 |
UNITED STATES
SECURITIES AND EXCHANGE COMMISSION
Washington, D.C. 20549
FORM 10-K
☒
ANNUAL REPORT PURSUANT TO SECTION 13 OR 15(d) OF THE SECURITIES EXCHANGE ACT OF 1934For the fiscal year ended December 31, 2020
or
☐
TRANSITION REPORT PURSUANT TO SECTION 13 OR 15(d) OF THE SECURITIES EXCHANGE ACT OF 1934For the transition period from to
Commission File Number 000-09908
TOMI ENVIRONMENTAL SOLUTIONS, INC. | |
(Exact name of registrant as specified in its charter) |
Florida | 59-1947988 | |
(State or other jurisdiction of incorporation or organization) | (I.R.S. Employer Identification No.) | |
8430 Spires Way Frederick, Maryland | 21701 | |
(Address of principal executive offices) | (Zip Code) |
Registrant’s telephone number, including area code: (800) 525-1698
Securities registered under Section 12(b) of the Exchange Act: None
Title of each class | Trading Symbol(s) | Name of each exchange on which registered |
Common Stock, par value $0.001 per share | TOMZ | The Nasdaq Capital Market |
Securities registered under Section 12(g) of the Exchange Act:
Indicate by check mark if the registrant is a well-known seasoned issuer, as defined in Rule 405 of the Securities Act.
Yes ☐ No ☒Indicate by check mark if the registrant is not required to file reports pursuant to Section 13 or Section 15(d) of the Act. Yes ☐ No ☒
Indicate by check mark whether the registrant (1) has filed all reports required to be filed by Section 13 or 15(d) of the Securities Exchange Act of 1934 during the preceding 12 months (or for such shorter period that the registrant was required to file such reports), and (2) has been subject to such filing requirements for the past 90 days. Yes ☒ No ☐
Indicate by check mark whether the registrant has submitted electronically and posted on its corporate Web site, if any, every Interactive Data File required to be submitted and posted pursuant to Rule 405 of Regulation S-T (§ 232.405 of this chapter) during the preceding 12 months (or for such shorter period that the registrant was required to submit and post such files). Yes ☒ No ☐
Indicate by check mark whether the registrant is a large accelerated filer, an accelerated filer, a non-accelerated filer, a smaller reporting company, or emerging growth company. See the definitions of “large accelerated filer,” “accelerated filer,” “smaller reporting company,” and “emerging growth company” in Rule 12b-2 of the Exchange Act:
Large Accelerated Filer | ☐ | Accelerated Filer | ☐ |
Non-Accelerated Filer | ☒ | Smaller Reporting Company | ☒ |
Emerging Growth Company | ☐ |
If an emerging growth company, indicate by check mark if the registrant has elected not to use the extended transition period for complying with any new or revised financial accounting standards provided pursuant to Section 13(a) of the Exchange Act. ☐
Indicate by check mark whether the registrant has filed a report on and attestation to its management’s assessment of the effectiveness of its internal control over financial reporting under Section 404(b) of the Sarbanes-Oxley Act (15 U.S.C. 7262(b)) by the registered public accounting firm that prepared or issued its audit report ☐
If securities are registered pursuant to Section 12(b) of the Act, indicate by check mark whether the financial statements of the registrant included in the filing reflect the correction of an error to previously issued financial statements. ☐
Indicate by check mark whether any of those error corrections are restatements that required a recovery analysis of incentive-based compensation received by any of the registrant’s executive officers during the relevant recovery period pursuant to § 240.10D-1(b). ☐
Indicate by check mark whether the registrant is a shell company (as defined in Rule 12b-2 of the Act). Yes ☐ No ☒
As of June 30, 2020,2023, the last business day of the registrant’s most recently completed second fiscal quarter, the aggregate market value of the common stock held by non-affiliates of the registrant was approximately $104,219,332,$9,612,000, based upon the closing price of the registrant’s common stock as reported on the OTCQB MarketplaceNasdaq Capital Market on such date.
As of March 29, 2021,28, 2024, the registrant had 16,811,51319,955,205 shares of common stock outstanding.
Documents incorporated by reference
None.
TOMI ENVIRONMENTAL SOLUTIONS, INC.
ANNUAL REPORT ON FORM 10-K
FOR THE FISCAL YEAR ENDED DECEMBER 31, 2020
TABLE OF CONTENTS
Item | Page | |
PART I | ||
| 1 | ||
| 9 | ||
| 19 | ||
| 19 | ||
| 20 | ||
| 20 | ||
| PART II | ||
| 21 | ||
| 21 | ||
| 21 | ||
| 41 | ||
| 41 | ||
| 41 | ||
| 41 | ||
| 42 | ||
| PART III | ||
| 43 | ||
| 45 | ||
| 50 | ||
| 52 | ||
| 52 | ||
| PART IV | ||
| 53 | ||
| 54 | ||
| 55 | ||
| F-1 | ||
| 2 |
| Table of Contents |
FORWARD-LOOKING STATEMENTS
This Annual Report on Form 10-K contains certain forward-looking statements within the meaning of Section 27A of the Securities Act of 1933, as amended (the “Securities Act”), and Section 21E of the Securities Exchange Act of 1934, as amended (the “Exchange Act”), and we intend that such forward-looking statements be subject to the safe harbors created thereby. For this purpose, any statements contained in this Annual Report on Form 10-K, except for historical information, may be deemed to be forward-looking statements. You can generally identify forward-looking statements as statements containing the words “will,” “would,” “believe,” “expect,” “estimate,” “anticipate,” “intend,” “assume,” “can,” “could,” “plan,” “predict,” “should” or the negative or other variations thereof or comparable terminology are intended to identify forward-looking statements. In addition, any statements that refer to projections of our future financial performance, trends in our businesses, or other characterizations of future events or circumstances are forward-looking statements.
The forward-looking statements included herein are based on current expectations of our management based on available information and involve a number of risks and uncertainties, all of which are difficult or impossible to predict accurately and many of which are beyond our control. As such, our actual results could differ materially and adversely from those expressed in any forward-looking statements as a result of various factors. Important factors some of whichthat could affect our performance and cause results to differ materially from management’s expectations are listed underdescribed in the section entitled “Risk Factors,” Item 1A of this Annual Report on Form 10-K. These factors include: our history of losses that may prevent us from achieving profitability in the future; our lack of long-term customer contracts and our inability to rely on our sales history or backlog as an indicator of our future sales; that we are subject to a variety or risks associated with doing business internationally; our success in business depends on our ability to adequately protect our intellectual property; and that our stock price is volatile and there is a limited market for our shares.
Readers should carefully review these risks,“Risk Factors”, as well as the additional risks described in other documents we file from time to time with the Securities and Exchange Commission. In light of the significant risks and uncertainties inherent in the forward-looking information included herein, the inclusion of such information should not be regarded as a representation by us or any other person that such results will be achieved, and readers are cautioned not to place undue reliance on such forward-looking information. Except as required by law, we undertake no obligation to revise the forward-looking statements contained herein to reflect events or circumstances after the date hereof or to reflect the occurrence of unanticipated events.
| 3 |
| Table of Contents |
PART I
Item 1.
Overview
TOMI Environmental Solutions, Inc. (“TOMI”, “we” and “our”TOMI,” “we,” “our,” or the “Company”) is a global leader in bacteria decontamination and infectious disease control, company, providing environmentaloffering environmentally friendly solutions for indoor air and surface decontamination through the manufacturing, sales, servicedisinfection and licensing ofdecontamination. Our flagship product, SteraMist, uses our SteraMist
Developed under a grant by
We owe our success to register with the EPAcollaborative efforts of Titan Defense and certain state regulatory authorities asDARPA who uncovered a sellersuperior technology that mimics nature’s cleansing mechanism, bringing this natural phenomenon indoors providing a competitive edge that exceeds the capabilities of disinfectants. In June 2015, SteraMist
| 4 |
| Table of Contents |
The Science Behind the Technology
Introducing a hospital-healthcare disinfectantrevolutionary approach to disinfection and general broad-spectrum surface disinfectant for use as a misting/fogging agent. SteraMist
BIT technology was included in the EPA’s list G (Norovirus), L (Ebola) and M (Avian Flu). In March 2020, our EPA label was further amended to include Emerging Viral Pathogens claims, thus meeting the criteria against Enveloped viruses and Large Non-enveloped viruses and included on List N (Emerging Viral Pathogens including SARS-CoV-2).
The unique alteration of the chemistry of our solution occurs after our EPA-registeredonly once BIT solution passes through anthe atmospheric cold plasma arc, which causes the breaking of the double bond of a hydrogen peroxide molecule the net result - our
TOMI has and continues to adapt this innovative technology into an everyday solution for use by multiple industries. Under the Federal Insecticide, Fungicide, and Rodenticide Act (“FIFRA”), we are mandated to register our disinfectants with the Environmental Protection Agency (“EPA”) and specific state regulatory bodies. SteraMist BIT was EPA-registered (#90150-2) in June 2015 as a hospital-healthcare and broad-spectrum surface disinfectant for misting/fogging applications. We achieved a cutting-edge claim on the EPA label and was coined as the first equipment + solution combination hospital-healthcare disinfectant on the market and maintain the claim as the only EPA Registered Solution + Equipment combination that provides the unique technology of hydrogen peroxide ionization.
Today our EPA registered BIT
TOMI continuous to build its portfolio of feasibility studies with renowned and trusted partners. In 2023, the U.S. Department of Defense’s BSAT Biorisk Program Office and the Department of Homeland Security’s Science and Technology Directorate’s Plum Island Animal Disease Center published a low percentage (7.8%) Hydrogen Peroxidereport demonstrating that iHP is an effective tool for decontamination of biological toxoids and is representeddangerous pathogens that may disrupt our world. We maintain registrations in all 50 states, Washington D.C., Canada, and approximately 40 other countries. These endorsements signify our commitment to safeguarding our world against any potential threats.
Our Customers
We empower our customers to create a healthier and safer world by offering innovative products and services spanning life sciences, healthcare, food safety, and everyday visited facilities. Our comprehensive solutions encompass a range of capital equipment and services, from mobile sprayers and foggers to fully automated installed systems, alongside routine and emergency deployment, qualification, and validation procedures. We also operate across diverse sectors such as Life Sciences, Hospital-Healthcare, Food Safety, and everyday buildings visited by people, and provide the option for routine and emergency treatment through our service provider membership, the TOMI
Our revenue is derived from a variety of industry groups. The life-science industry’s growth trajectory is fueled by various factors including global demographic trends, technological advancements, regulatory requirements, and economic influences. In hospital-healthcare, the rising concern over hospital-acquired infections, coupled with increasing demand for medical procedures and efficiency improvements, drives a demand for our products and services. Food safety regulations mandate strict sanitation practices in food handling and processing facilities to ensure the production of safe and hygienic food products. Our technology producesSanitation plays a germ-killing aerosol that moves throughout a space like a gas. Our technology is able to efficiently and effectively kill pathogenic and resistant organismscritical role in the air and on the surfaces without damaging delicate equipment or computers,preventing contamination and the spread of foodborne illnesses. Regulations typically outline requirements for cleaning and disinfecting food contact surfaces, equipment, utensils, and facilities to remove dirt, debris, and harmful microorganisms.
| 5 |
| Table of Contents |
It is imperative to emphasize the importance of a proactive approach, particularly in disinfection and decontamination. Investing in advanced technology should not solely be reactive to crises but should be seen as an integral part of a robust risk management strategy for any business. At TOMI, we are dedicated to modernizing operational efficiencies across diverse industries, including life sciences, hospital-healthcare, food safety, hospitality, and emergency service sectors.
By integrating SteraMist iHP technology into facilities now, we not only by-product is oxygenmitigate existing risks but also strengthen defenses against future challenges the world may face. Establishing a culture of safety and water inhygiene through routine cleaning disinfection protocols employers instill confidence among their patients, researchers, employees, students, emergency responders - showcasing a commitment to the formwell-being of humidity.
Validated and proven effective, SteraMist
We now provide a wide array of products and services customized to meet the unique operational needs of our global clientele, providing a customizable approach to our customers and elevating their overall performance.
In U.S. hospitals where SteraMist
We tackle critical global challenges, delivering real results that reflect our dedication to making a reductionpositive impact on employees, customers, investors, and the communities we serve. In an industry full of Clostridium
|
 | |
 |
 |
 |
 | |
 |
 |
Industries & Market Segments
SteraMist products are designed to address a healthier world by providing them a significant opportunity to help reduce the spread of Community Associated Infections (“CAI’s”) and Healthcare-Acquired Infections (“HAI’s”) and the most lethal of pathogens including our recent SARS CoV-2 pandemic and future pandemics.
Life Sciences
SteraMist iHP is designed to be tailored to provide a complete solution to address the regulatory inspections of disinfecting/decontaminating and Installation Qualification (IQ)-Operational Qualification (OQ)–Performance Qualification (PQ) validation processes within the life sciences industry.
The life sciences sector demands rigorous decontamination procedures to ensure the integrity and safety of pharmaceutical products, medical devices, and research environments. With the evolving landscape of the pharmaceutical market, there is an increasing demand for fully automated decontamination products that offer quick turnaround times to minimize downtime and expedite production cycles.
The life sciences industry was among the first to embrace the Company’s innovative decontamination solutions, recognizing the limitations of traditional methods and effects on progress. Our current portfolio of life science customers, including Fortune 100 companies has been able to overcome the constraints imposed by outdated practices, paving the way for enhanced efficiency, safety, and productivity in their operations. Their early adoption of our Commercial division.
| 6 |
| Table of Contents |
The insights gained from working closely with life sciences companies also inform our product development and service offerings, enabling us to better meet the evolving needs of markets. In today’s pharmaceutical market, characterized by rapid innovation, stringent regulatory requirements, and global competition—efficiency and speed are paramount. Pharmaceutical companies, including Contract Development and Manufacturing Organizations (“CDMO”), are under pressure to streamline their operations while maintaining high standards of quality and compliance.
According to industry statistics, the global pharmaceutical market is projected to grow steadily, with emerging markets playing an increasingly significant role in driving growth. As their operations expand globally, there is a growing need for decontamination solutions that can deliver consistent fast results across the dynamic and ever-changing landscape of manufacturing and production facilities and research laboratories.
By offering fully automated products and services tailored to aid our Hospital-HealthCare customersthe unique requirements of pharmaceutical manufacturers and CDMOs, TOMI aims to support their efforts in maintaining the highest standards of quality, safety, and efficiency on a global scale.
Hospital-Healthcare
TOMI focuses on the Hospital-Healthcare Market by providing thehigh quality of caresafety to patients and safety they provide to their patientspersonnel by disinfecting patient and operating rooms, pharmacies, ambulances, and emergency environments inthroughout a hospital or healthcare facility. Our team
Healthcare facilities worldwide should prioritize disinfection to mitigate the risk of technicianshealthcare-associated infections (“HAI”), enhance patient safety, and representatives train, maintain and troubleshoot capital equipment throughouta sterile environment conducive to healing. According to the world for our Hospital-HealthCare customers.
In 2024, it’s estimated that approximately 7-10% of patients being infected asadmitted to healthcare facilities worldwide will acquire at least one HAI during their stay. This translates to millions of cases annually, with significant economic burdens and human costs. Furthermore, the emergence of antimicrobial-resistant pathogens poses a resultgrowing threat, exacerbating the challenge of infection control in healthcare settings.
Effective disinfection measures, including the historic poor manual cleaninguse of theseadvanced technologies like SteraMist, are essential for reducing the incidence of HAIs and safeguarding patient rooms, infectious disease rooms and operatory suites, with a corresponding return on investment to the hospital of up to 20-to-1 in the first year.
TOMI will intensify its efforts to penetrate the healthcare market by forging strategic partnerships and advocating for the adoption of advanced disinfection technologies. By collaborating with key stakeholders, including healthcare providers, facility managers, group purchasing organizations (“GPO”) like Vizient and regulatory bodies, we can promote the integration of SteraMist as well as potentially infectious agents and/or materials, which facilities such as these handle on a routine basis.
TOMI Service Network (“TSN”)
TSN is an expansive network consisting of professionals who are exclusively licensed and perform decontamination clean-uptrained to use the SteraMist products. With the purchase of SteraMist and joining TSN, TOMI trains and services a wide array of professional remediation companies in these spaces quickly, less caustically, requiring no wipethe use of SteraMist throughout the TSN division. TSN allows for increased accessibility and with no residue. By usingbrand awareness of iHP technology these most importantservices to facilities are able to perform more experiments a yearin need of local routine and emergency disinfection and decontamination.
The TSN addressed many cleaning protocols that changed permanently due to the COVID-19 pandemic, and our network plays a significant role in facilitating and maintaining these protocols. COVID-19 highlighted the limitations of reactive approaches to cleanliness and hygiene. Recognizing this, TOMI is now championing a proactive approach to disinfection. While the pandemic may have initially spurred reactive measures, we are advocating for a shift towards proactive, ongoing disinfection protocols.
| 7 |
| Table of Contents |
Through consistent and persistent efforts, we are slowly but steadily changing minds across all industries that individuals interact with in their daily lives. By emphasizing the importance of maintaining clean and safe environments as a preemptive measure providing long-term benefits of proactive disinfection in ensuring the health and well-being of their employees, customers, and communities, rather than merely reacting to immediate threats, we are promoting a culture of preventive healthcare via our TSN.
Food Safety
Every day there are news articles around the world pertaining to the contamination of food supply. Unsafe food containing harmful bacteria, viruses, parasites, or chemical substances causes more than 200 diseases. It also creates a vicious cycle of disease and malnutrition, particularly affecting infants, young children, elderly and the sick. With the global population explosion, severe worldwide avian flu pandemics resulting in the unnecessary culling of bird flocks, unusually high number of accidents resulting in the destruction of dozens of storages, packing and processing food plants, in the U.S. alone, we anticipate an increase in the demand for a mechanical way to sanitize the food supply. TOMI, in cooperation with the USDA, demonstrated that our technology offers a consistent, quick, and effective quick treatment that iHP offers.
Sanitation procedures must be implemented regularly and effectively to maintain cleanliness and prevent cross-contamination throughout the food processing chain. This includes proper cleaning and sanitizing of techniciansfood preparation areas, storage facilities, transportation vehicles, and representatives train, maintain, and troubleshoot capital equipment globally for our Life Sciences customers. Further, our iHP
Compliance with food safety industry. Accordingregulations is essential for food businesses to the CDC, 80 million people per year in the United States contract,protect public health, uphold consumer trust, and 5,000 people die from, food poisoning or other food-related illnesses. Current food safety cleaning techniques involve time intensive processes, which can reduce food manufacturers’ profit. Our iHP
In 2023, we made significant strides in boosting brand awareness within the food safety industry through targeted promotion and marketing initiatives. Leveraging a similar strategy to what proved successful in the Life Sciences sector; we focused on building a customer base through referrals and feasibility studies, gradually expanding our reach. By fostering relationships with key supporters of our technology and remaining patient in our approach, we have finally laid a foundation. In 2024, we expect to continue to expand and grow our presence in this critical market segment.
Commercial
In line with adopting a proactive approach through our TOMI Service Network, it’s imperative for the entire commercial world to follow suit. Proactive disinfection practices not only ensure the health and safety of employees, customers, and visitors but also safeguard business continuity and reputation. Our Commercial division includes, but is not limited to, use sites such as aviation, airports, police and fire, prisons, manufacturing companies, automobile, gymnasiums, cruise ships, shipping ports, preschool education, primary and secondary schools, colleges including dormitories, all modes of public and private transportation, regulatory consulting agencies, retail, housing and recreation, and of foodcourse emergency preparedness for counties and cities use of SteraMist throughout such communities.
SteraMist disinfection helps prevent the spread of harmful pathogens, including bacteria and viruses, reducing the risk of illnesses and infections among individuals. This is particularly crucial in shared spaces such as offices, retail stores, and restaurants where people gather regularly. A healthy and safe work environment promotes employee well-being and productivity. By reducing absenteeism due to illness and creating a comfortable workspace, disinfection measures contribute to a more efficient and effective workforce. For businesses in the service industry, such as hotels, restaurants, and grocery stores.
| 8 |
| Table of Contents |
TOMI, in conjunction with its partners, collaborators, and industry associations, is proactively educating the community on the importance of preventive disinfection through verbal explanation and visual demonstrations of the impact of maintaining a weaponized biologicalclean environment. We engage in targeted social media campaigns, offer training programs and chemical attack. workshops on best practices, and share case studies of real-life examples highlighting the long-term benefits in promoting health and safety for a successful business.
By further implementing these strategies and our reach, we can effectively convey the importance of proactive disinfection and inspire action among businesses and individuals to prioritize cleanliness and hygiene in commercial settings.
The Company is committed to further expanding its marketing, advertising, and educational campaigns aimed at its customer base and driving adoption of our SteraMist iHP product line across all our industries: Life Sciences, Hospital-Healthcare, TOMI Service Network, Food Safety, and Commercial. We will continue to innovate and develop tailored products to meet the specific needs of each, ensuring seamless implementation and optimal performance. Our dedicated team of technicians and representatives will continue to provide comprehensive training, maintenance, and servicing of capital equipment worldwide, supporting customers in maximizing the benefits of our patented technology. Additionally, TOMI will continue to offer protocol development and implementation services for SteraMist iHP, recognizing its critical role in various settings, particularly in pandemic preparedness scenarios.
Competition
The environmental infectious disease control industry or disinfection, decontamination, and sanitization arena is intensely competitive and highly regulated. Competition is intense in all five of our divisions and includes many large and small competitors.
SteraMist iHP Provides a 99.9999% or six-log kill and above kill (i.e., the statistical destruction of all microorganisms and their spores) on all challenged pathogens, on multiple surfaces including Bacillus atrophaeus spores, Bacillus subtilis spores and Geobacillus stearothermophilus spores naked or dressed the last spore is considered a gold standard for validation of sterilization versus household/industrial cleaners that offer a 99.9% (sanitizing) or three-log kill to 99.99% (disinfection) or four-log kill. Thus, our SteraMist iHP surpasses many of the subpar products hastily launched in response to the COVID-19 pandemic. Unlike the reactive solutions, SteraMist iHP offers comprehensive protection against a wide range of pathogens, ensuring thorough and effective disinfection, decontamination, and sanitization in any environment.
SteraMist iHP offers a single consistent, repeatedly validated solution with various application choices. Per the EPA (see, EPA Reg. No. 90150-1), our technology has many competitive advantages including, but not limited to, the following:
• | Easy to use and easily incorporated into (current) cleaning procedures; |
• | Fully validated to comply with Good Manufacturing Practice (“GMP”) Standards; |
• | Product performance is supported by Good Laboratory Practice (“GLP”) efficacy data; |
• | Ready-to-use (formula), (no mixing required); |
• | Go (Goes) above, beyond, under and around disinfecting sprays and wipes; |
• | Frequent (daily) use formula; |
• | Mobile (portable) for rapid deployment throughout a facility; |
• | Low operating and maintenance costs; |
• | No Wipe, No Rinse; |
• | Does not include silver ions or peracetic acid; |
• | Does not contain particulate (heavy metals) (minerals) (dyes) (fragrances); |
• | Leaves no residues (no wiping necessary); |
• | Eliminates (Removes) odor causing bacteria; |
• | Does not require adjustment to (modification of) (specific) room temperature or humidity before use (application); |
• | Does not contaminate the environment with any toxic by-products; |
• | Leaves environment with only oxygen and water (humidity). |
In addition, SteraMist
Our comparable competitors include companies that market other hydrogen peroxide-based products, such as Steris Corporation (“Steris”), Bioquell, Inc. (“Bioquell”) currently owned by Ecolab, Inc. (“Ecolab”), and influenza virus subtypes like h1n1, h5n1, h7n9The Clorox Company (“Clorox”), miscellaneous hydrogen peroxide products various ultraviolet companies and h10n8.hundreds of quad ammonia-chemical companies. Some of these competitors may have longer operating histories, greater name recognition, larger installed customer bases and substantially greater financial and marketing resources than us.
| 9 |
| Table of Contents |
Ultimately, against all competitors and their products, TOMI SteraMist prevails when the following is prioritized by a facility and user:
Speed: SteraMist offers rapid turnaround times providing a near kill on contact to pathogens, resulting in faster re-entry and use to the treated area.
Comprehensive Coverage: SteraMist reaches every nook and cranny, ensuring thorough disinfection of all areas.
No Preconditions: SteraMist does not require preconditioning of the space before treatment, streamlining the entire process.
Equipment Safety: Our gentle process ensures sensitive electronics and equipment are safeguarded against corrosion.
Personnel Safety:SteraMist
SteraMist iHP emerges as the superior choice when the facility and its users not only require a sterile environment but also must prioritize efficiency, thoroughness, and safety in their disinfection, decontamination, and sanitization requirements.
Finally, our exceptional support team further solidifies TOMI SteraMist’s competitive edge. With a dedicated and knowledgeable support team, we ensure that our customers receive unparalleled assistance and guidance. Our commitment to providing outstanding customer service enhances user satisfaction and strengthens loyalty to our brand. In the end, our supportive and attentive approach fosters trust and admiration among our customers.
SteraMist iHP Product and Services
The versatility of SteraMist iHP technology is evidenced by its diverse range of products, may assist border patrol agentsaccommodating to both mobile and permanent integration needs. Handheld devices offer convenient application, with a quick full coverage spray of 5 seconds per square foot. Meanwhile, our environment fogging devices are automated, scalable, and programmed for repeatable use. Three SteraMist applicators achieve a thorough full room disinfection decontamination of a sealed space up to 103.8 m3 (3,663 ft3) in controllingjust under 45 minutes (application and dwell time). Individually, each remote applicator can be used to treat a space of approximately 34.6 m3 (1,221 ft3). Injection times are based on individual room size and number of applicators. This adaptability ensures effective and efficient disinfection solutions for various environments and applications.
| 10 |
| Table of Contents |
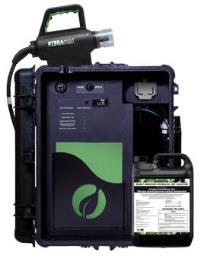
SteraPak
The all-in-one SteraPak places the spreadSteraMist iHP technology onto the technicians back, delivering premium disinfection utilizing a rechargeable battery and cordless operation. Our most affordable product line to date is comfortable to use, easy to operate, and has AC and DC power functionality ensuring compatibility in all countries. The SteraPak is sold with a case of infectious disease introducedBIT Solution of eight 32-ounce bottles.
SteraMist Surface Unit
The SteraMist Surface Unit, the original all enclosed fully portable TOMI product is a handheld, point and spray disinfection decontamination unit intended to provide quick turnover of any affected space. The Surface Unit is sold with a case of BIT Solution of four-gallon bottles.
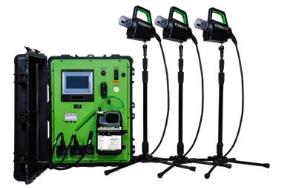
SteraMist Environment System
The SteraMist Environment System (“ENV”) is a transportable, remotely controlled system that provides complete room disinfection decontamination. Multiple systems can be used simultaneously to accommodate larger or multiple spaces with fast application and minimal down time. The system allows for both manual (point and spray) and/or fogging modes. Additional features include downloadable and printable cycle data in PDF format (lot # of BIT Solution, location identifier, injection/dwell/aeration times, and error notifications) and audit reporting. These features are required for many Life Science facilities. The ENV is sold with a case of BIT Solution of four-gallon bottles.
| 11 |
| Table of Contents |
The SteraMist Total Disinfection Cart
The Total Disinfection Cart was designed with input of public healthcare facilities EVS (Environmental Service) teams. The cart houses our Surface Unit, a portable H2O2 monitor, Carbon Air Scrubber, Respiratory Protection System with positive pressure air flow, storage hooks, and a sign notifying the room is being treated. Included with the Cart is a custom ICU 55-minute terminal cleaning protocol. The Surface Unit is sold with a case of BIT Solution of four-gallon bottles.
SteraMist Transport
The SteraMist Transport unit, an all-in-one dual voltage fogging product designed to treat a wide variety of vehicle sizes with an application time of only 20 minutes per 1,000 cubic feet. Additional features include remote start and cycle notification lights. The initial batch of this innovative product is currently in a soft launch phase and has been sold to long-term partners working with their customers for live practical assessment. The Transport is sold with a case of BIT Solution of eight 32-ounce bottles.
NV+
Our new NV+ cutting-edge solution tailored to meet the needs of smaller areas and budgets, while maintaining key advantages of SteraMist iHP fogging application. Encased in a stainless-steel cart, the NV+, like its counterpart ENV features precise dosage based on space volume, remote activation, audit reporting, and cleanroom compliance standards including GMP, cGMP, and GLP. Different than the ENV, the NV+ boasts LED notification cycle alerts and operates with a telescopic rotating applicator, delivering a 36-minute injection time for spaces up to 1,800 cubic feet. Currently the NV+ is available for purchase, with its debut set for April 2024 at InterPhex, the Company’s premier tradeshow. Designed for efficiency and effectiveness, the NV+ offers a cost-effective solution for comprehensive fogging disinfection and decontamination in smaller spaces. The NV+ is sold with a case of BIT Solution of four-gallon bottles or a case of two 10-liter bottles.
SteraMist Custom Engineered System
The SteraMist Customer Engineered System (“CES”) permanent installation is perfect for any room that requires routine automated decontamination. The CES is an automated system that is installed and plumbed utilizing the facilities’ existing HVAC system. This involves permanently installing SteraMist applicators within the designated space to achieve maximum results and connecting the applicators to an enclosure in a central remote location within a facility. The entire system can be developed for multiple rooms and various specifications. The status of the decontamination cycle is monitored with indicators and can be integrated into a Supervisory Control and Data Acquisition (“SCADA”) monitoring board. The system is now available with a scale to measure the use of BIT Solution for a customer’s ease of reordering our consumable and comes in a variety of drum sizes.
Our long-term focus remains on ongoing projects and validations, which often lead to proposals and interest in our CES permanent decontamination room. These projects involve longer lead times, as they are custom designed, procured, assembled, and installed upon order, a process that can take months to complete. The utilization of BIT Solution typically occurs after the system has been commissioned, site accepted, validated, and performance qualified, which aligns with the customer’s readiness for production. However, this can sometimes result in delays in seeing an increase in BIT Solution usage, as it depends heavily on the customer’s production and manufacturing timelines, particularly in the pharmaceutical industry.
Despite these challenges, we anticipate that installations of our CES permanent decontamination rooms will have a positive material impact on our results in the upcoming year(s). As these projects progress and come to fruition, we expect to see increased utilization of our BIT Solution, contributing to our overall growth and success.
The CES eliminates issues such as human error, guarantees accuracy that is unmatched by foreign individuals by decontaminating interview rooms, containment rooms, holding cellscompetitors, and quarantine areas afterdecreases a potential infected carrier’s condition either improvesclient’s labor cost and downtime. Since its launch, SteraMist’s CES has emerged as a leading solution meeting the increasing demands of customers. In 2023, we focused on expanding our network of contacts and partners to facilitate the adoption of SteraMist iHP CES and other products in the life sciences and other industries. We invested significant time engaging with construction companies, engineers, and design firms involved in facility construction to pave the way for the global expansion of our system(s). As these relationships continue to grow, we are confident that the groundwork laid in 2023 will soon yield tangible results, driving further adoption and utilization of SteraMist solutions worldwide.
| 12 |
| Table of Contents |
SteraMist Hybrid
The SteraMist Hybrid, a combination of innovation, seamlessly integrating our CES’s elegant permanently installed stainless-steel applicators with the generator of the ENV. The generator is strategically positioned in a centralized location of the facility through a docking station or hub. Central to its operation is the Hybrid connection hub, linking the applicators to the ENV and powering the automation of SteraMist iHP decontamination.
Compliant with cGMP, GMP, and ISO standards, the Hybrid is designed with specific self-programming capabilities. It supports four outputs and one analog input, tailored to receive signals from a H2O2 sensor. Key outputs would include, shutdown air supply and exhaust, door positions or the carrier dies.
The SteraMist Hybrid offers a cutting-edge solution for customers seeking precise fogging control, permanent applicator placement for accelerated decontamination, and building communication capabilities—all within budgetary or time constraints that may not align with the CES option. This innovative system provides a cost-effective alternative while ensuring compliance with industry standards.
SteraMist Integrated System
The SteraMist Integrated System (“SIS”) lineup marks a significant advancement, following the SteraMist Select and SteraMist Plasma decontamination chamber products. We’ve consolidated the capabilities of these predecessors into three new offerings, providing versatile options to meet the diverse needs of our customers, both in terms of product functionality and accessibility.
The SIS-Stand Alone or SIS-SA, replacing the SteraMist Select, and the SIS-Pharm are now available for integrated enclosure decontamination. The SIS-SA will be stocked in inventory and showcased alongside our NV+ at InterPhex in April 2024. Conversely, the SIS-Pharm is made-to-order, delivering tailored solutions for specific customer requirements in enclosure decontamination, like our CES. Both offerings are crafted to streamline products while catering to individual customer needs.
Furthermore, we’re collaborating with manufacturers of enclosure decontamination products to develop the SIS-MFG, formerly known as the Plasma decontamination chamber. Our custom generator enclosure is shipped unassembled for integration by Original Equipment Manufacturer or OEMs, providing the flexibility to mount and fully integrate iHP control panel components and applicators into OEM enclosure. This design ensures that the generator remains out of sight while providing customers an easier method of purchasing iHP as their decontamination solution in a turnkey product.
With our comprehensive lineup of SIS products, we’re committed to providing cutting-edge decontamination solutions tailored to the specific needs and preferences of our customers.
Stainless Steel 90 Degree Applicator
TOMI’s standard applicator sold with our original systems is redesigned and manufactured to a 90-degree 316 stainless steel applicator; the ideal applicator to accompany all the SIS product lines. This applicator is purchased with a flange for ease of installation either permanently or semi-permanently.
iHP Corporate Service Decontamination
TOMI offers full room, equipment, facility, and emergency disinfection and decontamination services by certified SteraMist technicians. Our goal is to give our customers a fully tailored service that provides quality control by reducing bioburden and eliminate the potential for costly microbial contamination in the Life Sciences and Food Safety industries. Single and routine services are provided to TOMI customers to coincide with maintenance, mandatory facility shutdowns, or to control a specific threat. SteraMist technicians provide an efficient 4-step facility disinfection decontamination: site review, protocol generation, deployment and service, and post-treatment reporting.
| 13 |
| Table of Contents |
TOMI’s iHP service department continues to grow with new and existing customers in several divisions. In the life science sector, TOMI’s iHP service department has kept its relationships with large pharmaceuticals, such as Pfizer and ThermoFisher, as well as adding several smaller life science companies, like ForDoz, Scripps, and Lonza, to a regular decontamination schedule. The food safety department steadily gains traction as several plant/produce companies have expressed interest as new and emerging bacteria, toxins, and fungi hamper production.
TOMI’s iHP Service stands out as a source of revenue that consistently demonstrates either stability or growth.
Installation Qualification, Operational Qualification, and Performance Qualification
TOMI offers Installation Qualification, Operation Qualification, and Performance Qualification (together “IOQ/PQ”) services to ensure the proper functioning and validation of our decontamination systems. IOQ/PQ involves verifying that the system is installed correctly and operates as intended, meeting predetermined specifications and regulatory requirements. This service is at times requested for our mobile products, but certainly is in demand with the SIS and CES products. Notably, all CES installations worldwide have undergone rigorous qualification processes to validate their performance. Initially, systems were provided by outsourced consultants with the assistances of certified TOMI personnel, but now TOMI offers an all-inclusive package directly, providing an additional source of revenue. In the latter half of 2024, we plan to expand this department, offering IOQ/PQ services to both current and prospective customers, further solidifying our commitment to delivering comprehensive solutions and exceptional service.
| 14 |
| Table of Contents |
INFORMATION WITH RESPECT TO OUR BUSINESS IN GENERAL
Manufacturing
We outsource the manufacturing and blending of our SteraMist
®line of equipment and BIT™Solution. Our SteraMist®equipment is manufactured byOur solution is blended by an EPA approved blender; our blend includes one (1)sole active ingredient, 7.8% Hydrogen Peroxide.
TOMI maintains sole source distributionownership of all the SteraMist
Intellectual Property
Our success depends in part upon our ability to obtain and maintain proprietary protection for our products and technologies. We protect our technology and products by, among other means, obtaining United States and foreign patents. There can be no assurance, however, that any patent will provide adequate protection for the technology, system, product, service or process it covers. In addition, the process of obtaining and protecting patents can be long and expensive. We also rely upon trade secrets, technical know-how, and continuing technological innovation to develop and maintain our competitive position.
As part of our intellectual property protection strategy, we have registered our BIT
Our portfolio includes more than twenty (20)25 Utility Patent applicationsor Design Patents worldwide which expire at various dates through the year 2038 for both method and system claims on SteraMist
We have submitted utility patent applications in on-going United Statesmultiple countries, including Europe, China, Brazil, Korea and worldwide patent applications. In May 2020, we filed a PCT applicationAustralia for further additional applications of SteraMist
Our products are sold around the world under various brand names and trademarks. We consider our brand names and trademarks to be valuable in the marketing of our products. As of March 1, 2021,today, we held a total of onehave over two hundred seventy-eight (178) trademarks or trademark applications, (word andand/or logo) registered or pending across the globe. TOMI registers marks in seven (7)eight classes of specification of goods and services: Class 1 for Chemicals for Treating Hazardous Waste, Class 5 for Disinfectants, All-Purpose for Hard Surfaces and for Treating Mold, Class 7 for Handheld Power Operated Spraying Machines, Class 11 for Sterilizers for Medical Use and Air Purification, Class 35 for Business Consultation and Management Services, Class 37 for General Disinfecting Services, and Class 40 for Chemical Decontamination and Manufacturing Services.
| 15 |
| Table of Contents |
Marketing and Distribution
Through our brand awareness, marketing, social media presence and sales, our business growth objective is to be the global leader in disinfection and decontamination products sales, services, and manufacturing. We intend to continue to expand and support research and development on other decontamination and remediation solutions and to form more business alliances with strategic partners.
We continue to perform decontamination services within cleanrooms, bio-safety labs including BSL-3 and BSL-4 labs, tissue and blood labs, pharmaceutical labs, vivariums and research universities and we continue to secure additional license agreements with major remediation, construction, forensic clean-up and bio-safety servicing companies. Both of these strategies assist in the brand awareness and use of our suite of products.
We sell our products domestically and internationally through our internal sales force, as well as independent sales and manufacturing representatives. Internationally, our products are sold through exclusive and non-exclusive sales representatives and distributors. In late 2020During 2023, we focused on expanding our network of distributors and during the first quarter 2021, TOMIsale representative and business development initiatives. We brought on and onboarded 9 distributors and 11 sales representatives, which has onboarded three new vice presidents of sales for the promoting, demonstrating,expanded our presence domestically and selling of its SteraMist
Research & Development
Our research and supporting researchdevelopment efforts focus on improving, extending and applying our patentsproprietary technology in the field of mechanical cleaning and decontamination. Research and development expenses for the years ended December 31, 20202023 and 2019,2022, were approximately $455,000$492,000 and $341,000,$352,000, respectively.
Government Regulation
Our business is subject to various degrees of governmental regulation in the countries in which we operate. In the United States, the EPA, the FDA and other governmental authorities regulate the development, manufacture, sale, and distribution of our products and services. Our international operations also are subject to a significant amount of government regulation, including country-specific rules and regulations and U.S. regulations applicable to our international operations. Government regulations include detailed inspection of, and controls over, research and development, product approvals and manufacturing, marketing and promotion, sampling, distribution, record-keeping, storage, and disposal practices. Our low percentage of hydrogen peroxide serves as a competitive advantage with respect to transporting our product by air. Our major hydrogen peroxide competitors have to transport their chemicals by rail, road or sea as the Department of Transportation (DOT) will not allow a product that contains greater than 8% hydrogen peroxide to be transported by air. SteraMist with 7.8% Hydrogen peroxide is not subject to stringent government regulations that usually apply to the transporting chemicals We believe that we are currently compliant in all material respects with applicable regulatory requirements. To date, every registration for our technology we have applied for has been accepted.
Employees
As of March 1, 2021,7, 2024, we have twenty-nine (29)26 full-time executive, operational and administrative employees working within the United States. Most of our sales are conducted by global exclusive distribution agreements or domestically by our internal sales team or independent manufacturing representatives.
Available Information
We make available free of charge on or through our corporate website, https://tomimist.com/, our Annual Report on Form 10-K, Quarterly Reports on Form 10-Q, Current Reports on Form 8-K, proxy statements, and all amendments to those filings as soon as reasonably practicable after such material is electronically filed with, or furnished to, the Securities and Exchange Commission (“SEC”). Information contained on our website is not incorporated by reference unless specifically stated therein.
| 16 |
| Table of Contents |
In addition, the SEC maintains a website that contains reports, proxy statements, and other information about issuers, such as TOMI, who file electronically with the SEC. The address of the website is www.sec.gov.
Item 1A.
Our business routinely encounters and attempts to address risks, some of which will cause our future results to differ, sometimes materially, from those originally anticipated. Below, we have described our present view of certain important risks. The risk factors set forth below are not the only risks that we may face or that could adversely affect us. If any of the risks discussed in this Annual Report on Form 10-K actually occur, our business, financial condition and results of operations could be materially adversely affected. If this were to occur, the trading price of our securities could decline significantly.
In assessing these risks, investors should also refer to the other information contained or incorporated by reference in our other filings with the SEC.Risk Related to Our Company and Business
We have historically experienceda history of losses from our operations,and may not be able to sustainachieve profitability and may need to seek additional financing to sustain our operations.
We generated net income of approximately $4.4 million for the year ended December 31, 2020, incurred a net loss of $2.3approximately $3.4 and $2.9 million for the yearyears ended December 31, 20192023 and 2022, respectively. We also had an accumulated deficit of $39.1$49.8 million as of December 31, 2020. We2023. Prior to 2020, we had not generated any profit from our business operations. While we experienced an increase of our revenue and net income in 2020, primarily due to a significant increase of demand for our products as protective measures against the spread of the COVID-19 disease during the pandemic, such demand subsided in 2021 as the pandemic gradually came under control, which caused us to incur a net loss in 2021 and such trend has continued. In addition, we have been considering increasing our headcount and expenses to support our continued product development and planned growth, and if demand for our products declines and we are unable to sustain our recent increases in our net income, we may not be able to sustain profitability.
COVID-19 has adversely affected, and any resurgence of COVID-19 pandemic or increase profitability on a quarterlyanother global health epidemic may in the future, directly or annual basis, we may still need to seek additional financing to facilitate our continued growth. To finance our product development and growindirectly, adversely affect our business, we may seek funds through borrowings or through private or public equity or debt offerings. We may be unableresults of operations and financial condition.
COVID-19 has had a significant impact globally, prompting governments and businesses to raise funds on commercially reasonable terms or at all.take unprecedented measures in response. In addition, the sale of additional equity or convertible debt securities could result in additional dilution to our shareholders. If we borrow additional funds or issue debt securities, these securities could have rights superior to holders of our common stock and could contain covenants that will restrict our operations. If we do not obtain additional resources or achieve and sustain profitability, our ability to capitalize on business opportunities will be limited, the growth of our business will be harmed, our business may fail, and investors may lose all of their investment.
In the future, our business could be materially adversely affected, directly or indirectly, by the widespread outbreak of an infectious disease occurs in the United States or worldwide, our business may be adversely affected. In December 2019, a novel strain of coronavirus, SARS-CoV-2, was identified in Wuhan, China. Since then, the SARS-CoV-2 virus, and the resulting disease, COVID-19, has spread to most countries, and has caused the worldwide COVID-19 Pandemic. While the demand for our products generated from the COVID-19 Pandemic has positively impacted our financial position, it has negatively impacted our operational condition in two divisions by forcing us to implement various policies for the safety of our employees, including “work from home” policies and office social distancing policies, which may lead to lower productivity of our employees and a decrease in the innovation and advancement of our products. Beyond our own policies, numerouscontagious disease. If national, state and local jurisdictions have previously imposed, and othersgovernments in the future may impose, “shelter-in-place” orders,affected regions implement safety precautions, similar to those implemented in response to COVID-19, including quarantines, executiveborder closures, increased border controls, travel restrictions, governmental orders and similar government ordersshutdowns, business closures, cancellations of public gatherings and restrictionsother measures, such precautions could, and for their residents to control the spreadCOVID-19 did, disrupt normal business operations both in and outside of affected areas and could have significant negative impacts on businesses and financial markets worldwide.
The impact of COVID-19 which negatively affects our operationshas had, and potentially the demand for our products and services. However, these “shelter-in-place” measures and challenges will likely continue for the durationany resurgence of the COVID-19 pandemic which is uncertain, and may continue to negatively impact our operations.
| 17 |
| Table of Contents |
Our SteraMist
®family of products currently accounts for the majority of our revenue, and our success is almost completely dependent on the success of our SteraMist®brand.Our SteraMist
®family of products is currently our primary product offering, and we are completely dependent on its success. Successfully commercializing products such as ours is a complex and uncertain process. Our commercialization efforts will depend on the efforts of our management and sales team, our third-party manufacturers and suppliers and general economic conditions, among other factors, including the following:• | the effectiveness of our marketing and sales efforts in the United States and internationally; | |
• | our third-party manufacturers and suppliers’ ability to manufacture and supply the components of our SteraMist® products in a timely manner, in accordance with our specifications, and in compliance with applicable regulatory requirements, and to remain in good standing with regulatory agencies; | |
• | the availability, perceived advantages, relative cost, relative safety, and relative efficacy of alternative and competing disinfection products; | |
• | our ability to obtain, maintain, and enforce our intellectual property rights in and to our SteraMist® products; | |
• | the emergence of competing technologies and other adverse market developments, and our need to enhance our SteraMist® products and/or develop new products to maintain market share in response to such competing technologies or market developments; | |
• | our ability to raise additional capital on acceptable terms, or at all, if needed to support the commercialization of our SteraMist® products; and | |
• | our ability to achieve and maintain compliance with all regulatory requirements applicable to our SteraMist® products. |
We have hired and trained additional sales professionals to account for the increased demand for our products.personnel. Despite this growth in sales personnel, we expect that our additional sales force will require lead time in the field to grow their network of accounts and achieve the productivity levels we expect them to reach in any individual vertical and or territory. Furthermore, the use of our products will often require or benefit from direct support from us. If our sales representatives do not achieve the productivity levels, we expect them to reach, our revenue will not grow at the rate we expect, and our financial performance will suffer.
We do not have no long-term customer contracts, and our sales history or backlog cannot be relied upon as an indicator of our future sales.
We do not have long-term contracts with any of our customers, and our sales history or backlog cannot be relied upon as a future indicator of our revenues. Our contracts and purchase commitments with customers may be canceled under certain circumstances. As a result, we are exposed to competitive price pressures on every order, and our agreements with customers do not provide assurance of future sales. Our customers are not required to make minimum purchases and may cease purchasing our products at any time without penalty. As such, our unfilled orders and previously completed sales should not be relied on as a measure of anticipated demand or future revenue.
Our agreements with restoration industry specialists are not exclusive, which may allow for our competitors to sell their products and services to such specialists.
Our agreements with restoration industry specialists under our TOMI Service Network program, which allows certain restoration specialists to use and sell our products, are not exclusive. This lack of exclusivity allows our competitors to sell products to the same restoration specialists, which could reduce our sales if our competitors’ products are used in lieu of our products. Additionally, the use of our and our competitors’ products by a restoration specialist may create market confusion between our products and the products of our competitors, which may adversely affect our brand reputation and business.
Our success depends upon broad market acceptance of our technology that has not yet been achieved.
Our BIT technology as a Hospital-Healthcare disinfectant is relatively new, having received full Hospital registration for Clostridium
difficilespores from the EPA in mid-2017. Our sales are dependent upon broad market acceptance of our technology that replaces long-standing failing manual cleaning techniques such as quaternary ammonium compounds and bleach for disinfection, with our no-touch mechanical process. The failure to obtain broad market acceptance inevitably leads to substantially increased lead times for sales until our prospective customers, particularly in the Hospital-Healthcare market, are accustomed to the use of newer mechanical technology. The inability to timely meet our sales goals could adversely affect our financial condition and results of operations.| 18 |
| Table of Contents |
We are subject to a variety of risks associated with doing business internationally.
We maintain and have grown over the last year, significant international operations, including operations in the U.S., Canada, Mexico, Europe, Asia Pacific and Latin America. As a result, we are subject to a number of risks and complications associated with international manufacturing, sales, services, and other operations. These include: risks associated with currency exchange rate fluctuations; requirements or preferences for domestic products or solutions, which could reduce demand for our products; difficulties in enforcing agreements and collecting receivables through some foreign legal systems; unexpected legal or regulatory changes; enhanced credit risks in certain countries and emerging market regions; significant variations in tax rates among the countries in which we do business, and tax withholding obligations in respect of our earnings; exchange controls or other trade restrictions including, the impact of the COVID-19 Pandemicconstraints on our supply chain and the industries in which we operate; customs clearance and shipping delays; general economic and political conditions in countries where we operate or where end users of our products are situated, including the potential implications of the COVID-19 Pandemic;situated; natural disasters, political and economic instability, including wars, terrorism and political unrest, outbreak of disease, travel, social distancing and quarantine policies, boycotts, curtailment of trade, and other business restrictions affecting our ability to manufacture or sell our products; difficulties associated with managing a large organization spread throughout various countries; difficulties in enforcing intellectual property rights or weaker intellectual property right protections in some countries; and difficulties associated with compliance with a variety of laws and regulations governing international trade.
In late February 2022, Russia launched a large-scale military attack on Ukraine, amplifying already existing geopolitical tensions among Russia, Ukraine, Europe, NATO and the West, including the United States, and resulting in global sanctions against Russia by various countries, including the United States, the United Kingdom, and European Union. In addition, the Israel-Hamas War and wider Middle East geopolitical developments may negatively impact regional and global economic markets (including Europe and the United States), companies in other countries (particularly those that have done business with Russia, Ukraine, or Israel) and on various sectors, industries and markets for securities and commodities globally. Accordingly, the actions discussed above and the potential for a wider conflict could increase financial market volatility, cause severe negative effects on regional and global economic markets, industries, and companies and have a negative effect on the Company’s performance. The extent and duration of these military actions or future escalation of such hostilities, the extent and impact of existing and future sanctions, market disruptions and volatility, and the result of any diplomatic negotiations cannot be predicted. These and any related events could have a significant impact on the Company’s performance.
If our procedures to ensure compliance with export control laws are ineffective, our business could be harmed.
Our sales to foreign entities are subject to far reaching and complex export control laws and regulations in the United States and elsewhere. Violations of those laws and regulations could have material negative consequences for us including large fines, criminal sanctions, prohibitions on participating in certain transactions and government contracts, sanctions on other companies if they continue to do business with us and adverse publicity.
Failure to comply with the U.S. Foreign Corrupt Practices Act (“FCPA”), and similar laws associated with our activities outside of the United States could subject us to penalties and other adverse consequences.
Failure to comply with the FCPA, and similar laws associated with our activities outside of the United States could subject us to penalties and other adverse consequences. We face significant risks if we fail to comply with the FCPA and other anti-corruption laws that prohibit improper payments or offers of payment to foreign governments and political parties for the purpose of obtaining or retaining business. In many foreign countries, particularly in countries with developing economies, it may be a local custom that businesses operating in such countries engage in business practices that are prohibited by the FCPA or other applicable laws and regulations. Any violation of the FCPA or other applicable anti-corruption laws could result in severe criminal or civil sanctions and, in the case of the FCPA, suspension or debarment from U.S. government contracting, which could have a material and adverse effect on our reputation, businesses, financial conditions, operating results and cash flows.
Our operations are subject to environmental laws and regulations that may increase costs of operations and impact or limit our business plans.
We are subject to environmental laws and regulations affecting many aspects of our present and potential future operations, including a wide variety of EPA labeling and other state regulatory agency requirements. For example, under the Federal Insecticide, Fungicide, and Rodenticide Act, we are required to register with the EPA and certain state regulatory authorities as a seller of disinfectants, and we are subject to EPA labeling requirements for each use that SteraMist
®is intended to address. Compliance with these laws and regulations may result in increased costs and delays as a result of administrative proceedings and certain reporting obligations. Public officials and entities may seek injunctive relief or other remedies to enforce applicable environmental laws and regulations. If we are found to not have complied with these laws and are unable to sell out products, our business and financial results will be negatively impacted.| 19 |
| Table of Contents |
Our reliance upon third-party contractors, suppliers and manufacturers for the manufacture of our products increases the risk that we will not have sufficient quantities of our products or such quantities at an acceptable cost and reduces our control over the manufacturing process.
We rely upon third parties to supply us with our products. We outsource the manufacturing of our SteraMist
®line of equipment to two manufacturing companies and use contract manufacturers to build our BIT-based systems, as we do not maintain our own manufacturing facilities. If we fail to maintain relationships with our current suppliers, we may not be able to effectively commercialize and market our products, due to risks including increased product costs, limited inventory that is not capable of meeting demand and the possible misappropriation of our proprietary information, such as our trade secrets and know-how. Further, as we maintain a limited number of manufacturers for our SteraMist®line of equipment and blenders for our SteraMist®solutions, alternative production facilities may not be available in the event of a disruption, or if alternative production facilities are available, the number of third-party suppliers with the necessary manufacturing and regulatory expertise to produce our products at their current quality level is limited, and it could be expensive and take a significant amount of time to arrange for and qualify alternative suppliers, which could have a material adverse effect on our business.Because of our reliance upon third parties to supply us with our products, we do not have control over the manufacturing process of our third-party suppliers and are dependent on such third-party suppliers for compliance with the regulations applicable to our products. Third-party suppliers may not be able, or fail, to comply with applicable regulatory requirements, which could result in sanctions being imposed on us, including fines, injunctions, civil penalties, delays, suspension or withdrawal of approvals, seizures or recalls, operating restrictions and criminal prosecutions, any of which could significantly and adversely harm our business and results of operations.
Our results of operations could be materially harmed if we are unable to accurately forecast customer demand for our products and manage our inventory.
To ensure adequate inventory supply, we must forecast inventory needs and place orders with suppliers based on our estimates of future demand for our products and services. Our limited historical experience in foreign markets and recent increase in demand in the United States may lead us to inadequately forecast such inventory needs. Further, our ability to accurately forecast demand for our products could be negatively affected by many factors, including our failure to adequately manage our expansion efforts, product introductions by competitors, an increase or decrease in customer demand for products of our competitors, our failure to accurately forecast customer acceptance of new product enhancements, unanticipated changes in general market conditions or regulatory matters, and weakening of economic conditions or consumer confidence in future economic conditions.
Inventory levels in excess of customer demand may result in inventory write-downs or write-offs, which would cause our gross margin to be adversely affected and could impair the strength of our brand. Similarly, a portion of our inventory could become obsolete or expire, which could have a material and adverse effect on our earnings and cash flows due to the resulting costs associated with inventory impairment charges and costs required to replace obsolete inventory. Any of these occurrences could negatively impact our financial performance.
Conversely, if we underestimate customer demand, we may not be able to deliver sufficient products to meet our customers’ requirements, which could result in damage to our reputation and customer relationships. In addition, if we experience a significant increase in demand, additional supplies of raw materials or additional manufacturing capacity may not be available when required on terms that are acceptable to us, or at all, and suppliers or our third-party manufacturers may not be able to allocate sufficient resources to meet our increased requirements, which could have an adverse effect on our ability to meet customer demand for our products and our results of operations.
| 20 |
| Table of Contents |
Our success depends on our ability to adequately protect our intellectual property.
Our commercial success depends, in part, on our ability to obtain, maintain, defend, file new or enforce our existing patents, trademarks, trade secrets and other intellectual property rights covering our technologies and products throughout the world. We may, however, be unable to adequately preserve such rights due to a number of reasons, including the following:
· | our rights could be invalidated, circumvented, challenged, breached or infringed upon; | |
· | we may not have sufficient resources to adequately prosecute or protect our intellectual property rights; | |
· | upon expiration of our patents, certain of our key technology may become widely available; or | |
· | third parties may be able to develop or obtain patents for similar or competing technology. |
Although we devote resources to the establishment and protection of our patents and trademarks, the actions we have taken or will take in the future may not be adequate to prevent violation of our patents, trademarks and proprietary rights by others or prevent others from seeking to block sales of our products as an alleged violation of their patents, trademarks and proprietary rights. In the future, litigation may be necessary to enforce our trademarks or proprietary rights and we may be forced to defend ourselves against claimed infringement or the rights of others. Any such litigation could result in adverse determinations that could have a material adverse effect on our business, financial condition or results of operations.
In addition, we rely in part upon unpatented trade secrets, unpatented know-how, and continuing technological innovation which may not yet, or may never be, patented, to develop and maintain our competitive position, which we seek to protect, in part, by confidentiality agreements with our employees, third party manufacturers, and consultants. We also have agreements with our employees and consultants that obligate them to assign their inventions to us. It is possible that technology relevant to our business will be independently developed by a person that is not a party to such an agreement. In addition, if the employees and consultants who are parties to these agreements breach or violate the terms of these agreements, we may not have adequate remedies for any such breach or violation, and we could lose our trade secrets through such breaches or violations. To the extent that our commercial partners, collaborators, employees and consultants use intellectual property owned by others in their work for us, disputes may arise as to the rights in related or resulting know-how and inventions. Further, our trade secrets could otherwise become known or be independently discovered by our competitors, which would harm our business.
The risk of loss of the Company’s intellectual property, trade secrets or other sensitive business information or disruption of operations could negatively impact the Company’s financial results.
The Company has sensitive information, including intellectual property, trade secrets, and other sensitive, business critical information as well as on-premises and cloud-based business applications critical to conducting business. In addition, our research and development facility uses modern computer systems. Cyber-incidents affecting the Company, its supply chain or customers could compromise confidential, business critical information, cause a disruption in the Company’s operations, harm the Company’s reputation, or endanger the environment if the Company, its suppliers or customers do not effectively prevent, detect and recover from these or other security breaches. While the Company has not encountered cyber security challenges that have materially impaired our operations or financial condition it may be the target of cyber security related incidents.
Although management believes the Company has not experienced any cyber security related incident or losses to date related to these cyber security incidents, there can be no assurance that such losses will not be suffered in the future. The Company seeks to actively manage the risks within its control that could lead to business disruptions and cyber security incidents through a comprehensive cyber security program. As cyber security threats present themselves, the Company may be required to expend significant resources to enhance its control environment, processes, practices, and other protective measures. Despite these efforts, such events could have a material adverse effect on the Company’s business, results of operations, financial condition and cash flows.
We may be unable to enforce our intellectual property rights throughout the world.
As part of our growth strategy, we are seekingcontinuing to expand our operations internationally. The laws of some foreign countries do not protect intellectual property rights to the same extent as the laws of the United States. Companies have encountered significant problems in protecting and defending intellectual property rights in certain foreign jurisdictions. To the extent that we have obtained or are able to obtain patents, trademarks or other intellectual property rights in any foreign jurisdictions, it may be difficult to stop the infringement of our patents, trademarks or the misappropriation of other intellectual property rights. For example, some foreign countries have compulsory licensing laws under which a patent owner must grant licenses to third parties. In addition, some countries limit the availability of certain types of patent rights and enforceability of patents against third parties, including government agencies or government contractors. In these countries, patents may provide only limited benefit or no benefit.
| 21 |
| Table of Contents |
Proceedings to enforce our patent rights in foreign jurisdictions could result in substantial costs and divert our efforts and attention from other aspects of our business. Accordingly, efforts to protect our intellectual property rights in such countries may be inadequate. In addition, future changes in the law and legal decisions by courts in the United States and foreign countries may affect our ability to obtain adequate protection for our technology and products and the enforcement of intellectual property.
We face significant competition in our industry, some of which have longer operating histories, more established products or greater resources than we do, which may prevent us from achieving increased market penetration and improved operating results.
The decontamination and environmental infectious disease control industry is extremely competitive. The competition includes remediators and disinfection/decontamination companies such as Steris, Bioquell (Eco-lab) and Clorox, various miscellaneous hydrogen peroxide companies, ultraviolet companies and hundreds of quad ammonia-chemical companies. These competitors may have longer operating histories, greater name recognition, larger installed customer bases, a greater ability to provide similar products and services at a lower cost and substantially greater financial and marketing resources than us to develop new products and commercialize existing products. We believe that the principal factors affecting competition in our markets include name recognition, customer familiarity with products, effective marketing, competitive pricing strategies and the ability to receive referrals based on client confidence in the service. There are no significant barriers of entry that could keep potential competitors from opening similar facilities. Our ability to compete successfully in the industry will depend, in large part, upon our ability to market and sell our indoor decontamination and infectious disease control products and services. We may not be able to compete successfully in the remediation industry. Further, if one or more competitors successfully develops a decontamination product that is more effective, better tolerated, results in a better customer experience, is easier to use or otherwise more attractive than our products, our ability to continue to commercialize our products could be significantly and adversely affected due to a lack of ability to compete, which would have a material adverse effect on our business, financial condition and results of operations.
If the quality of our products do not meet the expectations of our customers, then our brand and reputation or our business could be adversely affected.
In the course of conducting our business, we must adequately address quality issues that may arise with our products, including defects in third-party components and inventory. We may not be able to eliminate or mitigate occurrences of these issues and associated liabilities. In addition, even in the absence of quality issues, we may be subject to claims and liability if the performance of products do not meet the expectations of our customers. If the quality of our products does not meet the expectations of customers, then our brand and reputation, and our ability to receive referral customer business, could be adversely affected.
Our long-term growth depends, in part, on our ability to enhance, develop, market and developsell new products, and if we fail to do so we may be unable to compete effectively.
It is important to our business and our long-term growth that we continue to enhance and develop new products. We intend to continue to invest in research and development activities focused on improvements and enhancements to our existing intellectual property and product offerings. Our development goals include the development and commercialization of a variety of sanitizing robotic devices and backpack units. Despite our reasonable efforts, it may not be possible for us to innovate in a way to keep us competitive with other companies due to financial and time constraints which will negatively impact our business.
The development and initial production and enhancement of the decontamination systems we produce is often accompanied by design and production delays and related costs. If we are unable to introduce new products on our anticipated timeframe or financial cost, our business, financial condition and results of operations may suffer due to failing to remain competitive in our market.
| 22 |
| Table of Contents |
We have a limited management team size which may reduce our ability to effectively manage our business operations as it grows.
Despite our current hiring efforts for non-management employees and redefining of job descriptions, we have a limited management team size, even though we keep hiring and redefining job descriptions.size. This limited management team may reduce our ability to effectively manage our business as it grows.grows or respond to significant demand from customers. As we expand, we expect to increase the size of our management team. However, our management team may not be able to adequately manage our business, and any failure to do so could lead to a general negative impact to our business.
We are dependent on our key personnel, the loss of whom could adversely affect our operations, and if we fail to attract and retain the talent required for our business, we could be materially harmed.
Our success is substantially dependent on the performance of our executive officers, including our Chairman and Chief Executive Officer, Dr. Halden S. Shane, the loss of whom would have a material adverse effect on our business.
We depend to a significant degree on our ability to attract, retain and motivate quality personnel. We further note that competition for highly skilled personnel is often intense. Moreover, our new sales representatives require a lengthy training process to achieve the requisite level of competency with our products. We may not be successful in attracting, integrating or retaining qualified personnel to fulfill our current or future needs, the failure of which would have a material adverse effect on our business.
Our operations, and those of our suppliers, are subject to a variety of business continuity hazards and risks, any of which could interrupt production or operations or otherwise adversely affect our performance and results.
We are subject to business continuity hazards and other risks, including natural disasters, utility and other mechanical failures, labor difficulties, inability to obtain necessary licenses, permits or registrations, disruption of communications, data security and preservation, disruption of supply or distribution, safety regulation and labor difficulties. The occurrence of any of these or other events might disrupt or shut down operations, or otherwise adversely impact the production or profitability of a particular facility, or our operations as a whole. We may also be subject to certain liability claims in the event of an injury or loss of life, or damage to property and equipment, resulting from such events. Although we maintain property and casualty insurance, as well as other forms of insurance that we believe are customary for our industries, our insurance policies include limits and, as such, our coverage may be insufficient to protect against all potential hazards and risks incident to our business. Should any such hazards or risks occur, or should our insurance coverage be inadequate or unavailable, our business, prospects, financial condition and results of operations might be adversely affected.
Our products are subject to potential product liability claims which, if successful, could have a material adverse effect on our business, financial condition and results of operations.
We are exposed to significant risks for product liability claims if death, personal injury or property damage results from the use of our products. While we currently maintain insurance against product liability claims, we may experience material product liability losses in the future. Our insurance coverage may not continue to be available on terms that we accept, if at all, and our insurance coverage also may not adequately cover liabilities that we incur. A successful claim against us that exceeds our insurance coverage level or that is not covered by insurance, or any product recall, could have a material adverse effect on our business, financial condition and results of operations. In addition, product liability and other claims can divert the attention of management and other personnel for significant periods of time, regardless of the ultimate outcome. Further, claims of this nature may cause our customers to lose confidence in our products and us. As a result, an unsuccessful defense of a product liability or other claim could have a material adverse effect on our financial condition, results of operations and cash flows.
The misuse of our products may harm our reputation in the marketplace, result in injuries that lead to product liability suits or result in costly investigations, fines or sanctions by regulatory bodies if we are deemed to have engaged in the promotion of these uses, any of which could be costly to our business.
Customers, technicians, or service providers could use our products in a manner that is inconsistent with the products’ intended use. We train our marketing personnel and sales representatives to not promote our products for uses outside of the intended use, however, we cannot otherwise prevent all instances of misuse. Further, the marketing and sales representatives that we have hired to help meet the demand for our products may not have received proper training or have the working knowledge needed to adequately advise our customers how to safely use our products. Misuse of our products may cause an increased risk of injury to customers, which could harm our reputation in the marketplace, as well as lead to potential product liability lawsuits.
| 23 |
| Table of Contents |
We may seek to grow our business through acquisitions of complementary products or technologies, and the failure to manage acquisitions, or the failure to integrate them with our existing business, could harm our business, financial condition and operating results.
From time to time, we may consider opportunities to acquire other companies, products or technologies that may enhance our product platform or technology, expand the breadth of our markets or customer base, or advance our business strategies. Potential acquisitions involve numerous risks, including: problems assimilating the acquired products or technologies; issues maintaining uniform standards, procedures, controls and policies; unanticipated costs associated with acquisitions; diversion of management’s attention from our existing business; risks associated with entering new markets in which we have limited or no experience; increased legal and accounting costs relating to the acquisitions or compliance with regulatory matters; and unanticipated or undisclosed liabilities of any target.
We have no current commitments with respect to any acquisition. We do not know if we will be able to identify acquisitions, we deem suitable, whether we will be able to successfully complete any such acquisitions on favorable terms or at all, or whether we will be able to successfully integrate any acquired products or technologies. Our potential inability to integrate any acquired products or technologies effectively may adversely affect our business, operating results and financial condition.
The requirements of being a public company may strain our resources, divert management’s attention and affect our ability to attract and retain executive management and qualified board members.
We have and likely will continue to incur significant legal, accounting and other expenses as a public company subject to the reporting requirements of the Securities Exchange Act of 1934, the Sarbanes-Oxley Act of 2002 (“SOX”), the Dodd–Frank Wall Street Reform and Consumer Protection Act and other applicable rules and regulations. Our management and other personnel devote a substantial amount of time to these compliance initiatives. Moreover, these rules and regulations have increased our legal and financial compliance costs and will make some activities more time-consuming and costly. For example, applicable rules and regulations could make it more difficult for us to attract and retain qualified persons to serve on our board of directors ( the(the “Board), or as executive officers.
In addition, SOX requires, among other things, that we maintain effective internal control over financial reporting and disclosure controls and procedures. Our testing, or the potential subsequent testing by our independent registered public accounting firm in future periods, may reveal deficiencies in our internal control over financial reporting that are deemed to be material weaknesses. Our compliance with Section 404 of SOX may require that we incur substantial expense and expend significant management time on compliance-related issues. Moreover, if our independent registered public accounting firm identifies deficiencies in our internal control over financial reporting that are deemed to be material weaknesses, the market price of our stock could decline, and we could be subject to sanctions or investigations by regulatory authorities, which would require additional financial and management resources.
As a result of disclosure of information, our business and financial condition are more visible, which we believe may result in threatened or actual litigation, including by competitors and other third parties. If such claims are successful, our business and operating results could be adversely affected. Even if the claims do not result in litigation or are resolved in our favor, these claims, and the time and resources necessary to resolve them, could divert the resources of our management and adversely affect our business and operating results.
Risk Related to Our Securities
Our stock price is volatile and there is a limited market for our shares.
The stock markets generally have experienced, and will probably continue to experience, extreme price and volume fluctuations that have affected the market price of the shares of many small-cap companies. These fluctuations have often been unrelated to the operating results of such companies and in recent times have been exasperated by investors’ concerns stemming from the COVID-19 Pandemic. Factors that may affect the volatility of our stock price include the following:
· | anticipated or actual fluctuations in our quarterly or annual operating results; | |
· | our success, or lack of success, in developing and marketing our products and services; | |
· | changes in general economic, political and market conditions in or any of the regions in which we conduct our business; | |
· | changes in financial estimates by us or of securities or industry analysts; |
| 24 |
| Table of Contents |
· | the issuance of new or updated research reports by securities or industry analysts; | |
· | the announcement of new products, services, or technological innovations by us or our competitors; | |
· | the announcement of new customers, partners or suppliers; | |
· | the ability to collect our outstanding accounts receivable; | |
· | changes in our executive leadership; | |
· | regulatory developments in our industry affecting us, our customers or our competitors; | |
· | competition; | |
· | actual or purported “short squeeze” trading activity; and | |
· | the sale or attempted sale of a large amount of common stock, including sales of common stock following exercises of outstanding warrants. |
We do not intend to pay dividends for the foreseeable future.
We have not paid dividends on our common stock since inception. The continued operation and expansion of our business will require substantial funding. Accordingly, we currently intend to retain earnings, if any, for use in the business and we do not anticipate that we will pay any cash dividends on shares of our common stock for the foreseeable future. Any determination to pay dividends in the future will be at the discretion of our Board and will depend upon results of operations, financial condition, contractual restrictions, restrictions imposed by applicable law and other factors our Board deems relevant. Investors seeking cash dividends should not purchase our common stock. Accordingly, realization of a gain on your investment will depend on the appreciation of the price of our common stock, which may never occur.
We have a substantial number of options, warrants, convertible notes and convertible preferred stock outstanding, which could give rise to additional issuances of our common stock and potential dilution of ownership to existing shareholders.
As of December 31, 2020,2023, we had outstanding convertible note, options, warrants and convertible preferred stock to purchase approximately an aggregate of 2.25.5 million shares of our common stock at exercise prices ranging from $0.80 to $8.40$6.95 per share. Of these, approximately 132,5002,100,000 represent shares underlying convertible notes with an exercise price of $1.25, approximately 618,000 represent shares underlying options with exercise prices ranging from $0.80 to $7.06 per share, approximately 2.02.8 million represent shares underlying warrants at exercise prices ranging from $0.64 to $8.40$6.95 per share and approximately 63,750 represent shares underlying our shares of convertible $0.01 Series A preferred A stock. To the extent any holders of options, warrants or convertible preferred stock exercise the same, the issuance of shares of our common stock upon such exercise will result in dilution of ownership to existing shareholders.
The trading market for our common stock will rely in part on the research and reports that securities or industry analysts publish about us and our business. If one or more of the analysts who cover us downgrades our common stock or issues other unfavorable commentary or research the price of our common stock may decline. If one or more analysts ceases coverage of our company or fails to publish reports on us regularly, demand for our stock could decrease, which in turn could cause the trading price or trading volume of our common stock to decline and could result in the loss of all or part of your investment in us.
Substantial future sales of our common stock, or the perception in the public markets that these sales may occur, may depress our stock price.
Our common stock is traded on the NASDAQ Capital Market (“Nasdaq”) and, despite certain increases of trading volume from time to time, there have been periods when our common stock could be considered thinly traded, meaning that the number of persons interested in purchasing our common stock at or near bid prices at any given time may be relatively small. Equity or equity-related financing transactions that result in a large amount of newly issued shares that become readily tradable, or sales of significant numbers of shares by current shareholders, have placed, and in the future could place, downward pressure on the trading price of our stock. In addition, during times of lower trading volume, a shareholder who desires to sell a large number of shares of common stock may need to sell the shares in increments over time to mitigate any adverse impact of the sales on the market price of our stock.
If our shareholders sell, or the market perceives that our shareholders intend to sell, substantial amounts of our common stock in the public market, the market price of our common stock could fall. Sales of a substantial number of shares of our common stock may make it more difficult for us to sell equity or equity-related securities in the future at a time and price that we deem reasonable or appropriate. In the event that the price of our stock falls, we may become involved in securities class action litigation that could divert management’s attention and harm our business.
| 25 |
| Table of Contents |
In the future, we may also issue our securities if we need to raise additional capital or in connection with acquisitions. The number of shares of our common stock issued in connection with a financing or acquisition could constitute a material portion of our then-outstanding shares of our common stock.
We have recently listed on the Nasdaq and may not be able to maintain compliance with NASDAQ’sNasdaq’s listing standards, to maintain listing on the exchange, which could limit shareholders’ ability to trade our common stock.
As a listed company on the Nasdaq, we are required to meet certain financial, public float, bid price and liquidity standards on an ongoing basis in order to continue the listing of our common stock. If we fail to meet these continued listing requirements, our common stock may be subject to delisting, which could materially impact the liquidity of our common stock making it more challenging to buy and sell shares of our common stock.
We are a “smaller reporting company” under the U.S. federal securities laws, and the reduced reporting requirements applicable to smaller reporting companies could make our common stock less attractive to investors.
We are a “smaller reporting company” under U.S. federal securities laws. For as long as we continue to be a smaller reporting company, we may take advantage of exemptions from various reporting requirements that are applicable to other public companies that are not smaller reporting companies. Investors may not find our common stock attractive because we may rely on these exemptions. If some investors find our common stock less attractive as a result, there may be a less active trading market for our common stock and our stock price may be more volatile.
Our anti-takeover provisions could prevent or delay a change in control of our company, even if such change in control would be beneficial to our shareholders.
Provisions of our articles of incorporation, as amended, and amended bylaws as well as provisions of Florida law could discourage, delay or prevent a merger, acquisition or other change in control of our company, even if such change in control would be beneficial to our shareholders. These include: maintaining authorized but unissued shares of our capital stock that could be issued by our Board to increase the number of outstanding shares and thwart a takeover attempt; no provision for the use of cumulative voting for the election of directors; maintaining a staggered board, limiting the speed at which our shareholders may replace our entire Board, and limiting the ability of our shareholders to call special meetings.
In addition, Florida Business Corporation Act, or FBCA, § 607.0902 generally provides that shares acquired in excess of certain specified thresholds, without first obtaining the approval of our Board, will not possess any voting rights unless such voting rights are approved by a majority of our disinterested shareholders. Additionally, FBCA § 607.0901 requires that, subject to certain exceptions, any affiliated transaction with a shareholder that owns more than 15% of the voting shares of the corporation, referred to as an “interested shareholder,” receive the approval of either the corporation’s disinterested directors or a supermajority vote of disinterested shareholders, or, absent either such approval, that a statutory “fair price” be paid to the shareholders in the transaction. The shareholder vote requirement is in addition to any shareholder vote required under any other section of the FBCA or our articles of incorporation, as amended.
The concentration of our common stock ownership with our executive officers, directors and affiliates will limit your ability to influence corporate matters.
Our executive officers, directors and owners of 5% or more of our outstanding common stock and their respective affiliates beneficially owned, in the aggregate approximately 26.7%23.5% of our outstanding common stock as of March 5, 2021.7, 2024. This percentage includes outstanding shares of common stock, convertible preferred stock, warrant and stock options that are vested and exercisable as of that date. These shareholders will therefore have significant influence over management and affairs and over all matters requiring shareholder approval, including the election of directors and significant corporate transactions, such as a merger or other sale of our company or our assets, for the foreseeable future. This concentrated control will limit our shareholders’ ability to influence corporate matters and, as a result, we may take actions that our shareholders do not view as beneficial. This ownership could negatively affect the value of our common stock.
There can be no assurance that we will be able to regain and maintain compliance with continued listing standards of the Nasdaq Capital Market.
The Nasdaq Capital Market’s continued listing standards for our common stock require, among other things, that (i) we maintain a closing bid price for our common stock of at least $1.00, and (ii) we maintain: (A) stockholders’ equity of $2.5 million; (B) market value of listed securities of $35 million; or (C) net income from continuing operations of $500,000 in the most recently completed fiscal year or in two of the last three most recently completed fiscal years. Any failures to satisfy any continued listing requirements could lead to the receipt of a deficiency notice from the Nasdaq and ultimately to a delisting from trading of our common stock.
| 26 |
| Table of Contents |
On February 4, 2024, we received a deficiency letter notifying us that we had not maintained a closing bid price for our common stock of at least $1.00 for a 30-day period. In accordance with Nasdaq rules, we have been provided an initial period of 180 calendar days, or until August 15, 2024 (the “Compliance Date”), to regain compliance with the bid price requirement. If we do not regain compliance with the bid price requirement by the Compliance Date, we may be eligible for an additional 180 calendar day compliance period, otherwise our common stock will be subject to delisting from the Nasdaq Capital Market. We cannot be certain that we will be able to regain compliance and then maintain compliance with the minimum bid price and the other standards in order to maintain a listing of our common stock on the Nasdaq Capital Market.
If our common stock were delisted from the Nasdaq Capital Market, among other things, this could result in a number of negative implications, including reduced liquidity in our common stock as a result of the loss of market efficiencies associated with Nasdaq and the loss of federal preemption of state securities laws as well as the potential loss of confidence by suppliers, customers and employees, institutional investor interest, fewer business development opportunities, greater difficulty in obtaining financing and breaches of certain contractual obligations.
Item 1B.
Not applicable.
Item 1C. CYBERSECURITY
Cybersecurity Risk Management and Strategy
We recognize the importance of assessing, identifying, and managing material risks associated with cyber security threats, as such term is defined in Item 106(a) of Regulation S-K. We have certain processes for assessing, identifying and managing cyber security risks, which are built into our overall information technology function and are designed to help protect our information assets and operations from internal and external cyber threats, and protect employee information from unauthorized access or attack, as well as secure our networks and systems. Such processes include physical, procedural and technical safeguards and routine review of our policies and procedures to identify risks and refine our practices. We consider the internal risk oversight programs of third-party service providers before engaging them in order to help protect us from any related vulnerabilities.
We have not encountered cyber security challenges that have materially impaired our operations or financial condition. Additional information regarding risks from cyber security threats is provided at “Item 1A. Risk Factors.”
Governance; Board Oversight
The Audit Committee of our Board provides direct oversight over cyber security risk and provides updates to the Board of Directors regarding such oversight, when and if appropriate. Management provides periodic updates to the Audit Committee regarding cyber security matters including significant new cyber security threats or incidents, when and if appropriate.
Item 2.
Our U.S. headquarters, a 9,000 square foot office space, is located at 8430 Spires Way, Frederick, MD 21701.
The| 27 |
| Table of Contents |
Item 3.
We currently are not a party to any legal proceedings, the adverse outcome of which, in management’s opinion, individually or in the aggregate, would have a material adverse effect on our results of operations, financial position or cash flows.
Item 4.
Not applicable.
| 28 |
| Table of Contents |
PART II
Item 5.
Market Information
Our common stock is currently quotedlisted on Nasdaq Capital Market under the symbol “TOMZ.”
Shareholders
As of March 29, 2021,13, 2024, there were 227214 record holders of our common stock; however, we believe we have approximately 6,0005,000 stockholders, including those held in street name. On March 29, 2021,18, 2024, the last reported sale price of our common stock on the Nasdaq was $4.15$0.71 per share.
Dividends
We have not paid and do not currently intend to pay cash dividends on our common stock in the foreseeable future. Our policy is to retain all earnings, if any, to provide funds for operation and expansion of our business. The declaration of dividends, if any, will be subject to the discretion of our Board, which may consider such factors as our results of operations, financial condition, capital needs and acquisition strategy, among others.
Recent Sales of Unregistered Securities
None.
Issuer Repurchases of Equity Securities
None.
Equity Compensation Plan Information
For information about our equity compensation plans and other related stockholder matters see Item 12 of Part III of this Annual Report on Form 10-K.
Item 6.
Item 7.
The following discussion and analysis of our financial condition and results of operations relates to the years ended December 31, 20202023 and 2019.2022. This discussion and analysis should be read in conjunction with our financial statements and the notes to those financial statements that are included elsewhere in this report.
Annual and “our”) is a global bacteria decontamination and infectious disease control company, providing environmental solutions for indoor surface decontaminationQuarterly Highlights
Business Update
During our 2023 calendar year, we continued to build out our sales infrastructure through the manufacturing, sales, service and licensingexpansion of our SteraMist
In October and November of hydrogen peroxide converted2023, we agreed to iHP
| 29 |
| Table of Contents |
During 2023, we focused on expanding our network of distributors and or decontamination treat areas mechanically, causing cellular disruptions and/or dysfunctions resultingsale representative and business development initiatives. We brought on and onboarded 9 distributors and 11 sales representatives, which has expanded our presence domestically and on an international basis. We anticipate the increased bandwidth of our internal and external sales channels will have a positive impact on our revenue in 2024 and beyond. In addition, we entered into a 6-log (99.9999%) and greater kill or inactivation of all pathogenscontract with Vizient, Inc. increasing our presence in the treatment area.
Most recently in November 2023, we announced the addition of Sterile Grow, a United States based distributor and consultation company in the food and cannabis market. Sterile Grow, led by Burrell Williamson III and Tri Nguyen, has demonstrated noteworthy achievements in the cannabis and food markets. Williamson, rooted in the greenhouse industry, has expanded into vertical farming, bringing extensive expertise to the food and cannabis sectors. Tri Nguyen specializes in controlled environment agriculture, particularly in integrating systems for large-scale indoor cannabis cultivation. Combining their cultivation knowledge and past success with SteraMist, Sterile Grow has joined forces as a distributor with the purchase of mobile products designedequipment in our current quarter.
In November 2023, we entered into a consulting agreement with BEAMS, LLC to be easily incorporated into their existingstrengthen and expand the TOMI SteraMist Network and increase business development in the commercial market. BEAMS, LLC brings over 20 years’ experience establishing strategic vision and direction of large institutions and companies spanning multiple industries, including higher education, not-for-profit, healthcare, consultancy, hospitality, and pharmaceutical sectors.
We remain actively engaged in marketing and submitting bids for Custom Engineered Systems (“CES”) project as the market continues to shift to fully automatic disinfection and decontamination proceduressolutions. We are also diligently working with existing outstanding potential purchasers while simultaneously building a robust pipeline for these long-term installations. Further, we have expanded our bandwidth to meet the increasing demands for the product line, which includes the SteraMist Integration System for enclosures and protocols. Additionally,have successfully navigated the challenges posed by the global supply chain issues.
During 2023, we offer integrated facility equipment installations knowncompleted and delivered four CES systems, as Custom Engineered Systems, routine & emergencyfollows:
- | During the first quarter, we delivered a CES system to Orna Therapeutics, a leading biotechnology company located in Massachusetts. As we complete each CES project, our iHP technology is becoming widely preferred as a decontamination solution for pharmaceutical and biotech companies. Further, with each new CES installation the product line becomes more of a turnkey solution. We obtained the Orna project through a prior colleague from Dana Farber Cancer Institute who became a spokesperson to the preference of SteraMist iHP for Orna. | |
- | During the second quarter, we delivered an eleven applicator CES system to Avid Bioservices, Inc. (“Avid”) for implementation in Avid’s new purpose-built viral vector development and manufacturing facility in Costa Mesa, California. | |
- | During the third quarter of 2023, we delivered a three applicator CES system to Ragon Institute of MGH, MIT and Harvard for implementation in their research and clinical lab located in Cambridge, MA. | |
- | During the third quarter of 2023, we delivered to a one applicator system Indigo Pharmaceutical, Inc. in Las Vegas, Nevada. |
Our patented technology continues to be the answer to cell therapy manufacturing. SteraMist iHP
To date, we have received 16 orders for CES systems. With the successful completion of each project, our iHP technology is rapidly gaining popularity as the preferred decontamination solution for pharmaceutical and biotech companies. Further, as we continue to addressinstall our technology in new CES projects, the unique disinfectionproduct line evolves into a comprehensive turnkey solution.
| 30 |
| Table of Contents |
Indeed, the timing is favorable as the industry is experiencing a shift towards modular cleanroom requirements. The adaptability and decontaminationefficiency offered by our iHP technology align perfectly with the changing needs of cleanroom setups. This trend allows us to capitalize on the increasing demand for flexible and scalable cleanroom solutions, further enhancing the relevance and value of our customers worldwide regardlessproducts within the industry.
We believe our growing portfolio of CES systems will give us a competitive edge in the type of facility requiring or requesting SteraMist
In 2023, we saw a complete room solution to address the regulatory inspections of disinfecting/decontaminating and Installation Qualification (IQ)-Operational Qualification (OQ)–Performance Qualification (PQ) validation processes within the life sciences industry.
In August of 2023, Pfizer Rocky Mount engaged our iHP service team to conduct emergency decontamination within their facility, which suffered substantial damage due to a tornado. Pfizer Rocky Mount has been a long-term, loyal client of TOMI, having commenced their utilization of SteraMist iHP Corporate Service in 2014. Since then, TOMI has been performing decontamination service twice a year during their facility’s routine scheduled shutdowns and sixty-three (363%) percent increase overcalled on as necessary throughout the calendar year 2019. Post COVID-19 outlookyears.
On March 7, 2024, announced an expansion in its SteraMist iHP Corporate Service contracts with the addition of new partners including the University of Texas and Rising Pharmaceuticals reaffirming its position as a leading provider of decontamination services to corporate clients in the life sciences industry.
We continued to diversify our base of products in 2023 with the introduction of the SteraMist Hybrid and SteraMist Transport, to support our ongoing commitment to providing superior disinfection decontamination solutions for our growing customer base.
Throughout 2023, we will continueremained active in our marketing initiatives and attended and presented our SteraMist brand of products at various tradeshows, most notable were Interphex, Food Safety Summit, AALAS, ISSA North America, and MJBiz Conference. In the fourth quarter of 2023, we attended and presented at the following shows: Pharma Ed Aseptic, ISPE National, AALAS National Conference, NFMT Remix Conference, Bio Innovation, ISSA North America, and MJBiz Conference.
In June 2023, we launched our updated website, now accessible through our new domain name steramist.com. The refreshed website offers a modern, user-friendly design and streamlined navigation, providing visitors with easy access to see demand for theessential information about SteraMist
Business Highlights and services will continue and we are building a team to address the post COVID-19 pandemic market opportunities. We are starting to see many of our life science and biosafety customers come back to their workplace.
Revenues:
Total revenue for the year ended December 31, 20202023, and 2019,2022, was $25,028,000$7,355,000 and $6,347,000,$8,338,000, respectively, representing an increasea decrease of $18,681,000,$983,000, or 294% compared to the same prior year period.
We believe that we possess one of the best technologies in the world in the disinfection and decontamination space. ThisThe COVID-19 pandemic along with the needs of the pharmaceutical and vivarium space has givenprovided us with the confidenceopportunity and experience to developimplement a clear strategy to develop and manufacture what may beadditional products to add to our best product portfolio to date.portfolio. In addition, we continue to move our BIT technology closer to becoming theas a standard in disinfection and decontamination globally. This should lead to a greaterincreased market share, increased profitability, and capability strength.
Our products are an environmentally friendly solution, and our processes address the concerns of 2020 showed us thatsustainability. Customers are requesting and discussing the positive results of our customers wanted a lower cost disinfection device, even if it gave the end-user less efficacyproduct and the potentialenvironmentally friendly results compared to the caustic and environmentally unfriendly results of damagemany other disinfectants.
| 31 |
| Table of Contents |
SteraMist has established a successful track record in fighting pandemics and outbreaks and implementing SteraMist for emergency preparedness is vital. The COVID-19 pandemic took the world by surprise, and history has shown that other pandemics and viruses are likely to its personal propertyfollow. Using a proven and delicate equipment. Earlytrusted disinfectant for emergency outbreaks and daily for preventative maintenance, such as SteraMist, can alleviate the threat of infections from spreading and could stop a possible outbreak.
2023 Events and Highlights:
On January 17, 2023, we announced National Health Services (NHS) Wales purchased SteraMist ionized Hydrogen Peroxide (iHP) technology further expanding our presence in 2021, approximately 500,000Great Britain.
On January 25, 2023, we announced that we would present our SteraMist brand of products at three upcoming International Society for Pharmaceutical Engineering (ISPE) Conferences in the first quarter of 2023: The ISPE Facilities of the lower cost competitors electrostatic devices were recalled by Consumer Product Safety Commission. InFuture Conference, that was held in Bethesda, MD, January 31 and February 1, 2023; the ISPE-CaSA Life Sciences Technology Conference in Raleigh, NC, held on February 28, 2023; and the ISPE Aseptic Conference in Bethesda, MD, held on March 6 and 7, 2023.
On April 20, 2023, we announced our participation in several upcoming industry tradeshows, including CETA International, RIA International, the Lab Manager Leadership Summit, FDIC International, and the INTERPHEX Conference. The company has showcased its SteraMist products, a proprietary and industry-leading disinfection technology, designed to combat a broad spectrum of viruses and bacteria spores.
On April 24, 2023, we announced the addition to safety issues, they were damaging the materials that they were being used on but were also dangerousof four independent manufacturing representatives and causing explosions with many resulting in fires.
On April 26, 2023, we announced that approximately 20 billion medical devices are sterilized per year with Ethelene Oxide and a proposal restriction restricting its usage could create a significant market void that may be filled with alternative sterilization processes such as TOMI’s patented Binary Ionization Technology ® (BIT™) Technology.
On May 10, 2023, we announced our SteraMist technology was recognized as one of the Top 10 Infection Solution Providers of 2023 in the recent infection control solutions special edition.
On May 11, 2023, we announced the addition of Technimount System (“Technimount”) as an exclusive distributor selling capital equipment to the emergency medical services market throughout Canada.
On May 18, 2023, we announced the launch of our updated website, now accessible through the new domain name steramist.com. The refreshed website offers a modern, user-friendly design and streamlined navigation, providing visitors with easy access to essential information about SteraMist products and services.
On May 31, 2023, we announced the completion of a lower coststudy conducted in accordance with the U.S. Department of Defense’s Biological Select Agents and more versatile product,Toxins Biorisk Program Office which demonstrated SteraMist iHP as an effective technology for decontamination of biological toxoids.
On June 5, 2023, we developedannounced that the Company has entered a Backpack unit that will possess our award winning 6-log and above kill technology and speed without the damage to space and materials. We expect our backpack to be competitively priced and open SteraMist to the largest cleaning marketcontract with Vizient, Inc., increasing TOMI’s presence in the world-membersU.S. healthcare system.
On June 22, 2023, we announced a partnership with I.B.D., as a distributor in Italy.
On August 3, 2023, we announced a collaboration with Cellares to integrate its SteraMist ionized Hydrogen Peroxide (iHP) technology into a cutting-edge new cell therapy manufacturing solution, the Cell Shuttle, designed and produced by Cellares.
On August 14, 2023, we announced that Pfizer Rocky Mount has engaged TOMI’s iHP Corporate Service to conduct emergency decontamination within their facility, which suffered substantial damage due to a recent tornado.
On September 5, 2023, we announced the completion of ISSA (International Sanitary Supply Association)a study funded by the USDA and its divisions IEHA (Integrated Environment and Health Assessment) and EMEA (Europe, Middle East & Africa). These organizations have historically been price conscious and were resistant early on to ourNIFA which demonstrated SteraMist pricingiHP as an effective treatment of deformed wing virus (DWV) contaminated hive substrates.
| 32 |
| Table of Contents |
On September 13, 2023, we announced the expansion of our professionaldistribution channels with Avantor ® (NYSE: AVTR), a Fortune 500 company and a leading supplier of mission-critical products and services.
On September 13, 2023, we announced that we partnered with Colcom, Inc. to offer SteraMist iHP products as part of Colcom’s life sciences and healthcare portfolio of products.
On September 29, 2023, we announced the roll out of two new products, the SteraMist Hybrid and SteraMist Transport, to support its ongoing commitment to providing superior disinfection decontamination equipment (SteraMist Surfacesolutions for its growing customer base.
On November 27, 2023, we announced the addition of Sterile Grow, a United States based distributor and Environment Unit). We plan on introducing ourconsultation company in the food and cannabis market.
2024 Highlights:
On February 29, 2024, we announced the signing of a new innovative backpack globally in early second quarter of 2021contract for a SteraMist iHP Custom Engineered System (CES) installation with pre-orders being accepted on or about April 1. We have budgeted to sell two thousand units in 2021.
On March 7, 2024, announced an expansion in its SteraMist iHP Corporate Service contracts with the addition of new partners including the University of Texas and Rising Pharmaceuticals reaffirming its position as a leading provider of decontamination services to corporate clients in the life sciences industry.
On March 11, 2024, we announced a new groundbreaking study demonstrating the effectiveness of its solutions against foot-and-mouth disease virus (FMDV). This significant advancement supports the Company’s submission for 2021 – 2024.
Research Studies:
TOMI continues to be active in the ELC programglobal market, using registrations to expand sales opportunities. Currently, TOMI is in the registration process for India, and renewal to meet new requirements in the Philippines. Both markets offer excellent potential due to interest in the TOMI suite of decontamination/disinfection solutions.
TOMI is in the annual process of self-audit, where all SOPs are reviewed and updated as needed, and all compliments and complains and requests for changes/new equipment are evaluated.
TOMI has successfully completed a second 24-month storage stability, this one to meet EPA requirements (first one was for EU BPR submission and had different methods/requirements). With the patented 7.8% product, Binary Ionization Technology Solution is safe to ship by air and store under normal ambient conditions. The study will be submitted for EPA review, and expiration date extended going forward upon EPA approval.
The EPA has registered our 0.35% hydrogen peroxide product for the use in greenhouses, pre harvests and post harvests. TOMI is conducting internal studies with the 0.35% on common pathogens in the food safety market to enhance protocols. We continue to pursue acceptance of the additional 1% hydrogen peroxide label with the EPA for direct food application.
Recent SteraMist food safety customers and partners are conducting further studies to prove SteraMist in the industry. Soli Organic Inc., one of the nation’s largest commercial indoor organic growing companies, obtained multiple SteraMist systems to protect their controlled indoor growing food process from costly fungus, Botrytis. The combination of all SteraMist systems purchased will be used daily, on a continuous cycle, to disinfect everything from seed trays that the soil and plants sit in, and the plants themselves.
Analysis concluded dramatic reduction in fungal growth, mold spores, and yield loss from environmental bio-loads, with notable efficacy against Alternaria, a species causing 20% yield loss in all annual vegetable production. Levels went from high/ medium to non-existent/nondetectable with the following spores: Alternaria (Ulocladium), Aspergillus/Penicillium, Acremonium++, and Botrytis.
| 33 |
| Table of Contents |
SteraMist is also working with a few partners in the cannabis industry. Enviro-Mist has been criticaltesting cannabis flower incubated with Aspergillus flavus, Aspergillus fumigatus, Aspergillus niger, Aspergillus terreus, Escherichia Coli, Shigella Spp, Salmonella, Staphylococcus aureus, yeasts and molds and subsequently treated using ionized Hydrogen Peroxide (iHP) to U.S. health departments’ abilitythe dried material. Potency results of the cannabis plant were not affected, and no additional residual solvents were found. The process was successful in complete remediation of all microbial contaminants. Another partner TOMI is working with has proven SteraMist that has reduced microbial count on cannabis flower from 400cfu/g to combat infectious diseases.
In August 2023, we announced the completion of a study funded by the USDA and the National Institute of Food and Agriculture (“NIFA”) which demonstrated SteraMist iHP as an effective treatment of deformed wing virus (“DWV”) contaminated hive substrates.
In 2024, we will continue to use research and testing to inform the marketplace of the effectiveness of our products. One goal of TOMI is to make SteraMist a recommended best practice to minimize emergency responder exposures to synthetic opioids, including fentanyl and fentanyl analogs.
We are also investigating whether SteraMist can play a role in controlling the environmental impact from perfluorooctane sulfonate (PFOS) and perfluorooctanoic acid (PFOA). These substances and group of chemicals have been released to the environment through industrial manufacturing and through the use and disposal of PFAS containing products. As a result, they are found across all 50 states, several large metro areas,trophic levels in the soil, air, and U.S. territories and affiliates receive direct financial support to detect, respond to, control, and prevent infectious diseases.
On April 26, 2023, we announced that approximately 20 billion medical devices are presently moving beyondsterilized per year with Ethelene oxide and a proposal restriction restricting its usage could create a significant market void that may be filled with alternative sterilization processes such as TOMI’s patented Binary Ionization Technology ® (BIT™) Technology.
On March 14, 2024, the New York Times published an article “E.P.A. Sets Limits on Carcinogenic Gas Used to Sterilize Medical Devices” which stated,
The Environmental Protection Agency is imposing new restrictions on the emissions of ethylene oxide, a colorless gas that is widely used to sterilize medical devices and is also a carcinogen.
The regulation, which is expected to be finalized shortly, would force sterilizing plants and other facilities that use ethylene oxide to install pollution controls to reduce emissions of the gas by about 90 percent.
It would mark the first time in 20 years that the government has tightened limits on the amount of the gas permitted to escape from a manufacturing facility.
Ethylene oxide is used in a number of products but is applied to about half the medical equipment made in the United States to reduce the risk of infection.
When inhaled, the gas can irritate the eyes, nose, throat and lungs, and has been linked to lymphoid and breast cancer as well as damage to the brain and nervous and reproductive systems.
It is still very early in the process, but this pandemic,could open up large manufacturing faculties that would have a need for our custom unit built-ins in the manufacturing of medical equipment to replace ethylene oxide, as SteraMist’s only by-product environmentally is humidity and oxygen.
Product Development:
Our recent products developed and launched are as follows:
SteraMist Engineering continues to make strides collaborating with key manufactures of cleanroom technology and equipment developing a turnkey seamless decontamination integration to chambers, cabinets, passthroughs, isolators, cage washers, heat sterilizers, hot cells and more. TOMI begins this endeavor with a project management, turnkey modular solution, and process design consulting firm that we have partnered with in one of our previous CES projects.
| 34 |
| Table of Contents |
The SteraMist Hybrid, an integral component of the SteraMist ENV, SteraMist Hybrid is designed with capabilities to communicate with a facility. The system is strategically positioned in a centralized location of the facility through a docking station and features our newly designed permanently mounted stainless steel applicators.
Recently, TOMI successfully installed the first SteraMist Hybrid at Indigo Pharmaceutical, Inc.’s existing research facility, which selected the SteraMist Hybrid because it met the client’s strict delivery timeline while adhering to the facility’s budget constraints. We remain in specification discussions with Indigo for a Custom Engineered System for a future site dedicated to injectables.
The SteraMist Transport has seen positive reception of its SteraMist Transport unit, an all-in-one dual voltage fogging product designed to treat a wide variety of vehicle sizes with an application time of only 20 minutes per 1,000 cubic foot. The initial batch of this innovative product is currently in a soft launch phase and has been sold this quarter for live practical assessment with an existing international customer.
The Select Plus (“Select Plus”) is a hybrid product consisting of the Company’s current Surface Select and Environment systems. The unit will provide enhanced flexibility by using a single applicator to decontaminate full-room to small-space volume while maintaining the size of the current Surface Select unit with more robust process controls. The iHP SteraMist Transport System has been designed for the transportation market, specifically ambulances. The iHP SteraMist Transport System is a timer based fogging system that can be installed semi-permanently or permanently and used for any transport and/or cargo vehicle. It will be an easy-to-use turn-key integration system. We expect the implementation of this product and our patented non-corrosive iHP technology to replace the number one competitor in this marketplace, which uses an extremely harsh chemical.
All SteraMist systems will remain important to the marketplace as they are designed for specific needs and budgets. The Select Surface Unit performs most of the functionality that the Select Plus offers and is priced at a lower cost, although Select Plus will provide additional options that are appealing to certain customers, such as laboratory and pharmaceutical companies. The SteraPak is a more cost-effective product and designed for residential and commercial real estate including large buildings and public space, any area that needs quick consistent disinfection. We believe there are many pathogens, some of whichnew and existing clients that are respiratory in nature, that represent a looming threat. Preparedness is the most important measure to mitigate their effect. We learned this first with Ebola and again with SARS CoV-2. SteraMist can and will reduce the impact of the next pandemic.
TOMI recently launched its fourth generation SteraMist ENV. The system will now be a line item on all companies’ budgets going forward whether private, public or government. Dangerous pathogens still exist “Disease X”24 volts, allowing for universal outlet usage and will exist long after we recover from this pandemic. While the United States and mostconvert even more of the world is currently recovering from the SARS CoV-2 coronavirus outbreak there are many pathogens still a looming threat, with cases occurring globallyhydrogen peroxide BIT Solution to this day. There are 1.67 million unknown viruses in the world. Preparedness is the most important measure to ensure your family and business survives. We learned this with Ebola and recently with SARS CoV-2. SteraMist can reduce the impact of the next pandemic as it has already proven.
Our SteraMist® BIT™ solution product line is currently made up of a food safety pilot study based on novel, nonthermal, and environmentally friendly technology to control foodborne pathogens on industrial hemp seed and strawberry as representative model foods. The study will investigate the efficacy of aerosolized hydrogen peroxide in inactivating foodborne pathogens – determining the optimum treatment conditions on microbial and physical quality of the two model products. We anticipate the pilot to be completed Q2-21.


 | ||
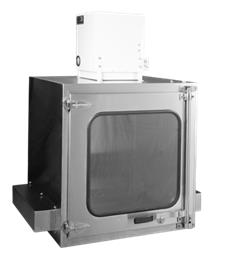 |
We expect these new products and logo) registered or pending acrossservice introductions will positively impact our net sales, cost of sales and operating expenses during this fiscal year.
Supply Chain:
We have orders for supplies and materials that are required in our equipment and are prepared to continue the globe.manufacturing of all our products. Further, TOMI registers marks in seven (7) classeshas multiple suppliers, outsourced engineers, and software programmers to turn to for the manufacturing and installation of specification of goods and services: Class 1 for Chemicals for Treating Hazardous Waste, Class 5 for Disinfectants, All-Purpose for Hard Surfaces and for Treating Mold, Class 7 for Handheld Power Operated Spraying Machines, Class 11 for Sterilizers for Medical Use and Air Purification, Class 35 for Business Consultation and Management Services, Class 37 for General Disinfecting Services, and Class 40 for Chemical Decontamination and Manufacturing Services.
| 35 |
| Table of Contents |
Financial Operations Overview
Our financial position as of December 31, 20202023 and 2019,2022, respectively, was as follows:
December 31, 2020 | December 31, 2019 | |
| Total shareholders’ equity | $13,203,000 | $890,000 |
| Cash and cash equivalents | $5,199,000 | $897,000 |
| Accounts receivable, net | $3,717,000 | $1,495,000 |
| Inventories, net | $3,782,000 | $2,315,000 |
| Prepaid expenses | $421,000 | $188,000 |
| Vendor Deposits | $389,000 | $141,000 |
| Other Receivables | $199,000 | $- |
| Current liabilities (excluding convertible notes) | $2,203,000 | $1,302,000 |
| Convertible notes payable, net | $- | $5,000,000 |
| Long-term liabilities | $1,364,000 | $1,034,000 |
| Working Capital (excluding convertible notes) | $11,503,000 | $3,734,000 |
| Working Capital (including convertible notes) | $11,503,000 | $(1,266,000) |
|
| December 31, 2023 |
|
| December 31, 2022 |
| ||
Total shareholders’ equity |
| $ | 8,359,000 |
|
| $ | 11,448,000 |
|
Cash and cash equivalents |
| $ | 2,339,000 |
|
| $ | 3,867,000 |
|
Deferred Revenue |
| $ | - |
|
| $ | 700,000 |
|
Accounts receivable – Current, net |
| $ | 2,430,000 |
|
| $ | 2,772,000 |
|
Inventories |
| $ | 4,627,000 |
|
| $ | 4,496,000 |
|
Prepaid expenses |
| $ | 371,000 |
|
| $ | 338,000 |
|
Vendor Deposits |
| $ | 29,000 |
|
| $ | 447,000 |
|
Other Receivables |
| $ | 164,000 |
|
| $ | 164,000 |
|
Accounts receivable – Long Term, net |
| $ | 206,000 |
|
|
|
|
|
Current liabilities – Excluding Deferred Revenue |
| $ | 2,058,000 |
|
| $ | 2,591,000 |
|
Long-term liabilities – Convertible Notes |
| $ | 2,298,000 |
|
| $ | - |
|
Long-term liabilities – Other |
| $ | 643,000 |
|
| $ | 761,000 |
|
Working Capital |
| $ | 7,903,000 |
|
| $ | 8,844,000 |
|
During the year ended December 31, 2020,2023, our debt and liquidity positions were affected by the following:
· | Net cash used in operations of approximately $3,599,000. | |
· | Net cash used in investing activities $217,000. | |
· | Net cash provided from financing activities $2,288,000. |
Results of Operations for the Year Ended December 31, 20202023 Compared to the Year Ended December 31, 2019
For The Years Ended December 31, | Change | |||
2020 | 2019 | $ | % | |
| Revenue, Net | $25,028,000 | $6,347,000 | $18,681,000 | 294% |
| Gross Profit | 15,043,000 | 3,914,000 | 11,129,000 | 284% |
Total Operating Expenses (1) | 10,534,000 | 5,997,000 | 4,537,000 | 76% |
| Income (Loss) from Operations | 4,509,000 | (2,083,000) | 6,592,000 | NM(2) |
| Total Other Income (Expense) | (40,000) | (214,000) | 174,000 | NM(2) |
| Provision for Income Taxes | (77,000) | - | (77,000) | NM(2) |
| Net Income (Loss) | $4,391,000 | $(2,297,000) | $6,689,000 | NM(2) |
| Basic Net Income (Loss) per share | $0.27 | $(0.15) | $0.42 | NM(2) |
| Diluted Net Income (Loss) per share | $0.23 | $(0.15) | $0.38 | NM(2) |
|
| For The Year Ended December 31, |
|
| Change |
| ||||||
|
| 2023 |
|
| 2022 |
|
| $ |
| |||
Revenue, Net |
| $ | 7,355,000 |
|
| $ | 8,338,000 |
|
| $ | (983,000 | ) |
Gross Profit |
|
| 4,290,000 |
|
|
| 5,060,000 |
|
|
| (770,000 | ) |
Total Operating Expenses (1) |
|
| 7,639,000 |
|
|
| 7,942,000 |
|
|
| (303,000 | ) |
Income (Loss) from Operations |
|
| (3,349,000 | ) |
|
| (2,882,000 | ) |
|
| (467,000 | ) |
Total Other Income (Expense) |
|
| (53,000 | ) |
|
| 2,000 |
|
|
| (55,000 | ) |
Provision for (benefit from) Income Taxes |
|
| - |
|
|
| - |
|
|
| - |
|
Net Income (Loss) |
| $ | (3,402,000 | ) |
| $ | (2,880,000 | ) |
|
| (522,000 | ) |
Basic Net Income (Loss) per share |
| $ | (0.17 | ) |
| $ | (0.15 | ) |
| $ | (0.02 | ) |
Diluted Net Income (Loss) per share |
| $ | (0.17 | ) |
| $ | (0.15 | ) |
| $ | (0.02 | ) |
Sales
During the years ended December 31, 20202023 and 2019,2022, we had net revenue of approximately $25,028,000$7,355,000 and $6,347,000,$8,338,000, respectively, representing an increasea decrease in revenue of approximately $18,681,000$983,000 or 294%12%. The increase in revenue was attributable to increased global demand for disinfection and infectious disease control products in response to the COVID-19 Pandemic. Although we saw a significant demand for our product within our Hospital-Healthcare, TSN, and Commercial divisions as a result of the COVID-19 Pandemic during the first half of 2020, we expect revenue to reflect steady growth as our customers update their operation requirements to include disinfecting and decontamination services into their regular routines for all potential pathogens and across all our divisions.
As customers mature through the product and adoption cycle and our sales pipeline converts to revenue, we expect to havegenerate more predictable sales quarter over quarter. Further, as the COVID-19 pandemic subsides,has subsided, we expect that the demand for our products and services will continue andas we are building a team to address the post COVID-19 pandemic market opportunities.
| 36 |
| Table of Contents |
Product and Service Revenue
For the Years Ended December 31, | Change | |||
2020 | 2019 | $ | % | |
| SteraMist Product | $22,971,000 | $4,999,000 | $17,972,000 | 360% |
| Service and Training | 2,057,000 | 1,348,000 | 709,000 | 53% |
| Total | $25,028,000 | $6,347,000 | $18,681,000 | 294% |
|
| For The Year Ended December 31, |
|
| Change |
| ||||||
|
| 2023 |
|
| 2022 |
|
| $ |
| |||
SteraMist Product |
| $ | 5,695,000 |
|
| $ | 6,864,000 |
|
| $ | (1,169,000 | ) |
Service and Training |
|
| 1,660,000 |
|
|
| 1,474,000 |
|
|
| 186,000 |
|
Total |
| $ | 7,355,000 |
|
| $ | 8,338,000 |
|
| $ | (983,000 | ) |
SteraMist product-based revenues for the years ended December 31, 2023 and 2022, were $5,695,000 and $6,864,000, representing a decrease of $1,169,000 when compared to the same prior year period.
Our service-based revenue for the years ended December 31, 2023 and 2022, was $1,660,000 and $1,474,000, respectively, representing a year over year increase of $186,000.
Revenue by Geographic Region
For The Years Ended December 31, | Change | |||
2020 | 2019 | $ | % | |
| United States | $18,367,000 | $5,002,000 | $13,365,000 | 267% |
| International | 6,661,000 | 1,345,000 | 5,316,000 | 395% |
| Total | $25,028,000 | $6,347,000 | $18,681,000 | 294% |
|
| For The Year Ended December 31, |
|
| Change |
| ||||||
|
| 2023 |
|
| 2022 |
|
| $ |
| |||
United States |
| $ | 6,125,000 |
|
| $ | 6,261,000 |
|
| $ | (136,000 | ) |
International |
|
| 1,230,000 |
|
|
| 2,077,000 |
|
|
| (847,000 | ) |
Total |
| $ | 7,355,000 |
|
| $ | 8,338,000 |
|
| $ | (983,000 | ) |
Our domestic revenue for the years ended December 31, 2023 and 2022, was $6,125,000 and $6,261,000, respectively, a decrease of $136,000 when compared to the same prior year period
Internationally, our revenue for the years ended December 31, 2023 and 2022, was approximately $1,230,000 and $2,077,000, respectively, representing a decrease of $847,000.
Cost of Sales
For The Years Ended December 31, | Change | |||
2020 | 2019 | $ | % | |
| Cost of Sales | $9,985,000 | $2,433,000 | $7,552,000 | 310% |
|
| For The Year Ended December 31, |
|
| Change |
| ||||||
|
| 2023 |
|
| 2022 |
|
| $ |
| |||
Cost of Sales |
| $ | 3,065,000 |
|
| $ | 3,278,000 |
|
| $ | (213,000 | ) |
Cost of sales was $9,985,000$3,065,000 and $2,433,000$3,278,000 for the yearyears ended December 31, 20202023 and 2019,2022, respectively, an increasea decrease of $7,552,000, or 310%,$213,000, compared to the prior year. The primary reason for the increasedecrease in cost of sales is attributablewas primarily due to the increase in revenue in the current year.lower sales. Our gross profit as a percentage of sales for the yearsyear ended December 31, 20202023 was 60.1%58.3% compared to 61.7%60.7% in the same prior period, respectively. The lower gross profit is attributable to the product mix in sales. As revenues continue to grow and we are able to negotiate more favorable pricing from our vendors, we anticipate that our cost per unit could decrease.
Professional Fees
For The Years Ended December 31, | Change | |||
2020 | 2019 | $ | % | |
| Professional Fees | $681,000 | $364,000 | $317,000 | 87% |
|
| For The Year Ended December 31, |
|
| Change |
| ||||||
|
| 2023 |
|
| 2022 |
|
| $ |
| |||
Professional Fees |
| $ | 576,000 |
|
| $ | 536,000 |
|
| $ | 40,000 |
|
Professional fees are comprised mainly of legal, accounting, and financial consulting fees.
Professional fees were $681,000$576,000 and $364,000$536,000 for the years ended December 31, 20202023 and 2019,2022, respectively, representing an increase of approximately $317,000, or 87%,$40,000 in the current year period. The increase is attributable to additional professionalhigher accounting and legal fees in connection with our up list to the Nasdaq.
| 37 |
| Table of Contents |
Depreciation and Amortization
For The Years Ended December 31, | Change | |||
2020 | 2019 | $ | % | |
| Depreciation and Amortization | $720,000 | $716,000 | $4,000 | 1% |
|
| For The Year Ended December 31, |
|
| Change |
| ||||||
|
| 2023 |
|
| 2022 |
|
| $ |
| |||
Depreciation and Amortization |
| $ | 367,000 |
|
| $ | 329,000 |
|
| $ | 38,000 |
|
Depreciation and amortization were approximately $720,000$367,000 and $716,000$329,000 for the years ended December 31, 20202023 and 2019,2022, respectively, representing an increase of $4,000,$38,000, or 1%12%.
Selling Expenses
For The Years Ended December 31, | Change | |||
2020 | 2019 | $ | % | |
| Selling Expenses | $1,247,000 | $1,655,000 | $(408,000) | (25)% |
|
| For The Year Ended December 31, |
|
| Change |
| ||||||
|
| 2023 |
|
| 2022 |
|
| $ |
| |||
Selling Expenses |
| $ | 1,351,000 |
|
| $ | 1,867,000 |
|
| $ | (516,000 | ) |
Selling expenses for the year ended December 31, 20202023 were approximately $1,247,000,$1,351,000, as compared to $1,655,000$1,867,000 for the year ended December 31, 2019,2022, representing a decrease of approximately $408,000$516,000, or 25%28%.
Research and Development
For the Years Ended December 31, | Change | |||
2020 | 2019 | $ | % | |
| Research and Development | $455,000 | $341,000 | $114,000 | 33% |
|
| For The Year Ended December 31, |
|
| Change |
| ||||||
|
| 2023 |
|
| 2022 |
|
| $ |
| |||
Research and Development |
| $ | 492,000 |
|
| $ | 352,000 |
|
| $ | 140,000 |
|
Research and development expenses for the year ended December 31, 20202023 were approximately $455,000,$492,000, as compared to $341,000$352,000 for the year ended December 31, 2019,2022, representing an increase of approximately $114,000,$140,000, or 33%40%. The increase in in research and development expenses is attributable to newdue testing and product development in connection with the SteraMist Hybrid, Transport and increased testing.
For The Years Ended December 31, | Change | |||
2020 | 2019 | $ | % | |
| Equity Compensation Expense | $3,131,000 | $114,000 | $3,017,000 | 2,646% |
Consulting Fees
|
| For The Year Ended December 31, |
|
| Change |
| ||||||
|
| 2023 |
|
| 2022 |
|
| $ |
| |||
Consulting Fees |
| $ | 283,000 |
|
| $ | 215,000 |
|
| $ | 68,000 |
|
Consulting fees were $283,000 and $114,000$215,000 for the years ended December 31, 20202023 and 2019,2022, respectively, representing an increase of $3,017,000$68,000, or 2,646%32%. The increase in equity compensation expense relates to the timing of warrants issued to executives and consultants in 2020.
For the Years Ended December 31, | Change | |||
2020 | 2019 | $ | % | |
| Consulting Fees | $327,000 | $127,000 | $200,000 | 157% |
| 38 |
| Table of Contents |
General and Administrative Expense
For The Years Ended December 31, | Change | |||
2020 | 2019 | $ | % | |
| General and Administrative | $3,972,000 | $2,681,000 | $1,291,000 | 48% |
|
| For The Year Ended December 31, |
|
| Change |
| ||||||
|
| 2023 |
|
| 2022 |
|
| $ |
| |||
General and Administrative |
| $ | 4,571,000 |
|
| $ | 4,643,000 |
|
| $ | (72,000 | ) |
General and administrative expense includes salaries and payroll taxes, rent, insurance expense, utilities, office expense, and product registration costs.
General and administrative expense was $3,972,000$4,571,000 and $2,681,000$4,643,000 for the years ended December 31, 20202023 and 2019,2022, respectively, an increasea decrease of $1,291,000, or 48%,$72,000 in the current year period. The increasedecrease in Generalgeneral and administrative expense is primarily attributable to a higher employee headcount and higher wages as well as an increaselower equity-based compensation in international product registration.
Other Income and Expense
For The Years Ended December 31, | Change | |||
2020 | 2019 | $ | % | |
| Amortization of Debt Discounts | $- | $(18,000) | $18,000 | NM |
| Interest Income | 2,900 | 3,000 | (100) | (3)% |
| Interest Expense | (44,000) | (200,000) | 156,000 | (78)% |
| Other Income (Expense) | $(41,100) | $(215,000) | $173,900 | (81)% |
|
| For The Year Ended December 31, |
|
| Change |
| ||||||
|
| 2023 |
|
| 2022 |
|
| $ |
| |||
|
|
|
|
|
|
|
|
|
| |||
Interest Income |
|
| 12,000 |
|
|
| 2,000 |
|
|
| 10,000 |
|
Interest Expense |
|
| (65,000 | ) |
|
| - |
|
|
| (65,000 | ) |
Other Income (Expense) |
| $ | (53,000 | ) |
| $ | 2,000 |
|
| $ | (55,000 | ) |
Amortization of debt discountdeferred financing costs was approximately $10,000 and $0 for the year ended December 31, 2023 and $18,0002022, respectively. This represents the amortization of costs incurred in connection with the convertible notes.
Interest income was approximately $12,000 and $2,000 for the years ended December 31, 20202023 and 2019,2022, respectively. Amortization of debt discount for the year ended December 31, 2019, consisted of the amortization of debt discount on the $6,000,000 principal amount of Notes issued in March and May 2017. The debt discount was amortized over the life of the Notes utilizing the effective interest method.
Interest expense was $44,000 and $200,000 for the years ended December 31, 2020 and 2019, respectively. Interest expense for the years ended December 31, 2020 and 2019 primarily consisted of the interest incurred on the $6,000,000 principal amount of Notes issued in March and May 2017 of which $4,500,000 was converted to common stock in March, 2020 and the remaining $500,000 was paid in cash in March 2020.
For The Years Ended December 31, | Change | |||
2020 | 2019 | $ | % | |
| Provision for Income Taxes | $77,000 | $- | $77,000 | NM |
Provision for Income Taxes
For The Years Ended December 31, | Change | |||||||||||
2023 | 2022 | $ | ||||||||||
Provision for Income Tax Expense (Benefit) | $ | - | $ | - | $ | - | ||||||
Provision for income tax was $0 for the years ended December 31, 2023 and 2022.
Liquidity and Capital Resources
As of December 31, 2020,2023, we had cash and cash equivalents of $5,199,000approximately $2,339,000 and working capital of $11,503,000.$7,903,000. Our principal capital requirements are to fund operations, invest in research and development and capital equipment, and the continued costs of compliance with public company filingreporting requirements. We have historically funded our operations through funds generated through operations and debt and equity financings.
| 39 |
| Table of Contents |
For the year ended December 31, 2020 we generated income from operations of $4,509,0002023 and for the year ended December 31, 2019,2022, we incurred losses from operations of ($2,083,000).3,349,000) and ($2,882,000), respectively. Cash provided fromused in operations for the year ended December 31, 2020,2023 and 2022, was $4,578,000. Cash used in operations was ($814,000) for the year ended December 31, 2019.
A breakdown of our statement of cash flows for the year ended December 31, 20202023 and 20192022 is provided below:
For the Year Ended December 31, | ||
2020 | 2019 | |
| Net Cash Provided By (Used) in Operating Activities | $4,578,000 | $(814,000) |
| Net Cash Used in Investing Activities | $(401,000) | $(293,000) |
| Net Cash Provided By Financing Activities: | $124,000 | $- |
|
| For the Year Ended December 31, |
| |||||
|
| 2023 |
|
| 2022 |
| ||
Net Cash Provided By (Used) in Operating Activities |
| $ | (3,599,000 | ) |
| $ | (1,234,000 | ) |
Net Cash Used in Investing Activities |
| $ | (217,000 | ) |
| $ | (241,000 | ) |
Net Cash Provided By Financing Activities: |
| $ | 2,288,000 |
|
| $ | 25,000 |
|
Operating Activities
Cash provided byused in operating activities
Investing Activities
Cash used in investing activities
for the years ended December 31,Financing Activities
Cash provided by financing activities for the years ended December 31, 20202023 and 20192022 was $124,000$2,288,000 and $0,$25,000 respectively. The cash provided by financing activities increased in the current period due toas a result of the proceeds from the exercise of warrants and options in the amount of $214,000 and proceeds from loans payable of $411,000 offset by repayment of the principal balance of the convertible notes issued in October and November of $500,000.
Liquidity
Our revenues can fluctuate due to the following factors, among others:
· | ramp up and expansion of our internal sales force and manufacturer’s representatives; | |
· | length of our sales cycle; | |
· | global and regional response to the outbreak of infectious diseases; | |
· | expansion into new territories and markets; and | |
· | timing of orders from distributors. |
We could incur operating losses and an increase of costs related to the continuation of product and technology development, and sales expense as we continue to grow our sales teams, inventory as we continue to ensure we have products needed and geographic presence, tooling capital expenditures as we ramp up and streamline our production and administrative activities including compliance with the Sarbanes-Oxley Act of 2002 Section 404.
Management has taken and will endeavor to continue to take a number of actions in order to improve our results of operations and the related cash flows generated from operations in order to strengthen our financial position, including the following items:
· | expanding our label with the EPA to further our product registration internationally; | |
· | continued expansion of our internal sales force and manufacturer representatives in an effort to drive global revenue in all verticals; | |
· | continue research and development and add new products to our “Stera” product line; | |
· | source alternative lower-cost suppliers; | |
· | expansion of international distributors; and | |
· | continued growth in all of our verticals. |
| 40 |
| Table of Contents |
During 2022 and 2023, we experienced increased demand for our label withCES where we collect deposits upon the EPAexecution of the contract. The deposits we receive fund the production for the CES and improve our overall liquidity through the duration of the project. We believe our sales for our CES will continue to furthergrow in 2024 and improve our product registration internationally;
We expect that the cash we generate from our core operations will generally be sufficient to cover our future capital expenditures and to pay down our near-term debt obligations, although we may choose to seek alternative financing sources.
We believe that our existing balance of cash and cash equivalents and amounts expected to be provided by operations will provide us with sufficient financial resources to meet our cash requirements for operations, working capital and capital expenditures over the next twelve months.
We believe strongly that the current and historical trading prices of our Common Stock is depressed and does not reflect the actual valuation of the Company, and that our declining trading price was the result of active short selling and market manipulation at the close using the cross at the end of many days by certain investors in the market that is outside the control of the Company. While short selling may be permitted in some cases under applicable laws, we believe that certain investors, particularly those investing in small and microcap companies like TOMI, may be circumventing regulatory requirements and conducting aggressive short selling that is designed to drive down the trading price of our Common Stock, including naked short selling tactics. These activities have not only depressed our stock price, but also reduced the trading liquidity of our stock and caused damage to our reputation, while making it more difficult for us to secure financing to fund our operations and comply with NASDAQ’s minimum bid price requirements. We believe that the regulatory authorities, such as the SEC and FINRA, should take more aggressive enforcement actions against short selling traders who are undermining the values of microcap companies, and we will continue our various efforts and strategies to ensure that trading price of our stock reflects the true value of TOMI and generates positive returns for our shareholders.
On November 7, 2023, we entered into a Securities Purchase Agreement (the “SPA”) with certain accredited investors (collectively, the “Investors”) pursuant to which we agreed to sell and issue to the Investors in a private placement transaction (the “Private Placement”) in one or more closings up to an aggregate principal amount of $5,000,000 (the “Notes”). As of November 7, 2023, we issued and sold an aggregate of $2,600,000 of Notes to certain Investors pursuant to the SPA.
The gross proceeds from the transaction are approximately $2,600,000, before deducting the placement agent’s fees and other estimated offering expenses. We intend to use the net proceeds from this offering for working capital and other general corporate purposes. The initial closing of the Private Placement occurred on November 7, 2023.
The Notes are due on the fifth anniversary of the issuance date of the Notes and bear simple interest at a rate of 12% per annum, payable in equal monthly installments. The Notes are convertible into shares of our Common Stock, at the option of the holder, at a conversion price of $1.25 per share, which shall not exceed $1.55 per share. In addition, we can require Investors to convert the Notes at the then current conversion price at any time after 90 days from the issue date if the Common Stock has a closing bid price of $1.55 per share or higher on any twenty days within a thirty day period of consecutive trading days, or if a “fundamental change” occurs (as defined in the SPA). The Notes are unsecured and senior to other indebtedness subject to certain exceptions.
Critical Accounting Policies and Estimates
Our discussion and analysis of our financial condition and results of operations is based upon our consolidated financial statements, which have been prepared in accordance with accounting principles generally accepted in the United States. The preparation of these financial statements requires us to make estimates and judgments that affect the reported amounts of assets, liabilities, revenues and expenses, and related disclosure of contingent assets and liabilities. The estimation process requires assumptions to be made about future events and conditions, and as such, is inherently subjective and uncertain. Actual results could differ materially from our estimates.
| 41 |
| Table of Contents |
The SEC defines critical accounting policiesestimates as those that are, in management’s view, most important to the portrayal of our financial condition and results of operations and most demanding of our judgment. We consider the following policiesestimates to be critical to an understanding of our consolidated financial statements and the uncertainties associated with the complex judgments made by us that could impact our results of operations, financial position and cash flows.
Revenue Recognition
We recognize revenue in accordance with Financial Accounting Standards Board (FASB) Accounting Standards Update (ASU) No. 2014-09, Revenue from Contracts with Customers (Topic 606). We recognize revenue when we transfer promised goods or services to customers in an amount that reflects the consideration to which we expect to be entitled in exchange for those goods or services. To determine revenue recognition for contracts with customers we perform the following five steps: (i) identify the contract(s) with a customer; (ii) identify the performance obligation(s) in the contract; (iii) determine the transaction price; (iv) allocate the transaction price to the performance obligation(s) in the contract; and (v) recognize revenue when (or as) we satisfy the performance obligation(s). At contract inception, we assess the goods or services promised within each contract, assess whether each promised good or service is distinct and identify those that are performance obligations.
We must use judgment to determine: a) the number of performance obligations based on the determination under step (ii) above and whether those performance obligations are distinct from other performance obligations in the contract; b) the transaction price under step (iii) above; and c) the stand-alone selling price for each performance obligation identified in the contract for the allocation of transaction price in step (iv) above.
Title and risk of loss generally pass to our customers upon shipment. Our Customerscustomers include end users as well as dealers and distributors who market and sell our products. Our revenue is not contingent upon resale by the dealer or distributor, and we have no further obligations related to bringing about resale. Shipping and handling costs charged to customers are included in Product Revenues. The associated expenses are treated as fulfillment costs and are included in Cost of Revenues. Revenues are reported net of sales taxes collected from Customers.
Product revenue includes sales from our standard and customized equipment, solution and accessories sold with our equipment. Revenue is recognized upon transfer of control of promised products to customers in an amount that reflects the consideration we expect to receive in exchange for those products.
Service and training revenue include sales from our high-level decontamination and service engagements, validation of our equipment and technology and customer training. Service revenue is recognized as the agreed upon services are rendered to our customers in an amount that reflects the consideration we expect to receive in exchange for those services.
Estimated allowances for sales returns are recorded as sales are recognized. We use a specific identification method based on subsequent product return activity and historical average calculation to estimate the allowance for sales returns.
Costs to Obtain a Contract with a Customer
We apply a practical expedient to expense costs as incurred for costs to obtain a contract with a customer when the amortization period would have been one year or less. We generally expense sales commissions when incurred because the amortization period would have been one year or less. These costs are recorded within selling expenses.
Contract Balances
As of December 31, 2020,2023, and December 31, 20192022 we did not have any unsatisfied performance obligations for (i) contracts with an original expected length of one year or less and (ii) contracts for which we recognize revenue at the amount to which we have the right to invoice for services performed.
Arrangements with Multiple Performance Obligations
Our contracts with customers may include multiple performance obligations. We enter into contracts that can include various combinations of products and services, which are primarily distinct and accounted for as separate performance obligations.
Our contracts with customers for products and services often dictate the terms and conditions of when the control of the promised products or services is transferred to the customer and the amount of consideration to be received in exchange for the products and services.
Use of Estimates
The preparation of consolidated financial statements in conformity with U.S. GAAP requires us to make estimates and assumptions that affect the amounts reported and disclosed in the accompanying consolidated financial statements and the accompanying notes. Actual results could differ materially from these estimates. On an ongoing basis, we evaluate our estimates, including those related to accounts receivable, inventory, fair values of financial instruments, intangible assets, useful lives of intangible assets and property and equipment, fair values of stock-based awards, income taxes, and contingent liabilities, among others. We base our estimates on historical experience and on various other assumptions that are believed to be reasonable, the results of which form the basis for making judgments about the carrying values of our assets and liabilities.
Accounts Receivable
Our accounts receivable are typically from credit worthy customers or, for certain international customers, are supported by pre-payments. For those customers to whom we extend credit, we perform periodic evaluations of them and maintain allowances for potential credit losses as deemed necessary. We have a policy of reserving for doubtful accountscredit losses based on our best estimate of the amount of potential credit losses in existing accounts receivable. We periodically review our accounts receivable to determine whether an allowance is necessary based on an analysis of past due accounts and other factors that may indicate that the realization of an account may be in doubt. Account balances deemed to be uncollectible are charged to the allowance after all means of collection have been exhausted and the potential for recovery is considered remote.
Inventories
Inventories are valued at the lower of cost or marketnet realizable value using the first-in, first-out (FIFO) method. Inventories consist primarily of finished goods.
We review inventory on an ongoing basis, considering factors such as deterioration and obsolescence. We record an allowance for estimated losses when the facts and circumstances indicate that particular inventories may not be usable.
Long-Lived Assets Including Acquired Intangible Assets
We assess long-lived assets for potential impairments at the end of each year, or during the year if an event or other circumstance indicates that we may not be able to recover the carrying amount of the asset. In evaluating long-lived assets for impairment, we measure recoverability of these assets by comparing the carrying amounts to the future undiscounted cash flows the assets are expected to generate. If our long-lived assets are considered to be impaired, the impairment to be recognized equals the amount by which the carrying value of the asset exceeds its fair market value. We base the calculations of the estimated fair value of our long-lived assets on the income approach. For the income approach, we use an internally developed discounted cash flow model that includes, among others, the following assumptions: projections of revenues and expenses and related cash flows based on assumed long-term growth rates and demand trends; expected future investments to grow new units; and estimated discount rates. We base these assumptions on our historical data and experience, industry projections, micro and macro general economic condition projections, and our expectations. We had no long-lived asset impairment charges for the years ended December 31, 20202023 and 2019.
Recently issued accounting pronouncements not yet adopted
In November 2023, the Financial Accounting Pronouncements
| 43 |
| Table of Contents |
In August 2018,December 2023, the FASB issued ASU No. 2018-15, “Intangibles-Goodwill and Other-Internal-Use Software2023-09, Improvements to Income Tax Disclosures (Topic 350): Customer’s Accounting for Implementation Costs Incurred in740). The ASU requires disaggregated information about a Cloud Computing Arrangement That is a Service Contract.” This new guidance aligns the requirements for capitalizing implementation costs incurred in a hosting arrangement that is a service contract with the requirements for capitalizing implementation costs incurred to develop or obtain internal-use software. This new guidancereporting entity’s effective tax rate reconciliation as well as additional information on income taxes paid. The ASU is effective on a prospective basis for annual periods beginning after December 15, 2024. Early adoption is also permitted for annual financial statements that have not yet been issued or retrospective basis beginningmade available for issuance. This ASU will result in the required additional disclosures being included in our consolidated financial statements, once adopted.
Recently adopted accounting pronouncements
In March 2022, the FASB issued ASU 2022-02, Troubled Debt Restructurings and Vintage Disclosures. This ASU eliminates the accounting guidance for troubled debt restructurings by creditors that have adopted ASU 2016-13, Measurement of Credit Losses on Financial Instruments, which we adopted on January 1, 2020, with early adoption permitted.2020. This ASU also enhances the disclosure requirements for certain loan refinancing and restructurings by creditors when a borrower is experiencing financial difficulty. In addition, the ASU amends the guidance on vintage disclosures to require entities to disclose current period gross write-offs by year of origination for financing receivables and net investments in leases within the scope of ASC 326-20. The ASU is effective for annual periods beginning after December 15, 2022, including interim periods within those fiscal years. We elected to adopt this guidance early, in 2020adopted the ASU prospectively on a prospective basis. The new guidanceJanuary 1, 2023. This ASU did not have a material impact on our Consolidatedconsolidated financial statements.
In October 2021, the FASB issued ASU No. 2021-08, Accounting for Contract Assets and Contract Liabilities from Contracts with Customers (Topic 805). This ASU requires an acquirer in a business combination to recognize and measure contract assets and contract liabilities (deferred revenue) from acquired contracts using the revenue recognition guidance in Topic 606. At the acquisition date, the acquirer applies the revenue model as if it had originated the acquired contracts. The ASU is effective for annual periods beginning after December 15, 2022, including interim periods within those fiscal years. We adopted this ASU prospectively on January 1, 2023. This ASU did not have a material impact on our consolidated financial statements.
In August 2020, the FASB issued ASU No. 2020-06, Debt—Debt with Conversion and Other Options (Subtopic 470-20) and Derivatives and Hedging—Contracts in Entity’s Own Equity (Subtopic 815-40): Accounting for Convertible Instruments and Contracts in an Entity’s Own Equity. ASU 2020-06 was issued to reduce the complexity associated with accounting for certain financial instruments with characteristics of liabilities and equity. ASU 2020-06 reduces the number of accounting models for convertible debt instruments and convertible preferred stock and improves the disclosures for convertible instruments and related earnings per share guidance. ASU 2020-06 also amends the guidance for the derivatives scope exception for contracts in an entity’s own equity and improves and amends the related earnings per share guidance. For public entities that qualify as a filer with the SEC, excluding entities eligible to be smaller reporting companies, ASU 2020-06 is effective for fiscal annual periods beginning after December 15, 2021, including interim periods within those fiscal years. For nonpublic entities, ASU 2020-06 is effective for fiscal years beginning after December 15, 2023, including interim periods within those fiscal years. Early adoption was permitted, but no earlier than fiscal years beginning after December 15, 2020, including interim periods within those fiscal years. ASU 2020-06 must be adopted as of the beginning of a company’s annual fiscal year. ASU 2020-06 may be adopted through either a modified retrospective method of transition or a fully retrospective method of transition. The Company adopted ASU 2020-06 on January 1, 2021. The adoption did not have an impact on our consolidated financial statements.
In June 2016, the FASB issued ASU 2016-13, Financial Statements.
Item 7A.
Not required.
| 44 |
| Table of Contents |
Item 8.
The financial statements required by this item are included in Part IV, Item 15 of this Annual Report on Form 10-K, beginning on page F-1, and are incorporated by reference herein.
Item 9.
None.
Item 9A.
Evaluation of Disclosure Controls and Procedures
Our management with the participation of our Principal Executive Officer and Principal Financial Officer, conducted an evaluation of the effectiveness of our disclosure controls and procedures (as is defined in Rules 13a-15(e) and 15d-15(e) under the Exchange Act) as of the end of the period covered by this Annual Report on Form 10-K. Our disclosure controls and procedures are intended to ensure that the information we are required to disclose in the reports that we file or submit under the Exchange Act is (i) recorded, processed, summarized and reported within the time periods specified in the SEC’s rules and forms and (ii) accumulated and communicated to our management, including the Principal Executive Officer and Principal Financial Officer, to allow timely decisions regarding required disclosures.
Based on that evaluation, our Principal Executive Officer and Principal Financial Officer have concluded that, as of the end of the period covered by this Annual Report, our disclosure controls and procedures were effective.designed, implemented and operating effectively. Our management has concluded that the financial statements included in this Annual Report on Form 10-K present fairly, in all material respects, our financial position, results of operations and cash flows for the periods presented in conformity with generally accepted accounting principles.
Our disclosure controls and procedures are designed to provide reasonable assurance of achieving the desired control objectives. Our management recognizes that any control system, no matter how well designed and operated, is based upon certain judgments and assumptions and cannot provide absolute assurance that its objectives will be met. In addition, the design of disclosure controls and procedures must reflect the fact that there are resource constraints and that management is required to apply judgment in evaluating the benefits of possible controls and procedures relative to their costs. Similarly, an evaluation of controls cannot provide absolute assurance that misstatements due to error or fraud will not occur or that all control issues and instances of fraud, if any, have been detected.
Management’s Annual Report on Internal Control Over Financial Reporting
Management is responsible for establishing and maintaining adequate internal control over our financial reporting (as defined in Rule 13a-15(f) and 15d-15(f) under the Exchange Act). Internal control over financial reporting is a process designed to provide reasonable assurance regarding the reliability of financial reporting and the preparation of financial statements for external purposes in accordance with accounting principles generally accepted in the United States.
Our internal control over financial reporting includes those policies and procedures that (i) pertain to the maintenance of records that, in reasonable detail, accurately and fairly reflect the transactions and dispositions of our assets, (ii) provide reasonable assurance that transactions are recorded as necessary to permit preparation of financial statements in accordance with accounting principles generally accepted in the United States of America, and that our receipts and expenditures are being made only in accordance with authorizations of our management and directors, and (iii) provide reasonable assurance regarding prevention or timely detection of unauthorized acquisition, use or disposition of our assets that could have a material effect on the financial statements. Because of its inherent limitations, internal control over financial reporting may not prevent or detect misstatements. Also, projections of any evaluation of effectiveness to future periods are subject to the risk that controls may become inadequate because of changes in conditions, or that the degree of compliance with the policies or procedures may deteriorate.
Changes in Internal Control Over Financial Reporting
During our most recent fiscal quarter, there have been no changes in our internal control over financial reporting that have materially affected or are reasonably likely to materially affect our internal control over financial reporting.
| 45 |
| Table of Contents |
Item 9B. OTHEROTHER INFORMATION
During the three months ended December 31, 2023, no director or officer of the Company adopted or terminated a “Rule 10b5-1 trading arrangement” or “non-Rule 10b5-1 trading arrangement,” as each term is defined in Item 408(a) of Regulation S-K.
Item 9C. DISCLOSURE REGARDING FOREIGN JURISDICTIONS THAT PREVENT INSPECTIONS
Not applicable.
| 46 |
| Table of Contents |
PART III
Item 10.
Our directors and executive officers and their ages and positions as of March 21, 20217, 2023 are presented below.
Name | Age | Position | ||
Halden S. Shane | 79 | Chief Executive Officer and Chairman of the Board | ||
Elissa J. Shane | 44 | Chief Operating Officer and Director | ||
Nick Jennings | 46 | Chief Financial Officer | ||
Walter C. Johnsen | 73 | Director | ||
Kelly J. Anderson | 56 | Director | ||
Lim Boh Soon | 68 | Director | ||
Halden S. Shane
: Dr. Shane has been our Chief Executive Officer and Chairman of the Board since October 15, 2007, when we commenced our current operations. Dr. Shane also served as President and CEO of Tiger Management International, a private management company that deals in business management of private and public companies. Dr. Shane resigned all positions and closed Tiger Management International in 2009. Dr. Shane was founder and CEO of Integrated Healthcare Alliance, Inc. and also founder and General Partner of Doctors Hospital West Covina, California. Prior thereto, Dr. Shane practiced Podiatric Surgery specializing in ankle arthroscopy. Dr. Shane received his Bachelor of Science degree from the University of Miami in 1969, his Bachelor of Medical Science degree from California College of Podiatric Medicine in 1971, and his Doctor of Podiatric Medicine Degree from the California College of Podiatric Medicine in 1973. He is Board Certified by the American Board of Podiatric Surgery, American Board of Orthopedics, and the American Board of Quality Assurance and Review. Dr.Elissa J. Shane
: Ms. Shane has been our Chief Operating Officer since January 2018. On July 30, 2021, at the recommendation of the Nominating and Governance Committee, the Board appointed Ms. Elissa J. Shane to serve as a member of the Board. Previously, she served as our Chief Regulatory and Compliance Officer from September 2015 to December 2017 and as our Corporate Secretary in 2016. From January 2014 to September 2015, Ms. ShaneNick Jennings
: Mr. Jennings has been our Chief Financial Officer since October 2014. From July 2014 until his employment by the Company, Mr. Jennings was self-employed and provided consulting, accounting and tax compliance services to private-owned companies. From November 2006 until June 2014, Mr. Jennings was a senior manager at Richardson Kontogouris Emerson LLP, where he worked with various public and private companies providing services in a variety of business areas including tax compliance, tax consulting, general accounting, and business assurance. He is a graduate of Loyola Marymount College with a degree in accounting and is a member of the American Institute of Certified Public Accountants.Walter C. Johnsen
:Mr. Johnsen has been one of our directors since January 29, 2016. Since January 1, 2007, Mr. Johnsen has served as Chairman of the Board and Chief Executive Officer of Acme United Corporation, a leading worldwide supplier of innovative branded cutting, measuring and safety products in the school, home, office, hardware & industrial markets. From November 30, 1995 to December 31, 2006, he held the titles of President and Chief Executive Officer at Acme United. Mr. Johnsen previously served as Vice Chairman and a principal of Marshall Products, Inc., a medical supply distributor. Mr. Johnsen holds a Bachelor of Science in Chemical Engineering and a Master of Science in Chemical Engineering from Cornell University, and a Master of Business Administration from Columbia University. The Board concluded that Mr. Johnsen’s business and operations experience allows him to serve as one of our directors.| 47 |
| Table of Contents |
Kelly J. Anderson
:Ms. Anderson has been one of our directors since January 29, 2016. Ms. Anderson is the Chief Executive Officer of CXO Executive Solutions, LLC, a provider of executive services.Dr. Lim Boh Soon
: Dr. Lim Boh Soon: Dr. Lim has served as a member of the Board since January 2018. Dr. Lim has more thanFamily Relationships
Ms. Elissa J. Shane, our Chief Operating Officer and Director, is the daughter of Dr. Halden Shane, our Chief Executive Officer and Chairman of the Board.
Board Composition
The Board currently consists of five members. Our bylaws provide that our directors will holddivided into three classes, with each class holding office for a three-year term. Each director serves until their successors have beenhis or her successor is duly elected and qualified.qualified, or until his or her earlier resignation or removal. Our Board is responsible for the business and affairs of our Company and considers various matters that require its approval. Our executive officers are appointed by our Board and serve at its discretion.
Audit Committee
Our Audit Committee was established in June 2009 and currently is comprised of Ms. Anderson, Mr. Johnsen and Dr. Lim. Ms. Anderson serves as chairperson of the Audit Committee. The Company relies on the exemption related to Mr. Johnsen’s lack of standingBoard has determined that Ms. Anderson qualifies as aan audit committee financial expert since a majoritywithin the meaning of SEC regulations and meets Nasdaq’s financial sophistication requirements. In making this determination, the Audit Committee was comprised ofBoard has considered Ms. Anderson’s extensive financial expertsexperience and does not believe the committee composition materially affects its ability to act independently.business background.
The Audit Committee operates under a written charter, which is available at http://investor.tomimist.com/corporate-governance/audit-committee-charter. The purpose of the Audit Committee is to assist the Board in monitoring the integrity of the annual, quarterly and other financial statements of the Company, the independent auditor’s qualifications and independence, the performance of the Company’s independent auditors and the compliance by the Company with legal and regulatory requirements. The Audit Committee also reviews and approves all related-party transactions. Our Board has determined that Ms. Anderson is an “audit committee financial expert” as defined by the regulations promulgated by the SEC.
| 48 |
| Table of Contents |
Code of Ethics
The Board adopted a Code of Ethics in 2008 that applies to, among other persons, Board members, officers
1. | honest and ethical conduct including the ethical handling of actual or apparent conflicts of interest between personal and professional relationships; | |
2. | full, fair, accurate, timely and understandable disclosure in reports and documents that we file with or submit to the SEC and in other public communications made by us; | |
3. | compliance with applicable governmental laws, rules and regulations; | |
4. | the prompt internal reporting of violations of the Code of Ethics to an appropriate person or persons identified in the Code of Ethics; and | |
5. | accountability for adherence to the Code of Ethics. |
Item 11.
Summary
Compensation TableThe following table sets forth the total compensation paid to or earned by our named executive officers for the years ended December 31, 20202023 and 2019,2022, respectively:
| Name and Principal Position | Year | Salary ($) | Bonus ($) | Stock Awards ($) (1) | Option/ Warrant Awards ($) (1) | All Other Compensation ($) | Total ($) |
| Halden S. Shane | 2020 | 400,833 | — | — | 2,835,090(2) | — | 3,235,923 |
| Chairman and CEO (2) | 2019 | 360,000 | — | — | 89,654(3) | — | 449,654 |
| Elissa J. Shane (4) | 2020 | 226,083 | 40,000(8) | — | 226,950(4) | 13,500(4) | 506,533 |
| COO | 2019 | 200,000 | 7,500(8) | — | 23,595(5) | 9,000(5) | 240,095 |
| Nick Jennings (6) | 2020 | 165,225 | 50,000(8) | — | 24,846(6) | — | 240,071 |
| CFO | 2019 | 155,000 | 5,000(8) | — | 4,483(7) | — | 164,483 |
Name and Principal Position |
| Year |
| Salary ($) |
|
| Bonus ($) |
|
| Stock Awards ($) (1) |
|
| Option/ Warrant Awards ($) (1) |
|
| All Other Compensation ($) |
|
| Total ($) |
| ||||||
|
|
|
|
|
|
|
|
|
|
|
|
|
|
|
|
|
|
|
|
| ||||||
Halden S. Shane |
| 2023 |
|
| 605,000 |
|
|
| - |
|
|
| - |
|
|
| 75,635 |
|
|
| 9,000 |
|
|
| 689,635 |
|
Chairman and CEO (2) |
| 2022 |
|
| 550,000 |
|
|
| - |
|
|
| - |
|
|
| 178,281 | (3) |
|
| 9,000 |
|
|
| 737,281 |
|
|
|
|
|
|
|
|
|
|
|
|
|
|
|
|
|
|
|
|
|
|
|
|
|
|
|
|
Elissa J. Shane (4) |
| 2023 |
|
| 326,700 |
|
|
| - |
|
|
| - |
|
|
| 37,817 |
|
|
| 12,000 |
|
|
| 376,517 |
|
COO |
| 2022 |
|
| 297,000 |
|
|
| - |
|
|
| - |
|
|
| 59,427 | (3) |
|
| 13,500 |
|
|
| 369,927 |
|
|
|
|
|
|
|
|
|
|
|
|
|
|
|
|
|
|
|
|
|
|
|
|
|
|
|
|
Nick Jennings (6) |
| 2023 |
|
| 211,750 |
|
|
| - |
|
|
| - |
|
|
| 18,909 |
|
|
| - |
|
|
| 230,659 |
|
CFO |
| 2022 |
|
| 192,500 |
|
|
| - |
|
|
| - |
|
|
| 41,340 | (3) |
|
| - |
|
|
| 233,840 |
|
(1) | The amounts shown in this column represent the aggregate grant date fair value of stock, option and/or warrant award, as applicable, granted during the year computed in accordance with FASB ASC Topic 718. See Note 2 of the notes to our audited consolidated financial statements contained in this Annual Report on Form 10-K for a discussion of valuation assumptions made in determining the grant date fair value of the awards. | |
(2) | During the year ended December 31, 2023, we issued an option to purchase 100,000 shares of common stock to our Chief Executive Officer at an exercise price of $0.85 per share pursuant to an employment agreement. The option was valued at $76,635 and has a contractual term of 10 years. We utilized the Black-Scholes model to fair value the option received by our Chief Executive Officer with the following assumptions: volatility, 139%; expected dividend yield, 0%; risk free interest rate, 3.59%; and an expected life of 10 years. The grant date fair value of each share of common stock underlying the option was $0.76. Please refer to Item 11 Employment Agreements for additional details of Dr. Shane’s annual compensation. | |
(3) | During the year ended December 31, 2022, we issued an option to purchase 172,500 shares of common stock to our Chief Executive Officer at an exercise price of $1.12 per share pursuant to an employment agreement. The option was valued at $178,281 and has a contractual term of 10 years. We utilized the Black-Scholes model to fair value the option received by our Chief Executive Officer with the following assumptions: volatility, 156%; expected dividend yield, 0%; risk free interest rate, 1.65%; and an expected life of 5 years. The grant date fair value of each share of common stock underlying the option was $1.03. | |
(4) | During the year ended December 31, 2023, we issued an option to purchase 50,000 shares of common stock to our Chief Operating Officer at an exercise price of $0.85 per share pursuant to an employment agreement. The option was valued at $37,817 and has a contractual term of 10 years. We utilized the Black-Scholes model to fair value the option received by our Chief Executive Officer with the following assumptions: volatility, 139%; expected dividend yield, 0%; risk free interest rate, 3.59%; and an expected life of 10 years. The grant date fair value of each share of common stock underlying the option was $0.76. The other compensation in the amount of $12,000 represents an auto allowance pursuant to Ms. Shane’s employment agreement. Please refer to Item 11 Employment Agreements for additional details of Ms. Shane’s annual compensation. | |
(5) | During the year ended December 31, 2022, we issued an option to purchase 57,500 shares of common stock to our Chief Operating Officer at an exercise price of $1.12 per share pursuant to an employment agreement. The option was valued at $59,427 and has a contractual term of 10 years. We utilized the Black-Scholes model to fair value the option received by our Chief Executive Officer with the following assumptions: volatility, 156%; expected dividend yield, 0%; risk free interest rate, 1.65%; and an expected life of 5 years. The grant date fair value of each share of common stock underlying the option was $1.03. | |
(6) | During the year ended December 31, 2023, we issued an option to purchase 25,000 shares of common stock to our Chief Financial Officer at an exercise price of $0.85 per share pursuant to an employment agreement. The option was valued at $18,909 and has a contractual term of 10 years. We utilized the Black-Scholes model to fair value the option received by our Chief Executive Officer with the following assumptions: volatility, 139%; expected dividend yield, 0%; risk free interest rate, 3.59%; and an expected life of 10 years. The grant date fair value of each share of common stock underlying the option was $0.76. Please refer to Item 11 Employment Agreement for additional details of Mr. Jennings’ annual compensation. | |
(7) | During the year ended December 31, 2022 we issued an option to purchase 40,000 shares of common stock to our Chief Financial Officer at an exercise price of $1.12 per share pursuant to an employment agreement. The option was valued at $41,340 and has a contractual term of 10 years. We utilized the Black-Scholes model to fair value the option received by our Chief Executive Officer with the following assumptions: volatility, 156%; expected dividend yield, 0%; risk free interest rate, 1.65%; and an expected life of 5 years. The grant date fair value of each share of common stock underlying the option was $1.03. |
| 49 |
| Table of Contents |
Outstanding Equity Awards at 20202023 Fiscal Year-End
The following table sets forth certain information with respect to outstanding options and warrants to purchase common stock previously awarded to our named executive officers as of December 31, 2020.
Name |
| Number of Securities Underlying Unexercised Warrants / Options Exercisable(1) (#) |
|
| Number of Securities Underlying Unexercised Warrants / Options Unexercisable (#) |
|
| Equity Incentive Plan Awards: Number of Securities Underlying Unexercised Unearned Warrants (#) |
|
| Exercise Price(1) ($) |
|
| Expiration Date | |||||
Halden S. Shane |
|
| 156,250 | (2) |
|
| — |
|
|
| — |
|
| $ | 1.20 |
|
| 1/31/2025 | |
|
|
| 12,500 | (3) |
|
| — |
|
|
| — |
|
| $ | 4.00 |
|
| 4/24/2030 | |
|
|
| 375,000 | (4) |
|
| — |
|
|
| — |
|
| $ | 6.95 |
|
| 10/01/2030 | |
|
|
| 172,500 | (5) |
|
| — |
|
|
| — |
|
| $ | 1.12 |
|
| 1/1/2032 | |
|
|
| 437,500 | (6) |
|
| — |
|
|
| — |
|
| $ | 0.96 |
|
| 12/22/2032 | |
|
|
| 31,250 | (7) |
|
| — |
|
|
| — |
|
| $ | 0.64 |
|
| 11/19/2033 | |
|
|
| 125,000 | (8) |
|
| — |
|
|
| — |
|
| $ | 0.80 |
|
| 1/26/2034 | |
|
|
| 100,000 | (9) |
|
| — |
|
|
| — |
|
| $ | 0.86 |
|
| 1/26/2033 | |
|
|
|
|
|
|
|
|
|
|
|
|
|
|
|
|
|
|
| |
Elissa J. Shane |
|
| 31,250 | (10) |
|
| — |
|
|
| — |
|
| $ | 0.88 |
|
| 1/03/2024 | |
|
|
| 12,500 | (11) |
|
| — |
|
|
| — |
|
| $ | 0.96 |
|
| 1/03/2025 | |
|
|
| 18,750 | (12) |
|
| — |
|
|
| — |
|
| $ | 0.80 |
|
| 1/15/2025 | |
|
|
| 6,250 | (13) |
|
| — |
|
|
| — |
|
| $ | 4.00 |
|
| 4/24/2030 | |
|
|
| 31,250 | (14) |
|
| — |
|
|
| — |
|
| $ | 7.06 |
|
| 10/1/2025 | |
|
|
| 57,500 | (15) |
|
| — |
|
|
| — |
|
| $ | 1.12 |
|
| 1/18/2032 | |
|
|
| 50,000 | (16) |
|
| — |
|
|
| — |
|
| $ | 0.86 |
|
| 1/26/2033 | |
Nick Jennings |
|
| 6,250 | (17) |
|
| — |
|
|
| — |
|
| $ | 0.80 |
|
| 1/26/2023 | |
|
|
| 6,250 | (18) |
|
| — |
|
|
| — |
|
| $ | 4.00 |
|
| 4/24/2030 | |
|
|
| 40,000 | (19) |
|
| — |
|
|
| — |
|
| $ | 1.12 |
|
| 1/18/2032 | |
|
|
| 25,000 | (20) |
|
| — |
|
|
| — |
|
| $ | 0.86 |
|
| 1/26/2033 | |
(1) | Reflects the 1-for-8 reverse stock split of | |||||
(2) | Warrants vested on January 31, 2020 and have a term of five years. | |||||
(3) | Warrants April 24, 2020 and have a term of ten years. | |||||
(4) | Warrants vested on October 01, 2020 and have a term of ten years. | |||||
(5) | Options vested on January 18, 2022 and have a term of ten years. | |||||
(6) | Warrants vested on December 22, 2017 and were modified to expire on December 22, 2032 | |||||
(7) | Warrants vested on November 19, 2018 and were modified to expire on November 19, 2032. | |||||
(8) | Warrants vested on January 26, 2019 and where modified to expire on January 26, 2034. | |||||
(9) | Options vested on January 26, 2023 and have a term of ten years. | |||||
(10) | Options pursuant to the 2016 Plan vested on January 3, 2019 and have a term of five years. | |||||
(11) | Options pursuant to the 2016 Plan vested on January 3, 2020 and have a term of five years. | |||||
(12) | Options pursuant to the 2016 Plan vested on January 15, 2020 and have a term of five years. | |||||
(13) | Warrants vested on April 24, 2020 and have a term of ten years. | |||||
(14) | Options pursuant to the 2016 Plan vested on October 01, 2020 and have a term of five years. | |||||
(15) | Options vested on January 18, 2022 and have a term of ten years. | |||||
(16) | Options vested on January 26, 2023 and have a term of ten years. | |||||
(17) | Options pursuant to the 2016 Plan vested on January 26, 2018 and have a term of five years. | |||||
(18) | Warrants vested on April 24, 2020 and have a term of ten years. | |||||
(19) | Options vested on January 18, 2022 and have a term of ten years. | |||||
(20) | Options vested on January 26, 2023 and have a term of ten years. | |||||
Employment Agreements, Termination of Employment and Change-in-Control Arrangements
Except as described below, we currently have no employment agreements with any of our executive officers, nor any compensatory plans or arrangements resulting from the resignation, retirement or any other termination of any of our executive officers, from a change-in-control, or from a change in any executive officer’s responsibilities following a change-in-control.
| 50 |
| Table of Contents |
Employment Agreements
We have entered into employment agreements with each of the named executive officers and generally include the named executive officer’s initial base salary and an indication of equity compensation opportunities.
Halden S. Shane
On September 22, 2020, we entered into
a three year employment agreement with Dr. Shane, effective October 1, 2020. The agreement provides for a base annual salary of $500,000. The agreement also provides for a signing bonus of 375,000 warrants. Dr. Shane is also entitled to a cash performance bonus and an annual issuance of an option to purchase 31,250 shares of common stock from the 2016 Plan at the discretion of the Board. The agreement also provides that we will reimburse Dr. Shane for the expenses associated with the use of an automobile up to $750 a month. The initial term ofIn the event Dr. Shane is terminated as CEO as a result of a change in control, Dr. Shane will be entitled to a lump sum payment of two years’ salary at the time of such termination.
Elissa J. Shane
On October 1, 2020, we entered into an employment agreement with Elissa J. Shane, effective October 1, 2020. Pursuant to her employment agreement, Ms. Shane will receive an annual base salary of at least $270,000, subject to annual review and discretionary increase by the Compensation Committee of the Board. Ms. Shane is eligible to receive an annual cash bonus and other annual incentive compensation. The agreement originally provided for a grant of 93,750 warrants. Additionally, in connection with the execution of her employment agreement, on October 1, 2020, we issued Ms. Shane a warrant to purchase 93,750 shares of Common Stock at an exercise price of $6.17 per share. These provisions were subsequently amended to provide for the issuance to Ms. Shane of 31,250 options from the 2016 Equity Plan at the closing price of $7.06 on the date of grant in lieu of the warrant grant and the 93,750 warrants were cancelled. Ms. Shane acknowledged that the 31,250 options were in full consideration of the amount she was entitled to under the agreement. Her employment agreement also provides that we will reimburse Ms. Shane for reasonable and necessary business and entertainment expenses that she incurs in performing her duties. During the term of her employment, Ms. Shane will also be entitled to up to four weeks of paid vacation time annually, which will accrue up to six weeks, and to participate in our benefit plans and programs, including but not limited to all group health, life, disability and retirement plans. Ms. Shane is also entitled to the sum of $1,000 per month as a vehicle allowance. The initial term of her employment agreement is three years, which may be automatically extended for successive one-year terms, unless either party provides the other with 120 days’ prior written notice of its intent to terminate the agreement.
In the event Ms. Shane is terminated as COO as a result of a change in control, Ms. Shane will be entitled to a lump sum payment of one and a half years’ salary at the time of such termination.
Nick Jennings
On September 2, 2015, we entered into a new employment agreement with Mr. Jennings, which superseded his prior agreement, pursuant to which he continues to serve as our Chief Financial Officer. Mr. Jennings’ annual salary is $132,000, which is reviewed annually. On January 26, 2016, we issued Mr. Jennings a five-year warrant to purchase up to 12,500 shares of common stock at an exercise price of $4.40 per share. The agreement also provided for the issuance of an additional five-year warrant to purchase 12,500 shares of common stock in 2016, however, this provision was modified to grant a salary increase in lieu of the options. In October 2020, Mr. Jennings’ annual salary was increased to $175,000 per year. Mr. Jennings is also entitled to additional equity compensation based upon superior performance of his responsibilities, as determined by the Board in its sole discretion. The agreement also provides that we will reimburse Mr. Jennings for certain business and entertainment expenses. In the event of a change in control of the Company that results in his termination, Mr. Jennings will be entitled to a lump sum payment of one year’s salary and all equity awards will be accelerated and fully vested. In the event his employment is terminated other than for cause, Mr. Jennings will receive an amount equal to his annual salary as of such termination date after the second employment anniversary.
| 51 |
| Table of Contents |
Director Compensation
Each of our non-employee directors receives cash fees and stock as compensation for their service on the Board and the committees of the Board on which they are a member. The tables below set forth cash and stock compensation earned by each non-employee director during the fiscal year ended December 31, 2020.
| Name | Fees earned or paid in cash ($) | Stock awards ($) | Option awards ($) | Other Compensation ($) | Total ($) |
| Harold W. Paul (1) | 40,000 | 12,000 | — | 78,000 | 130,000 |
| Walter Johnsen (2) | 40,000 | 12,000 | — | — | 52,000 |
| Kelly Anderson (3) | 45,000 | 12,000 | — | — | 57,000 |
| Lim Boh Soon (4) | 40,000 | 12,000 | — | — | 52,000 |
Name |
| Fees earned or paid in cash ($) |
|
| Stock awards ($) |
|
| Option awards ($) |
|
| Other Compensation ($) |
|
| Total ($) |
| |||||
Walter Johnsen (1) |
|
| 48,000 |
|
|
| 17,000 |
|
|
| — |
|
|
| — |
|
|
| 65,000 |
|
Kelly Anderson (2) |
|
| 54,600 |
|
|
| 17,000 |
|
|
| — |
|
|
| — |
|
|
| 71,600 |
|
Lim Boh Soon (3) |
|
| 48,000 |
|
|
| 17,000 |
|
|
| — |
|
|
| — |
|
|
| 65,000 |
|
(1) | Mr. Johnsen was elected to the Board on January 29, 2016. The term of his agreement as director commenced on February 1, 2016 for up to two years and until a successor is elected, or resignation or removal. Mr. Johnsen was re-elected to the board for a 3-year term at our 2019 annual meeting. Our agreement with Mr. Johnsen provides for an annual fee in the amount of $48,000 paid on a quarterly basis and an annual grant of shares of common stock. In January 2023, we issued Mr. Johnsen 20,000 shares of common stock that were valued at $17,000. | |
(2) | Ms. Anderson was elected to the Board on January 29, 2016 and serves as the chairperson of our Audit Committee. The term of her agreement as director commenced on February 1, 2016 for up to two years and until a successor is elected, or resignation or removal. Ms. Anderson was re-elected to the board for a 3-year term at our 2019 annual meeting. Our agreement with Ms. Anderson provides for an annual fee in the amount of $54,600 paid on a quarterly basis and an annual grant of shares of common stock. In January 2023, we issued Ms. Anderson 20,000 shares of common stock that were valued at $17,000. | |
(3) | Mr. Lim was elected to the Board on January 29, 2018. The term of his agreement as director commenced on February 1, 2018 for up to three years unless re-elected or until a successor is elected, or resignation or removal. Mr. Lim was re-elected to the board for a 3-year term at our 2021 annual meeting. Our agreement with Mr. Lim provides for an annual fee in the amount of $48,000 paid on a quarterly basis and an annual grant of shares of common stock. In January 2022, we issued Mr. Lim 20,000 shares of common stock that were valued at $17,000. |
| 52 |
| Table of Contents |
Item 12.
Equity Compensation
Plan InformationWe currently maintain one compensation plan: the 2016 Plan.Equity Incentive Plan (the “2016 Plan”). The 2016 Plan was approved by the Board on January 29, 2016 and received shareholder approval on July 7, 2017. The 2016 Plan authorized the issuance of 625,000 shares of common stock. On August 25, 2015, the Board terminated the 2008 Plan, which we had maintained previously and which our shareholders had approved. Accordingly, we will issue future awards under the 2016 Plan.
On December 30, 2020, we received shareholder approval to restateamend and amendrestate the 2016 Equity Incentive Plan to increase the maximum number of shares of common stock authorized from issuance by 1,375,000, from 625,000 shares to 2,000,000.
The following table provides information as of December 31, 20202023 with respect to compensation plans under which our equity securities are authorized for issuance.
Plan Category | Number of securities to be issued upon exercise of outstanding options, warrants and rights(1) | Weighted-average exercise price of outstanding options, warrants and rights(1) | Number of securities remaining available for future issuance under equity compensation plans(1) |
| Equity compensation plans approved by security holders | 132,500(2) | $2.72 | 1,659,500(4) |
Equity compensation plans not approved by security holders | 940,625(3) | $2.96 | — |
| Total | 1,073,125 | $2.88 | — |
Plan Category |
| Number of securities to be issued upon exercise of outstanding options, warrants and rights(1) |
|
| Weighted-average exercise price of outstanding options, warrants and rights(1) |
|
| Number of securities remaining available for future issuance under equity compensation plans(1) |
| |||
Equity compensation plans approved by security holders |
|
| 617,542 | (2) |
| $ | 1.09 |
|
|
| 1,037,708 | (4) |
Equity compensation plans not approved by security holders |
|
| 1,165,208 | (3) |
| $ | 2.97 |
|
|
| — |
|
Total |
|
| 1,782,750 |
|
| $ | 2.41 |
|
|
| — |
|
(1) | Reflects the 1-for-8 reverse stock split of our Common Stock and Series A Preferred Stock effected on September 10, 2020. | |
(2) | Prior to August 25, 2015, we granted awards under the 2008 Plan. | |
(3) | Represents shares of common stock issuable upon the exercise of warrants issued to executive officers, employees and consultants in exchange for services rendered. | |
(4) | On July 7, 2017, the 2016 Plan received shareholder approval, which permits the grant up to 625,000 shares of common stock. On December 30, 2020, we received shareholder approval to amend and restate the 2016 Plan to increase the maximum number of shares of common stock authorized from issuance by 1,375,000, from 625,000 shares to 2,000,000. |
Security Ownership of Certain Beneficial Owners and Management
The following table sets forth certain information with respect to the beneficial ownership of our common stock and Series A preferred stock (together, “Voting Stock”) as of March 5, 20217, 2024 for:
· | each person (or group of affiliated persons) known by us to be the beneficial owner of more than 5% of our outstanding shares of common stock or Series A preferred stock; | |
· | each of our directors and nominees for election to the Board; | |
· | each of the executive officers named in the summary compensation table; and | |
· | all of our directors and executive officers as a group. |
We have determined beneficial ownership in accordance with the rules of the SEC. Except as indicated by the footnotes below, we believe, based on the information furnished to us, that the persons and entities named in the following table have sole voting and investment power with respect to all shares of Voting Stock that they beneficially own, subject to applicable community property laws.
| 53 |
| Table of Contents |
Applicable percentage ownership is based on 16,811,513
Shares Beneficially Owned | |||||
Common Stock | Series A Preferred Stock | ||||
Shares | % of Class | Shares | % of Class | % of Total Voting Power(1) | |
| 5% Shareholders: | |||||
Lau Sok Huy(2) | 2,170,139 | 12.9% | — | — | 12.9% |
Ah Kee Wee (3) | 956,099 | 5.7% | — | — | 5.7% |
| Named Executive Officers and Directors: | |||||
Halden S. Shane(4) | 3,961,881 | 21.6% | 63,750 | 100.0% | 21.9% |
Elissa J. Shane(5) | 442,664 | 2.4% | — | — | 2.4% |
Nick Jennings(6) | 57,768 | * | — | — | * |
Harold W. Paul(7) | 207,625 | 1.1% | — | — | 1.1% |
Walter Johnsen(8) | 56,250 | * | — | — | * |
Kelly Anderson(9) | 56,250 | * | — | — | * |
Lim Boh Soon(10) | 111,274 | * | — | — | * |
Executive Officers and Directors as a Group (11) | 4,893,712 | 26.7% | — | — | 26.9% |
|
|
|
|
|
|
|
| Shares Beneficially Owned |
|
|
|
| ||||||||
|
| Common Stock |
|
| Series A Preferred Stock |
|
| % of Total Voting |
| |||||||||||
Name of Beneficial Owner |
| Shares |
|
| % of Class |
|
| Shares |
|
| % of Class |
|
| Power(1) |
| |||||
5% Shareholders: |
|
|
|
|
|
|
|
|
|
|
|
|
|
|
| |||||
Lau Sok Huy(2) |
|
| 2,170,139 |
|
|
| 10.9 | % |
|
| — |
|
|
| — |
|
|
| 10.8 | % |
Named Executive Officers and Directors: |
|
|
|
|
|
|
|
|
|
|
|
|
|
|
|
|
|
|
|
|
Halden S. Shane(1)(3) |
|
| 4,152,664 |
|
|
| 19.1 | % |
|
| 63,750 |
|
|
| 100.0 | % |
|
| 19.3 | % |
Elissa J. Shane(4) |
|
| 475,164 |
|
|
| 2.2 | % |
|
| — |
|
|
| — |
|
|
| 2.2 | % |
Nick Jennings(5) |
|
| 96,869 |
|
| * |
|
|
| — |
|
|
| — |
|
| * |
| ||
Walter Johnsen(6) |
|
| 91,875 |
|
| * |
|
|
| — |
|
|
| — |
|
| * |
| ||
Kelly Anderson(7) |
|
| 91,875 |
|
| * |
|
|
| — |
|
|
| — |
|
| * |
| ||
Lim Boh Soon(8) |
|
| 143,774 |
|
| * |
|
|
| — |
|
|
| — |
|
| * |
| ||
Executive Officers and Directors as a Group (9) |
|
| 5,052,220 |
|
|
| 23.2 | % |
|
| — |
|
|
| — |
|
|
| 23.4 | % |
*
(1) | Percentage of total voting power represents voting power with respect to all shares of our Common Stock and Series A Preferred Stock, as a single class. The holders of Common Stock and Series A Preferred Stock are each entitled to one vote per share. | |
(2) | Based on Form 3 filed with the SEC by Lau Sok Huy on January 24, 2018. | |
(3) | Consists of: (i) 2,430,164 shares of Common Stock held of record by Dr. Shane; (ii) 187,500 shares of Common Stock held of record by the Shane Family Trust; (iii) 125,000 shares of Common Stock held of record by Belinha Shane; and (iv) 1,410,000 shares of Common Stock issuable upon the exercise of warrants and options to purchase Common Stock held by Dr. Shane that are exercisable or will become exercisable within 60 days of March 7, 2024. Dr. Shane is a co-trustee of the Shane Family Trust and may be deemed to share voting and investment power over the securities held by the trust. Belinha Shane is Dr. Shane’s wife. Dr. Shane disclaims ownership of such shares held by his wife, except to the extent of his pecuniary interest. | |
(4) | Consists of: (i) 267,664 shares of Common Stock held of record by Ms. Shane; and (ii) 207,500 shares of Common Stock issuable upon the exercise of warrants and options to purchase Common Stock held by Ms. Shane that are exercisable or will become exercisable within 60 days of March 7, 2024. | |
(5) | Consists of: (i) 26,519 shares of Common Stock held of record by Mr. Jennings; and (ii) 71,250 shares of Common Stock issuable upon the exercise of warrants and options to purchase Common Stock held by Mr. Jennings that are exercisable or will become exercisable within 60 days of March 7, 2024. | |
(6) | Consists of: (i) 88,750 shares of Common Stock held of record by Mr. Johnsen; and (ii) 3,125 shares of Common Stock issuable upon exercise of stock options that are exercisable or will become exercisable within 60 days of March 7, 2024. | |
(7) | Consists of: (i) 88,750 shares of Common Stock held of record by Ms. Anderson; and (ii) 3,125 shares of Common Stock issuable upon exercise of stock options that are exercisable or will become exercisable within 60 days of March 7, 2024. | |
(8) | Consists of 143,774 shares of Common Stock held of record by Dr. Lim. | |
(9) | Consists of: (i) 3,357,220 shares of Common Stock; (ii) 1,150,000 shares of Common Stock issuable upon the exercise of warrants to purchase Common Stock; and (iii) 545,000 shares of Common Stock issuable upon exercise of stock options that are exercisable or will become exercisable within 60 days of March 7, 2024. |
| 54 |
| Table of Contents |
Item 13.
Transactions with Related Persons
None.
Independence of the Board
Based upon information submitted by Mr. Johnsen, Ms. Anderson, and Dr. Lim, and Mr. Paul the Board has determined that each of them is “independent” for purposes of OTC Governance Guidelines for directors.under Nasdaq corporate governance rules. Dr. Shane isand Ms. Elissa Shane are not an independent director.directors as they are employees of the Company. No director will be considered “independent” unless the Board affirmatively determines that the director has no direct or indirect material relationship with the Company.
Our Board has three separate standing committees: the Audit Committee, the Compensation Committee and the Nominating and Corporate Governance Committee.
We have made each of our committee charters available on our website at http://investor.tomimist.com/.
Item 14.
Accountant Fees
The following table presents the aggregate fees billed for audit and other services provided by our independent registered public accounting firm, Wolinetz, Lafazan & Company, P.C,Rosenberg Rich Baker Berman, P.A., during the 20202023 and 20192022 fiscal years:
For the Fiscal Years Ended December 31, | ||
2020 | 2019 | |
| Audit Fees (1) | $138,000 | $122,000 |
| Audit-Related Fees (2) | — | — |
| Tax Fees (3) | — | — |
| All Other Fees (4) | — | — |
| Total | $138,000 | $122,000 |
|
| For the Fiscal Years Ended December 31, |
| |||||
|
| 2023 |
|
| 2022 |
| ||
Audit Fees (1) |
| $ | 160,000 |
|
| $ | 150,000 |
|
Audit-Related Fees (2) |
|
| — |
|
|
| — |
|
Tax Fees (3) |
|
| — |
|
|
| — |
|
All Other Fees (4) |
|
| — |
|
|
| — |
|
Total |
| $ | 160,000 |
|
| $ | 150,000 |
|
(1) | Audit Fees: Audit fees represent the professional services rendered for the audit of our annual financial statements and the review of our financial statements included in quarterly reports, along with services normally provided by the accounting firm in connection with statutory and regulatory filings or engagements. | |
(2) | Audit-Related Fees: Audit-related fees represent professional services rendered for assurance and related services by Rosenberg Rich Baker Berman, P.A. that were reasonably related to the performance of the audit or review of our financial statements that are not reported under audit fees. | |
(3) | Tax Fees: Tax fees represent professional services rendered by the accounting firm for tax compliance, tax advice, and tax planning. | |
(4) | All Other Fees: All other fees represent fees billed for products and services provided by Rosenberg Rich Baker Berman, P.A other than the services reported for the other categories. |
Pre-Approval Policies and the review of our financial statements included in quarterly reports, along with services normally provided by the accounting firm in connection with statutory and regulatory filings or engagements.
Consistent with the rules and regulations promulgated by the Securities and Exchange Commission, the Audit Committee approves the engagement of our independent registered public accounting firm and is also required to pre-approve all audit and non-audit expenses. All of the services described above were approved by the Audit Committee in accordance with its procedure. We do not otherwise rely on pre-approval policies and procedures.
| 55 |
| Table of Contents |
PART IV
Item 15.
(a) Documents filed as part of this report:
(1) Financial Statements. See Index to Financial Statements and Schedule on page F-1.
(2) Schedules to Financial Statements. All financial statement schedules have been omitted because they are either inapplicable or the information required is provided in our consolidated financial statements and the related notes thereto, included in Part II, Item 8 of this Annual Report on Form 10-K.
(3) The exhibits listed on the accompanying Exhibit Index are filed (or incorporated by reference herein) as part of this Annual Report on Form 10-K.
| 56 |
| Table of Contents |
Item 16. FORM 10-K SUMMARY
None.
EXHIBIT INDEX
Exhibit Number |
| Description of Exhibit |
| Form |
| File No. |
| Date |
| Exhibit |
| Filed Herewith |
Articles of Restatement of the Registrant, effective October 6, 2009 |
| S-1 |
| 333-162356 |
| 10/6/09 |
| 3.1 |
|
| ||
Articles of Amendment of Articles of Incorporation of the Registrant, effective October 24, 2011 |
| 8-K |
| 000-09908 |
| 11/07/11 |
| 3 |
|
| ||
Articles of Amendment of Articles of Incorporation of the Registrant, effective September 10, 2020 |
| 8-K |
| 000-09908 |
| 9/14/20 |
| 3.1 |
|
| ||
Amended Bylaws of the Registrant, adopted effective November 2, 2007 |
| 10-Q |
| 000-09908 |
| 5/16/16 |
| 3.2 |
|
| ||
Amendment to Amended Bylaws of the Registrant, adopted effective January 29, 2016 |
| 8-K |
| 000-09908 |
| 2/1/16 |
| 3.2 |
|
| ||
Specimen certificate evidencing shares of common stock of the Registrant |
| S-3 |
| 333-249850 |
| 11/4/20 |
| 4.1 |
|
| ||
| 10-K |
| 001-39574 |
| 03/29/2022 |
| 4.2 |
|
| |||
| 10-Q |
| 000-09908 |
| 05/17/21 |
| 4.1 |
| ||||
| 10-Q |
| 000-09908 |
| 05/17/21 |
| 4.2 |
| ||||
| 8-K |
| 000-09908 |
| 09/26/21 |
| 4.1 |
| ||||
| 8-K |
| 000-09908 |
| 09/26/21 |
| 4.2 |
| ||||
Form of TOMI Environmental Solutions, Inc. 12% Convertible Note |
| 8-K |
| 001-39574 |
| 11/07/2023 |
| 10.2 |
| |||
| DEF 14A |
| 001-39574 |
| 12/2/20 |
| Appendix A |
|
| |||
Offer Letter, dated January 15, 2016, by and between the Registrant and Dr. Halden Shane |
| 10-Q |
| 000-09908 |
| 5/16/16 |
| 10.1 |
|
| ||
Offer Letter, dated September 2, 2015, by and between the Registrant and Nick Jennings |
| 10-Q |
| 000-09908 |
| 5/16/16 |
| 10.3 |
|
| ||
Form of Appointment to the Board of Directors as Independent Director of the Registrant |
| 10-Q |
| 000-09908 |
| 5/16/16 |
| 10.5 |
|
| ||
10.5 |
| Restated Manufacturing and Development Agreement, dated November 10, 2016, by and between the Registrant and RG Group |
| 10-Q |
| 000-09908 |
| 9/30/16 |
| 10.1 |
|
|
| 8-K |
| 000-09908 |
| 1/8/18 |
| 10.1 |
|
| |||
10.7+ |
| Amendment to Executive Employment Agreement |
|
|
|
|
|
|
|
|
|
|
| 8-K |
| 000-09908 |
| 09/26/21 |
| 10.1 |
|
| |||
| 8-K |
| 001-39574 |
| 11/07/2023 |
| 10.1 |
|
| |||
| 8-K |
| 001-39574 |
| 11/07/2023 |
| 10.3 |
|
| |||
| 10-K |
| 000-09908 |
| 3/31/09 |
| 14 |
|
| |||
|
|
|
|
|
|
|
|
|
| X | ||
24.1 |
| Power of Attorney (included in signature page) |
|
|
|
|
|
|
|
|
| X |
|
|
|
|
|
|
|
|
|
| X | ||
|
|
|
|
|
|
|
|
|
| X | ||
|
|
|
|
|
|
|
|
|
| X | ||
101.INS |
| XBRL Instance Document |
|
|
|
|
|
|
|
|
| X |
101.SCH |
| XBRL Taxonomy Extension Schema |
|
|
|
|
|
|
|
|
| X |
101.CAL |
| XBRL Taxonomy Extension Calculation Linkbase |
|
|
|
|
|
|
|
|
| X |
101.DEF |
| XBRL Taxonomy Extension Definition Linkbase |
|
|
|
|
|
|
|
|
| X |
101.LAB |
| XBRL Taxonomy Extension Label Linkbase |
|
|
|
|
|
|
|
|
| X |
101.PRE |
| XBRL Taxonomy Extension Presentation Linkbase |
|
|
|
|
|
|
|
|
| X |
104 |
| Cover Page Interactive Data File |
|
|
|
|
|
|
|
|
| X |
+ | Indicates a management contract or compensatory plan. |
# | The information in Exhibit 32.1 shall not be deemed “filed” for purposes of Section 18 of the Securities Exchange Act of 1934, as amended, or the Exchange Act, or otherwise subject to the liabilities of that section, nor shall they be deemed incorporated by reference in any filing under the Securities Act of 1933, as amended, or the Exchange Act (including this report), unless the Registrant specifically incorporates the foregoing information into those documents by reference. |
| 57 |
| Table of Contents |
SIGNATURES
Pursuant to the requirements of Section 13 or 15(d) of the Securities Exchange Act of 1934, the registrant has duly caused this report to be signed on its behalf by the undersigned, thereunto duly authorized.
DATED: April 1, 2024 | |||
TOMI ENVIRONMENTAL SOLUTIONS, INC. | |||
/s/ HALDEN S. SHANE | |||
Halden S Shane Chairman of the Board and Chief Executive Officer (Principal Executive Officer) |
The undersigned directors and officers of TOMI Environmental Solutions, Inc. constitute and appoint Halden S. Shane and Nick Jennings, or either of them, as their true and lawful attorney and agent with power of substitution, to do any and all acts and things in our name and behalf in our capacities as directors and officers and to execute any and all instruments for us and in our names in the capacities indicated below, which said attorney and agent may deem necessary or advisable to enable said corporation to comply with the Securities Exchange Act of 1934, as amended, and any rules, regulations and requirements of the Securities and Exchange Commission, in connection with this Annual Report on Form 10-K, including specifically but without limitation, power and authority to sign for us or any of us in our names in the capacities indicated below, any and all amendments hereto; and we do hereby ratify and confirm all that said attorney and agent shall do or cause to be done by virtue hereof. Pursuant to the requirements of the Securities Exchange Act of 1934, this report has been signed below by the following persons on behalf of the registrant and in the capacities and on the dates indicated.
Signature | Title | Date | ||
/s/ HALDEN S. SHANE | Chairman of the Board and Chief Executive Officer (Principal Executive Officer) | April 1, 2024 | ||
Halden S. Shane | ||||
/s/ NICK JENNINGS | Chief Financial Officer (Principal Financial Officer and Principal Accounting Officer) | April 1, 2024 | ||
Nick Jennings | ||||
/s/ | Director | April 1, 2024 |
Elissa J. Shane |
/s/ WALTER C. JOHNSEN | Director | April 1, 2024 | ||
Walter C. Johnsen |
/s/ KELLY J. ANDERSON | Director | April 1, 2024 | ||
Kelly J. Anderson |
/s/ LIM BOH SOON | Director | April 1, 2024 | ||
Lim Boh Soon |
| Articles of Restatement of the Registrant, effective October 6, 2009 | S-1 | 333-162356 | 10/6/09 | 3.1 | ||||||||
| Articles of Amendment of Articles of Incorporation of the Registrant, effective October 24, 2011 | 8-K | 000-09908 | 10/24/11 | 3.1(a) | ||||||||
| Articles of Amendment of Articles of Incorporation of the Registrant, effective September 10, 2020 | 8-K | 000-09908 | 9/14/20 | 3.1 | ||||||||
| Amended Bylaws of the Registrant, adopted effective November 2, 2007 | 10-Q | 000-09908 | 5/16/16 | 3.2 | ||||||||
| Amendment to Amended Bylaws of the Registrant, adopted effective January 29, 2016 | 8-K | 000-09908 | 2/1/16 | 3.2 | ||||||||
| 4.1 | Specimen certificate evidencing shares of common stock of the Registrant | S-3 | 333-249850 | 11/4/20 | 4.1 | |||||||
| 4.2 | Description of Registrants Securities | S-3 | 333-249850 | 11/4/20 | ||||||||
| 10.1+ | Amended and Restated 2016 Equity Incentive Plan, as adopted by the Registrant’s stockholders on December 30, 2020 | DEF 14A | 001-39574 | 12/2/20 | Appendix A | |||||||
| Offer Letter, dated January 15, 2016, by and between the Registrant and Dr. Halden Shane | 10-Q | 000-09908 | 5/16/16 | 10.1 | ||||||||
| Employment Agreement, dated February 8, 2016, by and between the Registrant and Robert Wotczak | 10-Q | 000-09908 | 5/16/16 | 10.2 | ||||||||
| Offer Letter, dated September 2, 2015, by and between the Registrant and Nick Jennings | 10-Q | 000-09908 | 5/16/16 | 10.3 | ||||||||
| Offer Letter, dated September 2, 2015, by and between the Registrant and Norris Gearhart | 10-Q | 000-09908 | 5/16/16 | 10.4 | ||||||||
| Form of Appointment to the Board of Directors as Independent Director of the Registrant | 10-Q | 000-09908 | 5/16/16 | 10.5 | ||||||||
| Restated Manufacturing and Development Agreement, dated November 10, 2016, by and between the Registrant and RG Group | 10-Q | 000-09908 | 9/30/16 | 10.1 | ||||||||
| Employment Agreement, entered into as of January 5, 2018, by and between the Registrant and Elissa J. Shane, effective as of January 1, 2018 | 8-K | 000-09908 | 1/18/18 | 10.1 | ||||||||
| Code of Ethics | 10-K | 000-09908 | 3/31/07 | 14 | ||||||||
| Subsidiaries of the Registrant | X | |||||||||||
| Power of Attorney (included in signature page) | X | |||||||||||
| Certification of Chief Executive Officer pursuant to Rule 13a-14(a) or Rule 15d-14(a) of the Securities Exchange Act of 1934, as amended, as adopted pursuant to Section 302 of the Sarbanes-Oxley Act of 2002 | X | |||||||||||
| Certification of Chief Financial Officer pursuant to Rule 13a-14(a) or Rule 15d-14(a) of the Securities Exchange Act of 1934, as amended, as adopted pursuant to Section 302 of the Sarbanes-Oxley Act of 2002 | X | |||||||||||
| Certifications of Chief Executive Officer and Chief Financial Officer pursuant to 18 U.S.C. Section 1350, as adopted pursuant to Section 906 of the Sarbanes-Oxley Act of 2002 | X | |||||||||||
| 101.INS | XBRL Instance Document | X | ||||||||||
| 101.SCH | XBRL Taxonomy Extension Schema | X | ||||||||||
| 101.CAL | XBRL Taxonomy Extension Calculation Linkbase | X | ||||||||||
| 101.DEF | XBRL Taxonomy Extension Definition Linkbase | X | ||||||||||
| 101.LAB | XBRL Taxonomy Extension Label Linkbase | X | ||||||||||
| 101.PRE | XBRL Taxonomy Extension Presentation Linkbase | X |
TOMI ENVIRONMENTAL SOLUTIONS, INC.
INDEX TO CONSOLIDATED FINANCIALFINANCIAL STATEMENTS
Page | |||
F-2 | |||
F-4 | |||
F-5 | |||
F-6 | |||
F-7 | |||
F-9 |
| F-1 |
| Table of Contents |
To the Shareholders and Board of Directors and
Stockholders of
Opinion on the Financial Statements
We have audited the accompanying consolidated balance sheets of TOMI Environmental Solutions, Inc. and Subsidiary (the “Company”)Company) as of years ended December 31, 20202023 and 2019,2022, and the related consolidated statements of operations, shareholders’ equity, and cash flows for each of the two years in the two-year period ended December 31, 2020,2023 and 2022, and the related notes (collectively referred to as the “consolidated financial statements”)statements). In our opinion, the consolidated financial statements present fairly, in all material respects, the financial position of the Company as of December 31, 20202023 and 2019,2022, and the results of its operations and its cash flows for each of the two years in the two-year period ended December 31, 2020,2023, in conformity with accounting principles generally accepted in the United States of America.
Basis for Opinion
These financial statements are the responsibility of the Company’s management. Our responsibility is to express an opinion on the Company’s financial statements based on our audits. We are a public accounting firm registered with the Public Company Accounting Oversight Board (United States) (PCAOB) and are required to be independent with respect to the Company in accordance with the U.S. federal securities laws and the applicable rules and regulations of the Securities and Exchange Commission and the PCAOB.
We conducted our audits in accordance with the standards of the PCAOB. Those standards require that we plan and perform the audit to obtain reasonable assurance about whether the financial statements are free of material misstatement, whether due to error or fraud. The Company is not required to have, nor were we engaged to perform, an audit of its internal control over financial reporting. As part of our audits, we are required to obtain an understanding of internal control over financial reporting, but not for the purpose of expressing an opinion on the effectiveness of the Company’s internal control over financial reporting. Accordingly, we express no such opinion.
Our audits included performing procedures to assess the risks of material misstatement of the financial statements, whether due to error or fraud, and performing procedures that respond to those risks. Such procedures included examining, on a test basis, evidence regarding the amounts and disclosures in the financial statements. Our audits also included evaluating the accounting principles used and significant estimates made by management, as well as evaluating the overall presentation of the financial statements. We believe that our audits provide a reasonable basis for our opinion.
Critical Audit Matters
The critical audit matters communicated below are matters arising from the current period audit of the financial statements that were communicated or required to be communicated to the audit committee and that: (1) relate to accounts or disclosures that are material to the financial statements and (2) involved our especially challenging, subjective, or complex judgments. The communication of critical audit matters does not alter in any way our opinion on the consolidated financial statements, taken as a whole, and we are not, by communicating the critical audit matters below, providing separate opinions on the critical audit matters or on the accounts or disclosures to which they relate.
Allowance for credit losses
As described further in Note 2 to the consolidated financial statements,
We have identified the following:
| F-2 |
| Table of Contents |
Our audit procedures related to the allowance for doubtful accounts included:
· | Testing the mathematical accuracy of management’s allowance for doubtful accounts calculation as of December 31, 2023 by recalculating and independently applying the policy to each risk pool, as well as recalculating the aging of receivables based on underlying source documentation. |
· | Recomputing current and historical collection rates for customer receivable balances and comparing the historical loss rates against the current period estimated loss rates within the respective risk pools, and performing a retrospective analysis of the subsequent collections on customer receivables with certain risk characteristics. |
· | Evaluating the reasonableness of management’s qualitative adjustments against the allowance for credit losses by obtaining corroborating evidence which supports the adjustments and assumptions made by management in determining the allowance. |
Inventory – Valuation associated with excess and conditionsobsolete (E&O) inventory
As further described in contracts with customers by examining customer agreementsNote 2 to the consolidated financial statements, inventory is stated at the lower of cost or net realizable value. At the balance sheet date, the Company evaluated inventories for excess quantities and obsolescence and included an inventory reserve against its inventory balances. As of December 31, 2023, the inventory reserve was approximately $0.1 million, or 3% of total inventory. To estimate the amount of inventory that may be in excess or obsolete, the Company reviews inventory quantities on hand as well as historical and projected distribution levels. The Company’s model assumes that inventory will be distributed on a test basis including reviewingfirst-in-first-out basis. Due to the nature of the inventory and the levels of inventory purchased in prior years, estimating the amount of inventory that is in excess or potentially obsolete involves significant judgments and estimates.
Given the significant judgments associated with evaluating the valuation of E&O inventory, auditing the reasonableness of management’s identificationestimates and assumptions involved especially subjective judgment and an increased extent of performance obligations.
Our audit procedures related to the Company’s valuation of E&O inventory included the following:
· | Evaluating the design and implementation of controls over the E&O inventory valuation. |
· | Evaluating management’s future projections by comparing the historical sales. |
· | Obtaining the Company’s E&O calculation and testing the mathematical accuracy. |
· | Assessing the reasonableness of the assumptions used in the E&O calculation by developing an independent expectation and comparing our independent expectation to the results of the Company’s calculation. |
· | Inquiring of the Company’s employees outside of the accounting department and evaluating other areas of the audit to identify business, product, or industry changes that may impact the inputs in the inventory E&O calculation. |
/s/ Rosenberg Rich Baker Berman, P.A.
We have served as the Company'sCompany’s auditor since 2004.
CONSOLIDATED BALANCE SHEET
| ASSETS | ||
| Current Assets: | December 31, 2020 (1) | December 31, 2019 (1) |
| Cash and Cash Equivalents | $5,198,842 | $897,223 |
| Accounts Receivable - net | 3,716,701 | 1,494,658 |
| Other Receivables | 198,951 | - |
| Inventories (Note 3) | 3,781,515 | 2,315,214 |
| Vendor Deposits (Note 4) | 388,712 | 141,052 |
| Prepaid Expenses | 421,305 | 187,664 |
| Total Current Assets | 13,706,027 | 5,035,811 |
| Property and Equipment – net (Note 5) | 1,298,103 | 1,367,864 |
| Other Assets: | ||
| Intangible Assets – net (Note 6) | 722,916 | 939,010 |
| Operating Lease - Right of Use Asset (Note 7) | 631,527 | 674,471 |
| Capitalized Software Development Costs - net (Note 8) | 52,377 | 94,278 |
| Other Assets | 358,935 | 114,033 |
| Total Other Assets | 1,765,755 | 1,821,792 |
| Total Assets | $16,769,885 | $8,225,467 |
| LIABILITIES AND SHAREHOLDERS’ EQUITY | ||
| Current Liabilities: | ||
| Accounts Payable | $1,501,469 | $713,222 |
| Accrued Expenses and Other Current Liabilities (Note 14) | 501,849 | 450,112 |
| Accrued Interest (Note 10) | - | 66,667 |
| Customer Deposits | 118,880 | - |
| Current Portion of Long-Term Operating Lease | 81,223 | 71,510 |
| Convertible Notes Payable, net of discount of $0 | ||
| at December 31, 2019 (Note 10) | - | 5,000,000 |
| Total Current Liabilities | 2,203,421 | 6,301,511 |
| Long-Term Liabilities: | ||
| Loan Payable (Note 16) | 410,700 | - |
| Long-Term Operating Lease, Net of Current Portion (Note 7) | 953,190 | 1,034,413 |
| Total Long-Term Liabilities | 1,363,890 | 1,034,413 |
| Total Liabilities | 3,567,311 | 7,335,924 |
| Commitments and Contingencies | - | - |
| Shareholders’ Equity: | ||
| Cumulative Convertible Series A Preferred Stock; | ||
| par value $0.01 per share, 1,000,000 shares authorized; 63,750 shares issued | ||
| and outstanding at December 31, 2020 and December 31, 2019 | 638 | 638 |
| Cumulative Convertible Series B Preferred Stock; $1,000 stated value; | ||
| 7.5% Cumulative dividend; 4,000 shares authorized; none issued | ||
| and outstanding at December 31, 2020 and December 31, 2019 | - | - |
| Common stock; par value $0.01 per share, 250,000,000 shares authorized; | ||
| 16,761,513 and 15,587,552 shares issued and outstanding | ||
| at December 31, 2020 and December 31, 2019, respectively. | 167,615 | 155,875 |
| Additional Paid-In Capital | 52,142,399 | 44,232,274 |
| Accumulated Deficit | (39,108,078) | (43,499,244) |
| Total Shareholders’ Equity | 13,202,574 | 889,543 |
| Total Liabilities and Shareholders’ Equity | $16,769,885 | $8,225,467 |
For The Years Ended | ||
December 31, | ||
2020 (1) | 2019 (1) | |
| Sales, net | $25,027,637 | $6,347,160 |
| Cost of Sales | 9,985,046 | 2,433,243 |
| Gross Profit | 15,042,591 | 3,913,917 |
| Operating Expenses: | ||
| Professional Fees | 681,377 | 363,789 |
| Depreciation and Amortization | 719,760 | 716,165 |
| Selling Expenses | 1,247,444 | 1,654,564 |
| Research and Development | 455,046 | 340,582 |
| Equity Compensation Expense (Note 11) | 3,130,986 | 114,222 |
| Consulting Fees | 327,232 | 126,693 |
| General and Administrative | 3,971,956 | 2,681,146 |
| Total Operating Expenses | 10,533,802 | 5,997,161 |
| Income (loss) from Operations | 4,508,789 | (2,083,244) |
| Other Income (Expense): | ||
| Amortization of Debt Discounts | - | (17,534) |
| Interest Income | 2,915 | 3,045 |
| Interest Expense | (43,538) | (200,000) |
| Total Other Income (Expense) | (40,623) | (214,489) |
| Income (loss) before income taxes | 4,468,166 | (2,297,733) |
| Provision for Income Taxes (Note 17) | 77,000 | - |
| Net Income (loss) | $4,391,166 | $(2,297,733) |
| Net income (loss) Per Common Share | ||
| Basic | $0.27 | $(0.15) |
| Diluted | $0.23 | $(0.15) |
| Basic Weighted Average Common Shares Outstanding | 16,512,126 | 15,586,258 |
| Diluted Weighted Average Common Shares Outstanding | 18,757,509 | 15,586,258 |
Series A Preferred | Common Stock | ||||||
Additional Paid | Accumulated | Total Shareholders’ | |||||
Shares | Amount | Shares | Amount | in Capital | Deficit | Equity | |
| Balance at December 31, 2018 | 63,750 | $638 | 15,536,302 | $155,363 | $44,040,708 | $(41,201,511) | $2,995,198 |
| Equity Compensation | 146,878 | 146,878 | |||||
| Common Stock Issued for Services Provided | 51,250 | 513 | 44,688 | 45,200 | |||
| Net Loss for the year ended December 31, 2019 | (2,297,733) | (2,297,733) | |||||
| Balance at December 31, 2019 | 63,750 | 638 | 15,587,552 | 155,876 | 44,232,274 | (43,499,244) | 889,543 |
| Equity Compensation | 3,158,175 | 3,158,175 | |||||
| Common Stock Issued for Services Provided | 50,500 | 505 | 49,685 | 50,190 | |||
| Conversion of Notes Payable into Common Stock | 1,041,667 | 10,417 | 4,489,584 | 4,500,000 | |||
| Warrants and Options Exercised | 79,296 | 793 | 212,707 | 213,500 | |||
| Other | 2,499 | 25 | (25) | - | |||
| Net Income for the year ended December 31, 2020 | 4,391,166 | 4,391,166 | |||||
| Balance at December 31, 2020 | 63,750 | $638 | 16,761,514 | $167,614 | $52,142,400 | $(39,108,078) | $13,202,573 |
For the Years Ended December 31, | ||
2020 | 2019 | |
| Cash Flow From Operating Activities: | ||
| Net Income (Loss) | $4,391,166 | $(2,297,733) |
| Adjustments to Reconcile Net Income (Loss) to | ||
| Net Cash Provided by (Used) In Operating Activities: | ||
| Depreciation and Amortization | 719,760 | 716,165 |
| Amortization of Right of Use Asset | 157,315 | 157,315 |
| Amortization of Debt Discount | - | 17,534 |
| Amortization of Software Costs | 41,900 | 31,426 |
| Equity Compensation Expense | 3,130,986 | 114,222 |
| Value of Equity Issued for Services | 50,190 | 45,200 |
| Reserve for Bad Debt | 280,000 | (190,000) |
| Inventory Reserve | (100,000) | - |
| Changes in Operating Assets and Liabilities: | ||
| Decrease (Increase) in: | ||
| Accounts Receivable | (2,502,043) | 840,964 |
| Inventory | (1,388,986) | 348,226 |
| Prepaid Expenses | (233,642) | 78,269 |
| Vendor Deposits | (247,660) | (31,611) |
| Other Receivables | (198,951) | - |
| Other Assets | (294,659) | (154,330) |
| Increase (Decrease) in: | ||
| Accounts Payable | 788,247 | (420,427) |
| Accrued Expenses | 78,926 | 67,569 |
| Accrued Interest | (66,667) | - |
| Accrued Officer Compensation | - | (70,000) |
| Customer Deposits | 118,880 | (1,486) |
| Lease Liability | (146,688) | (65,753) |
| Net Cash Provided (Used) in Operating Activities | 4,578,076 | (814,451) |
| Cash Flow From Investing Activities: | ||
| Capitalized Software Costs | - | (125,704) |
| Capitalized Patent Costs | (111,386) | (21,980) |
| Purchase of Property and Equipment | (289,270) | (145,580) |
| Net Cash (Used) in Investing Activities | (400,655) | (293,264) |
|
| December 31, 2023 |
|
| December 31, 2022 |
| ||
ASSETS |
|
|
|
|
|
| ||
Current Assets: |
|
|
|
|
|
| ||
Cash and Cash Equivalents |
| $ | 2,339,059 |
|
| $ | 3,866,733 |
|
Accounts Receivable - net |
|
| 2,429,929 |
|
|
| 2,772,340 |
|
Other Receivables |
|
| 164,150 |
|
|
| 164,150 |
|
Inventories (Note 3) |
|
| 4,627,103 |
|
|
| 4,495,999 |
|
Vendor Deposits (Note 4) |
|
| 29,335 |
|
|
| 447,052 |
|
Prepaid Expenses |
|
| 371,298 |
|
|
| 388,359 |
|
Total Current Assets |
|
| 9,960,874 |
|
|
| 12,134,633 |
|
|
|
|
|
|
|
|
|
|
Property and Equipment – net (Note 5) |
|
| 1,048,642 |
|
|
| 1,335,331 |
|
|
|
|
|
|
|
|
|
|
Other Assets: |
|
|
|
|
|
|
|
|
Intangible Assets – net (Note 6) |
|
| 1,123,246 |
|
|
| 1,025,736 |
|
Operating Lease - Right of Use Asset (Note - 7) |
|
| 467,935 |
|
|
| 528,996 |
|
Long Term Accounts Receivable - net |
|
| 206,240 |
|
|
| - |
|
Other Assets |
|
| 550,677 |
|
|
| 475,103 |
|
Total Other Assets |
|
| 2,348,098 |
|
|
| 2,029,835 |
|
Total Assets |
| $ | 13,357,614 |
|
| $ | 15,499,799 |
|
|
|
|
|
|
|
|
|
|
LIABILITIES AND SHAREHOLDERS’ EQUITY |
|
|
|
|
|
|
|
|
|
|
|
|
|
|
|
|
|
Current Liabilities: |
|
|
|
|
|
|
|
|
Accounts Payable |
| $ | 1,267,029 |
|
| $ | 1,761,750 |
|
Accrued Expenses and Other Current Liabilities (Note 14) |
|
| 675,491 |
|
|
| 728,703 |
|
Deferred Revenue |
|
| - |
|
|
| 699,732 |
|
Current Portion of Long-Term Operating Lease (Note 7) |
|
| 115,658 |
|
|
| 100,282 |
|
Total Current Liabilities |
|
| 2,058,178 |
|
|
| 3,290,467 |
|
|
|
|
|
|
|
|
|
|
Long-Term Liabilities: |
|
|
|
|
|
|
|
|
Long-Term Operating Lease, Net of Current Portion (Note 7) |
|
| 642,527 |
|
|
| 761,132 |
|
Convertible Notes Payable, net of discount of $301,985 and $0 at December 31, 2023 and 2022, respectively (Note 10) |
|
| 2,298,015 |
|
|
| - |
|
Total Long-Term Liabilities |
|
| 2,940,542 |
|
|
| 761,132 |
|
Total Liabilities |
|
| 4,998,720 |
|
|
| 4,051,599 |
|
|
|
|
|
|
|
|
|
|
Commitments and Contingencies (Note 12) |
|
|
|
|
|
|
|
|
|
|
|
|
|
|
|
|
|
Shareholders’ Equity: |
|
|
|
|
|
|
|
|
Cumulative Convertible Series A Preferred Stock; par value $0.01 per share, 1,000,000 shares authorized; 63,750 shares issued and outstanding at December 31, 2023 and 2022, respectively |
|
| 638 |
|
|
| 638 |
|
Cumulative Convertible Series B Preferred Stock; $1,000 stated value; 7.5% Cumulative dividend; 4,000 shares authorized; none issued and outstanding at December 31, 2023 and 2022, respectively |
|
| - |
|
|
| - |
|
Common stock; par value $0.01 per share, 250,000,000 shares authorized; 19,923,955 and 19,763,955 shares issued and outstanding at December 31, 2023 and 2022, respectively |
|
| 199,240 |
|
|
| 197,640 |
|
Additional Paid-In Capital |
|
| 57,985,245 |
|
|
| 57,673,559 |
|
Accumulated Deficit |
|
| (49,826,229 | ) |
|
| (46,423,637 | ) |
Total Shareholders’ Equity |
|
| 8,358,894 |
|
|
| 11,448,200 |
|
Total Liabilities and Shareholders’ Equity |
| $ | 13,357,614 |
|
| $ | 15,499,799 |
|
The accompanying notes are an integral part of the consolidated financial statements.
| Table of Contents |
For the Years Ended December 31, | ||
2020 | 2019 | |
| Cash Flow From Financing Activities: | ||
| Proceeds from Exercise of Warrants and Options | 213,500 | - |
| Proceeds from Loan Payable | 410,700 | - |
| Repayment of Principal Balance on Convertible Note | (500,000) | - |
Net Cash Provided by Financing Activities: | 124,200 | - |
| Increase (Decrease) In Cash and Cash Equivalents | 4,301,620 | (1,107,715) |
| Cash and Cash Equivalents - Beginning | 897,223 | 2,004,938 |
| Cash and Cash Equivalents – Ending | $5,198,842 | $897,223 |
| Supplemental Cash Flow Information: | ||
| Cash Paid For Interest | $107,356 | $200,000 |
| Cash Paid for Income Taxes | $800 | $800 |
| Non-Cash Investing and Financing Activities: | ||
| Accrued Equity Compensation | $27,189 | $32,656 |
| Conversion of Note Payable into Common Stock | $4,500,000 | $- |
| Equipment, net Transferred to and from Inventory | $22,685 | $18,574 |
| Patent and trademark costs reclassified from Other Assets | $49,758 | $51,692 |
TOMI ENVIRONMENTAL SOLUTIONS, INC.
CONSOLIDATED STATEMENTS OF OPERATIONS
|
| For The Years Ended |
| |||||
|
| December 31, |
| |||||
|
| 2023 |
|
| 2022 |
| ||
|
|
|
|
|
|
| ||
Sales, net |
| $ | 7,354,564 |
|
| $ | 8,338,099 |
|
Cost of Sales |
|
| 3,065,028 |
|
|
| 3,277,644 |
|
Gross Profit |
|
| 4,289,536 |
|
|
| 5,060,455 |
|
|
|
|
|
|
|
|
|
|
Operating Expenses: |
|
|
|
|
|
|
|
|
Professional Fees |
|
| 575,728 |
|
|
| 536,311 |
|
Depreciation and Amortization |
|
| 366,677 |
|
|
| 329,164 |
|
Selling Expenses |
|
| 1,351,465 |
|
|
| 1,867,013 |
|
Research and Development |
|
| 491,798 |
|
|
| 352,238 |
|
Consulting Fees |
|
| 282,548 |
|
|
| 215,180 |
|
General and Administrative |
|
| 4,570,597 |
|
|
| 4,642,548 |
|
Total Operating Expenses |
|
| 7,638,813 |
|
|
| 7,942,454 |
|
Income (loss) from Operations |
|
| (3,349,277 | ) |
|
| (2,881,999 | ) |
|
|
|
|
|
|
|
|
|
Other Income (Expense): |
|
|
|
|
|
|
|
|
Interest Income |
|
| 11,990 |
|
|
| 1,939 |
|
Interest Expense |
|
| (63,305 | ) |
|
| - |
|
Total Other Income (Expense) |
|
| (53,315 | ) |
|
| 1,939 |
|
|
|
|
|
|
|
|
|
|
Income (loss) before income taxes |
|
| (3,402,592 | ) |
|
| (2,880,060 | ) |
Provision for Income Taxes (Note 16) |
|
| - |
|
|
| - |
|
Net Income (loss) |
| $ | (3,402,592 | ) |
| $ | (2,880,060 | ) |
|
|
|
|
|
|
|
|
|
Net income (loss) Per Common Share |
|
|
|
|
|
|
|
|
Basic |
| $ | (0.17 | ) |
| $ | (0.15 | ) |
Diluted |
| $ | (0.17 | ) |
| $ | (0.15 | ) |
|
|
|
|
|
|
|
|
|
Basic Weighted Average Common Shares Outstanding |
|
| 19,834,476 |
|
|
| 19,743,544 |
|
Diluted Weighted Average Common Shares Outstanding |
|
| 19,834,476 |
|
|
| 19,743,544 |
|
The accompanying notes are an integral part of the consolidated financial statements.
| F-5 |
| Table of Contents |
TOMI ENVIRONMENTAL SOLUTIONS, INC.
CONSOLIDATED STATEMENTS OF SHAREHOLDERS’ EQUITY
FOR THE YEARS ENDED DECEMBER 31, 2023 AND 2022
|
| Series A Preferred |
|
| Common Stock |
|
| Additional Paid |
|
| Accumulated |
|
| Total Shareholders’ |
| |||||||||||||
|
| Shares |
|
| Amount |
|
| Shares |
|
| Amount |
|
| in Capital |
|
| Deficit |
|
| Equity |
| |||||||
|
|
|
|
|
|
|
|
|
|
|
|
|
|
|
|
|
|
|
|
|
| |||||||
Balance at January 1, 2022 |
|
| 63,750 |
|
|
| 638 |
|
|
| 19,680,955 |
|
|
| 196,809 |
|
| $ | 56,941,209 |
|
| $ | (43,543,577 | ) |
| $ | 13,595,080 |
|
Equity Compensation |
|
|
|
|
|
|
|
|
|
|
|
|
|
|
|
|
|
| 653,843 |
|
|
|
|
|
|
| 653,843 |
|
Common Stock Issued for Services Provided |
|
|
|
|
|
|
|
|
|
| 51,750 |
|
|
| 518 |
|
|
| 53,820 |
|
|
|
|
|
|
| 54,338 |
|
Warrants and Options Exercised |
|
|
|
|
|
|
|
|
|
| 31,250 |
|
|
| 313 |
|
|
| 24,687 |
|
|
|
|
|
|
| 25,000 |
|
Net (Loss) for the year ended December 31, 2022 |
|
|
|
|
|
|
|
|
|
|
|
|
|
|
|
|
|
|
|
|
|
| (2,880,060 | ) |
|
| (2,880,060 | ) |
Balance at December 31, 2022 |
|
| 63,750 |
|
| $ | 638 |
|
|
| 19,763,955 |
|
| $ | 197,640 |
|
| $ | 57,673,559 |
|
| $ | (46,423,637 | ) |
| $ | 11,448,200 |
|
|
|
|
|
|
|
|
|
|
|
|
|
|
|
|
|
|
|
|
|
|
|
|
|
|
|
|
|
|
Equity Compensation |
|
|
|
|
|
|
|
|
|
|
|
|
|
|
|
|
|
| 163,286 |
|
|
|
|
|
|
| 163,286 |
|
Common Stock Issued for Services Provided |
|
|
|
|
|
|
|
|
|
| 160,000 |
|
|
| 1,600 |
|
|
| 148,400 |
|
|
|
|
|
|
| 150,000 |
|
Net (Loss) for the year ended December 31, 2023 |
|
|
|
|
|
|
|
|
|
|
|
|
|
|
|
|
|
|
|
|
|
| (3,402,592 | ) |
|
| (3,402,592 | ) |
Balance at December 31, 2023 |
|
| 63,750 |
|
| $ | 638 |
|
|
| 19,923,955 |
|
| $ | 199,240 |
|
| $ | 57,985,245 |
|
| $ | (49,826,229 | ) |
| $ | 8,358,894 |
|
The accompanying notes are an integral part of the consolidated financial statements.
| F-6 |
| Table of Contents |
TOMI ENVIRONMENTAL SOLUTIONS, INC.
CONSOLIDATED STATEMENTS OF CASH FLOWS
|
| For the Years Ended December 31, |
| |||||
|
| 2023 |
|
| 2022 |
| ||
Cash Flow Used in Operating Activities: |
|
|
|
|
|
| ||
Net Loss |
| $ | (3,402,592 | ) |
| $ | (2,880,060 | ) |
Adjustments to Reconcile Net Loss to |
|
|
|
|
|
|
|
|
Net Used In Operating Activities: |
|
|
|
|
|
|
|
|
Depreciation and Amortization |
|
| 366,677 |
|
|
| 329,164 |
|
Amortization of Right of Use Asset |
|
| 157,315 |
|
|
| 157,315 |
|
Amortization of Software Costs |
|
| - |
|
|
| 10,475 |
|
Amortization of Deferred Financing Costs |
|
| 10,413 |
|
|
|
|
|
Equity Compensation Expense |
|
| 163,286 |
|
|
| 653,843 |
|
Value of Equity Issued for Services |
|
| 150,000 |
|
|
| 54,338 |
|
Reserve for Bad Debt |
|
| (183,653 | ) |
|
| - |
|
Inventory Reserve |
|
| - |
|
|
| 95,000 |
|
Changes in Operating Assets and Liabilities: |
|
|
|
|
|
|
|
|
Decrease (Increase) in: |
|
|
|
|
|
|
|
|
Accounts Receivable |
|
| 526,064 |
|
|
| (807,564 | ) |
Inventory |
|
| (131,104 | ) |
|
| 152,281 |
|
Prepaid Expenses |
|
| 17,061 |
|
|
| (44,786 | ) |
Vendor Deposits |
|
| 417,718 |
|
|
| (158,466 | ) |
Other Receivables |
|
| - |
|
|
| 71,754 |
|
Long Term Accounts Receivable |
|
| (206,240 | ) |
|
|
|
|
Other Assets |
|
| (75,574 | ) |
|
| (177,474 | ) |
Increase (Decrease) in: |
|
|
|
|
|
|
|
|
Accounts Payable |
|
| (494,721 | ) |
|
| 707,711 |
|
Accrued Expenses |
|
| (53,212 | ) |
|
| 64,095 |
|
Customer Deposits |
|
| (699,732 | ) |
|
| 693,732 |
|
Lease Liability |
|
| (160,291 | ) |
|
| (155,622 | ) |
Net Cash Used in Operating Activities |
|
| (3,598,585 | ) |
|
| (1,234,264 | ) |
|
|
|
|
|
|
|
|
|
Cash Flow From Investing Activities: |
|
|
|
|
|
|
|
|
Capitalized Patent and Trademark Costs |
|
| (118,630 | ) |
|
| (40,570 | ) |
Purchase of Property and Equipment |
|
| (98,060 | ) |
|
| (200,876 | ) |
Net Cash Used in Investing Activities |
|
| (216,690 | ) |
|
| (241,446 | ) |
| F-7 |
| Table of Contents |
TOMI ENVIRONMENTAL SOLUTIONS, INC.
CONSOLIDATED STATEMENTS OF CASH FLOWS – CONTINUED
|
| For the Years Ended December 31, |
| |||||
|
| 2023 |
|
| 2022 |
| ||
Cash Flow From Financing Activities: |
|
|
|
|
|
| ||
Proceeds from Issuance of Convertible Notes |
|
| 2,287,601 |
|
|
| - |
|
Proceeds from Issuance of Stock and Warrants |
|
| - |
|
|
| 25,000 |
|
Net Cash From Financing Activities: |
|
| 2,287,601 |
|
|
| 25,000 |
|
Decrease In Cash and Cash Equivalents |
|
| (1,527,674 | ) |
|
| (1,450,710 | ) |
Cash and Cash Equivalents - Beginning |
|
| 3,866,733 |
|
|
| 5,317,443 |
|
Cash and Cash Equivalents – Ending |
| $ | 2,339,059 |
|
| $ | 3,866,733 |
|
|
|
|
|
|
|
|
|
|
Supplemental Cash Flow Information: |
|
|
|
|
|
|
|
|
Cash Paid For Interest |
| $ | - |
|
| $ | 28,892 |
|
Cash Paid (Refunded) for Income Taxes |
| $ | - |
|
| $ | (72,086 | ) |
Non-Cash Investing and Financing Activities: |
|
|
|
|
|
|
|
|
Patent and trademark costs reclassified from Other Assets |
| $ | - |
|
| $ | 43,377 |
|
The accompanying notes are an integral part of the consolidated financial statements.
| F-8 |
| Table of Contents |
TOMI ENVIRONMENTAL SOLUTIONS, INC.
NOTES TO CONSOLIDATED FINANCIAL STATEMENTS
NOTE 1. DESCRIPTION OF BUSINESS
TOMI Environmental Solutions, Inc., a Florida corporation (“TOMI”, the “Company”, “we”, “our” and “us”) is a global provider of disinfection and decontamination essentials through our premier Binary Ionization Technology
Invented under a defense grant in association with the Defense Advanced Research Projects Agency (DARPA)(“DARPA”) of the U.S. Department of Defense, BIT
Our products are designed to service a broad spectrum of commercial structures, including, but not limited to, hospitals and medical facilities, bio-safety labs, pharmaceutical facilities, meat and produce processing facilities, universities and research facilities, vivarium labs, allother service industries including cruise ships, office buildings, hotel and motel rooms, schools, restaurants, military barracks, police and fire departments, prisons, and athletic facilities. Our products are also used in single-family homes and multi-unit residences. Additionally, our products have been listed on the EPA’s List N as products that help combat COVID-19 and are actively being used for this purpose.
NOTE 2. SUMMARY OF SIGNIFICANT ACCOUNTING POLICIES
Principles of Consolidation
The accompanying consolidated financial statements include the accounts of TOMI and its wholly owned subsidiary, TOMI Environmental Solutions, Inc., a Nevada corporation. All significant intercompany accounts and transactions have been eliminated in consolidation.
Reclassification of Accounts
Certain reclassifications have been made to prior-year comparative financial statements to conform to the current year presentation. These reclassifications had no material effect on previously reported results of operations or financial position.
Use of Estimates
The preparation of the consolidated financial statements in conformity with U.S. GAAP requires us to make estimates and assumptions that affect the amounts reported and disclosed in the accompanying consolidated financial statements and the accompanying notes. Actual results could differ materially from these estimates. On an ongoing basis, we evaluate our estimates, including those related to accounts receivable, inventory, fair values of financial instruments, intangible assets, useful lives of intangible assets and property and equipment, fair values of stock-based awards, income taxes, and contingent liabilities, among others. We base our estimates on historical experience and on various other assumptions that are believed to be reasonable, the results of which form the basis for making judgments about the carrying values of our assets and liabilities.
Fair Value Measurements
The authoritative guidance for fair value measurements defines fair value as the exchange price that would be received for an asset or paid to transfer a liability (an exit price) in the principal or the most advantageous market for the asset or liability in an orderly transaction between market participants on the measurement date. Market participants are buyers and sellers in the principal market that are (i) independent, (ii) knowledgeable, (iii) able to transact, and (iv) willing to transact. The guidance describes a fair value hierarchy based on the levels of inputs, of which the first two are considered observable and the last unobservable, that may be used to measure fair value, which are the following:
Level 1: | Quoted prices in active markets for identical assets or liabilities. | |
Level 2: | Inputs other than Level 1 that are observable, either directly or indirectly, such as quoted prices for similar assets or liabilities; quoted prices in markets that are not active; or other inputs that are observable or corroborated by observable market data for substantially the full term of the assets or liabilities. | |
Level 3: | Unobservable inputs that are supported by little or no market activity and that are significant to the value of the assets or liabilities. |
| F-9 |
| Table of Contents |
The carrying amounts of cash and cash equivalents, accounts receivable, accounts payable and accrued expenses approximated fair value because of the short maturity of these instruments.
Cash and Cash Equivalents
Cash and cash equivalents includes cash on hand, held at financial institutions and other liquid investments with original maturities of three months or less. At times, these deposits may be in excess of insured limits
Accounts Receivable
Our accounts receivable are typically from credit worthycredit-worthy customers or, for certain international customers, are supported by pre-payments. For those customers to whom we extend credit, we perform periodic evaluations of their status and maintain allowances for potential credit losses as deemed necessary. We have a policy of reserving for doubtful accountscredit losses based on our best estimate of the amount of potential credit losses in existing accounts receivable. We periodically review our accounts receivable to determine whether an allowance is necessary based on an analysis of past due accounts and other factors that may indicate that the realization of an account may be in doubt. Account balances deemed to be uncollectible are charged to the allowance after all means of collection have been exhausted and the potential for recovery is considered remote. Bad debt expense for the years ended December 31, 20202023 and 20192022, was $332,027approximately $272,517 and $32,721,$142,188, respectively.
Long-term trade accounts receivable, are principally amounts arising from the sale of goods and services with a contractual maturity date or realization period of greater than one year and are recognized as “Long-Term Accounts Receivable” in our Consolidated Balance Sheet.
Inventories
Inventories are valued at the lower of cost or marketnet realizable value using the first-in, first-out (FIFO) method. Inventories consist primarily of finished goods.
We expense costs to maintain certification to cost of goods sold as incurred.
We review inventory on an ongoing basis, considering factors such as deterioration and obsolescence. We record an allowance for estimated losses when the facts and circumstances indicate that particular inventories may not be usable. Our reserve for obsolete inventory was $0 and $100,000$95,000 as of December 31, 20202023 and December 31, 2019, respectively.
Property and Equipment
We account for property and equipment at cost less accumulated depreciation. We compute depreciation using the straight-line method over the estimated useful lives of the assets, generally three to five years. Depreciation for equipment, furniture and fixtures and vehicles commences once placed in service for its intended use. Leasehold improvements are amortized using the straight-line method over the lives of the respective leases or service lives of the improvements, whichever is shorter.
Leases
We recognize a right-of-use (“ROU”) asset and lease liability for all leases with certain exceptions, on the balance sheet, while recognition on the statementterms of operations will remain similar to current lease accounting. Subsequently, the FASB issued ASU No. 2018-10,
| F-10 |
| Table of Contents |
As a lessee, we areutilize the reasonably certain tothreshold criteria in determining which options we will exercise. All otherFurthermore, our lease assets and lease liabilitiespayments are recognized based on index rates with minimum annual increases. These represent fixed payments and are captured in the future minimum lease payments calculation. In determining the discount rate to use in calculating the present value of lease payments, over the lease term at commencement date. Because most of our leases do not provide an implicit rate of return, we used our incremental borrowing rate based on the information available at adoption date in determining the present value of lease payments.
We have also elected the practical expedient to not separate lease and non-lease components for all asset classes, meaning all consideration that is fixed, or in-substance fixed, will be captured as part of our lease components for balance sheet purposes. Furthermore, all variable payments included in lease agreements will be disclosed as variable lease expense when incurred. Generally, variable lease payments are based on usage and common area maintenance. These payments will be included as variable lease expense in the period in which they are incurred.
Capitalized Software Development Costs
In accordance with ASC 985-20 regarding the development of software to be sold, leased, or marketed, we expense such costs as they are incurred until technological feasibility has been established, at and after which time those costs are capitalized until the product is available for general release to customers. The periodic expense for the amortization of capitalized software development costs will be included in cost of sales. The periodic expense for the amortization of capitalized software development costs will be included in cost of sales. Amortization expense for the years ended December 31, 20202023 and 2019,2022, was $41,900 was $31,426,$0 and $10,475, respectively.
Accounts Payable
As of December 31, 2020,2023, two vendors accounted for approximately 32%59% of accounts payable. As of December 31, 2019, one vendor2022, two vendors accounted for approximately 40%55% of accounts payable.
For the year ended December 31, 2020,2023, two vendors accounted for 76%70% of cost of sales. For the year ended December 31, 2019, one vendor2022, two vendors accounted for 72%67% of cost of sales.
Accrued Warranties
Accrued warranties represent the estimated costs, if any, that will be incurred during the warranty period of our products. We estimate the expected costs to be incurred during the warranty period and record the expense to the consolidated statement of operations at the date of sale. Our manufacturers assume the warranty against product defects from date of sale, which we extend to our customers upon sale of the product. We assume responsibility for product reliability and results. As of December 31, 2020,2023, and December 31, 2019,2022, our warranty reserve was $30,000 and $68,000, and $30,000, respectivelyrespectively. (See Note 15).
Income Taxes
Deferred income tax assets and liabilities are determined based on differences between the financial statement reporting and tax bases of assets and liabilities and are measured using the enacted tax rates and laws in effect when the differences are expected to reverse. The measurement of deferred income tax assets is reduced, if necessary, by a valuation allowance for any tax benefits that are, on a more likely than not basis, not expected to be realized in accordance with Accounting Standards Codification (ASC)FASB ASC Topic 740, Income Taxes guidance for income taxes. Net deferred tax benefits have been fully reserved at December 31, 20202023 and December 31, 2019.2022. The effect on deferred income tax assets and liabilities of a change in tax rates is recognized in the period that such tax rate changes are enacted.
Net Income (Loss) Per Share
Basic net income or (loss) per share is computed by dividing our net income or (loss) by the weighted average number of shares of common stock outstanding during the period presented. Diluted income or (loss) per share is based on the treasury stock method and includes the effect from potential issuance of shares of common stock, such as shares issuable pursuant to the exercise of options and warrants and conversions of preferred stock or debentures.
Potentially dilutive securities as of December 31, 20202023 consisted of 2,049,1332,080,000 shares of common stock from convertible debentures, 2,772,096 shares of common stock issuable upon exercise of outstanding warrants, 132,500617,542 shares of common stock issuable upon outstanding options and 63,750 shares of common stock issuable upon conversion of outstanding shares of Preferred A stock (“Convertible Series A Preferred Stock”).
| F-11 |
| Table of Contents |
Potentially dilutive securities as of December 31, 20192022 consisted of 1,157,406 shares of common stock from convertible debentures, 2,155,0652,792,335 shares of common stock issuable upon exercise of outstanding warrants, 77,500413,000 shares of common stock issuable upon outstanding options and 63,750 shares of common stock issuable upon conversion of outstanding shares of Preferred A stock (“Convertible Series A Preferred Stock”). Diluted and basic weighted average shares are the same, as potentially dilutive shares are anti-dilutive.
Options, warrants, preferred stock and shares associated with the conversion of debt to purchase approximately 2.25.5 million and 3.53.3 million shares of common stock were outstanding at December 31, 20202023 and 2019,2022, respectively, but were excluded from the computation of diluted net loss per share at December 31, 20192023 and 2022 due to the anti-dilutive effect on net loss per share.
For the Years Ended December 31, | ||
2020 | 2019 | |
| Net Income (Loss) | $4,391,166 | $(2,297,733) |
| Adjustments for convertible debt - as converted | ||
| Interest on convertible debt | 40,689 | 200,000 |
| Amortization of debt discount on convertible debt | - | 17,534 |
| Net income (loss) attributable to common shareholders | $4,431,855 | $(2,080,199) |
| Weighted average number of shares of common stock outstanding: | ||
| Basic | 16,512,126 | 15,586,258 |
| Diluted | 18,757,509 | 15,586,258 |
| Net income (loss) attributable to common shareholders per share: | ||
| Basic | $0.27 | $(0.13) |
| Diluted | $0.24 | $(0.13) |
|
| For the Year Ended December 31, |
| |||||
|
| 2023 |
|
| 2022 |
| ||
Net Loss |
| $ | (3,402,592 | ) |
| $ | (2,880,060 | ) |
Net loss attributable to common shareholders |
| $ | (3,402,592 | ) |
| $ | (2,880,060 | ) |
Weighted average number of shares of common stock outstanding: |
|
|
|
|
|
|
|
|
Basic |
|
| 19,834,476 |
|
|
| 19,743,544 |
|
Diluted |
|
| 19,834,476 |
|
|
| 19,743,544 |
|
Net loss attributable to common shareholders per share: |
|
|
|
|
|
|
|
|
Basic |
| $ | (0.17 | ) |
| $ | (0.15 | ) |
Diluted |
| $ | (0.17 | ) |
| $ | (0.15 | ) |
The following provides a reconciliation of the shares used in calculating the per share amounts for the periods presented:
For the Years Ended December 31, | ||
2020 | 2019 | |
| Numerator: | ||
| Net Income (Loss) | $4,391,166 | $(2,297,733) |
| Denominator: | ||
| Basic weighted-average shares | 16,512,126 | 15, 586,258 |
| Effect of dilutive securities | ||
| Warrants | 2,049,133 | - |
| Convertible Debt | - | - |
| Options | 132,500 | - |
| Preferred Stock | 63,750 | - |
| Diluted Weighted Average Shares | 18,757,509 | 15, 586,258 |
| Net Income (Loss) Per Common Share: | ||
| Basic | $0.27 | $(0.15) |
| Diluted | $0.23 | $(0.15) |
| Income (loss) from Operations Data: | ||
| Income (Loss) from Operations | $4,508,789 | $(2,083,244) |
| Basic and Diluted Weighted Average Shares | �� | |
| Basic | 16,512,126 | 15, 586,258 |
| Diluted | 18,757,509 | 15, 586,258 |
| Basic and Diluted Income (loss) Per Common Share | ||
| Basic | $0.27 | $(0.13) |
| Diluted | $0.24 | $(0.13) |
|
| For the Years Ended December 31, |
| |||||
|
| 2023 |
|
| 2022 |
| ||
Numerator: |
|
|
|
|
|
| ||
Net Loss |
| $ | (3,402,592 | ) |
| $ | (2,880,060 | ) |
Denominator: |
|
|
|
|
|
|
|
|
Basic weighted-average shares |
|
| 19,834,476 |
|
|
| 19,743,544 |
|
Effect of dilutive securities |
|
|
|
|
|
|
|
|
Warrants |
|
| - |
|
|
| - |
|
Convertible Debt |
|
| - |
|
|
| - |
|
Options |
|
| - |
|
|
| - |
|
Preferred Stock |
|
| - |
|
|
| - |
|
Diluted Weighted Average Shares |
|
| 19,834,476 |
|
|
| 19,743,544 |
|
|
|
|
|
|
|
|
|
|
Net Loss Per Common Share: |
|
|
|
|
|
|
|
|
| ||||||||
Basic |
| $ | (0.17 | ) |
| $ | (0.15 | ) |
Diluted |
| $ | (0.17 | ) |
| $ | (0.15 | ) |
| F-12 |
| Table of Contents |
Revenue Recognition
We recognize revenue in accordance with Financial Accounting Standards Board (FASB) Accounting Standards Update (ASU) No. 2014-09,Codification (“ASC”) Topic 606, Revenue from Contracts with Customers, Revenue from Contracts with Customers (Topic 606). We recognize revenue when we transfer promised goods or services to customers in an amount that reflects the consideration to which we expect to be entitled in exchange for those goods or services. To determine revenue recognition for contracts with customers we perform the following five steps: (i) identify the contract(s) with a customer; (ii) identify the performance obligation(s) in the contract; (iii) determine the transaction price; (iv) allocate the transaction price to the performance obligation(s) in the contract; and (v) recognize revenue when (or as) we satisfy the performance obligation(s). At contract inception, we assess the goods or services promised within each contract, assess whether each promised good or service is distinct and identify those that are performance obligations.
We must use judgment to determine: a) the number of performance obligations based on the determination under step (ii) above and whether those performance obligations are distinct from other performance obligations in the contract; b) the transaction price under step (iii) above; and c) the stand-alone selling price for each performance obligation identified in the contract for the allocation of transaction price in step (iv) above.
Title and risk of loss generally pass to our customers upon shipment. Our Customerscustomers include end users as well as dealers and distributors who market and sell our products. Our revenue is not contingent upon resale by the dealer or distributor, and we have no further obligations related to bringing about resale. Shipping and handling costs charged to customers are included in Product Revenues. The associated expenses are treated as fulfillment costs and are included in Cost of Revenues. Revenues are reported net of sales taxes collected from Customers.
Disaggregation of Revenue
The following table presents our revenues disaggregated by revenue source.
Product and Service Revenue
For the Years Ended December 31, | ||
2020 | 2019 | |
| SteraMist Product | $22,971,000 | $4,999,000 |
| Service and Training | 2,057,000 | 1,348,000 |
| Total | $25,028,000 | $6,347,000 |
For The Years Ended December 31, |
|
| Change |
| ||||||||
|
| 2023 |
|
| 2022 |
|
| $ |
| |||
SteraMist Product |
| $ | 5,695,000 |
|
| $ | 6,864,000 |
|
| $ | (1,169,000 | ) |
Service and Training |
|
| 1,660,000 |
|
|
| 1,474,000 |
|
|
| 186,000 |
|
Total |
| $ | 7,355,000 |
|
| $ | 8,338,000 |
|
| $ | (983,000 | ) |
Revenue by Geographic Region
For the Years Ended December 31, | ||
2020 | 2019 | |
| United States | $18,367,000 | $5,002,000 |
| International | 6,661,000 | 1,345,000 |
| Total | $25,028,000 | $6,347,000 |
|
| For The Years Ended December 31, |
|
| Change |
| ||||||
|
| 2023 |
|
| 2022 |
|
| $ |
| |||
United States |
| $ | 6,125,000 |
|
| $ | 6,261,000 |
|
| $ | (136,000 | ) |
International |
|
| 1,230,000 |
|
|
| 2,077,000 |
|
|
| (847,000 | ) |
Total |
| $ | 7,355,000 |
|
| $ | 8,338,000 |
|
| $ | (983,000 | ) |
Product revenue includes sales from our standard and customized equipment, solution and accessories sold with our equipment. Revenue is recognized upon transfer of control of promised products to customers in an amount that reflects the consideration we expect to receive in exchange for those products.
Service and training revenue include sales from our high-level decontamination and service engagements, validation of our equipment and technology and customer training. Service revenue is recognized as the agreed upon services are rendered to our customers in an amount that reflects the consideration we expect to receive in exchange for those services.
Costs to Obtain a Contract with a Customer
We apply a practical expedient to expense costs as incurred for costs to obtain a contract with a customer when the amortization period would have been one year or less. We generally expense sales commissions when incurred because the amortization period would have been one year or less. These costs are recorded within selling expenses.
Contract Balances
As of December 31, 2020,2023, and December 31, 20192022 we did not have any unsatisfied performance obligations for (i) contracts with an original expected length of one year or less and (ii) contracts for which we recognize revenue at the amount to which we have the right to invoice for services performed.
| F-13 |
| Table of Contents |
Arrangements with Multiple Performance Obligations
Our contracts with customers may include multiple performance obligations. We enter into contracts that can include various combinations of products and services, which are primarily distinct and accounted for as separate performance obligations.
Significant Judgments
Our contracts with customers for products and services often dictate the terms and conditions of when the control of the promised products or services is transferred to the customer and the amount of consideration to be received in exchange for the products and services.
Equity Compensation Expense
We account for equity compensation expense in accordance with FASB ASC 718, “Compensation—Stock Compensation.” Under the provisions of FASB ASC 718, equity compensation expense is estimated at the grant date based on the award’s fair value.
The valuation methodology used to determine the fair value of options and warrants issued as compensation during the period is the Black-Scholes option-pricing model. The Black-Scholes model requires the use of a number of assumptions including volatility of the stock price, the average risk-free interest rate, and the weighted average expected life of the options. Risk–free interest rates are calculated based on continuously compounded risk–free rates for the appropriate term. The expected term of the Company’s warrants has been determined utilizing the “simplified” method for awards that qualify as “plain-vanilla” warrants. The dividend yield is assumed to be zero as the Company has never paid or declared any cash dividends on its common stock, par value $0.01 (the “Common Stock”) and does not intend to pay dividends on its Common Stock in the foreseeable future. The expected forfeiture rate is estimated based on management’s best assessment.
On July 7, 2017, our shareholders approved the Company’s Amended and Restated 2016 Equity Incentive Plan or the 2016 Plan.(the “2016 Plan”). The 2016 Plan authorizes the grant of stock options, stock appreciation rights, restricted stock, restricted stock units and performance units/shares. Up to 2,000,000 shares of common stockCommon Stock are authorized for issuance under the 2016 Plan. Shares issued under the 2016 Plan may be either authorized but unissued shares, treasury shares, or any combination thereof. Provisions in the 2016 Plan permit the reuse or reissuance by the 2016 Plan of shares of common stockCommon Stock for numerous reasons, including, but not limited to, shares of common stockCommon Stock underlying canceled, expired, or forfeited awards of stock-based compensation and stock appreciation rights paid out in the form of cash. Equity compensation expense will typically be awarded in consideration for the future performance of services to us. All recipients of awards under the 2016 Plan are required to enter into award agreements with us at the time of the award;award, and awards under the 2016 Plan are expressly conditioned upon such agreements. For the year ended December 31, 20202023 and 2019,2022, we issued 50,00060,000 and 50,00051,750 shares of common stock, respectively, out of the 2016 Plan.
Concentrations of Credit Risk
Financial instruments that potentially subject us to significant concentrations of credit risk consist principally of cash and cash equivalents. We maintain cash balances at financial institutions which exceed the current Federal Deposit Insurance Corporation limit of $250,000 at times during the year.
Long-Lived Assets Including Acquired Intangible Assets
We assess long-lived assets for potential impairments at the end of each year, or during the year if an event or other circumstance indicates that we may not be able to recover the carrying amount of the asset. In evaluating long-lived assets for impairment, we measure recoverability of these assets by comparing the carrying amounts to the future undiscounted cash flows the assets are expected to generate. If our long-lived assets are considered to be impaired, the impairment to be recognized equals the amount by which the carrying value of the asset exceeds its fair market value. We base the calculations of the estimated fair value of our long-lived assets on the income approach. For the income approach, we use an internally developed discounted cash flow model that includes, among others, the following assumptions: projections of revenues and expenses and related cash flows based on assumed long-term growth rates and demand trends; expected future investments to grow new units; and estimated discount rates. We base these assumptions on our historical data and experience, industry projections, micro and macro general economic condition projections, and our expectations. We had no long-lived asset impairment charges for the years ended December 31, 20202023 and 2019.
| F-14 |
| Table of Contents |
Advertising and Promotional Expenses
We expense advertising costs in the period in which they are incurred. Advertising and promotional expenses included in selling expenses for the years ended December 31, 20202023 and 20192022 were approximately $276,000$498,000 and $144,000,$653,000, respectively.
Research and Development Expenses
We expense research and development expenses in the period in which they are incurred. For the years ended December 31, 20202023 and 2019,2022, research and development expenses were approximately $455,000$492,000 and $341,000,$352,000, respectively.
Business Segments
We currently have one reportable business segment due to the fact that we derive our revenue primarily from one product. A breakdown of revenue is presented in “Revenue Recognition” in Note 2 above.
Recent Accounting Pronouncements
Recently issued accounting pronouncements not yet adopted
In August 2018,November 2023, the Financial Accounting Standards Board (“FASB”) issued ASU No. 2023-07, Improvements to Reportable Segment Disclosures (Topic 280). This ASU updates reportable segment disclosure requirements by requiring disclosures of significant reportable segment expenses that are regularly provided to the Chief Operating Decision Maker (“CODM”) and included within each reported measure of a segment’s profit or loss. This ASU also requires disclosure of the title and position of the individual identified as the CODM and an explanation of how the CODM uses the reported measures of a segment’s profit or loss in assessing segment performance and deciding how to allocate resources. The ASU is effective for annual periods beginning after December 15, 2023, and interim periods within fiscal years beginning after December 15, 2024. Adoption of the ASU should be applied retrospectively to all prior periods presented in the financial statements. Early adoption is also permitted. This ASU will likely result in us including the additional required disclosures when adopted. We are currently evaluating the provisions of this ASU and expect to adopt them for the year ending December 31, 2024.
In December 2023, the FASB issued ASU No. 2018-15, “Intangibles-Goodwill and Other-Internal-Use Software2023-09, Improvements to Income Tax Disclosures (Topic 350): Customer’s Accounting for Implementation Costs Incurred in740). The ASU requires disaggregated information about a Cloud Computing Arrangement That is a Service Contract.” This new guidance aligns the requirements for capitalizing implementation costs incurred in a hosting arrangement that is a service contract with the requirements for capitalizing implementation costs incurred to develop or obtain internal-use software. This new guidancereporting entity’s effective tax rate reconciliation as well as additional information on income taxes paid. The ASU is effective on a prospective basis for annual periods beginning after December 15, 2024. Early adoption is also permitted for annual financial statements that have not yet been issued or retrospective basis beginningmade available for issuance. This ASU will result in the required additional disclosures being included in our consolidated financial statements, once adopted.
Recently adopted accounting pronouncements
In March 2022, the FASB issued ASU 2022-02, Troubled Debt Restructurings and Vintage Disclosures. This ASU eliminates the accounting guidance for troubled debt restructurings by creditors that have adopted ASU 2016-13, Measurement of Credit Losses on Financial Instruments, which we adopted on January 1, 2020, with early adoption permitted.2020. This ASU also enhances the disclosure requirements for certain loan refinancing and restructurings by creditors when a borrower is experiencing financial difficulty. In addition, the ASU amends the guidance on vintage disclosures to require entities to disclose current period gross write-offs by year of origination for financing receivables and net investments in leases within the scope of ASC 326-20. The ASU is effective for annual periods beginning after December 15, 2022, including interim periods within those fiscal years. We elected to adopt this guidance early, in 2020adopted the ASU prospectively on a prospective basis. The new guidanceJanuary 1, 2023. This ASU did not have a material impact on our Consolidatedconsolidated financial statements.
In October 2021, the FASB issued ASU No. 2021-08, Accounting for Contract Assets and Contract Liabilities from Contracts with Customers (Topic 805). This ASU requires an acquirer in a business combination to recognize and measure contract assets and contract liabilities (deferred revenue) from acquired contracts using the revenue recognition guidance in Topic 606. At the acquisition date, the acquirer applies the revenue model as if it had originated the acquired contracts. The ASU is effective for annual periods beginning after December 15, 2022, including interim periods within those fiscal years. We adopted this ASU prospectively on January 1, 2023. This ASU did not have a material impact on our consolidated financial statements.
| F-15 |
| Table of Contents |
In August 2020, the FASB issued ASU No. 2020-06, Debt—Debt with Conversion and Other Options (Subtopic 470-20) and Derivatives and Hedging—Contracts in Entity’s Own Equity (Subtopic 815-40): Accounting for Convertible Instruments and Contracts in an Entity’s Own Equity. ASU 2020-06 was issued to reduce the complexity associated with accounting for certain financial instruments with characteristics of liabilities and equity. ASU 2020-06 reduces the number of accounting models for convertible debt instruments and convertible preferred stock and improves the disclosures for convertible instruments and related earnings per share guidance. ASU 2020-06 also amends the guidance for the derivatives scope exception for contracts in an entity’s own equity and improves and amends the related earnings per share guidance. For public entities that qualify as a filer with the SEC, excluding entities eligible to be smaller reporting companies, ASU 2020-06 is effective for fiscal annual periods beginning after December 15, 2021, including interim periods within those fiscal years. For nonpublic entities, ASU 2020-06 is effective for fiscal years beginning after December 15, 2023, including interim periods within those fiscal years. Early adoption was permitted, but no earlier than fiscal years beginning after December 15, 2020, including interim periods within those fiscal years. ASU 2020-06 must be adopted as of the beginning of a company’s annual fiscal year. ASU 2020-06 may be adopted through either a modified retrospective method of transition or a fully retrospective method of transition. The Company adopted ASU 2020-06 on January 1, 2021. The adoption did not have an impact on our consolidated financial statements.
In June 2016, the FASB issued ASU 2016-13, Financial Statements.
NOTE 3. INVENTORIES
Inventories consist of the following at:
December 31, 2020 | December 31, 2019 | |
| Finished goods | $3,404,025 | $2,364,786 |
| Raw Materials | 377,490 | 50,428 |
| Inventory Reserve | - | (100,000) |
$3,781,515 | $2,315,214 |
|
| December 31, 2023 |
|
| December 31, 2022 |
| ||
Finished goods |
| $ | 3,980,000 |
|
| $ | 3,929,000 |
|
Raw Materials |
|
| 742,000 |
|
|
| 662,000 |
|
Inventory Reserve |
|
| (95,000 | ) |
|
| (95,000 | ) |
Inventory, net |
| $ | 4,627,000 |
|
| $ | 4,496,000 |
|
NOTE 4. VENDOR DEPOSITS
On December 31, 20202023 and December 31, 2019,2022, we maintained vendor deposits of $388,712$29,335 and $141,052,$447,052, respectively, for open purchase orders for inventory.
NOTE 5. PROPERTY AND EQUIPMENT
Property and equipment consist of the following at:
December 31, 2020 | December 31, 2019 | |
| Furniture and fixtures | $357,236 | $357,236 |
| Equipment | 1,580,743 | 1,355,014 |
| Vehicles | 60,703 | 60,703 |
| Computer and software | 203,704 | 166,598 |
| Leasehold improvements | 386,120 | 362,898 |
| Tenant Improvement Allowance | 405,000 | 405,000 |
2,993,507 | 2,707,449 | |
| Less: Accumulated depreciation | 1,695,404 | 1,339,585 |
$1,298,103 | $1,367,864 |
|
| December 31, 2023 |
|
| December 31, 2022 |
| ||
Furniture and fixtures |
| $ | 364,819 |
|
| $ | 364,819 |
|
Equipment |
|
| 2,269,185 |
|
|
| 2,236,510 |
|
Vehicles |
|
| 66,170 |
|
|
| 60,703 |
|
Computer and software |
|
| 306,556 |
|
|
| 246,638 |
|
Leasehold improvements |
|
| 393,381 |
|
|
| 393,381 |
|
Tenant Improvement Allowance |
|
| 405,000 |
|
|
| 405,000 |
|
|
|
|
|
|
|
|
|
|
Total Property and Equipment |
|
| 3,805,111 |
|
|
| 3,707,051 |
|
Less: Accumulated depreciation |
|
| 2,756,469 |
|
|
| 2,371,720 |
|
Property and Equipment, net |
| $ | 1,048,642 |
|
| $ | 1,335,331 |
|
| F-16 |
| Table of Contents |
For the years ended December 31, 20202023 and 2019,2022, depreciation was $342,523$345,556 and $345,687,$314,669, respectively. For the years ended December 31, 20202023 and 2019,2022, amortization of tenant improvement allowance was $39,194 and was recorded as lease expense and included within general and administrative expense on the consolidated statement of operations.
NOTE 6. INTANGIBLE ASSETS
Intangible assets consist of patents and trademarks related to our Binary Ionization Technology. We amortize the patents over the estimated remaining lives of the related patents. The trademarks have an indefinite life. Amortization expense was $377,237$21,121 and $370,478$14,495 for the years ended December 31, 20202022 and 2019,2021, respectively.
Definite life intangible assets consist of the following:
December 31, 2020 | December 31, 2019 | |
| Intellectual Property and Patents | $3,000,012 | $2,906,507 |
| Less: Accumulated Amortization | 2,856,991 | 2,479,754 |
| Intangible Assets, net | $143,021 | $426,753 |
|
| December 31, 2023 |
|
| December 31, 2022 |
| ||
Intellectual Property and Patents |
| $ | 3,196,396 |
|
| $ | 3,108,063 |
|
Less: Accumulated Amortization |
|
| 2,904,013 |
|
|
| 2,882,892 |
|
Patents, net |
| $ | 292,383 |
|
| $ | 225,171 |
|
Indefinite life intangible assets consist of the following:
| Trademarks | 579,895 | 512,257 |
Total Intangible Assets, net | $722,916 | $939,010 |
Trademarks |
|
| 830,863 |
|
|
| 800,565 |
|
Total Intangible Assets, net |
| $ | 1,123,246 |
|
| $ | 1,025,736 |
|
Approximate future amortization is as follows:
Year Ended: |
| Amount |
| |
|
|
|
| |
December 31, 2024 |
|
| 20,000 |
|
December 31, 2025 |
|
| 20,000 |
|
December 31, 2026 |
|
| 20,000 |
|
December 31, 2027 |
|
| 20,000 |
|
December 31, 2028 |
|
| 20,000 |
|
Thereafter |
|
| 192,000 |
|
Total |
| $ | 292,000 |
|
F-17 | |
NOTE 7. LEASES
In April 2018, we entered into a 10-year lease agreement for a new 9,000-square-foot facility that contains office, warehouse, lab and research and development space in Frederick, Maryland. The lease agreement was scheduled to commence oncommenced in December 1, 2018 or when the property was ready for occupancy. The agreement provided for annual rent of $143,460, an escalation clause that increases the rent 3% year over year, a landlord tenant improvement allowance of $405,000 and additional landlord work as discussed in the lease agreement. We took occupancy of the property on December 17, 2018 and the lease was amended in March 2019 to provide for a 4-month rent holiday and a commencement date of April 1, 2019. A 7% discount rate was determined using our incremental borrowing rate based on the information available at adoption date in determining the present value of lease payments. Lease expense for operating lease payments is recognized on a straight-line basis over the lease term.
The balances for our operating lease where we are the lessee are presented as follows within our consolidated balance sheet:
| Operating leases: | December 31, 2020 | December 31, 2019 |
| Assets: | ||
| Operating lease right-of-use asset | $631,527 | $674,471 |
Liabilities: | ||
| Current Portion of Long-Term Operating Lease | $81,223 | $71,510 |
| Long-Term Operating Lease, Net of Current Portion | 953,190 | 1,034,413 |
$1,034,413 | $1,105,923 |
Operating leases: |
| December 31, 2023 |
|
| December 31, 2022 |
| ||
Assets: |
|
|
|
|
|
| ||
Operating lease right-of-use asset |
| $ | 467,935 |
|
| $ | 528,996 |
|
Liabilities: |
|
|
|
|
|
|
|
|
Current Portion of Long-Term Operating Lease |
| $ | 115,658 |
|
| $ | 100,282 |
|
Long-Term Operating Lease, Net of Current Portion |
|
| 642,527 |
|
|
| 761,132 |
|
Total |
| $ | 758,185 |
|
| $ | 861,414 |
|
The components of lease expense are as follows within our consolidated statement of operations:
For the Year Ended December 31, 2020 | For the Year Ended December 31, 2019 | |
| Operating lease expense | $157,315 | $157,315 |
|
| For the Year Ended December 31, 2023 |
|
| For the Year Ended December 31, 2022 |
| ||
|
|
|
|
|
|
| ||
Operating lease expense |
| $ | 157,315 |
|
| $ | 157,315 |
|
Other information related to leases where we are the lessee is as follows:
December 31, 2020 | December 31, 2019 | ||
| Weighted-average remaining lease term: | |||
| Operating leases | 8.25 years | 9.25 years | |
| Discount rate: | |||
| Operating leases | 7.00% | 7.00% |
|
| December 31, 2023 |
|
| December 31, 2022 |
| ||
| ||||||||
Weighted-average remaining lease term: |
|
|
|
|
|
| ||
Operating leases |
| 5.00 years |
|
| 6.00 years |
| ||
|
|
|
|
|
|
| ||
Discount rate: |
|
|
|
|
|
| ||
Operating leases |
|
| 7.00 | % |
|
| 7.00 | % |
Supplemental cash flow information related to leases where we are the lessee is as follows:
For the Year Ended December 31, 2020 | For the Year Ended December 31, 2019 | |
| Cash paid for amounts included in the measurement of lease liabilities: | $146,688 | $65,753 |
|
| For the Year Ended December 31, 2023 |
|
| For the Year Ended December 31, 2022 |
| ||
Cash paid for amounts included in the measurement of lease liabilities: |
| $ | 160,290 |
|
| $ | 155,621 |
|
As of December 31, 2020,2023, the maturities of our operating lease liability are as follows:
Year Ended: |
| Operating Lease |
| |
December 31, 2024 |
| $ | 165,098 |
|
December 31, 2025 |
|
| 170,051 |
|
December 31, 2026 |
|
| 175,153 |
|
December 31, 2027 |
|
| 180,408 |
|
December 31, 2028 |
|
| 185,819 |
|
Thereafter |
|
| 33,751 |
|
Total minimum lease payments |
|
| 910,281 |
|
Less: Interest |
|
| 152,096 |
|
Present value of lease obligations |
|
| 758,185 |
|
Less: Current portion |
|
| 115,658 |
|
Long-term portion of lease obligations |
| $ | 642,527 |
|
NOTE 8. CAPITALIZED SOFTWARE DEVELOPMENT COSTS
In accordance with ASC 985-20 we capitalized certain software development costs associated with updating our continuing line of product offerings. Capitalized software development costs consist of the following at:
December 31, 2020 | December 31, 2019 | |
| Capitalized Software Development Costs | $125,704 | $125,704 |
| Less: Accumulated Amortization | (73,327) | (31,426) |
$52,377 | $94,278 |
|
| December 31, 2023 |
|
| December 31, 2022 |
| ||
Capitalized Software Development Costs |
| $ | 125,704 |
|
| $ | 125,704 |
|
Less: Accumulated Amortization |
|
| (125,704 | ) |
|
| (125,704 | ) |
Capitalized Software Development Costs - net |
| $ | - |
|
| $ | - |
|
Amortization expense for the years ended December 31, 20202023 and 20192022 was $41,900$0 and $31,426,$10,475, respectively.
NOTE 9.
CLOUD COMPUTING SERVICE CONTRACTIn May 2020 we entered into a cloud computing service contract.contract with a vendor. The contract provides for annual payments in the amount of $30,409 and has a term of 5 years. The annual contract payments are capitalized as a prepaid expense and amortized over a twelve-month period. Amortization expense for the year ended December 31, 2020 was $17,745.
We have incurred implementation costs of $68,330$66,857 in connection with the cloud computing service contract which have been capitalized in prepaid expenses and other assets as of December 31, 2020.2023. In accordance with
NOTE 10. CONVERTIBLE DEBT
On October and May 2017,November 2023, we closedentered into a Securities Purchase Agreement (the “SPA”) with certain accredited investors (collectively, the “Investors”) pursuant to which we agreed to sell and issue to the Investors in a private placement transaction (the “Private Placement”) in whichone or more closings up to an aggregate principal amount of $5,000,000 of Convertible Notes (the “Notes”). As of December 31, 2023, we issued and sold an aggregate of $2,600,000 of Notes to certain accredited investors unregistered senior callableInvestors pursuant to the SPA.
In October and November 2023, we sold and issued pursuant to the SPA convertible promissory notes or the Notes, and three-year warrants(the “Notes”) to purchase an aggregate of 125,0002,080,000 shares of common stock at an exercise price of $5.52$1.25 per share in exchange for aggregate gross proceeds of $6,000,000.$2,600,000. The Notes mature and are due on the fifth anniversary of the issuance date in October and November of 2028. The Notes bear simple interest at a rate of 4%12% per annum. $5,300,000annum, payable in principal was originally scheduled to mature on August 31, 2018 and $700,000 in principal was originally scheduled to mature on November 8, 2018, unless earlier redeemed, repurchased or converted.equal monthly installments. The Notes are convertible into shares of our Common Stock, at the option of the holder, into common stock at a conversion price of $4.32$1.25 per share, which shall not exceed $1.55 per share. SubsequentIn addition, we can require Investors to September 1, 2017, we may redeemconvert the Notes that are scheduled to mature on August 31, 2018at the then current conversion price at any time priorafter 90 days from the issue date if the Common Stock has a closing bid price of $1.55 per share or higher on any twenty (20) days within a thirty (30) day period of consecutive trading days, or if a “fundamental change” occurs (as defined in the Securities Purchase Agreement). The Notes are unsecured and senior to maturity at a price equalother indebtedness subject to 100% of the outstanding principal amount of the Notes to be redeemed, plus accrued and unpaid interest as of the redemption date. Prior to November 8, 2018, we may redeem the Notes that are scheduled to mature on such date at any time prior to maturity at a price equal to 100% of the outstanding principal amount of the Notes to be redeemed, plus accrued and unpaid interest as of the redemption date. Interest on the Notes is payable semi-annually in cash on February 28 and August 31 of each year, beginning on August 31, 2017.certain exceptions. Interest expense related to the Notes for the years ended December 31, 20202023 and 20192022 was $40,689$54,892 and $200,000,$0, respectively.
Amortization of deferred financing costs were valued at $62,559 using the Black-Scholes pricing model with the following assumptions: expected volatility: 104.06% –111.54%; expected dividend: $0; expected term: 3 years;$10,413 and risk-free rate: 1.49%–1.59%. We recorded the warrants’ relative fair value of $61,904 as an increase to additional paid-in capital and a discount against the related Notes.
Convertible notes consist of the following at:
|
| December 31, |
|
| December 31, |
| ||
|
| 2023 |
|
| 2022 |
| ||
|
|
|
|
|
|
| ||
Convertible notes |
| $ | 2,600,000 |
|
| $ | - |
|
Less: Debt issuance costs |
|
| (312,398 | ) |
|
| - |
|
Accumulated amortization |
|
| 10,413 |
|
|
| - |
|
Convertible notes, net |
| $ | 2,298,015 |
|
| $ | - |
|
F-19 | ||
NOTE 11. SHAREHOLDERS’ EQUITY
Our Board of Directors (the “Board”) may, without further action by our shareholders, from time to time, direct the issuance of any authorized but unissued or unreserved shares of preferred stock in series and at the time of issuance, determine the rights, preferences and limitations of each series. The holders of such preferred stock may be entitled to receive a preference payment in the event of any liquidation, dissolution or winding-up by us before any payment is made to the holders of our common stock. Furthermore, the Board could issue preferred stock with voting and other rights that could adversely affect the voting power of the holders of our common stock.
Convertible Series A Preferred Stock in each case, at a ratio of 1-for-8 and without any change to the respective par value thereof (the “Reverse Stock Split”), and, on September 10, 2020, we filed an Articles of Amendment to our Articles of Incorporation with the Department of State of the State of Florida to effect the Reverse Stock Split. The Reverse Stock Split became effective as of 5:00 p.m., Eastern time, on September 10, 2020 (the “Effective Time”). All per-share and share amounts have been retroactively restated in this Annual Report on Form 10-K for all periods presented to reflect the reverse stock split.
Our authorized Convertible Series A Preferred Stock, $0.01 par value, consists of 1,000,000 shares. At December 31, 20202023 and 2019,2022, there were 63,750 shares issued and outstanding. The Convertible Series A Preferred Stock is convertible at the rate of one share of common stock for one share of Convertible Series A Preferred Stock.
Convertible Series B Preferred Stock
Our authorized Convertible Series B Preferred Stock, $1,000 stated value, 7.5% cumulative dividend, consists of 4,000 shares. At December 31, 20202023 and 2019,2022, there were no shares issued and outstanding, respectively. Each share of Convertible Series B Preferred Stock may be converted (at the holder’s election) into two hundred shares of our common stock.
Common Stock
In November 2019, we amended our Restated Articles of Incorporation, increasing the number of authorized shares of our Common Stock from 200,000,000 to 250,000,000.
In January 2023, we issued 1,25060,000 shares of common stockCommon Stock valued at $1,200 to a consultant.
Stock Options
In January 2022 we issued 500 shares of common stock valued at $2,190 to a consultant.
December 31, 2020 | December 31, 2019 | |||
Number of Options | Weighted Average Exercise Price | Number of Options | Weighted Average Exercise Price | |
| Outstanding, beginning of period | 77,500 | $2.56 | 40,000 | $4.16 |
| Granted | 62,500 | 3.96 | 37,500 | 0.88 |
| Exercised | (2,500) | 0.40 | - | - |
| Expired | (5,000) | 16.80 | - | - |
| Outstanding, end of period | 132,500 | $ 2.72 | 77,500 | $2.56 |
Outstanding Options | Average Weighted | Exercisable Options | ||
Range | Number | Remaining Contractual Life in Years | Number | Weighted Average Exercise Price |
$0.80 | 27,500 | 4.10 | 27,500 | $0.80 |
$0.88 | 31,250 | 3.01 | 31,250 | $0.88 |
$0.96 | 25,000 | 3.02 | 25,000 | $0.96 |
$2.16 | 5,000 | 4.01 | 5,000 | $2.16 |
$4.40 | 12,500 | 5.10 | 12,500 | $4.40 |
$7.06 | 31,250 | 4.75 | 31,250 | $7.06 |
132,500 | 3.89 | 132,500 | $2.72 | |
In April 2020January 2022 we issued a warrantan option to purchase 6,25057,500 shares of common stock to our Chief Operating Officer at an exercise price of $4.00$1.12 per share pursuant to an employment agreement. The warrantoption was valued at $24,846$59,427 and has a term of 10 years. We utilized the Black-Scholes model to fair value the warrant received by our Chief Operating Officer with the following assumptions: volatility, 173%; expected dividend yield, 0%; risk free interest rate, 0.68%; and a life of 10 years. The grant date fair value of each share of common stock underlying the warrant was $4.00.
In January 2022 we issued an option to purchase 40,000 shares of common stock to our Chief Financial Officer at an exercise price of $1.12 per share pursuant to an employment agreement. The option was valued at $41,340 and has a contractual term of 10 years. We utilized the Black-Scholes model to fair value the warrant received by our Chief Executive Officer with the following assumptions: volatility, 156%; expected dividend yield, 0%; risk free interest rate, 1.65%; and an expected life of 5 years. The grant date fair value of each share of common stock underlying the warrant was $1.03.
In January 2023, we issued options to purchase 175,000 shares of Common Stock to Officers at an exercise price of $0.85 per share pursuant to an employment agreement. The options were valued at $132,361 and have a contractual term of 10 years. We utilized the Black-Scholes model to fair value the options received by Officers with the following assumptions: volatility, 139%; expected dividend yield, 0%; risk free interest rate, 3.59%; and an expected life of 5 years. The grant date fair value of each share of Common Stock underlying the options was $0.76.
In January 2023, we issued options to purchase 42,042 shares of Common Stock to employees at an exercise prices of $0.71- $0.85 per share pursuant to an employment agreement. The options were valued at $30,925, in aggregate and have a contractual term of 10 years. We utilized the Black-Scholes model to fair value the options received by our employees with the following assumptions: volatility, 139%; expected dividend yield, 0%; risk free interest rate, 3.59%; and an expected life of 5 years. The grant date fair value of each share of Common Stock underlying the options was $0.76.
The total stock based compensation for the years ended December 31, 2023 and 2022, was $163,286 and $653,843, respectively which has been in included within General and Administration expense in our statement of operations.
| F-20 |
| Table of Contents |
The following table summarizes stock options outstanding as of December 31, 2023 and 2022:
|
| December 31, 2023 |
|
| December 31, 2022 |
| ||||||||||
|
| Number of Options |
|
| Weighted Average Exercise Price |
|
| Number of Options |
|
| Weighted Average Exercise Price |
| ||||
Outstanding, beginning of period |
|
| 413,000 |
|
| $ | 1.65 |
|
|
| 143,000 |
|
| $ | 2.66 |
|
Granted |
|
| 217,042 |
|
|
| 0.82 |
|
|
| 270,000 |
|
|
| 1.12 |
|
Exercised |
|
| - |
|
|
| - |
|
|
| - |
|
|
| - |
|
Expired |
|
| (12,500 | ) |
|
| - |
|
|
| - |
|
|
| - |
|
Outstanding, end of period |
|
| 617,542 |
|
| $ | 1.38 |
|
|
| 413,000 |
|
| $ | 1.65 |
|
Options outstanding and exercisable by price range as of December 31, 2023 were as follows:
|
|
| Average |
|
| Exercisable Options |
| |||||||||||
|
|
|
|
| Weighted |
| ||||||||||||
|
|
|
|
|
| Remaining |
|
|
|
|
| Weighted |
| |||||
Outstanding Options |
|
| Contractual |
|
|
|
|
| Average |
| ||||||||
Range |
|
| Number |
|
| Life in Years |
|
| Number |
|
| Exercise Price |
| |||||
| $ | 0.71 |
|
|
| 7,042 |
|
|
| 4.06 |
|
|
| 7,042 |
|
| $ | 0.71 |
|
| $ | 0.80 |
|
|
| 27,500 |
|
|
| 2.20 |
|
|
| 27,500 |
|
| $ | 0.80 |
|
| $ | 0.85 |
|
|
| 210,000 |
|
|
| 9.08 |
|
|
| 210,000 |
|
| $ | 0.85 |
|
| $ | 0.88 |
|
|
| 31,250 |
|
|
| 1.01 |
|
|
| 31,250 |
|
| $ | 0.88 |
|
| $ | 0.96 |
|
|
| 12,500 |
|
|
| 1.02 |
|
|
| 12,500 |
|
| $ | 0.96 |
|
| $ | 1.12 |
|
|
| 270,000 |
|
|
| 9.06 |
|
|
| 270,000 |
|
| $ | 1.12 |
|
| $ | 1.93 |
|
|
| 10,500 |
|
|
| 4.06 |
|
|
| 10,500 |
|
| $ | 1.93 |
|
| $ | 2.16 |
|
|
| 5,000 |
|
|
| 2.00 |
|
|
| 5,000 |
|
| $ | 2.16 |
|
| $ | 4.40 |
|
|
| 12,500 |
|
|
| 3.05 |
|
|
| 12,500 |
|
| $ | 4.40 |
|
| $ | 7.06 |
|
|
| 31,250 |
|
|
| 2.75 |
|
|
| 31,250 |
|
| $ | 7.06 |
|
|
|
|
|
| 617,542 |
|
|
| 7.05 |
|
|
| 617,542 |
|
| $ | 1.38 |
|
Stock Warrants
The following table summarizes the outstanding common stock warrants as of December 31, 20202023 and 2019:
December 31, 2020 | December 31, 2019 | |||
Number of Warrants | Weighted Average Exercise Price | Number of Warrants | Weighted Average Exercise Price | |
| Outstanding, beginning of period | 2,155,065 | $3.12 | 3,318,826 | $2.72 |
| Granted | 585,447 | 4.97 | 162,500 | 0.88 |
| Exercised | (76,796) | (2.77) | - | - |
| Expired | (614,583) | (6.40) | (1,326,261) | (1.84) |
| Outstanding, end of period | 2,049,133 | $2.55 | 2,155,065 | $3.12 |
|
| December 31, 2023 |
|
| December 31, 2022 |
| ||||||||||
|
| (Unaudited) |
|
| Weighted Average Exercise Price |
|
| Number of Warrants |
|
| Weighted Average Exercise Price |
| ||||
Outstanding, beginning of period |
|
| 2,792,335 |
|
| $ | 2.25 |
|
|
| 3,381,021 |
|
| $ | 2.22 |
|
Granted |
|
| - |
|
|
| - |
|
|
| - |
|
|
| - |
|
Exercised |
|
| - |
|
|
| - |
|
|
| (31,250 | ) |
|
| (0.21 | ) |
Expired |
|
| (20,239 | ) |
|
| (1.11 | ) |
|
| (557,436 | ) |
|
| (2.23 | ) |
Outstanding, end of period |
|
| 2,772,096 |
|
| $ | 2.25 |
|
|
| 2,792,335 |
|
| $ | 2.25 |
|
| F-21 |
| Table of Contents |
Warrants outstanding and exercisable by price range as of December 31, 20202023 were as follows:
Outstanding Warrants | Exercisable Warrants | |||
Exercise Price | Number | Average Weighted Remaining Contractual Life in Years | Number | Weighted Average Exercise Price |
$0.64 | 31,250 | 2.90 | 31,250 | $0.64 |
$0.80 | 158,125 | 2.76 | 158,125 | $0.80 |
$0.96 | 473,958 | 1.94 | 473,958 | $0.96 |
$1.12 | 6,250 | 3.30 | 6,250 | $1.12 |
$1.20 | 175,000 | 3.88 | 175,000 | $1.20 |
$1.36 | 1,250 | 1.82 | 1,250 | $1.36 |
$2.16 | 31,250 | 1.00 | 31,250 | $2.16 |
$2.32 | 523,061 | 1.16 | 523,061 | $2.32 |
$2.40 | 137,500 | 0.14 | 137,500 | $2.40 |
$2.56 | 31,250 | 0.75 | 31,250 | $2.56 |
$3.36 | 31,250 | 0.50 | 31,250 | $3,36 |
$4.00 | 60,000 | 4.60 | 60,000 | $4.00 |
$4.40 | 12,500 | 0.09 | 12,500 | $4.40 |
$6.95 | 375,000 | 9.75 | 375,000 | $6.95 |
$8.40 | 1,488 | 2.63 | 1,488 | $8.40 |
2,049,133 | 3.31 | 2,049,133 | $2.55 | |
Outstanding Warrants |
|
|
|
| Exercisable Warrants |
| ||||||||||||
Exercise Price |
|
| Number |
|
| Average Weighted Remaining Contractual Life in Years |
|
| Number |
|
| Weighted Average Exercise Price |
| |||||
| $ | 0.64 |
|
|
| 31,250 |
|
|
| 9.89 |
|
|
| 31,250 |
|
| $ | 0.64 |
|
| $ | 0.80 |
|
|
| 125,000 |
|
|
| 10.08 |
|
|
| 125,000 |
|
| $ | 0.80 |
|
| $ | 0.96 |
|
|
| 442,708 |
|
|
| 8.98 |
|
|
| 442,708 |
|
| $ | 0.96 |
|
| $ | 1.12 |
|
|
| 6,250 |
|
|
| 0.30 |
|
|
| 6,250 |
|
| $ | 1.12 |
|
| $ | 1.20 |
|
|
| 156,250 |
|
|
| 1.09 |
|
|
| 156,250 |
|
| $ | 1.20 |
|
| $ | 1.68 |
|
|
| 1,434,721 |
|
|
| 2.75 |
|
|
| 1,434,721 |
|
| $ | 1.68 |
|
| $ | 2.18 |
|
|
| 172,167 |
|
|
| 2.75 |
|
|
| 172,167 |
|
| $ | 2.18 |
|
| $ | 4.00 |
|
|
| 28,750 |
|
|
| 6.32 |
|
|
| 28,750 |
|
| $ | 4.00 |
|
| $ | 6.95 |
|
|
| 375,000 |
|
|
| 7.75 |
|
|
| 375,000 |
|
| $ | 6.95 |
|
|
|
|
|
|
|
|
|
|
|
|
|
|
|
|
|
|
|
|
|
|
|
|
| 2,772,096 |
|
|
| 4.62 |
|
|
| 2,772,096 |
|
| $ | 2.25 |
|
There were no unvested warrants outstanding as of December 31, 2020.
NOTE 12. COMMITMENTS AND CONTINGENCIES
Legal Contingencies
We may become a party to litigation in the normal course of business. In the opinion of management, there are no legal matters involving us that would have a material adverse effect upon our financial condition, results of operations or cash flows. In addition, from time to time, we may have to file claims against parties that infringe on our intellectual property.
Product Liability
As of December 31, 20202023 and 2019,2022, there were no claims against us for product liability.
NOTE 13. CONTRACTS AND AGREEMENTS
Director Compensation
In the event Dr. Shane is terminated as CEO as a result of a change in control, Dr. Shane will be entitled to a lump sum payment of two years’ salary at the time of such termination.
For the year ended December 31, 2019,2022, we issued an aggregate of 50,00051,750 shares of common stockCommon Stock that were valued at $44,000approximately $54,000 to members of our Board.
For the year ended December 31, 2020,2023, we issued an aggregate of 50,00060,000 shares of common stockCommon Stock that were valued at $48,000approximately $51,000 to members of our Board.
Manufacturing Agreement
In June 2020 we entered into a manufacturing agreement with Planet Innovation Products, Pty Ltd (“PI”). The agreement does not provide for any minimum purchase commitments and is for a term of three years. The agreement also provides for a warranty against product defects.
| F-22 |
| Table of Contents |
Cloud Computing Service Contract
In May 2020 we entered into an agreement with a vendor for a cloud computing service contract. The contract provides for annual payments in the amount of $30,409 and has a term of 5 years.
Approximate minimum future payments under the contract are asYear Ended: |
| Amount |
| |
December 31, 2024 |
|
| 30,000 |
|
December 31, 2025 |
|
| - |
|
December 31, 2026 |
|
| - |
|
Total |
| $ | 30,000 |
|
NOTE 14. ACCRUED EXPENSES AND OTHER CURRENT LIABILITIES
Accrued expenses and other current liabilities consisted of the following at:
December 31, 2020 | December 31, 2019 | |
| Commissions | $151,709 | $112,102 |
| Payroll and related costs | 84,000 | 167,689 |
| Director fees | 41,250 | 41,250 |
| Sales Tax Payable | 9,784 | 21,814 |
| Income Taxes Payable (Note 17) | 77,000 | - |
| Accrued warranty (Note 15) | 68,000 | 30,000 |
| Other accrued expenses | 70,106 | 77,257 |
| Total | $501,849 | $450,112 |
|
| December 31, 2023 |
|
| December 31, 2022 |
| ||
Commissions |
| $ | 200,837 |
|
| $ | 442,805 |
|
Payroll and related costs |
|
| 201,009 |
|
|
| 136,000 |
|
Director fees |
|
| 37,650 |
|
|
| 34,650 |
|
Sales Tax Payable |
|
| 5,707 |
|
|
| (1,351 | ) |
Accrued warranty (Note 15) |
|
| 30,000 |
|
|
| 68,000 |
|
Allowance for Sales Returns |
|
| 128,390 |
|
|
| - |
|
Other accrued expenses |
|
| 71,898 |
|
|
| 48,599 |
|
Total |
| $ | 675,491 |
|
| $ | 728,703 |
|
NOTE 15. ACCRUED WARRANTY
Our manufacturers assume the warranty against product defects from date of sale, which we extend to our customers upon sale of the product. We assume responsibility for product reliability and results. The warranty is generally limited to a refund of the original purchase price of the product or a replacement part. We estimate warranty costs based on historical warranty claim experience.
The following table presents warranty reserve activities at:
December 31, 2020 | December 31, 2019 | |
| Beginning accrued warranty costs | $30,000 | $30,000 |
| Provision for warranty expense | 101,041 | 2,609 |
| Settlement of warranty claims | (63,041) | (2,609) |
| Ending accrued warranty costs | $68,000 | $30,000 |
|
| December 31, 2023 |
|
| December 31, 2022 |
| ||
Beginning accrued warranty costs |
| $ | 68,000 |
|
| $ | 68,000 |
|
Provision for warranty expense |
|
| 26,911 |
|
|
| 24,158 |
|
Settlement of warranty claims |
|
| (64,911 | ) |
|
| (24,158 | ) |
Ending accrued warranty costs |
| $ | 30,000 |
|
| $ | 68,000 |
|
| F-23 |
| Table of Contents |
NOTE 16. LOAN PAYABLE
For the Year Ended | ||
December 31, | December 31, | |
2020 | 2019 | |
| Current: | ||
| Federal | $- | $- |
| State | 77,000 | - |
| Foreign | - | - |
77,000 | - | |
| Deferred: | ||
| Federal | - | - |
| State | - | - |
| Foreign | - | - |
- | - | |
| Total | $77,000 | $- |
The Company’s income tax expense (benefit) consisted of: | ||||||||
For the Year Ended | ||||||||
December 31, | December 31, | |||||||
2023 | 2022 | |||||||
Current: | ||||||||
Federal | $ | - | $ | - | ||||
State | - | - | ||||||
Foreign | - | - | ||||||
| - | ||||||||
Deferred: | ||||||||
Federal | - | - | ||||||
State | - | - | ||||||
Foreign | - | - | ||||||
| - | - | |||||||
Total | $ | - | $ | - | ||||
The Company’s net income (loss) before income tax consisted of:
For the Year Ended | ||
December 31, | December 31, | |
2020 | 2019 | |
| United States | $4,468,166 | $(2,297,733) |
| Foreign | - | - |
| Total | $4,468,166 | $(2,297,733) |
|
| For the Year Ended |
| |||||
|
| December 31, |
|
| December 31, |
| ||
|
| 2023 |
|
| 2022 |
| ||
|
|
|
|
|
|
| ||
United States |
| $ | (3,402,592 | ) |
| $ | (2,880,060 | ) |
Foreign |
|
| - |
|
|
| - |
|
Total |
| $ | (3,402,592 | ) |
| $ | (2,880,060 | ) |
Our income tax expense differed from the amounts computed by applying the United States statutory corporate income tax rate for the following reasons:
On December 22, 2017, the 2017 Tax Cuts and Jobs Act (“Tax Act”) was enacted into law making significant changes to the Internal Revenue Code. Changes include, but are not limited to, a federal corporate tax rate decrease from 35% to 21% for tax years beginning after December 31, 2017, the transition of U.S. international taxation from a worldwide tax system to a territorial system and a one-time transition tax on the mandatory deemed repatriation of foreign earnings. We are required to recognize the effect of the tax law changes in the period of enactment, such as re-measuring our U.S. deferred tax assets and liabilities as well as reassessing the net realizability of our deferred tax assets and liabilities. The Tax Act did not give rise to any material impact on the consolidated balance sheets and consolidated statements of operations due to our historical loss position and the full valuation allowance on our net U.S. deferred tax assets.
The reconciliation of taxes at the federal and state statutory rate to our provision for income taxes for the years ended December 31, 20202023 and 20192022 was as follows:
For the Year Ended | ||
December 31, | December 31, | |
2020 | 2019 | |
| Income (Loss) before income tax | $4,468,166 | $(2,297,733) |
| US statutory corporate income tax rate | 28.00% | 28.00% |
| Income tax expense computed at US statutory corporate income tax rate | ||
| Income tax expense computed at US statutory corporate income tax rate | 1,251,086 | (643,365) |
| Reconciling items: | ||
| Change in valuation allowance on deferred tax assets | (2,050,485) | 620,817 |
| Provision to prior year tax return | - | 6,991 |
| Incentive stock options and warrants | 876,676 | 31,982 |
| Amortized debt discount | - | 4,910 |
| Meals and Entertainment | 1,300 | 2,005 |
| Other | (1,577) | (23,340) |
| Income tax expense | $77,000 | $- |
|
| For the Year Ended |
| |||||
|
| December 31, |
|
| December 31, |
| ||
|
| 2023 |
|
| 2022 |
| ||
|
|
|
|
|
|
| ||
Income (Loss) before income tax |
| $ | (3,402,592 | ) |
| $ | (2,880,060 | ) |
US statutory corporate income tax rate |
|
| 28 | % |
|
| 28 | % |
Income tax expense computed at US statutory corporate income tax rate |
|
| (952,726 | ) |
|
| (806,417 | ) |
Reconciling items: |
|
|
|
|
|
|
|
|
Change in valuation allowance on deferred tax assets |
|
| 2,121,178 |
|
|
| 553,005 |
|
Provision to prior year tax return |
|
| (1,188,884 | ) |
|
| 36,032 |
|
Incentive stock options and warrants |
|
| 45,720 |
|
|
| 183,076 |
|
Gain Upon Debt Extinguishment |
|
|
|
|
|
|
|
|
Meals and Entertainment |
|
| 3,347 |
|
|
| - |
|
Other |
|
| (29,235 | ) |
|
| 34,304 |
|
Income tax expense (benefit) |
| $ | - |
|
| $ | - |
|
| F-24 |
| Table of Contents |
Components of our deferred income tax assets (liabilities) are as follows:
December 31, | December 31, | |
2020 | 2019 | |
| Deferred tax assets: | ||
| Reserve for Bad Debt | $109,000 | $31,000 |
| Inventory Reserve | - | 28,000 |
| Accrued Vacation | 82,000 | 92,000 |
| Warranty Reserve | 19,000 | 8,000 |
| Intangible Assets | 412,000 | 381,000 |
| Operating lease right-of-use liabilities | 290,000 | 310,000 |
| Net operating losses | 3,100,000 | 5,223,000 |
| Valuation Allowance | (3,530,000) | (5,580,000) |
Deferred Tax Assets | 482,000 | 493,000 |
| Deferred tax liabilities: | ||
| Operating lease right-of-use assets | (290,000) | (302,000) |
| Property and Equipment | (192,000) | (191,000) |
(482,000) | (493,000) | |
| Net Deferred Tax Assets and Liabilities | $- | $- |
|
| December 31, |
|
| December 31, |
| ||
|
| 2023 |
|
| 2022 |
| ||
Deferred tax assets: |
|
|
|
|
|
| ||
|
|
|
|
|
|
| ||
Reserve for Bad Debt |
| $ | 418,000 |
|
| $ | 470,000 |
|
Inventory Reserve |
|
| 27,000 |
|
|
| 27,000 |
|
Accrued Vacation |
|
| 53,000 |
|
|
| 38,000 |
|
Warranty Reserve |
|
| 8,000 |
|
|
| 19,000 |
|
Intangible Assets |
|
| 181,000 |
|
|
| 257,000 |
|
Capitalized R&D |
|
| 148,000 |
|
|
| 67,000 |
|
Stock-Based Compensation |
|
| 1,246,000 |
|
|
| - |
|
Operating lease right-of-use liabilities |
|
| 212,000 |
|
|
| 241,000 |
|
Net operating losses |
|
| 5,568,000 |
|
|
| 4,639,000 |
|
Valuation Allowance |
|
| (7,539,000 | ) |
|
| (5,332,000 | ) |
Deferred Tax Assets |
|
| 322,000 |
|
|
| 426,000 |
|
|
|
|
|
|
|
|
|
|
Deferred tax liabilities: |
|
|
|
|
|
|
|
|
Operating lease right-of-use assets |
|
| (189,000 | ) |
|
| (217,000 | ) |
Property and Equipment |
|
| (133,000 | ) |
|
| (209,000 | ) |
|
|
| (322,000 | ) |
|
| (426,000 | ) |
|
|
|
|
|
|
|
|
|
Net Deferred Tax Assets and Liabilities |
| $ | - |
|
| $ | - |
|
Deferred income tax assets and liabilities are determined based on differences between the financial statement reporting and tax bases of assets and liabilities and are measured using the enacted tax rates and laws in effect when the differences are expected to reverse. The measurement of deferred income tax assets is reduced, if necessary, by a valuation allowance for any tax benefits, which are, on a more likely than not basis, not expected to be realized; in accordance with ASCASC-740 guidance for income taxes. As of December 31,
For income tax purposes in the United States, we had available federal net operating loss carryforwards (“NOL”) as of December 31, 20202023 and 20192022 of approximately $11,465,000$20,796,000 and $9,596,000$17,479,000 respectively to reduce future federal taxable income.
We record uncertain tax positions in accordance with ASC 740 on the basis of a two-step process whereby (1) we determine whether it is more likely than not that the tax positions will be sustained on the basis of the technical merits of the position and (2) for those tax positions that meet the more-likely-than-not recognition threshold, we recognize the largest amount of tax benefit that is more than 50 percent likely to be realized upon ultimate settlement with the related tax authority. As of December 31, 2020,2023, and 2019,2022, the management of the Company determined there were no reportable uncertain tax positions.
NOTE 18.17. CUSTOMER CONCENTRATION
The Company had certain customers whose accounts receivable balances individually represented 10% or more of the Company’s accounts receivable.
As of December 31, 2020, three2023, two customers accounted for 36%27% of our gross accounts receivable.
As of December 31, 2019, three customers2022, one customer accounted for 37%14% of our gross accounts receivable.
For the yearsyear ended December 31, 2020 and 2019,2023, we had 2 customers who represented 20% of revenue. For the year ended December 31, 2022, we had no customerscustomer who represented 10% or more of revenue.
| F-25 |