UNITED STATES
SECURITIES AND EXCHANGE COMMISSION
Washington, D.C. 20549
FORM 10-K
☑ Annual Report Pursuant to Section 13 or 15(d) of the Securities Exchange Act of 1934
For the fiscal year ended December 31, 20202023
or
☐ Transition Report Pursuant to Section 13 or 15(d) of the Securities Exchange Act of 1934
Commission file number 001-37697
CENTENNIAL RESOURCE DEVELOPMENT, INC.PERMIAN RESOURCES CORPORATION
(Exact name of registrant as specified in its charter)
| | | | | | | | |
| Delaware | | 47-5381253 |
| (State of Incorporation) | | (I.R.S. Employer Identification No.) |
1001 Seventeenth Street,300 N. Marienfeld St., Suite 18001000
Denver, Colorado 80202Midland, Texas 79701
(Registrant’s telephone number, including area code): (720) 499-1400(432) 695-4222
Securities registered pursuant to Section 12(b) of the Act:
| | | | | | | | | | | | | | |
| Title of each class | | Trading Symbol(s) | | Name of each exchange on which registered |
| Class A Common Stock, par value $0.0001 per share | | CDEVPR | | The NASDAQNew York Stock Market LLCExchange |
Securities registered pursuant to Section 12(g) of the Act: None
Indicate by check mark if the registrant is a well-known seasoned issuer, as defined in Rule 405 of the Securities Act. Yes ☒ No ☐
Indicate by check mark if the registrant is not required to file reports pursuant to Section 13 or Section 15(d) of the Act. Yes ☐ No ☒
Indicate by check mark whether the registrant (1) has filed all reports required to be filed by Section 13 or 15(d) of the Securities Exchange Act of 1934 during the preceding 12 months (or for such shorter period that the registrant was required to file such reports), and (2) has been subject to the filing requirements for the past 90 days. Yes ☒ No ☐
Indicate by check mark whether the Registrant has submitted electronically and posted on its corporate website, if any, every Interactive Data File required to be submitted and posted pursuant to Rule 405 of Regulation S-T (§232.405 of this chapter) during the preceding 12 months (or for such shorter period that the registrant was required to submit and post such files). Yes ☒ No ☐
Indicate by check mark whether the registrant is a large accelerated filer, an accelerated filer, a non-accelerated filer, a smaller reporting company or an emerging growth company. (See definitions of “large accelerated filer,” “accelerated filer,” “smaller reporting company” and “emerging growth company” in Rule 12b-2 of the Exchange Act).
| | | | | | | | | | | | | | | | | | | | | | | | | | |
| Large accelerated filer | | Accelerated filer | | Non-accelerated filer
| | Smaller reporting company | | Emerging growth company |
☐ | | ☒ | | ☐ | | ☐ | | ☒☐ | | ☐ |
If an emerging growth company, indicate by check mark if the registrant has elected not to use the extended transition period for complying with any new or revised financial accounting standards provided pursuant to Section 13(a) of the Exchange Act. ☐
Indicate by check mark whether the registrant has filed a report on and attestation to its management’s assessment of the effectiveness of its internal control over financial reporting under Section 404(b) of the Sarbanes-Oxley Act (15 U.S.C.7262(b)) by the registered public accounting firm that prepared or issued its audit report. ☒
If securities are registered pursuant to Section 12(b) of the Act, indicate by check mark whether the financial statements of the registrant included in the filing reflect the correction of an error to previously issued financial statements. ☐
Indicate by check mark whether any of those error corrections are restatements that required a recovery analysis of incentive-based compensation received by any of the registrant’s executive officers during the relevant recovery period pursuant to §240.10D-1(b). ☐
Indicate by check mark whether the registrant is a shell company (as defined in Rule 12b-2 of the Exchange Act). Yes ☐ No ☒
The aggregate market value of the voting and non-voting common stock held by non-affiliates of the registrant as of June 30, 2020,2023, the last business day of the registrant’s most recently completed second fiscal quarter, was approximately $162,307,533$2,940,481,909 based on the closing price of the shares of common stock on that date. While shares of Class C Common Stock are not listed for public trading, they are exchangeable for shares of Class A Common Stock at any time on a share-for-share basis, and the calculation of aggregate market value assumes all outstanding shares of Class C Common Stock were exchanged for Class A Common Stock as of June 30, 2023.
As of February 19, 2021,23, 2024, there were 278,916,306540,951,732 shares of Class A Common Stock, par value $0.0001 per share outstanding and 230,910,435 shares of Class C Common Stock , par value $0.0001 per share, outstanding.
Documents Incorporated by Reference:
Portions of the registrant’s definitive proxy statement for its 20212024 Annual Meeting of Stockholders, which will be filed with the United States Securities and Exchange Commission within 120 days of December 31, 2020,2023, are incorporated by reference into Part III of this Form 10-K for the year ended December 31, 2020.
TABLE OF CONTENTS
GLOSSARY OF OILUNITS OF MEASUREMENTS AND NATURAL GASINDUSTRY TERMS
The following are abbreviations and definitions of certain terms used in this Annual Report on Form 10-K, which are commonly used in the oil and natural gas industry:
Bbl. One stock tank barrel of 42 U.S. gallons liquid volume used herein in reference to crude oil, condensate or NGLs.
Bbl/d. One Bbl per day.
Boe. One barrel of oil equivalent, calculated by converting natural gas to oil equivalent barrels at a ratio of six Mcf of natural gas to one Bbl of oil. This is an energy content correlation and does not reflect a value or price relationship between the commodities.
Boe/d. One Boe per day.
Btu. One British thermal unit, which is the quantity of heat required to raise the temperature of a one-pound mass of water by one-degree Fahrenheit.
Completion. The process of preparing an oil and gas wellbore for production through the installation of permanent production equipment, as well as perforation and fracture stimulation to initiate production.
Development well. A well drilled within the proved area of an oil or natural gas reservoir to the depth of a stratigraphic horizon known to be productive.
Differential. An adjustment to the price of oil or natural gas from an established spot market price to reflect differences in the quality, gathering, processing and transportation fees and location of oil or natural gas.
Exploratory well. A well drilled to find a new field or to find a new reservoir in a field previously found to be productive of oil or natural gas in another reservoir.
Extension well. A well drilled to extend the limits of a known reservoir.
Field. An area consisting of a single reservoir or multiple reservoirs all grouped on, or related to, the same individual geological structural feature or stratigraphic condition. The field name refers to the surface area, although it may refer to both the surface and the underground productive formations.
Formation. A layer of rock which has distinct characteristics that differs from nearby rock.
Henry Hub price. A natural gas benchmark price quoted at settlement date average.
Horizontal drilling. A drilling technique used in certain formations where a well is drilled vertically to a certain depth and then drilled at a right angle within a specified interval.
ICE Brent. Brent crude oil traded on the Intercontinental Exchange, Inc. (ICE).
LIBOR. London Interbank Offered Rate.
MBbl. One thousand barrels of crude oil, condensate or NGLs.
MBoe. One thousand Boe.
Mcf. One thousand cubic feet of natural gas.
Mcf/d. One Mcf per day.
MMBtu. One million British thermal units.
MMcf. One million cubic feet of natural gas.
NGL. Natural gas liquids. These are naturally occurring substances found in natural gas, including ethane, butane, isobutane, propane and natural gasoline, that can be collectively removed from produced natural gas, separated in these substances and sold.
NYMEX. The New York Mercantile Exchange.
NYSE. The New York Stock Exchange.
Operator. The individual or company responsible for the development and/or production of an oil or natural gas well or lease.
Proved developed reserves. Reserves that can be expected to be recovered through existing wells with existing equipment and operating methods or in which the cost of the required equipment is relatively minor compared with the cost of a new well.
Proved reserves. The estimated quantities of oil, NGLs and natural gas that geological and engineering data demonstrate with reasonable certainty to be commercially recoverable in future years from known reservoirs under existing economic and operating conditions.
Proved undeveloped reserves or PUD. Proved reserves that are expected to be recovered from new wells on undrilled acreage, or from existing wells where a relatively major expenditure is required for completion.
Realized price. The cash market price less differentials.
Reserves. Estimated remaining quantities of oil and natural gas and related substances anticipated to be economically producible, as of a given date, by application of development projects to known accumulations. In addition, there must exist, or there must be a reasonable expectation that there will exist, the legal right to produce or a revenue interest in the production, installed means of delivering oil and natural gas or related substances to market and all permits and financing required to implement the project.
Reservoir. A porous and permeable underground formation containing a natural accumulation of producible oil and/or natural gas that is confined by impermeable rock or water barriers and is individual and separate from other reservoirs.
Royalty interest. An interest in an oil or gas property entitling the owner to shares of the production free of costs of exploration, development and production operations.
SOFR. Secured Overnight Funding Rate.
Spot market price. The cash market price without reduction for expected quality, location, transportation and demand adjustments.
Unproved reserves. Reserves attributable to unproved properties with no proved reserves.
Wellbore. The hole drilled by a drill bit that is equipped for oil and natural gas production once the well has been completed. Also called well or borehole.
Working interest. The interest in an oil and gas property (typically a leasehold interest) that gives the owner the right to drill, produce and conduct operations on the property and to a share of production, subject to all royalties and other burdens and to all costs of exploration, development and operations and all risks in connection therewith.
Workover. Operations on a producing well to restore or increase production.
WTI. West Texas Intermediate is a grade of crude oil used as a benchmark in oil pricing.
GLOSSARY OF CERTAIN OTHER TERMS
The following are definitions of certain other terms that are used in this Annual Report:
Business Combination. The acquisition of approximately 89% of the outstanding membership interests in CRP from the Centennial Contributors, which closed on October 11, 2016, and the other transactions contemplated by the Contribution Agreement.
Centennial Contributors. The legacy owners of CRP, who sold approximately 89% of the outstanding membership interests in CRP to the Company in connection with the Business Combination. On April 2, 2020, the Centennial Contributors converted all of their remaining CRP Common Units (and corresponding shares of Class C Common Stock) for Class A Common Stock, which eliminated their entire ownership interest in CRP.
The Company, We, Our or Us. (i) Centennial Resource Development, Inc. and its consolidated subsidiaries including CRP, following the closing of the Business Combination and (ii) Silver Run Acquisition Corporation prior to the closing of the Business Combination.
Class A Common Stock. Our Class A Common Stock, par value $0.0001 per share, also referred to as our Common Stock.
Class C Common Stock. Our Class C Common Stock, par value $0.0001 per share, which was issued to the Centennial Contributors in connection with the Business Combination, all of which have been converted for Class A Common Stock and are no longer outstanding.
Contribution Agreement. The Contribution Agreement, dated as of July 6, 2016, among the Centennial Contributors, CRP and NewCo, as amended by Amendment No. 1 thereto, dated as of July 29, 2016, and the Joinder Agreement, dated as of October 7, 2016, by the Company.
CRP. Centennial Resource Production, LLC, a Delaware limited liability company.
CRP Common Units. The units representing common membership interests in CRP.
GMT Acquisition. The acquisition of certain undeveloped acreage and producing oil and natural gas properties of GMT Exploration Company LLC, which closed on June 8, 2017.
IPO. Our initial public offering of units, which closed on February 29, 2016.
NewCo. New Centennial, LLC, a Delaware limited liability company controlled by affiliates of Riverstone.
Private Placement Warrants. Our 8,000,000 outstanding warrants for the purchase of shares of Class A Common Stock, which were purchased by our Sponsor in a private placement simultaneously with the closing of our IPO.
Riverstone. Riverstone Investment Group LLC and its affiliates, including Silver Run Sponsor, LLC, a Delaware limited liability company, collectively.
Silverback. Silverback Exploration, LLC and Silverback Operating, LLC, collectively.
Silverback Acquisition. The acquisition of leasehold interests and related upstream assets in Reeves County, Texas from Silverback, which closed on December 28, 2016.
Voting common stock. Our Class A Common Stock and Class C Common Stock.
CAUTIONARY STATEMENT CONCERNING FORWARD-LOOKING STATEMENTS
This Annual Report on Form 10-K (the “Annual Report”), includes “forward-looking statements” within the meaning of Section 27A of the Securities Act of 1933, as amended (the “Securities Act”), and Section 21E of the Securities Exchange Act of 1934, as amended (the “Exchange Act”). All statements, other than statements of historical fact included in this Annual Report, regarding our strategy, future operations, financial position, estimated revenues and losses, projected costs, prospects, plans and objectives of management are forward-looking statements. When used in this Annual Report, the words “could,” “may,” “believe,” “anticipate,” “intend,” “estimate,” “expect,” “project,” “goal,” “plan,” “target” and similar expressions are intended to identify forward-looking statements, although not all forward-looking statements contain such identifying words. These forward-looking statements are based on management’s current expectations and assumptions about future events and are based on currently available information as to the outcome and timing of future events. When considering forward-looking statements, you should keep in mind the risk factors and other cautionary statements described in Item 1A. Risk Factors in this Annual Report.
Forward-looking statements may include statements about:
•volatility of oil, natural gas and NGL prices or a prolonged period of low oil, natural gas or NGL prices and the effects of actions by, or disputes among or between, members of the Organization of Petroleum Exporting Countries (“OPEC”), such as Saudi Arabia, and other oil and natural gas producing countries, such as Russia, with respect to production levels or other matters related to the price of oil;
•political and economic conditions in or affecting other producing regions or countries, including the effects of excess supply of oilMiddle East, Russia, Eastern Europe, Africa and natural gas resulting from the reduced demand caused by the Coronavirus Disease 2019 (“COVID-19”) pandemic and the actions by certain oil and natural gas producing countries;South America;
•our business strategy and future drilling plans;
•our reserves and our ability to replace the reserves we produce through drilling and property acquisitions;
•our drilling prospects, inventories, projects and programs;
•our financial strategy, return of capital program, leverage, liquidity and capital required for our development program;
•our realized oil, natural gas and NGL prices;
•the timing and amount of our future production of oil, natural gas and NGLs;
•our ability to identify, complete and effectively integrate acquisitions of properties or businesses;
•our ability to realize the anticipated benefits and synergies from the Earthstone Merger and effectively integrate the acquired assets (as defined below);
•our hedging strategy and results;
•our competition and government regulations;
•our ability to obtain permits and governmental approvals;
•our pending legal or environmental matters;
•the marketing and transportation of our oil, natural gas and NGLs;
•our leasehold or business acquisitions;
•cost of developing or operating our properties;
•our anticipated rate of return;
•general economic conditions;
•weather conditions in the areas where we operate;
•credit markets;
•our ability to make dividends, distributions and share repurchases;
•uncertainty regarding our future operating results; and
•our plans, objectives, expectations and intentions contained in this Annual Report that are not historical.
We caution you that these forward-looking statements are subject to all of the risks and uncertainties, most of which are difficult to predict and many of which are beyond our control, incident to the development, production, gathering and sale of oil and natural gas. These risks include, but are not limited to, commodity price volatility, inflation, lack of availability of drilling and production equipment and services, risks relating to the merger of the Company with Earthstone Energy, Inc (the “Earthstone
Merger”), environmental risks, drilling and other operating risks, regulatory changes, the uncertainty inherent in estimating reserves and in projecting future rates of production, cash flow and access to capital, the timing of development expenditures and the other risks described in Item 1A. Risk Factors in this Annual Report.
Reserve engineering is a process of estimating underground accumulations of oil and natural gas that cannot be measured in an exact way. The accuracy of any reserve estimate depends on the quality of available data, the interpretation of such data and price and cost assumptions made by reserve engineers. In addition, the results of drilling, testing and production activities may
justify revisions of estimates that were made previously. If significant, such revisions would change the schedule of any further production and development drilling. Accordingly, reserve estimates may differ significantly from the quantities of oil and natural gas that are ultimately recovered.
Should one or more of the risks or uncertainties described in this Annual Report occur, or should underlying assumptions prove incorrect, our actual results and plans could differ materially from those expressed in any forward-looking statements.
All forward-looking statements, expressed or implied, included in this Annual Report are expressly qualified in their entirety by this cautionary statement. This cautionary statement should also be considered in connection with any subsequent written or oral forward-looking statements that we or persons acting on our behalf may issue.
Except as otherwise required by applicable law, we disclaim any duty to update any forward-looking statements, all of which are expressly qualified by the statements in this section, to reflect events or circumstances after the date of this Annual Report.
Risk Factors Summary
The following is a summary of the principal risks that could materially adversely affect our business, financial condition and results of operations. Refer to Risk Factors under Part I, Item 1A of this Annual Report for a more detailed description of each risk factor.
Risks Related to Commodity Prices
•Commodity prices are volatile, and a sustained period of low commodity prices for oil, natural gas and NGLs could adversely affect our business, financial condition and results of operations.
•If commodity prices decrease to a level such that our future undiscounted cash flows from our properties are less than their carrying value, we may be required to take write-downs of the carrying values of our properties.
Risks Related to Our Reserves, Leases and Drilling Locations
•Reserve estimates depend on many assumptions that may turn out to be inaccurate. Any material inaccuracies in reserve estimates or underlying assumptions will materially affect the quantities and present value of our reserves.
•Unless we replace our reserves with new reserves and develop those reserves, our reserves and production will decline, which would adversely affect our future cash flows and results of operations.
•Our use of seismic data is subject to interpretation and may not accurately identify the presence of oil and natural gas, which could adversely affect the results of our drilling operations.
•The development of our estimated PUDs may take longer and may require higher levels of capital expenditures than we currently anticipate. Therefore, our estimated PUDs may not be ultimately developed or produced.
•Certain of our undeveloped leasehold acreage is subject to leases that will expire over the next several years unless production is established on units containing the acreage, the primary term is extended through continuous drilling provisions or the leases are renewed.
•Our identified drilling locations are scheduled out over many years, making them susceptible to uncertainties that could materially alter the occurrence or timing of their drilling.
•Properties that we decide to drill may not yield oil or natural gas in commercially viable quantities.
Risks Related to Our Operations
•Our development and acquisition projects require substantial capital expenditures. We may be unable to obtain required capital or financing on satisfactory terms, which could lead to a decline in our ability to access or grow production and reserves.
•Drilling for and producing oil and natural gas are high risk activities with many uncertainties that could adversely affect our business, financial condition or results of operations. Additionally, we may not be insured for, or our insurance may be inadequate to protect us against, these risks.
•Many of our properties are in areas that may have been partially depleted or drained by offset wells and certain of our wells may be adversely affected by actions other operators may take when drilling, completing, or operating wells that they own.
•Part of our strategy involves using some of the latest available horizontal drilling and completion techniques, which involve risks and uncertainties in their application.
•Our operations are substantially dependent on the availability of water. Restrictions on our ability to obtain water may have an adverse effect on our financial condition, results of operations and cash flows.
•Our ability to produce crude oil, natural gas and NGLs economically and in commercial quantities could be impaired if we are unable to acquire adequate supplies of water for our drilling operations or are unable to recycle or dispose of the produced water we produce in an economical and environmentally safe manner.
•Our producing properties are concentrated in the Permian Basin, making us vulnerable to risks associated with operating in a single geographic area.
•The marketability of our production is dependent upon transportation and other facilities, most of which we do not control. If these facilities are unavailable, or if we are unable to access these facilities on commercially reasonable terms, our operations could be interrupted and our revenues reduced.
•We have entered into multi-year agreements with some of our suppliers, service providers and the purchasers of our oil and natural gas, which contain minimum volume commitments. Any failure by us to satisfy the minimum volume commitments could lead to contractual penalties that could adversely affect our results of operations and financial position.
•The unavailability or high cost of additional drilling rigs, equipment, supplies, personnel and oilfield services could adversely affect our ability to execute our development plans within our budget and on a timely basis.
•We could experience periods of higher costs if commodity prices rise. These increases could reduce our profitability, cash flow and ability to complete development activities as planned.
•We depend upon a small number of significant purchasers for the sale of most of our oil, natural gas and NGL production.
•We may incur losses as a result of title defects in the properties in which we invest.
•Multi-well pad drilling may result in volatility in our operating results.
•We may be unable to make attractive acquisitions or successfully integrate acquired businesses, and any inability to do so may disrupt our business and hinder our ability to grow.
•A security interruption or failure with respect to our information technology systems could harm our ability to effectively operate our business.
Risks Related to Our Derivative Transactions, Debt and Access to Capital
•Our derivative activities could result in financial losses or could reduce our earnings.
•Our leverage and debt service obligations may adversely affect our financial condition, results of operations, business prospects and our ability to make payments on our outstanding debt.
•We may not be able to generate sufficient cash to service all of OpCo’s indebtedness and may be forced to take other actions to satisfy OpCo’s obligations under applicable debt instruments, which may not be successful.
•Restrictions in OpCo’s existing and future debt agreements could limit our growth and ability to engage in certain activities.
•If OpCo is unable to comply with the restrictions and covenants in the agreements governing its indebtedness, there could be a default under the terms of these agreements, which could result in an acceleration of payment of funds that OpCo has borrowed.
•Any significant reduction in the borrowing base under OpCo’s revolving credit facility as a result of the periodic borrowing base redeterminations or otherwise may negatively impact our ability to fund our operations.
•If we experience liquidity concerns, we could face a downgrade in our debt ratings which could restrict our access to, and negatively impact the terms of, current or future financings or trade credit.
•Increases in interest rates could adversely affect our business.
Risks Related to Legislative and Regulatory Initiatives
•Climate change laws and regulations restricting emissions of GHGs could increase our costs and reduce demand for the oil and natural gas we produce, while potential physical effects of climate change could disrupt our production and cause us to incur significant costs in preparing for or responding to those effects.
•Federal, state and local legislative and regulatory initiatives relating to hydraulic fracturing as well as governmental reviews of such activities could result in increased costs and additional operating restrictions or delays in the completion of oil and natural gas wells and adversely affect our production.
•Conservation measures, technological advances and negative shift in market perception toward the oil and natural gas industry could reduce demand for oil and natural gas.
•Our operations may be exposed to significant delays, costs and liabilities as a result of environmental and occupational health and safety requirements applicable to our business activities.
•Restrictions on drilling activities intended to protect certain species of wildlife may adversely affect our ability to conduct drilling activities in areas where we operate.
•A negative shift in investor sentiment towards the oil and natural gas industry and increased attention to environmental, social and governance (“ESG”) and conservation matters may adversely impact our business.
•Any restrictions on oil and natural gas development on federal lands has the potential to adversely impact our operations.
•Tax laws and regulations may change over time, and any such changes could adversely affect our business and financial condition.
•Changes in laws or regulations, or a failure to comply with any laws and regulations, may adversely affect our business, investments and results of operations.
Risks Related to Our Common Stock and Capital Structure
•A negative shift in investor sentiment towards the oil and gas industry could adversely affect our ability to raise equity and debt capital.
•Our principal stockholders hold substantial voting power of our outstanding voting common stock.
•There may be future sales or other dilution of our equity, which may adversely affect the market price of our common stock.
•The declaration of dividends and any repurchases of our common stock are each within the discretion of our board of directors based upon a review of relevant considerations, and there is no guarantee that we will pay any dividends on or repurchase shares of our common stock in the future or at levels anticipated by our stockholders.
•Provisions contained in our Charter and Bylaws, as well as provisions of Delaware law, could impair a takeover attempt, which may adversely affect the market price of our common stock.
•The Charter designates the Court of Chancery of the State of Delaware as the sole and exclusive forum for substantially all actions and proceedings that may be initiated by stockholders, which could limit shareholders’ ability to obtain a favorable judicial forum for disputes with us or our directors, officers, employees or agents.
Risks Related to the Earthstone Merger
•We may be unable to integrate the business of the Company and Earthstone successfully or realize the anticipated benefits of the Earthstone Merger.
•The financial forecasts disclosed in connection with the announcement of the Earthstone Merger are based on various assumptions that may not be realized.
•The synergies attributable to the Earthstone Merger may vary from expectations.
PART I
ITEMS 1 AND 2. BUSINESS AND PROPERTIES
Overview
Centennial Resource Development, Inc.Permian Resources Corporation is an independent oil and natural gas company focused on driving sustainable returns through the responsible acquisition, optimization and development of unconventionalhigh-return crude oil and associated liquids-rich natural gas reserves in the Permian Basin.reserves. Throughout this Annual Report, unless the context otherwise indicates, all references to the “Company,” “Centennial,“Permian Resources,” “we,” “us,” or “our” refer to Centennial Resource Development, Inc.Permian Resources Corporation and its consolidated subsidiary, Centennial Resource Production,Permian Resources Operating, LLC (“CRP”OpCo”).
Our principal business objective is to increasedeliver leading shareholder valuereturns by building a premier development company focused on horizontal drilling in the Delaware Basin. We intendleveraging our high-quality asset base and technical expertise to growsustainably and responsibly develop our production and oil and natural gas reserves by developingresources to meet the world’s need for affordable, abundant energy. We intend to drive disciplined production growth through optimized development of our acreageassets with an increased focus on optimizing drilling and completion results, drilling extended laterals and managing costs, with anthe overall objective of improving our rates of return, on all wells drilledgenerating sustainable free cash flow, maintaining a strong and thereby fundingflexible balance sheet and maximizing returns to our drilling and development capex entirely from cash flows from operations.shareholders. We also intendlook for opportunities to increase scale and grow production and reservesoptimize our portfolio of high-return, long-life inventory through selectiveaccretive acquisitions that meet our strategic and financial objectives.
Organizational StructureBusiness Combinations
On October 11, 2016,November 1, 2023, we completed the acquisitionmerger (the “Earthstone Merger”) with Earthstone Energy, Inc. (“Earthstone”). Earthstone was an independent oil and gas company engaged in the operation and development of oil and natural gas properties. The Earthstone Merger added approximately 89%223,000 net leasehold acres and significant core inventory locations to our position in the Permian Basin in both Texas and New Mexico and was completed to drive long-term accretion across our key financial and operating metrics, enhance shareholder returns and improve capital efficiency. As a part of the outstanding membership interests in CRP was consummated (the “Business Combination”). CRP is currently a wholly-owned subsidiaryEarthstone Merger consideration, approximately 161.2 million shares of Centennial Resource Development due to various equity transactions.
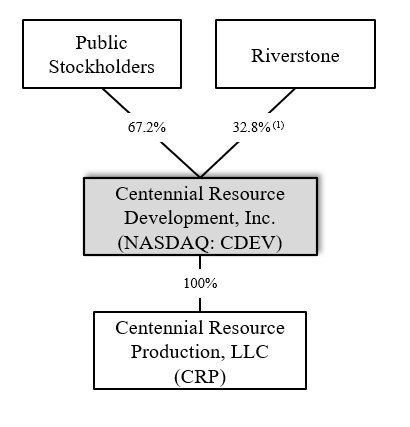
The following diagram illustrates the current ownership structure of the company as of December 31, 2020, including the voting interests of our equity holders:
(1) The above diagram excludes 8,000,000 outstanding Private Placement Warrants, each of which is exercisable for one share of Class A Common Stock at a priceand 49.5 million shares of $11.50 per shareour Class C Common Stock (with underlying units of OpCo) were issued to Earthstone’s equity holders. Certain operational and will expirefinancial information set forth in this Annual Report on October 11, 2021 (five years afterForm 10-K does not include the activity of Earthstone for periods prior to the completion of the Business Combination) or earlier upon redemption or liquidation. As of December 31, 2020, Riverstone Investment GroupEarthstone Merger on November 1, 2023.
On September 1, 2022, we completed the merger (the “Colgate Merger”) with Colgate Energy Partners III, LLC (“Riverstone”Colgate”) owns 6,826,502 Private Placement Warrants. Colgate was an independent oil and Mark G. Papa,gas exploration and development company with properties located in the Delaware Basin. The Colgate Merger was completed to provide increases to our former Chief Executive Officeroperational and Chairman, owns 1,173,498.financial scale, drive accretion across our key financial and operating metrics, and enhance the combined company’s shareholder returns. As a part of the Merger consideration, 269.3 million shares of our Class C Common Stock and underlying units of OpCo were issued to Colgate’s equity holders. Certain operational and financial information set forth in this Annual Report on Form 10-K does not include the activity of Colgate for periods prior to the completion of the Colgate Merger on September 1, 2022.
Refer to Note 2—Business Combinations under Part II, Item 8
Description of Our Properties
Our assets are concentrated in the Delaware Basin, a sub-basincore of the Permian Basin and our properties consist of large, contiguous acreage blocks in West Texas and New Mexico. As a result, we are able to efficiently develop our drilling inventory and focus on maximizing returns to our stakeholders. We have established commercial production on our acreage using horizontal drilling from ten distinct zones: the Avalon Shale, 1st Bone Spring Sand, 2nd Bone Spring Sand, 2nd Bone Spring Shale, 3rd Bone Spring Sand, 3rd Bone Spring Shale, Upper Wolfcamp A, Lower Wolfcamp A, Wolfcamp B and Wolfcamp C. Our development drilling plan is comprised exclusively of horizontal drilling with an ongoing focus on optimizing completions, improving drilling results and managing costs.
As of December 31, 2020,2023, we have leased or acquired approximately 81,657407,000 net leasehold acres 97% of which we operate. In addition, we own 1,472and approximately 68,000 net mineral acres in the Delaware Basin.royalty acres. Approximately 71%70% of our total acreage is located in Texas primarily Reeves County, in the southern portion of the Delaware Basin and the remaining 29%30% is located in Lea County, New Mexico, in the northern portion of the Delaware Basin. Over 88% of our net acreage is held by production as of December 31, 2020. The relatively high proportion of our operated acreage that is held by production gives us significant operational control and capital spending flexibility. This allows us to execute our development program with significant control over the timing and allocation of capital expenditures and application of the optimal drilling and completion techniques to efficiently develop our resource base as evidenced by our operational flexibility executed in 2020.
During the first quarter of 2020, we operated a five-rig drilling program completing 22 gross operated wells and planned to operate a similar drilling and completion program for the remainder of the year. However, in response to significant market deterioration and declines in the oil and natural gas commodity prices, both stemming from the COVID-19 pandemic and tensions between members of OPEC and other important oil producing countries like Russia, we suspended our drilling program at the end of the first quarter of 2020. We continued with no rigs in operation until the end of the third quarter of 2020 when markets and commodity prices began to recover. During August of 2020, we also completed five gross operated wells that had been drilled but left uncompleted earlier in the year. We operated one drilling rig through the fourth quarter of 2020 and ended the year with two drilling rigs in operation. These operational decisions allowed us to preserve liquidity, conserve our reserve base and develop our properties during periods of higher economic opportunity. Refer to Item 7, Management Discussion and Analysis of Financial Condition and Result of Operations under Part II, Item 7 of this Annual Report for further discussion on the 2020 market conditions and our operational activity.Mexico.
Proved Oil and Gas Reserves
Reserve estimates are inherently imprecise, and estimates for new discoveries and undeveloped locations are more imprecise than reserve estimates for producing oil and gas properties. Accordingly, these estimates are expected to change as new information becomes available. The pre-tax PV 10% amounts shown in the following table are not intended to represent the current market value of our estimated proved reserves. The actual quantities and present value of our estimated proved reserves may be more or less than we have estimated, due to a number of factors. The following table should be read along with Item 1A. Risk Factors in this Annual Report.
The following table summarizes estimated proved reserves, pre-tax PV 10%, and standardized measure of discounted future cash flows for the periods indicated:
| | | | | | | | | | | | | | | | | |
| December 31, 2020 | | December 31, 2019 | | December 31, 2018 |
| Proved developed reserves: | | | | | |
| Oil (MBbls) | 70,716 | | | 74,842 | | | 63,317 | |
| Natural gas (MMcf) | 279,556 | | | 237,791 | | | 180,542 | |
| NGL (MBbls) | 31,672 | | | 32,743 | | | 23,093 | |
Total proved developed reserves (MBoe)(1) | 148,981 | | | 147,216 | | | 116,500 | |
| Proved undeveloped reserves: | | | | | |
| Oil (MBbls) | 79,776 | | | 75,317 | | | 79,449 | |
| Natural gas (MMcf) | 248,231 | | | 264,639 | | | 222,310 | |
| NGL (MBbls) | 28,773 | | | 34,499 | | | 28,825 | |
Total proved undeveloped reserves (MBoe)(1) | 149,921 | | | 153,923 | | | 145,326 | |
| Total proved reserves: | | | | | |
| Oil (MBbls) | 150,492 | | | 150,159 | | | 142,766 | |
| Natural gas (MMcf) | 527,787 | | | 502,430 | | | 402,852 | |
| NGL (MBbls) | 60,445 | | | 67,242 | | | 51,918 | |
Total proved reserves (MBoe)(1) | 298,902 | | | 301,139 | | | 261,826 | |
| | | | | |
| Proved developed reserves % | 50 | % | | 49 | % | | 44 | % |
| Proved undeveloped reserves % | 50 | % | | 51 | % | | 56 | % |
| | | | | |
| Reserve values (in millions): | | | | | |
| Standard measure of discounted future net cash flows | $ | 1,184.7 | | | $ | 2,062.4 | | | $ | 2,479.9 | |
| Discounted future income tax expense | 4.4 | | | 135.5 | | | 499.6 | |
Total proved pre-tax PV 10%(2) | $ | 1,189.1 | | | $ | 2,197.9 | | | $ | 2,979.5 | |
| | | | | | | | | | | | | | | | | |
| December 31, 2023 | | December 31, 2022 | | December 31, 2021 |
| Proved developed reserves: | | | | | |
| Oil (MBbls) | 271,328 | | | 156,941 | | | 77,973 | |
| Natural gas (MMcf) | 1,441,914 | | | 652,270 | | | 326,223 | |
| NGL (MBbls) | 192,368 | | | 74,940 | | | 30,318 | |
Total proved developed reserves (MBoe)(1) | 704,015 | | | 340,593 | | | 162,662 | |
| Proved undeveloped reserves: | | | | | |
| Oil (MBbls) | 122,008 | | | 130,091 | | | 75,480 | |
| Natural gas (MMcf) | 324,176 | | | 381,301 | | | 250,782 | |
| NGL (MBbls) | 45,046 | | | 47,911 | | | 25,265 | |
Total proved undeveloped reserves (MBoe)(1) | 221,083 | | | 241,553 | | | 142,542 | |
| Total proved reserves: | | | | | |
| Oil (MBbls) | 393,336 | | | 287,032 | | | 153,453 | |
| Natural gas (MMcf) | 1,766,090 | | | 1,033,571 | | | 577,005 | |
| NGL (MBbls) | 237,414 | | | 122,851 | | | 55,583 | |
Total proved reserves (MBoe)(1) | 925,098 | | | 582,146 | | | 305,204 | |
| | | | | |
| Proved developed reserves % | 76 | % | | 59 | % | | 53 | % |
| Proved undeveloped reserves % | 24 | % | | 41 | % | | 47 | % |
| | | | | |
| Reserve values (in millions): | | | | | |
| Standard measure of discounted future net cash flows | $ | 9,526.2 | | | $ | 9,425.6 | | | $ | 3,396.3 | |
| Discounted future income tax expense | 1,581.5 | | | 2,289.1 | | | 481.2 | |
Total proved pre-tax PV 10%(2) | $ | 11,107.7 | | | $ | 11,714.7 | | | $ | 3,877.5 | |
(1) Calculated by converting natural gas to oil equivalent barrels at a ratio of six Mcf of natural gas to one Boe.
(2) Total proved pre-tax PV 10% (“Pre-tax PV 10%”) is a supplemental non-GAAP financial measure as defined by the SEC U.S. Securities and Exchange Commission (“SEC”) and is derived from the standardized measure of discounted future net cash flows (the ‘‘Standardized Measure’’), which is the most directly comparable U.S. generally accepted accounting principles (“GAAP”) financial measure. Pre-tax PV 10% is computed on the same basis as the Standardized Measure but without deducting future income taxes. We believe Pre-tax PV 10% is a useful measure for investors when evaluating the relative monetary significance of our oil and natural gas properties. We further believe investors may utilize our Pre-tax PV 10% as a basis for comparison of the relative size and value of our proved reserves to other companies because many factors that are unique to each individual company impact the amount of future income taxes to be paid. Our management uses this measure when assessing the potential return on investment related to our oil and gas properties and acquisitions. However, Pre-tax PV 10% is not a substitute for the Standardized Measure. Our Pre-tax PV 10% and Standardized Measure do not purport to present the fair value of our proved oil, NGL and natural gas reserves.
Proved Undeveloped Reserves. Our proved undeveloped (“PUD”) reserves decreased by 4.020.5 MMBoe on a net basis from December 31, 20192022 to December 31, 2020,2023, and the following table provides a reconciliation of the changes to our PUD reserves that occurred during the year:
| | | | | |
| (MBoe) | 20202023 |
| Proved undeveloped reserves at January 1, 2023 | 241,553 | | 153,923 |
TransferredTransfers to proved developed reserves | (18,622)(91,234) | |
| Revisions to previous estimates | (37,471)(34,872) | |
| Extensions and discoveries | 52,09147,947 | |
| |
| |
| Purchase of reserves in place | 57,689 | |
| Proved undeveloped reserves at December 31, 2023 | 221,083 | | 149,921 |
During 2020, we spent $158.3 millionThe decrease in capital expendituresproved undeveloped reserves was primarily attributable to convert 18.6converting 91.2 MMBoe of PUD reserves to proved developed reserves. Furthermore, we added 52.1 MMBoe of PUD reserves during the year through extensions and discoveries,2023, for which mainly related to new locations added based on our 2020 drilling results. The majority of these new PUD locations were on our New Mexico acreage within the 2nd and 3rd Bone Spring formations, and we also added locationsspent $870.6 million in the Wolfcamp C and 3rd Bone Spring on our Texas acreage position. Totalcapital expenditures. Additionally, total revisions to previous estimates reduced PUD reserves by a net amount of 37.534.9 MMBoe. Negative revisions during 2020 totaled 114.02023 mainly related to (i) 22.3 MMBoe and consisted of (i) 83.9 MMBoe of downward pricing adjustments, (ii) 25.4 MMBoe of negative revisions associated with PUD locations that were eithermainly reclassified to unproved reserves or removed due to changes inmade to our active development program,plan (ii) 7.6 MMBoe of downward revisions related to lowered estimates associated with timing and performance, and (iii) 4.05.0 MMBoe of reduced PUD reserves removedfrom lower average commodity prices for PUD locations no longer expected to be developed within five years of their initial recording.the year ended 2023. These downward revisionsdecreases in proved undeveloped reserves were partially offset by 76.5adding 57.7 MMBoe of upward revisions primarily relatedPUD reserves, the significant majority of which were from properties acquired in the Earthstone Merger on November 1, 2023 (Refer to reductions to our operating costs and per-well capital expenditures realizedNote 2—Business Combinations under Part II, Item 8 of this Annual Report for further details on the Earthstone Merger). Additionally, we added 47.9 MMBoe of PUD reserves during the year through extensions and applieddiscoveries as a result of our 2023 drilling results, which mainly related to our reserve estimates.new locations added in the various Bone Spring and Wolfcamp formations on the Company’s acreage position in the Delaware Basin. All of our PUD locations are scheduled to be drilled within five years of their initial booking. Our PUD to proved developed reserves conversion rate was 13%38% in 2020, which is lower than historical conversion rates due to our reduced 2020 drilling activity as previously discussed.2023.
For additional information and for a discussion of material changes on our total proved reserves, see Supplemental Information About Oil & Natural Gas Producing Activities, Item 8. Financial Statements and Supplementary Data of this Annual Report.
Preparation of Reserve Estimates
Our proved reserves are estimated by an independent engineering firm, Netherland, Sewell & Associates, Inc. (“NSAI”). Reserve estimates are prepared in accordance with the definitions and regulations of the SEC and the Financial Accounting Standards Board (the “FASB”) using a deterministic method, which includes decline curve analysis, production performance analysis, offset analogies, and in some cases a combination of these methodologies.
Controls over Reserve Estimation
We maintain adequate and effective internal controls over the reserve estimation process and the underlying data which the reserve estimates are based upon. Our reserves estimation process is coordinated by our internal reserves department, which consists of qualified petroleum engineers and is overseen by our Vice President of Strategic Planning and Corporate Reserves.Reserves Manager. Reserve information, including models and other technical data, are stored on a secured database on our network. Certain non-technical inputs used in the reserves estimation process such as ownership interest percentages, oil and natural gas production, commodity prices, price differentials, operating and development costs and plug and abandonment estimates are obtained by other departments and are subject to our internal control process.departments. Annually, our internal reserves department prepares a preliminary reserve database and meets with NSAI to discuss the assumptions and methods to be used in the year-end proved reserve estimation process and to review field performance and our future development plans. Following this review, the reserve database and supporting data is furnished to NSAI for their independent estimates and final report.
Qualifications of Responsible Technical Persons
Our Vice President of Strategic Planning and Corporate Reserves Jeff Thompson,Manager, Joseph Jones, is responsible for overseeing the preparation of the reserves estimates. Mr. ThompsonJones has held this position at CentennialPermian Resources since July 2017September 2022 after formerly serving in a similar role for Colgate prior to the Colgate Merger and has over 1510 years of relevant experience in reservoir engineering and reserve estimation. He holds a Bachelor of Science degree in petroleum engineering from the University of Oklahoma and is a Registered Professional Engineer in Oklahoma and member of the Society of Petroleum Engineers.Texas A&M University.
NSAI was founded in 1961 and performs consulting petroleum engineering services under Texas Board of Professional Engineers Registration No. F-2699. Within NSAI, the technical persons primarily responsible for preparing the estimates set forth in the NSAI reservereserves report incorporated herein are Mr. Neil H. LittleMs. Lily W. Cheung and Mr. Edward C. Roy III. Mr. Little,Zachary R. Long. Ms. Cheung, a Licensed Professional Engineer in the State of Texas (No. 117966)107207), has been practicing consulting petroleum engineering at NSAI since 20112007 and has over 4 years of prior industry experience. She graduated from Massachusetts Institute of Technology in 2003 with a Bachelor of Science Degree in Mechanical Engineering and from University of Texas at Austin in 2007 with a Master of Business
over 9 years of prior industry experience. He graduated from Rice University with a Bachelor of Science Degree in Chemical Engineering and from University of Houston with a Master of Business Administration Degree. Mr. Roy,Long, a Licensed Professional Geoscientist in the State of Texas, Geology (No. 2364)11792), has been practicing consulting petroleum geoscience at NSAI since 20082007 and has over 112 years of prior industry experience. He graduated from Texas Christian University of Louisiana at Lafayette in 2003 with a Bachelor of Science Degree in Petroleum Geology and from Texas A&M University in 2005 with a Master’sMaster of Science Degree in Geology.Geophysics. Both technical principals meet or exceed the education, training, and experience requirements set forth in the Standards Pertaining to the Estimating and Auditing of Oil and Gas Reserves Information promulgated by the Society of Petroleum Engineers; both are proficient in judiciously applying industry standard practices to engineering and geoscience evaluations as well as applying SEC and other industry reservereserves definitions and guidelines.
Production
The following table sets forth information regarding net production of oil, natural gas and NGLs, and certain price and cost information for each of the periods indicated:
| | | | | | | | | | | | | | | | | |
| Year Ended December 31, |
| 2020 | | 2019 | | 2018 |
| Net production: | | | | | |
| Oil (MBbls) | 13,207 | | | 15,582 | | | 12,679 | |
| Natural gas (MMcf) | 41,302 | | | 41,703 | | | 31,707 | |
| NGL (MBbls) | 4,490 | | | 5,234 | | | 4,332 | |
Total (MBoe)(1) | 24,581 | | | 27,766 | | | 22,295 | |
| Average sales price (excluding effect of hedges): | | | | | |
| Oil (per Bbl) | $ | 36.02 | | | $ | 52.02 | | | $ | 55.98 | |
| Natural gas (per Mcf) | 1.13 | | | 1.07 | | | 1.97 | |
| NGL (per Bbl) | 12.91 | | | 17.03 | | | 27.45 | |
Total per BOE(1) | $ | 23.61 | | | $ | 34.01 | | | $ | 39.97 | |
| Operating costs per Boe: | | | | | |
| Lease operating expenses | $ | 4.45 | | | $ | 5.26 | | | $ | 3.74 | |
| Severance and ad valorem taxes | 1.60 | | | 2.28 | | | 2.54 | |
| Gathering, processing and transportation expenses | 2.90 | | | 2.62 | | | 2.58 | |
| | | | | | | | | | | | | | | | | |
| Year Ended December 31, |
| 2023 | | 2022 | | 2021 |
| Net production: | | | | | |
| Oil (MBbls) | 35,560 | | | 18,235 | | | 11,701 | |
| Natural gas (MMcf) | 119,182 | | | 59,692 | | | 40,741 | |
| NGL (MBbls) | 15,569 | | | 6,750 | | | 3,752 | |
Total (MBoe)(1) | 70,992 | | | 34,934 | | | 22,243 | |
| Average sales price (excluding effect of hedges): | | | | | |
| Oil (per Bbl) | $ | 75.84 | | | $ | 88.95 | | | $ | 63.50 | |
Natural gas price excluding the effects of GP&T (per Mcf)(2) | 1.60 | | | 4.86 | | | 3.67 | |
NGL price excluding the effects of GP&T (per Bbl)(3) | 22.83 | | | 35.97 | | | 36.61 | |
Total per Boe(1) | $ | 45.68 | | | $ | 61.69 | | | $ | 46.30 | |
| Operating costs per Boe: | | | | | |
| Lease operating expenses | $ | 5.26 | | | $ | 4.92 | | | $ | 4.78 | |
| Severance and ad valorem taxes | 3.39 | | | 4.46 | | | 3.02 | |
| Gathering, processing and transportation expenses | 1.26 | | | 2.80 | | | 3.86 | |
(1) Calculated by converting natural gas to oil equivalent barrels at a ratio of six Mcf of natural gas to one Boe.
(2) Natural gas average sales price excludes $0.41 per Mcf of gathering, processing and transportation costs (“GP&T”) for the year ended December 31, 2023, $0.22 for the year ended December 31, 2022 and none for the year ended December 31, 2021.
(3) NGL average sales price excludes $4.71 per Bbl of GP&T charges for the year ended December 31, 2023, $1.56 per Bbl for the year ended December 31, 2022 and none for the year ended December 31, 2021.
Productive Wells
As of December 31, 2020,2023, we owned an approximate 75%83% average working interest in 5342,577 gross (400(2,143 net) operated productive wells and an approximate 11% average working interest in 1,094 gross (120 net) non-operated productive wells. Our wells are primarily oil wells (517 gross/387(3,150 gross, 2,018 net productive oil wells) that produce associated liquids-rich natural gas. Productive wells consist of producing wells, wells capable of production and wells awaiting connection to production facilities. Gross wells are the total number of producing wells in which we have an interest, operated and non-operated, and net wells are the sum of our fractional working interests owned in gross wells.
Acreage
The following table sets forth information as of December 31, 20202023 relating to our gross and net developed and undeveloped leasehold acreage. Developed acreage consists of acres spaced or assigned to productive wells and does not include undrilled acreage held by production under the terms of the lease. Undeveloped acreage is defined as acres on which wells have not been drilled or completed to a point that would permit the production of commercial quantities of oil or natural gas, regardless of whether such acreage contains proved reserves.
| | | | | | | | | | | | | | | | | | | | | | | | | | | | | | | | |
Developed Acreage(3) | | Undeveloped Acreage(3) | | Total Acreage(3) |
Gross(1) | | Net(2) | | Gross(1) | | Net(2) | | Gross(1) | | Net(2) |
| 60,267 | | | 45,579 | | | 45,983 | | | 36,078 | | | 106,250 | | | 81,657 | |
| | | | | | | | | | | | | | | | | | | | | | | | | | | | | | | | |
| Developed Acreage | | Undeveloped Acreage | | Total Acreage |
Gross(1) | | Net(2) | | Gross(1) | | Net(2) | | Gross(1) | | Net(2) |
| 433,957 | | | 345,390 | | | 109,534 | | | 61,663 | | | 543,491 | | | 407,053 | |
(1) A gross acre is an acre in which a working interest is owned. The number of gross acres is the total number of acres in which a working interest is owned.
(2) A net acre is deemed to exist when the sum of the fractional ownership working interests in gross acres equals one. The number of net acres is the sum of the fractional working interests owned in gross acres expressed as whole numbers and fractions thereof.
(3) Does not include our 1,472 net mineral acres.
The following table sets forth the gross and net undeveloped acreage, as of December 31, 2020,2023, that will expire over the next five years unless production is established within the spacing units covering the acreage, the lease is renewed or extended under continuous drilling provisions prior to the primary term expiration dates, or pursuant to other terms of the lease agreements.
| | | | | | | | | | | | | | | | | | | | | | | | | | | | | | | | | | | | | | | | | | | | | | | | | | | | | | | | |
| 2021 | | 2022 | | 2023 | | 2024 | | 2025 |
| Gross | | Net | | Gross | | Net | | Gross | | Net | | Gross | | Net | | Gross | | Net |
| 7,776 | | | 5,017 | | | 4,183 | | | 2,171 | | | 1,335 | | | 211 | | | 1,320 | | | 1,081 | | | 320 | | | 320 | |
| | | | | | | | | | | | | | | | | | | | | | | | | | | | | | | | | | | | | | | | | | | | | | | | | | | | | | | | |
| 2024 | | 2025 | | 2026 | | 2027 | | 2028 |
| Gross | | Net | | Gross | | Net | | Gross | | Net | | Gross | | Net | | Gross | | Net |
| 1,620 | | | 766 | | | 1,519 | | | 930 | | | 3,402 | | | 1,700 | | | 1,120 | | | 533 | | | 213 | | | 200 | |
Drilling Results
The following table sets forth the results of our drilling activity, as defined by wells placed on production, for the periods indicated. Productive wells are exploratory, development or extension wells that produce, or are capable of producing, commercial quantities of hydrocarbons, regardless of whether they produce a reasonable rate of return. Dry wells are exploratory, development or extension wells that prove to be incapable of producing hydrocarbons in sufficient quantities to justify incurring the costs associated with completion as an oil or gas well.
| | | | | | | | | | | | | | | | | | | | | | | | | | | | | | | | | | | |
| Year Ended December 31, |
| 2020 | | 2019 | | 2018 |
| Gross | | Net | | Gross | | Net | | Gross | | Net |
| Development Wells: | | | | | | | | | | | |
Productive(1) | 31 | | | 29.5 | | | 84 | | | 73.6 | | | 80 | | | 72.4 | |
Dry(2) | 1 | | | 1.0 | | | 2 | | | 2.0 | | | — | | | — | |
| 32 | | | 30.5 | | | 86 | | | 75.6 | | | 80 | | | 72.4 | |
| Exploratory Wells: | | | | | | | | | | | |
Productive(1) | — | | | — | | | — | | | — | | | — | | | — | |
| Dry | 1 | | | 1.0 | | | — | | | — | | | — | | | — | |
| 1 | | | 1.0 | | | — | | | — | | | — | | | — | |
| Total | 33 | | | 31.5 | | | 86 | | | 75.6 | | | 80 | | | 72.4 | |
| | | | | | | | | | | | | | | | | | | | | | | | | | | | | | | | | | | |
| Year Ended December 31, |
| 2023 | | 2022 | | 2021 |
| Gross | | Net | | Gross | | Net | | Gross | | Net |
| Development Wells: | | | | | | | | | | | |
| Productive | 183 | | | 150.2 | | | 95 | | | 84.9 | | | 42 | | | 38.0 | |
Dry(1) | 2 | | | 1.8 | | | 3 | | | 2.8 | | | — | | | — | |
| 185 | | | 152.0 | | | 98 | | | 87.7 | | | 42 | | | 38.0 | |
| Exploratory Wells: | | | | | | | | | | | |
| Productive | — | | | — | | | — | | | — | | | — | | | — | |
| Dry | — | | | — | | | — | | | — | | | — | | | — | |
| — | | | — | | | — | | | — | | | — | | | — | |
| Total | 185 | | | 152.0 | | | 98 | | | 87.7 | | | 42 | | | 38.0 | |
(1) Although a well may be classified as productive upon completion, future changes in oil and natural gas prices, operating costs and production may result in the well becoming uneconomical, particularly exploratory wells where there is no production history.
(2) The developmental dry hole category includes wells that were unsuccessful due to mechanical issues that occurred during drilling.
As of December 31, 2020,2023, we had 923 gross (8.4(19.5 net) operated wells in the process of drilling completingand 45 gross (36.3 net) operated wells in the process of completion or waiting on completion.
Delivery Commitments
The table below summarizes our firm sales agreements for crude oil, and natural gas, both of which provideprovides for gross firm sales over the contractual terms:
| | | | | | | | | | | | | | | | | | | | | | | | | | |
| | Oil Volume Commitments(1)(2) | | Gas Volume Commitments(1)(3) |
| Period | | Total (Bbl) | | Daily (Bbls/d) | | Total (MMBtu) | | Daily (MMBtu/d) |
| 2021 | | 14,000,000 | | | 38,300 | | | 30,150,000 | | | 82,600 | |
| 2022 | | 18,250,000 | | | 50,000 | | | 12,450,000 | | | 41,000 | |
| 2023 | | 20,075,000 | | | 55,000 | | | — | | | — | |
| 2024 | | 10,980,000 | | | 30,100 | | | — | | | — | |
| 2025 | | 4,530,000 | | | 30,000 | | | — | | | — | |
| Total | | 67,835,000 | | | | | 42,600,000 | | | |
| | | | | | | | | | | | | | |
| | Oil Volume Commitments(1) |
| Period | | Total (Bbl) | | Daily (Bbls/d) |
| 2024 | | 10,610,000 | | | 29,000 | |
| 2025 | | 4,380,000 | | | 29,000 | |
| | | | |
| | | | |
| Total | | 14,990,000 | | | |
(1) Above volumes represent the total gross volumes we are required to deliver per thesepursuant to agreements with carriers, which gross volumes are not comparable to our net production presented in Item 7. Management’s Discussion and Analysis of Financial Condition and Results of Operation in this Annual Report, as amounts therein are reflected net of all royalties, overriding royalties and production due to others.
(2) WeThese total oil volumes committed are only requiredsubject to physically deliver 30,000 Bbls/d of the total committed gross volumes of crude oil during the years 2021 through May 2025, andfinancial ship-or-pay penalties if thesesuch physical delivery commitments are not met, a financial obligation would arise. Failure to deliver the remainder of the committed gross volumes of crude oil under these agreements could result, and during 2020 did result, in a reduction of our future firm takeaway capacity at the purchasers’ discretion in accordance with the terms of the agreements.
(3) We are not required to physically deliver these gross volumes over the terms of the agreements, but if the volumetric commitments are not met and the purchaser incurs financial damages, we are required to pay for any differences between the contracted prices and current market prices for replacement volumes bought by the purchaser.
met. We believe our current production and reserves are sufficient to fulfill these physical delivery commitments, and production under the agreements is not tied to any specific property. Therefore, if our production is not sufficient to satisfy the firm delivery commitments above, we believe we can purchase sufficient volumes in the market at index-related prices to satisfy our commitments. See also Item 7. Management’s Discussion and Analysis of Financial Condition and Results of Operations — Contractual Obligations, in this Annual Report for discussion of our firm transportation commitments related to natural gas deliveries.
Title to Properties
We believe that we have satisfactory title to substantially all of our producing properties in accordance with generally accepted industry standards. Individual properties may be subject to burdens such as royalty, overriding royalty, working and other outstanding interests customary in the industry. In most cases, we investigate title and obtain title opinions from counsel only when we acquire producing properties or before commencement of drilling operations.
Marketing and Customers
We market the majority of the production from properties we operate on account of both ourselves and that of the other working interest owners in these properties. We generally sell our oil, natural gas and NGL production to purchasers at prevailing market prices, which in certain cases are adjusted for contractual differentials, and the majority of our revenue contracts have terms greater than twelve months.
We normally sell production to a relatively small number of customers, as is customary in our business. The table below summarizes the purchasers that accounted for 10% or more of our total net revenues for the periods presented:
| | | | | | | | | | | | | | | | | |
| Year Ended December 31, |
| 2020 | | 2019 | | 2018 |
| BP America | 47 | % | | 37 | % | | 18 | % |
| Shell Trading (US) Company | 20 | % | | 11 | % | | 19 | % |
| Eagleclaw Midstream Ventures, LLC | 8 | % | | 8 | % | | 12 | % |
| ExxonMobil Oil Corporation | 4 | % | | 26 | % | | — | % |
| | | | | | | | | | | | | | | | | |
| Year Ended December 31, |
| 2023 | | 2022 | | 2021 |
| BP America | 20 | % | | 34 | % | | 50 | % |
| Shell Trading (US) Company | 20 | % | | 21 | % | | 22 | % |
| Enterprise Crude Oil, LLC | 30 | % | | 18 | % | | — | % |
| Kinetik Holdings Inc. | 5 | % | | 8 | % | | 11 | % |
During these periods, no other purchaser accounted for 10% or more of our net revenues. The loss of any of our major purchasers could materially and adversely affect our revenues in the near-term. However, since crude oil and natural gas are fungible products with well-established markets and numerous purchasers and are based on current demand for oil and natural
gas, we believe that the loss of any major purchaser would not have a material adverse effect on our financial condition or results of operations.
Competition
The oil and natural gas industry is a highly competitive environment. We compete with both major integrated and other independent oil and natural gas companies in all aspects of our business including exploring, developing and operating our properties as well as transporting and marketing our production. Competitive conditions may be affected by future legislation and regulations as the United States develops new energy and climate-related policies. In addition, some of our competitors may have a competitive advantage when responding to factors that affect the supply and demand for oil and natural gas production, such as price fluctuations (including basis differentials), domestic and foreign political conditions, weather conditions, the proximity and capacity of natural gas pipelines and other transportation facilities and overall economic conditions. We also face indirect competition from alternative energy sources. Our ability to acquire additional prospects and to find and develop reserves in the
future will depend on our ability to evaluate and select suitable properties and to consummate transactions in a highly competitive environment.
Transportation
During the initial development of our fields, we consider all gathering and delivery infrastructure options in the areas of our production. The majority of our oil production is sold at the leasewellhead as it enters third-party gathering pipelines. The purchaser then transports the oil by pipeline or truck to a tank farm, another pipeline or a refinery. Our natural gas is either transported by gathering lines from the wellhead to a central delivery point and is then gathered by third-party lines to a gas processing facility or gathered by a third-party directly from the wellhead.
Regulation of the Oil and Natural Gas Industry
Our operations are subject to extensive federal, state and local laws and regulations. All of the jurisdictions in which we own or operate producing properties have statutory provisions regulating the development and production of oil and natural gas, including, but not limited to, provisions related to permits for the drilling of wells, bonding requirements to drill or operate wells, the location of wells, the method of drilling and casing wells, the surface use and restoration of properties upon which wells are drilled, sourcing and disposal of water used in the drilling and completion process, and the abandonment of wells. Our operations are also subject to various conservation laws and regulations including, but not limited to, the regulation of the size of drilling and spacing units or proration units, the number of wells which may be drilled in an area, and the unitization or pooling of crude oil or natural gas wells, as well as regulations that generally prohibit the venting or flaring of natural gas and impose certain requirements regarding the ratability or fair apportionment of production from fields and individual wells.
Failure to comply with applicable laws and regulations can result in substantial penalties. The regulatory burden on the industry increases the cost of doing business and affects profitability. Although we believe we are in substantial compliance with all applicable laws and regulations, such laws and regulations are frequently amended or reinterpreted. Therefore, we are unable to predict the future costs or impact of compliance. Additional proposals and proceedings affecting the oil and natural gas industry are regularly considered by Congress, the states, regulatory authorities, including the Federal Energy Regulatory Commission (“FERC”), and the courts. We cannot predict when or whether any such proposals may become effective.
We believe we are in substantial compliance with currently applicable laws and regulations and that continued substantial compliance with existing requirements will not have a material adverse effect on our financial position, cash flows or results of operations. However, current regulatory requirements may change, currently unforeseen environmental, health or safety incidents may occur or past non-compliance with environmental, health and safety laws or regulations may be discovered. In addition, governmental, scientific, and public concern over the threat of climate change arising from increasing global greenhouse gas (“GHG”) emissions has resulted in higher political and regulatory risks in the United States, including climate change related pledges made by certain administrations. President Biden has issued several executive orders focused on addressing climate change since taking office, which may impact the costs to produce, or demand for, oil and natural gas. Additionally, in November 2021, the Biden administration released “The Long-Term Strategy of the United States: Pathways to Net-Zero Greenhouse Gas Emissions by 2050,” which establishes a roadmap to net zero emissions in the United States by 2050 through, among other things, improving energy efficiency; decarbonizing energy sources via electricity, hydrogen, and sustainable biofuels; and reducing non-carbon dioxide GHG emissions, such as methane and nitrous oxide. The Biden administration has also proposed certain changes to the leasing and permitting programs for oil and natural gas development on federal lands, including imposing bans on new oil and gas leasing, cancelling issued oil and gas leases, and removing public lands from future oil and gas leasing.
Regulation of Production of Oil and Natural Gas
The production of oil, natural gas and NGLs is subject to regulation under a wide range of local, state and federal statutes, rules, orders and regulations. Federal, state and local statutes and regulations require permits for drilling operations, drilling bonds and reports concerning operations. We own interests in properties located in New Mexico and Texas, which regulate drilling and operating activities by, among other things, requiring permits for the drilling of wells, maintaining bonding requirements in order to drill or operate wells, and regulating the location of wells, the method of drilling and casing wells, the surface use and restoration of properties upon which wells are drilled and the plugging and abandonment of wells. The laws of New Mexico and Texas also govern a number of conservation matters, including provisions for the unitization or pooling of oil and natural gas properties, the establishment of maximum allowable rates of production from oil and natural gas wells, the regulation of well spacing or density, and plugging and abandonment of wells. The effect of these regulations is to limit the amount of oil, natural gas and NGLs that we can produce from our wells and to limit the number of wells or the locations where we can drill, although we can apply for exceptions to such regulations or to have reductions in well spacing or density. Moreover, New Mexico and Texas impose a production or severance tax with respect to the production and sale of oil, natural gas and NGLs within their jurisdiction.
Our competitors in the oil and natural gas industry are subject to the same regulatory requirements and restrictions that affect our operations, and as a result we do not expect compliance with such regulatory requirements to affect our operations in any way
that is of material difference from our competitors who are similarly situated. However, the failure to comply with these rules and regulations can result in substantial penalties.
Regulation of Sales and Transportation of Oil
Sales of oil, condensate and NGLs from our producing wells are not currently regulated and are made at negotiated prices. Nevertheless, Congress could enact price controls in the future.
Sales of oil are affected by the availability, terms and conditions and cost of transportation services. The transportation of oil in common carrier pipelines is also subject to rate and access regulation. FERC regulates the transportation in interstate commerce of crude oil, petroleum products, NGLs and other forms of liquid fuel under the Interstate Commerce Act.
Intrastate oil pipeline transportation rates are subject to regulation by state regulatory commissions. The basis for intrastate oil pipeline regulation, and the degree of regulatory oversight and scrutiny given to intrastate oil pipeline rates, varies from state to state. We rely on third-party pipeline systems to transport the majority of crude oil produced by ours wells. Insofar as effective interstate and intrastate rates and regulations regarding access are equally applicable to all comparable shippers, we believe that the regulation of oil transportation will not affect our operations in any way that is of material difference from those of our competitors who are similarly situated.
Changes in FERC or state policies and regulations or laws may adversely affect the availability and reliability of firm and/or interruptible transportation service on interstate and intrastate pipelines, and we cannot predict what future action FERC or state regulatory bodies will take. We do not believe, however, that any regulatory changes will affect us in a way that materially differs from the way they will affect other oil producers and marketers with which we compete.
Regulation of Transportation and Sales of Natural Gas
Historically, the transportation and sale of natural gas in interstate commerce have been regulated by agencies of the U.S. federal government, primarily FERC. In the past, the federal government regulated the prices at which natural gas could be sold. While sales by producers of natural gas can currently be made at uncontrolled market prices, Congress could reenact price controls in the future. Deregulation of wellhead natural gas sales began with the enactment of the Natural Gas Policy Act of 1978 (the “NGPA”) and culminated in adoption of the Natural Gas Wellhead Decontrol Act, which removed controls affecting wellhead sales of natural gas effective January 1, 1993. The transportation and sale for resale of natural gas in interstate commerce is regulated primarily under the Natural Gas Act of 1938 (the “NGA”), and by regulations and orders promulgated under the NGA by FERC. In certain limited circumstances, intrastate transportation and wholesale sales of natural gas may also be affected directly or indirectly by laws enacted by Congress and by FERC regulations.
The federal Energy Policy Act of 2005 (the “EP Act of 2005”) is a comprehensive compilation of tax incentives, authorized appropriations for grants and guaranteed loans, and significant changes to the statutory policy that affects all segments of the energy industry. Among other matters, the EP Act of 2005 amended the NGA to add an anti-market manipulation provision that makes it unlawful for any entity to engage in prohibited behavior to be prescribed by FERC, and furthermore provides FERC with additional civil penalty authority. The EP Act of 2005 provided FERC with the power to assess civil penalties of up to $1.0 million per day for violations of the NGA and increased FERC’s civil penalty authority under the NGPA from $5,000 per violation per day to $1.0 million per violation per day. In January 2020, FERC issued a final rule increasing itsSuch maximum civil penalty authority under the NGA and NGPA has been increased to adjust for inflation. FERC may now assess civil penalties under the NGA and NGPA of $1,291,894$1,388,496 per violation per day. The civil penalty provisions are applicable to entities that engage in the sale of natural gas for resale in interstate commerce. On January 19, 2006, FERC issued Order No. 670, a rule implementing the anti-market manipulation provision of the EP Act of 2005, and subsequently denied rehearing. The rules make it unlawful, in connection with the purchase or sale of natural gas or the purchase or sale of transportation services subject to the jurisdiction of FERC, for any entity, directly or indirectly, to: (i) use or employ any device, scheme or artifice to defraud; (ii) make any untrue statement of material fact or omit to make any such statement necessary to make the statements made not misleading; or (iii) engage in any act or practice that operates as a fraud or deceit upon any person. The new anti-market manipulation rule does not apply to activities that relate only to intrastate or other non-jurisdictional sales or gathering, but does apply to activities of gas pipelines and storage companies that provide interstate services, as well as otherwise non-jurisdictional entities to the extent the activities are conducted “in connection with” gas sales, purchases or transportation subject to FERC jurisdiction, which now includes the annual reporting requirements under Order 704, described below. The anti-market manipulation rule and enhanced civil penalty authority reflect an expansion of FERC’s NGA enforcement authority.
We are required to observe such anti-market manipulation laws and related regulations enforced by FERC under the EP Act of 2005 and those enforced by the US Commodity Futures Trading Commission (the “CFTC”) under the Commodity Exchange Act, as amended (the “CEA”) and CFTC regulations promulgated thereunder. The CEA prohibits any person from manipulating or attempting to manipulate the price of any commodity in interstate commerce, as well as the market for financial instruments on
such commodity, such as futures, options and swaps. The CEA also prohibits knowingly delivering or causing to be delivered false or misleading or knowingly inaccurate reports concerning market information or conditions that affect or tend to affect the
price of a commodity. Should we violate the anti-market manipulation laws and regulations, we could also be subject to related third-party damage claims by, among others, sellers, royalty owners and taxing authorities.
Natural gas gathering service, which occurs upstream of jurisdictional transmission services, is regulated by the states. Section 1(b) of the NGA exempts companies that provide natural gas gathering services from regulation by FERC as a “natural gas company” under the NGA. Although FERC has set forth a general test for determining whether facilities perform a non-jurisdictional gathering function or a jurisdictional transmission function, FERC’s determinations as to the classification of facilities are done on a case-by-case basis. To the extent that FERC issues an order that reclassifies certain jurisdictional transmission facilities as non-jurisdictional gathering facilities, or vice versa, and depending on the scope of that decision, our costs of delivering gas to point-of-sale locations may increase. We believe that the natural gas pipelines in our gathering systems meet the traditional tests FERC has used to establish a pipeline’s status as a gatherer not subject to regulation as a natural gas company. However, the distinction between FERC-regulated transmission services and federally unregulated gathering services is the subject of ongoing litigation, so the classification and regulation of our gathering facilities are subject to change based on future determinations by FERC, the courts or Congress. State regulation of natural gas gathering facilities generally includes various occupational safety, environmental and, in some circumstances, nondiscriminatory-take requirements. Although such regulation has not generally been affirmatively applied by state agencies, natural gas gathering may receive greater regulatory scrutiny in the future.
Intrastate natural gas transportation is also subject to regulation by state regulatory agencies. The basis for intrastate regulation of natural gas transportation and the degree of regulatory oversight and scrutiny given to intrastate natural gas pipeline rates and services varies from state to state. Insofar as such regulation within a particular state will generally affect all intrastate natural gas shippers within the state on a comparable basis, we believe that the regulation of similarly situated intrastate natural gas transportation in any states in which we operate and ship natural gas on an intrastate basis will not affect our operations in any way that is of material difference from those of our competitors. Like the regulation of interstate transportation rates, the regulation of intrastate transportation rates affects the marketing of natural gas that we produce, as well as the revenues we receive for sales of our natural gas.
Changes in FERC or state policies and regulations or laws may adversely affect the availability and reliability of firm and/or interruptible transportation service on interstate and intrastate pipelines, and we cannot predict what future action that FERC or state regulatory bodies will take. We do not believe, however, that any regulatory changes will affect us in a way that materially differs from the way they will affect other natural gas producers and marketers with which we compete.
Regulation of Environmental and Occupational Safety and Health Matters
Our operations are subject to stringent federal, state and local laws and regulations governing the occupational safety and health aspects of our operations, the discharge of materials into the environment, and protection of the environment and natural resources (including threatened and endangered species and their habitats). Numerous governmental entities, including the U.S. Environmental Protection Agency (the “EPA”) and analogous state agencies, have the power to enforce compliance with these laws and regulations and the permits issued under them, often requiring difficult and costly investigation or actions. These laws and regulations may, among other things, (i) require the acquisition of permits to conduct drilling and other regulated activities; (ii) restrict the types, quantities and concentrations of various substances that can be released into the environment or injected into formations in connection with drilling and production activities; (iii) limit or prohibit drilling activities on certain lands lying within wilderness, wetlands, and other protected areas; (iv) require remedial measures to prevent or mitigate pollution from former and ongoing operations, such as requirements to close pits and plug abandoned wells; (v) apply specific health and safety criteria addressing worker protection; and (vi) impose substantial liabilities for pollution resulting from drilling and production operations. Any failure to comply with these laws and regulations may result in the assessment of administrative, civil and criminal penalties, the imposition of corrective or remedial obligations, the occurrence of delays or restrictions in permitting or performance of projects, and the issuance of orders enjoining performance of some or all of our operations.
The following is a summary of the more significant existing and proposed environmental and occupational safety and health laws, as amended from time to time, to which our business operations are or may be subject, and for which compliance may have a material adverse impact on our capital expenditures, results of operations or financial position.
Hazardous Substances and Handling Wastes
The Resource Conservation and Recovery Act (“RCRA”) and comparable state laws regulate the generation, transportation, treatment, storage, disposal and cleanup of hazardous and nonhazardous solid wastes. Pursuant to rules issued by the EPA, the individual states administer some or all of the provisions of RCRA, sometimes in conjunction with their own, more stringent requirements. Drilling fluids, produced waters and other wastes associated with the exploration, development and production of oil, natural gas and NGLs, if properly handled, are currently exempt from regulation as hazardous waste under RCRA and,
instead, are regulated under RCRA’s less stringent nonhazardous solid waste provisions, state laws or other federal laws. However, it is possible that certain oil and natural gas drilling and production wastes now classified as nonhazardous solid wastes could be classified as
hazardous wastes in the future. For example, in December 2016, the EPA and environmental groups entered into a consent decree to address the EPA’s alleged failure to timely assess its RCRA Subtitle D criteria regulations exempting certain exploration and production related oil and natural gas wastes from regulation as hazardous wastes under RCRA. The consent decree required the EPA to propose a rulemaking no later than March 15, 2019 for revision of certain Subtitle D criteria regulations pertaining to oil and natural gas wastes, or to sign a determination that revision of the regulations is not necessary. After undertaking its review, the EPA concluded in 2019 that it does not need to regulate exploration and production waste, and specifically "drilling“drilling fluids, produced waters, and other wastes associated with the exploration, development, or production of oil, gas or geothermal energy."” The EPA concluded that states are adequately regulating exploration and production waste under the Subtitle D provisions of RCRA. However, any such change in the future could result in an increase in our, as well as the oil, natural gas and NGL exploration and production industry’s, costs to manage and dispose of wastes, which could have a material adverse effect on our results of operations and financial position. In addition, in the course of our operations, we may generate some amounts of ordinary industrial wastes, such as paint wastes, waste solvents, laboratory wastes and waste compressor oils that may be regulated as hazardous wastes if such wastes have hazardous characteristics. Although the costs of managing hazardous waste may be significant, we do not believe that our costs in this regard are materially more burdensome than those for similarly situated companies.
The Comprehensive Environmental Response, Compensation, and Liability Act (“CERCLA”), also known as the Superfund law, and comparable state laws impose joint and several liability, without regard to fault or the legality of conduct, on classes of persons who are considered to be responsible for the release of a hazardous substance into the environment. These persons include the current and former owners or operators of the site where the release occurred and anyone who disposed or arranged for the disposal of a hazardous substance released at the site. Under CERCLA, such persons may be subject to joint and several liability for the costs of cleaning up the hazardous substances that have been released into the environment, for damages to natural resources, and for the costs of certain health studies. CERCLA also authorizes the EPA and, in some instances, third parties to act in response to threats to the public health or the environment, and to seek to recover from the responsible classes of persons the costs they incur. In addition, it is not uncommon for neighboring landowners and other third parties to file claims for personal injury and property damage allegedly caused by the hazardous substances released into the environment. We may generate materials in the course of our operations that may be regulated as hazardous substances.
We currently own, lease or operate numerous properties that have been used for oil, natural gas and NGL exploration, production and processing for many years. Although we believe that we have utilized operating and waste disposal practices that were standard in the industry at the time, hazardous substances, wastes, or petroleum hydrocarbons may have been released on, under or from the properties owned or leased by us, or on, under or from other locations, including off-site locations, where such substances have been taken for treatment or disposal. In addition, some of our properties have been operated by third parties or by previous owners or operators whose treatment and disposal of hazardous substances, wastes or petroleum hydrocarbons was not under our control. These properties and the substances disposed or released on, under or from them may be subject to CERCLA, RCRA and analogous state laws. Under such laws, we could be required to undertake response or corrective measures, which could include removal of previously disposed substances and wastes, cleanup of contaminated property or performance of remedial plugging or pit closure operations to prevent future contamination, the costs of which could be substantial.
Water Discharges
The Clean Water Act (the “CWA”) and comparable state laws impose restrictions and strict controls with respect to the discharge of pollutants, including spills and leaks of hazardous substances, into state waters and waters of the United States.States (“WOTUS”). The discharge of pollutants into regulated waters is prohibited, except in accordance with the terms of a permit issued by the EPA or an analogous state agency. Spill prevention, control and countermeasure plan requirements imposed under the CWA require appropriate containment berms and similar structures to help prevent the contamination of navigable waters in the event of a petroleum hydrocarbon tank spill, rupture or leak. In addition, the CWA and analogous state laws require individual permits or coverage under general permits for discharges of storm water runoff from certain types of facilities. Federal and state regulatory agencies can impose administrative, civil and criminal penalties for noncompliance with discharge permits or other CWA requirements and analogous state laws and regulations.
The CWA also prohibits the discharge of dredge and fill material into regulated waters, including wetlands, unless authorized by permit. The EPA and the U.S. Army Corps of Engineers (the “Corps”) have issued final rules attempting to clarify the federal jurisdictional reach over Waters of the United States insince 2015 (the “WOTUS(“WOTUS rule”). However, in 2017, President Trump issued an executive order directing the EPA and the U.S. Army Corps of Engineers to review the WOTUS rule and, if the agencies’ reviews find that the rule does not meet the executive order’s goal of promoting economic growth while reducing regulatory uncertainty, to initiate a new rulemaking to repeal or revise the rule. The EPA and the U.S. Army Corps of Engineers formally repealed the WOTUS rule in September 2019. In January 2020, the Trump administration published a final replacement rule, called, including the Navigable Waters Protection Rule during the Trump administration, rules reverting back to the 1986 WOTUS definition during the Biden administration, and rules reinstating the pre-2015 definition in January 2023. However, in May 2023, the Supreme Court decided Sackett v. EPA, which sharply curtailed the EPA’s and Corps’ jurisdictional reach by limiting the types of wetlands that purportsfell under WOTUS. Sackett codified the definition of WOTUS as only “geographical features” that are described in ordinary parlance as “streams, oceans, rivers, and lakes” and to expressly define which categoriesadjacent wetlands that are “indistinguishable” from those bodies of water may be federally regulated underdue to a continuous surface connection. In September 2023, the CWA.EPA and the Corps published a direct-to-final rule redefining WOTUS to amend the January 2023 rule and align with the decision in Sackett. The final rule eliminated the “significant nexus” test from consideration
Navigable Waters Protection Rulewhen determining federal jurisdiction and clarified that the CWA only extends to relatively permanent bodies of water and wetlands that have a continuous surface connection with such bodies of water. The final rule is setcurrently subject to take effect 60 days from publication of the replacement rulechallenges in the Federal Register. Legal challenges to the Navigable Waters Protection Rule have been filed and are pending.federal district courts. As such, uncertainty remains with respect to future implementation of the rule. In addition, in an April 2020 decision defining the scope of the CWA, the U.S. Supreme Court held that, in certain cases, discharges from a point source to groundwater could fall within the scope of the CWArule and require a permit. The U.S. Supreme Court rejected assertions by the EPA and the U.S. Army Corps of Engineers that groundwater should be totally excluded from CWA jurisdiction.any resulting litigation.
The process for obtaining permits under the CWA also has the potential to impact our operations. In April 2020, the U.S. District Court for the District of Montana vacated Nationwide Permit (“NWP”) 12, the general permit issued by the U.S. Army Corps of Engineers for pipelines and utility projects. In May 2020, the court narrowed its ruling, vacating and enjoining the use of NWP 12 only as it relates to construction of new oil and gas pipelines. The U.S. Army Corps of Engineers appealed the decision to the U.S. Court of Appeals for the Ninth Circuit (“Ninth Circuit”) and the litigation is ongoing.. In July 2020, the U.S. Supreme Court stayed the lower court order except as it applies to the Keystone XL pipeline. The stay is to remain in place pending disposition of the appeal currently pending before the Ninth Circuit. In January 2021, the U.S. Army Corps of Engineers released the final version of a rule renewing twelve of its NWPs, including NWP 12. The new rule splits NWP 12 into three parts; NWP 12 will continue to be available to oil and gas pipelines, while new NWP 57 will be available for electric utility line and telecommunications activities, and a new NWP 58 will be available for utility line activities for water and other substances. The new rule also eliminates preconstruction notice requirements for NWP 12 for several conditions that used to require such notice, but also now requires new oil and gas pipeline projects that exceed 250 miles in length to give preconstruction notice and obtain approval before proceeding. As a result of the U.S. Army Corps of Engineer’s new NWP 12, the Ninth Circuit in August 2021 ruled that the appeal of the superseded NWP 12 was moot, and remanded the case back to the District Court. On March 28, 2022, the Corps published a notice announcing that it is undertaking formal review of NWP 12 and sought public comments through May 27, 2022. We cannot predict at this time whether and, if so, how the new rule will be implemented, because permits are issued by the local U.S. Army Corps of Engineers district offices. Moreover, in January 2021, the Biden administration issued an executive order directing all federal agencies to review and take action to address any federal regulations, orders, guidance documents, policies, and similar agency actions promulgated during the prior administration that may be inconsistent with the current administration’s policies. If new oil and gas pipeline projects are unable to utilize NWP 12 or identify an alternate means of CWA compliance, such projects could be significantly delayed, which could have an adverse impact on our operations.
The primary federal law related specifically to oil spill liability is the Oil Pollution Act of 1990 (the “OPA”), which amends and augments the oil spill provisions of the CWA and imposes certain duties and liabilities on certain “responsible parties” related to the prevention of oil spills and damages resulting from such spills in or threatening waters of the United StatesWOTUS or adjoining shorelines. For example, operators of certain oil and natural gas facilities must develop, implement and maintain facility response plans, conduct annual spill training for certain employees and provide varying degrees of financial assurance. Owners or operators of a facility, vessel or pipeline that is a source of an oil discharge or that poses the substantial threat of discharge is one type of “responsible party” who is liable. The OPA applies joint and several liability, without regard to fault, to each liable party for oil removal costs and a variety of public and private damages. Although defenses exist, they are limited. As such, a violation of the OPA has the potential to adversely affect our operations.
Subsurface Injections
In the course of our operations, we produce water in addition to natural gas, crude oil and NGLs. Water that is not recycled may be disposed of in disposal wells, which inject the produced water into non-producing subsurface formations. Underground injection operations are regulated pursuant to the Underground Injection Control (the “UIC”(“UIC”) program established under the federal Safe Drinking Water Act (the “SDWA”(“SDWA”) and analogous state laws. The UIC program requires permits from the EPA or an analogous state agency for the construction and operation of disposal wells, establishes minimum standards for disposal well operations, and restricts the types and quantities of fluids that may be disposed. A change in UIC disposal well regulations or the inability to obtain permits for new disposal wells in the future may affect our ability to dispose of produced water and ultimately increase the cost of our operations. For example, in response to recent seismic events near below-ground disposal wells used for the injection of natural gas- and oil-related wastewaters, federal and some state agencies have begun investigating whether such wells have caused increased seismic activity, and some states have shut down or imposed moratoria on the use of such disposal wells. In response to these concerns, regulators in some states have adopted, and other states are considering adopting, additional requirements related to seismic safety. The Railroad Commission of Texas (the “TRRC”) issued a notice to operators in the Midland area to reduce daily injection volumes following multiple earthquakes above a 3.5 magnitude over an 18-month period. The notice also required disposal well operators to provide injection data to TRRC staff to further analyze seismicity in the area. As of May 1, 2023, operators in the Midland area began to implement the Operator Response Plan for the Gardendale Seismic Response Area (“SRA”), revised August 18, 2023, to prevent the occurrence of seismic events at or above magnitude 3.5 within the Gardendale SRA. Similar response plans have been developed for other SRAs in Texas. While we cannot predict the ultimate outcome of these actions, any action that temporarily or permanently restricts the availability of disposal capacity for produced water or other fluids may increase our costs or have other adverse impacts on our operations. These seismic events have also led to an increase in tort lawsuits filed against exploration and production companies, as well as the owners of underground injection wells. Increased costs associated with the transportation and disposal of produced water, including the cost of complying with regulations concerning produced water disposal, may reduce our profitability; however, these costs are commonly incurred by all oil, natural gas and NGL producers, and we do not believe that the costs associated with the disposal of produced water will affect our operations in any way that is of material difference from those of our competitors who are similarly situated.
Air Emissions
The federal Clean Air Act (the “CAA”) and comparable state laws restrict the emission of air pollutants from many sources, such as tank batteries, through air emissions standards, construction and operating permitting programs and the imposition of
other compliance standards. These laws and regulations may require us to obtain pre-approval for the construction or modification of certain projects or facilities expected to produce or significantly increase air emissions, obtain and strictly comply with stringent air permit requirements or utilize specific equipment or technologies to control emissions of certain pollutants. The need to obtain permits has the potential to delay the development of our projects. Recently, there has been increased regulation with respect to air emissions from the oil and natural gas sector. For example, the EPA promulgated rules in 2012 under the CAA that subject oil and natural gas production, processing, transmission and storage operations to regulation under the New Source Performance Standards (“NSPS”), and a separate set of requirements to address certain hazardous air pollutants frequently associated with oil and natural gas production and processing activities pursuant to the National Emissions Standards for Hazardous Air Pollutants program. Additionally, in July 2023, the EPA issued a proposed rule to expand the scope of its Greenhouse Gas Reporting Program for certain petroleum and natural gas facilities. The proposed rule would make the reach of the program both broader and more granular, creating reporting obligations for a wider set of methane and other gas emissions events and requiring increased technical detail for certain other preexisting reporting obligations. The proposed rule indicated an intended effective date of January 1, 2025, but the final rule remains pending at this time and any final effective date thus remains uncertain.Should this rule go into effect without major changes, it could raise our costs of regulatory compliance.
In June 2016, the EPA published final rules establishing new air emission controls for methane emissions from certain new, modified or reconstructed equipment and processes in the oil and natural gas source category, including production, processing, transmission and storage activities. The EPA’s final rules include NSPS at Subpart OOOOa to limit methane emissions from equipment and processes across the oil and natural gas source category. The rules also extend limitations on volatile organic compound (“VOC”) emissions to sources that were unregulated under the previous NSPS at Subpart OOOO. Affected methane and VOC sources include hydraulically fractured (or re-fractured) oil and natural gas well completions, fugitive emissions from well sites and compressors, and pneumatic pumps. In September 2018, the EPA proposed amendments to the 2016 rules that would reduce the 2016 rules’ fugitive emissions monitoring requirements and expand exceptions to controlling methane emissions from pneumatic pumps, among other changes. Various industry and environmental groups have separately challenged both the original 2016 methane requirements and EPA’s attempt to delay the implementation of the rule. Further, in August 2019, the EPA proposed two options for rescinding the Subpart OOOOa standards. In September 2020, the EPA finalized amendments to the 2016 standards that removed the transmission and storage segment from the oil and natural gas source category and rescinded the methane-specific requirements for production and processing facilities. However, several lawsuits have been filed challenging these amendments, and the amendments may be subject to reversal under the current administration. Asas discussed above, in January 2021, the administration issued an executive order directing all federal agencies to review and take action to address any federal regulations, orders, guidance documents, policies, and similar agency actions promulgated during the prior administration that may be inconsistent with the current administration’s policies. The executive order specifically called on the EPA to consider a proposed rule suspending, revising or rescinding the September 2020 deregulatory amendments by September 2021. In response, the U.S. Congress has approved, and President Biden has signed into law, a resolution under the Congressional Review Act to repeal the September 2020 revisions to the methane standards, effectively reinstating the prior standards. In November 2021, as required by President Biden’s executive order, the EPA proposed new regulations to establish comprehensive standards of performance and emission guidelines for methane and volatile organic compound emissions from new and existing operations in the oil and gas sector, including the exploration and production, transmission, processing, and storage segments. The EPA announced a final rule on December 2, 2023, which, among other things, requires the phase out of routine flaring of natural gas from new oil wells and routine leak monitoring at all well sites and compressor stations. Notably, the EPA updated the applicability date for Subparts OOOOb and OOOOc to December 6, 2022, meaning that sources constructed prior to that date will be considered existing sources with later compliance dates under state plans. The final rule gives states, along with federal tribes that wish to regulate existing sources, two years to develop and submit their plans for reducing methane from existing sources. The final emissions guidelines under Subpart OOOOc provide three years from the plan submission deadline for existing sources to comply. The regulations are subject to legal challenge and will also need to be incorporated into the states’ implementation plans, which will need to be approved by the EPA in individual rulemakings that could also be subject to legal challenge. As a result, future implementation of the standards is uncertain at this time.
The Bureau of Land Management (the “BLM”) also finalized rules (the “BLM methane rule”) in November 2016 that seek to limit methane emissions from exploration and production activities on federal lands by imposing limitations on venting and flaring of natural gas, as well as requirements for the implementation of leak detection and repair programs for certain processes and equipment. After attempts by the Trump administration to delay implementation of the BLM methane rule, and legal challenges both to the BLM methane rule and the delays, the BLM issued a final rule in September 2018 rescinding many of the provisions of the 2016 BLM methane rule, including the requirement to implement leak detection and repair programs, and imposing certain new requirements in a manner the BLM considered would reduce unnecessary compliance obligations on the industry. In July 2020November 2022, the BLM issued a proposed rule to reduce the waste of natural gas from venting, flaring, and leaks during oil and gas production activities on federal district courtand American Indian leases. The comment period for this rule has closed and the rule is in California vacated the 2018 rescission rule. BLM filed a noticeprocess of appeal tobeing finalized. We cannot predict the U.S. Courtscope of Appeals for the Ninth Circuit; however, the federal district courtany resulting legislation or new regulations, which may, in California entered a final judgment vacating the September 2018 rescission rule in October 2020.turn, affect our business.
The EPA also finalized separate rules under the CAA in June 2016 regarding criteria for aggregating multiple sites into a single source for air-quality permitting purposes applicable to the oil and natural gas industry. This rule could cause small facilities (such as tank batteries), on an aggregate basis, to be deemed a major source, thereby triggering more stringent air permitting requirements, which in turn could result in operational delays or require us to install costly pollution control equipment. In addition, in October 2015, the EPA issued a final rule under the CAA lowering the National Ambient Air Quality Standards for ground-level ozone from the current standard of 75 parts per billion (“ppb”) for the current 8-hour primary and secondary ozone standards to 70 ppb for both standards. The final rule became effective on December 28, 2015. The EPA issued its anticipated area designations in November and December 2017. In December 2020, the EPA announced its intention to leave the ozone NAAQS unchanged at 70 ppb rather than lower them further. However,In October 2021, the EPA announced it will reconsider its December 2020 decision; however, in August 2023, the EPA announced a new review of the ozone NAAQS after considering advice provided by the Clean Air Scientific Advisory Committee (“CASAC”). As part of its new review, the EPA is seeking information from the scientific community and the public to guide CASAC’s development of the Integrated Science Assessment prior to the EPA’s expected release of its Integrated Review Plan in the fall of 2024. If the EPA were to adopt more stringent NAAQS for ground-level ozone as discussed above, that action could be subject to reversal followingpart of its reconsideration of the administration’s January 2021 executive order.December 2020 decision, States are expected to implement more stringent permitting and pollution control requirements as a result of this new final rule, which could apply to our operations. In addition, in November 2021, the EPA revised the 2015 ozone NAAQS designations, which expanded a New Mexico non-attainment area to include parts of El Paso County, Texas and designated Weld County, Colorado as a non-attainment area. The EPA’s designation of El Paso County was vacated as impermissibly retroactive in June 2023 by the D.C. Circuit Court of Appeals, but the designation of Weld County was upheld. In 2017, the EPA designated certain counties in southeastern New Mexico and West Texas located in the Permian Basin attainment/unclassifiable for the 2015 ozone NAAQS. In June 2022, the EPA announced that it is considering a discretionary redesignation for these counties based on current monitoring data and other air quality factors. If in the future, the areas in which we operate were redesignated as nonattainment areas, this could subject us to increased regulatory burdens in the form of more stringent emission controls, emission offset requirements and increased permitting delays and costs.
Compliance with one or more of these and other air pollution control and permitting requirements and rules has the potential to delay the development of natural gas, oil and NGL projects and increase our costs of development and production, which costs could be significant.
Regulation of GHG Emissions
In response to findings that emissions of carbon dioxide, methane and other greenhouse gases (“GHGs”)GHGs endanger public health and the environment, the EPA has adopted regulations under existing provisions of the CAA that, among other things, establish Prevention of Significant Deterioration (“PSD”) preconstruction and Title V operating permit reviews for certain large
stationary sources that are already potential major sources of certain principal, or criteria, pollutant emissions. Facilities required to obtain PSD permits for their GHG emissions will also be required to meet “best available control technology” standards that will typically be established by state agencies. In addition, the EPA has adopted rules requiring the monitoring and annual reporting of GHG emissions from large GHG emission sources in the United States, including certain onshore and offshore natural gas, oil and NGL production sources, which include certain of our operations. As discussed above, federal regulatory action regarding GHG emissions from the oil and gas sector has focused on methane emissions; however, federal implementation of the finalized 2016 methane rule is uncertain at this time (as also discussed above).
While Congress has, from time to time, considered legislation to reduce emissions of GHGs, no significant legislation has been adopted at the federal level. In the absence of such federal climate legislation, a number of state and regional cap-and-trade programs have emerged that typically require major sources of GHG emissions to acquire and surrender emission allowances in return for emitting those GHGs. The SEC issued a proposed rule in March 2022 that would mandate extensive disclosure of climate-related data, risks, and opportunities, including financial impacts, physical and transition risks, related governance and strategy, and GHG emissions, for certain public companies. The SEC originally planned to issue a final rule by October 2022, but according to the SEC’s updated rulemaking agenda, a final rule is now expected to be issued in the spring of 2024. In addition, the United States is one of almost 200 nations that, in December 2015, agreed to theNations-sponsored Paris Agreement an international climate change agreement in Paris, France that calls for countries to set their own GHG emissions targets and be transparent about the measures each country will take to achieve its GHG emissions targets. The Paris Agreement entered into force on November 4, 2016 upon achieving its threshold for ratification by signatory countries. A long-term goal of the Paris Agreement is to limit global warming to below two degrees Celsius by 2100 from temperatures in the pre-industrial era. However, the Paris Agreement does not impose any binding obligations on its participants. In November 2019,President Biden has recommitted the Trump administration initiated the formal process for withdrawing fromUnited States to the Paris Agreement and, in April 2021, announced a goal of reducing the United States’ emissions by 50-52% below 2005 levels by 2030. In November 2021, the international community gathered again in Glasgow at the 26th Conference to the Parties on the UN Framework Convention on Climate Change (“COP26”), during which resultedmultiple announcements were made, including a call for parties to eliminate certain fossil fuel subsidies and pursue further action on non-carbon dioxide GHGs. Relatedly, the United States and European Union jointly announced the launch of the “Global Methane Pledge,” which aims to cut global methane pollution at least 30% by 2030 relative to 2020 levels, including “all feasible reductions” in anthe energy sector. These goals were reaffirmed in November 2022 at the 27th Conference of the Parties (“COP27”) in Sharm-El Sheik. While there were limited announcements at COP27 with respect to the reduction of fossil fuel use, there were negotiations on emissions reduction targets and reduction of fossil fuel use amongst
the international community, and such discussions continued at the 28th Conference of the Parties (“COP28”) in Dubai. In addition, the Inflation Reduction Act of 2022 (“IRA”), signed by President Biden in August 2022, provides significant funding and incentives for research and development of low-carbon energy production methods, carbon capture, and other programs directed at addressing climate change. The IRA also includes a methane emissions reduction program that amends the Clean Air Act to include a Methane Emissions and Waste Reduction Incentive Program for petroleum and natural gas systems. This program requires the EPA to impose a “waste emissions charge” on certain natural gas and oil sources that are already required to report under EPA’s Greenhouse Gas Reporting Program. The EPA recently issued a proposed rule to implement the waste emissions charge with a proposed effective exit date of November 2020. However, in its January 2021 executive order, the Biden administration initiated the process2025 for rejoining the Paris Agreement.reporting year 2024 emissions.
TheAn executive order also established an Interagency Working Group on the Social Cost of Greenhouse Gases (“Working Group”), which is called on to, among other things, develop methodologies for calculating the “social cost of carbon,” “social cost of nitrous oxide,” and “social cost of methane.” Final recommendations fromThe EPA published a final report in December 2023 with the Working Group are due no later than January 2022.social cost of carbon at $190 per metric ton of carbon dioxide emitted in 2020 at a 2% discount rate. That figure is intended to be used to guide federal decisions on the costs and benefits of various policies and approvals, although such efforts have been the subject of a series of judicial challenges. A separate executive order targeting climate change, also issued by the current administration in January 2021, directed the Secretary of the Interior to pause new oil and natural gas leasing on public lands and in offshore waters pending completion of a comprehensive review of the federal permitting and leasing practices, consider whether to adjust royalties associated with coal, oil, and gas resources extracted from public lands and offshore waters, or take other appropriate actions to account for corresponding climate costs. The climate change executive order also directed the federal government to identify “fossil fuel subsidies” to take steps to ensure that, to the extent consistent with applicable law, federal funding is not directly subsidizing fossil fuels. Legal challenges to the executive orders have been filed. A federal district court issued a preliminary injunction against the order in June 2021, which the Fifth U.S. Circuit Court of Appeals vacated and remanded back to the district court in August 2022. The federal district court subsequently issued a permanent injunction against the order in August 2022 limited to the thirteen Plaintiff states, which included Louisiana, Alabama, Alaska, Arkansas, Georgia, Mississippi, Missouri, Montana, Nebraska, Oklahoma, Texas, Utah, and West Virginia. We cannot predict the scope of any resulting legislation or new regulations, which may, in turn, affect our business.
Although it is not possible at this time to predict how new laws or regulations that may be adopted or issued to address GHG emissions would impact our business, any such future laws, regulations or legal requirements imposing reporting or permitting obligations on, or limiting emissions of GHGs from, our equipment and operations could require us to incur costs to reduce emissions of GHGs associated with our operations, as well as delay or restrict our ability to permit GHG emissions from new or modified sources. In addition, substantial limitations on GHG emissions could adversely affect demand for the natural gas, oil and NGLs we produce and lower the value of our reserves. Finally, it should be noted that increasing concentrations of GHGs in the Earth’s atmosphere may produce climate changes that have significant physical effects, such as increased frequency and severity of storms, floods, droughts and other extreme climatic events; if any such effects were to occur, they could have an adverse effect on our exploration and production operations.
Hydraulic Fracturing Activities
Hydraulic fracturing is an important and common practice that is used to stimulate production of oil, natural gas and NGLs from dense subsurface rock formations. We regularly use hydraulic fracturing as part of our operations. Hydraulic fracturing is typically regulated by state oil and natural gas commissions. However, several federal agencies have asserted regulatory authority over certain aspects of the process. For example, the EPA published final CAA regulations in 2012 and, more recently, in June 2016, establishing performance standards, including standards for the capture of air emissions released during oil and natural gas hydraulic fracturing, leak detection, and permitting (which are subject to revision, as discussed above); published in June 2016 an effluent limitation guideline final rule prohibiting the discharge of wastewater from onshore unconventional oil and natural gas extraction facilities to publicly owned wastewater treatment plants; and issued in 2014 a prepublication version of itsan Advance Notice of Proposed Rulemaking regarding Toxic Substances Control Act (“TSCA”) reporting of the chemical substances and mixtures used in hydraulic fracturing. Also, in March 2015,In November 2022, the BLM adopted rules establishing stringent standards relatingalso issued a proposed rule to hydraulic fracturingreduce the waste of natural gas from venting, flaring, and leaks during oil and gas production activities on federal and American Indian lands. In June 2016, a federal district court judge in Wyoming struck down this final rule, finding that the BLM lacked authority to promulgate the rule. That ruling was appealed, but in September 2017 the U.S. Court of Appeals for the Tenth Circuit dismissed the appeal and remanded with directions to vacate the lower court’s opinion, leaving the final rule in place. However, following the issuance of an executive order by President Trump to review rules related to the energy industry, the BLM initiated a rulemaking to rescind the final rule in December 2017. Shortly after the final rulemaking was issued, the state of California and several environmental groups filed lawsuits against the BLM, the Secretary of the Interior, and the Assistant Secretary for Land and Minerals Management, seeking an injunction and a declaration that the
repeal violated numerous federal statutes. After the suits were filed, multiple industry groups and the state of Wyoming sought to intervene and transfer the case to federal court in Wyoming, which decided the initial legal challenge to the Obama administration’s fracking regulations. A hearing was held in January 2020 to consider a motion for summary judgment in the case, and in March 2020, the court granted BLM’s motion for summary judgment, upholding the agency’s decision to rescind the hydraulic fracturing regulations finalized in the 2015 rule.leases. Also, in December 2016, the EPA released its final report on the potential impacts of hydraulic fracturing on drinking water resources. The final report concluded that “water cycle” activities associated with hydraulic fracturing may impact drinking water resources “under certain limited circumstances.” To date, EPA has taken no further action in response to the December 2016 report.
From time to time, legislation has been introduced, but not enacted, in Congress to provide for federal regulation of hydraulic fracturing and to require disclosure of the chemicals used in the fracturing process. Meanwhile, the regulation of hydraulic fracturing has continued at the state level. For example, Wyoming has promulgated rules related to the public disclosure of substances used in hydraulic fluid, testing requirements for water wells near drilling sites and leak detection and repair requirements for fugitive emissions from oil and gas production facilities.
In the event that a new, federal level of legal restrictions relating to the hydraulic fracturing process is adopted in areas where we operate, we may incur additional costs to comply with such federal requirements that may be significant in nature, and also
could become subject to additional permitting requirements and experience added delays or curtailment in the pursuit of exploration, development, or production activities.
Activities on Federal Lands and State Lands
Oil and natural gas exploration, development and production activities on federal lands, including American Indian lands and lands administered by the BLM, are frequently subject to permitting delays. Operations on these lands are also subject to the National Environmental Policy Act (“NEPA”). NEPA requires federal agencies, including the BLM, to evaluate major actions having the potential to significantly impact the environment. In the course of such evaluations, an agency will prepare an Environmental Assessment that assesses the potential direct, indirect and cumulative impacts of a proposed project and, if necessary, will prepare a more detailed Environmental Impact Statement that may be made available for public review and comment. In January 2020, the White House Council on Environmental Quality (“CEQ”) proposed changes to NEPA regulations designed to overhaul the system and speed up federal agencies’ approval of projects. Among other things, the rule proposes to narrow the definition of “effects” to exclude the terms “direct,” “indirect,” and “cumulative” and redefine the term to be “reasonably foreseeable” and having “a reasonably close causal relationship to the proposed action or alternatives.” In July 2020, CEQ issued a final rule implementing the January 2020 proposal. SuchHowever, several states and environmental groups have filed challenges to this rulemaking, and CEQ’s amendments are subject to reconsideration and may be subject to reversal or change under the Biden administration. CEQ issued an Interim Final Rule in June 2021, which extended the deadline by two years (to September 14, 2023) for federal agencies to develop or update their NEPA implementing procedures to conform to the CEQ regulations. Additionally, in October 2021, the CEQ issued a notice of proposed rulemaking to reintroduce certain requirements removed or reduced by the July 2020 amendments, and the Infrastructure and Investment Jobs Act, Pub.L. 117-58, signed into law in November 2021, codified some of the July 2020 amendments in statutory text. These amendments must be implemented into each agency’s implementing regulations, and each of those individual rulemakings could be subject to legal challenge. In April 2022, CEQ issued the Phase 1 Final Rule. The rule finalizes a narrow set of changes to generally restore regulatory provisions that were in effect for decades before the 2020 rule modified them for the first time. In June 2023, the Fiscal Responsibility Act was signed into law by President Biden, which also included reforms to the National Environmental Policy Act. In July 2023, the CEQ issued the proposed Phase 2 Rule. The impact of changes to the NEPA regulations if they survive review following the January 2021 executive order,and statutory text therefore remains uncertain and could have an effect on our operations and our ability to obtain governmental permits. We currently have exploration, development and production activities on federal lands. Our proposed exploration, development and production activities are expected to include leasing of federal mineral interests, which will require the acquisition of governmental permits or authorizations that are subject to the requirements of NEPA. This process has the potential to delay or limit, or increase the cost of, the development of natural gas, oil and NGL projects. Authorizations under NEPA are also subject to protest, appeal or litigation, any or all of which may delay or halt projects. Moreover, depending on the mitigation strategies recommended in the Environmental Assessments or Environmental Impact Statements, we could incur added costs, which may be substantial. However, any such adverse regulatory developments are expected to have no more than a minimal impact on our results, given our limited exposure of leases on federal lands.
In addition, the New Mexico state legislature recentlyin 2019 considered House Bill 206, which, if passed, would have enacted an Environmental Review Act comparable to NEPA. Specifically, the Environmental Review Act would require state governmental agencies at all levels to consider the qualitative, technical and economic factors relating to a project that may impact public health, ecosystems and the environment, the long-term as well as short-term benefits and costs of the proposed project, the cumulative impacts of the proposed project, and reasonable alternatives to proposed actions affecting the environment, communities or public health. If reconsidered and enacted in the future, the process contemplated by the Environmental Review Act has the potential, like NEPA, to delay or limit, or increase the cost of, the development of natural gas, oil and NGL projects in New Mexico, which costs could be substantial.
ESA and Migratory Birds
The federal Endangered Species Act (“ESA”) and comparable state laws were established to protect endangered and threatened species. Pursuant to the ESA, if a species is listed as threatened or endangered, restrictions may be imposed on activities adversely affecting that species’ habitat. Similar protections are offered to migratory birds under the Migratory Bird Treaty Act. We may conduct operations on oil and natural gas leases in areas where certain species that are listed as threatened or endangered are known to exist and where other species that potentially could be listed as threatened or endangered under the ESA may exist. Moreover, as a result of a 2011 settlement agreement, the U.S. Fish and Wildlife Service (the “FWS”) was required to make a determination on listing of numerous species as endangered or threatened under the ESA by no later than completion of the agency’s 2017 fiscal year. The FWS did not meet that deadline. In August 2020, the FWS and the National Marine Fisheries Service issued three rules amending the implementation of the ESA regulations, among other things revising the process for listing species and designating critical habitat. A coalition of states and environmental groups has challenged the three rules and the litigation remains pending. However, the Biden administration published two rules in October 2021 that reversed changes made by the Trump administration, namely to the definition of “habitat” and to a policy that made it easier to exclude territory from critical habitat under the ESA. In June and July 2022, the FWS issued final rules rescinding Trump-era regulations concerning the definition of “habitat” and critical habitat exclusions. In June 2023, the Biden administration announced additional proposed revisions concerning the procedures and criteria used for listing, reclassifying, and delisting protected species and
designating critical habitat. It is possible those developments could, in the litigation remains pending. Iffuture, affect our operations if the areas in which we were to have a portion of our leasesoperate are designated as critical or suitable habitat, it could adversely impact the value of our leases.habitat.
In addition, the federal government recently has issued indictments under the Migratory Bird Treaty Act (“MBTA”) to several oil and natural gas companies after migratory birds were found dead near reserve pits associated with drilling activities. The Department of the Interior issued an opinion in December 2017 that would narrow certain protections afforded to migratory birds pursuant to the MBTA. In response to this opinion, two separate lawsuits were filed in May 2018 in the U.S. District Court for the Southern District of New York challenging the Department of the Interior’s interpretation of the MBTA. In September 2018, eight states filed a similar suit in the U.S. District Court for the Southern District of New York. The litigation is ongoing. In February 2020, the FWS published a rule seeking to codify the December 2017 legal opinion. The FWS issuedIn August 2020, the District Court struck down the December 2017 opinion, and the Department of the Interior responded by issuing a draftnew rule in January 2021 which was set to take effect in February 2021. However, in response tothat reduced the activities that could incur liability under the MBTA. The Biden administration has since revoked the January 2021 executive order directing federal agenciesrule; published an Advanced Notice of Proposed Rulemaking announcing an intent to review actions taken bysolicit comments to help develop proposed regulations establishing a permitting system to authorize, under certain circumstances, the prior administration, FWS has delayed implementationincidental take of migratory birds; and issued a Director’s Order “establishing criteria for the final rule by 30 days and opened the ruletypes of conduct that will be a priority for additional public comment.enforcement activities with respect to incidental take of migratory birds.” The identification or designation of previously unprotected species as threatened or endangered in areas where underlying property operations are conducted could cause us to incur increased costs arising from species protection measures, time delays or limitations on our exploration and production activities, which could have an adverse impact on our ability to develop and produce reserves. If we were to have a portion of our leases designated as critical or suitable habitat, it could adversely impact the value of our leases.
OSHA
We are subject to the requirements of the Occupational Safety and Health Act (“OSHA”) and comparable state statutes whose purpose is to protect the health and safety of workers. In addition, OSHA’s hazard communication standard, the Emergency Planning and Community Right-to-Know Act, comparable state statutes and any implementing regulations require that we organize and/or disclose information about hazardous materials used or produced in our operations and that this information be provided to employees, state and local governmental authorities and citizens.
Related Permits and Authorizations
Many environmental laws require us to obtain permits or other authorizations from state and/or federal agencies before initiating certain drilling, construction, production, operation or other activities and to maintain these permits and compliance with their requirements for ongoing operations. These permits are generally subject to protest, appeal or litigation, which can in certain cases delay or halt projects and cease production or operation of wells, pipelines and other operations.
Related Insurance
We maintain insurance against some risks associated with above or underground contamination that may occur as a result of our development activities. However, this insurance is limited to activities at the well site and there can be no assurance that this insurance will continue to be commercially available or that this insurance will be available at premium levels that justify its purchase by us. The occurrence of a significant event that is not fully insured or indemnified against could have a materially adverse effect on our financial condition and operations.
Human Capital Resources
We aim to attract topand retain top-tier talent in the oil and gas sector and empower our employees to be innovators in our industry. As of December 31, 2020,2023, we had 151 full-time461 total employees. In addition, we hire independent contractors on an as needed basis but have no collective bargaining or employment agreements with our employees.
We believe that our employees give us a sustainable competitive advantage, and we understand the need to attract, retain and train the best team possible. We provide fair and competitive wages to assist in retention of our top talent, and our compensation programs are integrated with our overall business strategies to incentivize performance and maximize shareholder returns. In addition, we conduct an equitable pay analysis at least annually to ensure that we are adequately and fairly compensating all employees based on their experience and performance. We offer a variety of programs that are designed to retain our employees and also provide opportunities to grow their professional careers while continuing to deliver value to the company. Additionally, we havemaintain a comprehensive suite of benefits that providesprovide our employees with various programs to meet their different needsoptions including retirement, health and wellness, and life and disability plans.
We are committed to a diverse workforce because we believe employees with different backgrounds, experiences, interests and skillsets drive superior results. In terms of gender and racial distribution, approximately 38%31% of our employees identify as female and approximately 24%32% of our employees identify as non-white. We plan to continue to recruit and develop a diverse workforce to ensure that we remain an employer of choice delivering top-tier results.
We strive to promote a safe and healthy working environment with a focus on protecting our employees, contractors, the public and the environment in the communities in which we conduct our business. We provide frequent trainings and monthly safety meetings for all field employees and have excelled in health, safety and environmental performance maintaining zero employee recordable incidents due to illnesses or injuries at the workplace.
Offices
Our principal executive offices are located at 1001 Seventeenth300 N. Marienfeld Street, Suite 1800, Denver, Colorado 80202,1000, Midland, Texas, 79701, and our telephone number is (720) 499-1400.(432) 695-4222. We also have office space in Midland,Carlsbad, New Mexico; Denver, Colorado; Eunice, New Mexico; Gardendale, Texas; Sugar Land,Greenwood, Texas; Pecos, Texas; San Angelo, Texas; and Jal, New Mexico.Woodlands, Texas.
Available Information
Our internet website address is www.cdevinc.com.www.permianres.com. We routinely post important information for investors on our website. Within our website’s investor relations section, we make available free of charge our annual reports on Form 10-K, quarterly reports on Form 10-Q, current reports on Form 8-K, and amendments to those reports filed with or furnished to the SEC under applicable securities laws. These materials are made available as soon as reasonably practical after we electronically file such materials with or furnish such materials to the SEC. Information on our website is not incorporated by reference into this Annual Report and should not be considered part of this document.
The SEC maintains a website that contains reports, proxy and information statements and other information regarding issuers that file electronically with the SEC at www.sec.gov.
ITEM 1A. RISK FACTORS
You should carefully consider the following risk factors together with all of the other information included in this Annual Report and our other reports filed with the SEC before investing in our securities. The occurrence of one or more of these risks could materially and adversely affect our business, our financial condition, and the results of our operations, which in turn could negatively impact the value of our securities.
Risks Related to Commodity Prices
The COVID-19 pandemic and related governmental actions have and may continue to lead to an imbalance in expected supply and demand of oil and natural gas, which could negatively impact commodity prices and therefore our business, financial condition and results of operations.
The COVID-19 pandemic and various governmental actions taken to mitigate the impact of COVID-19 resulted in an unprecedented decline in demand for oil, natural gas and NGLs starting in 2020. The impact was exacerbated by Saudi Arabia significantly reducing export prices and increasing oil production in March 2020. As a result, there was a significant decline in commodity prices starting at the end of the first quarter of 2020. These commodity prices remained depressed for the remainder of 2020 as compared to average commodity prices over the last few years.
In late 2020 and early 2021, commitments made by the OPEC and other oil producing countries to reduce their crude oil production, taken together with U.S. producers substantially reducing drilling and producing activities, resulted in higher commodity prices, but commodity prices remain volatile. The remaining uncertainty around COVID-19, the efficacy of and timeframe for vaccinations, the emergence and spread of new strains of the virus, renewed actions by governments to combat the spread of the virus, including stay-at-home mandates and recommendations and general restrictions on travel, and other lingering risks and concerns relating to COVID-19, combined together, continue to impact actual and expected demand for oil and natural gas. To the extent oil producers fail to implement or sustain production cuts or take other actions that are sufficient to balance oil, natural gas and NGLs supply with expected demand, the excess supply could lead to a resurgence of commodity price declines. As the vast majority of our revenue and cash flow is generated from the sale of oil, natural gas and NGLs, lower commodity prices resulting from COVID-19 factors could materially and adversely affect our future business, financial condition and results of operations.
Commodity prices are volatile, and a sustained period of low commodity prices for oil, natural gas and NGLs could adversely affect our business, financial condition and results of operations.
The prices we receive for our oil, natural gas and NGLs heavily influence our revenue, cash flows, profitability, access to capital, future rate of growth and carrying value of our properties. Oil, natural gas and NGLs are commodities, and their prices may fluctuate widely in response to relatively minor changes in the actual and expected supply of and demand for oil, natural gas and NGLs and market uncertainty. In addition to the influence of the COVID-19 pandemic and related governmental actions, discussed above,Historically, oil, natural gas and NGL prices have historically been volatile and subject to fluctuations relating to a variety of additional factors that are beyond our control, including:
•worldwide and regional economic conditions impacting the global supply of and demand for oil, natural gas and NGLs;
•the price and quantity of foreign imports of oil, natural gas and NGLs;
•political and economic conditions in or affecting other producing regions or countries, including the Middle East, Russia, Eastern Europe, Africa and South America and Russia;America;
•actions of OPEC, its members and other state-controlled oil companies relating to oil price and production controls;
•actions of U.S., European Union and other governments and governmental organizations relating to Russia’s oil, natural gas and NGLs, including through sanctions, import restrictions and commodity price caps;
•actions of U.S. producers, and independent producers operating in other countries, relating to production levels;
•political, economic and other conditions that affect perceived or actual demand for oil, natural gas and NGLs, including international trade tensions between the U.S. and other countriesdisputes, sanctions and global health pandemics, epidemics and concerns;
•the level of global exploration, development, production, and inventories;
•actions of U.S. and other governments to strategically release oil, natural gas and NGLs from strategic reserves;
•the availability of refining and storage capacity;
•prevailing prices on local price indexes in the area in which we operate;
•the proximity, capacity, cost and availability of gathering and transportation facilities;
•the availability of refining and storage capacity;
•the cost of exploring for, developing, producing and transporting reserves;
•weather conditions and other natural disasters;
•terrorist attacks targeting oil and natural gas related facilities and infrastructure;
•technological advances affecting fuel economy, energy supply and energy consumption;
•the effect of energy conservation measures, alternative fuel requirements and the price and availability of alternative fuels;
•laws, regulations and taxes in the U.S. and in foreign jurisdictions that impact the demand for oil, natural gas and NGLs;
•shareholder activism or activities by non-governmental organizations to restrict the exploration and production of oil and natural gas so as to minimize emissions of carbon dioxide and methane GHGs or otherwise;
•localized and global supply and demand fundamentals; and
•expectations about future commodity prices.
These factors and the volatility of the energy markets make it extremely difficult to predict future oil, natural gas and NGL price movements with any certainty. From 2016 through 2020, the WTI spot price for oil averaged $51.21 per Bbl, which is down substantially from the $85.82 average for the prior five-year period. The Henry Hub average spot price from 2016 through 2020 of $2.65 per MMBtu similarly declined from $3.49 per MMBtu, which was the average for the prior five-year period. The commodity prices displayed even more dramatic volatility in 2020, during which the WTI spot price for oil briefly fell to a low of negative $37.63 per barrel on April 20, 2020 and the Henry Hub spot price reached a low of $1.33 on September 21, 2020. During these periods, NGLs, which are made up of ethane, propane, isobutene, normal butane and natural gasoline, all of which have different uses and different pricing characteristics, have suffered significant recent price declines.
A sustained or further extended decline in commodity prices may result in a shortfall in our expected revenues and cash flows and require us to reduce capital spending or borrow funds to cover any such shortfall. If we are unable to obtain needed capital or financing on satisfactory terms, our ability to develop future reserves could be adversely affected. Also, using lower prices in estimating proved reserves may result in a reduction in proved reserve volumes due to economic limits. In addition, sustained periods of low commodity prices for oil and natural gas and the resultant effect such prices may have on our drilling economics and our ability to raise capital may require us to re-evaluate and postpone, moderate or eliminate our planned drilling and completions operations, or suspend production from current wells, which could result in the reduction of our expected production
and some of our proved undeveloped reserves and related standardized measure. If we moderate or curtail our drilling, completion or production operations, we may be unable to continue to hold leases that are scheduled to expire, which may further reduce our reserves. As a result, a sustained or further extended decline in commodity prices may materially and adversely affect our future business, financial condition, results of operations, liquidity and ability to finance planned capital expenditures.
If commodity prices decrease to a level such that our future undiscounted cash flows from our properties are less than their carrying value, we may be required to take write-downs of the carrying values of our properties.
Accounting guidance requires that we periodically review the carrying value of our properties for possible impairment. Based on prevailing commodity prices and specific market factors and circumstances at the time of prospective impairment reviews, and the continuing evaluation of development plans, production data, economics and other factors, we may be required to write-down the carrying value of our properties. A write-down constitutes a non-cash charge to earnings. In 2020, we recognized an impairment of $591.8 million because of the depressed oil and natural gas commodity prices at the time we conducted the impairment analysis in the first quarter. While commodity prices improved in the subsequent quarters of 2020 and we did not recognize any further impairments directly relating to prevailing commodity prices, aA sustained or further extended decline in commodity prices in the future could result in additionalrequire that we recognize impairments of our properties, which could have a material adverse effect on our results of operations for the periods in which such charges are taken.
Risks Related to Our Reserves, Leases and Drilling Locations
Reserve estimates depend on many assumptions that may turn out to be inaccurate. Any material inaccuracies in reserve estimates or underlying assumptions will materially affect the quantities and present value of our reserves.
The process of estimating oil and natural gas reserves is complex. In order to prepare reserve estimates, we must project production rates and timing of development expenditures. We must also analyze available geological, geophysical, seismic, production and engineering data. The extent, quality and reliability of this data can vary. The process also requires economic assumptions about matters such as commodity prices, drilling and operating expenses, capital expenditures, taxes and availability of funds. Any significant inaccuracies in our interpretations of this technical data or in making our assumptions could materially affect the estimated quantities and present value of our reserves.
Actual future production, commodity prices, revenues, taxes, development expenditures, operating expenses and quantities of recoverable oil and natural gas reserves may vary from our estimates. For instance, initial production rates reported by us or other operators may not be indicative of future or long-term production rates, our recovery efficiencies may be worse than expected, and production declines may be greater than our estimates and may be more rapid and irregular when compared to initial production rates. In addition, we may adjust reserve estimates to reflect additional production history, results of development activities, current commodity prices and other existing factors. Any significant variance could materially affect the estimated quantities and present value of our reserves.
You should not assume that the present value of future net revenues from our reserves is the current market value of our estimated reserves. We generally base the estimated discounted future net cash flows from reserves on prices and costs on the date
of the estimate. Actual future prices and costs may differ materially from those used in the present value estimate. Our estimated proved reserves as of December 31, 2020,2023, and related standardized measure were calculated under rules of the SEC using twelve-month trailing average benchmark prices of $36.04$74.70 per barrel of oil (WTI Posted) and $1.99$2.64 per MMBtu (Henry Hub spot), which may be substantially higher or lower than the available spot prices in 2021.2023. For example, if the crude oil and natural gas prices used in our year-end reserve estimates were to increase or decrease by 10%, our proved reserve quantities at December 31, 20202023 would increase by 4.514.4 MMBoe (2%(1.6%) or decrease by 24.318.2 MMBoe (8%(2.0%), respectively, and the pre-tax PV10%PV 10% of our proved reserves would increase by $334.5 million (28%) or decrease by $327.7 million (28%$1.9 billion (17%), respectively.
Our use of seismic data is subject to interpretation and may not accurately identify the presence of oil and natural gas, which could adversely affect the results of our drilling operations.
Even when properly used and interpreted, seismic data and visualization techniques are only tools used to assist geoscientists in identifying subsurface structures and hydrocarbon indicators and do not enable the interpreter to know whether hydrocarbons are, in fact, present in those structures. As a result, our drilling activities may not be successful or economical. In addition, the use of advanced technologies, such as 3-D seismic data, requires greater pre-drilling expenditures than traditional drilling strategies, and we could incur losses as a result of such expenditures..
Unless we replace our reserves with new reserves and develop those reserves, our reserves and production will decline, which would adversely affect our future cash flows and results of operations.
Producing oil and natural gas reservoirs generally are characterized by declining production rates that vary depending upon reservoir characteristics and other factors. Unless we conduct successful ongoing exploration and development activities or continually acquire properties containing proved reserves, our proved reserves will decline as those reserves are produced. Our future reserves and production, and therefore our future cash flows and results of operations, are highly dependent on our success in efficiently developing our current reserves and economically finding or acquiring additional recoverable reserves. We may not be able to develop, find or acquire sufficient additional reserves to replace our current and future production, particularly because competition in the oil and natural gas industry is intense, and many of our competitors possess and employ financial, technical and personnel resources substantially greater than ours. If we are unable to replace our current and future production, the value of our reserves will decrease, and our business, financial condition and results of operations would be materially and adversely affected.
Our use of seismic data is subject to interpretation and may not accurately identify the presence of oil and natural gas, which could adversely affect the results of our drilling operations.
Even when properly used and interpreted, seismic data and visualization techniques are only tools used to assist geoscientists in identifying subsurface structures and hydrocarbon indicators and do not enable the interpreter to know whether hydrocarbons are, in fact, present in those structures. As a result, our drilling activities may not be successful or economical. In addition, the use of advanced technologies, such as 3-D seismic data, requires greater pre-drilling expenditures than traditional drilling strategies, and we could incur losses as a result of such expenditures.
The development of our estimated PUDs may take longer and may require higher levels of capital expenditures than we currently anticipate. Therefore, our estimated PUDs may not be ultimately developed or produced.
As of December 31, 2020, 50%2023, 24% of our total estimated proved reserves were classified as proved undeveloped. Development of these proved undeveloped reserves may take longer and require higher levels of capital expenditures than we currently anticipate. Delays in the development of our reserves, increases in costs to drill and develop such reserves or decreases in commodity prices will reduce the value of our estimated PUDs and future net revenues estimated for such reserves and may result in some projects becoming uneconomic. In addition, delays in the development of reserves could cause us to have to reclassify our PUDs as unproved reserves. Further, we may be required to write-down our PUDs if we do not drill those wells within five years after their respective dates of booking.
Certain of our undeveloped leasehold acreage is subject to leases that will expire over the next several years unless production is established on units containing the acreage, the primary term is extended through continuous drilling provisions or the leases are renewed.
As of December 31, 2020,2023, over 88%96% of our total net acreage was held by production. The leases for our net acreage not held by production will expire at the end of their primary term unless production is established in paying quantities under the units containing these leases, the leases are held beyond their primary terms under continuous drilling provisions or the leases are renewed. Some of our leases also expire as to certain depths if continuous drilling obligations are not met. If our leases expire in whole or in part and we are unable to renew the leases, we will lose the right to develop the related properties. Our ability to drill and develop these locations depends on a number of uncertainties, including commodity prices, the availability and cost of capital, drilling and production costs, availability of drilling services and equipment, drilling results, lease expirations, gathering system and pipeline transportation constraints, access to and availability of water sourcing and distribution systems, regulatory approvals and other factors.
In 2020, given the weakness in realized oil prices at the end of the first quarter, we voluntarily shut-in a portion of our second quarter 2020 production volumes. In the future, we may again shut-in some or all of our production depending on market conditions, storage or transportation constraints and contractual obligations, and any prolonged shut-in of our wells could result in the expiration, in whole or in part, of the related leases, which could adversely affect our reserves, business, financial condition and results of operations.
Our identified drilling locations are scheduled out over many years, making them susceptible to uncertainties that could materially alter the occurrence or timing of their drilling.
We have specifically identified and scheduled certain drilling locations as an estimation of our future multi-year drilling activities on our existing acreage. These drilling locations represent a significant part of our business strategy. Our ability to drill and develop these locations depends on a number of uncertainties, including commodity prices, the availability and cost of capital, drilling and production costs, availability of drilling services and equipment, drilling results, lease expirations, availability of gathering or transportation facilities, access to and availability of water sourcing and distribution systems, regulatory approvals, including permitting, and other factors. Because of these uncertain factors, we do not know if the numerous identified drilling locations will ever be drilled or if we will be able to produce natural gas or oil from these or any other drilling locations. In addition, unless production is established within the spacing units covering the undeveloped acres on which some of the drilling locations are obtained, the leases for such acreage will expire. As such, our actual drilling activities may materially differ from those presently identified.
Properties that we decide to drill may not yield oil or natural gas in commercially viable quantities.
Properties that we decide to drill that do not yield oil or natural gas in commercially viable quantities will adversely affect our results of operations and financial condition. There is no way to predict in advance of drilling and testing whether any particular prospect will yield oil or natural gas in sufficient quantities to recover drilling or completion costs or be economically viable. The use of micro-seismic data and other technologies and the study of producing fields in the same area will not enable us to know conclusively prior to drilling whether oil or natural gas will be present or, if present, whether oil or natural gas will be present in commercial quantities. We cannot assure you that the analogies we draw from available data from other wells, more fully explored prospects or producing fields will be applicable to our drilling prospects.
Risks Related to Our Operations
Our development and acquisition projects require substantial capital expenditures. We may be unable to obtain required capital or financing on satisfactory terms, which could lead to a decline in our ability to access or grow production and reserves.
The oil and natural gas industry is capital-intensive. We make and expect to continue to make substantial capital expenditures related to development and acquisition projects. Historically, we have funded our capital expenditures with cash flows from operations, borrowings under CRP’sOpCo’s revolving credit facility, proceeds from offering debt and equity securities and divestitures of non-core assets, and we intend to finance our future capital expenditures in a similar fashion. When we finance our capital expenditures through indebtedness, a portion of our cash flows from operations must be used to pay interest and principal on the indebtedness, which reduces our ability to use cash flows from operations to fund working capital, capital expenditures and acquisitions. The actual amount and timing of our future capital expenditures may differ materially from our estimates as a result of, among other things, oil, natural gas and NGL prices; actual drilling results; the availability of drilling rigs and other services and equipment; and regulatory, technological and competitive developments.
Our cash flow from operations and access to capital are subject to a number of variables, including:
•the prices at which our production is sold;
•our proved reserves;
•the level of hydrocarbons we are able to produce from existing wells;
•our ability to acquire, locate and produce new reserves;
•the levels of our operating expenses; and
•our ability to borrow under CRP’sOpCo’s revolving credit facility and to access the capital markets.
If our revenues or the borrowing base under CRP’sOpCo’s revolving credit facility decrease as a result of lower oil, natural gas and NGL prices, operating difficulties, declines in reserves or for any other reason, we may have limited ability to obtain the capital necessary to sustain our operations at current levels. If additional capital is needed, we may not be able to obtain debt or equity financing on terms acceptable to us, if at all. If cash flow generated by our operations or available borrowings under CRP’sOpCo’s revolving credit facility are not sufficient to meet our capital requirements, the failure to obtain additional financing could result in a curtailment of our operations relating to development of our properties. This, in turn, could lead to a decline in our reserves and production, and could materially and adversely affect our business, financial condition and results of operations.
Drilling for and producing oil and natural gas are high risk activities with many uncertainties that could adversely affect our business, financial condition or results of operations. Additionally, we may not be insured for, or our insurance may be inadequate to protect us against, these risks.
Our future financial condition and results of operations will depend on the success of our development, acquisition and production activities, which are subject to numerous risks beyond our control, including the risk that drilling will not result in commercially
viable oil and natural gas production. In addition to the risks we face in drilling for and producing oil and natural gas, some factors that may directly or indirectly negatively impact our scheduled operations:
•lack of available gathering or transportation facilities or delays in the constructing such facilities;
•abnormal pressure or irregularities in geological formations;
•shortages of or delays in obtaining equipment, qualified personnel, materials or resources;
•equipment failures, accidents or other unexpected operational events;
•delays imposed by or resulting from compliance with laws, and regulations or litigation, including limitations resulting from wastewater disposal, emission of GHGs and limitations on hydraulic fracturing;
•environmental hazards, such as oil and natural gas leaks, oil spills, pipeline and tank ruptures and unauthorized discharges of brine, well stimulation and completion fluids, toxic gases or other pollutants into the surface and subsurface environment;
•natural disasters;
•personal injuries and death;
•terrorist attacks targeting oil and natural gas related facilities and infrastructure;
•limited availability of financing at acceptable terms;
•title problems;
•adverse weather conditions; and
•limitations in the market for oil and natural gas.
We are not insured against all risks. Losses and liabilities arising from uninsured and underinsured events, including those operating risks listed above, could materially and adversely affect our business, financial condition or results of operations. We may elect not to obtain insurance for any or all of these risks if we believe that the cost of available insurance is excessive relative to the risks presented. In addition, pollution and environmental risks generally are not fully insurable. The occurrence of an event that is not fully covered by insurance could have a material adverse effect on our business, financial condition and results of operations.
Many of our properties are in areas that may have been partially depleted or drained by offset wells and certain of our wells may be adversely affected by actions other operators may take when drilling, completing, or operating wells that they own.
Many of our properties are in areas that may have already been partially depleted or drained by earlier offset drilling. The owners of leasehold interests adjoining any of our properties could take actions, such as drilling and completing additional wells, which could adversely affect our operations. When a new well is completed and produced, the pressure differential in the vicinity of the well causes the migration of reservoir fluids toward the new wellbore (and potentially away from existing wellbores). As a result, the drilling and production of these potential locations could cause a depletion of our proved reserves and may inhibit our ability to further develop our proved reserves. In addition, completion operations and other activities conducted on adjacent or nearby wells could cause production from our wells to be shut in for indefinite periods of time, could result in increased lease operating expenses and could adversely affect the production and reserves from our wells after they re-commence production. We have no control over the operations or activities of offsetting operators.
Part of our strategy involves using some of the latest available horizontal drilling and completion techniques, which involve risks and uncertainties in their application.
Our operations involve utilizing some of the latest drilling and completion techniques as developed by us and our service providers. Risks that we face while drilling horizontal wells include the following:include:
•landing a wellbore in the desired drilling zone;
•staying in the desired drilling zone while drilling horizontally through the formation; and
•spacing the wells appropriately to maximize production rates and recoverable reserves;
•running our casing the entire length of the wellbore; and
•being able to run tools and other equipment consistently through the horizontal wellbore.reserves.
Risks that we face while completing wells include the following:include:
•the ability to fracture stimulate the planned number of stages;
•the ability to run tools the entire length of the wellbore during completion operations;
•the ability to successfully clean out the wellbore after completion of the final fracture stimulation stage; and
•the ability to prevent unintentional communication with other wells.
In addition, the results of our drilling in new or emerging formations are more uncertain initially than drilling results in areas that are more developed and have a longer history of established production. Newer or emerging formations and areas have limited or no production history and, consequently, we are more limited in assessing future drilling results in these areas. If our drilling results are less than anticipated, the return on our investment for a particular project may not be as attractive as anticipated, and we could incur material write-downs of unevaluated properties and the value of our undeveloped acreage could decline in the future.
Our operations are substantially dependent on the availability of water. Restrictions on our ability to obtain water may have an adverse effect on our financial condition, results of operations and cash flows.
Water is an essential component of deep shale oil and natural gas production during both the drilling and hydraulic fracturing processes. Drought conditions have persisted in Texas and New Mexico in past years. These drought conditions have led some local water districts to restrict the use of water subject to their jurisdiction for hydraulic fracturing to protect local water supplies. Where practicable, we strive to use recycled water for our hydraulic fracturing operations. If we are unable to obtain water from water suppliers or our recycling operations, it may need to be obtained from non-local sources and transported to drilling sites, resulting in increased costs, or we may be unable to economically drill for or produce oil and natural gas, each of which could have an adverse effect on our financial condition, results of operations and cash flows.
Our ability to produce crude oil, natural gas and NGLs economically and in commercial quantities could be impaired if we are unable to acquire adequate supplies of water for our drilling operations or are unable to recycle or dispose of the produced water we produce in an economical and environmentally safe manner.
Our operations could be impaired if we are unable to recycle or dispose of the water we produce in an economical and environmentally safe manner. Where practicable, we strive to recycle the produced water for our future oil and gas operations. Produced water that is not recycled generally gets disposed of in disposal wells that are operated by us or third-party contractors. Some studies have linked earthquakes or induced seismicity in certain areas to underground injection of produced water resulting from oil and gas activities, which has led to increased public and governmental scrutiny of injection safety. For instance, in response to concerns regarding induced seismicity, regulators in Texas have adopted new rules governing the permitting or re-permitting of wells used to dispose of produced water and other fluids resulting from the production of oil and gas. Among other things, these rules require companies seeking permits for disposal wells to provide seismic activity data in permit applications, provide for more frequent monitoring and reporting for certain wells and allow the state to modify, suspend or terminate permits on grounds that a disposal well is likely to be, or determined to be, causing seismic activity.
Another consequence of water disposal activities and seismic events may be lawsuits alleging that disposal well operations have caused damage to neighboring properties or otherwise violated state and federal rules regulating waste disposal. These developments could result in additional regulation and restrictions on our use of injection wells or commercial disposal wells to dispose of produced water. Increased regulation and attention given to water disposal and induced seismicity could also lead to greater opposition, including litigation, to limit or prohibit oil and gas activities utilizing injection wells for produced water disposal. Any one or more of these developments may result in limitations on disposal well volumes, disposal rates and pressures or locations, require us or our vendors to shut down or curtail the injection into disposal wells, or cause delays, interruptions or termination of our operations, which events could have a material adverse effect on our business, financial condition and results of operations.
Our producing properties are concentrated in the Delaware Basin, a sub-basin of the Permian Basin, making us vulnerable to risks associated with operating in a single geographic area.
Our producing properties are geographically concentrated in the Delaware Basin, a sub-basin of the Permian Basin, primarily in West Texas and New Mexico.Mexico in the Permian Basin. At December 31, 2020,2023, all of our total estimated proved reserves were attributable to properties located in this area. As a result of this concentration, we may be disproportionately exposed to the impact of regional supply and demand factors, delays or interruptions of production from wells in this area caused by governmental regulation, processing or transportation capacity constraints, market limitations, availability of equipment and personnel, water shortages, regional power outages or other drought or extreme weather related conditions or interruption of the processing or transportation of oil, natural gas or NGLs. In addition, the effect of fluctuations on supply and demand may become more pronounced within specific geographic oil and natural gas producing areas such as the Permian Basin, which may cause these conditions to occur with greater frequency or magnify the effects of these conditions. Due to the concentrated nature of our portfolio of properties, a number of our properties could experience any of the same conditions at the same time, resulting in a relatively greater impact on our results of operations than they might have on other companies that have a more diversified portfolio of properties. Such delays or interruptions could have a material adverse effect on our financial condition and results of operations.
The marketability of our production is dependent upon transportation and other facilities, most of which we do not control. If these facilities are unavailable, or if we are unable to access these facilities on commercially reasonable terms, our operations could be interrupted and our revenues reduced.
The marketability of our oil, natural gas and NGLs production depends in part upon the availability, proximity and capacity of transportation facilities owned by third parties. Our oil, natural gas and NGLs production is generally transported from the wellhead by gathering systems that are either owned by us or third-party midstream companies. In general, we do not control the transportation of our production and our access to transportation facilities may be limited or denied. In some instances, we have contractual guarantees relating to the transportation of our production through firm transportation arrangements, but third-party systems may be temporarily unavailable due to pressure limitations, market conditions, mechanical failures, accidents or other reasons. Insufficient production from our wells to support the construction of pipeline facilities by our purchasers or third-party midstream companies or a significant disruption in the availability of our or third-party transportation facilities or other production facilities could adversely impact our ability to deliver to market or produce our oil, natural gas and NGLs and thereby cause a significant interruption in our operations. If, in the future, we are unable, for any sustained period, to implement acceptable delivery or transportation arrangements, we may be required to shut in or curtail production or flare our natural gas. If we were required to shut-in wells, we might also be obligated to pay certain demand charges for gathering and processing services and firm transportation charges for pipeline capacity we have reserved. Any such shut-in or curtailment, or an inability to obtain favorable terms for delivery of the oil, natural gas and NGLs produced from our fields, would materially and adversely affect our financial condition and results of operations.
We have entered into multi-year agreements with some of our suppliers, service providers and the purchasers of our oil and natural gas, which contain minimum volume commitments. Any failure by us to satisfy the minimum volume commitments could lead to contractual penalties that could adversely affect our results of operations and financial position.
We have entered into certain multi-year supply and service agreements associated with water disposal.energy and frac sand purchase agreements. We also have various multi-year agreements that relate to the sale, transportation or gathering of our oil and natural gas and may in the future enter into multi-year agreements for contracts for drilling rigs or other services. Some of these agreements contain minimum volume commitments that we must satisfy or contractual penalties in the form of volume deficiencies or other remedies may apply. As of December 31, 2020,2023, our aggregate long-term contractual obligation under these agreements was $12.8$120.4 million, which represents the gross minimum obligation but does not include amounts that may be due under certain contracts that contain variable pricing or volumetric components as the future obligations cannot be determined. Further information about these agreements can be found at Note 13—14—Commitments and Contingencies, under Part II, Item 8. Financial Statements and Supplementary Data in8 of this Annual Report. Any failure by us to satisfy the minimum volume commitments in these agreements could adversely affect our results of operations and financial position.
We depend upon a small number of significant purchasers for the sale of most of our oil, natural gas and NGL production.
We normally sell production to a relatively small number of customers, as is customary in our business. See Note 1—Basis of Presentation and Summary of Significant Accounting Policies, Item 8. Financial Statements and Supplementary Data in this Annual Report for significant purchasers that accounted for more than 10% of our revenues for the years ended December 31, 2020, 2019 and 2018. The loss of any of our major purchasers could materially and adversely affect our revenues in the near-term.
We may incur losses as a result of title defects in the properties in which we invest.
The existence of a material title deficiency can render a lease worthless and can adversely affect our results of operations and financial condition. While we typically obtain title opinions prior to commencing drilling operations on a lease or in a unit, the failure of title may not be discovered until after a well is drilled, in which case we may lose the lease and the right to produce all or a portion of the minerals under the property.
Multi-well pad drilling may result in volatility in our operating results.
We utilize multi-well pad drilling where practical. Because wells drilled on a pad are not brought into production until all wells on the pad are drilled and completed and the drilling rig is moved from the location, multi-well pad drilling delays the commencement of production from a given pad, which may cause volatility in our operating results. In addition, problems affecting one pad could adversely affect production from all wells on such pad. As a result, multi-well pad drilling can cause delays in the scheduled commencement of production or interruptions in ongoing production.
We may be unable to make attractive acquisitions or successfully integrate acquired businesses, and any inability to do so may disrupt our business and hinder our ability to grow.
In the future we may make acquisitions of assets or businesses that complement or expand our current business. The successful acquisition of producing properties requires an assessment of several factors, including:
•recoverable reserves;
•future commodity prices and their applicable differentials;
•operating costs; and
•potential environmental and other liabilities.
The accuracy of these assessments is inherently uncertain. In connection with these assessments, we perform a review of the subject properties that we believe to be generally consistent with industry practices. Our review will not reveal all existing or potential problems, nor will it permit us to become sufficiently familiar with the properties to fully assess their deficiencies and capabilities. Inspections may not always be performed on every well, and environmental problems, such as groundwater contamination, are not necessarily observable even when an inspection is undertaken. Even when problems are identified, the seller may be unwilling or unable to provide effective contractual protection against all or part of the problems. We often are not entitled to contractual indemnification for environmental liabilities and acquire properties on an “as is” basis.
The success of any completed acquisition will depend on our ability to integrate effectively the acquired business into our existing operations. The process of integrating acquired businesses may involve unforeseen difficulties and may require a disproportionate amount of our managerial and financial resources. In addition, possible future acquisitions may be larger and purchase prices higher than those paid for earlier acquisitions. No assurance can be given that we will be able to identify additional suitable acquisition opportunities, negotiate acceptable terms, obtain financing for acquisitions on acceptable terms or successfully acquire identified targets. Our failure to achieve consolidation savings, to integrate the acquired businesses and assets into our existing operations successfully or to minimize any unforeseen operational difficulties could have a material adverse effect on our financial condition and results of operations. In addition, debt agreements impose certain limitations on our ability to enter into mergers or combination transactions and our ability to incur certain indebtedness, which could indirectly limit our ability to engage in acquisitions of businesses.
The unavailability or high cost of additional drilling rigs, equipment, supplies, personnel and oilfield services could adversely affect our ability to execute our development plans within our budget and on a timely basis.
The demand for drilling rigs, pipe and other equipment and supplies, as well as for qualified and experienced field personnel to drill wells and conduct field operations, geologists, geophysicists, engineers and other professionals in the oil and natural gas industry, can fluctuate significantly, often in correlation with commodity prices, causing periodic shortages. In addition, to the extent our suppliers source their products or raw materials from foreign markets, the cost of such equipment could be impacted if the United States imposes tariffs on imported goods from countries where these goods are produced. We cannot predict whether these conditions will exist in the future and, if so, what their timing and duration will be. Such shortages or cost increases could delay or cause us to incur significant expenditures that are not provided for in our capital budget, which could have a material adverse effect on our business, financial condition or results of operations.
We could experience periods of higher costs if commodity prices rise. These increases could reduce our profitability, cash flow and ability to complete development activities as planned.
Historically, our capital and operating costs have risen during periods of increasing oil, natural gas and NGL prices. These cost increases result from a variety of factors beyond our control, such as increases in the cost of electricity, steel and other raw materials that we and our vendors rely upon; increased demand for labor, services and materials as drilling activity increases; and increased taxes. Such costs may rise faster than increases in our revenue as commodity prices rise, thereby negatively impacting our profitability, cash flows and ability to complete development activities as scheduled and on budget. This impact may be magnified to the extent that our ability to participate in the commodity price increases is limited by our derivative activities.
We depend upon a small number of significant purchasers for the sale of most of our oil, natural gas and NGL production.
We normally sell production to a relatively small number of customers, as is customary in our business. See Note 1—Basis of Presentation and Summary of Significant Accounting Policies under Part II, Item 8 of this Annual Report for significant purchasers that accounted for more than 10% of our revenues for the years ended December 31, 2023, 2022 and 2021. The loss of any of our major purchasers could materially and adversely affect our revenues in the near-term.
We may incur losses as a result of title defects in the properties in which we invest.
The existence of a material title deficiency can render a lease worthless and can adversely affect our results of operations and financial condition. While we typically obtain title opinions prior to commencing drilling operations on a lease or in a unit, the failure of title may not be discovered until after a well is drilled, in which case we may lose the lease and the right to produce all or a portion of the minerals under the property.
Multi-well pad drilling may result in volatility in our operating results.
We utilize multi-well pad drilling where practical. Because wells drilled on a pad are not brought into production until all wells on the pad are drilled and completed and the drilling rig is moved from the location, multi-well pad drilling delays the commencement of production from a given pad, which may cause volatility in our operating results. In addition, problems affecting one pad could adversely affect production from all wells on such pad. As a result, multi-well pad drilling can cause delays in the scheduled commencement of production or interruptions in ongoing production.
We may be unable to make attractive acquisitions or successfully integrate acquired businesses, and any inability to do so may disrupt our business and hinder our ability to grow.
In the future we may make acquisitions of assets or businesses that complement or expand our current business. The successful acquisition of producing properties requires an assessment of several factors, including:
•recoverable reserves;
•future commodity prices and their applicable differentials;
•operating costs; and
•potential environmental and other liabilities.
The accuracy of these assessments is inherently uncertain. In connection with these assessments, we perform a review of the subject properties that we believe to be generally consistent with industry practices. Our review will not reveal all existing or potential problems, nor will it permit us to become sufficiently familiar with the properties to fully assess their deficiencies and capabilities. Inspections may not always be performed on every well, and environmental problems, such as groundwater contamination, are not necessarily observable even when an inspection is undertaken. Even when problems are identified, the seller may be unwilling or unable to provide effective contractual protection against all or part of the problems. We often are not entitled to contractual indemnification for environmental liabilities and acquire properties on an “as is” basis.
The success of any completed acquisition will depend on our ability to integrate effectively the acquired business into our existing operations. The process of integrating acquired businesses may involve unforeseen difficulties and may require a disproportionate amount of our managerial and financial resources. In addition, possible future acquisitions may be larger and purchase prices higher than those paid for earlier acquisitions. No assurance can be given that we will be able to identify additional suitable acquisition opportunities, negotiate acceptable terms, obtain financing for acquisitions on acceptable terms or successfully acquire identified targets. Our failure to achieve consolidation savings, to integrate the acquired businesses and assets into our existing operations successfully or to minimize any unforeseen operational difficulties could have a material adverse effect on our financial condition and results of operations. In addition, debt agreements impose certain limitations on our ability to enter into mergers or combination transactions and our ability to incur certain indebtedness, which could indirectly limit our ability to engage in acquisitions of businesses.
A security interruption or failure with respect to our information technology systems could harm our ability to effectively operate our business.
Our ability to effectively manage and operate our business depends significantly on information technology systems. The failure of these systems to operate effectively and support our operations, challenges in transitioning to upgraded or replacement systems, difficulty in integrating new or updated systems, or a breach in security of these systems could adversely impact the operations of our business.
Any breach of our network may result in the loss of valuable business data, misappropriation of our customers’ or employees’ personal information, or a disruption of our business, which could harm our customer relationships and reputation, and result in lost revenues, fines or lawsuits.
Moreover, we must comply with increasingly complex and rigorous regulatory standards enacted to protect business and personal data. Any failure to comply with these regulatory standards could subject us to legal and reputational risks. Misuse of or failure to secure personal information could also result in violation of data privacy laws and regulations, proceedings against us by governmental entities or others, damage to our reputation and credibility, and could have a negative impact on revenues and profits.
Risks Related to Our Derivative Transactions, Debt and Access to Capital
Our derivative activities could result in financial losses or could reduce our earnings.
We may enter into derivative instrument contracts for a portion of our oil and natural gas production from time to time. As of December 31, 2020,2023, we had entered into derivative contracts covering a portion of our projected oil and gas production through early 20222023 (refer to Note 7—8—Derivative Instruments under Part II, Item 8 of this Annual Report for a summary of our derivative instruments as of December 31, 2020)2023). Accordingly, our earnings may fluctuate significantly as a result of changes in fair value of our derivative instruments.
Derivative instruments also expose us to the risk of financial loss in some circumstances, including when:
•production is less than the volume covered by the derivative instruments;
•there is an increase in the differential between the underlying price in the derivative instrument and actual prices received; or
•there are issues with regard to legal enforceability of such instruments.
The use of derivatives may, in some cases, require the posting of cash collateral with counterparties. If we enter into derivative instruments that require cash collateral and commodity prices or interest rates change in a manner adverse to us, our cash otherwise available for use in our operations would be reduced, which could limit our ability to make future capital expenditures and make payments on our indebtedness, and which could also limit the size of CRP’sOpCo’s borrowing base. Future
collateral requirements will depend on arrangements with our counterparties, highly volatile commodity prices and interest rates. In addition, derivative arrangements could limit the benefit we would receive from increases in the prices for oil and natural gas, which could also have a material adverse effect on our financial condition.
Our commodity derivative contracts expose us to risk of financial loss if a counterparty fails to perform under a contract. Disruptions in the financial markets could lead to sudden decreases in a counterparty’s liquidity, which could make the counterparty unable to perform under the terms of the contract, and we may not be able to realize the benefit of the contract. We are unable to predict sudden changes in a counterparty’s creditworthiness or ability to perform. Even if we accurately predict sudden changes, our ability to negate the risk may be limited depending upon market conditions.
Since our production is not fully hedged, and we are also exposed to fluctuations in oil, natural gas and NGL prices as it relates to the price we receive from the sale of our unhedged volumes. We intend to continue to hedge a portion of our production, but we may not be able to do so at favorable prices. Accordingly, our revenues and cash flows are subject to increased volatility with regard to these unhedged volumes, and a decline in commodity prices could materially and adversely affect our business, financial condition and results of operations.
Our leverage and debt service obligations may adversely affect our financial condition, results of operations, business prospects and our ability to make payments on our outstanding debt.
As of December 31, 2020,2023, we had approximately $1.1$3.8 billion of total long-term debt and additional borrowing capacity of $333.9 million$2.0 billion under CRP’sOpCo’s revolving credit facility (after giving effect to a $31.8 million availability blocker and $4.3$5.7 million of outstanding letters of credit ),credit), all of which would be secured if borrowed. Subject to the restrictions in the instruments governing CRP’sOpCo’s outstanding indebtedness (including CRP’sOpCo’s revolving credit facility and senior notes), CRPOpCo and its subsidiaries may incur substantial additional indebtedness (including secured indebtedness) in the future. Although the instruments governing CRP’sOpCo’s outstanding indebtedness do contain restrictions on the incurrence of additional indebtedness, these restrictions will be subject to waiver and a number of significant qualifications and exceptions, and indebtedness incurred in compliance with these restrictions could be substantial.
Our current and future level of indebtedness could affect our operations in several ways, including the following:
•require us to dedicate a substantial portion of our cash flow from operations to service our existing debt, thereby reducing the cash available to finance our operations and other business activities;
•limit management’s discretion in operating our business and our flexibility in planning for, or reacting to, changes in our business and the industry in which we operate;
•increase our vulnerability to downturns and adverse developments in our business and the economy generally;
•limit our ability to access the capital markets to raise capital on favorable terms or to obtain additional financing for working capital, capital expenditures, acquisitions, general corporate or other expenses or to refinance existing indebtedness;
•place restrictions on our ability to obtain additional financing, make investments, lease equipment, sell assets and engage in business combinations;
•make it more likely that a reduction in CRP’sOpCo’s borrowing base following a periodic redetermination could require CRPOpCo to repay a portion of its then-outstanding bank borrowings;
•make us vulnerable to increases in interest rates as the indebtedness under CRP’sOpCo’s revolving credit facility may vary with prevailing interest rates;
•place us at a competitive disadvantage relative to our competitors with lower levels of indebtedness in relation to their overall size or less restrictive terms governing their indebtedness; and
•make it more difficult for CRPOpCo to satisfy its obligations under its debt and increase the risk that we may default on its debt obligations.
We may not be able to generate sufficient cash to service all of CRP’sOpCo’s indebtedness and may be forced to take other actions to satisfy CRP’sOpCo’s obligations under applicable debt instruments, which may not be successful.
CRP’sOpCo’s ability to make scheduled payments on or to refinance its indebtedness depends on our financial condition and operating performance, which are subject to prevailing economic and competitive conditions and certain financial, business and other factors beyond our control. We may not be able to maintain a level of cash flows from operating activities sufficient to permit CRPOpCo to pay the principal, premium, if any, and interest on CRP’sOpCo’s indebtedness.
If our cash flows and capital resources are insufficient to fund debt service obligations, we may be forced to reduce or delay investments and capital expenditures, sell assets, seek additional capital or restructure or refinance indebtedness. Our ability to restructure or refinance CRP’sOpCo’s indebtedness will depend on the condition of the capital markets and our financial condition at such time. Any refinancing of indebtedness could be at higher interest rates and may require CRPOpCo to comply with more onerous
covenants, which could further restrict business operations. The terms of existing or future debt instruments may restrict us from adopting some of these alternatives. In addition, any failure to make payments of interest and principal on outstanding indebtedness on a timely basis would likely result in a reduction of our credit rating, which could harm CRP’sOpCo’s ability to incur additional indebtedness. In the absence of sufficient cash flows and capital resources, we could face substantial liquidity problems and might be required to dispose of material assets or operations to meet debt service and other obligations. The agreements governing CRP’sOpCo’s indebtedness restrict CRP’sOpCo’s ability to dispose of assets and CRP’sOpCo’s use of the proceeds from such disposition. CRPOpCo may not be able to consummate those dispositions, and the proceeds of any such disposition may not be adequate to meet any debt service obligations then due. These alternative measures may not be successful and may not permit CRPOpCo to meet scheduled debt service obligations.
Restrictions in CRP’sOpCo’s existing and future debt agreements could limit our growth and ability to engage in certain activities.
CRP’sOpCo’s credit agreement with a syndicate of banks that provides for a five-year secured revolving credit facility, maturing in February 2027 (the “Credit Agreement”) and the indentures governing its senior notes contain a number of significant covenants, including restrictive covenants that may limit CRP’sOpCo’s ability to, among other things:
•incur additional indebtedness;
•make loans to others;
•make investments;
•merge or consolidate with another entity;
•make certain payments;
•hedge future production or interest rates;
•incur liens;
•sell assets; and
•engage in certain other transactions without the prior consent of the lenders.
In addition, CRP’s credit agreementOpCo’s Credit Agreement requires us to maintain certain financial ratios or to reduce our indebtedness if we are unable to comply with such ratios. As of December 31, 2020,2023, we were in full compliance with such financial ratios and covenants.
The restrictions in CRP’sOpCo’s debt agreements may also limit our ability to obtain future financings to withstand a future downturn in our business or the economy in general, or to otherwise conduct necessary corporate activities. We may also be prevented from taking advantage of business opportunities that arise because of the limitations that the restrictive imposed on CRP.
If CRPOpCo is unable to comply with the restrictions and covenants in the agreements governing its indebtedness, there could be a default under the terms of these agreements, which could result in an acceleration of payment of funds that CRPOpCo has borrowed.
Any default under the agreements governing CRP’sOpCo’s indebtedness that is not cured or waived by the required lenders, and the remedies sought by the holders of any such indebtedness, could make CRPOpCo unable to pay principal, premium, if any, and interest on such indebtedness. If we are unable to generate sufficient cash flow and are otherwise unable to obtain funds necessary to meet required payments of principal, premium, if any, and interest on CRP’sOpCo’s indebtedness, or if CRPOpCo otherwise fails to comply with the various covenants, including financial and operating covenants, in the agreements governing CRP’sOpCo’s indebtedness, CRPOpCo could be in default under the terms of the agreements governing such indebtedness. In the event of such default:
•the holders of such indebtedness could elect to declare all the funds borrowed thereunder to be due and payable, together with accrued and unpaid interest;
•the lenders under CRP’sOpCo’s revolving credit facility could elect to terminate their commitments thereunder, cease making further loans and institute foreclosure proceedings against our assets; and
•we could be forced into bankruptcy or liquidation.
If our operating performance declines, we may in the future need to obtain waivers under CRP’sOpCo’s revolving credit facility to avoid CRPOpCo being in default. If CRPOpCo breaches the covenants under its revolving credit facility and seeks a waiver, CRPOpCo may not be able to obtain a waiver from the required lenders. If this occurs, CRPOpCo would be in default under the revolving credit facility, the lenders could exercise their rights, as described above, and we could be forced into bankruptcy or liquidation.
Any significant reduction in the borrowing base under CRP’sOpCo’s revolving credit facility as a result of the periodic borrowing base redeterminations or otherwise may negatively impact our ability to fund our operations.
CRP’sOpCo’s revolving credit facility limits the amounts CRPOpCo can borrow up to a borrowing base amount, which the lenders, in their sole discretion, determine semiannually in the spring and fall. The borrowing base depends on, among other things, projected
revenues from, and asset values of, the oil and natural gas properties securing the loan. The borrowing base will automatically be decreased by an amount equal to 25% of the aggregate notional amount of permitted senior unsecured notes CRPOpCo may issue in the future. In addition, CRP’s credit agreement contains a minimum availability condition to borrowing equal to 25% of the aggregate principal amount of the Senior Secured Notes outstanding, which we refer to in this Annual Report as an availability blocker. The lenders can unilaterally adjust the borrowing base and the borrowings permitted to be outstanding under CRP’sOpCo’s revolving credit facility. Any increase in the borrowing base requires the consent of the lenders holding 100% of the commitments. In connection with amending the fall 2020 semi-annual borrowing base redetermination,Credit Agreement in connection with closing the borrowing base andEarthstone Merger, the elected commitments were reaffirmed at $700.0 million.increased to $2.0 billion.
In the future, we may not be able to access adequate funding under CRP’sOpCo’s revolving credit facility (or a replacement facility) as a result of a decrease in the borrowing base due to the issuance of new indebtedness, the outcome of a subsequent borrowing base redetermination or an unwillingness or inability on the part of lending counterparties to meet their funding obligations and the inability of other lenders to provide additional funding to cover the defaulting lender’s portion. Declines in commodity prices could result in a determination to lower the borrowing base in the future and, in such case, CRPOpCo could be required to repay any indebtedness in excess of the redetermined borrowing base. As a result, we may be unable to implement our respective drilling and development plan, make acquisitions or otherwise carry out business plans, which would have a material adverse effect on our financial condition and results of operations and impair our ability to service CRP’sOpCo’s indebtedness.
If we experience liquidity concerns, we could face a downgrade in our debt ratings which could restrict our access to, and negatively impact the terms of, current or future financings or trade credit.
Our ability to obtain financing and trade credit and the terms of any financing or trade credit is, in part, dependent on the credit ratings assigned to our debt by independent credit rating agencies. We cannot provide assurance that any of our current ratings will remain in effect for any given period of time or that a rating will not be lowered or withdrawn entirely by a rating agency if, in its judgment, circumstances so warrant. Factors that may impact our credit ratings include debt levels, planned asset purchases or sales and near-term and long-term production growth opportunities, liquidity, asset quality, cost structure, product mix and commodity pricing levels. A ratings downgrade could adversely impact our ability to access financings or trade credit and increase our borrowing costs.
Increases in interest rates could adversely affect our business.
Our business and operating results can be harmed by factors such as the availability, terms of and cost of capital, increases in interest rates or a reduction in credit rating. These changes could cause our cost of doing business to increase, limit our ability to pursue acquisition opportunities, reduce cash flow used for drilling and place us at a competitive disadvantage. At December 31, 2020, we had $330.0 million in borrowings outstanding under CRP’s revolving credit facility. Interest is calculated under the terms of CRP’s credit agreement based on a LIBOR spread. Recent and continuing disruptions and volatility in the global
financial markets may lead to an increase in interest rates or a contraction in credit availability impacting our ability to finance operations. We require continued access to capital. A significant reduction in cash flows from operations or the availability of credit could materially and adversely affect our ability to achieve our planned growth and operating results.
Risks Related to Legislative and Regulatory Initiatives
Climate change laws and regulations restricting emissions of GHGs could result in increased operatingincrease our costs and reducedreduce demand for the oil and natural gas that we produce, while potential physical effects of climate change could disrupt our production and cause us to incur significant costs in preparing for or responding to those effects.
The threat of climate change continues to attract considerable attention in the United States and around the world. Numerous proposals have been made and could continue to be made at the international, national, regional and state levels of government to monitor, limit, and report existing emissions of greenhouse gases as well as to reduce such future emissions. The SEC issued a proposed rule in March 2022 that would mandate disclosure of climate-related data, risks, and opportunities, including financial impacts, physical and transition risks, related governance and strategy, and GHG emissions, for certain public companies. The SEC originally planned to issue a final rule by October 2022, but according to the SEC’s updated rulemaking agenda, a final rule is now expected to be issued in the spring of 2024.
In addition, in response to findings that emissions of carbon dioxide, methane and other GHGs present an endangerment to public health and the environment, the EPA has adopted regulations pursuant to the CAA that, among other things, require PSDPrevention of Significant Deterioration preconstruction and Title V operating permits for certain large stationary sources. Facilities required to obtain PSD permits for their GHG emissions are also required to meet “best available control technology” standards that are being established byWhile the states or, in some cases, by the EPA on a case-by-case basis. These regulatory requirements could adversely affect our operations and restrict or delay our ability to obtain air permits for new or modified sources. In addition, the EPA has adopted rules requiring the monitoring and reporting of GHG emissions from specified onshore and offshore oil and natural gas production sources in the United States, which include certain of our operations. Furthermore, in June 2016, the EPA finalized rules that establish new controls for emissionsregulation of methane from oil and gas facilities in the U.S. has been subject to uncertainty in recent years, President Biden signed an executive order in January 20, 2021 calling for the reinstatement or issuance of methane emissions standards for new, modified, or reconstructed sourcesand existing oil and gas facilities. The EPA subsequently issued new regulations to establish comprehensive standards of performance and emission guidelines for methane and volatile organic compound emissions from new and existing operations in the oil and natural gas source category, includingsector, which were finalized in December 2023. The EPA has also issued a proposed rule in July 2023 with a proposed effective date of January 1, 2025, to expand the scope of the EPA’s Mandatory Greenhouse Gas Reporting program and to update reporting requirements. We cannot predict the scope of any final methane or GHG regulatory requirements or the cost to comply with such requirements. In addition, the IRA, signed by President Biden in August 2022, provides significant funding and incentives for research and development of low-carbon energy production processing, transmissionmethods, carbon capture, and storage activities.other programs directed
at addressing climate change. The rule included first-time standardsIRA also includes a methane emissions reduction program that amends the Clean Air Act to address emissions of methane from equipmentinclude a Methane Emissions and processes across the source category, including hydraulically fractured oilWaste Reduction Incentive Program for petroleum and natural gas well completions. However, in September 2020, the EPA adopted deregulatory amendments to the 2016 standards intended to streamline implementation, reduce duplicative EPA and state requirements and decrease the burden of compliance. In particular, the amendments removed the transmission and storage segments from the oil and natural gas source category and rescinded the methane-specific requirements for production and processing facilities. Although the amendments are now in effect, they may be subject to reversal under the new presidential administration. In January 2021, the administration issued an executive order directing all federal agencies to review and take action to address any federal regulations, orders, guidance documents, policies, and similar agency actions promulgated during the prior administration that may be inconsistent with the current administration’s policies. The executive order specifically called onsystems. This program requires the EPA to considerimpose a “waste emissions charge” on certain natural gas and oil sources that are already required to report under EPA’s Greenhouse Gas Reporting Program. The EPA recently issued a proposed rule suspending, revising or rescindingto implement the September 2020 deregulatory amendments by September 2021. As such, future implementation is uncertain at this time. However, compliancewaste emissions charge with a proposed effective date in 2025 for reporting year 2024 emissions.Compliance with these rules and legislation will likely require enhanced record-keeping practices, the purchase of new equipment, such as optical gas imaging instruments to detect leaks, and increased frequency of maintenance and repair activities to address emissions leakage. The rules will also likely requireleakage and additional personnel time to support these activities or the engagement of third partythird-party contractors to assist with and verify compliance. These new and proposed rules could result in increased compliance costs on our operations.
While Congress has from time to time considered legislation to reduce emissions of GHGs, there has not been significant activity in the form of adopted legislation to reduce GHG emissions at the federal level in recent years. In the absence of such federal climate legislation, a number of state and regional efforts have emerged that are aimed at tracking and/or reducing GHG emissions by means of cap-and-trade programs. These programs typically require major sources of GHG emissions to acquire and surrender emission allowances in return for emitting those GHGs. In addition, efforts have been made and continue to be made in the international community toward the adoption of international treaties or protocols that would address global climate change issues. The United States became one of almost 200 nations that, in December 2015, agreed to the Paris Agreement, which requires member countries to review and “represent a progression” in their intended nationally determined contributions, which set GHG emission reduction goals, every five years beginning in 2020. Although the previous administration withdrew the United States from the Paris Agreement, effective November 2020, the aforementioned executive order issued by the current administration in January 2021 commenced the process for reentering the Paris Agreement. The executive order also established a Working Group, which is called on to, among other things, develop methodologies for calculating the “social cost of carbon,” “social cost of nitrous oxide,” and “social cost of methane.” Final recommendations from the Working Group are due no later than January 2022. A separate executive order targeting climate change alsowas issued by the current administrationPresident Biden in January 2021, which directed the Secretary of the Interior to pause new oil and natural gas leasing on public lands and in offshore waters pending completion of a comprehensive review of the federal permitting and leasing practices, consider whether to adjust royalties associated with coal, oil, and gas resources extracted from public lands and offshore waters or take other appropriate actions to account for corresponding climate costs. The climate change executive order also directed the federal government toand identify any “fossil fuel subsidies” to take steps to ensure that to the extent consistent with applicable law, federal funding is not directly subsidizing fossil fuels. Legal challenges to the executive orders have been filed. Although it is not possible at this timeA federal district court issued a preliminary injunction against the order in June 2021, which the Fifth U.S. Circuit Court of Appeals vacated and remanded back to the district court in August 2022. The federal district court subsequently issued a permanent injunction against the order in August 2022, limited to the thirteen Plaintiff states, which included Louisiana, Alabama, Alaska, Arkansas, Georgia, Mississippi, Missouri, Montana, Nebraska, Oklahoma, Texas, Utah, and West Virginia. In November 2022, the BLM also issued a proposed rule to reduce the waste of natural gas from venting, flaring, and leaks during oil and gas production activities on federal and American Indian leases. We cannot predict howthe scope of any resulting legislation or new regulations, thatwhich may, in turn, affect our business.
At the international level, the United Nations-sponsored Paris Agreement, a non-binding agreement of which the U.S. is a signatory, encourages nations to limit their GHG emissions through nationally-determined reduction goals every five years after 2020. President Biden announced in April 2021 a new, more rigorous nationally determined emissions reduction level of 50% to 52% from 2005 levels in economy-wide net GHG emissions by 2030. Moreover, the international community gathered again in Glasgow in November 2021 at the COP26, during which multiple announcements were made, including a call for parties to eliminate certain fossil fuel subsidies and pursue further action on non-CO2 GHGs. Relatedly, the United States and European Union jointly announced at COP26 the launch of a Global Methane Pledge, an initiative which over 150 counties have joined since, committing to a collective goal of reducing global methane emissions by at least 30% from 2020 levels by 2030, including “all feasible reductions” in the energy sector. These goals were reaffirmed in November 2022 at the COP27 in Sharm-El Sheik. While there were limited announcements at COP27 with respect to the reduction of fossil fuel use, there were negotiations on emissions reduction targets and reduction of fossil fuel use amongst the international community, and such discussions continued at COP28 in Dubai. The impacts of these orders, pledges, agreements and any legislation or regulation promulgated to fulfill the United States’ commitments under the Paris Agreement, the Global Methane Pledge, or other international conventions cannot be adoptedpredicted at this time.
Please refer to Regulation of the Oil and Natural Gas Industry in Item 1 for further discussion on the topics referenced above and additional information on existing and proposed laws, regulations, treaties and international pledges intended to address GHG emissions would impact our business, any suchGHGs and other climate change issues. Existing and future laws and regulations imposing reporting obligations on, or limiting emissions of GHGs from, our equipmentrelating to climate change and operations could require us to incur costs to reduce emissions of GHGs associated with our operations. Substantial limitations on GHG emissions could adversely affectincrease our costs, reduce demand for the oilour products, limit our growth opportunities, impair our ability to develop our reserves and natural gas we produce. Finally, some scientists have concluded that increasing concentrations of GHGs in the Earth’s atmosphere may produce climate changes that have significant physicalother adverse effects such as
increased frequency and severity of storms, floods and other climatic events; if any such effects were to occur, they could have a material adverse effect on our operations.business.
Federal, state and local legislative and regulatory initiatives relating to hydraulic fracturing as well as governmental reviews of such activities could result in increased costs and additional operating restrictions or delays in the completion of oil and natural gas wells and adversely affect our production.
Hydraulic fracturing is an important and common practice that is used to stimulate production of oil and/or natural gas from dense subsurface rock formations. The hydraulic fracturing process involves the injection of water, proppants and chemicals under pressure into targeted subsurface formations to fracture the surrounding rock and stimulate production. We regularly use hydraulic fracturing as part of our operations. Hydraulic fracturing is typically regulated by state oil and natural gas commissions, but the EPA and other federal agencies have asserted regulatory authority over aspects of the process. In addition, Congress has from time to time considered legislation to provide for federal regulation of hydraulic fracturing under the SDWASafe Drinking Water Act (“SDWA”) and to require disclosure of the chemicals used in the hydraulic fracturing process. It is unclear how any additional federal regulation of hydraulic fracturing activities may affect our operations.
Certain governmental reviews are either underway or being proposed that focus on environmental aspects of hydraulic fracturing practices. The White House Council on Environmental Quality is coordinating an administration-wide review of hydraulic fracturing practices. Additionally, in December 2016, the EPA released its final report on the potential impacts of hydraulic fracturing on drinking water resources. The EPA report concluded that hydraulic fracturing activities have not led to widespread, systemic impacts on drinking water resources in the United States, although there are above-and-below ground mechanisms by which hydraulic fracturing activities have the potential to impact drinking water resources. To date, EPA has
taken no further action in response to the December 2016 report. Other governmental agencies, including the United States Department of Energy and the United States Department of the Interior, are evaluating various other aspects of hydraulic fracturing. These completed, ongoing, or proposed studies could spur initiatives to further regulate hydraulic fracturing under the federal SDWA or other regulatory mechanisms. Additionally, from time to time, legislation has been introduced, but not enacted, in Congress to provide for federal regulation of hydraulic fracturing and to require disclosure of the chemicals used in the fracturing process.
At the state level, several states have adopted or are considering legal requirements that could impose more stringent permitting, disclosure and well construction requirements on hydraulic fracturing activities. For example, in May 2013, the Railroad Commission of Texas issued a “well integrity rule,” which updates the requirements for drilling, putting pipe down and cementing wells. The rule also includes new testing and reporting requirements, such as (i) the requirement to submit cementing reports after well completion or after cessation of drilling, whichever is later, and (ii) the imposition of additional testing on wells less than 1,000 feet below usable groundwater. The well integrity rule took effect in January 2014. Local governments also may seek to adopt ordinances within their jurisdictions regulating the time, place and manner of drilling activities in general or hydraulic fracturing activities in particular. State and federal regulatory agencies have also recently focused on a possible connection between the operation of injection wells used for natural gas and oil waste disposal and seismic activity. Increased regulation and attention given to induced seismicity could lead to greater opposition to, and litigation concerning, production or development activities utilizing hydraulic fracturing or injection wells for waste disposal, which could indirectly impact our business, financial condition and results of operations. We believe that we follow applicable standard industry practices and legal requirements for groundwater protection in our hydraulic fracturing activities. Nonetheless, if new or more stringent federal, state or local legal restrictions relating to the hydraulic fracturing process are adopted in areas where we operate, we could incur potentially significant added costs to comply with such requirements, experience delays or curtailment in the pursuit of development activities, and perhaps even be precluded from drilling wells.
Conservation measures, technological advances and negative shift in market perception toward the oil and natural gas industry could reduce demand for oil and natural gas.
Fuel conservation measures, alternative fuel requirements, increasing consumer demand for alternatives to oil and natural gas, technological advances in fuel economy and energy generation devices, including as a result of the renewable energy incentives contained in the IRA, could reduce demand for oil and natural gas. Additionally, the increased competitiveness of alternative energy sources (such as electric vehicles, wind, solar, geothermal, tidal, fuel cells and biofuels) could reduce demand for oil and natural gas and, therefore, our revenues.
Additionally, certainCertain segments of the investor community have recently expressed negative sentiment towards investing in the oil and natural gas industry. Recent equity returns in the sector versus other industry sectors have led to lower oil and natural gas representation in certain key equity market indices. Some investors, including certain pension funds, university endowments and family foundations, have stated policies to reduce or eliminate their investments in the oil and natural gas sector based on social and environmental considerations. Furthermore, certain other stakeholders have pressured commercial and investment banks to stop funding oil and gas projects.
The impact of the changing demand for oil and natural gas, together with a change in investor sentiment, may have a material adverse effect on our business, financial condition, results of operations and cash flows.
Our operations may be exposed to significant delays, costs and liabilities as a result of environmental and occupational health and safety requirements applicable to our business activities.
Our operations are subject to stringent, complex and evolving federal, state and local laws and regulations governing the discharge of materials into the environment, health and safety aspects of our operations or otherwise relating to environmental protection.protection of the environment and natural resources (including threatened and endangered species and their habitats). These laws and regulations may impose numerous obligations applicable to our operations, including the acquisition
of a permit or other approval before conducting regulated activities; the restriction of types, quantities and concentration of materials that can be released into the environment; the requirement to engage in remedial measures to prevent or mitigate pollution from former and ongoing operations, such as requirements to close pits and plug abandoned wells; the limitation or prohibition of drilling activities on certain lands lying within wilderness, wetlands and other protected areas; the application of specific health and safety criteria addressing worker protection; and the imposition of substantial liabilities for pollution resulting from our operations. Numerous governmental authorities, such as the EPA and analogous state agencies, have the power to enforce compliance with these laws and regulations and the permits issued under them. Such enforcement actions often involve taking difficult and costly compliance measures or corrective actions. Failure to comply with these laws and regulations may result in the assessment of sanctions, including administrative, civil or criminal penalties, natural resource damages, the imposition of investigatory or remedial obligations, and the issuance of orders limiting or prohibiting some or all of our operations. In addition, we may experience delays in obtaining, or be unable to obtain, required permits, which may delay or interrupt our operations and limit our growth and revenue.
Certain environmental laws impose strict joint and several liability for costs required to remediate and restore sites where hazardous substances, hydrocarbons or solid wastes have been stored or released. We may be required to remediate contaminated properties currently or formerly operated by us or facilities of third parties that received waste generated by our operations regardless of whether such contamination resulted from the conduct of others or from consequences of our own actions that were in compliance with all applicable laws at the time those actions were taken. In connection with certain acquisitions, we could acquire, or be required to provide indemnification against, environmental liabilities that could expose us to material losses. In addition, claims for damages to persons or property, including natural resources, may result from the environmental, health and safety impacts of our operations. Our insurance may not cover all environmental, health and safety risks and costs or may not provide sufficient coverage if an environmental, health and safety claim is made against us. Moreover, public interest in the protection of the environment and human health has increased dramatically in recent years. The trend of more expansive and stringent environmental legislation and regulations applied to the crude oil and natural gas industry could continue, resulting in increased costs of doing business and consequently affecting profitability. In the states of New Mexico and Texas, as an example, governmental authorities are investigating the practice of flaring natural gas and it is possible that such states could implement additional volumetric or other restrictions on this practice which may require us to curtail or shut in production which otherwise is or would be flared due to the unavailability of acceptable delivery, transportation or processing arrangements. To the extent laws are enacted or other governmental action is taken that restricts drilling or imposes more stringent and costly operating, waste handling, disposal and cleanup requirements, our business, prospects, financial condition or results of operations could be materially adversely affected.
Restrictions on drilling activities intended to protect certain species of wildlife may adversely affect our ability to conduct drilling activities in areas where we operate.
Oil and natural gas operations in our operating areas may be adversely affected by seasonal or permanent restrictions on drilling activities designed to protect various wildlife. Seasonal restrictions may limit our ability to operate in protected areas and can intensify competition for drilling rigs, oilfield equipment, services, supplies and qualified personnel, which may lead to periodic shortages when drilling is allowed. These constraints and the resulting shortages or high costs could delay our operations or materially increase our operating and capital costs. Permanent restrictions imposed to protect endangered or threatened species and their habitats could prohibit drilling in certain areas or require the implementation of expensive mitigation measures. The designation of previously unprotected species in areas where we operate as threatened or endangered could cause us to incur increased costs arising from species protection measures or could result in limitations on our activities that could have a material and adverse impact on our ability to develop and produce our reserves.
A negative shift in investor sentiment towards the oil and natural gas industry and increased attention to environmental, social and governance (“ESG”) and conservation matters may adversely impact our business.
Increasing attention to climate change and natural capital, societal expectations on companies to address climate change, investor and societal expectations regarding voluntary ESG initiatives and disclosures, and consumer demand for alternative sources of energy may result in increased costs (including but not limited to increased costs associated with compliance, stakeholder engagement, contracting, and insurance), reduced demand for our products and our product and services, reduced profits, increased legislative and judicial scrutiny, investigations and litigation, and negative impacts on our stock price and access to capital markets. Increasing attention to climate change and environmental conservation, for example, may result in demand shifts for our products and additional governmental investigations and private litigation against us. To the extent that societal pressures or political or other factors are involved, it is possible that liability could be imposed on us without regard to our causation of or contribution to the asserted damage, or to other mitigating factors. Voluntary disclosures regarding ESG matters, as well as any ESG disclosures mandated by law, could result in private litigation or government investigation or enforcement action regarding the sufficiency or validity of such disclosures. In addition, failure or a perception (whether or not valid) of failure to implement ESG strategies or achieve ESG goals or commitments, including any GHG reduction or neutralization goals or commitments, could result in governmental investigations or enforcement, private litigation and damage our reputation, cause our investors or consumers to lose confidence in our Company, and negatively impact our operations.
Moreover, while we may create and publish disclosures regarding ESG matters, many of the statements in those disclosures may be on hypothetical expectations and assumptions that may or may not be representative of current or actual risks or events or forecasts of expected risks or events, including the costs associated therewith. Such expectations and assumptions are necessarily uncertain and may be prone to error or subject to misinterpretation given the long timelines involved and the lack of an established single approach to identifying and measuring many ESG matters. Such disclosures may also be partially reliant on third-party information that we have not or cannot independently verify. Additionally, we expect there will likely be increasing levels of regulation, disclosure-related and otherwise, with respect to ESG matters, and increased regulation will likely lead to increased compliance costs as well as scrutiny that could heighten all of the risks identified in this risk factor.
In addition, organizations that provide information to investors on corporate governance and related matters have developed ratings processes for evaluating companies on their approach to ESG matters. Such ratings are used by some investors to inform
their investment and voting decisions. Unfavorable ESG ratings and recent activism directed at shifting funding away from companies with energy-related assets could lead to increased negative investor sentiment toward us and to the diversion of investment to other industries, which could have a negative impact on our stock price and our or our access to and costs of capital. Also, institutional lenders may, of their own accord, decide not to provide funding for fossil fuel industry companies based on climate change, natural capital, or other ESG related concerns, which could affect our or our access to capital for potential growth projects. Moreover, to the extent ESG matters negatively impact our or the fossil fuel industry’s reputation, we may not be able to compete as effectively to recruit or retain employees, which may adversely affect our operations.
Any restrictions on oil and natural gas development on federal lands has the potential to adversely impact our operations.
We possess leases which are granted by the federal government and administered by the BLM, a federal agency. Operations we conduct on federal leases must comply with numerous additional statutory and regulatory restrictions. These leases contain relatively standardized terms requiring compliance with detailed regulations. Under certain circumstances, the BLM may require operations on federal leases to be suspended or terminated. Any such suspension or termination of our leases could adversely impact the results of our operations.
The Biden administration has proposed certain changes to the leasing and permitting programs for oil and natural gas development on federal lands, including imposing bans on new oil and gas leasing, cancelling issued oil and gas leases, and removing public lands from future oil and gas leasing.For example, on June 2, 2023, the Biden administration issued a 20-year ban on new oil and gas leasing within a 10-mile radius of Chaco Culture National Historical Park in Northern New Mexico.Additionally, on September 6, 2023, the Biden administration announced that it is cancelling issued leases for oil and gas in the Arctic National Wildlife Refuge designated for oil and gas development.While we cannot predict the ultimate impact of these changes or whether federal agencies will implement further reforms, any revisions to the federal leasing or permitting process that make it more difficult for us to pursue operations on federal lands may adversely impact our operations.
In addition to administrative and policy risks, operations on federal lands also face litigation risks. Ongoing litigation related to the federal oil and gas leasing program may impact our federal oil and gas leases, which in turn could impact our results of operations. For example, a June 2022 settlement approved by a federal district court in Washington, D.C., obligates the BLM to redo its environment reports under NEPA for all oil and gas leases sold between 2015 and 2020, including leases in New Mexico. The settlement stems from a 2016 lawsuit alleging that the BLM was not properly accounting for the cumulative climate impacts of its federal leasing program. Separately, there is a risk that authorizations required for existing operations may be delayed to the point that it causes a business disruption, and we cannot guarantee that further action will not be taken to curtail oil and natural gas development on federal land. For example, certain lawmakers have proposed to reduce or ban further leasing on federal lands or to adopt further restrictions for same. To the extent such legislation is passed, it may adversely impact our operations, which could negatively impact our financial performance.
Tax laws and regulations may change over time, and any such changes could adversely affect our business and financial condition.
From time to time, legislation has been proposed that, if enacted into law, would make significant changes to U.S. federal and state income tax laws affecting the oil and natural gas industry, including (i) eliminating the immediate deduction for intangible drilling and development costs, (ii) the repeal of the percentage depletion allowance for oil and natural gas properties and (iii) an extension of the amortization period for certain geological and geophysical expenditures. No accurate prediction can be made as to whether any such legislative changes will be proposed or enacted in the future or, if enacted, what the specific provisions or the effective date of any such legislation would be. These proposed changes in the U.S. tax law, if adopted, or other similar changes that would impose additional tax on our activities or reduce or eliminate deductions currently available with respect to natural gas and oil exploration, development or similar activities, could adversely affect our business, results of operations, financial condition and cash flow.
Changes in laws or regulations, or a failure to comply with any laws and regulations, may adversely affect our business, investments and results of operations.
We are subject to laws, regulations and rules enacted by national, regional and local governments and NASDAQ.NYSE. In particular, we are required to comply with certain SEC, NASDAQNYSE and other legal or regulatory requirements. Compliance with, and monitoring of, applicable laws, regulations and rules may be difficult, time consuming and costly. Those laws, regulations and rules and their interpretation and application may also change from time to time and those changes could have a material adverse effect on our business, investments and results of operations. In addition, a failure to comply with applicable laws, regulations and rules, as interpreted and applied, could have a material adverse effect on our business and results of operationsoperations.
Risks Related to Our Common Stock and Capital Structure
A negative shift in investor sentiment towards the oil and gas industry could adversely affect our ability to raise equity and debt capital.
Certain segments of the investor community have recently developed negative sentiment towards investing in the oil and gas industry. Over the past years, equity returns in the sector versus other industry sectors have led to lower oil and gas representation in certain key equity market indices. Some investors, including certain institutional investors, private equity companies, pension funds, university endowments and family foundations have stated policies to reduce or eliminate their investments in the oil and gas sector based on social and environment considerations. Certain other stakeholders have pressured commercial and investment
banks to stop funding oil and gas projects. Such developments could result in downward pressure on the stock prices of oil and gas companies, including ours. This may also result in a reduction of available capital funding for potential development projects, further impacting our future financial results.
Riverstone and its affiliates own a significant percentageOur principal stockholders hold substantial voting power of our outstanding voting common stock.
Holders of our Class A Common Stock and Class C Common Stock vote together as a single class on all matters presented to our stockholders for their vote or approval, except as otherwise required by applicable law or our Fourth Amended and Restated Certificate of Incorporation, as amended (the “Charter”). As of December 31, 2023, Pearl Energy Investments (“Pearl”), EnCap Partners GP, LLC (“EnCap”), Riverstone Investment Group LLC (“Riverstone”) and its affiliatesNGP Energy Capital (“NGP”) beneficially own approximately 33%12%, 10%, 7% and 6%, respectively, of our voting common stock asinterests and, along with their affiliates, could limit the ability of December 31, 2020. our other stockholders to approve transactions they may deem to be in the best interests of our Company or delay or prevent changes in control or changes in our management.
As long as Pearl, EnCap, Riverstone and its affiliatesNGP continue to own or control a significant percentage of outstanding voting power, they may have the ability to strongly influence all corporate actions requiring stockholder approval, including the election and removal of directors and the size of our board of directors, any amendment of our third amended and restated certificate of incorporation (the “Charter”)Charter or our second amended and restated bylaws (the “Bylaws”), or the approval of any merger or other significant corporate transaction, including a sale of substantially all of our assets.
The interests ofIn addition, Pearl, EnCap, Riverstone and itsNGP and their respective affiliates may, not align with the interests of our other stockholders. Riverstone is in the business of making investments in companies and mayfrom time to time, acquire and hold interests in businesses that compete directly or indirectly compete with us. Riverstone and its affiliatesour business, as well as businesses that are significant existing or potential acquisition candidates or industry partners. They may also pursue acquisition opportunitiesacquire or seek to acquire assets that may be complementarywe seek to our business,acquire and, as a result, those acquisition opportunities may not be available to us. In addition,us or may be more expensive for us to pursue. Moreover, this concentration of stock ownership by our Charter providessignificant stockholders may also adversely affect the trading price of our common stock to the extent investors perceive a disadvantage in owning stock of a company with stockholders who own such a significant percentage of our voting securities.
There may be future sales or other dilution of our equity, which may adversely affect the market price of our common stock.
We are not restricted from issuing additional shares of common stock, including securities that are convertible into or exchangeable for, or that represent a right to receive, common stock. Any issuance of additional shares of our common stock or convertible securities will dilute the ownership interest of our common stockholders. Sales of a substantial number of shares of our common stock or other equity-related securities in the public market, or the perception that these sales could occur, could depress the market price of our common stock and impair our ability to raise capital through the sale of additional equity securities. We cannot predict the effect that future sales of our common stock or other equity-related securities would have on the market price of our common stock.
The declaration of dividends and any repurchases of our common stock are each within the discretion of our board of directors based upon a review of relevant considerations, and there is no guarantee that we renouncewill pay any interestdividends on or expectancyrepurchase shares of our common stock in the business opportunitiesfuture or at levels anticipated by our stockholders.
Dividends, whether fixed or variable, and stock repurchases are authorized and determined by our board of directors in its sole discretion and depend upon a number of factors, including the Company’s financial results, cash requirements and future prospects, restrictions in our debt agreements, as well as such other factors deemed relevant by our board of directors. In September 2022 at the closing of the Colgate Merger, we announced an upsized $500 million stock repurchase program, but this repurchase program may be suspended from time to time, modified, extended or discontinued by our board of directors at any time. Similarly, any dividends, whether fixed or variable, we may declare in the future will be determined by our board of directors in its sole discretion. Any elimination of, or downward revision in, our stock repurchase program or dividend policy could have an adverse effect on the market price of our officers and directors and their respective affiliates and each such party shall not have any obligation to offer us those opportunities unless presented to onecommon stock.
Provisions contained in our Charter and Bylaws, as well as provisions of Delaware law, could impair a takeover attempt, which may adversely affect the market price of our Common Stock.
Our Charter and Bylaws contain provisions that could have the effect of delaying or preventing changes in control or changes in our management without the consent of our board of directors. These provisions include:
•a classified board of directors, with only approximately one-third of our board of directors elected each year;
•no cumulative voting in the election of directors, which limits the ability of minority stockholders to elect director candidates;
•the exclusive right of our board of directors to elect a director to fill a vacancy created by the expansion of the board of directors or the resignation, death, or removal of a director, which prevents stockholders from being able to fill vacancies on our board of directors;
•the ability of our board of directors to determine whether to issue shares of our preferred stock and to determine the price and other terms of those shares, including preferences and voting rights, without stockholder approval, which could be used to significantly dilute the ownership of a hostile acquirer;
•a prohibition on stockholder action by written consent, which forces stockholder action to be taken at an annual or special meeting of our stockholders;
•the requirement that an annual meeting of stockholders may be called only by the chairman of the board of directors, the chief executive officer,officers, or the board of directors, which may delay the ability of our stockholders to force consideration of a proposal or to take action, including the removal of directors;
•limiting the liability of, and providing indemnification to, our directors and officers;
•controlling the procedures for the conduct and scheduling of stockholder meetings;
•providing that directors may be removed prior to the expiration of their terms by stockholders only for cause; and
•advance notice procedures that stockholders must comply with in order to nominate candidates to our board of directors or to propose matters to be acted upon at a stockholders’ meeting, which may discourage or deter a potential acquirer from conducting a solicitation of proxies to elect the acquirer’s own slate of directors or otherwise attempting to obtain control of the Company.
These provisions, alone or together, could delay hostile takeovers and changes in control of the Company or changes in our board of directors and management.
As a Delaware corporation, we are also subject to provisions of Delaware law, including Section 203 of the Delaware General Corporation Law, which prevents some stockholders holding more than 15% of our outstanding voting common stock from engaging in certain business combinations without approval of the holders of substantially all of our outstanding voting common stock. Any provision of our Charter or Bylaws or Delaware law that has the effect of delaying or deterring a change in control could limit the opportunity for our stockholders to receive a premium for their securities and could also affect the price that some investors are willing to pay for our securities.
The Charter designates the Court of Chancery of the State of Delaware as the sole and exclusive forum for substantially all actions and proceedings that may be initiated by stockholders, which could limit shareholders’ ability to obtain a favorable judicial forum for disputes with us or our directors, officers, employees or agents.
Our Charter provide that, unless we consent in writing to the selection of an alternative forum, the (i) Court of Chancery of the State of Delaware will, to the fullest extent permitted by applicable law, be the sole and exclusive forum for (A) any derivative action or proceeding brought on our behalf, (B) any action asserting a claim of breach of a fiduciary duty owed by any of our directors, officers, employees or agents to us or our shareholders, (C) any action asserting a claim arising pursuant to any provision of the Delaware General Corporation Law, the Charter or our Bylaws or (D) any action asserting a claim against us that is governed by the internal affairs doctrine, in each such case subject to such Court of Chancery having personal jurisdiction over the indispensable parties named as defendants therein; and (ii) subject to the foregoing, the federal district courts of the United States of America shall be the exclusive forum for the resolution of any complaint asserting a cause of action arising under the Securities Act, including all causes of action asserted against any defendant to such complaint. In the event the Delaware Court of Chancery lacks subject matter jurisdiction, then the sole and exclusive forum for such action or proceeding shall be the federal district court for the District of Delaware.
Any person or entity purchasing or otherwise acquiring any interest in shares of our capital stock is deemed to have received notice of and consented to the foregoing forum selection provision. This provision may limit our shareholders’ ability to bring a claim in a judicial forum that they find favorable for disputes with us or our directors, officers, or other employees, which may discourage such lawsuits. Alternatively, if a court were to find this choice of forum provision inapplicable to, or unenforceable in respect of, one or more of the specified types of actions or proceedings, we may incur additional costs associated with resolving
such matters in other jurisdictions, which could adversely affect its business, financial condition, prospects, or results of operations.
Risks Related to the Earthstone Merger
We may be unable to integrate the business of the Company and Earthstone successfully or realize the anticipated benefits of the Earthstone Merger.
The Earthstone Merger involved the combination of two companies that operated as independent public companies until November 1, 2023. The combination of two independent businesses is complex, costly and time consuming, and we will be required to continue to devote significant management attention and resources to integrating the business practices and operations of Earthstone into the Company. Potential difficulties that we may encounter as part of the integration process include the following:
•the inability to successfully combine the business of the Company and Earthstone in a manner that permits the combined company to achieve, on a timely basis, or at all, the enhanced revenue opportunities and cost savings and other benefits anticipated to result from the Earthstone Merger;
•complexities associated with managing the combined businesses, including difficulty addressing possible differences in operational philosophies and the challenge of integrating complex systems, technology, networks and other assets of each of the companies in a seamless manner that minimizes any adverse impact on customers, suppliers, employees and other constituencies;
•the assumption of contractual obligations with less favorable or more restrictive terms; and
•potential unknown liabilities and unforeseen increased expenses associated with the Earthstone Merger.
Any of these issues could adversely affect our ability to maintain relationships with customers, suppliers, employees and other constituencies, our ability to achieve the anticipated benefits of the Earthstone Merger, our earnings or our business and financial results following the Earthstone Merger.
The financial forecasts disclosed in connection with the announcement of the Earthstone Merger are based on various assumptions that may not be realized.
The financial estimates disclosed in connection with the announcement of the Earthstone Merger were based on assumptions of, and information available to, our management when prepared, and these estimates and assumptions are subject to uncertainties, many of which are beyond our control and may not be realized. Many factors will be important in determining the Company’s future results following the Earthstone Merger. As a result of these contingencies, actual future results may vary materially from our estimates. In view of these uncertainties, these financial estimates should not be viewed as a representation that the forecasted results will necessarily reflect actual future results.
Our financial estimates were not prepared with a view toward public disclosure, and such financial estimates were not prepared with a view toward compliance with published guidelines of any regulatory or professional body. Further, any forward-looking statement speaks only as of the date on which it is made, and we do not undertake any obligation, other than as required by applicable law, to update the financial estimates to reflect events or circumstances after the date those financial estimates were prepared or to reflect the occurrence of anticipated or unanticipated events or circumstances.
The synergies attributable to the Earthstone Merger may vary from expectations.
We may fail to realize the anticipated benefits and synergies expected from the Earthstone Merger, which could adversely affect the Company’s business, financial condition and results of operations. The success of the Earthstone Merger will depend, in significant part, on the Company’s ability to successfully integrate the acquired business, grow the revenue of the Company and realize the anticipated strategic benefits and synergies from the acquisition. We believe that the acquisition will provide operational and financial scale, increasing free cash flow and an enhanced corporate rate of return. However, achieving these goals requires, among other things, realization of the targeted cost synergies expected from the Earthstone Merger. This growth and the anticipated benefits of the transaction may not be realized fully or at all, or may take longer to realize than expected. Actual operating, technological, strategic and revenue opportunities, if achieved at all, may be less significant than expected or may take longer to achieve than anticipated. If we are not able to achieve these objectives and realize the anticipated benefits and synergies expected from the Earthstone Merger within the anticipated timing or at all, our business, financial condition and results of operations may be adversely affected.
ITEM 1B. UNRESOLVED STAFF COMMENTS
None.
ITEM 1C. CYBERSECURITY
Risk Management and Strategy
We rely on information technology and data to operate our business effectively and recognize the importance of implementing and maintaining cybersecurity systems and processes that allow us to protect the confidentiality, integrity and availability of our information systems and the data residing within them.
In order to monitor our information technology systems and data and to identify potential threats to such, we maintain cybersecurity risk assessment and management programs. Such programs include, but are not limited to, annual security penetration tests performed both externally and internally, bi-annual security assessments against cybersecurity frameworks, continuous vulnerability scanning, incident response processes, monthly and annual security awareness and simulated phishing trainings for our employees, and various system alert monitoring and screenings.
As part of our cybersecurity risk management process, we conduct simulated cybersecurity incidents to ensure that we are prepared to respond to such incidents and to highlight any areas for potential improvement in our cyber incident preparedness. We have a cybersecurity incident management policy and response plan in place. Cybersecurity breaches are evaluated by our information technology teams, which includes our VP of Information Technology. If an incident is deemed to be a breach, it is communicated to our legal department and management for evaluation, including whether the breach requires communication to the Board of Directors or investors through a relevant public filing.
Governance
Our cybersecurity risk management is primarily the responsibility of our VP of Information Technology and information technology teams. Our VP of Information Technology has over 25 years of industry experience in the field of information systems and oversees our risk assessment programs, remediation of known risks, processes for the regular monitoring of our information systems and our employee cybersecurity training programs. Our Board of Directors also oversees cybersecurity risk through our Audit Committee who reviews periodic reporting and updates regarding our risk management associated with cybersecurity.
We have not experienced any cybersecurity incidents that have had a material impact on our business strategy, results of operations or financial condition. For more information about the cybersecurity risks we face, refer to Risk Factors under Part I, Item 1A of this Annual Report.
ITEM 3. LEGAL PROCEEDINGS
From timeRefer to time,Note 14—Commitments and Contingencies under Part II, Item 8 of this Annual Report for more information regarding our legal proceedings.
Environmental. Due to the nature of the oil and gas industry, we are a partyexposed to ongoing legal proceedingsenvironmental risks. We have various policies and procedures to minimize and mitigate the risks from environmental contamination and we conduct periodic reviews to identify changes in our environmental risk profile. Liabilities are recorded when environmental damages resulting from events are probable and the ordinary coursecosts can be reasonably estimated. We are not aware of business, including workers’ compensationany material environmental claims and employment-related disputes. While the outcomeexisting as of these proceedings cannot be predicted with certainty, we doDecember 31, 2023 which have not believe the results of these proceedings, individuallybeen provided for or in the aggregate, willwould otherwise have a material adverse effectimpact on our business, financial condition, results of operations,statements; however, there can be no assurance that current regulatory requirements will not change or liquidity.that unknown potential past non-compliance with environmental laws or other environmental liabilities will not be discovered on our properties.
ITEM 4. MINE SAFETY DISCLOSURE
Not applicable.
PART II
ITEM 5. MARKET FOR REGISTRANT’S COMMON EQUITY, RELATED STOCKHOLDER MATTERS AND ISSUER PURCHASES OF EQUITY SECURITIES
Common Stock
Our Class A Common Stock is currently quotedlisted on NASDAQthe New York Stock Exchange under the ticker symbol “CDEV.”“PR”. As of February 19, 2021,23, 2024, there were 17240 registered holders of record of our Class A Common Stock and 55 registered holders of record of our Class C Common Stock.
Stock Performance Graph
The following performance graph and related information shall deemed to be furnished, but not filed with the SEC.
The performance graph below compares the cumulative total stockholder return on our Class A Common Stock (“PR”) to that of the Standard & Poor’s 500 Index (“S&P 500”) and the Standard & Poor’s 500 Oil and Gas Exploration & Production ETF (“XOP”). The “cumulative total return” assumes that $100 was invested, including reinvestment of dividends, if any, in our Class A Common Stock, the S&P 500, and XOP on December 31, 2018 and tracks it through December 31, 2023. The results shown in the graph below are not necessarily indicative of future stock price performance.
Stock Repurchase Program
Our Board of Directors authorized a stock repurchase program to acquire up to $500 million of our outstanding Common Stock (the “Repurchase Program”), which was approved to run through December 31, 2024. The Repurchase Program can be used to reduce our shares of Class A Common Stock and Class C Common Stock outstanding. Repurchases may be made from time to time in the open-market or via privately negotiated transactions at our discretion and will be subject to market conditions, applicable legal requirements, available liquidity, compliance with our debt agreements and other factors. The Repurchase Program does not require any specific number of shares to be acquired and can be modified or discontinued by our Board of Directors at any time.
Issuer Purchases of Equity Securities
Share repurchase activity during the three months ended December 31, 2023 was as follows: | | | | | | | | | | | | | | | | | | | | | | | | | | |
| Period | | Total Number of Shares Purchased | | Average Price Paid per Share | | Total Number of Shares Purchased as Part of Publicly Announced Programs | | Approximate Dollar Amount of Shares that May Yet Be Purchased under Plans or Programs (in thousands) |
| October 1 - 31, 2023 | | — | | | $ | — | | | — | | | $ | 442,661 | |
November 1 - 30, 2023(1) | | 2,774,826 | | | $ | 13.64 | | | 2,774,826 | | | $ | 404,811 | |
December 1 - 31, 2023(2) | | 2,252,252 | | | $ | 12.93 | | | 2,252,252 | | | $ | 375,689 | |
(1) During the fourth quarter of 2023, we repurchased and subsequently canceled 2,774,826 shares of Class A Common Stock in connection with shares issued for the Earthstone Merger on November 1, 2023. The shares were repurchased at an average price of $13.64 per common share for a total cost of $37.9 million.
(2) During the fourth quarter of 2023, we repurchased 2,252,252 shares of Class C Common Stock at a weighted average price of $12.93 per common share for a total cost of $29.1 million. The shares that were repurchased were subsequently canceled. The share repurchase was completed from a selling shareholder during a secondary offering of Class C Common Stock.
Dividend Policy
We have notreturn capital to shareholders through a combination of base dividends plus a variable return framework, comprised of variable dividends and/or share repurchases. The variable return program is structured to distribute at least 50% of free cash flow after the base dividend through a variable dividend, share repurchases or a combination of both. The mix between variable dividends and share repurchases are dependent upon market conditions during a given quarter. Variable dividends are typically declared on or around our quarterly earnings and paid shortly thereafter. The decision to pay any cashfuture dividends onis solely within the discretion of, and subject to approval by, our Common StockBoard of Directors. Our Board of Directors’ determination with respect to date. Our boardany such dividends, including the record date, the payment date and the actual amount of directors may fromthe dividend, will depend upon our profitability and financial condition, contractual restrictions, restrictions imposed by applicable law and other factors that the Board deems relevant at the time to time consider whether or not to institute a dividend policy. It is our present intention to retain any earnings for use in our business operations and, accordingly, we do not anticipate the board of directors declaring any dividends in the near future.such determination.
ITEM 6. [Reserved]
ITEM 6. SELECTED FINANCIAL DATA
The following data should be read in conjunction with Item 7. Management’s Discussion and Analysis of Financial Condition and Results of Operations in this Annual report, which includes a discussion of factors materially affecting the comparability of the information presented, and in conjunction with our consolidated financial statements included in this Annual Report. Our historical results are not necessarily indicative of future operating results.
The following table shows selected historical financial information for the periods and as of the dates indicated. The term “Successor” refers to Centennial after the acquisition of the outstanding membership interests in CRP on October 11, 2016 (the “Business Combination”) and the consolidation of CRP subsequent to the Business Combination. The term “Predecessor” refers to CRP for periods prior to the Business Combination.
The selected historical financial information for the periods presented may not be comparable from period to period as a result of the following transactions:
•the GMT Acquisition completed in June 2017;
•the Silverback Acquisition completed in December 2016; and
•the Business Combination completed in October 2016.
| | | | | | | | | | | | | | | | | | | | | | | | | | | | | | | | | | | | | | |
| Successor | | | Predecessor |
| Year Ended December 31, | | October 11, 2016
through
December 31, 2016 | | | January 1, 2016 through October 10, 2016(1) |
| (in thousands, except per share data) | 2020 | | 2019 | | 2018 | | 2017 | | | |
| Statements of Operations Data: | | | | | | | | | | | | |
| Total revenues | $ | 580,456 | | | $ | 944,330 | | | $ | 891,045 | | | $ | 429,902 | | | 29,717 | | | | $ | 69,116 | |
| Net income (loss) attributable to Class A Common Stock | (682,837) | | | 15,798 | | | 199,899 | | | 75,568 | | | (8,081) | | | | (218,724) | |
Income (loss) per share of Class A Common Stock:(2) | | | | | | | | | | | | |
| Basic | $ | (2.46) | | | $ | 0.06 | | | $ | 0.76 | | | $ | 0.32 | | | $ | (0.05) | | | | |
| Diluted | $ | (2.46) | | | $ | 0.06 | | | $ | 0.75 | | | $ | 0.32 | | | $ | (0.05) | | | | |
| Cash Flows Data: | | | | | | | | | | | | |
| Net cash provided by operating activities | $ | 171,376 | | | $ | 564,173 | | | $ | 670,011 | | | $ | 259,918 | | | $ | 9,410 | | | | $ | 51,740 | |
| Net cash used in investing activities | (326,323) | | | (932,989) | | | (1,068,664) | | | (992,306) | | | (1,749,733) | | | | (101,434) | |
| Net cash provided by financing activities | 147,743 | | | 362,937 | | | 294,160 | | | 724,220 | | | 1,874,268 | | | | 47,296 | |
| | | | | | | | | | | | | | | | | | | | | | | | | | | | | | | | |
| | Successor |
| | December 31, |
| (in thousands) | | 2020 | | 2019 | | 2018 | | 2017 | | 2016 |
| Balance Sheet Data: | | | | | | | | | | |
| Total assets | | $ | 3,827,425 | | | $ | 4,688,288 | | | $ | 4,260,021 | | | $ | 3,616,569 | | | $ | 2,651,642 | |
| Long-term debt, net | | 1,068,624 | | | 1,057,389 | | | 691,630 | | | 390,764 | | | — | |
| Total equity | | 2,603,961 | | | 3,270,701 | | | 3,243,869 | | | 3,003,972 | | | 2,552,935 | |
(1) The selected historical consolidated financial information of CRP for the period from January 1, 2016 through October 10, 2016 was derived from the audited historical consolidated financial statements of CRP.
(2) No cash or stock dividends were declared or paid on our Common Stock during the periods presented.
ITEM 7. MANAGEMENT’S DISCUSSION AND ANALYSIS OF FINANCIAL CONDITION AND RESULTS OF OPERATIONS
The following discussion and analysis of our financial condition and results of operations should be read in conjunction with the accompanying consolidated financial statements and related notes in “Item 8. Financial Statements and Supplementary Data” in this Annual Report. The following discussion and analysis contains forward-looking statements that reflect our future plans, estimates, beliefs and expected performance. The forward-looking statements are dependent upon events, risks and uncertainties that may be outside our control. Our actual results could differ materially from those discussed in these forward-looking statements. Factors that could cause or contribute to such differences include, but are not limited to, future market prices for oil, natural gas and NGLs, future production volumes, estimates of proved reserves, capital expenditures, economic and competitive conditions, inflation, regulatory changes, continuedthe implementation and future impactsactual result of COVID-19the Earthstone Merger (defined below) and other uncertainties, as well as those factors discussed in “Cautionary Statement Concerning Forward-Looking Statements” and “Item 1A. Risk Factors” in this Annual Report, all of which are difficult to predict. In light of these risks, uncertainties and assumptions, the forward-looking events discussed may or may not occur. We do not undertake any obligation to publicly update any forward-looking statements except as otherwise required by applicable law.
Overview
We are an independent oil and natural gas company focused on the responsible acquisition, optimization and development of unconventionalhigh-return oil and associated liquids-rich natural gas reserves in the Permian Basin.properties. Our assets are concentratedmainly located in the Delaware Basin, a sub-basincore of the Permian Basin. Our capital programs are focused on projects that we believe provide the highestprincipal business objective is to increase shareholder value by efficiently developing our oil and natural gas assets in an environmentally and socially responsible way, with an overall objective of improving our rates of return on capital.and generating sustainable free cash flow.
Market Conditions
TheOur revenue, profitability and ability to return cash to stockholders can depend substantially on factors beyond our control, such as economic, political and regulatory developments. Prices for crude oil, natural gas and NGLs have experienced significant fluctuations in recent worldwide outbreak of COVID-19years and various governmental actions takenmay continue to mitigate the impact of COVID-19 have resulted in an unprecedented declinefluctuate widely in the demand forfuture.
Immediately following the COVID-19 pandemic, global oil and natural gas. In addition in March 2020, the decisionsupply was limited by Saudi Arabia to drastically reduce export prices and increase oil production (the “Saudi-Russia oil price war”) followed by curtailment agreements among OPEC and other countries such as Russia further increased uncertainty and volatility around global oil supply-demand dynamics. As a result, there was a significant decline in commodity prices starting at the endOrganization of the first quarter of 2020. However, during the second quarter of 2020, OPECPetroleum Exporting Countries and other oil producing countries agreed(“OPEC+”), in addition to reduce their crudeoverall reduced drilling and completion activity from U.S. producers. As global economies have reopened, demand for oil production, while U.S. producers substantially reduced or suspended drilling activity and in most cases curtailed production duegas has risen steadily post-pandemic and has been positively impacted by a global-wide transition away from coal to low oilnatural gas. The aforementioned factors, among others, led to heightened commodity prices and poor economics. The oil production cuts by OPEC and other producing countries were agreed upon and continuedduring certain time periods of 2022, particularly during the remainderbeginning of 2020, and U.S. drilling activity remained low throughout the second halfRussia’s invasion of 2020. These actions have aided in a partial recovery of global commodity prices.Ukraine. Specifically, NYMEX WTI spot prices for crude oil fell toreached a lowhigh of negative $37.63$123.70 per barrel on April 20, 2020 (due to depressed demandMarch 8, 2022, and insufficient storage capacity, particularly at the WTI physical settlement location in Cushing, Oklahoma) and have since recovered toNYMEX Henry Hub index price for natural gas reached a high of $49.10$9.85 per MMBtu on August 23, 2022. Subsequently, governments from several countries coordinated a simultaneous release of a portion of their strategic petroleum reserves, which increased global oil inventories to near normalized levels. In response, OPEC+ announced an agreement to curtail production by approximately two million barrels per day. Despite OPEC+’s largest production cut since the pandemic, crude oil prices continued to fall from their peak in mid-2022 due in part to government-coordinated petroleum releases, in addition to global recession concerns, a high interest rate environment, and lower than expected demand from China. Year-to-date, OPEC+ has undertaken a series of actions in an effort to support commodity prices. In April 2023, OPEC+ announced further production cuts, which were later extended. In addition, both Saudi Arabia and Russia announced unilateral production curtailments at separate times during 2023. These actions, coupled with relatively strong global demand and recent tensions in the Middle East, caused crude oil prices to increase during 2023, with NYMEX WTI spot prices reaching a high of $93.68 per barrel on December 18, 2020.September 27, 2023. However, further concerns of global economic growth and increases in oil and natural gas supply levels have resulted in additional price deterioration at the end of 2023.
The oil and natural gas industry is cyclical, and it is likely that commodity prices, as well as commodity price differentials, will continue to be volatile due to fluctuations in global supply and demand, inventory levels, the continued effects of COVID-19, geopolitical events, federal and state government regulations, weather conditions, the global transition to alternative energy sources, supply chain constraints and other factors. The following table highlights the quarterly average NYMEX price trends for NYMEX WTI spot prices for crude oil and NYMEX Henry Hub index price for natural gas since the first quarter of 2018:2021:
| | | | | | | | | | | | | | | | | | | | | | | | | | | | | | | | | | | | | | | | | | | | | | | | | | | | | | | | | | | | | | | | | | | | | | | |
| 2018 | | 2019 | | 2020 |
| Q1 | | Q2 | | Q3 | | Q4 | | Q1 | | Q2 | | Q3 | | Q4 | | Q1 | | Q2 | | Q3 | | Q4 |
| Crude Oil (per Bbl) | $ | 62.91 | | | $ | 68.07 | | | $ | 69.50 | | | $ | 58.81 | | | $ | 54.90 | | | $ | 59.81 | | | $ | 56.45 | | | $ | 56.94 | | | $ | 46.19 | | | $ | 28.00 | | | $ | 40.93 | | | $ | 42.66 | |
| Natural Gas (per MMBtu) | $ | 3.08 | | | $ | 2.85 | | | $ | 2.93 | | | $ | 3.77 | | | $ | 2.88 | | | $ | 2.51 | | | $ | 2.33 | | | $ | 2.34 | | | $ | 1.88 | | | $ | 1.65 | | | $ | 1.95 | | | $ | 2.47 | |
A sustained drop in oil, natural gas and NGL prices, such as those we have experienced during 2020, will not only decrease our revenues but can also reduce the amount of oil, natural gas and NGLs that we can produce economically and can therefore potentially lower our oil, natural gas and NGL reserve quantities. | | | | | | | | | | | | | | | | | | | | | | | | | | | | | | | | | | | | | | | | | | | | | | | | | | | | | | | | | | | | | | | | | | | | | | | |
| 2021 | | 2022 | | 2023 |
| Q1 | | Q2 | | Q3 | | Q4 | | Q1 | | Q2 | | Q3 | | Q4 | | Q1 | | Q2 | | Q3 | | Q4 |
| Crude Oil (per Bbl) | $ | 57.84 | | | $ | 66.06 | | | $ | 70.56 | | | $ | 77.09 | | | $ | 94.40 | | | $ | 108.34 | | | $ | 91.56 | | | $ | 82.64 | | | $ | 76.13 | | | $ | 73.78 | | | $ | 82.26 | | | $ | 78.32 | |
| Natural Gas (per MMBtu) | $ | 3.44 | | | $ | 2.88 | | | $ | 4.28 | | | $ | 4.74 | | | $ | 4.60 | | | $ | 7.39 | | | $ | 7.96 | | | $ | 5.55 | | | $ | 2.67 | | | $ | 2.12 | | | $ | 2.58 | | | $ | 2.74 | |
Lower commodity prices (including our realized differentials) and lower futures curves for oil and gas prices can also result in further impairments of our proved oil and natural gas properties or undeveloped acreage (such as the impairments discussed below under “Results of Operations”) and may materially and adversely affect our future business, operating cash flows, liquidity,
financial condition, results of operations, operating cash flows, liquidityfuture business and operations, and/or our ability to finance planned capital expenditures.expenditures, which could in turn impact our ability to comply with covenants under our Credit Agreement and senior notes. Lower realized prices may also reduce the borrowing base under CRP’s credit agreement (such as the reduction discussed below under “Financing Highlights”),our Credit Agreement, which is determined at the discretion of the lenders and is based on the collateral value of our proved reserves that have been mortgaged to the lenders. Upon a redetermination, if any borrowings in excess of the revised borrowing capacity were outstanding, we could be forced to immediately repay a portion of the debt outstanding under the Credit Agreement.
Due to the cyclical nature of the oil and gas industry, fluctuating demand for oilfield goods and services can put pressure on the pricing structure within our industry. As commodity prices rise, costs of oilfield goods and services generally also increase; however, during periods of commodity price declines, oilfield costs typically lag and do not adjust downward as fast as oil prices do. In addition, the U.S. inflation rate has been steadily increasing during 2022 and 2023. Inflationary pressures such as these may also result in increases to the costs of our oilfield goods, services and personnel, which can in turn cause our capital expenditures and operating costs to rise.
2023 Highlights and Future Considerations
Earthstone Merger
On August 21, 2023, we entered into an Agreement and Plan of Merger (“the Merger Agreement”) with Earthstone pursuant to which Permian Resources agreed to acquire Earthstone. On November 1, 2023 the Earthstone Merger was completed, and we issued 161.2 million shares of our Class A Common Stock and 49.5 million shares of our Class C Common Stock to Earthstone stockholders under the terms of the Merger Agreement, and we also assumed Earthstone’s debt upon closing of the Merger, which consisted of $1.05 billion of senior notes and $830 million in borrowings outstanding under its credit agreement. Additionally,facility at closing. Based on the lower price environmentfair value of our common stock on the closing date of the Earthstone Merger, November 1, 2023, the merger consideration was $2.9 billion.
Under the terms of the Merger Agreement (i) each share of Earthstone Class A Common Stock was converted into 1.446 shares (the “Exchange Ratio”) of our Class A Common Stock, (ii) each share of Earthstone Class B Common Stock was converted into 1.446 shares of our Class C Common Stock, (iii) each common unit of Earthstone Energy Holdings, LLC (“Earthstone OpCo”), a subsidiary of Earthstone, representing limited liability company membership interests in Earthstone OpCo were converted into common units of OpCo (“Common Unit”), equal to the Exchange Ratio.
As a result of the Earthstone Merger, we acquired approximately 223,000 net leasehold acres in the Permian Basin and its impactincreased our aggregate production to approximately 300,000 Boe per day. We believe that the Earthstone Merger will drive accretion across our key financial and operating metrics over the long term, enhance our shareholder returns, improve capital efficiency, add significant core inventory and provide increased acreage to our operations could impactposition in the Permian Basin. The operational and financial information set forth in this Annual Report on Form 10-K do not include the activity of Earthstone for periods prior to the completion of the Earthstone Merger on November 1, 2023.
2023 Bolt-On Acquisitions
On December 15, 2023 we completed the acquisition of approximately 7,000 net leasehold acres for an unadjusted purchase price of $98 million. The acquired assets consist largely of undeveloped acreage that is contiguous to one of our abilityexisting core acreage blocks in Eddy County, New Mexico.
On February 16, 2023, we completed an acquisition of approximately 4,000 net leasehold acres and 3,300 net royalty acres for an unadjusted purchase price of $98 million. The acquired assets consist largely of undeveloped acreage that is contiguous to comply withone of our existing core acreage blocks in Lea County, New Mexico.
2023 SWD Divestiture
On March 13, 2023, we completed the covenantssale of our operated saltwater disposal wells and the associated produced water infrastructure in Reeves County, Texas. The total cash consideration received at closing was $125 million, of which $65 million was directly related to the sale and transfer of control of our water assets, while the remaining $60 million consisted of contingent consideration that is tied to our future drilling, completion and water connection activity in Reeves County, Texas. The proceeds from the divestiture were used to fund the February 2023 bolt-on acquisition discussed above and to pay down incremental borrowings under our credit agreementfacility.
Return of Capital Program
During each quarter of the year ended December 31, 2023, we declared and senior notes.paid a quarterly dividend of $0.05 per share of Class A Common Stock and a quarterly distribution of $0.05 per Class C Common Stock (each of which has an underlying Common Unit of OpCo). Additionally, during the year ended December 31, 2023, our Board of Directors declared and paid
COVID-19 Outbreak
variable dividends and distributions totaling $0.17 per share of Class A Common Stock and Class C Common Stock. The COVID-19 outbreakcash dividends and its development into a pandemic in March 2020 have required that we take precautionary measures intendeddistributions paid to help minimize the risk to our business, employees, customers, contractors, suppliers and the communities in which we operate. Our operational employees have been and are currently able to work on site, while the vast majority of our non-operational employees have worked remotely or reported to our offices on a limited basis during 2020. We have taken various precautionary measures with respect to our operational employees, direct contractors and employees who returned to our offices or job sites during the year such as (i) requiring them to verify they have not experienced any symptoms consistent with COVID-19, or been in close contact with someone showing such symptoms, before reporting to the work site or office, (ii) self-quarantining any employees or contractors who have shown signs or symptoms of COVID-19 regardless of whether such person has been confirmed to be infected, (iii) imposing social distancing requirements on work sites and at our offices that are in accordance with the guidelines released by the Center for Disease Control (the “CDC”) as well as local and state authorities, (iv) requiring all employees and contractors to have a fit-test for and wear KN-95 type respirators while in our offices and work sites, and (v) encouraging all employees and contractors to follow the CDC recommended preventive measures (including those mentioned above) to limit the spread of COVID-19. We have not experienced any operational disruptions (including disruptions from our suppliers or service providers) as a result of the COVID-19 outbreak.
2020 Highlights and Future Considerations
The changes in the macro environment and related volatility in commodity prices that occurred during 2020 discussed above have significantly impacted our results of operationscommon unitholders totaled $236.0 million for the year ended December 31, 2020, and we believe that our future operating results and near-term financial condition could continue to be impacted, until such time that oil supply and demand dynamics re-balance and stabilize.2023.
Operational Highlights
We operated a five-rig drilling programAlso during the majorityyear ended 2023, we paid in aggregate $86.5 million to repurchase 7.2 million Common Units of the first quarterOpCo resulting in an equal number of 2020, which enabled us to complete and bring online 26 gross operated wells with an average effective lateral lengthassociated shares of approximately 7,000 feet during the first half of 2020. Due to the decline in crude oil prices and ongoing uncertainty regarding the oil supply-demand macro environment, in the second quarter of 2020, we suspended all drilling and completion activities in order to preserve capital. Specifically, we reducedClass C Common Stock simultaneously being canceled under our operated drilling rig program to zero rigs starting in April of 2020 and continued with no drilling rigs in operation until the end of the third quarter. In addition, given the weakness in realized oil prices, we voluntarily curtailed or shut-in approximately 20% of our production during the month of May, but we were able to bring the majority of this production back online in June as crude oil prices recovered, with minimal incremental cost.
We did not experience any further curtailments to our production during the remainder of 2020, and we recommenced drilling and completion activity in the third quarter of 2020. We completed an additional 5 gross operated wells during August of 2020 with an effective lateral length of approximately 9,000 feet, which were previously drilled during the first quarter of 2020. Further, we initiated a one-rig drilling program at the end of the third quarter, which we operated through the remainder of the year and added a second drilling rig in December. During the second half of 2020, we drilled six gross operated wells to total depth and began drilling an additional three gross operated wells, all of which we plan to complete in the first quarter of 2021.stock repurchase program.
Financing Highlights
On May 22, 2020,September 12, 2023, we completedissued at par $500 million of 7.00% senior notes due 2032 (the “Existing Notes”) in a 144A private placement. On December 13, 2023, we issued additional notes under this indenture dated September 12, 2023, that totaled an opportunistic private exchangeadditional $500 million of 7.00% senior notes (together with the Existing Notes, the “2032 Senior Notes”) which resulted in aggregate net proceeds to the Company of $982.5 million from the 2032 Senior Notes, after deducting the issuance discount of $2.5 million and debt issuance costs of $15.0 million. The proceeds from the 2032 Senior Notes were used to repay debt outstanding under our credit facility, including borrowings assumed in connection with the closing of the Earthstone Merger.
On December 20, 2023, we entered into the sixth amendment to the Credit Agreement (the “Sixth Amendment”). The Sixth Amendment, among other things, increased the borrowing base from $2.5 billion to $4.0 billion and maintained the elected commitments at $2.0 billion. On September 1, 2023, we entered into the fourth and fifth amendments to the Credit Agreement (the “Fourth Amendment” and the “Fifth Amendment”). The Fourth Amendment expanded the waiver of the automatic reduction of the borrowing base under the Credit Agreement to, among other things, allow for the assumption (or the issuance, in certain circumstances) of up to $1.05 billion principal amount of Permitted Senior Unsecured Notes (as defined in the Credit Agreement) in order to refinance debt pursuantassumed in the Earthstone Merger and otherwise allow for the issuance of Permitted Senior Unsecured Notes up to which $110.6 millionan aggregate principal amount of CRP’s 5.375% senior unsecured notes due 2026 (the “2026 Senior Notes”) and $143.7 million$1.0 billion. The Fifth Amendment, among other things, waived compliance with certain restrictive covenants to enable the Earthstone Merger, subject to customary conditions. In addition, the Fifth Amendment increased the aggregate principal amount of CRP’s 6.875% senior unsecured notes due 2027 (the “2027 Senior Notes” and, together with the 2026 Senior Notes, the “Senior Unsecured Notes”) were validly tendered and exchanged by certain eligible bondholders for consideration consisting of $127.1 million aggregate principal amount (the “Debt Exchange”) of newly issued 8.00% second lien senior secured notes due 2025 (the “Senior Secured Notes”). This transaction resulted in the removal of $127.1 million in aggregate principal amount of Senior Unsecured Notes from the long-term debt balance in our consolidated balance sheets.
On May 1, 2020, we entered into the second and third amendments to CRP’s amended and restated credit agreement (the “Q2 2020 Amendments”) with the lenders to our existing credit agreement. Pursuant to the Q2 2020 Amendments, the borrowing base and level of elected commitments were both reducedfrom $1.5 billion to $700.0 million from their previous amounts of $1.2 billion and $800.0 million, respectively.$2.0 billion. The Q2 2020 Amendments, which were approved by the lenders, permitted the issuanceFifth Amendment was effective as of the Senior Secured Notes in connection with the Debt Exchange, and they implemented an availability blocker of $31.8 million equal to 25%closing date of the newly issued and outstanding Senior Secured Notes. Among other things, the Q2 2020 Amendments also suspended theEarthstone Merger on November 1, 2023.
total funded debt to EBITDAX ratio (as specified in the existing credit agreement) through year-end 2021 and introduced a new financial covenant testing the ratio of first lien debt to EBITDAX.
In connection with the credit facility’s fall 2020 semi-annual redetermination process, the borrowing base and amount of elected commitments were reaffirmed at $700.0 million.
Results of Operations
For the Year Ended December 31, 20202023 Compared to the Year Ended December 31, 20192022
During 2023, we completed the Earthstone Merger, and the results of operations of Earthstone were included in our financial and operational data beginning on November 1, 2023. During 2022, we completed the Colgate Merger, and the results of operations of Colgate were included in our financial and operational data beginning on September 1, 2022.
The following table provides the components of our net revenues and net production (net of all royalties, overriding royalties and production due to others) for the periods indicated, as well as each period’s average prices and average daily production volumes:
| | | | | | | | | | | | | | | | | | | | | | | |
| Year Ended December 31, | | Increase/(Decrease) |
| 2020 | | 2019 | | $ | | % |
| Net revenues (in thousands): | | | | | | | |
| Oil sales | $ | 475,694 | |
| $ | 810,655 | | | $ | (334,961) | | | (41) | % |
| Natural gas sales | 46,776 | | | 44,556 | | | 2,220 | | | 5 | % |
| NGL sales | 57,986 | | | 89,119 | | | (31,133) | | | (35) | % |
| Oil and gas sales | $ | 580,456 | | | $ | 944,330 | | | $ | (363,874) | | | (39) | % |
| | | | | | | |
| Average sales price: | | | | | | | |
| Oil (per Bbl) | $ | 36.02 | | | $ | 52.02 | | | $ | (16.00) | | | (31) | % |
| Effect of derivative settlements on average price (per Bbl) | (3.15) | | | (1.13) | | | (2.02) | | | (179) | % |
| Oil net of hedging (per Bbl) | $ | 32.87 | | | $ | 50.89 | | | $ | (18.02) | | | (35) | % |
| | | | | | | |
| Average NYMEX price for oil (per Bbl) | $ | 39.44 | | | $ | 57.03 | | | $ | (17.59) | | | (31) | % |
| Oil differential from NYMEX | (3.42) | | | (5.01) | | | 1.59 | | | 32 | % |
| | | | | | | |
| Natural gas (per Mcf) | $ | 1.13 | | | $ | 1.07 | | | $ | 0.06 | | | 6 | % |
| Effect of derivative settlements on average price (per Mcf) | (0.12) | | | 0.29 | | | (0.41) | | | (141) | % |
| Natural gas net of hedging (per Mcf) | $ | 1.01 | | | $ | 1.36 | | | $ | (0.35) | | | (26) | % |
| | | | | | | |
| Average NYMEX price for natural gas (per Mcf) | $ | 1.99 | | | $ | 2.52 | | | $ | (0.53) | | | (21) | % |
| Natural gas differential from NYMEX | (0.86) | | | (1.45) | | | 0.59 | | | 41 | % |
| | | | | | | |
| NGL (per Bbl) | $ | 12.91 | | | $ | 17.03 | | | $ | (4.12) | | | (24) | % |
| | | | | | | |
| Net production: | | | | | | | |
| Oil (MBbls) | 13,207 | | | 15,582 | | | (2,375) | | | (15) | % |
| Natural gas (MMcf) | 41,302 | | | 41,703 | | | (401) | | | (1) | % |
| NGL (MBbls) | 4,490 | | | 5,234 | | | (744) | | | (14) | % |
Total (MBoe)(1) | 24,581 | | | 27,766 | | | (3,185) | | | (11) | % |
| | | | | | | |
| Average daily net production: | | | | | | | |
| Oil (Bbls/d) | 36,084 | | | 42,692 | | | (6,608) | | | (15) | % |
| Natural gas (Mcf/d) | 112,848 | | | 114,254 | | | (1,406) | | | (1) | % |
| NGL (Bbls/d) | 12,269 | | | 14,338 | | | (2,069) | | | (14) | % |
Total (Boe/d)(1) | 67,161 | | | 76,072 | | | (8,911) | | | (12) | % |
| | | | | | | | | | | | | | | | | | | | | | | |
| Year Ended December 31, | | Increase/(Decrease) |
| 2023 | | 2022 | | $ | | % |
| Net revenues (in thousands): | | | | | | | |
| Oil sales | $ | 2,696,777 | |
| $ | 1,622,035 | | | $ | 1,074,742 | | | 66 | % |
Natural gas sales(1) | 142,077 | | | 276,957 | | | (134,880) | | | (49) | % |
NGL sales(2) | 282,039 | | | 232,273 | | | 49,766 | | | 21 | % |
| Oil and gas sales | $ | 3,120,893 | | | $ | 2,131,265 | | | $ | 989,628 | | | 46 | % |
| | | | | | | |
| Average sales prices: | | | | | | | |
| Oil (per Bbl) | $ | 75.84 | | | $ | 88.95 | | | $ | (13.11) | | | (15) | % |
| Effect of derivative settlements on average price (per Bbl) | 1.81 | | | (4.85) | | | 6.66 | | | 137 | % |
| Oil including the effects of hedging (per Bbl) | $ | 77.65 | | | $ | 84.10 | | | $ | (6.45) | | | (8) | % |
| | | | | | | |
| Average NYMEX WTI price for oil (per Bbl) | $ | 77.62 | | | $ | 94.24 | | | $ | (16.62) | | | (18) | % |
| Oil differential from NYMEX | (1.78) | | | (5.29) | | | 3.51 | | | 66 | % |
| | | | | | | |
Natural gas price excluding the effects of GP&T (per Mcf)(1) | $ | 1.60 | | | $ | 4.86 | | | $ | (3.26) | | | (67) | % |
| Effect of derivative settlements on average price (per Mcf) | 0.29 | | | (0.53) | | | 0.82 | | | 155 | % |
| Natural gas including the effects of hedging (per Mcf) | $ | 1.89 | | | $ | 4.33 | | | $ | (2.44) | | | (56) | % |
| | | | | | | |
| Average NYMEX Henry Hub price for natural gas (per MMBtu) | $ | 2.53 | | | $ | 6.38 | | | $ | (3.85) | | | (60) | % |
| Natural gas differential from NYMEX | (0.93) | | | (1.52) | | | 0.59 | | | 39 | % |
| | | | | | | |
NGL price excluding the effects of GP&T (per Bbl)(2) | $ | 22.83 | | | $ | 35.97 | | | $ | (13.14) | | | (37) | % |
| | | | | | | |
| Net production: | | | | | | | |
| Oil (MBbls) | 35,560 | | | 18,235 | | | 17,325 | | | 95 | % |
| Natural gas (MMcf) | 119,182 | | | 59,692 | | | 59,490 | | | 100 | % |
| NGL (MBbls) | 15,569 | | | 6,750 | | | 8,819 | | | 131 | % |
Total (MBoe)(3) | 70,992 | | | 34,934 | | | 36,058 | | | 103 | % |
| | | | | | | |
| Average daily net production: | | | | | | | |
| Oil (Bbls/d) | 97,424 | | | 49,958 | | | 47,466 | | | 95 | % |
| Natural gas (Mcf/d) | 326,525 | | | 163,539 | | | 162,986 | | | 100 | % |
| NGL (Bbls/d) | 42,654 | | | 18,494 | | | 24,160 | | | 131 | % |
Total (Boe/d)(3) | 194,499 | | | 95,708 | | | 98,791 | | | 103 | % |
(1) Natural gas sales for the year ended December 31, 2023 include $48.9 million of gathering, processing and transportation costs (“GP&T”) that are reflected as a reduction to natural gas sales and $13.1 million for the year ended December 31, 2022. Natural gas average sales price, however, excludes $0.41 per Mcf of such GP&T charges for the year ended December 31, 2023and $0.22 for the year ended December 31, 2022.
(2) NGL sales for the year ended December 31, 2023 include $73.3 million of GP&T that are reflected as a reduction to NGL sales and $10.6 million for the year ended December 31, 2022. NGL average sales price, however, excludes $4.71 per Bbl of such GP&T charges for the year ended December 31, 2023 and $1.56 per Bbl for the year ended December 31, 2022.
(3) Calculated by converting natural gas to oil equivalent barrels at a ratio of six Mcf of natural gas to one Boe.
Oil, Natural Gas and NGL Sales Revenues. Total net revenues for the year ended December 31, 2020 were lower2023 increased by $363.9 million,$1.0 billion, or 39%46%, compared to the year ended December 31, 2019.2022. Revenues are a function of oil, natural gas and NGL volumes sold and average commodity prices realized.
Average realized sale prices for oil and NGLs decreased for the year ended December 31, 2020 as compared to 2019. The average price for oil before the effects of hedging decreased 31% and the average price for NGLs decreased 24% between periods. The 31% decrease in the average realized oil price was the result of lower NYMEX crude prices in 2020 (average NYMEX oil prices decreased 31%), which was minimally offset by improved oil differentials of $1.59 per Bbl during 2020. The
24% decrease in average realized NGL prices between periods was primarily attributable to lower Mont Belvieu spot prices for plant products in 2020. Conversely, the average realized sales price of natural gas before the effects of hedging increased 6% in 2020 as compared to 2019. This increase was mainly due to improved gas differentials ($0.59 per Mcf), which was partially offset by lower average NYMEX gas prices (down $0.53 per Mcf) between periods. The improvement in gas differentials is the result of higher natural gas prices realized in West Texas as several producers shut-in wells and curtailed production in the Permian Basin during the year and as new pipelines have been placed into service. These pipelines have provided relief from the gas takeaway capacity constraints experienced in 2019. The market prices for oil, natural gas and NGLs have all been significantly impacted by lower demand globally for oil and gas as a result of COVID-19 as well as by supply disruptions from the Russia-Saudi oil price war early in 2020, which combined have resulted in significant price declines starting in March 2020 as discussed in the market conditions section above.
Net production volumes for oil, natural gas, and NGLs decreased 15%increased 95%, 1%100% and 14%131%, respectively, between periods. The oil production volume decrease between periods was the result of (i) the temporary suspension of our drilling and completion activity during most of the second and third quarters of 2020, whichincrease resulted in onlyfrom placing 183 wells on production since December 31, new2022 as compared to 95 wells being completed and brought online during 2020 and added 2,849 MBbls of net oil production during the year ended December 31, 2020 as compared to 842022. Oil production also benefited from wells completedacquired in the mergers with Colgate and brought online during 2019 adding 5,611Earthstone, which collectively added 9,852 MBbls of net oil production duringto the year ended December 31, 2019; (ii)2023 compared to 3,517 MBbls of net oil production added from the curtailment of a portion of ourColgate Merger to the year ended December 31, 2022. These oil volume increases were partially offset by normal production during the second quarter of 2020; and (iii) normal field production declinesdecline across our existing wells. Natural gas and NGLs are produced concurrently with our crude oil volumes, typically resulting in a high correlation between fluctuations in oil quantities sold and natural gas and NGL quantities sold. However, during 2020, we flared significantly less wellhead gas as compared to 2019, resultingsold driving the 100% and 131%, respectively, increase in a higher ratio of natural gas and NGL sales comparedvolumes between periods. The higher increase in gas and NGL volumes between periods as compare to the 95% increase in oil salesvolumes was due to the producing wells acquired in the period. In addition, for over halfEarthstone Merger, which have a higher gas-to-oil ratio than our existing production base, and this has resulted in more volumes of 2020,gas and NGLs being added to our total production stream since the main processorclosing of the Earthstone Merger on November 1, 2023. Additionally, certain processors of our raw gas operated in ethane-rejectionhigher ethane-recovery mode during the year ended December 31, 2023 as compared to operatingthe year ended December 31, 2022, which resulted in ethane-recovery during the majoritya higher percentage of 2019. As a result, we sold an increased amount of natural gasNGLs being recovered from our wet gas stream and recovered fewer NGLs during 2023.
These production increases were partially offset by decreases in the 2020 period, resulting in a lower decline inaverage realized sale prices for oil, natural gas volumes (down 1%) asand NGLs which decreased 15%, 67% and 37%, respectively, for the year ended December 31, 2023 compared to the 14%same 2022 period. The 15% decrease in the average realized oil price was mainly the result of 18% lower NYMEX crude prices between periods, which was slightly offset by improved oil differentials. The average realized sales price of natural gas decreased 67% due to 60% lower average NYMEX gas prices between periods as well as a larger proportional gas differential during the year ended December 31, 2023 compared to the same 2022 period. The 37% decrease in average realized NGL volumesprices between periods.periods was primarily attributable to lower Mont Belvieu spot prices for plant products in 2023 compared to 2022. The market prices for oil and natural gas have been impacted by global supply and demand factors throughout 2022 and 2023 as discussed in the market conditions section above.
Operating Expenses. The following table sets forth selected operating expense data for the periods indicated:
| | | | | | | | | | | | | | | | | | | | | | | |
| Year Ended December 31, | | Increase/(Decrease) |
| 2020 | | 2019 | | $ | | % |
| Operating costs (in thousands): | | | | | | | |
| Lease operating expenses | $ | 109,282 | | | $ | 145,976 | | | $ | (36,694) | | | (25) | % |
| Severance and ad valorem taxes | 39,417 | | | 63,200 | | | (23,783) | | | (38) | % |
| Gathering, processing, and transportation expense | 71,309 | | | 72,834 | | | (1,525) | | | (2) | % |
| Operating costs per Boe: | | | | | | | |
| Lease operating expenses | $ | 4.45 | | | $ | 5.26 | | | $ | (0.81) | | | (15) | % |
| Severance and ad valorem taxes | 1.60 | | | 2.28 | | | (0.68) | | | (30) | % |
| Gathering, processing, and transportation expense | 2.90 | | | 2.62 | | | 0.28 | | | 11 | % |
| | | | | | | | | | | | | | | | | | | | | | | |
| Year Ended December 31, | | Increase/(Decrease) |
| 2023 | | 2022 | | Change | | % |
| Operating costs (in thousands): | | | | | | | |
| Lease operating expenses | $ | 373,772 | | | $ | 171,867 | | | $ | 201,905 | | | 117 | % |
| Severance and ad valorem taxes | 240,762 | | | 155,724 | | | 85,038 | | | 55 | % |
| Gathering, processing, and transportation expense | 89,282 | | | 97,915 | | | (8,633) | | | (9) | % |
| Operating cost metrics: | | | | | | | |
| Lease operating expenses (per Boe) | $ | 5.26 | | | $ | 4.92 | | | $ | 0.35 | | | 7 | % |
| Severance and ad valorem taxes (% of revenue) | 7.7 | % | | 7.3 | % | | 0.4 | % | | 6 | % |
| Gathering, processing, and transportation expense (per Boe) | 1.26 | | | 2.80 | | | (1.55) | | | (55) | % |
Lease Operating Expenses. Lease operating expenses (“LOE”) for the year ended December 31, 2020 decreased $36.72023 increased $201.9 million compared to the year ended December 31, 2019. Lower2022. This increase in LOE for 2020 was primarily related to a $21.9 million decrease in workover expense between periodshigher fixed and semi-variable well costs, such as a result of less workover activitywater disposal, equipment rentals, repair work, wellhead chemicals, labor and a $14.8 million decrease in well operating expenseselectricity, associated with cost reduction initiatives, described below, asour significantly higher well as lower variable and semi-variable costs stemmingcount from the 11% production decline between periods. These decreases were partially offset by LOE costs associated with ournew producing wells drilled or acquired. The higher well count in 2020. We had 3862023 was due to (i) 309 gross operated horizontal wells asacquired in the Colgate Merger on September 1, 2022 that operated for the entire year of 2023 compared to four months in 2022, (ii) 183 wells placed on production since December 31, 2020 compared to 3492022, and (iii) 1,190 gross operated horizontal wells as of December 31, 2019. The net increaseacquired in well count was mainly the result of our drilling activity adding 31 gross operated wells in 2020, which was further adjusted for acquisitions and divestitures.Earthstone Merger on November 1, 2023.
LOE on a per Boe basis decreased when comparing the year ended December 31, 2020 to the year ended December 31, 2019. LOE per Boe was $4.45$5.26 for the year ended December 31, 2020,2023, which represents a decreasean increase of $0.81$0.35 per Boe (or 15%7%) from 2019.the year ended December 31, 2022. This decreaseincrease was primarily driven by per Boe increases associated with higher water disposal rates between periods, resulting from the sale of our operated saltwater disposal system in rateMarch 2023 (see Note 3—Acquisitions and Divestitures for additional information on the divestiture). This increase was mainly due to the lower level of workover activity discussed above as well as cost reduction initiatives we have undertaken such as (i) moving multiple wells off generators to more cost-efficient electrical line-power, (ii) switching wells away from electric submersible pumps (“ESPs”) to more reliable and lower cost gas lift, and (iii) performing field reviews to reduce or eliminate various costs for contract labor, oilfield equipment and supplies. These decreases were partially offset by per BOE cost increases between periods associated with fixedfewer workovers and lower semi-variable well costs, that don’t decrease at the same rate as declines in production such as monthly rental fees for compressorswellhead chemicals, labor and other equipment, wellhead chemical costs, and water handling costs.electricity that resulted from operational efficiencies.
Severance and Ad Valorem Taxes. Severance and ad valorem taxes for the year ended December 31, 2020 decreased $23.82023 increased $85.0 million compared to the year ended December 31, 2019.2022. Severance taxes are primarily based on the market value of our
production at the wellhead, while ad valorem taxes are generally based on the assessed taxable value of our proved developed oil and natural gas properties and vary across the different counties in which we operate. Severance taxes for the year ended 2020 decreased $17.9 2023 increased $63.4
million compared to the same 20192022 period primarily due to lowerhigher oil, natural gas and NGL revenues between periods. Ad valorem taxes decreased $5.9 million between periods increased by $21.6 million due to lower(i) higher tax assessments on our oil and gas reserve values. values, (ii) incurring a full year of ad valorem taxes on the proved developed properties acquired in the Colgate Merger compared to four months in 2022, and (iii) additional expense incurred on the proved developed properties acquired in the Earthstone Merger on November 1, 2023.
Severance and ad valorem taxes as a percentage of total net revenues remained consistent between periods at 6.8% and 6.7%increased to 7.7% for the yearsyear ended December 31, 2020 and 2019, respectively.2023 as compared to 7.3% for the year ended December 31, 2022. This increase in rate was primarily the result of higher ad valorem taxes as discussed above.
Gathering, Processing and Transportation Expenses. Gathering, processing and transportation costs (“GP&T”) for the year ended December 31, 20202023 decreased $1.5$8.6 million compared to the year ended December 31, 2019 due to an $8.3 million decrease in plant processing, transportation and gathering fees incurred between periods as a result of lower wellhead production in 2020. This was partially offset by a $6.5 million decrease in reimbursements (net of related fees) received from third parties for their usage of our available firm transportation capacity.
On2022. Additionally, GP&T decreased on a per Boe basis GP&T increased 11% from $2.62$2.80 for the year ended December 31, 20192022 to $2.90$1.26 per Boe for the year ended December 31, 2020. On2023. These decreases are primarily due to a naturalhigher proportion of our GP&T costs being recognized as a reduction to our gas and NGLs volume basis (i.e. excluding crude oil barrels) the Boe rate likewise increased between periods from $5.98 to $6.27NGL revenues for the year ended December 31, 2019 and 2020, respectively. These rate increases were mainly attributable2023 as compared to a lower amount2022. This classification of FT reimbursements (net of related fees) for the usageGP&T costs in revenues is required under ASC Topic 606, Revenue from contracts with Customers, whenever our gas processers transfer control of our available FT capacity as referenced above.raw gas at delivery points prior to, or at, the inlet of gas processing plants. Refer to Note 15—Revenues under Part II, Item 8 of this Annual Report for additional information on our natural gas gathering and processing contracts.
Depreciation, Depletion and Amortization. The following table summarizes our depreciation, depletion and amortization (“DD&A”) for the periods indicated:
| | Year Ended December 31, |
| Year Ended December 31, | | | Year Ended December 31, |
| (in thousands, except per Boe data) | (in thousands, except per Boe data) | 2020 | | 2019 | (in thousands, except per Boe data) | 2023 | | 2022 |
| Depreciation, depletion and amortization | Depreciation, depletion and amortization | $ | 358,554 | | | $ | 444,243 | |
| Depreciation, depletion and amortization per Boe | Depreciation, depletion and amortization per Boe | $ | 14.59 | | | $ | 16.00 | |
Our DD&A rate can fluctuate as a result of finding and development costs incurred, acquisitions, impairments, as well as changes in proved developed reserves and proved undeveloped reserves. For the year ended December 31, 2020,Our DD&A expense amounted to $358.6 million, a decrease of $85.7 million over 2019. The primary factor contributing to lower DD&A expense in 2020rate per Boe was the decrease in our overall production volumes between periods, which decreased DD&A expense by $51.0 million$14.19 for the year ended December 31, 2020, while lower DD&A rates2023 compared to $12.73 in 2022. This increase in the rate between periods lowered DD&A expense by $34.7 million.
DD&A per Boe was $14.59 for the year ended December 31, 2020 compared to $16.00 in 2019. This decrease in DD&A rate was primarily due to (i) the proved property impairment recognizedfinding and development rate of approximately $10.50 per BOE for 2023, as incorporated in the first quarter of 2020, which lowered the carrying value of our depletion base by $591.8 millionDD&A computation and (ii) upwarddownward proved reserve revisions to proved developed reservesprimarily because of 18.3 MMBoe for the year ended December 31, 2020 related to lower operating costs that we realizeddecreasing oil prices during 2020, which were partially offset by downward revisions associated with lower SEC reserve pricing.
Impairment and Abandonment Expense. For the year ended December 31, 2020, $691.2 million of impairment and abandonment expense was incurred related to certain of our oil and gas properties. This expense consisted of (i) a $591.8 million non-cash impairment of our proved properties in the first quarter as a result of the depressed NYMEX oil and gas futures curves as of March 31, 2020; (ii) $78.8 million related to the amortization of leasehold expiration costs associated with individually insignificant unproved properties, and (iii) a $20.6 million non-cash impairment of other noncurrent assets, which represented advances paid to a third-party broker to acquire exploratory leasehold acres on our behalf, which acres are not currently included in our current development plan.
We review our proved oil and natural gas properties for impairment whenever events and circumstances indicate that the fair value of these assets may be below their carrying value. Fair values of our oil and natural gas properties are estimated using an income approach that is based on the discounted expected future net cash flows from these assets. These valuations are based on inputs which require significant judgment and include estimates of: (i) oil and gas reserves quantities; (ii) future production decline rates; (iii) future operating and development costs; (iv) future commodity prices, including price differentials; and (v) a market participant-based weighted-average cost of capital discount rate.
We performed an impairment assessment of all our proved oil and gas properties as of March 31, 2020. Two of our fields were subject to impairment write-downs as quantified above, but the remaining five fields were not impaired due to their undiscounted cash flows exceeding their carrying values by 30% to over 100%. This impairment assessment was performed using commodity price futures curves as of March 31, 2020. If future oil, natural gas and NGL prices were to decline to lower levels, or other estimates impacting future net cash flows deteriorate (e.g. reserves, price differentials, future operating and/or development costs), our proved oil and gas properties could be subject to additional impairment write-downs in future periods. We did not recognize any additional impairment write-downs with respect to our proved oil and gas properties for the remainder of 2020.
For the year ended December 31, 2019, $47.2 million of impairment and abandonment expense was incurred related to undeveloped leasehold acreage. This expense consisted of (i) $19.1 million related to non-core acreage that expired during 2019 after efforts to extend, sell or trade these leases were unsuccessful, (ii) $16.6 million for impaired acreage following an acreage sale initiated in the first quarter of 2019, and (iii) $11.5 million related to the amortization of leasehold expiration costs associated with individually insignificant unproved properties.
Exploration and Other Expenses. The following table summarizes exploration and other expenses for the periods indicated:
| | | | | | | | | | | |
| Year Ended December 31, |
| (in thousands) | 2020 | | 2019 |
| Geological and geophysical costs | $ | 4,533 | | | $ | 8,424 | |
| Stock-based compensation - equity awards | 1,433 | | | 2,682 | |
| Stock-based compensation - liability awards | 90 | | | — | |
| Exploratory dry hole costs | 6,615 | | | — | |
| Rig termination fees | 3,046 | | | 284 | |
| Severance payments | 722 | | | — | |
| Other expenses | 1,916 | | | — | |
| Exploration and other expenses | $ | 18,355 | | | $ | 11,390 | |
Exploration and other expenses were $18.4 million for the year ended December 31, 2020 compared to $11.4 million for the year ended December 31, 2019. Exploration and other expenses mainly consists of topographical studies, geographical and geophysical (“G&G”) projects, salaries and expenses of G&G personnel and includes other operating costs. The period over period increase was primarily related to (i) $6.6 million in exploratory dry hole costs incurred in 2020; (ii) $2.8 million in higher rig termination fees as a result of temporarily suspending drilling activity in 2020; and (iii) $1.7 million in environmental remediation costs incurred in 2020 associated with a recently acquired proved property. These increases were partially offset by (i) a $1.7 million decrease in G&G project and seismic costs incurred between periods, and (ii) $2.2 million in lower G&G personnel costs and $1.2 million in lower stock-based compensation in the 2020 period, both of which were associated with the lower headcount from our 2020 workforce reduction (as further described below under General and Administrative Expenses).2023.
General and Administrative Expenses. The following table summarizes our general and administrative (“G&A”) expenses for the periods indicated: | | | | | | | | | | | |
| Year Ended December 31, |
| (in thousands) | 2023 | | 2022 |
| Cash general and administrative expenses | $ | 85,978 | | | $ | 60,584 | |
| Stock-based compensation - equity awards | 75,877 | | | 113,759 | |
| Stock-based compensation - liability awards | — | | | (24,174) | |
| Stock-based compensation - cash settled awards | — | | | 9,385 | |
| General and administrative expenses | $ | 161,855 | | | $ | 159,554 | |
| | | | | | | | | | | |
| Year Ended December 31, |
| (in thousands) | 2020 | | 2019 |
| Cash general and administrative expenses | $ | 46,356 | | | $ | 52,841 | |
| Stock-based compensation - equity awards | 19,533 | | | 26,315 | |
| Stock-based compensation - liability awards | 3,512 | | | — | |
| Severance payments | 3,466 | | | — | |
| General and administrative expenses | $ | 72,867 | | | $ | 79,156 | |
G&A expenses for the year ended December 31, 20202023 were $72.9$161.9 million compared to $79.2$159.6 million for the year ended December 31, 2019. Lower2022. Higher G&A expenses incurred in 2020 were primarily2023 was the result of a reduction$25.4 million increase in cash G&A between periods. This increase was primarily due to (i) higher payroll and employee-related costs associated with our workforceG&A headcount, which increased from a year to date monthly average of 126 as of December 31, 2022 to 185 as of December 31, 2023 stemming from the Colgate and reduced salaries effective May 1, 2020 for employees that were retained. These two factors combined resulted inEarthstone Mergers; (ii) higher professional and legal fees between periods; and (iii) higher rent, software and office expenses between periods associated with the higher headcount. This was partially offset by a $5.4$23.1 million decrease in payroll and other personnel related costs and a $6.8 million decrease in equity-based stocktotal stock-based compensation expense between periods. In addition, in 2019 we incurred a $1.8 million charge for the settlement of a water disposal contract dispute that did not re-occur in 2020. These decreases were partially offset by 2020 charges relatedThis decrease was largely due to (i) $3.5a $19.4 million of nonrecurring severance payments paid to G&A employees who were includednet decrease in our workforce reduction and (ii) $3.5 million in stockstock-based compensation expense related to liability classified awards granted to G&A employees in the third quarter of 2020 that we will settlewere settled in cash upon vesting. Theseor reclassified as equity in 2022 (we no longer have any liability stock-basedbased equity awards are recorded at their respective fair values,outstanding); and such fair values are re-measured each balance sheet date (refer(ii) a $6.5 million decrease in equity awards compensation costs associated with less expense recognized for the acceleration of certain awards for officer and employee exits stemming from the Colgate Merger, which totaled $40.0 million for the year ended December 31, 2023 as compared to $46.5 million for the year
ended December 31, 2022. Refer to Note 6—7—Stock-Based Compensation under Part II, Item 8 of this Annual Report for additional information regarding the liability awards).these awards.
47Merger and integration expense. Merger and integration expense for the year ended December 31, 2023 was $125.3 million. compared to $77.4 million for the year ended December 31, 2022. Merger and integration expense incurred during the year ended December 31, 2023 consisted of (i) $63.4 million in bankers’ advisory, legal, consultancy and accounting fees associated with the Earthstone Merger; (ii) $43.5 million in severance and related benefits associated with employee terminations that occurred in 2023 in connection with the Earthstone Merger; and (iii) $18.4 million in costs incurred during 2023 related to the Colgate Merger primarily related to employee severance charges and integration and consulting expenses. During the year ended December 31, 2022, merger and integration expense primarily consisted of (i) $40.0 million in bankers’ advisory fees related to the Colgate Merger; (ii) $24.0 million in severance and related benefits associated with employee terminations that occurred in connection with the Colgate Merger; and (iii) legal, accounting and consultancy fees.
TableExploration and Other Expenses. The following table summarizes exploration and other expenses for the periods indicated: | | | | | | | | | | | |
| Year Ended December 31, |
| (in thousands) | 2023 | | 2022 |
| Geological and geophysical costs | $ | 11,342 | | | $ | 7,401 | |
| Stock-based compensation - equity awards | 2,541 | | | 2,721 | |
| Other expenses | 5,454 | | | 1,256 | |
| Exploration and other expenses | $ | 19,337 | | | $ | 11,378 | |
Exploration and other expenses were $19.3 million for the year ended December 31, 2023 compared to $11.4 million for the year ended December 31, 2022. Exploration and other expenses mainly consist of Contents
topographical studies, geographical and geophysical (“G&G”) projects, salaries and expenses of G&G personnel and include other operating costs. The period over period increase was primarily related to (i) higher G&G personnel costs associated with increased headcount; (ii) increased costs incurred on G&G projects and seismic studies; and (iii) $1.5 million in costs incurred in 2023 associated with nonrecurring legal settlements.Other Income and Expense.
Interest Expense. The following table summarizes interest expense for the periods indicated: | | | | | | | | | | | |
| Year Ended December 31, |
| (in thousands) | 2023 | | 2022 |
| Credit Facility | $ | 30,049 | | | $ | 15,974 | |
| 5.375% Senior Notes due 2026 | 15,557 | | | 15,557 | |
| 7.75% Senior Notes due 2026 | 23,250 | | | 7,750 | |
| 6.875% Senior Notes due 2027 | 24,500 | | | 24,500 | |
| 8.00% Senior Notes due 2027 | 7,333 | | | — | |
| 3.25% Convertible Senior Notes due 2028 | 5,525 | | | 5,525 | |
| 5.875% Senior Notes due 2029 | 41,125 | | | 13,708 | |
| 9.875% Senior Notes due 2031 | 8,229 | | | — | |
| 7.00% Senior Notes due 2032 | 12,347 | | | — | |
| Amortization of debt issuance costs, debt discount and debt premium | 16,078 | | | 15,652 | |
| Interest capitalized | (7,813) | | | (3,021) | |
| Other interest expense | 1,029 | | | — | |
| Total | $ | 177,209 | | | $ | 95,645 | |
| | | | | | | | | | | |
| Year Ended December 31, |
| (in thousands) | 2020 | | 2019 |
| Credit facility | $ | 12,973 | | | $ | 8,371 | |
| 6.875% Senior Notes due 2027 | 28,368 | | | 27,309 | |
| 5.375% Senior Notes due 2026 | 17,884 | | | 21,500 | |
| 8.000% Senior Secured Notes due 2025 | 6,185 | | | — | |
| Amortization of debt issuance costs and debt discount | 5,923 | | | 2,861 | |
| Interest capitalized | (2,141) | | | (4,050) | |
| Total | $ | 69,192 | | | $ | 55,991 | |
Interest expense was $13.2$81.6 million higher for the year ended December 31, 20202023 compared to the year ended December 31, 2019. Higher interest expense incurred during the year ended 2020 was2022 mainly due to (i) $6.2$58.5 million in additional interest expense incurred on our new Senior Secured Notes issuedfrom the senior notes that were assumed in May of 2020 in connection with our Debt Exchange (refer to Note 4—Long-Term Debt under Part II, Item 8 of this Annual Report),the Colgate and Earthstone Mergers; (ii) $4.6$14.1 million in higher interest expense incurred on our credit facility due to a higher weighted average borrowings outstanding and effective interest rate during 2023; and (iii) $3.1$12.3 million in higher amortization of debt issuance costs and the debt discount recognized in May 2020 in connection with our Debt Exchange and (iv) $1.9 million in lower capitalized interest due to our decreased capital spend in 2020. These increases were partially offset by lower interest expense incurred on our 2026 Senior Notes during the 2020 period, as $110.6 million of the 2026 Senior Notesdue 2032 that were extinguishedissued in our Debt Exchange transaction.September 2023.
Our weighted average borrowings outstanding under our credit facilityCredit Agreement were $334.2$357.0 million during 20202023 compared to $154.8$235.5 million in 2019.2022. Our credit facility’sCredit Agreement’s weighted average effective interest rate (which is a LIBOR-based rate) was 3.3% for 2020 as compared to 3.7% during 2019 as a result of lower LIBOR in 2020.
Gain on exchange of debt. A gain of $143.4 million was recognized7.1% and 4.5% for the yearyears ended December 31, 2020 related2023 and 2022, respectively, due to higher rates on our opportunistic Debt Exchange that was executed in the second quartervariable-rate borrowings between periods.
Net Gain (Loss) on Derivative Instruments. Net gains and losses are a function of (i) fluctuationschanges in mark-to-market derivative fair values associated with changesfluctuations in the forward price curves for the commodities underlying each of our hedge contracts outstanding and (ii) monthly cash settlements of our hedged derivative positions.on any closed out hedge positions during the period.
The following table presents gains and losses on our derivative instruments for the periods indicated:
| | | | | | | | | | | |
| Year Ended December 31, |
| (in thousands) | 2020 | | 2019 |
| Realized cash settlement gains (losses) | $ | (46,651) | | | $ | (5,655) | |
| Non-cash mark-to-market derivative gain (loss) | (17,884) | | | 4,094 | |
| Total | $ | (64,535) | | | $ | (1,561) | |
| | | | | | | | | | | |
| Year Ended December 31, |
| (in thousands) | 2023 | | 2022 |
| Realized cash settlement gains (losses) | $ | 99,410 | | | $ | (120,105) | |
| Non-cash mark-to-market derivative gain (loss) | 14,606 | | | 77,737 | |
| Total | $ | 114,016 | | | $ | (42,368) | |
Income Tax (Expense) Benefit:Expense: The following table summarizes our pre-tax income (loss) and income tax (expense) benefitexpense for the periods indicated.
| | | | | | | | | | | |
| Year Ended December 31, |
| (in thousands) | 2020 | | 2019 |
| Income (loss) before income taxes | $ | (770,323) | | | $ | 22,211 | |
| Income tax (expense) benefit | 85,124 | | | (5,797) | |
| | | | | | | | | | | |
| Year Ended December 31, |
| (in thousands) | 2023 | | 2022 |
| Income before income taxes | $ | 1,035,648 | | | $ | 870,132 | |
| Income tax expense | (155,945) | | | (120,292) | |
Our provision for income taxes for the years ended December 31, 20202023 and 20192022 differs from the amounts that would be provided by applying the statutory U.S. federal income tax rate of 21% to pre-tax book income (loss) primarily due to (i) the portion of pre-tax net income that is attributable to our non-controlling interest and which is therefore not taxable to the Company; (ii) other permanent differences; (ii)(iii) state income taxes; and (iii)(iv) any changes during the period in our deferred tax asset valuation allowance.
For the year ended December 31, 2020, we recognized a deferred tax asset valuation allowance of $77.0 million against net operating losses that2023 we generated during the period, which are estimated as unlikely to be realized in future periods. This
increase in valuation allowance was the$1.0 billion and recorded income tax expense of $155.9 million. The primary factor reducingfactors decreasing our income tax benefit forexpense below the U.S. statutory rate was the portion of pre-tax income that was attributable to our non-controlling interest partners and not taxable to the Company.
During the year ended December 31, 2020 from2022, generated pre-tax net income of $870.1 million and recorded income tax expense of $120.3 million. The primary factors decreasing our income tax expense below the U.S. statutory rate was (i) the portion of pre-tax income that was attributable to $85.1 million.
Forour non-controlling interest partners, and (ii) the year ended December 31, 2019, we recognized a discrete permanent itemrelease of $1.7 million for lower deductions on stock awards that vested duringour deferred tax valuation allowance due to the period, which was partially offset by a decreasegeneration of net income in a projected permanent item of $0.8 million related to future stock compensation not expected to be deductible. These items were the primary factors increasing our income tax expense for the year ended December 31, 2019 from the U.S. statutory rate to $5.8 million.
For the Year Ended December 31, 20192022 Compared to the Year Ended December 31, 20182021
Refer to Item 7. Management’s Discussion and Analysis of Financial Condition and Results of Operations in the 20192022 Annual Report on Form 10-K filed with the SEC for a discussion of the results of operations for the year ended December 31, 20192022 compared to the year ended December 31, 2018.2021.
Liquidity and Capital Resources
Overview
Our drilling and completion and land acquisition activities require us to make significant capital expenditures. Historically, our primary sources of liquidity have been cash flows from operations, borrowings under CRP’sour revolving credit facility, and proceeds from offerings of debt or equity securities. Futuresecurities, or proceeds from the sale of oil and gas properties. Our future cash flows are subject to a number of variables, including oil and natural gas prices. Prices for oilprices, which have been and natural gas beganwill likely continue to decline significantly in March 2020 and have remained volatile since. These lowerbe volatile. Lower commodity prices can negatively impact our operating cash flows and our ability to access debt or equity markets, and sustained low oil and natural gas prices could have a material and adverse effect on our liquidity position. To date, our primary useuses of capital hashave been for drilling and development capital expenditures and for the acquisition of oil and natural gas properties. The following table summarizes our capital expenditures (“capex”) incurred during the year:
| | | | | |
(in millions) | Year Ended December 31, 2020 |
Drilling and completion capital expenditures | $ | 212.0 | |
Facilities, infrastructure and other | 38.2 | |
Land | 4.6 | |
Total capital expenditures | $ | 254.8 | |
We continually evaluate our capital needs and compare them to our capital resources. As a result of the decline in crude oil prices and ongoing uncertainty regarding the oil supply-demand macro environment, we temporarily suspended all drilling and completion activities at the end of the first quarter of 2020 in order to preserve capital. Specifically, we reduced our operated drilling rig program to zero rigs starting in April of 2020 and continued with no drilling rigs in operation until the end of September 2020 when we resumed drilling activity with a one-rig program. Of our $212.0 million in drilling and completionOur total capital expenditures incurred duringfor the year ended December 31, 2020, approximately 70% was incurred during the first quarter of 2020. We operated one drilling rig during the entire fourth quarter, added a second drilling rig in late December 2020, and we plan to continue to operate a two rig program through 2021.2023 were $1.5 billion. We expect our total capex budget for 2021 to be between $260 million to $310 million, of which $250 million to $290 million is allocated to drilling, completion and facilities activity.cash capital expenditures budget for 2024 to be between $1.9 billion to $2.1 billion. We funded our capital expenditures for 2023 entirely from cash flows from operations, and we expect to fund our capex2024 capital expenditures budget entirely from cash flows from operations given current commodity price levels. We were free cash flow positive during the second halfour anticipated level of 2020 such that we were able to partially pay down borrowings under our credit agreement during the thirdoil and fourth quarters of 2020. Based upongas production, current commodity prices we expect to continue to pay down borrowings through expected free cash flow generation during 2021.and our commodity hedge positions in place.
Because we are the operator of a high percentage of our acreage, we can control the amount and timing of our capital expenditures. WeAccordingly, we can choose to defer or accelerate a portion of our planned capexcapital expenditures depending on a variety of factors, including but not limited to: prevailing and anticipated prices for oil and natural gas; oil storage or transportation constraints; the success of our drilling activities; the availability of necessary equipment, infrastructure and capital; the receipt and timing of required regulatory permits and approvals; seasonal conditions; property or land acquisition costs; and the level of participation by other working interest owners.
GivenIn August 2023, we announced our merger with Earthstone, and it was completed on November 1, 2023. As a result of the weakness in realized oil prices,Earthstone Merger, our future operational plans, cash flows and leverage profile, among others things, as a combined entity has changed, and such changes include (i) assuming $1.05 billion of Earthstone’s senior notes, (ii) refinancing Earthstone’s credit facility borrowings outstanding at closing with borrowings under our facility, and (iii) funding of transaction costs incurred related to the Earthstone Merger. Additionally, during the year ended 2023, we voluntarily curtailed or shut-inissued $1.0 billion of 7.00% 2032 Senior Notes, with the net proceeds being used to repay indebtedness outstanding under our credit facility, including a portion of our secondthe debt we assumed upon closing of the Earthstone Merger.
We plan to return capital to shareholders through a combination of base dividends plus a variable return program, including variable dividends, share repurchases or a combination of both. During each quarter 2020 production volumes. Specifically,for the year ended December 31, 2023, we curtailed approximately 20%declared and paid a quarterly cash dividend of our production$0.05 per share of Class A Common Stock and a quarterly cash distribution of $0.05 per Common Unit of OpCo. In addition, during the monthyear ended December 31, 2023, our Board of May but were ableDirectors also declared and paid total variable cash dividends of $0.17 per share of Class A Common Stock and total variable cash distributions of $0.17 per Common Unit of OpCo. The cash dividends and distributions paid to bringcommon unitholders totaled $236.0 million for the majorityyear ended December 31, 2023. Additionally, we repurchased 7.2 million shares of Class C Common Stock for $86.5 million and 2.8 million shares of Class A Common Stock for $37.9 million under our production back online in June as crude oil prices recovered. We did not experience any further curtailments of our productionstock repurchase program during the remainderyear ended December 31, 2023.
The stock repurchase program can be used to reduce our shares of the year, but curtailments could occur in the future as a result of depressedcommon stock outstanding. Such repurchases would be made at terms and prices determined by us based upon prevailing market conditions, storageapplicable legal requirements, available liquidity, compliance with our debt agreements and transportation constraints and weather. Any decisionother factors. In addition, we may, from time to time, seek to retire or purchase our outstanding senior notes through cash purchases and/or exchanges for debt in the future to curtailopen-market purchases, privately negotiated transactions or shut-in our production or reduce our drilling and completion activity could adversely affect our business, financial condition, results of operations, liquidity, and ability to finance planned capital expenditures.otherwise.
We cannot ensure that cash flows from operations will be available or other sources of needed capital onwill be available at acceptable terms or at all. Further, our ability to access the public or private debt or equity capital markets at economic terms in the future will be affected by general economic conditions, the domestic and global oil and financial markets, our operational and financial performance, the value and performance of our debt or equity securities, prevailing commodity prices and other macroeconomic factors outside of our control.
Moreover, in order to manage our future financing cash outflows and improve our liquidity position, we completed the Debt Exchange with respect to our Senior Unsecured Notes in May 2020, which reduced the total principal amounts due of our aggregated secured and unsecured notes by $127.1 million and also reduced future interest payments.
Analysis of Cash Flow Changes
The following table summarizes our cash flows for the periods indicated:
| | | | | | | | | | | | | | | | | |
| Year Ended December 31, |
| (in thousands) | 2020 | | 2019 | | 2018 |
| Net cash provided by operating activities | $ | 171,376 | | | $ | 564,173 | | | $ | 670,011 | |
| Net cash used in investing activities | (326,323) | | | (932,989) | | | (1,068,664) | |
| Net cash provided by financing activities | 147,743 | | | 362,937 | | | 294,160 | |
| | | | | | | | | | | | | | | | | |
| Year Ended December 31, |
| (in thousands) | 2023 | | 2022 | | 2021 |
| Net cash provided by operating activities | $ | 2,213,499 | | | $ | 1,371,671 | | | $ | 525,619 | |
| Net cash used in investing activities | (1,578,379) | | | (1,205,049) | | | (226,476) | |
| Net cash (used in) provided by financing activities | (631,188) | | | (106,625) | | | (297,547) | |
Cash Flows from 20202023 Compared to 2019.2022. For the year ended December 31, 2020,2023, we generated $171.4 million$2.2 billion of cash from operating activities, a decreasean increase of $392.8$841.8 million from 2019.2022. Cash provided by operating activities decreasedincreased primarily due to lower realized prices for oil and NGLs, lowerhigher production volumes, for crude oil, residue gas and NGLs, higher exploration and other expenses, interest payments, cash settlement lossessettlements on derivatives and the timing of vendor payments during 2020 as compared to 2019. These declining factors were partially offset by higher realized natural gas prices, lower lease operating expenses, production taxes, GP&T costs, cash G&A expenses, andwell as the timing of our receivable collections during 2020for the year ended December 31, 2023 as compared to the same 20192022 period. These increasing factors were partially offset by lower realized prices for all commodities, higher lease operating expenses, severance and ad valorem taxes, interest expense, merger and integration expense and cash G&A expense for the year ended December 31, 2023. Refer to “ResultsResults of Operations”Operations for more information on the impact of volumes and prices on revenues and on fluctuations in our operating costsexpenses between periods.
For the year ended December 31, 2020,2023, cash flows from operating activities, cash on hand, $1.0 billion in proceeds from the issuance of our 2032 Senior Notes and net borrowingssales proceeds from divestitures together with contingent consideration of $155.0$175.4 million under our credit facilityfrom the sale of oil and natural gas properties were used to finance $318.5 millionto: fund $1.5 billion of drilling and development cash expenditures,expenditures; repay $830.0 million of borrowings outstanding from Earthstone’s credit facility that were assumed at closing of the Earthstone Merger; repay net borrowings of $385.0 million under our Credit Agreement; pay $236.0 million in dividends and cash distributions to holders of our Common Units; fund $8.5 million inacquisitions of oil and gas property acquisitions,properties of $234.3 million; and to finance $6.7repurchase $162.4 million of debt issuance and exchange costs.our common stock.
Cash Flows from 20192022 Compared to 2018.2021. For the year ended December 31, 2019,2022, we generated $564.2 million$1.4 billion of cash from operating activities, a decreasean increase of $105.8$846.1 million from 2018.2021. Cash provided by operating activities decreasedincreased primarily due to lowerhigher realized prices for crude oil naturaland gas, and NGLs, higher lease operating expenses, severance and ad valorem taxes, GP&T costs, exploration expense, cash G&A expenses, interest payments, cash settlement losses from derivativesproduction volumes, and the timing of our suppliervendor payments during 2019.2022 as compared to 2021. These decliningincreasing factors were partially offset by higher crude oil, natural gasmerger and NGL production volumesintegration expense, severance and ad valorem taxes, lease operating expenses, GP&T, cash G&A expense and the timing of our receivable collections during 2019for the year ended December 31, 2022 as compared to the 2018same 2021 period.
For the year ended December 31, 2019,2022, cash flows from operating activities cash on hand, proceeds from sales of oil and gas properties and proceeds from the issuance ofnet borrowings under our 2027 Senior Notesrevolving credit facility were used to repay net borrowings of $125.0 million under our credit facility, to finance $855.2fund $771.6 million of drilling and development capex, to fund $103.7 million in oil and gas property acquisitions and to purchase $8.9cash expenditures, finance $496.7 million of other propertynet cash consideration paid for the Colgate Merger, repay $400.0 million of borrowings outstanding from Colgate’s credit facility that were assumed at closing of the Colgate Merger and equipment.pay a total cash dividend and distribution to noncontrolling interest owners of $27.9 million.
Credit Agreement
CRP,OpCo, our consolidated subsidiary, has a credit agreementfive-year secured revolving Credit Agreement with a syndicate of banks maturing in February 2027 that, provides foras of December 31, 2023, had a five-year secured revolving credit facility, maturing on May 4, 2023 (the “Credit Agreement”). On May 1, 2020, CRP as borrower and we, as parent guarantor, entered into the Q2 2020 Amendments, which among other things established a new borrowing base of $700.0 million$4.0 billion and a new level of elected commitments also $700.0 million. The Q2 2020 Amendments that the lenders approved permitted the issuance of the Senior Secured Notes in connection with the Debt Exchange (discussed below), and they implemented an availability blocker equal to 25% of the newly issued amount of Senior Secured Notes. $2.0 billion. As of December 31, 2020,2023, we had $330.0 million inno borrowings outstanding and $333.9 million$2.0 billion in available borrowing capacity, which was net of $4.3$5.7 million in letters of credit outstanding and the availability blocker of $31.8 million. In connection with the Credit Agreement’s fall 2020 semi-annual borrowing base redetermination, the borrowing base and amount of elected commitments were both reaffirmed at $700.0 million.outstanding.
CRP’sThe Credit Agreement contains restrictive covenants that limit itsour ability to, among other things: (i) incur additional indebtedness; (ii) make investments and loans; (iii) enter into mergers; (iv) make restricted payments; (v) repurchase or declare dividends; (v)redeem junior debt; (vi) enter into commodity hedges exceeding a specified percentage of our expected production; (vi)(vii) enter into interest rate hedges exceeding a specified percentage of its outstanding indebtedness; (vii)(viii) incur liens; (viii)(ix) sell assets; and (ix)(x) engage in transactions with affiliates.
CRP’s credit agreementThe Credit Agreement also requires itOpCo to maintain compliance with the following financial ratios:
(i) a current ratio, which is the ratio of CRP’sOpCo’s consolidated current assets (including an add back of unused commitments under the revolving credit facility and excluding non-cash derivative assets and certain restricted cash) to its consolidated current liabilities (excluding the current portion of long-term debt under the Credit Agreement and non-cash derivative liabilities), of not less than 1.0 to 1.0; and
(ii) a first lien leverage ratio, as defined within the Credit Agreement as the ratio of first lien debt to EBITDAX for the rolling four fiscal quarter period, which may not exceed 2.75 to 1.00 beginning with the quarter ending June 30, 2020 and extending through the quarter ending December 31, 2021, after which the maximum ratio shall decrease to 2.50 to 1.00 for each of the quarters ending in 2022; and
(iii) a leverage ratio, as defined within the Credit Agreement as the ratio of total funded debt to consolidated EBITDAX (as defined within the Credit Agreement) for the rolling four fiscalmost recent quarter period. Pursuant to the Q2 2020 Amendments, the leverage ratio is suspended until March 31, 2022, at which time, the ratio may not exceed 5.00 to 1.00, with such maximum ratio declining at a rateannualized, of 0.25 for each succeeding quarter until March 31, 2023 when the ratio is set at not greater than 4.03.5 to 1.0.
CRPThe Credit Agreement includes fall away covenants, lower interest rates and reduced collateral requirements that OpCo may elect if OpCo is assigned an Investment Grade Rating (as defined within the Credit Agreement).
OpCo was in compliance with the covenants and applicable financial ratios under the Amended Credit Agreement described above as of December 31, 2020 and through the filing of this Annual Report.
For further information on the Credit Agreement, refer to Note 4—5—Long-Term Debt under Part II, Item 8 of this Annual Report.
Convertible Senior Notes
On March 19, 2021, OpCo issued $150.0 million in aggregate principal amount of Convertible Senior Notes. On March 26, 2021, OpCo issued an additional $20.0 million of Convertible Senior Notes pursuant to the exercise of the underwriters’ over-allotment option to purchase additional notes. These issuances resulted in aggregate net proceeds to OpCo of $163.6 million, which were used to repay borrowings outstanding under the Credit Agreement and to fund the cost of entering in to capped call spread transactions of $14.7 million. Subsequently in April 2021, we redeemed at par all of our Senior Secured Notes (defined below), which was the intended use of proceeds from the Convertible Senior Notes offering.
The Convertible Senior Notes are fully and unconditionally guaranteed on a senior unsecured basis by the Company and each of OpCo’s current subsidiaries that guarantee OpCo’s outstanding Senior Unsecured Notes Debt Exchangeas defined below.
The Convertible Senior Notes bear interest at an annual rate of 3.25% and are due on April 1, 2028 unless earlier repurchased, redeemed or converted. The Convertible Senior SecuredNotes may become convertible prior to April 1, 2028, upon the occurrence of certain events or conditions being met as disclosed in Note 5—Long-Term Debt under Item 8 of this Annual Report. As of December 31, 2023, certain conditions have been met, and as a result, noteholders have the right to convert their Convertible Senior Notes during the first quarter of 2023. OpCo can settle the Convertible Senior Notes by paying or delivering cash, shares of the Class A Common Stock, or a combination of cash and Class A Common Stock, at OpCo’s election.
In connection with the Convertible Senior Notes issuance, OpCo entered into privately negotiated capped call spread transactions (the “Capped Call Transactions”), that are expected to reduce potential dilution to our Class A Common Stock upon a conversion and/or offset any cash payments OpCo is required to make in excess of the principal amount of the Convertible Senior
Notes, subject to a cap. The Capped Call Transactions have an initial strike price of $6.28 per share of Class A Common Stock and an initial capped price of $8.4525 per share of Class A Common Stock (each subject to certain customary adjustments per the agreements).
Senior Notes
On November 1, 2023, in connection with the Earthstone Merger, OpCo entered into supplemental indentures whereby all of Earthstone’s outstanding senior notes were assumed and became the senior unsecured debt of OpCo. The senior notes assumed by OpCo included $550 million of 8.00% senior notes due 2027 (the “2027 8.00% Senior Notes”) and $500 million of 9.875% senior notes due 2031 (the “2031 Senior Notes”). We recorded the acquired senior notes at their fair values as of the Earthstone Merger closing date, which were equal to 102.86% of par (a $15.7 million premium) for the 2027 8.00% Senior Notes and 107.37% of par (a $36.8 million premium) for the 2031 Senior Notes.
On September 12, 2023, OpCo issued at par $500 million of 7.00% senior notes due 2032 (the “Existing Notes”) in a 144A private placement. On December 13, 2023, OpCo issued additional notes under the indenture dated September 12, 2023 that totaled an additional $500 million of 7.00% senior notes (together with the Existing Notes, the “2032 Senior Notes”), which resulted in aggregate net proceeds of $982.5 million, after deducting the issuance discount of $2.5 million and debt issuance costs of $15.0 million. The 2032 Senior Notes are treated as a single series of securities and will vote together as a single class, and have substantially identical terms, other than the issue date and issue price.
On September 1, 2022, in connection with the Colgate Merger, OpCo entered into supplemental indentures whereby all of Colgate’s outstanding senior notes were assumed at the Colgate Merger closing date and became the senior unsecured debt of OpCo. The senior notes assumed by OpCo included $300 million of 7.75% senior notes due 2026 (the “2026 7.75% Senior Notes”) and $700 million of 5.875% senior notes due 2029 (the “2029 Senior Notes”). We recorded the acquired senior notes at their fair value as of the Colgate Merger closing, which were equal to 100% of par for the 2026 7.75% Senior Notes and 93.68% of par (a $49.3 million debt discount) for the 2029 Senior Notes.
On November 30, 2017, OpCo issued $400.0 million of 5.375% senior notes due 2026 (the “2026 5.375% Senior Notes”) and on March 15, 2019, OpCo issued $500.0 million of 6.875% senior notes due 2027 (the “2027 6.875% Senior Notes” and, together with the 2027 8.00% Senior Notes, 2031 Senior Notes, 2032 Senior Notes, 2026 5.375% Senior Notes, 2029 Senior Notes and the 2026 7.75% Senior Notes, the “Senior Unsecured Notes”) in 144A private placements. In May 22, 2020, CRP completed the Debt Exchange pursuant to which $110.6 million aggregate principal amount of CRP’sthe 2026 5.375% Senior Notes and $143.7 million aggregate principal amount of CRP’sthe 2027 6.875% Senior Notes were validly tendered and exchanged by certain eligible bondholders for consideration consisting of $127.1 million aggregate principal amount of newly issued8.00% second lien senior secured notes, which were fully redeemed at par in connection with the Convertible Senior Secured Notes. The Senior Secured Notes bear interest at an annual rateissuance during the second quarter of 8% and are due on June 1, 2025. Interest is payable semi-annually in arrears on each June 1 and December 1, commencing on December 1, 2020.2021.
The Debt Exchange was accounted for as an extinguishment of debt in accordance with Financial Accounting Standards Board’s Accounting Standard Codification Topic 470-50, Modifications and Extinguishments. As a result, a gain on the exchange of debt of $143.4 million was recognized in the consolidated statement of operations, which consisted of the carrying values of the Senior Unsecured Notes exchanged less the aggregate principal amount of new Senior Secured Notes issued, net of their associated debt discount of $21.0 million (which was based on the Senior Secured Notes’ estimated fair value on the exchange date).
The Senior Secured Notes are guaranteed, subject to certain exceptions, by us and each of CRP’s subsidiaries and are secured on a second-priority basis (subject in priority only to certain exceptions) by substantially all of CRP’s and our assets, including deposit accounts and substantially all proved reserves and undeveloped acreage.
Senior Unsecured Notes
On November 30, 2017, CRP issued $400.0 million of 5.375% senior notes due 2026 and on March 15, 2019, CRP issued $500.0 million of 6.875% senior notes due 2027 in 144A private placements. The Senior Unsecured Notes are fully and unconditionally guaranteed on a senior unsecured basis by Centennialthe Company and each of CRP’sOpCo’s current subsidiaries that guarantee CRP’s revolving credit facility. In May 2020, a portion of the Senior Unsecured Notes were exchanged for Senior Secured Notes (see above discussion for details of the Debt Exchange).OpCo’s Credit Agreement.
The indentures governing the Senior Unsecured Notes and Senior Secured Notes (collectively, the “Senior Notes”) contain covenants that, among other things and subject to certain exceptions and qualifications, limit CRP’sOpCo’s ability and the ability of CRP’sOpCo’s restricted subsidiaries to: (i) incur or guarantee additional indebtedness or issue certain types of preferred stock; (ii) pay dividends on capital stock or redeem, repurchase or retire capital stock or subordinated indebtedness; (iii) transfer or sell assets; (iv) make investments; (v) create certain liens; (vi) enter into agreements that restrict dividends or other payments from their subsidiaries to them; (vii) consolidate, merge or transfer all or substantially all of their assets; (viii) engage in transactions with affiliates; and (ix) create unrestricted subsidiaries. CRPOpCo was in compliance with these covenants as of December 31, 20202023 and through the filing of this Annual Report.
For further information on our Convertible Senior Notes and Senior Unsecured Notes, refer to Note 4—5—Long-Term Debt under Part II, Item 8 of this Annual Report.
Off-Balance Sheet Arrangements
We may enter into off-balance sheet arrangements and transactions that can give rise to material off-balance sheet obligations. As of December 31, 2020, we had no off-balance sheet arrangements.
Contractual Obligations and Commitments
We routinely enter into or extend operating and transportation agreements, office and equipment leases, drilling rig contracts, among others, in the ordinary course of business. The following table summarizes our obligations and commitments as of December 31, 20202023 to make future payments under long-term contracts for the time periods specified below.
| | | | | | | | | | | | | | | | | | | | | | | | | | | | | | | | | | | | | | | | | |
| (in thousands) | 2021 | | 2022 | | 2023 | | 2024 | | 2025 | | Thereafter | | Total |
Operating leases(1) | $ | 3,260 | | | $ | 425 | | | $ | — | | | $ | — | | | $ | — | | | $ | — | | | $ | 3,685 | |
Water disposal agreements(2) | 1,825 | | | 100 | | | — | | | — | | | — | | | — | | | 1,925 | |
| | | | | | | | | | | | | |
Asset retirement obligations(3) | 384 | | | — | | | — | | | 457 | | | — | | | 16,168 | | | 17,009 | |
Long term debt obligations(4) | — | | | — | | | 330,000 | | | — | | | 127,073 | | | 645,799 | | | 1,102,872 | |
Cash interest expense on long-term debt obligations(5) | 62,319 | | | 62,319 | | | 58,749 | | | 50,223 | | | 44,290 | | | 30,547 | | | 308,447 | |
Transportation agreements(6) | 9,060 | | | 1,770 | | | — | | | — | | | — | | | — | | | 10,830 | |
| Total | $ | 76,848 | | | $ | 64,614 | | | $ | 388,749 | | | $ | 50,680 | | | $ | 171,363 | | | $ | 692,514 | | | $ | 1,444,768 | |
| | | | | | | | | | | | | | | | | | | | | | | | | | | | | | | | | | | | | | | | | |
| (in thousands) | 2024 | | 2025 | | 2026 | | 2027 | | 2028 | | Thereafter | | Total |
Operating leases(1) | $ | 35,112 | | | $ | 14,721 | | | $ | 5,204 | | | $ | 2,895 | | | $ | 2,705 | | | $ | 6,045 | | | $ | 66,682 | |
Financing leases(2) | 753 | | | 718 | | | 684 | | | 652 | | | 621 | | | 12,146 | | | 15,574 | |
Purchase obligations(3) | 57,581 | | | 57,575 | | | 5,200 | | | — | | | — | | | — | | | 120,356 | |
Development obligation(4) | 20,000 | | | 20,000 | | | 20,000 | | | — | | | — | | | — | | | 60,000 | |
Asset retirement obligations(5) | 974 | | | 9,735 | | | 12,095 | | | 326 | | | 150 | | | 98,137 | | | 121,417 | |
Long term debt obligations(6) | — | | | — | | | 589,448 | | | 906,351 | | | 170,000 | | | 2,200,000 | | | 3,865,799 | |
Cash interest expense on long-term debt obligations(7) | 280,917 | | | 280,917 | | | 245,664 | | | 186,063 | | | 161,897 | | | 359,088 | | | 1,514,546 | |
| Total | $ | 395,337 | | | $ | 383,666 | | | $ | 878,295 | | | $ | 1,096,287 | | | $ | 335,373 | | | $ | 2,675,416 | | | $ | 5,764,374 | |
(1) Operating leases includeconsist of our office rental agreements, drilling rig contracts and other wellhead equipment. Please refer to Note 15—16—Leases under Part II, Item 8 of this Annual Report for details on our operating lease commitments.
(2) Water disposal agreementsFinancing leases consist of contractsour ground lease related to the office building we purchased in Midland, Texas. The lease term is ninety-nine years and as a result, the commitments above have been shown at their current present value. Please refer to Note 16—Leases under Part II, Item 8 of this Annual Report for transportation and disposaldetails on our financing lease commitments.
(3) Consists of produced water from our operated wells. Under the termsan energy purchase agreement to buy a minimum amount of these agreements, we are obligatedelectricity at a fixed price or pay for underutilization as well as a take-or-pay agreement to deliverpurchase a minimum volume of produced water or else pay for any deficienciesfrac sand at the prices stipulated in the contracts.a fixed price. The obligations reported above represent our remaining minimum financial commitments pursuant to the terms of these contracts as of December 31, 2020. Actual2023, however actual expenditures under these contracts may exceed the minimum commitments presented above.
(3)(4) Consists of obligations that are tied to our future drilling, completion and water connection activity in Reeves County, Texas that will require repayment if certain performance obligations through September 2026 are not met.
(5) Asset retirement obligations reflect the present value of the estimated future costs associated with the plugging and abandonment of oil and gas wells and the related land restoration in accordance with applicable laws and regulations.
(4)(6) Long-term debt consists of the principal amounts of the Senior Notesour senior notes due and borrowings outstanding under the Credit Agreement maturing on May 4,as of December 31, 2023.
(5)(7) Cash interest expense on the Senior Notesour senior notes is estimated assuming no principal repayment until the maturity of the instruments. Cash interest expense on the Credit Agreement includes unused commitment fees and assumes no additional principal borrowings, repayments or changes to commitments under the agreement through the instrument due date.
(6) Transportation agreements include various firm natural gas transportation contracts whereby we are required to pay fixed pipeline capacity reservation fees over the contractual terms. The obligations reported above represent minimum financial commitments pursuant to the terms of these contracts. However, our expenditures under these contracts are likely to exceed the minimum commitments presented above.
Recently Issued Accounting Standards
There were no significant new accounting standards adopted or new accounting pronouncements that would have a potential effect on us as of December 31, 2020.2023.
Critical Accounting Policies and Estimates
The discussion and analysis of our financial condition and results of operations are based upon our consolidated financial statements, which have been prepared in accordance with GAAP. The preparation of these statements requires us to make certain assumptions, judgments and estimates that affect the reported amounts of assets, liabilities, revenues and expenses, as well as, the disclosure of contingent assets, contingent liabilities and commitments as of the date of our financial statements. We base our assumptions and estimates on historical experience and other sources that we believe to be reasonable at the time. Actual results may vary from our estimates due to changes in circumstances, weather, politics, global economics, commodity prices, production performance, drilling results, mechanical problems, general business conditions and other factors. A summary of our significant accounting policies can be found in Note 1—Basis of Presentation and Summary of Significant Accounting Policies,under Item 8. Financial Statements and Supplementary Data in8 of this Annual Report.
We have outlined certain of our accounting policies below which require the application of significant judgment by our management.
Oil and Natural Gas Reserve Quantities
We use the successful efforts method of accounting for our oil and gas producing activities. The successful efforts method inherently relies on the estimation of proved crude oil, natural gas and NGL reserves. Reserve quantities and the related estimates of future net cash flows are used as inputs to our calculation of depletion, evaluation of proved properties for impairment, assessment of the expected realizability of our deferred income tax assets, and the standardized measure of discounted future net cash flows computations.
The process of estimating quantities of proved reserves is inherently imprecise and relies on the following: i) interpretations and judgment of available geological, geophysical, engineering and production data; ii) certain economic assumptions, some of which are mandated by the SEC, such as commodity prices; and iii) assumptions and estimates of underlying inputs such as operating expenses, capital expenditures, plug and abandonment costs and taxes. All of these assumptions may differ substantially from actual results, which could result in a significant change in our estimated quantities of proved reserves and their future net cash flows. We continually make revisions to reserve estimates throughout the year as additional information becomes available, and we make changes to depletion rates in the same reporting period that changes to reserve estimates are made.
Business Combinations
From time to time, we may acquire assets and assume liabilities in transactions accounted for as business combinations, such as the Earthstone Merger. In connection with the Earthstone Merger, we allocated the $2.9 billion of purchase price consideration to the assets acquired and liabilities assumed based on estimated fair values as of the Earthstone Merger closing date.
For business and asset acquisitions, we generally recognize the identifiable assets acquired, the liabilities assumed and any noncontrolling interest in the acquiree at their estimated fair values on the acquisition date. Determining fair value requires management’s judgment and involves the use of significant estimates and assumptions with respect to projections of future production volumes, forecasted development costs, pricing and cash flows, discount rates, expectations regarding customer contracts and relationships, reserve risk adjustment factors and other management estimates. The judgments made in the determination of the estimated fair value assigned to the assets acquired, liabilities assumed and any noncontrolling interest, as well as the estimated useful life of each asset and the duration of each liability, can materially impact the financial statements in periods after acquisition. See Note 2—Business Combinations in Item 8 of this Annual Report on Form 10-K.
Impairment of Oil and Natural Gas Properties
We assess our proved properties for impairment when events or changes in circumstances indicate that the carrying value of such proved property assets may not be recoverable. For purposes of an impairment evaluation, our proved oil and natural gas properties must be grouped at the lowest level for which independent cash flows can be identified. If the sum of the undiscounted estimated cash flows from the use of the asset group and its eventual disposition is less than the carrying value of an asset group, the carrying value is written down to its estimated fair value. Fair value for the purpose of testingmeasuring impairment iswrite-downs are calculated using the present value of expected future cash flows that are estimated to be generated from the asset group. Fair value estimates are based on projected financial information which we believe to be reasonably likely to occur, as of the date that the impairment write-down is being measured. However, such future cash flow estimates are based on numerous assumptions that can materially affect our estimates, and such assumptions are subject to change with variations in commodity prices, production performance, drilling results, operating and development costs, underlying oil and gas reserve quantities, and other internal or external factors.
Unproved properties consist of the costs we incurred to acquire undeveloped leasehold acreage as well as the costs we incurred to acquire unproved reserves. Unproved properties with individually significant acquisition costs are periodically assessed for impairment based on remaining lease term, drilling results, reservoir performance, seismic interpretation or changes in future plans to develop acreage. Unproved properties which are not individually significant are amortized by prospect, based on our historical experience, current drilling plan, existing geological data and average remaining lease terms. Changes in our assumptions as to the estimated nonproductive portion of our undeveloped leases could result in additional impairment charges.
ITEM 7A. QUANTITATIVE AND QUALITATIVE DISCLOSURES ABOUT MARKET RISK
The term “market risk” as it applies to our business refers to the risk of loss arising from adverse changes in oil and natural gas prices and interest rates, and we are exposed to market risk as described below. The primary objective of the following information is to provide quantitative and qualitative information about our potential exposure to market risks. The disclosures are not meant to be precise indicators of expected future losses, but rather indicators of reasonably possible losses. All of our market risk sensitive instruments were entered into for purposes of mitigating our potential for losses arising from our exposure to market risks and were not entered into forother than speculative trading purposes.trading.
Commodity Price Risk
Our primary market risk exposure is in the pricing that we receive for our oil, natural gas and NGL production. Pricing for oil, natural gas and NGLs has been volatile and unpredictable for several years, and we expect this volatility to continue for the foreseeable future. Based on our production for the year ended December 31, 2020,2023, our oil and gas sales for the year ended December 31, 20202023 would have moved up or down $47.6$269.7 million for each 10% change in oil prices per Bbl, $4.7$14.2 million for each 10% change in gas prices per Mcf, and $28.2 million for each 10% change in NGL prices per Bbl, and $5.8 million for each 10% change in natural gas prices per Mcf.Bbl.
Due to this volatility, we have historically used, and willwe may elect to continue to selectively use, commodity derivative instruments (such as collars, swaps, puts and basis swaps) to mitigate price risk associated with a portion of our anticipated production. Our derivative instruments allow us to reduce, but not eliminate, the potential effects of the variability in cash flowflows that can emanate from operations due to fluctuations in oil and natural gas prices, and thereby provide increased certainty of cash flows for our drilling program and debt service requirements. These instruments provide only partial price protection against declines in oil and natural gas prices, andbut alternatively they also partially limit our potential gains from potential future increases in price.prices. Our Credit Agreement limits our ability to enter into commodity hedges covering greater than 85% of our reasonably anticipated, projected production from proved properties.
Refer to Note 7—Derivative Instruments under Part II, Item 8 of this Annual Report for open derivative positions as of December 31, 2020. The following table below summarizes the terms of the derivative contracts we had in place as of December 31, 20202023 and additional contracts entered into through February 19, 2021:23, 2024. Refer to
| | | | | | | | | | | | | | | | | | | | | | | |
| Period | | Volume (Bbls) | | Volume (Bbls/d) | | Wtd. Avg. Crude Price ($/Bbl)(1) |
| Crude oil swaps | | | | | | | |
| NYMEX WTI | January 2021 - March 2021 | | 990,000 | | 11,000 | | | $41.48 |
| April 2021 - June 2021 | | 1,183,000 | | 13,000 | | | 43.18 |
| July 2021 - September 2021 | | 736,000 | | 8,000 | | | 45.87 |
| October 2021 - December 2021 | | 644,000 | | 7,000 | | | 45.59 |
| | | | | | | |
| ICE Brent | January 2021 - March 2021 | | 270,000 | | 3,000 | | | $46.85 |
| April 2021 - June 2021 | | 409,500 | | 4,500 | | | 54.98 |
| July 2021 - September 2021 | | 184,000 | | 2,000 | | | 48.25 |
| October 2021 - December 2021 | | 184,000 | | 2,000 | | | 48.50 |
| | | | | | | | | | | | | | | | | | | | | | | | | | | | | |
| Period | | Volume (Bbls) | | Volume (Bbls/d) | | Wtd. Avg. Collar Price Ranges ($/Bbl)(2) |
| Crude oil collars | January 2021 - March 2021 | | 315,000 | | 3,500 | | | $ | 40.00 | | - | $ | 48.14 | |
| April 2021 - June 2021 | | 227,500 | | 2,500 | | | 42.00 | | - | 51.14 | |
| July 2021 - September 2021 | | 92,000 | | 1,000 | | | 42.00 | | - | 50.10 | |
| October 2021 - December 2021 | | 92,000 | | 1,000 | | | 42.00 | | - | 50.10 | |
| | | | | | | | | | | | | | | | | | | | | | | |
| Period | | Volume (Bbls) | | Volume (Bbls/d) | | Wtd. Avg. Differential ($/Bbl)(3) |
| Crude oil basis differential swaps | January 2021 - March 2021 | | 990,000 | | 11,000 | | | $0.01 |
| April 2021 - June 2021 | | 1,183,000 | | 13,000 | | | 0.11 |
| July 2021 - September 2021 | | 736,000 | | 8,000 | | | 0.26 |
| October 2021 - December 2021 | | 644,000 | | 7,000 | | | 0.26 |
| | | | | | | | | | | | | | | | | | | | | | | |
| Period | | Volume (Bbls) | | Volume (Bbls/d) | | Wtd. Avg. Crude Price ($/Bbl)(1) |
| Crude oil swaps | January 2024 - March 2024 | | 2,919,100 | | | 32,078 | | | $77.10 |
| April 2024 - June 2024 | | 2,975,500 | | | 32,698 | | | 76.24 |
| July 2024 - September 2024 | | 2,990,000 | | | 32,500 | | | 75.40 |
| October 2024 - December 2024 | | 2,990,000 | | | 32,500 | | | 74.61 |
| January 2025 - March 2025 | | 1,575,000 | | | 17,500 | | | 73.33 |
| April 2025 - June 2025 | | 1,592,500 | | | 17,500 | | | 72.27 |
| July 2025 - September 2025 | | 1,610,000 | | | 17,500 | | | 71.25 |
| October 2025 - December 2025 | | 1,610,000 | | | 17,500 | | | 70.34 |
| | | | | | | |
| | | | | | | |
| | | | | | | |
| | | | | | | |
| | | | | | | |
| | | | | | | | | | | | | | | | | | | | | | | | | | | | | |
| Period | | Volume (Bbls) | | Volume (Bbls/d) | | Wtd. Avg. Collar Price Ranges ($/Bbl)(2) |
| Crude oil collars | January 2024 - March 2024 | | 182,000 | | | 2,000 | | | $60.00 | - | $76.01 |
| April 2024 - June 2024 | | 182,000 | | | 2,000 | | | 60.00 | - | 76.01 |
| July 2024 - September 2024 | | 184,000 | | | 2,000 | | | 60.00 | - | 76.01 |
| October 2024 - December 2024 | | 184,000 | | | 2,000 | | | 60.00 | - | 76.01 |
| | | | | | | | | |
| | | | | | | | | |
| | | | | | | | | | | | | | | | | | | | | | | | | | | | | |
| Period | | Volume (Bbls) | | Volume (Bbls/d) | | Wtd. Avg. Put Price ($/Bbl)(3) | | Deferred Premium ($/Bbl)(3) |
| Deferred premium puts | January 2024 - March 2024 | | 227,500 | | | 2,500 | | | $65.00 | | $4.96 |
| April 2024 - June 2024 | | 227,500 | | | 2,500 | | | 65.00 | | 4.96 |
| July 2024 - September 2024 | | 230,000 | | | 2,500 | | | 65.00 | | 4.96 |
| October 2024 - December 2024 | | 230,000 | | | 2,500 | | | 65.00 | | 4.96 |
| | | | | | | | | |
| | | | | | | | | |
| | | | | | | | | | | | | | | | | | | | | | | |
| Period | | Volume (Bbls) | | Volume (Bbls/d) | | Wtd. Avg. Differential ($/Bbl)(4) |
| Crude oil basis differential swaps | January 2024 - March 2024 | | 3,148,600 | | | 34,600 | | | $0.94 |
| April 2024 - June 2024 | | 3,385,018 | | | 37,198 | | | 0.95 |
| July 2024 - September 2024 | | 3,404,000 | | | 37,000 | | | 0.95 |
| October 2024 - December 2024 | | 3,404,000 | | | 37,000 | | | 0.95 |
| January 2025 - March 2025 | | 1,575,000 | | | 17,500 | | | 1.09 |
| April 2025 - June 2025 | | 1,592,500 | | | 17,500 | | | 1.09 |
| July 2025 - September 2025 | | 1,610,000 | | | 17,500 | | | 1.09 |
| October 2025 - December 2025 | | 1,610,000 | | | 17,500 | | | 1.09 |
| | | | | | | | | | | | | | | | | | | | | | | |
| Period | | Volume (Bbls) | | Volume (Bbls/d) | | Wtd. Avg. Differential ($/Bbl)(5) |
| Crude oil roll differential swaps | January 2024 - March 2024 | | 3,148,600 | | | 34,600 | | | $0.45 |
| April 2024 - June 2024 | | 3,385,018 | | | 37,198 | | | 0.45 |
| July 2024 - September 2024 | | 3,404,000 | | | 37,000 | | | 0.45 |
| October 2024 - December 2024 | | 3,404,000 | | | 37,000 | | | 0.45 |
| January 2025 - March 2025 | | 1,575,000 | | | 17,500 | | | 0.37 |
| April 2025 - June 2025 | | 1,592,500 | | | 17,500 | | | 0.37 |
| July 2025 - September 2025 | | 1,610,000 | | | 17,500 | | | 0.37 |
| October 2025 - December 2025 | | 1,610,000 | | | 17,500 | | | 0.37 |
(1) These crude oil swap transactions are settled based on the NYMEX WTI or ICE Brent oilindex price on each trading day within the specified monthly settlement period versus the contractual swap price for the volumes stipulated.
(2) These crude oil collars are settled based on the NYMEX WTI index price on each trading day within the specified monthly settlement period versus the contractual floor and ceiling prices for the volumes stipulated.
(3) These crude oil deferred premium puts are settled based on the NYMEX WTI index price on each trading day within the specified monthly settlement period versus the contractual put prices for the volumes stipulated.
(4) These crude oil basis swap transactions are settled based on the difference between the arithmetic average of the ARGUS MIDLAND WTI and ARGUS WTI CUSHING indices, during each applicable monthly settlement period.
| | | | | | | | | | | | | | | | | | | | | | | |
| Period | | Volume (MMBtu) | | Volume (MMBtu/d) | | Wtd. Avg. Gas Price ($/MMBtu)(1) |
| Natural gas swaps | January 2021 - March 2021 | | 5,400,000 | | 60,000 | | | $2.91 |
| April 2021 - June 2021 | | 3,640,000 | | 40,000 | | | 2.89 |
| July 2021 - September 2021 | | 3,680,000 | | 40,000 | | | 2.89 |
| October 2021 - December 2021 | | 3,680,000 | | 40,000 | | | 2.95 |
| January 2022 - March 2022 | | 1,800,000 | | 20,000 | | | 3.00 |
| | | | | | | | | | | | | | | | | | | | | | | | | | | | | |
| Period | | Volume (MMBtu) | | Volume (MMBtu/d) | | Wtd. Avg. Collar Price Ranges ($/MMBtu)(2) |
| Natural gas collars | January 2021 - March 2021 | | 1,800,000 | | 20,000 | | | $ | 2.90 | | - | $ | 3.64 | |
| | | | | | | | | | | | | | | | | | | | | | | |
| Period | | Volume (MMBtu) | | Volume (MMBtu/d) | | Wtd. Avg. Gas Price ($/MMBtu)(1) |
| Natural gas swaps | January 2024 - March 2024 | | 4,104,919 | | | 45,109 | | | $3.77 |
| April 2024 - June 2024 | | 5,906,321 | | | 64,905 | | | 3.29 |
| July 2024 - September 2024 | | 5,949,388 | | | 64,667 | | | 3.43 |
| October 2024 - December 2024 | | 5,933,899 | | | 64,499 | | | 3.86 |
| January 2025 - March 2025 | | 3,600,000 | | | 40,000 | | | 4.32 |
| April 2025 - June 2025 | | 3,640,000 | | | 40,000 | | | 3.65 |
| July 2025 - September 2025 | | 3,680,000 | | | 40,000 | | | 3.83 |
| October 2025 - December 2025 | | 3,680,000 | | | 40,000 | | | 4.20 |
| | | | | | | | | | | | | | | | | | | | | | | |
| Period | | Volume (MMBtu) | | Volume (MMBtu/d) | | Wtd. Avg. Differential ($/MMBtu)(3) |
| Natural gas basis differential swaps | January 2021 - March 2021 | | 1,800,000 | | 20,000 | | | $(0.30) |
| April 2021 - June 2021 | | 3,640,000 | | 40,000 | | | (0.30) |
| July 2021 - September 2021 | | 3,680,000 | | 40,000 | | | (0.30) |
| October 2021 - December 2021 | | 3,680,000 | | 40,000 | | | (0.28) |
| January 2022 - March 2022 | | 1,800,000 | | 20,000 | | | (0.26) |
| | | | | | | | | | | | | | | | | | | | | | | |
| Period | | Volume (MMBtu) | | Volume (MMBtu/d) | | Wtd. Avg. Differential ($/MMBtu)(2) |
| Natural gas basis differential swaps | January 2024 - March 2024 | | 12,740,000 | | | 140,000 | | | $(0.90) |
| April 2024 - June 2024 | | 10,920,000 | | | 120,000 | | | (0.99) |
| July 2024 - September 2024 | | 11,040,000 | | | 120,000 | | | (0.99) |
| October 2024 - December 2024 | | 11,040,000 | | | 120,000 | | | (0.98) |
| January 2025 - March 2025 | | 3,600,000 | | | 40,000 | | | (0.74) |
| April 2025 - June 2025 | | 3,640,000 | | | 40,000 | | | (0.74) |
| July 2025 - September 2025 | | 3,680,000 | | | 40,000 | | | (0.74) |
| October 2025 - December 2025 | | 3,680,000 | | | 40,000 | | | (0.74) |
| | | | | | | | | | | | | | | | | | | | | | | |
| Period | | Volume (MMBtu) | | Volume (MMBtu/d) | | Wtd. Avg. Differential ($/MMBtu)(3) |
| Natural gas basis differential swaps | January 2024 - March 2024 | | 3,640,000 | | | 40,000 | | | $0.00 |
| | | | | | | | | | | | | | | | | | | | | | | | | | | | | |
| Period | | Volume (MMBtu) | | Volume (MMBtu/d) | | Wtd. Avg. Collar Price Ranges ($/MMBtu)(4) |
| Natural gas collars | January 2024 - March 2024 | | 6,815,081 | | 74,891 | | | $2.93 | - | $6.81 |
| April 2024 - June 2024 | | 5,013,679 | | 55,095 | | | 2.68 | - | 5.04 |
| July 2024 - September 2024 | | 5,090,612 | | 55,333 | | | 2.68 | - | 5.06 |
| October 2024 - December 2024 | | 5,106,101 | | 55,501 | | | 2.75 | - | 5.29 |
| | | | | | | | | |
| | | | | | | | | |
| | | | | | | | | |
| | | | | | | | | |
(1)These natural gas swap contracts are settled based on the NYMEX Henry Hub price on each trading day within the specified monthly settlement period versus the contractual swap price for the volumes stipulated.
(2) These natural gas basis swap contracts are settled based on the difference between the Inside FERC’s West Texas WAHA price and the NYMEX price of natural gas during each applicable monthly settlement period.
(3) These natural gas basis swap contracts are settled based on the difference between the Houston Ship Channel (“HSC”) price and the NYMEX price of natural gas during each applicable monthly settlement period.
(4) These natural gas collars are settled based on the NYMEX Henry Hub price on each trading day within the specified monthly settlement period versus the contractual floor and ceiling prices for the volumes stipulated.
(3) These natural gas basis swap contracts are settled based on the difference between the inside FERC’s West Texas WAHA price and the NYMEX price of natural gas, during each applicable monthly settlement period.
Changes in the fair value of derivative contracts from December 31, 20192022 to December 31, 2020,2023, are presented below:
| | | | | | | | |
| (in thousands) | | Commodity derivative asset (liability) |
Net fair value of oil and gas derivative contracts outstanding as of December 31, 20192022 | | $ | (325)114,466 | |
| Commodity hedge contract settlement payments, net of any receipts | | 46,651 (99,410) | |
| Fair value of commodity hedge contracts acquired in the Earthstone Merger | | (35,499) | |
Cash and non-cash mark-to-market lossesgains (losses) on commodity hedge contracts(1) | | (64,535)114,016 | |
Net fair value of oil and gas derivative contracts outstanding as of December 31, 20202023 | | $ | (18,209)93,573 | |
(1) At inception, new derivative contracts entered into by us have no intrinsic value.
A hypothetical upward or downward shift of 10% per Bbl in the NYMEX forward curve for crude oil as of December 31, 20202023 would cause a $23.4$124.5 million increase or $24.1$125.1 million decrease, respectively, in this fair value position, and a hypothetical upward or downward shift of 10% per Mcf in the NYMEX forward curve for natural gas as of December 31, 20202023 would cause a $4.5$8.6 million increase or $4.4$9.0 million decrease, respectively, in this same fair value position.
Interest Rate Risk
Our ability to borrow and the rates offered by lenders can be adversely affected by deteriorations in the credit markets and/or downgrades in our credit rating. The uncertainties regarding the impact of COVID-19 as well as the significant decline in March and April of 2020 in global oil and gas prices and their continued volatility throughout 2020 has impacted the credit markets, resulting in increases in market interest rates for new debt issuances in our industry. CRP’sOpCo’s Credit Agreement interest rate is based on a LIBORSOFR spread, (subject to a 1% floor), which exposes us to interest rate risk to the extent LIBOR increases above the floor and we have borrowings outstanding. Further, LIBOR rates are expected tooutstanding under this credit facility. As of December 31, 2023, we had no longer be published beginning June 30, 2023, however, due to the structure ofborrowings outstanding under the Credit Agreement, we do not expect the termination of LIBOR rates to have a material impact to us.
At December 31, 2020, we had $330.0 million of debt outstanding under our Credit Agreement, with a weighted average interest rate of 3.25%. Assuming no change in the amount outstanding, the impact on interest expense of a 1.0% increase or decrease in the weighted average interest rate would be approximately $3.3 million per year.Agreement. We do not currently have or intend to enter into any derivative hedge contracts to protect against fluctuations in interest rates that are applicable to our outstanding indebtedness.
The remaining long-term debt balance of $738.6 million$3.8 billion consists of our Senior Notes,senior notes, which have fixed interest rates; therefore, this balance is not affected by interest rate movements. For additional information regarding our debt instruments, see Note 4—5—Long-Term Debt, in Item 8. Financial Statements and Supplementary Data in8 of this Annual Report.
ITEM 8. FINANCIAL STATEMENTS AND SUPPLEMENTARY DATA
CENTENNIAL RESOURCE DEVELOPMENT, INC.PERMIAN RESOURCES CORPORATION
INDEX TO FINANCIAL STATEMENTS AND SUPPLEMENTARY DATA
| | | | | |
| Page |
| |
| |
| |
| |
| |
| |
| |
| |
| |
| |
| |
| |
| |
| |
| |
| |
| |
| |
| |
| |
| |
| |
| |
| |
| |
| |
| |
| |
| |
| |
| |
| |
| Supplemental Information to Consolidated Financial Statements | |
| |
| |
Report of Independent Registered Public Accounting Firm
To the Shareholders and Board of Directors
Centennial Resource Development, Inc.:Permian Resources Corporation:
Opinion on the Consolidated Financial Statements
We have audited the accompanying consolidated balance sheets of Centennial Resource Development, Inc.Permian Resources Corporation and subsidiaries (the Company) as of December 31, 20202023 and 2019,2022, the related consolidated statements of operations, shareholders’ equity, and cash flows for each of the years in the three‑yearthree-year period ended December 31, 2020,2023, and the related notes (collectively, the consolidated financial statements). In our opinion, the consolidated financial statements present fairly, in all material respects, the financial position of the Company as of December 31, 20202023 and 2019,2022, and the results of its operations and its cash flows for each of the years in the three‑yearthree-year period ended December 31, 2020,2023, in conformity with U.S. generally accepted accounting principles.
We also have audited, in accordance with the standards of the Public Company Accounting Oversight Board (United States) (PCAOB), the Company’s internal control over financial reporting as of December 31, 2020,2023, based on criteria established in Internal Control -– Integrated Framework (2013) issued by the Committee of Sponsoring Organizations of the Treadway Commission, and our report dated February 24, 202129, 2024 expressed an unqualified opinion on the effectiveness of the Company’s internal control over financial reporting.
Change in Accounting Principle
As discussed in Note 15 to the consolidated financial statements, the Company has changed its method of accounting for leases as of January 1, 2019 due to the adoption of Accounting Standards Update 2016-02 Leases (ASC Topic 842).
Basis for Opinion
These consolidated financial statements are the responsibility of the Company’s management. Our responsibility is to express an opinion on these consolidated financial statements based on our audits. We are a public accounting firm registered with the PCAOB and are required to be independent with respect to the Company in accordance with the U.S. federal securities laws and the applicable rules and regulations of the Securities and Exchange Commission and the PCAOB.
We conducted our audits in accordance with the standards of the PCAOB. Those standards require that we plan and perform the audit to obtain reasonable assurance about whether the consolidated financial statements are free of material misstatement, whether due to error or fraud. Our audits included performing procedures to assess the risks of material misstatement of the consolidated financial statements, whether due to error or fraud, and performing procedures that respond to those risks. Such procedures included examining, on a test basis, evidence regarding the amounts and disclosures in the consolidated financial statements. Our audits also included evaluating the accounting principles used and significant estimates made by management, as well as evaluating the overall presentation of the consolidated financial statements. We believe that our audits provide a reasonable basis for our opinion.
Critical Audit Matters
The critical audit matters communicated below are matters arising from the current period audit of the consolidated financial statements that were communicated or required to be communicated to the audit committee and that: (1) relate to accounts or disclosures that are material to the consolidated financial statements and (2) involved our especially challenging, subjective, or complex judgments. The communication of critical audit matters does not alter in any way our opinion on the consolidated financial statements, taken as a whole, and we are not, by communicating the critical audit matters below, providing a separate opinionopinions on the critical audit matters or on the accounts or disclosures to which they relate.
Estimation of oil and natural gas reserves on depletion expense related to proved oil and natural gas properties
As discussed in Note 1 to the consolidated financial statements, capitalized proved property acquisition and development costs are depleted on a units-of-production method, which is based on the estimated oil and natural gas reserves remaining. For the year ended December 31, 2020,2023, the Company recorded depletion expense of proved oil and gas properties included in total depreciation, depletion and amortization expense of $358.6 million.$1.0 billion. The estimation of economically recoverable proved oil and natural gas reserves requires the expertise of professional petroleum reserve engineers who take into consideration forecasted production, operating and development cost assumptions and forecasted oil and natural gas prices inclusive of market differentials. The Company annually engages independent reserve engineers to estimate the proved oil and natural gas reserves and the Company’s internal reserve engineers update the estimates of proved oil and natural gas reserves on a quarterly basis.
We identified the estimation of oil and natural gas reserves on depletion expense related to proved oil and natural gas properties as a critical audit matter. There was a high degree of subjectivity in evaluating the estimate of proved oil and
natural gas reserves, which is a significant input into the calculation of depletion. Subjective auditor judgment was required to evaluate the assumptions used by the Company related to forecasted production, operating and development costs, and forecasted oil and natural gas pricespricing inclusive of market differentials.
The following are the primary procedures we performed to address this critical audit matter. We evaluated the design and tested the operating effectiveness of certain internal controls related to the Company’s process to estimate depletion expense related to proved oil and natural gas properties. This included controls related to the assumptions used in the proved oil and natural gas reserves estimate, and to calculate depletion expense. We evaluated (1) the professional qualifications of the Company’s internal reserve engineers as well as the externalindependent reserve engineers and externalindependent engineering firm, (2) the knowledge, skills, and ability of the Company’s internal and externalindependent reserve engineers, and (3) the relationship of the externalindependent reserve engineers and externalindependent engineering firm to the Company. We assessed the methodology used by the Company to estimate the reserves for consistency with industry and regulatory standards. We assessed the data used in the average of the first-day-of-the-month pricing assumptions used in the internal reserve engineers’ and the independent reserve engineers’ estimates of the proved reserves by comparing them to publicly available oil and natural gas benchmark pricing data, calculations of historical differentials and existing contractual arrangements. We evaluated assumptions used in the internal reserve engineers’ and independent reserve engineers’ estimates regarding future operating and development costs by comparing them to historical information including assessing the nature and timing of future development costs compared to development plan.costs. Additionally, we compared the forecasted production volumes to historical production, and we compared the Company’s historical production forecasts to actual production volumes to assess the Company’s ability to accurately forecast. We read the report of the Company’s independent reserve engineers in order to understand the methods and assumptions used by the independent reserve engineers in connection with our evaluation of the Company’s reserve estimates. We compared reserve quantity information to the corresponding information used for depletion expense and recalculated the depletion expense for compliance with regulatory standards.
Impairment
Fair value of proved oil and natural gas properties on the acquisition of Earthstone
As discussed in Note 12 to the consolidated financial statements, on November 1, 2023, the Company assesses itscompleted a merger with Earthstone Energy, Inc. (Earthstone) for equity consideration of approximately $2.9 billion. The transaction was accounted for as a business combination using the acquisition method, with the Company being identified as the accounting acquirer. Under the acquisition method of accounting, the assets acquired and liabilities assumed were recorded at their respective fair values as of the acquisition date. As a result of the transaction, the Company acquired both proved and unproved oil and natural gas properties, for impairment whenever events and circumstances indicate that thewhich were recognized at their acquisition date fair value of these assets may be below their carrying value. If an impairment indicator is$4.5 billion and $1.0 billion, respectively. The estimation of economically recoverable oil and natural gas reserves requires the expertise of professional petroleum reserve engineers who take into consideration forecasted production, forecasted development cost assumptions and forecasted oil and natural gas pricing. The Company engaged independent reserve engineers to estimate the oil and natural gas reserves.
We identified in relation to one or morethe evaluation of the acquisition-date fair value of the proved and unproved oil and natural gas properties the estimated undiscounted future net cash flows are compared to the carrying amount of the proved oil and natural gas property to determine if the carrying amount is recoverable. When the carrying amount of a proved oil and natural gas property exceeds its estimated undiscounted future net cash flows, the carrying amount is written down to its estimated fair value. Estimated discounted cash flows used to estimate fair value are based on the Company’s forecasted production of proved oil and natural gas reserves, commodity prices based on published forward price curves as of the date of the estimate, operating and development costs, and a market participant-based weighted average cost of capital rate. The Company recorded an impairment expense of $591.8 million for the year ended December 31, 2020 related to proved oil and natural gas properties.
We identified the assessment of the impairment of proved oil and natural gas propertiesEarthstone as a critical audit matter. There was aA high degree of subjective auditor judgment was required in evaluating the key assumptions used to estimate the undiscountedfair value of the proved and discounted cash flows of provedunproved oil and natural gas properties.properties as changes to those assumptions could have had a significant effect on the fair value. The key assumptions wereused by the estimated future commodity prices, including relevant price differentials,Company to determine fair value included forecasted production ofvolumes, forecasted development costs, forecasted oil and natural gas reserves,pricing, proved and unproved reserve risk adjustment factors, and the discount rate. Additionally, the audit effort associated with evaluating the forecasted oil and natural gas reserves, estimated future operatingpricing, proved and development costs,unproved reserve risk adjustment factors, and the discount rate.rate assumptions required specialized skills and knowledge.
The following are the primary procedures we performed to address this critical audit matter. We evaluated the design and tested the operating effectiveness of certain internal controls related to the Company’s acquisition-date valuation process, including controls related to assess itsthe determination of the key assumptions, as noted above, used to measure the fair value of the acquired proved and unproved oil and natural gas properties for impairment. This included controls related toproperties. We evaluated (1) the developmentprofessional qualifications of the key assumptions
includingCompany’s internal reserve engineers as well as the estimated future commodity prices, including relevant price differentials, forecasted production of oilindependent reserve engineers and natural gas reserves, risk adjustment factors associated with oil and natural gas reserves, estimated future operating and development costs, andindependent engineering firm, (2) the discount rate. We evaluated the professional qualifications, knowledge, skills, and ability of the Company’s internal and independent reserve engineers.engineers, and (3) the relationship of the independent reserve engineers and independent engineering firm to the Company. We assessedevaluated the methodologyprocesses and methodologies used by the Companyindependent reserve engineers to estimate the reservesforecasted production volumes for consistency with industry and regulatoryprofessional standards. We evaluated assumptions used incompared the internal reserve engineers’ estimates regarding future operating and development costs based by comparing them to historical information including assessing the nature and timing of future development costs compared to development plan. Additionally, we compared theestimated forecasted production volumes to historical production volumes and we compared the Company’sforecasted development costs to historical production forecasts to actual production volumes to assess the Company’s ability to accurately forecast.costs. In addition, we involved valuation professionals with specialized skills and knowledge, who assisted in:
•evaluating the Company’sforecasted oil and natural gas pricing assumptions by comparing them to independently developed ranges of forward price estimates using data from analysts and other industry sources
•evaluating the risk adjustment factors associated with the proved and unproved reserves by comparing them to the ranges of guideline risk adjustment factors by reserve class in published industry surveys
•evaluating the discount rate by comparing it to a discount rate range that was independently developed using publicly available market data for comparable entities
•evaluating the reserve category risk adjustment factors used by the Company by comparing them to third party publications of risk adjustment factors utilized by market participants
•evaluating benchmark commodity prices used by the Company in estimating future commodity prices by comparing the benchmark prices utilized to publicly disclosed commodity pricing curvesentities.
/s/ KPMG LLP
We have served as the Company’s auditor since 2014.
Denver, ColoradoDallas, Texas
February 24, 202129, 2024
Report of Independent Registered Public Accounting Firm
To the Shareholders and Board of Directors
Centennial Resource Development, Inc.:Permian Resources Corporation:
Opinion on Internal Control Over Financial Reporting
We have audited Centennial Resource Development, Inc.Permian Resources Corporation and subsidiariessubsidiaries' (the Company) internal control over financial reporting as of December 31, 2020,2023, based on criteria established inInternal Control -– Integrated Framework (2013) issued by the Committee of Sponsoring Organizations of the Treadway Commission. In our opinion, the Company maintained, in all material respects, effective internal control over financial reporting as of December 31, 2020,2023, based on criteria established inInternal Control -– Integrated Framework (2013) issued by the Committee of Sponsoring Organizations of the Treadway Commission.
We also have audited, in accordance with the standards of the Public Company Accounting Oversight Board (United States) (PCAOB), the consolidated balance sheets of the Company as of December 31, 20202023 and 2019,2022, the related consolidated statements of operations, shareholders’ equity, and cash flows for each of the years in the three-year period ended December 31, 2020,2023, and the related notes (collectively, the consolidated financial statements), and our report dated February 24, 202129, 2024 expressed an unqualified opinion on those consolidated financial statements.
The Company acquired Earthstone Energy, Inc. during 2023, and management excluded from its assessment of the effectiveness of the Company’s internal control over financial reporting as of December 31, 2023, Earthstone Energy, Inc.’s internal control over financial reporting associated with 39% of total assets and 11% of total revenues included in the consolidated financial statements of the Company as of and for the year ended December 31, 2023. Our audit of internal control over financial reporting of the Company also excluded an evaluation of the internal control over financial reporting of Earthstone Energy, Inc..
Basis for Opinion
The Company’s management is responsible for maintaining effective internal control over financial reporting and for its assessment of the effectiveness of internal control over financial reporting, included in the accompanying Management’s Annual Report on Internal Control Over Financial Reporting. Our responsibility is to express an opinion on the Company’s internal control over financial reporting based on our audit. We are a public accounting firm registered with the PCAOB and are required to be independent with respect to the Company in accordance with the U.S. federal securities laws and the applicable rules and regulations of the Securities and Exchange Commission and the PCAOB.
We conducted our audit in accordance with the standards of the PCAOB. Those standards require that we plan and perform the audit to obtain reasonable assurance about whether effective internal control over financial reporting was maintained in all material respects. Our audit of internal control over financial reporting included obtaining an understanding of internal control over financial reporting, assessing the risk that a material weakness exists, and testing and evaluating the design and operating effectiveness of internal control based on the assessed risk. Our audit also included performing such other procedures as we considered necessary in the circumstances. We believe that our audit provides a reasonable basis for our opinion.
Definition and Limitations of Internal Control Over Financial Reporting
A company’s internal control over financial reporting is a process designed to provide reasonable assurance regarding the reliability of financial reporting and the preparation of financial statements for external purposes in accordance with generally accepted accounting principles. A company’s internal control over financial reporting includes those policies and procedures that (1) pertain to the maintenance of records that, in reasonable detail, accurately and fairly reflect the transactions and dispositions of the assets of the company; (2) provide reasonable assurance that transactions are recorded as necessary to permit preparation of financial statements in accordance with generally accepted accounting principles, and that receipts and expenditures of the company are being made only in accordance with authorizations of management and directors of the company; and (3) provide reasonable assurance regarding prevention or timely detection of unauthorized acquisition, use, or disposition of the company’s assets that could have a material effect on the financial statements.
Because of its inherent limitations, internal control over financial reporting may not prevent or detect misstatements. Also, projections of any evaluation of effectiveness to future periods are subject to the risk that controls may become inadequate because of changes in conditions, or that the degree of compliance with the policies or procedures may deteriorate.
/s/ KPMG LLP
Denver, ColoradoDallas, Texas
February 24, 202129, 2024
CENTENNIAL RESOURCE DEVELOPMENT, INC. PERMIAN RESOURCES CORPORATION
CONSOLIDATED BALANCE SHEETS
(in thousands, except share and per share amounts)
| | | | | | | | | | | |
| December 31, 2020 | | December 31, 2019 |
| ASSETS | | | |
| Current assets | | | |
| Cash and cash equivalents | $ | 5,800 | | | $ | 10,223 | |
| Accounts receivable, net | 54,557 | | | 101,912 |
| | | |
| Prepaid and other current assets | 5,229 | | | 7,994 | |
| Total current assets | 65,586 | | | 120,129 |
| Property and equipment | | | |
| Oil and natural gas properties, successful efforts method | | | |
| Unproved properties | 1,209,205 | | | 1,470,903 |
| Proved properties | 4,395,473 | | | 3,962,175 |
| Accumulated depreciation, depletion and amortization | (1,877,832) | | | (931,737) | |
| Total oil and natural gas properties, net | 3,726,846 | | | 4,501,341 | |
| Other property and equipment, net | 12,650 | | | 14,612 |
| Total property and equipment, net | 3,739,496 | | | 4,515,953 | |
| Noncurrent assets | | | |
| Operating lease right-of-use assets | 3,176 | | | 11,841 | |
| Other noncurrent assets | 19,167 | | | 40,365 |
| TOTAL ASSETS | $ | 3,827,425 | | | $ | 4,688,288 | |
| | | |
| LIABILITIES AND EQUITY | | | |
| Current liabilities | | | |
| Accounts payable and accrued expenses | $ | 110,439 | | | $ | 244,309 | |
| | | |
| Operating lease liabilities | 3,155 | | | 9,232 | |
| Other current liabilities | 18,274 | | | 925 | |
| Total current liabilities | 131,868 | | | 254,466 | |
| Noncurrent liabilities | | | |
| Long-term debt, net | 1,068,624 | | | 1,057,389 | |
| Asset retirement obligations | 17,009 | | | 16,874 |
| Deferred income taxes | 2,589 | | | 85,504 | |
| Operating lease liabilities | 422 | | | 3,354 | |
| Other noncurrent liabilities | 2,952 | | | 0 | |
| Total liabilities | 1,223,464 | | | 1,417,587 |
| Commitments and contingencies (Note 13) | 0 | | 0 |
| Shareholders’ equity | | | |
| Preferred stock, $.0001 par value, 1,000,000 shares authorized: | | | |
| Series A: No shares issued and outstanding at December 31, 2020 and 1 share issued and outstanding at December 31, 2019 | 0 | | | 0 | |
| Common stock, $0.0001 par value, 620,000,000 shares authorized: | | | |
| Class A: 290,645,623 shares issued and 278,551,901 shares outstanding at December 31, 2020 and 280,650,341 shares issued and 275,811,346 shares outstanding at December 31, 2019 | 29 | | | 28 | |
| Class C (Convertible): No shares issued and outstanding at December 31, 2020 and 1,034,119 shares issued and outstanding at December 31, 2019 | 0 | | | 0 | |
| Additional paid-in capital | 3,004,433 | | | 2,975,756 | |
| Retained earnings (accumulated deficit) | (400,501) | | | 282,336 | |
| Total shareholders’ equity | 2,603,961 | | | 3,258,120 |
| Noncontrolling interest | 0 | | | 12,581 | |
| Total equity | 2,603,961 | | | 3,270,701 | |
| TOTAL LIABILITIES AND EQUITY | $ | 3,827,425 | | | $ | 4,688,288 | |
| | | | | | | | | | | |
| December 31, 2023 | | December 31, 2022 |
| ASSETS | | | |
| Current assets | | | |
| Cash and cash equivalents | $ | 73,290 | | | $ | 59,545 | |
| Accounts receivable, net | 481,060 | | | 282,846 |
| Derivative instruments | 70,591 | | | 100,797 | |
| Prepaid and other current assets | 25,451 | | | 20,602 | |
| Total current assets | 650,392 | | | 463,790 |
| Property and equipment | | | |
| Oil and natural gas properties, successful efforts method | | | |
| Unproved properties | 2,401,317 | | | 1,424,744 |
| Proved properties | 15,036,687 | | | 8,869,174 |
| Accumulated depreciation, depletion and amortization | (3,401,895) | | | (2,419,692) | |
| Total oil and natural gas properties, net | 14,036,109 | | | 7,874,226 | |
| Other property and equipment, net | 43,647 | | | 15,173 |
| Total property and equipment, net | 14,079,756 | | | 7,889,399 | |
| Noncurrent assets | | | |
| Operating lease right-of-use assets | 59,359 | | | 64,792 | |
| Other noncurrent assets | 176,071 | | | 74,611 |
| TOTAL ASSETS | $ | 14,965,578 | | | $ | 8,492,592 | |
| | | |
| LIABILITIES AND EQUITY | | | |
| Current liabilities | | | |
| Accounts payable and accrued expenses | $ | 1,167,525 | | | $ | 562,156 | |
| Operating lease liabilities | 33,006 | | | 29,759 | |
| Other current liabilities | 41,022 | | | 13,654 | |
| Total current liabilities | 1,241,553 | | | 605,569 | |
| Noncurrent liabilities | | | |
| Long-term debt, net | 3,848,781 | | | 2,140,798 | |
| Asset retirement obligations | 121,417 | | | 40,947 |
| Deferred income taxes | 422,627 | | | 4,430 | |
| Operating lease liabilities | 28,302 | | | 41,341 | |
| Other noncurrent liabilities | 73,150 | | | 3,211 | |
| Total liabilities | 5,735,830 | | | 2,836,296 |
| Commitments and contingencies (Note 14) | | | |
| Shareholders’ equity | | | |
| Common stock, $0.0001 par value, 1,500,000,000 shares authorized: | | | |
| Class A: 544,610,984 shares issued and 540,789,758 shares outstanding at December 31, 2023 and 298,640,260 shares issued and 288,532,257 shares outstanding at December 31, 2022 | 54 | | | 30 | |
| Class C: 230,962,833 shares issued and outstanding at December 31, 2023 and 269,300,000 shares issued and outstanding at December 31, 2022 | 23 | | | 27 | |
| Additional paid-in capital | 5,766,881 | | | 2,698,465 | |
| Retained earnings (accumulated deficit) | 569,139 | | | 237,226 | |
| Total shareholders’ equity | 6,336,097 | | | 2,935,748 |
| Noncontrolling interest | 2,893,651 | | | 2,720,548 | |
| Total equity | 9,229,748 | | | 5,656,296 | |
| TOTAL LIABILITIES AND EQUITY | $ | 14,965,578 | | | $ | 8,492,592 | |
The accompanying notes are an integral part of these consolidated financial statements.
CENTENNIAL RESOURCE DEVELOPMENT, INC.PERMIAN RESOURCES CORPORATION
CONSOLIDATED STATEMENTS OF OPERATIONS
(in thousands, except per share data)
| | | | | | | | | | | | | | | | | |
| Year Ended December 31, |
| 2020 | | 2019 | | 2018 |
| Operating revenues | | | | | |
| Oil and gas sales | $ | 580,456 | | | $ | 944,330 | | | $ | 891,045 | |
| Operating expenses | | | | | |
| Lease operating expenses | 109,282 | | | 145,976 | | | 83,313 | |
| Severance and ad valorem taxes | 39,417 | | | 63,200 | | | 56,523 | |
| Gathering, processing and transportation expenses | 71,309 | | | 72,834 | | | 57,624 | |
| Depreciation, depletion and amortization | 358,554 | | | 444,243 | | | 326,462 | |
| Impairment and abandonment expense | 691,190 | | | 47,245 | | | 11,136 | |
| Exploration and other expenses | 18,355 | | | 11,390 | | | 9,968 | |
| General and administrative expenses | 72,867 | | | 79,156 | | | 63,304 | |
| Total operating expenses | 1,360,974 | | | 864,044 | | | 608,330 | |
| Net gain (loss) on sale of long-lived assets | 398 | | | (857) | | | 475 | |
| Income (loss) from operations | (780,120) | | | 79,429 | | | 283,190 | |
| | | | | |
| Other income (expense) | | | | | |
| Interest expense | (69,192) | | | (55,991) | | | (26,358) | |
| Gain on exchange of debt | 143,443 | | | 0 | | | 0 | |
| Net gain (loss) on derivative instruments | (64,535) | | | (1,561) | | | 15,336 | |
| Other income (expense) | 81 | | | 334 | | | 8 | |
| Total other income (expense) | 9,797 | | | (57,218) | | | (11,014) | |
| | | | | |
| Income (loss) before income taxes | (770,323) | | | 22,211 | | | 272,176 | |
| Income tax (expense) benefit | 85,124 | | | (5,797) | | | (59,440) | |
| Net income (loss) | (685,199) | | | 16,414 | | | 212,736 | |
| Less: Net (income) loss attributable to noncontrolling interest | 2,362 | | | (616) | | | (12,837) | |
| Net income (loss) attributable to Class A Common Stock | $ | (682,837) | | | $ | 15,798 | | | $ | 199,899 | |
| | | | | |
| Income (loss) per share of Class A Common Stock: | | | | | |
| Basic | $ | (2.46) | | | $ | 0.06 | | | $ | 0.76 | |
| Diluted | $ | (2.46) | | | $ | 0.06 | | | $ | 0.75 | |
| | | | | | | | | | | | | | | | | |
| Year Ended December 31, |
| 2023 | | 2022 | | 2021 |
| Operating revenues | | | | | |
| Oil and gas sales | $ | 3,120,893 | | | $ | 2,131,265 | | | $ | 1,029,892 | |
| Operating expenses | | | | | |
| Lease operating expenses | 373,772 | | | 171,867 | | | 106,419 | |
| Severance and ad valorem taxes | 240,762 | | | 155,724 | | | 67,140 | |
| Gathering, processing and transportation expenses | 89,282 | | | 97,915 | | | 85,896 | |
| Depreciation, depletion and amortization | 1,007,576 | | | 444,678 | | | 289,122 | |
| General and administrative expenses | 161,855 | | | 159,554 | | | 110,454 | |
| Merger and integration expense | 125,331 | | | 77,424 | | | — | |
| Impairment and abandonment expense | 6,681 | | | 3,875 | | | 32,511 | |
| Exploration and other expenses | 19,337 | | | 11,378 | | | 7,883 | |
| Total operating expenses | 2,024,596 | | | 1,122,415 | | | 699,425 | |
| Net gain (loss) on sale of long-lived assets | 211 | | | (1,314) | | | 34,168 | |
| Proceeds from terminated sale of assets | — | | | — | | | 5,983 | |
| Income from operations | 1,096,508 | | | 1,007,536 | | | 370,618 | |
| | | | | |
| Other income (expense) | | | | | |
| Interest expense | (177,209) | | | (95,645) | | | (61,288) | |
| Gain (loss) on extinguishment of debt | — | | | — | | | (22,156) | |
| Net gain (loss) on derivative instruments | 114,016 | | | (42,368) | | | (148,825) | |
| Other income (expense) | 2,333 | | | 609 | | | 395 | |
| Total other income (expense) | (60,860) | | | (137,404) | | | (231,874) | |
| | | | | |
| Income before income taxes | 1,035,648 | | | 870,132 | | | 138,744 | |
| Income tax expense | (155,945) | | | (120,292) | | | (569) | |
| Net income | 879,703 | | | 749,840 | | | 138,175 | |
| Less: Net income attributable to noncontrolling interest | (403,397) | | | (234,803) | | | — | |
| Net income attributable to Class A Common Stock | $ | 476,306 | | | $ | 515,037 | | | $ | 138,175 | |
| | | | | |
| Income per share of Class A Common Stock: | | | | | |
| Basic | $ | 1.36 | | | $ | 1.80 | | | $ | 0.49 | |
| Diluted | $ | 1.24 | | | $ | 1.61 | | | $ | 0.46 | |
The accompanying notes are an integral part of these consolidated financial statements.
CENTENNIAL RESOURCE DEVELOPMENT, INC.PERMIAN RESOURCES CORPORATION
CONSOLIDATED STATEMENTS OF CASH FLOWS
(in thousands)
| | | | | | | | | | | | | | | | | |
| Year Ended December 31, |
| 2020 | | 2019 | | 2018 |
| Cash flows from operating activities: | | | | | |
| Net income (loss) | $ | (685,199) | | | $ | 16,414 | | | $ | 212,736 | |
| Adjustments to reconcile net income to net cash provided by operating activities: | | | | | |
| Depreciation, depletion and amortization | 358,554 | | | 444,243 | | | 326,462 | |
| Stock-based compensation expense - equity awards | 20,966 | | | 28,997 | | | 20,670 | |
| Impairment and abandonment expense | 691,190 | | | 47,245 | | | 11,136 | |
| Exploratory dry hole costs | 6,615 | | | 0 | | | 528 | |
| Deferred tax expense (benefit) | (85,124) | | | 5,797 | | | 59,440 | |
| Net (gain) loss on sale of long-lived assets | (398) | | | 857 | | | (475) | |
| Non-cash portion of derivative (gain) loss | 17,884 | | | (4,094) | | | 5,274 | |
| Amortization of debt issuance costs and discount | 5,923 | | | 2,861 | | | 1,749 | |
| Gain on exchange of debt | (143,443) | | | 0 | | | 0 | |
| Changes in operating assets and liabilities: | | | | | |
| (Increase) decrease in accounts receivable | 44,572 | | | (10,098) | | | (33,001) | |
| (Increase) decrease in prepaid and other assets | (3,804) | | | (1,882) | | | (1,168) | |
| Increase (decrease) in accounts payable and other liabilities | (56,360) | | | 33,833 | | | 66,660 | |
| Net cash provided by operating activities | 171,376 | | | 564,173 | | | 670,011 | |
| Cash flows from investing activities: | | | | | |
| Acquisition of oil and natural gas properties | (8,464) | | | (103,709) | | | (212,513) | |
| Drilling and development capital expenditures | (318,465) | | | (855,153) | | | (998,242) | |
| Purchases of other property and equipment | (1,083) | | | (8,857) | | | (6,058) | |
| Proceeds from sales of oil and natural gas properties | 1,689 | | | 34,730 | | | 148,149 | |
| Net cash used in investing activities | (326,323) | | | (932,989) | | | (1,068,664) | |
| Cash flows from financing activities: | | | | | |
| Proceeds from borrowings under revolving credit facility | 570,000 | | | 595,000 | | | 475,000 | |
| Repayment of borrowings under revolving credit facility | (415,000) | | | (720,000) | | | (175,000) | |
| Proceeds from issuance of Senior Notes | 0 | | | 496,175 | | | 0 | |
| Debt exchange and debt issuance costs | (6,650) | | | (7,200) | | | (5,157) | |
| Proceeds from exercise of stock options | 0 | | | 0 | | | 982 | |
| Restricted stock used for tax withholdings | (607) | | | (1,038) | | | (1,665) | |
| Net cash provided by financing activities | 147,743 | | | 362,937 | | | 294,160 | |
| Net increase (decrease) in cash, cash equivalents and restricted cash | (7,204) | | | (5,879) | | | (104,493) | |
| Cash, cash equivalents and restricted cash, beginning of period | 15,543 | | | 21,422 | | | 125,915 | |
| Cash, cash equivalents and restricted cash, end of period | $ | 8,339 | | | $ | 15,543 | | | $ | 21,422 | |
| | | | | | | | | | | | | | | | | |
| Year Ended December 31, |
| 2023 | | 2022 | | 2021 |
| Cash flows from operating activities: | | | | | |
| Net income | $ | 879,703 | | | $ | 749,840 | | | $ | 138,175 | |
| Adjustments to reconcile net income to net cash provided by operating activities: | | | | | |
| Depreciation, depletion and amortization | 1,007,576 | | | 444,678 | | | 289,122 | |
| Stock-based compensation expense - equity awards | 78,418 | | | 116,480 | | | 37,541 | |
| Stock-based compensation expense - liability awards | — | | | (24,174) | | | 20,573 | |
| Impairment and abandonment expense | 6,681 | | | 3,875 | | | 32,511 | |
| Deferred tax expense (benefit) | 152,383 | | | 119,679 | | | 569 | |
| Net (gain) loss on sale of long-lived assets | (211) | | | 1,314 | | | (34,168) | |
| Non-cash portion of derivative (gain) loss | (14,606) | | | (77,737) | | | 16,700 | |
| Amortization of debt issuance costs, debt discount and debt premium | 11,326 | | | 15,362 | | | 4,992 | |
| (Gain) loss on extinguishment of debt | — | | | — | | | 22,156 | |
| Changes in operating assets and liabilities: | | | | | |
| (Increase) decrease in accounts receivable | 36,336 | | | (66,824) | | | (21,475) | |
| (Increase) decrease in prepaid and other assets | (27,267) | | | (1,751) | | | 2,907 | |
| Increase (decrease) in accounts payable and other liabilities | 83,160 | | | 90,929 | | | 16,016 | |
| Net cash provided by operating activities | 2,213,499 | | | 1,371,671 | | | 525,619 | |
| Cash flows from investing activities: | | | | | |
| Acquisition of oil and natural gas properties, net | (234,288) | | | (8,858) | | | (6,510) | |
| Drilling and development capital expenditures | (1,524,899) | | | (771,577) | | | (319,640) | |
| Cash (paid) received for businesses acquired in mergers, net of cash received | 39,832 | | | (496,671) | | | — | |
| Purchases of other property and equipment | (34,483) | | | (3,563) | | | (901) | |
| Contingent considerations received related to divestiture | 60,000 | | | — | | | — | |
| Proceeds from sales of oil and natural gas properties | 115,459 | | | 75,620 | | | 100,575 | |
| Net cash used in investing activities | (1,578,379) | | | (1,205,049) | | | (226,476) | |
| Cash flows from financing activities: | | | | | |
| Proceeds from borrowings under revolving credit facility | 1,950,000 | | | 1,115,000 | | | 570,000 | |
| Repayment of borrowings under revolving credit facility | (2,335,000) | | | (755,000) | | | (875,000) | |
| Repayment of credit facility acquired in mergers | (830,000) | | | (400,000) | | | — | |
| Proceeds from issuance of senior notes | 997,500 | | | — | | | 170,000 | |
| Debt issuance costs | (15,169) | | | (19,833) | | | (6,421) | |
| Premiums paid on capped call transactions | — | | | — | | | (14,688) | |
| Redemption of senior secured notes | — | | | — | | | (127,073) | |
| Proceeds from exercise of stock options | 534 | | | 109 | | | 132 | |
| Share repurchases | (162,420) | | | (19,010) | | | (14,497) | |
| Dividends paid | (141,947) | | | (14,426) | | | — | |
| Distributions paid to noncontrolling interest owners | (94,686) | | | (13,465) | | | — | |
| Net cash (used in) provided by financing activities | (631,188) | | | (106,625) | | | (297,547) | |
| Net increase (decrease) in cash, cash equivalents and restricted cash | 3,932 | | | 59,997 | | | 1,596 | |
| Cash, cash equivalents and restricted cash, beginning of period | 69,932 | | | 9,935 | | | 8,339 | |
| Cash, cash equivalents and restricted cash, end of period | $ | 73,864 | | | $ | 69,932 | | | $ | 9,935 | |
The accompanying notes are an integral part of these consolidated financial statements.
CENTENNIAL RESOURCE DEVELOPMENT, INC.PERMIAN RESOURCES CORPORATION
CONSOLIDATED STATEMENTS OF CASH FLOWS (Continued)
(in thousands)
| | | | | | | | | | | | | | | | | |
| Year Ended December 31, |
| 2020 | | 2019 | | 2018 |
| Supplemental cash flow information | | | | | |
| Cash paid for interest | $ | 69,675 | | | $ | 48,905 | | | $ | 18,284 | |
| Supplemental non-cash activity | | | | | |
| Accrued capital expenditures included in accounts payable and accrued expenses | $ | 23,409 | | | $ | 97,090 | | | $ | 119,492 | |
| Asset retirement obligations incurred, including revisions to estimates | (563) | | | 2,262 | | | 1,451 | |
| Change in Senior Notes from debt exchange: | | | | | |
| Senior Secured Notes issued in the debt exchange, net of debt discount | 106,030 | | | 0 | | | 0 | |
| 2026 Senior Notes extinguished in the debt exchange, net of unamortized debt issue costs | (108,632) | | | 0 | | | 0 | |
| 2027 Senior Notes extinguished in the debt exchange, net of unamortized discount and debt issue costs | (140,840) | | | 0 | | | 0 | |
| | | | | | | | | | | | | | | | | |
| Year Ended December 31, |
| 2023 | | 2022 | | 2021 |
| Supplemental cash flow information | | | | | |
| Cash paid for interest | $ | 140,069 | | | $ | 60,700 | | | $ | 57,943 | |
| Cash paid for income taxes | 3,603 | | | 613 | | | — | |
| Supplemental non-cash activity | | | | | |
| Equity issued and long-term debt assumed to acquire oil and gas properties via mergers | $ | 4,873,949 | | | $ | 3,317,797 | | | $ | — | |
| Accrued capital expenditures included in accounts payable and accrued expenses | 325,069 | | | 166,062 | | | 29,128 | |
| Deferred tax liability assumed in asset acquisition and merger | 344,223 | | | — | | | — | |
| Asset retirement obligations incurred, including revisions to estimates | 83,446 | | | 22,648 | | | 249 | |
| Dividends payable | 3,504 | | | 1,059 | | | — | |
Reconciliation of cash, cash equivalents and restricted cash presented in the consolidated statements of cash flows:
| | | | | | | | | | | | | | | | | |
| Year Ended December 31, |
| 2020 | | 2019 | | 2018 |
| Cash and cash equivalents | $ | 5,800 | | | $ | 10,223 | | | $ | 18,157 | |
Restricted cash(1) | 2,539 | | | 5,320 | | | 3,265 | |
| Total cash, cash equivalents and restricted cash | $ | 8,339 | | | $ | 15,543 | | | $ | 21,422 | |
| | | | | | | | | | | | | | | | | |
| Year Ended December 31, |
| 2023 | | 2022 | | 2021 |
| Cash and cash equivalents | $ | 73,290 | | | $ | 59,545 | | | $ | 9,380 | |
Restricted cash(1) | 574 | | | 10,387 | | | 555 | |
| Total cash, cash equivalents and restricted cash | $ | 73,864 | | | $ | 69,932 | | | $ | 9,935 | |
(1) Included in Prepaid and other current assetsand as of December 31, 2023 and 2021 and in Prepaid and other current assets and Other noncurrent assetsasset line itemsas of December 31, 2022 in the consolidated balance sheets.sheets.
The accompanying notes are an integral part of these consolidated financial statements.
CENTENNIAL RESOURCE DEVELOPMENT, INC.PERMIAN RESOURCES CORPORATION
CONSOLIDATED STATEMENTS OF SHAREHOLDERS’ EQUITY
(in thousands) | | | | | | | | | | | | | | | | | | | | | | | | | | | | | | | | | | | | | | | | | | | | | | | | | | | | | |
| Common Stock | | Additional Paid-In Capital | | Retained Earnings (Accumulated Deficit) | | Total Shareholder’s Equity | | Non-controlling Interest | | Total Equity |
| Class A | | Class C | | | | | |
| Shares | | Amount | | Shares | | Amount | | | | | |
| Balance at December 31, 2020 | 290,646 | | | $ | 29 | | | — | | | — | | | $ | 3,004,433 | | | $ | (400,501) | | | $ | 2,603,961 | | | $ | — | | | $ | 2,603,961 | |
| Restricted stock issued | 6,075 | | | — | | | — | | | — | | | — | | | — | | | — | | | — | | | — | |
| Restricted stock forfeited | (42) | | | — | | | — | | | — | | | — | | | — | | | — | | | — | | | — | |
| Share repurchases - Class A | (2,896) | | | — | | | — | | | — | | | (14,497) | | | — | | | (14,497) | | | — | | | (14,497) | |
| Issuance of Class A Common Stock under Employee Stock Purchase Plan | 446 | | | — | | | — | | | — | | | 96 | | | — | | | 96 | | | — | | | 96 | |
| Capped call premiums | — | | | — | | | — | | | — | | | (14,688) | | | — | | | (14,688) | | | — | | | (14,688) | |
| Stock-based compensation - equity awards | — | | | — | | | — | | | — | | | 37,541 | | | — | | | 37,541 | | | — | | | 37,541 | |
| Stock option exercises | 32 | | | — | | | — | | | — | | | 132 | | | — | | | 132 | | | — | | | 132 | |
| Net income | — | | | — | | | — | | | — | | | — | | | 138,175 | | | 138,175 | | | — | | | 138,175 | |
| Balance at December 31, 2021 | 294,261 | | | 29 | | | — | | | — | | | 3,013,017 | | | (262,326) | | | 2,750,720 | | | — | | | 2,750,720 | |
| Restricted stock issued | 6,692 | | | 1 | | | — | | | — | | | (1) | | | — | | | — | | | — | | | — | |
| Issuance of Class C Common Stock, net of tax | — | | | — | | | 269,300 | | | 27 | | | (412,734) | | | — | | | (412,707) | | | 2,499,914 | | | 2,087,207 | |
| Taxes payable attributable to noncontrolling interest owners | — | | | — | | | — | | | — | | | — | | | — | | | — | | | (704) | | | (704) | |
| Restricted stock forfeited | (225) | | | — | | | — | | | — | | | — | | | — | | | — | | | — | | | — | |
| Share repurchases - Class A | (2,396) | | | — | | | — | | | — | | | (18,102) | | | — | | | (18,102) | | | — | | | (18,102) | |
| Issuance of Class A Common Stock under Employee Stock Purchase Plan | 120 | | | — | | | — | | | — | | | 604 | | | — | | | 604 | | | — | | | 604 | |
| Performance stock issued less stock used for tax withholding | 159 | | | — | | | — | | | — | | | (908) | | | — | | | (908) | | | — | | | (908) | |
| Stock-based compensation - equity awards | — | | | — | | | — | | | — | | | 116,480 | | | — | | | 116,480 | | | — | | | 116,480 | |
| Stock option exercises | 29 | | | — | | | — | | | — | | | 109 | | | — | | | 109 | | | — | | | 109 | |
| Dividends | — | | | — | | | — | | | — | | | — | | | (15,485) | | | (15,485) | | | — | | | (15,485) | |
| Distributions to noncontrolling interest owners | — | | | — | | | — | | | — | | | — | | | — | | | — | | | (13,465) | | | (13,465) | |
| Net income | — | | | — | | | — | | | — | | | — | | | 515,037 | | | 515,037 | | | 234,803 | | | 749,840 | |
| Balance at December 31, 2022 | 298,640 | | | 30 | | | 269,300 | | | 27 | | | 2,698,465 | | | 237,226 | | | 2,935,748 | | | 2,720,548 | | | 5,656,296 | |
PERMIAN RESOURCES CORPORATION
CONSOLIDATED STATEMENTS OF SHAREHOLDERS’ EQUITY (continued)
(in thousands)
| | | | | | | | | | | | | | | | | | | | | | | | | | | | | | | | | | | | | | | | | | | | | | | | | | | | | | | | | | | | | |
| Common Stock | | | | Additional Paid-In Capital | | Retained Earnings (Accumulated Deficit) | | Total Shareholder’s Equity | | Non-controlling Interest | | Total Equity |
| Class A | | Class C | | | | | | | | | |
| Shares | | Amount | | Shares | | Amount | | | | | | | | | | | | | |
| Balance at December 31, 2017 | 261,338 | | | $ | 26 | | | 15,661 | | | $ | 2 | | | | | | | | | | | $ | 2,767,558 | | | $ | 66,639 | | | $ | 2,834,225 | | | $ | 169,747 | | | $ | 3,003,972 | |
| Restricted stock issued | 1,030 | | | — | | | — | | | — | | | | | | | | | | | — | | | — | | | — | | | — | | | — | |
| Restricted stock forfeited | (136) | | | — | | | — | | | — | | | | | | | | | | | — | | | — | | | — | | | — | | | — | |
| Restricted stock used for tax withholding | (91) | | | — | | | — | | | — | | | | | | | | | | | (1,665) | | | — | | | (1,665) | | | — | | | (1,665) | |
| Option exercises | 60 | | | 0 | | | — | | | — | | | | | | | | | | | 982 | | | — | | | 982 | | | — | | | 982 | |
| Stock-based compensation | — | | | — | | | — | | | — | | | | | | | | | | | 20,670 | | | — | | | 20,670 | | | — | | | 20,670 | |
| Conversion of common shares from Class C to Class A, net of tax | 3,658 | | | 1 | | | (3,658) | | | (1) | | | | | | | | | | | 46,066 | | | — | | | 46,066 | | | (38,892) | | | 7,174 | |
| Net income (loss) | — | | | — | | | — | | | — | | | | | | | | | | | — | | | 199,899 | | | 199,899 | | | 12,837 | | | 212,736 | |
| Balance at December 31, 2018 | 265,859 | | | 27 | | | 12,003 | | | 1 | | | | | | | | | | | 2,833,611 | | | 266,538 | | | 3,100,177 | | | 143,692 | | | 3,243,869 | |
| Restricted stock issued | 4,109 | | | — | | | — | | | — | | | | | | | | | | | — | | | — | | | — | | | — | | | — | |
| Restricted stock forfeited | (116) | | | — | | | — | | | — | | | | | | | | | | | — | | | — | | | — | | | — | | | — | |
| Restricted stock used for tax withholding | (171) | | | — | | | — | | | — | | | | | | | | | | | (1,038) | | | — | | | (1,038) | | | — | | | (1,038) | |
| | | | | | | | | | | | | | | | | | | | | | | | | |
| Stock-based compensation | — | | | — | | | — | | | — | | | | | | | | | | | 28,997 | | | — | | | 28,997 | | | — | | | 28,997 | |
| | | | | | | | | | | | | | | | | | | | | | | | | |
| Conversion of common shares from Class C to Class A, net of tax | 10,969 | | | 1 | | | (10,969) | | | (1) | | | | | | | | | | | 114,186 | | | — | | | 114,186 | | | (131,727) | | | (17,541) | |
| Net income (loss) | — | | | — | | | — | | | — | | | | | | | | | | | — | | | 15,798 | | | 15,798 | | | 616 | | | 16,414 | |
| Balance at December 31, 2019 | 280,650 | | | 28 | | | 1,034 | | | 0 | | | | | | | | | | | 2,975,756 | | | 282,336 | | | 3,258,120 | | | 12,581 | | | 3,270,701 | |
| Restricted stock issued | 10,246 | | | 1 | | | — | | | — | | | | | | | | | | | (1) | | | — | | | — | | | — | | | — | |
| Restricted stock forfeited | (897) | | | — | | | — | | | — | | | | | | | | | | | — | | | — | | | — | | | — | | | — | |
| Restricted stock used for tax withholding | (550) | | | — | | | — | | | — | | | | | | | | | | | (607) | | | — | | | (607) | | | — | | | (607) | |
| Issuance of Class A common stock under Employee Stock Purchase Plan | 163 | | | 0 | | | — | | | — | | | | | | | | | | | 308 | | | — | | | 308 | | | — | | | 308 | |
| Stock-based compensation | — | | | — | | | — | | | — | | | | | | | | | | | 20,966 | | | ��� | | | 20,966 | | | — | | | 20,966 | |
| Conversion of common stock from Class C to Class A, net of tax | 1,034 | | | 0 | | | (1,034) | | | 0 | | | | | | | | | | | 8,011 | | | — | | | 8,011 | | | (10,219) | | | (2,208) | |
| Net income (loss) | — | | | — | | | — | | | — | | | | | | | | | | | — | | | (682,837) | | | (682,837) | | | (2,362) | | | (685,199) | |
| Balance at December 31, 2020 | 290,646 | | | $ | 29 | | | 0 | | | $ | 0 | | | | | | | | | | | $ | 3,004,433 | | | $ | (400,501) | | | $ | 2,603,961 | | | $ | 0 | | | $ | 2,603,961 | |
| | | | | | | | | | | | | | | | | | | | | | | | | | | | | | | | | | | | | | | | | | | | | | | | | | | | | |
| Common Stock | | Additional Paid-In Capital | | Retained Earnings (Accumulated Deficit) | | Total Shareholder’s Equity | | Non-controlling Interest | | Total Equity |
| Class A | | Class C | | | | | |
| Shares | | Amount | | Shares | | Amount | | | | | |
| Restricted stock issued | 1,204 | | | — | | | — | | | — | | | — | | | — | | | — | | | — | | | — | |
| Issuance of Class A Common Stock for Earthstone Merger | 161,166 | | | 16 | | | — | | | — | | | 2,288,014 | | | — | | | 2,288,030 | | | — | | | 2,288,030 | |
| Issuance of Class C Common Stock for Earthstone Merger, net of tax | — | | | — | | | 49,534 | | | 5 | | | (164,494) | | | — | | | (164,489) | | | 864,919 | | | 700,430 | |
| Restricted stock forfeited | (814) | | | — | | | — | | | — | | | — | | | — | | | — | | | — | | | — | |
| Share repurchases - Class A | (6,761) | | | (1) | | | — | | | — | | | (75,959) | | | — | | | (75,960) | | | — | | | (75,960) | |
| Share repurchases - Class C | — | | | — | | | (7,202) | | | (1) | | | 1 | | | — | | | — | | | (86,460) | | | (86,460) | |
| Issuance of Common Stock under Employee Stock Purchase Plan | 56 | | | — | | | — | | | — | | | 241 | | | — | | | 241 | | | — | | | 241 | |
| Performance stock vested and issued | 10,372 | | | 1 | | | — | | | — | | | (1) | | | — | | | — | | | — | | | — | |
| Stock-based compensation - equity awards | — | | | — | | | — | | | — | | | 78,418 | | | — | | | 78,418 | | | — | | | 78,418 | |
| Stock option exercises | 79 | | | — | | | — | | | — | | | 534 | | | — | | | 534 | | | — | | | 534 | |
| Dividends | — | | | — | | | — | | | — | | | — | | | (144,393) | | | (144,393) | | | — | | | (144,393) | |
| Distributions to noncontrolling interest owners | — | | | — | | | — | | | — | | | — | | | — | | | — | | | (94,683) | | | (94,683) | |
| Conversion of common shares from Class C to Class A, net of tax | 80,669 | | | 8 | | | (80,669) | | | (8) | | | 934,713 | | | — | | | 934,713 | | | (905,102) | | | 29,611 | |
| Equity impact from transactions effecting Common Units, net of tax of $2.0 million | — | | | — | | | — | | | — | | | 6,949 | | | — | | | 6,949 | | | (8,968) | | | (2,019) | |
| Net income | — | | | — | | | — | | | — | | | — | | | 476,306 | | | 476,306 | | | 403,397 | | | 879,703 | |
| Balance at December 31, 2023 | 544,611 | | | $ | 54 | | | 230,963 | | | $ | 23 | | | $ | 5,766,881 | | | $ | 569,139 | | | $ | 6,336,097 | | | $ | 2,893,651 | | | $ | 9,229,748 | |
The accompanying notes are an integral part of these consolidated financial statements.
CENTENNIAL RESOURCE DEVELOPMENT, INC.PERMIAN RESOURCES CORPORATION
NOTES TO CONSOLIDATED FINANCIAL STATEMENTS
Note 1—Basis of Presentation and Summary of Significant Accounting Policies
Description of Business
Centennial Resource Development, Inc.Permian Resources Corporation is an independent oil and natural gas company focused on the responsible acquisition, optimization and development of unconventionalcrude oil and associated liquids-rich natural gas reserves in the Permian Basin.reserves. The Company’s assets and operations are primarily concentrated in the Delaware Basin, a sub-basincore of the Permian Basin, and its properties consist of large, contiguous acreage blocks located in West Texas and New Mexico. Unless otherwise specified or the context otherwise requires, all references in these notes to “Centennial”“Permian Resources” or the “Company” are to Centennial Resource Development, Inc.Permian Resources Corporation and its consolidated subsidiary, Centennial Resource Production,subsidiaries including, Permian Resources Operating, LLC (“CRP”OpCo”).
Principles of Consolidation and Basis of Presentation
The consolidated financial statements include the accounts of the Company, and its subsidiary CRP,OpCo and CRP’sOpCo’s wholly-owned subsidiaries and have been prepared in accordance with accounting principles generally accepted in the United States of America (“GAAP”) and the rules and regulations of the United States Securities and Exchange Commission (“SEC”). All intercompany balances and transactions have been eliminated in consolidation.
Noncontrolling interests represent third-party ownership in CRPOpCo and is presented as a component of equity. See Note 9—10—Shareholders' Equity and Noncontrolling Interest for a discussion onof noncontrolling interest.
Certain prior period amounts have been reclassified to conform to the current presentation in the accompanying consolidated financial statements. Such reclassifications had no impact on net income, cash flows or shareholders’ equity previously reported.
Use of Estimates
The preparation of the Company’s consolidated financial statements requires the Company’s management to make various assumptions, judgments and estimates to determine the reported amounts of assets, liabilities, revenues and expenses, and the disclosures of commitments and contingencies. Changes in these assumptions, judgments and estimates will occur as a result of the passage of time and the occurrence of future events, and accordingly, actual results could differ from amounts previously established. Additionally, the prices received for oil, natural gas and NGL production can heavily influence the Company’s assumptions, judgments and estimates, and continued volatility of oil and gas prices could have a significant impact on the Company’s estimates.
The more significant areas requiring the use of assumptions, judgments and estimates include: (i) oil and natural gas reserves; (ii) cash flow estimates used in impairment tests offor long-lived assets; (iii) impairment expense of unproved properties; (iv) depreciation, depletion and amortization; (v) asset retirement obligations; (vi) determining fair value and allocating purchase price in connection with business combinations and asset acquisitions; (vii) accrued revenues and related receivables; (viii) accrued liabilities; (ix) derivative valuations; and (x) deferred income taxes.taxes; and (xi) determining the fair values of certain stock-based compensation awards.
Cash and Cash Equivalents and Restricted Cash
The Company considers all highly liquid instruments with an original maturity of three months or less at the time of issuance to be cash equivalents. The carrying value of cash and cash equivalents approximates fair value because of the short-term maturity of these investments. From time to time, the Company is required to maintain cash in separate accounts, the use of which is restricted by the terms of contracted arrangements. Such amounts are included in Prepaid and other current assets as of December 31, 2023 and Prepaid and other current assets and Other noncurrent assetsas of as of December 31, 2020 and December 31, 20192022 in the consolidated balance sheets.
Accounts Receivable
Accounts receivable consists mainly of receivables from oil and natural gas purchasers and from joint interest owners on properties the Company operates. For receivables from joint interest owners, the Company typically has the ability to withhold future revenue disbursements to recover non-payment of joint interest billings. Accordingly, the Company’s oil and natural gas receivables are generally collected, and the Company has minimal bad debts.
Although diversified among many companies, collectability is dependent upon the financial wherewithal of each individual company and is influenced by the general economic conditions of the industry. Receivables are not collateralized, and the Company therefore establishes an allowance for doubtful accounts equal to the portions of its accounts receivable for which collectability is not reasonably assured. The Company had $0.1 million inno allowance for doubtful accounts as of December 31, 20202023 and December 31, 2019.2022.
CENTENNIAL RESOURCE DEVELOPMENT, INC.PERMIAN RESOURCES CORPORATION
NOTES TO CONSOLIDATED FINANCIAL STATEMENTS (Continued)
Credit Risk and Other Concentrations
CentennialPermian Resources is exposed to credit risk in the event of nonpayment by counterparties. The Company normally sells production to a relatively small number of customers, as is customary in its business. The table below summarizes the purchasers that accounted for 10% or more of the Company’s total net revenues for the periods presented:
| | | | | | | | | | | | | | | | | |
| Year Ended December 31, |
| 2020 | | 2019 | | 2018 |
| BP America | 47 | % | | 37 | % | | 18 | % |
| Shell Trading (US) Company | 20 | % | | 11 | % | | 19 | % |
| Eagleclaw Midstream Ventures, LLC | 8 | % | | 8 | % | | 12 | % |
| ExxonMobil Oil Corporation | 4 | % | | 26 | % | | 0 | % |
| | | | | | | | | | | | | | | | | |
| Year Ended December 31, |
| 2023 | | 2022 | | 2021 |
| BP America | 20 | % | | 34 | % | | 50 | % |
| Shell Trading (US) Company | 20 | % | | 21 | % | | 22 | % |
| Enterprise Crude Oil, LLC | 30 | % | | 18 | % | | — | % |
| Kinetik Holdings Inc. | 5 | % | | 8 | % | | 11 | % |
During these periods, no other purchaser accounted for 10% or more of the Company’s net revenues. The loss of any of the Company’s major purchasers could materially and adversely affect its revenues in the short-term. However, based on the demand for oil and natural gas and the availability of other purchasers, the Company believes that the loss of any major purchaser would not have a material adverse effect on its financial condition and results of operations because crude oil and natural gas are fungible products with well-established markets and numerous purchasers.
By using derivative instruments to economically hedge exposures to changes in commodity prices, the Company also exposes itself to credit risk. When the fair value of a derivative contract is positive, the counterparty owes the Company, which creates credit risk. The Company minimizes the credit risk in derivative instruments by: (i) limiting its exposure to any single counterparty; and (ii) only entering into hedging arrangements with counterparties that are also participants in CRP’sOpCo’s credit agreement, all of which have investment-grade credit ratings.
Oil and Natural Gas Properties
The Company’s oil and natural gas producing activities are accounted for using the successful efforts method of accounting. Under the successful efforts method, the costs incurred to acquire, drill, and complete development wells are capitalized to proved properties. Exploration costs, including personnel and other internal costs, geological and geophysical expenses and delay rentals for oil and gas leases, are charged to expense as incurred. Costs of drilling exploratory wells, on the other hand, are initially capitalized but are charged to expense if the well is determined to be unsuccessful. Costs to operate, repair and maintain wells and field equipment are expensed as incurred.
The Company capitalizes interest on expenditures made in connection with exploration and development projects that are not subject to current amortization. Interest is capitalized only for the period that activities are in process to bring the projects to their intended use. Capitalized interest cannot exceed interest expense for the period capitalized. The Company capitalized interest of $2.1$7.8 million, $4.1$3.0 million and $2.9$1.8 million during the years ended December 31, 2020, 20192023, 2022 and 2018,2021, respectively.
Proved Properties. Costs incurred to obtain access to proved reserves and to provide facilities for extracting, treating, gathering and storing oil, natural gas and NGLs are capitalized. All costs incurred to drill and equip successful exploratory wells, development wells, development-type stratigraphic test wells, extension wells and service wells, are capitalized. Capitalized proved property acquisition and development costs are depleted using a units-of production method based on the remaining life of proved and proved developed reserves, respectively.
Net carrying values of retired, sold or abandoned properties that constitute less than a complete unit of depreciable property are charged or credited, net of proceeds, to accumulated depreciation, depletion and amortization unless doing so significantly affects the unit-of-production amortization rate, in which case a gain or loss is recognized. Gains or losses from the disposal of complete units of depreciable property are recognized to the consolidated statements of operations.
The Company reviews its proved oil and natural gas properties for impairment whenever events and circumstances indicate that there could be a possible decline in the recoverability of the carrying amount of such property. The Company estimates the expected future cash flows of its oil and natural gas properties and compares these undiscounted cash flows to the carrying amount of the oil and natural gas properties to determine if the carrying amount is recoverable. If the carrying amount exceeds the estimated undiscounted future cash flows, the Company will write down the carrying amount of the oil and natural gas properties to fair value. The factors used to determine fair value include, but are not limited to, estimates of reserves, future commodity prices, future production estimates, estimated future capital and operating expenditures and discount rates, which are based on a weighted average cost of capital. For the year ended December 31, 2020, a non-cash impairmentThere were no impairments of $591.8 million for proved oil and natural gas properties was recorded as a result of depressed oilfor the years ended December 31, 2023, 2022 and natural gas commodity prices. There were no impairments2021.
CENTENNIAL RESOURCE DEVELOPMENT, INC.PERMIAN RESOURCES CORPORATION
NOTES TO CONSOLIDATED FINANCIAL STATEMENTS (Continued)
of proved oil and natural gas properties for the years ended December 31, 2019 and 2018. Refer to
Note 8—Fair Value Measurements for additional information on the 2020 impairment charge.
Unproved Properties. Unproved properties consist of costs to acquire undeveloped leases as well as costs to acquire unproved reserves, and they are both capitalized as incurred. These consist of costs incurred in obtaining a mineral interest or a right in a property such as a lease, in addition to broker fees, recording fees and other similar costs related to acquiring properties. Leasehold costs are classified as unproved until proved reserves are discovered on or otherwise attributed to the property, at which time the related unproved property costs are transferred to proved oil and natural gas properties.
The Company evaluates significant unproved properties for impairment based on remaining lease term, drilling results, reservoir performance, seismic interpretation or changes in future plans to develop acreage. Unproved properties that are not individually significant are aggregated by prospect or geographically, and the portion of such costs estimated to be nonproductive prior to lease expiration is amortized over the average holding period. The estimate of what could be nonproductive is based on the Company’s historical experience or other information, including current drilling plans and existing geological data. Impairment and amortization of unproved properties are included in Impairment and abandonment expense in the consolidated statements of operations.
Other Property and Equipment
Other property and equipment includes office furniture and equipment, buildings, vehicles, computer hardware and software and is recorded at cost. These assets are depreciated using the straight-line method over their estimated useful lives which range from three to twenty years. Equipment upgrades and improvements are capitalized while expenditures for maintenance and repairs are expensed as incurred. When other property and equipment is sold or retired, the capitalized costs and related accumulated depreciation are removed from the accounts and a gain or loss is recorded in the consolidated statements of operations as needed.
Debt Issuance Costs, Discounts and DiscountPremiums
Debt issuance costs related to the Company’s revolving credit facility are included in the line item Other Noncurrent Assets in the consolidated balance sheets. These costs are amortized to interest expense on a straight-line basis over the borrowing term. Issuance costs incurred in connection with the Company’s Senior Notessenior notes offerings and any related issuance discount or premium are deferred and charged to interest expense over the term of the agreement; however, these amounts are reflected as a reduction of or addition to the related obligation in the line item Long-term debt on the consolidated balance sheets.
Derivative Financial Instruments
In order to mitigate its exposure to oil and natural gas price volatility, the Company may periodically use derivative instruments, such as swaps, costless collars, basis swaps, and other similar agreements. To the extent legal right of offset exists with a counterparty, the Company reports derivative assets and liabilities on a net basis.
The Company records derivative instruments in its consolidated balance sheets as either an asset or liability measured at fair value. The commodity derivative instruments are accounted for using mark-to-market accounting where all gains and losses are recognized in earnings during the period in which they are incurred. The Company’s derivatives have not been designated as hedges for accounting purposes.
Asset Retirement Obligations
The Company recognizes a liability for the estimated future costs associated with abandonment of its oil and natural gas properties. A liability for the fair value of an asset retirement obligation and corresponding increase to the carrying value of the related long-lived asset are recorded at the time a well is drilled or acquired. The fair value of the liability recognized is based on the present value of the estimated future cash outflows associated with its plug and abandonment obligations. The Company depletes the amount added to proved oil and natural gas property costs and recognizes expense in connection with the accretion of the discounted liability over the remaining estimated economic lives of the respective oil and natural gas properties. Revisions typically occur due to changes in estimated abandonment costs or well economic lives, or if federal or state regulators enact new requirements regarding the abandonment of wells.
Revenue Recognition
The Company derives revenue primarily from the sale of produced oil, natural gas, and NGLs. Revenue is recognized when a performance obligation is satisfied by transferring control of the produced oil, natural gas or NGLs to the customer. For all commodity products, the Company records revenue in the month production is delivered to the purchaser based on estimates of the amount of production delivered to the purchaser and the price the Company will receive. Payments are generally received between 30 and 90 days after the date of production. Variances between estimated sales and actual amounts received are insignificant and are recorded in the month payment is received. Refer to Note 14—15—Revenues for additional information.
CENTENNIAL RESOURCE DEVELOPMENT, INC.PERMIAN RESOURCES CORPORATION
NOTES TO CONSOLIDATED FINANCIAL STATEMENTS (Continued)
Income Taxes
The Company is subject to U.S. federal, state and local income taxes with respect to its allocable share of any taxable income or loss of OpCo, as well as any stand-alone income or loss generated by the Company. OpCo is treated as a partnership for U.S. federal and most applicable state and local income tax purposes. As a partnership, OpCo is not subject to U.S. federal and certain state and local income taxes. Any taxable income or loss generated by OpCo is passed through to and included in the taxable income or loss of its members, including the Company, on a pro rata basis.
Income taxes are recognized based on earnings reported for tax return purposes and provisions recorded for deferred income taxes. Deferred income tax assets and liabilities are recognized based on temporary differences resulting from: (i) net operating loss carryforwards for income tax purposes, and (ii) differences between the amounts recorded to the consolidated financial statements and the tax basis of assets and liabilities, as measured using enacted statutory tax rates in effect at the end of a period. The effect of a change in tax rates or tax laws is recognized in income during the period such changes are enacted. A valuation allowance for deferred tax assets is established when it is more likely than not that some portion of the benefit from deferred tax assets will not be realized.
Stock-Based Compensation
The Company’s stock-based compensation consists of equity grants of restricted stock, stock options, and performance stock units to employees and directors, an employee stock purchase plan which is available to eligible employees, and grants of restricted stock units and performance stock units that are settled in cash.. The Company determines compensation expense related to all equity-based awards based on their estimated grant-date fair value, and such expense is recognized on a straight-line basis over the applicable service period of the award. For cash settled awards classified as liabilities, compensation expense is estimated based on the fair value of the awards as of the balance sheet date, and such expense is recognized ratably over the period in which the award is expected to be paid. See Note 6—7—Stock-Based Compensation for additional information regarding the Company’s stock-based compensation.
Earnings (Loss) Per Share
Basic earnings per share (“EPS”) is calculated by dividing net income availableattributable to the Company’s Class A Common Stock by the weighted average shares of Class A Common Stock outstanding during each period. Dilutive EPS is calculated by dividing adjusted net income availableattributable to Class A Common Stock by the weighted average numbershares of diluted Class A Common Stock outstanding, which includes the effect of potentially dilutive securities. See Note 10—11—Earnings Per Share for additional information regarding the Company’s computation of EPS.
Segment Reporting
The Company operates in only 1one industry segment which is the exploration and production of oil and natural gas. All of its operations are conducted in 1one geographic area of the United States. All revenues are derived from customers located in the United States.
Note 2—Property Acquisitions and DivestituresBusiness Combinations
2020 Dispositions2023 Business Combination
Earthstone Merger
On February 24, 2020,August 21, 2023, the Company entered into a purchasean Agreement and sale agreementPlan of Merger (“the Earthstone Merger Agreement”) with Earthstone Energy, Inc. (“Earthstone”) pursuant to which Permian Resources acquired Earthstone (the “Agreement”“Earthstone Merger”) to sell certain of its water disposal assets. On May 15, 2020, the Agreement. Earthstone was terminated after the purchaser failed to close the transaction as set forth an independent oil and gas company engaged in the Agreement.
The purchaser deposited $10.0 millionoperation and development of cash in an escrow account (the “Deposit”) which,oil and natural gas properties in the event of termination of the Agreement, was to be distributed to the Company or the purchaserPermian Basin in accordance with the remedy provisions of the Agreement. Centennial believes it has a right to receive the Deposit pursuant to the terms of the Agreement. However, the purchaser advised the Company that it disputes this position,both Texas and as a result, the distribution of the Deposit is under ongoing litigation between the Company and the purchaser.
2018 Acquisitions
On February 8, 2018, the Company completed the acquisitionNew Mexico. Earthstone’s assets consisted of approximately 4,000 undeveloped167,000 net leasehold acres as well as certain minor producing properties,in the Midland Basin and 56,000 net leasehold acres in the Delaware Basin, and Earthstone’s Delaware Basin acreage is offset to Permian Resources’ existing acreage in Lea County, New Mexico for an unadjusted purchase price of $94.7 million.and Eddy Counties. The operated acreage position contains an approximate 92% average working interestEarthstone Merger was completed to drive long-term accretion across the Company’s key financial and is largely contiguous to Centennial’s existing positions in the northern Delaware Basin.
During the fourth quarter of 2018, the Company completed several acquisitions totaling approximately 2,900 net acres, which are located adjacentoperating metrics, enhance shareholder returns, improve capital efficiency, and add significant core inventory locations to the Company’s existing acreage in Lea County, New Mexico and Reeves County, Texas, for an aggregate unadjusted purchase price of $87.9 million. This purchase price encompasses certain minor producing properties that were also includedposition in the acquisitions.Permian Basin.
All acquisitions during 2018 were recorded as asset acquisitions under Accounting Standards UpdateIn connection with the Earthstone Merger, the Board of Directors of both companies unanimously determined (i) each share of Earthstone Class A common stock would be converted into the right to receive 1.446 shares (the “Exchange Ratio”) of Permian Resources Class A Common Stock, (ii) each share of Earthstone Class B common stock would be converted into the right to receive 1.446 shares of Permian Resources Class C Common Stock, (iii) each common unit of Earthstone Energy Holdings, LLC (“ASU”Earthstone OpCo”), a subsidiary of Earthstone, representing limited liability company membership interests in Earthstone OpCo (the “Earthstone OpCo Unit holders”) 2017-01, Business Combinations (Topic 805): Clarifyingwould be converted into the Definitionright to receive a number of a Business. Accordingly, the purchase consideration for these assets has been allocatedcommon units representing limited liability company interests in OpCo (“Common Units”) equal to the provedExchange Ratio.
On November 1, 2023 the Earthstone Merger was completed, and unproved oilthe Company issued 161.2 million shares of its Class A Common Stock and gas properties based on their relative fair values measured as49.5 million shares of its Class C Common Stock to Earthstone stockholders under the terms of the
CENTENNIAL RESOURCE DEVELOPMENT, INC.PERMIAN RESOURCES CORPORATION
NOTES TO CONSOLIDATED FINANCIAL STATEMENTS (Continued)
acquisition dates. After settlement statement adjustments of $0.3 million,Earthstone Merger Agreement, and the Company paid an aggregate purchase pricealso assumed Earthstone’s debt upon closing of $182.3 million. On a relative fair value basis, $142.5 million was allocated to unproved properties and $39.8 million to proved properties. Transaction costs incurred and capitalized amounted to $0.2 million and mainlyMerger, which consisted of advisory$1.05 billion of senior notes and legal fees.$830 million in borrowings outstanding under its credit facility.
2018 DispositionPurchase Price Allocation
On March 2, 2018, the Company completed the sale of approximately 8,600 undeveloped net acres and 12 gross producing wells located in Reeves County, TexasThe Earthstone Merger has been accounted for a total unadjusted sales price of $140.7 million. The divested acreage represents a largely non-operated position (32% average working interest) on the western portion of Centennial’s position in Reeves County. There was 0 gain or loss recognized as a resultbusiness combination using the acquisition method of this divestiture, which constituted a partial sale of oil and gas propertiesaccounting in accordance with Accounting StandardStandards Codification (“ASC”) 932Topic 805, Business Combinations (“ASC 805”), Extractive Activities -with the Company being identified as the accounting acquirer. Under the acquisition method of accounting, the assets acquired and liabilities assumed are recorded at their respective fair values as of the Earthstone Merger closing date, which requires judgment and certain estimates and assumptions to be made. Oil and Gas.natural gas properties were valued using an income based approach, which incorporates a discounted cash flow method. The Company usedretained Netherland, Sewell & Associates, Inc., an independent petroleum engineering firm, to prepare the estimates of all reserves obtained in connection with the Earthstone Merger and the associated pre-tax future net proceeds fromcash flows. The individuals performing reserves estimates possess professional qualifications and demonstrate competency in reserves estimation and evaluation. The fair value of Earthstone’s outstanding senior notes was based on unadjusted quoted prices for these same notes in an active market. The value of derivative instruments was based on Level 2 inputs similar to the saleCompany's other commodity price derivatives. Refer to fund the 2018 acquisitions discussed above.Note 9—Fair Value Measurements for additional information on fair value measurements.
Note 3—Accounts Receivable, Accounts Payable and Accrued Expenses
Accounts receivable are comprisedAs of the following:
| | | | | | | | | | | |
| (in thousands) | December 31, 2020 | | December 31, 2019 |
| Accrued oil and gas sales receivable, net | $ | 41,670 | | | $ | 76,578 | |
| Joint interest billings, net | 12,770 | | | 25,136 |
| Other | 117 | | | 198 |
| Accounts receivable, net | $ | 54,557 | | | $ | 101,912 | |
Accounts payabledate of this filing, the fair value of assets acquired and accrued expensesliabilities assumed are comprised ofnot complete and adjustments may be made. The Company expects to complete the following:
| | | | | | | | | | | |
| (in thousands) | December 31, 2020 | | December 31, 2019 |
| Accounts payable | $ | 5,052 | | | $ | 21,484 | |
| Accrued capital expenditures | 21,471 | | | 83,002 |
| Revenues payable | 42,115 | | | 82,539 |
| Accrued employee compensation and benefits | 11,516 | | | 12,979 | |
| Accrued interest | 15,138 | | | 19,405 | |
| Accrued derivative settlements payable | 3,488 | | | 0 |
| Accrued expenses and other | 11,659 | | | 24,900 |
| Accounts payable and accrued expenses | $ | 110,439 | | | $ | 244,309 | |
CENTENNIAL RESOURCE DEVELOPMENT, INC.PERMIAN RESOURCES CORPORATION
NOTES TO CONSOLIDATED FINANCIAL STATEMENTS (Continued)
The following table represents the merger consideration and purchase price allocation of the identifiable assets acquired and the liabilities assumed based on their respective fair values as of the closing date of the Earthstone Merger.
| | | | | |
| (in thousands, except share and per share data) | Earthstone Merger Consideration |
| Share consideration | |
| Shares of Earthstone Class A common Stock | 111,456,669 | |
| Shares of Earthstone Class B common Stock | 34,255,640 | |
| Total Earthstone common stock exchanged | 145,712,309 | |
| Exchange Ratio | 1.446 | |
| Shares of Permian Resources Class A Common Stock issued as merger consideration | 161,166,344 | |
| Shares of Permian Resources Class C Common Stock issued as merger consideration | 49,533,655 | |
| Total Permian Resources common stock issued as merger consideration | 210,699,999 | |
Permian Resources Class A Common Stock price on November 1, 2023(1) | $14.20 |
| Class A Share Consideration | $ | 2,288,030 | |
Class C Common Stock per share fair value on November 1, 2023(2) | $13.19 |
| Class C Share Consideration | $ | 653,349 | |
| Total Merger Consideration | $ | 2,941,379 | |
| |
| Fair value of assets acquired: | Preliminary Purchase Price Allocation |
| Cash and cash equivalents | $ | 39,832 | |
| Accounts receivable, net | 229,898 | |
| Prepaid and other assets | 54,377 | |
| Derivative instruments | 862 | |
| Operating lease right-of-use assets | 8,707 | |
| Unproved oil and natural gas properties | 969,989 | |
| Proved oil and natural gas properties | 4,498,192 | |
| Other property & equipment, net | 1,967 | |
| Total assets acquired | $ | 5,803,824 | |
| |
| Fair value of liabilities assumed: | |
| Accounts payable and accrued expenses | $ | 474,857 | |
| Derivative instruments | 36,361 | |
| Long-term debt, net | 1,932,570 | |
| Asset retirement obligations | 71,854 | |
| Deferred Taxes | 321,376 | |
| Operating lease liabilities | 8,708 | |
| Other liabilities, net | 16,719 | |
| Total liabilities assumed | $ | 2,862,445 | |
| Net assets acquired | $ | 2,941,379 | |
(1) The fair value of the common stock issued was based on the adjusted closing price of the Company’s Class A Common Stock on November 1, 2023 of $14.20.
(2) The fair value ascribed to the Company’s Class C Common Stock, that was issued as part of the Earthstone Merger consideration, was determined by applying a valuation discount to the share price of the Company’s Class A Common Stock as of the Earthstone Merger closing date. This discount was determined using a Finnerty model, which considers the lack of marketability of the Class C Common Stock associated with its 180-day minimum holding period required per the terms of the transaction agreement governing the Earthstone Merger.
PERMIAN RESOURCES CORPORATION
NOTES TO CONSOLIDATED FINANCIAL STATEMENTS (Continued)
The valuation model considers expected volatility based on the historical volatility of the Company’s Class A Common Stock, a risk-free interest rate based on U.S. Treasury yield curves, and the Company’s current dividend yield.
Post-Acquisition Operating Results
Since the November 1, 2023, the closing date of the Earthstone Merger, the results of operations for Earthstone have been included in the Company’s consolidated financial statements. For the year ended December 31, 2023, approximately $337.3 million of operating revenues and $211.8 million of direct operating expenses attributable to Earthstone’s business have been included in the consolidated statements of operations.
In connection with the Earthstone Merger, the Company incurred certain merger-related integration and transaction costs that are expensed as incurred. For the year ended December 31, 2023 the Company recognized transaction costs of $106.9 million related to the Earthstone Merger which are included in Merger and integration expense in the consolidated statements of operations. These costs primarily relate to bankers’ advisory, legal, consultancy and accounting fees, as well as severance and related benefits for employees that were terminated in connection with the Earthstone Merger.
Supplemental Unaudited Pro Forma Financial Information
The following supplemental unaudited pro forma financial information (“pro forma information”) for the years ended December 31, 2023 and 2022 has been prepared from the respective historical consolidated financial statements of the Company and has been adjusted to reflect the Earthstone Merger as if it had been completed on January 1, 2022.
The pro forma information is not necessarily indicative of the results that might have occurred had the merger occurred in the past and is not intended to be a projection of future results. Future results may vary significantly from the results reflected in the following pro forma information. | | | | | | | | |
| Year Ended December 31, |
| 2023 | 2022 |
| Total Revenue | $ | 4,769,673 | | $ | 5,309,689 | |
| Net Income | 896,900 | | 1,110,270 | |
| | |
| Earnings per share: | | |
| Basic | $ | 1.86 | | $ | 2.50 | |
| Diluted | 1.55 | | 1.75 | |
2022 Business Combination
Colgate Merger
On September 1, 2022, the Company completed its merger (the “Colgate Merger”) with Colgate Energy Partners III, LLC (“Colgate”) and Colgate Energy Partners III MidCo, LLC (the “Colgate Unit holder”), and all membership interests issued and outstanding immediately prior to the closing were converted into “Common Units equal to the number of shares of the Company’s Class A Common Stock that were outstanding immediately prior to the closing. All of the Colgate Unit holder’s membership interests in Colgate were exchanged for 269,300,000 shares of Class C Common Stock, 269,300,000 Common Units and $525 million in cash consideration. The Merger Agreement provided for the combination of a merger of equals transaction, with OpCo continuing as the surviving legal entity in the Merger and a subsidiary of the Company. Colgate was an independent oil and gas exploration and development company with properties located in the Delaware Basin. Colgate’s assets consisted of approximately 105,000 net leasehold acres and 25,000 net royalty acres located primarily in Reeves and Ward Counties in Texas and Eddy County in New Mexico. The Merger was completed to provide increases to our operational and financial scale, drive accretion across our key financial and operating metrics, and enhance the combined company’s shareholder returns.
Purchase Price Allocation
The Colgate Merger was accounted for as a business combination using the acquisition method of accounting in accordance with ASC 805, with the Company being identified as the accounting acquirer. Under the acquisition method of accounting, the assets acquired and liabilities assumed are recorded at their respective fair values as of the Colgate Merger closing date, which requires judgment and certain assumptions to be made. Oil and natural gas properties were valued using an income based approach which incorporates a discounted cash flow method. The fair value of Colgate’s outstanding senior notes was based on unadjusted quoted prices for these same notes in an active market. The value of derivative instruments was based on Level 2 inputs similar to the Company's other commodity price derivatives. Refer to Note 9—Fair Value Measurements for additional information on fair value measurements.
PERMIAN RESOURCES CORPORATION
NOTES TO CONSOLIDATED FINANCIAL STATEMENTS (Continued)
The purchase price allocation was finalized during the third quarter of 2023. The following table represents the final merger consideration and purchase price allocation of the identifiable assets acquired and the liabilities assumed based on their respective fair values as of the closing date of the Colgate Merger. | | | | | |
| (in thousands, except share and per share data) | Colgate Merger Consideration |
| Share consideration | |
| Shares of Class C Common Stock issued to Colgate Unit holders | 269,300,000 | |
Class C Common Stock per share fair value on September 1, 2022(1) | $ | 7.30 | |
| Fair value of noncontrolling interest that resulted from Class C Common Stock issuance | $ | 1,967,053 | |
| Cash consideration | $ | 525,000 | |
| Total Merger Consideration | $ | 2,492,053 | |
| |
| Fair value of assets acquired: | Purchase Price Allocation |
| Cash and cash equivalents | $ | 28,212 | |
| Account receivable, net | 153,286 | |
| Derivative instruments | 71,961 | |
| Prepaid and other assets | 10,288 | |
| Unproved oil and natural gas properties | 636,619 | |
| Proved oil and natural gas properties | 3,298,909 | |
| Other property and equipment, net | 2,589 | |
| Operating lease right-of-use assets | 21,894 | |
| Total assets acquired | $ | 4,223,758 | |
| |
| Fair value of liabilities assumed: | |
| Accounts payable and accrued expenses | $ | 333,250 | |
| Operating lease liabilities | 26,233 | |
| Derivative instruments | 322 | |
| Long-term debt, net | 1,350,744 | |
| Asset retirement obligations | 21,156 | |
| Total liabilities assumed | $ | 1,731,705 | |
| Net assets acquired | $ | 2,492,053 | |
(1) The fair value ascribed to the Company’s Class C Common Stock, that was issued as part of merger consideration, was determined by applying a valuation discount to the share price of the Company’s Class A Common Stock as of the Colgate Merger closing date. This discount was determined using a Finnerty model, which considers the lack of marketability of the Class C Common Stock associated with its 180-day minimum holding period required per the terms of the transaction agreement governing the Colgate Merger. The valuation model considers expected volatility based on the historical volatility of the Company’s Class A Common Stock, a risk-free interest rate based on U.S. Treasury yield curves, and the Company’s current dividend yield.
Post-Acquisition Operating Results
The results of Colgate’s operations have been included in the Company’s consolidated financial statements since September 1, 2022, the effective date of the Colgate Merger. For the year ended December 31, 2022, approximately $564.0 million of operating revenues and $132.4 million of direct operating expenses attributable to Colgate’s business have been included in the consolidated statements of operations.
In connection with the Colgate Merger, the Company incurred certain merger-related integration and transaction costs that are expensed as incurred. For the years ended December 31, 2023 and 2022, the Company recognized transaction costs of $18.4 million and $77.4 million, respectively, which are included in Merger and integration expense in the consolidated statements of operations. These costs primarily relate to bankers’ advisory fees, legal costs, accounting and consultancy fees, as well as severance and related benefits for employees that were terminated in connection with the Colgate Merger.
PERMIAN RESOURCES CORPORATION
NOTES TO CONSOLIDATED FINANCIAL STATEMENTS (Continued)
Supplemental Unaudited Pro Forma Financial Information
The following supplemental unaudited pro forma financial information for the years ended December 31, 2022 and 2021 has been prepared from the respective historical consolidated financial statements of the Company and has been adjusted to reflect the Colgate Merger as if it had been completed on January 1, 2021.
The pro forma information is not necessarily indicative of the results that might have occurred had the Colgate Merger occurred in the past and is not intended to be a projection of future results. Future results may vary significantly from the results reflected in the following pro forma information. | | | | | | | | |
| Year Ended December 31, |
| 2022 | 2021 |
| Total Revenue | $ | 3,233,675 | | $ | 1,897,578 | |
| Net Income | 489,596 | | (41,370) | |
| | |
| Earnings per share: | | |
| Basic | $ | 1.70 | | $ | (0.15) | |
| Diluted | 1.52 | | (0.15) | |
Note 3—Acquisitions and Divestitures
2023 Bolt-On Acquisitions
On December 15, 2023. the Company completed the acquisition of approximately 7,000 net leasehold acres for an unadjusted purchase price of $98 million. The acquired assets consist largely of undeveloped acreage that is contiguous to one of the Company’s existing core acreage blocks in Eddy County, New Mexico.
The acquisition was recorded as an asset acquisition in accordance with ASC 805. Total consideration paid was $97.4 million after settlement statement adjustments, of which $77.4 million was allocated to unproved properties and $24.8 million to proved properties on a relative fair value basis and $4.8 million in assumed liabilities. As of December 31, 2023, the Company incurred $2.4 million in direct transaction costs related to this purchase that have been capitalized as acquisition costs.
On February 16, 2023, the Company completed the acquisition of approximately 4,000 net leasehold acres and 3,300 net royalty acres for an unadjusted purchase price of $98 million. The acquired assets consist largely of undeveloped acreage that is contiguous to one of the Company’s existing core acreage blocks in Lea County, New Mexico.
The acquisition was recorded as an asset acquisition in accordance with ASC 805. Total consideration paid was $107.3 million after settlement statement adjustments, of which $60.8 million was allocated to proved properties and $59.5 million to unproved properties on a relative fair value basis, $9.8 million to net working capital (including $11.3 million in cash acquired), less a deferred tax liability assumed of $22.8 million. As of December 31, 2023, the Company incurred $1.7 million in direct transaction costs related to this purchase that have been capitalized as acquisition costs.
2023 SWD Divestiture
On March 13, 2023, the Company completed the sale of its operated saltwater disposal wells and the associated produced water infrastructure in Reeves County, Texas. The total cash consideration received at closing was $125 million of which $65 million was directly related to the sale and transfer of control of its water assets, while the remaining $60 million consisted of contingent consideration that is tied to the Company’s future drilling, completion and water connection activity in Reeves County, Texas. The $60 million of contingent consideration will require repayment if certain performance obligations through September 2026 are not met, and it has been recorded as a liability within the Company’s consolidated balance sheet accordingly. There was no gain or loss recognized as a result of this divestiture.
PERMIAN RESOURCES CORPORATION
NOTES TO CONSOLIDATED FINANCIAL STATEMENTS (Continued)
Note 4—Accounts Receivable, Accounts Payable and Accrued Expenses
Accounts receivable are comprised of the following: | | | | | | | | | | | |
| (in thousands) | December 31, 2023 | | December 31, 2022 |
| Accrued oil and gas sales receivable, net | $ | 345,982 | | | $ | 206,266 | |
| Joint interest billings, net | 123,160 | | | 58,375 |
| Accrued derivative settlements receivable | 8,228 | | | 16,999 | |
| Other | 3,690 | | | 1,206 |
| Accounts receivable, net | $ | 481,060 | | | $ | 282,846 | |
Accounts payable and accrued expenses are comprised of the following:
| | | | | | | | | | | |
| (in thousands) | December 31, 2023 | | December 31, 2022 |
| Accounts payable | $ | 94,533 | | | $ | 51,443 | |
| Accrued capital expenditures | 271,569 | | | 133,854 |
| Revenues payable | 527,470 | | | 250,120 |
| Accrued employee compensation and benefits | 29,836 | | | 33,897 | |
| Accrued interest | 100,882 | | | 45,627 | |
| Accrued expenses and other | 143,235 | | | 47,215 |
| Accounts payable and accrued expenses | $ | 1,167,525 | | | $ | 562,156 | |
Note 5—Long-Term Debt
The following table provides information about the Company’s long-term debt as of the dates indicated:
| | | | | | | | | | | |
| (in thousands) | December 31, 2020 | | December 31, 2019 |
| Credit Facility due 2023 | $ | 330,000 | | | $ | 175,000 | |
| | | |
8.00% Senior Secured Notes due 2025 | 127,073 | | | 0 | |
| 5.375% Senior Notes due 2026 | 289,448 | | | 400,000 | |
| 6.875% Senior Notes due 2027 | 356,351 | | | 500,000 | |
| Unamortized debt issuance costs on Senior Notes | (12,790) | | | (14,061) | |
| Unamortized debt discount | (21,458) | | | (3,550) | |
| Senior Notes, net | 738,624 | | | 882,389 | |
| | | |
| Total long-term debt, net | $ | 1,068,624 | | | $ | 1,057,389 | |
| | | | | | | | | | | |
| (in thousands) | December 31, 2023 | | December 31, 2022 |
| Credit Facility due 2027 | $ | — | | | $ | 385,000 | |
| | | |
| Senior Notes | | | |
| 5.375% Senior Notes due 2026 | 289,448 | | | 289,448 | |
| 7.75% Senior Notes due 2026 | 300,000 | | | 300,000 | |
| 6.875% Senior Notes due 2027 | 356,351 | | | 356,351 | |
| 8.00% Senior Notes due 2027 | 550,000 | | | — | |
| 3.25% Convertible Senior Notes due 2028 | 170,000 | | | 170,000 | |
| 5.875% Senior Notes due 2029 | 700,000 | | | 700,000 | |
| 9.875% Senior Notes due 2031 | 500,000 | | | — | |
| 7.00% Senior Notes due 2032 | 1,000,000 | | | — | |
| Unamortized debt issuance costs on Senior Notes | (23,149) | | | (10,994) | |
| Unamortized debt (discount)/premium | 6,131 | | | (49,007) | |
| Senior Notes, net | 3,848,781 | | | 1,755,798 | |
| | | |
| Total long-term debt, net | $ | 3,848,781 | | | $ | 2,140,798 | |
Credit Agreement
CRP,OpCo, the Company’s consolidated subsidiary, has a credit agreement with a syndicate of banks that provides for a five-year secured revolving credit facility, maturing on May 4, 2023in February 2027 (the “Credit Agreement”). On May 1, 2020, CRP, that, as borrower,of December 31, 2023, had a borrowing base of $4.0 billion and elected commitments of $2.0 billion. As of December 31, 2023, the Company as parent guarantor,had no borrowings outstanding and $2.0 billion in available borrowing capacity, net of $5.7 million in letters of credit outstanding.
On December 20, 2023, the Company entered into the secondsixth amendment to the Credit Agreement (the “Sixth Amendment”). The Sixth Amendment, among other things, increased the borrowing base from $2.5 billion to $4.0 billion and thirdmaintained the elected commitments at $2.0 billion. On September 1, 2023, the Company entered into the fourth and fifth amendments to the Credit Agreement (the “Q2 2020 Amendments”“Fourth Amendment” and the “Fifth Amendment”), which,. The Fourth Amendment expanded the waiver of the automatic reduction of the borrowing base under the Credit Agreement to, among other things, established a new borrowing baseallow for the assumption (or the
PERMIAN RESOURCES CORPORATION
NOTES TO CONSOLIDATED FINANCIAL STATEMENTS (Continued)
issuance, in certain circumstances) of up to $1.05 billion principal amount of Permitted Senior Unsecured Notes (as defined in the Credit Agreement) in order to refinance debt assumed in the Earthstone Merger and level of elected commitments of $700.0 million. The Q2 2020 Amendments that the lenders approved also permittedotherwise allow for the issuance of Permitted Senior Unsecured Notes up to an aggregate principal amount of $1.0 billion. The Fifth Amendment, among other things, waived compliance with certain restrictive covenants to enable the Senior Secured Notes in connectionEarthstone Merger, subject to customary conditions. In addition, the Fifth Amendment increased the aggregate elected commitments from $1.5 billion to $2.0 billion. The Fifth Amendment was effective as of the closing date of the Earthstone Merger on November 1, 2023.
On April 24, 2023, the Company entered into the third amendment to the Credit Agreement (the “Third Amendment”). The Third Amendment, among other things, (i) reaffirmed the borrowing base at $2.5 billion and maintained the elected commitments at $1.5 billion; (ii) expanded the exceptions to the negative covenants to permit the incurrence of additional indebtedness on a pari passu basis with the Debt Exchange (defined below),facilities in the Credit Agreement, subject to certain conditions; and they implemented an availability blocker equal(iii) made technical changes to 25%permit OpCo to potentially incur term loans in addition to the revolving loans provided under the Credit Agreement, subject to terms to be agreed with the lenders making such term loans and to the terms of the newly issued amount of Senior Secured Notes. As of December 31, 2020, the Company had $330.0 million in borrowings outstanding and $333.9 million in available borrowing capacity, which was net of $4.3 million in letters of credit outstanding and the availability blocker of $31.8 million.Credit Agreement.
The amount available to be borrowed under the Credit Agreement is equal to the lesser of (i) the borrowing base, less the availability blocker,which is set at $4.0 billion; (ii) aggregate elected commitments, which wasis set at $700.0 million pursuant to the Q2 2020 Amendments,$2.0 billion currently; or (iii) $1.5$6.0 billion. The borrowing base is redetermined semi-annually in the spring and fall by the lenders in their sole discretion. It also allows for 2the Company to request two optional borrowing base redeterminations on January 1 and July 1.in between the scheduled redeterminations. The borrowing base depends on, among other things, the quantities of CRP’sOpCo’s proved oil and natural gas reserves, estimated cash flows from thesethose reserves, and the Company’s commodity hedge positions. Upon a redetermination of the borrowing base, if actual borrowings outstanding exceed the revised borrowing capacity, CRPOpCo could be required to immediately repay a portion of its debt outstanding. Borrowings under the Credit Agreement are guaranteed by certain of CRP’s subsidiaries and the Company. In connection with the Credit Agreement’s fall 2020 semi-annual borrowing base redetermination, the borrowing base and amount of elected commitments was reaffirmed at $700.0 million.OpCo’s subsidiaries.
Borrowings under the Credit Agreement may be base rate loans or LIBORSecured Overnight Financing Rate (“SOFR”) loans. Interest is payable quarterly for base rate loans and at the end of the applicable interest period for LIBORSOFR loans. LIBORSOFR loans bear interest at LIBOR (adjusted for statutory reserve requirements and subject to 1% floor)SOFR plus an applicable margin which rangedranging from 200175 to 300275 basis points, as of December 31, 2020, depending on the percentage of the borrowing base utilized.elected commitments utilized, plus an additional 10 basis point credit spread adjustment. Base rate loans bear interest at a rate per annum equal to the greatest of: (i) the agent bank’s prime rate; (ii) the federal funds effective rate plus 50 basis points; or (iii) the adjusted LIBORTerm SOFR rate for a one-month interest period plus 100 basis points, plus an applicable margin, which ranged 100ranging from 75 to 200175 basis points, as of December 31, 2020, depending on the percentage of the borrowing base utilized. CRPOpCo also pays a commitment fee of 37.5 to 50 basis points on unused elected commitment amounts under its facility.
CRP’sThe Credit Agreement contains restrictive covenants that limit itsour ability to, among other things: (i) incur additional indebtedness; (ii) make investments and loans; (iii) enter into mergers; (iv) make restricted payments; (v) repurchase or declare dividends; (v)redeem junior debt; (vi) enter into commodity hedges exceeding a specified percentage of the Company’sour expected production; (vi)(vii) enter into interest rate hedges exceeding a specified percentage of its outstanding indebtedness; (vii)(viii) incur liens; (viii)(ix) sell assets; and (ix)(x) engage in transactions with affiliates.
CRP’sThe Credit Agreement also requires itOpCo to maintain compliance with the following financial ratios:
(i) a current ratio, which is the ratio of CRP’sOpCo’s consolidated current assets (including an add back of unused commitments under the revolving credit facility and excluding non-cash derivative assets and certain restricted cash) to its consolidated current liabilities (excluding anythe current portion of long-term debt due under the Credit Agreement and non-cash derivative liabilities), of not less than 1.0 to 1.0; and
(ii) a leverage ratio, as defined within the Credit Agreement as the ratio of total funded debt to consolidated EBITDAX (as defined within the Credit Agreement) for the most recent quarter annualized, of not greater than 3.5 to 1.0.
The Credit Agreement includes fall away covenants, lower interest rates and reduced collateral requirements that OpCo may elect if OpCo is assigned an Investment Grade Rating (as defined within the Credit Agreement).
OpCo was in compliance with the covenants and the applicable financial ratios described above as of December 31, 2023.
Convertible Senior Notes
On March 19, 2021, OpCo issued $150 million in aggregate principal amount of 3.25% senior unsecured convertible notes due 2028 (the “Convertible Senior Notes”). On March 26, 2021, OpCo issued an additional $20.0 million of Convertible Senior Notes pursuant to the exercise of the underwriters’ over-allotment option to purchase additional Convertible Senior Notes. These issuances resulted in aggregate net proceeds to OpCo of $163.6 million, after deducting debt issuance costs of $6.4 million. Interest is payable on the Convertible Senior Notes semi-annually in arrears on each April 1 and October 1.
CENTENNIAL RESOURCE DEVELOPMENT, INC.PERMIAN RESOURCES CORPORATION
NOTES TO CONSOLIDATED FINANCIAL STATEMENTS (Continued)
liabilities), of not less than 1.0 to 1.0;
(ii) a first lien leverage ratio, as defined within the Credit Agreement as the ratio of first lien debt to EBITDAX for the rolling four fiscal quarter period, which may not exceed 2.75 to 1.00 beginning with the quarter ending June 30, 2020 and extending through the quarter ending December 31, 2021, after which the maximum ratio shall decrease to 2.50 to 1.00 for each of the quarters ending in 2022; and
(iii) a leverage ratio, as also defined in the Credit Agreement as the ratio of total funded debt to consolidated EBITDAX for the rolling four fiscal quarter period. Pursuant to the Q2 2020 Amendments, the leverage ratio is suspended until March 31, 2022, at which time, the ratio may not exceed 5.0 to 1.0, with such maximum ratio declining at a rate of 0.25 for each succeeding quarter until March 31, 2023 when the ratio is set at not greater than 4.0 to 1.0.
CRP was in compliance with the covenants and applicable financial ratios described above as of December 31, 2020 and through the filing of this Annual Report.
Senior Unsecured Notes Debt Exchange
On May 22, 2020, CRP completed its private exchange of debt pursuant to which a $254.2 million aggregate principal amount of Senior Unsecured Notes (defined below) was validly tendered and exchanged by certain eligible bondholders for consideration consisting of $127.1 million aggregate principal amount (the “Debt Exchange”) of newly issued 8.00% second lien senior secured notes due 2025 (the “Senior Secured Notes”).
Whether a debt exchange should be accounted for pursuant to Financial Accounting Standards Board’s Accounting Standard Codification (“ASC”) Topic 470-60, Troubled Debt Restructurings by Debtors, or pursuant to ASC Topic 470-50, Modifications and Extinguishments (“ASC 470-50”), requires judgments to be made with respect to whether or not an entity is experiencing financial difficulty. As it was determined that Centennial was not experiencing financial difficulty and could obtain funds at market rates it could afford (i.e. non-investment grade but nontroubled debtor rates), the Company’s Debt Exchange was accounted for as an extinguishment of debt in accordance with ASC 470-50. As a result, a gain on the exchange of debt of $143.4 million was recognized in the consolidated statement of operations, which consisted of the carrying values of the Senior Unsecured Notes exchanged less the aggregate principal amount of the new Senior Secured Notes issued, net of their associated debt discount of $21.0 million (which was based on the Senior Secured Notes’ estimated fair value on the exchange date).
Senior Secured Notes
In connection with the Debt Exchange, on May 22, 2020, the Company issued $127.1 million aggregate principal amount of Senior Secured Notes. The Senior Secured Notes were recorded at their fair value on the date of issuance equal to 83.44% of par (a debt discount of $21.0 million) and net of their associated debt issuance costs of $4.2 million. The Senior Secured Notes bear interest at an annual rate of 8.00% and are due on June 1, 2025. Interest is payable semi-annually in arrears on each June 1 and December 1, commencing on December 1, 2020.
The Convertible Senior Secured Notes are fully and unconditionally guaranteed subject to certain exceptions,on a senior unsecured basis by the Company and each of CRP’s subsidiariesOpCo’s current subsidiaries.
The Convertible Senior Notes will mature on April 1, 2028 unless earlier repurchased, redeemed or converted. Before January 3, 2028, noteholders have the right to convert their Convertible Senior Notes (i) upon the occurrence of certain events, (ii) if the Company’s share price exceeds 130% of the conversion price for any 20 trading days during the last 30 consecutive trading days of a calendar quarter, after June 30, 2021, or (iii) if the trading price per $1,000 principal amount of the notes is less than 98% of the Company’s share price multiplied by the conversion rate, for a 10 consecutive trading day period. In addition, after January 2, 2028, noteholders may convert their Convertible Senior Notes at any time at their election through the second scheduled trading day immediately before the April 1, 2028 maturity date. As of December 31, 2023, certain conditions have been met, and as a result, noteholders have the right to convert their Convertible Senior Notes during the first quarter of 2024.
OpCo can settle conversions by paying or delivering, as applicable, cash, shares of Class A Common Stock, or a combination of cash and shares of Class A Common Stock, at OpCo’s election. The initial conversion rate was 159.2610 shares of Class A Common Stock per $1,000 principal amount of Convertible Senior Notes, which represents an initial conversion price of approximately $6.28 per share of Class A Common Stock. The conversion rate and conversion price are subject to customary adjustments upon the occurrence of certain events (as defined in the indenture governing the Convertible Senior Notes) which, in certain circumstances, will increase the conversion rate for a specified period of time. As of December 31, 2023, the conversion rate was adjusted to 165.2357 shares of Class A Common Stock per $1,000 principal amount of Convertible Senior Notes as a result of cash dividends and distributions paid. In the context of this issuance, we refer to the notes as convertible in accordance with ASC 470 - Debt. However, per the terms of the Convertible Senior Notes’ indenture, the Convertible Senior Notes were issued by OpCo and are secured on a second priority basis (subject in priority only to certain exceptions) by substantially allexchangeable into shares of the assets of CRP and the Company, including deposit accounts and substantially all proved reserves and undeveloped acreage.Company’s Class A Common Stock.
The CompanyOpCo has the option to redeem, in whole or in part, all (but not less than all) of the Convertible Senior Secured Notes at any time prior to May 22, 2021 on a single occasion,or after April 7, 2025, at a redemption price equal to 100% of the principal amount, plus accrued and unpaid interest to the date of redemption, but only if the last reported sale price per share of Class A Common Stock exceeds 130% of the conversion price (i) for any 20 trading days during the 30 consecutive trading days ending on the day immediately before the date OpCo sends the related redemption notice; and (ii) also on the trading day immediately before the date OpCo sends such redemption is made entirelynotice.
If certain corporate events occur, including certain business combination transactions involving the Company or OpCo or a stock de-listing with proceedsrespect to the Class A Common Stock, noteholders may require OpCo to repurchase their Convertible Senior Notes at a cash repurchase price equal to the principal amount of the Convertible Senior Notes to be repurchased, plus accrued and unpaid interest as of the repurchase date.
Upon an Event of Default (as defined in the indenture governing the Convertible Senior Notes), the trustee or the holders of at least 25% of the aggregate principal amount of then outstanding Convertible Senior Notes may declare the Convertible Senior Notes immediately due and payable. In addition, a default resulting from equity offeringscertain events of bankruptcy or insolvency with respect to the Company, OpCo or any of the subsidiary guarantors will automatically cause all outstanding Convertible Senior Notes to become due and payable.
At issuance, the Company recorded a liability equal to the face value the Convertible Senior Notes, net of unamortized debt issuance costs, in Long-term debt, net in the consolidated balance sheets. As of December 31, 2023, the net liability related to the Convertible Senior Notes was $165.9 million.
Capped Called Transactions
In connection with the issuance of unsecured indebtedness.
At any time prior to June 1, 2022, the Company has the option to redeem theConvertible Senior Secured Notes in whole March 2021, OpCo entered into privately negotiated capped call spread transactions with option counterparties (the “Capped Call Transactions”). The Capped Call Transactions cover the aggregate number of shares of Class A Common Stock that initially underlie the Convertible Senior Notes and are expected to (i) generally reduce potential dilution to the Class A Common Stock upon a conversion of the Convertible Senior Notes, and/or (ii) offset any cash payments OpCo is required to make in part, at a redemption price equal to 100%excess of the principal amount of the Convertible Senior Secured Notes, redeemed plus accruedsubject to a cap. The Capped Call Transactions have an initial strike price of $6.28 per share of Class A Common Stock and unpaid interest and a “make-whole” premium. an initial capped price of $8.4525 per share of Class A Common Stock, each of which are subject to certain customary adjustments upon the occurrence of certain corporate events, as defined in the capped call agreements.
The Senior Secured Notes are redeemable at the Company’s option, in whole or in part, at any time on or after June 1, 2022, at specified redemption prices, together with accrued and unpaid interest. In addition, at any time prior to June 1, 2022, the Company may redeem up to 35%cost of the aggregate principal amount ofCapped Call Transactions was $14.7 million, which was funded from proceeds from the Convertible Senior Note issuance. The cost to purchase the Capped Call Transactions was recorded to Additional Paid-In Capital in the consolidated balances sheets and will not be subject to remeasurement each of the Senior Secured Notes, including any permitted additional Senior Secured Notes, with an amount of cash not greater than the net proceeds of certain equity offerings at a redemption price equal to 108% of the principal amount of such Senior Secured Notes, plus any accrued and unpaid interest to, but excluding, the redemption date.reporting period.
CENTENNIAL RESOURCE DEVELOPMENT, INC.PERMIAN RESOURCES CORPORATION
NOTES TO CONSOLIDATED FINANCIAL STATEMENTS (Continued)
Senior Unsecured Notes
On November 1, 2023, in connection with the Earthstone Merger, the Company entered into supplemental indentures whereby all of Earthstone’s outstanding senior notes were assumed and became the senior unsecured debt of OpCo. The senior notes assumed by OpCo included $550 million of 8.00% senior notes due 2027 (the “2027 8.00% Senior Notes”) and $500 million of 9.875% senior notes due 2031 (the “2031 Senior Notes”). The Company recorded the acquired senior notes at their fair values as of the Earthstone Merger closing date, which were equal to 102.86% of par (a $15.7 million premium) for the 2027 8.00% Senior Notes and 107.37% of par (a $36.8 million premium) for the 2031 Senior Notes. Interest on the 2027 8.00% Senior Notes is paid semi-annually in arrears on April 15 and October 15 of each year and interest on the 2031 Senior Notes is paid semi-annually in arrears on January 15 and July 15 of each year. At any time prior to April 15, 2024 (for the 2027 8.00% Senior Notes) and July 15, 2026 (for the 2031 Senior Notes), OpCo may, on any one or more occasions, redeem all or a portion of the acquired senior notes at a redemption price decreasing annually from 106% to 100% (for the 2027 8.00% Senior Notes) and 104.94% to 100% (for the 2031 Senior Notes) of the principal amount redeemed plus accrued and unpaid interest.
On September 12, 2023, OpCo issued at par $500 million of 7.00% senior notes due 2032 (the “Original 2032 Notes”) in a 144A private placement. On December 13, 2023, OpCo issued additional notes under the indenture dated September 12, 2023 that totaled an additional $500 million of 7.00% senior notes (together with the Original 2032 Notes, the “2032 Senior Notes”), which resulted in aggregate net proceeds to the Company of $982.5 million, after deducting the issuance discount of $2.5 million and debt issuance costs of $15.0 million. The 2032 Senior Notes are treated as a single series of securities and will vote together as a single class, and have substantially identical terms, other than the issue date and issue price. Interest is payable on the 2032 Senior Notes semi-annually in arrears each January 15 and July 15. On or after January 15, 2027, OpCo may, on any one or more occasions, redeem all or a portion of the 2032 Senior Notes at a redemption price decreasing annually from 103.5% to 100% of the principal amount redeemed plus accrued and unpaid interest.
On September 1, 2022, in connection with the Colgate Merger, the Company entered into supplemental indentures whereby all of Colgate’s outstanding senior notes were assumed and became the senior unsecured debt of OpCo. The senior notes assumed by OpCo included $300 million of 7.75% senior notes due 2026 (the “2026 7.75% Senior Notes”) and $700 million of 5.875% senior notes due 2029 (the “2029 Senior Notes”). The Company recorded the acquired senior notes at their fair values as of the Colgate Merger closing date, which were equal to 100% of par for the 2026 7.75% Senior Notes and 92.96% of par (a $49.3 million debt discount) for the 2029 Senior Notes. Interest on the 2026 7.75% Senior Notes is paid semi-annually each February 15 and August 15 and interest on the 2029 Senior Notes is paid semi-annually each January 1 and July 1. Since February 15, 2024 (for the 2026 7.75% Senior Notes) and on or after July 1, 2024 (for the 2029 Senior Notes), OpCo may, on any one or more occasions, redeem all or a portion of the acquired senior notes at a redemption price decreasing annually from 103.88% to 100% (for the 2026 7.75% Senior Notes) and 102.94% to 100% (for the 2029 Senior Notes) of the principal amount redeemed plus accrued and unpaid interest.
On March 15, 2019, CRPOpCo issued $500.0 million of 6.875% senior unsecured notes due 2027 (the “2027 6.875% Senior Notes”) in a 144A private placement at a price equal to 99.235% of par that resulted in net proceeds to CRPOpCo of $489.0 million, after deducting the original issuance discount of $3.8 million and debt issuance costs of $7.2 million. Interest is payable on the 2027 6.875% Senior Notes semi-annually in arrears on each April 1 and October 1. Since April 1, which commenced2022, OpCo may, on October 1, 2019. In May 2020 in connection with the Debt Exchange, $143.7 million aggregate principal amountany one or more occasions, redeem all or a portion of the 2027 6.875% Senior Notes was exchanged for Senior Secured Notes. Asat a redemption price decreasing annually from 103.44% to 100% of December 31, 2020, the remaining aggregate principal amount of 2027 Senior Notes outstanding was $356.4 million.redeemed plus accrued and unpaid interest.
On November 30, 2017, CRPOpCo issued at par $400.0 million of 5.375% senior unsecured notes due 2026 (the “2026 5.375% Senior Notes” and collectively with the 2032 Senior Notes, 2031 Senior Notes, 2027 8.00% Senior Notes, 2027 6.875% Senior Notes, 2029 Senior Notes and the 2026 7.75% Senior Notes, the “Senior Unsecured Notes”) in ana 144A private placement that resulted in net proceeds to CRPOpCo of $391.0 million, after deducting $9.0 million in debt issuance costs. Interest is payable on the 2026 5.375% Senior Notes semi-annually in arrears on each January 15 and July 15. Since January 15, which commenced2023, OpCo may, on July 15, 2018. any one or more occasions, redeem all or a portion of the 2026 5.375% Senior Notes at a redemption price of 100% of the principal amount redeemed plus accrued and unpaid interest.
In May 2020, in connection with the Debt Exchange, $110.6 million aggregate principal amount of the 2026 5.375% Senior Notes wasand $143.7 million aggregate principal amount of the 2027 6.875% Senior Notes were validly tendered and exchanged by certain eligible bondholders for consideration consisting of $127.1 million aggregate principal amount of 8.00% second lien senior secured notes, which were fully redeemed at par in connection with the Convertible Senior Secured Notes.Notes issuance during the second quarter of 2021. As of December 31, 2020,2023, the remaining aggregate principal amount of 2027 6.875% Senior Notes and 2026 5.375% Senior Notes outstanding was $356.4 million and $289.4 million.million, respectively.
The Senior Unsecured Notes are fully and unconditionally guaranteed on a senior unsecured basis by the Company and each of CRP’sOpCo’s current subsidiaries that guarantee CRP’s revolving credit facility.OpCo’s Credit Agreement.
PERMIAN RESOURCES CORPORATION
NOTES TO CONSOLIDATED FINANCIAL STATEMENTS (Continued)
At any time prior to JanuaryApril 15, 20212024 (for the 2027 8.00% Senior Notes), July 1, 2024 (for the 2029 Senior Notes), July 15, 2026 (for the 2031 Senior Notes) and April 1, 2022January 15, 2027 (for the 20272032 Senior Notes), the “Optional"Optional Redemption Dates,” CRPOpCo may, on any one or more occasions, redeem up to 35% (40% for the 2032 Senior Notes) of the aggregate principal amount of eithereach series of Senior Unsecured Notes with an amount of cash not greater than the net cash proceeds of certain equity offerings at a redemption price equal to 105.375%108.000% (for the 20262027 8.00% Senior Notes), 105.875% (for the 2029 Senior Notes), 109.875% (for the 2031 Senior Notes) and 106.875%107.000% (for the 20272032 Senior Notes) of the principal amount of the Senior Unsecured Notes of the applicable series redeemed, plus accrued and unpaid interest to the date of redemption; provided that at least 65% (60% for the 2032 Senior Notes) of the aggregate principal amount of each such series of Senior Unsecured Notes remains outstanding immediately after such redemption, and the redemption occurs within 180 days of the closing date of such equity offering.
At any time prior to Optional Redemption Dates, CRPOpCo may, on any one or more occasions, redeem all or a part of the Senior Unsecured Notes at a redemption price equal to 100% of the principal amount of the Senior Unsecured Notes redeemed, plus a “make-whole”"make-whole” premium, and any accrued and unpaid interest as of the date of redemption. On and after the Optional Redemption Dates, CRPOpCo may redeem the Senior Unsecured Notes, in whole or in part, at redemption prices expressed as percentages of principal amount plus accrued and unpaid interest to the redemption date.
Senior Notes
The following section discusses the general termsIf OpCo experiences certain defined changes of control accompanied by a ratings decline, each holder of the indentures applicable to the Company’s Senior Unsecured Notes andmay require OpCo to repurchase all or a portion of its Senior Unsecured Notes for cash at a price equal to 101% of the aggregate principal amount of such Senior SecuredUnsecured Notes, (collectively,plus any accrued but unpaid interest to the “Senior Notes”).date of repurchase.
The indentures governing the Senior Unsecured Notes contain covenants that, among other things and subject to certain exceptions and qualifications, limit CRP’sOpCo’s ability and the ability of CRP’sOpCo’s restricted subsidiaries to: (i) incur or guarantee additional indebtedness or issue certain types of preferred stock; (ii) pay dividends on capital stock or redeem, repurchase or retire capital stock or subordinated indebtedness; (iii) transfer or sell assets; (iv) make investments; (v) create certain liens; (vi) enter into agreements that restrict dividends or other payments from their subsidiaries to them; (vii) consolidate, merge or transfer all or substantially all of their assets; (viii) engage in transactions with affiliates; and (ix) create unrestricted subsidiaries. CRPOpCo was in compliance with these covenants as of December 31, 20202023 and through the filing of this Annual Report.
Upon an Event of Default (as defined in the indentures governing the Senior Unsecured Notes), the trustee or the holders of at least 25% (or in the case of the 2026 7.75% Senior Notes and the 2029 Senior Notes, 30%) of the aggregate principal amount of then outstanding Senior Unsecured Notes may declare the Senior Unsecured Notes immediately due and payable. In addition, a default resulting from certain events of bankruptcy or insolvency with respect to CRP,OpCo, any restricted subsidiary of CRPOpCo that is a significant subsidiary, or any group of restricted subsidiaries that, taken together, would constitute a significant subsidiary, will automatically cause all outstanding Senior Unsecured Notes to become due and payable.
If CRP experiences certain defined changes of control (and in certain cases followed by a ratings decline), each holder of the Senior Notes may require CRP to repurchase all or a portion of its Senior Notes for cash at a price equal to 101% of the aggregate principal amount of such Senior Notes, plus any accrued and unpaid interest to the date of repurchase.
CENTENNIAL RESOURCE DEVELOPMENT, INC.
NOTES TO CONSOLIDATED FINANCIAL STATEMENTS (Continued)
Note 5—6—Asset Retirement Obligations
The following table summarizes the period-to-period changes in the Company’s asset retirement obligations (“ARO”) that are associated with its oil and gas properties for the periods presented:
| | | | | | | | | | | |
| (in thousands) | December 31, 2020 | | December 31, 2019 |
| Asset retirement obligations, beginning of period | $ | 16,874 | | | $ | 13,895 | |
| Liabilities incurred | 589 | | | 1,393 | |
| Liabilities on acquired properties | 147 | | | 1,167 | |
| Liabilities divested and settled | (578) | | | (1,361) | |
| Accretion expense | 1,128 | | | 912 | |
| Revision to estimated cash flows | (1,151) | | | 868 | |
| Asset retirement obligations, end of period | $ | 17,009 | | | $ | 16,874 | |
| | | | | | | | | | | |
| (in thousands) | December 31, 2023 | | December 31, 2022 |
| Asset retirement obligations, beginning of period | $ | 40,947 | | | $ | 17,240 | |
| Liabilities assumed in mergers and acquisitions | 79,114 | | | 21,156 | |
| Liabilities incurred | 4,056 | | | 1,584 | |
| Liabilities divested and settled | (6,552) | | | (546) | |
| Accretion expense | 3,576 | | | 1,605 | |
| Revision to estimated cash flows | 276 | | | (92) | |
| Asset retirement obligations, end of period | $ | 121,417 | | | $ | 40,947 | |
ARO reflect the present value of the estimated future costs associated with the plugging and abandonment of oil and gas wells, removal of equipment and facilities from leased acreage and land restoration in accordance with applicable local, state and federal laws. Inherent in the presentfair value calculation of ARO are numerous estimates and assumptions, including plug and abandonment settlement amounts, inflation factors, credit adjusted discount rates and the timing of ultimate ARO settlement. To the extent future revisions to these assumptions impact the value of the existing ARO liabilities, a corresponding offsetting adjustment is made to the oil and gas property balance. Changes in the liability due to the passage of time are recognized as an increase in the carrying amount of the liability with an offsetting charge to accretion expense, which is included within depreciation, depletion and amortization.
PERMIAN RESOURCES CORPORATION
NOTES TO CONSOLIDATED FINANCIAL STATEMENTS (Continued)
Note 6—7—Stock-Based Compensation
On October 7, 2016,May 23, 2023, the stockholders of the Company approved the Centennial Resource Development, Inc. 20162023 Long Term Incentive Plan (the “LTIP”), which authorized. The LTIP is an aggregate of 16,500,000 shares of Common Stock for issuance to employeesequity incentive plan that replaced the Company’s prior plan and, directors. In April 29, 2020, the stockholders of the Company approved the amended and restated LTIP which, among other things, increased the number of shares of Class A Common Stock authorized for issuance to employees and directors by 25,000,000 shares to a total of 69,250,000 shares. On February 20, 2024, in connection with the Earthstone Merger, the Company amended and restated the LTIP to further increase the number of shares of Class A Common Stock authorized for issuance by 8,250,000 shares. As2,468,560 shares to a total of December 31, 2020,71,718,560 shares, reflecting the shares that the Company had 6,579,226 shares of Common Stock available for future grants.assumed from the Earthstone Energy, Inc. Amended and Restated 2014 Long Term Incentive Plan in connection with the Earthstone Merger. The LTIP provides for grants of restricted stock, stock options (including incentive stock options and nonqualified stock options), restricted stock units (including performance stock units), stock appreciation rights and other stock or cash-based awards.
As a result of the decline in crude oil and natural gas prices, ongoing uncertainty regarding the oil supply-demand macro environment and the related temporary suspension of the Company’s drilling and completion activities during 2020, the Company implemented a reduction to its workforce in the second quarter of 2020. In connection with this workforce reduction, the Compensation Committee of the Company’s Board of Directors approved an accelerated partial vesting of certain unvested stock options and restricted stock awards held by 37 of the terminated employees. The acceleration changed the terms of the vesting conditions and are therefore treated as modifications in accordance with ASC Topic 718, Compensation-Stock Compensation (“ASC 718”). The modification resulted in a decrease to total stock-based compensation expense of $2.7 million associated with the decrease in the fair value of the modified awards compared to the original awards’ fair value. The shares and options that were accelerated are included within the vested line item in the below tables.
Stock-based compensation expense is recognized within both General and administrative expenses and Exploration and other expenses in the consolidated statements of operations. The Company accounts for forfeitures of its stock-based compensation awards granted under the LTIP as they occur, when determining compensation expense.
CENTENNIAL RESOURCE DEVELOPMENT, INC.
NOTES TO CONSOLIDATED FINANCIAL STATEMENTS (Continued)
The following table summarizes stock-based compensation expense recognized for the periods presented:
| | | | | | | | | | | | | | | | | |
| Year Ended December 31, |
| (in thousands) | 2020 | | 2019 | | 2018 |
| Equity Awards | | | | | |
| Restricted stock awards | $ | 15,355 | | | $ | 15,929 | | | $ | 9,185 | |
| Stock option awards | 1,980 | | | 9,562 | | | 9,433 | |
| Performance stock units | 3,312 | | | 3,374 | | | 2,052 | |
Other stock-based compensation expense(1) | 319 | | | 132 | | | 0 | |
| Total stock-based compensation expense - equity awards | 20,966 | | | 28,997 | | | 20,670 | |
| Liability Awards | | | | | |
| Restricted stock units | 1,788 | | | 0 | | | 0 | |
| Performance stock units | 1,814 | | | 0 | | | 0 | |
| Total stock-based compensation - liability awards | 3,602 | | | 0 | | | 0 | |
| Total stock-based compensation expense | $ | 24,568 | | | $ | 28,997 | | | $ | 20,670 | |
| | | | | | | | | | | | | | | | | |
| Year Ended December 31, |
| (in thousands) | 2023 | | 2022 | | 2021 |
| Equity Awards | | | | | |
| Restricted stock | $ | 34,762 | | | $ | 36,825 | | | $ | 33,162 | |
| Stock option awards | 1 | | | 80 | | | 737 | |
| Performance stock units | 43,655 | | | 79,282 | | | 3,350 | |
Other stock-based compensation expense(1) | — | | | 293 | | | 292 | |
| Total stock-based compensation - equity awards | 78,418 | | | 116,480 | | | 37,541 | |
| Liability Awards | | | | | |
| Restricted stock units | — | | | — | | | 4,392 | |
| Performance stock units | — | | | (14,789) | | | 22,360 | |
| Total stock-based compensation - liability awards | — | | | (14,789) | | | 26,752 | |
| Total stock-based compensation expense | $ | 78,418 | | | $ | 101,691 | | | $ | 64,293 | |
(1) Includes expenses related to the Company’s EmployeesEmployee Stock Purchase Plan (the “ESPP”). In May 2019, an aggregate of 2,000,000 shares were authorized by stockholders for issuance under the ESPP, which became effective on July 1, 2019. As of December 31, 2020,January 1, 2023, the Company had 1,837,381 shares of Common Stock available for future issuance.no longer offers the ESPP.
Equity Awards
The Company has restricted stock, awards, stock options and performance stock units (“PSUs”) outstanding that were granted under the LTIP as discussed below. Each award has service-based and, in the case of the PSUs, market-based vesting requirements, and are expected to be settled in shares of the Company’sClass A Common Stock upon vesting. As a result, these awards are classified as equity-based awards in accordance with ASC Topic 718, Compensation-Stock Compensation (“ASC 718”).
In connection with the Colgate Merger, the Compensation Committee of the Company’s Board of Directors (the “Compensation Committee”) approved a resolution to extend severance benefits under the Company’s Second Amended and Restated Severance Plan (the “Severance Plan”) to employees that experience a Qualifying Termination (as defined in the Severance Plan) following the Colgate Merger. As a result, affected employees of the Company received an accelerated vesting of their unvested restricted stock awards and PSUs upon termination, which changed the terms of the vesting conditions and were treated as modifications in accordance with ASC 718. During the years ended December 31, 2023 and 2022, forty-three employees and two non-employee directors had Qualifying Terminations and received accelerated vesting of their unvested stock awards. These modifications resulted in an increase to total stock-based compensation expense of $40.0 million for the year ended December 31, 2023 and $46.5 million for the year ended December 31, 2022 as a result of the change in the fair value of the modified awards. The restricted stock shares and performance stock units that were accelerated are included within the vested line items in the below tables.
PERMIAN RESOURCES CORPORATION
NOTES TO CONSOLIDATED FINANCIAL STATEMENTS (Continued)
Restricted Stock
The following table provides a summary of theinformation about restricted stock activity during the year ended December 31, 2020:2023:
| | Awards | | Wtd. Avg. Grant-Date Fair Value |
| Unvested balance as of December 31, 2019 | 4,838,996 | | | $ | 8.51 | |
| Restricted Stock | | | Restricted Stock | | Weighted Average Fair Value |
| Unvested balance as of December 31, 2022 | |
| Granted | Granted | 10,245,500 | | | 1.12 | |
| Vested | Vested | (2,093,937) | | | 8.31 | |
| Forfeited | Forfeited | (896,836) | | | 5.85 | |
| Unvested balance as of December 31, 2020 | 12,093,723 | | | 2.33 | |
| Unvested balance as of December 31, 2023 | |
The Company grants service-based restricted stock awards to executivecertain officers and employees, which vesteither vests ratably over a three-year service period or cliff vests upon a three or five-year service period, and to directors, which vest over a one-year service period. Compensation cost for these service-based restricted stock awardsgrants is based on the closing market price of the Company’s Class A Common Stock on the grant date, and such costs are recognized ratably over the applicable vesting period. The weighted average grant-date fair value for restricted stock awards granted was $1.12, $6.59$10.99, $7.92 and $18.11$5.25 per share for the years ended December 31, 2020, 20192023, 2022 and 2018,2021, respectively. The total fair value of restricted stock awards that vested for the years ended December 31, 2020, 20192023, 2022 and 20182021 was $17.4$35.8 million, $12.0$35.7 million and $6.6$15.1 million, respectively. Unrecognized compensation cost related to restricted shares that were unvested as of December 31, 20202023 was $21.0$25.4 million, which the Company expects to recognize over a weighted average period of 1.92.3 years.
Stock Options
Stock options that have been granted under the LTIP expire ten years from the grant date and vest ratably over atheir three-year service period. The exercise price for an option granted under the LTIP is the closing market price of the Company’s Class A Common Stock on the grant date.
Compensation cost for stock options is based on the grant-date fair value of the award, which is then recognized ratably over the vesting period of three years. The Company estimates the grant-date fair value using the Black-Scholes option-pricing model. Expected volatilities are based on the weighted average historical volatilities of the Company and an identified set of comparable
CENTENNIAL RESOURCE DEVELOPMENT, INC.
NOTES TO CONSOLIDATED FINANCIAL STATEMENTS (Continued)
companies. Expected term is based on the simplified method and is estimated as the mid-point between the weighted average vesting term and the time to expiration as of the grant date. The Company uses U.S. Treasury bond rates in effect at the grant date for its risk-free interest rates.
The following table summarizes the assumptions and related information used to determine the grant-date fair value ofNo stock options awarded forwere granted during the periods presented:
| | | | | | | | | | | | | | | | | |
| Years Ended December 31, |
| 2020 | | 2019 | | 2018 |
| Weighted average grant-date fair value per share | $ | 1.16 | | | $ | 4.32 | | | $ | 8.58 | |
| Expected term (in years) | 6 | | 6 | | 6 |
| Expected stock volatility | 86 | % | | 47 | % | | 42 | % |
| Dividend yield | 0 | | | 0 | | | 0 | |
| Risk-free interest rate | 1.0 | % | | 2.2 | % | | 2.7 | % |
The following table provides information about stock option awards outstanding during the year ended December 31, 2020:
| | | | | | | | | | | | | | | | | | | | | | | |
| Options | | Wtd. Avg. Exercise Price | | Wtd. Avg. Remaining Term
(in years) | | Aggregate Intrinsic Value
(in thousands) |
| Outstanding as of December 31, 2019 | 4,764,167 | | | $ | 15.99 | | | | | |
| Granted | 124,000 | | | 2.13 | | | | | |
| Exercised | (366) | | | 0.25 | | | | | $ | 0 | |
| Forfeited | (130,424) | | | 13.12 | | | | | |
| Expired | (2,394,043) | | | 16.34 | | | | | |
| Outstanding as of December 31, 2020 | 2,363,334 | | | 15.07 | | | 6.5 | | $ | 78 | |
| Exercisable as of December 31, 2020 | 2,011,809 | | | 15.98 | | | 6.2 | | $ | 0 | |
| | | | | | | | | | | | | | | | | | | | | | | |
| Options | | Weighted Average Exercise Price | | Weighted Average Remaining Term (in years) | | Aggregate Intrinsic Value
(in thousands) |
| Outstanding as of December 31, 2022 | 2,056,467 | | | $ | 15.44 | | | | | |
| Granted | — | | | — | | | | | |
| Exercised | (79,434) | | | 6.75 | | | | | $ | 387 | |
| Forfeited | — | | | — | | | | | |
| Expired | (1,295,334) | | | 15.34 | | | | | |
| Outstanding as of December 31, 2023 | 681,699 | | | 16.64 | | | 3.7 | | $ | 628 | |
| Exercisable as of December 31, 2023 | 681,699 | | | 16.64 | | | 3.7 | | $ | 628 | |
The total fair value of stock options that vested during the yearsyear ended December 31, 2020, 2019 and 20182023 was $5.7 million, $10.2minimal compared to $0.3 million and $8.8$1.2 million for the years ended 2022 and 2021, respectively. The intrinsic value of the stock options exercised during the year ended December 31, 20202023 was $0.4 million and minimal there were 0 stock options exercised duringfor the yearyears ended December 31, 2019,2022 and the intrinsic value of stock options exercised during the year ended December 31, 2018 was approximately $0.2 million.2021. As of December 31, 2020,2023, there was $0.9 million ofno unrecognized compensation cost related to unvested stock options, which the Company expects to recognize on a pro-rata basis over a weighted-average period of 1.1 years.options.
Performance Stock Units
The Company grants performance stock units (“PSU”) to certain executive officers that are subject to market-based vesting criteria as well as a three-year service period.period ranging from three to five years. Vesting at the end of the three-year service period is subjectdepends on the Company’s absolute annualized total shareholder return (“TSR”) over the service period, as well as the Company’s TSR relative to the condition that the Company’s stock price increases by a greater percentage, or decreases by a lesser percentage, than the average percentage increase or decrease, respectively, of the stock pricesTSR of a peer group of companies. TheThese market-based conditions must be met in order for thesethe stock awards to vest, and it is therefore possible that no shares could ultimately vest. However, the Company recognizes compensation expense for these performance stock unitsthe PSUs subject to market conditions regardless of whether suchit becomes probable that these conditions arewill be met or not, and compensation expense is not reversed if vesting does not actually occur.
PERMIAN RESOURCES CORPORATION
NOTES TO CONSOLIDATED FINANCIAL STATEMENTS (Continued)
The grant-dateCompany’s PSUs currently outstanding can be settled in either Class A Common Stock or cash upon vesting at the Company’s discretion. The Company intends to settle all PSUs in Class A Common Stock and has sufficient shares available under the LTIP to settle the units in Class A Common Stock at the potential future vesting dates. Accordingly, the PSUs have been treated as equity-based awards with their fair value wasvalues determined as of the grant or modification date, as applicable. The fair values of the awards are estimated using a Monte Carlo valuation model. The Monte Carlo valuation model is based on random projections of stock price paths and must be repeated numerous times to achieve a probabilistic assessment. Expected volatility was calculated based on the historical volatility of the Company’s common stock as well as the peer companies that are specified in the award agreement,Class A Common Stock, and the risk-free interest rate is based on U.S. Treasury yield curve rates with maturities consistent with the three-year vesting period.
CENTENNIAL RESOURCE DEVELOPMENT, INC.
NOTES TO CONSOLIDATED FINANCIAL STATEMENTS (Continued)periods.
The following table summarizes the key assumptions and related information used to determine the grant-date fair value of performance stock units awardedPSUs measured during the periods presented:
| | | | | | | | | | | |
| |
| 2019 | | 2018 |
| Weighted average grant-date fair value per unit | $ | 6.68 | | | $ | 22.35 | |
| Number of simulations | 1,000,000 | | | 1,000,000 | |
| Expected stock volatility | 52.3 | % | | 40.2 | % |
| Dividend yield | 0 | % | | 0 | % |
| Risk-free interest rate | 1.8 | % | | 2.8 | % |
| | | | | | | | | | | | | | | | | | | | |
| | Year Ended December 31, |
| | 2023 | | 2022 | | 2021 |
| | | | | | |
| Weighted average fair value per share | | $18.19 | | $12.59 | | $9.36 |
| Number of simulations | | 10,000,000 | | 10,000,000 | | 10,000,000 |
| Weighted Average Expected implied stock volatility | | 55.4% | | 72.3% | | 99.8% |
| Dividend yield | | —% | | —% | | —% |
| Weighted Average risk-free interest rate | | 4.2% | | 3.2% | | 0.8% |
The following table provides information about
performance stock unitsPSUs outstanding during the year ended December 31,
2020:2023: | | | | | | | | | | | |
| Awards | | Weighted Average Fair Value |
| Unvested balance as of December 31, 2022 | 7,638,098 | | | $ | 13.11 | |
| Granted | 288,355 | | | 18.19 | |
Vested(1) | (2,462,725) | | | 10.10 | |
| Forfeited | (444,303) | | | 13.59 | |
| Unvested balance as of December 31, 2023 | 5,019,425 | | | 15.18 | |
| | | | | | | | | | | |
| Awards | | Wtd. Avg. Grant Date Fair Value |
| Unvested balance as of December 31, 2019 | 872,672 | | | $ | 13.44 | |
| Granted | 0 | | | 0 | |
| Vested | 0 | | | 0 | |
| Cancelled | (193,391) | | | 21.53 | |
| Forfeited | 0 | | | 0 | |
| Unvested balance as of December 31, 2020 | 679,281 | | | 11.13 | |
The total fair value of PSUs that vested during the year ended December 31, 2023 was $41.1 million compared to $53.6 million during the year ended December 31, 2022. As of December 31, 2020,2023, there was $2.4$45.1 million of unrecognized compensation cost related to unvested performance stock units, which the Company expects to recognize on a pro rata basis over a weighted average period of 1.2 years2.7 years.
Liability Awards
The Company hashad restricted stock units and performance stock units that were granted under the LTIP, which will be settledwere settleable in cash by the Company and are thereforewere classified as liability awards in accordance with ASC 718.718, but all such units were settled or modified to be settled in shares in 2022 and 2021. Compensation cost for thethese liability awards iswas based on the fair value of the units as of eachthe balance sheet date as further discussed below, and such costs arewere recognized ratably over the service periods of the awards. As the fair value of liability awards is required to be re-measured at each period end, stock compensation expense amounts recognized in future periods for these awards will vary. The estimated future cash payments of these awards are presented as liabilities within Other current liabilities and Other long-term liabilities in the consolidated balances sheets.
Restricted Stock Units
During the year ended December 31, 2020, theThe Company granted 5.5 million restricted stock units during the third quarter of 2020 to certain officers and employees that will be settledwere settleable in cash.cash upon vesting. The restricted stock units vestvested annually in one-third increments over a three-year service period, with the first portion vesting on September 1, 2021. After one year from the grant date, however, the remaining two-thirds of unvested restricted stock units cancould vest immediately on an accelerated basis if they meet certain market-based vesting criteria (equal to the maximum return percentage discussed below for at least 20 out of any 30 consecutive trading days). Additionally, the restricted stock units includeincluded maximum and minimum return amounts equal to 400% and 25%, respectively, of the closing market price of the Company’s common stockClass A Common Stock on the grant date. As of December 31, 2020, there was $5.5 million of unrecognized compensation cost, which represents the unvested portion of the fair value of the restricted stock units at December 31, 2020 and which will be recognized over a weighted average period of 1.8 years.
Performance Stock Units
During the year ended December 31, 2020, the Company granted 5.5 million performance stock units to certain executive officers that will be settled in cash that are subject to market-based vesting criteria as well as a three-year service condition. Vesting at the end of the three-year service period is subject to the condition that the Company’s stock price increases by a greater percentage, or decreases by a lessor percentage, than the average percentage increase or decrease, respectively, of the stock price of a peer group of companies. The market-based conditions must be met in order for the awards to vest, and it is therefore possible that no units could ultimately vest and cumulative stock compensation expense recognized for these awards would then be reduced to zero. As of December 31, 2020, there was $10.6 million of unrecognized compensation cost, which represents the unvested portion of the fair value of the performance stock units at December 31, 2020, and which will be recognized over a weighted average period of 2.5 years.
CENTENNIAL RESOURCE DEVELOPMENT, INC.PERMIAN RESOURCES CORPORATION
NOTES TO CONSOLIDATED FINANCIAL STATEMENTS (Continued)
Liability Awards Fair ValueDuring the second quarter of 2021, the Company amended these restricted stock unit agreements to (i) allow the units to be settleable in either cash or Class A Common Stock upon vesting at the Company’s discretion and (ii) remove the maximum and minimum return amounts if the units are settled in Class A Common Stock. The amended terms were effective July 1, 2021, and at the time, the Company intended to settle a portion of these restricted stock units in cash. As a result, the awards continued to be classified as liabilities in accordance with ASC 718.
During the third quarter of 2021, the maximum return event (described above) occurred resulting in an immediate vesting of all the outstanding restricted stock units on September 1, 2021. The fair valueCompany settled 1.8 million of the restricted stock units in cash resulting in a $6.2 million cash payment, and performancethe remaining units were settled in Class A Common Stock. The portion of the units that were settled in Class A Common Stock were recognized as equity instruments on the vesting date, which resulted in $13.6 million of incremental stock compensation expense being recognized during the year ended December 31, 2021. There are no remaining restricted stock units was estimated using a Monte Carlo valuation modeloutstanding as of the balance sheet date. December 31, 2023.
Performance Stock Units
The Monte Carlo valuation model is based on random projectionsCompany granted 5.5 million PSUs during third quarter of stock price paths2020 to certain executive officers that were settleable in cash and must be repeated numerous timessubject to achieve a probabilistic assessment. Expected volatility was calculated based on the historical volatility of the Company’s common stockmarket-based vesting criteria as well as a three-year service condition unless otherwise accelerated in accordance with the historical volatility of certain peer companies that are namedterms in the award agreement2020 PSU agreement. As the PSUs were settleable in cash they were classified as liability awards in accordance with ASC 718 with the compensation cost for the performance stock units. The risk-free rate isthese liability awards being recorded based on U.S. Treasury yield curve ratestheir fair value as of each balance sheet date.
On August 18, 2022, the Compensation Committee amended the 2020 PSU agreement to allow a portion of the units to be settled in either cash or Class A Common Stock upon vesting at the Company’s discretion. At that time, the Company had the ability and intended to settle the 4.7 million 2020 PSUs that were modified in shares. As a result, these units were reclassified to equity based awards in accordance with maturities consistentASC 718 and $10.0 million of incremental stock compensation expense was recognized during the third quarter of 2022 associated with the remaining vesting or performance period.
The following table summarizes the key assumptions and related information used to determinechange in the fair value of the units. As of December 31, 2023, the 2020 PSUs were fully vested and settled in shares.
The remaining 0.8 million 2020 PSUs were accelerated vested and settled in a $9.4 million cash payment during the third quarter of 2022. There are no liability awardsclassified performance stock units outstanding as of December 31, 2020:
| | | | | | | | | | | |
| Restricted stock units | | Performance stock units |
| Number of simulations | 10,000,000 | | | 10,000,000 | |
| Expected stock volatility | 123.2 | % | | 126.9 | % |
| Dividend yield | 0 | % | | 0 | % |
| Risk-free interest rate | 0.2 | % | | 0.1 | % |
| Shares outstanding | 5,442,681 | | | 5,464,433 | |
Note 7—8—Derivative Instruments
The Company is exposed to certain risks relating to its ongoing business operations and may use derivative instruments to manage its exposure to commodity price risk from time to time.
Commodity Derivative Contracts
Historically, prices received for crude oil and natural gas production have been volatile because of supply and demand factors, worldwide political factors, general economic conditions and seasonal weather patterns. The Company may periodically use derivative instruments, such as swaps, costless collars and basis swaps, to mitigate its exposure to declines in commodity prices and to the corresponding negative impacts such declines can have on its cash flowflows from operations, returns on capital and other financial results. While the use of these instruments limits the downside risk of adverse price changes, their use may also limit future revenues from favorable price changes. The Company does not enter into derivative contracts for speculative or trading purposes.
Commodity Swap, Collar Contracts and Collar Contracts.Deferred Premium Puts. The Company may use commodity derivative instruments known as fixed price swaps to realize a known price for a specific volume of production, basis swaps to hedge the difference between the index price and a local or future index price, or costless collars to establish fixed price floors and ceilings.ceilings, or deferred premium puts to establish fixed price floors while delaying the premium payment until the option’s expiration. All transactions are settled in cash with one party paying the other for the resulting difference in price multiplied by the contract volume.
CENTENNIAL RESOURCE DEVELOPMENT, INC.
NOTES TO CONSOLIDATED FINANCIAL STATEMENTS (Continued)
The following table summarizes the approximate volumes and average contract prices of derivative contracts the Company had in place as of December 31, 2020:2023:
| | | | | | | | | | | | | | | | | | | | | | | |
| Period | | Volume (Bbls) | | Volume (Bbls/d) | | Wtd. Avg. Crude Price ($/Bbl)(1) |
| Crude oil swaps | | | | | | | |
| NYMEX WTI | January 2021 - March 2021 | | 990,000 | | 11,000 | | | $41.48 |
| April 2021 - June 2021 | | 1,183,000 | | 13,000 | | | 43.18 |
| July 2021 - September 2021 | | 736,000 | | 8,000 | | | 45.87 |
| October 2021 - December 2021 | | 644,000 | | 7,000 | | | 45.59 |
| | | | | | | |
| ICE Brent | January 2021 - March 2021 | | 270,000 | | 3,000 | | | $46.85 |
| April 2021 - June 2021 | | 182,000 | | 2,000 | | | 48.01 |
| July 2021 - September 2021 | | 184,000 | | 2,000 | | | 48.25 |
| October 2021 - December 2021 | | 184,000 | | 2,000 | | | 48.50 |
PERMIAN RESOURCES CORPORATION
NOTES TO CONSOLIDATED FINANCIAL STATEMENTS (Continued)
| | | | | | | | | | | | | | | | | | | | | | | | | | | | | |
| Period | | Volume (Bbls) | | Volume (Bbls/d) | | Wtd. Avg. Collar Price Ranges ($/Bbl)(2) |
| Crude oil collars | January 2021 - March 2021 | | 315,000 | | 3,500 | | | $ | 40.00 | | - | $ | 48.14 | |
| April 2021 - June 2021 | | 136,500 | | 1,500 | | | 40.00 | | - | 48.57 | |
| July 2021 - September 2021 | | 92,000 | | 1,000 | | | 42.00 | | - | 50.10 | |
| October 2021 - December 2021 | | 92,000 | | 1,000 | | | 42.00 | | - | 50.10 | |
| | | | | | | | | | | | | | | | | | | | | | | |
| Period | | Volume (Bbls) | | Volume (Bbls/d) | | Wtd. Avg. Differential ($/Bbl)(3) |
| Crude oil basis differential swaps | January 2021 - March 2021 | | 990,000 | | 11,000 | | | $0.01 |
| April 2021 - June 2021 | | 1,183,000 | | 13,000 | | | 0.11 |
| July 2021 - September 2021 | | 736,000 | | 8,000 | | | 0.26 |
| October 2021 - December 2021 | | 644,000 | | 7,000 | | | 0.26 |
| | | | | | | | | | | | | | | | | | | | | | | |
| Period | | Volume (Bbls) | | Volume (Bbls/d) | | Wtd. Avg. Crude Price ($/Bbl)(1) |
| Crude oil swaps | January 2024 - March 2024 | | 2,739,100 | | | 30,100 | | | $77.27 |
| April 2024 - June 2024 | | 2,702,500 | | | 29,698 | | | 76.41 |
| July 2024 - September 2024 | | 2,714,000 | | | 29,500 | | | 75.49 |
| October 2024 - December 2024 | | 2,714,000 | | | 29,500 | | | 74.62 |
| January 2025 - March 2025 | | 1,440,000 | | | 16,000 | | | 73.53 |
| April 2025 - June 2025 | | 1,456,000 | | | 16,000 | | | 72.37 |
| July 2025 - September 2025 | | 1,472,000 | | | 16,000 | | | 71.26 |
| October 2025 - December 2025 | | 1,472,000 | | | 16,000 | | | 70.26 |
| | | | | | | |
| | | | | | | |
| | | | | | | |
| | | | | | | |
| | | | | | | | | | | | | | | | | | | | | | | | | | | | | |
| Period | | Volume (Bbls) | | Volume (Bbls/d) | | Wtd. Avg. Collar Price Ranges ($/Bbl)(2) |
| Crude oil collars | January 2024 - March 2024 | | 182,000 | | | 2,000 | | | $60.00 | - | $76.01 |
| April 2024 - June 2024 | | 182,000 | | | 2,000 | | | 60.00 | - | 76.01 |
| July 2024 - September 2024 | | 184,000 | | | 2,000 | | | 60.00 | - | 76.01 |
| October 2024 - December 2024 | | 184,000 | | | 2,000 | | | 60.00 | - | 76.01 |
| | | | | | | | | |
| | | | | | | | | |
| | | | | | | | | | | | | | | | | | | | | | | | | | | | | |
| Period | | Volume (Bbls) | | Volume (Bbls/d) | | Wtd. Avg. Put Price ($/Bbl)(3) | | Deferred Premium ($/Bbl)(3) |
| Deferred premium puts | January 2024 - March 2024 | | 227,500 | | | 2,500 | | | $65.00 | | $4.96 |
| April 2024 - June 2024 | | 227,500 | | | 2,500 | | | 65.00 | | 4.96 |
| July 2024 - September 2024 | | 230,000 | | | 2,500 | | | 65.00 | | 4.96 |
| October 2024 - December 2024 | | 230,000 | | | 2,500 | | | 65.00 | | 4.96 |
| | | | | | | | | |
| | | | | | | | | |
| | | | | | | | | | | | | | | | | | | | | | | |
| Period | | Volume (Bbls) | | Volume (Bbls/d) | | Wtd. Avg. Differential ($/Bbl)(4) |
| Crude oil basis differential swaps | January 2024 - March 2024 | | 3,148,600 | | | 34,600 | | | $0.94 |
| April 2024 - June 2024 | | 3,112,018 | | | 34,198 | | | 0.94 |
| July 2024 - September 2024 | | 3,128,000 | | | 34,000 | | | 0.94 |
| October 2024 - December 2024 | | 3,128,000 | | | 34,000 | | | 0.94 |
| January 2025 - March 2025 | | 1,440,000 | | | 16,000 | | | 1.09 |
| April 2025 - June 2025 | | 1,456,000 | | | 16,000 | | | 1.09 |
| July 2025 - September 2025 | | 1,472,000 | | | 16,000 | | | 1.09 |
| October 2025 - December 2025 | | 1,472,000 | | | 16,000 | | | 1.09 |
| | | | | | | | | | | | | | | | | | | | | | | |
| Period | | Volume (Bbls) | | Volume (Bbls/d) | | Wtd. Avg. Differential ($/Bbl)(5) |
| Crude oil roll differential swaps | January 2024 - March 2024 | | 3,148,600 | | | 34,600 | | | $0.45 |
| April 2024 - June 2024 | | 3,112,018 | | | 34,198 | | | 0.45 |
| July 2024 - September 2024 | | 3,128,000 | | | 34,000 | | | 0.45 |
| October 2024 - December 2024 | | 3,128,000 | | | 34,000 | | | 0.45 |
| January 2025 - March 2025 | | 1,440,000 | | | 16,000 | | | 0.37 |
| April 2025 - June 2025 | | 1,456,000 | | | 16,000 | | | 0.37 |
| July 2025 - September 2025 | | 1,472,000 | | | 16,000 | | | 0.37 |
| October 2025 - December 2025 | | 1,472,000 | | | 16,000 | | | 0.37 |
PERMIAN RESOURCES CORPORATION
NOTES TO CONSOLIDATED FINANCIAL STATEMENTS (Continued)
(1)These crude oil swap transactions are settled based on the NYMEX WTI or ICE Brent oilindex price on each trading day within the specified monthly settlement period versus the contractual swap price for the volumes stipulated.
(2) These crude oil collars are settled based on the NYMEX WTI index price on each trading day within the specified monthly settlement period versus the contractual floor and ceiling prices for the volumes stipulated.
(3)These crude oil deferred premium puts are settled based on the NYMEX WTI index price on each trading day within the specified monthly settlement period versus the contractual put prices for the volumes stipulated.
(4) These crude oil basis swap transactions are settled based on the difference between the arithmetic average of ARGUS MIDLAND WTI and ARGUS WTI CUSHING indices, during each applicable monthly settlement period.
Table of Contents | | | | | | | | | | | | | | | | | | | | | | | |
| Period | | Volume (MMBtu) | | Volume (MMBtu/d) | | Wtd. Avg. Gas Price ($/MMBtu)(1) |
| Natural gas swaps | January 2024 - March 2024 | | 4,104,919 | | | 45,109 | | | $3.77 |
| April 2024 - June 2024 | | 5,906,321 | | | 64,905 | | | 3.29 |
| July 2024 - September 2024 | | 5,949,388 | | | 64,667 | | | 3.43 |
| October 2024 - December 2024 | | 5,933,899 | | | 64,499 | | | 3.86 |
| January 2025 - March 2025 | | 3,600,000 | | | 40,000 | | | 4.32 |
| April 2025 - June 2025 | | 3,640,000 | | | 40,000 | | | 3.65 |
| July 2025 - September 2025 | | 3,680,000 | | | 40,000 | | | 3.83 |
| October 2025 - December 2025 | | 3,680,000 | | | 40,000 | | | 4.20 |
CENTENNIAL RESOURCE DEVELOPMENT, INC. | | | | | | | | | | | | | | | | | | | | | | | |
| Period | | Volume (MMBtu) | | Volume (MMBtu/d) | | Wtd. Avg. Differential ($/MMBtu)(2) |
| Natural gas basis differential swaps | January 2024 - March 2024 | | 12,740,000 | | | 140,000 | | | $(0.90) |
| April 2024 - June 2024 | | 10,920,000 | | | 120,000 | | | (0.99) |
| July 2024 - September 2024 | | 11,040,000 | | | 120,000 | | | (0.99) |
| October 2024 - December 2024 | | 11,040,000 | | | 120,000 | | | (0.98) |
| January 2025 - March 2025 | | 3,600,000 | | | 40,000 | | | (0.74) |
| April 2025 - June 2025 | | 3,640,000 | | | 40,000 | | | (0.74) |
| July 2025 - September 2025 | | 3,680,000 | | | 40,000 | | | (0.74) |
| October 2025 - December 2025 | | 3,680,000 | | | 40,000 | | | (0.74) |
NOTES TO CONSOLIDATED FINANCIAL STATEMENTS (Continued) | | | | | | | | | | | | | | | | | | | | | | | |
| Period | | Volume (MMBtu) | | Volume (MMBtu/d) | | Wtd. Avg. Differential ($/MMBtu)(3) |
| Natural gas basis differential swaps | January 2024 - March 2024 | | 3,640,000 | | | 40,000 | | | $0.00 |
| | | | | | | | | | | | | | | | | | | | | | | |
| Period | | Volume (MMBtu) | | Volume (MMBtu/d) | | Wtd. Avg. Gas Price ($/MMBtu)(1) |
| Natural gas swaps | January 2021 - March 2021 | | 5,400,000 | | 60,000 | | | $2.91 |
| April 2021 - June 2021 | | 3,640,000 | | 40,000 | | | 2.89 |
| July 2021 - September 2021 | | 3,680,000 | | 40,000 | | | 2.89 |
| October 2021 - December 2021 | | 3,680,000 | | 40,000 | | | 2.95 |
| January 2022 - March 2022 | | 1,800,000 | | 20,000 | | | 3.00 |
| | | | | | | | | | | | | | | | | | | | | | | | | | | | | |
| Period | | Volume (MMBtu) | | Volume (MMBtu/d) | | Wtd. Avg. Collar Price Ranges ($/MMBtu)(2) |
| Natural gas collars | January 2021 - March 2021 | | 1,800,000 | | 20,000 | | | $ | 2.90 | | - | $ | 3.64 | |
| | | | | | | | | | | | | | | | | | | | | | | |
| Period | | Volume (MMBtu) | | Volume (MMBtu/d) | | Wtd. Avg. Differential ($/MMBtu)(3) |
| Natural gas basis differential swaps | January 2021 - March 2021 | | 1,800,000 | | 20,000 | | | $(0.30) |
| April 2021 - June 2021 | | 3,640,000 | | 40,000 | | | (0.30) |
| July 2021 - September 2021 | | 3,680,000 | | 40,000 | | | (0.30) |
| October 2021 - December 2021 | | 3,680,000 | | 40,000 | | | (0.28) |
| January 2022 - March 2022 | | 1,800,000 | | 20,000 | | | (0.26) |
| | | | | | | | | | | | | | | | | | | | | | | | | | | | | |
| Period | | Volume (MMBtu) | | Volume (MMBtu/d) | | Wtd. Avg. Collar Price Ranges ($/MMBtu)(4) |
| Natural gas collars | January 2024 - March 2024 | | 6,815,081 | | 74,891 | | | $2.93 | - | $6.81 |
| April 2024 - June 2024 | | 5,013,679 | | 55,095 | | | 2.68 | - | 5.04 |
| July 2024 - September 2024 | | 5,090,612 | | 55,333 | | | 2.68 | - | 5.06 |
| October 2024 - December 2024 | | 5,106,101 | | 55,501 | | | 2.75 | - | 5.29 |
(1)These natural gas swap contracts are settled based on the NYMEX Henry Hub price on each trading day within the specified monthly settlement period versus the contractual swap price for the volumes stipulated.
(2) These natural gas basis swap contracts are settled based on the difference between the Inside FERC’s West Texas WAHA price and the NYMEX price of natural gas, during each applicable monthly settlement period.
(3) These natural gas basis swap contracts are settled based on the difference between the Houston Ship Channel (“HSC”) price and the NYMEX price of natural gas, during each applicable monthly settlement period.
PERMIAN RESOURCES CORPORATION
NOTES TO CONSOLIDATED FINANCIAL STATEMENTS (Continued)
(4) These natural gas collars are settled based on the NYMEX Henry Hub price on each trading day within the specified monthly settlement period versus the contractual floor and ceiling prices for the volumes stipulated.
(3) These natural gas basis swap contracts are settled based on the difference between the Inside FERC’s West Texas WAHA price and the NYMEX price of natural gas, during each applicable monthly settlement period.
Derivative Instrument Reporting. The Company’s oil and natural gas derivative instruments have not been designated as hedges for accounting purposes. Therefore, all gains and losses are recognized in the Company’s consolidated statements of operations. All derivative instruments are recorded at fair value in the consolidated balance sheets, other than derivative instruments that meet the “normal purchase normal sale” exclusion, and any fair value gains and losses are recognized in current period earnings.
The following table presents the impact of the Company’s derivative instruments onin its consolidated statements of operations for the periods presented:
| | | | | | | | | | | | | | | | | |
| Year Ended December 31, |
| (in thousands) | 2020 | | 2019 | | 2018 |
| Net gain (loss) on derivative instruments | $ | (64,535) | | | $ | (1,561) | | | $ | 15,336 | |
CENTENNIAL RESOURCE DEVELOPMENT, INC.
NOTES TO CONSOLIDATED FINANCIAL STATEMENTS (Continued)
| | | | | | | | | | | | | | | | | |
| Year Ended December 31, |
| (in thousands) | 2023 | | 2022 | | 2021 |
| Net gain (loss) on derivative instruments | $ | 114,016 | | | $ | (42,368) | | | $ | (148,825) | |
Offsetting of Derivative Assets and Liabilities. The Company’s commodity derivatives are included in the accompanying consolidated balance sheets as derivative assets and liabilities. The Company nets its financial derivative instrument fair value amounts executed with the same counterparty pursuant to ISDA master netting agreements, which provide for net settlement over the term of the contract and in the event of default or termination of the contract. The tables below summarize the fair value amounts and the classification in the consolidated balance sheets of the Company’s derivative contracts outstanding at the respective balance dates, as well as the gross recognized derivative assets, liabilities and offset amounts:
| | | | | | | | | | | | | | | | | | | | | | | |
| |
| Balance Sheet Classification | | Gross Fair Value Asset/Liability Amounts | | Gross Amounts Offset(1) | | Net Recognized Fair Value Assets/Liabilities |
| (in thousands) | | | December 31, 2020 |
| Derivative Assets | | | | | | | |
| Commodity contracts | Prepaid and other current assets | | $ | 6,131 | | | $ | (6,131) | | | $ | 0 | |
| Other noncurrent assets | | 152 | | | (100) | | | 52 | |
| Derivative Liabilities | | | | | | | |
| Commodity contracts | Other current liabilities | | $ | 24,392 | | | $ | (6,131) | | | $ | 18,261 | |
| Other noncurrent liabilities | | 100 | | | (100) | | | 0 | |
| | | | | | | |
| | | December 31, 2019 |
| Derivative Liabilities | | | | | | | |
| Commodity contracts | Other current liabilities | | $ | 325 | | | $ | 0 | | | $ | 325 | |
| | | | | | | | | | | | | | | | | | | | | | | |
| |
| Balance Sheet Classification | | Gross Fair Value Asset/Liability Amounts | | Gross Amounts Offset(1) | | Net Recognized Fair Value Assets/Liabilities |
| (in thousands) | | | December 31, 2023 |
| Derivative Assets | | | | | | | |
| Commodity contracts | Derivative instruments | | $ | 88,192 | | | $ | (17,601) | | | $ | 70,591 | |
| Other noncurrent assets | | 29,469 | | | (2,435) | | | 27,034 | |
| Derivative Liabilities | | | | | | | |
| Commodity contracts | Other current liabilities | | $ | 20,326 | | | $ | (17,601) | | | $ | 2,725 | |
| Other noncurrent liabilities | | 3,762 | | (2,435) | | | 1,327 | |
| | | | | | | |
| | | December 31, 2022 |
| Derivative Assets | | | | | | | |
| Commodity contracts | Derivative instruments | | $ | 125,120 | | | $ | (24,323) | | | $ | 100,797 | |
| Other noncurrent assets | | 22,016 | | | (3,691) | | | 18,325 | |
| Derivative Liabilities | | | | | | | |
| Commodity contracts | Other current liabilities | | $ | 26,321 | | | $ | (24,323) | | | $ | 1,998 | |
| Other noncurrent liabilities | | 6,349 | | | (3,691) | | | 2,658 | |
(1) The Company has agreements in place with alleach of its counterparties that allow for the financial right of offset for derivative assets against derivative liabilities at settlement or in the event of a default under the agreements or contract termination.if contracts are terminated.
Contingent Features in Financial Derivative Instruments. None of the Company’s derivative instruments contain credit-risk-related contingent features. Counterparties to the Company’s financial derivative contracts are high credit-quality financial institutions that are primarily lenders under CRP’sOpCo’s Credit Agreement. The Company usesenters into new hedge arrangements only with participants under its Credit Agreement, participants to hedge with, since these institutions are secured equally with the holders of any CRPOpCo bank debt, which eliminates the potential need to post collateral when Centennialthe Company is in a derivative liability position. As a result, the Company is not required to post letters of credit or corporate guarantees for its derivative counterparties in order to secure contract performance obligations.
In addition, the Company is exposed to credit risk associated with its derivative contracts from non-performance by its counterparties. The Company mitigates its exposure to any single counterparty by contracting with a number of financial institutions, each of which has a high credit rating and is a member of CRP’s credit facilitylender under OpCo’s Credit Agreement as referenced above.
PERMIAN RESOURCES CORPORATION
NOTES TO CONSOLIDATED FINANCIAL STATEMENTS (Continued)
Note 8—9—Fair Value Measurements
Recurring Fair Value Measurements
The Company follows ASC Topic 820, Fair Value Measurement and Disclosure, which establishes a three-level valuation hierarchy for disclosure of fair value measurements. The valuation hierarchy categorizes assets and liabilities measured at fair value into one of three different levels depending on the observability of the inputs employed in the measurement. The three levels are defined as follows:
•Level 1: Quoted Prices in Active Markets for Identical Assets – inputs to the valuation methodology are quoted prices (unadjusted) for identical assets or liabilities in active markets.
•Level 2: Significant Other Observable Inputs – inputs to the valuation methodology include quoted prices for similar assets and liabilities in active markets, and inputs that are observable for the asset or liability, either directly or indirectly, for substantially the full term of the financial instrument.
•Level 3: Significant Unobservable Inputs – inputs to the valuation methodology are unobservable and significant to the fair value measurement.
CENTENNIAL RESOURCE DEVELOPMENT, INC.
NOTES TO CONSOLIDATED FINANCIAL STATEMENTS (Continued)
The following table presents, for each applicable level within the fair value hierarchy, the Company’s net derivative assets and liabilities, including both current and noncurrent portions, measured at fair value on a recurring basis:
| | | | | | | | | | | | | | | | | |
| (in thousands) | Level 1 | | Level 2 | | Level 3 |
| December 31, 2020 | | | | | |
| Total assets | $ | 0 | | | $ | 52 | | | $ | 0 | |
| Total liabilities | 0 | | | 18,261 | | | 0 | |
| December 31, 2019 | | | | | |
| Total assets | $ | 0 | | | $ | 0 | | | $ | 0 | |
| Total liabilities | 0 | | | 325 | | | 0 | |
| | | | | | | | | | | | | | | | | |
| (in thousands) | Level 1 | | Level 2 | | Level 3 |
| December 31, 2023 | | | | | |
| Total assets | $ | — | | | $ | 97,625 | | | $ | — | |
| Total liabilities | — | | | 4,052 | | | — | |
| December 31, 2022 | | | | | |
| Total assets | $ | — | | | $ | 119,122 | | | $ | — | |
| Total liabilities | — | | | 4,656 | | | — | |
Both financial and non-financial assets and liabilities are categorized within the above fair value hierarchy based on the lowest level of input that is significant to the fair value measurement. The Company’s assessment of the significance of a particular input to the fair value measurement in its entirety requires judgementjudgment and considers factors specific to the asset or liability. The following is a description of the valuation methodologies used by the Company as well as the general classification of such instruments pursuant to the above fair value hierarchy. There were no transfers between any of the fair value levels during any period presented.
Derivatives
The Company uses Level 2 inputs to measure the fair value of its oil and natural gas commodity derivatives. The Company uses industry-standard models that consider various assumptions including current market and contractual prices for the underlying instruments, implied market volatility, time value, nonperformance risk, as well as other relevant economic measures. Substantially all of these inputs are observable in the marketplace throughout the full term of the instrument and can be supported by observable data. The Company utilizes its counterparties’ valuations to assess the reasonableness of its own valuations. Refer to Note 7—8—Derivative Instruments for details of the gross and net derivative assets, liabilities and offset amounts as presented in the consolidated balance sheets.
Nonrecurring Fair Value Measurements
The Company applies the provisions of the fair value measurement standard on a nonrecurring basis to its non-financial assets and liabilities, including proved oil and gas properties. These assets and liabilities are not measured at fair value on an ongoing basis but are subject to fair value adjustments in certain circumstances.
Oil and Gas Property Acquisitions. The fair value measurements of assets acquired and liabilities assumed are measured on the acquisition date using an income valuation technique based on inputs that are not observable in the market and therefore represent Level 3 inputs. Significant inputs to the valuation of acquired oil and gas properties include estimates of: (i) reserves; (ii) production rates; (iii) future development costs; (iv) future commodity prices, including price differentials; (v) future cash flows; (vi) a market participant-based weighted average cost of capital rate and (vii) risk adjustment factors applied to proved and unproved reserves. These inputs require significant judgements and estimates by the Company’s management at the time of valuation. Refer to Note 2—Business Combinations for additional information on the fair value of assets acquired and liabilities assumed.
PERMIAN RESOURCES CORPORATION
NOTES TO CONSOLIDATED FINANCIAL STATEMENTS (Continued)
Impairment of Oil and Natural Gas Properties. The Company reviews its proved oil and natural gas properties for impairment whenever events and circumstances indicate that the fair value of these assets may be below their carrying value. The significant decrease in the forward price curves for crude oil and natural gas in March of 2020 resulted in a triggering event which required the Company to reassess its proved oil and natural gas properties for impairment as of March 31, 2020. An impairment loss is indicated if the sum of the expected undiscounted future net cash flows from oil and gas properties is less than the carrying amount of the assets. In this circumstance, the Company then recognizes impairment expense for the amount by which the carrying amount of proved properties exceeds their estimated fair value. The Company reviews its oil and natural gas properties on a field-by-field basis.
The Company calculates the estimated fair valuesvalue of its oil and natural gas properties using an income approach that is based on inputs that are not observable in the market and therefore represent Level 3 inputs. Significant inputs to the expected future net cash flows used for the impairment review and the related fair value measurement of oil and natural gas proved properties include estimates of: (i) oil and gas reserves; (ii) future production decline rates; (iii) future operating and development costs; (iv) future commodity prices, including price differentials; and (v) a market participant-based weighted average cost of capital rate. These inputs require significant judgments and estimates by the Company’s management.
The impairment test performed by the Company indicated that a proved propertyno impairment had occurred with respect to certain of its oil and gas fields, and therefore a non-cash impairment charge to reduce the carrying value of the impaired property to its fair value was recorded. Proved oil and natural gas properties with a previous carrying value of $771.4 million were partially written down to their fair value of $179.6 million, resulting in a noncash impairment charge of $591.8 million being recorded in the first quarter of 2020. All of the Company’s proved oil and gas properties were included in the impairment assessment performed as of March 31, 2020. Two of the Company’s fields were subject to an impairment write-down as quantified above, but the remaining five fields were not impaired due to their undiscounted cash flows exceeding their carrying values by 30% to over 100%. The Company did not recognize any additional impairment write-downs with respect to its proved property during the remainder of the year endingyears ended December 31, 2020. Impairment expense for proved properties is presented as part of Impairment2023, 2022 and Abandonment Expense in the consolidated statements of operations.
CENTENNIAL RESOURCE DEVELOPMENT, INC.
NOTES TO CONSOLIDATED FINANCIAL STATEMENTS (Continued)
2021.Asset Retirement Obligations. The initial measurement of ARO at fair value is calculated using discounted cash flow techniques and is based on internal estimates of future retirement costs associated with property, plant and equipment. Significant Level 3 inputs used in the calculation of ARO include the estimated future costs to plug and abandon oil and gas properties and reserve lives. Refer to Note 5—6—Asset Retirement Obligations for additional information on the Company’s ARO.
Senior Secured Notes. The Company’s Senior Secured Notes were measured and recorded at their fair value on the date of issuance equal to 83.44% of par. The fair value was determined utilizing the Black-Derman-Toy binomial lattice model, which is a one-factor binomial lattice model that determines the future evolution of the relevant yields. For each node on the lattice, it is determined whether it is preferable to redeem, or not, based on the yields. The model utilizes both a yield curve and a yield volatility as of the valuation date, both of which are estimated based on yields of comparable debt instruments and are inputs that are not observable for the Senior Secured Notes for the term of the debt instrument (a Level 3 classification in the fair value hierarchy). The fair value was measured by the model using the following inputs: (i) the treasury yield curve as of the valuation date, (ii) 12% credit spread, (iii) 45% yield volatility, and (iv) a corporate credit rating of B. The Company has not elected the fair value option, which would require remeasurement at fair value each period, to account for this debt instrument.
Other Financial Instruments
The carrying amounts of the Company’s cash, cash equivalents, accounts receivable, accounts payable, and accrued liabilities approximate their fair values because of the short-term maturities and/or liquid nature of these assets and liabilities.
The Company’s Senior Notessenior notes and borrowings under its Credit Agreement are accounted for at cost, and the cost basis of the Company’s Senior Secured Notes issued in the Debt Exchange was measured based on their fair value on the date of the exchange, as discussed above.cost. The following table summarizes the faircarrying values, principal amounts and carryingfair values of these instruments as of the periods indicated:
| | | | | | | | | | | | | | | | | | | | | | | | | | | | | | | | | | | | | | |
| | December 31, 2020 | | December 31, 2019 |
| | Carrying Value | | Principal Amount | | Fair Value | | Carrying Value | | Principal Amount | | Fair value |
Credit facility due 2023(1) | | $ | 330,000 | | | $ | 330,000 | | | $ | 330,000 | | | $ | 175,000 | | | $ | 175,000 | | | $ | 175,000 | |
8.00% Senior Secured Notes due 2025(2) | | 103,902 | | | 127,073 | | | 114,366 | | | 0 | | | 0 | | | 0 | |
5.375% Senior Notes due 2026(2) | | 284,867 | | | 289,448 | | | 206,955 | | | 392,623 | | | 400,000 | | | 394,480 | |
6.875% Senior Notes due 2027(2) | | 349,856 | | | 356,351 | | | 254,791 | | | 489,766 | | | 500,000 | | | 520,000 | |
| | | | | | | | | | | | | | | | | | | | | | | | | | | | | | | | | | | | | | |
| | December 31, 2023 | | December 31, 2022 |
| | Carrying Value | | Principal Amount | | Fair Value | | Carrying Value | | Principal Amount | | Fair Value |
Credit Facility due 2027(1) | | $ | — | | | $ | — | | | $ | — | | | $ | 385,000 | | | $ | 385,000 | | | $ | 385,000 | |
5.375% Senior Notes due 2026(2) | | 287,408 | | | 289,448 | | | 285,287 | | | 286,512 | | | 289,448 | | | 264,366 | |
7.75% Senior Notes due 2026(2) | | 300,000 | | | 300,000 | | | 304,551 | | | 300,000 | | | 300,000 | | | 291,338 | |
6.875% Senior Notes due 2027(2) | | 352,619 | | | 356,351 | | | 356,852 | | | 351,632 | | | 356,351 | | | 337,126 | |
8.00% Senior Notes due 2027(2)
| | 565,063 | | | 550,000 | | | 568,473 | | | — | | | — | | | — | |
3.25% Convertible Senior Notes due 2028(2)(3) | | 165,897 | | | 170,000 | | | 404,124 | | | 165,025 | | | 170,000 | | | 285,858 | |
5.875% Senior Notes due 2029(2) | | 658,562 | | | 700,000 | | | 684,705 | | | 652,629 | | | 700,000 | | | 601,125 | |
9.875% Senior Notes due 2031(2)
| | 536,280 | | | 500,000 | | | 555,625 | | | — | | | — | | | — | |
7.00% Senior Notes due 2032(2) | | 982,952 | | | 1,000,000 | | | 1,030,790 | | | — | | | — | | | — | |
(1) The carrying values of the amounts outstanding under CRP’sOpCo’s Credit Agreement approximate fair value because its variable interest rates are tied to current market rates and the applicable credit spreads represent current market rates for the credit risk profile of the Company.
(2) The carrying values include associated unamortized debt issuance costs and any debt discounts as reflected in the consolidated balance sheets. The fair values are determined using quoted market prices for these debt securities, a Level 1 classification in the fair value hierarchy, and are based on the aggregate principal amount of the senior notes outstanding.
(3) The Convertible Senior Notes outstanding.
Note 9—Shareholders' Equityare subject to certain conditions that allow them to be convertible prior to their maturity and Noncontrolling Interest
On April 2, 2020,as of December 31, 2023, noteholders had the legacy ownersright to convert during the fourth quarter of CRP (the “Centennial Contributors”) converted all2023. The Company has Capped Call Transactions that cover the aggregate number of their remaining 1,034,119 CRP Common Units (and corresponding shares of Class C Common Stock) into Class A Common Stock (the “Conversion”), which eliminated the noncontrolling interest ownership in CRP. No cash proceeds were received by the Company in connection with the Conversion, and deferred tax expense of $2.2 million was recorded in equity.
During 2019, the Centennial Contributors converted 10,969,064 of their CRP Common Units (and corresponding shares of Class C Common Stock) into Class A Common Stock. NaN cash proceeds were received by the Company and deferred tax expense of $17.5 million was recorded in equity as a result of the conversion of shares from the noncontrolling interest owner.
On March 7, 2018, Silver Run Sponsor, LLC (“Silver Run Sponsor”), affiliates of Riverstone Investment Group LLC (“Riverstone”) and the Centennial Contributors completed an underwritten public offering of 25,000,000 shares of Class A Common Stock. NaN cash proceeds were received by the Company in connection with this offering and 3,347,647 shares of CRP Common Units (and corresponding shares of Class C Common Units) were converted to shares of Class A Common Stock on a one-to-one basis. A tax benefit of $7.2 million was recordedthat underlie the Convertible Senior Notes and would offset any cash payment OpCo is required to make in equity as a resultexcess of the conversionprincipal amount of shares fromthese notes. Refer to Note 5—Long-Term Debt for additional information on the noncontrolling interest owner.Convertible Senior Notes and associated Capped Call Transactions.
CENTENNIAL RESOURCE DEVELOPMENT, INC.PERMIAN RESOURCES CORPORATION
NOTES TO CONSOLIDATED FINANCIAL STATEMENTS (Continued)
Note 10—Shareholders' Equity and Noncontrolling Interest
Authorized shares of Common Stock
On August 29, 2022, the Company’s stockholders approved the Fourth Amended and Restated Certificate of Incorporation (as amended and restated, the “Charter”) to, among other things, increase the authorized number of shares of Class A Common Stock for issuance from 600,000,000 to 1,000,000,000 and Class C Common Stock for issuance from 20,000,000 to 500,000,000. The amendment became effective on September 1, 2022.
Class A Common Stock
The Company had 540,789,758 shares of Class A Common Stock outstanding as of December 31, 2023.
Holders of the Company's Class A Common Stock are entitled to 1one vote for each share held on all matters to be voted on by the Company’s stockholders. Holders of the Class A Common Stock and holders of the Class C Common Stock will vote together as a single class on all matters submitted to a vote byof the Company'sCompany’s stockholders, except as required by law.
Unless specified in the Company’s second amended and restated certificate of incorporation (the “Charter”)Charter (including any certificate of designation of preferred stock) or the Company’s second amendedSecond Amended and restated bylaws,Restated Bylaws, or as required by applicable provisions of the Delaware General Corporation Law or applicable stock exchange rules, the affirmative vote of a majority of the Company’s shares of common stock that are voted is required to approve any such matter voted on by the Company’s stockholders. There is no cumulative voting with respect to the election of directors, with the result that the holders of more than 50% of the shares voted for the election of directors can elect all of the directors. Subject to the rights of the holders of any outstanding series of preferred stock, the holders of the Class A Common Stock are entitled to receive ratable dividends when, as and if declared by the board of directors out of funds legally available therefor.
In the event of a liquidation, dissolution or winding up of the Company, the holders of the Class A Common Stock are entitled to share ratably in all assets remaining available for distribution to them after payment of liabilities and after provision is made for each class of stock, if any, having preference over the Class A Common Stock. The holders of the Class A Common Stock have no preemptive or other subscription rights. There are no sinking fund provisions applicable to the Class A Common Stock.
Class C Common Stock
The Company had no230,962,833 shares of Class C Common Stock outstanding as of December 31, 2020 as the remaining shares2023 which were converted on April 2, 2020 as part of the Conversion discussed above. The shares converted represented the remaining portion of the 20,000,000 shares of Class C Common Stock issued to the Centennial Contributors in connection with the acquisition of approximately 89% of the outstanding membership interests in CRP, consummated on October 11, 2016 (the “Business Combination”).Colgate and Earthstone mergers.
Prior to the Conversion, holdersHolders of Class C Common Stock, together with holders of the Class A Common Stock voting as a single class, hadhave the right to vote on all matters properly submitted to a vote of the stockholders. In addition, the holders of Class C Common Stock, voting as a separate class, werewill be entitled to approve any amendment, alteration or repeal of any provision of the Charter that would alter or change the powers, preferences or relative, participating, optional or other or special rights of the Class C Common Stock. Holders of Class C Common Stock werewill not be entitled to any dividends from the Company and werewill not be entitled to receive any of itsthe Company’s assets in the event of any voluntary or involuntary liquidation, dissolution or winding up of itsthe Company’s affairs.
Shares of Class C Common Stock werehave and currently may only allowed to be issued to the Centennial Contributors,Colgate or Earthstone OpCo Unit holders, their respective successors and assigns, as well asassignees, or any permitted transferees of the Centennial Contributors. Holderssuch unit holders. A holder of Class C Common Stock hadmay transfer shares of Class C Common Stock to any transferee (other than the Company) only if such holder also simultaneously transfers an equal number of such holder’s Common Units representing common membership interests in OpCo to such transferee in compliance with the Seventh Amended and Restated Limited Liability Company Agreement of OpCo. Each holder of Class C Common Stock generally has the right to cause CRPthe Company to redeem all or a portion of their CRPits Common Units in exchange for, at the Company’s option, an equal number of shares of the Company’s Class A Common Stock or at CRP’s option, an equivalent amount of cash.
Preferred Stock
In connection with the Business Combination, the The Company issued one sharemay, however, at its option, effect a direct exchange of Series A Preferred Stock at par value, $0.0001 per share (the “Series A Preferred Stock”) to one of the Centennial Contributors. The Series A Preferred Stock provided the holder thereof with the right to nominate and elect one director to the Company’s Board of Directors, but it did not provide any other voting rightscash or rights with respect to dividends except distributions in liquidation in the amount of $0.0001 per share. In July 2020, the Company redeemed the 1 share of Series A Preferred Stock after NGP X US Holdings, L.P., the current holder of the share of Series A Preferred Stock and a former indirect equity owner of CRP, ceased to own, in the aggregate, at least 5,000,000 CRP Common Units and/or shares of Class A Common Stock.
Warrants
Simultaneously with the closing of the Company’s initial public offering, 8,000,000 warrants were purchased by Silver Run Sponsor in a private placement (the “Private Placement Warrants”). The Private Placement Warrants are non-redeemable so long as they are held by Riverstone or its permitted transferees. Each whole Private Placement Warrant is exercisable for 1 whole share of Class A Common Stock atfor such OpCo Common Units in lieu of such a priceredemption by OpCo. Upon the future redemption or exchange of $11.50 per share. Common Units held by a holder of Class C Common Stock, a corresponding number of shares of Class C Common Stock held by such holder of Class C Common Stock will be canceled.
The Private Placement Warrantsshares of Class C Common Stock and underlying Common Units related to the Colgate Merger became exercisableexchangeable on March 1, 20172023. The shares of Class C Common Stock and will expire on October 11, 2021 (five years afterunderlying Common Units related to the completion of the Business Combination) or earlier upon redemption or liquidation. As of December 31, 2020, 8,000,000 Private Placement Warrants remained outstanding.Earthstone Merger are not exchangeable until April 28, 2024, subject to certain customary exceptions.
CENTENNIAL RESOURCE DEVELOPMENT, INC.PERMIAN RESOURCES CORPORATION
NOTES TO CONSOLIDATED FINANCIAL STATEMENTS (Continued)
Preferred Stock
The Company is authorized to issue 1,000,000 shares of preferred stock, par value $0.0001 per share, with such designations, voting and other rights and preferences as may be determined from time to time by the Company’s board of directors. At December 31, 2023, there were no shares of preferred stock issued or outstanding.
Stock Conversion
During the year ended December 31, 2023 certain legacy owners of Colgate and Earthstone exchanged 80.7 million of their Common Units of OpCo and corresponding shares of Class C Common Stock for Class A Common Stock. A deferred tax asset of $29.6 million was recorded in equity as a result of the conversion of shares from the noncontrolling interest owner. No cash proceeds were received by the Company in connection with these conversions.
Dividends
During the year ended December 31, 2023, the Company declared and paid a quarterly dividend of $0.05 per share of Class A Common Stock and a quarterly distribution of $0.05 per Common Unit (each of which has an underlying share of Class C Common Stock) during each quarter of 2023. Additionally, during the year ended December 31, 2023, the Company’s Board of Directors also declared and paid total variable dividends of $0.17 per share of Class A Common Stock and total variable distributions of $0.17 per Common Unit of OpCo. The cash dividends and distributions paid totaled $236.0 million for the year ended December 31, 2023.
During the year ended December 31, 2022, the Company declared its first dividend of $0.05 per share of Class A Common Stock and a distribution of $0.05 per Common Unit of OpCo, for a total cash payment of $27.9 million during the period.
Stock Repurchase Program
The Company’s Board of Directors authorized a stock repurchase program to acquire up to $500 million of the Company’s outstanding common stock (the “Repurchase Program”), which was approved to run through December 31, 2024. The Repurchase Program can be used by the Company to reduce its shares of Class A Common Stock and Class C Common Stock outstanding. Repurchases may be made from time to time in the open-market or via privately negotiated transactions at the Company’s discretion and will be subject to market conditions, applicable legal requirements, available liquidity, compliance with the Company’s debt agreements and other factors. The Repurchase Program does not require any specific number of shares to be acquired and can be modified or discontinued by the Company’s Board of Directors at any time.
During the year ended December 31, 2023, the Company paid $86.5 million to repurchase 7.2 million Common Units of OpCo resulting in an equal number of associated shares of Class C Common Stock simultaneously being canceled under its Repurchase Program. Additionally, during the three months ended December 31, 2023, the Company paid $37.9 million to repurchase 2.8 million shares of Class A Common Stock which were subsequently canceled under its Repurchase Program.
Noncontrolling Interest
The noncontrolling interest relates to CRP Common Units that were issued to the Centennial Contributors in connection with the Business Combination. At the date of the Business Combination, the noncontrolling interest held 10.9% of the ownership in CRP.Colgate and Earthstone mergers. The noncontrolling interest percentage is affected by various equity transactions such as CRP Common Unit and Class C Common Stock exchanges and transactions involving the Company’s Class A Common Stock activities.Stock.
As of December 31, 2019 and 2018,2023, the noncontrolling interest ownership of CRPOpCo had decreased to 0.37% and 4.34%, respectively. The decreases were30% from 48% as of December 31, 2022. This decrease was mainly the result of the exchange(i) exchanges of CRP80.7 million Common Units (and corresponding shares of Class C Common Stock) for Class A Common Stock. AsStock; (ii) issuing 161.2 million shares of December 31, 2020,Class A Common Stock and 49.5 million shares of Class C Common Stock in connection with the noncontrolling interest ownership of CRP was reduced to 0 due toEarthstone Merger; and (iii) common stock repurchases completed by the ConversionCompany as discussed above and CRP has since been a wholly-owned subsidiary of Centennial.above.
The Company consolidatedconsolidates the financial position, results of operations and cash flows of CRPOpCo and reflectedreflects the portion retained by other holders of CRP Common Units as a noncontrolling interest through the date of the Conversion.interest. Refer to the consolidated statements“Consolidated Statements of shareholders’ equityShareholders’ Equity” for a summary of the activity attributable to the noncontrolling interest during the periods.period.
PERMIAN RESOURCES CORPORATION
NOTES TO CONSOLIDATED FINANCIAL STATEMENTS (Continued)
Note 10—11—Earnings Per Share
Basic EPS is calculated by dividing net income availableattributable to Class A Common Stock by the weighted average shares of Class A Common Stock outstanding during each period. DilutiveDiluted EPS is calculated by dividing adjusted net income available to Class A Common Stock by the weighted average shares of diluted Class A Common Stock outstanding, which includes the effect of potentially dilutive securities. Potentially dilutive securities for the diluted EPS calculation consists of (i) unvested equity basedequity-based restricted stock and performance stock units, outstanding stock options, withholding amounts from the employee stock purchase plan (prior to its discontinuation in January 2023) and warrants (prior to their expiration in 2021), all using the treasury stock method,method; (ii) equity-based restricted stock and (ii)performance stock units that were vested but not outstanding, using the treasury stock method; and (iii) the Company’s Class C Common Stock outstanding prior to the Conversionand potential shares issuable under our Convertible Senior Notes, both using the “if-converted” method, which is net of tax. When a loss from continuing operations exists, all dilutive securities and potentially dilutive securities are anti-dilutive and therefore excluded from the computation of diluted earnings per share.
The following table reflects the allocation of net income to common stockholders and EPS computations for the periods indicated based on a weighted average number of common stockClass A Common Stock outstanding each period: | | | | | | | | | | | | | | | | | |
| Year Ended December 31, |
| (in thousands, except per share data) | 2023 | | 2022 | | 2021 |
| Net income attributable to Class A Common Stock | $ | 476,306 | | | $ | 515,037 | | | $ | 138,175 | |
| Add: Interest on Convertible Senior Notes, net of tax | 5,433 | | | 5,484 | | | 4,916 | |
| Adjusted net income attributable to Class A Common Stock | $ | 481,739 | | | $ | 520,521 | | | $ | 143,091 | |
| | | | | |
| Basic weighted average shares of Class A Common Stock outstanding | 349,213 | | | 286,160 | | | 280,871 | |
| Add: Dilutive effects of Convertible Senior Notes | 27,710 | | | 27,074 | | | 21,363 | |
| Add: Dilutive effects of equity awards and ESPP shares | 12,173 | | | 9,582 | | | 7,936 | |
| Diluted weighted average shares of Class A Common Stock outstanding | 389,096 | | | 322,816 | | | 310,170 | |
| | | | | |
| Basic net earnings per share of Class A Common Stock | $ | 1.36 | | | $ | 1.80 | | | $ | 0.49 | |
| Diluted net earnings per share of Class A Common Stock | $ | 1.24 | | | $ | 1.61 | | | $ | 0.46 | |
The following table presents shares excluded from the diluted earnings per share calculation for the period:periods presented as their impact was anti-dilutive:
| | | | | | | | | | | | | | | | | |
| Year Ended December 31, |
| (in thousands, except per share data) | 2020 | | 2019 | | 2018 |
| Net income attributable to Class A Common Stock | $ | (682,837) | | | $ | 15,798 | | | $ | 199,899 | |
| Add: Income from conversion of Class C Common Stock | 0 | | | 328 | | | 0 | |
| | | | | |
| Adjusted net income attributable to Class A Common Stock | $ | (682,837) | | | $ | 16,126 | | | $ | 199,899 | |
| | | | | |
| Basic net earnings per share of Class A Common Stock | $ | (2.46) | | | $ | 0.06 | | | $ | 0.76 | |
| Diluted net earnings per share of Class A Common Stock | $ | (2.46) | | | $ | 0.06 | | | $ | 0.75 | |
| | | | | |
| Basic weighted average shares of Class A Common Stock outstanding | 277,368 | | | 267,700 | | | 263,341 | |
| Add: Dilutive effects of conversion of Class C Common Stock | 0 | | | 8,869 | | | 0 | |
| Add: Dilutive effects of potential common stock | 0 | | | 63 | | | 3,514 | |
| Diluted weighted average shares of Class A Common Stock outstanding | 277,368 | | | 276,632 | | | 266,855 | |
| | | | | | | | | | | | | | | | | | |
| Year Ended December 31, | |
| (in thousands) | 2023 | | 2022 | | 2021 | |
| Out-of-the-money stock options | 1,260 | | | 2,038 | | | 2,222 | | |
| Restricted stock | 55 | | | 823 | | | 589 | | |
| Performance stock units | 29 | | | 941 | | | 100 | | |
| Employee Stock Purchase Plan | — | | | — | | | 7 | | |
| Weighted average shares of Class C Common Stock | 248,511 | | | 90,013 | | | — | | |
| Private Placement Warrants | — | | | — | | | 6,000 | | |
CENTENNIAL RESOURCE DEVELOPMENT, INC.PERMIAN RESOURCES CORPORATION
NOTES TO CONSOLIDATED FINANCIAL STATEMENTS (Continued)
The following table presents shares excluded from the diluted earnings per share calculation as their impacts were anti-dilutive for the periods presented:
| | | | | | | | | | | | | | | | | | |
| Year Ended December 31, | |
| (in thousands) | 2020(1) | | 2019 | | 2018 | |
| Out-of-the-money stock options | 3,571 | | | 4,706 | | | 818 | | |
| Restricted stock | 6,299 | | | 2,895 | | | 0 | | |
| Performance stock units | 13 | | | 0 | | | 39 | | |
| Employee Stock Purchase Plan | 76 | | | 22 | | | 0 | | |
| Weighted average shares of Class C Common Stock | 261 | | | 0 | | | 12,791 | | |
| Warrants | 8,000 | | | 8,000 | | | 0 | | |
(1) The Company recognized a net loss during the year ended December 31, 2020, and therefore all potential common shares were anti-dilutive and excluded from the calculation of diluted net earnings per share.
Note 11—12—Income Taxes
Historically, CRP has been treated as a partnership for U.S. federal and most applicable state and local income tax purposes. As a partnership, CRP was not subject to U.S. federal and certain state and local income taxes, and any taxable income or loss generated by CRP was passed through to and included in the taxable income or loss of its members, including Centennial, on a pro rata basis. Following the Conversion, CRP is no longer a partnership for tax purposes and the Company is now subject to U.S. federal and applicable state and local income taxes for its entire consolidated taxable income or loss.
Income tax expenses and benefits included in the consolidated statements of operations are detailed below:
| | | | | | | | | | | | | | | | | |
| Year Ended December 31, |
| (in thousands) | 2020 | | 2019 | | 2018 |
| Current taxes | | | | | |
| Federal | $ | 0 | | | $ | 0 | | | $ | 0 | |
| State | 0 | | | 0 | | | 0 | |
| 0 | | | 0 | | | 0 | |
| Deferred taxes | | | | | |
| Federal | 80,091 | | | (5,396) | | | (56,365) | |
| State | 5,033 | | | (401) | | | (3,075) | |
| 85,124 | | | (5,797) | | | (59,440) | |
| | | | | |
| Income tax (expense) benefit | $ | 85,124 | | | $ | (5,797) | | | $ | (59,440) | |
| | | | | | | | | | | | | | | | | |
| Year Ended December 31, |
| (in thousands) | 2023 | | 2022 | | 2021 |
| Current taxes | | | | | |
| Federal | $ | 104 | | | $ | — | | | $ | — | |
| State | (2,893) | | | (2,796) | | | (569) | |
| (2,789) | | | (2,796) | | | (569) | |
| Deferred taxes | | | | | |
| Federal | (132,039) | | | (106,011) | | | — | |
| State | (21,117) | | | (11,485) | | | — | |
| (153,156) | | | (117,496) | | | — | |
| | | | | |
| Income tax (expense) benefit | $ | (155,945) | | | $ | (120,292) | | | $ | (569) | |
A reconciliation of the statutory federal income tax expense, which is calculated at the federal statutory rate of 21%, to the income tax expense from continuing operations
provided for the periods presented is
as follows:provided below. In connection with the Earthstone Merger and Colgate Merger and the issuance of Class C Stock of the Company, noncontrolling interest in the partnership is the Company’s largest reconciling item to the federal statutory rate. | | | | | | | | | | | | | | | | | |
| Year Ended December 31, |
| (in thousands) | 2023 | | 2022 | | 2021 |
| Income tax (expense) benefit at the federal statutory rate | $ | (217,486) | | | $ | (182,728) | | | $ | (29,136) | |
| State income tax (expense) benefit - net of federal benefit | (18,741) | | | (16,007) | | | (1,648) | |
| Noncontrolling interest in partnership | 83,690 | | | 49,309 | | | — | |
| Nondeductible stock-based and other compensation | (963) | | | (10,827) | | | (6,609) | |
| Nondeductible expenses and other | (2,445) | | | (122) | | | (83) | |
| Change in valuation allowance | — | | | 40,083 | | | 36,907 | |
| Income tax (expense) benefit | $ | (155,945) | | | $ | (120,292) | | | $ | (569) | |
| | | | | | | | | | | | | | | | | |
| Year Ended December 31, |
| (in thousands) | 2020 | | 2019 | | 2018 |
| Income tax (expense) benefit at the federal statutory rate | $ | 161,768 | | | $ | (4,664) | | | $ | (57,157) | |
| State income tax (expense) benefit - net of federal benefit | 9,046 | | | (383) | | | (3,075) | |
| | | | | |
| | | | | |
| Noncontrolling interest in partnership | (496) | | | 129 | | | 2,696 | |
| Stock-based compensation | (8,047) | | | (780) | | | (1,825) | |
| Nondeductible expenses | (151) | | | (99) | | | (79) | |
| Change in valuation allowance | (76,996) | | | 0 | | | 0 | |
| | | | | |
| Income tax (expense) benefit | $ | 85,124 | | | $ | (5,797) | | | $ | (59,440) | |
CENTENNIAL RESOURCE DEVELOPMENT, INC.PERMIAN RESOURCES CORPORATION
NOTES TO CONSOLIDATED FINANCIAL STATEMENTS (Continued)
The tax effects of temporary differences that give rise to significant positions of the deferred income tax assets and liabilities are presented below: | | | | | | | | | | | |
| (in thousands) | December 31, 2023 | | December 31, 2022 |
| Deferred tax assets: | | | |
| Net operating loss carryforwards | $ | 104,915 | | | $ | 73,337 | |
| Other assets | 219 | | | 273 | |
| Total deferred tax assets | 105,134 | | | 73,610 | |
| | | |
| Deferred tax liabilities: | | | |
| Investment in OpCo | (527,755) | | | (73,535) | |
| | | |
| Valuation allowance | (6) | | | (6) | |
| | | |
| Net deferred tax asset (liability) | $ | (422,627) | | | $ | 69 | |
| | | | | | | | | | | |
| (in thousands) | December 31, 2020 | | December 31, 2019 |
| Deferred tax assets: | | | |
| Net operating loss carryforwards | $ | 107,897 | | | $ | 88,043 | |
| Capitalized intangible drilling cost | 110,590 | | | 100,307 | |
| Stock-based compensation | 4,871 | | | 8,284 | |
| Derivative assets | 3,985 | | | 0 | |
| Asset retirement obligations | 3,722 | | | 0 | |
| Interest expense | 0 | | | 18,722 | |
| Other assets | 637 | | | 295 | |
| Total deferred tax assets | 231,702 | | | 215,651 | |
| | | |
| Deferred tax liabilities: | | | |
| Investment in CRP | 0 | | | (301,155) | |
| Oil and gas properties | (155,748) | | | 0 | |
| Other liabilities | (1,547) | | | 0 | |
| Total deferred tax liabilities | (157,295) | | | (301,155) | |
| | | |
| Valuation Allowance | (76,996) | | | 0 | |
| | | |
| Net deferred tax asset (liability) | $ | (2,589) | | | $ | (85,504) | |
| | | | | | | | | | | |
| (in thousands) | December 31, 2023 | | December 31, 2022 |
| Deferred tax assets: | | | |
| Other noncurrent assets | $ | — | | | $ | 4,499 | |
| Deferred tax liabilities: | | | |
| Deferred income taxes | (422,627) | | | (4,430) | |
| Total deferred income taxes, net | $ | (422,627) | | | $ | 69 | |
In connection with the conversions of shares fromEarthstone Merger and Colgate Merger, the Company recorded a noncontrolling interest owner, a tax loss was recorded$164.5 million and $412.7 million reduction, respectively, in equity to reflect the change in its ownership interest in OpCo, which are net of $2.2a deferred income tax benefits of $47.1 million and $17.5$120.2 million, in 2020 and 2019, respectively, and a tax benefit was recorded in equity of $7.2 million in 2018. The Conversion that occurred during 2020 eliminated the noncontrolling interest and CRP is no longer treated as a partnership for tax purposes. As a result, the deferred tax assets and liabilities previously recorded within the partnership, and previously reported by the Company as a net deferred tax liability related to its investment in CRP, are now directly included within the Company’s deferred tax asset and liability categories above. Additionally, the Company’s deferred tax asset related to its interest expense limitation carryover at the partnership level was allocated proportionally to the Company’s oil and gas properties. All interest expense after the Conversion was deductible in the current year.respectively.
As of December 31, 2020,2023, the Company had approximately $496.3 million and $93.2$16.0 million of U.S. federal and state net operating loss carryovers, respectively. Approximately $417.4$382.6 million and $78.2$0.2 million of these U.S. federal and state net operating loss carryovers expire in 2037, respectively.
The Company periodically assesses whether it is more-likely-than-not that it will generate sufficient taxable income to realize its deferred income tax assets, including net operating loss carry forwards. In making this determination, the Company considers all available positive and negative evidence and makes certain assumptions. The Company considers, among other things, its deferred tax liabilities, the overall business environment, its historical earnings and losses, current industry trends, and its outlook for future years. The Company generated taxable income in the current year and is projecting future taxable income exclusive of reversing items. Based on whenupon these earnings and the Company expectsexpected timing of the reversal of its existing taxable temporary differences, to be realized, management determined that sufficient negative evidence exists as of December 31, 2020 to conclude that it is more-likely-than-not that, a portionwith the exception of itscertain state net operating loss carryovers, the remaining deferred income tax assets existing at December 31, 2023 will not be realized. Accordingly, a valuation allowance against its deferred tax assets in the amount of $77.0 million was recorded as of December 31, 2020.
The calculation of the Company’s tax liabilities involves uncertainties in the application of complex tax laws and regulations. The Company gives financial statement recognition to those tax positions that it believes are more-likely-than-not to be sustained upon the examination by the Internal Revenue Service or other governmental agency. As of December 31, 20202023 and 2019,2022, the Company did not have any accrued liability for uncertain tax positions and does not anticipate recognition of any significant liabilities for uncertain tax positions during the next 12 months. Interest and penalties related to uncertain tax positions are reported in income tax expense.
CENTENNIAL RESOURCE DEVELOPMENT, INC.
NOTES TO CONSOLIDATED FINANCIAL STATEMENTS (Continued)
The Company is subject to the following material taxing jurisdictions: U.S., Colorado, New Mexico, and Texas. As of December 31, 2020,2023, the Company has no current tax years under audit.audit, but one of the Company’s predecessor entities, Earthstone Energy Holdings, is currently under examination by the Internal Revenue Service for the 2021 Federal Form 1065 as filed. The Company remains subject to examination for federal income taxes and state income taxes for tax years 20172019 through 2020.2023.
PERMIAN RESOURCES CORPORATION
NOTES TO CONSOLIDATED FINANCIAL STATEMENTS (Continued)
Note 12—13—Transactions with Related Parties
Pearl Energy Investments (“Pearl”), EnCap Partners GP, LLC (“EnCap”), Riverstone Investment Group LLC (“Riverstone”), NGP Energy Capital (“NGP”) and itsrelated affiliates of each entity each beneficially own more thanapproximately 12%, 10%, 7% and 6%, respectively, equity interest in the Company as of December 31, 2023. Certain members of OpCo’s management owned profit interests at CEP III Holdings, LLC and its affiliates (“Colgate Holdings”) until December 2022. Due to Pearl, EnCap, Riverstone and NGP’s beneficial ownership and NGP, Pearl and OpCo’s management’s previously held interest in Colgate Holdings, these entities are therefore considered related parties. parties to the Company.
The Company has a marketing agreement with Lucid Energy Delaware, LLC (“Lucid”), an affiliate of Riverstone.the following agreements in place that represent related party transactions. The Company believes that the termterms of the marketing agreement with Lucidthese arrangements are no less favorable to either party than those held with unaffiliated parties.
(i) A marketing agreement with Lucid Energy Delaware, LLC (“Lucid”), who was an affiliate of Riverstone until the sale of Riverstone’s investment in Lucid in July 2022. As a result of such sale, there no longer remains a related party relationship with Lucid as of the third quarter of 2022.
(ii) A vendor arrangement with Streamline Innovations Inc (“Streamline”) who was an affiliate of Riverstone beginning in the second quarter of 2022 and an affiliate of Pearl.
(iii) A joint operating agreement with Maple Energy Holdings, LLC (“Maple”) who is an affiliate of Riverstone. On December 23, 2022, the Company sold all of its working interest ownership in producing properties operated by Maple for an unadjusted sales price of $60 million. As a result of such sale, there no longer remains a related party relationship with Maple as of December 31, 2022.
(iv) A vendor arrangement with LM Energy Partners who was an affiliate of Colgate Holdings until the sale of Colgate Holdings’ investment in LM Energy Partners in December 2022. As a result of such sale, there no longer remains a related party relationship with LM Energy Partners as of December 31, 2022.
The following table summarizes the costs incurred and revenues recognized andfrom such arrangements during the associated processing fees incurred from this marketing agreementperiods they were considered related parties, as presenteddiscussed above, as included in the consolidated statements of operations for the periods indicated, as well as the related net receivables and payables outstanding as of the balance sheet dates: | | | | | | | | | | | | | | | | | |
| Year Ended December 31, |
| (in thousands) | 2023 | | 2022 | | 2021 |
| Lucid | | | | | |
| Oil and gas sales | $ | — | | | $ | 25,117 | | | $ | 21,533 | |
| Gathering, processing and transportation expenses | — | | | 5,398 | | | 6,870 | |
| Streamline | | | | | |
| Lease operating expenses | 5,296 | | | 1,465 | | | — | |
| Maple | | | | | |
| Oil and gas sales | — | | | 8,354 | | | — | |
| Lease operating expenses | — | | | 4,368 | | | — | |
| Capital expenditures | — | | | 11,196 | | | — | |
| LM Energy Partners | | | | | |
| Gathering, processing and transportation expenses | — | | | 4,024 | | | — | |
| | | | | | | | | | | |
| (in thousands) | December 31, 2023 | | December 31, 2022 |
| Accounts receivable, net | | | |
| Maple | — | | | 128 | |
| Accounts payable and accrued expenses | | | |
| Maple | — | | | 2,790 | |
| LM Energy Partners | — | | | 2,283 | |
| | | |
| | | |
| | | | | | | | | | | | | | | | | |
| Year Ended December 31, |
| (in thousands) | 2020 | | 2019 | | 2018 |
| Lucid Energy Delaware, LLC (“Lucid”) | | | | | |
| Oil and gas sales | $ | 5,089 | | | $ | 3,559 | | | $ | 3,946 | |
| Gathering, processing and transportation expenses | 4,818 | | | 2,642 | | | 792 | |
| | | | | |
| | | | | |
PERMIAN RESOURCES CORPORATION
NOTES TO CONSOLIDATED FINANCIAL STATEMENTS (Continued)
| | | | | | | | | | | |
| (in thousands) | December 31, 2020 | | December 31, 2019 |
Accounts receivable, net(1) | $ | 994 | | | $ | 91 | |
(1) Represents amounts due from Lucid and are presented net of unpaid processing fees as of the indicated period end date.
Senior Secured Notes
During 2020, Riverstone acquired an aggregate of $100.7 million and $111.9 million of the Company’s 2026 Senior Notes and 2027 Senior Notes, respectively, in open market purchases. Subsequently, on May 22, 2020, Riverstone participated in the Company’s Debt Exchange, discussed in Note 4—Long-Term Debt, and exchanged all of its Senior Unsecured Notes for $106.3 million of the Company’s Senior Secured Notes. Riverstone’s participation in the Debt Exchange represented $120.0 million of the total extinguishment gain recognized in the consolidated statements of operations. The Company paid Riverstone $4.5 million in interest associated with the Senior Secured Notes during the year ended December 31, 2020.2023, the Company paid Novo Minerals, LP and Pegasus Resources Holdings, LLC, both affiliates of EnCap, $10.7 million and $2.2 million, respectively, for revenues earned based upon their net revenue interests held in wells that are operated by the Company.
Note 13—14—Commitments and Contingencies
Contractual Obligations
The following table is a schedule of the Company’s future minimum payments required under contractual commitments that have initial or remaining non-cancelable terms in excess of one year as of December 31, 20202023: | | | | | | | | | | | | | | | | | | | | | | | | | | | | | | | | | | | | | | | | | |
| (in thousands) | 2024 | | 2025 | | 2026 | | 2027 | | 2028 | | Thereafter | | Total |
| | | | | | | | | | | | | |
| Purchase obligations | $ | 57,581 | | | $ | 57,575 | | | $ | 5,200 | | | $ | — | | | $ | — | | | $ | — | | | $ | 120,356 | |
| | | | | | | | | | | | | | | | | | | | | | | | | | | | | | | | | | | | | | | | | |
| (in thousands) | 2021 | | 2022 | | 2023 | | 2024 | | 2025 | | Thereafter | | Total |
| Water disposal agreements | $ | 1,825 | | | $ | 100 | | | $ | 0 | | | $ | 0 | | | $ | 0 | | | $ | 0 | | | $ | 1,925 | |
| | | | | | | | | | | | | |
| Transportation agreements | 9,060 | | | 1,770 | | | 0 | | | 0 | | | 0 | | | 0 | | | 10,830 | |
| Total | $ | 10,885 | | | $ | 1,870 | | | $ | 0 | | | $ | 0 | | | $ | 0 | | | $ | 0 | | | $ | 12,755 | |
Water Disposal Agreement
TheIn 2021, the Company has entered into agreements for the transportation and disposal of produced water from a portion of its operated wells.multi-year energy purchase agreement to buy electricity utilized in our Texas operations. Under the terms of these agreements, Centennialcontract, the Company is obligated to deliverpurchase a minimum volumeamount of produced water or else payelectricity at a fixed price. If the Company does not utilize the minimum amounts of electricity on a monthly basis and the supplier is unable to sell the unutilized quantity, the Company is liable for any deficienciesthe full cost of the underutilization at the prices stipulated infixed price per the contracts.agreement. The obligations reported above representtotal remaining obligation is $15.6 million, which represents the remaininggross minimum financial commitmentcommitments pursuant to the terms of the contractsthis agreement as of December 31, 2020. Actual expenditures under these contracts may exceed the minimum commitments presented above.2023. The Company recognized water disposalpaid electricity costs of $2.4 million, $2.6$7.5 million and $2.2$8.0 million for the years ended December 31, 2020, 20192023 and 2018, respectively, related to these water disposal agreements.
CENTENNIAL RESOURCE DEVELOPMENT, INC.
NOTES TO CONSOLIDATED FINANCIAL STATEMENTS (Continued)
Transportation Agreements
The Company has various natural gas transportation agreements whereby it is required to pay fixed reservation fees for pipeline capacity over the contractual terms. The obligations reported above represent the gross minimum financial commitments pursuant to these agreements as of December 31, 2020. The2022, respectively, to this supplier.
In 2022, the Company has an additional gas transportentered into a two-year purchase agreement with a volumetric obligation, but this agreement has variable pricing components that cannot reliably be determined and therefore is not included above. Actual expenditures under these contracts are likely to exceed the minimum commitment amounts presented above. The Company paid transportation and gathering costs of $19.5 million, $12.8 million and $3.7 million for the years ended December 31, 2020, 2019 and 2018, respectively, related to these agreements.
Purchase Obligations
The Company has purchase agreements to buy frac’frac sand used in its well fracture stimulation process. Historically, underSubsequently in 2023, this purchase agreement was canceled without financial penalty and a new contract was entered into with the same third-party. Under the terms of these agreements, Centennial wasthis take-or-pay agreement, the Company is obligated to purchase a minimum volume of frac sand at a fixed sales price. However, these agreements were renegotiated in 2020 and all futureThe remaining obligation under this contract is $104.7 million, which represents the minimum volume commitments were eliminated. No penalties were paidfinancial commitment pursuant to the terms of the contract from December 31, 2023 through December 31, 2025. Actual expenditures under these agreements duringcontracts may exceed the yearminimum commitments. The Company paid $102.5 million and $11.3 million for the years ended December 31, 2020 related to2023 and December 31, 2022, respectively, under the failure to purchaseoriginal contract, which was capitalized as incurred during the minimum volumes of frac sand or as a result of the modifications to the agreements.period.
Delivery Commitments
In August 2018, the Company entered into a firm crude oil sales agreement with a large integrated oil company that was subsequently amended during the year ended December 31, 2020. Utilizing this company’s transport capacity out of the Permian Basin, the agreement, as amended, provides for firm gross sales of 30,00029,000 Bbls/d over the next 4.51.5 years and is based upon prevailing market prices of ICE Brent and contractual differentials. These pricing terms are resulting in realized prices that currently have wider differentials than those being realized under the Company’s other oil marketing agreements. However, if the oil price differential between the ICE Brent and NYMEX WTI indices widen in the future, the oil price realized under this delivery commitment will improve relative to the prices realized under the Company’s other oil sales contracts. Under-delivery of volumes would result in a financial obligation to the Company.
The Company has firm gas sales agreements that provide for firm gross sales ranging from approximately 41,000 to 91,000 MMBtu/d in aggregate over the next two years. These sales agreements do not require the Company to physically deliver the aforementioned volumes over the terms of the agreements, but if the volumetric commitments are not met and the purchaser incurs financial damages, the Company is required to pay for any differences between the contracted prices and current market prices for replacement volumes bought by the purchaser.
The amountsamount discussed above represent the total gross volumes the Company is required to deliver per these agreements,this agreement, which gross volumes are not comparable to the Company’s net production presented in Item 7. Management’s Discussion and Analysis of Financial Condition and Results of Operation, as amounts therein are reflected net of all royalties, overriding royalties and production due to others. The Company believes its current production and reserves are sufficient to fulfill the physical delivery commitments,commitment, and the Company is not required to deliver oil or gas specifically produced from any of the Company’s properties under these agreements.this agreement. Further, if the Company’s production is not sufficient to satisfy the firm delivery commitments,commitment, the Company believes it can purchase sufficient volumes in the market at index-related prices to satisfy its commitments.commitment. The aggregate amount of any such potential financial obligation under these contractsthis contract is not determinable since the amount and timing of any volumetric shortfalls, as well as the difference between the prevailing market price and contract price at such time, cannot be predicted with accuracy.
PERMIAN RESOURCES CORPORATION
NOTES TO CONSOLIDATED FINANCIAL STATEMENTS (Continued)
Lease Commitments
Refer to Note 15—16—Leases for details on the Company’s operating and financing lease agreements.
Contingencies
The Company may at times be subject to various commercial or regulatory claims, prior period adjustments from service providers, litigation or other legal proceedings that arise in the ordinary course of business. While the outcome of these lawsuits and claims cannot be predicted with certainty, management believes it is remote that the impact of such matters, other than those discussed below, that are reasonably possible to occur will have a material adverse effect on the Company’s financial position, results of operations or cash flows. Management
In February 2021, the Permian Basin was impacted by record-low temperatures and a severe winter storm (“Winter Storm Uri”) that resulted in multi-day electrical outages and shortages, pipeline and infrastructure freezes, transportation disruptions, and regulatory actions in Texas, which led to significant increases in gas prices, gathering, processing and transportation fees and electrical rates during this time. As a result, many oil and gas operators, including upstream producers like the Company, as well as gas processors and purchasers, and transportation providers experienced operational disruptions. During this time, the Company was unable to utilize the entire volume of its reserved capacity on pipelines and as a result has made certain force majeure declarations. One third-party transportation provider has filed a lawsuit against the Company claiming compensation for the full amount of the reserved capacity, both utilized and unutilized. The Company has made a payment for the utilized capacity and filed a separate lawsuit against the transportation provider requesting declaratory relief for the purpose of construing the provisions of the transportation agreement relating to the unutilized capacity. At this time, the Company believes that a loss is reasonably possible in relation to these matters, and such amount could range from zero to $7.6 million, which may be subject to additional interest charges, and no amount in that range is a better estimate than any other.
Other than the matter above, management is unaware of any pending claims or litigation brought against the Company requiring the reserve of a contingent liability to be recognized as of the date of these consolidated financial statements.
CENTENNIAL RESOURCE DEVELOPMENT, INC.
NOTES TO CONSOLIDATED FINANCIAL STATEMENTS (Continued)
Note 14—15—Revenues
Revenue from Contracts with Customers
Crude oil, natural gas and NGL sales are recognized at the point that control of the product is transferred to the customer and collectability is reasonably assured. Virtually all of the Company’s contract pricing provisions are tied to a market index, with certain adjustments based on, among other factors, transportation costs to an active spot market and quality differentials. As a result, the Company’s realized priceprices of oil, natural gas, and NGLs fluctuatesfluctuate to remain competitive with other available oil, natural gas, and NGLs supplies both globally (in the case of crude oil) and locally.
Oil and gas revenues presented within the consolidated statements of operations relate to the sale of oil, natural gas and NGLs as shown below:
| | | | | | | | | | | | | | | | | |
| Year Ended December 31, |
| 2020 | | 2019 | | 2018 |
| Operating revenues (in thousands): | | | | | |
| Oil sales | $ | 475,694 | | | $ | 810,655 | | | $ | 709,813 | |
| Natural gas sales | 46,776 | | | 44,556 | | | 62,325 | |
| NGL sales | 57,986 | | | 89,119 | | | 118,907 | |
| Oil and gas sales | $ | 580,456 | | | $ | 944,330 | | | $ | 891,045 | |
| | | | | | | | | | | | | | | | | |
| Year Ended December 31, |
| 2023 | | 2022 | | 2021 |
| Operating revenues (in thousands): | | | | | |
| Oil sales | $ | 2,696,777 | | | $ | 1,622,035 | | | $ | 743,069 | |
Natural gas sales(1) | 142,077 | | | 276,957 | | | 149,478 | |
NGL sales(2) | 282,039 | | | 232,273 | | | 137,345 | |
| Oil and gas sales | $ | 3,120,893 | | | $ | 2,131,265 | | | $ | 1,029,892 | |
(2) NGL sales include a portion of GP&T that are reflected as a reduction to NGL sales of $73.3 million for the year ended December 31, 2023, $10.6 million for the year ended December 31, 2022 and none for the year ended December 31, 2021.
Oil sales
The Company’s crude oil sales contracts are generally structured whereby oil is delivered to the purchaser at a contractually agreed-upon delivery point at which the purchaser takes title of the product. This delivery point is usually at the wellhead or at the inlet of a transportation pipeline. Revenue is recognized when control transfers to the purchaser at the delivery point based on the net price received from the purchaser. Any downstream transportation costs incurred by crude purchasers are reflected as a net reduction to oil sales revenues.
PERMIAN RESOURCES CORPORATION
NOTES TO CONSOLIDATED FINANCIAL STATEMENTS (Continued)
Natural gas and NGL sales
Under the Company’s natural gas processing contracts, liquids rich natural gas is delivered to a midstream gathering and processing entity at the inletagreed upon delivery point at which the purchaser takes title of the gas gathering system.product. The midstream processing entity gathers and processes the raw gas and then remits proceeds to Centennial for the resulting sales of NGLs, while the Company generally elects to take its residue gas product “in-kind” at the plant tailgate.Company. For these contracts, the Company evaluates when control is transferred and revenue should be recognized. Where the Company has concluded that control transferselects to take its residue gas or NGL product “in-kind” at the plant tailgate, of the processing facility, fees incurred prior to transfer of control at the outlet of the plant are presented as gathering, processing and transportation expenses (“GP&T”)&T within the consolidated statements of operations. Any transportationWhere the Company does not take its residue gas or NGL products “in-kind”, transfer of control occurs at the inlet of the gas gathering systems, or prior, and fractionation costsfees incurred subsequent to thethis point of transfer of control are reflected as a net reduction to natural gas and NGL sales revenues presented in the table above. During the year ended December 31, 2023, the majority of the Company’s contracts with customers have elections to not take its products “in-kind” resulting in more fees being shown as a net reduction to revenues as discussed above.
Performance obligations
For all commodity products, the Company records revenue in the month production is delivered to the purchaser. Settlement statements for crude oil are generally received within 30 days following the date that production volumes are delivered, but for natural gas and NGL sales, statements may not be received for 30 to 90 days after the date production volumes are delivered and for crude oil, generally within 3060 days after delivery has occurred. However, payment is unconditional once the performance obligations have been satisfied. At thissuch time, the volumevolumes delivered and pricesales prices can be reasonably estimated and amounts due from customers are accrued in Accounts receivable, net in the consolidated balance sheets. As of December 31, 20202023 and December 31, 2019,2022, such receivable balances were $41.7$346.0 million and $76.6$206.3 million, respectively.
The Company records any differences between its estimates and the actual amounts received for product sales in the month that payment is received from the purchaser. Historically, any identified differences between revenue estimates and actual revenue received have not been significant. For the years ended December 31, 20202023 and 2019,2022, revenue recognized in the reporting period related to performance obligations satisfied in prior reporting periods were not material.
CENTENNIAL RESOURCE DEVELOPMENT, INC.
NOTES TO CONSOLIDATED FINANCIAL STATEMENTS (Continued)
Transaction price allocated to remaining performance obligations
For the Company’s product sales that have a contract term greater than one year, the Company has utilized the practical expedient in ASC Topic 606, Revenue from contracts with Customers, which states the Company is not required to disclose the transaction price allocated to the remaining performance obligations if the variable consideration is allocated entirely to a wholly unsatisfied performance obligation. Under these sales contracts, monthly sales of a product generally represent a separate performance obligation; therefore,obligation. Therefore, future commodity volumes to be delivered and sold are wholly unsatisfied and disclosure of the transaction price allocated to such unsatisfied performance obligations is not required.
Note 15—16—Leases
At contract inception, the Company determines whether or not an arrangement contains a lease. However, in connection with the implementation of ASC 842, Leases (“ASC 842”), this assessment was made as of the adoption date of ASC 842, January 1, 2019.842. Upon determination of a lease, a lease right-of-use (“ROU”) asset and related liability are recorded based on the present value of the future lease payments over the lease term. ROU assets represent the Company’s right to use an underlying asset for the lease term, and lease liabilities represent the obligation to make future lease payments arising from the lease.
The Company has operating leases for drilling rig contracts, office rental agreements, and other wellhead equipment. As of December 31, 2020,2023, these leases have remaining lease terms ranging from two monthsone month to one year,eight years, some of which include options to extend the lease term for up to five years, and some of which include options to early terminate. These options are considered in determining the lease term and are included in the present value of future payments that are recorded for leases when the Company is reasonably certain to exercise the option. The Company has one financing lease entered into in connection with an office building purchase in Midland, Texas, where it had previously been a lessee of the building at the time of purchase in April of 2023. As part of the building purchase, the Company assumed a ninety-nine year ground lease and accordingly, recorded a financing lease liability. Leases with an initial term of one year or less are not recorded in the consolidated balance sheets. Additionally, none of the Company’s lease agreements contain any material residual value guarantees or material restrictive covenants.
PERMIAN RESOURCES CORPORATION
NOTES TO CONSOLIDATED FINANCIAL STATEMENTS (Continued)
The following table provides additional information related to the Company’s lease assets and liabilities as presented on balance sheet for the periods presented: | | | | | | | | | | | | | | | | | |
| (in thousands) | Balance Sheet Classification | | December 31, 2023 | | December 31, 2022 |
| Assets | | | | | |
| Operating right-of-use assets | Operating lease right-of-use asset | | $ | 59,359 | | | $ | 64,792 | |
| Finance right-of-use asset | Other noncurrent assets | | 15,189 | | | — | |
| Liabilities | | | | | |
| Current | | | | | |
| Operating lease liabilities | Operating lease liabilities | | $ | 33,006 | | | $ | 29,759 | |
| Finance lease liability | Other current liabilities | | 753 | | | — | |
| Noncurrent | | | | | |
| Operating lease liabilities | Operating lease liabilities | | $ | 28,302 | | | 41,341 | |
| Finance lease liability | Other noncurrent liabilities | | 14,821 | | | — | |
The present value of future lease payments is determined at the lease commencement date based upon the Company’s incremental borrowing rate. The incremental borrowing rate is calculated using a risk-free interest rate adjusted for the Company’s specific risk and the specific lease term. The table below summarizes the Company’s weighted average discount rate and weighted-average remaining lease term as of the periods presented.
| | December 31, 2020 | | December 31, 2019 |
| December 31, 2023 | | | December 31, 2023 | | December 31, 2022 |
| Operating Leases | | | Operating Leases | | Finance Lease | | Operating Leases | | Finance Lease |
| Weighted-average discount rate | Weighted-average discount rate | 5.1 | % | | 4.56 | % | Weighted-average discount rate | 5.55 | % | | 7.3 | % | | 5.02 | % | | — | % |
| Weighted-average remaining lease term (years) | Weighted-average remaining lease term (years) | 1.07 | | 1.29 | Weighted-average remaining lease term (years) | 3.02 | | 97.25 | | 4.55 | | 0 |
The Company’s drilling rig contracts, office rental agreements, and wellhead equipment agreements contain both lease and non-lease components, which are combined and accounted for as a single lease component.
CENTENNIAL RESOURCE DEVELOPMENT, INC.
NOTES TO CONSOLIDATED FINANCIAL STATEMENTS (Continued)
Variable lease payments are recognized in the period in which they are incurred and include operating expenses related to the office rental
agreements and cost incurred on the drilling rig contracts in excess of the contractual rate. Costagreements. Expenses related to short-term leases are recognized on a straight-line basis over the lease term as either expenses to the consolidated statements of operations or capitalized to the consolidated balance sheets. The following table presents the components of the Company’s lease
costexpenses for the
periodperiods presented.
| | | | | | | | | | | |
| Year Ended December 31, |
| (in thousands) | 2023 | | 2022 |
| Operating Lease costs | | | |
| Operating lease cost | $ | 40,988 | | | $ | 27,900 | |
| Variable lease cost | 1,222 | | | 892 | |
| Short-term lease cost | 168,026 | | | 42,567 | |
| Finance Lease costs | | | |
| Amortization of ROU assets | 117 | | | — | |
| Interest on lease liabilities | 844 | | | — | |
| Total Lease Cost | $ | 211,197 | | | $ | 71,359 | |
| | | | | | | | | | | |
| Year Ended December 31, |
| (in thousands) | 2020 | | 2019 |
| Lease costs | | | |
| Operating lease cost | $ | 8,117 | | | $ | 33,881 | |
| Variable lease cost | 4,773 | | | 3,104 | |
| Short-term lease cost | 41,533 | | | 60,798 | |
| Total Lease Cost | $ | 54,423 | | | $ | 97,783 | |
PERMIAN RESOURCES CORPORATION
NOTES TO CONSOLIDATED FINANCIAL STATEMENTS (Continued)
The following table presents supplemental cash flow information related to the Company’s leases for the periods presented. | | | | | | | | | | | |
| Year Ended December 31, |
| (in thousands) | 2023 | | 2022 |
| Operating lease liability payments: | | | |
| Net cash used in operating activities | $ | 15,856 | | | $ | 4,757 | |
| Net cash used in investing activities | $ | 25,645 | | | 23,143 | |
| Financing lease liability payments: | | | |
| Net cash used in operating activities | $ | 577 | | | $ | — | |
| Right-of-use assets recognized (derecognized) with offsetting operating lease liabilities | $ | 29,713 | | | $ | 63,681 | |
| Right-of-use assets recognized (derecognized) with offsetting finance lease liabilities | $ | 15,306 | | | $ | — | |
| | | | | | | | | | | |
| Year Ended December 31, |
| (in thousands) | 2020 | | 2019 |
| Operating lease liability payments: | | | |
| Cash used in operating activities | $ | 6,285 | | | $ | 15,897 | |
| Cash used in investing activities | $ | 1,832 | | | $ | 17,984 | |
| | | |
| Right-of-use assets recognized (derecognized) with offsetting operating lease liabilities | $ | (3,843) | | | $ | 34,833 | |
Maturities of the Company’s long-term operating and financing lease liabilities by fiscal year as of December 31, 20202023 are as follows:
| | | | | | | | |
| (in thousands) | | Total(2) |
| 2021 | | 3,260 | |
| 2022 | | 425 | |
| Total lease payments | | 3,685 | |
| Less: imputed interest | | (108) | |
Present value of lease liabilities(1) | | $ | 3,577 | |
| | | | | | | | | | | | | | |
| (in thousands) | | Operating Leases(1) | | Finance Lease |
| 2024 | | 35,112 | | | 783 | |
| 2025 | | 14,721 | | | 803 | |
| 2026 | | 5,204 | | | 823 | |
| 2027 | | 2,895 | | | 843 | |
| 2028 | | 2,705 | | | 864 | |
| 2029 and thereafter | | 6,045 | | | 206,420 | |
| Total lease payments | | 66,682 | | | 210,536 | |
| Less: imputed interest | | (5,374) | | | (194,962) | |
| Present value of lease liabilities | | $ | 61,308 | | | $ | 15,574 | |
(1) Of the total present value of lease liabilities, $3.2 million was recorded to current Operating lease liabilities and $0.4 million was recorded in noncurrent Operating lease liabilities in the consolidated balance sheets as of December 31, 2020.
(2) Total operating lease payments exclude variable lease payments which can be charged under the terms of the lease agreements.
Note 17—Subsequent Events
Dividends Declared
On February 27, 2024, the Company announced that its Board of Directors declared a quarterly dividend of $0.05 per share of Class A Common Stock and a quarterly distribution of $0.05 per Common Unit of OpCo. Additionally, the Company’s Board of Directors declared a variable dividend of $0.10 per share of Class A Common Stock and a quarterly variable distribution of $0.10 per Common Unit of OpCo. The base and variable dividend represent a total return of $0.15 per share. The dividend is payable on March 21, 2024 to shareholders of record as of March 13, 2024.
Supplemental Information About Oil & Natural Gas Producing Activities (Unaudited)
Capitalized Costs
The aggregate amounts of costs capitalized for oil and gas exploration and development activities and the related amounts of accumulated depreciation, depletion and amortization are shown below:
| | | | | | | | | | | |
| (in thousands) | December 31, 2020 | | December 31, 2019 |
| Proved properties | $ | 4,395,473 | | | $ | 3,962,175 | |
| Unproved properties | 1,209,205 | | | 1,470,903 | |
| Total proved and unproved properties | 5,604,678 | | | 5,433,078 | |
| Accumulated depreciation, depletion and amortization | (1,877,832) | | | (931,737) | |
| Net capitalized costs | $ | 3,726,846 | | | $ | 4,501,341 | |
| | | | | | | | | | | |
| (in thousands) | December 31, 2023 | | December 31, 2022 |
| Proved properties | $ | 15,036,687 | | | $ | 8,869,174 | |
| Unproved properties | 2,401,317 | | | 1,424,744 | |
| Total proved and unproved properties | 17,438,004 | | | 10,293,918 | |
| Accumulated depreciation, depletion and amortization | (3,401,895) | | | (2,419,692) | |
| Net capitalized costs | $ | 14,036,109 | | | $ | 7,874,226 | |
Costs Incurred for Oil and Natural Gas Producing Activities
The costs incurred in the Company’s oil and gas production, exploration, and development activities are displayed in the table below and include costs whether capitalized or expensed as well as revisions and additions to the estimated future asset retirement obligations.
| | | | | | | | | | | | | | | | | |
| Year Ended December 31, |
| (in thousands) | 2020 | | 2019 | | 2018 |
| Acquisition costs: | | | | | |
| Proved properties | $ | 1,384 | | | $ | 3,437 | | | $ | 39,731 | |
| Unproved properties | 4,768 | | | 81,602 | | | 173,519 | |
Advances for unproved properties(1) | 2,312 | | | 18,345 | | | — | |
Development costs(2) | 284,006 | | | 875,911 | | | 933,639 | |
| Exploration costs | 18,355 | | | 11,390 | | | 9,968 | |
| Total | $ | 310,825 | | | $ | 990,685 | | | $ | 1,156,857 | |
| | | | | | | | | | | | | | | | | |
| Year Ended December 31, |
| (in thousands) | 2023 | | 2022 | | 2021 |
| Acquisition costs: | | | | | |
Proved properties(1) | $ | 4,590,212 | | | $ | 3,297,400 | | | $ | 1,988 | |
Unproved properties(1) | 1,147,857 | | | 642,113 | | | 4,522 | |
Development costs(2) | 1,596,657 | | | 540,094 | | | 303,938 | |
Exploration costs(3) | 17,537 | | | 10,145 | | | 5,718 | |
| Total | $ | 7,352,263 | | | $ | 4,489,752 | | | $ | 316,166 | |
(1) Advances forThese amounts include the fair value of the proved and unproved properties represent amounts paidrecorded in the purchase price allocation with respect to the Earthstone Merger and other asset acquisitions as of December 31, 2023, which includes deferred tax liabilities of $344.2 million assumed in these acquisitions, and the Colgate Merger as of December 31, 2022. These purchases were funded through a third-party brokercombination of issuances of the Company’s Class A and C Common Stock, debt assumed and cash. Refer to acquire approximately 24,000 net leasehold acresNote 2—Business Combinations for additional information on the Company’s behalf in the Permian Basin. This prepaid amount was included in the Other noncurrent assets line item on the consolidated balance sheet; however, it was impaired during the year ended December 31, 2020. Refer to the Management Discussion and Analysis of Financial Condition and Results of Operations under Part II, Item 7 of this Annual Report for further discussion.mergers.
(2) Includes the cost of drilling development wells and associated facilities for which construction was completed during the period. Costs associated with wells and facilities that are in progress or awaiting completion at year-end are not included and were $45.3$242.4 million, $86.8$301.8 million and $115.0$60.6 million as of the years ended December 31, 2020, 20192023, 2022 and 2018,2021, respectively.
(3) Includes all exploratory expenses, including dry hole costs. Does not include other operating expenses.
Estimated Quantities of Proved Oil and Gas Reserves
The reserve estimates presented below and included herein conform to the definitions prescribed by the SEC. The Company retained Netherland, Sewell & Associates, Inc., an independent petroleum engineering firm, to prepare the estimates of all of its proved reserves as of December 31, 2020, 20192023, 2022 and 20182021 and their related pre-tax future net cash flows. The individuals performing reserves estimates possess professional qualifications and demonstrate competency in reserves estimation and evaluation. The estimates of proved reserves are inherently imprecise and are continually subject to revision based on production history, results of additional exploration and development, price changes and other factors.
Reserve estimates are based on an unweighted arithmetic average of commodity prices during the 12-month period, using the closing prices on the first day of each month, as defined by the SEC.
As of December 31, 2020,2023, all of the Company’s oil and gas reserves are attributable to properties within the United States. The table below presents a summary of changes in quantities of proved oil and gas reserves in the Company’s estimated proved reserves:
| | | | | | | | | | | | | | | | | | | | | | | |
| | Crude Oil (MBbls) | | Natural Gas (MMcf) | | Natural Gas Liquids (MBbls) | | Total (MBoe)(1) |
| Total proved reserves: | | | | | | | |
| Balance - December 31, 2017 | 100,933 | | | 327,212 | | | 30,986 | | | 186,454 | |
| Extensions and discoveries | 64,159 | | | 179,052 | | | 23,937 | | | 117,938 | |
| Revisions to previous estimates | (12,429) | | | (74,781) | | | 770 | | | (24,123) | |
| Purchases of reserves in place | 3,573 | | | 7,455 | | | 1,012 | | | 5,827 | |
| Divestitures of reserves in place | (791) | | | (4,379) | | | (455) | | | (1,975) | |
| Production | (12,679) | | | (31,707) | | | (4,332) | | | (22,295) | |
| Balance - December 31, 2018 | 142,766 | | | 402,852 | | | 51,918 | | | 261,826 | |
| Extensions and discoveries | 33,093 | | | 76,820 | | | 10,527 | | | 56,424 | |
| Revisions to previous estimates | (9,845) | | | 64,558 | | | 10,047 | | | 10,959 | |
| Purchases of reserves in place | 9 | | | 209 | | | 30 | | | 74 | |
| Divestitures of reserves in place | (282) | | | (306) | | | (46) | | | (378) | |
| Production | (15,582) | | | (41,703) | | | (5,234) | | | (27,766) | |
| Balance - December 31, 2019 | 150,159 | | | 502,430 | | | 67,242 | | | 301,139 | |
| Extensions and discoveries | 33,220 | | | 73,669 | | | 9,877 | | | 55,375 | |
| Revisions to previous estimates | (19,680) | | | (7,010) | | | (12,184) | | | (33,031) | |
| | | | | | | |
| | | | | | | |
| Production | (13,207) | | | (41,302) | | | (4,490) | | | (24,581) | |
| Balance - December 31, 2020 | 150,492 | | | 527,787 | | | 60,445 | | | 298,902 | |
| | | | | | | |
| Proved developed reserves: | | | | | | | |
| December 31, 2018 | 63,317 | | | 180,542 | | | 23,093 | | | 116,500 | |
| December 31, 2019 | 74,842 | | | 237,791 | | | 32,743 | | | 147,216 | |
| December 31, 2020 | 70,716 | | | 279,556 | | | 31,672 | | | 148,981 | |
| | | | | | | |
| Proved undeveloped reserves: | | | | | | | |
| December 31, 2018 | 79,449 | | | 222,310 | | | 28,825 | | | 145,326 | |
| December 31, 2019 | 75,317 | | | 264,639 | | | 34,499 | | | 153,923 | |
| December 31, 2020 | 79,776 | | | 248,231 | | | 28,773 | | | 149,921 | |
| | | | | | | | | | | | | | | | | | | | | | | |
| | Crude Oil (MBbls) | | Natural Gas (MMcf) | | Natural Gas Liquids (MBbls) | | Total (MBoe)(1)(2) |
| Total proved reserves: | | | | | | | |
| Balance - December 31, 2020 | 150,492 | | | 527,787 | | | 60,445 | | | 298,902 | |
| Extensions and discoveries | 19,405 | | | 55,820 | | | 6,242 | | | 34,950 | |
| Revisions to previous estimates | (1,948) | | | 40,697 | | | (6,703) | | | (1,868) | |
| | | | | | | |
| Divestitures of reserves in place | (2,795) | | | (6,558) | | | (649) | | | (4,537) | |
| Production | (11,701) | | | (40,741) | | | (3,752) | | | (22,243) | |
| Balance - December 31, 2021 | 153,453 | | | 577,005 | | | 55,583 | | | 305,204 | |
| Extensions and discoveries | 51,906 | | | 144,316 | | | 19,387 | | | 95,346 | |
| Revisions to previous estimates | (22,181) | | | (111,405) | | | (9,279) | | | (50,027) | |
| Purchases of reserves in place | 124,072 | | | 494,221 | | | 66,437 | | | 272,879 | |
| Divestitures of reserves in place | (1,983) | | | (10,874) | | | (2,527) | | | (6,322) | |
| Production | (18,235) | | | (59,692) | | | (6,750) | | | (34,934) | |
| Balance - December 31, 2022 | 287,032 | | | 1,033,571 | | | 122,851 | | | 582,146 | |
| Extensions and discoveries | 44,878 | | | 126,646 | | | 18,391 | | | 84,376 | |
| Revisions to previous estimates | (39,725) | | | (120,624) | | | (9,038) | | | (68,868) | |
| Purchases of reserves in place | 139,938 | | | 848,391 | | | 121,342 | | | 402,678 | |
| Divestitures of reserves in place | (3,227) | | | (2,712) | | | (563) | | | (4,242) | |
| Production | (35,560) | | | (119,182) | | | (15,569) | | | (70,992) | |
| Balance - December 31, 2023 | 393,336 | | | 1,766,090 | | | 237,414 | | | 925,098 | |
| | | | | | | |
| Proved developed reserves: | | | | | | | |
| December 31, 2021 | 77,973 | | | 326,223 | | | 30,318 | | | 162,662 | |
| December 31, 2022 | 156,941 | | | 652,270 | | | 74,940 | | | 340,593 | |
| December 31, 2023 | 271,328 | | | 1,441,914 | | | 192,368 | | | 704,015 | |
| | | | | | | |
| Proved undeveloped reserves: | | | | | | | |
| December 31, 2021 | 75,480 | | | 250,782 | | | 25,265 | | | 142,542 | |
| December 31, 2022 | 130,091 | | | 381,301 | | | 47,911 | | | 241,553 | |
| December 31, 2023 | 122,008 | | | 324,176 | | | 45,046 | | | 221,083 | |
(1) Calculated by converting natural gas to oil equivalent barrels at a ratio of six Mcf of natural gas to one Boe.
(2) Includes total proved reserves of 277,529 MBoe as of December 31, 2023 and 279,430 MBoe as of December 31, 2022 attributable to a consolidated subsidiary in which there was a 30% and 48%, respectively, noncontrolling interest. There was no noncontrolling interest as of December 31, 2021 and 2020.
Notable changes in proved reserves for the year ended December 31, 20202023 included the following:
•Purchases of reserves in place. In 2023, 402.7 MMBoe of proved reserves were added primarily from properties acquired in the Earthstone Merger on November 1, 2023. Refer to Note 2—Business Combinations for further details on the Earthstone Merger transaction.
•Extensions and discoveries. In 2020, 55.42023, 84.4 MMBoe of proved reserves were added through extensions and discoveries and include: i) 52.147.9 MMBoe for new proved undeveloped (“PUD”) locations; and ii) 3.336.4 MMBoe for unproved locations that were successfully converted to new proved developed (“PDP”) wells during the period. These additions resulted from the Company’s 20202023 drilling program, which added locations primarily in the 2ndvarious Bone Spring and 3rdWolfcamp formations on the Company’s acreage in the Delaware Basin.
•Revisions to previous estimates. In 2023, total revisions to previous estimates reduced proved reserves 68.9 MMBoe. These downward revisions in 2023 primarily related to i) 25.4 MMBoe of reduced reserves from lower average commodity prices for the year ended 2023, ii) 22.3 MMBoe of negative revisions associated with PUD locations that were mainly reclassified to unproved reserves due to changes in the Company’s development plan, and iii) the 21.2 MMBoe of downward revisions primarily related to lowered estimates associated with timing and performance.
Notable changes in proved reserves for the year ended December 31, 2022 included the following:
•Purchases of reserves in place. In 2022, 272.9 MMBoe of proved reserves were added primarily from properties acquired in the Colgate Merger on September 1, 2022. Refer to Note 2—Business Combinations for further details on the Colgate Merger transaction.
•Extensions and discoveries. In 2022, 95.3 MMBoe of proved reserves were added through extensions and discoveries and include: i) 77.8 MMBoe for new PUD locations; and ii) 17.5 MMBoe for unproved locations that were successfully converted to new PDP wells during the period. These additions resulted from the Company’s 2022 drilling program, which added locations primarily in the various Bone Spring Sand formations on the Company’s New Mexico acreage and also on the Company’s Texas position primarily in the Wolfcamp A and B formations.
•Revisions to previous estimates. In 2022, total revisions to previous estimates reduced proved reserves 50.0 MMBoe. Aggregate downward revisions in 2022 were 60.2 MMBoe and primarily related to 47.8 MMBoe of negative revisions associated with PUD locations that were either reclassified to unproved reserves or removed due to changes in the Company’s development plan as a result of combining drilling programs following the Colgate Merger. The remaining 12.4 MMBoe of the downward revisions were associated with performance, timing, and operating cost revisions. These downward revisions were mostly offset by positive revisions of 10.2 MMBoe related primarily to upward pricing adjustments associated with higher average commodity prices for the year ended December 31, 2022.
•Divestitures of reserves in place. In 2022, 6.3 MMBoe of proved reserves in place were removed mainly from divestitures of non-operated properties.
Notable changes in proved reserves for the year ended December 31, 2021 included the following:
•Extensions and discoveries. In 2021, 35.0 MMBoe of proved reserves were added through extensions and discoveries and include: i) 30.0 MMBoe for new proved undeveloped (“PUD”) locations; and ii) 5.0 MMBoe for unproved locations that were successfully converted to new proved developed (“PDP”) wells during the period. These additions resulted from the Company’s 2021 drilling program, which added locations primarily in the Bone Spring Sand formations on the Company’s New Mexico acreage and also on the Company’s Texas position in the Wolfcamp C and 3rd Bone Spring formations.formation.
•Revisions to previous estimates. In 2020,2021, total revisions to previous estimates reduced proved reserves by a net amount of 33.01.9 MMBoe. Aggregate downward revisions of 133.4in 2021 were 25.6 MMBoe for 2020 consisted of (i) 103.7 MMBoe of downward pricing adjustments and (ii) 29.4primarily related to 21.9 MMBoe of negative revisions associated with PUD locations that were either reclassified to unproved reserves or removed due to changes in the Company’s active development program. The remainder of the downward revisions were associated with timing, performance, and operating cost revisions. These downward revisions were partiallymostly offset by aggregate upwardpositive revisions of 100.423.7 MMBoe that wererelated primarily related to reductions in the Company’s operating costs, which extended the lives and increased total reserves for PDP and PUD locations, as well as reductions in per-well capital expenditures that elevated economics for certain PUD locations.
Notable changes in proved reservesupward pricing adjustments associated with higher average commodity prices for the year ended December 31, 2019 included the following:
•Extensions and discoveries. In 2019, 56.4 MMBoe of proved reserves were added through extensions and discoveries and include: i) 30.5 MMBoe for new PUD locations; and ii) 25.9 MMBoe for unproved locations that were successfully converted to new PDP wells during the period. These additions resulted from the Company’s effective drilling program throughout the year, which added locations primarily in the Upper Wolfcamp A formation in the Company’s Texas position and also in the 2nd Bone Spring formations in the Company’s New Mexico acreage.2021.
•Revisions to previous estimates.Divestitures of reserves in place. In 2019, revisions to previous estimates of 11.0 MMBoe consisted of 27.5 MMBoe of upward revisions primarily related to well performance revisions to reflect higher gas and NGL yields on older wells, which in turn increased total EURs for most proved developed and PUD locations. These positive revisions were partially offset by 16.5 MMBoe of negative revisions, of which 10.1 MMBoe related to downward pricing adjustments due to lower average commodity prices for oil, gas and NGLs for the year ended December 31, 2019. The remainder of the downward revisions related to PUD locations that were reclassified to unproven reserves due to them no longer being a part of the Company’s active development program.
Notable changes in proved reserves for the year ended December 31, 2018 included the following:
•Extensions and discoveries. In 2018, total extensions and discoveries of 117.9 MMBoe were primarily attributable to increased drilling activity as a result of the Company’s seven-rig drilling program effective throughout the year. These additions include 90.0 MMBoe related to new PUD locations, primarily in the Upper Wolfcamp A, and 27.9 MMBoe for the conversion of unproved locations to PDP wells.
•Revisions to previous estimates. In 2018, revisions to previous estimates were 24.1 MMBoe and mainly consist of negative revisions to PUD locations of 20.3 MMBoe. Of these PUD revisions, the majority related to locations that were reclassified to unproved reserves due to them no longer being a part of the Company’s active development program. In addition, 1.42021, 4.5 MMBoe of reserves in place were removed for locations no longer expected to be developed within five yearsfollowing the divestiture of their initial recording in accordance with SEC rules.
•Purchases of reserves in place. In 2018, purchases of reserves of 5.8 MMBoe was primarily attributable to asset acquisitionsnon-core acreage discussed further in Note 2—Property 3—Acquisitions and DivestituresDivestitures.
.
Standardized Measure of Discounted Future Net Cash Flows
The standardized measure of discounted future net cash flows (the “Standardized Measure”) relating to proved oil and gas reserves has been prepared in accordance with FASB ASC Topic 932, Extractive Activities - Oil and Gas (“ASC 932”). Future cash inflows as of December 31, 2020, 20192023, 2022 and 20182021 have been computed by applying average fiscal year prices (calculated as the unweighted arithmetic average of the first-day-of-the-month price for each month within the 12-month periods ended December 31, 2020, 20192023, 2022 and 2018,2021, respectively) to estimated future production. Future production and development costs are computed by estimating the expenditures to be incurred in developing and producing the proved oil and gas reserves, based on year-end costs and assuming the continuation of existing economic conditions. The Standardized Measure also includes costs for future dismantlement, abandonment and rehabilitation obligations.
Future income tax expenses are calculated by applying appropriate year-end tax rates to future pretax net cash flows relating to proved oil and natural gas reserves, less the tax basis of properties involved. Future income tax expenses give effect to permanent differences, tax credits and loss carryforwards relating to the proved oil and natural gas reserves.
Future net cash flows are discounted at a rate of 10% annually to derive the Standardized Measure. This calculation does not necessarily result in an estimate of the fair value of the Company’s oil and gas properties.
The following table presents the Company’s Standardized Measure of discounted future net cash flows: | | | | | | | | | | | | | | | | | |
| | Year Ended December 31, |
| (in thousands) | 2023 | | 2022 | | 2021 |
| Future cash inflows | $ | 39,110,246 | | | $ | 36,444,649 | | | $ | 13,224,260 | |
| Future development costs | (3,542,036) | | | (3,051,047) | | | (984,827) | |
| Future production costs | (15,772,824) | | | (9,381,857) | | | (4,404,841) | |
| Future income tax expenses | (2,629,285) | | | (4,821,696) | | | (1,162,657) | |
| Future net cash flows | 17,166,101 | | | 19,190,049 | | | 6,671,935 | |
| 10% discount to reflect timing of cash flows | (7,639,884) | | | (9,764,471) | | | (3,275,615) | |
Standardized measure of discounted future net cash flows(1) | $ | 9,526,217 | | | $ | 9,425,578 | | | $ | 3,396,320 | |
| | | | | | | | | | | | | | | | | |
| | Year Ended December 31, |
| (in thousands) | 2020 | | 2019 | | 2018 |
| Future cash inflows | $ | 6,700,654 | | | $ | 9,616,702 | | | $ | 10,989,064 | |
| Future development costs | (974,163) | | | (1,410,494) | | | (1,548,551) | |
| Future production costs | (3,135,089) | | | (3,943,766) | | | (3,313,981) | |
| Future income tax expenses | (25,487) | | | (391,168) | | | (1,027,976) | |
| Future net cash flows | 2,565,915 | | | 3,871,274 | | | 5,098,556 | |
| 10% discount to reflect timing of cash flows | (1,381,240) | | | (1,808,902) | | | (2,618,705) | |
| Standardized measure of discounted future net cash flows | $ | 1,184,675 | | | $ | 2,062,372 | | | $ | 2,479,851 | |
The following summarizes the principal sources of change in the Standardized Measure of discounted future net cash flows and such changes have been computed in accordance with ASC 932: | | | | | | | | | | | | | | | | | |
| Year Ended December 31, |
| (in thousands) | 2023 | | 2022 | | 2021 |
| Standardized measure of discounted future net cash flows, beginning of period | $ | 9,425,578 | | | $ | 3,396,320 | | | $ | 1,184,675 | |
| Sales of oil, natural gas and NGLs, net of production costs | (2,417,077) | | | (1,705,759) | | | (770,437) | |
| Purchase of minerals in place | 5,272,706 | | | 5,555,649 | | | — | |
| Divestiture of minerals in place | (81,196) | | | (103,030) | | | (34,334) | |
| Extensions and discoveries, net of future development costs | 1,173,711 | | | 1,789,830 | | | 445,256 | |
| Previously estimated development costs incurred during the period | 856,033 | | | 369,088 | | | 216,526 | |
| Net change in prices and production costs | (5,966,081) | | | 2,508,583 | | | 2,859,463 | |
| Change in estimated future development costs | 244,751 | | | 85,931 | | | (3,747) | |
| Revisions of previous quantity estimates | (823,441) | | | (1,127,536) | | | (29,946) | |
| Accretion of discount | 1,171,468 | | | 387,747 | | | 118,914 | |
| Net change in income taxes | 707,586 | | | (1,807,957) | | | (476,681) | |
| Net change in timing of production and other | (37,821) | | | 76,712 | | | (113,369) | |
Standardized measure of discounted future net cash flows, end of period(1) | $ | 9,526,217 | | | $ | 9,425,578 | | | $ | 3,396,320 | |
| | | | | | | | | | | | | | | | | |
| Year Ended December 31, |
| (in thousands) | 2020 | | 2019 | | 2018 |
| Standardized measure of discounted future net cash flows, beginning of period | $ | 2,062,372 | | | $ | 2,479,851 | | | $ | 1,503,326 | |
| Sales of oil, natural gas and NGLs, net of production costs | (360,448) | | | (662,319) | | | (693,585) | |
| Purchase of minerals in place | — | | | 154 | | | 61,137 | |
| Divestiture of minerals in place | — | | | (5,593) | | | (17,516) | |
| Extensions and discoveries, net of future development costs | 177,325 | | | 526,083 | | | 1,213,206 | |
| Previously estimated development costs incurred during the period | 167,135 | | | 380,376 | | | 380,452 | |
| Net change in prices and production costs | (1,428,068) | | | (1,395,537) | | | 532,702 | |
| Change in estimated future development costs | 463,286 | | | 15,056 | | | (145,048) | |
| Revisions of previous quantity estimates | (236,917) | | | 47,226 | | | (155,943) | |
| Accretion of discount | 219,789 | | | 297,946 | | | 174,806 | |
| Net change in income taxes | 131,054 | | | 364,089 | | | (254,873) | |
| Net change in timing of production and other | (10,853) | | | 15,040 | | | (118,813) | |
| Standardized measure of discounted future net cash flows, end of period | $ | 1,184,675 | | | $ | 2,062,372 | | | $ | 2,479,851 | |
Future net revenues included in the Standardized Measure relating to proved oil and natural gas reserves incorporate weighted average sales prices (inclusive of adjustments for transportation, quality and basis differentials) for each of the periods indicated below as follows:
| | | | | | | | | | | | | | | | | |
| Year Ended December 31, |
| 2020 | | 2019 | | 2018 |
| Oil (per Bbl) | $ | 35.89 | | | $ | 52.62 | | | $ | 58.71 | |
| Gas (per Mcf) | 0.97 | | | 0.87 | | | 2.45 | |
| NGLs (per Bbl) | 13.00 | | | 18.99 | | | 31.20 | |
| | | | | | | | | | | | | | | | | |
| Year Ended December 31, |
| 2023 | | 2022 | | 2021 |
| Oil (per Bbl) | $ | 77.05 | | | $ | 91.43 | | | $ | 61.77 | |
| Gas (per Mcf) | 1.63 | | | 5.01 | | | 3.23 | |
| NGLs (per Bbl) | 24.95 | | | 40.90 | | | 33.89 | |
Selected Quarterly Financial Data (Unaudited)
| | | | | | | | | | | | | | | | | | | | | | | |
| Quarter Ended |
| (in thousands) | March 31 | | June 30 | | September 30 | | December 31 |
| 2020 | | | | | | | |
| Operating revenues | $ | 192,769 | | | $ | 90,509 | | | $ | 149,101 | | | $ | 148,077 | |
| Operating expenses | 801,588 | | | 183,309 | | | 181,112 | | | 194,965 | |
| Income (loss) from operations | (608,574) | | | (92,802) | | | (31,866) | | | (46,878) | |
| Other income (expense) | (24,979) | | | 96,216 | | | (19,663) | | | (41,777) | |
| Income tax (expense) benefit | 83,208 | | | 1,916 | | | — | | | — | |
| Net income (loss) attributable to Class A Common Stock | (547,983) | | | 5,330 | | | (51,529) | | | (88,655) | |
| Income (loss) per share of Class A Common Stock: | | | | | | | |
| Basic | $ | (1.99) | | | $ | 0.02 | | | $ | (0.19) | | | $ | (0.32) | |
| Diluted | (1.99) | | | 0.02 | | | (0.19) | | | (0.32) | |
| | | | | | | | | | | | | | | | | | | | | | | |
| Quarter Ended |
| (in thousands) | March 31 | | June 30 | | September 30 | | December 31 |
| 2019 | | | | | | | |
| Operating revenues | $ | 214,569 | | | $ | 244,239 | | | $ | 229,130 | | | $ | 256,392 | |
| Operating expenses | 209,462 | | | 207,142 | | | 217,766 | | | 229,674 | |
Income (loss) from operations(1) | 5,105 | | | 37,106 | | | 11,342 | | | 25,876 | |
Other income (expense)(1) | (15,905) | | | (12,176) | | | (13,662) | | | (15,475) | |
| Income tax (expense) benefit | 2,263 | | | (5,928) | | | (1,393) | | | (739) | |
| Net income (loss) attributable to Class A Common Stock | (8,112) | | | 17,877 | | | (3,585) | | | 9,618 | |
| Income (loss) per share of Class A Common Stock: | | | | | | | |
| Basic | $ | (0.03) | | | $ | 0.07 | | | $ | (0.01) | | | $ | 0.03 | |
| Diluted | (0.03) | | | 0.07 | | | (0.01) | | | 0.03 | |
(1) Certain prior period amounts have been reclassified to conform to the current presentation in the accompanying consolidated financial statements.
ITEM 9. CHANGES IN AND DISAGREEMENTS WITH ACCOUNTANTS ON ACCOUNTING AND FINANCIAL DISCLOSURE
None.
ITEM 9A. CONTROLS AND PROCEDURES
Evaluation of Disclosure Control and Procedures
In accordance with Exchange Act Rules 13a-15 and 15d-15, the Company has evaluated, under the supervision and with the participation of management, including the principal executive officerofficers and principal financial officer, the effectiveness of the design and operation of disclosure controls and procedures (as defined in Rules 13a-15(e) and 15d-15(e) under the Exchange Act) as of December 31, 2020.2023. Our disclosure controls and procedures are designed to provide reasonable assurance that the information required to be disclosed in reports that the Company files under the Exchange Act is accumulated and communicated to management, including the principal executive officerofficers and principal financial officer, as appropriate, to allow timely decisions regarding required disclosure and is recorded, processed, summarized and reported within the time periods specified in the rules and forms of the SEC. Based upon that evaluation,
During the fourth quarter of 2023, the Company completed its merger with Earthstone. As part of the ongoing integration of the acquired business, the Company is in the process of incorporating the controls and related procedures of Earthstone.
The principal executive officerofficers and principal financial officer concluded that the Company’s disclosure controls and procedures were effective as of December 31, 20202023 at the reasonable assurance level.
Changes in Internal Control over Financial Reporting
Other than incorporating Earthstone’s processes and procedures, there were no changes in the system of internal control over financial reporting (as defined in Rule 13a-15(f) and Rule 15d-15(f) under the Exchange Act) during the quarter ended December 31, 2023 that have materially affected, or are reasonably likely to materially affect, the Company’s internal control over financial reporting.
Management’s Annual Report on Internal Control Over Financial Reporting
Management, including the principal executive officerofficers and principal financial officer, is responsible for establishing and maintaining adequate internal control over financial reporting as defined in Rule 13a-15(f) under the Exchange Act. The Company’s internal control over financial reporting is designed to provide reasonable assurance regarding the reliability of financial reporting and the preparation of the consolidated financial statements for external purposes in accordance with GAAP.
Because of its inherent limitations, internal control over financial reporting may not prevent or detect misstatements. Also, projections of any evaluation of effectiveness to future periods are subject to the risk that controls may become inadequate because of changes in conditions, or that the degree of compliance with the policies or procedures may deteriorate.
Management assessed the effectiveness of the Company’s internal control over financial reporting as of December 31, 2020,2023, using the criteria in Internal Control-Integrated Framework (2013) issued by the Committee of Sponsoring Organizations of the Treadway Commission (COSO). Based on this evaluation, management believes that the Company’s internal control over financial reporting was effective as of December 31, 2020.2023.
Management’s assessment and conclusion on the effectiveness of the Company’s internal control over financial reporting as of December 31, 2023 excludes an assessment of the internal control over financial reporting of Earthstone, which was acquired in a business combination on November 1, 2023 (refer to Note 2—Business Combinations in Item 8 of this Annual Report for further details on the Earthstone Merger). The total revenues of Earthstone represent approximately 11% of the related consolidated financial statement amounts for the year ended December 31, 2023 and the total fair value of the Earthstone assets acquired as of the Earthstone Merger closing date represent approximately 39% of the total assets of the consolidated Company as of December 31, 2023.
This Annual Report includes an attestation report of KPMG LLP, the Company’s independent registered public accounting firm, on the Company’s internal control over financial reporting as of December 31, 2020,2023, which is included in this Annual Report.
Changes in Internal Control over Financial Reporting
There were no changes in the system of internal control over financial reporting (as defined in Rule 13a-15(f) and Rule 15d-15(f) under the Exchange Act) during the quarter ended December 31, 2020 that have materially affected, or are reasonably likely to materially affect, the Company’s internal control over financial reporting.
ITEM 9B. OTHER INFORMATION
None.Trading Plans
During the quarter ended December 31, 2023, no directors or officers, as defined in Rule 16a-1(f), adopted or terminated a “Rule 10b5-1 trading arrangement” or a “non-Rule 10b5-1 trading arrangement,” each as defined in Regulation S-K Item 408.
ITEM 9C. DISCLOSURE REGARDING FOREIGN JURISDICTIONS THAT PREVENT INSPECTIONS.
None.
PART III
ITEM 10. DIRECTORS, EXECUTIVE OFFICERS AND CORPORATE GOVERNANCE
The information required in response to this item will be set forth in our definitive proxy statement for the 20212024 annual meeting of stockholders and is incorporated herein by reference.
ITEM 11. EXECUTIVE COMPENSATION
The information required in response to this item will be set forth in our definitive proxy statement for the 20212024 annual meeting of stockholders and is incorporated herein by reference.
ITEM 12. SECURITY OWNERSHIP OF CERTAIN BENEFICIAL OWNERS AND MANAGEMENT AND RELATED STOCKHOLDER MATTERS
The information required in response to this item will be set forth in our definitive proxy statement for the 20212024 annual meeting of stockholders and is incorporated herein by reference.
ITEM 13. CERTAIN RELATIONSHIPS AND RELATED TRANSACTIONS, AND DIRECTOR INDEPENDENCE
The information required in response to this item will be set forth in our definitive proxy statement for the 20212024 annual meeting of stockholders and is incorporated herein by reference.
ITEM 14. PRINCIPAL ACCOUNTINGACCOUNTANT FEES AND SERVICES
Our independent registered public accounting firm is KPMG LLP, Dallas, Texas, Auditor Firm ID: 185.
The information required in response to this item will be set forth in our definitive proxy statement for the 20212024 annual meeting of stockholders and is incorporated herein by reference.
PART IV
ITEM 15. EXHIBITS AND FINANCIAL STATEMENTS SCHEDULES
| | | | | | | | |
| | Page |
| (a)(1) | The following financial statements are included in Item 8. Financial Statements and Supplementary Data in this Annual Report: | |
| | |
| | |
| | |
| | |
| | |
| (2) | Financial statement schedules—None | |
| (3) | Exhibits: | |
| | | | | | | | |
Exhibit Number | | Description of Exhibits |
| 2.1 | | | ContributionBusiness Combination Agreement, dated as of July 6, 2016, as amendedMay 19, 2022, by Amendment No. 1 thereto, dated as of July 29, 2016,and among Centennial Resource Development, LLC, NGP Centennial Follow-On LLC, Celero Energy Company, LP,Registrant, Centennial Resource Production, LLC, and New Centennial,Colgate Energy Partners III, LLC, (incorporated by reference to Annex A of the Registrant’s definitive proxy statement filed with the SEC on September 23, 2016). |
2.2 | | | |
2.3 | | | |
| 2.2 | | | Agreement and Plan of Merger, dated as of August 21, 2023, among Permian Resources Corporation, Smits Merger Sub I Inc., Smits Merger Sub II LLC, Permian Resources Operating, LLC, Earthstone Energy, Inc. and Earthstone Energy Holdings, LLC. (incorporated by reference to Exhibit 2.1 to the Company’s Current Report on Form 8-K filed with the SEC on August 21, 2023). |
| 3.1 | | | |
| 3.2 | | | |
| 3.3 | | | |
3.4 | | | |
3.5 | | | |
3.6 | | | |
| 4.1 | | | |
| 4.2 | | | |
4.3 | | | |
4.4 | | | |
4.5 | | | |
4.64.3 | | | |
4.74.4 | | | |
Table of Contents| 4.5 | | | |
| 4.6 | | | |
| 4.7 | | | | | | | | | | | | | 4.8 | | | | | 4.9 | | | | | 4.10 | | | Second Supplemental Indenture (6.875% Senior Notes due 2027), dated as of May 22, 2020, by andSeptember 1, 2022, among CRP,Permian Resources Operating, LLC, the guarantors party thereto and UMB Bank, N.A., as trustee and collateral agentTrustee (incorporated by reference to Exhibit 4.14.4 to the Registrant’s Current Report on Form 8-K, filed with SEC on March 22,2020). | 10.1 | | | | 10.24.11 | | | |
| | | | | | | | | | 4.12 | | | | | 4.13 | | | | | 4.14 | | | | | 4.15 | | | | | 4.16 | | | | | 4.17 | | | | | 4.18 | | | | | 4.19 | | | First Supplemental Indenture (7.75% Senior Notes due 2026), dated as of September 1, 2022, among Centennial Resource Production, LLC, Colgate Energy Partners III, LLC, the guarantors party thereto and Computershare Trust Company, N.A., as Trustee (incorporated by reference to Exhibit 4.1 to the Company’s Current Report on Form 8-K filed with the SEC on September 8, 2022). | | 4.20 | | | | | 4.21 | | | | | 4.22 | | | | | 4.23 | | | First Supplemental Indenture (5.875% Senior Notes due 2029), dated as of September 1, 2022, among Centennial Resource Production, LLC, Colgate Energy Partners III, LLC, the guarantors party thereto and Computershare Trust Company, N.A., as Trustee (incorporated by reference to Exhibit 4.2 to the Company’s Current Report on Form 8-K filed with the SEC on September 8, 2022). | | 4.24 | | | | | 4.25 | | | | | 4.26 | | | | | 4.27 | | | | | 4.28 | | | | | 4.29 | | | | | 4.30 | | | | | 4.31 | | | |
| | | | | | | | | | 10.1 | | | | 10.310.2 | | | Second Amended and Restated Credit Agreement, dated as of May 4, 2018, among Centennial Resource Production, LLC, as borrower, and JPMorgan Chase Bank, N.A., as administrative agent, and the lenders party thereto (incorporated by reference to Exhibit 10.1 to Registrant’s Current Report on Form 8-K filed with the SEC on May 8, 2018). | 10.4 | | | Second Amendment to Second Amended and Restated Credit Agreement, dated as of May 1, 2020, among Centennial Resource Production, LLC, as borrower, Centennial Resource Development, Inc., as parent guarantor, the other guarantors party thereto, JP Morgan Chase Bank, N.A., as administrative agent and the lenders party thereto (incorporated by reference to Exhibit 10.1 to the Registrant’s Current Report on Form 8-K filed with the SEC on May 4, 2020). | 10.5 | | | Third Amendment to Second Amended and Restated Credit Agreement and First Amendment to Second Amended and Restated Pledge and Security Agreement, dated May 1, 2020, among Centennial Resource Production, LLC, as borrower, Centennial Resource Development, Inc., as parent guarantor, the other guarantors party thereto, JP Morgan Chase Bank, N.A., as administrative agent and the lenders party thereto (incorporated by reference to Exhibit 10.2 to the Registrant’s Current Report on Form 8-K filed with the SEC on May 4, 2020). | 10.6 | | | Fourth Amendment to Second Amended and Restated Credit Agreement, dated October 8, 2020, among Centennial Resource Production, LLC, as borrower, Centennial Resource Development, Inc., as parent guarantor, the other guarantors party thereto, JP Morgan Chase Bank, N.A., as administrative agent and the lenders party thereto (incorporated by reference to Exhibit 10.1 to the Registrant’s Current Report on Form 8-K filed with the SEC on October 13, 2020). | 10.7 | | | | 10.8 | | | | 10.910.3 | | | | 10.10 10.4# | | | | 10.11# | | | 10.12# | | | 10.13#10.5# | | | 10.14#10.6# | | | 10.15#10.7#* | | | | 10.8# | | | 10.16# | | | 10.17#10.9 | | | | 10.18# | | |
| | | | | | | | | 10.19# | | | 10.20# | | | 10.21#
| | | 10.22#10.10# | | | 21.110.11 | | | | | 10.12 | | | | | 10.13 | | | | | 10.14# | | | | 10.15# | | | | 10.16# | | | | 10.17 | | | | | 10.18 | | | | | 10.19 | | |
| | 10.20 | | | | | 10.21 | | | | | 10.22* | | | | 10.23#* | | | | 10.24 | | | | | 10.25 | | | Voting and Support Agreement, dated August 21, 2023, by and among Permian Resources Corporation, Earthstone Energy, Inc., NGP XI US Holdings, L.P., NGP Pearl Holdings II, LLC and Luxe Energy, LLC (incorporated by reference to Exhibit 10.2 to the Company’s Current Report on Form 8-K filed with the SEC on August 21, 2023). |
| | | | | | | | | | 10.26 | | | Voting and Support Agreement, dated August 21, 2023, by and among Permian Resources Corporation, Earthstone Energy, Inc. and Pearl Energy Investments, L.P., Pearl Energy Investments II, L.P. and Pearl CIII Holdings, L.P. (incorporated by reference to Exhibit 10.3 to the Company’s Current Report on Form 8-K filed with the SEC on August 21, 2023). | | 10.27 | | | Voting and Support Agreement, dated August 21, 2023, by and among Permian Resources Corporation, Earthstone Energy, Inc. and Riverstone VI Centennial QB Holdings, L.P., REL US Centennial Holdings, LLC, Riverstone Non-ECI USRPI AIV, L.P. and Silver Run Sponsor, LLC. (incorporated by reference to Exhibit 10.4 to the Company’s Current Report on Form 8-K filed with the SEC on August 21, 2023). | | 10.28 | | | Voting and Support Agreement, dated August 21, 2023, by and among Earthstone Energy, Inc., Permian Resources Corporation, EnCap Energy Capital Fund VII, L.P., Bold Energy Holdings, LLC and EnCap Energy Capital Fund XI. L.P. (incorporated by reference to Exhibit 10.5 to the Company’s Current Report on Form 8-K filed with the SEC on August 21, 2023). | | 10.29 | | | | | 10.30 | | | | | 21.1* | | | | 23.1* | | | | 23.2* | | | | 31.1* | | | | 31.2* | | | | 31.3* | | | | 32.1* | | | | 32.2* | | | | 99.1 | | | | | 99.2 | | | | | 99.3* | | | | 99.4* | | | | 101.INS* | | Inline XBRL Instance Document - The instance document does not appear in the Interactive Data File because its XBRL tags are embedded within the Inline XBRL document. | | 101.SCH* | | Inline XBRL Taxonomy Extension Schema Document. | | 101.CAL* | | Inline XBRL Taxonomy Extension Calculation Linkbase Document. | | 101.DEF* | | Inline XBRL Taxonomy Extension Definition Linkbase Document. | | 101.LAB* | | Inline XBRL Taxonomy Extension Label Linkbase Document. | | 101.PRE* | | Inline XBRL Taxonomy Extension Presentation Linkbase Document. |
* Filed herewith. # Management contract or compensatory plan or agreement. ITEM 16. FORM 10-K SUMMARY None.
SIGNATURES Pursuant to the requirements of the Securities Exchange Act of 1934, the registrant has duly caused this report to be signed on its behalf by the undersigned thereto duly authorized. | | | | | | | | | | CENTENNIAL RESOURCE DEVELOPMENT, INC.PERMIAN RESOURCES CORPORATION | | | | | By: | /s/ GEORGE S. GLYPHISGUY M. OLIPHINT | | | George S. Glyphis
Guy M. Oliphint
Executive Vice President and Chief Financial Officer and Assistant Secretary |
Pursuant to the requirements of the Securities Act of 1934, this registration statement has been signed by the following persons in the capacities and on the dates indicated.
| | | | | | | | | | | | | | | | Signature | | Title | | Date | | | | | | /s/ SEAN R. SMITHWILLIAM M. HICKEY, III | | | | | Sean R. SmithWilliam M. Hickey, III | | ChiefCo-Chief Executive Officer and Director (Principal Executive Officer) | | February 24, 202129, 2024 | | | | | | /s/ GEORGE S. GLYPHISJAMES H. WALTER | | | | | | James H. Walter | | Co-Chief Executive Officer and Director (Principal Executive Officer) | | February 29, 2024 | | | | | | George S. Glyphis/s/ GUY M. OLIPHINT | | | | | | Guy M. Oliphint | | Executive Vice President and Chief Financial Officer and Assistant Secretary (Principal Financial Officer) | | February 24, 202129, 2024 | | | | | | | /s/ BRENT P. JENSEN | | | | | | Brent P. Jensen | | Senior Vice President and Chief Accounting Officer (Principal Accounting Officer) | | February 24, 202129, 2024 | | | | | | /s/ STEVEN J. SHAPIROD. GRAY | | | | | Steven J. ShapiroD. Gray | | Chairman | | February 24, 202129, 2024 | | | | | | | /s/ ROBERT J. ANDERSON | | | | | | Robert J. Anderson | | Director | | February 29, 2024 | | | | | | | /s/ MAIRE A. BALDWIN | | | | | | Maire A. Baldwin | | Director | | February 24, 202129, 2024 | | | | | | | /s/ FROST W. COCHRAN | | | | | | Frost W. Cochran | | Director | | February 29, 2024 | | | | | | /s/ KARLKARAN E. BANDTELEVES | | | | | KarlKaran E. BandtelEves | | Director | | February 24, 202129, 2024 | | | | | | /s/ MATTHEW G. HYDEARON MARQUEZ | | | | | Matthew G. HydeAron Marquez | | Director | | February 24, 202129, 2024 | | | | | | /s/ PIERRE F. LAPEYRE, JR.WILLIAM J. QUINN | | | | | Pierre F. Lapeyre, Jr.William J. Quinn | | Director | | February 24, 202129, 2024 | | | | | | /s/ DAVID M. LEUSCHEN | | | | | David M. Leuschen | | Director | | February 24, 2021 | | | | | | | /s/ JEFFREY H. TEPPER | | | | | | Jeffrey H. Tepper | | Director | | February 24, 202129, 2024 | | | | | | | /s/ ROBERT M. TICHIO | | | | | | Robert M. Tichio | | Director | | February 24, 202129, 2024 |
|