UNITED STATES
SECURITIES AND EXCHANGE COMMISSION
WASHINGTON, D.C. 20549
FORM 10-K
|
| |
| x | ANNUAL REPORT PURSUANT TO SECTION 13 OR 15(d) OF THE SECURITIES EXCHANGE ACT OF 1934 |
For the fiscal year ended September 30, 20172018
or
|
| |
| o | TRANSITION REPORT PURSUANT TO SECTION 13 OR 15(d) OF THE SECURITIES EXCHANGE ACT OF 1934 |
Commission file number 001-37793
_________________________________________
Atkore International Group Inc.
(Exact name of registrant as specified in its charter)
|
| | |
| Delaware | | 90-0631463 |
| (State or other jurisdiction of incorporation or organization) | | (IRS Employer Identification No.) |
| | | |
| 16100 South Lathrop Avenue, Harvey, Illinois 60426 |
| (Address of principal executive offices) (Zip Code) |
| 708-339-1610 |
| (Registrant's telephone number, including area code) |
|
| | |
| Securities registered pursuant to Section 12 (b) of the Act: | | |
| Common stock, par value $0.01 per share | | New York Stock Exchange |
| (Title of Each Class) | | (Name of Each Exchange on which Registered) |
| Securities registered pursuant to Section 12 (g) of the Act: | | |
| | None | |
| (Title of class) |
Indicate by check mark if the registrant is a well-known seasoned issuer, as defined in Rule 405 of the Securities Act. Yes ☐☒ No ☒ ☐
Indicate by check mark if the registrant is not required to file reports pursuant to Section 13 or Section 15(d) of the Act. Yes ☐ No ☒
Indicate by check mark whether the registrant (1) has filed all reports required to be filed by Section 13 or 15(d) of the Securities Exchange Act of 1934 during the preceding 12 months (or for such shorter period that the registrant was required to file such reports), and (2) has been subject to such filing requirements for the past 90 days. Yes ☒ No ☐
Indicate by check mark whether the registrant has submitted electronically and posted on its corporate Web site, if any, every Interactive Data File required to be submitted and posted pursuant to Rule 405 of Regulation S-T during the preceding 12 months (or for such shorter period that the registrant was required to submit and post such files). Yes ☒ No ☐
Indicate by check mark if disclosure of delinquent filers pursuant to Item 405 of Regulation S-K is not contained herein, and will not be contained, to the best of the registrant's knowledge, in definitive proxy or information statements incorporated by reference in Part III of this Form 10-K or any amendment to this Form 10-K.☒
Indicate by check mark whether the registrant is a large accelerated filer, an accelerated filer, a non-accelerated filer, or a smaller reporting company. See definitions of "large accelerated filer," "accelerated filer," and "smaller reporting company" in Rule 12b-2 of the Exchange Act.
|
| | | | |
| Large accelerated filer ☒ | | Accelerated filer ☐ | | Smaller reporting company ☐ |
| Non-accelerated filer ☐ | | (Do not check if a smaller reporting company) | | Emerging growth company ☐ |
| If an emerging growth company, indicate by check mark if the registrant has elected not to use the extended transition period for complying with any new or revised financial accounting standards provided pursuant to Section 7(a)(2)(B) of the Securities Act . ☐ |
Indicate by check mark whether the registrant is a shell company (as defined in Rule 12b-2 of the Exchange Act). Yes ☐ No ☒
The aggregate market value of the voting and non-voting common equity of Atkore International Group Inc. held by non-affiliates as of the close of business inas of March 31, 201730, 2018 was $854.5$772.1 million.
The number of shares of the registrant's common stock outstanding as of November 17, 2017: 63,090,61918, 2018 was 47,079,645 shares of common stock, par value $0.01 per share.
Documents incorporated by reference:
Portions of the registrant's proxy statement to be filed with the United States Securities and Exchange Commission in connection with the registrant's 20182019 annual meeting of stockholders (the "Proxy Statement") are incorporated by reference into Part III hereof. Such Proxy Statement will be filed within 120 days of the registrant's fiscal year ended September 30, 2017.2018.
Table of Contents
|
| | |
| | | Page No. |
| | | |
| PART I | | |
| Item 1. | Business | |
| Item 1A. | Risk Factors | |
| Item 1B. | Unresolved Staff Comments | |
| Item 2. | Properties | |
| Item 3. | Legal Proceedings | |
| Item 4. | Mine Safety Disclosures | |
| PART II | | |
| Item 5. | Market for Registrant's Common Equity, Related Stockholder Matters, and Issuer Purchases of Equity Securities | |
| Item 6. | Selected Financial Data | |
| Item 7. | Management's Discussion and Analysis of Financial Condition and Results of Operations | |
| Item 7A. | Quantitative and Qualitative Disclosures about Market Risk | |
| Item 8. | Financial Statements and Supplementary Data | |
| Item 9. | Changes in and Disagreements with Accountants on Accounting and Financial Disclosure | |
| Item 9A. | Controls and Procedures | |
| Item 9B. | Other Information | |
| PART III | | |
| Item 10. | Directors, Executive Officers and Corporate Governance | |
| Item 11. | Executive Compensation | |
| Item 12. | Security Ownership of Certain Beneficial Owners and Management and Related Stockholder Matters | |
| Item 13. | Certain Relationships and Related Transactions, and Director Independence | |
| Item 14. | Principal Accounting Fees and Services | |
| PART IV | | |
| Item 15. | Exhibits and Financial Statement Schedules | |
| Item 16. | Form 10-K Summary | |
| | SignaturesExhibit Index | |
| | Exhibit IndexSignatures | |
PART I
Item 1. Business
The following discussion of our business contains "forward-looking statements," as discussed in Part II, Item 7, ''Management's Discussion and Analysis of Financial Condition and Results of Operations'' below. Our business, operations and financial condition are subject to various risks as set forth in Part I, Item 1A, ''Risk Factors'' below. The following information should be read in conjunction with Management's Discussion and Analysis of Financial Condition and Results of Operations, the Financial Statements and Supplementary Data and related notes and the Risk Factors included elsewhere in this Annual Report on Form 10-K.
Company Overview
Atkore International Group Inc. (collectively with all its subsidiaries referred to in this Annual Report on Form 10-K as "Atkore," the "Company," "we," "us" and "our") was incorporated in the State of Delaware on November 4, 2010. Atkore is the sole stockholder of Atkore International Holdings Inc. ("AIH"), which in turn is the sole stockholder of Atkore International, Inc. ("AII").
We are a leading manufacturer of Electrical Raceway products primarily for the non-residential construction and renovation markets and Mechanical Products and Solutions ("MP&S") for the construction and industrial markets. Electrical Raceway products form the critical infrastructure that enables the deployment, isolation and protection of a structure's electrical circuitry from the original power source to the final outlet. MP&S frame, support and secure component parts in a broad range of structures, equipment and systems in electrical, industrial and construction applications. We believe we hold #1 or #2 positions in the United States by net sales in the vast majority of our products. The quality of our products, the strength of our brands and our scale and national presence provide what we believe to be a unique set of competitive advantages that position us for profitable growth.
On June 9, 2016, the Company's Registration Statement on Form S-1 relating to an initial public offering ("IPO") of our common stock was declared effective by the SEC and on June 15, 2016, we completed the IPO at a price to the public of $16.00 per share. In connection with the IPO, CD&R Allied Holdings, L.P. (the "CD&R Investor"), an affiliate of Clayton, Dubilier & Rice, LLC ("CD&R") sold an aggregate of 12,000,000 shares of our common stock. The CD&R Investor received all of the net proceeds and bore all commissions and discounts from the sale of our common stock. We did not receive any proceeds from the IPO.
In a series of secondary offerings of our common stock during fiscal 2017, the CD&R Investor reduced its remaining ownership in our company to approximately 48% as of September 30, 2017. In August 2017, the Company announced that its board of directors had approved a share repurchase program for the repurchase of up to an aggregate amount of $75 million of the Company’s common stock. AsIn January 2018, the Company announced a stock repurchase transaction whereby the Company agreed to repurchase from the CD&R Investor, a related party, approximately 17.2 million shares of the Company's common stock, par value $0.01 per share, at a per share price equal to $21.77, for a total purchase price of $375 million, subject to the terms and conditions set forth in the stock purchase agreement. Following the stock repurchase program progresses,transaction in January 2018 and secondary offerings of the Company's common stock in February 2018 and May 2018, the CD&R Investor's ownership percentage will gradually increase.Investor completed its exit from its investment in the Company, and, as of September 30, 2018, no longer owned any of the Company's common stock. See Item 5, ''Market for Registrant's Common Equity, Related Stockholder Matters, and Issuer Purchases of Equity Securities'' for additional information.
Our products
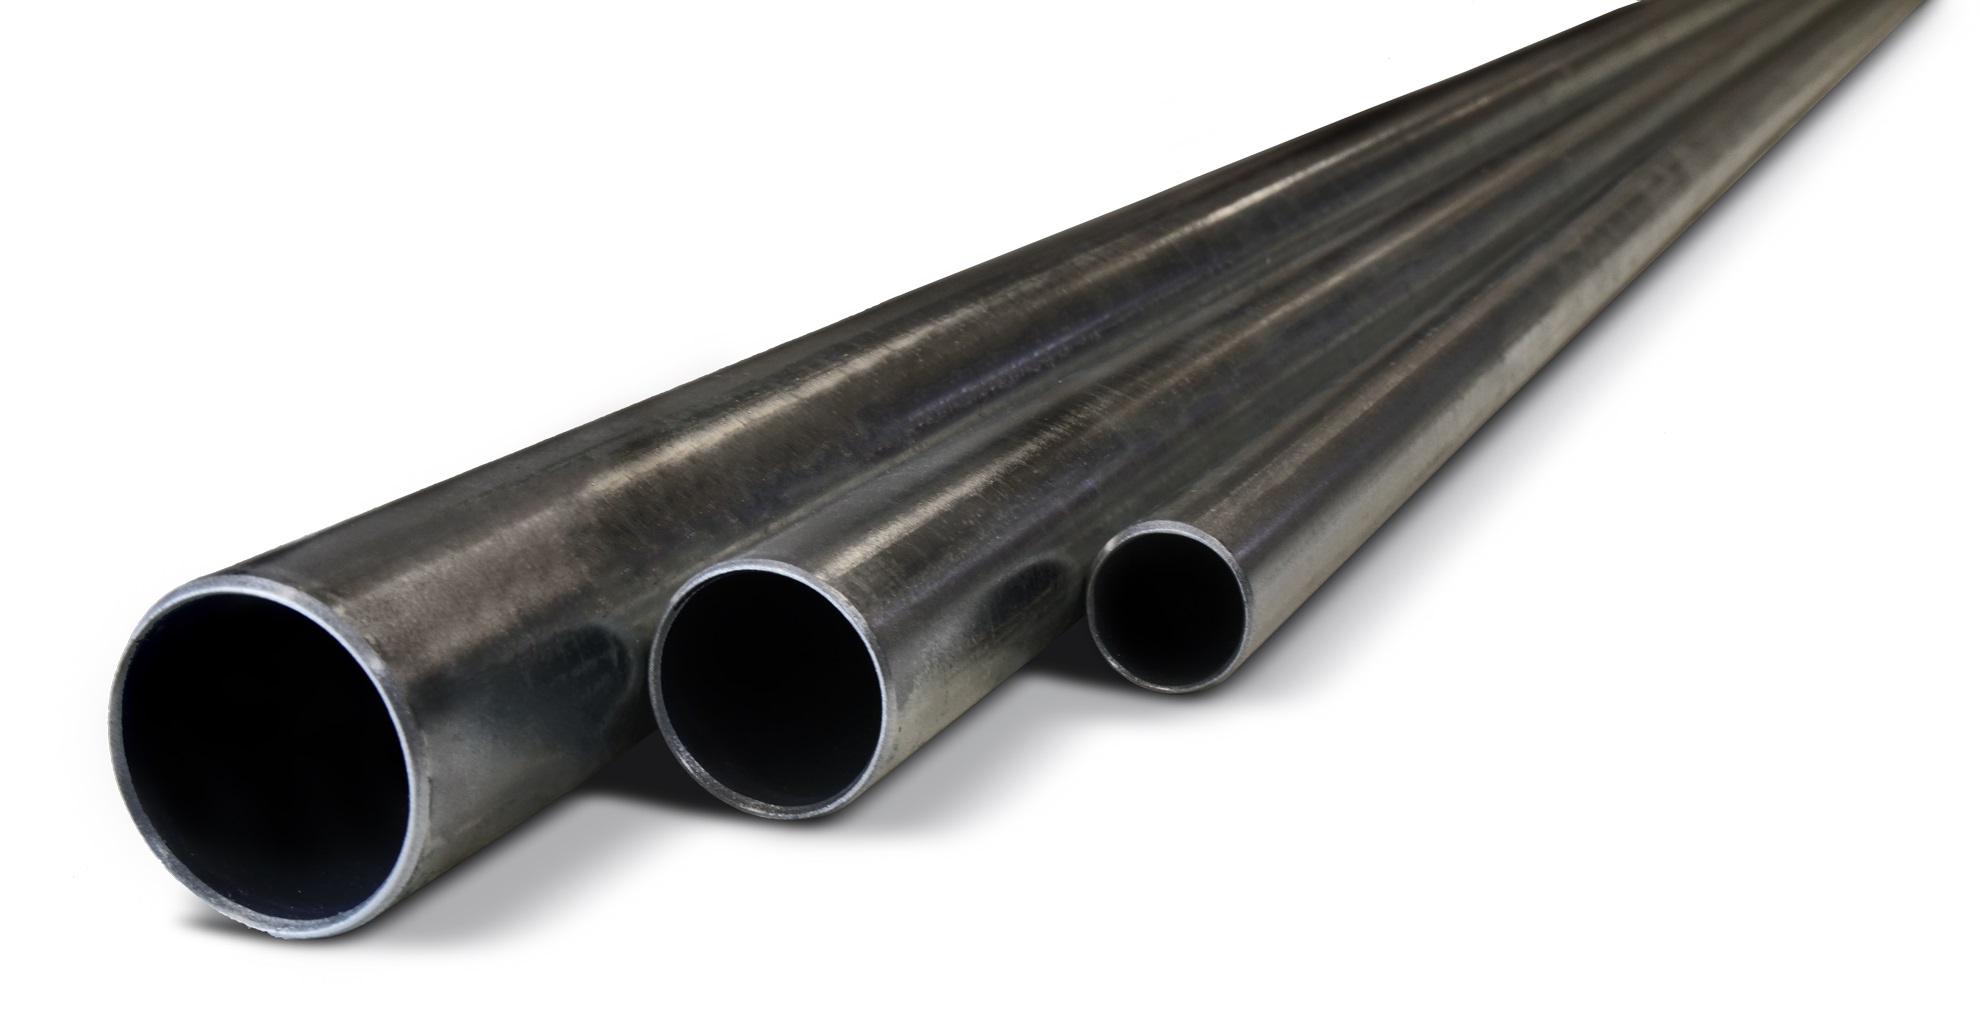
Our principal Electrical Raceway products include electrical conduit and fittings, armored cable and fittings, cable trays and mounting systems and fittings, which are critical components of the electrical infrastructure for new construction and maintenance, repair and remodel ("MR&R") markets. Our MP&S principal products are metal framing and in-line galvanized mechanical tube. Our metal framing products are used in the installation of electrical systems and various support structures. In total, we operate 30 manufacturing facilities and 3128 distribution facilities that enable us to efficiently receive materials from our suppliers and deliver products to our customers. In fiscal 2017, 91%2018, 90% of our net sales were to customers located in the United States. In fiscal 2017, we expanded our global footprint in Europe, Middle East and Africa ("EMEA") and Asia Pacific ("APAC") with two acquisitions in the Electrical Raceway space, broadening the Electrical Raceway offerings in these regions beyond what had been previously offered by us.
An overview of our product offerings is provided below:
|
| | | | | | | | |
| | Product Category | | Sample Products | | Brands | | Sample Product Images |
| Electrical Raceway | Metal Electrical Conduit and Fittings | | Metal Conduit: | | | | |
| | • | Electrical Metallic Tubing (EMT) | | | |
|
| | • | Intermediate Metal Conduit (IMC) | | |
| | • | Galvanized Rigid Conduit (GRC) | | | |
| | Metal Conduit Fittings: | | |
| | • | Elbows | | | | |
| | • | Couplings | | |
| | • | Nipples | | |
| | • | Conduit Bodies | | |
| PVC Electrical Conduit & Fittings | | | | | | | |
| | PVC Conduit: | | | | |
| | • | Rigid Non-Metallic Conduit (RNC) | | | | |
| | PVC Conduit Fittings: | | | |
| | • | Elbows | | | |
| | • | Couplings | | | |
| | • | Conduit Bodies | | |
| | • | Duct spacers | | | |
| | | | | | | |
| Corrosion Resistant Conduit | | • | Stainless conduit | | | | |
| | • | PVC coated conduit | | | |
| • | Aluminum conduit | | | |
| | | | | | | |
| Flexible Electrical Conduit and Fittings | | Flexible Electrical Conduit: | | | | |
| | • | Flexible Metallic Conduit (FMC) | | | | |
| | • | Liquidtight Flexible Metal Conduit (LFMC) | | |
| | • | Liquidtight Flexible Non-Metallic Conduit (LNFC) | | | |
| | • | Flexible Metallic Tubing (FMT) | | |
| | Flexible Electrical Conduit Fittings: | | | |
| | • | Cord Connectors | | | |
| | • | Angle Connectors | | | |
| | | | | | | |
| Armored Cable and Fittings | | | | | | | |
| | Armored Cable: | | | | |
| | • | Metal Clad Cable (MC) | | | | |
| | • | Armor Clad Cable (AC) | | | |
| | • | Healthcare Facility Cable (HFC) | | |
| | Armored Cable Fittings: | | | |
| | • | Connectors | | |
| | • | Service Entry Fittings | | | |
| | | | | | | |
| Cable Tray & Cable Ladders | | | | | | | |
| | • | Ladder Cable Tray | | | | |
| | • | Hat Cable Tray | | | |
| | • | Channel Cable Tray | | |
| | • | I Beam Cable Tray | | | |
| | • | Wire Basket Cable Tray | | | |
| | | | | | | |
|
| | | | | | | | |
| | Product Category | | Sample Products | | Brands | | Sample Product Images |
| MP&S | Metal Framing & Fittings | | | | | | | |
| | • | Channel | | | | |
| | • | Channel Fittings | | |
| | • | Pipe Clamps/Hangers | | | |
| | • | Concrete Inserts | | | | |
| | | | | | | |
| Construction Services | | | | | | | |
| | • | Design, Fabrication and Installation Services | | | | |
| | • | Modular support structures | | |
| | • | Fall protection | | | |
| | | | | | | |
| Mechanical Pipe | | | | | | | |
| | • | In-line galvanized mechanical tube | | | | |
| | • | Non-galvanized tube | | |
| | • | Fabrication services | | | |
| | | | | | | |
Flexible Sprinkler Drops | | | | | | | |
| • | Commercial | | | | |
| • | Industrial/Duct | | | | |
| • | Cleanroom | | |
| • | Institutional | | |
| • | Cold Storage | | | | |
| | | | | | |
| Barbed Tape | | | | | | | |
| | • | Security Confinement | | | | |
| | • | Power Station | | |
| | • | Military/Border | | |
| | • | Law Enforcement | | | | |
Marketing
Our products are primarily marketed by commissioned agents and sold directly to electrical and industrial distributors who resell our products under recognized brand names, including Allied Tube & Conduit, AFC Cable Systems, Heritage Plastics, Unistrut, Power-Strut, Cope and Calpipe as well as certain other sub-brands that are used regionally or in niche markets. Our commissioned agents are selected, trained and managed by our regional sales teams and supported by product managers who ensure that agents are adequately knowledgeable and sufficiently trained to represent our brands to our distribution customers. We stimulate end-user demand by promoting our products and solutions directly to architects, electrical engineers, electrical contractors and electrical code authorities across the United States. We also work directly with electrical contractors, who install Electrical Raceway products on new construction or renovation projects to assist them in selecting the most effective electrical raceway solution. In certain of the markets we serve, we market directly to electrical and industrial distributors, original equipment manufacturers ("OEMs") and governmental entities.
Distribution
We primarily sell and distribute our products through electrical, industrial and specialty distributors and OEMs. For many of the over 13,000 electrical-distributor branches in the United States, our products are must-stock lines that form a staple of their business. We serve a diverse group of end markets, including new construction, MR&R and infrastructure, diversified industrials, alternative power generation, healthcare, data centers and government. End-users, which are typically electrical, industrial and mechanical contractors as well as OEMs, install our products during non-residential, residential and infrastructure construction and renovation projects or in assembly and manufacturing processes.
Distribution-based sales accounted for approximately 84%86% of our net sales for fiscal 2017.2018. We distribute our products to electrical and industrial distributors from our manufacturing and distribution facilities as well as from over 50 dedicated distribution facilities operated by our agents. Our products are also stocked by electrical and industrial distributors who are located in major cities and towns across the United States. Some of our products are purchased by OEMs and used as part of their products and solutions in applications such as utility solar framing, conveyor systems and fabric cover buildings. OEM sales accounted for approximately 16%14% of our net sales for fiscal 2017.2018.
Our distribution footprint is concentrated in North America (the United States and Canada), with additional facilities in Australia, China, New Zealand and the United Kingdom.
Products are generally delivered to the dedicated distribution centers from our facilities and then subsequently delivered to the customer. In some instances, a product is delivered directly from our manufacturing facility to a customer or end-user. In many cases, our products are bundled and co-loaded when shipped. We contract with a wide range of transport providers to deliver our products, primarily via semi-tractor trailer.
Customers
Our sales and marketing processes are primarily focused on serving our immediate customers, including electrical, industrial and specialty distributors and OEMs. We believe customers view us as offering a strong value proposition based on our broad product offering, strong brands, short order cycle times, reliability and consistent product quality. For each of fiscal 2018, 2017 and 2016, approximately 90%, 91% and 2015, approximately 91%, 92% and 93%, respectively, of our net sales were sold to customers located in the United States. Our net sales by geographic area were as follows:
| | | | Fiscal Year Ended | Fiscal Year Ended |
| (in millions) | September 30, 2017 | | September 30, 2016 | | September 25, 2015 | September 30, 2018 | | September 30, 2017 | | September 30, 2016 |
| United States | $ | 1,368 |
| | $ | 1,396 |
| | $ | 1,605 |
| $ | 1,652 |
| | $ | 1,368 |
| | $ | 1,396 |
|
| International | 136 |
| | 127 |
| | 124 |
| 183 |
| | 136 |
| | 127 |
|
| Total | $ | 1,504 |
| | $ | 1,523 |
| | $ | 1,729 |
| $ | 1,835 |
| | $ | 1,504 |
| | $ | 1,523 |
|
In fiscal 2017,2018, our top ten customers accounted for approximately 32%33% of net sales. No single customer, even after consolidating all branches of such customer, which often make independent purchasing decisions, accounted for more than 10% of our net sales in each of fiscal 2018, 2017 2016 and 2015.or 2016. Our customers include global electrical distributors (such as Consolidated Electrical Distributors, Inc., Graybar Electric Company, Rexel, Sonepar S.A. and Wesco International, Inc.), independent electrical distributors including super-regional electrical distributors (such as U.S. Electrical Services Inc., Crescent Electric Supply Co. and United Electric Supply Company, Inc.) and members of buying groups (such as Affiliated Distributors, Inc. and IMARK Group, Inc.) as well as industrial distributors and big-box retailers (such as The Home Depot, Inc., Fastenal Company, HD Supply Holdings, Inc., McMaster-Carr Supply Co., Menard, Inc. and W.W. Grainger, Inc.).
Suppliers and Raw Materials
We use a variety of raw materials in the manufacture of our products. Our primary raw materials are steel, copper and polyvinyl chloride ("PVC") resin. We believe that sources for these raw materials are well-established, generally available on world markets and are in sufficient quantity that we may avoid disruption to our business if we encountered an interruption from one of our existing suppliers. Our primary suppliers of steel are ArcelorMittal, AK Steel and Nucor; our primary suppliers of copper are AmRod and Freeport McMoran; and our primary suppliers of PVC resin are Axiall,Westlake, Formosa and Oxy Vinyls. We strive to maintain strong relationships with our suppliers.
Seasonality
In a typical year, our operating results are impacted by seasonality. Weather can impact the ability to pursue non-residential construction projects at any time of year in any geography, but historically, our slowest quarters have been the first and second fiscal quarters of each fiscal year when frozen ground and cold temperatures in many parts of the country can impede the start and pursuit of construction projects. Sales of our products have historically been higher in the third and fourth quarters of each fiscal year due to favorable weather and longer daylight conditions during these periods. Seasonal variations in operating results may also be significantly impacted by inclement weather conditions, such as cold or wet weather, which can delay construction projects as well as by adverse economic conditions.
Manufacturing
We currently manufacture products in 30 facilities and operate a total footprint of approximately five5 million square feet of manufacturing and distribution space in six countries. Our headquarters are located in Harvey, Illinois, which is also the location of our largest manufacturing facility. Similar to our distribution footprint, our manufacturing footprint is currently concentrated in the United States, with additional facilities in Australia, China, New Zealand and the United Kingdom.
With respect to our tube and conduit products, we believe we are a technology leader in the in-line galvanizing manufacturing process and have developed specialized equipment that enables us to produce a variety of low-cost high-quality galvanized tube products. Our subsidiary, Allied Tube & Conduit Corporation, or "Allied Tube," developed an in-line galvanizing technique (Flo-Coat) in which zinc is applied in a continuous process when the tube and pipe are formed. The Flo-CoatFlo-
Coat galvanizing process provides superior zinc coverage of fabricated metal products for rust prevention and lower cost manufacturing than traditional hot-dip galvanization.
Competition
The industries in which we operate are highly competitive. Our principal competitors range from national manufacturers to smaller regional manufacturers and differ by each of our product lines. We also face competition from manufacturers in Canada, Mexico and several other international markets, depending on the particular product. We believe our customers purchase from us because we provide value through the quality of our products and the timeliness of our delivery. Competition is generally on the basis of product offering, product innovation, quality, service and price.
There are many competitors in each of our segments. The main competitors in each of these segments are listed below:
Electrical Raceway: ABB Ltd., Eaton Corporation plc, PentairnVent Electric plc, and Hubbell Incorporated, Zekelman Industries, Inc., Republic Conduit, Inc., Southwire Company, LLC, and Encore Wire Corporation plc
Mechanical Products & Solutions:
Metal Framing: B-Line (part of Eaton Corporation plc), Thomas & Betts (part of ABB Ltd.) and Haydon Corporation
Mechanical Tube: Wheatland Tube and Western Tube & ConduitZekelman Industries, Inc.
Intellectual Property
Patents and other proprietary rights can be important to our business. We also rely on trade secrets, manufacturing know-how, continuing technological innovations, and licensing opportunities to maintain and improve our competitive position. We periodically review third-party proprietary rights, including patents and patent applications, in an effort to avoid infringement of third-party proprietary rights, identify licensing opportunities and monitor the intellectual property claims of others.
We own a portfolio of patents and trademarks andtrademarks. Other than licenses to commercially available third-party software, we do not believe that any of our licenses to third-party intellectual property are alsomaterial to our business taken as a licensee of certain patents and a licensor of other patents.whole. Patents for individual products extend for varying periods according to the date of patent filing or grant and the legal term of patents in the various countries where patent protection is obtained. We rely on both trademark registration and common law protection for trademarks. Trademark rights may potentially extend indefinitely and are dependent upon national laws and use of the trademarks.
While we consider our patents and trademarks to be valued assets, we do not believe that our competitive position is dependent on patent or trademark protection or that our operations are dependent upon any single patent or group of related patents. We nevertheless face intellectual property-related risks. For more information on these risks, see Item 1A, "Risk Factors—Risks Related to Our Business—We may not be able to adequately protect our intellectual property rights in foreign countries, and we may become involved in intellectual property disputes." Other than licenses to commercially available third-party software, we do not believe that any of our licenses to third-party intellectual property are material to our business taken as a whole.
Management of Information Technology Systems
Historically, information technology has not been a significant differentiator for us in our markets, however, we believe that ease of doing business with us will become increasingly important to our growth. Currently, we operate our business using widely commercially available hardware and software products with well-developed support services. In addition to these widely available IT products, we developed a new application for our agents which we believe will improve the overall order entry process. Additionally, during fiscal 2016, we invested more than $6.0 million and installed and implemented a new general ledger and financial reporting system for the entire Company replacing a number of systems used in various parts of the Company. We have also chosen to migrate our email service and various other information technology services to a cloud computing platform hosted by Microsoft. During fiscal 2017, we launched an 18-month $10.0 million project that establishes an integrated system for order management, advanced warehouse management, finished goods inventory management and accounts receivable. We invested more than $10.0 million to date for this project, which went live in the fourth quarter of fiscal 2018.
Employees
As of September 30, 2017,2018, we employed approximately 3,500 total full-time equivalent employees of whom approximately 12%13% are temporary or contract workers. Our employees are primarily located in the United States, with about 15%14% employed at our international locations in Australia, Canada, China, New Zealand and the United Kingdom.
As of September 30, 2017,2018, approximately 40%26% of our employees globally were represented by a union under a collective bargaining agreement. All unions are either located in the United States or Canada with no unions or Worker's Councils at any of our other locations abroad.
From time to time our collective bargaining agreements expire and come up for re-negotiation. Our collective bargaining agreement in Harvey, Illinois expired in April 2017. During fiscal 2017, the Company and the United Steelworkers Union reached agreement on the terms of a new collective bargaining agreement which expires in April 2020. Ourfor our New Bedford Massachusetts facility hasexpired in February 2018, and we successfully negotiated a contractnew agreement which now expires in February 2018. The2023. Our Harvey, SMPF contractIllinois Special Metal Processing Facility agreement with the United Steelworkers Union, is set to expire ininvolving a bargaining unit of 12 employees, expired on November 2018, and our Wayne, Michigan11, 2018. We anticipate that the new collective bargaining agreement will be ratified by the union members within calendar 2018. Our Harvey Illinois collective bargaining agreement with the Iron Workers Union is set toUnited Steelworkers, involving nearly 400 represented employees, does not expire in Januaryuntil April 2020. We believe our relationship with our employees is good.
Regulatory Matters
Our facilities are subject to various federal, state, local and non-U.S. requirements relating to the protection of human health, safety and the environment. Among other things, these laws govern the use, storage, treatment, transportation, disposal and management of hazardous substances and wastes; regulate emissions or discharges of pollutants or other substances into the air, water, or otherwise into the environment; impose liability for the costs of investigating and remediating, and damages resulting from, present and past releases of hazardous substances and protect the health and safety of our employees.
We have incurred, and expect to continue to incur, capital expenditures in addition to ordinary course costs to comply with applicable current and future environmental, health and safety laws, such as those governing air emissions and wastewater discharges. In addition, government agencies could impose conditions or other restrictions in our environmental permits which increase our costs. These laws are subject to change, which can be frequent and material. More stringent federal, state or local environmental rules or regulations could increase our operating costs and expenses.
The cost of compliance with environmental, health and safety laws and capital expenditures required to meet regulatory requirements is not anticipated to have a material effect on our financial condition, results of operations, cash flows or competitive position.
In October 2013, the State of Illinois filed a complaint against our subsidiary Allied Tube, alleging violations of the Illinois Environmental Protection Act relating to discharges to a storm sewer system that terminates at Allied Tube's Harvey, Illinois manufacturing facility. The State sought an injunction ordering Allied Tube to take immediate corrective action to abate the alleged violations and civil penalties as permitted by applicable law. Allied Tube has reviewed management practices and made improvements to its diesel fuel storage and truck maintenance areas to resolve the State's claims. We have recently entered into a consent order that requiresrequired Allied Tube to pay a nominal penalty, install base low-flow oil and water separation equipment and take certain additional remedial actions to resolve the State's claims. We do not currently expect that any suchremaining obligations would have a material effect on our financial condition, results of operations or cash flows.
In August 2014, we received from the Illinois Environmental Protection Agency, or the "IEPA," the terms of a proposed new stormwater discharge permit for our Harvey, Illinois manufacturing facility. Because the facility did not meet the zinc limit set forth in the proposed permit, the Company was in negotiations with the IEPA to agree upon mutually acceptable discharge limits. During these negotiations, the facility was operating under an extension of the terms of our existing stormwater discharge permit. In October 2016, we received the final permit. A mutually agreed upon compliance plan is part of the permit and we expect to achieve compliance in accordance with a four-year schedule. The compliance plan includes studies to reduce zinc emitted from galvanizing manufacturing operations, implementation of more rigorous management practices, evaluation of the installation of passive/cost effective stormwater treatment and receiving stream studies to determine if a less stringent permit limit will be as protective of the water system as the current permit limit. Given the scope and time frame of the compliance plan, we do not expect that achieving compliance with either the stormwater discharge permit or the plan will have a material effect on our financial condition, results of operations or cash flows.
We received from the City of Phoenix the terms of an industrial wastewater discharge permit renewal that contains more rigorous wastewater discharge limits for our Phoenix, Arizona facility. We do not currently expect that any such obligations would have a material effect on our financial condition, results of operations or cash flows.
We are continually investigating, remediating or addressing contamination at our current and former facilities. For example, we are currently monitoring groundwater contamination at our Wayne, Michigan facility. Future remediation activities may be required to address contamination at or migrating from the Wayne, Michigan site. Many of our current and former facilities have a history of industrial usage for which additional investigation and remediation obligations could arise in the future and which could materially adversely affect our business, financial condition, results of operations or cash flows.
Available Information
We make available free of charge through our website, http://investors.atkore.com/sec-filings, our annual reports on Form 10-K, quarterly reports on Form 10-Q, current reports on Form 8-K, proxy statements, other reports filed under the Securities Exchange Act of 1934 (“Exchange Act”), and all amendments to those reports simultaneously or as soon as reasonably practicable after such material is electronically filed with, or furnished to, the SEC. Our reports are also available free of charge on the SEC’s website, www.sec.gov.
Item 1A. Risk Factors
You should carefully consider the factors described below, in addition to the other information set forth in this Annual Report on Form 10-K. These risk factors are important to understanding the contents of this Annual Report on Form 10-K and of other reports. Our reputation, business, financial position, results of operations and cash flows are subject to various risks. The risks and uncertainties described below are not the only ones relevant to us. Additional risks and uncertainties not currently known to us or that we currently believe are immaterial may also adversely impact our reputation, business, financial position, results of operations and cash flows.
Risks Related to Our Business
Our business is affected by general business and economic conditions, which could materially and adversely affect our business, financial position, results of operations or cash flows.
Demand for our products is affected by a number of general business and economic conditions. A decline in the United States and international markets in which we operate could materially and adversely affect our business, financial position, results of operations or cash flows. Our profit margins, as well as overall demand for our products, could decline as a result of a large number of factors beyond our control, including economic recessions, changes in end-user preferences, consumer confidence, inflation, availability of credit, fluctuation in interest and currency exchange rates and changes in the fiscal or monetary policies of governments in the regions in which we operate.
During the most recent United States economic recession, which began in the second half of 2007 and continued through June of 2009, demand for our products declined significantly. Another economic downturn in any of the markets we serve may result in a reduction of sales and pricing for our products. If the creditworthiness of our customers declines, we could face increased credit risk and some, or many, of our customers may not be able to pay us amounts when they become due. While the United States recession that began in 2007 has ended and there has been growth in the United States construction markets that we serve, there can be no assurance that any improvement will be sustained or continue.
We cannot predict the duration of current economic conditions, or the timing or strength of any future recovery of activities in our markets. Weakness in the markets in which we operate could have a material adverse effect on our business, financial condition, results of operations or cash flows. We may have to close underperforming facilities from time to time as warranted by general economic conditions and/or weakness in the markets in which we operate. In addition to a reduction in demand for our products, these factors may also reduce the price we are able to charge for our products. This, combined with an increase in excess capacity, could negatively impact our business, financial condition, results of operations or cash flows.
The non-residential construction industry accounts for a significant portion of our business, and the United States non-residential construction industry in recent years experienced a significant downturn followed by a slow recovery. Another downturn could materially and adversely affect our business, financial position, results of operations or cash flows.
Our business is largely dependent on the non-residential construction industry. Approximately 39% of our net sales in fiscal 20172018 were directly related to United States new non-residential construction. For new construction, we estimate that our product installation typically lags United States non-residential starts by six to twelve months. The United States non-residential construction industry is cyclical, with product demand based on numerous factors such as availability of credit, interest rates, general economic conditions, consumer confidence and other factors that are beyond our control. United States non-residential construction starts, as reported by Dodge, reached a historic low of 680 million square feet in our fiscal 2010 and increased to 1,0491,151 million square feet in our fiscal 2017,2018, which remains well below historical levels. We expect to capitalize on any further recovery in non-residential construction activity over the coming years and potentially drive higher margins by leveraging the scalability of our operations.
From time to time we have been adversely affected in various parts of the country by declines in non-residential building construction starts due to, among other things, changes in tax laws affecting the real estate industry, high interest rates and the level of non-residential construction activity. Continued uncertainty about current economic conditions will continue to pose a risk to our business, financial position, results of operations and cash flows, as participants in this industry may postpone spending in response to tighter credit, negative financial news and/or declines in income or asset values, which could have a continued material negative effect on the demand for our products.
Congress has enacted new tax legislation that that could materially impact our business.
On December 22, 2017, President Trump signed the Tax Cuts and Jobs Act of 2017 ("TCJA"), which reforms major aspects of the U.S. federal income tax law affecting the Company. Some of the provisions of TCJA have the potential to affect the Company adversely, including but not limited to:
A limitation on the deductibility of U.S. interest expense, although the Company's preliminary analysis shows that interest expense of the Company would have to increase substantially, or the Company's earnings would have to decrease significantly, before the limitation would apply.
A change to the scope of the net income of the Company's foreign subsidiaries that may be required to be included currently in the Company's U.S. taxable income
A change to the manner in which foreign income taxes are credited by the Company.
A repeal of a deduction related to domestic production activities.
An expansion to the limitation on the deductibility of certain employee compensation.
A tax imposed on certain payments to related foreign persons.
The above list is not comprehensive and represents the Company's current views on the potential impacts of the TCJA; however these views are subject to change as additional guidance becomes available and further analysis is completed. Elements of the tax reform may be substantially revised through the legislative process, or may never be implemented. To the extent that such changes, if any, have a negative effect on us or the industries we serve, including as a result of related uncertainty, these changes may materially and adversely affect our business, financial condition, results of operations and cash flows.
The raw materials on which we depend in our production process may be subject to price increases which we may not be able to pass through to our customers, or to price decreases which may decrease the price levels of our products. As a result, such price fluctuations could materially and adversely affect our business, financial position, results of operations or cash flows.
Our results of operations are impacted by changes in commodity prices, primarily steel, copper and PVC resin. Historically, we have not engaged in material hedging strategies for raw material purchases. Substantially all of the products we sell (such as steel conduit, tubing and framing, copper wiring in our cables, and PVC conduit) are subject to price fluctuations because they are composed primarily of steel, copper or PVC resin, three industrial commodities that are subject to price volatility. This volatility can significantly affect our gross profit. We also watch the market trends of certain other commodities, such as zinc (used in the galvanization process for a number of our products), electricity, natural gas and diesel fuel, as such commodities can be important to us as they impact our cost of sales, both directly through our plant operations and indirectly through transportation and freight expense.
Although, on an aggregate basis in the current year, we seek to recoverhave successfully recovered increases in raw material prices through price increases in our products, we havemay not always beenbe completely successful.successful in managing market fluctuations in the future. In addition, in periods of declining prices for our raw materials we may face pricing pressure from our customers. We generally sell our products on a spot basis (and not under long-term contracts). Any increase in raw material prices that is not offset by an increase in our prices, or our inability to maintain price levels in an environment of declining raw material prices, could materially and adversely affect our business, financial position, results of operations or cash flows.
We operate in a competitive landscape, and increased competition could materially and adversely affect our business, financial position, results of operations or cash flows.
The principal markets that we serve are highly competitive. Competition is based primarily on product offering, product innovation, quality, service and price. Our principal competitors range from national manufacturers to smaller regional manufacturers and differ by each of our product lines. See Item 1, ''Business—Competition." Some of our competitors may have greater financial and other resources than we do and some may have more established brand names in the markets we serve. The actions of our competitors may encourage us to lower our prices or to offer additional services or enhanced products at a higher cost to us, which could reduce our gross profit, net income or cash flows or may cause us to lose market share. Any of these consequences could materially and adversely affect our business, financial position, results of operations or cash flows.
Our operating results are sensitive to the availability and cost of freight and energy, such as diesel fuel and electricity, which are important in the manufacture and transport of our products.
Our operating costs increase when freight or energy costs rise. During periods of increasing freight and energy costs, we might not be able to fully recover our operating cost increases through price increases without reducing demand for our products. The cost of fuel is largely unpredictable and has fluctuated significantly in recent years, reaching historically high levels at times. Fuel availability, as well as pricing, is also impacted by political and economic factors that are beyond our control.
In addition, we are dependent on third-party freight carriers to transport many of our products. Our access to third-party freight carriers is not guaranteed, and we may be unable to transport our products at economically attractive rates in certain circumstances, particularly in cases of adverse market conditions or disruptions to transportation infrastructure. Similarly, increasing energy costs, in particular, the cost of diesel fuel, could put a strain on the transportation of materials and products if it forces certain transporters to close. Our business, financial position, results of operations or cash flows could be materially and adversely affected if we are unable to pass all of the cost increases on to our customers, if we are unable to obtain the necessary energy supplies or if freight carrier capacity in our geographic markets were to decline significantly or otherwise become unavailable.
Our business, financial position, results of operations or cash flows could be materially and adversely affected by the level of similar product imports into the United States.States, as well as U.S. trade policy and practices.
A substantial portion of our revenue is generated through our operations in the United States. Although we have not been substantially impacted by imports historically, imports of products similar to those manufactured by us may reduce the volume of products sold by domestic producers and depress the selling prices of our products and those of our competitors.
We believe import levels are affected by, among other things, overall worldwide product demand, the trade practices of foreign governments, the cost of freight, the challenges involved in shipping, government subsidies to foreign producers and governmentally imposed trade restrictions, such as quotas, tariffs, and other trade barriers in the United States. Increased imports of products similar to those manufactured by us in the United States could materially and adversely affect our business, financial position, results of operations or cash flows.
We are indirectly subject to regulatory changes that may affect demand for our products.
The market for certain of our products is influenced by federal, state, local and international governmental regulations and trade policies (such as the American Recovery and Reinvestment Act of 2009, Underwriters Laboratories, National Electric Code and American Society of Mechanical Engineers) as well as other policies, including those imposed on the non-residential construction industry (such as the National Electrical Code and corresponding state and local laws based on the National Electrical Code). These regulations and policies are subject to change. In the event that there would be changes in the National Electrical Code and any similar state, local or non-U.S. laws, including changes that would allow for alternative products to be used in the non-residential construction industry or that would render less restrictive or otherwise reduce the current requirements under such laws and regulations, the scope of products that would serve as alternatives to products we produce would increase. As a result, competition in the industries in which we operate could increase, with a potential corresponding decrease in the demand for our products. In addition, in the event that changes in such laws would render current requirements more restrictive, we may be required to change our products or production processes to meet such increased restrictions, which could result in increased costs and cause us to lose market share. Any changes to such regulations, laws and policies could materially and adversely affect our business, financial position, results of operations or cash flows.
Our results of operations could be adversely affected by weather.
Although weather patterns affect our operating results throughout the year, adverse weather historically has reduced construction activity in our first and second fiscal quarters. In contrast, our highest volume of net sales historically has occurred in our third and fourth fiscal quarters.
Most of our businesses experience seasonal variation as a result of the dependence of our customers on suitable weather to engage in construction projects. Generally, during the winter months, construction activity declines due to inclement weather, frozen ground and shorter daylight hours. For example, during the spring of 2014, extremely cold weather significantly reduced the level of construction activities in the United States, thereby impacting our net sales. In addition, to the extent that hurricanes, severe storms, floods, other natural disasters or similar events occur in the geographic regions in which we operate, our results of operations may be adversely affected. We anticipate that fluctuations of our operating results from period to period due to seasonality will continue in the future.
We may need to raise additional capital, and we cannot be sure that additional financing will be available.
To satisfy existing obligations and support the development of our business, we depend on our ability to generate cash flow from operations and to borrow funds and issue securities in the capital markets. We may require additional financing for liquidity, capital requirements or growth initiatives. We may not be able to obtain financing on terms and at interest rates that are favorable to us or at all. Any inability by us to obtain financing in the future could materially and adversely affect our business, financial position, results of operations or cash flows.
The indemnification provisions of acquisition agreements by which we have acquired companies may not fully protect us and as a result we may face unexpected liabilities.
Certain of the acquisition agreements by which we have acquired companies require the former owners to indemnify us against certain liabilities related to the operation of the company before we acquired it. In most of these agreements, however, the liability of the former owners is limited and former owners may be unable to meet their indemnification responsibilities. We cannot assure you that these indemnification provisions will protect us fully or at all, and as a result we may face unexpected liabilities that could adversely affect our financial position, results of operations or cash flows.
We have incurred and continue to incur significant costs to comply with current and future environmental, health and safety laws and regulations, and our operations expose us to the risk of material environmental, health and safety liabilities and obligations.
We are subject to numerous federal, state, local and non-U.S. environmental, health and safety laws governing, among other things, the generation, use, storage, treatment, transportation, disposal and management of hazardous substances and wastes, emissions or discharges of pollutants or other substances into the environment, investigation and remediation of, and damages resulting from, releases of hazardous substances and the health and safety of our employees. We have incurred, and expect to continue to incur, capital expenditures in addition to ordinary course costs to comply with applicable current and future environmental, health and safety laws, such as those governing air emissions and wastewater discharges. In addition, government agencies could impose conditions or other restrictions in our environmental permits which increase our costs. These laws are subject to change, which can be frequent and material. More stringent federal, state or local environmental rules or regulations could increase our operating costs and expenses. Furthermore, our operations are governed by the United States Occupational Safety and Health Administration, or "OSHA." OSHA regulations may change in a way that increases our costs of operations. Our failure to comply with applicable environmental, health and safety laws and permit requirements could result in civil or criminal fines or penalties, enforcement actions, and regulatory or judicial orders enjoining or curtailing operations or requiring corrective measures such as the installation of pollution control equipment, which could materially and adversely affect our business, financial position, results of operations or cash flows.
From time to time, we may be held liable for the costs to address contamination at any real property we have ever owned, operated or used as a disposal site. We are currently, and may in the future be, required to investigate, remediate or otherwise address contamination at our current or former facilities. Many of our current and former facilities have a history of industrial usage for which additional investigation, remediation or other obligations could arise in the future and that could materially and adversely affect our business, financial position, results of operations or cash flows. For example, as we sell, close or otherwise dispose of facilities, we may need to address environmental issues at such sites, including any previously unknown contamination.
We could be subject to third-party claims for property damage, personal injury and nuisance or otherwise as a result of violations of, or liabilities under, environmental, health or safety laws or in connection with releases of hazardous or other materials at any current or former facility. We could also be subject to environmental indemnification or other claims in connection with assets and businesses that we have divested.
In 2007, the United States Supreme Court classified carbon dioxide as an air pollutant under the Clean Air Act in a case seeking to require the United States Environmental Protection Agency to regulate carbon dioxide in vehicle emissions. As issues relating to climate change have become more prevalent, foreign, federal, state and local governments have responded, and are expected to continue to respond, with increased legislation and regulation, including laws aimed at reducing emissions of greenhouse gases. Such legislation and regulation can negatively affect us by, among other things, requiring us to incur costs to upgrade our equipment or to reduce emissions of greenhouse gases from operations.
We cannot assure you that any costs relating to future capital and operating expenditures to maintain compliance with environmental, health and safety laws, as well as costs to address contamination or environmental claims, will not exceed any current estimates or adversely affect our business, financial position, results of operations or cash flows. In addition, any unanticipated liabilities or obligations arising, for example, out of discovery of previously unknown conditions or changes in law or enforcement policies, could materially and adversely affect our business, financial position, results of operations or cash flows.
We rely on a few customers for a significant portion of our net sales, and the loss of those customers could materially and adversely affect our business, financial position, results of operations or cash flows.
Certain of our customers, in particular buying groups representing consortia of independent electrical distributors, national electrical distributors, OEMs, data centers and medical center general contractors are material to our business, financial position, results of operations and cash flows because they account for a significant portion of our net sales. In fiscal 2017,2018, although no single customer accounted for more than 10% of our net sales, our ten largest customers (including buyers and distributors in buying groups) accounted for approximately 32%33% of our net sales. Our percentage of sales to our major customers may increase if we are successful in pursuing our strategy of broadening the range of products we sell to existing customers. In such an event, or in the event of any consolidation in certain segments we serve, including retailers selling building products, our sales may be increasingly sensitive to deterioration in the financial condition of, or other adverse developments with respect to, one or more of our top customers. Our top customers may also be able to exert influences on us with respect to pricing, delivery, payment or other terms.
A significant asset included in our working capital is accounts receivable from customers. As of September 30, 2018, one customer, Sonepar Management US, Inc., represented 11% of the Company's accounts receivable balance due to increased sales in the last 60 days of the year. See Note 19, ''Segment Information'' to the accompanying consolidated financial statements included elsewhere in this Annual Report. If customers responsible for a significant amount of accounts receivable become insolvent or otherwise unable to pay for products and services, or become unwilling or unable to make payments in a timely manner, our business, financial position, results of operations or cash flows could be materially and adversely affected. A significant deterioration in the economy could have an adverse effect on the servicing of these accounts receivable, which could result in longer payment cycles, increased collection costs and defaults in excess of management's expectations. Deterioration in the credit quality of several major customers at the same time could materially and adversely affect our business, financial position, results of operations or cash flows.
In general, we do not have long-term contracts with our customers. As a result, although our customers periodically provide indications of their product needs and purchases, they generally purchase our products on an order-by-order basis, and the relationship, as well as particular orders, can be terminated at any time. The loss or bankruptcy of, or significant decrease in business from, any of our major customers could materially and adversely affect our business, financial position, results of operations or cash flows.
Our working capital requirements could result in us having lower cash available for, among other things, capital expenditures and acquisition financing.
Our working capital needs fluctuate based on economic activity and the market prices for our main raw materials, which are predominantly steel, copper and PVC resin. We require significant working capital to purchase these raw materials and sell our products efficiently and profitably to our customers. We are typically obligated to pay for our raw material purchases within 10 and 30 days of receipt, while we generally collect cash from the sale of manufactured products between 40 and 50 days from the point at which title and risk of loss transfers. If our working capital requirements increase and we are unable to finance our working capital on terms and conditions acceptable to us, we may not be able to obtain raw materials to respond to customer demand, which could result in a loss of sales. Our average working capital days during fiscal 20172018 was 6862 days.
If our working capital needs increase, the amount of liquidity we have at our disposal to devote to other uses will decrease. A decrease in liquidity could, among other things, limit our flexibility, including our ability to make capital expenditures and to complete acquisitions that we have identified, thereby materially and adversely affecting our business, financial condition, results of operations and cash flows.
Work stoppages and other production disruptions may adversely affect our operations and impair our financial performance.
As of September 30, 2017,2018, approximately 40%26% of our United States employees were represented with a collective bargaining agreement by labor unions. A work stoppage or other interruption of production could occur at our facilities as a result of disputes under existing collective bargaining agreements with labor unions or in connection with negotiations of new collective bargaining agreements, as a result of supplier financial distress, or for other reasons. For example, in the third quarter of fiscal 2014, in connection with labor negotiations, we experienced a week-long work stoppage at our Harvey, Illinois facility. In addition, we may encounter supplier constraints, be unable to maintain favorable supplier arrangements and relations or be affected by disruptions in the supply chain. A work stoppage or interruption of production at our facilities, due to labor disputes, shortages of supplies or any other reason could materially and adversely affect our business, financial position, results of operations or cash flows. See Item 1, ''Business—Employees."
If we are unable to hire, engage and retain key personnel, our business, financial position, results of operations or cash flows could be materially and adversely affected.
We are dependent, in part, on our continued ability to hire, engage and retain key employees at our operations around the world. Additionally, we rely upon experienced managerial, marketing and support personnel to effectively manage our business and to successfully promote our wide range of products. If we do not succeed in engaging and retaining key employees and other personnel, or if we do not succeed in facilitating transitions of new key personnel, we may be unable to meet our objectives and, as a result, our business, financial position, results of operations or cash flows could be materially and adversely affected.
We have financial obligations relating to pension plans that we maintain in the United States.
We provide pension benefits through a number of noncontributory and contributory defined benefit retirement plans covering eligible United States employees. As of September 30, 2017,2018, we estimated that our pension plans were underfunded by approximately $25$17 million. The funded status represents five plans, all of which are frozen and do not accrue any additional service cost. As such, the funded status is primarily impacted by the performance of the underlying assets supporting the plan and changes in interest rates or other factors, which may trigger additional cash contributions. Our pension obligation is calculated annually and is based on several assumptions, including then-prevailing conditions, which may change from year to year. If in any year our assumptions are inaccurate, we could be required to expend greater amounts than anticipated.
Unplanned outages at our facilities and other unforeseen disruptions could materially and adversely affect our business, financial position, results of operations or cash flows.
Our business depends on the operation of our manufacturing and distribution facilities. It is possible that we could experience prolonged periods of reduced production or distribution capacity due to interruptions in the operations of our facilities or those of our key suppliers. It is also possible that operations may be disrupted due to other unforeseen circumstances such as power outages, explosions, fires, floods, accidents and severe weather conditions. Availability of raw materials and delivery of products to customers could be affected by logistical disruptions. To the extent that lost production or distribution capacity could not be compensated for at unaffected facilities and depending on the length of the outage, our sales and production costs could be adversely affected.
We rely on the efforts of agents and distributors to generate sales of our products.
We utilize various third-party agents and distributors to market, sell and distribute our products and to directly interface with our customers and end-users by providing customer service and support. No single agent or distributor accounts for a material percentage of our annual net sales. We do not have long-term contracts with our third-party agents and distributors, who could cease offering our products. In addition, many of our third-party agents and distributors with whom we transact business also offer the products of our competitors to our ultimate customers and they could begin offering our products with less prominence. The loss of a substantial number of our third-party agents or distributors or a dramatic deviation from the amount of sales they generate, including due to an increase in their sales of our competitors' products, could reduce our sales and could materially and adversely affect our business, financial position, results of operations or cash flows.
Interruptions in the proper functioning of our information technology, or "IT" systems, including from cybersecurity threats, could disrupt operations and cause unanticipated increases in costs or decreases in revenues, or both.
We use our information systems to, among other things, manage our manufacturing operations, manage inventories and accounts receivable, make purchasing decisions and monitor our results of operations, and process, transmit and store sensitive electronic data, including employee, supplier and customer records. As a result, the proper functioning of our IT systems is critical to the successful operation of our business. Our information systems include proprietary systems developed and maintained by us. In addition, we depend on IT systems of third parties, such as suppliers, retailers and OEMs to, among other things, market and distribute our products, develop new products and services, operate our website, host and manage our services, store data, process transactions, respond to customer inquiries and manage inventory and our supply chain. Although our IT systems are protected through physical and software safeguards and remote processing capabilities exist, our IT systems or those of third parties whom we depend upon are still vulnerable to natural disasters, power losses, unauthorized access, telecommunication failures and other problems. If critical proprietary or third-party IT systems fail or are otherwise unavailable, including as a result of system upgrades and transitions, our ability to process orders, track credit risk, identify business opportunities, maintain proper levels of inventories, collect accounts receivable, pay expenses and otherwise manage our business would be adversely affected.
Cyber incidents can result from deliberate attacks or unintentional events. These incidents can include, but are not limited to, gaining unauthorized access to digital systems for purposes of misappropriating assets or sensitive information, corrupting data, or causing operational disruption. Cybersecurity attacks in particular are becoming more sophisticated and include, but are not limited to, malicious software, attempts to gain unauthorized access to data (either directly or through our vendors) and other electronic security breaches. Despite our security measures, our IT systems and infrastructure or those of our third parties may be vulnerable to such cyber incidents. The result of these incidents could include, but are not limited to, disrupted operations, misstated or misappropriated financial data, theft of our intellectual property or other confidential information (including of our customers, suppliers and employees), liability for stolen assets or information, increased cyber security protection costs and reputational damage adversely affecting customer or investor confidence. In addition, if any information about our customers, including payment information, were the subject of a successful cybersecurity attack against us, we could be subject to litigation or other claims by the affected customers. We have incurred costs and may incur significant additional costs in order to implement the security measures we feel are appropriate to protect our IT systems.
We may be required to recognize goodwill, indefinite-lived intangible assets or other long-lived asset impairment charges.
As of September 30, 2017,2018, we had goodwill of $147.7$170.1 million, intangible assets of $291.9 million, and indefinite-lived intangiblesother long-lived assets of $93.9$214.9 million. Goodwill and indefinite-lived intangible assets are not amortized and are subject to impairment testing at least annually. Future triggering events, such as declines in our cash flow projections or customer demand, may cause impairments of our goodwill or long-lived assets based on factors such as the price of our common stock, projected cash flows, assumptions used, control premiums or other variables.
In addition, if we divest long-lived assets at prices below their asset value, we must write them down to fair value resulting in long-lived asset impairment charges, which could adversely affect our financial position or results of operations. For example, in fiscal 2015 we recorded asset impairments of $27.9 million primarily related to our announced Fence and Sprinkler exit. See Note 13, ''Goodwill and Intangible Assets'' to the accompanying consolidated financial statements included elsewhere in this Annual Report. We cannot accurately predict the amount and timing of any impairment of assets, and we may be required to recognize goodwill or other asset impairment charges which could materially and adversely affect our results of operations.
We are subject to certain safety and labor risks associated with the manufacture and testing of our products.
As of September 30, 2017,2018, we employed approximately 3,500 total full-time equivalent employees, a significant percentage of whom work at our 30 manufacturing facilities. Our business involves complex manufacturing processes and there is a risk that an accident resulting in property damage, personal injury or death could occur in one of our facilities. In addition, prior to the introduction of new products, our employees test such products under rigorous conditions, which could potentially result in injury or death. The outcome of any personal injury, wrongful death or other litigation is difficult to assess or quantify and the cost to defend litigation can be significant. As a result, the costs to defend any action or the potential liability resulting from any such accident or death or arising out of any other litigation, and any negative publicity associated therewith or negative effects on employee morale, could have a negative effect on our business, financial position, results of operations or cash flows. In addition, any accident could result in manufacturing or product delays, which could negatively affect our business, financial position, results of operations or cash flows.
The nature of our business exposes us to product liability, construction defect and warranty claims and litigation as well as other legal proceedings, which could materially and adversely affect our business, financial position, results of operations or cash flows.
We are exposed to construction defect and product liability claims relating to our various products if our products do not meet customer expectations. Such claims and liabilities may arise out of the quality of raw materials or component parts we purchase from third-party suppliers, over which we do not have direct control, or due to our fabrication, assembly, or manufacturedamage in shipment of our products. In addition, we warrant certain of our products to be free of certain defects and could incur costs related to paying warranty claims in connection with defective products. We cannot assure you that we will not experience material losses or that we will not incur significant costs to defend or pay for such claims.
While we currently maintain insurance coverage to address a portion of these types of liabilities, we cannot make assurances that we will be able to obtain such insurance on acceptable terms in the future, if at all, or that any such insurance will provide adequate coverage against potential claims. Further, while we intend to seek indemnification against potential liability for product liability claims from relevant parties, we cannot guarantee that we will be able to recover under any such indemnification agreements. Any claims that result in liability exceeding our insurance coverage and rights to indemnification by third parties could materially and adversely affect our business, financial position, results of operations or cash flows. Product liability claims can be expensive to defend and can divert the attention of management and other personnel for significant time periods, regardless of the ultimate outcome. For example, certain of our subsidiaries have been named as defendants in product liability law suits claiming that our ABF II anti-microbial coated sprinkler pipe allegedly caused environmental stress cracking in chlorinated PVC pipe. See Note 16, ''Commitments and Contingencies'' to the accompanying consolidated financial statements included elsewhere in this Annual Report. An unsuccessful product liability defense could be highly costly and accordingly result in a decline in revenues and profitability.
From time to time, we are also involved in government inquiries and investigations, as well as consumer, employment, tort proceedings and other litigation. We cannot predict with certainty the outcomes of these legal proceedings and other contingencies. The outcome of some of these legal proceedings and other contingencies could require us to take actions which would adversely affect our operations or could require us to pay substantial amounts of money. Additionally, defending against these lawsuits and proceedings may involve significant expense and diversion of management's attention and resources from other matters.
We may not be able to adequately protect our intellectual property rights in foreign countries, and we may become involved in intellectual property disputes.
Our use of contractual provisions, confidentiality procedures and agreements, and patent, trademark, copyright, unfair competition, trade secret and other laws to protect our intellectual property and other proprietary rights may not be adequate. We have registered intellectual property (mainly trademarks and patents) in more than 7685 countries. Because of the differences in foreign trademark, patent and other intellectual property or proprietary rights laws, we may not receive the same protection in foreign countries as we would in the United States.
Litigation may be necessary to enforce our intellectual property rights or to defend against claims by third parties that our products infringe their intellectual property rights. Any litigation or claims brought by or against us could result in substantial costs and diversion of our resources. A successful intellectual property infringement suit against us could prevent us from manufacturing or selling certain products in a particular area, which could materially and adversely affect our business, financial position, results of operations or cash flows.
We face risks relating to doing business internationally that could materially and adversely affect our business, financial position, results of operations or cash flows.
Our business operates and serves customers in certain foreign countries, including Australia, Canada, China, New Zealand and the United Kingdom. There are certain risks inherent in doing business internationally, including: |
| | | |
| | • | | economic volatility and sustained economic downturns; |
| | • | | difficulties in enforcing contractual and intellectual property rights; |
| | • | | currency exchange rate fluctuations and currency exchange controls; |
| | • | | import or export restrictions and changes in trade regulations; |
| | • | | difficulties in developing, staffing, and simultaneously managing a number of foreign operations as a result of distance; |
| | • | | issues related to occupational safety and adherence to local labor laws and regulations; |
| | • | | potentially adverse tax developments; |
| | • | | longer payment cycles; |
| | • | | exposure to different legal standards; |
| | • | | political or social unrest, including terrorism; |
| | • | | risks related to government regulation and uncertain protection and enforcement of our intellectual property rights; |
| | • | | the presence of corruption in certain countries; and |
| | • | | higher than anticipated costs of entry. |
One or more of these factors could materially and adversely affect our business, financial position, results of operations or cash flows.
Our inability to introduce new products effectively or implement our innovation strategies could adversely affect our ability to compete.
We continually seek to develop products and solutions that allow us to stay at the forefront of the needs of the Electrical Raceway and MP&S markets. The success of new products depends on a variety of factors, including but not limited to, timely and successful product development, the effective consummation of strategic acquisitions, market acceptance and demand, competitive response, protection of associated intellectual property and avoidance of third-party infringement of the Company's intellectual property, our ability to manage risks associated with product life cycles, the effective management of inventory and purchase commitments, the availability and cost of raw materials and the quality of our initial products during the initial period of introduction. Some of the foregoing factors are beyond our control and we cannot fully predict the ultimate success of the introduction of new products, especially in the early stages of innovation. In introducing new products and implementing our innovation strategies, any delays, unexpected costs, diversion of resources, loss of key employees or other setbacks could materially and adversely affect our business, financial position, results of operations or cash flows.
The majority of our net sales are credit sales that are made primarily to customers whose ability to pay is dependent, in part, upon the economic strength of the industries and geographic areas in which they operate, and the failure to collect monies owed from customers could adversely affect our business, financial position, results of operations or cash flows.
The majority of our net sales are facilitated through the extension of credit to our customers, whose ability to pay is dependent, in part, upon the economic strength of the industries and geographic areas in which they operate. We offer credit to customers, either through unsecured credit that is based solely upon the creditworthiness of the customer, or secured credit for materials sold for a specific job where the security lies in lien rights associated with the material going into the job. The type of credit offered depends both on the financial strength of the customer and the nature of the business in which the customer is involved. End users, resellers and other non-contractor customers generally purchase more on unsecured credit than secured credit. The inability of our customers to pay off their credit lines in a timely manner, or at all, would adversely affect our business, financial condition, results of operations and cash flows. Furthermore, our collections efforts with respect to non-paying or slow-paying customers could negatively impact our customer relations going forward.
Because we depend on the creditworthiness of our customers, if the financial condition of our customers declines, our credit risk could increase. Significant contraction in our markets, coupled with tightened credit availability and financial institution underwriting standards, could adversely affect certain of our customers. Should one or more of our larger customers declare bankruptcy, it could adversely affect the collectability of our accounts receivable, bad debt reserves and net income.
Our business, financial position or results of operations could be materially and adversely affected by the ability to import raw materials, component parts and/or finished goods from existing suppliers and otherwise without government regulations or restrictions incremental to those borne by the business today.
Our business, financial position or results of operations could be materially and adversely affected by our inability to continue importing raw materials, component parts and/or finished goods under the regulatory regime applicable to our business. Although we seek to have alternate sources and recover increases in input costs through price increases in our products, regulatory changes or other governmental actions could result in the need to change suppliers or incur cost increases that cannot, in the short term, or in some cases even the long term, be offset by our prices. Such changes could reduce our gross profit, net income and cash flow. Any of these consequences could materially and adversely affect our business, financial position, results of operations or cash flows.
Congress has proposed comprehensive tax reform legislation that could materially affect the tax aspects of our business and the industries in which we compete.
President Trump, U.S. Congressional leaders and other elected officials have indicated their desire to implement significant U.S. federal income tax reform, and the current U.S. Congress has proposed comprehensive tax reform legislation, that could materially affect the tax aspects of our business and the industries in which we compete. Such tax reform may be substantially revised through the legislative process, or may never be enacted. To the extent that such changes, if any, have a negative effect on us or the industries we serve, including as a result of related uncertainty, these changes may materially and adversely affect our business, financial condition, results of operations and cash flows.
In connection with acquisitions, joint ventures or divestitures, we may become subject to liabilities and required to issue additional debt or equity.
In connection with any acquisitions or joint ventures, we may acquire liabilities or defects such as legal claims, including but not limited to third partythird-party liability and other tort claims; claims for breach of contract; employment-related claims; environmental liabilities, conditions or damage; permitting, regulatory or other compliance with law issues; liability for hazardous materials; or tax liabilities. If we acquire any of these liabilities, and they are not adequately covered by insurance or an enforceable indemnity or similar agreement from a creditworthy counterparty, we may be responsible for significant out-of-pocket expenditures. In connection with any divestitures, we may incur liabilities for breaches of representations and warranties or failure to comply with operating covenants under any agreement for a divestiture. In addition, we may indemnify a counterparty in a divestiture for certain liabilities of the subsidiary or operations subject to the divestiture transaction. These liabilities, if they materialize, could materially and adversely affect our business, financial position, results of operations or cash flows.
In addition, if we were to undertake a substantial acquisition for cash, the acquisition would likely need to be financed in part through additional financing from banks, through public offerings or private placements of debt or equity securities or through other arrangements. Such acquisition financing might decrease our ratio of earnings to fixed charges and adversely affect other leverage criteria and our credit rating. We cannot assure you that the necessary acquisition financing would be available to us on acceptable terms if and when required. Moreover, acquisitions financed through the issuance of equity securities could cause our stockholders to experience dilution.
We may be unable to identify, acquire, close or integrate acquisition targets successfully.
Acquisitions are a component of our growth strategy; however, there can be no assurance that we will be able to continue to grow our business through acquisitions as we have done historically or that any businesses acquired will perform in accordance with expectations or that business judgments concerning the value, strengths and weaknesses of businesses acquired will prove to be correct. We will continue to analyze and evaluate the acquisition of strategic businesses or product lines with the potential to strengthen our industry position or enhance our existing product offering. We cannot assure you that we will identify or successfully complete transactions with suitable acquisition candidates in the future, nor can we assure you that completed acquisitions will be successful. If an acquired business fails to operate as anticipated or cannot be successfully integrated with our existing business, our business, financial condition, results of operations or cash flows could be materially and adversely affected.
As a result of our international operations, we could be adversely affected by violations of the United States Foreign Corrupt Practices Act and similar foreign anti-corruption laws.
The United States Foreign Corrupt Practices Act, or the "FCPA," and similar foreign anti-corruption laws generally prohibit companies and their intermediaries from making improper payments or providing anything of value to influence foreign government officials for the purpose of obtaining or retaining business or obtaining an unfair advantage. Recent years have seen a substantial increase in the global enforcement of anti-corruption laws, with more frequent voluntary self-disclosures by companies, aggressive investigations and enforcement proceedings by both the United States Department of Justice and the United States Securities and Exchange Commission, or the "SEC," resulting in record fines and penalties, increased enforcement activity by non-U.S. regulators, and increases in criminal and civil proceedings brought against companies and individuals.
We have operations in Australia, Canada, China, New Zealand and the United Kingdom and sell our products in many additional countries. As we acquire additional businesses, we often become responsible for such businesses' prior violations of anti-corruption laws, if any. Our internal policies provide for compliance with all applicable anti-corruption laws for both us, third-party representatives, distributors and for our joint venture operations. Our continued operation and expansion outside the United States, including in developing countries, could increase the risk of such violations in the future. Despite our training and compliance programs, we cannot assure you that our internal control policies and procedures always will protect us from unauthorized reckless or criminal acts committed by our employees, agents or joint venture partners. In the event that we believe or have reason to believe that our employees, agents or distributors have or may have violated applicable anti-corruption laws, including the FCPA, we may be required to investigate or have outside counsel investigate the relevant facts and circumstances, which can be expensive and require significant time and attention from senior management. Violations of these laws may result in severe criminal or civil sanctions, which could disrupt our business and result in a material adverse effect on our business, financial condition, results of operations or cash flows.
Regulations related to "conflict minerals" may force us to incur additional expenses, may make our supply chain more complex and may result in damage to our reputation with customers.
As a public company, we are subject to the requirements under the Dodd-Frank Wall Street Reform and Consumer Protection Act of 2010, or the "Dodd-Frank Act." The SEC has adopted requirements under the Dodd-Frank Act for companies that use certain minerals and metals, known as conflict minerals, in their products, whether or not these products are manufactured by third parties. These requirements require companies to conduct due diligence and disclose whether or not such minerals originate from the Democratic Republic of Congo and adjoining countries. There are costs associated with complying with these disclosure requirements, including for efforts to determine the sources of conflict minerals used in our products and other potential changes to products, processes or sources of supply as a consequence of such verification activities. In addition, compliance with these requirements could adversely affect the sourcing, supply and pricing of materials used in those products and we may face reputational challenges if we are unable to verify the origins for all "conflict minerals" used in products through the procedures we have implemented. We may also encounter challenges to satisfy customers that may require all of the components of products purchased to be certified as conflict free. If we are not able to meet customer requirements, customers may choose to disqualify us as a supplier.
Anti-terrorism measures and other disruptions to the raw material supply network could impact our operations.
Our ability to provide efficient distribution of products to our customers is an integral component of our overall business strategy. In the aftermath of terrorist attacks in the United States, federal, state and local authorities have implemented and continue to implement various security measures that affect the raw material supply network in the United States and abroad. If security measures disrupt or impede the receipt of sufficient raw materials, we may fail to meet the needs of our customers or may incur increased expenses to do so.
Risks Related to Our Indebtedness
Our indebtedness may adversely affect our financial health.
As of September 30, 2017,2018, we had approximately $580.1$912.2 million of total long-term consolidated indebtedness outstanding (including current portion) under AII's credit facilities ("Credit Facilities"), which consist of: (i) an asset-based credit facility ("ABL Credit Facility"); and (ii) the first lien term loan facility (the "First Lien Term Loan Facility"). As of September 30, 2017,2018, AII had $173.0$315.1 million of available borrowing capacity under the ABL Credit Facility and there were no outstanding borrowings (excluding $8.6$9.9 million of letters of credit issued under the facility). In addition, subject to certain conditions and without the consent of the then existing lenders, the loans under the First Lien Term Loan Facility may be expanded (or a new term loan facility, revolving credit facility or letter of credit facility added) by up to $235.0 million, plus an additional amount not to exceed specified coverage ratios. In addition, we are able to incur additional indebtedness in the future, subject to the limitations contained in the agreements governing our indebtedness. Our indebtedness could have important consequences to you. Because of our indebtedness:
our ability to obtain additional financing for working capital, capital expenditures, acquisitions, debt service requirements or general corporate purposes and our ability to satisfy our obligations with respect to our indebtedness may be impaired in the future;
a large portion of our cash flow from operations must be dedicated to the payment of principal and interest on our indebtedness, thereby reducing the funds available to us for other purposes;
we are exposed to the risk of increased interest rates because a significant portion of our borrowings are at variable rates of interest;
it may be more difficult for us to satisfy our obligations to our creditors, resulting in possible defaults on, and acceleration of, such indebtedness;
we may be more vulnerable to general adverse economic and industry conditions;
we may be at a competitive disadvantage compared to our competitors with proportionately less indebtedness or with comparable indebtedness on more favorable terms and, as a result, they may be better positioned to withstand economic downturns;
our ability to refinance indebtedness may be limited or the associated costs may increase;
our flexibility to adjust to changing market conditions and ability to withstand competitive pressures could be limited; and
we may be prevented from carrying out capital spending and restructurings that are necessary or important to our growth strategy and efforts to improve our operating margins.
Despite our indebtedness levels, we and our subsidiaries may incur substantially more indebtedness, which may increase the risks created by our indebtedness.
We and our subsidiaries may incur substantial additional indebtedness in the future. The terms of the credit agreements governing the Credit Facilities do not fully prohibit our subsidiaries from incurring additional debt. If our subsidiaries are in compliance with certain coverage ratios set forth in the agreements governing the Credit Facilities, they may be able to incur substantial additional indebtedness, which may increase the risks created by our current indebtedness. In addition, subjectSubject to certain conditions and without the consent of the then existing lenders, the loans under the First Lien Term Loan Facility may be expanded (or a new term loan facility, revolving credit facility or letter of credit facility added) by up to $125.0$235.0 million, plus an additional amount not to exceed specified coverage ratios. In addition, subject to certain conditions and without the consent of the then existing lenders, the loans under the ABL Credit Facility may be expanded by up to $100 million, and $75.0the credit agreements governing the Credit Facilities allow for up to $50.0 million respectively,of second lien facilities, plus an additional amount not to exceed a specified leverage ratio. As of September 30, 2017,2018, we were able to borrow an additional $173.0$315.1 million under the ABL Credit Facility. In addition, we can request an increase in the commitments to our ABL Credit Facility from the participating banks or other banks of up to $75.0 million under the terms of the facility.
Increases in interest rates would increase the cost of servicing our indebtedness and could reduce our profitability.
A significant portion of our outstanding indebtedness bears interest or will bear interest at variable rates. As a result, increases in interest rates would increase the cost of servicing our indebtedness and could materially and adversely affect our business, financial position, results of operations or cash flows. As of September 30, 2017, assuming2018, LIBOR exceeded 1.00%,; therefore, each one percentage point change in interest rates would have resulted in a change of approximately $5.0$9.3 million in the annual interest expense on the First Lien Term Loan Facility. As of September 30, 2017,2018, assuming availability was fully utilized, each one percentage point change in interest rates would have resulted in a change of approximately $4.1$3.3 million in annual interest expense on the ABL Credit Facility. Additionally, if the ABL Credit Facility were fully utilized, the margin we pay on borrowings would increase by 0.50% from the current level and we would incur additional interest expense of $1.6 million. The impact of increases in interest rates could be more significant for us than it would be for some other companies because of our indebtedness, thereby affecting our profitability.
A lowering or withdrawal of the ratings, outlook or watch assigned to our indebtedness by rating agencies may increase our future borrowing costs and reduce our access to capital.
Our indebtedness currently has a non-investment grade rating, and any rating, outlook or watch assigned could be lowered or withdrawn entirely by a rating agency if, in that rating agency's judgment, current or future circumstances relating to the basis of the rating, outlook or watch, such as adverse changes to our business, so warrant. Any future lowering of our ratings, outlook or watch likely would make it more difficult or more expensive for us to obtain additional debt financing.
The agreements and instruments governing our indebtedness contain restrictions and limitations that could significantly impact our ability to operate our business.
The Credit Facilities contain covenants that, among other things, restrict the ability of AII and its subsidiaries to:
•incur additional indebtedness and create liens;
•pay dividends and make other distributions or to purchase, redeem or retire capital stock;
•purchase, redeem or retire certain junior indebtedness;
•make loans and investments;
•enter into agreements that limit AII's or its subsidiaries' ability to pledge assets or to make distributions or
loans to us or transfer assets to us;
•sell assets;
•enter into certain types of transactions with affiliates;
•consolidate, merge or sell substantially all assets;
•make voluntary payments or modifications of junior indebtedness; and
•enter into lines of business.
The restrictions in the Credit Facilities may prevent us from taking actions that we believe would be in the best interest of our business and may make it difficult for us to execute our business strategy successfully or effectively compete with companies that are not similarly restricted. We may also incur future debt obligations that might subject us to additional restrictive covenants that could affect our financial and operational flexibility. Additionally, we may be required to make accelerated payments due to the covenants and restrictions contained in the Credit Facilities. We may be unable to refinance our indebtedness, at maturity or otherwise, on terms acceptable to us or at all.
The ability of AII to comply with the covenants and restrictions contained in the Credit Facilities may be affected by economic, financial and industry conditions beyond our control including credit or capital market disruptions. The breach of any of these covenants or restrictions could result in a default that would permit the applicable lenders to declare all amounts outstanding thereunder to be due and payable, together with accrued and unpaid interest. If we are unable to repay indebtedness, lenders having secured obligations, such as the lenders under the Credit Facilities, could proceed against the collateral securing the indebtedness. In any such case, we may be unable to borrow under the Credit Facilities and may not be able to repay the amounts due under such facilities. This could materially and adversely affect our business, financial position, results of operations or cash flows and could cause us to become bankrupt or insolvent.
Our ability to increase or refinance our indebtedness could become more difficult or expensive upon the adoption of the new leasing accounting standard which requires companies to show all off-balance sheet operating leases as liabilities on the balance sheet.
The Financial Accounting Standards Board ("FASB") issued Accounting Standard Update ("ASU") 2016-02, Leases which the Company is required to adopt for its 2020 fiscal year. Under this ASU, operating leases are classified as liabilities on the balance sheet. These operating leases are currently treated as off-balance sheet financing under generally accepted accounting principles currently effective for Atkore. See Note 1, ''Basis of Presentation and Summary of Significant Accounting Policies'' to the accompanying consolidated financial statements included elsewhere in this Annual Report. Though the terms and conditions of our current debt agreements relating to covenants and restrictions are not impacted by this change as they incorporate the adoption of the ASU, our ability to increase or refinance our indebtedness could become more difficult or expensive given the additional liabilities that will be included on our balance sheet subsequent to the adoption of the ASU.
Our ability to generate the significant amount of cash needed to pay interest and principal on our indebtedness and our ability to refinance all or a portion of our indebtedness or obtain additional financing depends on many factors beyond our control.
Atkore International Group, Inc. ("AIG"), AII, and AIIAIH are each holding companies, and as such they have no independent operations or material assets other than ownership of equity interests in their respective subsidiaries. AtkoreAIG, AII and AIIAIH each depend on their respective subsidiaries to distribute funds to them so that they may pay obligations and expenses, including satisfying obligations with respect to indebtedness. Our ability to make scheduled payments on, or to refinance our obligations under, our indebtedness depends on the financial and operating performance of our subsidiaries and their ability to make distributions and dividends to us, which, in turn, depends on their results of operations, cash flows, cash requirements, financial position and general business conditions and any legal and regulatory restrictions on the payment of dividends to which they may be subject, many of which may be beyond our control.
We may be unable to maintain a level of cash flows from operating activities sufficient to permit us to pay the principal and interest on our indebtedness. If our cash flow and capital resources are insufficient to fund our debt service obligations, we may be forced to reduce or delay capital expenditures, sell assets, seek to obtain additional equity capital or restructure our indebtedness. In the future, our cash flow and capital resources may not be sufficient for payments of interest on and principal of our indebtedness, and such alternative measures may not be successful and may not permit us to meet our scheduled debt service obligations.
The outstanding borrowings under the First Lien Term Loan Facility have a maturity date of December 22, 2023 and the ABL Credit Facility is scheduled to mature on December 22, 2021.2021. We may be unable to refinance any of our indebtedness or obtain additional financing, particularly because of our indebtedness. Market disruptions, such as those experienced in 2008 and 2009, as well as our indebtedness levels, may increase our cost of borrowing or adversely affect our ability to refinance our obligations as they become due. If we are unable to refinance our indebtedness or access additional credit, or if short-term or long-term borrowing costs dramatically increase, our ability to finance current operations and meet our short-term and long-term obligations could be adversely affected.
If our subsidiary AII cannot make scheduled payments on its indebtedness, it will be in default and the lenders under the Credit Facilities could terminate their commitments to loan money or foreclose against the assets securing their borrowings, and we could be forced into bankruptcy or liquidation.
Risks Related to Our Common Stock
AtkoreAIG is a holding company with no operations of its own, and it depends on its subsidiaries for cash to fund all of its operations and expenses, including to make future dividend payments, if any.
Our operations are conducted entirely through our subsidiaries, and our ability to generate cash to fund our operations and expenses, to pay dividends or to meet debt service obligations is highly dependent on the earnings and the receipt of funds from our subsidiaries through dividends or intercompany loans. Deterioration in the financial condition, earnings or cash flow of AII and its subsidiaries for any reason could limit or impair their ability to pay such distributions. Additionally, to the extent our subsidiaries are restricted from making such distributions under applicable law or regulation or under the terms of our financing arrangements, or are otherwise unable to provide funds to the extent of our needs, there could be a material adverse effect on our business, financial condition, results of operations or cash flows.
For example, the agreements governing the Credit Facilities significantly restrict the ability of our subsidiaries to pay dividends, make loans or otherwise transfer assets to us. Furthermore, our subsidiaries are permitted under the terms of the Credit Facilities to incur additional indebtedness that may restrict or prohibit the making of distributions, the payment of dividends or the making of loans by such subsidiaries to us.
The market price of our common stock may be volatile and could decline.
The market price of our common stock may fluctuate significantly. Among the factors that could affect our stock price are:
industry or general market conditions;
domestic and international economic factors unrelated to our performance;
changes in our customers' preferences;
new regulatory pronouncements and changes in regulatory guidelines;
lawsuits, enforcement actions and other claims by third parties or governmental authorities;
actual or anticipated fluctuations in our quarterly operating results;
changes in securities analysts' estimates of our financial performance or lack of research coverage and reports by industry analysts;
action by institutional stockholders or other large stockholders, (including the CD&R Investor), including future sales of our common stock;
failure to meet any guidance given by us or any change in any guidance given by us, or changes by us in our guidance practices;
announcements by us of significant impairment charges;
speculation in the press or investment community;
investor perception of us and our industry;
changes in market valuations or earnings of similar companies;
announcements by us or our competitors of significant contracts, acquisitions, dispositions or strategic partnerships;
war, terrorist acts and epidemic disease;
any future sales of our common stock or other securities;
additions or departures of key personnel; and
misconduct or other improper actions of our employees.
Stock markets have experienced extreme volatility in recent years that has been unrelated to the operating performance of particular companies. These broad market fluctuations may adversely affect the trading price of our common stock. In the past, following periods of volatility in the market price of a company's securities, class action litigation has often been instituted against the affected company. Any litigation of this type brought against us could result in substantial costs and a diversion of our management's attention and resources, which could materially and adversely affect our business, financial position, results of operations or cash flows.
Future sales of shares by existing stockholders could cause our stock price to decline.
Sales of substantial amounts of our common stock in the public market, or the perception that these sales could occur, could cause the market price of our common stock to decline. These sales, or the possibility that these sales may occur, also might make it more difficult for us to sell equity securities in the future at a time and at a price that we deem appropriate.
As of November 17, 2017, we had 63,090,619 outstanding shares of common stock. Of these shares, all of the 31,550,000 shares sold in our IPO and secondary offerings by the CD&R Investor are freely tradable without restriction or further registration under the Securities Act of 1933, as amended (the "Securities Act"), unless purchased by our "affiliates," as that term is defined in Rule 144 under the Securities Act ("Rule 144").
On July 3, 2017, we filed a shelf registration statement on Form S-3 to register 30,460,377 shares of our common stock held by the CD&R Investor. Once sold, all 30,460,377 shares of our common stock currently held by the CD&R Investor were immediately tradable without restriction under the Securities Act, unless held by “Affiliates,” as that term is defined in Rule 144 under the Securities Act.
In June 2016, we filed a registration statement on Form S-8 under the Securities Act to register the shares of common stock to be issued under our equity compensation plans and, as a result, all shares of common stock issued upon exercise of (i) stock options granted under these plans and (ii) other equity based awards granted under the Atkore International Group Inc. Omnibus Incentive Plan, or the "Omnibus Incentive Plan", were also freely tradable under the Securities Act, subject to the terms of the lock-up agreements, unless purchased by our affiliates. As of November 17, 2017, there were stock options outstanding to purchase a total of 5,013,092 shares of our common stock. Additionally, 433,107 shares of our common stock are issuable pursuant to RSUs and 181,236 shares of our common stock are issuable pursuant to PSUs. As of November 17, 2017, 2,925,220 shares of our common stock were reserved for future issuance under our Omnibus Incentive Plan, of which 842,280 were subject to outstanding awards.
The remaining 31,540,619 shares of common stock outstanding as of November 17, 2017 are restricted securities within the meaning of Rule 144, but are eligible for resale subject to applicable volume, means of sale, holding period and other limitations of Rule 144. The market price of our common stock could decline if the holders of those shares sell them or are perceived by the market as intending to sell them. Furthermore, the CD&R Investor, which currently owns approximately 50% of the outstanding shares of our common stock as of November 17, 2017 has the right to require us to register shares of common stock for resale in some circumstances.
In the future, we may issue additional shares of common stock or other equity or debt securities convertible into or exercisable or exchangeable for shares of our common stock in connection with a financing, strategic investment, litigation settlement or employee arrangement or otherwise. Any of these issuances could result in substantial dilution to our existing stockholders and could cause the trading price of our common stock to decline.
The timing and amount of the Company’s share repurchases are subject to a number of uncertainties.
In August 2017, the Company announced that its board of directors had approved a share repurchase program for the repurchase of up to an aggregate amount of $75 million of the Company’s common stock. Share repurchases under the program arehave been and we expect will continue to be funded with cash on hand. The amount and timing of share repurchases will be based on a variety of factors. Important factors that could cause the Company to limit, suspend or delay its share repurchases include unfavorable trading market conditions, the price of the Company's common stock, the nature of other investment opportunities presented to us from time to time, the ability to obtain financing at attractive rates and the availability of U.S. cash. The share repurchase program does not obligate us to acquire any particular amount of common stock, and it may be terminated at any time at the Company’s discretion.
If securities or industry analysts do not publish research or publish misleading or unfavorable research about our business, our stock price and trading volume could decline.
The trading market for our common stock depends in part on the research and reports that securities or industry analysts publish about us or our business. If one or more of the analysts that covers our common stock downgrades our stock or publishes misleading or unfavorable research about our business, our stock price would likely decline. If one or more of the analysts ceases coverage of our common stock or fails to publish reports on us regularly, demand for our common stock could decrease, which could cause our common stock price or trading volume to decline.
The CD&R Investor has significant influence over us and may not always exercise its influence in a way that benefits our public stockholders.
As of November 17, 2017, the CD&R Investor owns approximately 50% of the outstanding shares of our common stock. As the Company's share repurchase program progresses, the CD&R Investor's ownership percentage may gradually increase. See Item 5, ''Market for Registrant's Common Equity, Related Stockholder Matters, and Issuer Purchases of Equity Securities'' for additional information. As a result, the CD&R Investor will continue to exercise significant influence over all matters requiring stockholder approval for the foreseeable future, including approval of significant corporate transactions, such as mergers and the sale of substantially all of our assets, which may reduce the market price of our common stock. In addition, the CD&R Investor will continue to have the right to designate for nomination for election at least 40% of the total number of our directors as long as the CD&R Investor beneficially owns at least 40% of our common stock.
Because the CD&R Investor's interests may differ from your interests, actions the CD&R Investor takes as a significant stockholder may not be favorable to you. For example, the concentration of ownership held by the CD&R Investor could delay, defer or prevent a change of control of us or impede a merger, takeover or other business combination that another stockholder may otherwise view favorably. Other potential conflicts could arise, for example, over matters such as employee retention or recruiting, or our dividend policy.
Under our amended and restated certificate of incorporation, the CD&R Investor and its affiliates and, in some circumstances, any of our directors and officers who is also a director, officer, employee, member or partner of the CD&R Investor and its affiliates, have no obligation to offer us corporate opportunities.
The policies relating to corporate opportunities and transactions with the CD&R Investor set forth in our second amended and restated certificate of incorporation ("amended and restated certificate of incorporation") address potential conflicts of interest between Atkore, on the one hand, and the CD&R Investor and its officers, directors, employees, members or partners who are directors or officers of our company, on the other hand. In accordance with those policies, the CD&R Investor may pursue corporate opportunities, including acquisition opportunities that may be complementary to our business, without offering those opportunities to us. Atkore stockholders are deemed to have notice of and have consented to these provisions of our amended and restated certificate of incorporation. Although these provisions are designed to resolve conflicts between us and the CD&R Investor and its affiliates fairly, conflicts may not be resolved in our favor or be resolved at all.
Future offerings of debt or equity securities which would rank senior to our common stock may adversely affect the market price of our common stock.
If, in the future, we decide to issue debt or equity securities that rank senior to our common stock, it is likely that such securities will be governed by an indenture or other instrument containing covenants restricting our operating flexibility. Additionally, any convertible or exchangeable securities that we issue in the future may have rights, preferences and privileges more favorable than those of our common stock and may result in dilution to owners of our common stock. We and, indirectly, our stockholders, will bear the cost of issuing and servicing such securities. Because our decision to issue debt or equity securities in any future offering will depend on market conditions and other factors beyond our control, we cannot predict or estimate the amount, timing or nature of our future offerings. Thus, holders of our common stock will bear the risk of our future offerings reducing the market price of our common stock and diluting the value of their stock holdings in us.
Fulfilling our obligations incident to being a public company, including compliance with the requirements of the Exchange Act, and related rules under the Sarbanes-Oxley Act of 2002, or the "Sarbanes-Oxley Act," and the Dodd-Frank Act, will beis expensive and time-consuming, and any delays or difficulties in satisfying these obligations could have a material adverse effect on our future results of operations and our stock price.
Our IPO was completed in June 2016. As a public company, we are subject to the reporting, accounting and corporate governance requirements of the NYSE, the Exchange Act, the Sarbanes-Oxley Act and the Dodd-Frank Act that apply to issuers of listed equity, which impose certain significant compliance requirements, costs and obligations upon us. The changes necessitated by being a publicly listed company require a significant commitment of additional resources and management oversight which increase our operating costs. Further, to comply with the requirements of being a public company, we may need to undertake various actions, such as implementing new internal controls and procedures and hiring additional accounting or internal audit staff. In addition, we may identify control deficiencies which could result in a material weakness or significant deficiency. In the past, we have identified material weaknesses, all of which have since been remediated. We did not identify any material weaknesses for fiscal 2017.2018.
The expenses associated with being a public company include increases in auditing, accounting and legal fees and expenses, investor relations expenses, increased directors' fees and director and officer liability insurance costs, registrar and transfer agent fees and listing fees, as well as other expenses. As a public company, we are required, among other things, to define and expand the roles and the duties of our board of directors and its committees and institute more comprehensive compliance and investor relations functions. Failure to comply with the Sarbanes-Oxley Act or Dodd-Frank Act could potentially subject us to sanctions or investigations by the SEC, the NYSE or other regulatory authorities.
Anti-takeover provisions in our amended and restated certificate of incorporation and amended and restated by-laws could discourage, delay or prevent a change of control of our company and may affect the trading price of our common stock.
Our amended and restated certificate of incorporation and our second amended and restated by-laws, ("amended and restated by-laws") include a number of provisions that may discourage, delay or prevent a change in our management or control over us that stockholders may consider favorable. For example, our amended and restated certificate of incorporation and amended and restated by-laws collectively:
authorize the issuance of "blank check" preferred stock that could be issued by our board of directors to thwart a takeover attempt;
provide for a classified board of directors, which divides our board of directors into three classes, with members of each class serving staggered three-year terms, which prevents stockholders from electing an entirely new board of directors at an annual meeting;
limit the ability of stockholders to remove directors if the CD&R Investor ceases to beneficially own at least 40% of the outstanding shares of our common stock;directors;
provide that vacancies on our board of directors, including vacancies resulting from an enlargement of our board of directors, may be filled only by a majority vote of directors then in office;
prohibit stockholders from calling special meetings of stockholders if the CD&R Investor ceases to beneficially own at least 40% of the outstanding shares of our common stock;stockholders;
prohibit stockholder action by written consent, thereby requiring all actions to be taken at a meeting of the stockholders, if the CD&R Investor ceases to beneficially own at least 40% of the outstanding shares of our common stock;stockholders;
establish advance notice requirements for nominations of candidates for election as directors or to bring other business before an annual meeting of our stockholders; and
require the approval of holders of at least 66⅔% of the outstanding shares of our common stock to amend our amended and restated by-laws and certain provisions of our amended and restated certificate of incorporation if the CD&R Investor ceases to beneficially own at least 40% of the outstanding shares of our common stock.incorporation.
These provisions may prevent our stockholders from receiving the benefit from any premium to the market price of our common stock offered by a bidder in a takeover context. Even in the absence of a takeover attempt, the existence of these provisions may adversely affect the prevailing market price of our common stock if the provisions are viewed as discouraging takeover attempts in the future.
Our amended and restated certificate of incorporation and amended and restated by-laws may also make it difficult for stockholders to replace or remove our management. Furthermore, the existence of the foregoing provisions as well as the significant amount of common stock that the CD&R Investor owns, could limit the price that investors might be willing to pay in the future for shares of our common stock. These provisions may facilitate management entrenchment that may delay, deter, render more difficult or prevent a change in our control, which may not be in the best interests of our stockholders.
We could be the subject of securities class action litigation due to future stock price volatility, which could divert management's attention and materially and adversely affect our business, financial position, results of operations or cash flows.
The stock market in general, and market prices for the securities of companies like ours in particular, have from time to time experienced volatility that often has been unrelated to the operating performance of the underlying companies. These broad market and industry fluctuations may adversely affect the market price of our common stock, regardless of our operating performance. In certain situations in which the market price of a stock has been volatile, holders of that stock have instituted securities class action litigation against the company that issued the stock. If any of our stockholders were to bring a similar lawsuit against us, the defense and disposition of the lawsuit could be costly and divert the time and attention of our management and could materially and adversely affect our business, financial position, results of operations or cash flows.
We do not currently intend to pay dividends on our common stock for the foreseeable future and, consequently, your ability to achieve a return on your investment depends on appreciation in the price of our common stock.
We do not currently intend to declare and pay dividends on our common stock for the foreseeable future. We currently intend to use our future earnings, if any, to repay debt, to fund our growth, to develop our business, for working capital needs and for general corporate purposes. Therefore, you are not likely to receive any dividends on your common stock for the foreseeable future, and the success of an investment in shares of our common stock depends upon any future appreciation in their value. There is no guarantee that shares of our common stock will appreciate in value or even maintain the price at which our stockholders have purchased their shares. Payments of dividends, if any, are at the sole discretion of our board of directors after taking into account various factors, including general and economic conditions, our financial condition and operating results, our available cash and current and anticipated cash needs, capital requirements, contractual, legal, tax and regulatory restrictions and implications of the payment of dividends by us to our stockholders or by our subsidiaries (including AII) to us, and such other factors as our board of directors may deem relevant. In addition, our operations are conducted almost entirely through our subsidiaries. As such, to the extent that we determine in the future to pay dividends on our common stock, none of our subsidiaries will be obligated to make funds available to us for the payment of dividends. Further, the agreements governing the Credit Facilities significantly restrict the ability of our subsidiaries to pay dividends or otherwise transfer assets to us. In addition, Delaware law imposes additional requirements that may restrict our ability to pay dividends to holders of our common stock.
Our amended and restated certificate of incorporation includes provisions limiting the personal liability of our directors for breaches of fiduciary duty under the DGCL.
Our amended and restated certificate of incorporation contains provisions permitted under the action asserting a claim arising under the General Corporation Law of the State of Delaware ("DGCL") relating to the liability of directors. These provisions eliminate a director's personal liability to the fullest extent permitted by the DGCL for monetary damages resulting from a breach of fiduciary duty, except in circumstances involving:
any breach of the director's duty of loyalty;
acts or omissions not in good faith or which involve intentional misconduct or a knowing violation of the law;
under Section 174 of the DGCL (unlawful dividends); or
any transaction from which the director derives an improper personal benefit.
The principal effect of the limitation on liability provision is that a stockholder will be unable to prosecute an action for monetary damages against a director unless the stockholder can demonstrate a basis for liability for which indemnification is not available under the DGCL. These provisions, however, should not limit or eliminate our rights or any stockholder's rights to seek non-monetary relief, such as an injunction or rescission, in the event of a breach of a director's fiduciary duty. These provisions do not alter a director's liability under federal securities laws. The inclusion of this provision in our amended and restated certificate of incorporation may discourage or deter stockholders or management from bringing a lawsuit against directors for a breach of their fiduciary duties, even though such an action, if successful, might otherwise have benefited us and our stockholders.
Our amended and restated certificate of incorporation designates the Court of Chancery of the State of Delaware as the sole and exclusive forum for certain litigation that may be initiated by our stockholders, which could limit our stockholders' ability to obtain a favorable judicial forum for disputes with us or our directors, officers or stockholders.
Our amended and restated certificate of incorporation provides that, unless we consent in writing to the selection of an alternative forum, the Court of Chancery of the State of Delaware is, to the fullest extent permitted by law, the sole and exclusive forum for (i) any derivative action or proceeding brought on our behalf, (ii) any action asserting a claim of breach of a fiduciary duty owed to us or our stockholders by any of our directors, officers, other employees, agents or stockholders, (iii) any action asserting a claim arising out of or under the DGCL, or as to which the DGCL confers jurisdiction on the Court of Chancery of the State of Delaware (including, without limitation, any action asserting a claim arising out of or pursuant to our amended and restated certificate of incorporation or our amended and restated by-laws) or (iv) any action asserting a claim that is governed by the internal affairs doctrine. As a stockholder in our company, you are deemed to have notice of and have consented to the provisions of our amended and restated certificate of incorporation related to choice of forum. The choice of forum provision in our amended and restated certificate of incorporation may limit our stockholders' ability to obtain a favorable judicial forum for disputes with us or any of our directors, officers, other employees, agents or stockholders, which may discourage lawsuits with respect to such claims. Alternatively, if a court were to find the choice of forum provision contained in our amended and restated certificate of incorporation to be inapplicable or unenforceable in an action, we may incur additional costs associated with resolving such action in other jurisdictions, which could materially and adversely affect our business, financial position, results of operations or cash flows.
Item 1B. Unresolved Staff Comments
None.
Item 2. Properties
Our corporate headquarters are located in owned premises at 16100 South Lathrop Avenue, Harvey, Illinois. We and our operating companies own and lease a variety of facilities, principally in the United States, for manufacturing, distribution and light assembly. Our manufacturing, distribution and assembly centers are strategically located to optimize route efficiency, market coverage and overhead. The following chart identifies the number of owned and leased facilities used by each of our reportable segments as of September 30, 2017.2018. We believe that these facilities, when considered with our corporate headquarters, offices and warehouses are suitable and adequate to support the current needs of our business.
| | | Reportable Segment | Owned Facilities | | Leased Facilities | Owned Facilities | | Leased Facilities |
| Electrical Raceway | 7 |
| | 32 |
| 7 |
| | 31 |
|
| Mechanical Products & Solutions | 7 |
| | 15 |
| 7 |
| | 13 |
|
We believe that our facilities are well-maintained and are sufficient to meet our current and projected needs. We also have an ongoing process to continually review and update our real estate portfolio to meet changing business needs. Our two principal facilities are located in Harvey, Illinois and New Bedford, Massachusetts. Our owned manufacturing facility in Harvey, Illinois supports both our Electrical Raceway and MP&S segments. Our owned facility in New Bedford, Massachusetts supports our Electrical Raceway segment.
Item 3. Legal Proceedings
See Note 16, ''Commitments and Contingencies'' to the accompanying consolidated financial statements included elsewhere in this Annual Report.
Item 4. Mine Safety Disclosures
None.
PART II
Item 5. Market for Registrant's Common Equity, Related Stockholder Matters, and Issuer Purchases of Equity Securities
Common Stock Market Prices
Shares of our common stock have traded on the NYSE under the symbol ATKR since June 10, 2016. Prior to that date, there was no market for our common stock. The range of high and low sale prices of our common stock as reported by the NYSE is set forth in the table below:
|
| | | | |
| | | High Sales Price | | Low Sales Price |
| 2016 | | | | |
| Third quarter (1) | | $16.85 | | $15.56 |
| Fourth quarter | | $19.17 | | $14.17 |
| 2017 | | | | |
| First quarter | | $24.34 | | $18.00 |
| Second quarter | | $27.30 | | $22.96 |
| Third quarter | | $26.80 | | $20.64 |
| Fourth quarter | | $23.43 | | $15.05 |
(1) Represents the period from June 10, 2016, the date of our initial listing on the NYSE, through June 24, 2016, the end of our third fiscal quarter.
** Assumes $100 invested on June 10, 2016 in stock or index, including reinvestment of dividends.
The following group of 10 public companies represents the Company's peer group:
|
| | | |
| • | PentairnVent Electric plc | • | Eaton Corp. Plc |
| • | Schneider Electric SE | • | Hubbell Incorporated Class B |
| • | ABB Ltd. Sponsored ADR | • | Littelfuse, Inc. |
| • | Acuity Brands | • | Legrand SA |
| • | AZZ Inc. | • | NCI Building Systems, Inc. |
Holders
As of November 17, 2017,18, 2018, there were 2 stockholderswas one stockholder of record of our common stock. This number excludes stockholders whose stock is held in nominee or street name by brokers.
Dividend Policy
We have not and do not currently intend to declare or pay dividends on our common stock for the foreseeable future. We currently intend to use our future earnings, if any, to repay debt, to fund our growth, to develop our business, for working capital needs and for general corporate purposes. Our ability to pay dividends to holders of our common stock is significantly limited as a practical matter by the Credit Facilities insofar as we may seek to pay dividends out of funds made available to us by AII or its subsidiaries, because AII's debt instruments directly or indirectly restrict AII's ability to pay dividends or make loans to us. Any future determination to pay dividends on our common stock will be subject to the discretion of our board of directors and dependdepends upon various factors, including our results of operations, financial condition, liquidity requirements, capital requirements, level of indebtedness, contractual restrictions with respect to payment of dividends, restrictions imposed by Delaware law, general business conditions and other factors that our board of directors may deem relevant.
Issuer Purchases of Equity Securities
The following table shows our purchases of our common stock during the fourth quarter of fiscal 2018 and 2017:
| | | Period | | Total Number of Shares Purchased | | Average Price Paid Per Share | | Total Number of Shares Purchased as Part of Publicly Announced Program(1) | | Maximum Value of Shares that May Yet Be Purchased Under the Program(1) | | Total Number of Shares Purchased | | Average Price Paid Per Share | | Total Number of Shares Purchased as Part of Publicly Announced Program(1) | | Maximum Value of Shares that May Yet Be Purchased Under the Program(1) |
| August 1, 2017 - August 31, 2017 | | 80.9 |
| | $ | 16.49 |
| | 80.9 |
| | $ | 73,666 |
| | 80.9 |
| | $ | 16.49 |
| | 80.9 |
| | $ | 73,666 |
|
| September 1, 2017 - September 30, 2017 | | 700.5 |
| | $ | 17.95 |
| | 700.5 |
| | $ | 61,089 |
| | 700.5 |
| | $ | 17.95 |
| | 700.5 |
| | $ | 61,092 |
|
| October 1, 2017 - October 31, 2017 | | | 89.6 |
| | $ | 18.91 |
| | 89.6 |
| | $ | 59,398 |
|
| November 1, 2017 - November 30, 2017 | | | 260.3 |
| | $ | 18.99 |
| | 260.3 |
| | $ | 54,455 |
|
| December 1, 2017 - December 31, 2017 | | | 1.8 |
| | $ | 20.49 |
| | 1.8 |
| | $ | 54,418 |
|
| February 1, 2018 - February 28, 2018 | | | 17,225.5 |
| | $ | 21.77 |
| | 17,225.5 |
| | $ | 54,418 |
|
| March 1, 2018 - March 31, 2018 | | | 6.4 |
| | $ | 19.50 |
| | 6.4 |
| | $ | 54,293 |
|
| May 1, 2018 - May 31, 2018 | | | 1,333.1 |
| | $ | 20.81 |
| | 1,333.1 |
| | $ | 26,551 |
|
| June 1, 2018 - June 30, 2018 | | | 25.5 |
| | $ | 20.95 |
| | 25.5 |
| | $ | 26,017 |
|
| July 1, 2018 - July 31, 2018 | | | 77.9 |
| | $ | 20.90 |
| | 77.9 |
| | $ | 24,389 |
|
| Total | | 781.4 |
| | | | 781.4 |
| |
|
| | 19,801.5 |
| | | | 19,801.5 |
| |
|
|
(1) OnIn August 24, 2017, wethe Company announced that our Boardits board of Directorsdirectors had approved a share repurchase program under which we mayfor the repurchase of up to an aggregate amount of $75.0$75 million of our outstandingthe Company’s common stock. In January 2018, the Company announced a stock over an open-ended periodrepurchase transaction whereby the Company agreed to repurchase from the CD&R Investor, a related party, approximately 17.2 million shares of time. We will conduct repurchases under the programCompany's common stock, par value $0.01 per share, at a per share price equal to $21.77, for a total purchase price of $375 million, subject to the terms and conditions set forth in the open market and through broker negotiated purchases in compliance with Rule 10b-18 of the Securities Exchange Act of 1934, as amended, and subject to market conditions, applicable legal requirements and other relevant factors.stock purchase agreement. The share repurchase program will be funded from our available cash balances. This share repurchase program does not obligate us to acquire any particular amount of common stock, and it may be terminated at any time at our discretion. As of September 30, 2017,2018, there were approximately $61.1$24.4 million of authorized repurchases remaining.
Securities Authorized for Issuance Under Equity Compensation Plans
The following table contains information, as of September 30, 2017,2018, about the amount of common shares to be issued upon the exercise of outstanding options, performance share options ("PSUs") and restricted stock units ("RSUs") granted under the Omnibus Incentive Plan ("Omnibus Incentive Plan").
| | | | | | | | | | Equity Compensation Plan Information |
| (share amounts in thousands) | | Number of Securities to be Issued Upon Exercise of Outstanding Options, Warrants and Rights | | Weighted Average Exercise Price of Outstanding Options | | Remaining Available for Future Issuance Under Equity Compensation Plans (excluding securities reflected in (1)) | | Number of Securities to be Issued Upon Exercise of Outstanding Options, Warrants and Rights | | Weighted Average Exercise Price of Outstanding Options | | Remaining Available for Future Issuance Under Equity Compensation Plans (excluding securities reflected in (1)) |
| Plan Category | | (1) | | |
| | | | (1) | | Weighted Average Exercise Price of Outstanding Options | | Remaining Available for Future Issuance Under Equity Compensation Plans (excluding securities reflected in (1)) |
| Equity compensation plans approved by shareholders | | 5,816 |
| | $ | 8.30 |
| | 2,923 |
| | 3,562 |
| |
| Equity compensation plans not approved by shareholders | | — |
| | — |
| | — |
| | — |
| | — |
| | — |
|
| Total | | 5,816 |
| | $ | 8.30 |
| | 2,923 |
| | 3,562 |
| | $ | 9.91 |
| | 2,189 |
|
(1) Includes 5,1582,605 stock options, 181307 PSUs and 477650 RSUs granted to officers pursuant to the Omnibus Incentive Plan. Shares underlying RSUs and PSUs are deliverable without payment of any consideration, and therefore these awards have not been taken into account in calculating the weighted-average exercise price of outstanding options. PSUs are reflected at the target level of performance. For a description of the Omnibus Incentive Plan, see Note 4,5, ''Stock Incentive Plan'' to the accompanying consolidated financial statements included elsewhere in this Annual Report.
Recent Sales of Unregistered Securities
In October 2015, we issued 5,138 shares of our common stock to certain former employees upon exercise of vested options at a purchase price of $9.12 per share.
In November 2015, we issued 2,055 shares of our common stock to certain former employees upon exercise of vested options at a purchase price of $9.12 per share.
In December 2015, we issued 2,778 shares of our common stock to current employees in exchange for $25,350 in cash.
In December 2015, we issued 22,834 restricted stock units to 3 outside directors with a value of $13.14 per unit.
In January 2016, we issued 5,138 shares of our common stock to certain former employees upon exercise of vested options at a purchase price of $13.14 per share.
In January 2016, we issued 2,152 shares of our common stock to a current employee in exchange for $28,278 in cash.
The sales of the above securities were deemed to be exempt from registration under the Securities Act in reliance upon Section 4(2) of the Securities Act or Regulation D or Rule 701 promulgated thereunder, as transactions by an issuer not involving any public offering or pursuant to benefit plans and contracts relating to compensation as provided under Rule 701.
There were no underwriters employedsales of unregistered securities in connection with any of the transactions set forth as "Recent Sales of Unregistered Securities."fiscal 2018.
Item 6. Selected Financial Data
The following tables set forth selected historical financial data as of the dates and for the periods indicated. The selected historical consolidated financial data as of September 30, 20172018 and September 30, 20162017 and for the fiscal years ended September 30, 2017,2018, September 30, 20162017 and September 25, 201530, 2016 have been derived from our audited consolidated financial statements and related notes included elsewhere in this Annual Report. The selected historical consolidated financial data as of September 30, 2016, September 25, 2015 and September 26, 2014 and for the years ended September 26, 201425, 2015 and September 27, 201326, 2014 have been derived from our audited consolidated financial statements and related notes not included elsewhere in this Annual Report. The selected historical consolidated financial data as of September 27, 2013 has been derived from our unaudited consolidated financial statements and related notes not included elsewhere in this Annual Report. The selected financial data presented below should be read in conjunction with Item 7, ''Management's Discussion and Analysis of Financial Condition and Results of Operations'' and the consolidated financial statements and related notes included in Item 8, ''Financial Statements and Supplementary Data'' of this Annual Report on Form 10-K. Our historical results are not necessarily indicative of the results to be expected for any future period.
|
| | | | | | | | | | | | | | | | | | | |
| (in thousands, except per share data) | September 30, 2017 (1) | | September 30, 2016 | | September 25, 2015 (2) | | September 26, 2014 (3) | | September 27, 2013 (4) |
| Statement of Operations Data: | | | | | | | | | |
| Net sales | $ | 1,503,934 |
| | $ | 1,523,384 |
| | $ | 1,729,168 |
| | $ | 1,702,838 |
| | $ | 1,475,897 |
|
| Income (loss) from continuing operations | $ | 84,639 |
| | $ | 58,796 |
| | $ | (4,955 | ) | | $ | (73,948 | ) | | $ | (18,581 | ) |
| Loss from discontinued operations (net of tax) (5) | — |
| | — |
| | — |
| | — |
| | (42,654 | ) |
| Net income (loss) | $ | 84,639 |
| | $ | 58,796 |
| | $ | (4,955 | ) | | $ | (73,948 | ) | | $ | (61,235 | ) |
| Convertible preferred stock and dividends | $ | — |
| | $ | — |
| | $ | — |
| | $ | 29,055 |
| | $ | 47,234 |
|
| Income (loss) from continuing operations per share | | | | | | | | | |
| Basic | $ | 1.33 |
| | $ | 0.94 |
| | $ | (0.08 | ) | | $ | (2.02 | ) | | $ | (0.46 | ) |
| Diluted | $ | 1.27 |
| | $ | 0.94 |
| | $ | (0.08 | ) | | $ | (2.02 | ) | | $ | (0.46 | ) |
| Net income (loss) per share | | | | | | | | | |
| Basic | $ | 1.33 |
| | $ | 0.94 |
| | $ | (0.08 | ) | | $ | (2.02 | ) | | $ | (2.66 | ) |
| Diluted | $ | 1.27 |
| | $ | 0.94 |
| | $ | (0.08 | ) | | $ | (2.02 | ) | | $ | (2.66 | ) |
| Balance Sheet Data (at end of period): | | | | | | | | | |
| Cash and cash equivalents | $ | 45,718 |
| | $ | 200,279 |
| | $ | 80,598 |
| | $ | 33,360 |
| | $ | 54,770 |
|
| Total assets | 1,215,092 |
| | 1,164,568 |
| | 1,113,799 |
| | 1,185,419 |
| | 1,272,195 |
|
| Long-term obligations | 642,384 |
| | 702,500 |
| | 747,024 |
| | 735,060 |
| | 504,827 |
|
| Total equity | 360,871 |
| | 257,246 |
| | 156,277 |
| | 176,469 |
| | 510,377 |
|
| Cash Flow Data: | | | | | | | | | |
| Cash flows provided by (used in): | | | | | | | | | |
| Operating activities | $ | 121,654 |
| | $ | 156,646 |
| | $ | 141,073 |
| | $ | 86,333 |
| | $ | 35,424 |
|
| Investing activities | (205,833 | ) | | (12,895 | ) | | (46,641 | ) | | (48,860 | ) | | (87,252 | ) |
| Financing activities | (67,760 | ) | | (23,908 | ) | | (44,106 | ) | | (57,584 | ) | | 55,823 |
|
| Other Financial Data: | | | | | | | | | |
| Adjusted net sales (6) | $ | 1,503,934 |
| | $ | 1,515,568 |
| | $ | 1,550,575 |
| | $ | 1,510,150 |
| | $ | 1,277,175 |
|
| Adjusted EBITDA (7) | 227,608 |
| | 235,002 |
| | 163,950 |
| | 126,597 |
| | 111,559 |
|
| Adjusted EBITDA Margin (8) | 15.1 | % | | 15.5 | % | | 10.6 | % | | 8.4 | % | | 8.7 | % |
| Capital expenditures | 25,122 |
| | 16,830 |
| | 26,849 |
| | 24,362 |
| | 14,999 |
|
|
| | | | | | | | | | | | | | | | | | | |
| (in thousands, except per share data) | September 30, 2018 (1) | | September 30, 2017 (2) | | September 30, 2016 | | September 25, 2015 (3) | | September 26, 2014 (4) |
| Statement of Operations Data: | | | | | | | | | |
| Net sales | $ | 1,835,139 |
| | $ | 1,503,934 |
| | $ | 1,523,384 |
| | $ | 1,729,168 |
| | $ | 1,702,838 |
|
| Net income (loss) | $ | 136,645 |
| | $ | 84,639 |
| | $ | 58,796 |
| | $ | (4,955 | ) | | $ | (73,948 | ) |
| Convertible preferred stock and dividends | $ | — |
| | $ | — |
| | $ | — |
| | $ | — |
| | $ | 29,055 |
|
| Net income per share | | | | | | | | | |
| Basic | $ | 2.59 |
| | $ | 1.33 |
| | $ | 0.94 |
| | $ | (0.08 | ) | | $ | (2.02 | ) |
| Diluted | $ | 2.48 |
| | $ | 1.27 |
| | $ | 0.94 |
| | $ | (0.08 | ) | | $ | (2.02 | ) |
| Balance Sheet Data (at end of period): | | | | | | | | | |
| Cash and cash equivalents | $ | 126,662 |
| | $ | 45,718 |
| | $ | 200,279 |
| | $ | 80,598 |
| | $ | 33,360 |
|
| Total assets | $ | 1,324,060 |
| | $ | 1,215,092 |
| | $ | 1,164,568 |
| | $ | 1,113,799 |
| | $ | 1,185,419 |
|
| Long-term obligations | $ | 929,254 |
| | $ | 642,384 |
| | $ | 702,500 |
| | $ | 747,024 |
| | $ | 735,060 |
|
| Total equity | $ | 122,059 |
| | $ | 360,871 |
| | $ | 257,246 |
| | $ | 156,277 |
| | $ | 176,469 |
|
| Cash Flow Data: | | | | | | | | | |
| Cash flows provided by (used in): | | | | | | | | | |
| Operating activities | $ | 145,703 |
| | $ | 121,654 |
| | $ | 156,646 |
| | $ | 141,073 |
| | $ | 86,333 |
|
| Investing activities | $ | 2,514 |
| | $ | (205,833 | ) | | $ | (12,895 | ) | | $ | (46,641 | ) | | $ | (48,860 | ) |
| Financing activities | $ | (65,931 | ) | | $ | (67,760 | ) | | $ | (23,908 | ) | | $ | (44,106 | ) | | $ | (57,584 | ) |
| Other Financial Data: | | | | | | | | | |
| Adjusted net sales (5) | $ | 1,835,139 |
| | $ | 1,503,934 |
| | $ | 1,515,568 |
| | $ | 1,550,575 |
| | $ | 1,510,150 |
|
| Adjusted EBITDA (6) | $ | 271,549 |
| | $ | 227,608 |
| | $ | 235,002 |
| | $ | 163,950 |
| | $ | 126,597 |
|
| Adjusted EBITDA Margin (7) | 14.8 | % | | 15.1 | % | | 15.5 | % | | 10.6 | % | | 8.4 | % |
| Capital expenditures | $ | 38,501 |
| | $ | 25,122 |
| | $ | 16,830 |
| | $ | 26,849 |
| | $ | 24,362 |
|
|
| | | |
| (1 | ) | | Includes results of operations of Cii from January 8, 2018. See Note 2, "Acquisitions" to our audited consolidated financial statements included elsewhere in this Annual Report. Includes results of operations of FlexHead until March 30, 2018. See Note 3, "Divestitures" to our audited consolidated financial statements included elsewhere in this Annual Report. |
| (2 | ) | | Includes results of operations of Marco, Cable Management ("Marco"), Flexicon Limited ("Flexicon") and Calpipe Industries, LLC ("Calpipe") from May 18, 2017, September 1, 2017, and September 29, 2017 respectively. See Note 2, "Acquisitions" to our audited consolidated financial statements included elsewhere in this Annual Report. |
(23 | ) | | Includes results of operations of American Pipe & Plastics, Inc., or "APPI," and Steel Components, Inc., or "SCI," from October 20, 2014 and November 17, 2014, respectively. See Note 2, "Acquisitions" to our audited consolidated financial statements included elsewhere in this Annual Report. |
(34 | ) | | Includes results of operations of EP Lenders II, LLC d/b/a Ridgeline ("Ridgeline") from October 11, 2013. |
(4 | ) | | Includes results of operations of Heritage Plastics, Inc ("Heritage Plastics") and Liberty Plastics, LLC ("Liberty Plastics") from September 17, 2013. |
(5 | ) | | We divested our business in Brazil during fiscal 2013, which was reported as a discontinued operation. |
(6 | ) | | We present Adjusted net sales to facilitate comparisons of reported net sales from period to period. In August 2015, we announced plans to exit our Fence and Sprinkler steel pipe and tube product lines ("Fence and Sprinkler") in order to re-align our long-term strategic focus. These product lines were discontinued during the first quarter of fiscal 2016. We define Adjusted net sales as reported net sales excluding net sales directly attributable to Fence and Sprinkler. We believe Adjusted net sales is useful for investors because management uses Adjusted net sales as an operating measure to evaluate our ongoing business operations, which no longer include Fence and Sprinkler. Adjusted net sales has limitations as an analytical tool, and should not be considered in isolation or as an alternative to measures based on accounting principles generally accepted in the United States of America ("GAAP"), such as net sales or other financial statement data presented in our consolidated financial statements as an indicator of revenue. Because Adjusted net sales is not a measure determined in accordance with GAAP and is susceptible to varying calculations, Adjusted net sales, as presented, may not be comparable to other similarly titled measures of other companies. |
The following table sets forth a reconciliation of net sales to Adjusted net sales for the periods presented: |
| | | | | | | | | | | | | | | | | | | | |
| | | Fiscal year ended |
| (in thousands) | | September 30, 2017 | | September 30, 2016 | | September 25, 2015 | | September 26, 2014 | | September 27, 2013 |
| Net sales | | $ | 1,503,934 |
| | $ | 1,523,384 |
| | $ | 1,729,168 |
| | $ | 1,702,838 |
| | $ | 1,475,897 |
|
| Impact of Fence and Sprinkler exit | | — |
| | (7,816 | ) | | (178,593 | ) | | (192,688 | ) | | (198,722 | ) |
| Adjusted net sales | | $ | 1,503,934 |
| | $ | 1,515,568 |
| | $ | 1,550,575 |
| | $ | 1,510,150 |
| | $ | 1,277,175 |
|
|
| | | |
(76 | ) | | We define Adjusted EBITDA as net income (loss) before: loss from discontinued operations (net of income taxes), income tax expense (benefit), depreciation and amortization, interest expense, (net),net, loss (gain) on extinguishment of debt, income tax expense (benefit), restructuring and impairments, stock-based compensation, consulting fees, multi-employer pension withdrawal, certain legal matters, transaction costs, gain on sale of a business, gain on sale of joint venture and other items, such as inventory reserves and the impact from our Fenceadjustments and Sprinkler exit.realized or unrealized gain (loss) on foreign currency transactions. Prior to fiscal 2017, net income (loss) was also adjusted to exclude net periodic pension benefit costs and the impact from routine anti-microbial coated sprinkler pipe, or "ABF" product liability. These costs are no longer an adjustment to Adjusted EBITDA beginning in fiscal 2017. Prior fiscal years have not been revised for this change due to the relative insignificance and nature of the amounts. |
| | | We believe Adjusted EBITDA, when presented in conjunction with comparable GAAPaccounting principles generally accepted in the United States of America ("GAAP") measures, is useful for investors because management uses Adjusted EBITDA as a profitability measure in evaluating the performance of our business. |
|
| | |
| | | Adjusted EBITDA is not considered a measure of financial performance under GAAP and the items excluded therefrom are significant components in understanding and assessing our financial performance. Adjusted EBITDA has limitations as an analytical tool, and should not be considered in isolation or as an alternative to such GAAP measures as net income (loss), cash flows provided by or used in operating, investing or financing activities or other financial statement data presented in our consolidated financial statements as an indicator of financial performance or liquidity. Some of these limitations are: |
| | | |
| | • | Adjusted EBITDA does not reflect changes in, or cash requirements for, working capital needs; |
| | • | Adjusted EBITDA does not reflect interest expense, or the requirements necessary to service interest or principal payments on debt; |
| | • | Adjusted EBITDA does not reflect income tax expense (benefit) or the cash requirements to pay taxes; |
| | • | Adjusted EBITDA does not reflect historical cash expenditures or future requirements for capital expenditures or contractual commitments; and |
| • | although depreciation and amortization charges are non-cash charges, the assets being depreciated and amortized will often have to be replaced in the future, and Adjusted EBITDA does not reflect any cash requirements for such replacements. |
| | Because Adjusted EBITDA is not a measure determined in accordance with GAAP and is susceptible to varying calculations, Adjusted EBITDA, as presented, may not be comparable to other similarly titled measures of other companies. |
| | |
| (7 | ) | | We define Adjusted EBITDA Margin as Adjusted EBITDA as a percentage of net sales. |
BecauseThe following table sets forth a reconciliation of net sales to Adjusted EBITDA is not a measure determined in accordance with GAAP and is susceptible to varying calculations, Adjusted EBITDA, as presented, may not be comparable to other similarly titled measures of other companies.net sales for the periods presented:
|
| | | | | | | | | | | | | | | | | | | | |
| | | Fiscal year ended |
| (in thousands) | | September 30, 2018 | | September 30, 2017 | | September 30, 2016 | | September 25, 2015 | | September 26, 2014 |
| Net sales | | $ | 1,835,139 |
| | $ | 1,503,934 |
| | $ | 1,523,384 |
| | $ | 1,729,168 |
| | $ | 1,702,838 |
|
| Impact of Fence and Sprinkler exit | | — |
| | — |
| | (7,816 | ) | | (178,593 | ) | | (192,688 | ) |
| Adjusted net sales | | $ | 1,835,139 |
| | $ | 1,503,934 |
| | $ | 1,515,568 |
| | $ | 1,550,575 |
| | $ | 1,510,150 |
|
The following table sets forth a reconciliation of net income (loss) to Adjusted EBITDA for the periods presented: | | | | | Fiscal year ended | | Fiscal year ended |
| (in thousands) | | September 30, 2017 | | September 30, 2016 | | September 25, 2015 | | September 26, 2014 | | September 27, 2013 | | September 30, 2018 | | September 30, 2017 | | September 30, 2016 | | September 25, 2015 | | September 26, 2014 |
| Net income (loss) | | $ | 84,639 |
| | $ | 58,796 |
| | $ | (4,955 | ) | | $ | (73,948 | ) | | $ | (61,235 | ) | | $ | 136,645 |
| | $ | 84,639 |
| | $ | 58,796 |
| | $ | (4,955 | ) | | $ | (73,948 | ) |
| Loss from discontinued operations, net of income tax (expense) benefit | | — |
| | — |
| | — |
| | — |
| | 42,654 |
| |
| Income tax expense (benefit) | | 41,486 |
| | 27,985 |
| | (2,916 | ) | | (32,939 | ) | | (2,966 | ) | | 29,707 |
| | 41,486 |
| | 27,985 |
| | (2,916 | ) | | (32,939 | ) |
| Depreciation and amortization | | 54,727 |
| | 55,017 |
| | 59,465 |
| | 58,695 |
| | 48,412 |
| | 66,890 |
| | 54,727 |
| | 55,017 |
| | 59,465 |
| | 58,695 |
|
| Interest expense, net | | 26,598 |
| | 41,798 |
| | 44,809 |
| | 44,266 |
| | 47,869 |
| | 40,694 |
| | 26,598 |
| | 41,798 |
| | 44,809 |
| | 44,266 |
|
| Loss (gain) on extinguishment of debt | | 9,805 |
| | (1,661 | ) | | — |
| | 43,667 |
| | — |
| | — |
| | 9,805 |
| | (1,661 | ) | | — |
| | 43,667 |
|
| Restructuring & impairments (a) | | 1,256 |
| | 4,096 |
| | 32,703 |
| | 46,687 |
| | 10,931 |
| | 1,849 |
| | 1,256 |
| | 4,096 |
| | 32,703 |
| | 46,687 |
|
| Net periodic pension benefit cost (b) | | — |
| | 441 |
| | 578 |
| | 1,368 |
| | 3,371 |
| | — |
| | — |
| | 441 |
| | 578 |
| | 1,368 |
|
| Stock-based compensation (c) | | 12,788 |
| | 21,127 |
| | 13,523 |
| | 8,398 |
| | 2,199 |
| | 14,664 |
| | 12,788 |
| | 21,127 |
| | 13,523 |
| | 8,398 |
|
ABF product liability impact (d) | | — |
| | 850 |
| | (216 | ) | | 2,841 |
| | 1,383 |
| | — |
| | — |
| | 850 |
| | (216 | ) | | 2,841 |
|
| Consulting fees (e) | | — |
| | 15,425 |
| | 3,500 |
| | 4,854 |
| | 6,000 |
| | — |
| | — |
| | 15,425 |
| | 3,500 |
| | 4,854 |
|
| Multi-employer pension withdrawal (f) | | — |
| | — |
| | — |
| | — |
| | 7,290 |
| |
| Legal matters (g) | | 7,551 |
| | 1,382 |
| | — |
| | — |
| | — |
| |
| Transaction costs (h) | | 4,779 |
| | 7,832 |
| | 6,039 |
| | 5,049 |
| | 1,780 |
| |
| Legal matters (f) | | | (4,833 | ) | | 7,551 |
| | 1,382 |
| | — |
| | — |
|
| Transaction costs (g) | | | 9,314 |
| | 4,779 |
| | 7,832 |
| | 6,039 |
| | 5,049 |
|
| Gain on sale of a business (h) | | | (27,575 | ) | | — |
| | — |
| | — |
| | — |
|
| Gain on sale of joint venture (i) | | (5,774 | ) | | — |
| | — |
| | — |
| | — |
| | — |
| | (5,774 | ) | | — |
| | — |
| | — |
|
| Other (j) | | (10,247 | ) | | 1,103 |
| | 14,305 |
| | 12,656 |
| | 7,685 |
| | 4,194 |
| | (10,247 | ) | | 1,103 |
| | 14,305 |
| | 12,656 |
|
| Impact of Fence and Sprinkler exit (k) | | — |
| | 811 |
| | (2,885 | ) | | 5,003 |
| | (3,814 | ) | | — |
| | — |
| | 811 |
| | (2,885 | ) | | 5,003 |
|
| Adjusted EBITDA | | $ | 227,608 |
| | $ | 235,002 |
| | $ | 163,950 |
| | $ | 126,597 |
| | $ | 111,559 |
| | $ | 271,549 |
| | $ | 227,608 |
| | $ | 235,002 |
| | $ | 163,950 |
| | $ | 126,597 |
|
| | | | | | | | | | | | | | | | | | | | | |
|
| |
| (a) | Restructuring amounts represent exit or disposal costs including termination benefits and facility closure costs. Impairment amounts represent write-downs of goodwill, intangible assets and/or current or long-lived assets. See Note 5,6, ''Restructuring Charges and Asset Impairments'' and Note 13, ''Goodwill and Intangible Assets'' to our consolidated financial statements for further detail. |
| (b) | Through fiscal 2016, represents pension costs in excess of cash funding for pension obligations in the period. Beginning in fiscal 2017, the Company has not excluded net periodic pension benefit cost from Adjusted EBITDA. Prior years have not been revised for this change due to the relative insignificance and nature of these amounts. See Note 3,4, ''Postretirement Benefits'' to our consolidated financial statements for further detail. |
| (c) | Represents stock-based compensation expenses related to stock option awards, performance stock awards and restricted stock awards. See Note 4,5, ''Stock Incentive Plan'' to our consolidated financial statements for further detail. |
| (d) | Through fiscal 2016, represents changes in the Company's estimated exposure to ABF matters. Beginning in fiscal 2017, the company has excluded the costs incurred with the routine ABF product liability from Adjusted EBITDA. Prior years have not been revised for this change due to the relative insignificance and nature of these amounts. See Note 16, ''Commitments and Contingencies'' to our consolidated financial statements for further detail. |
| (e) | Represents amounts paid to CD&R and, until April 9, 2014, to Tyco. The CD&R consulting agreement was terminated on June 15, 2016. See Note 18, ''Related Party Transactions'' to our consolidated financial statements for further detail. |
| (f) | Represents our proportional share of a multi-employer pension liability from which we withdrew in fiscal 2013. See Note 3, ''Postretirement Benefits'' to our consolidated financial statements for further detail. |
(g) | Represents certain legal matters.matters of an unusual or non recurring nature. See Note 16, ''Commitments and Contingencies'' to our consolidated financial statements for further detail. |
(h)(g) | Represents expenses related to our initial public offering ("IPO"), secondary offerings and acquisition and divestiture-related activities. See Note 1, ''Basis of Presentation and Summary of Significant Accounting Policies'' and Note 2, ''Acquisitions'' to our consolidated financial statements for further detail. |
| (h) | Represents pre-tax gain on sale of the assets of FlexHead on March 30, 2018. See Note 3, ''Divestitures'' to our consolidated financial statements for further detail. |
| (i) | Represents gain on sale of Abahsain-Cope Saudi Arabia Ltd. joint venture. See Note 11, ''Assets Held for Sale'' to our consolidated financial statements for further detail. |
| (j) | Represents other items, such as inventory reserves and adjustments, realized or unrealized gain (loss) on foreign currency transactions and release of indemnified uncertain tax positions. |
| (k) | Represents historical performance of Fence and Sprinkler and related operating costs. |
|
| | | |
(8 | ) | | We define Adjusted EBITDA Margin as Adjusted EBITDA as a percentage of Net sales. |
Item 7. Management's Discussion and Analysis of Financial Condition and Results of Operations
The following information should be read in conjunction with the accompanying consolidated financial statements and related notes included in this Annual Report.
The following discussion may contain forward-looking statements that reflect our plans, estimates and beliefs. Our actual results could differ materially from those discussed in these forward-looking statements. Factors that could cause or contribute to these differences include those factors discussed below and elsewhere in this report, particularly in "Special Note Regarding Forward-Looking Statements and Information" and "Risk Factors" included elsewhere in this Annual Report. The percentages provided below reflect rounding adjustments. Accordingly, figures expressed as percentages when aggregated may not be the arithmetic sum of the percentages that precede them.
Business Factors Influencing our Results of Operations
We are a leading manufacturer of Electrical Raceway products primarily for the non-residential construction and renovation markets and MP&S for the construction and industrial markets. Electrical Raceway products form the critical infrastructure that enables the deployment, isolation and protection of a structure's electrical circuitry from the original power source to the final outlet. MP&S frame, support and secure component parts in a broad range of structures, equipment and systems in electrical, industrial and construction applications. We believe we hold #1 or #2 positions in the United States by net sales in the vast majority of our products. The quality of our products, the strength of our brands and our scale and presence provide what we believe to be a unique set of competitive advantages that position us for profitable growth.
The following factors may affect our results of operations in any given period:
Economic Conditions. Our business depends on demand from customers across various end markets, including wholesale distributors, OEMs, retail distributors and general contractors. Our products are primarily used by trade contractors in the construction and renovation of non-residential structures such as commercial office buildings, healthcare facilities and manufacturing plants. In fiscal 2017, 91%2018, 90% of our net sales were to customers located in the United States. As a result, our business is heavily dependent on the health of the United States economy, in general, and on United States non-residential construction activity, in particular. A stronger United States economy and robust non-residential construction generally increase demand for our products.
We believe that our business and demand for our products is influenced by two main economic indicators: United States gross domestic product, or "GDP," and non-residential construction starts, measured in square footage. The United States non-residential construction market has experienced modest growth over the past few years, in line with United States GDP. Our historic results have been positively impacted by growth in the non-residential construction market, as such growth leads to greater demand for our products. MR&R activity generally increases and represents a greater share of non-residential construction activity during challenging periods in the economic or construction cycle. During those periods, our MR&R demand as a percentage of total demand typically increases, providing a more consistent revenue stream for our business.
Raw Materials. We use a variety of raw materials in the manufacture of our products, which primarily include steel, copper and PVC resin. We believe that sources for these raw materials are well established, generally available and are in sufficient quantity that we may avoid disruption in our business. The cost to procure these raw materials is subject to price fluctuations, often as a result of macroeconomic conditions. Our cost of sales may be affected by changes in the market price of these materials, and to a lesser extent, other commodities, such as zinc, aluminum, electricity, natural gas and diesel fuel. The prices at which we sell our products may adjust upward or downward based on raw material price changes. We believe several factors drive the pricing of our products, including the quality of our products, the ability to meet customer delivery expectations and co-loading capabilities, as well as the prices of our raw material inputs. Historically, we have not engaged in hedging strategies for raw material purchases. Our results may be impacted by inventory liquidations at costs higher or lower than current prices we pay for similar items.
Working Capital. Our working capital requirements are impacted by our operational activities. Our inventory levels may be impacted from time to time, due to delivery lead times from our suppliers. We are typically obligated to pay for our raw material purchases within 10 and 30 days of their receipt, while we generally collect cash from the sale of our manufactured products between 40 and 50 days from the point at which title and risk of loss transfers. Our average working capital days during fiscal 20172018 was 6862 days.
Seasonality. In a typical year, our operating results are impacted by seasonality. Historically, sales of our products have been higher in the third and fourth quarters of each fiscal year due to favorable weather for construction-related activities.
Recent Acquisitions. In addition to our organic growth, we have transformed the Company through acquisitions in recent years, allowing us to expand our product offerings with existing and new customers. In accordance with GAAP, the results of our acquisitions are reflected in our financial statements from the date of each acquisition forward.
Our acquisition strategy has focused primarily on growing market share by complementing our existing portfolio with synergistic products and expanding into end-markets that we have not previously served. In total, we have invested over $400 million in acquisitions since 2011.
In 2012, we acquired Flexhead Industries, or "Flexhead," a leading manufacturer of flexible sprinkler drops that provided a set of higher margin, value-added products to our MP&S portfolio. Flexhead's products provide engineers, architects, contractors and building owners with solutions for rapid installation, simple relocation and system versatility for commercial ceilings applications.
Product diversification has been a core element to our growth strategy. Prior to 2013, our Electrical Raceway offering primarily consisted of steel and copper products. At that time, we produced PVC conduit from a single facility in Georgia, and we did not have a meaningful presence in the market. In 2013 and 2014, we completed the acquisitions of Heritage Plastics, Liberty Plastics, Ridgeline and APPI, which significantly increased our portfolio of PVC products, including PVC conduit, fittings, elbows and sweeps. The additional scale, which included new operations in the Northeast, Midwest, Southwest and Western United States, enabled us to more comprehensively serve our largest electrical distribution customers in this product line and significantly increased our market share and presence in the Electrical Raceway market. These acquisitions also substantially increased our cross-selling opportunities, providing a meaningful avenue for growth going forward.
In 2015, we acquired SCI, a manufacturer of electrical fittings for steel, flexible and liquidtight conduit as well as armored cable. SCI enhanced the breadth of our product portfolio and is representative of the opportunities we have in our fragmented markets to add complementary products that will further support our growth and customer value proposition.
On May 18, 2017, we acquired Marco Cable Management ("Marco"), a leading designer and manufacturer of wire basket cable tray, PVC trunking and aluminum power poles. Marco's product portfolio adds value to our electrical distribution partners in the United Kingdom and expands the Company's presence in the United Kingdom and the rest of Europe.
On September 1, 2017, we acquired Flexicon Limited ("Flexicon"), a leading global manufacturer of metallic and non-metallic flexible cable protection systems that carry many international and market product approvals and serves the industrial, commercial and infrastructure sectors in more than 55 countries.
On September 29, 2017, we acquired Calpipe Industries, LLC ("Calpipe"), a market leader for electrical conduit systems for corrosive environments and bollards for high security, access control and architectural environments.
On January 8, 2018, we acquired the assets of Communications Integrators, Inc. ("Cii"), a manufacturer of modular, prefabricated power, voice and data distribution systems.
We expect to continue to pursue synergistic acquisitions as part of our growth strategy to expand our product offerings.
See Note 2, ''Acquisitions'' to the accompanying consolidated financial statements included elsewhere in this Annual Report.
Divestitures and Restructurings. Since 2011, we have continuously evaluated our operations to ensure that we are investing resources strategically. Our assessment has included existing operating performance, required levels of investment to improve performance and the overall complexities of doing business in certain markets and geographic regions. After careful consideration, we streamlined our business through a combination of business divestitures, asset sales and the exit of certain product lines.
In 2012, we sold our interest in a joint venture in Saudi Arabia that represented our only investment in the Middle East because we determined that it did not provide sufficient earnings or strategic value. During that same year, we also sold two low-margin, commodity-oriented businesses in the United States for which we had limited market presence or competitive differentiation—our hollow structural tube business based in Morrisville, Pennsylvania and our sprinkler system fabrication business. During 2013, we further reduced our non-domestic footprint by closing one facility in Brazil, selling the remainder of our Brazilian operations and closing our Acroba subsidiary in France.
In 2015, we exited Fence and Sprinkler, two product lines that did not align with our long-term vision due to limited product differentiation, exposure to significant import competition, ongoing price pressure due to overcapacity in the market and having different channels to market than our Electrical Raceway and MP&S segments. In conjunction with the exit from Fence and Sprinkler, we evaluated the viability of a Philadelphia, Pennsylvania manufacturing facility and determined that significant investment would be required to bring that facility to an acceptable level of operation. Given our ability to shift ongoing production capacity from that facility to other existing facilities, we closed this facility in the first quarter of fiscal 2016. Neither Fence nor Sprinkler constituted a component, with a significance level that would have requiredthus not requiring presentation as discontinued operations. On March 30, 2018, we sold the assets of FlexHead Industries, Inc. and SprinkFLEX, LLC (together "Flexhead").
See Note 5,3, ''Divestitures'' and Note 6, ''Restructuring Charges and Asset Impairments'' and Note 11, ''Assets Held for Sale'' to the accompanying consolidated financial statements included elsewhere in this Annual Report.
Initial Public Offering. On June 9, 2016, our registration statement on Form S-1 for our IPO was declared effective by the SEC. On June 15, 2016, we completed the offering of 12,000,000 shares of our common stock at a price of $16.00 per share. In a series of secondary offerings during fiscal 2017, the CD&R Investor sold an aggregate 19,550,000 shares of our common stock. The CD&R Investor received all of the net proceeds and bore all commissions and discounts from the sale of our common stock. We did not receive any proceeds from the shares sold in the IPO or secondary offerings.
Foreign Currencies. In fiscal 2017,2018, approximately 9%10% of our net sales came from customers located outside the United States, most of which were foreign currency sales denominated in British pounds sterling, Canadian dollars, Australian dollars, Chinese Yuan and New Zealand dollars. The functional currency of our operations outside the United States is generally the local currency. Assets and liabilities of our non-U.S. subsidiaries are translated into United States dollars using period-end exchange rates. Foreign revenue and expenses are translated at the monthly average exchange rates in effect during the period. Foreign currency translation adjustments are included as a component of accumulated other comprehensive loss within our statements of comprehensive income (loss). See "Quantitative and Qualitative Disclosures about Market Risk—Foreign Currency Risk."
See Note 1, ''Basis of Presentation and Summary of Significant Accounting Policies'' to the accompanying consolidated financial statements included elsewhere in this Annual Report.
Emerging Industry Trends. In addition to United States GDP and non-residential construction starts, there are emerging industry trends that we believe will drive further demand for our products. These include new building technologies which enhance facility management, such as automation and LED lighting systems, as well as the rapid expansion of certain non-residential construction categories, including data centers and healthcare facilities. In recent years, technological advancements aimed at improving facility management have been driven by a number of factors, including integration and interoperability, the proliferation of the Internet and associated increases in data and power requirements and a desire to reduce costs through improved energy efficiency, lighting systems and operating effectiveness. We believe that these trends will drive greater needs for electrical capacity and circuitry, increasing the demand for many of our products. We also target high growth end-markets that are projected to experience rapid growth and to drive demand for our products, including our framing and support products. According to Dodge non-residential construction data, healthcare sector construction activity is projected to grow at a compound annual growth rate ("CAGR") of 10.3%7.4% between 20172018 and 2019.2020. Lastly, based on third-party data, growth in the data center construction market in the United States is forecast to grow at a CAGR of 4.2% between 20152017 and 20202023 and, between 20162017 and 2021,2022, the building lighting control systems market in the United States is forecast to grow at a CAGR of 5%5.9%, while the LED lighting market in North America is forecast to grow at a CAGR of 13%.12% between 2018 and 2022.
Reportable Segments
We operate our business through two operating segments which are also our reportable segments: Electrical Raceway and MP&S. Our operating segments are organized based on primary market channel and, in most instances, the end use of products. We review the results of our operating segments separately for the purposes of making decisions about resource allocation and performance assessment. We evaluate performance on the basis of net sales, Adjusted net sales and Adjusted EBITDA. See Note 19, ''Segment Information'' to the accompanying consolidated financial statements included elsewhere in this Annual Report.
Effective in the fourth quarter of fiscal 2017, the Company implemented a realignment of its segment financial reporting structure such that its international businesses within EMEA and APAC are now reflected in its Electrical Raceway segment. These businesses were previously reflected within the MP&S segment. See Note 1, ''Basis of Presentation and Summary of Significant Accounting Policies'' for additional information. Prior year results have been revised for the impact of the realignment for comparability.
Fiscal Year
Starting in fiscal 2016, the Company has a fiscal year that ends on September 30. Prior to fiscal 2016, the fiscal year ended on the last Friday in September. Fiscal year 20172018 and 20152017 were 52-week fiscal years which ended on September 30, 20172018 and September 25, 2015,30, 2017, respectively. Fiscal year 2016 was a 53-week fiscal year which ended on September 30, 2016. Our fiscal quarters end on the last Friday in December, March and June.
Key Components of Results of Operations
Net sales
Net sales represents external sales of Electrical Raceway products to the non-residential construction and MR&R markets and MP&S products and solutions to the commercial and industrial markets. Net sales includes gross product sales and freight billed to our customers, net of allowances for rebates, sales incentives, trade promotions, product returns and discounts.
Adjusted net sales
For further discussion on Adjusted net sales, including definitions thereof and reconciliations of net sales to Adjusted net sales, see Item 6, ''Selected Financial Data''.
Cost of sales
Cost of sales includes all costs directly related to the production of goods for sale. These costs include direct material, direct labor, production related overheads, excess and obsolescence costs, lower-of-cost-or-market provisions, freight and distribution costs and the depreciation and amortization of assets directly used in the production of goods for sale.
Selling, general and administrative expenses
Selling, general and administrative costs includesexpenses include payroll related expenses including salaries, wages, employee benefits, payroll taxes, variable cash compensation for both administrative and selling personnel and consulting and professional services fees and other costs incurred in becoming a public company.fees. Also included are compensation expense for share-based awards, restructuring-related charges, third-party professional services and translation gains or losses for foreign currency trade transactions.
Adjusted EBITDA and Adjusted EBITDA Margin
For further discussion on Adjusted EBITDA and Adjusted EBITDA Margin, including definitions thereof and reconciliations of net income (loss) to Adjusted EBITDA, see Item 6, ''Selected Financial Data''.
Results of Operations
Fiscal 2018 Compared to Fiscal 2017
The results of operations for the fiscal years ended September 30, 2018 and September 30, 2017 were as follows: |
| | | | | | | | | | | | | | |
| | Fiscal year ended | | | |
| ($ in thousands) | September 30, 2018 | | September 30, 2017 As Adjusted** | | Change ($) | | Change (%) |
| Net sales | $ | 1,835,139 |
| | $ | 1,503,934 |
| | $ | 331,205 |
| | 22.0 | % |
| Cost of sales | 1,397,055 |
| | 1,142,664 |
| | 254,391 |
| | 22.3 | % |
| Gross profit | 438,084 |
| | 361,270 |
| | 76,814 |
| | 21.3 | % |
| Selling, general and administrative | 226,282 |
| | 182,910 |
| | 43,372 |
| | 23.7 | % |
| Intangible asset amortization | 32,104 |
| | 22,407 |
| | 9,697 |
| | 43.3 | % |
| Operating income | 179,698 |
| | 155,953 |
| | 23,745 |
| | 15.2 | % |
| Interest expense, net | 40,694 |
| | 26,598 |
| | 14,096 |
| | 53.0 | % |
| Loss on extinguishment of debt | — |
| | 9,805 |
| | (9,805 | ) | | * |
|
| Other income, net | (27,348 | ) | | (6,575 | ) | | (20,773 | ) | | 315.9 | % |
| Income before income taxes | 166,352 |
| | 126,125 |
| | 40,227 |
| | 31.9 | % |
| Income tax expense | 29,707 |
| | 41,486 |
| | (11,779 | ) | | (28.4 | )% |
| Net income | $ | 136,645 |
| | $ | 84,639 |
| | $ | 52,006 |
| | 61.4 | % |
| Non-GAAP financial data | | | | |
|
| | |
| Adjusted EBITDA | $ | 271,549 |
| | $ | 227,608 |
| | $ | 43,941 |
| | 19.3 | % |
| Adjusted EBITDA Margin | 14.8 | % | | 15.1 | % | |
|
| | |
| * Not meaningful | | | | | | | |
**As adjusted due to the adoption of ASU 2017-07. See Note 1, ''Basis of Presentation and Summary of Significant Accounting Policies'' for additional information. |
Net sales
|
| | | |
| | Change (%) |
| Volume | | 3.4 | % |
| Average selling prices | | 11.0 | % |
| Foreign exchange | | 0.4 | % |
| Acquisitions | | 7.2 | % |
| Net sales | | 22.0 | % |
Net sales for fiscal 2018 increased $331.2 million to $1,835.1 million, an increase of 22.0% compared to $1,503.9 million for fiscal 2017. Net sales increased by $165.6 million due to increased average market prices for the Metal and PVC electrical conduit and fittings product categories and the pass-through impact of higher average input costs of steel, copper, and freight. Additionally, net sales increased $118.5 million due to the acquisitions of Marco, Flexicon and Calpipe during fiscal 2017 and Cii during fiscal 2018, partially offset by a decrease in net sales of $10.0 million resulting from the divestiture of Flexhead. Lastly, net sales increased by $51.8 million due to higher volume of products primarily from the mechanical pipe and metal framing and fittings product categories sold within the Mechanical Products & Solutions segment.
Cost of sales
|
| | | |
| | Change (%) |
| Volume | | 3.8 | % |
| Average input costs | | 8.1 | % |
| Foreign exchange | | 0.4 | % |
| Acquisitions and divestitures | | 5.9 | % |
| Other | | 4.1 | % |
| Cost of sales | | 22.3 | % |
Cost of sales increased by $254.4 million, or 22.3% to $1,397.1 million for fiscal 2018 compared to $1,142.7 million for fiscal 2017. Cost of sales primarily increased due to higher average input costs of steel and copper of $92.5 million. Additionally, cost of sales increased $73.9 million due to the acquisitions of Marco, Flexicon, and Calpipe during fiscal 2017 and Cii during fiscal 2018, partially offset by a decrease in cost of sales of $6.6 million resulting from the divestiture of Flexhead. Cost of sales also increased $43.7 million due to higher volume of products primarily from the mechanical pipe and metal framing and fittings product categories sold within the Mechanical Products & Solutions segment. Lastly, cost of sales increased due to higher other cost of sales related to freight costs of $33.4 million resulting from a tighter freight market.
Selling, general and administrative
Selling, general and administrative expenses increased $43.4 million, or 23.7%, to $226.3 million for fiscal 2018 compared to $182.9 million for fiscal 2017. The Company had $26.0 million in additional expenses due to the acquisitions of Marco, Flexicon, and Calpipe during fiscal 2017 and Cii during fiscal 2018, partially offset by a decrease in expenses of $1.5 million resulting from the divestiture of Flexhead. Incentive-based compensation and stock-based compensation expense increased $9.9 million and $1.9 million, respectively during fiscal 2018 compared to fiscal 2017, due to stronger operating results, additional grants in fiscal 2018, and the modification of a key executive's awards. Additionally, the Company recorded $5.0 million of higher commissions expense due to the increase in sales volume compared to the prior year. The increase in expense is partially offset by the $7.2 million pre- tax reversal of expense related to the Antidumping Duty Order for Malleable Iron Pipe Fittings.
Intangible asset amortization
Intangible asset amortization expense increased $9.7 million, or 43.3% to $32.1 million for fiscal 2018 compared to $22.4 million for fiscal 2017 due to the acquisitions of Marco, Flexicon, and Calpipe during fiscal 2017 and Cii during fiscal 2018.
Interest expense, net
Interest expense, net, increased $14.1 million, or 53.0% to $40.7 million for fiscal 2018, compared to $26.6 million for fiscal 2017. The increase is primarily due to our debt refinancing transactions on February 2, 2018, which resulted in additional borrowings of $425.0 million. The Company used the proceeds to 1) repurchase approximately 17.2 million shares of common stock from CD&R Allied Holdings, L.P. ("the CD&R Investor") for a total purchase price of approximately $375 million, 2) repay $42.0 million of outstanding loans under the ABL Credit Facility and 3) pay $5.8 million in related fees and expenses. See Note 14, ''Debt'' to the accompanying consolidated financial statements included elsewhere in this Annual Report.
Loss (gain) on extinguishment of debt
The Companyrecorded a loss on the extinguishment of debt of $9.8 million during September 30, 2017 related to the December 22, 2016 debt refinancing transaction. See Note 14, ''Debt'' to the accompanying consolidated financial statements included elsewhere in this Annual Report.
Other income, net
On March 30, 2018, the Company sold the assets of FlexHead Industries, Inc. and SprinkFLEX, LLC (together "Flexhead"). The Company recognized a pre-tax gain of $27.6 million. During fiscal 2017, we recognized a pre-tax gain of $5.8 million on the sale of the minority ownership share in Abahsain-Cope Saudi Arabia Ltd. when transfer of ownership
was completed. See Note 3, ''Divestitures'' and Note 7, ''Other Income, net'' to the accompanying consolidated financial statements included elsewhere in this Annual Report.
Income tax expense
Income tax expense decreased $11.8 million, to $29.7 million, compared to $41.5 million for fiscal 2017. The Company's income tax rate decreased to 17.9% for fiscal 2018, compared to 32.9% for fiscal 2017. The decrease in the effective tax rate was primarily due to the reduction of the federal statutory rate from 35% to 21% as a result of the enactment of new tax legislation, TCJA, on December 22, 2017, the remeasurement of the deferred tax liabilities as a result of the TCJA, and a net tax benefit from the release of indemnified tax positions. See Note 8, ''Income Taxes'' to the accompanying consolidated financial statements included elsewhere in this Annual Report.
Net income
Net income increased by $52.0 million to $136.6 million for fiscal 2018, as compared to $84.6 million for fiscal 2017. The increase in net income was primarily driven by the gain on the divestiture of Flexhead of $27.6 million, higher operating income of $14.1 million, and lower tax expense of $11.8 million.
Adjusted EBITDA
Adjusted EBITDA increased by $43.9 million or 19.3%, to $271.5 million for fiscal 2018, as compared to $227.6 million for fiscal 2017. The increase was primarily due to higher gross profit, partially offset by higher selling, general and administrative expenses attributed to acquisitions in fiscal 2018 and 2017.
Segment results
|
| | | | | | | | | | | | | | | |
| | | Fiscal year ended | | | |
| ($ in thousands) | | September 30, 2018 | | September 30, 2017 | | Change ($) | | Change (%) |
| Net sales | | $ | 1,366,611 |
| | $ | 1,094,783 |
| | $ | 271,828 |
| | 24.8 | % |
| Adjusted EBITDA | | 255,260 |
| | 189,351 |
| | 65,909 |
| | 34.8 | % |
| Adjusted EBITDA Margin | | 18.7 | % | | 17.3 | % | | | | |
Net sales
|
| | |
| Change (%) |
| Volume | 0.5 | % |
| Average selling prices | 13.0 | % |
| Foreign exchange | 0.5 | % |
| Acquisitions | 10.8 | % |
| Net sales | 24.8 | % |
Net sales increased $271.8 million, or 24.8%, to $1,366.6 million for fiscal 2018 compared to $1,094.8 million for fiscal 2017. The increase was primarily due to increased average market prices for the Metal and PVC electrical conduit and fittings product categories and the pass-through impact of higher average input costs of steel, copper, and freight of $142.3 million. Additionally, net sales increased by $118.5 million resulting from acquisitions during fiscal 2017 and fiscal 2018.
Adjusted EBITDA
Adjusted EBITDA increased $65.9 million, or 34.8%, to $255.3 million for fiscal 2018 compared to $189.4 million for fiscal 2017. The increase in Adjusted EBITDA was largely due to higher gross profit from increased average market prices for the Metal and PVC electrical conduit and fittings product categories and incremental Adjusted EBITDA resulting from acquisitions. The increase in Adjusted EBITDA was partially offset by an increase in freight costs and selling, general and administrative expenses attributed to acquisitions in fiscal 2018 and 2017.
Mechanical Products & Solutions |
| | | | | | | | | | | | | | | |
| | | Fiscal year ended | | | |
| ($ in thousands) | | September 30, 2018 | | September 30, 2017 | | Change ($) | | Change (%) |
| Net sales | | $ | 470,153 |
| | $ | 410,532 |
| | $ | 59,621 |
| | 14.5 | % |
| Adjusted EBITDA | | $ | 51,339 |
| | $ | 63,687 |
| | $ | (12,348 | ) | | (19.4 | )% |
| Adjusted EBITDA Margin | | 10.9 | % | | 15.5 | % | | | | |
Net sales
|
| | | |
| | Change (%) |
| Volume | | 11.2 | % |
| Average selling prices | | 5.7 |
|
| Divestitures | | (2.4 | ) |
| Net sales | | 14.5 | % |
Net sales increased $59.6 million, or 14.5% to $470.2 million for fiscal 2018 compared to $410.5 million for fiscal 2017. The increase in net sales was primarily due to $46.2 million of higher volume of products sold within the mechanical pipe and metal framing and fittings product categories as well as higher average selling prices of $23.3 million, partially offset by a decrease in net sales of $10.0 million resulting from the Flexhead divestiture.
Adjusted EBITDA
Adjusted EBITDA decreased $12.3 million, or 19.4%, to $51.3 million for fiscal 2018 compared to $63.7 million for fiscal 2017. Adjusted EBITDA decreased due to an increase in average input costs, which exceeded the increase in average selling prices, and a decrease attributed to the sale of Flexhead, partially offset by higher volume of product categories sold.
Fiscal 2017 Compared to Fiscal 2016
The results of operations for the fiscal years ended September 30, 2017 and September 30, 2016 were as follows: | | | | Fiscal year ended | | | | | Fiscal year ended | | | |
| ($ in thousands) | September 30, 2017 | | September 30, 2016 | | Change ($) | | Change (%) | | September 30, 2017 As Adjusted** | | September 30, 2016 As Adjusted** | | Change ($) | | Change (%) |
| Net sales | $ | 1,503,934 |
| | $ | 1,523,384 |
| | $ | (19,450 | ) | | (1.3 | )% | | $ | 1,503,934 |
| | $ | 1,523,384 |
| | $ | (19,450 | ) | | (1.3 | )% |
| Cost of sales | 1,141,302 |
| | 1,154,702 |
| | (13,400 | ) | | (1.2 | ) | | 1,142,664 |
| | 1,155,808 |
| | (13,144 | ) | | (1.1 | )% |
| Gross profit | 362,632 |
| | 368,682 |
| | (6,050 | ) | | (1.6 | ) | | 361,270 |
| | 367,576 |
| | (6,306 | ) | | (1.7 | )% |
| Selling, general and administrative | 182,768 |
| | 219,397 |
| | (36,629 | ) | | (16.7 | ) | | 182,910 |
| | 219,743 |
| | (36,833 | ) | | (16.8 | )% |
| Intangible asset amortization | 22,407 |
| | 22,238 |
| | 169 |
| | 0.8 |
| | 22,407 |
| | 22,238 |
| | 169 |
| | 0.8 | % |
| Asset impairment charges | — |
| | 129 |
| | (129 | ) | | (100.0 | ) | | — |
| | 129 |
| | (129 | ) | | (100.0 | )% |
| Operating income | 157,457 |
| | 126,918 |
| | 30,539 |
| | 24.1 |
| | 155,953 |
| | 125,466 |
| | 30,487 |
| | 24.3 | % |
| Interest expense, net | 26,598 |
| | 41,798 |
| | (15,200 | ) | | (36.4 | ) | | 26,598 |
| | 41,798 |
| | (15,200 | ) | | (36.4 | )% |
| Loss (gain) on extinguishment of debt | 9,805 |
| | (1,661 | ) | | 11,466 |
| | * |
| |
| Gain (loss) on extinguishment of debt | | | 9,805 |
| | (1,661 | ) | | 11,466 |
| | * |
|
| Other income, net | (5,071 | ) | | — |
| | (5,071 | ) | | * |
| | (6,575 | ) | | (1,452 | ) | | (5,123 | ) | | * |
|
| Income before income taxes | 126,125 |
| | 86,781 |
| | 39,344 |
| | 45.3 |
| | 126,125 |
| | 86,781 |
| | 39,344 |
| | 45.3 | % |
| Income tax expense | 41,486 |
| | 27,985 |
| | 13,501 |
| | 48.2 |
| | 41,486 |
| | 27,985 |
| | 13,501 |
| | 48.2 | % |
| Net income | $ | 84,639 |
| | $ | 58,796 |
| | $ | 25,843 |
| | 44.0 |
| | $ | 84,639 |
| | $ | 58,796 |
| | $ | 25,843 |
| | 44.0 | % |
| Non-GAAP financial data | | | | |
|
| | | |
|
| | | | | | |
| Adjusted net sales | $ | 1,503,934 |
| | $ | 1,515,568 |
| | $ | (11,634 | ) | | (0.8 | ) | | $ | 1,503,934 |
| | $ | 1,515,568 |
| | $ | (11,634 | ) | | (0.8 | )% |
| Adjusted EBITDA | $ | 227,608 |
| | $ | 235,002 |
| | $ | (7,394 | ) | | (3.1 | ) | | $ | 227,608 |
| | $ | 235,002 |
| | $ | (7,394 | ) | | (3.1 | )% |
| Adjusted EBITDA Margin | 15.1 | % | | 15.5 | % | | | | | | 15.1 | % | | 15.5 | % | | | | |
| * Not meaningful | | | | | | | | | | | | | | | |
| **As adjusted due to the adoption of ASU 2017-07. See Note 1, ''Basis of Presentation and Summary of Significant Accounting Policies'' for additional information. | | **As adjusted due to the adoption of ASU 2017-07. See Note 1, ''Basis of Presentation and Summary of Significant Accounting Policies'' for additional information. |
Net sales
|
| | | |
| | | Change (%) |
| Volume | | (4.5 | )% |
| Average selling prices | | 5.8 |
|
| Foreign exchange | | (0.4 | ) |
| Acquisitions | | 0.4 |
|
| Working days | | (2.0 | ) |
| Impact of Fence and Sprinkler exit | | (0.5 | ) |
| Other | | (0.1 | ) |
| Net sales | | (1.3 | )% |
Net sales decreased $19.5 million, or 1.3% to $1,503.9 million for fiscal 2017 compared to $1,523.4 million for fiscal 2016. The decrease was primarily due to $68.0 million of lower volume of product sold primarily due to lower demand for mechanical pipe products within the solar end-market and lower demand for metal electrical conduit and fittings products. Additionally, there was a decrease of $29.3 million resulting from lower working days during fiscal 2017. There was a decline in sales of $7.8 million related to the Fence and Sprinkler exit announced in the fourth quarter of fiscal 2015. These product lines were fully discontinued in the first quarter of fiscal 2016. Partially offsetting the decrease in net sales were $86.5 million of higher average net selling prices due to the pass-through impact of higher input costs and $6.6 million resulting from the acquisitions of Marco Cable Management and Flexicon Limited during the third and fourth quarter of fiscal 2017, respectively.
Cost of sales
|
| | | |
| | | Change (%) |
| Volume | | (4.34.1 | )% |
| Average input costs | | 6.66.4 |
|
| Foreign exchange | | (0.4 | ) |
| Acquisitions | | 0.4 |
|
| Working days | | (2.0 | ) |
| Impact of Fence and Sprinkler exit | | (0.5 | ) |
| Other | | (1.00.9 | ) |
| Cost of sales | | (1.21.1 | )% |
Cost of sales decreased by $13.4$13.1 million, or 1.2%1.1% to $1,141.3$1,142.7 million for fiscal 2017 compared to $1,154.7$1,155.8 million for fiscal 2016. The decrease in cost of sales was primarily due to $47.8 million of lower volume of mechanical pipe products sold within the solar end-market and metal electrical conduit and fittings products sold. Additionally, cost of sales decreased $22.8 million due to lower working days during fiscal 2017 and $11.0$11 million of lower freight and warehouse costs resulting from productivity efficiencies included in the Other category above. Partially offsetting these decreases were higher input costs across all product categories of $73.8 million, including lower-of-cost-or-market charges.
Selling, general and administrative
Selling, general and administrative expenses decreased $36.6$36.8 million, or 16.7%16.8% to $182.8$182.9 million for fiscal 2017 compared to $219.4$219.7 million for fiscal 2016. The decrease was primarily due to $15.4 million of higher consulting service and termination fees paid to CD&R during fiscal 2016. See Note 18, ''Related Party Transactions'' for additional information. The Company had $10.2 million of lower incentive-based compensation expense during fiscal 2017. Stock-based compensation expense was $8.3 million lower during fiscal 2017 compared to fiscal 2016 resulting from a change from liability accounting to equity accounting. See Note 4,5, ''Stock Incentive Plan'' to the accompanying consolidated financial statements included elsewhere in this Annual Report. In 2016, we released $6.7 million of indemnified uncertain tax positions. The indemnification release was an expense which was offset by the tax benefit of the release of the corresponding uncertain tax positions recorded as a component of income tax expense. Additionally, we recorded decreased expenses of $3.5 million across a variety of expense categories, inclusive of IPO related costs. The decrease is partially offset by an increase of $7.5 million in contingent liabilities related to a ruling on the Company's imports of conduit fittings within the Atkore Steel Components Inc. business. See Note 16, ''Commitments and Contingencies'' to the accompanying consolidated financial statements included elsewhere in this Annual Report.
Intangible asset amortization
Intangible asset amortization expenses increased $0.2 million, or 0.8% to $22.4 million for fiscal 2017 compared to $22.2 million for fiscal 2016 primarily related to the acquisition of Marco Cable Management during the third fiscal quarter of 2017.
Asset impairment charges
During fiscal 2016, we recorded asset impairments of $0.1 million related to the write-down of prepaid shop supplies resulting from the exit of Fence and Sprinkler. There were no such asset impairment charges during fiscal 2017.
Interest expense, net
Interest expense, net, decreased $15.2 million, or 36.4% to $26.6 million for fiscal 2017, compared to $41.8 million for fiscal 2016. The decrease resulted primarily from the redemption of the Second Lien Term Loan Facility during the first quarter of fiscal 2017, resulting in lower interest expense, partially offset by higher interest rates. See Note 14, ''Debt'' to the accompanying consolidated financial statements included elsewhere in this Annual Report.
Loss (gain) on extinguishment of debt
We recorded a loss on the extinguishment of debt of $9.8 million during the fiscal year ended September 30, 2017 related to the December 22, 2016 debt refinancing transactions compared to a gain of $1.7 million during fiscal 2016 related to the redemption of $19.0 million outstanding under the Second Lien Term Loan Facility. See Note 14, ''Debt'' to the accompanying consolidated financial statements included elsewhere in this Annual Report.
Other income, net
In May 2012, we entered into a share purchase agreement pursuant to which the Company would sell its minority ownership share in Abahsain-Cope Saudi Arabia Ltd. for cash consideration of $9.1 million. The total carrying value of the investment was $3.3 million. During fiscal 2017, we recognized a pre-tax gain of $5.8 million on the sale when transfer of ownership was completed. See Note 11, ''Assets Held for Sale'' to the accompanying consolidated financial statements included elsewhere in this Annual Report.
Income tax expense
Income tax expense increased $13.5 million to $41.5 million for fiscal 2017, compared to $28.0 million for fiscal 2016. For the fiscal years ended September 30, 2017 and September 30, 2016, the Company's effective income tax rate was 32.9% and 32.3% respectively. The change in the effective tax rate for fiscal year 2017 from fiscal year 2016 was primarily due to the larger tax benefit of the indemnification of uncertain tax positions released in the prior year, partially offset by the excess tax benefit associated with the exercise of stock options, which is reflected as a reduction in tax expense and a lower effective state tax rate.
Net income
Net income increased by $25.8 million to $84.6 million for fiscal 2017 compared to $58.8 million for fiscal 2016. The increase was primarily due to lower selling, general and administrative expenses of $36.6$36.8 million and interest expense of $15.2 million, partially offset by a net loss on extinguishment of debt of $9.8 million and higher income tax expense of $13.5 million.
Adjusted EBITDA
Adjusted EBITDA decreased by $7.4 million, or 3.1% to $227.6 million for fiscal 2017 compared to $235.0 million for fiscal 2016. The increase was due primarily to lower volume of products sold across all product categories partially offset by improved productivity.
Segment results
|
| | | | | | | | | | | | | | | |
| | | Fiscal year ended | | | |
| ($ in thousands) | | September 30, 2017 | | September 30, 2016 | | Change ($) | | Change (%) |
| Net sales | | $ | 1,094,783 |
| | $ | 1,068,630 |
| | $ | 26,153 |
| | 2.4 | % |
| Adjusted EBITDA | | 189,351 |
| | 181,939 |
| | 7,412 |
| | 4.1 | % |
| Adjusted EBITDA Margin | | 17.3 | % | | 17.0 | % | | | | |
Net sales
|
| | | |
| | | Change (%) |
Volume | | (2.2 | )% |
| Average selling prices | | 6.5 |
% |
Foreign exchangeVolume | | (0.52.2 | ) |
| Acquisitions | | 0.6 |
|
| FX | | (0.5 | ) |
| Working days | | (1.9 | ) |
| Other | | (0.1 | ) |
| Net sales | | 2.4 | % |
Net sales increased $26.2 million, or 2.4%, to $1,094.8 million for fiscal 2017 compared to $1,068.6 million for fiscal 2016. The increase was due primarily to higher average selling prices of $70.3 million resulting from the pass-through impact of higher input costs and our ability to earn a premium from meeting customer expectations of product availability, delivery service levels and co-loading capabilities. Additionally, sales from the acquisition of Marco and Flexicon during 2017 contributed $6.6 million. The increase in sales was partially offset by lower volume of products sold of $24.1 million largely due to lower demand across all product lines. Metal electrical conduit and fittings product line sales partially decreased as a key customer began fulfilling a portion of their demand from a second source beginning in fiscal 2016. Lastly, sales decreased $20.2 million due to lower working days during fiscal 2017.
Adjusted EBITDA
Adjusted EBITDA increased $7.4 million, or 4.1%, to $189.4 million for fiscal 2017 compared to $181.9 million for fiscal 2016. The primary driver of the year-over-year increase was due to our ability to execute our pricing strategy which allows us to pass through raw material input costs and to earn a premium from meeting customer expectations of product availability, delivery service levels and co-loading capabilities. Additionally, Adjusted EBITDA increased due to improved productivity in manufacturing and lower freight and warehousing costs. The increases are partially offset by the impact of fewer working days during fiscal 2017.
Mechanical Products & Solutions
|
| | | | | | | | | | | | | | | |
| | | Fiscal year ended | | | |
| ($ in thousands) | | September 30, 2017 | | September 30, 2016 | | Change ($) | | Change (%) |
| Net sales | | $ | 410,532 |
| | $ | 456,821 |
| | $ | (46,289 | ) | | (10.1 | )% |
| Impact of Fence and Sprinkler exit | | — |
| | (7,816 | ) | | 7,816 |
| | (100.0 | )% |
| Adjusted net sales | | $ | 410,532 |
| | $ | 449,005 |
| | $ | (38,473 | ) | | (8.6 | )% |
| Adjusted EBITDA | | $ | 63,687 |
| | $ | 81,199 |
| | $ | (17,512 | ) | | (21.6 | )% |
| Adjusted EBITDA Margin | | 15.5 | % | | 18.1 | % | | | | |
Net sales
|
| | | |
| | | Change (%) |
Volume | | (29.7 | )% |
| Average selling prices | | 11.03.5 |
% |
Working daysVolume | | (6.29.6 | ) |
| Impact of Fence and Sprinkler exit | | (5.31.7 | ) |
| Working days | | (2.0 | ) |
| Other | | (1.10.3 | ) |
| Net sales | | (10.1 | )% |
Net sales decreased $46.3 million, or 10.1% to $410.5 million for fiscal 2017 compared to $456.8 million for fiscal 2016. The decrease in net sales was primarily due to $43.9 million of lower volume of product sold mostly due to lower demand for mechanical pipe products within the solar end-market and $9.2 million resulting from fewer working days during fiscal 2017. Additionally, sales decreased $7.8 million related to the Fence and Sprinkler exit partially offset by a $16.2 million increase in average selling prices resulting from the pass-through impact of higher input costs and our ability to earn a premium from meeting customer expectations of product availability, delivery service levels and co-loading capabilities..
Adjusted EBITDA
Adjusted EBITDA decreased $17.5 million, or 21.6%, to $63.7 million for fiscal 2017 compared to $81.2 million for fiscal 2016. The primary driver of the decrease was lower demand for mechanical pipe products within the solar end-market, partially offset by productivity efficiencies.
Fiscal 2016 Compared to Fiscal 2015
The results of operations for the fiscal years ended September 30, 2016 and September 25, 2015 were as follows: |
| | | | | | | | | | | | | | | |
| | | Fiscal year ended | | | |
| ($ in thousands) | | September 30, 2016 | | September 25, 2015 | | Change ($) | | Change (%) |
| Net sales | | $ | 1,523,384 |
| | $ | 1,729,168 |
| | $ | (205,784 | ) | | (11.9 | )% |
| Cost of sales | | 1,154,702 |
| | 1,456,375 |
| | (301,673 | ) | | (20.7 | ) |
| Gross profit | | 368,682 |
| | 272,793 |
| | 95,889 |
| | 35.2 |
|
| Selling, general and administrative | | 219,397 |
| | 185,815 |
| | 33,582 |
| | 18.1 |
|
| Intangible asset amortization | | 22,238 |
| | 22,103 |
| | 135 |
| | 0.6 |
|
| Asset impairment charges | | 129 |
| | 27,937 |
| | (27,808 | ) | | (99.5 | ) |
| Operating income | | 126,918 |
| | 36,938 |
| | 89,980 |
| | * |
|
| Interest expense, net | | 41,798 |
| | 44,809 |
| | (3,011 | ) | | (6.7 | ) |
| Gain on extinguishment of debt | | (1,661 | ) | | — |
| | (1,661 | ) | | * |
|
| Income (loss) before income taxes | | 86,781 |
| | (7,871 | ) | | 94,652 |
| | * |
|
| Income tax expense (benefit) | | 27,985 |
| | (2,916 | ) | | 30,901 |
| | * |
|
| Net income (loss) | | $ | 58,796 |
| | $ | (4,955 | ) | | $ | 63,751 |
| | * |
|
| Non-GAAP financial data | | | | | | | | |
| Adjusted net sales | | $ | 1,515,568 |
| | $ | 1,550,575 |
| | $ | (35,007 | ) | | (2.3 | ) |
| Adjusted EBITDA | | $ | 235,002 |
| | $ | 163,950 |
| | $ | 71,052 |
| | 43.3 |
|
| Adjusted EBITDA Margin | | 15.5 | % | | 10.6 | % | | | | |
| * Not meaningful | | | | | | | | |
Net sales
|
| | | |
| | Change (%) |
Volume | | (1.7 | )% |
Average selling prices | | (1.3 | ) |
Foreign exchange | | 0.2 |
|
Acquisitions | | (0.5 | ) |
Working days | | (9.9 | ) |
Impact of Fence and Sprinkler exit | | 1.7 |
|
Other | | (0.3 | ) |
Net sales | | (11.9 | )% |
Net sales decreased $205.8 million, or 11.9% to $1,523.4 million for fiscal 2016 compared to $1,729.2 million for fiscal 2015. The decrease was primarily due to declines in net sales of $170.8 million related to the Fence and Sprinkler exit announced in the fourth quarter of fiscal 2015. Sales further decreased $29.5 million due to the pass-through impact of lower input costs and $23.0 million due to a decrease in the volume sold of mechanical pipe products and armored cable fittings due to a decline in various end markets that utilize these products. Partially offsetting these decreases was a $29.3 million increase in sales resulting from additional working days during fiscal 2016.
Cost of sales
|
| | | |
| | Change (%) |
Volume | | (7.9 | )% |
Average input costs | | (1.2 | ) |
Foreign exchange | | 0.2 |
|
Acquisitions | | (0.5 | ) |
Working days | | (11.5 | ) |
Impact of Fence and Sprinkler exit | | 1.6 |
|
Other | | (1.3 | ) |
Cost of sales | | (20.6 | )% |
Cost of sales decreased by $301.7 million, or 20.7% to $1,154.7 million for fiscal 2016 compared to $1,456.4 million for fiscal 2015. The decrease was primarily due to lower costs resulting from the Fence and Sprinkler exit of $167.6 million. Additionally, lower material costs across all of our existing product categories and improved manufacturing productivity resulted in lower cost of sales of $115.5 million. Cost of sales also decreased $18.1 million due to a decrease in the volume sold of mechanical pipe products and armored cable fittings due to a decline in various end markets that utilize these products. Freight and warehouse costs decreased $13.3 million due to continuous improvement processes in the use of alternate modes and methods of transportation which provided cost savings, as well as lower overall fuel surcharges. The decrease in cost of sales was partially offset by increased costs of $22.8 million resulting from additional working days during fiscal 2016.
Selling, general and administrative
Selling, general and administrative expenses increased $33.6 million, or 18.1% to $219.4 million for fiscal 2016 compared to $185.8 million for fiscal 2015. The increase was primarily due to the payment of a fee to CD&R of $12.8 million to terminate our consulting agreement with CD&R in connection with our IPO during the third quarter of 2016. We recorded incremental stock-based compensation expense of $7.6 million to revalue our outstanding stock option awards. The adjustment represents mark-to-market adjustments for our stock-based awards which were accounted for as liability awards and straight-line expense over the vesting period for our stock-based awards accounted for as equity awards. The Company modified the Omnibus Incentive Plan on July 27, 2016, triggering a change from liability accounting to equity accounting for all outstanding stock options which no longer requires mark-to-market adjustments. We also recorded increased expenses of $8.7 million of transaction costs, the majority of which were in connection with our IPO and primarily consisted of accounting, legal and other
professional fees. Lastly, we recorded increased expenses of $4.5 million across a variety of expense categories.
Intangible asset amortization
Intangible asset amortization expenses increased $0.1 million, or 0.6% to $22.2 million for fiscal 2016 compared to $22.1 million for fiscal 2015. The increase was due to a full year of amortization arising from intangible assets acquired in connection with the purchases of APPI and SCI in fiscal 2015.
Asset impairment charges
In fiscal 2015, we announced the exit from Fence and Sprinkler and the planned closure of the Philadelphia, Pennsylvania manufacturing facility. As such, we recorded asset impairments of $24.0 million related to long-lived assets and prepaid shop supplies written- down to their fair value. Additionally, we recorded a $3.9 million impairment to goodwill within the Electrical Raceway reportable segment related to our SCI acquisition. The impairment was triggered by a decline in net sales and earnings due to a shift in the mix of products sold to a key customer, which was not expected to be replaced.
During fiscal 2016, we recorded asset impairments of $0.1 million related to the write-down of prepaid shop supplies resulting from the exit of Fence and Sprinkler.
Interest expense, net
Interest expense, net, decreased $3.0 million, or 6.7% to $41.8 million for fiscal 2016, compared to $44.8 million for fiscal 2015. These decreases were due primarily to higher interest expense of $1.9 million from borrowings against the Prior ABL Credit Facility and higher principal balances related to the Prior Second Lien Term Loan Facility in fiscal 2015. There were no amounts outstanding under the Prior ABL Credit Facility during fiscal 2016. Additionally, we redeemed $19.0 million of the Prior Second Lien Term Loan Facility on January 22, 2016, which helped to lower interest expense. See Note 14, ''Debt'' to the accompanying consolidated financial statements included elsewhere in this Annual Report.
Gain on extinguishment of debt
On January 22, 2016, AII redeemed $17.0 million outstanding under the Prior Second Lien Term Loan Facility at a redemption price of 89.00% of the par value, and $2.0 million at a redemption price of 89.75% of the par value. We recorded a gain on the extinguishment of debt of $1.7 million during fiscal 2016. There were no gains or losses recorded during September 25, 2015. See Note 14, ''Debt'' to the accompanying consolidated financial statements included elsewhere in this Annual Report.
Income tax expense (benefit)
Income tax expense increased $30.9 million to $28.0 million for fiscal 2016, compared to a benefit of $2.9 million. For the fiscal years ended September 30, 2016, and September 25, 2015 the Company's effective income tax rate was 32.2% and 37.0% respectively. The decrease in the effective tax rate for fiscal 2016 was primarily due to the release of indemnified uncertain tax positions, the tax benefit for the U.S domestic manufacturing deduction and the tax benefit for research and development credits.
Net income (loss)
Net income increased by $63.8 million to $58.8 million for fiscal 2016 compared to a loss of $5.0 million for fiscal 2015 The increase was due to higher operating income before taxes of $90.0 million, lower interest expense of $3.0 million and a gain on extinguishment of debt of $1.7 million offset partially by an increase in income tax expense of $30.9 million.
Adjusted EBITDA
Adjusted EBITDA increased by $71.1 million, or 43.3% to $235.0 million for fiscal 2016 compared to $164.0 million for fiscal 2015. The increase was due primarily to lower average raw material input costs which decreased approximately 13% for fiscal 2016 compared to the same periods in the prior year. Our strategic pricing initiatives allow us to pass through raw material input costs and to earn a premium from meeting customer expectations of product availability, delivery service levels and co-loading capabilities. Additionally, Adjusted EBITDA increased due to improved productivity in manufacturing and lower freight and warehouse costs. Lastly, Adjusted EBITDA increased due to extra working days during fiscal 2016.
Segment results
|
| | | | | | | | | | | | | | | |
| | | Fiscal year ended | | | |
| ($ in thousands) | | September 30, 2016 | | September 25, 2015 | | Change ($) | | Change (%) |
| Net sales | | $ | 1,068,630 |
| | $ | 1,080,276 |
| | $ | (11,646 | ) | | (1.1 | )% |
| Adjusted EBITDA | | 181,939 |
| | 112,544 |
| | 69,395 |
| | 61.7 | % |
| Adjusted EBITDA Margin | | 17.0 | % | | 10.4 | % | | | | |
Net sales
|
| | | |
| | Change (%) |
Average selling prices | | (1.9 | )% |
Acquisitions | | 0.3 |
|
FX | | (1.4 | ) |
Working days | | 1.9 |
|
Other | | 0.1 |
|
Net sales | | (1.1 | )% |
Net sales decreased $11.6 million, or 1.1%, to $1,068.6 million for fiscal 2016 compared to $1,080.3 million for fiscal 2015. The decrease was due primarily to lower average selling prices of $20.0 million and $15.3 million due to negative foreign currency translation impact due to a strengthened U.S. dollar. The decrease in sales is partially offset by an increase of $20.2 million resulting from additional working days during fiscal 2016 and $3.2 million of increase sales from our APPI and SCI businesses which were acquired during the first quarter of fiscal 2015.
Adjusted EBITDA
Adjusted EBITDA increased $69.4 million, or 61.7%, to $181.9 million for fiscal 2016 compared to $112.5 million for fiscal 2015. The primary driver of the year-over-year increase was due to our ability to execute our strategic pricing strategy which saw our average input material costs declining more than our change in average selling prices. Our strategic pricing initiatives allow us to pass through raw material input costs and to earn a premium from meeting customer expectations of product availability, delivery service levels and co-loading capabilities. Additionally, Adjusted EBITDA increased due to improved productivity in manufacturing and lower freight and warehousing costs. Lastly, Adjusted EBITDA increased due to additional working days during fiscal 2016.
Mechanical Products & Solutions
|
| | | | | | | | | | | | | | | |
| | | Fiscal year ended | | | |
| ($ in thousands) | | September 30, 2016 | | September 25, 2015 | | Change ($) | | Change (%) |
| Net sales | | $ | 456,821 |
| | $ | 650,217 |
| | $ | (193,396 | ) | | (29.7 | )% |
| Impact of Fence and Sprinkler exit | | (7,816 | ) | | (178,593 | ) | | 170,777 |
| | (95.6 | )% |
| Adjusted net sales | | $ | 449,005 |
| | $ | 471,624 |
| | $ | (22,619 | ) | | (4.8 | )% |
| Adjusted EBITDA | | $ | 81,199 |
| | $ | 73,737 |
| | $ | 7,462 |
| | 10.1 | % |
| Adjusted EBITDA Margin | | 18.1 | % | | 15.6 | % | | | | |
|
| | | |
| | Change (%) |
Average selling prices | | (1.5 | )% |
Volume | | (3.5 | ) |
FX | | 0.9 |
|
Impact of Fence and Sprinkler exit | | (26.2 | ) |
Working days | | 1.4 |
|
Other | | (0.9 | ) |
Net sales | | (29.7 | )% |
Net sales decreased $193.4 million, or 29.7% to $456.8 million for fiscal 2016 compared to $650.2 million for fiscal 2015. The decrease was primarily due to declines in sales of $170.8 million related to the Fence and Sprinkler exit. Net sales further declined $22.8 million due to lower volume resulting from lower demand for mechanical pipe products impacting certain end markets, partially offset by increased sales of $9.2 million resulting from additional working days during fiscal 2016.
Adjusted EBITDA
Adjusted EBITDA increased $7.5 million, or 10.1%, to $81.2 million for fiscal 2016 compared to $73.7 million for fiscal 2015. The primary driver of the year-over-year increase was due to improved productivity in manufacturing and lower freight and warehousing costs. Additionally, we were able to maintain an average selling price which decreased less than the decrease in raw material input costs due to our ability to execute our strategic pricing strategy. Our strategic pricing initiatives allow us to pass through raw material input costs and to earn a premium from meeting customer expectations of product availability, delivery service levels and co-loading capabilities. Lastly, Adjusted EBITDA increased due to additional working days during fiscal 2016.
Liquidity and Capital Resources
We believe we have sufficient liquidity to support our ongoing operations and to invest in future growth and create value for stockholders. Our cash and cash equivalents were $45.7$126.7 million as of September 30, 2017,2018, of which $40.9$97.4 million was held at non-U.S. subsidiaries. On September 27, 2018, we entered into a definitive agreement with Pentahold NV to acquire Vergokan International NV ("Vergokan"), a leading manufacturer of cable tray and cable ladder systems, underfloor installations and industrial floor trunking that serves industrial, power and energy, commercial and infrastructure sectors in more than 45 countries. At September 30, 2018 more cash was held at non-U.S. subsidiaries to facilitate the acquisition, which was completed on October 1, 2018. Those cash balances at foreign subsidiaries may be subject to United Stateswithholding or local country taxes if the Company's intention to permanently reinvest such income were to change and cash was repatriated to the United States. Our cash and cash equivalents decreased $154.6increased $80.9 million from September 30, 2016,2017, primarily as a result of acquisitions completed during fiscal 2017.the increase in cash flows from operations and incremental borrowings.
In general, we require cash to fund working capital investments, acquisitions, capital expenditures, debt repayment, interest payments, taxes and share repurchases. We have access to the ABL Credit Facility to fund our operational needs. As of September 30, 2017,2018, there were $85.0 million ofno outstanding borrowings under the ABL Credit Facility used to partially fund the acquisition(excluding $9.9 million of Calpipe (excluding $8.6 million ofstandby letters of credit issued under the ABL Credit Facility). The borrowing base was estimated to be $266.6$325.0 million and approximately $173.0$315.1 million was available under the ABL Credit Facility as of September 30, 2017.
We may from time to time repurchase our debt or take other steps to reduce our debt. These actions may include open-market repurchases, negotiated repurchases or opportunistic refinancing of debt. The amount of debt, if any, that may be repurchased or refinanced will depend on market conditions, trading levels of our debt, our cash position, compliance with debt covenants and other considerations. Our affiliates may also purchase our debt from time to time, through open-market purchases or other transactions. See Note 14, ''Debt'' to the accompanying consolidated financial statements included elsewhere in this Annual Report.2018.
Our use of cash may fluctuate during the year and from year to year due to differences in demand and changes in economic conditions primarily related to the prices of commodities we purchase.
Capital expenditures have historically been necessary to expand and update the production capacity and improve the productivity of our manufacturing operations.
Our ongoing liquidity needs are expected to be funded by cash on hand, net cash provided by operating activities and, as required, borrowings under the Credit Facilities. We expect that cash provided from operations and available capacity under the ABL Credit Facility will provide sufficient funds to operate our business, make expected capital expenditures and meet our liquidity requirements for at least the next twelve months, including payment of interest and principal on our debt.
Limitations on Distributions and Dividends by Subsidiaries
Atkore
AIG, AII, and AIIAIH are each holding companies, and as such have no independent operations or material assets other than ownership of equity interests in their respective subsidiaries. Each company depends on its respective subsidiaries to distribute funds to them so that they may pay obligations and expenses, including satisfying obligations with respect to indebtedness. The ability of our subsidiaries to make distributions and dividends to us depends on their operating results, cash requirements and financial and general business conditions, as well as restrictions under the laws of our subsidiaries' jurisdictions.
The agreements governing the Credit Facilities significantly restrict the ability of our subsidiaries, including AII, to pay dividends, make loans or otherwise transfer assets from AII and, in turn, to us. Further, AII's subsidiaries are permitted under the terms of the Credit Facilities to incur additional indebtedness that may restrict or prohibit the making of distributions, the payment of dividends or the making of loans by such subsidiaries to AII and, in turn, to us. The First Lien Term Loan Facility requires AII to meet a certain consolidated coverage ratio on an incurrence basis in connection with additional indebtedness. The ABL Credit Facility contains limits on additional indebtedness based on various conditions for incurring the additional debt. AII has been in compliance with the covenants under the agreements for all periods presented. See Note 14, ''Debt'' to the accompanying consolidated financial statements included elsewhere in this Annual Report.
Cash Flows
The table below summarizes cash flow information derived from our statements of cash flows for the fiscal years ended September 30, 2018 and September 30, 2017.
|
| | | | | | | | | | | | | | |
| | Fiscal year ended |
| (in thousands) | September 30, 2018 | | September 30, 2017 | | Change ($) | | Change (%) |
| Cash flows provided by (used in): | | | | | | | |
| Operating activities | $ | 145,703 |
| | $ | 121,654 |
| | $ | 24,049 |
| | 19.8 | % |
| Investing activities | 2,514 |
| | (205,833 | ) | | 208,347 |
| | (101.2 | )% |
| Financing activities | (65,931 | ) | | (67,760 | ) | | 1,829 |
| | (2.7 | )% |
Operating activities
During fiscal 2018, operating activities provided $145.7 million of cash, compared to $121.7 million during fiscal year 2017. The $24.0 million increase was primarily due to improved operating income of $23.7 million, see "Results of Operations".
Investing activities
During fiscal 2018, investing activities provided $2.5 million of cash compared to $205.8 million used during fiscal 2017. The $208.3 million increase in cash provided by investing activities is due primarily to a reduction of $180.5 million in cash used in acquisitions in fiscal 2018 compared to fiscal 2017, and the cash received for the sale of the assets of Flexhead of $42.6 million in fiscal 2018, and partially offset by the increase of $13.4 million in capital expenditures in fiscal 2018 compared to fiscal 2017. Capital expenditures represent enhancements to our IT infrastructure, manufacturing and distribution operations as well as replacement of our existing equipment and facilities.
Financing Activities
During fiscal 2018, we used $65.9 million for financing activities compared to $67.8 million during fiscal 2017. The $1.8 million decrease was due to the increase in borrowings net of repayments of $393.4 million in fiscal 2018 and the incremental issuance of common stock of $7.9 million in fiscal 2018 compared to fiscal 2017, partially offset by our incremental share repurchase of $397.8 million in fiscal 2018 compared to fiscal 2017.
The table below summarizes cash flow information derived from our statements of cash flows for the fiscal years ended September 30, 2017 and September 30, 2016.
|
| | | | | | | | | | | | | | |
| | Fiscal year ended |
| (in thousands) | September 30, 2017 | | September 30, 2016 | | Change ($) | | Change (%) |
| Cash flows provided by (used in): | | | | | | | |
| Operating activities | $ | 121,654 |
| | $ | 156,646 |
| | $ | (34,992 | ) | | (22.3 | )% |
| Investing activities | (205,833 | ) | | (12,895 | ) | | (192,938 | ) | | 1,496.2 | % |
| Financing activities | (67,760 | ) | | (23,908 | ) | | (43,852 | ) | | 183.4 | % |
Operating activities
During fiscal 2017, operating activities provided $121.7 million of cash, compared to $156.6 million during fiscal year 2016. The $35.0 million decreaseincrease was primarily due to a higher investment in working capital, partially offset by improved earnings of $25.8 million.
Investing activities
During fiscal 2017, we used $205.8 million for investing activities from continuing operations compared to $12.9 million during fiscal 2016. The $192.9 million increase in cash used for investing activities is due primarily to $183.9$180.5 million used to fund the acquisitions of Marco, Flexicon and Calpipe. There were no acquisitions during fiscal 2016. The acquisitions of Marco and Flexicon were funded using cash on hand. The acquisition of Calpipe was funded using cash on hand and the borrowings from the ABL Credit Facility. Additionally, we invested $8.3 million more for capital expenditures during fiscal 2017 as compared to fiscal 2016. Capital expenditures represent enhancements to our manufacturing and distribution operations as well as replacement and maintenance of our existing equipment and facilities.
Financing Activities
During fiscal 2017, we used $67.8 million for financing activities. The use of cash was primarily for the $649.9 million redemption of the Initial First Lien Term Loan Facility and the Second Lien Term Loan Facility and $13.9 million related to share buybacks. The use of cash was partially offset by cash provided from the net borrowing of $498.8 million for the First Lien Term Loan Facility, $85.0 million from the net borrowings on the ABL Credit Facility and $12.2 million from the issuance of common stock.
During fiscal 2016, we used $23.9 million for financing activities primarily for AII's redemption of $17.0 million of the Prior Second Lien Term Loan Facility at a redemption price of 89.00% of the par value, and $2.0 million at a redemption price of 89.75% of the par value.
The table below summarizes cash flow information derived from our statements of cash flows for the fiscal years ended September 30, 2016 and September 25, 2015.
|
| | | | | | | | | | | | | | |
| | Fiscal year ended |
| (in thousands) | September 30, 2016 | | September 25, 2015 | | Change ($) | | Change (%) |
| Cash flows provided by (used in): | | | | | | | |
| Operating activities | $ | 156,646 |
| | $ | 141,073 |
| | $ | 15,573 |
| | 11.0 | % |
| Investing activities | (12,895 | ) | | (46,641 | ) | | 33,746 |
| | (72.4 | )% |
| Financing activities | (23,908 | ) | | (44,106 | ) | | 20,198 |
| | (45.8 | )% |
Operating activities
During fiscal 2016, operating activities provided $156.6 million of cash, compared to $141.1 million during fiscal year 2015. The $15.6 million increase was primarily due to improved earnings.
Investing activities
During fiscal 2016, we used $12.9 million for investing activities from continuing operations compared to $51.2 million during fiscal 2015. The $38.3 million decrease in cash used for investing activities is due primarily to a $30.5 million decrease in funds used for acquisitions. During fiscal 2015, the Company used $30.5 million to fund the acquisitions of APPI and SCI. There were no acquisitions during fiscal 2016. Additionally, we invested $16.8 million compared to $26.8 million during fiscal 2016 and 2015, respectively for capital expenditures representing our enhancements of our manufacturing and distribution operations, as well as replacement and maintenance of existing equipment and facilities. Lastly, we used $1.3 million of other investing activities. The cash used for operating activities was offset by $3.5 million less of proceeds for divestitures.
During fiscal 2015, discontinued investing activity provided $4.5 million of cash. There was no cash provided by discontinued investing activity for fiscal 2017 or 2016.
Financing Activities
During fiscal 2016, we used $23.9 million for financing activities primarily for AII's redemption of $17.0 million of the Prior Second Lien Term Loan Facility at a redemption price of 89.00% of the par value, and $2.0 million at a redemption price of 89.75% of the par value.
We used $44.1 million cash for financing activities during fiscal 2015 primarily to repay the $40.0 million balance on the Prior ABL Credit Facility.
The agreements governing the Credit Facilities contain significant covenants, including prohibitions on our ability to incur certain additional indebtedness and to make certain investments and to pay dividends. For all periods presented, AII was in compliance with all covenants of the Credit Facilities. AII was not subject to the minimum fixed charge coverage ratio during any period subsequent to the establishment of the credit facilities. See Note 14, ''Debt'' to the accompanying audited consolidated financial statements included elsewhere in this Annual Report on Form 10-K.
Contractual Obligations
The following table presents our contractual obligations and commitments as of September 30, 2017.2018.
|
| | | | | | | | | | | | | | | | | | | | |
| ($ in thousands) | | Less than 1 Year | | 1-3 Years | | 3-5 Years | | More than 5 Years | | Total |
| First Lien Term Loan Facility due December 22, 2023 | | $ | 5,000 |
| | $ | 10,000 |
| | $ | 10,000 |
| | $ | 471,250 |
| | $ | 496,250 |
|
| ABL Credit Facility | | — |
| | — |
| | 85,000 |
| | — |
| | 85,000 |
|
| Interest payments (a) | | 25,793 |
| | 50,836 |
| | 46,898 |
| | 25,292 |
| | 148,819 |
|
| Purchase commitments(b) | | 89,117 |
| | 3,652 |
| | — |
| | — |
| | 92,769 |
|
| Operating lease obligations | | 10,735 |
| | 19,114 |
| | 11,993 |
| | 9,884 |
| | 51,726 |
|
| Total(c) | | $ | 130,645 |
| | $ | 83,602 |
| | $ | 153,891 |
| | $ | 506,426 |
| | $ | 874,564 |
|
| | | | | | | | | | | |
| (a) Interest expense is estimated based on outstanding loan balances assuming principal payments are made according to the payment schedule and interest rates as of September 30, 2017 (3.50% for the ABL Credit facility, 4.34% for the First Lien Term Loan Facility). |
| (b) Represents purchases of raw materials in the normal course of business for which all significant terms have been confirmed. |
| (c) As of September 30, 2017, we had $0.3 million of income tax liability, gross unrecognized tax benefits of $3.6 million and gross interest and penalties of $3.2 million. Of these amounts, $6.8 million is classified as a non-current liability in the consolidated balance sheet. At this time, we are unable to make a reasonably reliable estimate of the timing for such payments in future years; therefore, such amounts have been excluded from the above contractual obligations table. |
|
| | | | | | | | | | | | | | | | | | | | |
| ($ in thousands) | | Less than 1 Year | | 1-3 Years | | 3-5 Years | | More than 5 Years | | Total |
| First Lien Term Loan Facility due December 22, 2023 (a) | | $ | 28,136 |
| | $ | 18,400 |
| | $ | 18,400 |
| | $ | 848,164 |
| | $ | 913,100 |
|
| Interest payments (b) | | 49,428 |
| | 96,191 |
| | 91,647 |
| | 10,276 |
| | 247,542 |
|
| Purchase commitments(c) | | 100,649 |
| | 376 |
| | — |
| | — |
| | 101,025 |
|
| Acquisition commitments (d) | | 58,728 |
| | — |
| | — |
| | — |
| | 58,728 |
|
| Operating lease obligations | | 11,069 |
| | 15,322 |
| | 9,656 |
| | 11,668 |
| | 47,715 |
|
| Total(e) | | $ | 248,010 |
| | $ | 130,289 |
| | $ | 119,703 |
| | $ | 870,108 |
| | $ | 1,368,110 |
|
| | | | | | | | | | | |
| (a) Of the amount due within less than 1 year for the First Lien Term Loan Facility, $18,936 relates to an accelerated repayment of principal calculated by a formula based on 2018 excess cash flows and a leverage ratio as defined within the Term Loan Agreement. No such accelerated payments are indicated for any of the periods beyond 2019. |
| (b) Interest expense is estimated based on outstanding loan balances assuming principal payments are made according to the payment schedule and interest rates as of September 30, 2018 (3.50% for the ABL Credit facility, 5.14% for the First Lien Term Loan Facility). |
| (c) Represents purchases of raw materials in the normal course of business for which all significant terms have been confirmed. |
| (d) On September 27, 2018, we entered into a definitive agreement with Pentahold NV to acquire Vergokan, a leading manufacturer of cable tray and cable ladder systems, underfloor installations and industrial floor trunking that serves industrial, power and energy, commercial and infrastructure sectors in more than 45 countries. Note 2, ''Acquisitions'' to the accompanying consolidated financial statements included elsewhere in this Annual Report. |
| (e) As of September 30, 2018, we had $0.5 million of income tax liability, gross unrecognized tax benefits of $1.3 million and gross interest and penalties of $0.1 million. Of these amounts, $1.4 million is classified as a non-current liability in the consolidated balance sheet. At this time, we are unable to make a reasonably reliable estimate of the timing for such payments in future years; therefore, such amounts have been excluded from the above contractual obligations table. |
The ABL Credit Facility provides for a five-year senior secured revolving credit facility of up to $325.0 million. As of September 30, 2017, we had $85.0 million drawn2018, there were no borrowings under the ABL Credit Facility. We have the ability to continually refinance amounts drawn on the ABL Credit Facility through its maturity on December 22, 2021, subject to borrowing base limitations.
The estimated minimum requiredprojected company pension contribution to our pension plan incontributions for fiscal 20182019 is $1.2$1.1 million.
In the normal course of business, we are liable for contract completion and product performance. In the opinion of management, such obligations will not significantly affect our financial condition, results of operations or cash flows.
Off-Balance Sheet Arrangements
With the exception of operating leases, we do not have any off-balance sheet financing arrangements that we believe are reasonably likely to have a material current or future effect on our financial condition, revenues or expenses, results of operations, liquidity, capital expenditures or capital resources.
Critical Accounting Policies and Use of Estimates
The preparation of financial statements requires management to make estimates and assumptions relating to the reporting of results of operations, financial condition and related disclosure of contingent assets and liabilities at the date of the financial statements. Actual results may differ from those estimates under different assumptions or conditions. The following are our most critical accounting policies, which are those that require management's most difficult, subjective and complex judgments, requiring the need to make estimates about the effect of matters that are inherently uncertain and may change in subsequent periods.
The following discussion is not intended to represent a comprehensive list of our accounting policies. For a detailed discussion of the application of these and other accounting policies, see Note 1, ''Basis of Presentation and Summary of Significant Accounting Policies'' to the accompanying consolidated financial statements included elsewhere in this Annual Report.
Revenue Recognition
We recognize revenue when persuasive evidence of an agreement exists, delivery has occurred or services have been rendered, the price to the buyer is fixed and determinable and collectability is reasonably assured. Revenues are recognized from product sales when title to the products is passed to the customer, which generally occurs at the point of shipping. Provisions for volume rebates are based upon contractual terms, our historical experience and expectations regarding future customer sales. Rebates are recognized as a reduction of sales if settled in cash or customer credits. Our provisions for early payment discounts and product returns are estimated using our historical experience to approximate future exposures. The amounts recorded may require adjustments if actual experience differs from our estimates. Historically, these adjustments have not been material.
Income Taxes
In determining income for financial statement purposes, we must make certain estimates and judgments. These estimates and judgments affect the calculation of certain tax liabilities and the determination of the recoverability of certain deferred tax assets, which arise from temporary differences between the tax and financial statement recognition of revenue and expense. Certain deferred tax assets are reviewed for recoverability and valued accordingly, considering available positive and negative evidence, including our past results, estimated future taxable income streams and the impact of tax planning strategies in the applicable tax paying jurisdiction. A valuation allowance is established to reduce deferred tax assets to the amount that is considered more likely than not to be realized. Valuations related to tax accruals and assets can be impacted by changes in accounting regulations, changes in tax codes and rulings, changes in statutory tax rates, and changes in our forecasted future taxable income. Any reduction in future taxable income, including but not limited to any future restructuring activities, may require that we record an additional valuation allowance against our deferred tax assets. An increase in the valuation allowance could result in additional income tax expense in such period and could have a significant impact on our future earnings.
In addition, the calculation of our tax liabilities involves dealing with uncertainties in the application of complex tax regulations in a multitude of jurisdictions across our global operations. Certain tax positions may be considered uncertain requiring an assessment of whether an allowance should be recorded. Our provision for uncertain tax positions provides a recognition threshold based on an estimate of whether it is more likely than not that a position will be sustained upon examination. We measure our uncertain tax position as the largest amount of benefit that ishas greater than 50 percent likelya 50% likelihood of being realized upon ultimate settlement. We record interest and penalties related to unrecognized tax benefits as a component of provision for income taxes.
We recognize potential liabilities and record tax liabilities for anticipated tax audit issues in the United States and other tax jurisdictions based on our estimate of whether, and the extent to which, additional taxes will be due. These tax liabilities are reflected net of related tax loss carry-forwards. We adjust these reserves in light of changing facts and circumstances; however, due to the complexity of some of these uncertainties, the ultimate resolution may result in a payment that is materially different from our current estimate of the tax liabilities. If our estimate of tax liabilities proves to be less than the ultimate assessment, an additional charge to expense would result. If payment of these amounts ultimately proves to be less than the recorded amounts, the reversal of the liabilities would result in tax benefits being recognized in the period when we determine the liabilities are no longer necessary. See Note 7,8, ''Income Taxes'' to the accompanying consolidated financial statements included elsewhere in this Annual Report.
Pension and Postretirement Benefits
Our pension expense and obligations are developed from actuarial valuations. Two critical assumptions in determining pension expense and obligations are the discount rate and expected long-term return on plan assets. We evaluate these assumptions at least annually. Other assumptions reflect demographic factors such as retirement, mortality and turnover and are evaluated periodically and updated to reflect our actual experience. Actual results may differ from actuarial assumptions. The following table summarizes the impact thatof a change in50 basis point increase of these assumptions would have on our operating income for fiscal 2017:2018:
|
| |
| (in millions) | 50 Basis Point Change |
| Discount rate | $8.97.8 |
| Return on assets | 0.5$(0.5) |
See Note 3,4, ''Postretirement Benefits'' to the accompanying consolidated financial statements included elsewhere in this Annual Report.
Long-Lived Asset, Indefinite-Lived Intangible Assets and Goodwill Impairments
We review long-lived assets, including property, plantGoodwill and equipment, and finite-livedother intangible assets for impairment whenever events or changes inprimarily result from business circumstances indicate that the carrying amount of the asset may not be fully recoverable. We perform undiscounted operating cash flow analyses to determine if impairment exists. We group assets and liabilities at the lowest level for which cash flows are separately identified in order to measure an impairment. If impairment is determined to exist, any related impairment loss is calculated based on fair value. Impairment losses on assets to be disposed of, if any, are based on the estimated proceeds to be received, less costs of disposal. For fiscal 2017, we did not record any impairments nor did we identify any triggering events that caused us to perform any long-lived asset impairment testing.
We assessacquisitions. The Company assesses the recoverability of goodwill and indefinite-lived intangible assetstrade names on a yearlyan annual basis in accordance with Accounting Standards Codification 350 ("ASC"), "Intangibles - Goodwill and Other." The measurement date is the first day of the fourth fiscal quarter, or more frequently, if events or circumstances indicate that it is more likely than not that the fair value of a reporting unit or the respective indefinite-lived trade name is less than the carrying value. Our measurement date is the first dayThe Company can elect to perform a quantitative or qualitative test of impairment. In the fourth fiscal quarter.
quarter of 2017, the Company adopted Accounting Standards Update ("ASU") 2017-04, "Intangibles - Goodwill is testedand Other (Topic 350): Simplifying the Test for impairment atGoodwill Impairment." The new guidance eliminates the requirement to determine the fair value of individual assets and liabilities of a reporting unit levelto measure goodwill impairment. Under the amendments in the new guidance, the quantitative goodwill impairment testing is performed by comparing the fair value of the reporting unit with its carrying amount and recognizing an impairment charge for the amount by which the carrying amount exceeds the reporting unit's fair value.
For fiscal 2018 and fiscal 2016, the Company performed a quantitative impairment assessment for goodwill. The Company calculated the fair value of its reporting units considering three valuation approaches: (a) the income approach; (b) the guideline public company method; and (c) a market approach using either a transaction analysis. The income approach calculates the fair value of the reporting unit using a discounted cash flow approach. Internally forecasted future cash flows, which the Company believes reasonably approximate market participant assumptions, are discounted using a weighted average cost of capital (Discount Rate) developed for each reporting unit. The Discount Rate is developed using market observable inputs, as well as considering whether or not there is a measure of risk related to the specific reporting unit’s forecasted performance. Fair value under the guideline public company method is determined for each unit by applying market multiples for comparable public companies to the unit’s financial results. The key uncertainties in these calculations are the assumptions used in determining the reporting unit’s forecasted future performance, including revenue growth and operating margins, as well as the perceived risk associated with those forecasts, along with selecting representative market multiples.
For fiscal 2017, the Company determined through qualitative assessment ("step zero"Step 0") that it was not “more likely than not” that the fair values of its reporting units were less than their carrying values; as a result, the Company was not required to perform the quantitative impairment test.
The Company did not record any goodwill impairments in fiscal 2018, 2017 or quantitative assessment ("step one"). The qualitative assessment requires significant judgments about macroeconomic conditions including2016. As of September 30, 2018, the operating environment, industry and other market considerations as well as entity-specific events that could impactfair values of the reporting unit. If we conclude that it is more likely thanunits exceeded their respective carrying amount by 10% or more. A 10% decrease in the discounted cash flows utilized in Step 1 for each of the remaining reporting units would not have changed our determination that the fair value of aeach reporting unit exceedswas in excess of its carrying value, we would proceed to step one. As of our most recent quantitative goodwill impairment test performed in fiscal 2016, we had significant headroom when comparing the fair value of all of our reporting units to their carrying value and did not have any triggering events during fiscal 2017. A reasonably possible change in the residual growth rate, weighted-average cost of capital of market participants, or estimated future cash flows would not result in an impairment of goodwill.value.
ForAs noted above, ASC 350 also requires that the Company test the indefinite-lived intangible assets the quantitative analysis comparesfor impairment at least annually. Under ASC 350, if the carrying value of the indefinite-lived asset tois higher than its estimated fair value, then the asset is deemed to be impaired and anthe impairment charge is recognizedestimated as the difference. The Company calculated the fair value of its indefinite-lived intangible assets using the income approach, specifically the relief-from-royalty method. The relief-from-royalty method is used to estimate the cost savings that accrue to the owner of an intangible asset who would otherwise have to pay royalties or license fees on revenues earned through the use of the asset. Internally forecasted revenues, which the Company believes reasonably approximate market participant assumptions, are multiplied by a royalty rate to arrive at the estimated net after tax cost savings. The royalty rate used in the analysis is based on an analysis of empirical, market-derived royalty rates for guideline intangible assets. The net after tax cost savings are discounted using the amount its carrying value exceeds its estimated fair value.DuringDiscount Rate developed for purposes of the Company's goodwill impairment test. The key uncertainties in these calculations are the assumptions used in determining the revenue associated with each indefinite-lived intangible asset and the royalty rate.
During fiscal year 2018, 2017, and 2016 the results indicated all indefinite-lived intangible assets had significant excess of fair value over the carrying value. A reasonably possible change in the estimated revenues associated with the indefinite livedindefinite-lived intangible assets, selected royalty rates or the residual growth rate would not result in an impairment of any of these assets.
The impairment testing for long-lived assets, indefinite-lived intangible assets and goodwill involves the use of significant assumptions, estimates and judgments, and is subject to inherent uncertainties and subjectivity. The analysis estimates numerous factors, including future sales, gross profit, selling, general and administrative expense rates and capital expenditures. Different assumption, judgments and estimates could materially affect our results of operations. These estimates are based on our business plans and forecasts. For goodwill and indefinite-lived intangible assets, these estimated cash flows are then discounted, which necessitates the selection of an appropriate discount rate. The discount rate used reflects the market-based estimates of the risks associated with the projected cash flows of the reporting unit.
Inventories
We account for inventory valuation for a majority of the Company using the last-in, first-out ("LIFO") method measured at the lower of cost or market value. We utilize the LIFO method of valuing inventories because it reflects how we monitor and manage our business and it matches current costs and revenues. Valuation of inventory using the LIFO method is made at the end of our fiscal year based on inventory levels and costs at that time. Accordingly, interim LIFO calculations are based on estimates of expected year-end inventory levels and costs. Other inventories, consisting mostly of foreign inventories, are measured using first-in, first-out ("FIFO") costing methods. Inventory cost, regardless of valuation method, includes direct material, direct labor and overhead costs. In circumstances where inventory levels are in excess of anticipated market demand, where inventory is deemed technologically obsolete or not marketable due to its condition or where the inventory cost for an item exceeds its market value, we record a charge to cost of goods sold and reduce the inventory to its market value.
Product Liability
We are partially self-insured for product liability matters. We utilize third-party actuaries to assist us with measuring our exposure for these matters. Our product liability reserves represent both reported claims as well as an estimated for incurred but not reported claims. After a claim is filed, liability is estimated as facts associated with the claim become known. The establishment and update of liabilities for unpaid claims, including claims incurred but not reported, is based on the assessment by our claim administrator of each claim, an independent actuarial valuation of the nature and severity of total claims, and management's best estimate. We utilize a third-party claims administrator to pay claims, track and evaluate actual claims experience, and ensure consistency in the data used in the actuarial valuation. We assess product liability exposures for two different types of matters. The first type are claims and lawsuits alleging that the ABF and ABF II antimicrobial coating on our steel sprinkler pipe causes stress cracking in chlorinated polyvinyl pipe, or "CPVC," when the two types of pipe are installed in the same system. The second are product liability exposures unrelated to ABF. Product liability adjustments ranged from $0.6$0.5 million to $4.8$0.8 million of income for the 2015-20172016 through 2018 fiscal year periods. See Note 16, ''Commitments and Contingencies'' to the accompanying consolidated financial statements included elsewhere in this Annual Report.
Recent Accounting Pronouncements
See Note 1, ''Basis of Presentation and Summary of Significant Accounting Policies'' to the accompanying consolidated financial statements included elsewhere in this Annual Report.
Special Note Regarding Forward-Looking Statements and Information
This Annual Report on Form 10-K contains forward-looking statements and cautionary statements within the meaning of the Private Securities Litigation Reform Act of 1995 that are based on management's beliefs and assumptions and information currently available to management. Some of the forward-looking statements can be identified by the use of forward-looking terms such as "believes," "expects," "may," "will," "shall," "should," "would," "could," "seeks," "aims," "projects," "is optimistic," "intends," "plans," "estimates," "anticipates" or other comparable terms. Forward-looking statements include, without limitation, all matters that are not historical facts. They appear in a number of places throughout this Annual Report and include, without limitation, statements regarding our intentions, beliefs, assumptions or current expectations concerning, among other things, financial position; results of operations; cash flows; prospects; growth strategies or expectations; timing and amount of share repurchases; customer retention; the outcome (by judgment or settlement) and costs of legal, administrative or regulatory proceedings, investigations or inspections, including, without limitation, collective, representative or class action litigation; and the impact of prevailing economic conditions.
Forward-looking statements are subject to known and unknown risks and uncertainties, many of which may be beyond our control. We caution you that forward-looking statements are not guarantees of future performance or outcomes and that actual performance and outcomes, including, without limitation, our actual results of operations, financial condition and liquidity, and the development of the market in which we operate, may differ materially from those made in or suggested by the forward-looking statements contained in this Annual Report. In addition, even if our results of operations, financial condition and cash flows, and the development of the market in which we operate, are consistent with the forward-looking statements contained in this Annual Report, those results or developments may not be indicative of results or developments in subsequent periods. A number of important factors, including, without limitation, the risks and uncertainties discussed under the captions "Risk Factors" and "Management's Discussion and Analysis of Financial Condition and Results of Operations" in this Annual Report, could cause actual results and outcomes to differ materially from those reflected in the forward-looking statements. Additional factors that could cause actual results and outcomes to differ from those reflected in forward-looking statements include, without limitation:
declines in, and uncertainty regarding, the general business and economic conditions in the United States and international markets in which we operate;
weakness or another downturn in the United States non-residential construction industry;
changes in prices of raw materials;
pricing pressure, reduced profitability, or loss of market share due to intense competition;
availability and cost of third-party freight carriers and energy;
high levels of imports of products similar to those manufactured by us;
changes in federal, state, local and international governmental regulations and trade policies;
adverse weather conditions;
failure to generate sufficient cash flow from operations or to raise sufficient funds in the capital markets to satisfy existing obligations and support the development of our business;
increased costs relating to future capital and operating expenditures to maintain compliance with environmental, health and safety laws;
reduced spending by, deterioration in the financial condition of, or other adverse developments with respect to, one or more of our top customers;
increases in our working capital needs, which are substantial and fluctuate based on economic activity and the market prices for our main raw materials, including as a result of failure to collect, or delays in the collection of, cash from the sale of manufactured products;
work stoppage or other interruptions of production at our facilities as a result of disputes under existing collective bargaining agreements with labor unions or in connection with negotiations of new collective bargaining agreements, as a result of supplier financial distress, or for other reasons;
challenges attracting and retaining key personnel or high-quality employees;
changes in our financial obligations relating to pension plans that we maintain in the United States;
reduced production or distribution capacity due to interruptions in the operations of our facilities or those of our key suppliers;
loss of a substantial number of our third-party agents or distributors or a dramatic deviation from the amount of sales they generate;
security threats, attacks, or other disruptions to our information systems, or failure to comply with complex network security, data privacy and other legal obligations or the failure to protect sensitive information;
possible impairment of goodwill or other long-lived assets as a result of future triggering events, such as declines in our cash flow projections or customer demand;
safety and labor risks associated with the manufacture and in the testing of our products;
product liability, construction defect and warranty claims and litigation relating to our various products, as well as government inquiries and investigations, and consumer, employment, tort and other legal proceedings;
our ability to protect our intellectual property and other material proprietary rights;
risks inherent in doing business internationally;
our inability to introduce new products effectively or implement our innovation strategies;
the inability of our customers to pay off the credit lines extended to them by us in a timely manner and the negative impact on customer relations resulting from our collections efforts with respect to non-paying or slow-paying customers;
our inability to continue importing raw materials, component parts and/or finished goods;
changes as a result of comprehensive tax reform;
the incurrence of liabilities and the issuance of additional debt or equity in connection with acquisitions, joint ventures or divestitures and the failure of indemnification provisions in our acquisition agreements to fully protect us from unexpected liabilities;
failure to manage acquisitions successfully, including identifying, evaluating, and valuing acquisition targets and integrating acquired companies, businesses or assets;
the incurrence of liabilities in connection with violations of the FCPA and similar foreign anti-corruption laws;
the incurrence of additional expenses, increase in complexity of our supply chain and potential damage to our reputation with customers resulting from regulations related to "conflict minerals";
disruptions or impediments to the receipt of sufficient raw materials resulting from various anti-terrorism security measures;
restrictions contained in our debt agreements;
failure to generate cash sufficient to pay the principal of, interest on, or other amounts due on our debt;
the significant influence the CD&R Investor will have over corporate decisions; and
other risks and factors included under "Risk Factors" and elsewhere in this Annual Report.
You should read this Annual Report completely and with the understanding that actual future results may be materially different from expectations. All forward-looking statements attributable to us or persons acting on our behalf that are made in this Annual Report are qualified in their entirety by these cautionary statements. These forward-looking statements are made
only as of the date of this Annual Report, and we do not undertake any obligation, other than as may be required by law, to update or revise any forward-looking or cautionary statements to reflect changes in assumptions, the occurrence of events, unanticipated or otherwise, and changes in future operating results over time or otherwise.
Comparisons of results for current and any prior periods are not intended to express any future trends, or indications of future performance, unless expressed as such, and should only be viewed as historical data.
Item 7A. Quantitative and Qualitative Disclosures about Market Risk
In the normal course of conducting business, we are exposed to certain risks associated with potential changes in market conditions. These risks include fluctuations in interest rates, credit risks, commodity prices, including price fluctuations related to our primary raw materials and foreign currency translation rates.
Interest Rate Risk
The Credit Facilities bear interest at a floating rate. The ABL Credit Facility bears interest at a floating rate generallyof LIBOR plus an applicable margin. The First Lien Term Loan Facility bears interest at the greater of LIBOR or 1.00% plus an applicable margin. As a result, we are exposed to fluctuations in interest rates to the extent of our net borrowings under the Credit Facilities, which were $580.1$912.2 million at September 30, 2017.2018. As of September 30, 2017, assuming2018, LIBOR exceeded 1.00%,; therefore, each one percentage point change in interest rates would result in an approximately $5.0$9.3 million change in the annual interest expense on our First Lien Term Loan Facility. As of September 30, 2017,2018, assuming availability was fully utilized, each one percentage point change in interest rates would result in an approximately $4.1$3.3 million change in annual interest expense on the ABL Credit Facility. Additionally, if the ABL Credit Facility were fully utilized, the margin we pay on borrowings would increase by 0.50% from the current level and we would incur additional interest expense of $1.6 million.
Credit Risk
We are exposed to credit risk on accounts receivable balances. This risk is mitigated due to our large, diverse customer base. In fiscal 2017,2018, our ten largest customers (including buyers and distributors in buying groups) accounted for approximately 32%33.0% of our net sales. However, no single customer comprised more than 10% of our consolidated net sales andin fiscal 2018, 2017 or 2016. As of September 30, 2018, one customer, Sonepar Management US, Inc., represented 11% of the Company's accounts receivable balance due to increased sales in the last 60 days of the year. See Note 19, ''Segment Information'' to the accompanying consolidated financial statements included elsewhere in this Annual Report. No single customer comprised more than 10% of consolidated accounts receivable in fiscal 2017 2016 and 2015.or 2016. We maintain provisions for potential credit losses and such losses to date have normally been within our expectations. We evaluate the solvency of our customers on an ongoing basis to determine if additional allowances for doubtful accounts receivable need to be recorded. We have historically not been exposed to a material amount of uncollectible receivable balances.
Commodity Price Risk
We are exposed to price fluctuations for our primary raw material commodities such as steel, copper and PVC resin. Our operating performance may be affected by both upward and downward price fluctuations. We are also exposed to fluctuations in petroleum costs as we deliver a substantial portion of the products we sell by truck. We seek to minimize the effects of inflation and changing prices through economies of purchasing and inventory management resulting in cost reductions and productivity improvements as well as price increases to maintain reasonable gross margins. Such commodity price fluctuations have from time to time produced volatility in our financial performance and could do so in the future.
Foreign Currency Risk
Because we conduct our business on an international basis in multiple currencies, we may be adversely affected by foreign exchange rate fluctuations. Although we report financial results in United States dollars, approximately 9%10% of our net sales and expenses are denominated in currencies other than the United States dollar, particularly Canadian dollars, British pounds sterling, Australian dollars, Chinese Yuan and New Zealand dollars. Fluctuations in exchange rates could therefore significantly affect our reported results from period to period as we translate results in local currencies into United States dollars. With the exception of certain foreign denominated intercompany loans, we generally do not use derivative instruments to hedge translation risks in the ordinary course of business, including the risk related to earnings of foreign subsidiaries. Due to limited cross border transactions, we do not experience material foreign exchange transactional gains or losses.
Item 8. Financial Statements and Supplementary Data
REPORT OF INDEPENDENT REGISTERED PUBLIC ACCOUNTING FIRM
To the stockholders and the Board of Directors and Stockholders of Atkore International Group Inc.
Harvey, Illinois
Opinion on the Financial Statements
We have audited the accompanying consolidated balance sheets of Atkore International Group Inc. and subsidiaries (the “Company”"Company") as of September 30, 20172018 and 2016, and2017, the related consolidated statements of operations, comprehensive income, (loss), cash flows, and shareholders’shareholders' equity, for each of the three years in the period ended September 30, 2017. Our audits also included2018, and the financial statementrelated notes and the schedules listed in the Index at Part IV, Item 15. 15 (collectively referred to as the "financial statements"). In our opinion, the financial statements present fairly, in all material respects, the financial position of the Company as of September 30, 2018 and 2017, and the results of its operations and its cash flows for each of the three years in the period ended September 30, 2018, in conformity with accounting principles generally accepted in the United States of America.
We have also audited, in accordance with the standards of the Public Company Accounting Oversight Board (United States) (PCAOB), the Company's internal control over financial reporting as of September 30, 2018, based on criteria established in Internal Control - Integrated Framework (2013) issued by the Committee of Sponsoring Organizations of the Treadway Commission and our report dated November 28, 2018, expressed an unqualified opinion on the Company's internal control over financial reporting.
Basis for Opinion
These financial statements and financial statement schedules are the responsibility of the Company's management. Our responsibility is to express an opinion on the Company's financial statements and financial statement schedules based on our audits.
We are a public accounting firm registered with the PCAOB and are required to be independent with respect to the Company in accordance with the U.S. federal securities laws and the applicable rules and regulations of the Securities and Exchange Commission and the PCAOB.
We conducted our audits in accordance with the standards of the Public Company Accounting Oversight Board (United States).PCAOB. Those standards require that we plan and perform the audit to obtain reasonable assurance about whether the financial statements are free of material misstatement. An audit includesmisstatement, whether due to error or fraud. Our audits included performing procedures to assess the risks of material misstatement of the financial statements, whether due to error or fraud, and performing procedures that respond to those risks. Such procedures included examining, on a test basis, evidence supportingregarding the amounts and disclosures in the financial statements. An auditOur audits also includes assessingincluded evaluating the accounting principles used and significant estimates made by management, as well as evaluating the overall presentation of the financial statement presentation.statements. We believe that our audits provide a reasonable basis for our opinion.
In our opinion, such consolidated financial statements present fairly, in all material respects, the financial position of Atkore International Group Inc. and subsidiaries as of September 30, 2017, and 2016, and the results of their operations and their cash flows for each of the three years in the period ended September 30, 2017, in conformity with accounting principles generally accepted in the United States of America. Also, in our opinion, such financial statement schedules, when considered in relation to the basic consolidated financial statements taken as a whole, present fairly, in all material respects, the information set forth therein.
We have also audited in accordance with the standards of the Public Company Accounting Oversight Board (United States), the Company’s internal control over financial reporting as of September 30, 2017, based on the criteria established in [Internal Control - Integrated Framework (2013) Signatureissued by the Committee of Sponsoring Organizations of the Treadway Commission and our report dated November 29, 2017 expressed an unqualified opinion on the Company’s internal control over financial reporting.]
/s/ Deloitte & Touche LLP
Chicago, Illinois
November 29, 201728, 2018
We have served as the Company's auditor since 2011.
ATKORE INTERNATIONAL GROUP INC.
CONSOLIDATED STATEMENTS OF OPERATIONS
| | | | | | Fiscal Year Ended | | | Fiscal Year Ended |
| (in thousands, except per share data) | Note | | September 30, 2017 | | September 30, 2016 | | September 25, 2015 | Note | | September 30, 2018 | | September 30, 2017 As Adjusted** | | September 30, 2016 As Adjusted** |
| Net sales | | | $ | 1,503,934 |
|
| $ | 1,523,384 |
|
| $ | 1,729,168 |
| | | $ | 1,835,139 |
|
| $ | 1,503,934 |
|
| $ | 1,523,384 |
|
| Cost of sales | | | 1,141,302 |
| | 1,154,702 |
| | 1,456,375 |
| | | 1,397,055 |
| | 1,142,664 |
| | 1,155,808 |
|
| Gross profit | | 362,632 |
| | 368,682 |
| | 272,793 |
| | 438,084 |
| | 361,270 |
| | 367,576 |
|
| Selling, general and administrative | | 182,768 |
| | 219,397 |
| | 185,815 |
| | 226,282 |
| | 182,910 |
| | 219,743 |
|
| Intangible asset amortization | 13 | | 22,407 |
| | 22,238 |
| | 22,103 |
| 13 | | 32,104 |
| | 22,407 |
| | 22,238 |
|
| Asset impairment charges | | | — |
| | 129 |
| | 27,937 |
| 13 | | — |
| | — |
| | 129 |
|
| Operating income | | 157,457 |
| | 126,918 |
| | 36,938 |
| | 179,698 |
| | 155,953 |
| | 125,466 |
|
| Interest expense, net | | 26,598 |
| | 41,798 |
| | 44,809 |
| | 40,694 |
| | 26,598 |
| | 41,798 |
|
| Loss (gain) on extinguishment of debt | 14 | | 9,805 |
| | (1,661 | ) | | — |
| 14 | | — |
| | 9,805 |
| | (1,661 | ) |
| Other income, net | 6 | | (5,071 | ) | | — |
| | — |
| 7 | | (27,348 | ) | | (6,575 | ) | | (1,452 | ) |
| Income (loss) before income taxes | | 126,125 |
| | 86,781 |
| | (7,871 | ) | |
| Income tax expense (benefit) | 7 | | 41,486 |
| | 27,985 |
| | (2,916 | ) | |
| Net income (loss) | | | $ | 84,639 |
| | $ | 58,796 |
| | $ | (4,955 | ) | |
| Income before income taxes | | | 166,352 |
| | 126,125 |
| | 86,781 |
|
| Income tax expense | | 8 | | 29,707 |
| | 41,486 |
| | 27,985 |
|
| Net income | | | | $ | 136,645 |
| | $ | 84,639 |
| | $ | 58,796 |
|
| | | | | | | | |
|
| |
|
| | |
| Weighted-Average Common Shares Outstanding | | | | | | | |
| Net income per share | | | | | | | |
| Basic | 8 | | 63,420 |
| | 62,486 |
|
| 62,527 |
| 9 | | $ | 2.59 |
| | $ | 1.33 |
| | $ | 0.94 |
|
| Diluted | 8 | | 66,585 |
| | 62,820 |
|
| 62,527 |
| 9 | | $ | 2.48 |
| | $ | 1.27 |
| | $ | 0.94 |
|
| Net income (loss) per share | | | | | | | |
| Basic | 8 | | $ | 1.33 |
| | $ | 0.94 |
| | $ | (0.08 | ) | |
| Diluted | 8 | | $ | 1.27 |
| | $ | 0.94 |
| | $ | (0.08 | ) | |
| | | |
**As adjusted due to the adoption of ASU 2017-07. See Note 1, ''Basis of Presentation and Summary of Significant Accounting Policies'' for additional information. | | **As adjusted due to the adoption of ASU 2017-07. See Note 1, ''Basis of Presentation and Summary of Significant Accounting Policies'' for additional information. |
See Notes to Consolidated Financial Statements
ATKORE INTERNATIONAL GROUP INC.
CONSOLIDATED STATEMENTS OF COMPREHENSIVE INCOME (LOSS)
| | | | | Fiscal Year Ended | | Fiscal Year Ended |
| (in thousands) | Note | | September 30, 2017 | | September 30, 2016 | | September 25, 2015 | Note | | September 30, 2018 | | September 30, 2017 | | September 30, 2016 |
| Net income (loss) | | $ | 84,639 |
| | $ | 58,796 |
| | $ | (4,955 | ) | |
| Net income | | | $ | 136,645 |
| | $ | 84,639 |
| | $ | 58,796 |
|
| Other comprehensive (loss), net of tax: | | | | | | | | | | | | |
| Change in foreign currency translation adjustment | | 1,221 |
| | (858 | ) | | (7,135 | ) | | (2,853 | ) | | 1,221 |
| | (858 | ) |
| Change in unrecognized loss related to pension benefit plans, net of tax expense (benefit) of ($3,356), $2,680, $4,554, respectively | 3 | | 6,747 |
| | (4,059 | ) | | (7,268 | ) | |
| Change in unrecognized loss related to pension benefit plans, net of tax expense (benefit) of ($1,362), ($3,356), $2,680, respectively | | | 4,397 |
| | 6,747 |
| | (4,059 | ) |
| Total other comprehensive income (loss) | 9 | | 7,968 |
| | (4,917 | ) | | (14,403 | ) | 10 | | 1,544 |
| | 7,968 |
| | (4,917 | ) |
| Comprehensive income (loss) | | $ | 92,607 |
| | $ | 53,879 |
| | $ | (19,358 | ) | |
| Comprehensive income | | | $ | 138,189 |
| | $ | 92,607 |
| | $ | 53,879 |
|
See Notes to Consolidated Financial Statements
ATKORE INTERNATIONAL GROUP INC.
CONSOLIDATED BALANCE SHEETS
| | | (in thousands, except share and per share data) | Note | | September 30, 2017 | | September 30, 2016 | Note | | September 30, 2018 | | September 30, 2017 |
| Assets | | | | | | | | |
| Current Assets: | | | | | | | | |
| Cash and cash equivalents | | $ | 45,718 |
| | $ | 200,279 |
| | $ | 126,662 |
| | $ | 45,718 |
|
| Accounts receivable, less allowance for doubtful accounts of $1,239 and $1,006, respectively | | 224,427 |
| | 192,090 |
| |
| Accounts receivable, less allowance for doubtful accounts of $1,762 and $1,239, respectively | | | 265,147 |
| | 224,427 |
|
| Inventories, net | 10 | | 200,003 |
| | 161,465 |
| 11 | | 221,753 |
| | 200,003 |
|
| Assets held for sale | 11 | | — |
| | 6,680 |
| |
| Prepaid expenses and other current assets | | 35,611 |
| | 22,407 |
| | 33,576 |
| | 35,611 |
|
| Total current assets | | 505,759 |
| | 582,921 |
| | 647,138 |
| | 505,759 |
|
| Property, plant and equipment, net | 12 | | 208,619 |
| | 202,692 |
| 12 | | 213,108 |
| | 208,619 |
|
| Intangible assets, net | 13 | | 344,289 |
| | 254,937 |
| 13 | | 291,916 |
| | 344,289 |
|
| Goodwill | 13 | | 147,716 |
| | 115,829 |
| 13 | | 170,129 |
| | 147,716 |
|
| Deferred income taxes | 7 | | 1,657 |
| | 945 |
| 8 | | 162 |
| | 1,657 |
|
| Non-trade receivables | | 7,052 |
| | 7,244 |
| | 1,607 |
| | 7,052 |
|
| Total Assets | | $ | 1,215,092 |
| | $ | 1,164,568 |
| | $ | 1,324,060 |
| | $ | 1,215,092 |
|
| Liabilities and Equity | | | | | | | | |
| Current Liabilities: | | | | | |
| | |
| Short-term debt and current maturities of long-term debt | 14 | | $ | 4,215 |
| | $ | 1,267 |
| 14 | | $ | 26,561 |
| | $ | 4,215 |
|
| Accounts payable | | 125,618 |
| | 114,118 |
| | 156,525 |
| | 125,618 |
|
| Income tax payable | | 2,581 |
| | 2,326 |
| | 542 |
| | 2,581 |
|
| Accrued compensation and employee benefits | | 26,387 |
| | 34,331 |
| | 33,350 |
| | 26,387 |
|
| Other current liabilities | | 53,036 |
| | 52,780 |
| | 55,769 |
| | 53,036 |
|
| Total current liabilities | | 211,837 |
| | 204,822 |
| | 272,747 |
| | 211,837 |
|
| Long-term debt | 14 | | 571,863 |
| | 629,046 |
| 14 | | 877,686 |
| | 571,863 |
|
| Deferred income taxes | 7 | | 17,464 |
| | 12,834 |
| 8 | | 16,510 |
| | 17,464 |
|
| Other long-term tax liabilities | | 6,771 |
| | 6,838 |
| | 1,443 |
| | 6,771 |
|
| Pension liabilities | 3 | | 25,239 |
| | 35,172 |
| 4 | | 17,075 |
| | 25,239 |
|
| Other long-term liabilities | | 21,047 |
| | 18,610 |
| | 16,540 |
| | 21,047 |
|
| Total Liabilities | | 854,221 |
| | 907,322 |
| | 1,202,001 |
| | 854,221 |
|
| Equity: | | | | | | | | |
| Common stock, $0.01 par value, 1,000,000,000 shares authorized, 63,305,434 and 62,458,367 shares issued and outstanding, respectively | | 634 |
| | 626 |
| |
| Common stock, $0.01 par value, 1,000,000,000 shares authorized, 47,079,645 and 63,305,434 shares issued and outstanding, respectively | | | 472 |
| | 634 |
|
| Treasury stock, held at cost, 260,900 and 260,900 shares, respectively | | (2,580 | ) | | (2,580 | ) | | (2,580 | ) | | (2,580 | ) |
| Additional paid-in capital | | 423,232 |
| | 398,292 |
| | 457,978 |
| | 423,232 |
|
| Accumulated deficit | | (42,433 | ) | | (113,142 | ) | | (317,373 | ) | | (42,433 | ) |
| Accumulated other comprehensive loss | 9 | | (17,982 | ) | | (25,950 | ) | 10 | | (16,438 | ) | | (17,982 | ) |
| Total Equity | | 360,871 |
| | 257,246 |
| | 122,059 |
| | 360,871 |
|
| Total Liabilities and Equity | | $ | 1,215,092 |
| | $ | 1,164,568 |
| | $ | 1,324,060 |
| | $ | 1,215,092 |
|
See Notes to Consolidated Financial Statements
ATKORE INTERNATIONAL GROUP INC.
CONSOLIDATED STATEMENTS OF CASH FLOWS
| | | | | Fiscal year ended | | Fiscal year ended |
| (in thousands) | Note | | September 30, 2017 | | September 30, 2016 | | September 25, 2015 | Note | | September 30, 2018 | | September 30, 2017 | | September 30, 2016 |
| Operating activities: | | | | | | | | | | | | |
| Net income (loss) | | $ | 84,639 |
| | $ | 58,796 |
| | $ | (4,955 | ) | |
| Net income | | | $ | 136,645 |
| | $ | 84,639 |
| | $ | 58,796 |
|
| Adjustments to reconcile net income to net cash provided by operating activities: | | | | | | | | | | | | |
| (Gain) loss on sale of fixed assets and assets held for sale | | (5,093 | ) | | (357 | ) | | 1,240 |
| |
| Gain on sale of a business | | | (27,575 | ) | | (5,093 | ) | | (357 | ) |
| Impairment of assets | | — |
| | 129 |
| | 27,937 |
| | — |
| | — |
| | 129 |
|
| Depreciation and amortization | | 54,727 |
| | 55,017 |
| | 59,465 |
| | 66,890 |
| | 54,727 |
| | 55,017 |
|
| Amortization of debt issuance costs and original issue discount | | 1,446 |
| | 3,586 |
| | 3,631 |
| | 1,542 |
| | 1,446 |
| | 3,586 |
|
| Deferred income taxes | 7 | | 938 |
| | 2,556 |
| | (3,650 | ) | 8 | | (9,008 | ) | | 938 |
| | 2,556 |
|
| Loss (gain) on extinguishment of debt | 14 | | 9,805 |
| | (1,661 | ) | | — |
| 14 | | — |
| | 9,805 |
| | (1,661 | ) |
| Provision for losses on accounts receivable and inventory | | 1,333 |
| | 3,021 |
| | 546 |
| | 7,241 |
| | 1,333 |
| | 3,021 |
|
| Stock-based compensation expense | 4 | | 12,788 |
| | 21,127 |
| | 13,523 |
| 5 | | 14,664 |
| | 12,788 |
| | 21,127 |
|
| Other adjustments to net income (loss) | | 896 |
| | (190 | ) | | — |
| |
| Other adjustments to net income | | | 2,023 |
| | 896 |
| | (190 | ) |
| Changes in operating assets and liabilities, net of effects from acquisitions | | | | | | | | | | | | |
| Accounts receivable | | (13,445 | ) | | 24,538 |
| | 7,038 |
| | (44,419 | ) | | (13,445 | ) | | 24,538 |
|
| Inventories | | (10,301 | ) | | (2,437 | ) | | 67,509 |
| | (36,528 | ) | | (10,301 | ) | | (2,437 | ) |
| Prepaid expenses and other current assets | | (3,074 | ) | | (2,986 | ) | | (616 | ) | | (1,762 | ) | | (3,074 | ) | | (2,986 | ) |
| Accounts payable | | 8,673 |
| | 4,061 |
| | (43,710 | ) | | 31,667 |
| | 8,673 |
| | 4,061 |
|
| Income taxes | | (9,138 | ) | | 1,005 |
| | (3,814 | ) | | (3,179 | ) | | (9,138 | ) | | 1,005 |
|
| Accrued and other liabilities | | (11,232 | ) | | (9,551 | ) | | 16,311 |
| | 7,243 |
| | (11,232 | ) | | (9,551 | ) |
| Other, net | | (1,308 | ) | | (8 | ) | | 618 |
| | 259 |
| | (1,308 | ) | | (8 | ) |
| Net cash provided by operating activities | | 121,654 |
| | 156,646 |
| | 141,073 |
| | 145,703 |
| | 121,654 |
| | 156,646 |
|
| Investing activities: | | | | | | | | | | | | |
| Capital expenditures | | (25,122 | ) | | (16,830 | ) | | (26,849 | ) | | (38,501 | ) | | (25,122 | ) | | (16,830 | ) |
| Proceeds from sale of properties, plant and equipment | | 100 |
| | 75 |
| | 1,451 |
| | 349 |
| | 100 |
| | 75 |
|
| Proceeds from divestiture of business | | | 42,631 |
| | — |
| | — |
|
| Proceeds from sale of assets held for sale | 11 | | 3,024 |
| | 2,400 |
| | — |
| | — |
| | 3,024 |
| | 2,400 |
|
| Acquisitions of businesses, net of cash acquired | 2 | | (183,923 | ) | | — |
| | (30,549 | ) | 2 | | (3,467 | ) | | (183,923 | ) | | — |
|
| Proceeds from sale of an investment | | — |
| | 1,328 |
| | 4,844 |
| | — |
| | — |
| | 1,328 |
|
| Other, net | | 88 |
| | 132 |
| | (78 | ) | | 1,502 |
| | 88 |
| | 132 |
|
| Net cash (used for) continuing investing activities | | (205,833 | ) | | (12,895 | ) | | (51,181 | ) | |
| Net cash provided by discontinued investing activities | | — |
| | — |
| | 4,540 |
| |
| Net cash (used for) investing activities | | (205,833 | ) | | (12,895 | ) | | (46,641 | ) | |
| Net cash provided by (used for) investing activities | | | 2,514 |
| | (205,833 | ) | | (12,895 | ) |
| Financing activities: | | | | | | | | | | | | |
| Borrowings under credit facility | 14 | | 97,000 |
| | — |
| | 788,000 |
| 14 | | 358,000 |
| | 97,000 |
| | — |
|
| Repayments under credit facility | 14 | | (12,000 | ) | | — |
| | (828,000 | ) | 14 | | (443,000 | ) | | (12,000 | ) | | — |
|
| Issuance of short-term debt | 14 | | — |
| | — |
| | 1,692 |
| |
| Repayments of short-term debt | 14 | | (4,200 | ) | | (1,619 | ) | | (1,661 | ) | 14 | | (8,150 | ) | | (4,200 | ) | | (1,619 | ) |
| Issuance of long-term debt | 14 | | 498,750 |
| | — |
| | — |
| 14 | | 426,217 |
| | 498,750 |
| | — |
|
| Repayments of long-term debt | 14 | | (641,100 | ) | | (22,175 | ) | | (4,200 | ) | 14 | | (1,217 | ) | | (641,100 | ) | | (22,175 | ) |
| Issuance of common stock | 4 | | 12,168 |
| | 52 |
| | 49 |
| 5 | | 20,110 |
| | 12,168 |
| | 52 |
|
| Repurchase of common stock | | | (411,775 | ) | | (13,938 | ) | | — |
|
| Payments for debt financing costs and fees | | 14 | | (5,955 | ) | | (4,375 | ) | | — |
|
| | | | | Fiscal year ended | | Fiscal year ended |
| (in thousands) | Note | | September 30, 2017 | | September 30, 2016 | | September 25, 2015 | Note | | September 30, 2018 | | September 30, 2017 | | September 30, 2016 |
| Repurchase of common stock | | (13,938 | ) | | — |
| | (882 | ) | |
| Payment for debt financing costs and fees | 14 | | (4,375 | ) | | — |
| | (102 | ) | |
| Proceeds from foreign exchange forward option | | — |
| | — |
| | 999 |
| |
| Other, net | | (65 | ) | | (166 | ) | | (1 | ) | | (161 | ) | | (65 | ) | | (166 | ) |
| Net cash (used for) financing activities | | (67,760 | ) | | (23,908 | ) | | (44,106 | ) | | (65,931 | ) | | (67,760 | ) | | (23,908 | ) |
| Effects of foreign exchange rate changes on cash and cash equivalents | | (2,622 | ) | | (162 | ) | | (3,088 | ) | | (1,342 | ) | | (2,622 | ) | | (162 | ) |
| Increase (decrease) in cash and cash equivalents | | (154,561 | ) | | 119,681 |
| | 47,238 |
| | 80,944 |
| | (154,561 | ) | | 119,681 |
|
| Cash and cash equivalents at beginning of period | | 200,279 |
| | 80,598 |
| | 33,360 |
| | 45,718 |
| | 200,279 |
| | 80,598 |
|
| Cash and cash equivalents at end of period | | $ | 45,718 |
| | $ | 200,279 |
| | $ | 80,598 |
| | $ | 126,662 |
| | $ | 45,718 |
| | $ | 200,279 |
|
| Supplementary Cash Flow information | | | | | | | | | | | | |
| Interest paid | | $ | 26,131 |
| | $ | 49,855 |
| | $ | 41,460 |
| | $ | 39,898 |
| | $ | 26,131 |
| | $ | 49,855 |
|
| Income taxes paid, net of refunds | | 49,813 |
| | 30,859 |
| | 4,759 |
| | 41,601 |
| | 49,813 |
| | 30,859 |
|
| Capital expenditures, not yet paid | | 1,330 |
| | 525 |
| | 327 |
| | 916 |
| | 1,330 |
| | 525 |
|
| Reclassification of stock-based compensation liability | 4 | | — |
| | 43,870 |
| | — |
| 5 | | — |
| | — |
| | 43,870 |
|
See Notes to Consolidated Financial Statements
ATKORE INTERNATIONAL GROUP INC.
CONSOLIDATED STATEMENTS OF SHAREHOLDERS' EQUITY
For the three year period ended September 30, 20172018 | | | | | Common Stock | | Treasury Stock | | Additional Paid-in Capital | | Accumulated Deficit | | Accumulated Other Comprehensive Income (Loss) | | Total Equity | | Common Stock | | Treasury Stock | | Additional Paid-in Capital | | Accumulated Deficit | | Accumulated Other Comprehensive Income (Loss) | | Total Equity |
| (in thousands) | | Shares | | Amount | | Amount | | | Shares | | Amount | | Amount | |
| Balance as of September 26, 2014 | | 62,545 |
| | $ | 626 |
| | $ | (1,698 | ) | | $ | 352,457 |
| | $ | (168,286 | ) | | $ | (6,630 | ) | | $ | 176,469 |
| |
| Net loss | | — |
| | — |
| | — |
| | — |
| | (4,955 | ) | | — |
| | (4,955 | ) | |
| Other comprehensive loss | | — |
| | — |
| | — |
| | — |
| | — |
| | (14,403 | ) | | (14,403 | ) | |
| Issuance of common stock | | 5 |
| | — |
| | — |
| | 49 |
| | — |
| | — |
| | 49 |
| |
| Repurchase of common stock | | (97 | ) | | — |
| | (882 | ) | | — |
| | — |
| | — |
| | (882 | ) | |
| Balance as of September 25, 2015 | | 62,453 |
| | 626 |
| | (2,580 | ) | | 352,505 |
| | (173,241 | ) | | (21,033 | ) | | 156,277 |
| | 62,453 |
| | $ | 626 |
| | $ | (2,580 | ) | | $ | 352,505 |
| | $ | (173,241 | ) | | $ | (21,033 | ) | | $ | 156,277 |
|
| Net income | | — |
| | — |
| | — |
| | — |
| | 58,796 |
| | — |
| | 58,796 |
| | — |
| | — |
| | — |
| | — |
| | 58,796 |
| | — |
| | 58,796 |
|
| Cumulative effect adjustment for a change in accounting principle | | — |
| | — |
| | — |
| | — |
| | 1,303 |
| | — |
| | 1,303 |
| | — |
| | — |
| | — |
| | — |
| | 1,303 |
| | — |
| | 1,303 |
|
| Other comprehensive loss | | — |
| | — |
| | — |
| | — |
| | — |
| | (4,917 | ) | | (4,917 | ) | | — |
| | — |
| | — |
| | — |
| | — |
| | (4,917 | ) | | (4,917 | ) |
| Modification of liability award to equity based compensation | | — |
| | — |
| | — |
| | 43,870 |
| | — |
| | — |
| | 43,870 |
| | — |
| | — |
| | — |
| | 43,870 |
| | — |
| | — |
| | 43,870 |
|
| Stock-based compensation | | — |
| | — |
| | — |
| | 1,865 |
| | — |
| | — |
| | 1,865 |
| | — |
| | — |
| | — |
| | 1,865 |
| | — |
| | — |
| | 1,865 |
|
| Issuance of common stock | | 5 |
| | — |
| | — |
| | 52 |
| | — |
| | — |
| | 52 |
| | 5 |
| | — |
| | — |
| | 52 |
| | — |
| | — |
| | 52 |
|
| Balance as of September 30, 2016 | | 62,458 |
| | 626 |
| | (2,580 | ) | | 398,292 |
| | (113,142 | ) | | (25,950 | ) | | 257,246 |
| | 62,458 |
| | 626 |
| | (2,580 | ) | | 398,292 |
| | (113,142 | ) | | (25,950 | ) | | 257,246 |
|
| Net income | | — |
| | — |
| | — |
| | — |
| | 84,639 |
| | — |
| | 84,639 |
| | — |
| | — |
| | — |
| | — |
| | 84,639 |
| | — |
| | 84,639 |
|
| Other comprehensive income | | — |
| | — |
| | — |
| | — |
| | — |
| | 7,968 |
| | 7,968 |
| | — |
| | — |
| | — |
| | — |
| | — |
| | 7,968 |
| | 7,968 |
|
| Stock-based compensation | | — |
| | — |
| | — |
| | 12,788 |
| | — |
| | — |
| | 12,788 |
| | — |
| | — |
| | — |
| | 12,788 |
| | — |
| | — |
| | 12,788 |
|
| Issuance of common stock | | 1,628 |
| | 16 |
| | — |
| | 12,152 |
| | — |
| | — |
| | 12,168 |
| | 1,628 |
| | 16 |
| | — |
| | 12,152 |
| | — |
| | — |
| | 12,168 |
|
| Repurchase of common stock | | (781 | ) | | (8 | ) | | — |
| | — |
| | (13,930 | ) | | — |
| | (13,938 | ) | | (781 | ) | | (8 | ) | | — |
| | — |
| | (13,930 | ) | | — |
| | (13,938 | ) |
| Balance as of September 30, 2017 | | 63,305 |
| | $ | 634 |
| | $ | (2,580 | ) | | $ | 423,232 |
| | $ | (42,433 | ) | | $ | (17,982 | ) | | $ | 360,871 |
| | 63,305 |
| | 634 |
| | (2,580 | ) | | 423,232 |
| | (42,433 | ) | | (17,982 | ) | | 360,871 |
|
| Net income | | | — |
| | — |
| | — |
| | — |
| | 136,645 |
| | — |
| | 136,645 |
|
| Other comprehensive income | | | — |
| | — |
| | — |
| | — |
| | — |
| | 1,544 |
| | 1,544 |
|
| Stock-based compensation | | | — |
| | — |
| | — |
| | 14,664 |
| | — |
| | — |
| | 14,664 |
|
| Issuance of common stock | | | 2,795 |
| | 28 |
| | — |
| | 20,082 |
| | — |
| | — |
| | 20,110 |
|
| Repurchase of common stock | | | (19,020 | ) | | (190 | ) | | — |
| | — |
| | (411,585 | ) | | — |
| | (411,775 | ) |
| Balance as of September 30, 2018 | | | 47,080 |
| | $ | 472 |
| | $ | (2,580 | ) | | $ | 457,978 |
| | $ | (317,373 | ) | | $ | (16,438 | ) | | $ | 122,059 |
|
See Notes to Consolidated Financial Statements
ATKORE INTERNATIONAL GROUP INC.
NOTES TO CONSOLIDATED FINANCIAL STATEMENTS
(dollars in thousands, except share and per share data)
1. BASIS OF PRESENTATION AND SUMMARY OF SIGNIFICANT ACCOUNTING POLICIES
Basis of presentation
Organization and Ownership Structure — Atkore International Group Inc. (the "Company" or "Atkore") is a leading manufacturer of Electrical Raceway products primarily for the non-residential construction and renovation markets and Mechanical Products & Solutions ("MP&S") for the construction and industrial markets. Electrical Raceway products form the critical infrastructure that enables the deployment, isolation and protection of a structure's electrical circuitry from the original power source to the final outlet. MP&S frame, support and secure component parts in a broad range of structures, equipment and systems in electrical, industrial and construction applications.
The Company was incorporated in the State of Delaware on November 4, 2010. Atkore is the sole stockholder of Atkore International Holdings Inc. ("AIH"), which in turn is the sole stockholder of Atkore International, Inc. ("AII").
The Transactions — On November 9, 2010, Tyco announced that it had entered into an agreement to sell a majority interest in TEMP to CD&R Allied Holdings, L.P. (the "CD&R Investor)Investor"), an affiliate of the private equity firm Clayton Dubilier & Rice, LLC ("CD&R"). On December 22, 2010, the transaction was completed and CD&R acquired shares of a newly created class of cumulative convertible preferred stock (the "Preferred Stock") of the Company. The Preferred Stock initially represented 51% of the Company’s outstanding capital stock (on an as-converted basis). The preferred stock is entitled to a 12% fixed, cumulative dividend paid quarterly ("Preferred Dividends") and dividends on an as-converted basis when declared on common stock ("Participating Dividends"). On December 22, 2010, the Company also issued common stock (the "Common Stock") to Tyco’s wholly owned subsidiary, Tyco International Holding S.à.r.l. ("Tyco Seller"), that initially represented the remaining 49% of the Company’s outstanding capital stock. Subsequent to December 22, 2010, the Company has operated as an independent, stand-alone entity. The aforementioned transactions described in this paragraph are referred to herein as the "Transactions."
On March 6, 2014, the Company entered into a non-binding letter of intent (the "Letter of Intent") with Tyco for the acquisition (the "Acquisition") of 40.3 million shares of Common Stock held by Tyco Seller. On April 9, 2014, the Company paid $250,000 to Tyco Seller to redeem the shares, which were subsequently retired. The Company paid $2,000 of expenses related to the share redemption.
In a separate transaction on the same date, the CD&R Investor converted its Preferred Stock and accumulated Preferred Dividends into Common Stock. As of September 26, 2014, Common Stock is the Company’s sole issued and outstanding class of securities.
Initial Public Offering — On June 9, 2016, the Company's Registration Statement on Form S-1 relating to an initial public offering ("IPO") of its common stock was declared effective by the United States Securities and Exchange Commission ("SEC") and on June 15, 2016, we completed the IPO at a price to the public of $16.00 per share. In connection with the IPO, the CD&R Allied Holdings, L.P., (the "CD&R Investor"),Investor, an affiliate of Clayton, Dubilier & Rice LLC ("CD&R"),&R, sold an aggregate of 12,000,000 shares of its common stock. In a series of secondary offerings during fiscal 2017, the CD&R Investor sold an aggregate 19,550,000 shares of the Company's common stock. The CD&R Investor received all of the net proceeds and bore all commissions and discounts from the sale of our common stock. The Company did not receive any proceeds from the IPO or any of the secondary offerings. As of September 30, 2017, CD&R owned 48.1% of the common stock.
Holders of common stock are entitled to cast one vote for each share held of record on all matters submitted to a vote of the stockholders. Additionally, holders of common stock are entitled to receive, on a pro rata basis, dividends and distributions, if any, that the Company’s board of directors may declare out of legally available funds, subject to preferences that may be applicable to preferred stock, if any.
Share Repurchase Program — In August 2017, the Company's Board of Directors approved a share repurchase program, under which the Company may repurchase up to an aggregate amount of $75.0 million of its outstanding stock. Share repurchases will be conducted under the program in the open market and through broker negotiated purchases in compliance with Rule 10b-18 of the Securities Exchange Act of 1934, as amended, and subject to market conditions, applicable legal requirements, and other relevant factors. The share repurchase program will be funded from the Company's available cash balances. This share repurchase program does not obligate the Company to acquire any particular amount of common stock,
and it may be terminated at any time at the Company's discretion. As of September 30, 2017,2018, there were approximately $61,089 thousand$24.4 million of authorized repurchases remaining. The Company repurchased 781 thousand shares of common stock through September 30, 2017.
Segment Realignment and Reclassifications — Effective in the fourth quarter of fiscal 2017,
In January 2018, the Company implementedannounced a realignment (the "Realignment") of its segment financial reporting structure. Allstock repurchase transaction whereby the Company agreed to repurchase from the CD&R Investor, a related party, approximately 17.2 million shares of the Company's international businesses withincommon stock, par value $0.01 per share, at a per share price equal to $21.77, for a total purchase price of $375 million, subject to the Europe, Middle Eastterms and Africa ("EMEA") and Asia Pacific ("APAC") regions had historically been reportedconditions set forth in the MP&S segment despite having some Electrical Raceway content. Due tostock purchase agreement. Following the cumulative effectstock repurchase transaction in January 2018 and secondary offerings of the organic growthCompany's common stock in February 2018 and May 2018, the CD&R Investor completed its exit from its investment in the Company, and, as of these Electrical Raceway products andSeptember 30, 2018, no longer owned any of the Company's recent acquisitions (Marco Cable Management and Flexicon Industries), are now reported in the Electrical Raceway segment. The Realignment reflects how the Company's Chief Operating Decision Maker now assesses the operating performance and allocates resources to the Electrical Raceway segment.
The Company reflected these changes to its segment information retrospectively to the earliest period presented which resulted in a transfer of external net sales, intersegment sales, total assets and Adjusted EBITDA from the MP&S segment to the Electrical Raceway segment. These changes had no impact on the Company’s previously reported consolidated net sales, operating income, net income or earnings per share. See Note 19, ''Segment Information'' for additional details.common stock.
Basis of Presentation — The accompanying audited consolidated financial statements of the Company and all of its subsidiaries included herein have been prepared in accordance with accounting principles generally accepted in the United States of America ("GAAP").
The audited consolidated financial statements include the assets and liabilities used in operating the Company's business. All intercompany balances and transactions have been eliminated in consolidation. The results of companies acquired or disposed of are included in the audited consolidated financial statements from the effective date of acquisition or up to the date of disposal.
Fiscal Periods — Starting in fiscal 2016, the Company has a fiscal year that ends on September 30. Prior to fiscal 2016, the fiscal year ended on the last Friday in September. Fiscal year 20172018 and 20152017 were 52-week fiscal years which ended on September 30, 20172018 and September 25, 2015,30, 2017, respectively. Fiscal year 2016 was a 53-week fiscal year which ended on September 30, 2016. The Company's fiscal quarters end on the last Friday in December, March and June.
Use of Estimates — The preparation of the consolidated financial statements in conformity with GAAP requires management to make estimates and assumptions that affect the reported amounts of assets and liabilities, disclose contingent assets and liabilities at the date of the consolidated financial statements and report the associated amounts of revenues and expenses. Actual results could differ materially from these estimates.
Summary of significant accounting policies
Revenue Recognition — The Company's revenue is generated principally from the sale of its products. Revenue from the sale of products is recognized at the time title, risks and rewards of ownership pass. This is generally when the products reach the free-on-board shipping point, the sales price is fixed and determinable and collection is reasonably assured. The freight charges for shipments are included in the Company's revenues. Revenues are recorded net of tax.
Provisions for certain rebates, sales incentives, trade promotions, product returns and discounts to customers are accounted for as reductions in determining sales in the same period the related sales are recorded. Rebates are estimated based on sales terms and historical experience.
Product returns are estimated based on historical experience and are recorded at the time revenues are recognized. Accordingly, the Company reduces recognized revenue for estimated future returns at the time revenue is recorded. The estimates for returns are adjusted periodically based upon changes in historical rates of returns and trend analysis.
Cost of Sales — The Company includes all costs directly related to the production of goods for sale in cost of sales in the statement of operations. These costs include direct material, direct labor, production related overheads, excess and obsolescence costs, lower of cost or market provisions, freight and distribution costs, and the depreciation and amortization of assets directly used in the production of goods for sale.
Selling, General and Administrative Expenses — These amounts primarily include payroll-related expenses for both administrative and selling personnel, compensation expense from stock-based awards, restructuring-related charges, third-party
professional services and transactional gains or losses for foreign currency transactions, excluding the foreign exchange exposure for intercompany loan transactions, which is included in Other income, net.
Cash and Cash Equivalents — The Company considers all highly liquid investments with a maturity of three months or less, when purchased, to be cash equivalents.
Accounts Receivable and Allowance for Doubtful Accounts — The Company carries its accounts receivable at their face amounts less an allowance for doubtful accounts. The allowance for doubtful accounts receivable reflects the best estimate
of losses inherent in the Company's accounts receivable portfolio determined on the basis of historical experience, specific allowances for known troubled accounts and other available evidence.
Inventories — Inventories are recorded at the lower of cost (primarily LIFO) or market value. The Company estimates losses for excess and obsolete inventory through an assessment of its net realizable value based on the aging of the inventory and an evaluation of the likelihood of recovering the inventory costs based on anticipated demand and selling price. See Note 10,11, ''Inventories, net.''
Property, Plant and Equipment — Property, plant and equipment, net, is recorded at cost less accumulated depreciation. Maintenance and repair expenditures are charged to expense when incurred. Depreciation is calculated using the straight-line method over the estimated useful lives of the related assets as follows:
|
| | |
| Buildings | | 24 to 40 years |
| Building improvements | | 23 to 2220 years |
| Machinery and production equipment | | 21 to 20 years |
| Support and testing machinery and equipment | | 2 to 1510 years |
| Leasehold improvements | | Lesser of remaining term of the lease or economic useful life |
| Software | | 2 to 10 years |
The internal and external costs incurred to develop internal use computer software during the application development stage of the implementation, including the design of the chosen path, are capitalized. Other costs, including expenses incurred during the preliminary project stage, training expenses, data conversion costs and expenses incurred in the post implementation stage are expensed in the period incurred. Capitalized costs are amortized ratably over the useful life of the software when the software becomes operational. Upgrades and enhancements to internal use software are capitalized only if the costs result in additional functionality. The Company does not plan to sell or market our internal use computer software to third parties.
Long-Lived Asset and Finite - Lived Intangible Asset Impairments — The Company reviews long-lived assets, including property, plant and equipment and finite-lived intangible assets for impairment whenever events or changes in business circumstances indicate that the carrying amount of the asset may not be fully recoverable.
The Company groups assets at the lowest level for which cash flows are separately identified in order to measure an impairment. Recoverability of an asset or asset group is first measured by a comparison of the carrying amount to its estimated undiscounted future cash flows expected to be generated by the asset or asset group. If the carrying amount exceeds its estimated undiscounted future cash flows, an impairment charge is recognized as the amount by which the carrying amount of the asset or asset group exceeds the estimated fair value. If impairment is determined to exist, any related impairment loss is calculated based on the estimated fair value. Impairment losses on assets to be disposed of or held for sale, if any, are based on the estimated proceeds to be received, less costs of disposal. See Note 11, ''Assets Held for Sale.''
Goodwill and Indefinite-Lived Intangible Asset Impairments — Goodwill is assessed for impairment annually and more frequently if events or circumstances indicate that is more likely than not that the fair value of a reporting unit is less than the carrying value. See Note 13, ''Goodwill and Intangible Assets'' for additional detail. Management uses various sources of information to estimate fair value including forecasted operating results, business plans, economic projections, royalty rates, market multiples of publicly traded comparable companies and other market data.
In fiscal 2017, the Company utilized the qualitative approach ("step zero") when testing for goodwill impairment. The step zero assessment was used to determine whether it is more likely than not that the fair value of the reporting unit is less than its carrying value. The step zero assessment requires significant judgments about macroeconomic conditions including the operating environment, industry and other market considerations as well as entity-specific events to determine whether a reporting unit is at risk for goodwill impairment. In the event a reporting unit fails the step zero goodwill impairment test, it is necessary to perform the step one goodwill impairment test. The measurement date is the first day of the fourth fiscal quarter, or more frequently, if triggering events occur.
Prior to fiscal 2017, the Company tested goodwill for impairment using a two-step test. To perform step one, the Company first compares the fair value of a reporting unit with its carrying amount, including goodwill. The Company determines the fair value of a reporting unit using an income approach using a discounted cash flow analysis based on the forecasted cash flows (including estimated underlying revenue and operating income growth rates) discounted using an estimated weighted-average cost of capital of market participants. The Company additionally determines the fair value of a reporting unit using (a) a market approach using a comparable company analysis; and (b) a market approach using a transaction analysis to corroborate the results of the income approach. The fair value measurement is considered a Level 3 fair value
measurement in accordance with the fair value hierarchy. If the carrying amount of the reporting unit's goodwill exceeds the fair value of that goodwill, the Company proceeds to step two of the test and an impairment loss is recognized in an amount equal to the excess of the carrying amount of goodwill over its fair value.
The Company also assesses the recoverability of its indefinite-lived trade names on an annual basis or more frequently, if events or circumstances indicate that it is more likely than not that the fair value of a reporting unit is less than the carrying value, in accordance with ASC 350. The Company uses the relief from royalty method, an income approach method, to quantify the fair value of its trade names. The measurement date is the first day of the fourth fiscal quarter, or more frequently, if triggering events occur. In fiscal 2017, 2016 and 2015, there were no indefinite-lived trade name impairments.
The Company also considers potential impairment indicators associated with other finite-lived intangible assets, including its customer relationships, patents, and non-compete agreements. An impairment is recognized if the carrying value of an asset or asset group exceeds the estimated undiscounted future cash flows expected to result from the use of the asset or asset group and its eventual disposition. The Company's key customers are primarily wholesale and national distributors. The terms of these relationships are based on purchase orders and are not contractually based. Customer relationships are amortized on a straight-linedstraight-line basis over their useful lives, ranging from 6 to 14 years. The Company evaluates the appropriateness of remaining useful lives based on customer attrition rates. Other intangible assets are amortized on a straight-lined basis over their estimated useful lives, ranging from 21 to 20 years. The Company did not have a triggering event during fiscal 2018 and 2017.
Goodwill and Indefinite-Lived Intangible Asset Impairments —The Company assesses the recoverability of goodwill and indefinite-lived trade names on an annual basis in accordance with Accounting Standards Codification 350 ("ASC"), "Intangibles - Goodwill and Other." The measurement date is the first day of the fourth fiscal quarter, or more frequently, if events or circumstances indicate that it is more likely than not that the fair value of a reporting unit or the respective indefinite-lived trade name is less than the carrying value. The Company can elect to perform a quantitative or qualitative test of impairment. In the fourth quarter of 2017, the Company adopted Accounting Standards Update ("ASU") 2017-04, "Intangibles - Goodwill and Other (Topic 350): Simplifying the Test for Goodwill Impairment." The new guidance eliminates the requirement to determine the fair value of individual assets and liabilities of a reporting unit to measure goodwill impairment. Under the amendments in the new guidance, the quantitative goodwill impairment testing is performed by comparing the fair value of the reporting unit with its carrying amount and recognizing an impairment charge for the amount by which the carrying amount exceeds the reporting unit's fair value.
For fiscal 2018 and fiscal 2016, the Company performed a quantitative impairment assessment for goodwill. The Company calculated the fair value of its reporting units considering three valuation approaches: (a) the income approach; (b) the guideline public company method; and (c) a market approach using a transaction analysis. The income approach calculates the fair value of the reporting unit using a discounted cash flow approach. Internally forecasted future cash flows, which the Company believes reasonably approximate market participant assumptions, are discounted using a weighted average cost of capital (Discount Rate) developed for each reporting unit. The Discount Rate is developed using market observable inputs, as well as considering whether or not there is a measure of risk related to the specific reporting unit’s forecasted performance. Fair value under the guideline public company method is determined for each unit by applying market multiples for comparable public companies to the unit’s financial results. The key uncertainties in these calculations are the assumptions used in determining the reporting unit’s forecasted future performance, including revenue growth and operating margins, as well as the perceived risk associated with those forecasts, along with selecting representative market multiples.
For fiscal 2017, the Company determined through qualitative assessment ("Step 0") that it was not “more likely than not” that the fair values of its reporting units were less than their carrying values; as a result, the Company was not required to perform the quantitative impairment test.
The Company did not record any goodwill impairments in fiscal 2018, 2017 or 2016.
As noted above, ASC 350 also requires that the Company test the indefinite-lived intangible assets for impairment at least annually. Under ASC 350, if the carrying value of the indefinite-lived asset is higher than its fair value, then the asset is deemed to be impaired and the impairment charge is estimated as the difference. The Company calculated the fair value of its indefinite-lived intangible assets using the income approach, specifically the relief-from-royalty method. The relief-from-royalty method is used to estimate the cost savings that accrue to the owner of an intangible asset who would otherwise have to pay royalties or license fees on revenues earned through the use of the asset. Internally forecasted revenues, which the Company believes reasonably approximate market participant assumptions, are multiplied by a royalty rate to arrive at the estimated net after tax cost savings. The royalty rate used in the analysis is based on an analysis of empirical, market-derived royalty rates for guideline intangible assets. The net after tax cost savings are discounted using the Discount Rate developed for purposes of the Company's goodwill impairment test. The key uncertainties in these calculations are the assumptions used in determining the revenue associated with each indefinite-lived intangible asset and the royalty rate.
Fair Value Measurements — Authoritative guidance for fair value measurements establishes a three-level hierarchy that ranks the quality and reliability of information used in developing fair value estimates. The hierarchy gives the highest priority to quoted prices in active markets and the lowest priority to unobservable data. In cases where two or more levels of inputs are used to determine fair value, a financial instrument's level is determined based on the lowest level input that is considered significant to the fair value measurement in its entirety. The three levels of the fair value hierarchy are summarized as follows:
Level 1-inputs are based upon quoted prices (unadjusted) in active markets for identical assets or liabilities which are accessible as of the measurement date.
Level 2-inputs are based upon quoted prices for similar assets or liabilities in active markets, quoted prices for identical or similar assets or liabilities in markets that are not active, and model-derived valuations for the asset or liability that are derived principally from or corroborated by market data for which the primary inputs are observable, including forward interest rates, yield curves, credit risk and exchange rates.
Level 3-inputs for the valuations are unobservable and are based on management's estimates of assumptions that market participants would use in pricing the asset or liability. The fair values are therefore determined using model-based techniques such as option pricing models and discounted cash flow models.
Income Taxes and Uncertain Tax Positions — The Company accounts for income taxes under the asset and liability method, which requires the recognition of deferred tax assets and liabilities for the expected future tax consequences of events that have been included in the consolidated financial statements. Under this method, deferred tax assets and liabilities are determined based on the differences between the financial reporting and tax basis of assets and liabilities using enacted tax rates in effect for the year it is expected the differences will reverse. The effect of a change in tax rates on deferred tax assets and liabilities is recognized in income in the period of the enactment date. The Company maintains an indemnity receivable for certain tax obligations that are indemnified by Tyco International Holding S.à.r.l. ("Tyco") and that are expected to be settled directly with the taxing authorities.
The Company periodically assesses the realizabilty of the deferred tax assets. In making this determination management considers all available evidence, both positive and negative, including earnings history, expectations of future taxable income and available tax planning strategies. A valuation allowance is recorded to reduce the Company's deferred tax assets to the amount that is considered more likely than not to be realized. Changes in the required valuation allowance are recorded in income in the period such determination is made.
Certain tax positions may be considered uncertain requiring an assessment of whether an allowance should be recorded. Provisions for uncertain tax positions provide a recognition threshold based on an estimate of whether it is more likely than not that a position will be sustained upon examination. The Company measures its uncertain tax positions as the largest amount of benefit that is greater than a 50 percent50% likelihood of being realized upon examination. Interest and penalties related to unrecognized tax benefits are recorded as a component of income tax expense. See Note 7,8, ''Income Taxes.''
Leases — All leases that are determined not to meet any of the capital lease criteria are classified as operating leases. Operating lease payments are recognized as an expense in the statement of operations on a straight-line basis over the lease term.
Translation of Foreign Currency — For the Company's non-U.S. subsidiaries that report in a functional currency other than United States dollars, assets and liabilities are translated into United States dollars using year-end exchange rates. Revenue and expenses are translated at the monthly average exchange rates in effect during the fiscal year. Foreign currency translation adjustments are included as a component of accumulated other comprehensive loss within the consolidated statements of comprehensive income (loss).income.
Recent Accounting Pronouncements
A summary of recently adopted Accounting Standards Update ("ASU"s) are as follows. Adoption dates are on the first day of the fiscal year indicated below, unless otherwise specified. |
| | | | | | | | |
| Adopted Guidance |
| ASU | | Description of ASU | | Impact to Atkore | | Note | | Adoption Date |
| 2017-04 Intangibles - Goodwill and Other (Topic 350): Simplifying the Test for Goodwill Impairment | | The ASU allows an entity to perform its goodwill impairment test by comparing the fair value of a reporting segment with its carrying amount. If the carrying amount exceeds the fair value, the Company would recognize an impairment charge not to exceed the total amount of goodwill allocated to that reporting segment. This ASU eliminates existing guidance that requires an entity to determine goodwill impairment by calculating the implied fair value of goodwill by hypothetically assigning the fair value of a reporting unit to all of its assets and liabilities. | | No material impact on the consolidated financial statements. | | 13 | | 2017 |
| 2017-01 Business Combinations (Topic 805): Clarifying the Definition of a Business | | The ASU clarifies the definition of a business to assist entities in evaluating whether a transaction should be accounted for as an acquisition or disposal. | | No material impact on the consolidated financial statements. | | 2 | | 2017 |
| 2015-10 Technical Corrections and Improvements | | The ASU is part of an ongoing project on the Financial Accounting Standards Board's ("FASB") agenda to facilitate updates to the ASC, non-substantive technical corrections, clarifications, and improvements that are not expected to have a significant effect on accounting practice or create a significant administrative cost to most entities. The ASU applies to all reporting entities within the scope of the affected accounting guidance. | | No material impact on the consolidated financial statements. | | | | 2017 |
| 2015-07 Fair Value Measurement (Topic 820): Disclosures for Investments in Certain Entities that Calculate Net Asset Value per Share (or its Equivalent) | | The update amends Accounting Standards Codification ("ASC") 820, "Fair Value Measurement" and removes the requirement to categorize within the fair value hierarchy investments without readily determinable fair values in entities that elect to measure fair value using net asset value per share or its equivalent. These investments should continue to be shown in the investment disclosure amount to allow the disclosure to reconcile to the investment amount presented in the balance sheet. | | No material impact on the consolidated financial statements. | | | | 2017 |
|
| | | | | | | | |
| Adopted Guidance |
| ASU | | Description of ASU | | Impact to Atkore | | Note | | Adoption Date |
| 2017-07 Compensation - Retirement Benefits (Topic 715): Improving the Presentation of Net Periodic Pension Cost and Net Periodic Postretirement Benefit Cost | | The ASU requires an entity to report the service cost component of pension cost and postretirement benefit cost as compensation expense during the employee's service period. The other components of net periodic pension benefit costs will be presented outside a subtotal of income from operations.
| | Prior to the adoption of ASU 2017-07, pension costs were reported as cost of sales and selling, general and administrative expenses on the Company's consolidated statements of income. As a result of the early adoption of ASU 2017-07, the Company reclassified a net credit of $1,505 and $1,453 from operating income to other income, net on the consolidated statements of the years ended September 30, 2017, and September 30, 2016, respectively. | | 4 | | 2018 |
| 2017-09 Compensation - Stock Compensation (Topic 718): Scope of Modification Accounting | | The ASU does not require an entity to apply modification accounting if the fair value, vesting conditions and classification of the awards do not change.
| | No material impact on the consolidated financial statements. | | 5 | | 2018 |
|
| | | | | | | | |
| Adopted Guidance |
| ASU | | Description of ASU | | Impact to Atkore | | Note | | Adoption Date |
| 2015-16 Business Combinations (Topic 805): Simplifying the Accounting for Measurement-Period Adjustments | | The ASU requires an acquirer to recognize provisional amounts that are identified during the measurement period in the reporting period in which the adjustment amounts are determined rather than restating prior periods. | | No material impact on the consolidated financial statements. | | 2 | | 2016 |
| 2016-15 Classification of Certain Cash Receipts and Payments | | The ASU amends ASC 230, "Statement of Cash Flows" and provides guidance on the classification of certain cash receipts and payments including debt prepayment or debt issuance costs and cash payments for contingent considerations. | | No material impact on the consolidated financial statements. | | | | 2016 |
| 2016-09 Improvements to Employee Share-Based Payment Accounting | | The ASU amends ASC 718, "Compensation — Stock Compensation" and simplifies several aspects of the accounting for share-based payment transactions, including the income tax consequences, classification of awards as either equity or liabilities, and classification on the statement of cash flows. | | The Company recognized excess tax benefit adjustments using a modified retrospective method. In fiscal 2016, the Company recorded a cumulative adjustment to retained earnings of $1,300 to recognize net operating loss carryforwards, net of a valuation allowance, attributable to excess tax benefits on stock compensation that had not been previously recognized to additional paid in capital. The Company elected to account for forfeitures when they occur. The election had no impact to the financial statements. | | 4 | | 2016 |
| 2015-01 Simplifying Income Statement Presentation by Eliminating the Concept of Extraordinary Items | | This update eliminates the concept of an extraordinary item from GAAP. As a result, an entity will no longer (1) segregate an extraordinary item from the results of ordinary operations; (2) separately present an extraordinary item on its income statement, net of tax, after income from continuing operations; or (3) disclose income taxes and earnings-per-share data applicable to an extraordinary item. However, the ASU does not affect the reporting and disclosure requirements for an event that is unusual in nature or that occurs infrequently.
| | No material impact on the consolidated financial statements. | | | | 2016 |
A summary of guidance not yet adopted are as follows:
|
| | | | | | |
| Guidance not yet adopted |
| ASU | | Description of ASU | | Impact to Atkore | | Effective Date |
2017-09 Compensation - Stock Compensation (Topic 718): Scope of Modification | | The ASU does not require an entity to apply modification accounting if the fair value, vesting conditions and classification of the awards do not change. | | Under evaluation | | 2019 |
|
| | | | | | |
Guidance not yet adopted |
ASU | | Description of ASU | | Impact to Atkore | | Effective Date |
2017-07 Compensation - Retirement Benefits (Topic 715): Improving the Presentation of Net Periodic Pension Cost | | The ASU requires an entity to report the service cost component of pension cost and postretirement benefit cost as compensation expense during the employee's service period. The other components of net periodic pension benefit costs will be presented outside a subtotal of income from operations. | | Under evaluation | | 2019 |
| 2016-16 Income Taxes (Topic 740): Intra-Entity Transfers of Assets | | The ASU removes the prohibition in Accounting Standards Codification ("ASC")ASC 740 against the immediate recognition of the current and deferred income tax effects of intra-entity transfers of assets other than inventory. | | Under evaluation | | 2019 |
| ASU 2018-02 Income Statement - Reporting Comprehensive Income (Topic 220): Reclassification of Certain Tax Effects from Accumulated Other Comprehensive Income | | The ASU provided entities the option to reclassify tax effects stranded in accumulated other comprehensive income as a result of the Tax Cuts and Jobs Act to retained earnings. | | Under evaluation. | | 2020 |
| 2014-09 Revenue from Contracts with Customers | | The ASU, providesand subsequent amendments to the guidance issued in fiscal 2018, 2017, 2016 and 2015, provide guidance for revenue recognition. The update’supdate's core principle is that a company will recognize revenue when it transfers promised goods or services to customers in an amount that reflects the consideration to which the company expects to be entitled in exchange for those goods or services. In doing so, companies will need to use more judgment and make more estimates than under current guidance. Examples of the use of judgments and estimates may include identifying performance obligations in the contract, estimating the amount of variable consideration to include in the transaction price and allocating the transaction price to each separate performance obligation. The update also requires more detailed disclosures to enable users of financial statements to understand the nature, amount, timing, and uncertainty of revenue and cash flows arising from contracts with customers. The update provides for two transition methods to the new guidance: a full retrospective approach and a modified retrospective approach. | | The Company is currentlyadopted this standard in the processfirst quarter of completing2019 using the modified retrospective method. The adoption of the standard did not have a material impact on the Company’s consolidated financial statements. Based on the completion of its initial analysisreviews and performing detailed reviewsassessments, the Company has determined that the pattern of significant contractsrevenue recognition for substantially all of its existing revenue streams is substantially unchanged. The Company implemented the appropriate changes to determine if any adjustments will be necessary to existing accounting policies,business processes and controls to support an evaluation ofrecognition and disclosure under the impactnew standard, including the new qualitative and quantitative disclosures that will include information on its results of operationsthe nature, amount, timing and financial condition.significant judgments impacting revenue from contracts with customers. | | 2019 |
2015-14 Revenue from Contracts with Customers: Deferral of the Effective Date | | The standard updates ASU2014-09 and revises the effective dates to fiscal years beginning after December 15, 2017. | | Refer to impact of ASU 2014-09 above. | | 2019 |
2016-08, "Revenue from Contracts with Customers: Principal versus Agent Considerations
| | The ASU clarifies certain aspects of the principal-versus-agent guidance, including how an entity should identify the unit of accounting for the principal versus agent evaluation and how it should apply the control principle to certain types of arrangements, such as service transactions. The amendments also reframe the indicators to focus on evidence that an entity is acting as a principal rather than as an agent. | | Refer to impact of ASU 2014-09 above. | | 2019 |
2016-10, "Revenue from Contracts with Customers: Identifying Performance Obligations and Licensing | | The ASU clarifies how an entity should evaluate the nature of its promise in granting a license of intellectual property, which will determine whether it recognizes revenue over time or at a point in time. The amendments also clarify when a promised good or service is separately identifiable (i.e., distinct within the context of the contract) and allow entities to disregard items that are immaterial in the context of a contract. | | Refer to impact of ASU 2014-09 above. | | 2019 |
2016-12, "Revenue from Contracts with Customers: Narrow-Scope Improvements and Practical Expedients | | The ASU amends the new revenue recognition guidance on transition, collectibility, noncash consideration and the presentation of sales and other similar taxes. The amendments also clarify how an entity should evaluate the collectibility threshold and when an entity can recognize nonrefundable consideration received as revenue if an arrangement does not meet the standard's contract criteria. | | Refer to impact of ASU 2014-09 above. | | 2019 |
|
| | | | | | |
Guidance not yet adopted |
ASU | | Description of ASU | | Impact to Atkore | | Effective Date |
| 2016-02 Leases (Topic 842) | | The ASU, requiresand subsequent amendments to the guidance issued in fiscal 2018 and 2017, require companies to use a "right of use" lease model that assumes that each lease creates an asset (the lessee's right to use the leased asset) and a liability (the future rent payment obligations), which should be reflected on a lessee's balance sheet to fairly represent the lease transaction and the lessee's related financial obligations.obligations with terms of more than 12 months. | | Atkore conducts someThe Company will adopt the new lease guidance in the first quarter of fiscal 2020. The Company has established an implementation team, deployed lease landscape surveys and is currently evaluating the impact of adoption of this ASU on its operations under leases that are accountedconsolidated financial statements. | | 2020 |
| 2018-14 Compensation - Retirement Benefits - Defined Benefit Plans - General (Subtopic 715-20) | | The ASU amends ASC 715 to add, remove and clarify disclosure requirements related to defined benefit pension and other postretirement plans. | | Under evaluation. | | 2021 |
| 2018-07 Improvements to Nonemployee Share-Based Payment Accounting. | | ASU 2018-07 simplifies the accounting for as operating leases,share-based payments to nonemployees by aligning it with no related assets and liabilities on the balance sheet. The proposed changes would require that substantially all of the Company's operating leases be recognized as assets and liabilities on the balance sheet. The impact is still being evaluated.accounting for share-based payments to employees, with certain exceptions.
| | Under evaluation. | | 2020 |
2. ACQUISITIONS
From time to time, the Company enters into strategic acquisitions in an effort to better service existing customers and to attain new customers.
On January 8, 2018, AFC Cable Systems, Inc., a wholly-owned subsidiary of the Company, acquired the assets of Communications Integrators, Inc. ("Cii"), a manufacturer of modular, prefabricated power, voice and data distribution systems located in Tempe, Arizona for a total purchase price, including contingent consideration, of $3,997. The Company completedCii acquisition complements Atkore's existing modular and prewired products within the following acquisitions for total consideration, net of cash acquired, of approximately $185,819 and $30,440 for the fiscal years ended September 30, 2017 and September 25, 2015, respectively. The Company did not complete any acquisitions for the fiscal year ended September 30, 2016.Electrical Raceway segment.
Fiscal 2017 Transactions — On September 29, 2017, the CompanyAII acquired all of the outstanding stock of Calpipe Industries, LLC ("Calpipe"), a market leader for electrical conduit systems for corrosive environments and bollards for high security, access control and architectural environments for an aggregate purchase price of $107,000, net of cash acquired.environments. The Calpipe group of products expand Atkore's electrical racewayacquisition expanded the Company's product portfolio withby adding stainless steel and PVC coated conduit systems, introduceintroduced security bollards to the Company's offerings and further complement Atkore'scomplemented the Company's existing Electrical Raceway product offerings.
On September 1, 2017, Unistrut, Ltd, a wholly-owned indirect subsidiary of the Company, acquired all of the outstanding stock of Flexicon Limited ("Flexicon"), a leading global manufacturer of metallic and non-metallic flexible cable protection systems that carrycarries many international and market product approvals and serves the industrial, commercial and infrastructure sectors in more than 55 countries.
On May 18, 2017, Unistrut, Ltd, a wholly-owned indirect subsidiary of the Company acquired all of the outstanding stock of Marco Cable Management ("Marco"), a leading designer and manufacturer of wire basket cable tray, PVC trunking and aluminum power poles. Marco's product portfolio adds value to Atkore'sthe Company's electrical distribution partners in the U.KU.K. and expands the Company's presence in the U.K. and the rest of Europe.
The acquisitions forof Marco and Flexicon were funded using cash-on-hand. The acquisition of Calpipe was partially funded using borrowings from the ABL Credit Facility. The Company incurred approximately $751$558 and $925 during$1,676 for fiscal 2017 as acquisition-related expenses, for Calpipe and other acquisitions, respectively which were recorded as a component of selling, general and administrative expenses.expenses for the years ended September 30, 2018 and September 30, 2017, respectively.
The purchase price was allocated to tangible and intangible assets acquired and liabilities assumed, based on their estimated fair values. The following table summarizes the Level 3 fair values assigned to the net assets acquired and liabilities assumed as of the acquisition date:date for fiscal 2017: | | | (in thousands) | | Calpipe Industries, Inc. | | Other | | Total | | Calpipe | | Other | | Total |
| Fair value of consideration transferred: | | | | | | | | | | | | |
| Cash consideration | | $ | 110,155 |
| | $ | 87,649 |
| | $ | 197,804 |
| | $ | 110,155 |
| | $ | 87,649 |
| | $ | 197,804 |
|
| Working capital adjustment | | | 120 |
| | — |
| | 120 |
|
| Purchase price payable | | 2,278 |
| | — |
| | 2,278 |
| | 2,278 |
| | — |
| | 2,278 |
|
| Settlement of pre-existing relationship | | (382 | ) | | — |
| | (382 | ) | | (382 | ) | | — |
| | (382 | ) |
| Total consideration transferred | | $ | 112,051 |
| | $ | 87,649 |
| | $ | 199,700 |
| | 112,171 |
| | 87,649 |
| | 199,820 |
|
| Fair value of assets acquired and liabilities assumed: | | | | | | | | |
| | |
| | |
|
| Cash | | 5,051 |
| | 8,830 |
| | 13,881 |
| | 5,051 |
| | 8,830 |
| | 13,881 |
|
| Accounts receivable | | 10,918 |
| | 7,588 |
| | 18,506 |
| | 10,369 |
| | 7,589 |
| | 17,958 |
|
| Inventories | | 20,319 |
| | 8,297 |
| | 28,616 |
| | 18,360 |
| | 7,221 |
| | 25,581 |
|
| Intangible assets | | 62,720 |
| | 47,450 |
| | 110,170 |
| | 54,860 |
| | 40,100 |
| | 94,960 |
|
| Fixed assets | | 3,665 |
| | 8,286 |
| | 11,951 |
| | 3,245 |
| | 11,242 |
| | 14,487 |
|
| Accounts payable | | (1,601 | ) | | (1,550 | ) | | (3,151 | ) | | (1,601 | ) | | (1,550 | ) | | (3,151 | ) |
| Other | | (8,213 | ) | | (3,537 | ) | | (11,750 | ) | | (8,342 | ) | | (11,558 | ) | | (19,900 | ) |
| Net assets acquired | | 92,859 |
| | 75,364 |
| | 168,223 |
| | 81,942 |
| | 61,874 |
| | 143,816 |
|
| Excess purchase price attributed to goodwill acquired | | $ | 19,192 |
| | $ | 12,285 |
| | $ | 31,477 |
| | $ | 30,229 |
| | $ | 25,775 |
| | $ | 56,004 |
|
TheFrom the date of the Company's preliminary purchase price allocation intangible asset values and related estimates of useful lives for Calpipe and Flexicon are preliminary asthe 2017 acquisitions through September 30, 2018, the Company is finalizing its fairrecorded adjustments based on our valuation procedures for our acquisitions that resulted in an increase to
goodwill of $24.5 million. The current year adjustments were primarily attributable to a decrease of $18.8 million in the value estimates ofallocated to acquired assets, primarily intangible assets, fixed assets and working capital, items.
The Company recognized $19,192partially offset by an increase in the value of goodwillproperty, plant and equipment of $2.5 million. Additionally, an adjustment of $8.2 million was recorded for CalPipe and $12,285 from all other acquisitions. Goodwill consists of the excessdeferred tax liabilities as a result of the purchase price over the net of the fair value of the acquired assets and assumed liabilities, and represents the estimated economic value attributable to future operations.accounting adjustments. Goodwill recognized from the Calpipe acquisition is tax-deductible and is amortized over 15 years for income tax purposes. Goodwill recognized from the other acquisitions was non-deductible for tax purposes. The goodwill consists largely of the synergies and economies of scale from integrating these companies with existing businesses. See Note 13, ''Goodwill and Intangible Assets.''
The following table summarizes the fair value of intangible assets acquired in fiscal 2017 as of the acquisition dates:
| | | | | Calpipe Industries, Inc. | | Other | | Calpipe | | Other |
| ($ in thousands) | | Fair Value | | Weighted Average Useful Life (Years) | | Fair Value | | Weighted Average Useful Life (Years) | | Fair Value | | Weighted Average Useful Life (Years) | | Fair Value | | Weighted Average Useful Life (Years) |
| Customer relationships | | $ | 56,124 |
| | 10 | | $ | 44,436 |
| | 10 | | $ | 50,680 |
| | 10.0 | | $ | 37,341 |
| | 10.0 |
| Other | | 6,596 |
| | 10 | | 3,014 |
| | 6 | | 4,180 |
| | 8.5 | | 2,759 |
| | 8.1 |
| Total intangible assets | | $ | 62,720 |
| | 10 | | $ | 47,450 |
| | 10 | | $ | 54,860 |
| | 9.9 | | $ | 40,100 |
| | 9.9 |
The following table presents unaudited pro forma results of operations for the fiscal years ended September 30, 2017 and September 30, 2016 as if the Calpipe acquisition had occurred as of the first day of the fiscal 2016 period:
|
| | | | | | | | |
| | | Fiscal Year Ended |
| (in thousands) | | September 30, 2017 | | September 30, 2016 |
| Proforma net sales | | $ | 1,575,801 |
| | $ | 1,589,136 |
|
| Proforma net income | | 90,932 |
| | 63,412 |
|
|
| | | | | | | | |
| | | Fiscal Year Ended |
| (in thousands) | | September 30, 2017 | | September 30, 2016 |
| Pro forma net sales | | $ | 1,575,801 |
| | $ | 1,589,136 |
|
| Pro forma net income | | 91,362 |
| | 62,127 |
|
The pro forma condensed financial information is presented for illustrative purposes only and does not indicate the actual financial results of the Company if the closing of the Calpipe acquisition had been completed on September 26, 2015, nor is it indicative of the results of operations in future periods. Included in the unaudited pro forma financial information for the fiscal years ended September 30, 2017 and September 30, 2016 were pro forma adjustments to reflect the results of operations of Calpipe as well as the impact of amortizing certain acquisition accounting adjustments such as amortizable intangible assets.the non recurring inventory step up adjustment of $2.2 million. The pro forma financial information neither indicates the impact of possible business model changes nor considers any potential impact of current market conditions, expense efficiencies or other factors.
Net sales and net income of the other companies acquired during fiscal 2018 and 2017 are included in the consolidated statement of operations for fiscal 2018 and fiscal 2017 for the post-acquisition period.periods. Due to the immaterial nature of these acquisitions, both individually, and in the aggregate, the Company did not include the full year pro-formapro forma results of operations for the acquisition year or previous years.
Fiscal 2015 Transactions —On September 27, 2018, the Company entered into a definitive agreement with Pentahold NV to acquire Vergokan International NV ("Vergokan"), a leading manufacturer of cable tray and cable ladder systems, underfloor installations and industrial floor trunking that serves industrial, power and energy, commercial and infrastructure sectors in more than 45 countries. This transaction provides Atkore with an expanded presence in Western Europe and strengthens the Company electrical portfolio of cable management products within the Electrical Raceway segment. On October 20, 2014, Atkore Plastic Pipe Corporation, a wholly-owned indirect subsidiary of1, 2018, the Company acquired all of the outstanding stock of American Pipe & Plastics, Inc. ("APPI"). The aggregateVergokan for a purchase price was $6,572. APPI is a manufacturer of PVC conduit and is located in Kirkwood, New York. Additionally, on November 17, 2014, Atkore Steel Components, Inc., a wholly-owned indirect subsidiary of the Company, acquired most of the assets and assumed certain liabilities of Steel Components, Inc. ("SCI").$58,728. The aggregateinitial purchase price was $23,868. SCI provides steelallocation and malleable iron electrical fittings for steel, flexible and liquidtight conduit, as well as armored cable. SCI is located in Coconut Creek, Florida.
The purchase price was allocated to tangible and intangible assets acquired and liabilities assumed, based on their estimated fair values. Fair value measurements were applied based on assumptions that market participants would use in the pricing of the asset or liability. The following table summarizes the Level 3 fair values assigned to the net assets acquired and liabilities assumed as of the acquisition date:
|
| | | | | | | |
| (in thousands) | APPI | | SCI |
| Fair value of consideration transferred: | | | |
| Cash consideration | $ | 6,572 |
| | $ | 23,837 |
|
| Fair value of assets acquired and liabilities assumed: | | | |
| Accounts receivable | 1,813 |
| | 4,302 |
|
| Inventories | 1,850 |
| | 5,500 |
|
| Intangible assets | 480 |
| | 10,600 |
|
| Fixed assets | 2,907 |
| | 46 |
|
| Accounts payable | (1,057 | ) | | (690 | ) |
| Other | (808 | ) | | 155 |
|
| Net assets acquired | 5,185 |
| | 19,913 |
|
| Excess purchase price attributed to goodwill acquired | $ | 1,387 |
| | $ | 3,924 |
|
Both acquisitions strengthened and diversified the Company's Electrical Raceway reportable segment and its portfolio of products provided to electrical distribution customers. The Company funded both acquisitions using borrowings from AII's asset-based credit facility ("ABL Credit Facility"). The Company recognized $1,387 and $3,924 of goodwill for APPI and SCI, respectively. See Note 13, ''Goodwill and Intangible Assets.'' Goodwill recognized from the APPI acquisition was non-deductible for income tax purposes. Goodwill recognized from the SCI acquisition was tax-deductible and is amortized over 15 years for income tax purposes. The goodwill arising from both acquisitions consists largely of the synergies and economies of scale from integrating these companies with existing businesses. The Company incurred approximately $318 and $610 during the years ended September 30, 2016 and September 25, 2015, respectively for acquisition-related expenses for both transactions. Due to the immaterial nature of the acquisitions, both individually, and in the aggregate, the Company did not include the full year pro-forma results of operations forhave not been completed, as the acquisition year or previous years.Company is still determining the fair value estimates of intangible assets, fixed assets and working capital items.
3. DIVESTITURES
On March 30, 2018, the Company sold the assets of FlexHead Industries, Inc. and SprinkFLEX, LLC (together "Flexhead"). The following table summarizes the fair valueFlexhead businesses manufacture commercial flexible sprinkler head connection products for use in a variety of intangiblemarkets, including industrial, commercial, cold storage, institutional and clean room applications. The cash consideration received, net assets divested and resulting gain on sale are as of the acquisition dates:follows:
|
| | | | | | | | | | | | |
| | | APPI | | SCI |
| ($ in thousands) | | Fair Value | | Weighted Average Useful Life (Years) | | Fair Value | | Weighted Average Useful Life (Years) |
| Customer relationships | | $ | 300 |
| | 10 | | $ | 7,900 |
| | 8 |
| Other | | 180 |
| | 4 | | 2,700 |
| | 14 |
| Total intangible assets | | $ | 480 |
| | | | $ | 10,600 |
| | |
|
| | | | |
| (in thousands) | | Flexhead |
| Cash consideration | | $ | 42,631 |
|
| Net assets divested | | 15,056 |
|
| Gain on sale of a business | | $ | 27,575 |
|
The SCI purchase agreement contained a provision for contingent consideration requiring the Company to pay the former owners an amount not to exceed $500 upon achieving certain performance targets. The Company recorded $190 in Accrued and other current liabilities as the best estimateNet assets divested included $2,626 of fair value of the contingent consideration on the opening balance sheet. The fair value estimate was considered a Level 3 measurement in accordance with the fair value hierarchy and the range of possible outcomes did not differ materially from the amount recorded. The performance target period of one year expired during fiscal 2016 and the performance conditions were not met. As such, the Company recorded a reversal of the contingent liability as a component of selling, general and administrative expense.goodwill.
3.4. POSTRETIREMENT BENEFITS
The Company has a number of non-contributory and contributory defined benefit retirement plans covering certain United States employees. Net periodic pension benefit cost is based on periodic actuarial valuations that use the projected unit credit method of calculation and is charged to the statements of operations on a systematic basis over the expected average remaining service lives of current participants. The benefits under the defined benefit plans are based on various factors, such as years of service and compensation. As of September 30, 2017,2018, all defined pension benefit plans are frozen, whereby participants no longer accrue credited service. The net periodic benefit (benefit)/cost for the periods presented was as follows:
| | | | Fiscal Year Ended | Fiscal Year Ended |
| (in thousands) | September 30, 2017 | | September 30, 2016 | | September 25, 2015 | September 30, 2018 | | September 30, 2017 | | September 30, 2016 |
| Service cost | $ | 2,049 |
| | $ | 1,894 |
| | $ | 2,509 |
| $ | — |
| | $ | 2,049 |
| | $ | 1,894 |
|
| Interest cost | 3,793 |
| | 4,143 |
| | 4,784 |
| 4,098 |
| | 3,793 |
| | 4,143 |
|
| Expected return on plan assets | (6,601 | ) | | (6,318 | ) | | (6,803 | ) | (6,415 | ) | | (6,601 | ) | | (6,318 | ) |
| Amortization of actuarial loss | 1,303 |
| | 722 |
| | 88 |
| 343 |
| | 1,303 |
| | 722 |
|
| Net periodic benefit cost | $ | 544 |
| | $ | 441 |
| | $ | 578 |
| |
| Net periodic (benefit)/cost | | $ | (1,974 | ) | | $ | 544 |
| | $ | 441 |
|
The weighted-average assumptions used to determine net periodic pension benefit cost during the period were as follow:
| | | | September 30, 2017 | | September 30, 2016 | | September 25, 2015 | September 30, 2018 | | September 30, 2017 | | September 30, 2016 |
| Discount rate | 3.5 | % | | 4.2 | % | | 4.2 | % | 3.7 | % | | 3.5 | % | | 4.2 | % |
| Expected return on plan assets | 7.0 | % | | 7.0 | % | | 7.0 | % | 6.4 | % | | 7.0 | % | | 7.0 | % |
| Rate of compensation increase | N/a |
| | N/a |
| | N/a |
| N/a |
| | N/a |
| | N/a |
|
The change in the benefit obligations, plan assets and the amounts recognized on the consolidated balance sheets was as follows (in thousands):
| | | Change in benefit obligations: | | | | |
| Balance as of September 25, 2015 | | $ | 121,200 |
| |
| Service cost | | 1,894 |
| |
| Interest cost | | 4,143 |
| |
| Actuarial loss | | 10,542 |
| |
| Benefits and administrative expenses paid | | (4,627 | ) | |
| Balance as of September 30, 2016 | | 133,152 |
| | $ | 133,152 |
|
| Service cost | | 2,049 |
| | 2,049 |
|
| Interest cost | | 3,793 |
| | 3,793 |
|
| Actuarial (gain) | | (5,012 | ) | | (5,012 | ) |
| Benefits and administrative expenses paid | | (5,130 | ) | | (5,130 | ) |
| Balance as of September 30, 2017 | | $ | 128,852 |
| | 128,852 |
|
| Service cost | | | — |
|
| Interest cost | | | 4,098 |
|
| Actuarial (gain) | | | (7,130 | ) |
| Benefits and administrative expenses paid | | | (4,863 | ) |
| Balance as of September 30, 2018 | | | $ | 120,957 |
|
| | | |
| | |
|
| Change in plan assets: | | | | |
| Balance as of September 25, 2015 | | $ | 93,074 |
| |
| Actual return on plan assets | | 9,122 |
| |
| Employer contributions | | 411 |
| |
| Benefits and administrative expenses paid | | (4,627 | ) | |
| Balance as of September 30, 2016 | | 97,980 |
| | $ | 97,980 |
|
| Actual return on plan assets | | 10,388 |
| | 10,388 |
|
| Employer contributions | | 375 |
| | 375 |
|
| Benefits and administrative expenses paid | | (5,130 | ) | | (5,130 | ) |
| Balance as of September 30, 2017 | | $ | 103,613 |
| | 103,613 |
|
| Funded status as of September 30, 2017 | | $ | (25,239 | ) | |
| Actual return on plan assets | | | 4,701 |
|
| Employer contributions | | | 1,003 |
|
| Benefits and administrative expenses paid | | | (4,863 | ) |
| Balance as of September 30, 2018 | | | $ | 104,454 |
|
| Funded status as of September 30, 2018 | | | $ | (16,503 | ) |
| | | (in thousands) | | September 30, 2017 | | September 30, 2016 | | September 30, 2018 | | September 30, 2017 |
| Amounts recognized in the consolidated balance sheets consist of: | | | | | | | | |
| Pension assets | | | $ | 572 |
| | $ | — |
|
| Pension liabilities | | $ | (25,239 | ) | | $ | (35,172 | ) | | (17,075 | ) | | (25,239 | ) |
| Net amount recognized | | $ | (25,239 | ) | | $ | (35,172 | ) | | $ | (16,503 | ) | | $ | (25,239 | ) |
| | | | | | | | | |
| Amounts recognized in accumulated other comprehensive loss (before income taxes) consist of: | | | | | | | | |
| Net actuarial loss | | $ | (18,103 | ) | | $ | (28,205 | ) | | $ | (12,344 | ) | | $ | (18,103 | ) |
| Total loss recognized | | $ | (18,103 | ) | | $ | (28,205 | ) | | $ | (12,344 | ) | | $ | (18,103 | ) |
| | | | | | | | | |
| Weighted-average assumptions used to determine pension benefit obligations at year end: | | | | | | | | |
| Discount rate | | 3.7 | % | | 3.5 | % | | 4.2 | % | | 3.7 | % |
| Rate of compensation increase | | N/a |
| | N/a |
| | N/a |
| | N/a |
|
The following table summarizes the defined benefit pension plans with accumulated benefit obligations in excess of plan assets:
| | | (in thousands) | | September 30, 2017 | | September 30, 2016 | | September 30, 2018 | | September 30, 2017 |
| Accumulated benefit obligation | | $ | 128,852 |
| | $ | 133,152 |
| | $ | 105,414 |
| | $ | 128,852 |
|
| Fair value of plan assets | | 103,613 |
| | 97,980 |
| | 88,339 |
| | 103,613 |
|
The following table summarizes the defined benefit pension plans with projected benefit obligations in excess of plan assets:
| | | (in thousands) | | September 30, 2017 | | September 30, 2016 | | September 30, 2018 | | September 30, 2017 |
| Projected benefit obligation | | $ | 128,852 |
| | $ | 133,152 |
| | $ | 105,414 |
| | $ | 128,852 |
|
| Fair value of plan assets | | 103,613 |
| | 97,980 |
| | 88,339 |
| | 103,613 |
|
In determining the expected return on plan assets, the Company considers the relative weighting of plan assets by class, historical performance of asset classes over long-term periods, asset class performance expectations as well as current and future economic conditions. The Company's investment strategy for its pension plans is to manage the plans on a going-concern basis. Current investment policy is to maximize the return on assets, subject to a prudent level of portfolio risk, for the purpose of enhancing the security of benefits for participants. For the pension plans, this policy targets a 60% allocation to equity securities and a 40% allocation to debt securities.
Pension plans have the following weighted-average asset allocations:
| | | Asset Category: | | September 30, 2017 | | September 30, 2016 | | September 30, 2018 | | September 30, 2017 |
| Equity securities | | 61% | | 52% | | 59% | | 61% |
| Debt securities | | 38% | | 33% | | 39% | | 38% |
| Cash and cash equivalents | | 1% | | 15% | | 2% | | 1% |
| Total | | 100% | | 100% | | 100% | | 100% |
The Company evaluates its defined benefit plans' asset portfolios for the existence of significant concentrations of risk, such as investments in a single entity, industry, foreign country and individual fund manager. As of September 30, 2017,2018, there were no significant concentrations of risk in the Company's defined benefit plan assets.
The Company's plan assets are accounted for at fair value and are classified in their entirety based on the lowest level of input that is significant to the fair value measurement. The Company's assessment of the significance of a particular input to the fair value measurement requires judgment, and may affect the valuation of fair value of assets and their placement within the fair value hierarchy levels. The Company's asset allocations are presented in the table below:
| | | (in thousands) | | September 30, 2017 | | September 30, 2016 | | September 30, 2018 | | September 30, 2017 |
| | | Level 1 | | Level 2 | | Total | | Level 1 | | Level 2 | | Total | | Level 1 | | Level 2 | | Total | | Level 1 | | Level 2 | | Total |
| United States equity securities | | $ | — |
| | $ | 36,362 |
| | $ | 36,362 |
| | $ | — |
| | $ | 28,798 |
| | $ | 28,798 |
| | $ | 32,447 |
| | $ | 6,354 |
| | $ | 38,801 |
| | $ | — |
| | $ | 36,362 |
| | $ | 36,362 |
|
| Non-U.S. equity securities | | — |
| | 26,432 |
| | 26,432 |
| | — |
| | 21,754 |
| | 21,754 |
| | 20,164 |
| | 2,599 |
| | 22,763 |
| | — |
| | 26,432 |
| | 26,432 |
|
| Fixed income securities | | — |
| | 39,319 |
| | 39,319 |
| | — |
| | 32,372 |
| | 32,372 |
| | 34,111 |
| | 6,678 |
| | 40,789 |
| | — |
| | 39,319 |
| | 39,319 |
|
| Cash and cash equivalents | | 1,500 |
| | — |
| | 1,500 |
| | 15,056 |
| | — |
| | 15,056 |
| | 2,101 |
| | — |
| | 2,101 |
| | 1,500 |
| | — |
| | 1,500 |
|
| Total | | $ | 1,500 |
| | $ | 102,113 |
| | $ | 103,613 |
| | $ | 15,056 |
| | $ | 82,924 |
| | $ | 97,980 |
| | $ | 88,823 |
| | $ | 15,631 |
| | $ | 104,454 |
| | $ | 1,500 |
| | $ | 102,113 |
| | $ | 103,613 |
|
Equity securities consist primarily of publicly traded United States and non-U.S. equities. Publicly traded securities are valued at the last trade or closing price reported in the active market in which the individual securities are traded. Certain equity securities are held within commingled funds, which are valued at the unitized net asset value ("NAV") or percentage of the NAV as determined by the custodian of the fund. These values are based on the fair value of the underlying net assets owned by the fund.
Fixed income securities consist primarily of government and agency securities, corporate debt securities, and mortgage and other asset-backed securities. When available, fixed income securities are valued at the closing price reported in the active market in which the individual security is traded. Government and agency securities and corporate debt securities are valued using the most recent bid prices or occasionally the mean of the latest bid and ask prices when markets are less liquid. Asset-backed securities including mortgage-backed securities are valued using broker/dealer quotes when available. When quotes are not available, fair value is determined by utilizing a discounted cash flow approach, which incorporates other observable inputs such as cash flows, underlying security structure and market information including interest rates and bid evaluations of comparable securities. As of September 30, 20172018 and September 30, 2016,2017, the Company did not have any Level 3 pension assets. Certain fixed income securities are held within commingled funds, which are valued utilizing NAV as determined by the custodian of the fund. These values are based on the fair value of the underlying net assets owned by the fund.
Cash and cash equivalents consist primarily of short-term commercial paper, and other cash or cash-like instruments including settlement proceeds due from brokers, stated at cost, which approximates fair value.
Transfers between levels of the fair value hierarchy (the "hierarchy") are recognized on the actual date of the event or circumstance giving rise to the transfer, which generally coincides with the Company's valuation process. There were no transfers between levels of hierarchy during the fiscal years ended September 30, 2017 and September 30, 2016.
The strategy of the Company's investment managers with regard to the investments valued using NAV or its equivalent is to either match or exceed relevant benchmarks associated with the respective asset category. The underlying investment funds are available to be redeemed on a daily basis. None of the investments valued using NAV or its equivalent contain any redemption restrictions or unfunded commitments.
Contribution amounts are determined and funded based on laws and regulations and with the assistance of professionally qualified actuaries. The Company contributed $375$1,003 and $411$375 to its pension plans for the fiscal years ended September 30, 20172018 and September 30, 2016.2017. The Company anticipates that it will contribute at least the minimum required contribution of $1,177$1,077 to its pension plans in fiscal 20182019.
Benefit payments, which reflect future expected service as appropriate, are expected to be paid in each fiscal year as follows:
| | | (in thousands) | | | | |
| 2018 | | $ | 5,372 |
| |
| 2019 | | 5,681 |
| | $ | 5,717 |
|
| 2020 | | 6,046 |
| | 6,011 |
|
| 2021 | | 6,352 |
| | 6,340 |
|
| 2022 | | 6,624 |
| | 6,609 |
|
| 2023 and thereafter | | 36,056 |
| |
| 2023 | | | 6,814 |
|
| 2024 and thereafter | | | 36,690 |
|
Defined Contribution Retirement Plans — The Company also sponsors several defined contribution retirement plans - the 401(k) matching programs. Expense for the defined contribution plans is computed as a percentage of participants' compensation and was $3,600, $3,000 $2,817 and $2,741$2,817 for the fiscal years ended September 30, 2017,2018, September 30, 20162017 and September 25, 2015,30, 2016, respectively.
Multi-Employer Plan — The Company has a liability of $5,934 as of September 30, 2018 and $6,250 as of September 30, 2017 and $6,507 as of September 30, 2016 representing the Company's proportionate share of a multi-employer pension plan which was exited prior to fiscal 2017.
4.5. STOCK INCENTIVE PLAN
On June 10, 2016, the Company's Board of Directors adopted the Atkore International Group Inc. 2016 Omnibus Incentive Plan (the "Omnibus Incentive Plan"). The Omnibus Incentive Plan provides for stock purchases and grants of other equity awards, including non-qualified stock options, stock purchase rights, restricted stock, restricted stock units ("RSUs"), performance shares, performance stock units("PSUs"), stock appreciation rights, dividend equivalents and other stock-based awards to directors, offices,officers, other employees and consultants. The Omnibus Incentive Plan replaces and succeeds the Atkore International Group Inc. Stock Incentive Plan (the "Stock Incentive Plan"). The Company no longer grants awards from the Stock Incentive Plan. Awards previously granted under the Stock Incentive Plan were unaffected by the termination. A maximum of 3.8 million shares of common stock is reserved for issuance under the Omnibus Incentive Plan. All awards have a ten year life. All share-based awards are expected to be fulfilled with new shares of common stock. Stock compensation expense is included in selling, general and administrative in the Company's consolidated statements of operations and was $14,664, $12,788 $21,127 and $13,523$21,127 for fiscal years 2018, 2017 2016 and 2015,2016, respectively. The total income tax benefit recognized for share-based compensation arrangements was $3,681, $4,731 $7,704 and $4,797$7,704 for fiscal years 2018, 2017 2016 and 2015,2016, respectively.
On May 4, 2018, the Company's Board of Directors modified the stock awards of a key executive. As part of the modification, the Board extended the date through which the key executive has the right to exercise vested options. In addition, the amendment also accelerated the service vesting period of certain of his unvested stock options, RSUs and PSUs. As a result of these modifications, the Company recorded the entire incremental stock-based compensation expense of approximately $0.5 million during the year ended September 30, 2018.
Stock Options
On September 26, 2014, the Company's Board of Directors modified the Stock Incentive Plan to provide the Company with the discretion to net settle stock option awards in cash upon exercises by holders upon termination of their employment. Starting at that time, options were considered liability awards and thus were measured and recorded at their estimated fair value. The Company utilized equity valuations based on comparable publicly-traded companies, discounted free cash flows, an analysis of the Company's enterprise value and any other factors deemed relevant in estimating the fair value of the common stock. The fair values of outstanding options were remeasured each reporting period using the Black-Scholes model. OptionsOutstanding options granted under the Stock Incentive Plan vested ratably over five years. OptionsOutstanding options granted under the Omnibus Incentive Plan vest ratably over three years.
On July 27, 2016, the Company's Board of Directors modified the Stock Incentive Plan and terminated the net settlement feature, thereby requiring the stock option holders to exercise in an open market transaction through broker-assisted sales. The modification, which affected 63 employees, triggered a change from liability accounting to equity accounting. Consequently, the Company reclassified $43,870 from non-current liabilities to additional-paid-in-capital. The Company marked the options to their fair value as of July 27, 2016 using the Black-Scholes option pricing model resulting in $2.4 million of additional expense for vested options.
In accordance with ASC Topic 718 "Compensation"Compensation - Stock Compensation", stock compensation expense is recorded on a straight-line basis over the requisite service period (generally the vesting period), net of actual forfeitures based on the grant-date fair value of the option under the equity accounting method.
The assumptions used in the Black-Scholes option pricing model to value the options granted and modified were as follows:
| | | | | Fiscal Year Ended | | Fiscal Year Ended |
| | | September 30, 2017 | | September 30, 2016 | | September 25, 2015 | | September 30, 2018 | | September 30, 2017 | | September 30, 2016 |
| Expected dividend yield | | — | % | | — | % | | — | % | | — | % | | — | % | | — | % |
| Expected volatility | | 40 | % | | 40 | % | | 35 | % | | 40 | % | | 40 | % | | 40 | % |
| Range of risk-free interest rates (%) | | 1.95 |
| | 0.74 - 1.27 |
| | 0.85 - 1.74 |
| | 2.16-2.38 |
| | 1.95 |
| | 0.74 - 1.27 |
|
| Range of expected option lives | | 6.00 years |
| | 2.09 - 6.37 years |
| | 2.51 - 6.35 years |
| | 1.00 to 6.00 years |
| | 6.00 years |
| | 2.09 - 6.37 years |
|
Dividends are not paid on the Company's common stock. Expected volatility is based on historical volatilities of comparable companies. The risk-free interest rate is based on the United States Treasury yield curve in effect at the time of the grant for periods corresponding with the expected life of the options. The expected life of options is
estimated using the simplified method due to limited historical exercise activity. The Company does not estimate forfeitures, which are accounted for as they occur.
Stock option activity for the period September 26, 201425, 2015 to September 30, 20172018 was as follows:
| |
| Shares
(in thousands) | | Weighted-Average Exercise Price | | Weighted-Average Grant Date Fair Value | | Aggregate Intrinsic Value (in thousands) | | Weighted-Average Remaining Contractual Term (in years) | Shares
(in thousands) | | Weighted-Average Exercise Price | | Weighted-Average Grant Date Fair Value | | Aggregate Intrinsic Value (in thousands) | | Weighted-Average Remaining Contractual Term (in years) |
| Outstanding as of September 26, 2014 | 7,673 |
| | $ | 7.59 |
| | | | | | |
| Granted | 290 |
| | 9.04 |
| | $ | 9.09 |
| | | | |
| Exercised | (500 | ) | | 7.30 |
| | | | $ | 914 |
| | |
| Forfeited | (717 | ) | | 7.30 |
| | | | | | |
| Outstanding as of September 25, 2015 | 6,746 |
| | 7.70 |
| | | | | | 6,746 |
| | $ | 7.70 |
| | | | | |
| Granted | 72 |
| | 15.79 |
| | $ | 7.63 |
| | | | 72 |
| | 15.79 |
| | $ | 7.63 |
| | | |
| Exercised | (18 | ) | | 7.95 |
| | | | $ | 43 |
| | (18 | ) | | 7.95 |
| | | | $ | 43 |
| |
| Forfeited | (136 | ) | | 8.84 |
| | | | | | (136 | ) | | 8.84 |
| | | | | |
| Outstanding as of September 30, 2016 | 6,664 |
| | 7.76 |
| | | | | | 6,664 |
| | 7.76 |
| | | | | |
| Granted | 171 |
| | 21.45 |
| | $ | 8.84 |
| | | | 171 |
| | 21.45 |
| | $ | 8.84 |
| | | |
| Exercised | (1,629 | ) | | 7.47 |
| | | | $ | 25,757 |
| | (1,629 | ) | | 7.47 |
| | | | $ | 25,757 |
| |
| Forfeited | (48 | ) | | 9.02 |
| | | | | | (48 | ) | | 9.02 |
| | | | | |
| Outstanding as of September 30, 2017 | 5,158 |
| | 8.30 |
| | | | $ | 58,175 |
| | 5.6 | 5,158 |
| | 8.30 |
| | | | | |
| Exercisable as of September 30, 2017 | 3,600 |
| | $ | 7.67 |
| | | | $ | 42,605 |
| | 5.2 | |
| Granted | | 185 |
| | 20.01 |
| | $ | 8.33 |
| | | |
| Exercised | | (2,728 | ) | | 7.55 |
| | | | $ | 42,512 |
| |
| Forfeited | | (10 | ) | | 8.28 |
| | | | | |
| Outstanding as of September 30, 2018 | | 2,605 |
| | 9.91 |
| | | | $ | 43,302 |
| | 5.61 |
| Exercisable as of September 30, 2018 | | 1,915 |
| | $ | 8.41 |
| | | | $ | 34,697 |
| | 5.04 |
As of September 30, 2017,2018, there was $8,399$2,911 of total unrecognized compensation expense related to non-vested options granted expected to be recognized over a weighted-average period of approximately 1.61.36 years. The total fair value of shares vested during fiscal years 2018, 2017 and 2016 was $9,757, $10,696 and 2015 was $10,696, $12,507, and $2,787, respectively.
Cash received from stock option exercises for the fiscal years 2018, 2017 and 2016 was $20,110, $12,168 and 2015 was $12,168, $52, and $49, respectively. The actual tax benefit for the tax deductions from stock option exercises totaled $11,478, $9,530 $19 and $18,$19, respectively, for fiscal years 2018, 2017 2016 and 2015.2016. The amount of cash the Company paid to settle the options exercised during the fiscal yearyears ended 2018, 2017 2016 and 20152016 was $0, $43$0 and $914,$43, respectively.
Restricted Stock Units
Generally, RSUs granted under the Omnibus Incentive Plan vest ratably over three years. The fair value of RSU grants was based on the closing price of the Company's common stock on the date of grant. RSU compensation expense is recorded on a straight-line basis over the remaining vesting period.
Changes to the Company's nonvested RSU awards for the year ended September 30, 20172018 were as follows:
| | | | | Shares
(in thousands) | | Weighted-average grant-date fair value | | Shares
(in thousands) | | Weighted-average grant-date fair value |
| Nonvested as of September 30, 2016 | | — |
| | $ | — |
| | — |
| | $ | — |
|
| Granted | | 443 |
| | 19.68 |
| | 443 |
| | $ | 19.68 |
|
| Forfeited | | (8 | ) | | 21.45 |
| | (8 | ) | | $ | 21.45 |
|
| Nonvested as of September 30, 2017 | | 435 |
| | $ | 19.65 |
| | 435 |
| | $ | 19.65 |
|
| Granted | | | 334 |
| | 20.86 |
|
| Vested | | | (90 | ) | | 21.95 |
|
| Forfeited | | | (29 | ) | | 20.57 |
|
| Nonvested as of September 30, 2018 | | | 650 |
| | $ | 19.91 |
|
As of September 30, 2017,2018, there was $7,015$7,550 of total unrecognized compensation expense related to non-vested RSUs granted, expected to be recognized over a weighted-average period of approximately 2.51.9 years. The total fair value of RSUs vested during fiscal years 2018, 2017 and 2016 was $1,969, $0 and 2015 was $0, $300, and $100, respectively.
Performance Share Units
On November 30, 2016 and November 28, 2017, the Company awarded PSUs whose vesting is contingent upon meeting or exceeding certain market and performance conditions. The performance condition, which was based on an adjusted net income, represented 70% of the award and the market condition, which was based on Total Shareholder Return ("TSR") of the Company's common stock relative to thea peer group represented the remaining 30%. All PSUs cliff vest at the end of three years based on the satisfaction of the performance conditions. Expense for the performance condition based award is recorded when the achievement of the performance condition is considered probable of achievement and is recorded on a straight-line basis over the requisite service period. If such performance criteria are not met, no compensation cost is recognized and any recognized compensation cost is reversed. Expense for the market condition based award is recorded on a straight-line basis over the explicit service period.
The grant-date fair value for the performance condition based awards represents the closing stock price on the date of grant. For the grants in fiscal 2018 and 2017, the closing stock price on the date of grant of $21.45.was $20.01 and $21.45, respectively. The grant-date fair value for the market condition based awards was determined using the Monte-Carlo method. The assumptions used in the Monte-Carlo method to value the performance share awards granted and modified during the fiscal year ended September 30, 20172018 were as follows:
| | | | | September 30, 2017 | | September 30, 2018 | | September 30, 2017 |
| Expected dividend yield | | — | % | | — | % | | — | % |
| Range of expected volatility | | 17.55 - 75.55 |
| | 17.21 - 79.15 |
| | 17.55 - 75.55 |
|
| Risk free interest rates | | 1.35 | % | | 1.83 - 2.54 |
| | 1.35 | % |
| Expected life | | 3 years |
| | 1 - 3 years |
| | 3 years |
|
| Fair value | | $ | 29.53 |
| | $13.90 - 26.68 |
| | $ | 29.53 |
|
Dividends are not paid on the Company's common stock. Expected volatility is based on historical volatilities of comparable companies. The risk-free interest rate is based on the United States Treasury yield curve in effect at the time of the grant for periods corresponding with the expected life of the award. The expected life of the award represents the weighted-average period of time that awards granted are expected to be outstanding, giving consideration to vesting schedules and expected exercise patterns. The Company does not estimate forfeitures, which are accounted for as they occur.
Changes to the Company's nonvestednon-vested PSU awards for the year ended September 30, 20172018 were as follows:
| | | | | Shares
(in thousands) | | Weighted-average grant-date fair value | | Shares
(in thousands) | | Weighted-average grant-date fair value |
| Nonvested as of September 30, 2016 | | — |
| | $ | — |
| | — |
| | $ | — |
|
| Granted | | 184 |
| | 23.87 |
| | 184 |
| | $ | 23.87 |
|
| Forfeited | | (3 | ) | | 23.87 |
| | (3 | ) | | $ | 23.87 |
|
| Nonvested as of September 30, 2017 | | 181 |
| | $ | 23.87 |
| | 181 |
| | $ | 23.87 |
|
| Granted | | | 215 |
| | 22.01 |
|
| Forfeited | | | (89 | ) | | 28.53 |
|
| Nonvested as of September 30, 2018 | | | 307 |
| | $ | 21.22 |
|
As of September 30, 2017,2018, there was $3,182$4,472 of total unrecognized compensation expense related to non-vested PSUs granted, expected to be recognized over a weighted-average period of approximately 21.87 years. There were no PSUs vested during fiscal years 2018, 2017 2016 and 2015.2016.
5.6. RESTRUCTURING CHARGES AND ASSET IMPAIRMENTS
Restructuring charges relate to the streamlining of the Company's cost structure and improving its operations. These actions primarily resulted in workforce reductions, lease termination costs, and other facility rationalization costs.
Restructuring reserves are included as a component of other current liabilities. Prior periods have been revised for the change in our reportable segment presentation effective the fourth quarter of fiscal 2017. See Note 1, ''Basis of Presentation and Summary of Significant Accounting Policies.''
| | | | Electrical Raceway | | Mechanical Products & Solutions | | Other/Corporate | | | Electrical Raceway | | Mechanical Products & Solutions | | Other/Corporate | | |
| (in thousands) | Severance (a) | | Other | | Severance (b) | | Other (b) | | Severance | | Other | | Total | Severance (a) | | Other (a) | | Severance (b) | | Other (b) | | Severance | | Other | | Total |
| Balance as of September 26, 2014 | $ | 593 |
| | $ | — |
| | $ | 406 |
| | $ | — |
| | $ | 593 |
| | $ | — |
| | $ | 1,592 |
| |
| Charges | — |
| | 266 |
| | 3,680 |
| | 780 |
| | 1 |
| | 62 |
| | 4,789 |
| |
| Utilization | (353 | ) | | (267 | ) | | (554 | ) | | (35 | ) | | (577 | ) | | — |
| | (1,786 | ) | |
| Reversals/exchange rate effects | (34 | ) | | 1 |
| | (21 | ) | | (125 | ) | | (2 | ) | | (1 | ) | | (182 | ) | |
| Balance as of September 25, 2015 | $ | 206 |
| | $ | — |
| | $ | 3,511 |
| | $ | 620 |
| | $ | 15 |
| | $ | 61 |
| | $ | 4,413 |
| $ | 206 |
| | $ | — |
| | $ | 3,511 |
| | $ | 620 |
| | $ | 15 |
| | $ | 61 |
| | $ | 4,413 |
|
| Charges | 807 |
| | — |
| | 689 |
| | 2,583 |
| | — |
| | 199 |
| | 4,278 |
| 807 |
| | — |
| | 689 |
| | 2,583 |
| | — |
| | 199 |
| | 4,278 |
|
| Utilization | (168 | ) | | — |
| | (4,017 | ) | | (2,542 | ) | | (11 | ) | | (260 | ) | | (6,998 | ) | (168 | ) | | — |
| | (4,017 | ) | | (2,542 | ) | | (11 | ) | | (260 | ) | | (6,998 | ) |
| Reversals | — |
| | — |
| | (183 | ) | | (122 | ) | | (4 | ) | | — |
| | (309 | ) | — |
| | — |
| | (183 | ) | | (122 | ) | | (4 | ) | | — |
| | (309 | ) |
| Exchange rate effects | (4 | ) | | — |
| | — |
| | — |
| | — |
| | — |
| | (4 | ) | $ | (4 | ) | | $ | — |
| | $ | — |
| | $ | — |
| | $ | — |
| | $ | — |
| | $ | (4 | ) |
| Balance as of September 30, 2016 | $ | 841 |
| | $ | — |
| | $ | — |
| | $ | 539 |
| | $ | — |
| | $ | — |
| | $ | 1,380 |
| $ | 841 |
| | $ | — |
| | $ | — |
| | $ | 539 |
| | $ | — |
| | $ | — |
| | $ | 1,380 |
|
| Charges | 527 | | 439 |
| | 422 | | 63 | | 71 |
| | — |
| | 1,522 | 527 |
| | 439 |
| | 422 |
| | 63 |
| | 71 |
| | — |
| | 1,522 |
|
| Utilization | (917 | ) | | (209 | ) | | (166 | ) | | (556 | ) | | (71 | ) | | — |
| | (1,919 | ) | (917 | ) | | (209 | ) | | (166 | ) | | (556 | ) | | (71 | ) | | — |
| | (1,919 | ) |
| Reversals | — |
| | (230 | ) | | — |
| | (36 | ) | | — |
| | — |
| | (266 | ) | — |
| | (230 | ) | | — |
| | (36 | ) | | — |
| | — |
| | (266 | ) |
| Exchange rate effects | (2 | ) | | — |
| | 22 |
| | — |
| | — |
| | — |
| | 20 |
| (2 | ) | | — |
| | 22 |
| | — |
| | — |
| | — |
| | 20 |
|
| Balance as of September 30, 2017 | $ | 449 |
| | $ | — |
| | $ | 278 |
| | $ | 10 |
| | $ | — |
| | $ | — |
| | $ | 737 |
| $ | 449 |
| | $ | — |
| | $ | 278 |
| | $ | 10 |
| | $ | — |
| | $ | — |
| | $ | 737 |
|
| Charges | | 536 | | 1,130 |
| | 97 | | 179 | | 98 |
| | — |
| | 2,040 |
| Utilization | | (787 | ) | | (820 | ) | | (178 | ) | | (160 | ) | | (98 | ) | | — |
| | (2,043 | ) |
| Reversals | | — |
| | — |
| | (191 | ) | | — |
| | — |
| | — |
| | (191 | ) |
| Exchange rate effects | | 14 |
| | — |
| | (6 | ) | | — |
| | — |
| | — |
| | 8 |
|
| Balance as of September 30, 2018 | | $ | 212 |
| | $ | 310 |
| | $ | — |
| | $ | 29 |
| | $ | — |
| | $ | — |
| | $ | 551 |
|
(a) Primarily related to Atkore's commitment to close the Company's Acroba S.A.S. ("Acroba") subsidiary's facility in Reux, Francecertain facilities as part of its continuing effort to realign its strategic focus during fiscal 2013.focus. The Company recorded severance restructuring charges of $240, $297 and $778 related to termination benefits during the fiscal years ended 2018, 2017 and 2016, respectively.
The Company recorded other restructuring charges to close facilities of $976 and $297 for the fiscal years ending September 30, 2018 and September 30, 2017, respectively.
(b) Primarily related to the August 6, 2015 announcement of the Company's plans to exit its Fence and Sprinkler steel pipe and tube product lines ("Fence and Sprinkler") in order to realign its long-term strategic focus. The operations associated with these product lines were wound down during the first quarter of fiscal 2016 and resulted in headcount reductions in the Company's Philadelphia, Phoenix and Harvey facilities. The Company recorded $630 and $3,681 of severance-related expenses for the fiscal year ended September 30, 2016 and September 25, 2015 related to the headcount reductions. The Company also recorded $64 and $2,066 of facility-related and other charges related to the closure of the facilities during fiscal 2017 and 2016 respectively.
The Company expects to utilize all restructuring accruals as of September 30, 20172018 within the next twelve months. The net restructuring charges included as a component of selling, general and administrative expense and asset impairment charges in the Company's consolidated statements of operations were as follows:
| | | | | Fiscal Year Ended | | Fiscal Year Ended |
| (in thousands) | | September 30, 2017 | | September 30, 2016 | | September 25, 2015 | | September 30, 2018 | | September 30, 2017 | | September 30, 2016 |
| Total restructuring charges, net | | 1,256 |
| | 3,967 |
| | 4,766 |
| | 1,849 |
| | 1,256 |
| | 3,967 |
|
| Asset impairment charges | | — |
| | 129 |
| | 27,937 |
| | — |
| | — |
| | 129 |
|
Fence and Sprinkler Asset Impairment Charges
During fiscal 2016, the Company recorded impairment charges of $129 for the write-down of prepaid shop supplies related to Fence and Sprinkler.
During fiscal 2015, the Company recorded $19,495 of asset impairment charges related to property, plant and equipment and $4,518 for the write-down of prepaid shop supplies as a component of asset impairment charges and $664 of inventory write-down recorded as a component of cost of sales related to Fence and Sprinkler. The charges represent adjustments of the carrying values to current fair values.
6.7. OTHER INCOME, NET
Other income, net consisted of the following:
| | | | | Fiscal Year Ended | | Fiscal Year Ended | | Fiscal Year Ended | | Fiscal Year Ended |
| (in thousands) | | Note | | September 30, 2017 | | September 30, 2018 | | September 30, 2017 As Adjusted** | | September 30, 2016 As Adjusted** |
| Gain on sale of a business | | | $ | (27,575 | ) | | $ | — |
| | $ | — |
|
| Gain on sale of joint venture | | 11 | | $ | (5,774 | ) | | — |
| | (5,774 | ) | | — |
|
| Undesignated foreign currency derivate instruments | | 15 | | 2,741 |
| |
| Foreign exchange gain on intercompany loans | | (2,038 | ) | |
| Undesignated foreign currency derivative instruments | | | (121 | ) | | 2,741 |
| | — |
|
| Foreign exchange gain (loss) on intercompany loans | | | 1,500 |
| | (2,038 | ) | | — |
|
| Debt modification costs | | | 892 |
| | — |
| | — |
|
| Pension-related benefits | | | (1,975 | ) | | (1,504 | ) | | (1,452 | ) |
| Other | | | (69 | ) | | — |
| | — |
|
| Other income, net | | $ | (5,071 | ) | | $ | (27,348 | ) | | $ | (6,575 | ) | | $ | (1,452 | ) |
| | | |
**As adjusted due to the adoption of ASU 2017-07. See Note 1, ''Basis of Presentation and Summary of Significant Accounting Policies'' for additional information. | | **As adjusted due to the adoption of ASU 2017-07. See Note 1, ''Basis of Presentation and Summary of Significant Accounting Policies'' for additional information. |
7.8. INCOME TAXES
On December 22, 2017, "H.R.1," also known as the Tax Cuts and Jobs Act ("TCJA") was signed into law. This newly enacted legislation provides for significant changes to corporate taxation including, but not limited to, a reduction of the federal corporate tax rate from 35% to 21%, limitations on the deductibility of interest expense and executive compensation, full expensing of the costs of qualified property in the period of acquisition and the elimination of the domestic production activities deduction. The legislation also adopts a new quasi-territorial tax regime and imposes a one-time transition tax on deemed repatriated earnings of certain foreign subsidiaries.
The Company has estimated the impact of the new legislation on its financial position based on information currently available and will continue to assess the impact as additional guidance is received. As a fiscal year filer, the Company has a blended federal statutory rate of 24.5% for fiscal year 2018, in accordance with rules described in Section 15 of the Internal Revenue Code, and a federal statutory rate of 21.0% for fiscal year 2019 and following years. The value of the Company’s net deferred tax liability on the balance sheet decreased as a result of the newly enacted tax rates creating a one-time tax benefit to the Company; the preliminary analysis of the impact, using December 29, 2017 values, was an estimated decrease to the net deferred tax liability of $4,758, which was recognized in the period of enactment. At September 30, 2018, the Company has recorded an adjustment to the re-measurement of deferred tax liabilities of an additional $708 benefit as a result of updated estimates. The Company has an accumulated earnings and profits deficit in the foreign jurisdictions in which it operates. As a result, it does not anticipate an income tax liability from the one-time transition tax on the deemed repatriation of its foreign earnings.
The tax impact of the new legislation was based on the Company's best estimate. The provisional amounts incorporate assumptions made based upon the Company's current interpretation of the TCJA and may change as the Company receives additional clarification and implementation guidance. Further adjustments to the provisional amount will be included in income from continuing operations as an adjustment to income tax expense on the Company's consolidated statements of operations through the end of the measurement period in the first quarter of fiscal 2019.
Significant components of income (loss) before income taxes and income tax expense (benefit) for the fiscal years ended September 30, 2017,2018, September 30, 20162017 and September 25, 201530, 2016 consisted of the following:
| | | (in thousands) | | September 30, 2017 | | September 30, 2016 | | September 25, 2015 | | September 30, 2018 | | September 30, 2017 | | September 30, 2016 |
| Components of income (loss) before income taxes: | | | | | | | |
| Components of income before income taxes: | | | | | | | |
| United States | | $ | 116,580 |
| | $ | 78,016 |
| | $ | (11,739 | ) | | $ | 155,453 |
| | $ | 116,580 |
| | $ | 78,016 |
|
| Non-U.S | | 9,545 |
| | 8,765 |
| | 3,868 |
| | 10,899 |
| | 9,545 |
| | 8,765 |
|
| Income (loss) before income taxes | | $ | 126,125 |
| | $ | 86,781 |
| | $ | (7,871 | ) | |
| Income before income taxes | | | $ | 166,352 |
| | $ | 126,125 |
| | $ | 86,781 |
|
| | | | | | | | | | | | | |
| Income tax expense (benefit): | | | | | | | |
| Income tax expense: | | | | | | | |
| Current: | | | | | | | | | | | | |
| United States: | | | | | | | | | | | | |
| Federal | | $ | 33,127 |
| | $ | 18,748 |
| | $ | (2,017 | ) | | $ | 26,586 |
| | $ | 33,127 |
| | $ | 18,748 |
|
| State | | 4,246 |
| | 4,655 |
| | 1,562 |
| | 8,662 |
| | 4,246 |
| | 4,655 |
|
| Non-U.S: | | 3,175 |
| | 2,026 |
| | 1,189 |
| | 3,467 |
| | 3,175 |
| | 2,026 |
|
| Current income tax expense | | $ | 40,548 |
| | $ | 25,429 |
| | $ | 734 |
| | $ | 38,715 |
| | $ | 40,548 |
| | $ | 25,429 |
|
| | | | | | | | | | | | | |
| Deferred: | | | | | | | | | | | | |
| United States: | | | | | | | | | | | | |
| Federal | | $ | 224 |
| | $ | 642 |
| | $ | (3,721 | ) | | $ | (7,149 | ) | | $ | 224 |
| | $ | 642 |
|
| State | | 469 |
| | 1,872 |
| | (929 | ) | | (1,793 | ) | | 469 |
| | 1,872 |
|
| Non-U.S: | | 245 |
| | 42 |
| | 1,000 |
| | (66 | ) | | 245 |
| | 42 |
|
| Deferred income tax expense (benefit) | | 938 |
| | 2,556 |
| | (3,650 | ) | |
| Income tax expense (benefit) | | $ | 41,486 |
| | $ | 27,985 |
| | $ | (2,916 | ) | |
| Deferred income tax (benefit) expense | | | (9,008 | ) | | 938 |
| | 2,556 |
|
| Income tax expense | | | $ | 29,707 |
| | $ | 41,486 |
| | $ | 27,985 |
|
TheIn addition to the change in the U.S. federal statutory rate, the mix of foreign losses and domestic losses, along with rate reconciling items as outlined below, impacts the effective tax rate for the periods. Differences between the statutory federal income tax rate and effective income tax rate are summarized below:
| | | (in thousands) | | September 30, 2017 | | September 30, 2016 | | September 25, 2015 | | September 30, 2018 | | September 30, 2017 | | September 30, 2016 |
| Statutory federal tax | | 35 | % | | 35 | % | | 35 | % | | 25 | % | | 35 | % | | 35 | % |
| Adjustments to reconcile to the effective income tax rate: | | | | | | | | | | | | |
| State income taxes | | 3 | % | | 5 | % | | 1 | % | | 3 | % | | 3 | % | | 5 | % |
| Nondeductible expenses | | — | % | | 2 | % | | (7 | )% | | — | % | | — | % | | 2 | % |
| Valuation allowance | | — | % | | 1 | % | | (15 | )% | |
| Foreign rate differential | | (1 | )% | | (2 | )% | | 3 | % | |
| Domestic Manufacturing Deduction | | (2 | )% | | (3 | )% | | — | % | |
| Prior period adjustments | | — | % | | — | % | | (2 | )% | |
| Change in tax rates | | | (3 | )% | | — | % | | — | % |
| Domestic manufacturing deduction | | | (2 | )% | | (2 | )% | | (3 | )% |
| Indemnified uncertain tax benefits | | — | % | | (5 | )% | | 22 | % | | (2 | )% | | — | % | | (5 | )% |
| Stock-based compensation | | (3 | )% | | — | % | | — | % | | (3 | )% | | (3 | )% | | — | % |
| Other | | 1 | % | | (1 | )% | | — | % | | — | % | | — | % | | (2 | )% |
| Effective income tax rate | | 33 | % | | 32 | % | | 37 | % | | 18 | % | | 33 | % | | 32 | % |
The Company's effective tax rate for fiscal 2018 differs from the statutory rate due to a $5,466 benefit from the remeasurement of the deferred tax liabilities as a result of the TCJA, a $4,091 excess tax benefit associated with the exercise of stock options, a net tax benefit of $3,977 from the release of indemnified tax positions and a benefit of $3,309 for the domestic manufacturing deduction, partially offset by $5,675 of state income tax.
The Company's effective tax rate for fiscal 2017 differs from the statutory rate primarily due to a $3,589 excess tax benefit associated with the exercise of stock options, a $2,761 tax benefit for domestic manufacturing deduction, partially offset by $3,459 of state income tax expense.
The Company's effective tax rate for fiscal 2016 differs from the statutory rate primarily due to a $4,332 tax benefit from the release of indemnified uncertain tax positions, a $2,805 tax benefit for domestic manufacturing deduction, partially offset by $4,625 of state income tax expense and $1,685 of non-deductible transaction costs.
The Company's effective tax rate for fiscal 2015 differs from the statutory rate due to a $1,779 tax benefit from the release of indemnified uncertain tax positions offset by nondeductible expenses and additional valuation allowance against deferred tax assets and foreign jurisdictions in which the deferred tax assets are not expected to be realized.
Deferred income taxes result from temporary differences between the amount of assets and liabilities recognized for financial reporting and tax purposes. The components of the net deferred income tax assets are as follows:
| | | (in thousands) | | September 30, 2017 | | September 30, 2016 | | September 30, 2018 | | September 30, 2017 |
| Deferred tax assets: | | | | | | | | |
| Accrued liabilities and reserves | | $ | 48,619 |
| | $ | 50,221 |
| | $ | 32,099 |
| | $ | 48,619 |
|
| Tax loss and credit carryforwards | | 15,340 |
| | 14,138 |
| | 12,435 |
| | 15,340 |
|
| Postretirement benefits | | 9,863 |
| | 14,232 |
| | 4,317 |
| | 9,863 |
|
| Inventory | | 6,482 |
| | 6,526 |
| | 11,220 |
| | 6,482 |
|
| Other | | 877 |
| | 1,320 |
| | 218 |
| | 877 |
|
| | | $ | 81,181 |
| | $ | 86,437 |
| | $ | 60,289 |
| | $ | 81,181 |
|
| Deferred tax liabilities: | | | | | | | | |
| Property, plant and equipment | | $ | (13,770 | ) | | $ | (12,785 | ) | | $ | (13,739 | ) | | $ | (13,770 | ) |
| Intangible assets | | (65,072 | ) | | (70,037 | ) | | (48,375 | ) | | (65,072 | ) |
| Loss on investment | | (6,085 | ) | | (5,151 | ) | | (5,321 | ) | | (6,085 | ) |
| Other | | (2,549 | ) | | (1,695 | ) | | (1,775 | ) | | (2,549 | ) |
| | | $ | (87,476 | ) | | $ | (89,668 | ) | | $ | (69,210 | ) | | $ | (87,476 | ) |
| Net deferred tax liability before valuation allowance | | (6,295 | ) | | (3,231 | ) | | (8,921 | ) | | (6,295 | ) |
| Valuation allowance | | (9,512 | ) | | (8,658 | ) | | (7,427 | ) | | (9,512 | ) |
| Net deferred tax liability | | $ | (15,807 | ) | | $ | (11,889 | ) | | $ | (16,348 | ) | | $ | (15,807 | ) |
As of September 30, 2017,2018, the Company has $66,114$43,312 of state net operating loss carryforwards which expire beginning in 2018 through 2036.2035. In certain non-U.S. jurisdictions, the Company has net operating loss carryforwards of $42,494$38,434 which have an expiration period ranging from five years to unlimited.
Valuation allowances have been established on net operating losses and other deferred tax assets in Australia, France, Asia Pacific, and other foreign and United States state jurisdictions, as a result of the Company's determination that there is less than 50% likelihood that these assets will be realized. Evidence for this determination includes three year cumulative loss positions, future reversal of temporary differences, and expectations of future losses. For fiscal 2016,2018, the Company reassessed the need for a valuation allowance against deferred tax assets in the Company's Asia Pacific business based on recent earningslosses and utilizationthe expected future performance of net operating losses.the business. As a result, the Company released its historichas reestablished a $600 valuation allowance related toagainst the $1,360deferred tax assets of deferred taxes of itsthe Asia Pacific business.
As of September 30, 2017,2018, the Company had unrecognized tax benefits of $3,578$1,364 which, if recognized, would positively benefit the effective tax rate. The Company recognizes interest and penalties related to unrecognized tax benefits in income tax expense. As of September 30, 20172018 and September 30, 2016,2017, the Company had accrued interest and penalties of $3,193$78 and $3,035,$3,193, respectively, in the consolidated balance sheets.
A reconciliation of the beginning and ending amount of unrecognized tax benefit, excluding interest and penalties, is as follows:
| | | (in thousands) | | For the period from September 26, 2014 to September 30, 2017 | | For the period from September 30, 2016 to September 30, 2018 |
| Balance as of September 26, 2014 | | $ | 10,242 |
| |
| Additions based on tax positions related to prior years | | 69 |
| |
| Settlements | | (2,210 | ) | |
| Balance as of September 25, 2015 | | 8,101 |
| | $ | 8,101 |
|
| Additions based on tax positions related to prior years | | 62 |
| | 62 |
|
| Settlements | | (4,360 | ) | | (4,360 | ) |
| Balance as of September 30, 2016 | | 3,803 |
| | 3,803 |
|
| Additions based on tax positions related to prior years | | 63 |
| | 63 |
|
| Settlements | | (288 | ) | | (288 | ) |
| Balance as of September 30, 2017 | | $ | 3,578 |
| | 3,578 |
|
| Additions based on tax positions related to prior years | | | 893 |
|
| Settlements | | | (3,107 | ) |
| Balance as of September 30, 2018 | | | $ | 1,364 |
|
During fiscal 2018, the balance of unrecognized tax benefits decreased by $3,107 as a result of Tyco completing tax audits and the expiration of the statute of limitations in various state jurisdictions, partially offset by an increase of $893, primarily related to various state jurisdiction's uncertain tax positions. The related accrued penalties and interest for uncertain tax positions decreased by $3,139.
During fiscal 2017, the balance of unrecognized tax benefits decreased by $288 as a result of Tyco completing tax audits and the expiration of the statute of limitations in various state jurisdictions. The related accrued penalties and interest for uncertain tax positions increaseddecreased by $158.
During fiscal 2016, the balance of unrecognized tax benefits decreased by $4,360 as a result of Tyco completing tax audits and the expiration of the statute of limitations in various state jurisdictions. The related accrued penalties and interest for uncertain tax positions decreased by $2,458.
During fiscal 2015, the balance of unrecognized tax benefits decreased by $2,210 as a result of Tyco completing tax audits and the expiration of the statute of limitations in various state jurisdictions. The related accrued penalties and interest for uncertain tax positions decreased by $596.
Many of the Company's uncertain tax positions relate to tax years that remain subject to audit by the taxing authorities. The following tax years remain subject to examination by the major tax jurisdictions as follows:
|
| | |
| Jurisdiction | | Years Open to Audit |
France | | 2010-2012 |
| United States | | 2011-2014,2014, 2016, and 2017 |
The Company's income tax returns are examined periodically by various taxing authorities. The Company's federal tax return for fiscal 2015 has beenwas examined and completed by the Internal Revenue Servicein fiscal year 2017, with no change andas a result of the examination. The Company is currently under examination in various state jurisdictions. Based on the current status of its income tax audits, the Company believes that it is reasonably possible that there would be no material changes to the unrecognized tax benefits in the next twelve months. Should any unrecognized tax benefits be resolved, the Company will seek reimbursement from Tyco under the terms of the Investment Agreement relative to the periods prior to the Transactions.
Other Income Tax Matters—Prior to the passage of the TCJA, foreign undistributed earnings were generally subject to U.S. taxation when repatriated. The TCJA imposed a one-time transition tax on previously untaxed accumulated earnings of foreign subsidiaries. The Company has accumulated earnings and profits deficit, therefore, does not anticipate an additional tax liability as a result of the transition tax. The TCJA adopts a new quasi-territorial tax regime that eliminates U.S income taxes on dividends from foreign subsidiaries. The Company may still be liable for foreign taxes, such as withholding taxes, if earnings are repatriated.
During the fiscal years ended September 30, 20172018 and September 30, 2016,2017, the Company made no additional provision for United States or non-U.S. income taxes on the undistributed income of subsidiaries or for unrecognized deferred tax liabilities for temporary differences related to basis differences in investments in subsidiaries, as such income is expected to be indefinitely reinvested, the investments are essentially permanent in duration, or the Company has concluded that no additional tax liability will arise as a result of the distribution of such income.
As of September 30, 2017,2018, certain subsidiaries had approximately $33,307$39,978 of undistributed income that the Company intends to permanently reinvest. A liability could arise if the Company's intention to permanently reinvest such income were to change and amounts are distributed by such subsidiaries or if such subsidiaries are ultimately disposed.disposed of. It is not practicable to estimate the additional income taxes related to permanently reinvested income or the basis differences related to investments in subsidiaries.
The calculation of the Company's tax liabilities involves dealing with uncertainties in the application of complex tax regulations in a multitude of jurisdictions across its global operations. The Company records tax liabilities for anticipated tax audit issues in the United States and other tax jurisdictions based on the Company's estimate of whether, and the extent to which, additional taxes will be due. These tax liabilities are reflected net of related tax loss carry-forwards. The Company adjusts these reserves in light of changing facts and circumstances. However, due to the complexity of some of these
uncertainties, the ultimate resolution may result in a payment that is materially different from the Company's current estimate of the tax liabilities. For uncertain tax liabilities (including penalties and interest) arising in the periods prior to the Transactions that are resolved in a future period, the Company plans to seek repayment from Tyco under the terms of an investment agreement. Accordingly, the Company has reflected those liabilities with an offsetting receivable due from Tyco of $5,787$122 on the consolidated balance sheet as of September 30, 2017.2018. If the Company's estimate of uncertain tax liabilities arising in the periods following the Transactions proves to be less than the ultimate assessment, an additional charge to expense would result. If payment of these amounts ultimately proves to be less than the recorded amounts, the reversal of the liabilities may result in income tax benefits being recognized in the period when the Company determines the liabilities are no longer necessary.
Under the terms of an investment agreement between the Company and Tyco, Tyco has agreed to indemnify and hold harmless the Company and its subsidiaries and their respective affiliates from and against any taxes of the Company with respect to any tax period ending on or before the closing of the Transactions, as well as all tax liabilities relating to events or transactions occurring on or prior to the closing date of the Transactions. In addition, the Company has agreed to indemnify and hold harmless Tyco and its affiliates from and against any liability for any taxes of the Company with respect to any post-Transactions tax period.
8.9. EARNINGS PER SHARE
The Company calculates basic and diluted earnings per common share using the two-class method. Under the two-class method, net earnings are allocated to each class of common stock and participating securities as if all of the net earnings for the period had been distributed. The Company's participating securities consist of share-based payment awards that contain a non-forfeitable right to receive dividends and therefore are considered to participate in undistributed earnings with common stockholders.
Basic earnings (loss)per common share excludes dilution and is calculated by dividing the net earnings allocable to common stock by the weighted-average number of common stock outstanding for the period. Diluted earnings per common share is computedcalculated by dividing net income (loss) availableearnings allocated to common stockholdersstock by the weighted-average number of shares of common stock outstanding during the period.
Diluted earnings (loss) per share is computed by dividing net income (loss) available to common stockholders by the weighted-average number of shares of common stock outstanding duringfor the period, as adjusted to includefor the number of shares of common stock that would have been outstanding had potentially dilutive shares of common stock been issued. Thepotential dilutive effect of stock options and restricted stock units are reflected in diluted net income (loss)non-participating share-based awards. Prior to fiscal 2018, earnings per share by applyingunder the two-class method and the treasury stock method forwas the year ended September 30, 2017 and September 30, 2016. There are no other potentially dilutive instruments outstanding. For the year ended September 25, 2015,same, as the Company settled all employee stock options in cash, the potential issuance of shares of common stock related to these options did not affect diluted shares. Holders of certain stock-based compensation awards are eligible to receive dividends, requiring the Company to use the two-class method. Netnet income allocated to participating securities were not significant for the years ended September 30, 2017 and September 30, 2016. As holders of certain stock-based compensation awards are not required to fund losses, no allocation of the loss available to common stockholders was made for the year ended September 25, 2015.immaterial.
The following table sets forth the computation of basic and diluted earnings per share:
|
| | | | | | | | | | | | |
| | | Fiscal Year Ended |
| (in thousands, except per share data) | | September 30, 2017 | | September 30, 2016 | | September 25, 2015 |
| Basic: | | | | | | |
| Net income (loss) | | $ | 84,639 |
| | $ | 58,796 |
| | $ | (4,955 | ) |
| Weighted-average shares outstanding | | 63,420 |
| | 62,486 |
| | 62,527 |
|
| Basic earnings (loss) per share | | $ | 1.33 |
| | $ | 0.94 |
| | $ | (0.08 | ) |
| | | | | | | |
| Diluted: | | | | | | |
| Net income (loss) | | $ | 84,639 |
| | $ | 58,796 |
| | $ | (4,955 | ) |
| Weighted-average shares outstanding - basic | | 63,420 |
| | 62,486 |
| | 62,527 |
|
Effect of dilutive securities: Stock compensation plans (1) | | 3,165 |
| | 334 |
| | — |
|
| Weighted-average shares outstanding - diluted | | 66,585 |
| | 62,820 |
| | 62,527 |
|
| Diluted earnings (loss) per share | | $ | 1.27 |
| | $ | 0.94 |
| | $ | (0.08 | ) |
| | | | | | | |
|
| | | | | | | | | | | | |
| | | Fiscal Year Ended |
| (in thousands, except per share data) | | September 30, 2018 | | September 30, 2017 | | September 30, 2016 |
| Numerator: | | | | | | |
| Net income | | $ | 136,645 |
| | $ | 84,639 |
| | $ | 58,796 |
|
| Less: Undistributed earnings allocated to participating securities | | 2,456 |
| | 241 |
| | 32 |
|
| Net income available to common shareholders | | $ | 134,189 |
| | $ | 84,398 |
| | $ | 58,764 |
|
| | | | | | | |
| Denominator: | | | |
| | |
| Basic weighted average common shares outstanding | | 51,791 |
| | 63,420 |
| | 62,486 |
|
| Effect of dilutive securities: Non-participating employee stock options (1) | | 2,298 |
| | 3,134 |
| | 300 |
|
| Diluted weighted average common shares outstanding | | 54,089 |
| | 66,554 |
| | 62,786 |
|
| | | | | | | |
| Basic earnings per share | | $ | 2.59 |
| | $ | 1.33 |
| | $ | 0.94 |
|
| Diluted earnings per share | | $ | 2.48 |
| | $ | 1.27 |
| | $ | 0.94 |
|
| | | | | | | |
(1) Stock options to purchase approximately 2.00.3 million, 0.2 million, and 6.30.1 million shares of common stock and restricted stock of 0.2 million and 0.0 million were outstanding during the years ended September 30, 2018, September 30, 2017, and September 30, 2016, respectively, but were not included in the calculation of diluted earnings per share as the impact of these would have been anti-dilutive. Performance shares were excluded from the calculation of diluted shares since none of the performance or market conditions were met. For the year ended September 25, 2015, the Company settled all employee stock options in cash and therefore none of the outstanding awards affect the calculation of diluted earnings per share.
9.10. ACCUMULATED OTHER COMPREHENSIVE LOSS
The following table presents the changes in accumulated other comprehensive loss by component, net of tax: | | | (in thousands) | | Defined benefit pension items | | Currency translation adjustments | | Total | | Defined benefit pension items | | Currency translation adjustments | | Total |
| Balance as of September 25, 2015 | | $ | (13,133 | ) | | $ | (7,900 | ) | | $ | (21,033 | ) | |
| Balance as of September 30, 2016 | | | $ | (17,192 | ) | | $ | (8,758 | ) | | $ | (25,950 | ) |
| Other comprehensive loss before reclassifications | | (4,505 | ) | | (858 | ) | | (5,363 | ) | | 5,941 |
| | 1,221 |
| | 7,162 |
|
| Amounts reclassified from accumulated other comprehensive loss | | 446 |
| | — |
| | 446 |
| | 806 |
| | — |
| | 806 |
|
| Net current period other comprehensive loss | | (4,059 | ) | | (858 | ) | | (4,917 | ) | | 6,747 |
| | 1,221 |
| | 7,968 |
|
| Balance as of September 30, 2016 | | $ | (17,192 | ) | | $ | (8,758 | ) | | $ | (25,950 | ) | |
| Balance as of September 30, 2017 | | | $ | (10,445 | ) | | $ | (7,537 | ) | | $ | (17,982 | ) |
| Other comprehensive income before reclassifications | | 5,941 |
| | 1,221 |
| | 7,162 |
| | 4,068 |
| | (2,853 | ) | | 1,215 |
|
| Amounts reclassified from accumulated other comprehensive loss | | 806 |
| | — |
| | 806 |
| | 329 |
| | — |
| | 329 |
|
| Net current period other comprehensive income | | 6,747 |
| | 1,221 |
| | 7,968 |
| |
| Balance as of September 30, 2017 | | $ | (10,445 | ) | | $ | (7,537 | ) | | $ | (17,982 | ) | |
| Net current period other comprehensive income (loss) | | | 4,397 |
| | (2,853 | ) | | 1,544 |
|
| Balance as of September 30, 2018 | | | $ | (6,048 | ) | | $ | (10,390 | ) | | $ | (16,438 | ) |
The following is a summary of the amounts reclassified from accumulated other comprehensive loss to net income (loss):income:
| | | | Fiscal Year Ended | Fiscal Year Ended |
| (in thousands) | September 30, 2017 | | September 30, 2016 | | September 25, 2015 | September 30, 2018 | | September 30, 2017 | | September 30, 2016 |
| Amortization of defined benefit pension items: | | | | | | | | | | |
| Amortization of net loss (included within selling, general and administrative expense) | $ | 1,303 |
| | $ | 722 |
| | $ | 88 |
| |
| Amortization of net loss (included within other income, net) | | $ | 343 |
| | $ | 1,303 |
| | $ | 722 |
|
| Tax expense | (497 | ) | | (276 | ) | | (34 | ) | (14 | ) | | (497 | ) | | (276 | ) |
| Net reclassifications for the period | $ | 806 |
| | $ | 446 |
| | $ | 54 |
| $ | 329 |
| | $ | 806 |
| | $ | 446 |
|
The estimated net actuarial loss for pension benefit plans that will be amortized from accumulated other comprehensive loss into net periodic benefit cost over the next fiscal year is expected to be approximately $343.
$101.
10.11. INVENTORIES, NET
A majority of the Company records inventory at the lower of cost or market (primarily last in, first out, or "LIFO"). Approximately 75%80% and 87%75% of the Company's inventories are valued at the lower of LIFO cost or market at September 30, 20172018 and September 30, 2016,2017, respectively.
| | | (in thousands) | | September 30, 2017 | | September 30, 2016 | | September 30, 2018 | | September 30, 2017 |
| Purchased materials and manufactured parts, net | | $ | 49,168 |
| | $ | 39,921 |
| | $ | 58,572 |
| | $ | 49,168 |
|
| Work in process, net | | 17,598 |
| | 11,889 |
| | 21,769 |
| | 17,598 |
|
| Finished goods, net | | 133,237 |
| | 109,655 |
| | 141,412 |
| | 133,237 |
|
| Inventories, net | | $ | 200,003 |
| | $ | 161,465 |
| | $ | 221,753 |
| | $ | 200,003 |
|
Total inventories would be $4,915$26,340 and $18,433$4,915 higher than reported as of September 30, 20172018 and September 30, 2016,2017, respectively, if the first-in, first-out method was used for all inventories. As of September 30, 20172018 and September 30, 2016,2017, the excess and obsolete inventory reserve was $8,432$12,909 and $8,447,$8,432, respectively.
|
| | | | | | | |
| (in thousands) | September 30, 2017 | | September 30, 2016 |
| Assets held for sale | $ | — |
| | $ | 6,680 |
|
During the first quarter of fiscal 2017, the Company sold a parcel of land and a building related to the exit of a manufacturing facility in Philadelphia, PA at a loss of $329 which was included in selling, general and administrative in the Company's consolidated statements of operations. The assets were previously classified as held for sale within the MP&S segment and had a carrying value of $3,367.
In May 2012, the Company entered into a share purchase agreement pursuant to which the Company sold its minority ownership share in Abahsain-Cope Saudi Arabia Ltd. for cash consideration of $9,087. The total carrying value of the investment was $3,313. During fiscal 2017, the Company recognized a pre-tax gain of $5,774 ($3,102, net of tax) on the sale when transfer of ownership was completed. The pre-tax gain was included in other income, net in the Company's consolidated statements of operations.
12. PROPERTY, PLANT AND EQUIPMENT
As of September 30, 20172018 and September 30, 2016,2017, property, plant and equipment at cost and accumulated depreciation were as follows:
| | | (in thousands) | September 30, 2017 | | September 30, 2016 | September 30, 2018 | | September 30, 2017 |
| Land | $ | 13,296 |
| | $ | 12,804 |
| $ | 13,295 |
| | $ | 13,296 |
|
| Buildings and related improvements | 105,154 |
| | 103,256 |
| 108,758 |
| | 105,154 |
|
| Machinery and equipment | 263,575 |
| | 245,011 |
| 262,078 |
| | 248,440 |
|
| Leasehold improvements | 6,744 |
| | 6,498 |
| 7,382 |
| | 6,744 |
|
| Software | | 30,502 |
| | 15,135 |
|
| Construction in progress | 16,160 |
| | 6,148 |
| 16,777 |
| | 16,160 |
|
| Property, plant and equipment | 404,929 |
| | 373,717 |
| 438,792 |
| | 404,929 |
|
| Accumulated depreciation | (196,310 | ) | | (171,025 | ) | (225,684 | ) | | (196,310 | ) |
| Property, plant and equipment, net | $ | 208,619 |
| | $ | 202,692 |
| $ | 213,108 |
| | $ | 208,619 |
|
Depreciation expense for fiscal years ended September 30, 2018, September 30, 2017 and September 30, 2016 totaled $34,786, $32,320 and September 25, 2015 totaled $32,320, $32,779, and $37,362, respectively.
13. GOODWILL AND INTANGIBLE ASSETS
Goodwill — Changes in the carrying amount of goodwill are as follows: | | | | Segment | |
| Segment | |
|
| (in thousands) | Electrical Raceway | | Mechanical Products & Solutions | | Total | Electrical Raceway | | Mechanical Products & Solutions | | Total |
| Balance as of September 30, 2016 and September 25, 2015 | $ | 76,640 |
| | $ | 39,189 |
| | $ | 115,829 |
| |
| Balance as of September 30, 2016 | | $ | 76,640 |
| | $ | 39,189 |
| | $ | 115,829 |
|
| Goodwill acquired during year | 31,477 |
| | — |
| | 31,477 |
| 31,477 |
| | — |
| | $ | 31,477 |
|
| Exchange rate effects | 410 |
| | — |
| | 410 |
| 410 |
| | — |
| | $ | 410 |
|
| Balance as of September 30, 2017 | $ | 108,527 |
| | $ | 39,189 |
| | $ | 147,716 |
| $ | 108,527 |
| | $ | 39,189 |
| | $ | 147,716 |
|
| Goodwill divested during year | | — |
| | (2,626 | ) | | (2,626 | ) |
| Goodwill acquired during year | | 813 |
| | — |
| | 813 |
|
| Purchase price adjustments | | 24,527 |
| | — |
| | 24,527 |
|
| Exchange rate effects | | (301 | ) | | — |
| | (301 | ) |
| Balance as of September 30, 2018 | | $ | 133,566 |
| | $ | 36,563 |
| | $ | 170,129 |
|
Goodwill acquired during the year is based on a preliminary purchase price allocationbalances include $3,924 and is subject to final valuations$43,000 of intangible assets and property, plant and equipment. See Note 2, ''Acquisitions'' for additional details. Fiscal years 2017, 2016 and 2015 include accumulated impairment losses of $3,924 and $43,000 within the Electrical Raceway and Mechanical Products & SolutionsMP&S segments, respectively.
The Company assesses the recoverabilityrespectively, as of goodwill on an annual basis in accordance with ASC 350, "Intangibles - Goodwill and Other." The measurement date is the first day of the fourth fiscal quarter, or more frequently, if events or circumstances indicate that it is more likely than not that the fair value of a reporting unit is less than the carrying value.
Goodwill is tested for impairment at a reporting unit level using either a qualitative assessment ("step zero") or quantitative assessment ("step one"). The qualitative assessment requires significant judgments about macroeconomic conditions including the operating environment, industry and other market considerations as well as entity-specific events that could impact the reporting unit. If the Company concludes that it is more likely than not that the fair value of a reporting unit exceeds its carrying value, it would proceed to step one.
As of the Company’s most recent quantitative goodwill impairment test performed in fiscal 2016, there was significant headroom when comparing the fair value of all of the reporting units to their carrying value and no triggering events were identified during fiscal 2017. The Company therefore elected to use the step zero assessment for fiscal 2017 which did not indicate any potential goodwill impairment. A reasonably possible change in the assumptions around the residual growth rate, weighted-average cost of capital of market participants, or estimated future cash flows would not result in an impairment of goodwill.
During fiscal 2016 and 2015, the Company performed a step one assessment for each of its reporting units. The step one assessment first compares the fair value of a reporting unit with its carrying amount, including goodwill. The fair value of a reporting unit was determined using an income approach using a discounted cash flow analysis based on forecasted cash flows (including underlying revenue and operating income growth rates) discounted using an estimated weighted-average cost of capital of market participants. The Company corroborated the results under the income approach using (a) a market approach using a comparable company analysis and (b) a market approach using a transaction analysis. An impairment loss would be recorded in an amount equal to the excess of the carrying amount of goodwill over its fair value. The second part of the test, if required, compares the implied fair value of goodwill with its carrying amount. The Company had no goodwill impairments in the fiscal year ended September 30, 2016.
During fiscal 2015, the Company's acquisition of SCI was treated as a separate reporting unit for which all of the goodwill ascribed from the purchase price allocation was assigned. SCI's fiscal 2015 operating performance was below the Company's initial projections. Post-acquisition, SCI's net sales2018 and earnings degraded in part due to a shift in the mix of products sold to a key customer. This customer historically purchased a disproportionate amount of higher margin product for use in a particular geographic end market. During the year, the volume shifted to lower margin product. Additionally, the customer began fulfilling a portion of their demand from a second source. The shift in product mix and volume decline prompted the Company to revisit the long-term projected forecast for this customer and its relative impact on the entire reporting unit.
The Company's revised long-term projections were used in step one of the goodwill impairment analysis. The first step of the goodwill impairment test indicated that the carrying value of the reporting unit, including goodwill, exceeded the fair value of the reporting unit requiring the second step of the test in the fourth quarter. The implied fair value in Step 2 revealed a $3,924 non-cash impairment, which is considered a Level 3 fair value measurement in accordance with the fair value hierarchy.
As a result, there is no more goodwill ascribed to this reporting unit. The non-cash impairment charge was recorded as a component of asset impairment charges in the Company's consolidated statements of operations during fiscal 2015.
The Company concluded that the circumstances surrounding this customer constituted a triggering event in accordance with ASC 360, "Property, Plant & Equipment." The Company compared the estimated undiscounted cash flows of the finite-lived customer relationship intangible asset to its carrying value to assess the recoverability. As the undiscounted cash flows related to the customer relationship intangible asset exceeded its carrying value, the Company did not proceed to the second step of the impairment test.September 30, 2017.
Intangible Assets — The following table provides the gross carrying value, accumulated amortization, and net carrying value for each major class of intangible assets:
|
| | | | | | | | | | | | | | | | | | | | | | | | | |
| | | | September 30, 2017 | | September 30, 2016 |
| ($ in thousands) | Weighted Average Useful Life (Years) | | Gross Carrying Value | | Accumulated Amortization | | Net Carrying Value | | Gross Carrying Value | | Accumulated Amortization | | Net Carrying Value |
| Amortizable Intangible Assets: | | | | | | | | | | | | | |
| Customer relationships | 11 | | $ | 350,129 |
| | $ | (118,273 | ) | | $ | 231,856 |
| | $ | 249,245 |
| | $ | (97,484 | ) | | $ | 151,761 |
|
| Other | 8 | | 27,819 |
| | (9,266 | ) | | 18,553 |
| | 16,943 |
| | (7,647 | ) | | 9,296 |
|
| Total | 11 | | 377,948 |
| | (127,539 | ) | | 250,409 |
| | 266,188 |
| | (105,131 | ) | | 161,057 |
|
| Indefinite-lived Intangible Assets: | | | | | | | | |
| | | | |
| Trade names | | | 93,880 |
| | — |
| | 93,880 |
| | 93,880 |
| | — |
| | 93,880 |
|
| Total | | | $ | 471,828 |
| | $ | (127,539 | ) | | $ | 344,289 |
| | $ | 360,068 |
| | $ | (105,131 | ) | | $ | 254,937 |
|
Intangible assets acquired for Flexicon and Calpipe during the year are based on a preliminary purchase price allocation and are subject to final valuations. See Note 2, ''Acquisitions'' for additional details. |
| | | | | | | | | | | | | | | | | | | | | | | | | |
| | | | September 30, 2018 | | September 30, 2017 |
| (in thousands) | Weighted Average Useful Life (Years) | | Gross Carrying Value | | Accumulated Amortization | | Net Carrying Value | | Gross Carrying Value | | Accumulated Amortization | | Net Carrying Value |
| Amortizable Intangible Assets: | | | | | | | | | | | | | |
| Customer relationships | 11 | | $ | 330,295 |
| | $ | (141,401 | ) | | $ | 188,894 |
| | $ | 350,129 |
| | $ | (118,273 | ) | | $ | 231,856 |
|
| Other | 8 | | 16,003 |
| | (5,861 | ) | | 10,142 |
| | 27,819 |
| | (9,266 | ) | | 18,553 |
|
| Total |
| | 346,298 |
| | (147,262 | ) | | 199,036 |
| | 377,948 |
| | (127,539 | ) | | 250,409 |
|
| Indefinite-lived Intangible Assets: | | | | | | | | |
| | | | |
| Trade names | | | 92,880 |
| | — |
| | 92,880 |
| | 93,880 |
| | — |
| | 93,880 |
|
| Total | | | $ | 439,178 |
| | $ | (147,262 | ) | | $ | 291,916 |
| | $ | 471,828 |
| | $ | (127,539 | ) | | $ | 344,289 |
|
Amortization expense for the fiscal years ended September 30, 2018, September 30, 2017 and September 30, 2016 was $32,104, $22,407 and September 25, 2015 was $22,407, $22,238, and $22,103, respectively. Expected amortization expense for intangible assets over the next five years and thereafter is as follows (in(in thousands): | | | 2018 | $ | 33,152 |
| |
| 2019 | 32,990 |
| $ | 31,122 |
|
| 2020 | 32,505 | 29,401 |
|
| 2021 | 30,935 |
| 29,267 |
| 2022 | 30,112 | 27,981 |
|
| 2023 and thereafter | 90,715 |
| |
| 2023 | | 27,860 |
| 2024 and thereafter | | 53,405 |
|
Actual amounts of amortization may differ from estimated amounts due to additional intangible asset acquisitions, changes in estimated useful lives, impairment of intangible assets, and other events.
14. DEBT
Debt as of September 30, 20172018 and September 30, 20162017 was as follows:
| | | (in thousands) | September 30, 2017 | | September 30, 2016 | September 30, 2018 | | September 30, 2017 |
| First Lien Term Loan Facility due December 22, 2023 | $ | 495,134 |
| | $ | — |
| $ | 912,162 |
| | $ | 495,134 |
|
| Initial First Lien Term Loan Facility due April 9, 2021 | — |
| | 409,200 |
| |
| Second Lien Term Loan Facility due October 9, 2021 | — |
| | 229,460 |
| |
| ABL Credit Facility | 85,000 |
| | — |
| — |
| | 85,000 |
|
| Deferred financing costs | (4,496 | ) | | (8,347 | ) | (8,194 | ) | | (4,496 | ) |
| Other | 440 |
| | — |
| 279 |
| | 440 |
|
| Total debt | $ | 576,078 |
| | $ | 630,313 |
| $ | 904,247 |
| | $ | 576,078 |
|
| Less: Current portion | 4,215 |
| | 1,267 |
| |
| Less: Current portion (a) | | 26,561 |
| | 4,215 |
|
| Long-term debt | $ | 571,863 |
| | $ | 629,046 |
| $ | 877,686 |
| | $ | 571,863 |
|
| | | | | |
| (a) Of the amount due within 2019 for the First Lien Term Loan Facility, $18,936 relates to an accelerated repayment of principal calculated by a formula based on 2018 excess cash flows and a leverage ratio as defined within the Term Loan Agreement. No such accelerated payments are indicated for any of the periods beyond 2019. | | (a) Of the amount due within 2019 for the First Lien Term Loan Facility, $18,936 relates to an accelerated repayment of principal calculated by a formula based on 2018 excess cash flows and a leverage ratio as defined within the Term Loan Agreement. No such accelerated payments are indicated for any of the periods beyond 2019. |
As of September 30, 2017,2018, future contractual maturities of long-term debt are as follows (in(in thousands):
| | | 2018 | $ | 5,000 |
| |
| 2019 | 5,000 |
| |
| 2019 (a) | | $ | 28,136 |
|
| 2020 | 5,000 | 9,200 |
|
| 2021 | 5,000 |
| 9,200 |
|
| 2022 | 5,000 | 9,200 |
|
| 2023 and thereafter | 471,250 |
| |
| 2023 | | 9,200 |
|
| 2024 and thereafter | | $ | 848,164 |
|
Term Loan Facilities — On April 9, 2014, AII entered into a credit agreement (the "Initial Credit Agreement") for a $420,000 First Lien Term Loan Facility (the "Initial First Lien Term Loan Facility") and a credit agreement for a $250,000 Second Lien Term Loan Facility (the "Second Lien Term Loan Facility." The Initial First Lien Term Loan Facility was priced at 99.5%99.50% and carried an interest rate of LIBOR plus 3.5%3.50% with a LIBOR floor of 1.00%. The Second Lien Term Loan Facility was priced at 99.0%99.00% and carried an interest rate of LIBOR plus 6.75% with a LIBOR floor of 1.00%.
On January 22, 2016, AII redeemed $17,000 of the Second Lien Term Loan Facility at a redemption price of 89.00% of the par value, and $2,000 at a redemption price of 89.75% of the par value. For the fiscal year ended September 30, 2016, the Company recorded a gain on the extinguishment of debt of $1,661.
On December 22, 2016, AII entered into an amendment to the Initial Credit Agreement, which amended and restated the Initial Credit Agreement and provided for a new $500,000 first lien term loan facility and extended the maturity of the initial Credit Agreement to December 22, 2023 (the "First Lien Term Loan Facility"). Loans under the First Lien Term Loan Facility bear interest at either LIBOR plus an applicable margin equal to 3.0%3.00% or an alternate base rate plus an applicable margin equal to 2.0%2.00% and are guaranteed by AIH and the United States operating companies owned by AII. The First Lien Term Loan Facility amortizes at a rate of 1.0%1.00% per annum and was priced at 99.75%. AII used proceeds from the First Lien Term Loan Facility and approximately $155 million of available cash to (i) repay all outstanding loans under the Initial First Lien Term Loan Facility and the Second Lien Term Loan Facility and (ii) pay related fees and expenses, including accrued interest. For the fiscal year ended September 30, 2017, the Company recorded a $9,805 loss on the extinguishment of the Initial First Lien Term Loan Facility and the Second Lien Term Loan Facility.
On February 2, 2018, AII entered into the (i) First Amendment to the Amended and Restated First Lien Credit Agreement, by and among AII, Deutsche Bank AG New York Branch, as administrative agent and collateral agent, and the other financial institutions party thereto to, among other things, decrease the interest margins applicable to the ABR Loans to 1.75% and Eurodollar Loans to 2.75%, and (ii) Increase Supplement (the "Increase Supplement") to, among other things, incur incremental first lien secured term loans in aggregate principal amount of $425.0 million. The Company used the proceeds from the Increase Supplement to 1) repurchase approximately 17.2 million shares of common stock from the CD&R Investor for a total purchase price of approximately $375 million, 2) repay $42.0 million of outstanding loans under the ABL Credit Facility and 3) pay $5.8 million in related fees and expenses. The revisions to the First Lien Term Loan were accounted for as a debt modification, resulting in immediate expensing of related financing costs of $892 within other income, net on the consolidated statements of operations for the year ended September 30, 2018.
The First Lien Term Loan Facility containcontains customary covenants typical for this type of financing, including limitations on indebtedness, restricted payments including dividends, liens, restrictions on distributions from restricted subsidiaries, sales of assets, affiliate transactions, mergers and consolidations. The First Lien Term Loan Facility also containcontains customary events of default typical for this type of financing, including, without limitation, failure to pay principal and/or interest when due, failure to observe covenants, certain events of bankruptcy, the rendering of certain judgments, or the loss of any guarantee.
ABL Credit Facility — On December 22, 2016, AII entered into the Fifth Amendment to Credit Agreement and Third Amendment to and Reaffirmation of Guarantee and Collateral Agreement to amend its asset based credit facility (the "ABL Credit Facility"). The amendment, among other things, extended the maturity of the facility to December 22, 2021, decreased the interest rate margins applicable to loans under the facility to (i) in the case of United States dollar-denominated loans, either (x) LIBOR plus an applicable margin ranging from 1.25% to 1.75%, or (y) an alternate base rate plus an applicable margin ranging from 0.25% to 0.75% or (ii) in the case of Canadian dollar-denominated loans, either (x) the BA rate plus an applicable margin ranging from 1.25% to 1.75% or (y) a Canadian prime rate plus an applicable margin ranging from 0.25% to 0.75% and decreased the fee payable with respect to unutilized availability under the facility from 0.25% to 0.375% depending on the remaining availability under the facility.
The ABL Credit Facility has aggregate commitments of $325,000 and is guaranteed by AIH and the United States subsidiaries owned directly or indirectly by AII. AII's availability under the ABL Credit Facility was $172,994$315,119 and $255,755$172,994 as of September 30, 20172018 and September 30, 2016,2017, respectively. Availability under the ABL Credit Facility is subject to a borrowing base equal to the sum of 85% of eligible accounts receivable plus the lesser of (i) 80% of eligible inventory of each borrower and guarantor and (ii) 85% of the net orderly liquidation value of eligible inventory, subject to certain limitations. There were $0 and $85 million and $0 of borrowings outstanding under the ABL Credit Facility as of September 30, 20172018 and September 30, 2016,2017, respectively. The company paid a fee of 0.50% on unutilized availability in fiscal 2016 and up until December 22, 2016, and a fee of 0.375% for the period from December 22, 2016 through September 30, 2017.2018.
The ABL Credit Facility contains customary representations and warranties and customary affirmative and negative covenants. Affirmative covenants include, without limitation, the timely delivery of quarterly and annual financial statements, certifications to be made by AIH, AII and each of its restricted subsidiaries, payment of obligations, maintenance of corporate existence and insurance, notices, compliance with environmental laws, and the grant of liens. The negative covenants include, without limitation: limitations on indebtedness, dividends and distributions, investments, prepayments or redemptions of subordinated indebtedness, amendments of subordinated indebtedness, transactions with affiliates, asset sales, mergers, consolidations and sales of all or substantially all assets, liens, negative pledge clauses, changes in fiscal periods, changes in line of business and changes in charter documents. Additionally, if the availability under the ABL Credit Facility falls below certain levels, AII would subsequently be required to maintain a minimum fixed charge coverage ratio. AII has not been subject to the minimum fixed charge coverage ratio during any period subsequent to the establishment of the ABL Credit Facility.
The First Lien Term Loan Facility and the ABL Credit Facility are secured by all of the assets of the USU.S. subsidiaries of the Company. The First Lien Term Loan Facility has priority over all real property, plant and equipment, intellectual property and capital stock of any US subsidiary and any documents or instruments evidencing the foregoing assets. The ABL Credit Facility has first priority over cash and cash equivalents, accounts receivable, inventory and other documents and instruments evidencing the foregoing assets.
15. FAIR VALUE MEASUREMENTS
Certain assets and liabilities are required to be recorded at fair value on a recurring basis.
The Company uses forward currency contracts to hedge the effects of foreign exchange relating to certain of the Company's intercompany loansreceivables denominated in a foreign currency. These derivative instruments are not formally designated as hedges by the Company and the terms of these instruments range from six months to fivesix years. Short-term forward currency contracts are recorded in other current liabilities and long-term forward currency contracts are recorded in other long-term liabilities in the consolidated balance sheets. The fair value gains and losses are included in other income, net within the consolidated statements of operations. See Note 6,7, ''Other Income, net'' for further detail.
The total notional amountamounts of undesignated forward currency contracts were £49.1 million and £52.6 million as of September 30, 2017.2018 and September 30, 2017, respectively. There were no undesignated forward currency contracts as of September 30, 2016 and September 25, 2015.2016. Cash flows associated with derivative financial instruments are recognized in the operating section of the consolidated statements of cash flows. The fair value of forward currency contracts is calculated by reference to current forward exchange rates for contracts with similar maturity profiles.
The following table presents the recurring assets and liabilities measured at fair value on a recurring basis as of September 30, 20172018 and September 30, 20162017 in accordance with the fair value hierarchy:
| | | | September 30, 2017 | | September 30, 2016 | September 30, 2018 | | September 30, 2017 |
| | Level 1 | | Level 2 | | Level 3 | | Level 1 | | Level 2 | | Level 3 | |
| (in thousands) | | Level 1 | | Level 2 | | Level 3 | | Level 1 | | Level 2 | | Level 3 |
| Assets | | | | | | | | | | | | | | | | | | | | | | |
| Cash equivalents | $ | 571 |
| | $ | — |
| | $ | — |
| | $ | 167,006 |
| | $ | — |
| | $ | — |
| $ | 28,175 |
| | $ | — |
| | $ | — |
| | $ | 571 |
| | $ | — |
| | $ | — |
|
| Liabilities | | | | | | | | | | | | |
| Forward currency contracts | — |
| | 2,936 |
| | — |
| | — |
| | — |
| | — |
| — |
| | $ | 1,857 |
| | — |
| | — |
| | $ | 2,936 |
| | — |
|
The CompanyIn addition to the recurring assets and liabilities measured $6,680 of assets held for sale on a nonrecurring basis as of September 30, 2016 which is considered a Level 3at fair value, measurement in accordance with the Company has a contingent consideration liability of $650 measured at fair value hierarchy.related to the Cii acquisition, which will be settled in the second quarter of fiscal 2019. The liability is valued using significant unobservable inputs (Level 3) based on the probability of achievement of first year earnings post acquisition. See Note 2, ''Acquisitions.'' for further detail.
The Company's remaining financial instruments consist primarily of cash, accounts receivable and accounts payable whose carrying value approximate their fair value due to their short-term nature.
The estimated fair value of financial instruments not carried at fair value in the consolidated balance sheets were as follows:
| | | | | September 30, 2017 | | September 30, 2016 | | September 30, 2018 | | September 30, 2017 |
| (in thousands) | | Carrying Value | | Fair Value | | Carrying Value | | Fair Value | | Carrying Value | | Fair Value | | Carrying Value | | Fair Value |
| First Lien Term Loan Facility due December 22, 2023 | | $ | 496,250 |
| | $ | 498,979 |
| | $ | — |
| | $ | — |
| | $ | 913,100 |
| | $ | 916,113 |
| | $ | 496,250 |
| | $ | 498,979 |
|
| Initial First Lien Term Loan Facility due April 9, 2021 | | — |
| | — |
| | 409,200 |
| | 411,084 |
| |
| Second Lien Term Loan Facility due October 9, 2021 | | — |
| | — |
| | 229,460 |
| | 231,092 |
| |
| Total debt | | $ | 496,250 |
| | $ | 498,979 |
| | $ | 638,660 |
| | $ | 642,176 |
| | $ | 913,100 |
| | $ | 916,113 |
| | $ | 496,250 |
| | $ | 498,979 |
|
In determining the approximate fair value of its long-term debt, the Company used the trading value among financial institutions, which were classified within Level 2 of the fair value hierarchy. The carrying value of the ABL Credit Facility approximates fair value due to it being market-linked variable rate debt.
16. COMMITMENTS AND CONTINGENCIES
The Company has obligations related to commitments to purchase certain goods. As of September 30, 2017,2018, such obligations were $89,117 for fiscal 2018, $3,395$100,649 for fiscal 2019, $330 for fiscal 2020 and $257$46 thereafter. These amounts represent open purchase orders for materials used in production.
The Company leases certain facilities and equipment under operating leases. Total rental expense on all operating leases was $17,403, $12,941 $11,934 and $11,721$11,934 in fiscal 2018, 2017, 2016, and 2015,2016, respectively. At September 30, 2017,2018, minimum future operating lease payments for leases with terms in excess of one year are presented in the table below as follows (in thousands):
| | | 2018 | | $ | 10,735 |
| |
| 2019 | | 10,549 |
| | $ | 11,069 |
|
| 2020 | | 8,565 |
| | 8,226 |
|
| 2021 | | 7,373 |
| | 6,580 |
|
| 2022 | | 4,620 |
| | 4,886 |
|
| 2023 and thereafter | | 9,884 |
| |
| 2023 | | | 4,254 |
|
| 2024 and thereafter | | | 9,988 |
|
| Total | | $ | 51,726 |
| | $ | 45,003 |
|
Insurable Liabilities — The Company maintains policies with various insurance companies for its workers' compensation, product, property, general, auto, and executive liability risks. The insurance policies that the Company maintains have various retention levels and excess coverage limits. The establishment and update of liabilities for unpaid claims, including claims incurred but not reported, is based on management's estimate as a result of the assessment by the Company's claim administrator of each claim and an independent actuarial valuation of the nature and severity of total claims. The Company utilizes a third-party claims administrator to pay claims, track and evaluate actual claims experience, and ensure consistency in the data used in the actuarial valuation.
Legal Contingencies — The Company is a defendant in a number of pending legal proceedings, some of which were inherited from its former parent, Tyco International Ltd. ("Tyco"), including certain product liability claims. Several lawsuits have been filed against the Company and the Company has also received other claim demand letters alleging that the Company's anti-microbial coated steel sprinkler pipe, ("ABF"), which the Company has not manufactured or sold for several years, is incompatible with chlorinated polyvinyl chloride ("CPVC") and caused stress cracking in such pipe manufactured by third parties when installed together in the same sprinkler system, which the Company refers to collectively as the "Special Products Claims." After an analysis of claims experience, the Company reserved its best estimate of the probable and reasonably estimable losses related to these matters. The Company's total product liability reserves for Special Products Claims and other product liability matters were $5,872$6,755 and $4,951$5,872 as of September 30, 20172018 and September 30, 2016,2017, respectively. As of September 30, 2017,2018, the Company believes that the range of probable losses for Special Products Claims and other product liabilities is between $3,000 and $10,000.
After September 30, 2018, Tyco and the Company agreed with a plaintiff to settle one Special Products claim that was to go to trial. The Company agreed to fund the total settlement in exchange for Tyco's agreement to cap the Company's Special Products Claim deductible at $12 million, as opposed to the $13 million cap negotiated within the original indemnity agreement. Tyco and the Company are examining the Company's total Special Products Claim payments which are nearly $12 million with the aforementioned settlement payment and as of September 30, 2018, the Company believes that it has recorded $12 million of cumulative expense related to these Special Products Claims. From and after the point where the Company has spent $12 million on Special Products Claims, Tyco, now JCI, has a contractual obligation to indemnify the Company in respect of claims of incompatibility between the Company's antimicrobial coated steel sprinkler pipe and CPVC pipe used in the same sprinkler system.
At this time, the Company does not expect the outcome of the Special Products Claims proceedings, either individually or in the aggregate, to have a material adverse effect on its business, financial condition, results of operations or cash flows, and the Company believes that its reserves are adequate for all claims, includingremaining contingencies for Special Products Claims contingencies. However, it is possible that additional reserves could be required in the future that could have a material adverse effect on the Company's business, financial condition, results of operations or cash flows. This additional loss or range of losses cannot be recorded at this time, as it is not reasonably estimable.Claims.
On November 16, 2015, the Company was served with a Special Products Claim, Wind Condominium Association, Inc., et al. v. Allied Tube & Conduit Corporation, et al. (the "Wind Condominium Action"), a putative class action claim filed in the Southern District of Florida which defined a "National Class" and a "Florida Subclass" consisting of all condominium associations and building owners who had ABF and/or ABF II installed in combination with CPVC from January 1, 2003 through December 31, 2010 nationwide and in Florida, respectively. The plaintiffs sought to recover monetary damages for the replacement and repair of fire suppression systems and any damaged real property or personal property, as well as consequential and incidental damages. The Wind Condominium Action was dismissed voluntarily by plaintiffs on August 3, 2016. The named plaintiffs in the Wind Condominium Action are pursuing their claims individually or in state court. At this time, the Company does not expect the outcome of the Special Products Claims proceedings, or any other proceeding, either individually or in the aggregate, to have a material adverse effect on its business, financial condition, results of operations or cash flows, and the Company believes that its reserves are adequate for all claims, including for Special Products Claims contingencies. However, it is possible that additional reserves could be required in the future that could have a material adverse effect on the Company's business, financial condition, results of operations or cash flows. This additional loss or range of losses cannot be recorded at this time, as it is not reasonably estimable.
During fiscal 2017, the United StatesU.S. Department of Commerce ruled on a scope request in relation to an Antidumping Duty Order for Malleable Iron Pipe Fittings from China. The ruling subjects certain of the Company's imports of conduit fittings within the Atkore Steel Components Inc. ("ASCI") business (acquired in November 2014) to antidumping duties, which are incremental to the duties previously paid upon importation. The Company is appealingappealed the scope decision and has established an accrual of $7,501 during the second quarter of fiscal 2017 for the related contingent liability with the related expense withinrecorded in selling, general and administrative expenses in the Company's consolidated statements of operations which covers the post-acquisition period through the date of the scope ruling. On appeal, the Court of International Trade ordered the U.S. Department of Commerce to re-examine certain aspects of its prior scope ruling, and after doing so, the Department filed an amended scope ruling for the Court of International Trade’s consideration. The amended scope ruling finds the ASCI products at issue in the matter to be outside the scope of the aforesaid Antidumping Duty Order. On August 3, 2018, the Court of International Trade sustained the U.S. Department of Commerce’s new scope determination and entered judgment thereupon. The U.S. Department of Commerce did not appeal the ruling by the Court of International Trade by the October 2, 2018, deadline and the Company has reversed $7,171 of the related accrual established during the second quarter of fiscal 2017.
In addition to the matters discussed above, from time to time, the Company is subject to a number of disputes, administrative proceedings and other claims arising out of the ordinary conduct of the Company's business. These matters generally relate to disputes arising out of the use or installation of the Company's products, product liability litigation, contract disputes, patent infringement accusations, employment matters, personal injury claims and similar matters. On the basis of information currently available to the Company, it does not believe that existing proceedings and claims will have a material adverse effect on its business, financial condition, results of operations or cash flows. However, litigation is unpredictable, and the Company could incur judgments or enter into settlements for current or future claims that could adversely affect its business, financial condition, results of operations or cash flows.
17. GUARANTEES
The Company has outstanding letters of credit totaling $8,560$9.9 million supporting workers' compensation and general liability insurance policies and surety bonds primarily related to performance guarantees on supply agreements and construction contracts, and payment of duties and taxes totaling $30,437$25.3 million as of September 30, 2017.
As of September 30, 2016, the Company had outstanding letters of credit totaling $9,121 as collateral for advance payments it received pursuant to the sale of its minority ownership share in Abahsain-Cope Saudi Arabia Ltd. The bank guarantees were canceled during the second quarter of fiscal 2017 when the transfer of ownership was completed.2018.
In disposing of assets or businesses, the Company often provides representations, warranties and indemnities to cover various risks including unknown damage to the assets, environmental risks involved in the sale of real estate, liability to investigate and remediate environmental contamination at waste disposal sites and manufacturing facilities, and unidentified tax liabilities and legal fees related to periods prior to disposition. The Company does not have the ability to estimate the potential liability from such indemnities because they relate to unknown conditions. However, the Company has no reason to believe that these uncertainties would have a material adverse effect on the Company's business, financial condition, results of operations or cash flows.
In the normal course of business, the Company is liable for product performance and contract completion. In the opinion of management, such obligations will not have a material adverse effect on the Company's business, financial condition, results of operations or cash flows.
18. RELATED PARTY TRANSACTIONS
Transactions between the Company, CD&R and affiliates of CD&R are considered related party.
In December 2010, the CD&R Investor acquired a majority stake in the Company (the "CD&R Acquisition"). In connection with the CD&R Acquisition, the Company, AIH and AII entered into a consulting agreement (the "Consulting Agreement") with CD&R. The fees related to the Consulting Agreement were paid quarterly, in advance and recorded as a component of selling, general and administrative expenses in the Company's consolidated statement of operations. In connection with the IPO on June 15, 2016, the Company entered into an agreement with CD&R to terminate the Consulting Agreement, including the ongoing consulting fees and paid CD&R a fee of $12,800. The consulting and termination fees were $15,425 and $3,500 for the fiscal yearsyear ended September 30, 2016 and September 25, 2015, respectively.2016.
Additionally,On January 22, 2018, the Company announced a stock repurchase transaction whereby the Company agreed to repurchase from the CD&R Investor, a related party, approximately 17.2 million shares of the Company's common stock, par value $0.01 per share, at a per share price equal to $21.77, for a total purchase price of $375 million, subject to the terms and conditions set forth in the stock purchase agreement. Following the stock repurchase transaction in January 2018 and secondary offerings of the Company's common stock in February 2018 and May 2018, the CD&R Investor no longer owned any of the company's common stock as of September 30, 2018.
Prior to the CD&R Investor selling all of its remaining shares of the Company in May 2018, transactions between the Company, CD&R and affiliates of CD&R were considered to be between related parties. In addition to the consulting fees referenced above, affiliates of CD&R own equity positions in one of the Company's customer.customers. Net sales during fiscal 2018 and 2017 to this customer waswere $6.0 and $8.3 million.million, respectively. There were no related party transactions during fiscal 2016 and 2015.2016.
19. SEGMENT INFORMATION
The Company has two operating segments, which are also its reportable segments. The Company's operating segments are organized based upon primary market channels and, in most instances, the end use of products.
Through its Electrical Raceway segment, the Company manufactures products that deploy, isolate and protect a structure's electrical circuitry from the original power source to the final outlet. These products, which include electrical conduit, armored cable, cable trays, mounting systems and fittings, are critical components of the electrical infrastructure for new construction and maintenance, repair and remodel ("MR&R") markets. The vast majority of the Company's Electrical Raceway net sales are made to electrical distributors, who then serve electrical contractors and the Company considers both to be customers.
Through the MP&S segment, the Company provides products and services that frame, support and secure component parts in a broad range of structures, equipment and systems in electrical, industrial and construction applications. The Company's principal products in this segment are metal framing products and in-line galvanized mechanical tube. Through its metal framing business, the Company designs, manufactures and installs metal strut and fittings used to assemble mounting structures that support heavy equipment and electrical content in buildings and other structures.
Effective in the fourth quarter of fiscal 2017, the Company implemented a realignment of its segment financial reporting structure such that its international businesses within EMEA and APAC regions are now reflected in its Electrical Raceway segment. These businesses were previously reflected within the MP&S segment. See Note 1, ''Basis of Presentation and Summary of Significant Accounting Policies'' for additional information. Prior year results have been revised for the impact of the realignment for comparability.
Both segments use Adjusted EBITDA as the primary measure of profit and loss. Segment Adjusted EBITDA is the sum of income (loss) from operations before income taxes, adjusted to exclude unallocated expenses, depreciation and amortization, interest expense, net, gain (loss) on extinguishment of debt, restructuring and impairments, stock-based compensation, certain legal matters, consulting fees, transaction costs, gain on sale of joint venture and other items, such as inventory reserves and adjustments, release of indemnified uncertain tax positions, the impact of foreign exchange gains or losses and the impact from the Fence and Sprinkler exit. Prior to fiscal 2017, income (loss) before income taxes was also adjusted to exclude net periodic pension benefit cost and routine ABF product liability.Special Products Claims. Beginning in fiscal 2017, these costs are no longer excluded. Prior fiscal years have not been revised for this change due to the relative insignificance and nature of these amounts.
Intersegment transactions primarily consist of product sales at designated transfer prices on an arms-lengtharm's-length basis. Gross profit earned and reported within the segment is eliminated in the Company's consolidated results. Certain manufacturing and distribution expenses are allocated between the segments on a pro rata basis due to the shared nature of activities. Recorded amounts represent a proportional amount of the quantity of product produced for each segment. Certain assets, such as machinery and equipment and facilities, are not allocated to each segment despite serving both segments. These shared assets are reported within the MP&S segment. We allocate certain corporate operating expenses that directly benefit our operating segments, such as insurance and information technology, on a basis that reasonably approximates an estimate of the use of these services. | | | | Fiscal year ended | Fiscal year ended |
| | September 30, 2017 | | September 30, 2016 | | September 25, 2015 | September 30, 2018 | | September 30, 2017 | | September 30, 2016 |
| (in thousands) | External Net Sales | | Inter- segment Sales | | Adjusted EBITDA | | External Net Sales | | Inter- segment Sales | | Adjusted EBITDA | | External Net Sales | | Inter- segment Sales | | Adjusted EBITDA | External Net Sales | | Inter- segment Sales | | Adjusted EBITDA | | External Net Sales | | Inter- segment Sales | | Adjusted EBITDA | | External Net Sales | | Inter- segment Sales | | Adjusted EBITDA |
| Electrical Raceway | $ | 1,093,500 |
| | $ | 1,283 |
| | $ | 189,351 |
| | $ | 1,066,711 |
| | $ | 1,919 |
| | $ | 181,939 |
| | $ | 1,079,155 |
| | $ | 1,121 |
| | $ | 112,544 |
| $ | 1,365,067 |
| | $ | 1,544 |
| | $ | 255,260 |
| | $ | 1,093,500 |
| | $ | 1,283 |
| | $ | 189,351 |
| | $ | 1,066,711 |
| | $ | 1,919 |
| | $ | 181,939 |
|
| MP&S | 410,434 |
| | 98 |
| | $ | 63,687 |
| | 456,673 |
| | 148 |
| | $ | 81,199 |
| | 650,013 |
| | 205 |
| | $ | 73,737 |
| 470,072 |
| | 81 |
| | $ | 51,339 |
| | 410,434 |
| | 98 |
| | $ | 63,687 |
| | 456,673 |
| | 148 |
| | $ | 81,199 |
|
| Eliminations | — |
| | (1,381 | ) | | | | — |
| | (2,067 | ) | | | | — |
| | (1,326 | ) | | | — |
| | (1,625 | ) | | | | — |
| | (1,381 | ) | | | | — |
| | (2,067 | ) | | |
| Consolidated operations | $ | 1,503,934 |
| | $ | — |
| | | | $ | 1,523,384 |
| | $ | — |
| | | | $ | 1,729,168 |
| | $ | — |
| | | $ | 1,835,139 |
| | $ | — |
| | | | $ | 1,503,934 |
| | $ | — |
| | | | $ | 1,523,384 |
| | $ | — |
| | |
| | | | Capital Expenditures | | Total Assets | Capital Expenditures | | Total Assets |
| (in thousands) | September 30, 2017 | | September 30, 2016 | | September 25, 2015 | | September 30, 2017 | | September 30, 2016 | | September 25, 2015 | September 30, 2018 | | September 30, 2017 | | September 30, 2016 | | September 30, 2018 | | September 30, 2017 | | September 30, 2016 |
| Electrical Raceway | $ | 13,037 |
| | $ | 9,161 |
| | $ | 12,530 |
| | $ | 757,775 |
| | $ | 566,250 |
| | $ | 620,109 |
| $ | 16,389 |
| | $ | 13,037 |
| | $ | 9,161 |
| | $ | 751,024 |
| | $ | 757,775 |
| | $ | 566,250 |
|
| MP&S | 8,212 |
| | 6,130 |
| | 10,598 |
| | 306,229 |
| | 343,002 |
| | 409,937 |
| 14,267 |
| | 8,212 |
| | 6,130 |
| | 291,164 |
| | 306,229 |
| | 343,002 |
|
| Unallocated | 3,873 |
| | 1,539 |
| | 3,721 |
| | 151,088 |
| | 255,316 |
| | 83,753 |
| 7,845 |
| | 3,873 |
| | 1,539 |
| | 281,872 |
| | 151,088 |
| | 255,316 |
|
| Consolidated operations | $ | 25,122 |
| | $ | 16,830 |
| | $ | 26,849 |
| | $ | 1,215,092 |
| | $ | 1,164,568 |
| | $ | 1,113,799 |
| $ | 38,501 |
| | $ | 25,122 |
| | $ | 16,830 |
| | $ | 1,324,060 |
| | $ | 1,215,092 |
| | $ | 1,164,568 |
|
Presented below is a reconciliation of operating segment Adjusted EBITDA to Income (loss) before income taxes: | | | | Fiscal Year Ended | Fiscal Year Ended |
| (in thousands) | September 30, 2017 |
| September 30, 2016 | | September 25, 2015 | September 30, 2018 |
| September 30, 2017 | | September 30, 2016 |
| Operating segment Adjusted EBITDA | | | | | | | | | | |
| Electrical Raceway | $ | 189,351 |
| | $ | 181,939 |
| | $ | 112,544 |
| $ | 255,260 |
| | $ | 189,351 |
| | $ | 181,939 |
|
| MP&S | 63,687 |
| | 81,199 |
| | 73,737 |
| 51,339 |
| | 63,687 |
| | 81,199 |
|
| Total | $ | 253,038 |
|
| $ | 263,138 |
| | $ | 186,281 |
| $ | 306,599 |
|
| $ | 253,038 |
| | $ | 263,138 |
|
| Unallocated expenses (a) | (25,430 | ) | | (28,136 | ) | | (22,331 | ) | (35,050 | ) | | (25,430 | ) | | (28,136 | ) |
| Depreciation and amortization | (54,727 | ) | | (55,017 | ) | | (59,465 | ) | (66,890 | ) | | (54,727 | ) | | (55,017 | ) |
| Interest expense, net | (26,598 | ) | | (41,798 | ) | | (44,809 | ) | (40,694 | ) | | (26,598 | ) | | (41,798 | ) |
| Gain (loss) on extinguishment of debt | (9,805 | ) | | 1,661 |
| | — |
| — |
| | (9,805 | ) | | 1,661 |
|
| Restructuring & impairments | (1,256 | ) | | (4,096 | ) | | (32,703 | ) | (1,849 | ) | | (1,256 | ) | | (4,096 | ) |
| Net periodic pension benefit cost | — |
| | (441 | ) | | (578 | ) | — |
| | — |
| | (441 | ) |
| Stock-based compensation | (12,788 | ) | | (21,127 | ) | | (13,523 | ) | (14,664 | ) | | (12,788 | ) | | (21,127 | ) |
| ABF product liability impact | — |
| | (850 | ) | | 216 |
| |
| Legal matters | (7,551 | ) | | (1,382 | ) | | — |
| |
| Special products claims impact | | — |
| | — |
| | (850 | ) |
| Certain legal matters | | 4,833 |
| | (7,551 | ) | | (1,382 | ) |
| Consulting fees | — |
| | (15,425 | ) | | (3,500 | ) | — |
| | — |
| | (15,425 | ) |
| Transaction costs | (4,779 | ) | | (7,832 | ) | | (6,039 | ) | (9,314 | ) | | (4,779 | ) | | (7,832 | ) |
| Gain on sale of a business | | 27,575 |
| | — |
| | — |
|
| Gain on sale of joint venture | 5,774 |
| | — |
| | — |
| — |
| | 5,774 |
| | — |
|
| Other | 10,247 |
| | (1,103 | ) | | (14,305 | ) | |
| Other (b) | | (4,194 | ) | | 10,247 |
| | (1,103 | ) |
| Impact of Fence and Sprinkler exit | — |
| | (811 | ) | | 2,885 |
| — |
| | — |
| | (811 | ) |
| Income (loss) before income taxes | $ | 126,125 |
| | $ | 86,781 |
| | $ | (7,871 | ) | |
| Income before income taxes | | $ | 166,352 |
| | $ | 126,125 |
| | $ | 86,781 |
|
| | | | | | | | | | | |
(a) Represents unallocated selling, general and administrative activities and associated expenses including, in part, executive, legal, finance, human resources, information technology, business development and communications, as well as certain costs and earnings of employee-related benefits plans, such as stock-based compensation and a portion of self-insured medical costs. | | (b) Represents other items, such as inventory reserves and adjustments, release of indemnified uncertain tax positions and the impact of foreign exchange gains or losses. | | (b) Represents other items, such as inventory reserves and adjustments, release of indemnified uncertain tax positions and the impact of foreign exchange gains or losses. |
The Company's long-lived assets and net sales by geography were as follows: | | | | | Long-lived assets | | Net sales | | Long-lived assets | | Net sales |
| (in thousands) | | September 30, 2017 | | September 30, 2016 | | September 25, 2015 | | September 30, 2017 | | September 30, 2016 | | September 25, 2015 | | September 30, 2018 | | September 30, 2017 | | September 30, 2016 | | September 30, 2018 | | September 30, 2017 | | September 30, 2016 |
| United States | | $ | 202,823 |
| | $ | 204,640 |
| | $ | 232,566 |
| | $ | 1,367,907 |
| | $ | 1,395,750 |
| | $ | 1,604,788 |
| | $ | 201,101 |
| | $ | 202,823 |
| | $ | 204,640 |
| | $ | 1,651,636 |
| | $ | 1,367,907 |
| | $ | 1,395,750 |
|
| Other Americas | | 164 |
| | 175 |
| | 132 |
| | 37,908 |
| | 40,573 |
| | 42,136 |
| | 138 |
| | 164 |
| | 175 |
| | 43,013 |
| | 37,908 |
| | 40,573 |
|
| Europe | | 9,306 |
| | 1,295 |
| | 1,036 |
| | 55,181 |
| | 40,246 |
| | 38,621 |
| | 11,090 |
| | 9,306 |
| | 1,295 |
| | 90,915 |
| | 55,181 |
| | 40,246 |
|
| Asia-Pacific | | 3,378 |
| | 3,826 |
| | 4,482 |
| | 42,938 |
| | 46,815 |
| | 43,623 |
| | 2,386 |
| | 3,378 |
| | 3,826 |
| | 49,575 |
| | 42,938 |
| | 46,815 |
|
| Total | | $ | 215,671 |
| | $ | 209,936 |
| | $ | 238,216 |
| | $ | 1,503,934 |
| | $ | 1,523,384 |
| | $ | 1,729,168 |
| | $ | 214,715 |
| | $ | 215,671 |
| | $ | 209,936 |
| | $ | 1,835,139 |
| | $ | 1,503,934 |
| | $ | 1,523,384 |
|
The table below shows the amount of net sales from external customers for each of the Company's product categories which accounted for 10 percent10% or more of consolidated net sales in any of the last three fiscal years: | | | | | Fiscal Year Ended | | Fiscal Year Ended |
| (in thousands) | | September 30, 2017 | | September 30, 2016 | | September 25, 2015 | | September 30, 2018 | | September 30, 2017 | | September 30, 2016 |
| Metal Electrical Conduit and Fittings | | $ | 349,239 |
| | $ | 331,526 |
| | $ | 320,531 |
| | $ | 517,935 |
| | $ | 349,239 |
| | $ | 331,526 |
|
| Armored Cable and Fittings | | 323,070 |
| | 318,279 |
| | 332,153 |
| | 336,388 |
| | 323,070 |
| | 318,279 |
|
| PVC Electrical Conduit & Fittings | | 265,389 |
| | 258,954 |
| | 269,808 |
| | 311,811 |
| | 265,389 |
| | 258,954 |
|
| Other raceway products | | 155,802 |
| | 157,952 |
| | 156,663 |
| | 198,933 |
| | 155,802 |
| | 157,952 |
|
| Electrical Raceway | | 1,093,500 |
| | 1,066,711 |
| | 1,079,155 |
| | 1,365,067 |
| | 1,093,500 |
| | 1,066,711 |
|
| | | | | | | | | | | | | |
| Mechanical Pipe | | 211,245 |
| | 249,473 |
| | 286,635 |
| | 253,381 |
| | 211,245 |
| | 249,473 |
|
| Other MP&S products | | 199,189 |
| | 199,384 |
| | 184,785 |
| | 216,691 |
| | 199,189 |
| | 199,384 |
|
| Impact of Fence and Sprinkler | | — |
| | 7,816 |
| | 178,593 |
| | — |
| | — |
| | 7,816 |
|
| MP&S | | 410,434 |
| | 456,673 |
| | 650,013 |
| | 470,072 |
| | 410,434 |
| | 456,673 |
|
| Net sales | | $ | 1,503,934 |
| | $ | 1,523,384 |
| | $ | 1,729,168 |
| | $ | 1,835,139 |
| | $ | 1,503,934 |
| | $ | 1,523,384 |
|
Risks and Concentrations
Concentration of Credit Risk — The Company extends credit to various customers in the retail and construction industries. Collection of trade receivables may be affected by changes in economic or other industry conditions and may, accordingly, impact the Company's overall credit risk. Although the Company generally does not require collateral, the Company performs ongoing credit evaluations of customers and maintains reserves for potential credit losses. ForAs of September 30, 2018, one customer, Sonepar Management US, Inc., represented 11% of the Company's accounts receivable balance due to increased sales in the last 60 days of the year. As of November 28, 2018, all periods presented,amounts outstanding as of September 30, 2018, that are due to be paid from Sonepar Management US, Inc., have been received. In fiscal 2017 and 2016, no single customer accounted for more than 10% of sales or accounts receivable.
Concentration of Employees — As of September 30, 2017,2018, approximately 40%26% of the Company's employees were represented by a union under a collective bargaining agreement. All unions are either located in the United States or Canada with no unions or Worker's Councils at any of the other locations abroad. The Company's New Bedford, Massachusetts facility hasOur Harvey, Illinois Special Metal Processing Facility agreement with the United Steelworkers Union, involving a contract which expires in February 2018 affecting 250 employees.bargaining unit of 12 employees, expired on November 11, 2018. We anticipate that the new collective bargaining agreement will be ratified by the union members within calendar 2018. Our Harvey Illinois collective bargaining agreement with the United Steelworkers, involving nearly 400 represented employees, does not expire until April 2020. The Company believes its relationship with their employees is good.
20. QUARTERLY OPERATING RESULTS (UNAUDITED)
The following tablestable presents unaudited selected quarterly financial data for the years ended September 30, 20172018 and September 30, 2016.2017. The operating results for any quarter are not necessarily indicative of the results of any future period.
| | | | Three Months Ended | Three Months Ended |
| (in thousands, except per share data) | December 30, 2016
(1) | | March 31, 2017
(2) | | June 30, 2017 | | September 30, 2017 | | December 25, 2015 | | March 25, 2016 (3) | | June 24, 2016 | | September 30, 2016 (4) | December 29, 2017
(3) | | March 30, 2018
(4) | | June 29, 2018 | | September 30, 2018
(5) | | December 30, 2016 As Adjusted ** (1) | | March 31, 2017 As Adjusted ** (2) | | June 30, 2017 As Adjusted ** | | September 30, 2017 As Adjusted ** |
| Net sales | $ | 337,591 |
| | $ | 372,791 |
| | $ | 397,745 |
| | $ | 395,807 |
| | $ | 358,375 |
| | $ | 353,046 |
| | $ | 395,724 |
| | $ | 416,239 |
| $ | 414,558 |
| | $ | 445,000 |
| | $ | 498,014 |
| | $ | 477,567 |
| | $ | 337,591 |
| | $ | 372,791 |
| | $ | 397,745 |
| | $ | 395,807 |
|
| Gross profit | 92,005 |
| | 87,949 |
| | 92,825 |
| | 89,853 |
| | 72,409 |
| | 91,410 |
| | 111,521 |
| | 93,342 |
| 96,867 |
| | 109,157 |
| | 120,329 |
| | 111,731 |
| | 91,665 |
| | 87,609 |
| | 92,485 |
| | 89,513 |
|
| Net income | 17,382 |
| | 18,935 |
| | 27,465 |
| | 20,857 |
| | 8,572 |
| | 14,007 |
| | 20,645 |
| | 15,572 |
| 27,189 |
| | 42,558 |
| | 34,199 |
| | 32,699 |
| | 17,382 |
| | 18,935 |
| | 27,465 |
| | 20,857 |
|
| | | | | | | | | | | | | | | | | | | | | | | | | | | | | | | |
| Net income per share | | | | | | | | | | | | | | | | | | | | | | | | | | | | | | |
Basic (5)(6) | $ | 0.28 |
| | $ | 0.30 |
| | $ | 0.43 |
| | $ | 0.33 |
| | $ | 0.14 |
| | $ | 0.22 |
| | $ | 0.33 |
| | $ | 0.25 |
| $ | 0.43 |
| | $ | 0.83 |
| | $ | 0.73 |
| | $ | 0.69 |
| | $ | 0.28 |
| | $ | 0.30 |
| | $ | 0.43 |
| | $ | 0.33 |
|
Diluted (5)(6) | 0.26 |
| | 0.28 |
| | 0.41 |
| | 0.31 |
| | 0.14 |
| | 0.22 |
| | 0.33 |
| | 0.24 |
| 0.41 |
| | 0.79 |
| | 0.70 |
| | 0.66 |
| | 0.26 |
| | 0.28 |
| | 0.41 |
| | 0.31 |
|
| | **As adjusted due to the adoption of ASU 2017-07. See Note 1, ''Basis of Presentation and Summary of Significant Accounting Policies'' for additional information. | | **As adjusted due to the adoption of ASU 2017-07. See Note 1, ''Basis of Presentation and Summary of Significant Accounting Policies'' for additional information. |
(1) Includes a $9,805 loss on the extinguishment of the Initial First Lien Term Loan Facility and the Second Lien Term Loan Facility. See Note 14, "Debt." | | (2) Includes $5,774 pre-tax gain on sale of Abahsain-Cope Saudi Arabia Ltd joint venture and $7,501 pre-tax expense related to the Antidumping Duty Order for Malleable Iron Pipe Fittings. See Note 16, "Commitments and contingencies." | |
| (3) Includes a $1,661 gain on the extinguishment of debt related to the January 22, 2016 redemption of a portion of the Second Lien Term Loan Facility. See Note 14, "Debt." | |
| (4) Due to the Company's fiscal year convention, includes 14 weeks of operations compared to 13 weeks for all other periods presented. | |
| (5) The sum of the quarters may not equal the total of the respective year's earnings (loss) per share due to changes in the weighted average shares outstanding throughout the year. | |
| (2) Includes $5,774 pre-tax gain on sale of Abahsain-Cope Saudi Arabia Ltd joint venture and $7,501 pre-tax expense related to the Antidumping Duty Order for Malleable Iron Pipe Fittings. See Note 16, "Commitments and contingencies" for additional information | | (2) Includes $5,774 pre-tax gain on sale of Abahsain-Cope Saudi Arabia Ltd joint venture and $7,501 pre-tax expense related to the Antidumping Duty Order for Malleable Iron Pipe Fittings. See Note 16, "Commitments and contingencies" for additional information |
| (3) Includes a $4,758 benefit due to the re-measurement of deferred tax liabilities as a result of the TCJA. See Note 8, "Income taxes" for additional information. | | (3) Includes a $4,758 benefit due to the re-measurement of deferred tax liabilities as a result of the TCJA. See Note 8, "Income taxes" for additional information. |
| (4) Includes $26,737 pre-tax gain on the sale of Flexhead. The Company recorded an additional working capital adjustment to the assets sold, which increased the gain by $838, in the quarter ending June 29, 2018. See Note 3, "Divestitures" for additional information. | | (4) Includes $26,737 pre-tax gain on the sale of Flexhead. The Company recorded an additional working capital adjustment to the assets sold, which increased the gain by $838, in the quarter ending June 29, 2018. See Note 3, "Divestitures" for additional information. |
| (5) Includes $7,171 pre- tax reversal of expense related to the Antidumping Duty Order for Malleable Iron Pipe Fittings. See Note 16, Commitments and contingencies" for additional information. | | (5) Includes $7,171 pre- tax reversal of expense related to the Antidumping Duty Order for Malleable Iron Pipe Fittings. See Note 16, Commitments and contingencies" for additional information. |
| (6) The sum of the quarters may not equal the total of the respective year's earnings per share due to changes in the weighted average shares outstanding throughout the year. | | (6) The sum of the quarters may not equal the total of the respective year's earnings per share due to changes in the weighted average shares outstanding throughout the year. |
Item 9. Changes in and Disagreements with Accountants on Accounting and Financial Disclosure
None.
Item 9A. Controls and Procedures
Evaluation of Disclosure Controls and Procedures
Our President and CEO, John P. Williamson,William E. Waltz, and our Vice President and CFO, James A. Mallak,David P. Johnson, have evaluated our disclosure controls and procedures (as defined in Rule 13a-15(e) and Rule 15d-15(e) under the Exchange Act) as of the end of the period covered by this Annual Report on Form 10-K as required by Rule 13a-15(b) and Rule 15d-15(b) under the Exchange Act. Messrs. WilliamsonWaltz and MallakJohnson have concluded that both the design and operation of our disclosure controls and procedures were effective as of September 30, 20172018.
Changes in Internal Control over Financial Reporting
No changes in the Company's internal control over financial reporting, as defined in Rule 13a-15(f) or Rule 15d-15(f) under the Exchange Act, occurred during the fourth quarter of fiscal 20172018 that have materially affected, or are reasonably likely to materially affect, the Company's internal control over financial reporting.
Management's Report on Internal Control over Financial Reporting
The Company's management is responsible for establishing and maintaining adequate internal controls over financial reporting. The Company's internal control over financial reporting is a process designed to provide reasonable assurance regarding the reliability of financial reporting and the preparation and fair presentation of published financial statements.
All internal control systems, no matter how well designed, have inherent limitations. Therefore, even those systems determined to be effective can provide only reasonable assurance with respect to financial statement preparation and presentation.
The Company's management assessed, under the supervision and with the participation of our President and CEO, John P. Williamson,William E. Waltz, and our Vice President and CFO, James A. Mallak,David P. Johnson, the effectiveness of the Company's internal control over financial reporting as of September 30, 2017.2018. In making this assessment, management used the criteria set forth by the Committee of Sponsoring Organizations of the Treadway Commission in Internal Control-Integrated Framework (2013). Based on this assessment, management concluded that, as of September 30, 2017,2018, the Company's internal control over financial reporting is effective based on those criteria.
Management's assessment excluded the internal control over financial reporting at Calpipe which was acquired during fiscal 2017. Calpipe constituted 4% and 5% of the Company's consolidated total assets and net assets, respectively, and less than 1% each of the Company's consolidated revenue and net income of the consolidated financial statement amounts as of and for the year ended September 30, 2017.
The Company's independent registered public accounting firm, Deloitte and Touche LLP, has issued an audit report on the Company's internal control over financial reporting for fiscal 2017.2018.
REPORT OF INDEPENDENT REGISTERED PUBLIC ACCOUNTING FIRM
To the stockholders and the Board of Directors and Stockholders of
Atkore International Group Inc.
Harvey, Illinois
Opinion on Internal Control over Financial Reporting
We have audited the internal control over financial reporting of Atkore International Group Inc. and its subsidiaries (the "Company"“Company”) as of September 30, 2017,2018, based on the criteria established in Internal Control - Integrated Framework (2013) issued by the Committee of Sponsoring Organizations of the Treadway Commission. As describedCommission (COSO). In our opinion, the Company maintained, in the accompanying Management's Report on Internal Control over Financial Reporting dated November 29, 2017, management excluded from its assessment theall material respects, effective internal control over financial reporting at Calpipe Industries, LLC (“Calpipe”), which was acquiredas of September 30, 2018, based on September 29, 2017, and whose financial statements constitute 4% and 5%criteria established in Internal Control - Integrated Framework (2013) issued by COSO.
We have also audited, in accordance with the standards of net and total assets, respectively, and less than 1% of revenue and net income, respectively ofthe Public Company Accounting Oversight Board (United States) (PCAOB), the consolidated financial statements and financial statement amountsschedules as of and for the year ended September 30, 2017. Accordingly,2018, of the Company and our audit did not include the internal control overreport dated November 28, 2018, expressed an unqualified opinion on those financial reporting at Calpipe. statements.
Basis for Opinion
The Company'sCompany’s management is responsible for maintaining effective internal control over financial reporting and for its assessment of the effectiveness of internal control over financial reporting, included in the accompanying Management's Report on Internal Control Overover Financial Reporting. Our responsibility is to express an opinion on the Company'sCompany’s internal control over financial reporting based on our audit.
We are a public accounting firm registered with the PCAOB and are required to be independent with respect to the Company in accordance with the U.S. federal securities laws and the applicable rules and regulations of the Securities and Exchange Commission and the PCAOB.
We conducted our audit in accordance with the standards of the Public Company Accounting Oversight Board (United States).PCAOB. Those standards require that we plan and perform the audit to obtain reasonable assurance about whether effective internal control over financial reporting was maintained in all material respects. Our audit included obtaining an understanding of internal control over financial reporting, assessing the risk that a material weakness exists, testing and evaluating the design and operating effectiveness of internal control based on the assessed risk, and performing such other procedures as we considered necessary in the circumstances. We believe that our audit provides a reasonable basis for our opinion.
Definition and Limitations of Internal Control over Financial Reporting
A company'scompany’s internal control over financial reporting is a process designed by, or under the supervision of, the company's principal executive and principal financial officers, or persons performing similar functions, and effected by the company's board of directors, management, and other personnel to provide reasonable assurance regarding the reliability of financial reporting and the preparation of financial statements for external purposes in accordance with generally accepted accounting principles. A company'scompany’s internal control over financial reporting includes those policies and procedures that (1) pertain to the maintenance of records that, in reasonable detail, accurately and fairly reflect the transactions and dispositions of the assets of the company; (2) provide reasonable assurance that transactions are recorded as necessary to permit preparation of financial statements in accordance with generally accepted accounting principles, and that receipts and expenditures of the company are being made only in accordance with authorizations of management and directors of the company; and (3) provide reasonable assurance regarding prevention or timely detection of unauthorized acquisition, use, or disposition of the company'scompany’s assets that could have a material effect on the financial statements.
Because of theits inherent limitations, of internal control over financial reporting including the possibility of collusion or improper management override of controls, material misstatements due to error or fraud may not be preventedprevent or detected on a timely basis.detect misstatements. Also, projections of any evaluation of the effectiveness of the internal control over financial reporting to future periods are subject to the risk that the controls may become inadequate because of changes in conditions, or that the degree of compliance with the policies or procedures may deteriorate.
In our opinion, the Company maintained, in all material respects, effective internal control over financial reporting as of September 30, 2017, based on the criteria established in [Internal Control - Integrated Framework (2013)Signature issued by the Committee of Sponsoring Organizations of the Treadway Commission.]
We have also audited, in accordance with the standards of the Public Company Accounting Oversight Board (United States), the consolidated financial statements and financial statement schedules of the Company as of and for the year ended September 30, 2017 and our report dated November 29, 2017 expressed an unqualified opinion on those consolidated financial statements and financial statement schedules.
/s/ Deloitte and Touche LLP
Chicago, Illinois
November 29, 201728, 2018
Item 9B. Other Information
None.
PART III
Item 10. Directors, Executive Officers and Corporate Governance
The information required by this Item for Atkore will be set forth in Atkore's Proxy Statement for the 20182019 Annual Meeting of Stockholders, which information is hereby incorporated by reference. Atkore has omitted the information required by this Item pursuant to General Instruction I to the Form 10-K.
Item 11. Executive Compensation
The information required by this Item for Atkore will be set forth in Atkore's Proxy Statement for the 20182019 Annual Meeting of Stockholders, which information is hereby incorporated by reference. Atkore has omitted the information required by this Item pursuant to General Instruction I to the Form 10-K.
Item 12. Security Ownership of Certain Beneficial Owners and Management and Related Stockholder Matters
The information required by this Item for Atkore will be set forth in Atkore's Proxy Statement for the 20182019 Annual Meeting of Stockholders, which information is hereby incorporated by reference. Atkore has omitted the information required by this Item pursuant to General Instruction I to the Form 10-K.
Item 13. Certain Relationships and Related Transactions, and Director Independence
The information required by this Item for Atkore will be set forth in Atkore's Proxy Statement for the 20182019 Annual Meeting of Stockholders, which information is hereby incorporated by reference. Atkore has omitted the information required by this Item pursuant to General Instruction I to the Form 10-K.
Item 14. Principal Accounting Fees and Services
The information required by this Item for Atkore will be set forth in Atkore's Proxy Statement for the 20182019 Annual Meeting of Stockholders, which information is hereby incorporated by reference. Atkore has omitted the information required by this Item pursuant to General Instruction I to the Form 10-K.
PART IV
Item 15. Exhibits and Financial Statement Schedules
(a). Financial Statements, Schedules and Exhibits.
1. Financial Statements
|
| | |
| Report of Independent Registered Public Accounting Firm contained in Item 8 of this Annual Report on Form 10-K. | | |
| Consolidated Statements Of Operations for the years ended September 30, 2018, September 30, 2017, and September 30, 2016 contained in Item 8 of this Annual Report on Form 10-K. | | |
Consolidated Statements of Comprehensive Income for the years ended September 30, 2018, September 30, 2017, and September 25, 201530, 2016 contained in Item 8 of this Annual Report on Form 10-K. | | |
Consolidated Statements of Comprehensive Income (Loss)Balance Sheets for the years ended September 30, 2017,2018, and September 30, 2016, and September 25, 20152017 contained in Item 8 of this Annual Report on Form 10-K. | | |
Consolidated Balance SheetsStatements of Cash Flows for the years ended September 30, 2018, September 30, 2017, and September 30, 2016 contained in Item 8 of this Annual Report on Form 10-K. | | |
Consolidated Statements of Cash FlowsShareholders' Equity for the yearsthree year period ended September 30, 2017, September 30, 2016, and September 25, 20152018 contained in Item 8 of this Annual Report on Form 10-K. | | |
Consolidated Statements of Shareholders' Equity for the three year period ended September 30, 2017 contained in Item 8 of this Annual Report on Form 10-K. | | |
| Notes to the Consolidated Financial Statements contained in Item 8 of this Annual Report on Form 10-K. | | |
2. Financial Statements Schedules
The following information is filed as part of this Annual Report on Form 10-K and should be read in conjunction with the financial statements contained in Item 8 of this Annual Report on Form 10-K:
|
| | |
| Schedule I-Atkore International Group Inc. (Parent) Condensed Financial Information | | |
| Schedule II-Valuation and Qualifying Accounts | | |
The exhibits filed with this report are listed on the Exhibit Index. Entries marked by the symbol † next to the exhibit's number identify management compensatory plans, contracts or arrangements.
Item 16. Form 10-K Summary
None.
Exhibit Index
|
| | |
| Exhibit Number | | Exhibit Description |
| 3.1 | | |
| | | |
| 3.2 | | |
| | | |
| 4.1 | | |
| | | |
| 10.1 | | Credit Agreement, dated as of December 22, 2010, among Atkore International, Inc., the subsidiary borrowers from time to time party thereto, the several banks and other financial institutions from time to time party thereto, UBS AG, Stamford Branch, as an issuing lender, as administrative agent for the lenders thereunder and as collateral agent for the Secured Parties and the Issuing Lenders, Deutsche Bank AG New York Branch, as co-collateral agent and UBS Loan Finance LLC, as swingline lender, incorporated by reference to Exhibit 10.6 to AIH’s Registration Statement on Form S-4 filed on August 12, 2011. |
| | | |
| 10.1.1 | | First Amendment to Credit Agreement, dated as of February 3, 2011, among Atkore International, Inc., the subsidiary borrowers, the several banks and other financial institutions from time to time parties thereto, UBS AG, Stamford Branch, as an issuing lender, as administrative agent for the lenders and as collateral agent for the secured parties, DeutscheBank AG New York Branch, as co-collateral agent, and UBS Loan Finance LLC, as Swingline Lender, incorporated by reference to Exhibit 10.1.1 to Atkore International Group Inc.’s Registration Statement on Form S-1 filed on April 15, 2016. |
| | | |
| 10.1.2 | | Second Amendment to Credit Agreement and First Amendment to and Reaffirmation of Guarantee and Collateral Agreement, dated as of October 23, 2013, among Atkore International, Inc., the subsidiary borrowers, the several banks and other financial institutions from time to time parties thereto, UBS AG, Stamford Branch, as an issuing lender, as administrative agent for the Lenders and as collateral agent for the secured parties, DeutscheBank AG New York Branch, as co-collateral agent, and UBS Loan Finance LLC, as Swingline Lender, incorporated by reference to Exhibit 10.1.2 to Atkore International Group Inc.’s Registration Statement on Form S-1 filed on April 15, 2016. |
| | | |
| 10.1.3 | | Third Amendment to Credit Agreement, dated as of April 9, 2014, among Atkore International, Inc., the Persons party thereto and identified on the signature pages as a guarantor, the several banks and other financial institutions from time to time parties thereto, UBS AG, Stamford Branch, as an issuing lender, as administrative agent for the Lenders and as collateral agent for the secured parties, and Deutsche Bank AG New York Branch, as co-collateral agent, incorporated by reference to Exhibit 10.1.3 to Atkore International Group Inc.’s Registration Statement on Form S-1 filed on April 15, 2016. |
| | | |
| 10.1.4 | | Additional Lender Joinder Agreement, dated as of December 17, 2014, by and among PNC Bank, National Association, The Huntington National Bank, Citizens Bank, National Association and JPMorgan Chase Bank, N.A., Atkore International, Inc., the subsidiary borrowers from time to time party to the Credit Agreement and UBS AG, Stamford Branch, as administrative agent, incorporated by reference to Exhibit 10.1.4 to Atkore International Group Inc.’s Registration Statement on Form S-1 filed on April 15, 2016. |
| | | |
| 10.1.5 | | Fourth Amendment to Credit Agreement, dated as of November 12, 2015, among Atkore International, Inc., the several banks and other financial institutions from time to time parties thereto, UBS AG, Stamford Branch, as an issuing lender, as administrative agent for the lenders and as collateral agent for the secured parties, and Deutsche Bank AG New York Branch, as co-collateral agent, incorporated by reference to Exhibit 10.1.5 to Atkore International Group Inc.’s Registration Statement on Form S-1 filed on April 15, 2016. |
| | | |
| 10.1.6 | | Fifth Amendment to Credit Agreement and Third Amendment to and Reaffirmation of Guarantee and Collateral Agreement, dated as of December 22, 2016, among Atkore International, Inc., the several banks and other financial institutions from time to time parties thereto, UBS AG, Stamford Branch, as administrative agent for the lenders and as collateral agent for the secured parties, the other loan parties party thereto and the several banks and other financial institutions party thereto, incorporated by reference to Exhibit 10.1 to Atkore International Group Inc.’s Current Report on Form 8-K filed on December 22, 2016. |
| | | |
| 10.2 | | |
| | | |
|
| | |
| 10.2.1 | | |
| | | |
| 10.2.2 | | |
| | | |
| 10.2.3 | | |
| | |
| 10.2.4 | | Increase Supplement, dated as of February 2, 2018, to the Amended and Restated First Lien Credit Agreement, dated as of December 22, 2016 (as amended by the First Amendment to Amended and Restated First Lien Credit Agreement, dated as of February 2, 2018, and as further amended, supplemented, waived or otherwise modified from time to time), among Atkore International, Inc., a Delaware corporation, the several banks and other financial institutions from time to time parties thereto, and Deutsche Bank AG New York Branch, as administrative agent and collateral agent, incorporated by reference to Exhibit 10.2 to Atkore International Group Inc.'s Current Report on Form 8-K filed on February 5, 2018. |
| | |
| 10.3 | | |
| | | |
| 10.4 | | First Lien Guarantee and Collateral Agreement, dated as of April 9, 2014, made by Atkore International Holdings Inc., Atkore International, Inc., and certain subsidiaries of Atkore International, Inc. from time to time party thereto, in favor of Deutsche Bank AG New York Branch, as collateral agent and administrative agent for the banks and other financial institutions from time to time parties to the First Lien Credit Agreement, incorporated by reference to Exhibit 10.5 to Atkore International Group Inc.’s Registration Statement on Form S-1 filed on April 15, 2016. |
| | | |
| 10.5 | | |
| | | |
| 10.5.1 | | First Amendment and Waiver, dated as of April 9, 2014, to the Intercreditor Agreement, dated as of December 22, 2010, among UBS AG, Stamford Branch, in its capacity as ABL Agent and Deutsche Bank AG New York Branch, in its capacity as Note Agent, incorporated by reference to Exhibit 10.7.1 to Atkore International Group Inc.’s Registration Statement on Form S-1 filed on April 15, 2016. |
| | | |
| 10.6† | | |
| | | |
| 10.7† | | |
| | | |
| 10.8† | | |
| | | |
| 10.9† | | |
| | | |
| 10.10† | | |
| | | |
| 10.11† | | |
| | | |
|
| | |
| 10.12† | | |
| | | |
| 10.13† | | |
| | | |
| 10.14† | | |
| | | |
| 10.15† | | |
| | | |
| 10.15.1* | | |
| | | |
|
| | |
| 10.16† | | |
| | | |
| 10.17† | | |
| | | |
| 10.17.1† | | |
| | | |
| 10.17.2† | | |
| | | |
| 10.18† | | |
| | | |
| 10.19† | | |
| | | |
10.210.20 | | Indemnification Agreement, dated as of December 22, 2010 among Atkore International Group Inc., Atkore International Holdings Inc., Atkore International Inc., CD&R Allied Holdings, L.P., Clayton, Dubilier & Rice Fund VIII, L.P., CD&R Friends & Family Fund VIII, L.P., CD&R Allied Advisor Co-Investor, L.P., Clayton, Dubilier & Rice, Inc. and Clayton, Dubilier & Rice, LLC, incorporated by reference to Exhibit 10.4 to AIH’s Registration Statement on Form S-4 filed on June 3, 2011. |
| | | |
| 10.21 | | |
| | | |
| 10.22 | | |
| | | |
| 10.23 | | |
| | | |
| 10.24† | | |
| | | |
| 10.25† | | |
| | | |
| 10.26† | | |
| | | |
| 10.27† | | |
| | | |
|
| | |
| 10.28 | | |
| | |
| 10.29 | | |
| | |
| 10.30 | | Letter Agreement, dated as of January 24, 2018, by and among Atkore International, Inc., Deutsche Bank AG New York Branch, Deutsche Bank Securities, Inc., JPMorgan Chase Bank, N.A., UBS Securities LLC and UBS AG, Stamford Branch, incorporated by reference to Exhibit 10.1 to Atkore International Group Inc.’s Current Report on Form 8-K filed on January 24, 2018. |
| | |
| 10.31 | | |
| | |
| 10.32 | | |
| | |
| 10.32.1 | | |
| | |
| 21.1* | | |
| | | |
| 23.1* | | |
| | | |
| 31.1* | | |
| | | |
| 31.2* | | |
| | | |
| 32.1* | | |
| | | |
|
| | |
| 32.2* | | |
| | | |
| 101.INS* | | XBRL Instance Document |
| | | |
| 101.SCH* | | XBRL Taxonomy Extension Schema |
| | | |
| 101.CAL* | | XBRL Taxonomy Extension Calculation Linkbase |
| | | |
| 101.DEF* | | XBRL Taxonomy Extension Definition Linkbase |
| | | |
| 101.LAB* | | XBRL Taxonomy Extension Label Linkbase |
| | | |
| 101.PRE* | | XBRL Extension Presentation Linkbase |
* Filed herewith.
† Identifies each management contract or compensatory plan or arrangement.
SIGNATURES
Pursuant to the requirements of Section 13 or 15(d) of the Securities Exchange Act of 1934, the registrant has duly caused this report to be signed on its behalf by the undersigned, thereunto duly authorized.
|
| | | |
| | | | ATKORE INTERNATIONAL GROUP INC. |
| | | | (Registrant) |
| Date: | November 29, 201728, 2018 | By: | /s/ David P. Johnson |
| | | Vice President and Chief Financial Officer |
| Date: | November 28, 2018 | By: | /s/ James A. Mallak |
| | | | Vice President and Chief FinancialAccounting Officer |
Pursuant to the requirements of the Securities Exchange Act of 1934, this report has been signed below by the following persons on behalf of the registrant and in the capacities and on the dates indicated. |
| | | | |
| Date: | November 29, 201728, 2018 | By: | /s/ Philip W. KniselyMichael V. Schrock |
| | | | Name: | Philip W. KniselyMichael V. Schrock |
| | | | Title: | Director and Chairman of the Board |
| | | | |
| Date: | November 29, 201728, 2018 | By: | /s/ John P. WilliamsonWilliam E. Waltz |
| | | | Name: | John P. WilliamsonWilliam E. Waltz |
| | | | Title: | President and Chief Executive Officer, Director (Principal Executive Officer) |
| | | | | |
| Date: | November 29, 201728, 2018 | By: | /s/ David P. Johnson |
| | | Name: | David P. Johnson |
| | | Title: | Vice President and Chief Financial Officer |
| | | |
| Date: | November 28, 2018 | By: | /s/ James A. Mallak |
| | | | Name: | James A. Mallak |
| | | | Title: | Vice President and Chief FinancialAccounting Officer (Principal Financial Officer and Principal Accounting Officer) |
| | | | |
| Date: | November 29, 201728, 2018 | By: | /s/ James G. BergesBetty R. Johnson |
| | | | Name: | James G. BergesBetty R. Johnson |
| | | | Title: | Director |
| | | | |
| Date: | November 29, 201728, 2018 | By: | /s/ Jeri L. Isbell |
| | | | Name: | Jeri L. Isbell |
| | | | Title: | Director |
| | | | |
| Date: | November 29, 201728, 2018 | By: | /s/ Wilbert W. James Jr. |
| | | | Name: | Wilbert W. James Jr. |
| | | | Title: | Director |
| | | | | |
| Date: | November 29, 201728, 2018 | By: | /s/ Justin A. Kershaw |
| | | | Name: | Justin A. Kershaw |
| | | | Title: | Director |
| | | | | |
| Date: | November 29, 201728, 2018 | By: | /s/ Scott H. Muse |
| | | | Name: | Scott H. Muse |
| | | | Title: | Director |
| | | | |
| Date: | November 29, 2017 | By: | /s/ Nathan K. Sleeper |
| | | Name: | Nathan K. Sleeper |
| | | Title: | Director |
| | | |
Date: | November 29, 201728, 2018 | By: | /s/ William VanArsdale |
| | | | Name: | William VanArsdale |
| | | | Title: | Director |
| | | | |
| Date: | November 29, 201728, 2018 | By: | /s/ A. Mark Zeffiro |
| | | | Name: | A. Mark Zeffiro |
| | | Title: | Director |
| | | |
Date: | November 29, 2017 | By: | /s/ Jonathan L. Zrebiec |
| | | Name: | Jonathan L. Zrebiec |
| | | | Title: | Director |
SCHEDULE I
ATKORE INTERNATIONAL GROUP INC. (PARENT)
CONDENSED FINANCIAL INFORMATION
CONDENSED BALANCE SHEETS
| | | (in thousands, except share and per share data) | | September 30, 2017 | | September 30, 2016 | | September 30, 2018 | | September 30, 2017 |
| Assets | | | | | | | | |
| Investment in subsidiary | | $ | 360,871 |
| | $ | 257,246 |
| | $ | 122,059 |
| | $ | 360,871 |
|
| Total Assets | | 360,871 |
| | 257,246 |
| | 122,059 |
| | 360,871 |
|
| Liabilities and Equity | | | | | | | | |
| Total Liabilities | | $ | — |
| | $ | — |
| | $ | — |
| | $ | — |
|
| Equity: | | | | | | | | |
| Common stock, $0.01 par value, 1,000,000,000 shares authorized, 63,305,434 and 62,458,367 shares issued and outstanding, respectively | | $ | 634 |
| | $ | 626 |
| |
| Common stock, $0.01 par value, 1,000,000,000 shares authorized, 47,079,645 and 63,305,434 shares issued and outstanding, respectively | | | $ | 472 |
| | $ | 634 |
|
| Treasury stock, held at cost, 260,900 and 260,900 shares, respectively | | (2,580 | ) | | (2,580 | ) | | (2,580 | ) | | (2,580 | ) |
| Additional paid-in capital | | 423,232 |
| | 398,292 |
| | 457,978 |
| | 423,232 |
|
| Accumulated deficit | | (42,433 | ) | | (113,142 | ) | | (317,373 | ) | | (42,433 | ) |
| Accumulated other comprehensive loss | | (17,982 | ) | | (25,950 | ) | | (16,438 | ) | | (17,982 | ) |
| Total Equity | | 360,871 |
| | 257,246 |
| | 122,059 |
| | 360,871 |
|
| Total Liabilities and Equity | | $ | 360,871 |
| | $ | 257,246 |
| | $ | 122,059 |
| | $ | 360,871 |
|
| | | | | | | | | |
See Notes to Financial Statements
SCHEDULE I
ATKORE INTERNATIONAL GROUP INC. (PARENT)
CONDENSED FINANCIAL INFORMATION
CONDENSED STATEMENTS OF OPERATIONS
|
| | | | | | | | | | | | |
| | | Fiscal Year Ended |
| (in thousands) | | September 30, 2017 | | September 30, 2016 | | September 25, 2015 |
| Equity in net income (loss) of subsidiary | | $ | 84,639 |
| | $ | 58,796 |
| | $ | (4,955 | ) |
| Net income (loss) | | 84,639 |
| | 58,796 |
| | (4,955 | ) |
| Other comprehensive income (loss) of subsidiary, net of tax | | 7,968 |
| | (4,917 | ) | | (14,403 | ) |
| Comprehensive income (loss) | | $ | 92,607 |
| | $ | 53,879 |
| | $ | (19,358 | ) |
|
| | | | | | | | | | | | |
| | | Fiscal Year Ended |
| (in thousands) | | September 30, 2018 | | September 30, 2017 | | September 30, 2016 |
| Equity in net income of subsidiary | | $ | 136,645 |
| | $ | 84,639 |
| | $ | 58,796 |
|
| Net income | | 136,645 |
| | 84,639 |
| | 58,796 |
|
| Other comprehensive income (loss) of subsidiary, net of tax | | 1,544 |
| | 7,968 |
| | (4,917 | ) |
| Comprehensive income | | $ | 138,189 |
| | $ | 92,607 |
| | $ | 53,879 |
|
See Notes to Financial Statements
SCHEDULE I
ATKORE INTERNATIONAL GROUP INC. (PARENT)
CONDENSED FINANCIAL INFORMATION
CONDENSED STATEMENTS OF CASH FLOWS
| |
| | For the Year Ended | | For the Year Ended |
| (in thousands) | | September 30, 2017 | | September 30, 2016 | | September 25, 2015 | | September 30, 2018 | | September 30, 2017 | | September 30, 2016 |
| Cash Flows from Operating Activities: | | | | | | | | | | | | |
| Net cash provided by operating activities | | $ | — |
| | $ | — |
| | $ | — |
| | $ | — |
| | $ | — |
| | $ | — |
|
| | | | | | | | | | | | | |
| Cash Flows from Investing Activities: | | | | | | | | | | | | |
| Distribution received from subsidiary | | 13,938 |
| | — |
| | 882 |
| | 411,775 |
| | 13,938 |
| | — |
|
| Distribution paid to subsidiary | | (12,168 | ) | | (52 | ) | | (49 | ) | | (20,110 | ) | | (12,168 | ) | | (52 | ) |
| Net cash provided by (used in) investing activities | | 1,770 |
| | (52 | ) | | 833 |
| | 391,665 |
| | 1,770 |
| | (52 | ) |
| | | | | | | | | | | | | |
| Cash Flows from Financing Activities: | | | | | | | | | | | | |
| Issuance of common shares | | 12,168 |
| | 52 |
| | 49 |
| | 20,110 |
| | 12,168 |
| | 52 |
|
| Repurchase of common shares | | (13,938 | ) | | — |
| | (882 | ) | | (411,775 | ) | | (13,938 | ) | | — |
|
| Net cash (used in) provided by financing activities | | (1,770 | ) | | 52 |
| | (833 | ) | | (391,665 | ) | | (1,770 | ) | | 52 |
|
| | | | | | | | | | | | | |
| Net change in cash and cash equivalents | | — |
| | — |
| | — |
| | — |
| | — |
| | — |
|
| | | | | | | | | | | | | |
| Cash and cash equivalents: | | | | | | | | | | | | |
| Beginning | | — |
| | — |
| | — |
| | — |
| | — |
| | — |
|
| Ending | | $ | — |
| | $ | — |
| | $ | — |
| | $ | — |
| | $ | — |
| | $ | — |
|
See Notes to Financial Statements
SCHEDULE I
ATKORE INTERNATIONAL GROUP INC. (PARENT)
CONDENSED FINANCIAL INFORMATION
NOTES TO CONDENSED FINANCIAL STATEMENTS
(dollars in thousands)
1. Description of Atkore International Group Inc.
Atkore International Group Inc. (the "Company," "Parent" or "Atkore") was incorporated in the State of Delaware on November 4, 2010. The Company is the stockholder of Atkore International Holdings Inc. ("AIH"), which is the sole stockholder of Atkore International, Inc. ("AII"). Prior to the transactions described below, all of the capital stock of AII was owned by Tyco International Ltd. ("Tyco"). The business of AII was operated as the Tyco Electrical and Metal Products ("TEMP") business of Tyco. Atkore was initially formed by Tyco as a holding company to hold ownership of TEMP.
On November 9, 2010, Tyco announced that it had entered into an agreement to sell a majority interest in TEMP to CD&R Allied Holdings, L.P. (the "CD&R Investor), an affiliate of the private equity firm Clayton Dubilier & Rice, LLC ("CD&R"). On December 22, 2010, the transaction was completed and CD&R acquired shares of a newly created class of cumulative convertible preferred stock (the "Preferred Stock") of the Company. The Preferred Stock initially represented 51% of the Company's outstanding capital stock (on an as-converted basis). On December 22, 2010, the Company also issued common stock (the "Common Stock") to Tyco's wholly owned subsidiary, Tyco International Holding S.à.r.l. ("Tyco Seller"), that initially represented the remaining 49% of the Company's outstanding capital stock. Subsequent to December 22, 2010, the Company has operated as an independent, stand-alone entity.
On March 6, 2014, the Company entered into a non-binding letter of intent (the "Letter of Intent") with Tyco for the acquisition (the "Acquisition") of 40.3 million shares of Common Stock held by Tyco Seller. On April 9, 2014, the Company paid $250,000 to Tyco Seller to redeem the shares, which were subsequently retired. The Company paid $2,000 of expenses related to the share redemption.
In a separate transaction on the same date, the CD&R Investor converted its Preferred Stock and accumulated Preferred Dividends into Common Stock. As a result, Common Stock is the Company's sole issued and outstanding class of securities.
The Parent has no significant operations or assets other than its indirect ownership of the equity of AII. Accordingly, the Parent is dependent upon distributions from AII to fund its obligations. However, under the terms of the agreements governing AII's borrowings, AII's ability to pay dividends or lend to Atkore Holding or the Parent, is restricted. While certain exceptions to the paying dividends or lending funds restrictions exist, these restrictions have resulted in the restricted net assets (as defined in Rule 4-08(e)(3) of Regulation S-X) of the Company's subsidiaries exceeding 25% of the consolidated net assets of the Company and its subsidiaries. Atkore Holding has no obligations to pay dividends to the Parent except to pay specified amounts to Parent in order to fund the payment of the Parent's tax obligations.
2. Basis of Presentation
The accompanying condensed Parent only financial statements are required in accordance with Rule 4-08(e)(3) of Regulation S-X. The financial statements include the amounts of the Parent and its investment in its subsidiaries under the equity method, and does not present the financial statements of the Parent and its subsidiaries on a consolidated basis. Under the equity method, investment in its subsidiaries is stated at cost plus contributions and equity in undistributed income (loss) of subsidiary less distributions received since the date of acquisition. These condensed Parent only financial statements should be read in conjunction with the Atkore International Group Inc. consolidated financial statements and their accompanying notes.
3. Dividends and Distributions from Subsidiaries
The Company received distributions of $411,775, $13,938, $0, and $882$0 from its subsidiaries for the years ended September 30, 2017,2018, September 30, 20162017 and September 25, 2015,30, 2016, respectively. The distributions received in fiscal 2018 and 2017 were used to repurchase shares of the Company's common stock. These dividends were permissible under an exception to the net asset restrictions of the agreements governing AII's borrowings, which allow for dividend payments from AII to AIH or the Parent for the purpose of repurchasing shares of Parent's common stock.
4. Common Stock Split
On May 27, 2016, the Company filed a Certificate of Amendment to amend and restate the Company's Certificate of Incorporation in the State of Delaware, effecting a 1.37-for-1 common stock split. All applicable share data, per share amounts and related information in the consolidated financial statements and notes thereto have been adjusted retroactively to give effect to the 1.37-for-1 common stock split.
SCHEDULE II—VALUATION AND QUALIFYING ACCOUNTS | | | (in thousands) | | Balance at Beginning of Year | | Additions Charged to Income | | Write offs and Other | | Balance at End of Year | | Balance at Beginning of Year | | Additional (Charges)/Benefit to Income | | Write offs and Other | | Balance at End of Year |
| Accounts Receivable Allowance for Doubtful Accounts: | | | | | | | | | | | | | | | | |
| For the fiscal year ended: | | | | | | | | | | | | | | | | |
| 2018 | | | $ | (1,239 | ) | | (389 | ) | | (134 | ) | | $ | (1,762 | ) |
| 2017 | | $ | (1,006 | ) | | (243 | ) | | 10 |
| | $ | (1,239 | ) | | $ | (1,006 | ) | | (243 | ) | | 10 |
| | $ | (1,239 | ) |
| 2016 | | $ | (1,173 | ) | | (426 | ) | | 593 |
| | $ | (1,006 | ) | | $ | (1,173 | ) | | (426 | ) | | 593 |
| | $ | (1,006 | ) |
| 2015 | | $ | (1,986 | ) | | 560 |
| | 253 |
| | $ | (1,173 | ) | |
| | | | | | | | | | | | | | | | | |
| Deferred Tax Valuation Allowance: | | | | | | | | | | | | | | | | |
| For the fiscal year ended: | | | | | | | | | | | | | | | | |
| 2018 | | | $ | (9,512 | ) | | 428 |
| | 1,657 |
| | $ | (7,427 | ) |
| 2017 | | $ | (8,658 | ) | | (1,164 | ) | | 310 |
| | $ | (9,512 | ) | | $ | (8,658 | ) | | (1,164 | ) | | 310 |
| | $ | (9,512 | ) |
| 2016 | | $ | (7,532 | ) | | (2,604 | ) | | 1,478 |
| | $ | (8,658 | ) | | $ | (7,532 | ) | | (2,604 | ) | | 1,478 |
| | $ | (8,658 | ) |
| 2015 | | $ | (7,708 | ) | | (1,107 | ) | | 1,283 |
| | $ | (7,532 | ) | |