Due to the types of contracts we enter into and the markets in which we operate, the cumulative loss of several major contracts, customers, or alliances may have an adverse effect on our results of operations.
We often enter into large, long-term contracts that, collectively, represent a significant portion of our revenue. These agreements, if terminated or breached, may have a larger impact on our operating results or our financial condition than shorter-term contracts due to the value at risk. Moreover, the global market for the production, transportation, and transformation of hydrocarbons and by-products, as well as the other industrial markets in which we operate, is dominated by a small number of companies. As a result, our business relies on a limited number of customers. If we were to lose several key contracts, customers, or alliances over a relatively short period of time, we could experience a significant adverse impact on our financial condition, results of operations, or cash flows.
Disruptions in the political, regulatory, economic, and social conditions of the countries in which we conduct business could adversely affect our business or results of operations.
We operate in various countries across the world. Instability and unforeseen changes in any of the markets in which we conduct business, including economically and politically volatile areas could have an adverse effect on the demand for our services and products, our financial condition, or our results of operations. These factors include, but are not limited to, the following:
•nationalization and expropriation;
•potentially burdensome taxation;
•inflationary and recessionary markets, including capital and equity markets;
•civil unrest, labor issues, political instability, disease outbreaks, terrorist attacks, cyber-terrorism,cyber terrorism, military activity, and wars;
•supply disruptions in key oil producing countries;
•the ability of OPECOPEC+ to set and maintain production levels and pricing;
•trade restrictions, trade protection measures, price controls, or trade disputes;
•sanctions, such as prohibitions or restrictions by the United States against countries that are the targets of economic sanctions, or are designated as state sponsors of terrorism;
•foreign ownership restrictions;
•import or export licensing requirements;
•restrictions on operations, trade practices, trade partners, and investment decisions resulting from domestic and foreign laws, and regulations;
•regime changes;
•changes in, and the administration of, treaties, laws, and regulations;regulations including in response to public health issues;
•inability to repatriate income or capital;
•reductions in the availability of qualified personnel;
•foreign currency fluctuations or currency restrictions; and
•fluctuations in the interest rate component of forward foreign currency rates.
DTC and Euroclear Paris may cease to act as depository and clearing agencies for our shares.
34
Our shares were issued into the facilities of The Depository Trust Company (“DTC”) with respect to shares listed on the NYSE and Euroclear with respect to shares listed on Euronext Paris (DTC and Euroclear being referred to as the “Clearance Services”). The Clearance Services are widely used mechanisms that allow for rapid electronic transfers of securities between the participants in their respective systems, which include many large banks and brokerage firms. The Clearance Services have general discretion to cease to act as a depository and clearing agencies for our shares. If either of the Clearance Services determine at any time that our shares are not eligible for continued deposit and clearance within its facilities, then we believe that our shares would not be eligible for continued listing on the NYSE or Euronext Paris, as applicable, and trading in our shares would be disrupted. Any such disruption could have a material adverse effect on the trading price of our shares.
The United Kingdom’s proposed withdrawal from the European Union may have a negative effect on global economic conditions, financial markets, and our business.
We are based in the United Kingdom and have operational headquarters in Paris, France; Houston, Texas, United States; and in London, United Kingdom, with worldwide operations, including material business operations in Europe. In June 2016, a majority of voters in theThe United Kingdom elected to withdrawwithdrew from the European Union in a national referendumon January 31, 2020 (“Brexit”). The referendum was advisory, andIn connection with Brexit, the United Kingdom government served notice under Article 50 of the Treaty of the European Union in March 2017 to formally initiate a withdrawal process. The United Kingdom and the European Union have had a two-year period under Article 50 to negotiateagreed on the terms forTrade and Cooperation Agreement (“TCA”) that governs the United Kingdom’s withdrawal from the European Union. The withdrawal agreement and political declaration that were endorsed at a special meeting of the European Council on November 25, 2018 did not receive the approval of the United Kingdom Parliament in January 2019. Further discussions are ongoing, although the European Commission has stated that the European Union will not reopen the withdrawal agreement. Any extension of the negotiation period for withdrawal will require the consent of the remaining 27 member states of the European Union. Brexit has created significant uncertainty about the future trading relationship between the United Kingdom and the European Union and has given rise to calls for certain regions within thein specified areas. The TCA took effect on January 1, 2021. The United Kingdom to preserve their placeis no longer in the European Union by separatingcustoms union and is outside of the European Union single market. The TCA addresses trade, economic arrangements, law enforcement, judicial cooperation and a governance framework including procedures for dispute resolution, among other things.Because the agreement merely sets forth a framework in many respects and will require complex additional bilateral negotiations between the United Kingdom and the European Union as both parties continue to work on the rules for implementation, significant political and economic uncertainty remains about whether the terms of the relationship will differ materially from the United Kingdom.terms before withdrawal.
These developments or the perception that any of them could occur, could have a material adverse effect on global economic conditions and the stability of the global financial markets and could significantly reduce global market liquidity and restrict the ability of key market participants to operate in certain financial markets. Asset valuations, currency exchange rates, and credit ratings may be especially subject to increased market volatility. LackIn addition, there is a lack of clarity about applicablethe future United Kingdom laws and regulations or treaties as the United Kingdom negotiates the terms of a withdrawal, as well as the operation of any such rules pursuantdetermines which European Union laws to any withdrawal terms,replicate or replace, including financial laws and regulations, tax and free trade agreements, intellectual property rights, supply chain logistics, environmental, health and safety laws and regulations, immigration laws, employment laws, and other rules that would apply to us and our subsidiaries, could increase our costs, restrict our access to capital within the United Kingdom and the European Union, depress economic activity, and further decrease foreign direct investment in the United Kingdom. For
example, withdrawalany divergence in the United Kingdom from the European Union law could depending on the negotiated terms of such withdrawal, eliminate the benefit of certain tax-related E.U.European Union directives currently applicable to U.K.United Kingdom companies such as us, including the Parent-Subsidiary Directive and the Interest and Royalties Directive, which could, subject to any relief under an available tax treaty, raise our tax costs.cost.
Any of these factors could have a material adverse effect on our business, financial condition, andor results of operations.
Our existing and future debt may limit cash flow available to invest in the ongoing needs of our business and could prevent us from fulfilling our obligations under our outstanding debt.
We have substantial existing debt. As of December 31, 2018, after giving effect to the Merger,2020, our total debt is $4.2was $4.0 billion. In addition, in connection with Spin-off, we obtained commitments from a syndicate of financial institutions for a senior secured revolving credit facility of up to $1.0 billion. We will also have the capacity under our $2.5 billion credit facility, in addition to our bilateral facilitiesdebt agreements to incur substantial additional debt.
Our level of debt could have important consequences. For example, it could:
•make it more difficult for us to make payments on our debt;
•require us to dedicate a substantial portion of our cash flow from operations to the payment of debt service, reducing the availability of our cash flow to fund working capital, capital expenditures, acquisitions, distributions, and other general partnership purposes;
35
•increase our vulnerability to adverse economic or industry conditions;
•limit our ability to obtain additional financing to enable us to react to changes in our business; or
•place us at a competitive disadvantage compared to businesses in our industry that have less debt.
Additionally, any failure to meet required payments on our debt or to comply with any covenants in the instruments governing our debt, could result in an event of default under the terms of those instruments. In the event of such default, the holders of such debt could elect to declare all the amounts outstanding under such instruments to be due and payable. Such default could also trigger a cross default or our other debt.
The London Inter-bankInterbank Offered Rate (“LIBOR”), the Euro Interbank Offered Rate and certain other interest “benchmarks” may be subject to further regulatory guidance and/or reform that could cause interest rates under our current or future debt agreements to perform differently than in the past or cause other unanticipated consequences. The United Kingdom’s Financial Conduct Authority, which regulates LIBOR, has announced that it intends to stop encouraging or requiring banks to submitthe continuation of LIBOR rateson the current basis cannot and will not be guaranteed after 2021 and it is unclear if LIBOR will cease to exist or if new methods of calculating LIBOR will evolve. If LIBOR ceases to exist or if the methods of calculating LIBOR change from their current form, interest rates on our current or future debt obligations may be adversely affected.
The terms of the agreements governing our existing indebtedness restrict our current and future operations, particularly our ability to respond to changes or to take certain actions.
The terms of the agreements governing our indebtedness contain a number of restrictive covenants that limit our flexibility in conducting our debt rating couldbusiness and restrict our ability to access the capital markets.
A breach of the covenants or refinancerestrictions under our existing indebtedness could result in an event of default under the applicable indebtedness. Such default may allow the creditors to accelerate the related debt or cause us to refinance or issue debt with less favorable terms and conditions. Moreover, our revolving credit agreement includes an increase in interest rates if the ratings for our debt are downgraded, which could have an adverse effect on our results of operations. An increasemay result in the levelacceleration of any other debt to which a cross-acceleration or cross-default provision applies. An event of default under our Revolving Credit Facility would also permit the lenders to terminate all commitments to extend further credit under that facility. Furthermore, if we were unable to repay the amounts due and payable under our Revolving Credit Facility, lenders thereunder could proceed against the collateral granted to them to secure that indebtedness. In the event our lenders or noteholders accelerate the repayment of our indebtednessborrowings, we and related interest costsour subsidiaries may increase our vulnerabilitynot have sufficient assets to adverse general economic and industry conditions andrepay that indebtedness.
These restrictions may affect our ability to obtain additional financing, as well as have a material adverse effect ongrow in accordance with our business, financial condition, and results of operations.
Our acquisition and divestiture activities involve substantial risks.
We have made and expect to continue to pursue acquisitions, dispositions, or other investments that may strategically fit our business and/or growth objectives. We cannot provide assurances that we will be able to locate suitable acquisitions, dispositions, or investments, or that we will be able to consummate any such transactions on terms and conditions acceptable to us. Even if we do successfully execute such transactions, they may not result in anticipated benefits, which could have a material adverse effect on our financial results. If we are unable to successfully integrate and develop acquired businesses, we could fail to achieve anticipated synergies and cost savings, including any expected increases in revenues and operating results. We may not be able to successfully cause a buyer of a divested business to assume the liabilities of that business or, even if such liabilities are assumed, we may have difficulties enforcing our rights, contractual or otherwise, against the buyer. We may invest in companies or businesses that fail, causing a loss of all or part of our investment. In addition, if we determine that an other-than-temporary decline in the fair value exists for a company in which we have invested, we may have to write down that investment to its fair value and recognize the related write-down as an investment loss.
36
In connection with the Spin-off, we agreed to indemnify Technip Energies for certain liabilities and Technip Energies agreed to indemnify us for certain liabilities. If we are required to act on these indemnities to Technip Energies, our financial results could be negatively impacted. Additionally, any indemnity from Technip Energies may not be sufficient to insure us against the full amount of liabilities for which we are responsible and Technip Energies may not be able to satisfy its indemnification obligations in the future.
Risks Related to Our Operations
We may lose money on fixed-price contracts.
As customary for some of our projects, we often agree to provide products and services under fixed-price contracts. We are subject to material risks in connection with such fixed-price contracts. It is not possible to estimate with complete certainty the final cost or margin of a project at the time of bidding or during the early phases of its execution. Actual expenses incurred in executing these fixed-price contracts can vary substantially from those originally anticipated for several reasons including, but not limited to, the following:
•unforeseen additional costs related to the purchase of substantial equipment necessary for contract fulfillment or labor shortages in the markets where the contracts are performed;
•mechanical failure of our production equipment and machinery;
•delays caused by local weather conditions and/or natural disasters (including earthquakes, floods and public health crises such as the COVID-19 pandemic); and
•a failure of suppliers, subcontractors, or joint venture partners to perform their contractual obligations.
The realization of any material risks and unforeseen circumstances could also lead to delays in the execution schedule of a project. We may be held liable to a customer should we fail to meet project milestones or deadlines or to comply with other contractual provisions. Additionally, delays in certain projects could lead to delays in subsequent projects that were scheduled to use equipment and machinery still being utilized on a delayed project.
Pursuant to the terms of fixed-price contracts, we are not always able to increase the price of the contract to reflect factors that were unforeseen at the time our bid was submitted, and this risk may be heightened for projects with longer terms. Depending on the size of a project, variations from estimated contract performance, or variations in multiple contracts, could have a significant impact on our financial condition, results of operations or cash flows.
New capital asset construction projects for vessels and manufacturing facilities are subject to risks, including delays and cost overruns, which could have a material adverse effect on our financial condition, or results of operations.
From time to time, we carry out capital asset construction projects to maintain, upgrade, and develop our asset base, and such projects are subject to risks of delay and cost overruns that are inherent in any large construction project, resulting from numerous factors including, but not limited to, the following:
•shortages of key equipment, materials or skilled labor;
•delays in the delivery of ordered materials and equipment;
•design and engineering issues; and
•shipyard delays and performance issues.
Failure to complete construction in time, or the inability to complete construction in accordance with design specifications, may result in the loss of revenue. Additionally, capital expenditures for construction projects could materially exceed the initially planned investments, or there could be delays in putting such assets into operation.
Our failure to timely deliver our backlog could affect future sales, profitability, and relationships with our customers.
37
Many of the contracts we enter into with our customers require long manufacturing lead times due to complex technical and logistical requirements. These contracts may contain clauses related to liquidated damages or financial incentives regarding on-time delivery, and a failure by us to deliver in accordance with customer expectations could subject us to liquidated damages or loss of financial incentives, reduce our margins on these contracts, or result in damage to existing customer relationships. The ability to meet customer delivery schedules for this backlog is dependent upon a number of factors, including, but not limited to, access to the raw materials required for production, an adequately trained and capable workforce, subcontractor performance, project engineering expertise and execution, sufficient manufacturing plant capacity, and appropriate planning and scheduling of manufacturing resources. Failure to deliver backlog in accordance with expectations could negatively impact our financial performance.
We face risks relating to our reliance on subcontractors, suppliers, and our joint venture partners.
We generally rely on subcontractors, suppliers, and our joint venture partners for the performance of our contracts. Although we are not dependent upon any single supplier, certain geographic areas of our business or a project or group of projects may depend heavily on certain suppliers for raw materials or semi-finished goods.
Any difficulty in engaging suitable subcontractors or acquiring equipment and materials could compromise our ability to generate a significant margin on a project or to complete such project within the allocated time frame. If subcontractors, suppliers or joint venture partners refuse to adhere to their contractual obligations with us or are unable to do so due to a deterioration of their financial condition, we may be unable to find a suitable replacement at a comparable price, or at all. Moreover, the failure of one of our joint venture partners to perform their obligations in a timely and satisfactory manner could lead to additional obligations and costs being imposed on us as we may be obligated to assume our defaulting partner’s obligations or compensate our customers.
Any delay, failure to meet contractual obligations, or other event beyond our control or not foreseeable by us, that is attributable to a subcontractor, supplier or joint venture partner, could lead to delays in the overall progress of the project and/or generate significant extra costs. Even if we are entitled to make a claim for these extra costs against the defaulting supplier, subcontractor or joint venture partner, we may be unable to recover the entirety of these costs and this could materially adversely affect our business, financial condition or results of operations.
A failure of our IT infrastructure, including as a result of cyber attacks,cyber-attacks, could adversely impact our business and results of operations.
The efficient operation of our business is dependent on our IT systems. Accordingly, we rely upon the capacity, reliability, and security of our IT hardware and software infrastructure and our ability to expand and update this infrastructure in response to changing needs. We have been subject to cyber attackscyber-attacks in the past, including phishing, malware, and ransomware, and although noransomware. No such attack has had a material adverse effect on our business, however this may not be the case with future attacks. Our systems may be vulnerable to damages from such attacks, as well as from natural disasters, failures in hardware or software, power fluctuations, unauthorized access to data and systems, loss or destruction of data (including confidential customer information), human error, and other similar disruptions, and we cannot give assurance that any security measures we have implemented or may in the future implement will be sufficient to identify and prevent or mitigate such disruptions. In response to the COVID-19 pandemic, we have transitioned many of our employees to remote working arrangements which presents increased cybersecurity risks. If a cyber-attack, power outage, connectivity issue, or other event occurred that impacted our employees’ ability to work remotely, it may be difficult or, in certain cases, impossible, for us to continue our business for a substantial period of time.
We rely on third parties to support the operation of our IT hardware, software infrastructure, and cloud services, and in certain instances, utilize web-based and software-as-a-service applications. The security and privacy measures implemented by such third parties, as well as the measures implemented by any entities we acquire or with whom we do business, may not be sufficient to identify or prevent cyber attacks,cyber-attacks, and any such attacks may have a material adverse effect on our business. While our IT vendor agreements typically contain provisions that seek to eliminate or limit our exposure to liability for damages from a cyber-attack,cyber attack, we cannot ensure such provisions will withstand legal challenges or cover all or any such damages.
Threats to our IT systems arise from numerous sources, not all of which are within our control, including fraud or malice on the part of third parties, accidental technological failure, electrical or telecommunication outages, failures of computer servers or other damage to our property or assets, outbreaks of hostilities, or terrorist acts. The failure
38
of our IT systems or those of our vendors to perform as anticipated for any reason or any significant breach of security could disrupt our business and result in numerous adverse consequences, including reduced effectiveness and efficiency of operations, inappropriate disclosure of confidential and proprietary information, including personal data, regulatory action and fines included for a breach of data protection laws, reputational harm, regulatory fines or investigations, increased overhead costs, and loss of important information, which could have a material adverse effect on our business and results of operations. In addition, we may be required to incur significant costs to protect against or to mitigate damage caused by these disruptions or security breaches in the future. Our insurance coverage may not cover all of the costs and liabilities we incur as the result of any disruptions or security breaches, and if our business continuity and/or disaster recovery plans do not effectively and timely resolve issues resulting from a cyber-attack, we may suffer material adverse effects on our business.
Pirates endanger our maritime employees and assets.
We face material piracy risks in the Gulf of Guinea, the Somali Basin, and the Gulf of Aden, and, to a lesser extent, in Southeast Asia, Malacca, and the Singapore Straits. Piracy represents a risk for both our projects and our vessels, which operate and transport through sensitive maritime areas. Such risks have the potential to significantly harm our crews and to negatively impact the execution schedule for our projects. If our maritime employees or assets are endangered, additional time may be required to find an alternative solution, which may delay project realization and negatively impact our business, financial condition, or results of operations.
Risks Related to Legal Proceedings, Tax, and Regulatory Matters
The industries in which we operate or have operated expose us to potential liabilities, including the installation or use of our products, which may not be covered by insurance or may be in excess of policy limits, or for which expected recoveries may not be realized.
We are subject to potential liabilities arising from, among other possibilities, equipment malfunctions, equipment misuse, personal injuries, and natural disasters, any of which may result in hazardous situations, including uncontrollable flows of gas or well fluids, fires, and explosions. Our insurance against these risks may not be adequate to cover our liabilities. Further, the insurance may not generally be available in the future or, if available, premiums may not be commercially justifiable. If we incur substantial liability and the damages are not covered by insurance or are in excess of policy limits, or if we were to incur liability at a time when we were not able to obtain liability insurance, such potential liabilities could have a material adverse effect on our business, results of operations, financial condition or cash flows.
Our operations require us to comply with numerous regulations, violations of which could have a material adverse effect on our financial condition, results of operations, or cash flows.
Our operations and manufacturing activities are governed by international, regional, transnational, and national laws and regulations in every place where we operate relating to matters such as environmental protection, health and safety, labor and employment, import/export controls, currency exchange, bribery and corruption, and taxation. These laws and regulations are complex, frequently change, and have tended to become more stringent over time. In the event the scope of these laws and regulations expand in the future, the incremental cost of compliance could adversely impact our financial condition, results of operations, or cash flows.
Our international operations are subject to anti-corruption laws and regulations, such as the U.S. Foreign Corrupt Practices Act (“FCPA”), the U.K. Bribery Act of 2010 (the “Bribery Act”), the anti-corruption provisions of French law n° 2016-1691 dated December 9, 2016 relating to Transparency, Anti-corruption and Modernization of the Business Practice (“Sapin II Law”), the Brazilian law nº 12,846/13, or the Brazilian Anti-Bribery Act (also known as the Brazilian Clean Company Act), and economic and trade sanctions, including those administered by the United Nations, the European Union, the Office of Foreign Assets Control of the U.S. Department of the Treasury (“U.S. Treasury”), and the U.S. Department of State. The FCPA prohibits corruptly providing anything of value to foreign officials for the purposes of obtaining or retaining business or securing any improper business advantage. We may deal with both governments and state-owned business enterprises, the employees of which are considered foreign officials for purposes of the FCPA. The provisions of the Bribery Act extend beyond bribery of foreign public officials and are more onerous than the FCPA in a number of other respects, including jurisdiction, non-exemption of facilitation payments, and penalties. Economic and trade sanctions restrict our transactions or dealings with certain sanctioned countries, territories, and designated persons.
39
As a result of doing business in countries throughout the world, including through partners and agents, we are exposed to a risk of violating anti-corruption laws and sanctions regulations. Some of the international locations in which we currently operate or may, in the future, operate, have developing legal systems and may have higher levels of corruption than more developed nations. Our continued expansion and worldwide operations, including in developing countries, our development of joint venture relationships worldwide, and the employment of local agents in the countries in which we operate increases the risk of violations of anti-corruption laws and economic and trade sanctions. Violations of anti-corruption laws and economic and trade sanctions are punishable by civil penalties, including fines, denial of export privileges, injunctions, asset seizures, debarment from government contracts (and termination of existing contracts), and revocations or restrictions of licenses, as well as criminal fines and imprisonment. In addition, any major violations could have a significant impact on our reputation and consequently on our ability to win future business.
We have implemented internal controls designed to minimize and detect potential violations of laws and regulations in a timely manner but we can provide no assurance that such policies and procedures will be followed at all times or will effectively detect and prevent violations of the applicable laws by one or more of our employees, consultants, agents, or partners. The occurrence of any such violation could subject us to penalties and material adverse consequences on our business, financial condition, results of operations, or cash flows.
Compliance with environmental and climate change-related laws and regulations may adversely affect our business and results of operations.
Environmental laws and regulations in various countries affect the equipment, systems, and services we design, market, and sell, as well as the facilities where we manufacture our equipment and systems, and any other operations we undertake. We are required to invest financial and managerial resources to comply with environmental laws and regulations, and believe that we will continue to be required to do so in the future. Failure to comply with these laws and regulations may result in the assessment of administrative, civil, and criminal penalties, the imposition of remedial obligations, the issuance of orders enjoining our operations, or other claims and complaints. Additionally, our insurance and compliance costs may increase as a result of changes in environmental laws and regulations or changes in enforcement. These laws and regulations, as well as any new laws and regulations affecting exploration and development of drilling for crude oil and natural gas, are becoming increasingly strict and could adversely affect our business and operating results by increasing our costs, limiting the demand for our products and services, or restricting our operations.
Regulatory requirements related to Environmental, Social and Governance (ESG) (including sustainability) matters have been, and are being, implemented in the European Union in particular in relation to financial market participants. Such regulatory requirements are being implemented on a phased basis. We expect regulatory requirements related to, and investor focus on, ESG (including sustainability) matters to continue to expand in the EU, the United States, and more globally. We establish ESG objectives that align with our foundational beliefs and corporate strategy with an aim toward reducing our carbon footprint, raising awareness and making advancements in inclusion and diversity. If, in relation to ESG (including sustainability) matters, we are not able to meet current and future regulatory requirements, the reporting requirements of regulators, or the current and future expectations of investors, customers or other stakeholders, our business and ability to raise capital may be adversely affected.
Existing or future laws and regulations relating to greenhouse gas emissions and climate change may adversely affect our business.
Climate change continues to attract considerable public and scientific attention. As a result, numerous laws, regulations, and proposals have been made and are likely to continue to be made at the international, national, regional, and state levels of government to monitor and limit emissions of carbon dioxide, methane, and other “greenhouse gases” (“GHGs”). These efforts have included cap-and-trade programs, carbon taxes, GHG reporting and tracking programs and regulations that directly limit GHG emissions from certain sources. Such existing or future laws, regulations, and proposals concerning the release of GHGs or that concern climate change (including laws, regulations, and proposals that seek to mitigate the effects of climate change) may adversely impact demand for the equipment, systems and services we design, market and sell. For example, oil and natural gas exploration and production may decline as a result of such laws, regulations, and proposals, and as a consequence, demand for our equipment, systems and services may also decline. In addition, such laws, regulations, and proposals may also result in more onerous obligations with respect to our operations, including the facilities where we manufacture our equipment and systems. Such decline in demand for our equipment, systems and services and such onerous
40
obligations in respect of our operations may adversely affect our financial condition, results of operations, or cash flows.
As an English public limited company, we must meet certain additional financial requirements before we may declare dividends or repurchase shares and certain capital structure decisions may require stockholder approval which may limit our flexibility to manage our capital structure. We may not be able to pay dividends or repurchase shares of our ordinary shares in accordance with our announced intent, or at all.
Under English law, we will only be able to declare dividends, make distributions, or repurchase shares (other than out of the proceeds of a new issuance of shares for that purpose) out of “distributable profits.” Distributable profits are a company’s accumulated, realized profits, to the extent that they have not been previously utilized by distribution or capitalization, less its accumulated, realized losses, to the extent that they have not been previously written off in a reduction or reorganization of capital duly made. In addition, as a public limited company incorporated in England and Wales, we may only make a distribution if the amount of our net assets is not less than the aggregate of our called-up share capital and non-distributable reserves and to the extent that the distribution does not reduce the amount of those assets to less than that aggregate.
Our articles of association permit us by ordinary resolution of the stockholders to declare dividends, provided that the directors have made a recommendation as to its amount. The dividend shall not exceed the amount recommended by the Board of Directors. The directors may also decide to pay interim dividends if it appears to them that the profits available for distribution justify the payment. When recommending or declaring payment of a dividend, the directors are required under English law to comply with their duties, including considering our future financial requirements.
In addition, the Board of Directors’ determinations regarding dividends and share repurchases will depend on a variety of other factors, including our net income, cash flow generated from operations or other sources, liquidity position, and potential alternative uses of cash, such as acquisitions, as well as economic conditions and expected future financial results. Our ability to declare and pay future dividends and make future share repurchases will depend on our future financial performance, which in turn depends on the successful implementation of our strategy and on financial, competitive, regulatory, technical, general economic conditions, demand and selling prices for our products and services, and other factors specific to our industry or specific projects, many of which are beyond our control. Therefore, our ability to generate cash depends on the performance of our operations and could be limited by decreases in our profitability or increases in costs, regulatory changes, capital expenditures, or debt servicing requirements.
Any failure to pay dividends or repurchase shares of our ordinary shares could negatively impact our reputation, harm investor confidence in us, and cause the market price of our ordinary shares to decline.
Uninsured claims and litigation against us, including intellectual property litigation, could adversely impact our financial condition, results of operations, or cash flows.
We could be impacted by the outcome of pending litigation, as well as unexpected litigation or proceedings. We have insurance coverage against operating hazards, including product liability claims and personal injury claims related to our products or operating environments in which our employees operate, to the extent deemed prudent by our management and to the extent insurance is available. However, our insurance policies are subject to exclusions, limitations, and other conditions and may not apply in all cases, for example where willful wrongdoing on our part is alleged. Additionally, the nature and amount of that insurance may not be sufficient to fully indemnify us against liabilities arising out of pending and future claims and litigation. Additionally, in individual circumstances, certain proceedings or cases may also lead to our formal or informal exclusion from tenders or the revocation or loss of business licenses or permits. Our financial condition, results of operations, or cash flows could be adversely affected by unexpected claims not covered by insurance.
In addition, the tools, techniques, methodologies, programs, and components we use to provide our services may infringe upon the intellectual property rights of others. Infringement claims generally result in significant legal and other costs. The resolution of these claims could require us to pay damages, enter into license agreements or develop alternative technologies. The development of these technologies or the payment of royalties under licenses from third parties, if available, would increase our costs. If a license were not available, or we are not able to
41
develop alternative technologies, we might not be able to continue providing a particular service or product, which could adversely affect our financial condition, results of operations, or cash flows.
We are subject to governmental regulation and other legal obligations related to privacy, data protection, and data security. Our actual or perceived failure to comply with such obligations could harm our business.
We are subject to international data protection laws, such as the General Data Protection Regulation, or GDPR, in the European Economic Area.Area, or EEA, and the United Kingdom (“UK”) GDPR and Data Protection Act 2018 in the UK. The GDPR imposesand implementing legislation in the EEA and UK impose several stringent requirements for controllers and processors of personal data which have increased our obligations, including, for example, by requiring more robust disclosures to individuals, notifications, in some cases, of data breaches to regulators and data subjects, and a record of processing and other policies and procedures to be maintained to adhere to the accountability principle. In addition, we are subject to the GDPR’s rules on transferring personal data outside of the EEA and UK (including to the United States), and somerecent legal developments in Europe have created complexity and uncertainty regarding such transfers. In addition, the UK’s withdrawal from the European Union may mean that in future we are required to find alternative solutions for the compliant transfer of these rules are currently being challenged inpersonal data into the courts. UK.
Failure to comply with the requirements of GDPR and the local laws implementing or supplementing the GDPR could result in fines of up to €20,000,000 or up to 4% of the total worldwide annual turnover of the preceding financial year, whichever is higher, as well as other administrative penalties. The UK GDPR mirrors the fines under the GDPR. In addition, a breach of the GDPR or UK GDPR could result in regulatory investigations and enforcement action, reputational damage, and civil claims including representative actions and other class action type litigation.
We are likely to be required to expend significant capital and other resources to ensure ongoing compliance with the GDPR and UK GDPR and other applicable data protection legislation, and we may be required to put in place additional control mechanisms which could be onerous and adversely affect our business, financial condition, results of operations, and prospects.or cash flows.
The IRS may not agree that we should be treated as a foreign corporation for U.S. federal tax purposes and may seek to impose an excise tax on gains recognized by certain individuals.
Although we are incorporated in the United Kingdom, the U.S. Internal Revenue Service (the “IRS”) may assert that we should be treated as a U.S. “domestic” corporation (and, therefore, a U.S. tax resident) for U.S. federal income tax purposes pursuant to Section 7874 of the U.S. Internal Revenue Code of 1986, as amended (the “Code”). For U.S. federal income tax purposes, a corporation (i) is generally considered a “domestic” corporation (or U.S. tax resident) if it is organized in the United States or of any state or political subdivision therein, and (ii) is generally considered a “foreign” corporation (or non-U.S. tax resident) if it is not considered a domestic corporation. Because we are a U.K. incorporated entity, we would be considered a foreign corporation (and, therefore, a non-U.S. tax resident) under these rules. Section 7874 of the Code (“Section 7874”) provides an exception under which a foreign incorporated entity may, in certain circumstances, be treated as a domestic corporation for U.S. federal income tax purposes.
We do not believe this exception applies. However, the Section 7874 rules are complex and subject to detailed regulations, the application of which is uncertain in various respects. It is possible that the IRS will not agree with our position. Should the IRS successfully challenge our position, it is also possible that an excise tax under Section 4985 of the Code (the “Section 4985 Excise Tax”) may be assessed against certain “disqualified individuals” (including former officers and directors of FMC Technologies, Inc.) on certain stock-based compensation held thereby. We may, if we determine that it is appropriate, provide disqualified individuals with a payment with respect to the Section 4985 Excise Tax, so that, on a net after-tax basis, they would be in the same position as if no such Section 4985 Excise Tax had been applied.
In addition, there can be no assurance that there will not be a change in law or interpretation, including with retroactive effect, that might cause us to be treated as a domestic corporation for U.S. federal income tax purposes.
U.S. tax laws and/or guidance could affect our ability to engage in certain acquisition strategies and certain internal restructurings.
Even if we are treated as a foreign corporation for U.S. federal income tax purposes, Section 7874, U.S. Treasury regulations, and other guidance promulgated thereunder may adversely affect our ability to engage in certain future
42
acquisitions of U.S. businesses or to restructure the non-U.S. members of our group. These limitations, if applicable, may affect the tax efficiencies that otherwise might be achieved in such potential future transactions or restructurings.
In addition, the IRS and the U.S. Treasury have issued final and temporary regulations providing that, even if we are treated as a foreign corporation for U.S. federal income tax purposes, certain intercompany debt instruments issued on or after April 4, 2016 will be treated as equity for U.S. federal income tax purposes, therefore limiting U.S. tax benefits and resulting in possible U.S. withholding taxes. Although recent guidance from the U.S. Treasury proposes deferringremoves certain documentation requirements that would otherwise be imposed with respect to covered debt instruments, announces an intention to further modify and possibly withdraw certain classification rules relating to covered debt instruments, and further indicates that these rules generally are the subject of continuing study and may be further materially modified, the current regulations may adversely affect our future effective tax rate and could also
impact our ability to engage in future restructurings if such transactions cause an existing intercompany debt instrument to be treated as reissued for U.S. federal income tax purposes.
We are subject to the tax laws of numerous jurisdictions; challenges to the interpretation of, or future changes to, such laws could adversely affect us.
We and our subsidiaries are subject to tax laws and regulations in the United Kingdom, the United States, France, and numerous other jurisdictions in which we and our subsidiaries operate. These laws and regulations are inherently complex, and we are, and will continue to be, obligated to make judgments and interpretations about the application of these laws and regulations to our operations and businesses. The interpretation and application of these laws and regulations could be challenged by the relevant governmental authorities, which could result in administrative or judicial procedures, actions, or sanctions, which could be material.
On December 22, 2017, the Tax Cuts and Jobs Act was signed into law in the United States, which made extensive changes to the U.S. taxation of multinational companies, and is subject to continuing regulatory and possible legislative changes, especially given the new Administration and Congress in the United States. In addition, the U.S. Congress, the U.K. Government, the European Union, the Organization for Economic Co-operation and Development (the “OECD”), and other government agencies in jurisdictions where we and our affiliates do business have had an extended focus on issues related to the taxation of multinational corporations. New tax initiatives, directives, and rules, such as the U.S. Tax Cuts and Jobs Act, the OECD’s Base Erosion and Profit Shifting initiative, and the European Union’s Anti-Tax Avoidance Directives, may increase our tax burden and require additional compliance-related expenditures. As a result, our financial condition, results of operations, or cash flows may be adversely affected. Further changes, including with retroactive effect, in the tax laws of the United States, the United Kingdom, the European Union, or other countries in which we and our affiliates do business could also adversely affect us.
We may not qualify for benefits under tax treaties entered into between the United Kingdom and other countries.
We operate in a manner such that we believe we are eligible for benefits under tax treaties between the United Kingdom and other countries. However, our ability to qualify for such benefits will depend on whether we are treated as a U.K. tax resident, the requirements contained in each treaty and applicable domestic laws, on the facts and circumstances surrounding our operations and management, and on the relevant interpretation of the tax authorities and courts. For example, because of the anticipated withdrawal of the United Kingdom from the European Union (“Brexit”),Brexit, we may lose some or all of the benefits of tax treaties between the United States and the remaining members of the European Union, and face higher tax liabilities, which may be significant. Another example is the Multilateral Convention to Implement Tax Treaty Related Measures to Prevent Base Erosion and Profit Shifting (the “MLI”), which entered into force for participating jurisdictions on July 1, 2018. The MLI recommends that countries adopt a “limitation-on-benefit” (“LOB”) rule and/or a “principle purposes“principal purpose test” (“PPT”) rule with regards to their tax treaties. The scope and interpretation of these rules as adopted pursuant to the MLI are presently under development, but the application of eitherthe LOB rule mightor the PPT rule could deny us tax treaty benefits (such as a reduced rate of withholding tax) that were previously available and as such there remains uncertainty as to whether and, if so, to what extent such treaty benefits will continue to be available. The position is likely to remain uncertain for a number of years.
The failure by us or our subsidiaries to qualify for benefits under tax treaties entered into between the United Kingdom and other countries could result in adverse tax consequences to us (including an increased tax burden and increased filing obligations) and could result in certain tax consequences of owning and disposing of our shares.
43
We intend to be treated exclusively as a resident of the United Kingdom for tax purposes, but French or other tax authorities may seek to treat us as a tax resident of another jurisdiction.
We are incorporated in the United Kingdom. English law currently provides that we will be regarded as a U.K. resident for tax purposes from incorporation and shall remain so unless (i) we are concurrently a resident in another jurisdiction (applying the tax residence rules of that jurisdiction) that has a double tax treaty with the United Kingdom and (ii) there is a tiebreaker provision in that tax treaty which allocates exclusive residence to that other jurisdiction.
In this regard, we have a permanent establishment in France to satisfy certain French tax requirements imposed by the French Tax Code with respect to the Merger. Although it is intended that we will be treated as having our exclusive place of tax residence in the United Kingdom, the French tax authorities may claim that we are a tax resident of France if we were to fail to maintain our “place of effective management” in the United Kingdom. Any such claim would be settled between the French and U.K. tax authorities pursuant to the mutual assistance procedure provided for by the tax treaty concluded between France and the United Kingdom. There is no assurance that these authorities would reach an agreement that we will remain exclusively a U.K. tax resident; aan adverse determination which could materially and adversely affect our business, financial condition, results of operations, and future prospects.or cash flows. A failure to maintain exclusive tax residency in the United Kingdom could result in adverse tax
consequences to us and our subsidiaries and could result in certain adverse changes in the tax consequences of owning and disposing of our shares.
Risks Related to the Spin-off and the Other Transactions
The Company has identified material weaknesses relatingSpin-off may subject us to internalfuture liabilities.
On February 16, 2021, we completed the Spin-off, resulting in Technip Energies, which holds our former Technip Energies business segment, becoming a stand-alone publicly traded corporation. Pursuant to agreements we entered into with Technip Energies in connection with the Spin-off, we and Technip Energies are each generally responsible for the obligations and liabilities related to our respective businesses. Pursuant to those agreements, we and Technip Energies each agreed to cross-indemnities principally designed to allocate financial responsibility for the obligations and liabilities of our business to us and those of Technip Energies’ business to it. However, third parties, including governmental agencies, could seek to hold us responsible for obligations and liabilities that Technip Energies agreed to retain or assume, and there can be no assurance that the indemnification from Technip Energies will be sufficient to protect us against the full amount of such obligations and liabilities, or that Technip Energies will be able to fully satisfy its indemnification obligations. Additionally, if a court were to determine that the Spin-off or related transactions were consummated with the actual intent to hinder, delay or defraud current or future creditors or resulted in Technip Energies receiving less than reasonably equivalent value when it was insolvent, or that it was rendered insolvent, inadequately capitalized or unable to pay its debts as they become due, then it is possible that the court could disregard the allocation of obligations and liabilities agreed to between us and Technip Energies, impose substantial obligations and liabilities on us and void some or all of the transactions related to the Spin-off. Any of the foregoing could adversely affect our results of operations and financial position.
The Spin-off may not achieve some or all of the anticipated benefits.
We may not realize some or all of the anticipated strategic, financial, operational or other benefits from the Spin-off. As independent publicly-traded companies, we and Technip Energies are smaller, less diversified companies with a narrower business focus, and may be more vulnerable to changing market conditions, which could materially adversely affect our and its results of operations, cash flows and financial position.
In addition, other events outside of our control, including, but not limited to, political climate, the severity and duration of the pandemic, and regulatory or legislative changes, could also adversely affect our ability to realize the anticipated benefits from the Spin-off. Any such difficulties could have an adverse effect on our business, financial condition, or results of operations, and cause the combined market value of us and Technip Energies after the Spin-off to fall short of the market value of our shares prior to the Spin-off.
We are a significant shareholder of Technip Energies and the value of our investment in Technip Energies may fluctuate substantially.
44
Following completion of the Spin-off, we own approximately 49.9% of the outstanding shares of common stock of Technip Energies. The value of our investment in Technip Energies may be adversely affected by negative changes in its results of operations, cash flows and financial position, which may occur as a result of the many risks attendant with operating in the onshore/offshore industry, including the effect of laws and regulations on the operation of Technip Energies’ business and the development of its assets, increased competition, loss of contract commitments, delays in the timing of or the failure to complete projects, lack of access to capital and operating risks and hazards. The value of our investment in Technip Energies may fluctuate substantially and may result in a significant impact to our results of operations.
We intend to significantly reduce our shareholding in Technip Energies over financial reporting. If our remedial measures are insufficientthe 18 months following the Spin-off, including in connection with the sale of Technip Energies shares to addressBPI (as defined herein) pursuant to the material weaknesses,Investment (as defined herein). However, we can offer no guarantee that we will be able to complete such disposition or, if onecompleted, the extent to which we will reduce our shareholding or more additional material weaknesses or significant deficienciesthe value that we will realize in connection with such disposition. The occurrence of any of these and other risks faced by Technip Energies could adversely affect the value of our internal control over financial reporting are discovered or occurinvestment in the future, our consolidated financial statementsTechnip Energies.
We may contain material misstatements and we could be required to further restate our financial results,refund the Purchase Price under the Share Purchase Agreement to BPI in the event that certain conditions thereunder are not met.
In connection with the Spin-off, we entered into the Share Purchase Agreement with BPI, pursuant to which BPI agreed to purchase from us for $200.0 million, subject to a purchase price adjustment as described below (the “Purchase Price”), a number of Technip Energies shares (the “Purchased Shares”) determined based upon a thirty day volume-weighted average price of Technip Energies’ shares, less a six percent discount (the “Investment”). Pursuant to the Share Purchase Agreement, BPI paid us the Purchase Price on February 25, 2021, however (i) if the number of Purchased Shares due from us to BPI is less than 11.82% of the number of Technip Energies shares outstanding immediately following completion of the Spin-off, then BPI may, upon written notice to us, terminate the Share Purchase Agreement and we will be required to refund the Purchase Price to BPI or (ii) if the number of Purchased Shares due from us to BPI exceeds 17.25% of the number of Technip Energies shares outstanding immediately following completion of the Spin-off (the “Cap”), then we will transfer to BPI an aggregate number of Technip Energies shares equal to the Cap and will pay to BPI, as a reduction of the Purchase Price, an amount equal to (x) the difference between the number of Technip Energies shares that we would have delivered to BPI but for the Cap and the number of Technip Energies shares that we actually delivered to BPI, multiplied by (y) the applicable price per Technip Energy share. Any such refund or reduction of the Purchase Price could have a material adverse effect on our financial condition resultsor cash flows.
General Risk Factors
Our businesses are dependent on the continuing services of our key managers and employees.
We depend on key personnel. The loss of any key personnel could adversely impact our business if we are unable to implement key strategies or transactions in their absence. The loss of qualified employees or failure to retain and motivate additional highly-skilled employees required for the operation and expansion of our business could hinder our ability to successfully conduct research activities and develop marketable products and services.
Seasonal and weather conditions could adversely affect demand for our services and operations.
Our business may be materially affected by variation from normal weather patterns, such as cooler or warmer summers and winters. Adverse weather conditions, such as hurricanes in the Gulf of Mexico or extreme winter conditions in Canada, Russia, and the North Sea, may interrupt or curtail our operations, or our customers’ operations, cause supply disruptions or loss of productivity, and may result in a loss of revenue or damage to our equipment and facilities, which may or may not be insured. Increasing concentrations of greenhouse gases in the Earth’s atmosphere may produce climate changes that increase variation from normal weather patterns, such as increased frequency and severity of storms, floods, droughts, and other climatic events, which could further impact our operations. Significant physical effects of climate change could also have a direct effect on our operations and cash flows.
45
Currency exchange rate fluctuations could be required to restate our financial results, which could have a material adverse effect onadversely affect our financial condition, results of operations, or cash flows.
We conduct operations around the world in many different currencies. Because a significant portion of our revenue is denominated in currencies other than our reporting currency, the U.S. dollar, changes in exchange rates will produce fluctuations in our revenue, costs, and cash flows, restrictearnings, and may also affect the book value of our abilityassets and liabilities and related equity. We hedge transaction impacts on margins and earnings where a transaction is not in the functional currency of the business unit, but we do not hedge translation impacts on earnings. Our efforts to accessminimize our currency exposure through such hedging transactions may not be successful depending on market and business conditions. Moreover, certain currencies in which we conduct operations, specifically currencies in countries such as Angola and Nigeria, do not actively trade in the capitalglobal foreign exchange markets require significant resources to correct the weaknesses or deficiencies,and may subject us to fines, penaltiesincreased foreign currency exposures. As a result, fluctuations in foreign currency exchange rates may adversely affect our financial condition, results of operations, or judgments, harmcash flows.
We are exposed to risks in connection with our reputationdefined benefit pension plan commitments.
We have funded and unfunded defined benefit pension plans, which provide defined benefits based on years of service and salary. We are required to recognize the funded status of defined benefit post-retirement plans as an asset or otherwise cause a decline in investor confidence andliability in the consolidated balance sheet and recognize changes in that funded status in comprehensive income in the year in which the changes occur. Further, we are required to measure each plan’s assets and its obligations that determine its funded status as of the date of the consolidated balance sheet. Each
defined benefit pension plan’s assets are invested in different asset classes and their value may fluctuate in accordance with market priceconditions. Any deterioration in the value of the defined benefit pension plan assets could therefore increase our stock.
In addition, applicable law and/or implement required new or improved controls, or any difficulties we encounter in their implementation, could result in additional significant deficiencies or material weaknesses, causethe terms of the relevant defined benefit pension plan may require us to failmake cash contributions or provide financial support upon the occurrence of certain events. We cannot predict whether, or to meetwhat extent, changing market or economic conditions, regulatory changes or other factors will further increase our periodic reporting obligationspension expense or result in material misstatements infunding obligations. For further information regarding our financial statements. Any such failure could also adversely affect the results of periodic management evaluations and annual auditor attestation reports regarding the effectiveness of our internal control over financial reporting required under Section 404 of the U.S. Sarbanes-Oxley Act of 2002 and the rules promulgated under Section 404. The existence of a material weakness could result in errors in our financial statements that could result in a restatement of financial statements, cause us to fail to meet our reporting obligations and cause investors to lose confidence in our reported financial information, leading to, among other things, a decline in our stock price.pension liabilities, see Note 22 for further information.
ITEM 1B. UNRESOLVED STAFF COMMENTS
None.
46
ITEM 2. PROPERTIES
Our corporate headquarters is in London, England. We also maintain corporate offices in Houston, Texas and Paris, France, where significant worldwide global support activity occurs. In addition, we own or lease numerous properties throughout the world.
We believe our properties and facilities are suitable for their present and intended purposes and are operating at a level consistent with the requirements of the industry in which we operate. We also believe that our leases are at competitive or market rates and do not anticipate any difficulty in leasing suitable additional space upon expiration of our current lease terms.
The following table shows our principal properties by reporting segment atas of December 31, 2018:
2020:
| Location | Segment | |||||||
| Africa | ||||||||
| Dande, Angola | Subsea | |||||||
| Hassi-Messaoud, Algeria | Surface | |||||||
| Lagos, Nigeria | Subsea | |||||||
| Lobito, Angola | Subsea | |||||||
| Luanda, Angola | Subsea | |||||||
| Malabo, Equatorial | Subsea | |||||||
| Port Harcourt, Nigeria | Subsea | |||||||
| Takoradi, Ghana | Subsea | |||||||
| Asia | ||||||||
| Chennai, India | Technip Energies | |||||||
| Dahej, India | Technip Energies | |||||||
| Hyderabad, India | Surface | |||||||
| Jakarta, Indonesia | Surface | |||||||
| Johor, Malaysia | Subsea | |||||||
| Kuala Lumpur, Malaysia | Subsea, | |||||||
| New Delhi, India | ||||||||
| Noida, India | Subsea, | |||||||
| Nusajaya, Malaysia | Subsea, Surface | |||||||
| Singapore | Subsea, Surface | |||||||
| Australia | ||||||||
| Henderson, Australia | Subsea | |||||||
| Perth, Australia | Subsea, | |||||||
| Europe | ||||||||
| Aberdeen, United Kingdom | Subsea, Surface | |||||||
| Aktau, Kazakhstan | ||||||||
| Arnhem, The Netherlands | Surface | |||||||
| Atyrau, Kazakhstan | Surface | |||||||
| Barcelona, Spain | ||||||||
| Bergen, Norway | Subsea | |||||||
| Compiegne, France | ||||||||
| Courbevoie (Paris - La Défense), France | Subsea, | |||||||
| Dunfermline, United Kingdom | Subsea, Surface | |||||||
| Surface | ||||||||
| Evanton, United Kingdom | Subsea | |||||||
| Horten, Norway | Subsea | |||||||
| Kongsberg, Norway | Subsea, Surface | |||||||
| Krakow, Poland | Subsea | |||||||
| La Garenne-Colombes, France | Technip Energies | |||||||
| Le Trait, France | Subsea, Surface | |||||||
| Lisbon, Portugal | Subsea | |||||||
47
| London, United Kingdom | Subsea, | |||||||
| Lyon, France | Technip Energies | |||||||
| Lysaker, Norway | Subsea, Technip Energies | |||||||
| Moscow, Russia | Subsea, Surface, Technip Energies | |||||||
| Newcastle, United Kingdom | ||||||||
| Subsea | ||||||||
| Orkanger, Norway | Subsea | |||||||
| Rome, Italy | ||||||||
| Sens, France | Surface, Technip Energies | |||||||
| St. Petersburg, Russia | Technip Energies | |||||||
| Stavanger, Norway | Subsea, Surface | |||||||
| Veenord, Netherlands | Surface | |||||||
| Zoetermeer, Netherlands | ||||||||
| Middle East | ||||||||
| Abu Dhabi, United Arab Emirates | ||||||||
| Al-Khobar, Saudi Arabia | Technip Energies | |||||||
| Dammam, Saudi Arabia | Surface | |||||||
| Doha, Qatar | Technip Energies | |||||||
| North America | ||||||||
| Brighton (Colorado), United States | Surface | |||||||
| Calgary (Alberta), Canada | ||||||||
| Surface | ||||||||
| Davis (California), United States | Subsea | |||||||
| Erie (Pennsylvania), United States | Surface | |||||||
| Houston (Texas), United States | Subsea, | |||||||
| Odessa (Texas), United States | Surface | |||||||
| Oklahoma City (Oklahoma), United States | Surface | |||||||
| San Antonio (Texas), United States | Surface | |||||||
| Surface | ||||||||
| St. John’s (Newfoundland), Canada | Subsea | |||||||
| Stephenville (Texas), United States | Surface | |||||||
| Theodore (Alabama), United States | Subsea | |||||||
| South America | ||||||||
| Bogota, Colombia | ||||||||
| Macaé, Brazil | Subsea | |||||||
| Neuquén, Argentina | Surface | |||||||
| Rio de Janeiro, Brazil | Subsea, Surface | |||||||
| São João da Barra, Brazil | Subsea | |||||||
| Surface | ||||||||
48
The following table shows marine vessels in which we held an interest or operated as of December 31, 2018:2020:
| Vessel Name | Vessel Type | Special Equipment | ||||||||||||
| Deep Blue | PLSV | Reeled pipelay/flexible pipelay/umbilical systems | ||||||||||||
| Deep Energy | PLSV | Reeled pipelay/flexible pipelay/umbilical systems | ||||||||||||
| Apache II | PLSV | Reeled pipelay/umbilical systems | ||||||||||||
Global 1200(a) | PLSV/HCV | Conventional pipelay/Heavy handling operations | ||||||||||||
| Deep Orient | HCV | Construction/installation systems | ||||||||||||
North Sea Atlantic | HCV | Construction/installation systems | ||||||||||||
Skandi Africa | HCV | Construction/installation systems | ||||||||||||
| Deep Arctic | DSV/HCV | Diver support systems | ||||||||||||
| Deep | DSV/HCV | Diver support systems | ||||||||||||
| Deep Explorer | DSV/HCV | Diver support systems | ||||||||||||
| Skandi Vitória | PLSV | Flexible pipelay/umbilical systems | ||||||||||||
| Skandi Niterói | PLSV | Flexible pipelay/umbilical systems | ||||||||||||
| Coral do Atlantico | PLSV | Flexible pipelay/umbilical systems | ||||||||||||
| PLSV | Flexible pipelay/umbilical systems | |||||||||||||
| Skandi Açu | PLSV | Flexible pipelay/umbilical systems | ||||||||||||
| Skandi Búzios | PLSV | Flexible pipelay/umbilical systems | ||||||||||||
Skandi Olinda | PLSV | Flexible pipelay/umbilical systems | ||||||||||||
| Skandi Recife | PLSV | Flexible pipelay/umbilical systems | ||||||||||||
(a) At December 31, 2020, this vessel is held for sale.
(b) Vessels under long term charter.
PLSV: Pipelay Support Vessel
HCV: Heavy Duty Construction Vessel
DSV: Diving Support Vessel
49
PART II
ITEM 3. LEGAL PROCEEDINGS5. MARKET FOR REGISTRANT’S COMMON EQUITY, RELATED STOCKHOLDER MATTERS AND ISSUER PURCHASES OF EQUITY SECURITIES
For information about dividends, see Note 17 “Stockholders’ Equity” to the Consolidated Financial Statements in Item 8.
As of February 25, 2021, according to data provided by our transfer agent, there were 101 shareholders of record. However, many of our shareholders hold their shares in "street name" by a nominee of Depository Trust Company, which is a single shareholder class action filedof record. We estimate that there were approximately 20,500 shareholders whose shares were held in “street name” by banks, brokers, or other financial institutions at February 25, 2021.
We had no unregistered sales of equity securities during the year ended December 31, 2020.
Issuer Purchases of Equity Securities
Period | Total Number of Shares Purchased | Average Price Paid per Share | Total Number of Shares Purchased as Part of Publicly Announced Plans or Programs | Maximum Number of Shares That May Yet Be Purchased Under the Plans or Programs (a) | |||||||||||||||||||
| October 1, 2020 – October 31, 2020 | — | $ | — | — | 14,286,427 | ||||||||||||||||||
| November 1, 2020 – November 30, 2020 | — | $ | — | — | 14,286,427 | ||||||||||||||||||
| December 1, 2020 – December 31, 2020 | — | $ | — | — | 14,286,427 | ||||||||||||||||||
| Total | — | — | 14,286,427 | ||||||||||||||||||||
(a)In December 2018, our Board of Directors authorized an extension of our share repurchase program for $300 million for the purchase of ordinary shares. As of December 31, 2020, $207.8 million remained authorized under the share repurchase program.
50
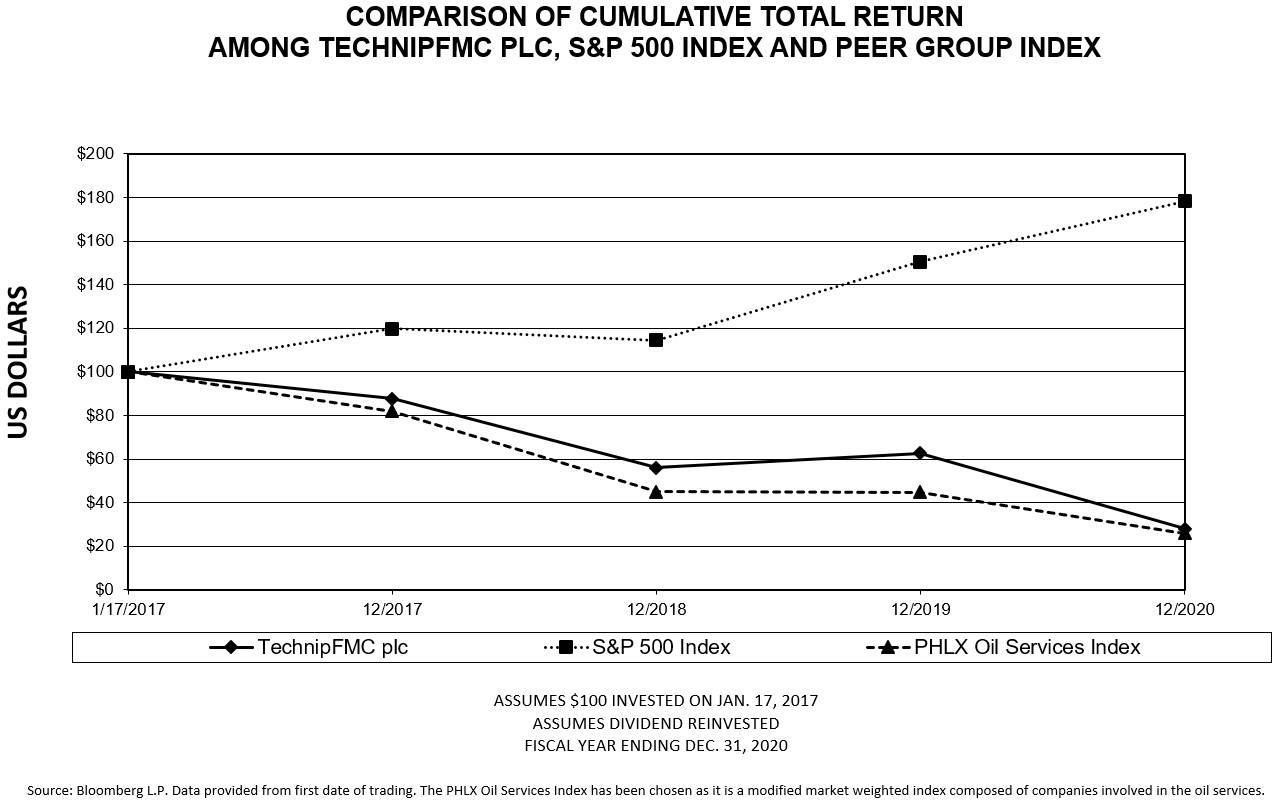
Performance Graph
The graph below compares the cumulative total shareholder return on our ordinary shares for the period from January 17, 2017 to December 31, 2020 with the Standard & Poor’s 500 Index (“S&P 500 Index”) and PHLX Oil Services Index. The comparison assumes $100 was invested, including reinvestment of dividends, if any, in our ordinary shares on January 17, 2017 and amended in January 2018 and captioned Prause v. TechnipFMC, et al., No. 4:17-cv-02368 (S.D. Texas) is pendingboth of the indexes on the same date. The results shown in the U.S. District Court for the Southern Districtgraph below are not necessarily indicative of Texas against the Company and certain current and former officers and employees of the Company. The suit alleged violations of the federal securities laws in connection with the Company's restatement of our first quarter 2017 financial results and a material weakness in our internal control over financial reporting announced on July 24, 2017. On January 18, 2019, the District Court dismissed claims under Section 10(b) and 20(a) of the Securities Exchange Act of 1934, as amended, and Section 15 of the Securities Act of 1933, as amended (“Securities Act”). A remaining claim for alleged violation of Section 11 of the Securities Act in connection with the reporting of certain financial results in the Company’s Form S-4 Registration Statement filed in 2016 is pending and seeks unspecified damages. The Company is vigorously contesting the litigation and cannot predict its duration or outcome.future performance.
| December 31 | |||||||||||||||||||||||
| 2017 | 2018 | 2019 | 2020 | ||||||||||||||||||||
| TechnipFMC plc | $ | 87.76 | $ | 55.89 | $ | 62.63 | $ | 28.03 | |||||||||||||||
| S&P 500 Index | 119.82 | 114.56 | 150.62 | 178.32 | |||||||||||||||||||
| PHLX Oil Services Index | 82.00 | 44.93 | 44.68 | 25.88 | |||||||||||||||||||
51
ITEM 4. MINE SAFETY DISCLOSURES6. SELECTED FINANCIAL DATA
| Year Ended December 31, | |||||||||||||||||||||||||||||||||||
| (In millions, except per share data) | 2020 | 2019 | 2018 | 2017 | 2016 | ||||||||||||||||||||||||||||||
| Statement of income data | |||||||||||||||||||||||||||||||||||
| Total revenue | $ | 13,050.6 | $ | 13,409.1 | $ | 12,552.9 | $ | 15,056.9 | $ | 9,199.6 | |||||||||||||||||||||||||
| Total costs and expenses | $ | 15,936.2 | $ | 14,935.8 | $ | 13,470.5 | $ | 14,091.7 | $ | 8,743.6 | |||||||||||||||||||||||||
| Net income (loss) | $ | (3,237.9) | $ | (2,412.1) | $ | (1,910.8) | $ | 134.2 | $ | 371.1 | |||||||||||||||||||||||||
| Net income (loss) attributable to TechnipFMC plc | $ | (3,287.6) | $ | (2,415.2) | $ | (1,921.6) | $ | 113.3 | $ | 393.3 | |||||||||||||||||||||||||
| Earnings (loss) per share from continuing operations attributable to TechnipFMC plc | |||||||||||||||||||||||||||||||||||
| Basic earnings (loss) per share | $ | (7.33) | $ | (5.39) | $ | (4.20) | $ | 0.24 | $ | 3.29 | |||||||||||||||||||||||||
| Diluted earnings (loss) per share | $ | (7.33) | $ | (5.39) | $ | (4.20) | $ | 0.24 | $ | 3.16 | |||||||||||||||||||||||||
| As of December 31, | |||||||||||||||||||||||||||||
| (In millions) | 2020 | 2019 | 2018 | 2017 | 2016 | ||||||||||||||||||||||||
| Balance sheet data | |||||||||||||||||||||||||||||
| Total assets | $ | 19,692.6 | $ | 23,518.8 | $ | 24,784.5 | $ | 28,263.7 | $ | 18,679.3 | |||||||||||||||||||
| Long-term debt, less current portion | $ | 3,317.7 | $ | 3,980.0 | $ | 4,124.3 | $ | 3,777.9 | $ | 1,869.3 | |||||||||||||||||||
| Total TechnipFMC plc stockholders’ equity | $ | 4,154.2 | $ | 7,659.3 | $ | 10,357.6 | $ | 13,345.9 | $ | 5,013.8 | |||||||||||||||||||
| Year Ended December 31, | ||||||||||||||||||||||||||||||||
| (In millions) | 2020 | 2019 | 2018 | 2017 | 2016 | |||||||||||||||||||||||||||
| Other financial information | ||||||||||||||||||||||||||||||||
| Capital expenditures | $ | 291.8 | $ | 454.4 | $ | 368.1 | $ | 255.7 | $ | 312.9 | ||||||||||||||||||||||
| Cash flows provided (required) by operating activities | $ | 656.9 | $ | 848.5 | $ | (185.4) | $ | 210.7 | $ | 493.8 | ||||||||||||||||||||||
| Net cash | $ | 853.9 | $ | 714.8 | $ | 1,348.3 | $ | 2,882.4 | $ | 3,716.4 | ||||||||||||||||||||||
| Order backlog | $ | 21,388.2 | $ | 24,251.1 | $ | 14,560.0 | $ | 12,982.8 | $ | 15,002.0 | ||||||||||||||||||||||
The results of our operations for the “FTI” symbol. Prioryear ended December 31, 2020 include goodwill and long-lived asset impairment charges of $3,083.4 million and $204.0 million, respectively. The results of our operations for the year ended December 31, 2019 include goodwill and long-lived asset impairment charges of $1,988.7 million and $495.4 million, respectively. The results of our operations for the year ended December 31, 2018 include goodwill and vessels impairment charges of $1,383.0 million and $372.9 million, respectively, and a legal provision of $280.0 million. See Notes 19 and 20 to our consolidated financial statements for further details.
The results of our operations for the year ended December 31, 2017 consist of the combined results of operations of Technip and FMC Technologies. Due to the Merger, FMC Technologies common stockTechnologies’ results of operations have been included in our financial statements for periods subsequent to the consummation of the Merger on January 16, 2017 and as a result, data presented for the year December 31, 2017 is not comparable to actual results presented in prior periods. Technip was quotedthe accounting acquirer, therefore results for the years ended December 31, 2016 represent Technip only.
Net cash consists of cash and cash equivalents less short-term debt, long-term debt and the current portion of long-term debt. Net cash is a non-GAAP measure that management uses to evaluate our capital structure and financial leverage. See “Liquidity and Capital Resources” in Part II, Item 7 of this Annual Report on Form 10-K for additional discussion and reconciliations of net cash.
Order backlog is calculated as the estimated sales value of unfilled, confirmed customer orders at the reporting date.
52
ITEM 7. MANAGEMENT’S DISCUSSION AND ANALYSIS OF FINANCIAL CONDITION AND RESULTS OF OPERATIONS
EXECUTIVE OVERVIEW
We are a global leader in energy projects, technologies, systems and services. We have manufacturing operations worldwide, strategically located to facilitate efficient delivery of these products, technologies, systems and services to our customers. We report our results of operations in the following segments: Subsea, Technip Energies and Surface Technologies. Management’s determination of our reporting segments was made on the NYSEbasis of our strategic priorities and corresponds to the manner in which our Chief Executive Officer reviews and evaluates operating performance to make decisions about resource allocations to each segment.
A description of our products and services and annual financial data for each segment can be found in Part I, Item 1, “Business” and Note 7 to our consolidated financial statements.
We focus on economic- and industry-specific drivers and key risk factors affecting our business segments as we formulate our strategic plans and make decisions related to allocating capital and human resources. The results of our segments are primarily driven by changes in capital spending by oil and gas companies, which largely depend upon current and anticipated future crude oil and natural gas demand, production volumes, and consequently, commodity prices. We use crude oil and natural gas prices as an indicator of demand. Additionally, we use both onshore and offshore rig count as an indicator of demand, which consequently influences the level of worldwide production activity and spending decisions. We also focus on key risk factors when determining our overall strategy and making decisions for capital allocation. These factors include risks associated with the global economic outlook, product obsolescence and the competitive environment. We address these risks in our business strategies, which incorporate continuing development of leading edge technologies and cultivating strong customer relationships.
Our Subsea segment is affected by changes in commodity prices and trends in deepwater oil and natural gas production. Our Technip Energies segment is impacted by change in commodity prices, population growth and demand for natural gas, although the onshore market is typically more resilient to these changes impacting the segment. Our Subsea and Technip Energies segments both benefit from the current market fundamentals supporting the demand for new liquefied natural gas facilities. Technip Energies also benefits from the construction of petrochemical and fertilizer plants.
Our Surface Technologies segment is primarily affected by changes in commodity prices and trends in land-based and shallow water oil and natural gas production. We have developed close working relationships with our customers. Our results reflect our ability to build long-term alliances with oil and natural gas companies and to provide solutions for their needs in a timely and cost-effective manner. We believe that by closely working with our customers, we enhance our competitive advantage, improve our operating results and strengthen our market positions.
As we evaluate our operating results, we consider business segment performance indicators like segment revenue, operating profit and capital employed, in addition to the level of inbound orders and order backlog. A significant proportion of our revenue is recognized under the FTI symbolpercentage of completion method of accounting. Cash receipts from such arrangements typically occur at milestones achieved under stated contract terms. Consequently, the timing of revenue recognition is not always correlated with the timing of customer payments. We aim to structure our contracts to receive advance payments that we typically use to fund engineering efforts and inventory purchases. Working capital (excluding cash) and net cash are therefore key performance indicators of cash flows.
In each of our segments, we serve customers from around the world. During 2020, approximately 84 percent of our total sales were recognized outside of the United States. We evaluate international markets and pursue opportunities that fit our technological capabilities and strategies.
The Spin-off
On February 16, 2021, we completed the separation of the Technip Energies business segment. The transaction was structured as a Spin-off, which occurred by way of a Distribution to our shareholders of 50.1 percent of the outstanding shares in Technip Energies N.V. Each of our shareholders received one ordinary share of Technip Energies N.V. for every five ordinary shares were listed on Euronext Paris. FMC Technologies common stock and Technip ordinary shares were suspended from tradingof TechnipFMC held at 5:00 p.m., New York City time on the NYSErecord date, February 17, 2021. Technip Energies N.V. is now an independent public company and its shares trade under the ticker symbol “TE” on the Euronext Paris respectively,stock exchange.
53
In connection with the Spin-off, on January 7, 2021, BPI, which has been one of our substantial shareholders since 2009, entered into a Share Purchase Agreement with us pursuant to which BPI agreed to purchase a portion of our retained stake in Technip Energies N.V. for $200.0 million. On February 25, 2021, BPI paid $200.0 million in connection with the Share Purchase Agreement. The Purchase Price is subject to adjustment, and BPI’s ownership stake will be determined based upon a thirty day volume-weighted average price of Technip Energies N.V.’ shares (with BPI’s ownership collared between an 11.82 percentage floor and a 17.25 percentage cap), less a six percent discount. The BPI Investment is subject to customary conditions and regulatory approval. We intend to significantly reduce our shareholding in Technip Energies N.V. over the 18 months following the Spin-off, including in connection with the sale of shares to BPI pursuant to the BPI Investment.
Beginning in the first quarter of 2021, Technip Energies’ historical financial results for periods prior to the openDistribution will be reflected in our consolidated financial statements as discontinued operations.
BUSINESS OUTLOOK
Overall outlook – While economic activity continues to be impacted by the COVID-19 pandemic, the short-term outlook for crude oil has improved as the OPEC+ countries better manage the oversupplied market. Long-term demand for energy is still forecast to rise, and we believe this outlook will ultimately provide our customers with the confidence to increase investments in new sources of tradingoil and natural gas production.
Subsequent to the Spin-off, we will operate under two reporting segments: Subsea and Surface Technologies, therefore the discussion below relates to these two reporting segments only.
Subsea – The volatile, and generally low crude oil price environment of the last several years led many of our customers to reduce their capital spending plans and defer new deepwater projects. Order activity in 2020 was particularly impacted by the sharp decline in commodity prices, driven in part by the reduced economic activity, and the general uncertainty related to the pandemic. The reduction and deferral of new projects resulted in delayed subsea project inbound for the industry.
The trajectory and pace of further recovery and expansion in the subsea market is subject to more stringent capital discipline and the allocation of capital our clients dedicate to developing offshore oil and gas fields amongst their entire portfolio of projects. The risk of project sanctioning delays still exists in the current environment; however, innovative approaches to subsea projects, like our iEPCI solution, have improved project economics, and many offshore discoveries can be developed economically at today’s crude oil prices. In the long-term, deepwater development is expected to remain a significant part of many of our customers’ portfolios.
As the subsea industry continues to evolve, we have taken actions to further streamline our organization, achieve standardization, and reduce cycle times. The rationalization of our global footprint will also further leverage the benefits of our integrated offering. We aim to continuously align our operations with activity levels, while preserving our core capacity in order to deliver current projects in backlog and future order activity.
We have experienced renewed operator confidence in advancing subsea activity as a result of the improved economic outlook, lower market volatility and higher oil price. With crude now trending back above $50 per barrel, the opportunity set of large subsea projects to be sanctioned over the next 24 months has expanded.
FEED activity is also improving, with solid momentum experienced in the second half of 2020. FEED activity in the current year is expected to return to the more robust levels seen in 2019, which further supports our view of a sustainable recovery for deepwater. We expect at least 60% of the projects undergoing studies in 2021 to include an iEPCI solution, many of which could be directly awarded to our Company upon reaching final investment decision.
TechnipFMC is increasingly less dependent on January 17, 2017.larger, publicly tendered projects.
•We anticipate that an increasing share of our inbound orders will result from projects that will be direct awarded to our Company, many of which come from our alliance partners;
•We anticipate higher activity in subsea services, with the industry’s largest installed base; and
54
•We expect a higher mix of iEPCI project awards, demonstrating strong geographic diversity and new adopters of our unique, integrated approach to subsea development.
For information about dividends,2021, we believe that Subsea inbound orders will meet or exceed the $4 billion achieved in 2020. We expect Brazil to be the most active region of the world for new project orders, driven by continued investment in the pre-salt field discoveries. We see Item 6 “Selected Financial Data”additional market growth potential coming from the North Sea, Asia Pacific and Note 15 “Stockholders’ Equity”Africa. The strong front end activity we are experiencing today should further support project award momentum into 2022.
Surface Technologies – Surface Technologies’ performance is typically driven by variations in global drilling activity, creating a dynamic environment. Operating results can be further impacted by stimulation activity and the completions intensity of shale applications in the Americas.
The North America shale market is sensitive to oil price fluctuations. The average rig count declined by just over 50 percent in 2020, with drilling and completion spending estimated to have declined by a similar amount. North America activity improved over the second half of the year as the rig count increased following the rising oil price. The rig count exited 2020 below prior year-end levels but has experienced further improvement in the current year.
In 2021, we expect our completions-related revenue to outperform the overall market, driven by increased market adoption of iComplete – our fully integrated, digitally-enabled pressure control system. iComplete has already achieved significant market penetration since its introduction in the third quarter of 2020, with 10 customers utilizing the new integrated system.
Despite the sequential improvement in market activity, full year revenue for North America is expected to be flat to down modestly versus 2020.
Drilling activity in international markets is less cyclical than North America as most activity is driven by national oil companies, which tend to maintain a longer term view that exhibits less variability in capital spend. Additionally, we continue to benefit from our exposure to the ConsolidatedMiddle East and Asia Pacific, both of which are being supported by strength in gas-related activity. The average rig count in these two regions declined by a more modest 17 percent in 2020 versus the prior year.
International revenue has been gaining significance in our total segment revenue, representing over 60 percent in 2020. We expect a gradual and steady recovery in well count in 2021 to drive modest international market growth, with spending increases led by national oil companies, particularly in the Middle East.
Our unique capabilities in the international markets, which demand higher specification equipment, global services and local content, provide a platform for us to extend our leadership positions. We remain levered to these more resilient markets where we expect to source approximately 65% of our full year revenue in 2021.
55
CONSOLIDATED RESULTS OF OPERATIONS
This section of this Form 10-K generally discusses 2020 and 2019 items and year-to-year comparisons between 2020 and 2019. Discussions of 2018 items and year-to-year comparisons between 2019 and 2018 that are not included in this Form 10-K can be found in “Management’s Discussion and Analysis of Financial StatementsCondition and Results of Operations” in Part II, Item 7 of our Annual Report on Form 10-K for the year ended December 31, 2019.
| Year Ended December 31, | Change | ||||||||||||||||||||||||||||||||||||||||
| (In millions, except percentages) | 2020 | 2019 | 2018 | 2020 vs. 2019 | 2019 vs. 2018 | ||||||||||||||||||||||||||||||||||||
| Revenue | $ | 13,050.6 | $ | 13,409.1 | $ | 12,552.9 | $ | (358.5) | (2.7) | % | $ | 856.2 | 6.8 | % | |||||||||||||||||||||||||||
| Costs and expenses | |||||||||||||||||||||||||||||||||||||||||
| Cost of sales | 11,209.4 | 10,950.7 | 10,273.0 | 258.7 | 2.4 | % | 677.7 | 6.6 | % | ||||||||||||||||||||||||||||||||
| Selling, general and administrative expense | 1,066.2 | 1,228.1 | 1,140.6 | (161.9) | (13.2) | % | 87.5 | 7.7 | % | ||||||||||||||||||||||||||||||||
| Research and development expense | 119.8 | 162.9 | 189.2 | (43.1) | (26.5) | % | (26.3) | (13.9) | % | ||||||||||||||||||||||||||||||||
| Impairment, restructuring and other expense | 3,501.3 | 2,490.8 | 1,831.2 | 1,010.5 | 40.6 | % | 659.6 | 36.0 | % | ||||||||||||||||||||||||||||||||
| Separation costs | 39.5 | 72.1 | — | (32.6) | (45.2) | % | 72.1 | n/a | |||||||||||||||||||||||||||||||||
| Merger transaction and integration costs | — | 31.2 | 36.5 | (31.2) | (100.0) | % | (5.3) | (14.5) | % | ||||||||||||||||||||||||||||||||
| Total costs and expenses | 15,936.2 | 14,935.8 | 13,470.5 | 1,000.4 | 6.7 | % | 1,465.3 | 10.9 | % | ||||||||||||||||||||||||||||||||
| Other income (expense), net | 31.1 | (220.7) | (323.9) | 251.8 | 114.1 | % | 103.2 | 31.9 | % | ||||||||||||||||||||||||||||||||
| Income from equity affiliates | 63.0 | 62.9 | 114.3 | 0.1 | 0.2 | % | (51.4) | (45.0) | % | ||||||||||||||||||||||||||||||||
| Net interest expense | (293.0) | (451.3) | (360.9) | 158.3 | 35.1 | % | (90.4) | (25.0) | % | ||||||||||||||||||||||||||||||||
| Loss before income taxes | (3,084.5) | (2,135.8) | (1,488.1) | (948.7) | (44.4) | % | (647.7) | (43.5) | % | ||||||||||||||||||||||||||||||||
| Provision for income taxes | 153.4 | 276.3 | 422.7 | (122.9) | (44.5) | % | (146.4) | (34.6) | % | ||||||||||||||||||||||||||||||||
| Net loss | (3,237.9) | (2,412.1) | (1,910.8) | (825.8) | (34.2) | % | (501.3) | (26.2) | % | ||||||||||||||||||||||||||||||||
| Net profit attributable to non-controlling interests | (49.7) | (3.1) | (10.8) | (46.6) | (1,503.2) | % | 7.7 | 71.3 | % | ||||||||||||||||||||||||||||||||
| Net loss attributable to TechnipFMC plc | $ | (3,287.6) | $ | (2,415.2) | $ | (1,921.6) | $ | (872.4) | (36.1) | % | $ | (493.6) | (25.7) | % | |||||||||||||||||||||||||||
Results of Operations in 2020 Compared to 2019
Revenue
Revenue decreased by $358.5 million in 2020 compared to 2019. Subsea revenue decreased year-over-year primarily due to decreased project activity in the Gulf of Mexico and the North Sea. Increased revenue in Technip Energies was primarily driven by the continued ramp-up of Arctic LNG 2, increased activity on downstream projects and in the Process Technology business, which more than offset the decline in revenue from Yamal LNG. Technip Energies revenue was also favorably impacted by the result of a litigation settlement. Surface Technologies revenue decreased, primarily as a result of the significant decline in operator activity in North America, with partial positive impact from order intake timing in international markets. In addition, our consolidated revenues were negatively impacted by operational challenges associated with the COVID-19 related disruptions.
Gross Profit
Gross profit (revenue less cost of sales) as a percentage of sales decreased to 14.1% in 2020 compared to 18.3% in 2019. Subsea gross profit decreased due to a more competitively priced backlog and the negative operational impacts related to COVID-19. Gross profit declined in Technip Energies due in large part to a reduced contribution from Yamal LNG as the project reached physical completion last year and is progressing through the warranty phase. Surface Technologies gross profit was negatively impacted by the year-over-year decline in North American drilling and completions activity, which was partially offset by the lower costs from our accelerated cost reduction initiative implemented during 2020.
56
Selling, General and Administrative Expense
Selling, general and administrative expense decreased by $161.9 million year-over-year, primarily as a result of decreased corporate expenses. During the beginning of 2020, in response to the deteriorated market environment, driven in part by the COVID-19 pandemic, we implemented a series of cost reduction initiatives that resulted in significant savings and extended to all business segments and support functions.
Impairment, Restructuring and Other Expenses
We incurred $3,501.3 million of restructuring, impairment and other expenses in 2020. These charges primarily included $3,083.4 million of goodwill impairment, $204.0 million of long-lived assets impairment, $101.8 million of COVID-19 related expenses, and $112.1 million for restructuring and severance expenses. COVID-19 related expenses represent unplanned, one-off, incremental and non-recoverable costs incurred solely as a result of the COVID-19 pandemic situation, which would not have been incurred otherwise. COVID-19 related expenses primarily included (a) employee payroll and travel, operational disruptions associated with quarantining, personnel travel restrictions to job sites, and shutdown of manufacturing plants and sites; (b) supply chain and related expediting costs of accelerated shipments for previously ordered and undelivered products; (c) costs associated with implementing additional information technology to support remote working environments; and (d) facilities-related expenses to ensure safe working environments. COVID-19 related expenses exclude costs associated with project and/or operational inefficiencies, time delays in performance delivery, indirect costs increases and potentially reimbursable or recoverable expenses. During 2019, we incurred $2,490.8 million of restructuring, impairment and other expenses, which included $1,988.7 million and $495.4 million of goodwill and long-lived assets impairments, respectively. See Note 19 to our consolidated financial statements for further details.
Separation costs
During the year ended December 31, 2020, we incurred $39.5 million of separation costs associated with the preparation of the separation transaction. During the first quarter of 2020, we incurred $27.1 million of separation costs associated with the separation transaction, which was postponed due to the COVID-19 pandemic, the significant decline in commodity prices, and the heightened volatility in global equity markets. During the fourth quarter of 2020, we incurred $12.4 million of separation costs associated with the January 2021 announcement of the resumption of activities toward the separation of Technip Energies. During the year ended December 31, 2019, we incurred $72.1 million of separation costs associated with the separation transaction. See Note 3 to our consolidated financial statements for further details.
Merger Transaction and Integration Costs
Prior to the initial announcement of the planned separation transaction in August 2019, we incurred merger transaction and integration costs of $31.2 million during the first half of 2019 relating to the continuation of the integration activities following the Merger. No such costs were incurred subsequently in 2019 or in 2020.
Other Income (Expense), Net
Other income (expense), net, primarily reflects foreign currency gains and losses, including gains and losses associated with the remeasurement of net cash positions, gains and losses on sales of property, plant and equipment and other non-operating gains and losses. During 2020, we recognized $31.1 million of other income, which primarily included $23.1 million of gains on sales of property, plant and equipment and other assets. During 2019, we recognized $220.7 million of other expenses, which primarily included $146.9 million of net foreign exchange losses and $54.6 million of legal provision, net of settlements. The change in foreign exchange losses is primarily due to a reduction in foreign exchange losses from unhedged currencies, more favorable hedging costs, and the effects of a weakened U.S. dollar on naturally hedged projects.
Net Interest Expense
Net interest expense decreased $158.3 million in 2020 compared to 2019, primarily due to the change in the fair value of the redeemable financial liability. We revalued the mandatorily redeemable financial liability to reflect current expectations about the obligation and recognized a charge of $202.0 million, as compared to $423.1 million recognized in 2019. See Note 24 to our consolidated financial statements for further details. Net interest expense, excluding the fair value measurement of the mandatorily redeemable financial liability and including interest income decreased by $62.8 million during 2020.
57
Provision for Income Taxes
Our provision for income taxes for 2020 and 2019 reflected effective tax rates of (5.0)% and (12.9)%, respectively. The year-over-year change in the effective tax rate was primarily due to the impact of nondeductible goodwill impairments, increase in adjustment on prior year taxes, offset in part by the amount of tax expense associated with movements in valuation allowances.
Our effective tax rate can fluctuate depending on our country mix of earnings, which may change based on changes in the jurisdictions in which we operate.
OPERATING RESULTS OF BUSINESS SEGMENTS
Segment operating profit is defined as total segment revenue less segment operating expenses. Certain items have been excluded in computing segment operating profit and are included in corporate items. See Note 7 to our consolidated financial statements for further details.
We report our results of operations in U.S. dollars; however, our earnings are generated in various currencies worldwide. In order to provide worldwide consolidated results, the earnings of subsidiaries functioning in their local currencies are translated into U.S. dollars based upon the average exchange rate during the period. While the U.S. dollar results reported reflect the actual economics of the period reported upon, the variances from prior periods include the impact of translating earnings at different rates.
Subsea
| Year Ended December 31, | Favorable/(Unfavorable) | ||||||||||||||||||||||||||||||||||||||||
| (In millions, except %) | 2020 | 2019 | 2018 | 2020 vs. 2019 | 2019 vs. 2018 | ||||||||||||||||||||||||||||||||||||
| Revenue | $ | 5,471.4 | $ | 5,523.0 | $ | 4,840.0 | $ | (51.6) | (0.9) | % | $ | 683.0 | 14.1 | % | |||||||||||||||||||||||||||
| Operating loss | $ | (2,815.5) | $ | (1,447.7) | $ | (1,529.5) | $ | (1,367.8) | (94.5) | % | $ | 81.8 | 5.3 | % | |||||||||||||||||||||||||||
| Operating loss as a percentage of revenue | (51.5) | % | (26.2) | % | (31.6) | % | (25.3) | pts. | 5.4 | pts. | |||||||||||||||||||||||||||||||
Subsea revenue decreased $51.6 million, or (0.9)% year-over-year, primarily due to operational challenges driven by the COVID-19 pandemic. However, despite these challenges and related disruptions, we continued to demonstrate strong execution of our backlog.
Subsea operating loss is primarily due to significant impairment and other non-recurring charges. The operating loss included $2,957.5 million of goodwill and long-lived assets impairments, restructuring and other charges and COVID-19 related expenses compared to $1,752.2 million in 2019. Non-recurring charges incurred related to COVID-19 disruptions during 2020 were $50.1 million. See Note 19 to our consolidated financial statements for further details.
Refer to ‘Non-GAAP Measures’ for more information regarding our segment operating results.
Technip Energies
| Year Ended December 31, | Favorable/(Unfavorable) | ||||||||||||||||||||||||||||||||||||||||
| (In millions, except %) | 2020 | 2019 | 2018 | 2020 vs. 2019 | 2019 vs. 2018 | ||||||||||||||||||||||||||||||||||||
| Revenue | $ | 6,520.0 | $ | 6,268.8 | $ | 6,120.7 | $ | 251.2 | 4.0 | % | $ | 148.1 | 2.4 | % | |||||||||||||||||||||||||||
| Operating profit | $ | 683.6 | $ | 959.6 | $ | 824.0 | $ | (276.0) | (28.8) | % | $ | 135.6 | 16.5 | % | |||||||||||||||||||||||||||
| Operating profit as a percentage of revenue | 10.5 | % | 15.3 | % | 13.5 | % | (4.8) | pts. | 1.8 | pts. | |||||||||||||||||||||||||||||||
Technip Energies revenue increased $251.2 million year-over-year. Revenue benefited from the continued ramp-up of Arctic LNG 2 and higher activity on downstream projects in Africa, North America and India, which more than offset the decline in revenue from Yamal LNG. COVID-19 related operational efficiencies and business disruption also impeded revenue growth during 2020. Revenue during the period benefited from a $113.2 million litigation settlement.
58
Operating profit decreased year-over-year, primarily due to a reduced contribution from Yamal LNG and lower margin realization on early stage projects, including Arctic LNG 2. Project execution remained strong across the portfolio. Non-recurring charges incurred related to COVID-19 disruptions during the period were $44.0 million.
Refer to ‘Non-GAAP Measures’ for more information regarding our segment operating results. Subsequent to the Spin-off, we operate under two reporting segments: Subsea and Surface Technologies, for further details see Note 3 to our consolidated financial statements.
Surface Technologies
| Year Ended December 31, | Favorable/(Unfavorable) | ||||||||||||||||||||||||||||||||||||||||
| (In millions, except %) | 2020 | 2019 | 2018 | 2020 vs. 2019 | 2019 vs. 2018 | ||||||||||||||||||||||||||||||||||||
| Revenue | $ | 1,059.2 | $ | 1,617.3 | $ | 1,592.2 | $ | (558.1) | (34.5)% | $ | 25.1 | 1.6 | % | ||||||||||||||||||||||||||||
| Operating profit (loss) | $ | (429.3) | $ | (656.1) | $ | 172.8 | $ | 226.8 | 34.6% | $ | (828.9) | (479.7) | % | ||||||||||||||||||||||||||||
| Operating profit (loss) as a percentage of revenue | (40.5) | % | (40.6) | % | 10.9 | % | 0.1 | pts. | (51.5) | pts. | |||||||||||||||||||||||||||||||
Surface Technologies revenue decreased $558.1 million, or (34.5)% year-over-year, primarily driven by the significant reduction in operator activity in North America. Revenue outside of North America displayed resilience, with a more modest decline due to reduced activity levels. Nearly 64% of total segment revenue was generated outside of North America in the period.
Surface Technologies operating loss was primarily due to impairment and other non-recurring charges. The operating loss included $440.2 million of goodwill and long-lived assets impairments, restructuring and other charges and COVID-19 related expenses compared to $704.2 million incurred in 2019. Operating loss was also negatively impacted by the reduced demand in North America driven by the significant decline in rig count and completions-related activity, which was partially offset by lower costs from our accelerated cost reduction actions initiated in the first quarter of 2020. Non-recurring charges incurred related to COVID-19 disruptions during the period were $7.7 million. See Note 19 to our consolidated financial statements for further details.
Refer to ‘Non-GAAP Measures’ for more information regarding our segment operating results.
Corporate Items
| Year Ended December 31, | Favorable/(Unfavorable) | ||||||||||||||||||||||||||||||||||||||||
| (In millions, except %) | 2020 | 2019 | 2018 | 2020 vs. 2019 | 2019 vs. 2018 | ||||||||||||||||||||||||||||||||||||
| Corporate expense | $ | (201.5) | $ | (393.4) | $ | (478.0) | $ | 191.9 | 49% | $ | 84.6 | 18% | |||||||||||||||||||||||||||||
Corporate expenses decreased by $191.9 million during 2020. The reduction in corporate expenses is primarily due to $54.6 million decrease in legal provision, net of settlements; $38.6 million decrease due to lower activity and the impact of cost reductions implemented in 2020; $32.7 million decrease in separation costs; $31.2 million decrease in integration expenses and $16.6 million decrease in restructuring and impairment expenses.
Refer to ‘Non-GAAP Measures’ for more information regarding our segment operating results.
59
NON-GAAP MEASURES
In addition to financial results determined in accordance with U.S. generally accepted accounting principles (“GAAP”), we provide non-GAAP financial measures (as defined in Item 8.10 of Regulation S-K of the Securities Exchange Act of 1934, as amended) below:
–Net income (loss), excluding charges and credits, as well as measures derived from it (excluding charges and credits;
–Income (loss) before net interest expense and income taxes, excluding charges and credits (“Adjusted Operating profit”);
–Adjusted diluted earnings per share attributable to TechnipFMC plc;
–Depreciation and amortization, excluding charges and credits (“Adjusted Depreciation and amortization”);
–Earnings before net interest expense, income taxes, depreciation and amortization, excluding charges and credits (“Adjusted EBITDA”);
–Corporate expenses excluding charges and credits;
–Net cash; and
–Free cash flow.
Management believes that the exclusion of charges and credits from these financial measures enables investors and management to more effectively evaluate our operations and consolidated results of operations period-over-period, and to identify operating trends that could otherwise be masked or misleading to both investors and management by the excluded items. These measures are also used by management as performance measures in determining certain incentive compensation. The foregoing non-GAAP financial measures should be considered in addition to, not as a substitute for or superior to, other measures of financial performance prepared in accordance with GAAP.
The following is a reconciliation of the most comparable financial measures under GAAP to the non-GAAP financial measures.
60
| Year Ended | |||||||||||||||||||||||||||||||||||||||||
| December 31, 2020 | |||||||||||||||||||||||||||||||||||||||||
| Net income (loss) attributable to TechnipFMC plc | Net income (loss) attributable to non-controlling interests | Provision for income taxes | Net interest expense | Income (loss) before net interest expense and income taxes (Operating profit) | Depreciation and amortization | Earnings before net interest expense, income taxes, depreciation and amortization (EBITDA) | |||||||||||||||||||||||||||||||||||
| TechnipFMC plc, as reported | $ | (3,287.6) | $ | 49.7 | $ | 153.4 | $ | 293.0 | $ | (2,791.5) | $ | 447.2 | $ | (2,344.3) | |||||||||||||||||||||||||||
| Charges and (credits): | |||||||||||||||||||||||||||||||||||||||||
| Impairment and other charges | 3,271.0 | — | 16.4 | — | 3,287.4 | — | 3,287.4 | ||||||||||||||||||||||||||||||||||
| Restructuring and other charges | 96.1 | — | 16.0 | — | 112.1 | — | 112.1 | ||||||||||||||||||||||||||||||||||
| Direct COVID-19 expenses | 83.7 | — | 18.1 | — | 101.8 | — | 101.8 | ||||||||||||||||||||||||||||||||||
| Litigation settlement | (113.2) | — | — | — | (113.2) | — | (113.2) | ||||||||||||||||||||||||||||||||||
| Separation costs | 36.3 | — | 3.2 | — | 39.5 | — | 39.5 | ||||||||||||||||||||||||||||||||||
| Purchase price accounting adjustment | 6.5 | — | 2.0 | — | 8.5 | (8.5) | — | ||||||||||||||||||||||||||||||||||
| Valuation allowance | (3.5) | — | 3.5 | — | — | — | — | ||||||||||||||||||||||||||||||||||
| Adjusted financial measures | $ | 89.3 | $ | 49.7 | $ | 212.6 | $ | 293.0 | $ | 644.6 | $ | 438.7 | $ | 1,083.3 | |||||||||||||||||||||||||||
| Diluted earnings (loss) per share attributable to TechnipFMC plc, as reported | $ | (7.33) | |||||||||||||||||||||||||||||||||||||||
| Adjusted diluted earnings per share attributable to TechnipFMC plc | $ | 0.20 | |||||||||||||||||||||||||||||||||||||||
| Year Ended | |||||||||||||||||||||||||||||||||||||||||
| December 31, 2019 | |||||||||||||||||||||||||||||||||||||||||
| Net income (loss) attributable to TechnipFMC plc | Net income (loss) attributable to non-controlling interests | Provision for income taxes | Net interest expense | Income (loss) before net interest expense and income taxes (Operating profit) | Depreciation and amortization | Earnings before net interest expense, income taxes, depreciation and amortization (EBITDA) | |||||||||||||||||||||||||||||||||||
| TechnipFMC plc, as reported | $ | (2,415.2) | $ | (3.1) | $ | 276.3 | $ | (451.3) | $ | (1,684.5) | $ | 509.6 | $ | (1,174.9) | |||||||||||||||||||||||||||
| Charges and (credits): | |||||||||||||||||||||||||||||||||||||||||
| Impairment and other charges | 2,364.2 | — | 119.9 | — | 2,484.1 | — | 2,484.1 | ||||||||||||||||||||||||||||||||||
| Restructuring and other charges | 27.7 | — | 9.3 | — | 37.0 | — | 37.0 | ||||||||||||||||||||||||||||||||||
| Business combination transaction and integration costs | 23.1 | — | 8.1 | — | 31.2 | — | 31.2 | ||||||||||||||||||||||||||||||||||
| Separation costs | 54.2 | — | 17.9 | — | 72.1 | — | 72.1 | ||||||||||||||||||||||||||||||||||
| Reorganization | 17.2 | — | 8.1 | — | 25.3 | — | 25.3 | ||||||||||||||||||||||||||||||||||
| Legal provision, net | 46.3 | — | 8.3 | — | 54.6 | — | 54.6 | ||||||||||||||||||||||||||||||||||
| Purchase price accounting adjustment | 26.0 | — | 8.0 | — | 34.0 | (34.0) | — | ||||||||||||||||||||||||||||||||||
| Valuation allowance | 187.0 | — | (187.0) | — | — | — | — | ||||||||||||||||||||||||||||||||||
| Adjusted financial measures | $ | 330.5 | $ | 3.1 | $ | 268.9 | $ | 451.3 | $ | 1,053.8 | $ | 475.6 | $ | 1,529.4 | |||||||||||||||||||||||||||
| Diluted earnings per share attributable to TechnipFMC plc, as reported | $ | (5.39) | |||||||||||||||||||||||||||||||||||||||
| Adjusted diluted earnings per share attributable to TechnipFMC plc | $ | 0.74 | |||||||||||||||||||||||||||||||||||||||
61
| Year Ended | |||||||||||||||||||||||||||||||||||
| December 31, 2020 | |||||||||||||||||||||||||||||||||||
| Subsea | Technip Energies | Surface Technologies | Corporate Expense | Foreign Exchange, net | Total | ||||||||||||||||||||||||||||||
| Revenue | $ | 5,471.4 | $ | 6,520.0 | $ | 1,059.2 | $ | — | $ | — | $ | 13,050.6 | |||||||||||||||||||||||
| Operating profit (loss), as reported (pre-tax) | $ | (2,815.5) | $ | 683.6 | $ | (429.3) | $ | (201.5) | $ | (28.8) | $ | (2,791.5) | |||||||||||||||||||||||
| Charges and (credits): | |||||||||||||||||||||||||||||||||||
| Impairment and other charges | 2,854.5 | 10.3 | 419.3 | 3.3 | — | 3,287.4 | |||||||||||||||||||||||||||||
| Restructuring and other charges* | 52.9 | 39.3 | 13.2 | 6.7 | — | 112.1 | |||||||||||||||||||||||||||||
| Direct COVID-19 expenses | 50.1 | 44.0 | 7.7 | — | — | 101.8 | |||||||||||||||||||||||||||||
| Litigation settlement | — | (113.2) | — | — | — | (113.2) | |||||||||||||||||||||||||||||
| Separation costs | — | — | — | 39.5 | — | 39.5 | |||||||||||||||||||||||||||||
| Purchase price accounting adjustments | 8.5 | — | — | — | — | 8.5 | |||||||||||||||||||||||||||||
| Subtotal | 2,966.0 | (19.6) | 440.2 | 49.5 | — | 3,436.1 | |||||||||||||||||||||||||||||
| Adjusted Operating profit (loss) | 150.5 | 664.0 | 10.9 | (152.0) | (28.8) | 644.6 | |||||||||||||||||||||||||||||
| Adjusted Depreciation and amortization | 316.4 | 34.2 | 70.1 | 18.0 | — | 438.7 | |||||||||||||||||||||||||||||
| Adjusted EBITDA | $ | 466.9 | $ | 698.2 | $ | 81.0 | $ | (134.0) | $ | (28.8) | $ | 1,083.3 | |||||||||||||||||||||||
| Operating profit margin | (51.5) | % | 10.5 | % | (40.5) | % | (21.4) | % | |||||||||||||||||||||||||||
| Adjusted Operating profit margin | 2.8 | % | 10.2 | % | 1.0 | % | 4.9 | % | |||||||||||||||||||||||||||
| Adjusted EBITDA margin | 8.5 | % | 10.7 | % | 7.6 | % | 8.3 | % | |||||||||||||||||||||||||||
*On December 30, 2019, we completed the acquisition of the remaining 50% of Technip Odebrecht PLSV CV. A $7.3 million gain was recorded within restructuring and other charges in the Subsea segment during 2020.
62
| Year Ended | |||||||||||||||||||||||||||||||||||
| December 31, 2019 | |||||||||||||||||||||||||||||||||||
| Subsea | Technip Energies | Surface Technologies | Corporate Expense | Foreign Exchange, net | Total | ||||||||||||||||||||||||||||||
| Revenue | $ | 5,523.0 | $ | 6,268.8 | $ | 1,617.3 | $ | — | $ | — | $ | 13,409.1 | |||||||||||||||||||||||
| Operating profit (loss), as reported (pre-tax) | $ | (1,447.7) | $ | 959.6 | $ | (656.1) | $ | (393.4) | $ | (146.9) | $ | (1,684.5) | |||||||||||||||||||||||
| Charges and (credits): | |||||||||||||||||||||||||||||||||||
| Impairment and other charges* | 1,798.6 | — | 685.5 | — | — | 2,484.1 | |||||||||||||||||||||||||||||
| Restructuring and other charges* | (46.4) | 17.0 | 39.8 | 26.6 | — | 37.0 | |||||||||||||||||||||||||||||
| Business combination transaction and integration costs | — | — | — | 31.2 | — | 31.2 | |||||||||||||||||||||||||||||
| Separation costs | — | — | — | 72.1 | — | 72.1 | |||||||||||||||||||||||||||||
| Reorganization | — | 25.3 | — | — | — | 25.3 | |||||||||||||||||||||||||||||
| Legal provision, net | — | — | — | 54.6 | — | 54.6 | |||||||||||||||||||||||||||||
| Purchase price accounting adjustments | 34.0 | — | — | — | — | 34.0 | |||||||||||||||||||||||||||||
| Subtotal | 1,786.2 | 42.3 | 725.3 | 184.5 | — | 2,738.3 | |||||||||||||||||||||||||||||
| Adjusted Operating profit (loss) | 338.5 | 1,001.9 | 69.2 | (208.9) | (146.9) | 1,053.8 | |||||||||||||||||||||||||||||
| Adjusted Depreciation and amortization | 311.6 | 38.7 | 107.9 | 17.4 | — | 475.6 | |||||||||||||||||||||||||||||
| Adjusted EBITDA | $ | 650.1 | $ | 1,040.6 | $ | 177.1 | $ | (191.5) | $ | (146.9) | $ | 1,529.4 | |||||||||||||||||||||||
| Operating profit margin | (26.2) | % | 15.3 | % | (40.6) | % | (12.6) | % | |||||||||||||||||||||||||||
| Adjusted Operating profit margin | 6.1 | % | 16.0 | % | 4.3 | % | 7.9 | % | |||||||||||||||||||||||||||
| Adjusted EBITDA margin | 11.8 | % | 16.6 | % | 11.0 | % | 11.4 | % | |||||||||||||||||||||||||||
*On December 30, 2019, we completed the acquisition of the remaining 50 percent of Technip Odebrecht PLSV CV, which resulted in a net loss of $0.9 million that was recorded in the Subsea segment. The net loss was comprised of an impairment charge of $84.2 million included within impairment and other charges and a gain on bargain purchase of $83.3 million included within restructuring and other charges.
63
INBOUND ORDERS AND ORDER BACKLOG
Inbound orders - Inbound orders represent the estimated sales value of confirmed customer orders received during the reporting period. The significant decline in commodity prices, due in part to the lower demand resulting from COVID-19 contributed to the decrease in the inbound orders during 2020.
| Inbound Orders Year Ended December 31, | |||||||||||
| (In millions) | 2020 | 2019 | |||||||||
| Subsea | $ | 4,003.0 | $ | 7,992.6 | |||||||
| Technip Energies | 5,001.3 | 13,080.5 | |||||||||
| Surface Technologies | 1,061.2 | 1,619.9 | |||||||||
| Total inbound orders | $ | 10,065.5 | $ | 22,693.0 | |||||||
Order backlog - Order backlog is calculated as the estimated sales value of unfilled, confirmed customer orders at the reporting date. Backlog reflects the current expectations for the timing of project execution. The scheduling of some future work included in our order backlog has been impacted by COVID-19 related disruptions and remains subject to future adjustment. See Note 6 to our consolidated financial statements for further details.
| Order Backlog December 31, | |||||||||||
| (In millions) | 2020 | 2019 | |||||||||
| Subsea | $ | 6,876.0 | $ | 8,479.8 | |||||||
| Technip Energies | 14,098.7 | 15,298.1 | |||||||||
| Surface Technologies | 413.5 | 473.2 | |||||||||
| Total order backlog | $ | 21,388.2 | $ | 24,251.1 | |||||||
Subsea - Order backlog for Subsea as of December 31, 2020, decreased by $1.6 billion from December 31, 2019. Subsea backlog of $6.9 billion as of December 31, 2020, was composed of various subsea projects, including Total Mozambique LNG; Eni Coral and Merakes; Petrobras Mero I and Mero II; Energean Karish; ExxonMobil Payara; Reliance MJ-1; Equinor Johan Sverdrup Phase 2; Husky West White Rose; BP Platina; Chevron Gorgon Stage 2; and Woodside Pyxis and Lambert Deep.
Technip Energies - Technip Energies order backlog as of December 31, 2020, decreased by $1.2 billion compared to December 31, 2019. Technip Energies backlog of $14.1 billion as of December 31, 2020 was composed of various projects, including Arctic LNG 2, Yamal LNG; Midor refinery expansion; BP Tortue FPSO; Long Son Petrochemicals; ExxonMobil Beaumont refinery expansion; HURL fertilizer plants; Petronas Kasawari; Energean Karish; Neste bio-diesel expansion; and Motor Oil Hellas New Naphtha Complex. Subsequent to the Spin-off, we will operate under two reporting segments: Subsea and Surface Technologies, for further details see Note 3 to our consolidated financial statements.
Surface Technologies - Order backlog for Surface Technologies as of December 31, 2020, decreased by $59.7 million compared to December 31, 2019, mainly driven by the transfer of the Loading Systems business unit from Surface Technologies to Technip Energies. Given the short-cycle nature of the business, most orders are quickly converted into sales revenue; longer contracts are typically converted within twelve months.
Non-consolidated backlog - Non-consolidated backlog reflects the proportional share of backlog related to joint ventures that is not consolidated due to our minority ownership position.
| Non-consolidated order backlog | |||||
| (In millions) | December 31, 2020 | ||||
| Subsea | $ | 640.2 | |||
| Technip Energies | 1,890.3 | ||||
| Total order backlog | $ | 2,530.5 | |||
64
LIQUIDITY AND CAPITAL RESOURCES
Most of our cash is managed centrally and flows through centralized bank accounts controlled and maintained by TechnipFMC globally and in many operating jurisdictions to best meet the liquidity needs of our global operations.
Net Cash - Net cash, is a non-GAAP financial measure reflecting cash and cash equivalents, net of debt. Management uses this non-GAAP financial measure to evaluate our capital structure and financial leverage. We believe net cash is a meaningful financial measure that may assist investors in understanding our financial condition and recognizing underlying trends in our capital structure. Net cash should not be considered an alternative to, or more meaningful than, cash and cash equivalents as determined in accordance with GAAP or as an indicator of our operating performance or liquidity.
The following table provides a reconciliation of our cash and cash equivalents to net cash, utilizing details of classifications from our consolidated balance sheets.
| (In millions) | December 31, 2020 | December 31, 2019 | |||||||||
| Cash and cash equivalents | $ | 4,807.8 | $ | 5,190.2 | |||||||
| Short-term debt and current portion of long-term debt | (636.2) | (495.4) | |||||||||
| Long-term debt, less current portion | (3,317.7) | (3,980.0) | |||||||||
| Net cash | $ | 853.9 | $ | 714.8 | |||||||
Cash Flows
Cash flows for the years ended December 31, 2020, 2019 and 2018 were as follows:
| Year Ended December 31, | |||||||||||||||||
| (In millions) | 2020 | 2019 | 2018 | ||||||||||||||
| Cash provided (required) by operating activities | $ | 656.9 | $ | 848.5 | $ | (185.4) | |||||||||||
| Cash required by investing activities | (180.6) | (419.8) | (460.2) | ||||||||||||||
| Cash required by financing activities | (1,082.2) | (784.4) | (444.8) | ||||||||||||||
| Effect of exchange rate changes on cash and cash equivalents | 223.5 | 5.9 | (107.0) | ||||||||||||||
| Decrease in cash and cash equivalents | $ | (382.4) | $ | (349.8) | $ | (1,197.4) | |||||||||||
| Working capital | $ | 54.0 | $ | (82.2) | $ | (759.0) | |||||||||||
| Free cash flow | $ | 365.1 | $ | 394.1 | $ | (553.5) | |||||||||||
Operating cash flows - During 2020, we generated $656.9 million in cash flows from operating activities as compared to $848.5 million generated in 2019, resulting in a $191.6 million decrease compared to 2019. The decrease in operating cash flows is primarily driven by the decrease in cash generated by our operations during the year due to the overall decline in activity.
Investing cash flows - Investing activities used $180.6 million and $419.8 million of cash in 2020 and 2019, respectively. The decrease in cash used by investing activities was due primarily to decreased capital expenditures, decreased payments to acquire debt securities and increased proceeds from sale of assets and debt securities during 2020. In 2019, we purchased a deepwater dive support vessel, Deep Discoverer for $116.8 million, that was subsequently funded through a sale-leaseback transaction.
Financing cash flows - Financing activities used $1,082.2 million and $784.4 million in 2020 and 2019, respectively. The increase of $297.8 million in cash required for financing activities was due primarily to the increased debt pay down activity during 2020 of $883.6 million, partially offset by $338.6 million reduction in settlements of mandatorily redeemable financial liability and our efforts and commitment to preserve cash, which included reduction in cash dividends of $173.6 million and reduction in share repurchases of $92.7 million .
Working capital represents total changes in operating current assets and liabilities.
65
Free cash flow is defined as operating cash flows less capital expenditures. The following table reconciles cash provided by operating activities, which is directly comparable financial measure determined in accordance with GAAP, to free cash flow (non-GAAP measure).
| Year Ended December 31, | |||||||||||||||||
| (In millions) | 2020 | 2019 | 2018 | ||||||||||||||
| Cash provided (required) by operating activities | $ | 656.9 | $ | 848.5 | $ | (185.4) | |||||||||||
| Capital expenditures | (291.8) | (454.4) | (368.1) | ||||||||||||||
| Free cash flow | $ | 365.1 | $ | 394.1 | $ | (553.5) | |||||||||||
Debt and Liquidity
Significant Funding and Liquidity Activities - During 2020, we completed the following transactions in order to enhance our total liquidity position:
•Repaid $233.9 million of 5.00% 2010 private placement notes;
•Repaid the remaining outstanding balance of $190.0 million of the term loan assumed in connection with the acquisition of the remaining 50% interest in TOP CV.
•Issued €200 million aggregate principal amount of 4.500% Private Placement Notes due June 30, 2025. Within three months of the effective date of the Spin-off of Technip Energies, if there is a downgrade by a nationally recognized rating agency of the corporate rating of TechnipFMC from an investment grade to a non-investment grade rating or a withdrawal of any such rating, the interest rate applicable to the Private Placement Notes will be increased to 5.75%;
•Entered into a new, six-month €500 million senior unsecured revolving credit facility agreement, which may be extended for two additional three-month periods (the “Euro Facility”); and
•Entered into the Bank of England’s COVID Corporate Financing Facility program (the “CCFF Program”), which allows us to issue up to £600 million of unsecured commercial paper notes.
Total borrowings as of December 31, 2020 and 2019 were as follows:
| (In millions) | December 31, | ||||||||||
| 2020 | 2019 | ||||||||||
| Commercial paper | $ | 1,525.9 | $ | 1,967.0 | |||||||
| Synthetic bonds due 2021 | 551.2 | 492.9 | |||||||||
| 3.45% Senior Notes due 2022 | 500.0 | 500.0 | |||||||||
| 5.00% Notes due 2020 | — | 224.6 | |||||||||
| 3.40% Notes due 2022 | 184.0 | 168.5 | |||||||||
| 3.15% Notes due 2023 | 159.5 | 146.0 | |||||||||
| 3.15% Notes due 2023 | 153.4 | 140.4 | |||||||||
| 4.50% Notes due 2025 | 245.4 | — | |||||||||
| 4.00% Notes due 2027 | 92.0 | 84.2 | |||||||||
| 4.00% Notes due 2032 | 122.7 | 112.3 | |||||||||
| 3.75% Notes due 2033 | 122.7 | 112.3 | |||||||||
| Bank borrowings and Other | 309.9 | 536.3 | |||||||||
| Unamortized debt issuance costs and discounts | (12.8) | (9.1) | |||||||||
| Total borrowings | $ | 3,953.9 | $ | 4,475.4 | |||||||
66
Credit Facilities - The following is a summary of our credit facilities as of December 31, 2020:
(In millions) Description | Amount | Debt Outstanding | Commercial Paper Outstanding (a) | Letters of Credit | Unused Capacity | Maturity | |||||||||||||||||||||||||||||
| Revolving credit facility | $ | 2,500.0 | $ | — | $ | 708.0 | $ | — | $ | 1,792.0 | January 2023 | ||||||||||||||||||||||||
| CCFF Program | £ | 600.0 | £ | — | £ | 600.0 | £ | — | £ | — | March 2021 | ||||||||||||||||||||||||
| Euro Facility | € | 500.0 | € | — | € | — | € | — | € | 500.0 | February 2021 | ||||||||||||||||||||||||
| Bilateral credit facility | € | 100.0 | € | — | € | — | € | — | € | 100.0 | May 2021 | ||||||||||||||||||||||||
(a)Under our commercial paper program, we have the ability to access up to $1.5 billion and €1.0 billion of financing through our commercial paper dealers. Our available capacity under our revolving credit facility is reduced by any outstanding commercial paper.
Committed credit available under our revolving credit facilities provides the ability to issue our commercial paper obligations on a long-term basis. We had $708.0 million of commercial paper issued under our facilities as of December 31, 2020. In addition, we had $817.9 million of Notes outstanding under the CCFF Program. When we have both the ability and intent to refinance certain obligations on a long-term basis, the obligations are classified as long-term, as such, the commercial paper borrowings were classified as long-term debt in our consolidated balance sheet as of December 31, 2020.
On June 12, 2020, we entered into Amendment No. 1 to the Facility Agreement and into an Amendment and Restatement Agreement to our Euro Facility. The amendments, which are effective through the respective expirations of the Facility Agreement and Euro Facility, permit us to include the gross book value of $3.2 billion of goodwill (fully impaired in the quarter ended March 31, 2020) in the calculation of consolidated net worth, which is used in the calculation of our quarterly compliance with the total capitalization ratio under the Facility Agreement and Euro Facility.
The amended and restated Facility Agreement and Euro Facility contain usual and customary covenants, representations and warranties, and events of default for credit facilities of this type, including financial covenants requiring that our total capitalization ratio not exceed 60% at the end of any financial quarter. The Facility Agreement and Euro Facility also contain covenants restricting our ability and our subsidiaries’ ability to incur additional liens and indebtedness, enter into asset sales, or make certain investments.
As of December 31, 2020, we were in compliance with all restrictive covenants under our credit facilities.
Refer to Note 24 to our consolidated financial statements included in Part II, Item 8 of this Annual Report on Form 10-K for further information related to credit risk.
Credit Ratings - As of February 25, 2021, our credit ratings with Standard and Poor’s (S&P) are BB+ for our long-term secured debt and B for commercial paper program. Our credit ratings with Moody’s are Ba1 for our long-term secured debt.
Credit Risk Analysis
For the purposes of mitigating the effect of the changes in exchange rates, we hold derivative financial instruments. Valuations of derivative assets and liabilities reflect the fair value of the instruments, including the values associated with counterparty risk. These values must also take into account our credit standing, thus including the valuation of the derivative instrument and the value of the net credit differential between the counterparties to the derivative contract. Adjustments to our derivative assets and liabilities related to credit risk were not material for any period presented.
The income approach was used as the valuation technique to measure the fair value of foreign currency derivative instruments on a recurring basis. This approach calculates the present value of the future cash flow by measuring the change from the derivative contract rate and the published market indicative currency rate, multiplied by the contract notional values. Credit risk is then incorporated by reducing the derivative’s fair value in asset positions by the result of multiplying the present value of the portfolio by the counterparty’s published credit spread. Portfolios in a liability position are adjusted by the same calculation; however, a spread representing our credit spread is used.
Our credit spread, and the credit spread of other counterparties not publicly available, are approximated using the spread of similar companies in the same industry, of similar size, and with the same credit rating. See Notes 24 and 25 to our consolidated financial statements for further details.
67
At this time, we have no credit-risk-related contingent features in our agreements with the financial institutions that would require us to post collateral for derivative positions in a liability position.
Financial Position Outlook
Overview
We are committed to a strong balance sheet and ample liquidity that that will enable us to avoid distress in cyclical troughs and access capital markets throughout the cycle. We believe our liquidity has and continues to exceed the level required to achieve this goal.
Our objective in financing our business is to maintain sufficient liquidity, adequate financial resources and financial flexibility in order to fund the requirements of our business. Our capital expenditures can be adjusted and managed to match market demand and activity levels. Based on current market conditions and our future expectations, our capital expenditures for 2021 are estimated to be approximately $250.0 million. Projected capital expenditures do not include any contingent capital that may be needed to respond to a contract award.
Spin-off
In connection with the Spin-off, we executed a series of refinancing transactions, in order to provide a capital structure with sufficient cash resources to support future operating and investment plans.
Debt Issuance
On February 16, 2021, we entered into Revolving Credit Facility that provides for aggregate revolving capacity of up to $1.0 billion. Availability of borrowings under the Revolving Credit Facility is reduced by any outstanding letters of credit issued against the facility. At February 25, 2021, there were no outstanding letters of credit and availability of borrowings under the Revolving Credit Facility was $800 million.
On January 29, 2021, we issued $1.0 billion of 6.5% senior notes due 2026 (the “2021 Notes”). The interest on the 2021 Notes is paid semi-annually on February 1 and August 1 of each year, beginning on August 1, 2021. The 2021 Notes are senior unsecured obligations and are guaranteed on a senior unsecured basis by substantially all of our wholly-owned U.S. subsidiaries and non-U.S. subsidiaries in Brazil, the Netherlands, Norway, Singapore and the United Kingdom.
Repayment of Debt
The proceeds from the debt issuance described above along with the available cash on hand were used to fund:
•The repayment of all $522.8 million of the outstanding Synthetic Convertible Bonds that matured in January 2021.
•The repayment of all $500.0 million aggregate principal amount of outstanding 3.45% Senior Notes due 2022.
•The termination of the $2.5 billion senior unsecured revolving credit facility we entered into on January 17, 2017; the termination of the €500.0 million Euro Facility and the CCFF Program we entered into on May 19, 2020. In connection with the termination of these credit facilities, we repaid most of the outstanding commercial paper borrowings, which were $1,525.9 million as of December 31, 2020.
We will continue to be strategically focused on cash and liquidity preservation. Subsequent to the completion of the Spin-off, we own 49.9% of the outstanding shares of Technip Energies. The ownership percentage will be further reduced by the sale of shares to BPI pursuant to the Share Purchase Agreement, for further details see section “The Spin-off” in “Item 1. Business.” We intend to conduct an orderly sale of our stake in Technip Energies over time and will use the proceeds from future sales to further reduce our net leverage.
68
CONTRACTUAL OBLIGATIONS
The following is a summary of our contractual obligations as of December 31, 2020:
| Payments Due by Period | |||||||||||||||||||||||||||||
| (In millions) | Total payments | Less than 1 year | 1-3 years | 3-5 years | After 5 years | ||||||||||||||||||||||||
Debt (a) | $ | 3,953.9 | $ | 636.2 | $ | 2,589.1 | $ | 294.0 | $ | 434.6 | |||||||||||||||||||
Interest on debt (a) | 242.3 | 58.1 | 69.3 | 42.9 | 72.0 | ||||||||||||||||||||||||
Operating leases (b) | 1,128.0 | 131.2 | 328.6 | 196.8 | 471.4 | ||||||||||||||||||||||||
Purchase obligations (c) | 5,709.4 | 4,587.5 | 1,008.9 | 112.0 | 1.0 | ||||||||||||||||||||||||
Pension and other post-retirement benefits (d) | 19.0 | 19.0 | — | — | — | ||||||||||||||||||||||||
Unrecognized tax benefits (e) | 56.1 | 4.2 | 4.2 | 47.6 | 0.1 | ||||||||||||||||||||||||
Other contractual obligations (f) | 246.6 | 141.9 | 104.7 | — | — | ||||||||||||||||||||||||
| Total contractual obligations | $ | 11,355.3 | $ | 5,578.1 | $ | 4,104.8 | $ | 693.3 | $ | 979.1 | |||||||||||||||||||
(a)Our available debt is dependent upon our compliance with covenants, including negative covenants related to liens and our total capitalization ratio. Any violation of covenants or other events of default, which are not waived or cured, or changes in our credit rating could have a material impact on our ability to maintain our committed financing arrangements.
Due to our intent and ability to refinance commercial paper obligations on a long-term basis under our revolving credit facility and the variable interest rates associated with these debt instruments, only interest on our Senior Notes is included in the table. During 2020, we paid $107.0 million for interest charges, net of interest capitalized.
Subsequent to the Spin-off, we expect the total future principal payments on debt and total future interest payments to be approximately $2,376.8 million and $556.1 million, respectively.
(b)We lease office space, manufacturing facilities and various types of manufacturing and data processing equipment. Leases of real estate generally provide for payment of property taxes, insurance and repairs by us. Substantially all of our leases are classified as operating leases.
(c)In the normal course of business, we enter into agreements with our suppliers to purchase raw materials or services. These agreements include a requirement that our supplier provide products or services to our specifications and require us to make a firm purchase commitment to our supplier. As substantially all of these commitments are associated with purchases made to fulfill our customers’ orders, the costs associated with these agreements will ultimately be reflected in cost of sales in our consolidated statements of income. Subsequent to the Spin-off, we expect the total remaining future purchase obligations to be approximately $1,094.1 million.
(d)We expect to contribute approximately $20.7 million to our international pension plans during 2021. Required contributions for future years depend on factors that cannot be determined at this time. Additionally, we expect to pay directly to beneficiaries approximately $14.3 million for international unfunded pension plan and $4.7 million for U.S. Non-Qualified unfunded pension plan during 2021. Subsequent to the Spin-off, we expect to contribute approximately $18.9 million to our international pension plans during 2021.
(e)It is reasonably possible that $4.2 million of liabilities for unrecognized tax benefits will be settled during 2021, and this amount is reflected in income taxes payable in our consolidated balance sheet as of December 31, 2020. Although unrecognized tax benefits are not contractual obligations, they are presented in this table because they represent demands on our liquidity.
(f)Other contractual obligations represent our share of the mandatorily redeemable financial liability, which is recorded at its fair value. The mandatorily redeemable financial liability relates to our voting control interests in legal Technip Energies contract entities which own and account for the design, engineering and construction of the Yamal LNG plant. During the year ended December 31, 2020 we revalued the liability to reflect current expectations about the obligation. See Note 24 to our consolidated financial statements for further details.
OTHER OFF-BALANCE SHEET ARRANGEMENTS
The following is a summary of other off-balance sheet arrangements for our consolidated subsidiaries as of December 31, 2020:
| Amount of Commitment Expiration per Period | |||||||||||||||||||||||||||||
| (In millions) | Total amount | Less than 1 year | 1-3 years | 3-5 years | After 5 years | ||||||||||||||||||||||||
Financial guarantees (a) | $ | 310.1 | $ | 204.1 | $ | 38.9 | $ | 24.7 | $ | 42.4 | |||||||||||||||||||
Performance guarantees (b) | 4,659.6 | 1,968.0 | 2,011.4 | 565.7 | 114.5 | ||||||||||||||||||||||||
| Total other off-balance sheet arrangements | $ | 4,969.7 | $ | 2,172.1 | $ | 2,050.3 | $ | 590.4 | $ | 156.9 | |||||||||||||||||||
(a)Financial guarantees represent contracts that contingently require a guarantor to make payments to a guaranteed party based on changes in an underlying agreement that is related to an asset, a liability or an equity security of the guaranteed party. These tend to be drawn down only if there is a failure to fulfill our financial obligations.
69
(b)Performance guarantees represent contracts that contingently require a guarantor to make payments to a guaranteed party based on another entity's failure to perform under a nonfinancial obligating agreement. Events that trigger payment are performance-related, such as failure to ship a product or provide a service.
CRITICAL ACCOUNTING ESTIMATES
The preparation of financial statements in conformity with GAAP requires management to make certain estimates, judgments and assumptions about future events that affect the reported amounts of assets and liabilities at the date of the financial statements, the reported amounts of revenue and expenses during the periods presented and the related disclosures in the accompanying notes to the financial statements. Management has reviewed these critical accounting estimates with the Audit Committee of our Board of Directors. We believe the following critical accounting estimates used in preparing our financial statements address all important accounting areas where the nature of the estimates or assumptions is material due to the levels of subjectivity and judgment necessary to account for highly uncertain matters or the susceptibility of such matters to change. See Note 1 to our consolidated financial statements for further details.
Revenue Recognition
The majority of our revenue is derived from long-term contracts that can span several years. We account for revenue in accordance with Accounting Standard Codification (“ASC”) Topic 606, Revenues from Contracts with Customers. The unit of account in ASC Topic 606 is a performance obligation. A contract’s transaction price is allocated to each distinct performance obligation and recognized as revenue when, or as, the performance obligation is satisfied. Our performance obligations are satisfied over time as work progresses or at a point in time.
A significant portion of our total revenue recognized over time relates to our Technip Energies and Subsea segments, primarily for the entire range of onshore facilities, fixed and floating offshore oil and gas facilities, and subsea exploration and production equipment projects that involve the design, engineering, manufacturing, construction, and assembly of complex, customer-specific systems. Because of control transferring over time, revenue is recognized based on the extent of progress towards completion of the performance obligation. The selection of the method to measure progress towards completion requires judgment and is based on the nature of the products or services to be provided. We generally use the cost-to-cost measure of progress for our contracts because it best depicts the transfer of control to the customer that occurs as we incur costs on our contracts. Under the cost-to-cost measure of progress, the extent of progress towards completion is measured based on the ratio of costs incurred to date to the total estimated costs at completion of the performance obligation. Revenues, including estimated fees or profits, are recorded proportionally as costs are incurred.
Due to the nature of the work required to be performed on many of our performance obligations, the estimation of total revenue and cost at completion is complex, subject to many variables, and requires significant judgment. It is common for our long-term contracts to contain award fees, incentive fees, or other provisions that can either increase or decrease the transaction price. We include estimated amounts in the transaction price when we believe we have an enforceable right to the modification, the amount can be estimated reliably, and its realization is probable. The estimated amounts are included in the transaction price to the extent it is probable that a significant reversal of cumulative revenue recognized will not occur when the uncertainty associated with the variable consideration is resolved.
We execute contracts with our customers that clearly describe the equipment, systems, and/or services. After analyzing the drawings and specifications of the contract requirements, our project engineers estimate total contract costs based on their experience with similar projects and then adjust these estimates for specific risks associated with each project, such as technical risks associated with a new design. Costs associated with specific risks are estimated by assessing the probability that conditions arising from these specific risks will affect our total cost to complete the project. After work on a project begins, assumptions that form the basis for our calculation of total project cost are examined on a regular basis and our estimates are updated to reflect the most current information and management’s best judgment.
70
Adjustments to estimates of contract revenue, total contract cost, or extent of progress toward completion are often required as work progresses under the contract and as experience is gained, even though the scope of work required under the contract may not change. The nature of accounting for long-term contracts is such that refinements of the estimating process for changing conditions and new developments are continuous and characteristic of the process. Consequently, the amount of revenue recognized over time is sensitive to changes in our estimates of total contract costs. There are many factors, including, but not limited to, the ability to properly execute the engineering and design phases consistent with our customers’ expectations, the availability and costs of labor and material resources, productivity, and weather, all of which can affect the accuracy of our cost estimates, and ultimately, our future profitability.
Our operating loss for the year ended December 31, 2020 was positively impacted by approximately $457.9 million, as a result of changes in contract estimates related to projects that were in progress as of December 31, 2019. During the year ended December 31, 2020, we recognized changes in our estimates that had an impact on our margin in the amounts of $519.5 million, $(56.5) million and $(5.1) million in our Technip Energies, Subsea and Surface Technologies segments, respectively. The changes in contract estimates are attributed to better, than expected performance throughout our execution of our projects.
Our operating loss for the year ended December 31, 2019 was positively impacted by approximately $1,114.3 million, as a result of changes in contract estimates related to projects that were in progress as of December 31, 2018. During the year ended December 31, 2019, we recognized changes in our estimates that had 81 registered shareholders.an impact on our margin in the amounts of $797.2 million, $324.7 million and $(7.6) million in our Technip Energies, Subsea and Surface Technologies segments, respectively. The changes in contract estimates are attributed to better, than expected performance throughout our execution of our projects.
Our operating profit for the year ended December 31, 2018 was positively impacted by approximately $553.4 million, as a result of changes in contract estimates related to projects that were in progress as of December 31, 2017. During the year ended December 31, 2018, we recognized changes in our estimates that had an impact on our margin in the amounts of $379.2 million, $169.9 million and $4.3 million in our Technip Energies, Subsea and Surface technologies segments, respectively. The changes in contract estimates are attributed to better, than expected performance throughout our execution of our projects.
Accounting for Income Taxes
Our income tax expense, deferred tax assets and liabilities, and reserves for uncertain tax positions reflect management’s best assessment of estimated future taxes to be paid. We hadare subject to income taxes in the United Kingdom and numerous foreign jurisdictions. Significant judgments and estimates are required in determining our consolidated income tax expense.
In determining our current income tax provision, we assess temporary differences resulting from differing treatments of items for tax and accounting purposes. These differences result in deferred tax assets and liabilities, which are recorded in our consolidated balance sheets. When we maintain deferred tax assets, we must assess the likelihood that these assets will be recovered through adjustments to future taxable income. To the extent, we believe recovery is not likely, we establish a valuation allowance. We record a valuation allowance to reduce the asset to a value we believe will be recoverable based on our expectation of future taxable income. We believe the accounting estimate related to the valuation allowance is a critical accounting estimate because it is highly susceptible to change from period to period, requires management to make assumptions about our future income over the lives of the deferred tax assets, and finally, the impact of increasing or decreasing the valuation allowance is potentially material to our results of operations.
Forecasting future income requires us to use a significant amount of judgment. In estimating future income, we use our internal operating budgets and long-range planning projections. We develop our budgets and long-range projections based on recent results, trends, economic and industry forecasts influencing our segments’ performance, our backlog, planned timing of new product launches and customer sales commitments. Significant changes in our judgment related to the expected realizability of a deferred tax asset results in an adjustment to the associated valuation allowance.
As of December 31, 2020, we have provided a valuation allowance against the related deferred tax assets where we believe it is not more likely than not that we will generate future taxable income sufficient to realize such assets.
71
The calculation of our income tax expense involves dealing with uncertainties in the application of complex tax laws and regulations in numerous jurisdictions in which we operate. We recognize tax benefits related to uncertain tax positions when, in our judgment, it is more likely than not that such positions will be sustained on examination, including resolutions of any related appeals or litigation, based on the technical merits. We adjust our liabilities for uncertain tax positions when our judgment changes as a result of new information previously unavailable. Due to the complexity of some of these uncertainties, their ultimate resolution may result in payments that are materially different from our current estimates. Any such differences will be reflected as adjustments to income tax expense in the periods in which they are determined.
Accounting for Pension and Other Post-retirement Benefit Plans
The determination of the projected benefit obligations of our pension and other post-retirement benefit plans are important to the recorded amounts of such obligations in our consolidated balance sheets and to the amount of pension expense in our consolidated statements of income. In order to measure the obligations and expense associated with our pension benefits, management must make a variety of estimates, including discount rates used to value certain liabilities, expected return on plan assets set aside to fund these costs, rate of compensation increase, employee turnover rates, retirement rates, mortality rates and other factors. We update these estimates on an annual basis or more frequently upon the occurrence of significant events. These accounting estimates bear the risk of change due to the uncertainty and difficulty in estimating these measures. Different estimates used by management could result in our recognition of different amounts of expense over different periods of time.
Due to the specialized and statistical nature of these calculations which attempt to anticipate future events, we engage third-party specialists to assist management in evaluating our assumptions as well as appropriately measuring the costs and obligations associated with these pension benefits. The discount rate and expected long-term rate of return on plan assets are primarily based on investment yields available and the historical performance of our plan assets, respectively. The timing and amount of cash outflows related to the bonds included in the indices matches it estimated defined benefits payments. These measures are critical accounting estimates because they are subject to management’s judgment and can materially affect net income.
The actuarial assumptions and estimates made by management in determining our pension benefit obligations may materially differ from actual results as a result of changing market and economic conditions and changes in plan participant assumptions. While we believe the assumptions and estimates used are appropriate, differences in actual experience or changes in plan participant assumptions may materially affect our financial position or results of operations.
The following table illustrates the sensitivity of changes in the discount rate and expected long-term return on plan assets on pension expense and the projected benefit obligation:
| (In millions, except basis points) | Increase (Decrease) in 2020 Pension Expense Before Income Taxes | Increase (Decrease) in Projected Benefit Obligation as of December 31, 2020 | |||||||||
| 25 basis point decrease in discount rate | $ | 3.2 | $ | 66.8 | |||||||
| 25 basis point increase in discount rate | $ | (3.2) | $ | (63.5) | |||||||
| 25 basis point decrease in expected long-term rate of return on plan assets | $ | 3.7 | N/A | ||||||||
| 25 basis point increase in expected long-term rate of return on plan assets | $ | (1.6) | N/A | ||||||||
72
Determination of Fair Value in Business Combinations
Accounting for the acquisition of a business requires the allocation of the purchase price to the various assets acquired and liabilities assumed at their respective fair values. The determination of fair value requires the use of significant estimates and assumptions, and in making these determinations, management uses all available information. If necessary, we have up to one year after the acquisition closing date to finalize these fair value determinations. For tangible and identifiable intangible assets acquired in a business combination, the determination of fair value utilizes several valuation methodologies including discounted cash flows which has assumptions with respect to the timing and amount of future revenue and expenses associated with an asset. The assumptions made in performing these valuations include, but are not limited to, discount rates, future revenues and operating costs, projections of capital costs, and other assumptions believed to be consistent with those used by principal market participants. Due to the specialized nature of these calculations, we engage third-party specialists to assist management in evaluating our assumptions as well as appropriately measuring the fair value of assets acquired and liabilities assumed. See Note 2 to our consolidated financial statements for further details.
Impairment of Long-Lived and Intangible Assets
Long-lived assets, including vessels, property, plant and equipment, identifiable intangible assets being amortized and capitalized software costs are reviewed for impairment whenever events or changes in circumstances indicate the carrying amount of the long-lived asset may not be recoverable. The carrying amount of a long-lived asset is not recoverable if it exceeds the sum of the undiscounted cash flows expected to result from the use and eventual disposition of the asset. If it is determined that an impairment loss has occurred, the loss is measured as the amount by which the carrying amount of the long-lived asset exceeds its fair value. The determination of future cash flows as well as the estimated fair value of long-lived assets involves significant estimates on the part of management. Because there usually is a lack of quoted market prices for long-lived assets, fair value of impaired assets is typically determined based on the present values of expected future cash flows using discount rates believed to be consistent with those used by principal market participants, or based on a multiple of operating cash flows validated with historical market transactions of similar assets where possible. The expected future cash flows used for impairment reviews and related fair value calculations are based on judgmental assessments of revenue, forecasted utilization, operating costs and capital decisions and all available information at the date of review. If future market conditions deteriorate beyond our current expectations and assumptions, impairments of long-lived assets may be identified if we conclude that the carrying amounts are no unregistered saleslonger recoverable.
Impairment of equity securitiesGoodwill
Goodwill represents the excess of cost over the fair market value of net assets acquired in business combinations. Goodwill is not subject to amortization but is tested for impairment at a reporting unit level on an annual basis, or more frequently if impairment indicators arise. We have established October 31 as the date of our annual test for impairment of goodwill. We identify a potential impairment by comparing the fair value of the applicable reporting unit to its net book value, including goodwill. If the net book value exceeds the fair value of the reporting unit, we measure the impairment by comparing the carrying value of the reporting unit to its fair value. Reporting units with goodwill are tested for impairment using a quantitative impairment test.
When using the quantitative impairment test, determining the fair value of a reporting unit is judgmental in nature and involves the use of significant estimates and assumptions. We estimate the fair value of our reporting units using a discounted future cash flow model. The majority of the estimates and assumptions used in a discounted future cash flow model involve unobservable inputs reflecting management’s own assumptions about the assumptions market participants would use in estimating the fair value of a business. These estimates and assumptions include revenue growth rates and operating margins used to calculate projected future cash flows, discount rates and future economic and market conditions. Our estimates are based upon assumptions believed to be reasonable, but which are inherently uncertain and unpredictable and do not reflect unanticipated events and circumstances that may occur.
73
The income approach estimates fair value by discounting each reporting unit’s estimated future cash flows using a weighted-average cost of capital that reflects current market conditions and the risk profile of the reporting unit. To arrive at our future cash flows, we use estimates of economic and market assumptions, including growth rates in revenues, costs, estimates of future expected changes in operating margins, tax rates and cash expenditures. Future revenues are also adjusted to match changes in our business strategy. We believe this approach is an appropriate valuation method. Under the market multiple approach, we determine the estimated fair value of each of our reporting units by applying transaction multiples to each reporting unit’s projected EBITDA and then averaging that estimate with similar historical calculations using either a one, two or three year average. Our reporting unit valuations were determined primarily by utilizing the income approach, with a lesser weighting attributed the market multiple approach.
During the first quarter of 2020 a severe decline in the Company’s market capitalization, significant decline in crude oil prices and the growing pandemic caused by COVID-19 triggered the need for an impairment test at March 31, 2020. We utilized a market approach to measure the fair value of our reporting units as of March 31, 2020. In measuring a fair value of the Company we used the Company’s market capitalization. An appropriate control premium was considered for each of the reporting units and applied to the output of the market approach. An interim impairment test during the first quarter of 2020 resulted in $2,747.5 million and $335.9 million of goodwill impairment charges recorded in our Subsea and Surface Technologies segments, respectively.
During our annual impairment test the following significant estimates were used by management in determining the fair values of our reporting units in order to test the remaining goodwill at October 31:
| 2020 | 2019 | 2018 | |||||||||||||||
| Year of cash flows before terminal value | 4 | 4 | 5 | ||||||||||||||
| Discount rates | 0.15 | 12.5% to 15.0% | 12.0% to 13.0% | ||||||||||||||
| EBITDA multiples | N/A | 6.0 - 8.5x | 7.0 - 8.5x | ||||||||||||||
During the year ended December 31, 2020, the significant estimates used by management in determining the fair value described above relate to Technip Energies reporting unit only. Based on the impairment tests performed during the year ended December 31, 2018.2020 we recorded $2,747.5 million and $335.9 million of goodwill impairment charges recorded in our Subsea and Surface Technologies reporting units, respectively. No goodwill impairment charges were recorded in our Technip Energies reporting unit. The fair value over carrying amount for our Technip Energies segment was in excess of 300% of its carrying amount at our annual impairment test date that is October 31, 2020.
Period | Total Number of Shares Purchased (a) | Average Price Paid per Share | Total Number of Shares Purchased as Part of Publicly Announced Plans or Programs | Maximum Number of Shares That May Yet Be Purchased Under the Plans or Programs (b) | ||||||||
| October 1, 2018 – October 31, 2018 | 408,691 | $ | 29.29 | 408,691 | 3,650,795 | |||||||
| November 1, 2018 – November 30, 2018 | 1,202,133 | $ | 23.38 | 1,202,057 | 2,448,738 | |||||||
| December 1, 2018 – December 31, 2018 | 928,273 | $ | 19.67 | 927,809 | 16,091,108 | |||||||
| Total | 2,539,097 | 2,538,557 | 16,091,108 | |||||||||
See Notes 15 and 19 to our consolidated financial statements for further details.
OTHER MATTERS
On March 28, 2016, FMC Technologies received an inquiry from the U.S. Department of Justice (“DOJ”) related to the DOJ's investigation of whether certain services Unaoil S.A.M. provided to its clients, including FMC Technologies, violated the FCPA. On March 29, 2016, Technip S.A. also received an inquiry from the DOJ related to Unaoil. We cooperated with the Standard & Poor’s 500 IndexDOJ's investigations and, with regard to FMC Technologies, a related investigation by the SEC.
In late 2016, Technip S.A. was contacted by the DOJ regarding its investigation of offshore platform projects awarded between 2003 and 2007, performed in Brazil by a joint venture company in which Technip S.A. was a minority participant, and we have also raised with DOJ certain other projects performed by Technip S.A. subsidiaries in Brazil between 2002 and 2013. The DOJ has also inquired about projects in Ghana and Equatorial Guinea that were awarded to Technip S.A. subsidiaries in 2008 and 2009, respectively. We cooperated with the DOJ in its investigation into potential violations of the FCPA in connection with these projects. We contacted and cooperated with the Brazilian authorities (Federal Prosecution Service (“S&P 500 Index”MPF”), the Comptroller General of Brazil (“CGU”) and PHLX Oil Services Index. The comparison assumes $100 was invested, including reinvestmentthe Attorney General of dividends, if any,Brazil (“AGU”)) with their investigation concerning the projects in Brazil and have also
74
contacted and are cooperating with French authorities (the Parquet National Financier (“PNF”)) about these existing matters.
On June 25, 2019, we announced a global resolution to pay a total of $301.3 million to the DOJ, the SEC, the MPF, and the CGU/AGU to resolve these anti-corruption investigations. We will not be required to have a monitor and will, instead, provide reports on our ordinary sharesanti-corruption program to the Brazilian and U.S. authorities for two and three years, respectively.
As part of this resolution, we entered into a three-year Deferred Prosecution Agreement (“DPA”) with the DOJ related to charges of conspiracy to violate the FCPA related to conduct in Brazil and with Unaoil. In addition, Technip USA, Inc., a U.S. subsidiary, pled guilty to one count of conspiracy to violate the FCPA related to conduct in Brazil. We will also provide the DOJ reports on January 17, 2017 and in bothour anti-corruption program during the term of the indexes onDPA.
In Brazil, our subsidiaries Technip Brasil - Engenharia, Instalações E Apoio Marítimo Ltda. and Flexibrás Tubos Flexíveis Ltda. entered into leniency agreements with both the same date. The results shownMPF and the CGU/AGU. We have committed, as part of those agreements, to make certain enhancements to their compliance programs in Brazil during a two-year self-reporting period, which aligns with our commitment to cooperation and transparency with the compliance community in Brazil and globally.
In September 2019, the SEC approved our previously disclosed agreement in principle with the SEC Staff and issued an Administrative Order, pursuant to which we paid the SEC $5.1 million, which was included in the graph below areglobal resolution of $301.3 million.
To date, the investigation by PNF related to historical projects in Equatorial Guinea and Ghana has not necessarily indicativereached resolution. We remain committed to finding a resolution with the PNF and will maintain a $70.0 million provision related to this investigation. As we continue to progress our discussions with PNF towards resolution, the amount of future performance.a settlement could exceed this provision.
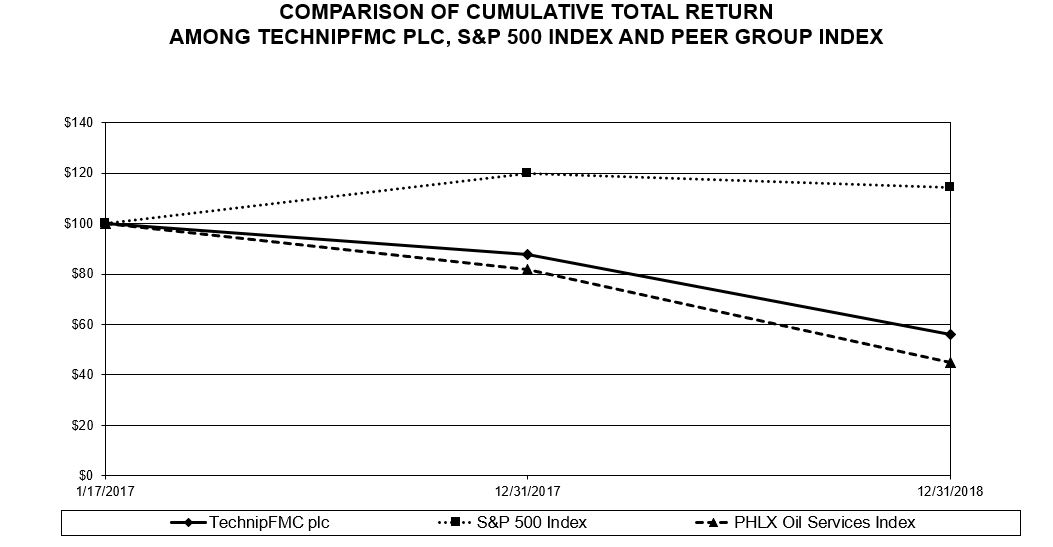
RECENTLY ISSUED ACCOUNTING STANDARDS
See Note 4 to our consolidated financial statements included in Part II, Item 8 of this Annual Report on Form 10-K.
75
| January 17 | December 31 | ||||||||||
| 2017 | 2017 | 2018 | |||||||||
| TechnipFMC plc | $ | 100.00 | $ | 87.76 | $ | 55.89 | |||||
| S&P 500 Index | 100.00 | 119.82 | 114.56 | ||||||||
| PHLX Oil Services Index | 100.00 | 82.00 | 44.93 | ||||||||
ITEM 6. SELECTED FINANCIAL DATA7A. QUANTITATIVE AND QUALITATIVE DISCLOSURES ABOUT MARKET RISK
We are subject to financial market risks, including fluctuations in foreign currency exchange rates and interest rates. In order to manage and mitigate our exposure to these risks, we may use derivative financial instruments in accordance with established policies and procedures. We do not use derivative financial instruments where the objective is to generate profits solely from trading activities. As of December 31, 2020 and 2019, substantially all of our derivative holdings consisted of foreign currency forward contracts and foreign currency instruments embedded in purchase and sale contracts.
These forward-looking disclosures only address potential impacts from market risks as they affect our financial instruments and do not include other potential effects that could impact our business as a result of changes in foreign currency exchange rates, interest rates, commodity prices or equity prices.
Foreign Currency Exchange Rate Risk
We conduct operations around the world in a number of different currencies. Many of our significant foreign subsidiaries have designated the local currency as their functional currency. Our earnings are therefore subject to change due to fluctuations in foreign currency exchange rates when the earnings in foreign currencies are translated into U.S. dollars. We do not hedge this translation impact on earnings. A 10% increase or decrease in the average exchange rates of all foreign currencies as of December 31, 2020, would have changed our revenue and income before income taxes attributable to TechnipFMC by approximately $813.0 million and $38.0 million, respectively.
When transactions are denominated in currencies other than our subsidiaries’ respective functional currencies, we manage these exposures through the use of derivative instruments. We primarily use foreign currency forward contracts to hedge the foreign currency fluctuation associated with firmly committed and forecasted foreign currency denominated payments and receipts. The following tables set forth selected financial dataderivative instruments associated with these anticipated transactions are usually designated and qualify as cash flow hedges, and as such the gains and losses associated with these instruments are recorded in other comprehensive income until such time that the underlying transactions are recognized. Unless these cash flow contracts are deemed to be ineffective or are not designated as cash flow hedges at inception, changes in the derivative fair value will not have an immediate impact on our results of operations since the gains and losses associated with these instruments are recorded in other comprehensive income. When the anticipated transactions occur, these changes in value of derivative instrument positions will be offset against changes in the value of the Companyunderlying transaction. When an anticipated transaction in a currency other than the functional currency of an entity is recognized as an asset or liability on the balance sheet, we also hedge the foreign currency fluctuation of these assets and liabilities with derivative instruments after netting our exposures worldwide. These derivative instruments do not qualify as cash flow hedges.
Occasionally, we enter into contracts or other arrangements containing terms and conditions that qualify as embedded derivative instruments and are subject to fluctuations in foreign exchange rates. In those situations, we enter into derivative foreign exchange contracts that hedge the price or cost fluctuations due to movements in the foreign exchange rates. These derivative instruments are not designated as cash flow hedges.
For our foreign currency forward contracts hedging anticipated transactions that are accounted for as cash flow hedges, a 10% increase in the value of the U.S. dollar would have resulted in an additional loss of $68.4 million in the net fair value of cash flow hedges reflected in our consolidated balance sheet as of December 31, 2020.
Interest Rate Risk
As of December 31, 2020, we had commercial paper of approximately $1.5 billion with a weighted average interest rate of 0.26%. Using sensitivity analysis to measure the impact of a 10% adverse movement in the interest rate, or three basis points, would result in an increase to interest expense of $0.5 million.
76
We assess effectiveness of forward foreign currency contracts designated as cash flow hedges based on changes in fair value attributable to changes in spot rates. We exclude the impact attributable to changes in the difference between the spot rate and the forward rate for the assessment of hedge effectiveness and recognize the change in fair value of this component immediately in earnings. Considering that the difference between the spot rate and the forward rate is proportional to the differences in the interest rates of the countries of the currencies being traded, we do not have significant exposure in the unrealized valuation of our forward foreign currency contracts to relative changes in interest rates between countries in our results of operations. To the extent any one interest rate increases by 10% across all tenors and other countries’ interest rates remain fixed, and assuming no change in discount rates, we would expect to recognize a decrease of $1.5 million in unrealized earnings in the period of change. Based on our portfolio at December 31, 2020, we have material positions with exposure to interest rates in the United States, Canada, Australia, Brazil, the United Kingdom, Singapore, the European Community, and Norway.
77
ITEM 8. FINANCIAL STATEMENTS AND SUPPLEMENTARY DATA
Report of Independent Registered Public Accounting Firm
To the Board of Directors and Stockholders of TechnipFMC plc
Opinions on the Financial Statements and Internal Control over Financial Reporting
We have audited the accompanying consolidated balance sheets of TechnipFMC plc and its subsidiaries (the “Company”) as of December 31, 2020 and 2019, and the related consolidated statements of income, of comprehensive income, of changes in stockholders’ equity and of cash flows for each of the fourthree years in the period ended December 31, 2018. This information should be read2020, including the related notes and schedule of valuation and qualifying accounts for each of the three years in conjunction with Part I,the period ended December 31, 2020 appearing under Item 1 “Business,” Part II, Item 7 “Management’s Discussion15(a)(2) (collectively referred to as the “consolidated financial statements”). We also have audited the Company's internal control over financial reporting as of December 31, 2020, based on criteria established in Internal Control - Integrated Framework (2013) issued by the Committee of Sponsoring Organizations of the Treadway Commission (COSO).
In our opinion, the consolidated financial statements referred to above present fairly, in all material respects, the financial position of the Company as of December 31, 2020 and Analysis of Financial Condition and Results of Operations”2019, and the auditedresults of its operations and its cash flows for each of the three years in the period ended December 31, 2020 in conformity with accounting principles generally accepted in the United States of America. Also, in our opinion, the Company maintained, in all material respects, effective internal control over financial reporting as of December 31, 2020, based on criteria established in Internal Control - Integrated Framework (2013) issued by the COSO.
Change in Accounting Principle
As discussed in Note 1 to the consolidated financial statements, the Company changed the manner in which it accounts for leases in 2019.
Basis for Opinions
The Company's management is responsible for these consolidated financial statements, for maintaining effective internal control over financial reporting, and for its assessment of the effectiveness of internal control over financial reporting, included in Management’s Annual Report on Internal Control over Financial Reporting appearing under Item 9A. Our responsibility is to express opinions on the Company’s consolidated financial statements and notes thereto includedon the Company's internal control over financial reporting based on our audits. We are a public accounting firm registered with the Public Company Accounting Oversight Board (United States) (PCAOB) and are required to be independent with respect to the Company in Part II, Item 8accordance with the U.S. federal securities laws and the applicable rules and regulations of this Annual Report on Form 10-K.the Securities and Exchange Commission and the PCAOB.
| Year Ended December 31, | |||||||||||||||
| (In millions, except per share data) | 2018 (a) | 2017 (b) | 2016 | 2015 | |||||||||||
| Statement of income data | |||||||||||||||
| Total revenue | $ | 12,552.9 | $ | 15,056.9 | $ | 9,199.6 | $ | 11,471.9 | |||||||
| Total costs and expenses | $ | 13,470.5 | $ | 14,091.7 | $ | 8,743.6 | $ | 11,198.3 | |||||||
| Net income (loss) | $ | (1,910.8 | ) | $ | 134.2 | $ | 371.1 | $ | 14.0 | ||||||
| Net income (loss) attributable to TechnipFMC plc | $ | (1,921.6 | ) | $ | 113.3 | $ | 393.3 | $ | 14.4 | ||||||
| Earnings (loss) per share from continuing operations attributable to TechnipFMC plc | |||||||||||||||
| Basic earnings (loss) per share | $ | (4.20 | ) | $ | 0.24 | $ | 3.29 | $ | 0.13 | ||||||
| Diluted earnings (loss) per share | $ | (4.20 | ) | $ | 0.24 | $ | 3.16 | $ | 0.13 | ||||||
| December 31, | |||||||||||||||
| (In millions) | 2018 | 2017 (b) | 2016 | 2015 | |||||||||||
| Balance sheet data | |||||||||||||||
| Total assets | $ | 24,784.5 | $ | 28,263.7 | $ | 18,679.3 | $ | 14,953.6 | |||||||
| Long-term debt, less current portion | $ | 4,124.3 | $ | 3,777.9 | $ | 1,869.3 | $ | 2,005.0 | |||||||
| Total TechnipFMC plc stockholders’ equity | $ | 10,399.6 | $ | 13,387.9 | $ | 5,055.8 | $ | 4,947.2 | |||||||
| Year Ended December 31, | |||||||||||||||
| (In millions) | 2018 | 2017 (b) | 2016 | 2015 | |||||||||||
| Other financial information | |||||||||||||||
| Capital expenditures | $ | 368.1 | $ | 255.7 | $ | 312.9 | $ | 325.5 | |||||||
| Cash flows provided (required) by operating activities | $ | (185.4 | ) | $ | 210.7 | $ | 493.8 | $ | 700.3 | ||||||
Net cash (c) | $ | 1,348.3 | $ | 2,882.4 | $ | 3,716.4 | $ | 370.4 | |||||||
Order backlog (d) | $ | 14,560.0 | $ | 12,982.8 | $ | 15,002.0 | $ | 18,475.5 | |||||||
Definition and Limitations of Internal Control over Financial Reporting
A discussion and analysiscompany’s internal control over financial reporting is a process designed to provide reasonable assurance regarding the reliability of our consolidated results of operationsfinancial reporting and the resultspreparation of operationsfinancial statements for external purposes in accordance with generally accepted accounting principles. A company’s internal control over financial reporting
78
includes those policies and procedures that (i) pertain to the maintenance of eachrecords that, in reasonable detail, accurately and fairly reflect the transactions and dispositions of our segments for the years ended December 31, 2018, 2017assets of the company; (ii) provide reasonable assurance that transactions are recorded as necessary to permit preparation of financial statements in accordance with generally accepted accounting principles, and 2016 follows.that receipts and expenditures of the company are being made only in accordance with authorizations of management and directors of the company; and (iii) provide reasonable assurance regarding prevention or timely detection of unauthorized acquisition, use, or disposition of the company’s assets that could have a material effect on the financial statements.
Because of its inherent limitations, internal control over financial reporting may not prevent or detect misstatements. Also, projections of any evaluation of effectiveness to future periods are subject to the risk factors affecting our business segments as we formulate our strategic plans and make decisions related to allocating capital and human resources. The resultsthat controls may become inadequate because of our segments are primarily driven by changes in capital spending by oil and gas companies, which largely depend upon current and anticipated future crude oil and natural gas demand, production volumes, and consequently, commodity prices. We use crude oil and natural gas prices as an indicatorconditions, or that the degree of demand. Additionally, we use both onshore and offshore rig count as an indicator of demand, which consequently influences the level of worldwide production activity and spending decisions. We also focus on key risk factors when determining our overall strategy and making decisions for capital allocation. These factors include risks associatedcompliance with the global economic outlook, product obsolescence and the competitive environment. We address these risks in our business strategies, which incorporate continuing development of leading edge technologies and cultivating strong customer relationships.policies or procedures may deteriorate.
Critical Audit Matters
The critical audit matters communicated below are matters arising from the current market fundamentals supportingperiod audit of the demand for new liquefied natural gas facilities. Onshore/Offshore also benefits from the construction of petrochemical and fertilizer plants.
Revenue Recognition - Determination of LNG investments will continueEstimated Costs to growComplete for Long-Term Contracts
As described in Note 6 to the near and intermediate term. As an industry leader, we are well positioned for the growth in new liquefaction and regasification capacity and are actively engaged in several LNG FEED studies across multiple geographies. These FEED studies provide a platform for early engagement with clients and can significantly de-risk project execution while also supporting our pursuitconsolidated financial statements, approximately 86% of the engineering, procurement and construction (“EPC”) contract. Additionally, we continue to selectively pursue refining, petrochemical, and fertilizer project opportunities in the Middle East, Africa, Asia, and North American markets.
| Year Ended December 31, | Change | |||||||||||||||||||||||||||
| (In millions, except percentages) | 2018 | 2017 | 2016 Pro Forma* | 2016 | 2018 vs. 2017 | 2017 vs. 2016 Pro Forma | ||||||||||||||||||||||
| Revenue | $ | 12,552.9 | $ | 15,056.9 | $ | 19,068.8 | $ | 9,199.6 | $ | (2,504.0 | ) | (16.6 | )% | $ | (4,011.9 | ) | (21)% | |||||||||||
| Costs and expenses | ||||||||||||||||||||||||||||
| Cost of sales | 10,273.0 | 12,524.6 | 16,382.5 | 7,630.0 | (2,251.6 | ) | (18.0 | )% | (3,857.9 | ) | (24)% | |||||||||||||||||
| Selling, general and administrative expense | 1,140.6 | 1,060.9 | 1,229.9 | 572.6 | 79.7 | 7.5 | % | (169.0 | ) | (14)% | ||||||||||||||||||
| Research and development expense | 189.2 | 212.9 | 219.5 | 105.4 | (23.7 | ) | (11.1 | )% | (6.6 | ) | (3)% | |||||||||||||||||
| Impairment, restructuring and other expense | 1,831.2 | 191.5 | 443.6 | 343.0 | 1,639.7 | 856.2 | % | (252.1 | ) | (57)% | ||||||||||||||||||
| Merger transaction and integration costs | 36.5 | 101.8 | 137.8 | 92.6 | (65.3 | ) | (64.1 | )% | (36.0 | ) | (26)% | |||||||||||||||||
| Total costs and expenses | 13,470.5 | 14,091.7 | 18,413.3 | 8,743.6 | (621.2 | ) | (4.4 | )% | (4,321.6 | ) | (23)% | |||||||||||||||||
| Other income (expense), net | (323.9 | ) | (25.9 | ) | 12.1 | 6.5 | (298.0 | ) | (1,150.6 | )% | (38.0 | ) | (314)% | |||||||||||||||
| Income from equity affiliates | 114.3 | 55.6 | 10.9 | 117.7 | 58.7 | 105.6 | % | 44.7 | 410% | |||||||||||||||||||
| Net interest expense | (360.9 | ) | (315.2 | ) | (29.1 | ) | (28.8 | ) | (45.7 | ) | (14.5 | )% | (286.1 | ) | (983)% | |||||||||||||
| Income (loss) before income taxes | (1,488.1 | ) | 679.7 | 649.4 | 551.4 | (2,167.8 | ) | (318.9 | )% | 30.3 | 5% | |||||||||||||||||
| Provision for income taxes | 422.7 | 545.5 | 284.7 | 180.3 | (122.8 | ) | (22.5 | )% | 260.8 | 92% | ||||||||||||||||||
| Income (loss) from continuing operations | (1,910.8 | ) | 134.2 | 364.7 | 371.1 | (2,045.0 | ) | (1,523.8 | )% | (230.5 | ) | (63)% | ||||||||||||||||
| Income (loss) from discontinued operations, net of income taxes | — | — | (10.1 | ) | — | — | — | % | 10.1 | 100% | ||||||||||||||||||
| Net income (loss) | (1,910.8 | ) | 134.2 | 354.6 | 371.1 | (2,045.0 | ) | (1,523.8 | )% | (220.4 | ) | (62)% | ||||||||||||||||
| Net loss (income) attributable to noncontrolling interests | (10.8 | ) | (20.9 | ) | 23.6 | 22.2 | 10.1 | 48.3 | % | (44.5 | ) | (189)% | ||||||||||||||||
| Net income (loss) attributable to TechnipFMC plc | $ | (1,921.6 | ) | $ | 113.3 | $ | 378.2 | $ | 393.3 | $ | (2,034.9 | ) | (1,796.0 | )% | $ | (264.9 | ) | (70)% | ||||||||||
| Year Ended December 31, | Favorable/(Unfavorable) | |||||||||||||||||||||||||||
| (In millions, except %) | 2018 | 2017 (a) | 2016 Pro Forma | 2016 | 2018 vs. 2017 | 2017 vs. 2016 Pro Forma | ||||||||||||||||||||||
| Revenue | $ | 4,840.0 | $ | 5,877.4 | $ | 9,150.5 | $ | 5,850.5 | $ | (1,037.4 | ) | (18)% | $ | (3,273.1 | ) | (36)% | ||||||||||||
| Operating profit (loss) | $ | (1,529.5 | ) | $ | 460.5 | $ | 982.6 | $ | 732.0 | $ | (1,990.0 | ) | (432)% | $ | (522.1 | ) | (53)% | |||||||||||
| Operating profit as a percent of revenue | n/a | 7.8 | % | 10.7 | % | 12.5 | % | n/a | (2.9 | ) pts. | ||||||||||||||||||
| Year Ended December 31, | Favorable/(Unfavorable) | ||||||||||||||||||||||||||||
| (In millions, except %) | 2018 | 2017 | 2016 Pro Forma | 2016 | 2018 vs. 2017 | 2017 vs. 2016 Pro Forma | |||||||||||||||||||||||
| Revenue | $ | 6,120.7 | $ | 7,904.5 | $ | 8,690.0 | $ | 3,349.1 | $ | (1,783.8 | ) | (23)% | $ | (785.5 | ) | (9)% | |||||||||||||
| Operating profit | $ | 824.0 | $ | 810.9 | $ | 184.5 | $ | 34.1 | $ | 13.1 | 2% | $ | 626.4 | 340% | |||||||||||||||
| Operating profit as a percent of revenue | 13.5 | % | 10.3 | % | 2.1 | % | 1.0 | % | 3.2 | pts. | 8.2 | pts. | |||||||||||||||||
| Year Ended December 31, | Favorable/(Unfavorable) | ||||||||||||||||||||||||
| (In millions, except %) | 2018 | 2017 (a) | 2016 Pro Forma | 2018 vs. 2017 | 2017 vs. 2016 Pro Forma | ||||||||||||||||||||
| Revenue | $ | 1,592.2 | $ | 1,274.6 | $ | 1,252.2 | $ | 317.6 | 25% | $ | 22.4 | 2% | |||||||||||||
| Operating profit (loss) | $ | 172.8 | $ | 82.7 | $ | (122.0 | ) | $ | 90.1 | 109% | $ | 204.7 | 168% | ||||||||||||
| Operating profit (loss) as a percent of revenue | 10.9 | % | 6.5 | % | (9.7 | )% | 4.4 | pts. | 16.2 | pts. | |||||||||||||||
| Year Ended December 31, | Favorable/(Unfavorable) | ||||||||||||||||||||||||||
| (In millions, except %) | 2018 | 2017 | 2016 Pro Forma | 2016 | 2018 vs. 2017 | 2017 vs. 2016 Pro Forma | |||||||||||||||||||||
| Corporate expense | $ | (594.5 | ) | $ | (359.2 | ) | $ | (366.6 | ) | $ | (185.9 | ) | $ | (235.3 | ) | (66)% | $ | 7.4 | 2% | ||||||||
| Year Ended | |||||||||||||||||||
| December 31, 2018 | |||||||||||||||||||
| Subsea | Onshore/ Offshore | Surface Technologies | Corporate and Other | Total | |||||||||||||||
| Revenue | $ | 4,840.0 | $ | 6,120.7 | $ | 1,592.2 | $ | — | $ | 12,552.9 | |||||||||
| Operating profit (loss), as reported (pre-tax) | $ | (1,529.5 | ) | $ | 824.0 | $ | 172.8 | $ | (594.5 | ) | $ | (1,127.2 | ) | ||||||
| Charges and (credits): | |||||||||||||||||||
| Impairment and other charges | 1,784.2 | — | 4.5 | 3.9 | 1,792.6 | ||||||||||||||
| Restructuring and other severance charges | 17.7 | (3.4 | ) | 9.3 | 15.0 | 38.6 | |||||||||||||
| Business combination transaction and integration costs | — | — | — | 36.5 | 36.5 | ||||||||||||||
| Legal provision | — | — | — | 280.0 | 280.0 | ||||||||||||||
| Gain on divestitures | (3.3 | ) | (28.3 | ) | — | — | (31.6 | ) | |||||||||||
| Purchase price accounting adjustments - non-amortization related | (9.4 | ) | — | 7.1 | (0.2 | ) | (2.5 | ) | |||||||||||
| Purchase price accounting adjustments - amortization related | 91.3 | — | — | — | 91.3 | ||||||||||||||
| Subtotal | 1,880.5 | (31.7 | ) | 20.9 | 335.2 | 2,204.9 | |||||||||||||
| Adjusted Operating profit (loss) | 351.0 | 792.3 | 193.7 | (259.3 | ) | 1,077.7 | |||||||||||||
| Adjusted Depreciation and amortization | 349.2 | 38.1 | 66.6 | 5.2 | 459.1 | ||||||||||||||
| Adjusted EBITDA | $ | 700.2 | $ | 830.4 | $ | 260.3 | $ | (254.1 | ) | $ | 1,536.8 | ||||||||
| Operating profit margin | (31.6 | )% | 13.5 | % | 10.9 | % | (9.0 | )% | |||||||||||
| Adjusted Operating profit margin | 7.3 | % | 12.9 | % | 12.2 | % | 8.6 | % | |||||||||||
| Adjusted EBITDA margin | 14.5 | % | 13.6 | % | 16.3 | % | 12.2 | % | |||||||||||
| Year Ended | |||||||||||||||||||
| December 31, 2017 | |||||||||||||||||||
| Subsea | Onshore/ Offshore | Surface Technologies | Corporate and Other | Total | |||||||||||||||
| Revenue | $ | 5,877.4 | $ | 7,904.5 | $ | 1,274.6 | $ | 0.4 | $ | 15,056.9 | |||||||||
| Operating profit (loss), as reported (pre-tax) | $ | 460.5 | $ | 810.9 | $ | 82.7 | $ | (359.2 | ) | $ | 994.9 | ||||||||
| Charges and (credits): | |||||||||||||||||||
| Impairment and other charges | 11.5 | — | 10.2 | 12.6 | 34.3 | ||||||||||||||
| Restructuring and other severance charges | 88.4 | 27.0 | 9.0 | 32.8 | 157.2 | ||||||||||||||
| Business combination transaction and integration costs | — | — | — | 101.8 | 101.8 | ||||||||||||||
| Change in accounting estimate | 11.8 | — | 10.1 | — | 21.9 | ||||||||||||||
| Purchase price accounting adjustments - non-amortization related | 40.5 | — | 43.3 | (25.6 | ) | 58.2 | |||||||||||||
| Purchase price accounting adjustments - amortization related | 139.2 | — | 12.4 | (1.2 | ) | 150.4 | |||||||||||||
| Subtotal | 291.4 | 27.0 | 85.0 | 120.4 | 523.8 | ||||||||||||||
| Adjusted Operating profit (loss) | 751.9 | 837.9 | 167.7 | (238.8 | ) | 1,518.7 | |||||||||||||
| Adjusted Depreciation and amortization | 368.0 | 41.1 | 51.1 | 4.1 | 464.3 | ||||||||||||||
| Adjusted EBITDA | $ | 1,119.9 | $ | 879.0 | $ | 218.8 | $ | (234.7 | ) | $ | 1,983.0 | ||||||||
| Operating profit margin | 7.8 | % | 10.3 | % | 6.5 | % | 6.6 | % | |||||||||||
| Adjusted Operating profit margin | 12.8 | % | 10.6 | % | 13.2 | % | 10.1 | % | |||||||||||
| Adjusted EBITDA margin | 19.1 | % | 11.1 | % | 17.2 | % | 13.2 | % | |||||||||||
Inbound Orders Year Ended December 31, | |||||||
| (In millions) | 2018 | 2017 | |||||
| Subsea | $ | 5,178.5 | $ | 5,143.6 | |||
| Onshore/Offshore | 7,425.9 | 3,812.9 | |||||
| Surface Technologies | 1,686.6 | 1,239.8 | |||||
| Total inbound orders | $ | 14,291.0 | $ | 10,196.3 | |||
Order Backlog December 31, | |||||||
| (In millions) | 2018 | 2017 | |||||
| Subsea | $ | 5,999.6 | $ | 6,203.9 | |||
| Onshore/Offshore | 8,090.5 | 6,369.1 | |||||
| Surface Technologies | 469.9 | 409.8 | |||||
| Total order backlog | $ | 14,560.0 | $ | 12,982.8 | |||
| Non-consolidated backlog | |||
| (In millions) | December 31, 2018 | ||
| Subsea | $ | 974.0 | |
| Onshore/Offshore | 1,748.5 | ||
| Total order backlog | $ | 2,722.5 | |
| (In millions) | December 31, 2018 | December 31, 2017 | |||||
| Cash and cash equivalents | $ | 5,540.0 | $ | 6,737.4 | |||
| Short-term debt and current portion of long-term debt | (67.4 | ) | (77.1 | ) | |||
| Long-term debt, less current portion | (4,124.3 | ) | (3,777.9 | ) | |||
| Net cash | $ | 1,348.3 | $ | 2,882.4 | |||
| Year Ended December 31, | |||||||||||
| (In millions) | 2018 | 2017 | 2016 | ||||||||
| Cash provided (required) by operating activities | $ | (185.4 | ) | $ | 210.7 | $ | 493.8 | ||||
| Cash provided (required) by investing activities | (460.2 | ) | 1,250.0 | 3,110.5 | |||||||
| Cash required by financing activities | (444.8 | ) | (1,054.8 | ) | (534.6 | ) | |||||
| Effect of exchange rate changes on cash and cash equivalents | (107.0 | ) | 62.2 | 21.6 | |||||||
| Increase (decrease) in cash and cash equivalents | $ | (1,197.4 | ) | $ | 468.1 | $ | 3,091.3 | ||||
| Working capital | $ | (759.0 | ) | $ | (725.2 | ) | $ | (142.7 | ) | ||
| (In millions) | December 31, 2018 | December 31, 2017 | |||||
| Revolving credit facility | $ | — | $ | — | |||
| Bilateral credit facilities | — | — | |||||
| Commercial paper | 1,916.1 | 1,450.4 | |||||
| Synthetic bonds due 2021 | 490.9 | 502.4 | |||||
| 3.45% Senior Notes due 2022 | 500.0 | 500.0 | |||||
| 5.00% Notes due 2020 | 229.0 | 239.9 | |||||
| 3.40% Notes due 2022 | 171.8 | 179.9 | |||||
| 3.15% Notes due 2023 | 148.9 | 155.9 | |||||
| 3.15% Notes due 2023 | 143.1 | 149.9 | |||||
| 4.00% Notes due 2027 | 85.9 | 89.9 | |||||
| 4.00% Notes due 2032 | 114.5 | 119.9 | |||||
| 3.75% Notes due 2033 | 114.5 | 119.9 | |||||
| Bank borrowings | 265.2 | 332.5 | |||||
| Other | 23.2 | 28.2 | |||||
| Unamortized debt issuance costs and discounts | (11.4 | ) | (13.8 | ) | |||
| Total borrowings | $ | 4,191.7 | $ | 3,855.0 | |||
(In millions) Description | Amount | Debt Outstanding | Commercial Paper Outstanding (a) | Letters of Credit | Unused Capacity | Maturity | |||||||||||||||
| Five-year revolving credit facility | $ | 2,500.0 | $ | — | $ | 1,916.1 | $ | — | $ | 583.9 | January 2023 | ||||||||||
| Payments Due by Period | |||||||||||||||||||
| (In millions) | Total payments | Less than 1 year | 1-3 years | 3-5 years | After 5 years | ||||||||||||||
Debt (a) | $ | 4,191.7 | $ | 67.4 | $ | 2,854.2 | $ | 962.9 | $ | 307.2 | |||||||||
Interest on debt (a) | 394.8 | 60.6 | 121.1 | 93.7 | 119.4 | ||||||||||||||
Operating leases (b) | 1,519.7 | 329.8 | 478.4 | 225.9 | 485.6 | ||||||||||||||
Purchase obligations (c) | 3,766.1 | 3,211.8 | 552.0 | 0.4 | 1.9 | ||||||||||||||
Pension and other post-retirement benefits (d) | 14.5 | 14.5 | — | — | — | ||||||||||||||
Unrecognized tax benefits (e) | 93.8 | 1.3 | 69.1 | 23.4 | — | ||||||||||||||
Other contractual obligations (f) | 1,028.3 | 358.3 | 400.0 | 220.0 | 50.0 | ||||||||||||||
| Total contractual obligations | $ | 11,008.9 | $ | 4,043.7 | $ | 4,474.8 | $ | 1,526.3 | $ | 964.1 | |||||||||
| Amount of Commitment Expiration per Period | |||||||||||||||||||
| (In millions) | Total amount | Less than 1 year | 1-3 years | 3-5 years | After 5 years | ||||||||||||||
Letters of credit and bank guarantees (a) | $ | 4,796.9 | $ | 1,932.5 | $ | 2,024.5 | $ | 670.4 | $ | 169.5 | |||||||||
Surety bonds (a) | 1.1 | 1.1 | — | — | — | ||||||||||||||
| Total other off-balance sheet arrangements | $ | 4,798.0 | $ | 1,933.6 | $ | 2,024.5 | $ | 670.4 | $ | 169.5 | |||||||||
Due to the nature of the work required to be performed on many of ourthe performance obligations, themanagement’s estimation of total revenue and cost at completion is complex, subject to many variables and requires significant judgment. It is common for our long-term contracts to contain award fees, incentive fees, or other provisions that can either increase or decrease the transaction price. We include estimated amounts in the transaction price when we believe we have an enforceable right to the modification, the amount can be estimated reliably, and its realization is probable. The estimated amounts are included in the transaction price to the extent it is probable that a significant reversal of cumulative revenue recognized will not occur when the uncertainty associated with the variable consideration is resolved.
The principal considerations for our determination that performing procedures relating to revenue recognition - determination of estimated costs to complete for long-term contracts is a critical audit matter are the significant judgment by management when determining the estimated costs to complete for long-term contracts, which in turn led to a high degree of auditor judgment, subjectivity and effort in performing procedures and evaluating management’s significant assumptions related to the estimates of costs to complete.
Addressing the matter involved performing procedures and evaluating audit evidence in connection with forming our overall opinion on the consolidated financial statements. These procedures included testing the effectiveness of controls relating to the revenue recognition process, including controls over the determination of estimated costs to complete for long-term contracts. These procedures also included, among others, testing management’s process for determining the estimated costs to complete for a selection of long-term contracts by (i) obtaining executed purchase orders and agreements, (ii) evaluating the appropriateness of the method to measure progress towards completion, (iii) testing the completeness and accuracy of the underlying data used by management, and (iv) evaluating the reasonableness of significant assumptions related to the estimates of costs to complete. Evaluating the reasonableness of significant assumptions involved assessing management’s ability to reasonably estimate costs to complete long-term contracts, as applicable, by (i) performing procedures to assess the reasonableness of estimated costs to complete, (ii) testing management’s process to evaluate the timely identification of circumstances which may warrant a modification to a previous cost estimate, (iii) testing management’s process to evaluate contract contingencies relative to the contractual terms and actual progress of contracts, and (iv) performing procedures to assess the reasonableness of changes in life of project margin.
79
Long-Lived Asset Impairments - Certain Asset Groups in the Subsea and Surface Segments
As described in Notes 1, 14, and 19 to the consolidated financial statements, the Company’s consolidated net property, plant and equipment was $2,861.8 million as of December 31, 2020. For the year ended December 31, 2018 was negatively impacted by approximately $6.7 million, as a result of changes2020, the Company recorded impairment charges in contract estimates relatedrelation to projects that werecertain asset groups in progress at December 31, 2017. During the year ended December 31, 2018, we recognized changes in our estimates that had an impact on our margin in the amounts of $(5.1) million, $(5.9) million and $4.3 million in our Onshore/Offshore, Subsea and Surface technologies segments respectively. The changes in contract estimates are attributed to better than expected performance throughout our execution of our projects.
| (In millions, except basis points) | Increase (Decrease) in 2018 Pension Expense Before Income Taxes | Increase (Decrease) in Projected Benefit Obligation at December 31, 2018 | |||||
| 25 basis point decrease in discount rate | $ | 1.1 | $ | 48.2 | |||
| 25 basis point increase in discount rate | $ | (1.0 | ) | $ | (49.0 | ) | |
| 25 basis point decrease in expected long-term rate of return on plan assets | $ | 2.6 | N/A | ||||
| 25 basis point increase in expected long-term rate of return on plan assets | $ | (2.6 | ) | N/A | |||
The principal considerations for our determination that performing procedures relating to the long-lived asset impairments – certain asset groups in the Subsea and Surface segments is a critical audit matter are the significant judgment by management when determining the fair value estimates, which in turn led to a high degree of auditor judgment, subjectivity and effort in performing procedures and evaluating management’s significant assumptions related to future market conditions deteriorate beyondrevenue for certain asset groups in the Subsea segment and future revenue and operating costs for certain asset groups in the Surface segment.
Addressing the matter involved performing procedures and evaluating audit evidence in connection with forming our current expectations and assumptions, impairmentsoverall opinion on the consolidated financial statements. These procedures included testing the effectiveness of controls relating to management’s long-lived assets may be identified if we conclude that the carrying amounts are no longer recoverable.
/s/ PricewaterhouseCoopers LLP
Houston, Texas
March 5, 2021
We have served as the relationship between our market capitalization and our consolidated book value of equity.Company’s auditor since 2017.
80
TECHNIPFMC PLC AND CONSOLIDATED SUBSIDIARIES
CONSOLIDATED STATEMENTS OF INCOME
| Year Ended | |||||||||||||||||
| (In millions, except per share data) | 2020 | 2019 | 2018 | ||||||||||||||
| Revenue | |||||||||||||||||
| Service revenue | $ | 9,708.2 | $ | 9,789.7 | $ | 9,057.6 | |||||||||||
| Product revenue | 3,200.4 | 3,352.9 | 3,272.6 | ||||||||||||||
| Lease revenue | 142.0 | 266.5 | 222.7 | ||||||||||||||
| Total revenue | 13,050.6 | 13,409.1 | 12,552.9 | ||||||||||||||
| Costs and expenses | |||||||||||||||||
| Cost of service revenue | 8,261.9 | 7,767.2 | 7,452.7 | ||||||||||||||
| Cost of product revenue | 2,830.8 | 3,015.6 | 2,676.9 | ||||||||||||||
| Cost of lease revenue | 116.7 | 167.9 | 143.4 | ||||||||||||||
| Selling, general and administrative expense | 1,066.2 | 1,228.1 | 1,140.6 | ||||||||||||||
| Research and development expense | 119.8 | 162.9 | 189.2 | ||||||||||||||
| Impairment, restructuring and other expense (Note 19) | 3,501.3 | 2,490.8 | 1,831.2 | ||||||||||||||
| Separation costs (Note 3) | 39.5 | 72.1 | 0 | ||||||||||||||
| Merger transaction and integration costs | — | 31.2 | 36.5 | ||||||||||||||
| Total costs and expenses | 15,936.2 | 14,935.8 | 13,470.5 | ||||||||||||||
| Other income (expense), net | 31.1 | (220.7) | (323.9) | ||||||||||||||
| Income from equity affiliates (Note 12) | 63.0 | 62.9 | 114.3 | ||||||||||||||
| Loss before interest income, interest expense and income taxes | (2,791.5) | (1,684.5) | (1,127.2) | ||||||||||||||
| Interest income | 56.6 | 116.5 | 121.4 | ||||||||||||||
| Interest expense | (349.6) | (567.8) | (482.3) | ||||||||||||||
| Loss before income taxes | (3,084.5) | (2,135.8) | (1,488.1) | ||||||||||||||
| Provision for income taxes (Note 21) | 153.4 | 276.3 | 422.7 | ||||||||||||||
| Net loss | (3,237.9) | (2,412.1) | (1,910.8) | ||||||||||||||
| Net profit attributable to non-controlling interests | (49.7) | (3.1) | (10.8) | ||||||||||||||
| Net loss attributable to TechnipFMC plc | $ | (3,287.6) | $ | (2,415.2) | $ | (1,921.6) | |||||||||||
| Earnings (loss) per share attributable to TechnipFMC plc (Note 8) | |||||||||||||||||
| Basic | $ | (7.33) | $ | (5.39) | $ | (4.20) | |||||||||||
| Diluted | $ | (7.33) | $ | (5.39) | $ | (4.20) | |||||||||||
| Weighted average shares outstanding (Note 8) | |||||||||||||||||
| Basic | 448.7 | 448.0 | 458.0 | ||||||||||||||
| Diluted | 448.7 | 448.0 | 458.0 | ||||||||||||||
The income approach estimates fair value by discounting each reporting unit’s estimated future cash flows using a weighted-average cost of capital that reflects current market conditions and the risk profileaccompanying notes are an integral part of the reporting unit. To arrive at our future cash flows, we use estimatesconsolidated financial statements.
81
TECHNIPFMC PLC AND CONSOLIDATED SUBSIDIARIES
CONSOLIDATED STATEMENTS OF COMPREHENSIVE INCOME
| Year Ended | |||||||||||||||||
| (In millions) | 2020 | 2019 | 2018 | ||||||||||||||
| Net loss | $ | (3,237.9) | $ | (2,412.1) | $ | (1,910.8) | |||||||||||
| Foreign currency translation adjustments | |||||||||||||||||
| Net gain (losses) arising during the period | (169.1) | 15.6 | (183.3) | ||||||||||||||
| Reclassification adjustment for net gains included in net income | — | (12.0) | (41.1) | ||||||||||||||
Foreign currency translation adjustments(a) | (169.1) | 3.6 | (224.4) | ||||||||||||||
| Net gains (losses) on hedging instruments | |||||||||||||||||
| Net gains (losses) arising during the period | 25.4 | 8.9 | (58.7) | ||||||||||||||
| Reclassification adjustment for net losses (gains) included in net income | 13.0 | 18.2 | (2.0) | ||||||||||||||
Net gains (losses) on hedging instruments (b) | 38.4 | 27.1 | (60.7) | ||||||||||||||
| Pension and other post-retirement benefits | |||||||||||||||||
| Net losses arising during the period | (88.3) | (81.5) | (72.4) | ||||||||||||||
| Prior service cost arising during the period | (4.6) | (0.7) | (2.1) | ||||||||||||||
| Reclassification adjustment for settlement losses (gains) included in net income | 1.4 | 0.2 | (2.5) | ||||||||||||||
| Reclassification adjustment for amortization of prior service cost included in net income | 0.9 | 2.0 | 1.2 | ||||||||||||||
| Reclassification adjustment for amortization of net actuarial loss included in net income | 6.9 | 0.8 | 0.3 | ||||||||||||||
Net pension and other post-retirement benefits (c) | (83.7) | (79.2) | (75.5) | ||||||||||||||
| Other comprehensive loss, net of tax | (214.4) | (48.5) | (360.6) | ||||||||||||||
| Comprehensive loss | (3,452.3) | (2,460.6) | (2,271.4) | ||||||||||||||
| Comprehensive income attributable to non-controlling interest | (50.4) | (2.4) | (6.2) | ||||||||||||||
| Comprehensive loss attributable to TechnipFMC plc | $ | (3,502.7) | $ | (2,463.0) | $ | (2,277.6) | |||||||||||
(a)Net of economicincome tax (expense) benefit of NaN, $7.9 and market assumptions, including growth rates in revenues, costs, estimates of future expected changes in operating margins, tax rates and cash expenditures. Future revenues are also adjusted to match changes in our business strategy. We believe this approach is an appropriate valuation method. Under$3.6 for the market multiple approach, we determine the estimated fair value of each of our reporting units by applying transaction multiples to each reporting unit’s projected EBITDA and then averaging that estimate with similar historical calculations using either a one, two or three year average. Our reporting unit valuations were determined primarily by utilizing the income approach, with a lesser weighting attributed the market multiple approach.
(b)Net of goodwill impairment charges in our Subsea reporting unit. Refer to Note 17 to our consolidated financial statements included in Part II, Item 8income tax (expense) benefit of this Annual Report on Form 10-K$(9.7), $(6.9) and $16.6 for additional disclosure related to the impairment of goodwill during the yearyears ended December 31, 2018.2020, 2019 and 2018, respectively.
The accompanying notes are an integral part of the settlement will not exceed current accruals. These authorities have a broad range of civil and criminal sanctions under anticorruption laws and regulations, which they may seek to impose against corporations and individuals in appropriate circumstances including, but not limited to, fines, penalties and modifications to business practices and compliance programs. These authorities have entered into agreements with, and obtained a range of sanctions against, numerous public corporations and individuals arising from allegations of improper payments whereby civil and/or criminal penalties were imposed. Recent civil and criminal settlements have included fines, deferred prosecution agreements, guilty pleas and other sanctions, including the requirement that the relevant corporation retain a monitor to oversee its compliance with anticorruption laws. Any of these remedial measures, if applicable to us, as well as potential customer reaction to such remedial measures, could have a material adverse impact on our business, results of operations and financial condition.
82
TECHNIPFMC PLC AND CONSOLIDATED SUBSIDIARIES CONSOLIDATED BALANCE SHEETS | |||||||||||
| (In millions, except par value data) | December 31, | ||||||||||
| Assets | 2020 | 2019 | |||||||||
| Cash and cash equivalents | $ | 4,807.8 | $ | 5,190.2 | |||||||
| Trade receivables, net of allowances of $108.9 in 2020 and $95.4 in 2019 | 2,289.8 | 2,287.1 | |||||||||
| Contract assets, net of allowances of $1.0 in 2020 and $2.5 in 2019 | 1,267.6 | 1,520.0 | |||||||||
| Inventories, net (Note 9) | 1,268.5 | 1,416.0 | |||||||||
| Derivative financial instruments (Note 23) | 301.4 | 101.9 | |||||||||
| Income taxes receivable | 313.4 | 264.6 | |||||||||
| Advances paid to suppliers | 203.6 | 242.9 | |||||||||
| Other current assets (Note 10) | 992.6 | 863.7 | |||||||||
| Total current assets | 11,444.7 | 11,886.4 | |||||||||
| Investments in equity affiliates (Note 12) | 358.9 | 300.4 | |||||||||
| Property, plant and equipment, net (Note 14) | 2,861.8 | 3,162.0 | |||||||||
| Operating lease right-of-use assets (Note 5) | 1,016.7 | 892.6 | |||||||||
| Finance lease right-of-use assets (Note 5) | 27.5 | 0 | |||||||||
| Goodwill (Note 15) | 2,512.5 | 5,598.3 | |||||||||
| Intangible assets, net (Note 15) | 981.1 | 1,086.6 | |||||||||
| Deferred income taxes (Note 21) | 217.9 | 260.5 | |||||||||
| Derivative financial instruments (Note 23) | 35.9 | 39.5 | |||||||||
| Other assets | 235.6 | 292.5 | |||||||||
| Total assets | $ | 19,692.6 | $ | 23,518.8 | |||||||
| Liabilities and equity | |||||||||||
| Short-term debt and current portion of long-term debt (Note 16) | $ | 636.2 | $ | 495.4 | |||||||
| Operating lease liabilities (Note 5) | 247.0 | 275.1 | |||||||||
| Finance lease liabilities (Note 5) | 26.9 | 0 | |||||||||
| Accounts payable, trade | 2,740.3 | 2,659.8 | |||||||||
| Contract liabilities | 4,736.1 | 4,585.1 | |||||||||
| Accrued payroll | 418.8 | 411.5 | |||||||||
| Derivative financial instruments (Note 23) | 167.2 | 141.3 | |||||||||
| Income taxes payable | 74.1 | 75.7 | |||||||||
| Other current liabilities (Note 10) | 1,368.6 | 1,494.5 | |||||||||
| Total current liabilities | 10,415.2 | 10,138.4 | |||||||||
| Long-term debt, less current portion (Note 16) | 3,317.7 | 3,980.0 | |||||||||
| Operating lease liabilities, less current portion (Note 5) | 881.0 | 681.7 | |||||||||
| Deferred income taxes (Note 21) | 79.5 | 138.2 | |||||||||
| Accrued pension and other post-retirement benefits, less current portion (Note 22) | 420.8 | 368.6 | |||||||||
| Derivative financial instruments (Note 23) | 23.3 | 52.7 | |||||||||
| Other liabilities | 297.1 | 430.0 | |||||||||
| Total liabilities | 15,434.6 | 15,789.6 | |||||||||
| Commitments and contingent liabilities (Note 20) | 0 | 0 | |||||||||
| Mezzanine equity | |||||||||||
| Redeemable non-controlling interest | 43.7 | 41.1 | |||||||||
| Stockholders’ equity (Note 17) | |||||||||||
| Ordinary shares, $1 par value; 618.3 shares authorized in 2020 and 2019; 449.5 shares and 447.1 shares issued and outstanding in 2020 and 2019, respectively; NaN and 4.0 shares canceled in 2020 and 2019, respectively | 449.5 | 447.1 | |||||||||
| Capital in excess of par value of ordinary shares | 10,242.4 | 10,182.8 | |||||||||
| Accumulated deficit | (4,915.2) | (1,563.1) | |||||||||
| Accumulated other comprehensive loss | (1,622.5) | (1,407.5) | |||||||||
| Total TechnipFMC plc stockholders’ equity | 4,154.2 | 7,659.3 | |||||||||
| Non-controlling interests | 60.1 | 28.8 | |||||||||
| Total equity | 4,214.3 | 7,688.1 | |||||||||
| Total liabilities and equity | $ | 19,692.6 | $ | 23,518.8 | |||||||
The accompanying notes are an integral part of this Annual Report on Form 10-K.
the consolidated financial statements.
83
TECHNIPFMC PLC AND CONSOLIDATED SUBSIDIARIES
CONSOLIDATED STATEMENTS OF CASH FLOWS
| Year Ended December 31, | |||||||||||||||||
| (In millions) | 2020 | 2019 | 2018 | ||||||||||||||
| Cash provided (required) by operating activities | |||||||||||||||||
| Net loss | $ | (3,237.9) | $ | (2,412.1) | $ | (1,910.8) | |||||||||||
| Adjustments to reconcile net income to cash provided (required) by operating activities | |||||||||||||||||
| Depreciation | 323.5 | 383.5 | 367.8 | ||||||||||||||
| Amortization | 123.7 | 126.1 | 182.6 | ||||||||||||||
| Impairments (Note 19) | 3,287.4 | 2,484.1 | 1,792.6 | ||||||||||||||
| Employee benefit plan and share-based compensation costs | 47.5 | 63.3 | 22.4 | ||||||||||||||
| Deferred income tax provision (benefit), net | (6.7) | (75.4) | 48.8 | ||||||||||||||
| Unrealized loss (gain) on derivative instruments and foreign exchange | (41.2) | 32.5 | 102.7 | ||||||||||||||
| Income from equity affiliates, net of dividends received | (58.1) | (58.8) | (110.7) | ||||||||||||||
| Other | 195.5 | 364.4 | 291.8 | ||||||||||||||
| Changes in operating assets and liabilities, net of effects of acquisitions | |||||||||||||||||
| Trade receivables, net and contract assets | 348.1 | (39.7) | (664.1) | ||||||||||||||
| Inventories, net | 82.8 | (169.6) | (339.4) | ||||||||||||||
| Accounts payable, trade | 18.4 | 26.1 | (1,248.7) | ||||||||||||||
| Contract liabilities | (75.2) | 520.1 | 762.7 | ||||||||||||||
| Income taxes payable (receivable), net | (52.8) | 12.7 | (190.7) | ||||||||||||||
| Other current assets and liabilities, net | (267.3) | (431.8) | 921.2 | ||||||||||||||
| Other noncurrent assets and liabilities, net | (30.8) | 23.1 | (213.6) | ||||||||||||||
| Cash provided (required) by operating activities | 656.9 | 848.5 | (185.4) | ||||||||||||||
| Cash required by investing activities | |||||||||||||||||
| Capital expenditures | (291.8) | (454.4) | (368.1) | ||||||||||||||
| Payment to acquire debt securities | (3.9) | (71.6) | 0 | ||||||||||||||
| Proceeds from sale of debt securities | 51.5 | 18.9 | 0 | ||||||||||||||
| Acquisition of equity securities | (17.9) | 0 | 0 | ||||||||||||||
| Acquisitions, net of cash acquired | 0 | 16.0 | (104.9) | ||||||||||||||
| Cash received from (used by) divestitures | 8.8 | (2.1) | (6.7) | ||||||||||||||
| Proceeds from sale of assets | 46.0 | 7.8 | 19.5 | ||||||||||||||
| Proceeds from repayment of advance to joint venture | 26.7 | 62.0 | — | ||||||||||||||
| Other | — | 3.6 | 0 | ||||||||||||||
| Cash required by investing activities | (180.6) | (419.8) | (460.2) | ||||||||||||||
| Cash required by financing activities | |||||||||||||||||
| Net decrease in short-term debt | (24.4) | (49.6) | (34.9) | ||||||||||||||
| Net increase (decrease) in commercial paper | (554.5) | 57.3 | 496.6 | ||||||||||||||
| Proceeds from issuance of long-term debt | 223.2 | 96.2 | — | ||||||||||||||
| Repayments of long-term debt | (423.9) | 0 | 0 | ||||||||||||||
| Purchase of ordinary shares | — | (92.7) | (442.6) | ||||||||||||||
| Dividends paid | (59.2) | (232.8) | (238.1) | ||||||||||||||
| Payments related to taxes withheld on share-based compensation | (7.4) | — | 0 | ||||||||||||||
| Settlements of mandatorily redeemable financial liability | (224.2) | (562.8) | (225.8) | ||||||||||||||
| Acquisition of non-controlling interest | (11.8) | 0 | 0 | ||||||||||||||
| Cash required by financing activities | (1,082.2) | (784.4) | (444.8) | ||||||||||||||
| Effect of changes in foreign exchange rates on cash and cash equivalents | 223.5 | 5.9 | (107.0) | ||||||||||||||
| Decrease in cash and cash equivalents | (382.4) | (349.8) | (1,197.4) | ||||||||||||||
| Cash and cash equivalents, beginning of year | 5,190.2 | 5,540.0 | 6,737.4 | ||||||||||||||
| Cash and cash equivalents, end of year | $ | 4,807.8 | $ | 5,190.2 | $ | 5,540.0 | |||||||||||
84
| Year Ended December 31, | |||||||||||||||||
| (In millions) | 2020 | 2019 | 2018 | ||||||||||||||
| Supplemental disclosures of cash flow information | |||||||||||||||||
| Cash paid for interest (net of interest capitalized) | $ | 107.0 | $ | 109.4 | $ | 99.0 | |||||||||||
| Cash paid for income taxes (net of refunds received) | $ | 219.7 | $ | 374.5 | $ | 410.6 | |||||||||||
The accompanying notes are an integral part of the consolidated financial statements.
85
TECHNIPFMC PLC AND CONSOLIDATED SUBSIDIARIES
CONSOLIDATED STATEMENTS OF CHANGES IN STOCKHOLDERS’ EQUITY
| (In millions) | Ordinary Shares | Ordinary Shares Held in Treasury and Employee Benefit Trust | Capital in Excess of Par Value of Ordinary Shares | Retained Earnings (Accumulated Deficit) | Accumulated Other Comprehensive Income (Loss) | Non- controlling Interest | Total Stockholders’ Equity | ||||||||||||||||||||||||||||||||||
| Balance as of December 31, 2017 | $ | 465.1 | $ | (4.8) | $ | 10,483.3 | $ | 3,406.0 | $ | (1,003.7) | $ | 21.5 | $ | 13,367.4 | |||||||||||||||||||||||||||
| Adoption of accounting standards (Note 6) | — | — | — | (91.5) | — | 0.1 | (91.4) | ||||||||||||||||||||||||||||||||||
| Net income (loss) | — | — | — | (1,921.6) | — | 10.8 | (1,910.8) | ||||||||||||||||||||||||||||||||||
| Other comprehensive loss | — | — | — | — | (356.0) | (4.6) | (360.6) | ||||||||||||||||||||||||||||||||||
| Cancellation of treasury shares (Note 17) | (14.8) | — | (333.5) | (94.5) | — | — | (442.8) | ||||||||||||||||||||||||||||||||||
| Issuance of ordinary shares | 0.2 | — | — | — | — | — | 0.2 | ||||||||||||||||||||||||||||||||||
| Net sales of ordinary shares for employee benefit trust | — | 2.4 | — | — | — | — | 2.4 | ||||||||||||||||||||||||||||||||||
| Cash dividends declared ($0.52 per share) (Note 17) | — | — | — | (238.1) | — | — | (238.1) | ||||||||||||||||||||||||||||||||||
| Share-based compensation (Note 18) | — | — | 49.1 | — | — | — | 49.1 | ||||||||||||||||||||||||||||||||||
| Other | — | — | (1.9) | 11.9 | — | 3.5 | 13.5 | ||||||||||||||||||||||||||||||||||
| Balance as of December 31, 2018 | $ | 450.5 | $ | (2.4) | $ | 10,197.0 | $ | 1,072.2 | $ | (1,359.7) | $ | 31.3 | $ | 10,388.9 | |||||||||||||||||||||||||||
| Adoption of accounting standards (Note 5) | — | — | — | 1.8 | — | — | 1.8 | ||||||||||||||||||||||||||||||||||
| Net income (loss) | — | — | — | (2,415.2) | — | 3.1 | (2,412.1) | ||||||||||||||||||||||||||||||||||
| Other comprehensive loss | — | — | — | — | (47.8) | (0.7) | (48.5) | ||||||||||||||||||||||||||||||||||
| Cancellation of treasury shares (Note 17) | (4.0) | — | (88.7) | — | — | — | (92.7) | ||||||||||||||||||||||||||||||||||
| Issuance of ordinary shares | 0.6 | — | — | — | — | — | 0.6 | ||||||||||||||||||||||||||||||||||
| Net sales of ordinary shares for employee benefit trust | — | 2.4 | — | — | — | — | 2.4 | ||||||||||||||||||||||||||||||||||
| Cash dividends declared ($0.52 per share) (Note 17) | — | — | — | (232.8) | — | — | (232.8) | ||||||||||||||||||||||||||||||||||
| Share-based compensation (Note 18) | — | — | 74.5 | — | — | — | 74.5 | ||||||||||||||||||||||||||||||||||
| Other | — | — | — | 10.9 | — | (4.9) | 6.0 | ||||||||||||||||||||||||||||||||||
| Balance as of December 31, 2019 | $ | 447.1 | $ | 0 | $ | 10,182.8 | $ | (1,563.1) | $ | (1,407.5) | $ | 28.8 | $ | 7,688.1 | |||||||||||||||||||||||||||
| Adoption of accounting standards (Note 4) | — | — | — | (7.8) | — | — | (7.8) | ||||||||||||||||||||||||||||||||||
| Net income (loss) | — | — | — | (3,287.6) | — | 49.7 | (3,237.9) | ||||||||||||||||||||||||||||||||||
| Other comprehensive loss | — | — | — | — | (215.0) | 0.6 | (214.4) | ||||||||||||||||||||||||||||||||||
| Issuance of ordinary shares | 2.4 | — | (9.4) | — | — | — | (7.0) | ||||||||||||||||||||||||||||||||||
| Cash dividends declared ($0.13 per share) (Note 17) | — | — | — | (59.2) | — | — | (59.2) | ||||||||||||||||||||||||||||||||||
| Share-based compensation (Note 18) | — | — | 69.0 | — | — | — | 69.0 | ||||||||||||||||||||||||||||||||||
| Acquisition of non-controlling interest | — | — | — | (9.4) | — | (2.1) | (11.5) | ||||||||||||||||||||||||||||||||||
| Other | — | — | — | 11.9 | — | (16.9) | (5.0) | ||||||||||||||||||||||||||||||||||
| Balance as of December 31, 2020 | $ | 449.5 | $ | 0 | $ | 10,242.4 | $ | (4,915.2) | $ | (1,622.5) | $ | 60.1 | $ | 4,214.3 | |||||||||||||||||||||||||||
The accompanying notes are an integral part of the consolidated financial statements.
86
TECHNIPFMC PLC AND CONSOLIDATED SUBSIDIARIES
NOTES TO CONSOLIDATED FINANCIAL STATEMENTS
Nature of operations - TechnipFMC plc and consolidated subsidiaries (“TechnipFMC,” “we,” “us” or “our”) is a global leader in oil and gas projects, technologies, systems and services through our business segments: Subsea, Technip Energies and Surface Technologies. We have manufacturing operations worldwide, strategically located to facilitate delivery of our products, systems and services to our customers. On February 16, 2021, we completed the separation of Technip Energies segment (the “Spin-off”). Subsequent to the Spin-off, we will operate under two reporting segments: Subsea and Surface Technologies.
In this Annual Report on Form 10-K, we are subject to financial market risks, including fluctuations in foreign currency exchange rates and interest rates. In order to manage and mitigatereporting the results of our exposure to these risks, we may use derivative financial instruments in accordance with established policies and procedures. We do not use derivative financial instruments whereoperations for the objective is to generate profits solely from trading activities. Atyear ended December 31, 2018 and December 31, 2017, substantially all of our derivative holdings consisted of foreign currency forward contracts and foreign currency instruments embedded in purchase and sale contracts.
Use of material misstatement, whether dueestimates - The preparation of financial statements in conformity with GAAP requires management to error or fraud,make estimates and whether effective internal control over financial reporting were maintained in all material respects.
Investments in the common stock of unconsolidated affiliates - The equity method of accounting is used to account for investments in unconsolidated affiliates where we have the ability to exert significant influence over the affiliates’ operating and financial policies. We measure equity investments not accounted for under the equity method at fair value and recognize any changes in fair value in net income. For certain construction joint ventures, we use the proportionate consolidation method, whereby our proportionate share of each entity’s assets, liabilities, revenues and expenses are included performing procedures to assessin the risks of material misstatement of the consolidated financial statements, whether due to error or fraud, and performing procedures that respond to those risks. Such procedures included examining, on a test basis, evidence regarding the amounts and disclosuresappropriate classifications in the consolidated financial statements. Our audits also included evaluating the accounting principles usedIntercompany balances and significant estimates made by management, as well as evaluating the overall presentation oftransactions have been eliminated in preparing the consolidated financial statements. Our audit
Investments in unconsolidated affiliates are assessed for impairment whenever events or changes in facts and circumstances indicate the carrying value of internal control over financial reporting included obtaining an understandingthe investments may not be fully recoverable. When such a condition is subjectively determined to be other than temporary, the carrying value of internal control over financial reporting, assessing the riskinvestment is written down to fair value. Management’s assessment as to whether any decline in value is other than temporary is based on our ability and intent to hold the investment and whether evidence indicating the carrying value of the investment is recoverable within a reasonable period of time outweighs evidence to the contrary. Management generally considers our investments in equity method investees to be strategic, long-term investments and completes its assessments for impairment with a long-term viewpoint.
Investments in which ownership is less than 20% or that a material weaknessdo not represent significant investments are reported in other assets in the consolidated balance sheets. Where no active market exists and testing and evaluatingwhere no other valuation method can be used, these financial assets are maintained at cost minus impairment, if any, plus or minus changes resulting from observable price changes in orderly transactions for the design and operating effectivenessidentical or a similar investment of internal controlthe same issuer.
87
We determine whether investments involve a variable interest entity (“VIE”) based on the assessed risk. Our audits also included performing suchcharacteristics of the subject entity. If the entity is determined to be a VIE, then management determines if we are the primary beneficiary of the entity and whether or not consolidation of the VIE is required. The primary beneficiary consolidating the VIE must normally have both (i) the power to direct the activities that most significantly affect the VIE’s economic performance and (ii) the obligation to absorb significant losses of or the right to receive significant benefits from the VIE. If we are deemed to be the primary beneficiary, the VIE is consolidated and the other procedures as we considered necessaryparty’s equity interest in the circumstances.VIE is accounted for as a non-controlling interest. Our unconsolidated VIEs are accounted for using the equity method of accounting.
Business combinations - Business combinations are accounted for using the acquisition method of accounting. Under the acquisition method, assets acquired and liabilities assumed are recorded at their respective fair values as of the acquisition date. Determining the fair value of assets and liabilities involves significant judgment regarding methods and assumptions used to calculate estimated fair values. The purchase price is allocated to the acquired assets, assumed liabilities and identifiable intangible assets based on their estimated fair values. Any excess of the purchase price over the estimated fair values of the net assets acquired is recorded as goodwill. Transaction related costs are expensed as incurred.
Leases- The majority of our leases are operating leases. We believe that our audits provide a reasonable basisaccount for our opinions.
Revenue recognition - The majority of our revenue is derived from long-term contracts that can span several years. We account for revenue in accordance with ASC Topic 606, Revenue from Contracts with Customers, which we adopted on January 1, 2018, using the modified retrospective method. See Note 6 for further details.
Contract costs to obtain a contract - Our incremental direct costs of obtaining a contract are deferred and amortized over the period of contract performance or a longer period, generally accepted accounting principles. A company’s internal control over financial reporting includes those policiesthe estimated life of the customer relationship, if renewals are expected and procedures that (i) pertainthe renewal commission is not commensurate with the initial commission. We classify deferred commissions as current or noncurrent based on the timing of when we expect to recognize the expense. The current and noncurrent portions of deferred commissions are included in other current assets and other assets, respectively, in our consolidated balance sheets.
Amortization of deferred commissions is included in selling, general and administrative expenses in our consolidated statements of income.
Cash equivalents - Cash equivalents are highly-liquid, short-term investments with original maturities of three months or less from their date of purchase.
Trade receivables, net of allowances - An allowance for doubtful accounts is provided on receivables equal to the maintenanceestimated uncollectible amounts and is calculated based on loss rates from historical data. We develop loss-rate statistics on the basis of records that, in reasonable detail, accuratelythe amount written off over the life of the receivable and fairly reflectadjust these historical credit loss trends for forward-looking factors specific to the transactionsdebtors and dispositionsthe economic environment to determine lifetime expected losses.
Inventories - Inventories are stated at the lower of cost or net realizable value, except as it relates to inventory measured using the last-in, first-out (“LIFO”) method, for which the inventories are stated at the lower of cost or market. Inventory costs include those costs directly attributable to products, including all manufacturing overhead, but excluding costs to distribute. Cost for a significant portion of the U.S. domiciled inventories is determined on the LIFO method. The first-in, first-out (“FIFO”) or weighted average methods are used to determine the cost for the remaining inventories. Write-down of inventories is recorded when the net realizable value of inventories is lower than their net book value.
Property, plant and equipment - Property, plant, and equipment is recorded at cost. Depreciation is principally provided on the straight-line basis over the estimated useful lives of the assets (vessels - 10 to 30 years; buildings - 10 to 50 years; and machinery and equipment - 3 to 20 years). Gains and losses are realized upon the sale or retirement of assets and are recorded in other income (expense), net on our consolidated statements of income. Maintenance and repair costs are expensed as incurred. Expenditures that extend the useful lives of property, plant and equipment are capitalized and depreciated over the estimated new remaining life of the company; (ii) provide reasonable assuranceasset.
88
Impairment of property, plant and equipment - Property, plant and equipment are reviewed for impairment whenever events or changes in circumstances indicate the carrying value of the long-lived asset may not be recoverable. The carrying value of an asset group is not recoverable if it exceeds the sum of the undiscounted cash flows expected to result from the use and eventual disposition of the asset. If it is determined that transactionsan impairment loss has occurred, the impairment loss is measured as the amount by which the carrying value of the long-lived asset exceeds its fair value.
Long-lived assets classified as held for sale are reported at the lower of carrying value or fair value less cost to sell.
Goodwill - Goodwill is not subject to amortization but is tested for impairment on an annual basis (or more frequently if impairment indicators arise) by comparing the estimated fair value of each reporting unit to its carrying value, including goodwill. A reporting unit is defined as an operating segment or one level below the operating segment. We have established October 31 as the date of our annual test for impairment of goodwill. Reporting units with goodwill are tested for impairment using a quantitative impairment test known as the income approach, which estimates fair value by discounting each reporting unit’s estimated future cash flows using a weighted-average cost of capital that reflects current market conditions and the risk profile of the reporting unit. To arrive at our future cash flows, we use estimates of economic and market assumptions, including growth rates in revenues, costs, estimates of future expected changes in operating margins, tax rates and cash expenditures. Future revenues are also adjusted to match changes in our business strategy. If the fair value of the reporting unit is less than its carrying amount as a result of this method, then an impairment loss is recorded.
A lower fair value estimate in the future for any of our reporting units could result in goodwill impairments. Factors that could trigger a lower fair value estimate include sustained price declines of the reporting unit’s products and services, cost increases, regulatory or political environment changes, changes in customer demand, and other changes in market conditions, which may affect certain market participant assumptions used in the discounted future cash flow model.
Intangible assets - Our acquired intangible assets are generally amortized on a straight-line basis over their estimated useful lives, which generally range from 2 to 20years. Our acquired intangible assets do not have indefinite lives. Intangible assets are reviewed for impairment whenever events or changes in circumstances indicate the carrying amount of the intangible asset may not be recoverable. The carrying amount of an intangible asset is not recoverable if it exceeds the sum of the undiscounted cash flows expected to result from the use and eventual disposition of the asset. If it is determined that an impairment loss has occurred, the loss is measured as the amount by which the carrying amount of the intangible asset exceeds its fair value.
Capitalized software costs are recorded at cost. Capitalized software costs include purchases of software and internal and external costs incurred during the application development stage of software projects. These costs are amortized on a straight-line basis over the estimated useful lives. For internal use software, the useful lives range from 3 to 10years. For Internet website costs, the estimated useful lives do not exceed 3 years.
Research and development expense is expensed as incurred. Research and development expense includes improvement of existing products and services, design and development of new products and services and test of new technologies.
Debt instruments - Debt instruments include synthetic bonds, senior and private placement notes and other borrowings. Issuance fees and redemption premium on debt instruments are included in the cost of debt in the consolidated balance sheets, as an adjustment to the nominal amount of the debt. Loan origination costs for revolving credit facilities are recorded as necessary to permit preparation of financial statements in accordance with generally accepted accounting principles,an asset and that receipts and expendituresamortized over the life of the companyunderlying debt.
Fair value measurements - Fair value is defined as the price that would be received to sell an asset or paid to transfer a liability (an exit price) in an orderly transaction between market participants at the reporting date. The fair value framework requires the categorization of assets and liabilities measured at fair value into three levels based upon the assumptions (inputs) used to price the assets or liabilities, with the exception of certain assets and liabilities measured using the net asset value practical expedient, which are being made onlynot required to be leveled. Level 1 provides the most reliable measure of fair value, whereas Level 3 generally requires significant management judgment. The three levels are defined as follows:
•Level 1: Unadjusted quoted prices in accordance with authorizationsactive markets for identical assets and liabilities.
•Level 2: Observable inputs other than quoted prices included in Level 1. For example, quoted prices for similar assets or liabilities in active markets or quoted prices for identical assets or liabilities in inactive markets.
89
•Level 3: Unobservable inputs reflecting management’s own assumptions about the assumptions market participants would use in pricing the asset or liability.
Income taxes - Current income taxes are provided on income reported for financial statement purposes, adjusted for transactions that do not enter into the computation of income taxes payable in the same year. Deferred tax assets and liabilities are measured using enacted tax rates for the expected future tax consequences of temporary differences between the carrying amounts and the tax basis of assets and liabilities. A valuation allowance is established whenever management believes that it is more likely than not that deferred tax assets may not be realizable.
Income taxes are not provided on our equity in undistributed earnings of foreign subsidiaries or affiliates to the extent we have determined that the earnings are indefinitely reinvested. Income taxes are provided on such earnings in the period in which we can no longer support that such earnings are indefinitely reinvested.
Tax benefits related to uncertain tax positions are recognized when it is more likely than not, based on the technical merits, that the position will be sustained upon examination.
We classify interest expense and directorspenalties recognized on underpayments of income taxes as income tax expense.
Share-based compensation - The measurement of share-based compensation expense on restricted share awards and performance share awards is based on the market price at the grant date and the number of shares awarded. We use Black-Scholes options pricing model to measure the fair value of stock options granted on or after January 1, 2017. The stock-based compensation expense for each award is recognized ratably over the applicable service period or the period beginning at the start of the company;service period and (iii) provide reasonable assurance regarding prevention or timely detectionending when an employee becomes eligible for retirement, after taking into account estimated forfeitures.
Earnings per ordinary share (“EPS”) - Basic EPS is computed using the weighted-average number of unauthorized acquisition,ordinary shares outstanding during the year. We use or dispositionthe treasury stock method to compute diluted EPS which gives effect to the potential dilution of the company’s assetsearnings that could have occurred if additional shares were issued for awards granted under our incentive compensation and stock plan. The treasury stock method assumes proceeds that would be obtained upon exercise of awards granted under our incentive compensation and stock plan are used to purchase outstanding ordinary shares at the average market price during the period.
Foreign currency - Financial statements of operations for which the U.S. dollar is not the functional currency, and which are located in non-highly inflationary countries, are translated into U.S. dollars prior to consolidation. Assets and liabilities are translated at the exchange rate in effect at the balance sheet date, while income statement accounts are translated at the average exchange rate for each period. For these operations, translation gains and losses are recorded as a component of accumulated other comprehensive income (loss) in stockholders’ equity until the foreign entity is sold or liquidated. For operations in highly inflationary countries and where the local currency is not the functional currency, inventories, property, plant and equipment, and other non-current assets are converted to U.S. dollars at historical exchange rates, and all gains or losses from conversion are included in net income. Foreign currency effects on cash, cash equivalents and debt in highly inflationary economies are included in interest income or expense.
For certain committed and anticipated future cash flows and recognized assets and liabilities which are denominated in a foreign currency, we may choose to manage our risk against changes in the exchange rates, when compared against the functional currency, through the economic netting of exposures instead of derivative instruments. Cash outflows or liabilities in a foreign currency are matched against cash inflows or assets in the same currency, such that movements in exchange rates will result in offsetting gains or losses. Due to the inherent unpredictability of the timing of cash flows, gains and losses in the current period may be economically offset by gains and losses in a future period. All gains and losses are recorded in our consolidated statements of income in the period in which they are incurred. Gains and losses from the remeasurement of assets and liabilities are recognized in other income (expense), net.
During 2018, Argentina’s three year cumulative inflation rate exceeded 100% based on published inflation data, and effective July 1, 2018, Argentina’s currency was considered highly inflationary. Our local operations in Argentina use U.S. dollars as the functional currency and both monetary and non-monetary assets and liabilities denominated in Argentina pesos were remeasured into U.S. dollars with gains and losses resulting from foreign currency transactions included in current results of operations. This event did not have a material effectimpact on theTechnipFMC’s consolidated financial statements.
90
Derivative instruments - Derivatives are recognized on the consolidated balance sheets at fair value, with classification as current or non-current based upon the maturity of the derivative instrument. Changes in the fair value of derivative instruments are recorded in current earnings or deferred in accumulated other comprehensive income (loss), depending on the type of hedging transaction and whether a derivative is designated as, and is effective as, a hedge. Each instrument is accounted for individually and assets and liabilities are not offset.
Hedge accounting is only applied when the derivative is deemed to be highly effective at offsetting changes in anticipated cash flows of the hedged item or transaction. Changes in fair value of derivatives that are designated as cash flow hedges are deferred in accumulated other comprehensive income (loss) until the underlying transactions are recognized in earnings. At such time, related deferred hedging gains or losses are recorded in earnings on the same line as the hedged item. Effectiveness is assessed at the inception of the hedge and on a quarterly basis. Effectiveness of forward contract cash flow hedges are assessed based solely on changes in fair value attributable to the change in the spot rate. The change in the fair value of the contract related to the change in forward rates is excluded from the assessment of hedge effectiveness. Changes in this excluded component of the derivative instrument, along with any ineffectiveness identified, are recorded in earnings as incurred. We document our risk management strategy and hedge effectiveness at the inception of, and during the term of, each hedge.
We also use forward contracts to hedge foreign currency assets and liabilities, for which we do not apply hedge accounting. The changes in fair value of these contracts are recognized in other income (expense), net on our consolidated statements of income, as they occur and offset gains or losses on the remeasurement of the related asset or liability.
Reclassifications - Certain prior-year amounts have been reclassified to conform to the current year’s presentation.
NOTE 2. BUSINESS COMBINATION AND OTHER TRANSACTIONS
On October 7, 2020, we signed a Memorandum of Understanding with McPhy Energy S.A. (“McPhy”), a leading manufacturer and supplier of carbon-free hydrogen production and distribution equipment, pursuant to which we will jointly work on technology development and project implementation. In October 2020, we subscribed to 638,297 shares for €15 million that represents 2.29% of McPhy’s capital. The investment was recorded at the fair value.
On December 30, 2019, we completed the acquisition of the remaining 50% interest in Technip Odebrecht PLSV CV (“TOP CV”). TOP CV was formed as a joint venture between Technip SA and Ocyan SA to provide pipeline installation ships to Petroleo Brasileiro SA (“Petrobras”) for their work in oil and gas fields offshore Brazil with results reported in our Subsea segment using the equity method of accounting. Subsequent to this transaction the investment became a fully consolidated entity. In connection with the acquisition, we acquired $391.0 million in assets, including two vessels valued at $335.2 million. In addition, we assumed $239.9 million of liabilities, including a $203.1 million term loan. As a result of the acquisition, we recorded a net loss of $0.9 million. The net loss on acquisition was comprised of the impairment charge of $84.2 million and a gain on bargain purchase of $83.3 million included within restructuring and other charges in our consolidated statement of income.
In February 2018, we signed an agreement with the Island Offshore Group to acquire a 51% stake in Island Offshore’s wholly-owned subsidiary, Island Offshore Subsea AS. Island Offshore Subsea AS provides RLWI project management and engineering services for plug and abandonment (“P&A”), riserless coiled tubing, and well completion operations. In connection with the acquisition of the controlling interest, TechnipFMC and Island Offshore entered into a strategic cooperation agreement to deliver RLWI services on a worldwide basis, which also include TechnipFMC’s RLWI capabilities. Island Offshore Subsea AS has been rebranded to TIOS AS and is now the operating unit for TechnipFMC’s RLWI activities worldwide. The acquisition was completed on April 18, 2018 for total cash consideration of $42.4 million. As a result of the acquisition, we recorded a redeemable financial liability equal to the fair value of a written put option and a goodwill of $85.0 million.
On July 18, 2018, we entered into a share sale and purchase agreement with POC Holding Oy to sell 100% of the outstanding shares of Technip Offshore Finland Oy. The total pre-tax gain recognized in 2018 was $27.8 million.
Additional acquisitions, including purchased interests in equity method investments, during 2018 totaled $62.5 million in consideration paid.
91
NOTE 3. SEPARATION TRANSACTION
On August 26, 2019, we announced our intention to separate into two diversified pure-play market leaders – TechnipFMC, focused on subsea and surface hydrocarbon production, and Technip Energies, focused on downstream engineering, procurement, and construction project execution. Due to the COVID-19 pandemic, a significant decline in commodity prices, and the heightened volatility in global equity markets, on March 15, 2020, we announced the postponement of the completion of the transaction until the markets sufficiently recover. On January 7, 2021, we announced the resumption of activity toward completion of the transaction based on increased clarity in the market outlook and our demonstrated ability to successfully execute projects.
On February 16, 2021, we completed the separation of the Technip Energies business segment. The transaction was structured as a spin-off (the “Spin-off”), which occurred by way of a pro rata dividend (the “Distribution”) to our shareholders of 50.1 percent of the outstanding shares in Technip Energies N.V. Each of our shareholders received 1 ordinary share of Technip Energies N.V. for every 5 ordinary shares of TechnipFMC held at 5:00 p.m., New York City time on the record date, February 17, 2021. Technip Energies N.V. is now an independent public company and its inherent limitations, internal controlshares trade under the ticker symbol “TE” on the Euronext Paris stock exchange.
In connection with the Spin-off, on January 7, 2021, Bpifrance Participations SA (“BPI”), which has been one of our substantial shareholders since 2009, entered into a share purchase agreement with us (the “Share Purchase Agreement”) pursuant to which BPI agreed to purchase a portion of our retained stake in Technip Energies N.V. (the “BPI Investment”) for $200.0 million (the “Purchase Price”). On February 25, 2021, BPI paid $200.0 million in connection with the Share Purchase Agreement. The Purchase Price is subject to adjustment, and BPI’s ownership stake will be determined based upon a thirty day volume-weighted average price of Technip Energies N.V.’s shares (with BPI’s ownership collared between an 11.82 percentage floor and a 17.25 percentage cap), less a 6 percent discount. The BPI Investment is subject to customary conditions and regulatory approval. We intend to significantly reduce our shareholding in Technip Energies N.V. over the 18 months following the Spin-off, including in connection with the sale of shares to BPI pursuant to the BPI Investment.
Beginning in the first quarter of 2021, Technip Energies’ historical financial results for periods prior to the Distribution will be reflected in our consolidated financial statements as discontinued operations, as the Spin-off represented a strategic shift that will have a major impact to our operations and consolidated financial statements. Following the completion of the Spin-off, we elected to apply a fair value option to account for our equity method investment in Technip Energies N.V.
During the years ended December 31, 2020 and 2019, we incurred $39.5 million and $72.1 million of separation costs associated with the Spin-off transaction, respectively.
NOTE 4. NEW ACCOUNTING STANDARDS
Recently Adopted Accounting Standards under GAAP
Effective January 1, 2020, we adopted Accounting Standards Update (“ASU”) No. 2018-13, “Fair Value Measurement (Topic 820): Disclosure Framework—Changes to the Disclosure Requirements for Fair Value Measurement.” This update modifies the disclosure requirement on fair value measurements in Topic 820. The amendments on changes in unrealized gains and losses, the range and weighted average of significant unobservable inputs used to develop Level 3 fair value measurements, and the narrative description of measurement uncertainty should be applied prospectively. The adoption of this update concerns presentation and disclosure only as it relates to our consolidated financial statements. See Note 24 for our fair value measurements disclosure.
Effective January 1, 2020, we adopted ASU No. 2018-15, “Intangibles—Goodwill and Other—Internal-Use Software (Subtopic 350-40): Customer’s Accounting for Implementation Costs Incurred in a Cloud Computing Arrangement That Is a Service Contract (a consensus of the FASB Emerging Issues Task Force).” This update requires that the implementation costs incurred in a cloud computing arrangement under a service contract are deferred, not capitalized. The adoption of this update did not have a material impact on our consolidated financial statements.
92
Effective January 1, 2020, we adopted ASU No. 2018-18, “Collaborative Arrangements (Topic 808)—Clarifying the Interaction between Topic 808 and Topic 606.” This update clarifies the interaction between the guidance for certain collaborative arrangements and the Revenue Recognition financial accounting and reporting may not preventstandard. The adoption of this update concerns presentation and disclosure only with no material impact to our consolidated financial statements.
Effective January 1, 2020, we adopted ASU No. 2019-04, “Codification Improvements to
•Topic 326, Financial Instruments—Credit Losses;
•Topic 815, Derivatives and Hedging; and
• Topic 825, Financial Instruments.”
The update clarifies and improves areas of guidance related to the recently issued standards including
• ASU No. 2016-01, “Financial Instruments—Overall (Subtopic 825-10): Recognition and Measurement of Financial Assets and Liabilities”;
• ASU No. 2016-13, “Financial Instruments—Credit Losses (Topic 326): Measurement of Credit Losses on Financial Instruments.”; and
• ASU No. 2017-12, “Derivatives and Hedging (Topic 815): Targeted Improvements to Accounting for Hedging Activities.”
The adoption of this update concerns presentation and disclosure only with no material impact to our consolidated financial statements.
Adoption of ASU No. 2016-13 “Financial Instruments—Credit Losses (Topic 326): Measurement of Credit Losses on Financial Instruments
Effective January 1, 2020, we adopted ASU No. 2016-13, “Financial Instruments—Credit Losses (Topic 326): Measurement of Credit Losses on Financial Instruments.” This ASU introduces a new model for recognizing credit losses on financial instruments based on an estimate of current expected credit losses. The guidance applies to (1) loans, accounts receivable, trade receivables, and other financial assets measured at amortized cost, (2) loan commitments and other off-balance sheet credit exposures, (3) debt securities and other financial assets measured at fair value through other comprehensive income, and (4) beneficial interests in securitized financial assets.
In June 2016, the Financial Accounting Standards Board (“FASB”) issued an update of the ASU to provide a practical expedient for transition and targeted improvements.
We adopted Topic 326 using a modified retrospective transition method through a cumulative-effect adjustment to beginning retained earnings in the period of adoption. The effect of adopting Topic 326 was an increase in accumulated deficit of $7.8 million, which includes a $2.1 million increase in noncurrent deferred tax assets, with a corresponding decrease in trade receivables, loans, and debt notes receivable.
Financial assets at amortized cost include trade receivables, loans issued to third or detect misstatements. Also, projections of any evaluation of effectivenessrelated parties, and held to future periodsmaturity debt securities. These financial assets were presented under other current assets or other assets, as applicable. Contract assets are subject to the credit losses standard per revenue recognition standard.
Trade receivables and contract assets constitute a homogeneous portfolio, and therefore, to measure the expected credit losses, trade receivables and contract assets have been grouped together. The contract assets relate to unbilled work in progress and have substantially the same risk that controls may become inadequate becausecharacteristics as the trade receivables for the same types of changes in conditions, orcontracts. We have therefore concluded that the degreeexpected loss rates for trade receivables are a reasonable approximation of compliance with the policies or procedures may deteriorate.loss rates for the contract assets.
93
| (In millions) | As reported as of December 31, 2019 | Impact of ASC 326 | Balance as of January 1, 2020 | ||||||||||||||
| Trade receivables, net | $ | 2,287.1 | $ | (3.8) | $ | 2,283.3 | |||||||||||
| Loans receivable, net | 138.5 | (1.5) | 137.0 | ||||||||||||||
| Security deposits and other, net | 36.6 | (1.0) | 35.6 | ||||||||||||||
| Held-to-maturity | |||||||||||||||||
| Debt securities at amortized cost | 71.9 | (1.1) | 70.8 | ||||||||||||||
| Total financial assets | $ | 2,534.1 | $ | (7.4) | $ | 2,526.7 | |||||||||||
| Non-financial assets | |||||||||||||||||
| Contract assets, net | $ | 1,520.0 | $ | (2.5) | $ | 1,517.5 | |||||||||||
We manage our receivables portfolios using published default risk as a key credit quality indicator for our loans and receivables. Our loans receivable and security deposits were related to sales of long-lived assets or businesses, loans to related parties for capital expenditure purposes, or security deposits for lease arrangements.
We manage our held-to-maturity debt securities using published credit ratings as a key credit quality indicator as our held-to-maturity debt securities consist of government bonds.
The table below summarizes the amortized cost basis of financial assets by years of origination and credit quality. The key credit quality indicator is updated as of December 31, 2020.
| (In millions) | Year of origination | Balance as of December 31, 2020 | |||||||||
| Loans receivables, security deposits and other | |||||||||||
| Moody’s rating Ba2 | 2019 | $ | 133.0 | ||||||||
| Debt securities at amortized cost | |||||||||||
| Moody’s rating B3 | 2019 | 23.7 | |||||||||
| Total financial assets | $ | 156.7 | |||||||||
Credit Losses
For contract assets and trade receivables, we have servedelected to calculate an expected credit loss based on loss rates from historical data. We develop loss-rate statistics on the basis of the amount written off over the life of the financial assets and contract assets and adjust these historical credit loss trends for forward-looking factors specific to the debtors and the economic environment to determine lifetime expected losses. For short-term notes receivable an expected credit loss is calculated assuming the maximum possible loss in the event of a default (that is, the loan is fully drawn and no amount is recovered). Management established a probability of default based on the counterparty’s credit risk as determined by external credit rating agencies and the Company's auditor since 2017.maximum loss given default (average recovery rate of sovereign bond issuers as published by credit rating agencies). Based on these factors we determine the expected credit loss for our short-term loans receivable.
For held-to-maturity debt securities at amortized cost, we evaluate whether the debt securities are considered to have low credit risk at the reporting date using available, reasonable, and supportable information.
94
| Balance as of December 31, 2020 | |||||||||||||||||||||||||||||
| (In millions) | Trade receivables | Contract assets | Loans receivable | Security deposit and other | Held-to-maturity debt securities | ||||||||||||||||||||||||
| Beginning balance in allowance for credit losses | $99.2 | $5.0 | $9.5 | $1.6 | $1.1 | ||||||||||||||||||||||||
| Current period provision for expected credit losses | 54.3 | (0.2) | (0.1) | 0.9 | (0.6) | ||||||||||||||||||||||||
| Write-offs charged against the allowance | (46.9) | 0 | 0 | 0 | 0 | ||||||||||||||||||||||||
| Recoveries | 2.3 | (3.8) | (0.9) | (1.4) | 0 | ||||||||||||||||||||||||
| Ending balance in the allowance for credit losses | $ | 108.9 | $ | 1.0 | $ | 8.5 | $ | 1.1 | $ | 0.5 | |||||||||||||||||||
Other than certain trade receivables due in allone year or less, we do not have any financial assets that are past due or are on non-accrual status.
Recently Issued Accounting Standards under GAAP
In August 2018, the FASB issued ASU No. 2018-14, “Compensation—Retirement Benefits—Defined Benefit Plans—General (Subtopic 715-20): Disclosure Framework—Changes to the Disclosure Requirements for Defined Benefit Plans.” This update amends ASC 715 to add, remove, and clarify disclosure requirements related to defined benefit pension and other post-retirement plans. The amendments in this update are required to be adopted retrospectively. We adopted this amendment as of January 1, 2021. The adoption of this update did not have a material respects,impact on our consolidated financial statements.
In December 2019, the resultsFASB issued ASU No. 2019-12, “Income Taxes to Topic 740—Simplifying the Accounting for Income Taxes.” The amendments simplify the accounting for income taxes by removing certain exceptions to the general principles in Topic 740. This update also improves and simplifies areas of operationsgenerally accepted accounting principles (GAAP) for which costs and cash flowscomplexity can be reduced while maintaining or improving the usefulness of TechnipFMC plcthe information provided to users of financial statements. We adopted this amendment as of January 1, 2021. The adoption of this update did not have a material impact on our consolidated financial statements.
In January 2020, the FASB issued ASU No. 2020-01, "Investments—Equity Securities (Topic 321),”“Investments—Equity Method and its subsidiariesJoint Ventures (Topic 323),” and “Derivatives and Hedging (Topic 815)—Clarifying the Interactions between Topic 321, Topic 323, and Topic 815,”and made targeted improvements to address certain aspects of accounting for financial instruments. This update clarifies that a company should consider observable transactions that require a company to either apply or discontinue the equity method of accounting under Topic 323, Investments—Equity Method and Joint Ventures, for the yearpurposes of applying the measurement alternative in accordance with Topic 321 immediately before applying or upon discontinuing the equity method. The new ASU also clarifies that, when determining the accounting for certain forward contracts and purchased options, a company should not consider whether underlying securities would be accounted for under the equity method or fair value option upon settlement or exercise. We adopted this amendment as of January 1, 2021. The adoption of this update did not have a material impact on our consolidated financial statements.
In March 2020, the FASB issued ASU No. 2020-04, “Facilitation of the Effects of Reference Rate Reform on Financial Reporting (Topic 848),” The amendments in this update apply only to contracts, hedging relationships, and other transactions that reference LIBOR or another reference rate expected to be discontinued because of reference rate reform. The expedients and exceptions provided by the amendments do not apply to contract modifications made and hedging relationships entered into or evaluated after December 31, 2022, except for hedging relationships existing as of December 31, 2022, that an entity has elected certain optional expedients for and that are retained through the end of the hedging relationship. The amendments in this update are effective as of March 12, 2020 through December 31, 2022. The adoption of this update is not expected to have a material impact on our consolidated financial statements.
NOTE 5. LEASES
Lessee Arrangements
We lease real estate, including land, buildings and warehouses, machinery/equipment, vessels, vehicles, and various types of manufacturing and data processing equipment, from a lessee perspective. Leases of real estate generally provide for payment of property taxes, insurance, and repairs by us. Substantially all our leases are classified as operating leases.
95
We determine if an arrangement is a lease at inception by assessing whether an identified asset exists and if we have the right to control the use of the identified asset. Operating leases are included in Operating lease right-of-use assets, Operating lease liabilities (current), and Operating lease liabilities (non-current) in our consolidated balance sheets. Right-of-use assets represent our right to use an underlying asset for the lease term and lease liabilities represent our obligation to make lease payments arising from the lease. Operating lease right-of-use assets and liabilities are recognized at the commencement date based on the present value of the remaining lease payments over the lease term. With the exception of rare cases in which the implicit rate is readily determinable, we use our incremental borrowing rate based on the information available at the commencement date in determining the present value of lease payments. The Operating lease right-of-use assets also includes any lease prepayments made and excludes lease incentives we received from the lessor. Lease cost for lease payments is recognized on a straight-line basis over the lease term. Several of our leases provide for certain guarantees of residual value. We estimate and include in the determination of lease payments any amount probable of being owed under these residual value guarantees.
Lease terms within our lessee arrangements may include options to extend/renew or terminate the lease and/or purchase the underlying asset when it is reasonably certain that we will exercise that option. TechnipFMC applies a portfolio approach by asset class to determine lease term renewals. The leases within these portfolios are categorized by asset class and have initial lease terms that vary depending on the asset class. The renewal terms range from 60 days to 5 years for asset classes such as temporary residential housing, forklifts, vehicles, vessels, office and IT equipment, and tool rentals, and up to 15 years or more for commercial real estate. Short-term leases with an initial term of 12 months or less that do not include a purchase option are not recorded on the balance sheet. Lease costs for short-term leases are recognized on a straight-line basis over the lease term and amounts related to short-term leases are disclosed within our financial statements.
TechnipFMC has variable lease payments, including adjustments to lease payments based on an index or rate (such as the Consumer Price Index), fair value adjustments to lease payments, and common area maintenance, real estate taxes, and insurance payments in triple-net real estate leases. Variable lease payments that depend on an index or a rate (such as the Consumer Price Index or a market interest rate) are included when measuring consideration within our lease arrangements using the payments’ base rate or index. Variable payments that do not depend on an index or rate are recognized in the consolidated income statements and are disclosed as “variable lease costs” in the period they are incurred.
We adopted the practical expedient to not separate lease and non-lease components for all asset classes except for vessels, which have significant non-lease components.
TechnipFMC currently subleases certain of its leased real estate and vessels to third parties.
The following table is a summary of the Company’s components of net lease cost for the years ended December 31, 2016, in conformity with accounting principles generally accepted in the United States of America. In addition, in our opinion, the financial statement schedule2020 and 2019:
| Year Ended December 31, | |||||||||||
| (In millions) | 2020 | 2019 | |||||||||
| Operating lease costs including variable costs | $ | 312.1 | $ | 362.4 | |||||||
| Short-term lease costs | 13.7 | 20.8 | |||||||||
| Less: sublease income | 7.3 | 8.9 | |||||||||
| Net lease cost | $ | 318.5 | $ | 374.3 | |||||||
Supplemental cash flow information related to leases for the yearyears ended December 31, 2016 presents fairly,2020 and 2019 is as follows:
96
| Year Ended December 31, | |||||||||||
| (In millions) | 2020 | 2019 | |||||||||
| Cash paid for amounts included in the measurement of lease liabilities | |||||||||||
| Operating cash flows from operating leases | $ | 314.2 | $ | 384.7 | |||||||
| Right-of-use assets obtained in exchange for lease liabilities | |||||||||||
| Operating leases | $ | 535.9 | $ | 125.4 | |||||||
Supplemental balance sheet information related to leases as of December 31, 2020 and 2019 is as follows:
| December 31, | |||||||||||
| (In millions, except lease term and discount rate) | 2020 | 2019 | |||||||||
| Weighted average remaining lease term | |||||||||||
| Operating leases | 11.8 years | 7.5 years | |||||||||
| Finance leases | 0.6 years | $ | — | ||||||||
| Weighted average discount rate | |||||||||||
| Operating leases | 5.1 | % | 4.4 | % | |||||||
| Finance leases | 2.1 | % | — | % | |||||||
Maturities of operating lease liabilities as of December 31, 2020 are as follows:
| (In millions) | Operating Leases | ||||
| 2021 | $ | 252.5 | |||
| 2022 | 191.5 | ||||
| 2023 | 137.1 | ||||
| 2024 | 117.6 | ||||
| 2025 | 79.2 | ||||
| Thereafter | 471.4 | ||||
| Total lease payments | 1,249.3 | ||||
Less: Imputed interest (a) | 121.3 | ||||
Total lease liabilities (b) | $ | 1,128.0 | |||
Note: For leases that commenced prior to 2019, minimum lease payments exclude payments to landlords for real estate taxes and common area maintenance.
(a)Calculated using the interest rate for each lease.
(b)Includes the current portion of $247.0 million for operating leases.
In December 2020, TechnipFMC sold its leased office building at Gremp Campus in all material respects,Houston, Texas on behalf of the information set forth therein when readexisting lessor to Oak Street Real Estate Capital, LLC (“New Lessor”). TechnipFMC also sold the land underneath Gremp Campus which the Company owned to the New Lessor. TechnipFMC concurrently executed a new lease agreement for both land and the office building (collectively, “Gremp Campus Properties”) with New Lessor.
The new lease agreement of Gremp Campus Properties commenced on December 11, 2020 and the initial term ends on December 31, 2042. TechnipFMC has 4 renewal periods of 10 years each after the expiration of initial term. At inception of the new lease agreement, TechnipFMC did not consider any renewal period as probable of being exercised.
TechnipFMC paid net cash of $1.8 million in conjunctionconnection with the related consolidated financial statements. These financial statementsnew lease agreement, and financial statement schedule are the responsibilityrecognized a loss of $3.1 million from derecognition of the Company’s management.existing lease. There was no gain or loss from the sale of the land at Gremp Campus.
97
Lessor Arrangements
We lease real estate including land, buildings and warehouses, machinery/equipment, and vessels from a lessor perspective. We determine if an arrangement is a lease at inception by assessing whether an identified asset exists and if the customer has the right to control the use of the identified asset. We use our implicit rate for our lessor arrangements. We have elected the practical expedient available for lessors to not separate lease and non-lease components for vessels. If the non-lease component is predominant in our contracts, we account for the contracts under the revenue recognition guidance in ASU 2014-09, “Revenue from Contracts with Customers” (Topic 606). If the lease component is predominant in our contracts, we account for the contracts under the lease guidance in Topic842. We estimate the amount we expect to derive from the underlying asset following the end of the lease term based on remaining economic life. Our responsibilitylessor arrangements generally do not include any residual value guarantees. We recognize lessee payments of lessor costs such as taxes and insurance on a net basis when the lessee pays those costs directly to a third party or when the amount paid by the lessee is not readily determinable.
The following table is a summary of components of lease revenue for the years ended December 31, 2020 and 2019:
| Year Ended December 31, | |||||||||||
| (In millions) | 2020 | 2019 | |||||||||
| Operating lease revenue including variable revenue | $ | 142.0 | $ | 266.5 | |||||||
The following table is a summary of the maturity analysis of the undiscounted cash flows to be received on an annual basis for each of the first five years, and a total of the amounts for the remaining years:
| (In millions) | Operating Leases | ||||
| 2021 | $ | 21.4 | |||
| 2022 | 14.3 | ||||
| 2023 | 1.0 | ||||
| 2024 | 0 | ||||
| 2025 | 0 | ||||
| Thereafter | 0 | ||||
| Total undiscounted cash flows | $ | 36.7 | |||
NOTE 6. REVENUE
The majority of our revenue is from long-term contracts associated with designing and manufacturing products and systems and providing services to customers involved in exploration and production of crude oil and natural gas. On January 1, 2018, we adopted Topic 606 of GAAP using the modified retrospective method applied to those contracts that were not completed as of January 1, 2018 resulting in a $91.5 million reduction to retained earnings.
Significant Revenue Recognition Criteria Explained
Allocation of transaction price to performance obligations - A contract’s transaction price is allocated to each distinct performance obligation and recognized as revenue, when, or as, the performance obligation is satisfied. To determine the proper revenue recognition method, we evaluate whether two or more contracts should be combined and accounted for as one single contract and whether the combined or single contract should be accounted for as more than one performance obligation. This evaluation requires significant judgment; some of our contracts have a single performance obligation as the promise to transfer the individual goods or services is not separately identifiable from other promises in the contracts and, therefore, not distinct.
98
Variable consideration - Due to the nature of the work required to be performed on many of our performance obligations, the estimation of total revenue and cost at completion is complex, subject to many variables and requires significant judgment. It is common for our long-term contracts to contain variable considerations that can either increase or decrease the transaction price. Variability in the transaction price arises primarily due to liquidated damages. We consider our experience with similar transactions and expectations regarding the contract in estimating the amount of variable consideration to which we will be entitled, and determining whether the estimated variable consideration should be constrained. We include estimated amounts in the transaction price to the extent it is probable that a significant reversal of cumulative revenue recognized will not occur when the uncertainty associated with the variable consideration is resolved. Our estimates of variable consideration are based largely on an assessment of our anticipated performance and all information (historical, current and forecasted) that is reasonably available to us.
Payment terms - Progress billings are generally issued upon completion of certain phases of the work as stipulated in the contract. Payment terms may either be fixed, lump-sum or driven by time and materials (e.g., daily or hourly rates, plus materials). Because typically the customer retains a small portion of the contract price until completion of the contract, our contracts generally result in revenue recognized in excess of billings which we present as contract assets on the balance sheet. Amounts billed and due from our customers are classified as receivables in the consolidated balance sheets. The portion of the payments retained by the customer until final contract settlement is not considered a significant financing component because the intent is to expressprotect the customer. For some contracts, we may be entitled to receive an opinion onadvance payment. We recognize a liability for these financial statementsadvance payments in excess of revenue recognized and financial statement schedulepresent it as contract liabilities in the consolidated balance sheets. The advance payment typically is not considered a significant financing component because it is used to meet working capital demands that can be higher in the early stages of a contract and to protect us from the other party failing to adequately complete some or all of its obligations under the contract.
Warranty - Certain contracts include an assurance-type warranty clause, typically between 18 to 36 months, to guarantee that the products comply with agreed specifications. A service-type warranty may also be provided to the customer; in such a case, management allocates a portion of the transaction price to the warranty based on the estimated stand-alone selling price of the service-type warranty.
Revenue recognized over time - Our performance obligations are satisfied over time as work progresses or at a point in time. Revenue from products and services transferred to customers over time accounted for approximately 86.0%, 81.7% and 82.4% of our audit.revenue for the years ended December 31, 2020, 2019 and 2018, respectively. Typically, revenue is recognized over time using an input measure (e.g., costs incurred to date relative to total estimated costs at completion) to measure progress.
Cost-to-cost method - For our long-term contracts, because of control transferring over time, revenue is recognized based on the extent of progress towards completion of the performance obligation. We conductedgenerally use the cost-to-cost measure of progress for our auditcontracts because it best depicts the transfer of control to the customer which occurs as we incur costs on our contracts. Under the cost-to-cost measure of progress, the extent of progress towards completion is measured based on the ratio of costs incurred to date to the total estimated costs at completion of the performance obligation. Revenues, including estimated fees or profits, are recorded proportionally as costs are incurred. Any expected losses on construction-type contracts in progress are charged to earnings, in total, in the period the losses are identified.
Right to invoice practical expedient - The right-to-invoice practical expedient can be applied to a performance obligation satisfied over time if we have a right to invoice the customer for an amount that corresponds directly with the value transferred to the customer for our performance completed to date. When this practical expedient is used, we do not estimate variable consideration at the inception of the contract to determine the transaction price or for disclosure purposes. We have contracts which have payment terms dictated by daily or hourly rates where some contracts may have mixed pricing terms which include a fixed fee portion. For contracts in which we charge the customer a fixed rate based on the time or materials spent during the project that correspond to the value transferred to the customer, we recognize revenue in the amount to which we have the right to invoice.
99
Contract modifications - Contracts are often modified to account for changes in contract specifications and requirements. We consider contract modifications to exist when the modification either creates new, or changes the existing, enforceable rights and obligations. Most of our contract modifications are for goods or services that are not distinct from the existing contract due to the significant integration service provided in the context of the contract and are accounted for as if they were part of that existing contract. The effect of a contract modification on the transaction price and our measure of progress for the performance obligation to which it relates is recognized as an adjustment to revenue (either as an increase in or a reduction of revenue) on a cumulative catch-up basis.
Revenue Recognition by Segment
The following is a description of principal activities separated by reportable segments from which TechnipFMC generates its revenue. See Note 7 for more detailed information about reportable segments.
Subsea
Our Subsea segment manufactures and designs products and systems, performs engineering, procurement and project management and provides services used by oil and gas companies involved in offshore exploration and production of crude oil and natural gas. Systems and services may be sold separately or as combined integrated systems and services offered within one contract. Many of the systems and products TechnipFMC supplies for subsea applications are highly engineered to meet the unique demands of our customers’ field properties and are typically ordered one to two years prior to installation. We often receive advance payments and progress billings from our customers in order to fund initial development and working capital requirements.
Under Subsea engineering, procurement, construction and installation contracts, revenue is principally generated from long-term contracts with customers. We have determined these contracts generally have one performance obligation as the delivered product is highly customized to customer and field specifications. We generally recognize revenue over time for such contracts as the customized products do not have an alternative use for TechnipFMC and we have an enforceable right to payment plus a reasonable profit for performance completed to date.
Our Subsea segment also performs an array of subsea services including (i) installation services, (ii) asset management services (iii) product optimization, (iv) inspection, maintenance and repair services, and (v) well access and intervention services, where revenue is generally earned through the execution of either installation-type or maintenance-type contracts. For either contract-type, management has determined that the performance of the service generally represents one single performance obligation. We have determined that revenue from these contracts is recognized over time as the customer simultaneously receives and consumes the benefit of the services.
Technip Energies
Our Technip Energies segment designs and builds onshore facilities related to the production, treatment, transformation and transportation of hydrocarbons and renewable feedstock; and designs, manufactures and installs fixed and floating platforms for the offshore production and processing of oil and gas reserves.
Our onshore business combines the design, engineering, procurement, construction and project management of the entire range of onshore facilities. Our onshore activity covers all types of onshore facilities related to the production, treatment and transportation of oil and gas, as well as transformation with petrochemicals such as ethylene, polymers and fertilizers. Some of the onshore activities include the development of onshore fields, refining, natural gas treatment and liquefaction, and design and construction of hydrogen and synthesis gas production units.
Many of these financial statements in accordance withcontracts provide a combination of engineering, procurement, construction, project management and installation services, which may last several years. We have determined that contracts of this nature have generally one performance obligation. In these contracts, the standardsfinal product is highly customized to the specifications of the Public Company Accounting Oversight Board (United States). Those standards requirefield and the customer’s requirements. Therefore, the customer obtains control of the asset over time, and thus revenue is recognized over time.
Our offshore business combines the design, engineering, procurement, construction and project management within the entire range of fixed and floating offshore oil and gas facilities, many of which were the first of their kind, including the development of floating liquefied natural gas (“FLNG”) facilities. Similar to onshore contracts, contracts grouped under this segment provide a combination of services, which may last several years.
100
We have determined that contracts of this nature have one performance obligation. In these contracts, the final product is highly customized to the specifications of the field and the customer’s requirements. We have determined that the customer obtains control of the asset over time, and thus revenue is recognized over time as the customized products do not have an alternative use for us and we planhave an enforceable right to payment plus reasonable profit for performance completed to date. Subsequent to the Spin-off, we operate under two reporting segments: Subsea and performSurface Technologies, for further details see Note 3 for further details.
Surface Technologies
Our Surface Technologies segment designs, manufactures and supplies technologically advanced wellhead systems and high pressure valves and pumps used in stimulation activities for oilfield service companies and provides installation, flowback and other services for exploration and production companies.
We provide a full range of drilling, completion and production wellhead systems for both standard and custom-engineered applications. Under pressure control product contracts, we design and manufacture flowline products, under the auditWeco®/Chiksan® trademarks, articulating frac arm manifold trailers, well service pumps, compact valves and reciprocating pumps used in well completion and stimulation activities by major oilfield service companies. Performance obligations within these systems are satisfied either through delivery of a standardized product or equipment or the delivery of a customized product or equipment.
For contracts with a standardized product or equipment performance obligation, management has determined that because there is limited customization to obtain reasonable assurance about whetherproducts sold within such contracts and the financial statementsasset delivered can be resold to another customer, revenue should be recognized as of a point in time, upon transfer of control to the customer and after the customer acceptance provisions have been met.
For contracts with a customized product or equipment performance obligation, the revenue is recognized over time, as the manufacturing of our product does not create an asset with an alternative use for us.
This segment also designs, manufactures and services measurement products globally. Contract-types include standard product or equipment and maintenance-type services where we have determined that each contract under this product line represents one performance obligation.
Revenue from standard measurement equipment contracts is recognized at a point in time, while maintenance-type contracts are freetypically priced at a daily or hourly rate. We have determined that revenue for these contracts is recognized over time because the customer simultaneously receives and consumes the benefit of material misstatement. An audit includes examining,the services.
Disaggregation of Revenue
We disaggregate revenue by geographic location and contract type. The following table presents products and services revenue by geography for each reportable segment for the years ended December 31, 2020, 2019 and 2018:
| Reportable Segments | |||||||||||||||||||||||||||||||||||||||||||||||||||||
| Year Ended December 31, | |||||||||||||||||||||||||||||||||||||||||||||||||||||
| 2020 | 2019 | 2018 | |||||||||||||||||||||||||||||||||||||||||||||||||||
| (In millions) | Subsea | Technip Energies | Surface Technologies | Subsea | Technip Energies | Surface Technologies | Subsea | Technip Energies | Surface Technologies | ||||||||||||||||||||||||||||||||||||||||||||
| Europe, Russia, Central Asia | $ | 1,641.9 | $ | 3,111.6 | $ | 188.2 | $ | 1,745.2 | $ | 2,813.1 | $ | 236.7 | $ | 1,528.1 | $ | 3,506.1 | $ | 227.7 | |||||||||||||||||||||||||||||||||||
| Americas | 1,957.7 | 982.6 | 373.1 | 1,770.0 | 766.2 | 732.1 | 1,721.5 | 365.1 | 865.5 | ||||||||||||||||||||||||||||||||||||||||||||
| Asia Pacific | 753.2 | 1,094.3 | 123.4 | 659.9 | 1,152.5 | 189.3 | 532.9 | 1,236.1 | 123.2 | ||||||||||||||||||||||||||||||||||||||||||||
| Africa | 893.9 | 884.4 | 45.8 | 824.8 | 526.0 | 61.1 | 758.1 | 252.7 | 57.9 | ||||||||||||||||||||||||||||||||||||||||||||
| Middle East | 169.8 | 447.1 | 241.6 | 407.1 | 1,011.0 | 247.6 | 181.2 | 760.7 | 213.4 | ||||||||||||||||||||||||||||||||||||||||||||
| Total products and services revenue | $ | 5,416.5 | $ | 6,520.0 | $ | 972.1 | $ | 5,407.0 | $ | 6,268.8 | $ | 1,466.8 | $ | 4,721.8 | $ | 6,120.7 | $ | 1,487.7 | |||||||||||||||||||||||||||||||||||
101
The following table represents revenue by contract type for each reportable segment for the years ended December 31, 2020, 2019 and 2018:
| Reportable Segments | |||||||||||||||||||||||||||||||||||||||||||||||||||||
| Year Ended December 31, | |||||||||||||||||||||||||||||||||||||||||||||||||||||
| 2020 | 2019 | 2018 | |||||||||||||||||||||||||||||||||||||||||||||||||||
| (In millions) | Subsea | Technip Energies | Surface Technologies | Subsea | Technip Energies | Surface Technologies | Subsea | Technip Energies | Surface Technologies | ||||||||||||||||||||||||||||||||||||||||||||
| Services | $ | 3,121.1 | $ | 6,436.9 | $ | 150.2 | $ | 3,244.5 | $ | 6,268.8 | $ | 276.4 | $ | 2,687.1 | $ | 6,120.7 | $ | 249.8 | |||||||||||||||||||||||||||||||||||
| Products | 2,295.4 | 83.1 | 821.9 | 2,162.5 | 0 | 1,190.4 | 2,034.7 | 0 | 1,237.9 | ||||||||||||||||||||||||||||||||||||||||||||
| Total products and services revenue | 5,416.5 | 6,520.0 | 972.1 | 5,407.0 | 6,268.8 | 1,466.8 | 4,721.8 | 6,120.7 | 1,487.7 | ||||||||||||||||||||||||||||||||||||||||||||
Lease and other(a) | 54.9 | 0 | 87.1 | 116.0 | 0 | 150.5 | 118.2 | 0 | 104.5 | ||||||||||||||||||||||||||||||||||||||||||||
| Total revenue | $ | 5,471.4 | $ | 6,520.0 | $ | 1,059.2 | $ | 5,523.0 | $ | 6,268.8 | $ | 1,617.3 | $ | 4,840.0 | $ | 6,120.7 | $ | 1,592.2 | |||||||||||||||||||||||||||||||||||
(a)Represents revenue not subject to ASC Topic 606.
Contract Balances
The timing of revenue recognition, billings and cash collections results in billed accounts receivable, costs and estimated earnings in excess of billings on a test basis, evidence supporting the amountsuncompleted contracts (contract assets), and disclosuresbillings in excess of costs and estimated earnings on uncompleted contracts (contract liabilities) in the financial statements, assessingconsolidated balance sheets.
Contract Assets -Contract Assets include unbilled amounts typically resulting from sales under long-term contracts when revenue is recognized over time and revenue recognized exceeds the accounting principles usedamount billed to the customer, and significant estimates made by management,right to payment is not just subject to the passage of time. Amounts may not exceed their net realizable value. Costs and evaluating the overall financial statement presentation. estimated earnings in excess of billings on uncompleted contracts are generally classified as current.
Contract Liabilities - We believe thatsometimes receive advances or deposits from our audit provides a reasonable basis for our opinion.
| Year Ended | |||||||||||
| (In millions, except per share data) | 2018 | 2017 | 2016 | ||||||||
| Revenue | |||||||||||
| Service revenue | $ | 9,765.0 | $ | 12,210.5 | $ | 9,128.7 | |||||
| Product revenue | 2,565.2 | 2,651.8 | 70.9 | ||||||||
| Lease and other revenue | 222.7 | 194.6 | — | ||||||||
| Total revenue | 12,552.9 | 15,056.9 | 9,199.6 | ||||||||
| Costs and expenses | |||||||||||
| Cost of service revenue | 7,895.1 | 9,984.0 | 7,585.7 | ||||||||
| Cost of product revenue | 2,234.5 | 2,403.4 | 44.3 | ||||||||
| Cost of lease and other revenue | 143.4 | 137.2 | — | ||||||||
| Selling, general and administrative expense | 1,140.6 | 1,060.9 | 572.6 | ||||||||
| Research and development expense | 189.2 | 212.9 | 105.4 | ||||||||
| Impairment, restructuring and other expense (Note 17) | 1,831.2 | 191.5 | 343.0 | ||||||||
| Merger transaction and integration costs (Note 2) | 36.5 | 101.8 | 92.6 | ||||||||
| Total costs and expenses | 13,470.5 | 14,091.7 | 8,743.6 | ||||||||
| Other income (expense), net | (323.9 | ) | (25.9 | ) | 6.5 | ||||||
| Income from equity affiliates (Note 9) | 114.3 | 55.6 | 117.7 | ||||||||
| Income before interest income, interest expense and income taxes | (1,127.2 | ) | 994.9 | 580.2 | |||||||
| Interest income | 121.4 | 140.8 | 85.3 | ||||||||
| Interest expense | (482.3 | ) | (456.0 | ) | (114.1 | ) | |||||
| Income (loss) before income taxes | (1,488.1 | ) | 679.7 | 551.4 | |||||||
| Provision for income taxes (Note 19) | 422.7 | 545.5 | 180.3 | ||||||||
| Net income (loss) | (1,910.8 | ) | 134.2 | 371.1 | |||||||
| Net (income) loss attributable to noncontrolling interests | (10.8 | ) | (20.9 | ) | 22.2 | ||||||
| Net income (loss) attributable to TechnipFMC plc | $ | (1,921.6 | ) | $ | 113.3 | $ | 393.3 | ||||
| Earnings (loss) per share attributable to TechnipFMC plc (Note 6) | |||||||||||
| Basic | $ | (4.20 | ) | $ | 0.24 | $ | 3.29 | ||||
| Diluted | $ | (4.20 | ) | $ | 0.24 | $ | 3.16 | ||||
| Weighted average shares outstanding (Note 6) | |||||||||||
| Basic | 458.0 | 466.7 | 119.4 | ||||||||
| Diluted | 458.0 | 468.3 | 125.1 | ||||||||
The accompanying notes are an integral partfollowing table provides information about net contract assets (liabilities) as of December 31, 2020 and 2019:
| December 31, | |||||||||||||||||||||||
| (In millions) | 2020 | 2019 | $ change | % change | |||||||||||||||||||
| Contract assets | $ | 1,267.6 | $ | 1,520.0 | $ | (252.4) | (16.6) | ||||||||||||||||
| Contract (liabilities) | (4,736.1) | (4,585.1) | (151.0) | (3.3) | |||||||||||||||||||
| Net contract liabilities | $ | (3,468.5) | $ | (3,065.1) | $ | (403.4) | (13.2) | ||||||||||||||||
The decrease in our contract assets from December 31, 2019 to December 31, 2020 was primarily due to the timing of milestones.
The increase in our contract liabilities was primarily due to additional cash received, excluding amounts recognized as revenue during the period.
In order to determine revenue recognized in the period from contract liabilities, we first allocate revenue to the individual contract liability balance outstanding at the beginning of the consolidated financial statements.
period until the revenue exceeds that balance. Any subsequent revenue we recognize increases contract asset balance. Revenue recognized for the years ended December 31, 2020 and 2019 that were included in the contract liabilities balance as of December 31, 2019 and 2018 was $1,267.5 million and $2,414.0 million, respectively.
102
| Year Ended | |||||||||||
| (In millions) | 2018 | 2017 | 2016 | ||||||||
| Net income (loss) | $ | (1,910.8 | ) | $ | 134.2 | $ | 371.1 | ||||
| Foreign currency translation adjustments | |||||||||||
| Net gain (losses) arising during the period | (183.3 | ) | (87.2 | ) | (71.4 | ) | |||||
| Reclassification adjustment for net gains included in net income | (41.1 | ) | — | — | |||||||
Net gains (losses) on foreign currency translation adjustments(a) | (224.4 | ) | (87.2 | ) | (71.4 | ) | |||||
| Net gains (losses) on hedging instruments | |||||||||||
| Net gains (losses) arising during the period | (58.7 | ) | 53.8 | (64.8 | ) | ||||||
| Reclassification adjustment for net gains included in net income | (2.0 | ) | 101.2 | 120.1 | |||||||
Net gains (losses) on hedging instruments (b) | (60.7 | ) | 155.0 | 55.3 | |||||||
| Pension and other post-retirement benefits | |||||||||||
| Net gains arising during the period | (72.4 | ) | 43.2 | 7.0 | |||||||
| Prior service cost arising during the period | (2.1 | ) | — | — | |||||||
| Reclassification adjustment for settlement losses included in net income | (2.5 | ) | (15.2 | ) | (7.4 | ) | |||||
| Reclassification adjustment for amortization of prior service cost included in net income | 1.2 | 0.7 | 0.5 | ||||||||
| Reclassification adjustment for amortization of net actuarial loss included in net income | 0.3 | 1.8 | 0.7 | ||||||||
Net pension and other post-retirement benefits (c) | (75.5 | ) | 30.5 | 0.8 | |||||||
| Other comprehensive income (loss), net of tax | (360.6 | ) | 98.3 | (15.3 | ) | ||||||
| Comprehensive income (loss) | (2,271.4 | ) | 232.5 | 355.8 | |||||||
| Comprehensive (income) loss attributable to noncontrolling interest | (6.2 | ) | (21.3 | ) | 20.9 | ||||||
| Comprehensive income (loss) attributable to TechnipFMC plc | $ | (2,277.6 | ) | $ | 211.2 | $ | 376.7 | ||||
Transaction Price Allocated to the Remaining Unsatisfied Performance Obligations
Remaining unsatisfied performance obligations (“RUPO” or “order backlog”) represent the transaction price for products and services for which we have a material right, but work has not been performed. Transaction price of the order backlog includes the base transaction price, variable consideration and changes in transaction price. The order backlog table does not include contracts for which we recognize revenue at the amount to which we have the right to invoice for services performed. The transaction price of order backlog related to unfilled, confirmed customer orders is estimated at each reporting date. As of December 31, 2020, the aggregate amount of the transaction price allocated to order backlog was $21,388.2 million. TechnipFMC expects to recognize revenue on approximately 51.2% of the order backlog through 2021 and 48.8% thereafter.
The accompanying notes are an integral partfollowing table details the order backlog for each business segment as of the consolidated financial statements.
December 31, 2020:
| (In millions) | 2021 | 2022 | Thereafter | ||||||||||||||
| Subsea | $ | 3,585.4 | $ | 2,217.2 | $ | 1,073.4 | |||||||||||
| Technip Energies | 7,016.2 | 4,081.7 | 3,000.8 | ||||||||||||||
| Surface Technologies | 343.6 | 69.4 | 0.5 | ||||||||||||||
| Total remaining unsatisfied performance obligations | $ | 10,945.2 | $ | 6,368.3 | $ | 4,074.7 | |||||||||||
TECHNIPFMC PLC AND CONSOLIDATED SUBSIDIARIES CONSOLIDATED BALANCE SHEETS | ||||||||
| (In millions, except par value data) | December 31, | |||||||
| Assets | 2018 | 2017 | ||||||
| Cash and cash equivalents | $ | 5,540.0 | $ | 6,737.4 | ||||
| Trade receivables, net of allowances of $119.6 in 2018 and $117.4 in 2017 | 2,469.7 | 1,484.4 | ||||||
| Contract assets | 1,295.0 | 1,755.5 | ||||||
| Inventories, net (Note 7) | 1,251.2 | 987.0 | ||||||
| Derivative financial instruments (Note 21) | 95.7 | 78.3 | ||||||
| Income taxes receivable | 284.3 | 337.0 | ||||||
| Advances paid to suppliers | 189.7 | 391.3 | ||||||
| Other current assets (Note 8) | 655.6 | 1,206.2 | ||||||
| Total current assets | 11,781.2 | 12,977.1 | ||||||
| Investments in equity affiliates (Note 9) | 394.5 | 272.5 | ||||||
| Property, plant and equipment, net (Note 11) | 3,259.8 | 3,871.5 | ||||||
| Goodwill (Note 12) | 7,607.6 | 8,929.8 | ||||||
| Intangible assets, net (Note 12) | 1,176.7 | 1,333.8 | ||||||
| Deferred income taxes (Note 19) | 232.4 | 454.7 | ||||||
| Derivative financial instruments (Note 21) | 18.3 | 94.9 | ||||||
| Other assets | 314.0 | 329.4 | ||||||
| Total assets | $ | 24,784.5 | $ | 28,263.7 | ||||
| Liabilities and equity | ||||||||
| Short-term debt and current portion of long-term debt (Note 13) | $ | 67.4 | $ | 77.1 | ||||
| Accounts payable, trade | 2,600.3 | 3,958.7 | ||||||
| Contract liabilities | 4,085.1 | 3,314.2 | ||||||
| Accrued payroll | 394.7 | 402.2 | ||||||
| Derivative financial instruments (Note 21) | 138.4 | 69.0 | ||||||
| Income taxes payable | 81.9 | 320.3 | ||||||
| Other current liabilities (Note 8) | 1,766.6 | — | 1,687.9 | |||||
| Total current liabilities | 9,134.4 | 9,829.4 | ||||||
| Long-term debt, less current portion (Note 13) | 4,124.3 | 3,777.9 | ||||||
| Deferred income taxes (Note 19) | 209.2 | 419.7 | ||||||
| Accrued pension and other post-retirement benefits, less current portion (Note 20) | 298.9 | 282.0 | ||||||
| Derivative financial instruments (Note 21) | 44.9 | 68.1 | ||||||
| Other liabilities | 503.4 | 477.2 | ||||||
| Total liabilities | 14,315.1 | 14,854.3 | ||||||
| Commitments and contingent liabilities (Note 18) | ||||||||
| Mezzanine equity | ||||||||
| Redeemable noncontrolling interest | 38.5 | — | ||||||
| Stockholders’ equity (Note 15) | ||||||||
| Ordinary shares, $1.00 par value; 618.3 shares and 525.0 shares authorized in 2018 and 2017, respectively; 450.5 shares and 465.1 shares issued and outstanding in 2018 and 2017, respectively; 14.8 and 2.1 shares canceled in 2018 and 2017, respectively | 450.5 | 465.1 | ||||||
| Ordinary shares held in employee benefit trust, at cost; 0.1 and 0.1 shares in 2018 and 2017, respectively | (2.4 | ) | (4.8 | ) | ||||
| Capital in excess of par value of ordinary shares | 10,197.0 | 10,483.3 | ||||||
| Retained earnings | 1,114.2 | 3,448.0 | ||||||
| Accumulated other comprehensive loss | (1,359.7 | ) | (1,003.7 | ) | ||||
| Total TechnipFMC plc stockholders’ equity | 10,399.6 | 13,387.9 | ||||||
| Noncontrolling interests | 31.3 | 21.5 | ||||||
| Total equity | 10,430.9 | 13,409.4 | ||||||
| Total liabilities and equity | $ | 24,784.5 | $ | 28,263.7 | ||||
| Year Ended December 31, | |||||||||||
| (In millions) | 2018 | 2017 | 2016 | ||||||||
| Cash provided (required) by operating activities | |||||||||||
| Net income (loss) | $ | (1,910.8 | ) | $ | 134.2 | $ | 371.1 | ||||
| Adjustments to reconcile net income to cash provided (required) by operating activities | |||||||||||
| Depreciation | 367.8 | 370.2 | 283.2 | ||||||||
| Amortization | 182.6 | 244.5 | 17.5 | ||||||||
| Employee benefit plan and share-based compensation costs | 22.4 | 18.7 | 27.4 | ||||||||
| Deferred income tax provision (benefit), net | 48.8 | 141.6 | (172.1 | ) | |||||||
| Unrealized loss (gain) on derivative instruments and foreign exchange | 102.7 | (73.5 | ) | (123.2 | ) | ||||||
| Impairments (Note 17) | 1,792.6 | 34.3 | 38.2 | ||||||||
| Income from equity affiliates, net of dividends received | (110.7 | ) | (37.9 | ) | (48.1 | ) | |||||
| Other | 291.8 | 4.7 | 161.8 | ||||||||
| Changes in operating assets and liabilities, net of effects of acquisitions | |||||||||||
| Trade receivables, net and contract assets | (664.1 | ) | 286.8 | (268.7 | ) | ||||||
| Inventories, net | (339.4 | ) | 130.9 | 172.7 | |||||||
| Accounts payable, trade | (1,248.7 | ) | (525.8 | ) | 115.5 | ||||||
| Contract liabilities | 762.7 | (1,111.4 | ) | (498.3 | ) | ||||||
| Income taxes payable (receivable), net | (190.7 | ) | (152.2 | ) | 71.7 | ||||||
| Other current assets and liabilities, net | 921.2 | 646.5 | 264.4 | ||||||||
| Other noncurrent assets and liabilities, net | (213.6 | ) | 99.1 | 80.7 | |||||||
| Cash provided (required) by operating activities | (185.4 | ) | 210.7 | 493.8 | |||||||
| Cash provided (required) by investing activities | |||||||||||
| Capital expenditures | (368.1 | ) | (255.7 | ) | (312.9 | ) | |||||
| Cash acquired in merger of FMC Technologies, Inc. and Technip S.A. (Note 2) | — | 1,479.2 | — | ||||||||
| Acquisitions, net of cash acquired | (104.9 | ) | — | — | |||||||
| Cash acquired upon consolidation of investee | — | — | 3,480.7 | ||||||||
| Cash divested from deconsolidation | (6.7 | ) | — | (89.1 | ) | ||||||
| Proceeds from sale of assets | 19.5 | 14.4 | 39.2 | ||||||||
| Other | — | 12.1 | (7.4 | ) | |||||||
| Cash provided (required) by investing activities | (460.2 | ) | 1,250.0 | 3,110.5 | |||||||
| Cash provided (required) by financing activities | |||||||||||
| Net increase (decrease) in short-term debt | (34.9 | ) | (106.4 | ) | 8.6 | ||||||
| Net increase in commercial paper | 496.6 | 234.9 | — | ||||||||
| Proceeds from issuance of long-term debt | — | 25.7 | 644.5 | ||||||||
| Repayments of long-term debt | — | (888.0 | ) | (891.2 | ) | ||||||
| Purchase of ordinary shares | (442.6 | ) | (58.5 | ) | (186.8 | ) | |||||
| Dividends paid | (238.1 | ) | (60.6 | ) | (111.5 | ) | |||||
| Payments related to taxes withheld on share-based compensation | — | (46.6 | ) | — | |||||||
| Settlements of mandatorily redeemable financial liability | (225.8 | ) | (156.5 | ) | — | ||||||
| Other | — | 1.2 | 1.8 | ||||||||
| Cash provided (required) by financing activities | (444.8 | ) | (1,054.8 | ) | (534.6 | ) | |||||
| Effect of changes in foreign exchange rates on cash and cash equivalents | (107.0 | ) | 62.2 | 21.6 | |||||||
| Increase (decrease) in cash and cash equivalents | (1,197.4 | ) | 468.1 | 3,091.3 | |||||||
| Cash and cash equivalents, beginning of year | 6,737.4 | 6,269.3 | 3,178.0 | ||||||||
| Cash and cash equivalents, end of year | $ | 5,540.0 | $ | 6,737.4 | $ | 6,269.3 | |||||
| Year Ended December 31, | |||||||||||
| (In millions) | 2018 | 2017 | 2016 | ||||||||
| Supplemental disclosures of cash flow information | |||||||||||
| Cash paid for interest (net of interest capitalized) | $ | 99.0 | $ | 50.3 | $ | 40.2 | |||||
| Cash paid for income taxes (net of refunds received) | $ | 410.6 | $ | 424.7 | $ | 261.3 | |||||
| (In millions) | Ordinary Shares | Ordinary Shares Held in Treasury and Employee Benefit Trust | Capital in Excess of Par Value of Ordinary Shares | Retained Earnings | Accumulated Other Comprehensive Income (Loss) | Non- controlling Interest | Total Stockholders’ Equity | ||||||||||||||||||||
| Balance as of December 31, 2015 | $ | 114.5 | $ | (81.1 | ) | $ | 2,725.4 | $ | 3,273.4 | $ | (1,085.0 | ) | $ | 9.2 | $ | 4,956.4 | |||||||||||
| Net income (loss) | — | — | — | 393.3 | — | (22.2 | ) | 371.1 | |||||||||||||||||||
| Other comprehensive income (loss) | — | — | — | — | (16.6 | ) | 1.3 | (15.3 | ) | ||||||||||||||||||
| Net capital transactions | 0.2 | — | (35.1 | ) | — | — | — | (34.9 | ) | ||||||||||||||||||
| Treasury shares (Note 15) | — | 36.6 | (31.1 | ) | — | — | — | 5.5 | |||||||||||||||||||
| Dividends (€2.00 per share) (Note 15) | — | — | — | (262.6 | ) | — | — | (262.6 | ) | ||||||||||||||||||
| Share-based compensation (Note 16) | — | — | 22.0 | — | — | — | 22.0 | ||||||||||||||||||||
| Other | — | — | 1.9 | — | — | — | 1.9 | ||||||||||||||||||||
| Balance as of December 31, 2016 | $ | 114.7 | $ | (44.5 | ) | $ | 2,683.1 | $ | 3,404.1 | $ | (1,101.6 | ) | $ | (11.7 | ) | $ | 5,044.1 | ||||||||||
| Net income (loss) | — | — | — | 113.3 | — | 20.9 | 134.2 | ||||||||||||||||||||
| Other comprehensive income (loss) | — | — | — | — | 97.9 | 0.4 | 98.3 | ||||||||||||||||||||
| Issuance of ordinary shares due to the merger of FMC Technologies and Technip | 351.9 | (6.6 | ) | 7,825.4 | — | — | — | 8,170.7 | |||||||||||||||||||
| Cancellation of treasury shares due to the merger of FMC Technologies and Technip | — | 44.5 | (23.3 | ) | — | — | — | 21.2 | |||||||||||||||||||
| Cancellation treasury shares (Note 15) | (2.1 | ) | — | (47.6 | ) | (8.8 | ) | — | — | (58.5 | ) | ||||||||||||||||
| Net sales of ordinary shares for employee benefit trust | — | 1.8 | — | — | — | — | 1.8 | ||||||||||||||||||||
| Issuance of ordinary shares | 0.6 | — | 0.6 | — | — | — | 1.2 | ||||||||||||||||||||
| Dividends ($0.13 per share) (Note 15) | — | — | — | (60.6 | ) | — | — | (60.6 | ) | ||||||||||||||||||
| Share-based compensation (Note 16) | — | — | 44.4 | — | — | — | 44.4 | ||||||||||||||||||||
| Other | — | — | 0.7 | — | — | 11.9 | 12.6 | ||||||||||||||||||||
| Balance as of December 31, 2017 | $ | 465.1 | $ | (4.8 | ) | $ | 10,483.3 | $ | 3,448.0 | $ | (1,003.7 | ) | $ | 21.5 | $ | 13,409.4 | |||||||||||
| Adoption of accounting standards (Note 4) | — | — | — | (91.5 | ) | — | 0.1 | (91.4 | ) | ||||||||||||||||||
| Net income (loss) | — | — | — | (1,921.6 | ) | — | 10.8 | (1,910.8 | ) | ||||||||||||||||||
| Other comprehensive income (loss) | — | — | — | — | (356.0 | ) | (4.6 | ) | (360.6 | ) | |||||||||||||||||
| Cancellation of treasury shares (Note 15) | (14.8 | ) | — | (333.5 | ) | (94.5 | ) | — | — | (442.8 | ) | ||||||||||||||||
| Issuance of ordinary shares | 0.2 | — | — | — | — | — | 0.2 | ||||||||||||||||||||
| Net sales of ordinary shares for employee benefit trust | — | 2.4 | — | — | — | — | 2.4 | ||||||||||||||||||||
| Dividends ($0.52 per share) (Note 15) | — | — | — | (238.1 | ) | — | — | (238.1 | ) | ||||||||||||||||||
| Share-based compensation (Note 16) | — | — | 49.1 | — | — | — | 49.1 | ||||||||||||||||||||
| Other | — | — | (1.9 | ) | 11.9 | — | 3.5 | 13.5 | |||||||||||||||||||
| Balance as of December 31, 2018 | $ | 450.5 | $ | (2.4 | ) | $ | 10,197.0 | $ | 1,114.2 | $ | (1,359.7 | ) | $ | 31.3 | $ | 10,430.9 | |||||||||||
NOTE 1. BASIS OF PRESENTATION AND SUMMARY OF SIGNIFICANT ACCOUNTING POLICIES7. BUSINESS SEGMENTS
We report the results of operations in the following segments:
•Subsea - TechnipFMC plcdesigns and consolidated subsidiaries (“TechnipFMC,” “we,” “us” or “our”) is a global leader inmanufactures products and systems, performs engineering, procurement and project management, and provides services used by oil and gas projects, technologies, systemscompanies involved in offshore exploration and services through our business segments: Subsea, Onshore/Offshoreproduction of crude oil and Surface Technologies. We have manufacturing operations worldwide, strategically located to facilitate delivery of ournatural gas.
•Technip Energies - offers extensive experience, knowledge and unique project management capabilities in onshore and offshore hydrocarbon infrastructure businesses; it also combines its leading engineering and construction capabilities with its technological know-how, products systems and services to our customers.develop new solutions that will support the world’s energy transition.
Beginning in the United Statesfirst quarter of America (“GAAP”)2020, in anticipation of our separation transaction, we renamed our Onshore/Offshore segment to Technip Energies, which includes our Loading Systems business that was previously reported in the Surface Technologies segment and rulesour process automation business, Cybernetix, that was previously reported in the Subsea segment. Prior year information has not been restated due to these businesses not being material. Subsequent to the Spin-off, we operate under two reporting segments: Subsea and regulations of the SecuritiesSurface Technologies, for further details see Note 3 for further details.
Segment operating profit (loss) is defined as total segment revenue less segment operating expenses. Income (loss) from equity method investments is included in computing segment operating profit. The following items have been excluded in computing segment operating profit (loss): corporate staff expense, net interest income (expense) associated with corporate debt facilities, income taxes, and Exchange Commission (“SEC”) pertaining to annual financial information. The preparation of financial statements in conformity with these accounting principles requires us to make estimates and assumptions that affect the reported amounts of assets and liabilities at the date of the financial statements and the reported amounts ofother revenue and other expense, net.
103
Information by business segment
Segment revenue and segment operating profit (loss) were as follows:
| Year Ended December 31, | |||||||||||||||||
| (In millions) | 2020 | 2019 | 2018 | ||||||||||||||
| Segment revenue | |||||||||||||||||
| Subsea | $ | 5,471.4 | $ | 5,523.0 | $ | 4,840.0 | |||||||||||
| Technip Energies | 6,520.0 | 6,268.8 | 6,120.7 | ||||||||||||||
| Surface Technologies | 1,059.2 | 1,617.3 | 1,592.2 | ||||||||||||||
| Total revenue | $ | 13,050.6 | $ | 13,409.1 | $ | 12,552.9 | |||||||||||
| Segment operating profit (loss) | |||||||||||||||||
| Subsea | $ | (2,815.5) | $ | (1,447.7) | $ | (1,529.5) | |||||||||||
| Technip Energies | 683.6 | 959.6 | 824.0 | ||||||||||||||
| Surface Technologies | (429.3) | (656.1) | 172.8 | ||||||||||||||
| Total segment operating loss | (2,561.2) | (1,144.2) | (532.7) | ||||||||||||||
| Corporate items | |||||||||||||||||
| Impairment, restructuring and other expenses | (10.0) | (17.4) | (18.9) | ||||||||||||||
| Separation costs | (39.5) | (72.1) | 0 | ||||||||||||||
| Merger transaction and integration costs | — | (31.2) | (36.5) | ||||||||||||||
| Legal expenses | — | (54.6) | (280.0) | ||||||||||||||
Other corporate expenses (a) | (152.0) | (218.1) | (142.6) | ||||||||||||||
| Corporate expense | (201.5) | (393.4) | (478.0) | ||||||||||||||
| Interest income | 56.6 | 116.5 | 121.4 | ||||||||||||||
| Interest expense | (349.6) | (567.8) | (482.3) | ||||||||||||||
| Foreign exchange losses | (28.8) | (146.9) | (116.5) | ||||||||||||||
| Total corporate items | (523.3) | (991.6) | (955.4) | ||||||||||||||
Loss before income taxes (b) | $ | (3,084.5) | $ | (2,135.8) | $ | (1,488.1) | |||||||||||
(a)Other corporate expenses during the reporting period. Ultimate results could differ from our estimates. Certain prior-yearprimarily include corporate staff expenses, share-based compensation expenses, and other employee benefits.
(b)Includes amounts have been reclassifiedattributable to conform to the current year’s presentation. non-controlling interests.
Segment assets were as follows:
| December 31, | |||||||||||
| (In millions) | 2020 | 2019 | |||||||||
| Segment assets | |||||||||||
| Subsea | $ | 6,796.6 | $ | 10,824.2 | |||||||
| Technip Energies | 5,058.3 | 4,448.8 | |||||||||
| Surface Technologies | 1,758.3 | 2,246.4 | |||||||||
| Total segment assets | 13,613.2 | 17,519.4 | |||||||||
Corporate (a) | 6,079.4 | 5,999.4 | |||||||||
| Total assets | $ | 19,692.6 | $ | 23,518.8 | |||||||
(a)Corporate includes cash, LIFO adjustments, deferred income tax balances, property, plant and equipment and intercompany eliminations not associated with a specific segment, pension assets and the fair value of derivative financial instruments.
104
Other business segment information is as follows:
| Capital Expenditures | Depreciation and Amortization | Research and Development Expense | |||||||||||||||||||||||||||||||||||||||||||||||||||
| Year Ended December 31, | Year Ended December 31, | Year Ended December 31, | |||||||||||||||||||||||||||||||||||||||||||||||||||
| (In millions) | 2020 | 2019 | 2018 | 2020 | 2019 | 2018 | 2020 | 2019 | 2018 | ||||||||||||||||||||||||||||||||||||||||||||
| Subsea | $ | 213.6 | $ | 287.7 | $ | 223.2 | $ | 324.9 | $ | 345.6 | $ | 440.4 | $ | 66.5 | $ | 134.4 | $ | 145.2 | |||||||||||||||||||||||||||||||||||
| Technip Energies | 13.0 | 22.6 | 7.6 | 34.2 | 38.7 | 38.2 | 44.5 | 13.2 | 29.7 | ||||||||||||||||||||||||||||||||||||||||||||
| Surface Technologies | 38.5 | 96.6 | 111.9 | 70.1 | 107.9 | 66.6 | 8.8 | 15.3 | 14.3 | ||||||||||||||||||||||||||||||||||||||||||||
| Corporate | 26.7 | 47.5 | 25.4 | 18.0 | 17.4 | 5.2 | — | — | — | ||||||||||||||||||||||||||||||||||||||||||||
| Total | $ | 291.8 | $ | 454.4 | $ | 368.1 | $ | 447.2 | $ | 509.6 | $ | 550.4 | $ | 119.8 | $ | 162.9 | $ | 189.2 | |||||||||||||||||||||||||||||||||||
Information by geography
Sales by geography were identified based on the country where our products and services were delivered, and are as follows:
| Year Ended December 31, | |||||||||||||||||
| (In millions) | 2020 | 2019 | 2018 | ||||||||||||||
| Revenue | |||||||||||||||||
| Russia | $ | 2,451.5 | $ | 2,378.0 | $ | 2,773.3 | |||||||||||
| United States | 2,141.4 | 1,931.2 | 1,275.8 | ||||||||||||||
| Norway | 1,393.5 | 1,371.1 | 1,202.6 | ||||||||||||||
| Brazil | 698.8 | 1,099.7 | 1,478.7 | ||||||||||||||
| United Kingdom | 513.8 | 540.8 | 442.1 | ||||||||||||||
| Angola | 488.5 | 447.8 | 385.7 | ||||||||||||||
| Egypt | 445.9 | 177.6 | 13.2 | ||||||||||||||
| Mozambique | 391.4 | 166.1 | 116.2 | ||||||||||||||
| India | 386.4 | 518.0 | 214.0 | ||||||||||||||
| Senegal | 353.0 | 176.5 | 1.2 | ||||||||||||||
| Vietnam | 340.7 | 72.1 | 34.7 | ||||||||||||||
| Israel | 333.6 | 757.0 | 243.8 | ||||||||||||||
| Guyana | 330.1 | 7.2 | 7.6 | ||||||||||||||
| Australia | 320.8 | 372.8 | 926.6 | ||||||||||||||
| Singapore | 312.2 | 64.9 | 23.4 | ||||||||||||||
| Indonesia | 286.9 | 237.6 | 130.7 | ||||||||||||||
| Malaysia | 281.7 | 283.8 | 362.3 | ||||||||||||||
| France | 186.9 | 92.8 | 138.9 | ||||||||||||||
| China | 151.4 | 272.9 | 112.3 | ||||||||||||||
| United Arab Emirates | 147.9 | 327.2 | 460.3 | ||||||||||||||
| All other countries | 1,094.2 | 2,114.0 | 2,209.5 | ||||||||||||||
| Total revenue | $ | 13,050.6 | $ | 13,409.1 | $ | 12,552.9 | |||||||||||
105
Long-lived assets by geography represent property, plant and equipment, net, and are as follows:
| December 31, | |||||||||||
| (In millions) | 2020 | 2019 | |||||||||
| Long-lived assets | |||||||||||
| United Kingdom | $ | 936.2 | $ | 957.1 | |||||||
| United States | 467.5 | 558.1 | |||||||||
| Netherlands | 419.5 | 493.0 | |||||||||
| Norway | 312.2 | 333.0 | |||||||||
| Brazil | 260.0 | 313.2 | |||||||||
| All other countries | 466.4 | 507.6 | |||||||||
| Total long-lived assets | $ | 2,861.8 | $ | 3,162.0 | |||||||
NOTE 8. EARNINGS (LOSS) PER SHARE
A reconciliation of the number of shares used for the basic and diluted earnings per share calculation was as follows:
| Year Ended December 31, | |||||||||||||||||
| (In millions, except per share data) | 2020 | 2019 | 2018 | ||||||||||||||
| Net loss attributable to TechnipFMC plc | $ | (3,287.6) | $ | (2,415.2) | $ | (1,921.6) | |||||||||||
| Weighted average number of shares outstanding | 448.7 | 448.0 | 458.0 | ||||||||||||||
| Dilutive effect of restricted stock units | — | 0 | 0 | ||||||||||||||
| Dilutive effect of performance shares | — | — | 0 | ||||||||||||||
| Total shares and dilutive securities | 448.7 | 448.0 | 458.0 | ||||||||||||||
| Basic loss per share attributable to TechnipFMC plc | $ | (7.33) | $ | (5.39) | $ | (4.20) | |||||||||||
| Diluted loss per share attributable to TechnipFMC plc | $ | (7.33) | $ | (5.39) | $ | (4.20) | |||||||||||
For the years ended December 31, 2020, 2019 and 2018, we incurred net losses; therefore, the impact of any incremental shares from our share-based compensation awards would be anti-dilutive. For the years ended December 31, 2020, 2019 and 2018, 3.8 million shares, 4.3 million shares and 2.7 million shares, respectively, were anti-dilutive due to Note 2a net loss position.
Weighted average shares of the following share-based compensation awards were excluded from the calculation of diluted weighted average number of shares where the assumed proceeds exceed the average market price from the calculation of diluted weighted average number of shares, because their effect would be anti-dilutive:
| Year Ended December 31, | |||||||||||||||||
| (millions of shares) | 2020 | 2019 | 2018 | ||||||||||||||
| Share option awards | 4.6 | 4.0 | 3.5 | ||||||||||||||
| Restricted share units | 1.8 | 0 | 0 | ||||||||||||||
| Performance shares | 1.9 | 1.6 | 0 | ||||||||||||||
| Total | 8.3 | 5.6 | 3.5 | ||||||||||||||
106
NOTE 9. INVENTORIES
Inventories consisted of the following:
| December 31, | |||||||||||
| (In millions) | 2020 | 2019 | |||||||||
| Raw materials | $ | 272.4 | $ | 347.5 | |||||||
| Work in process | 245.2 | 290.2 | |||||||||
| Finished goods | 750.9 | 778.3 | |||||||||
| Inventories, net | $ | 1,268.5 | $ | 1,416.0 | |||||||
All amounts in the table above are reported net of obsolescence reserves of $162.8 million and $135.7 million as of December 31, 2020 and 2019, respectively.
Net inventories accounted for further information relatedunder the LIFO method totaled $408.5 million and $386.6 million as of December 31, 2020 and 2019, respectively. The current replacement costs of LIFO inventories exceeded their recorded values by $11.6 million and $10.9 million as of December 31, 2020 and 2019, respectively. There was 0 reduction to the merger of FMC Technologies and Technip.base LIFO inventory in 2020.
NOTE 10. OTHER CURRENT ASSETS & OTHER CURRENT LIABILITIES
Other current assets and liabilities and disclosures of contingent assets and liabilities at the dateconsisted of the financial statementsfollowing:
| December 31, | |||||||||||
| (In millions) | 2020 | 2019 | |||||||||
| Value - added tax receivables | $ | 450.5 | $ | 395.2 | |||||||
| Sundry receivables | 179.3 | 69.6 | |||||||||
| Prepaid expenses | 111.7 | 66.8 | |||||||||
| Other taxes receivables | 90.1 | 100.7 | |||||||||
| Assets held for sale | 47.3 | 25.8 | |||||||||
| Current financial assets at amortized cost | 40.6 | 42.0 | |||||||||
| Held-to-maturity investments | 24.2 | 49.7 | |||||||||
| Other | 48.9 | 113.9 | |||||||||
| Total other current assets | $ | 992.6 | $ | 863.7 | |||||||
Other current liabilities consisted of the following:
| December 31, | |||||||||||
| (In millions) | 2020 | 2019 | |||||||||
| Warranty accruals and project contingencies | 285.9 | 310.1 | |||||||||
| Value - added tax and other taxes payable | $ | 221.3 | $ | 240.4 | |||||||
| Legal provisions | 188.5 | 183.6 | |||||||||
| Redeemable financial liability | 141.9 | 129.1 | |||||||||
| Social security liability | 108.9 | 116.5 | |||||||||
| Provisions | 75.5 | 86.6 | |||||||||
| Compensation accrual | 54.3 | 89.6 | |||||||||
| Current portion of accrued pension and other post-retirement benefits | 13.9 | 14.9 | |||||||||
| Liabilities classified as held for sale | 0 | 9.3 | |||||||||
| Other accrued liabilities | 278.4 | 314.4 | |||||||||
| Total other current liabilities | $ | 1,368.6 | $ | 1,494.5 | |||||||
107
NOTE 11. WARRANTY OBLIGATIONS
Warranty obligations are included within “Other current liabilities” in our consolidated balance sheets as of December 31, 2020 and 2019. A reconciliation of warranty obligations for the reported amounts of revenueyears ended December 31, 2020 and expenses during the reporting period. Actual results could differ from those estimates. Such estimates include, but are not limited to, estimates of total contract profit or loss on long-term construction-type contracts; estimated realizable value on excess and obsolete inventory; estimates related to pension accounting; estimates related to fair value for purposes of assessing goodwill, long-lived assets and intangible assets for impairment; estimates of fair value in business combinations and estimates related to income taxes.2019 is as follows:
| Year Ended December 31, | |||||||||||
| (In millions) | 2020 | 2019 | |||||||||
| Balance at beginning of period | $ | 193.5 | $ | 234.4 | |||||||
| Warranty expenses | 95.6 | 78.8 | |||||||||
| Adjustment to existing accruals | (86.2) | (57.5) | |||||||||
| Claims paid | (28.1) | (62.2) | |||||||||
| Balance at end of period | $ | 174.8 | $ | 193.5 | |||||||
NOTE 12. EQUITY METHOD INVESTMENTS
The equity method of accounting is used to account for investments in unconsolidated affiliates where we can have the ability to exert significant influence over the affiliates’affiliates operating and financial policies. The cost method of accounting is used where significant influence over the affiliate is not present.
For certain construction joint ventures, we use the proportionate consolidation method, whereby our proportionate share of each entity’s assets, liabilities, revenues, and expenses are included in the appropriate classifications in the accompanying consolidated financial statements. Intercompany balancesNone of our proportionate consolidation investments, individually or in the aggregate, are significant to our consolidated results for 2020, 2019, or 2018.
Our equity investments were as follows as of December 31, 2020 and transactions have been eliminated in preparing the accompanying consolidated financial statements.2019:
| December 31 | |||||||||||||||||
| 2020 | 2019 | ||||||||||||||||
| (In millions, except %) | Percentage Owned | Carrying Value | |||||||||||||||
| Dofcon Brasil AS | 50.0 | % | 234.7 | 167.4 | |||||||||||||
| Magma Global Limited | 25.0 | % | 51.4 | 50.2 | |||||||||||||
| Serimax Holdings SAS | 20.0 | % | 18.8 | 21.5 | |||||||||||||
| Other | 54.0 | 61.3 | |||||||||||||||
| Investments in equity affiliates | $ | 358.9 | $ | 300.4 | |||||||||||||
Our major equity method investees to be strategic, long-term investments and completes its assessments for impairment with a long-term viewpoint.
Dofcon Brasil AS (“Dofcon”) - is an affiliated company in other assets on the consolidated balance sheets. Where no active market existsform of a joint venture between TechnipFMC and where no other valuation method can be used, these financial assets are maintained at cost minus impairment, if any, plus or minus changes resulting from observable price changesDOF Subsea and was founded in orderly transactions2006. Dofcon provides Pipe-Laying Support Vessels (PLSVs) for the identical or a similar investment of the same issuer.
| (In millions, except per share data) | ||||
| Total FMC Technologies, Inc. shares subject to exchange as of January 16, 2017 | 228.9 | |||
FMC Technologies, Inc. exchange ratio (a) | 0.5 | |||
| Shares of TechnipFMC issued | 114.4 | |||
Value per share of Technip as of January 16, 2017 (b) | $ | 71.4 | ||
| Total purchase consideration | $ | 8,170.7 | ||
| (In millions) | ||||
| Assets | ||||
| Cash | $ | 1,479.2 | ||
| Accounts receivable | 647.8 | |||
| Costs and estimated earnings in excess of billings on uncompleted contracts | 599.6 | |||
| Inventory | 764.8 | |||
| Income taxes receivable | 139.2 | |||
| Other current assets | 282.2 | |||
| Property, plant and equipment | 1,293.3 | |||
| Intangible assets | 1,390.3 | |||
| Other long-term assets | 167.3 | |||
| Total identifiable assets acquired | 6,763.7 | |||
| Liabilities | ||||
| Short-term and current portion of long-term debt | 319.5 | |||
| Accounts payable, trade | 386.0 | |||
| Billings in excess of costs and estimated earnings on uncompleted contracts | 454.0 | |||
| Income taxes payable | 92.1 | |||
| Other current liabilities | 524.3 | |||
| Long-term debt, less current portion | 1,444.2 | |||
| Accrued pension and other post-retirement benefits, less current portion | 195.5 | |||
| Deferred income taxes | 219.4 | |||
| Other long-term liabilities | 138.7 | |||
| Total liabilities assumed | 3,773.7 | |||
| Net identifiable assets acquired | 2,990.0 | |||
| Goodwill | 5,180.7 | |||
| Net assets acquired | $ | 8,170.7 | ||
| (In millions) | Allocated Goodwill | ||
| Subsea | $ | 2,527.7 | |
| Onshore/Offshore | 1,635.5 | ||
| Surface Technologies | 1,017.5 | ||
| Total | $ | 5,180.7 | |
| (In millions, except estimated useful lives) | Fair Value | Estimated Useful Lives | |||
| Acquired technology | $ | 240.0 | 10 | ||
| Backlog | 175.0 | 2 | |||
| Customer relationships | 285.0 | 10 | |||
| Tradenames | 635.0 | 20 | |||
| Software | 55.3 | Various | |||
| Total identifiable intangible assets acquired | $ | 1,390.3 | |||
As part of the ongoing reviewcollaboration, TechnipFMC holds a minority stake. We have accounted for our 25% investment using the equity method investment of accounting with results reported in our Subsea segment.
Serimax Holdings SAS (“Serimax”) - is an affiliated company in the purchase price allocation,form of a $19.7 million adjustment to our deferred tax liability balancejoint venture between TechnipFMC and Vallourec SA and was recorded during the first quarter of 2018 which increased Surface Technologies goodwill.
| Unaudited | |||||||
| Year Ended December 31, | |||||||
| (In millions, except per share data) | 2017 Pro Forma | 2016 Pro Forma | |||||
| Revenue | $ | 15,169.8 | $ | 13,727.9 | |||
| Net income attributable to TechnipFMC adjusted for dilutive effects | $ | 28.5 | $ | 291.8 | |||
| Diluted earnings per share | 0.06 | 0.62 | |||||
108
Our income from equity investments that do not have readily determinable fair values at cost minus impairment, if any, plus or minus changes resulting from observable price changes in orderly transactions for the identical or a similar investment of the same issuer. This updated guidance also simplifies the impairment assessment of equity investments without readily determinable fair values and eliminates the requirement to disclose significant assumptions and methods used to estimate the fair value of financial instruments measured at amortized cost. The updated guidance further requires the use of an exit price notion when measuring the fair value of financial instruments for disclosure purposes. All amendments are required to be adopted on a modified retrospective basis, with two exceptions. The amendments related to equity investments without readily determinable fair values and the requirement to use an exit price notion are required to be adopted prospectively. In February 2018, the FASB issued ASU No. 2018-03, “Technical Corrections and Improvements to Financial Instruments-Overall (Subtopic 825-10): Recognition and Measurement of Financial Assets and Financial Liabilities”. These amendments clarify the guidance in ASU No. 2016-01, on the following issues (among other things): Equity Securities without a Readily Determinable Fair Value-Discontinuation; Equity Securities without a Readily Determinable Fair Value - Adjustment; Forward Contracts and Purchase Options; Presentation Requirements for Certain Fair Value Option Liabilities; Fair Value Option Liabilities Denominated in a Foreign Currency; and Transition Guidance for Equity Securities without a Readily Determinable Fair Value. The amendments in this ASU are effective in conjunction with the adoption of ASU No. 2016-01. In March 2018, the FASB issued ASU No. 2018-04, “Investments-Debt Securities (Topic 320) and Regulated Operations (Topic 980): Amendments to SEC Paragraphs Pursuant to SEC Staff Accounting Bulletin No. 117 and SEC Release No. 33-9273.” This ASU supersedes SEC paragraphs pursuant to the SEC Staff Accounting Bulletin No. 117, which brings existing guidance into conformity with Topic 321, Investments-Equity Securities, and SEC Release No. 33-9273, which removed Regulation S-X Rule 3A-05, Special Requirements as to Public Utility Holding Companies. The adoption of these updates did not have a material impact on our consolidated financial statements.
| Year Ended December 31, | |||||||||||||||||
| (In millions) | 2020 | 2019 | 2018 | ||||||||||||||
| Subsea | $ | 64.6 | $ | 59.8 | $ | 80.9 | |||||||||||
| Technip Energies | (1.6) | 3.1 | 33.4 | ||||||||||||||
| Income from equity affiliates | $ | 63.0 | $ | 62.9 | $ | 114.3 | |||||||||||
| Reportable Segments | |||||||||||
| Year Ended | |||||||||||
| December 31, 2018 | |||||||||||
| (In millions) | Subsea | Onshore/ Offshore | Surface Technologies | ||||||||
| Europe, Russia, Central Asia | 1,528.1 | 3,506.1 | 227.7 | ||||||||
| America | 1,721.5 | 365.1 | 865.5 | ||||||||
| Asia Pacific | 532.9 | 1,236.1 | 123.2 | ||||||||
| Africa | 758.1 | 252.7 | 57.9 | ||||||||
| Middle East | 181.2 | 760.7 | 213.4 | ||||||||
| Total products and services revenue | $ | 4,721.8 | $ | 6,120.7 | $ | 1,487.7 | |||||
| Reportable Segments | |||||||||||
| Year Ended | |||||||||||
| December 31, 2018 | |||||||||||
| (In millions) | Subsea | Onshore/ Offshore | Surface Technologies | ||||||||
| Services | 3,394.5 | 6,120.7 | 249.8 | ||||||||
| Products | 1,327.3 | — | 1,237.9 | ||||||||
| Total products and services revenue | 4,721.8 | 6,120.7 | 1,487.7 | ||||||||
Lease and other(a) | 118.2 | — | 104.5 | ||||||||
| Total revenue | $ | 4,840.0 | $ | 6,120.7 | $ | 1,592.2 | |||||
| (In millions) | December 31, 2018 | December 31, 2017 | $ change | % change | ||||||||||
| Contract assets | $ | 1,295.0 | $ | 1,755.5 | $ | (460.5 | ) | (26.2 | ) | |||||
| Contract (liabilities) | (4,085.1 | ) | (3,314.2 | ) | (770.9 | ) | (23.3 | ) | ||||||
| Net contract assets (liabilities) | $ | (2,790.1 | ) | $ | (1,558.7 | ) | $ | (1,231.4 | ) | (79.0 | ) | |||
| (In millions) | 2019 | 2020 | Thereafter | ||||||||
| Subsea | 3,379.2 | 1,382.1 | 1,238.3 | ||||||||
| Onshore/Offshore | 5,335.1 | 1,732.9 | 1,022.5 | ||||||||
| Surface Technologies | 469.9 | — | — | ||||||||
| Total remaining unsatisfied performance obligations | $ | 9,184.2 | — | $ | 3,115.0 | 2,260.8 | |||||
| Year Ended | |||||||||||
| December 31, 2018 | |||||||||||
| (In millions, except per share data) | As reported | Effect of ASC Topic 606 | Under ASC Topic 605 | ||||||||
| Revenue | |||||||||||
| Service revenue | $ | 9,765.0 | $ | (32.0 | ) | $ | 9,733.0 | ||||
| Product revenue | 2,565.2 | 4.9 | 2,570.1 | ||||||||
| Lease and other revenue | 222.7 | — | 222.7 | ||||||||
| Total revenue | 12,552.9 | (27.1 | ) | 12,525.8 | |||||||
| Costs and expenses | |||||||||||
| Cost of service revenue | 7,895.1 | (17.7 | ) | 7,877.4 | |||||||
| Cost of product revenue | 2,234.5 | 5.9 | 2,240.4 | ||||||||
| Cost of lease and other revenue | 143.4 | — | 143.4 | ||||||||
| Selling, general and administrative expense | 1,140.6 | — | 1,140.6 | ||||||||
| Research and development expense | 189.2 | — | 189.2 | ||||||||
| Impairment, restructuring and other expenses (Note 17) | 1,831.2 | — | 1,831.2 | ||||||||
| Merger transaction and integration costs (Note 2) | 36.5 | — | 36.5 | ||||||||
| Total costs and expenses | 13,470.5 | (11.8 | ) | 13,458.7 | |||||||
| Other income (expense), net | (323.9 | ) | — | (323.9 | ) | ||||||
| Income from equity affiliates | 114.3 | (8.0 | ) | 106.3 | |||||||
| Income before net interest expense and income taxes | (1,127.2 | ) | (23.3 | ) | (1,150.5 | ) | |||||
| Net interest expense | (360.9 | ) | — | (360.9 | ) | ||||||
| Income before income taxes | (1,488.1 | ) | (23.3 | ) | (1,511.4 | ) | |||||
| Provision for income taxes (Note 19) | 422.7 | (8.9 | ) | 413.8 | |||||||
| Net income (loss) | (1,910.8 | ) | (14.4 | ) | (1,925.2 | ) | |||||
| Net (income) loss attributable to noncontrolling interests | (10.8 | ) | — | (10.8 | ) | ||||||
| Net income (loss) attributable to TechnipFMC plc | $ | (1,921.6 | ) | $ | (14.4 | ) | $ | (1,936.0 | ) | ||
| December 31, 2018 | |||||||||||
| (In millions, except par value data) | As reported | Effect of ASC Topic 606 | Under ASC Topic 605 | ||||||||
| Assets | |||||||||||
| Cash and cash equivalents | $ | 5,540.0 | $ | — | $ | 5,540.0 | |||||
| Trade receivables, net | 2,469.7 | (1,513.4 | ) | 956.3 | |||||||
| Contract assets | 1,295.0 | 450.2 | 1,745.2 | ||||||||
| Inventories, net (Note 7) | 1,251.2 | 16.4 | 1,267.6 | ||||||||
| Derivative financial instruments (Note 21) | 95.7 | — | 95.7 | ||||||||
| Income taxes receivable | 284.3 | (1.2 | ) | 283.1 | |||||||
| Advances paid to suppliers | 189.7 | — | 189.7 | ||||||||
| Other current assets (Note 8) | 655.6 | — | 655.6 | ||||||||
| Total current assets | 11,781.2 | (1,048.0 | ) | 10,733.2 | |||||||
| Investments in equity affiliates | 394.5 | (8.0 | ) | 386.5 | |||||||
| Property, plant and equipment, net of accumulated depreciation | 3,259.8 | — | 3,259.8 | ||||||||
| Goodwill | 7,607.6 | — | 7,607.6 | ||||||||
| Intangible assets, net of accumulated amortization | 1,176.7 | — | 1,176.7 | ||||||||
| Deferred income taxes | 232.4 | (0.2 | ) | 232.2 | |||||||
| Derivative financial instruments (Note 21) | 18.3 | — | 18.3 | ||||||||
| Other assets | 314.0 | — | 314.0 | ||||||||
| Total assets | $ | 24,784.5 | $ | (1,056.2 | ) | $ | 23,728.3 | ||||
| Liabilities and equity | |||||||||||
| Short-term debt and current portion of long-term debt (Note 13) | $ | 67.4 | $ | — | $ | 67.4 | |||||
| Accounts payable, trade | 2,600.3 | 17.6 | 2,617.9 | ||||||||
| Contract liabilities | 4,085.1 | (1,116.1 | ) | 2,969.0 | |||||||
| Accrued payroll | 394.7 | — | 394.7 | ||||||||
| Derivative financial instruments (Note 21) | 138.4 | — | 138.4 | ||||||||
| Income taxes payable | 81.9 | 2.2 | 84.1 | ||||||||
| Other current liabilities (Note 8) | 1,766.6 | (39.0 | ) | 1,727.6 | |||||||
| Total current liabilities | 9,134.4 | (1,135.3 | ) | 7,999.1 | |||||||
| Long-term debt, less current portion (Note 13) | 4,124.3 | — | 4,124.3 | ||||||||
| Accrued pension and other post-retirement benefits, less current portion | 298.9 | — | 298.9 | ||||||||
| Derivative financial instruments (Note 21) | 44.9 | — | 44.9 | ||||||||
| Deferred income taxes | 209.2 | 2.1 | 211.3 | ||||||||
| Other liabilities | 503.4 | — | 503.4 | ||||||||
| Total liabilities | 14,315.1 | (1,133.2 | ) | 13,181.9 | |||||||
| Commitments and contingent liabilities (Note 18) | |||||||||||
| Mezzanine equity | |||||||||||
| Redeemable noncontrolling interest | 38.5 | — | 38.5 | ||||||||
| Stockholders’ equity (Note 15) | |||||||||||
| Ordinary shares | 450.5 | — | 450.5 | ||||||||
| Ordinary shares held in employee benefit trust | (2.4 | ) | — | (2.4 | ) | ||||||
| Capital in excess of par value of ordinary shares | 10,197.0 | — | 10,197.0 | ||||||||
| Retained earnings | 1,114.2 | 77.1 | 1,191.3 | ||||||||
| Accumulated other comprehensive loss | (1,359.7 | ) | — | (1,359.7 | ) | ||||||
| Total TechnipFMC plc stockholders’ equity | 10,399.6 | 77.1 | 10,476.7 | ||||||||
| Noncontrolling interests | 31.3 | (0.1 | ) | 31.2 | |||||||
| Total equity | 10,430.9 | 77.0 | 10,507.9 | ||||||||
| Total liabilities and equity | $ | 24,784.5 | $ | (1,056.2 | ) | $ | 23,728.3 | ||||
NOTE 5. BUSINESS SEGMENTS13. RELATED PARTY TRANSACTIONS
Trade receivables consisted of receivables due from following related parties:
| December 31, | |||||||||||
| (In millions) | 2020 | 2019 | |||||||||
| TP JGC Coral France SNC | $ | 38.1 | $ | 40.1 | |||||||
| Equinor ASA | 24.1 | 0 | |||||||||
| TTSJV W.L.L. | 14.9 | 22.4 | |||||||||
| Novarctic SNC | 9.7 | 0 | |||||||||
| Dofcon Navegacao | 4.2 | 0 | |||||||||
| Techdof Brasil AS | 8.0 | 4.3 | |||||||||
| Storengy | 6.1 | 3.1 | |||||||||
| Others | 8.4 | 6.9 | |||||||||
| Total trade receivables | $ | 113.5 | $ | 76.8 | |||||||
TP JGC Coral France SNC, TTSJV W.L.L., Dofcon Navegacao, and Novarctic SNC are equity method affiliates. Techdof Brasil AS is a wholly owned subsidiary of Dofcon Brasil AS, our equity method affiliate. A member of our Board of Directors serves on the basisBoard of Directors for Storengy. In October 2020, we added a new member of our strategic priorities within each segmentBoard of Directors who is an executive of Equinor ASA.
Trade payables consisted of payables due to following related parties:
| December 31, | |||||||||||
| (In millions) | 2020 | 2019 | |||||||||
| Chiyoda | $ | 14.2 | $ | 24.8 | |||||||
| Nipigas | 14.2 | — | |||||||||
| Saipem | 23.7 | — | |||||||||
| JGC Corporation | 1.9 | 15.1 | |||||||||
| IFP Energies nouvelles | — | 2.4 | |||||||||
| Dofcon Navegacao | 1.5 | 2.1 | |||||||||
| Others | 5.7 | 6.7 | |||||||||
| Total trade payables | $ | 61.2 | $ | 51.1 | |||||||
Chiyoda and JGC Corporation are joint venture partners on our Yamal project. Saipem and Nipigas are joint venture partners on our Arctic LNG project. A member of our Board of Directors serves as an executive officer of IFP Energies nouvelles until June 2020.
Additionally, we have note receivable balance of $40.3 million and $65.2 million as of December 31, 2020 and 2019, respectively. The note receivable balance includes $37.6 million and $62.5 million with Dofcon Brasil AS as of December 31, 2020 and 2019, respectively. Dofcon Brasil AS is a VIE and accounted for as an equity method affiliate. These are included in other assets in our consolidated balance sheets.
Revenue consisted of amount from following related parties:
109
| Year Ended December 31, | |||||||||||||||||
| (In millions) | 2020 | 2019 | 2018 | ||||||||||||||
| TTSJV W.L.L. | $ | 47.2 | $ | 127.9 | $ | 0 | |||||||||||
| TP JGC Coral France SNC | 44.2 | 110.4 | 118.2 | ||||||||||||||
| Equinor ASA | 81.1 | 0 | 0 | ||||||||||||||
| Equinor Brasil | 38.5 | 0 | 0 | ||||||||||||||
| Anadarko Petroleum Company | — | 67.1 | 124.8 | ||||||||||||||
| TOP CV | — | 11.9 | 7.2 | ||||||||||||||
| Storengy | 10.7 | 8.8 | — | ||||||||||||||
| Novarctic SNC | 10.7 | 0.4 | 0 | ||||||||||||||
| Dofcon Navegacao | 3.4 | 8.4 | 2.9 | ||||||||||||||
| Techdof Brasil AS | 11.2 | 8.3 | 7.0 | ||||||||||||||
| JGC Corporation | — | 6.7 | 0 | ||||||||||||||
| Others | 27.2 | 29.7 | 33.2 | ||||||||||||||
| Total revenue | $ | 274.2 | $ | 379.6 | $ | 293.3 | |||||||||||
A member of our Board of Directors (the “Director”) served on the differences in the products and services we provide, which corresponds to the manner in which our Chief Executive Officer, as our chief operating decision maker, reviews and evaluates operating performance to make decisions about resources to be allocated to the segment.
Equinor Brasil is includeda subsidiary of Equinor ASA in computing segment operating profit. ReferBrazil.
Expenses consisted of amounts to Note 9 for additional information. The following items have been excluded in computing segment operating profit: corporate staff expense, net interest income (expense) associated with corporate debt facilities, income taxes,related parties:
| Year Ended December 31, | |||||||||||||||||
| (In millions) | 2020 | 2019 | 2018 | ||||||||||||||
| Chiyoda | $ | 1.4 | $ | 25.1 | $ | 53.0 | |||||||||||
| JGC Corporation | 0.4 | 20.8 | 81.2 | ||||||||||||||
| Arkema S.A. | 5.3 | 18.9 | 2.6 | ||||||||||||||
| Serimax Holdings SAS | 0.4 | 17.7 | 0.1 | ||||||||||||||
| Saipem | 26.8 | 0 | 0 | ||||||||||||||
| Nipigas | 36.8 | 0 | 0 | ||||||||||||||
| Magma Global Limited | 14.0 | 7.3 | 3.0 | ||||||||||||||
| TP JGC Coral France SNC | — | 5.0 | — | ||||||||||||||
| Jumbo Shipping | 16.0 | 4.5 | — | ||||||||||||||
| Dofcon Navegacao | 24.0 | 1.8 | 0 | ||||||||||||||
| Others | 24.6 | 41.3 | 14.8 | ||||||||||||||
| Total expenses | $ | 149.7 | $ | 142.4 | $ | 154.7 | |||||||||||
Serimax Holdings SAS and other revenue and other expense, net.
| Year Ended December 31, | |||||||||||
| (In millions) | 2018 | 2017 | 2016 | ||||||||
| Segment revenue | |||||||||||
| Subsea | $ | 4,840.0 | $ | 5,877.4 | $ | 5,850.5 | |||||
| Onshore/Offshore | 6,120.7 | 7,904.5 | 3,349.1 | ||||||||
| Surface Technologies | 1,592.2 | 1,274.6 | — | ||||||||
| Other revenue and intercompany eliminations | — | 0.4 | — | ||||||||
| Total revenue | $ | 12,552.9 | $ | 15,056.9 | $ | 9,199.6 | |||||
| Segment operating profit (loss) | |||||||||||
| Subsea | $ | (1,529.5 | ) | $ | 460.5 | $ | 732.0 | ||||
| Onshore/Offshore | 824.0 | 810.9 | 34.1 | ||||||||
| Surface Technologies | 172.8 | 82.7 | — | ||||||||
| Total segment operating profit (loss) | (532.7 | ) | 1,354.1 | 766.1 | |||||||
| Corporate items | |||||||||||
Corporate expense (a) | (594.5 | ) | (359.2 | ) | (185.9 | ) | |||||
| Interest income | 121.4 | 140.8 | 85.3 | ||||||||
| Interest expense | (482.3 | ) | (456.0 | ) | (114.1 | ) | |||||
| Total corporate items | (955.4 | ) | (674.4 | ) | (214.7 | ) | |||||
Income (loss) before income taxes (b) | $ | (1,488.1 | ) | $ | 679.7 | $ | 551.4 | ||||
| December 31, | |||||||
| (In millions) | 2018 | 2017 | |||||
| Segment assets | |||||||
| Subsea | $ | 11,037.8 | $ | 12,944.4 | |||
| Onshore/Offshore | 4,355.2 | 4,604.8 | |||||
| Surface Technologies | 2,825.6 | 2,453.3 | |||||
| Intercompany eliminations | (26.4 | ) | (24.3 | ) | |||
| Total segment assets | 18,192.2 | 19,978.2 | |||||
Corporate (a) | 6,592.3 | 8,285.5 | |||||
| Total assets | $ | 24,784.5 | $ | 28,263.7 | |||
110
| Year Ended December 31, | |||||||||||
| (In millions) | 2018 | 2017 | 2016 | ||||||||
| Revenue | |||||||||||
| Russia | $ | 2,773.3 | $ | 4,894.2 | $ | 283.3 | |||||
| Brazil | 1,478.7 | 911.1 | 1,006.9 | ||||||||
| United States | 1,275.8 | 1,534.7 | 1,033.7 | ||||||||
| Norway | 1,202.6 | 971.2 | 574.4 | ||||||||
| Australia | 926.6 | 953.9 | 776.6 | ||||||||
| United Kingdom | 442.1 | 465.9 | 761.5 | ||||||||
| Angola | 385.7 | 1,016.2 | 935.3 | ||||||||
| All other countries | 4,068.1 | 4,309.7 | 3,827.9 | ||||||||
| Total revenue | $ | 12,552.9 | $ | 15,056.9 | $ | 9,199.6 | |||||
NOTE 14. PROPERTY, PLANT AND EQUIPMENT
Property, plant and equipment net.consisted of the following:
| December 31, | |||||||
| (In millions) | 2018 | 2017 | |||||
| Long-lived assets | |||||||
| United Kingdom | $ | 925.6 | $ | 1,190.1 | |||
| United States | 589.9 | 567.1 | |||||
| Netherlands | 360.5 | 574.2 | |||||
| Brazil | 325.8 | 408.3 | |||||
| Norway | 311.4 | 321.4 | |||||
| All other countries | 746.6 | 810.4 | |||||
| Total long-lived assets | $ | 3,259.8 | $ | 3,871.5 | |||
| December 31, | |||||||||||
| (In millions) | 2020 | 2019 | |||||||||
| Land and land improvements | $ | 88.4 | $ | 108.4 | |||||||
| Buildings | 611.0 | 626.9 | |||||||||
| Vessels | 1,968.1 | 2,091.9 | |||||||||
| Machinery and equipment | 1,919.4 | 1,930.6 | |||||||||
| Office fixtures and furniture | 292.0 | 285.0 | |||||||||
| Construction in process | 148.1 | 130.9 | |||||||||
| Other | 243.5 | 277.1 | |||||||||
| 5,270.5 | 5,450.8 | ||||||||||
| Accumulated depreciation | (2,408.7) | (2,288.8) | |||||||||
| Property, plant and equipment, net | $ | 2,861.8 | $ | 3,162.0 | |||||||
| Capital Expenditures | Depreciation and Amortization | Research and Development Expense | |||||||||||||||||||||||||||||||||
| Year Ended December 31, | Year Ended December 31, | Year Ended December 31, | |||||||||||||||||||||||||||||||||
| (In millions) | 2018 | 2017 | 2016 | 2018 | 2017 | 2016 | 2018 | 2017 | 2016 | ||||||||||||||||||||||||||
| Subsea | $ | 223.2 | $ | 179.1 | $ | 286.9 | $ | 440.4 | $ | 507.2 | $ | 256.8 | $ | 145.2 | $ | 169.2 | $ | 75.4 | |||||||||||||||||
| Onshore/Offshore | 7.6 | 16.2 | 26.0 | 38.2 | 41.1 | 43.9 | 29.7 | 31.4 | 30.0 | ||||||||||||||||||||||||||
| Surface Technologies | 111.9 | 35.4 | — | 66.6 | 63.6 | — | 14.3 | 12.3 | — | ||||||||||||||||||||||||||
| Corporate | 25.4 | 25.0 | — | 5.2 | 2.8 | — | — | — | — | ||||||||||||||||||||||||||
| Total | $ | 368.1 | $ | 255.7 | $ | 312.9 | $ | 550.4 | $ | 614.7 | $ | 300.7 | $ | 189.2 | $ | 212.9 | $ | 105.4 | |||||||||||||||||
Depreciation expense was $323.5 million, $383.5 million and $367.8 million in 2020, 2019 and 2018, respectively. The amount of interest cost capitalized was not material for the years presented.
During 2020 and 2019, we determined the years ended December 31, 2018, 2017 and 2016, revenue from JSC Yamal LNG exceeded 10%carrying amount of certain of our long-lived assets exceeded their fair value and recorded an impairment. See Note 19 for further details.
In December 2020, we declared our intent to sell our G1200 vessel as part of our overall strategy to optimize the profile and size of our subsea fleet and classified it as an asset held for sale in Other Current Assets in our consolidated revenue. Duringbalance sheet. We also evaluated the vessel’s book value and recorded an impairment charge of $8.3 million within Impairment, Restructuring and Other Expenses in our consolidated statement of income for the year ended December 31, 2016, revenue from Total exceeded 10%2020.
In December 2019, we completed the sale of our consolidated revenue.
| Year Ended December 31, | |||||||||||
| (In millions, except per share data) | 2018 | 2017 | 2016 | ||||||||
| Net income (loss) attributable to TechnipFMC plc | $ | (1,921.6 | ) | $ | 113.3 | $ | 393.3 | ||||
| After-tax interest expense related to dilutive shares | — | — | 1.5 | ||||||||
| Net income (loss) attributable to TechnipFMC plc adjusted for dilutive effects | (1,921.6 | ) | 113.3 | 394.8 | |||||||
| Weighted average number of shares outstanding | 458.0 | 466.7 | 119.4 | ||||||||
| Dilutive effect of restricted stock units | — | 0.2 | — | ||||||||
| Dilutive effect of stock options | — | — | — | ||||||||
| Dilutive effect of performance shares | — | 1.4 | 0.5 | ||||||||
| Dilutive effect of convertible bonds | — | — | 5.2 | ||||||||
| Total shares and dilutive securities | 458.0 | 468.3 | 125.1 | ||||||||
| Basic earnings (loss) per share attributable to TechnipFMC plc | $ | (4.20 | ) | $ | 0.24 | $ | 3.29 | ||||
| Diluted earnings (loss) per share attributable to TechnipFMC plc | $ | (4.20 | ) | $ | 0.24 | $ | 3.16 | ||||
| December 31, | |||||||
| (In millions) | 2018 | 2017 | |||||
| Raw materials | $ | 366.4 | $ | 271.4 | |||
| Work in process | 146.4 | 130.2 | |||||
| Finished goods | 738.4 | 585.4 | |||||
| Inventory, net | 1,251.2 | 987.0 | |||||
| December 31, | |||||||
| (In millions) | 2018 | 2017 | |||||
| Value-added tax receivables | $ | 305.8 | $ | 532.5 | |||
| Prepaid expenses | 91.3 | 136.2 | |||||
| Sundry receivables | 87.0 | 170.9 | |||||
| Other taxes receivables | 85.0 | 155.8 | |||||
| Held-to-maturity investments | — | 60.0 | |||||
| Asset held for sale | 9.6 | 50.2 | |||||
| Available-for-sale securities | — | 9.9 | |||||
| Other | 76.9 | 90.7 | |||||
| Other current assets | $ | 655.6 | $ | 1,206.2 | |||
| (In millions) | December 31, 2018 | December 31, 2017 | |||||
| Legal provisions | $ | 418.2 | $ | 74.6 | |||
| Warranty accruals and project contingencies | 418.2 | 616.3 | |||||
| Value added tax and other taxes payable | 214.3 | 204.4 | |||||
| Provisions | 135.5 | 83.4 | |||||
| Redeemable financial liability | 173.0 | 69.7 | |||||
| Social security liability | 112.3 | 145.0 | |||||
| Compensation accrual | 87.3 | 123.5 | |||||
| Liabilities held for sale | 16.2 | 13.7 | |||||
| Current portion of accrued pension and other post-retirement benefits | 14.0 | 10.3 | |||||
| Other accrued liabilities | 177.6 | 347.0 | |||||
| Total other current liabilities | $ | 1,766.6 | $ | 1,687.9 | |||
| December 31, 2018 | ||||||
| Percentage Owned | Carrying Value (in millions) | |||||
| Technip Odebrecht PLSV CV | 50.0 | % | $ | 136.1 | ||
| Dofcon Brasil AS | 50.0 | % | 126.2 | |||
| Serimax Holdings SAS | 20.0 | % | 23.2 | |||
| Magma Global Limited | 25.0 | % | 49.8 | |||
| Other | 59.2 | |||||
| Investments in equity affiliates | $ | 394.5 | ||||
| December 31, 2017 | ||||||
| Percentage Owned | Carrying Value (in millions) | |||||
| Technip Odebrecht PLSV CV | 50.0 | % | $ | 111.4 | ||
| Dofcon Brasil AS | 50.0 | % | 74.1 | |||
| Serimax Holdings SAS | 20.0 | % | 25.1 | |||
| FSTP Brasil Ltda | 25.0 | % | 21.5 | |||
| Other | 40.4 | |||||
| Investments in equity affiliates | $ | 272.5 | ||||
| Year Ended December 31, | |||||||||||
| (In millions) | 2018 | 2017 | 2016 | ||||||||
| Subsea | $ | 80.9 | $ | 55.3 | $ | 35.0 | |||||
| Onshore/Offshore | 33.4 | 0.3 | 82.7 | ||||||||
| Income from equity affiliates | $ | 114.3 | $ | 55.6 | $ | 117.7 | |||||
| (In millions) | 2016 (a) | ||
| Year ended December 31 | |||
| Revenues | $ | 6,782.9 | |
| Gross profit | 461.0 | ||
| Net income (loss) | (348.4 | ) | |
NOTE 10. RELATED PARTY TRANSACTIONS15. GOODWILL AND INTANGIBLE ASSETS
We test our goodwill for impairment by comparing the fair value of each of our reporting units to their net carrying value. Our impairment analysis is quantitative; however, it includes subjective estimates based on assumptions regarding future growth rates, interest rates and operating expenses.
A lower fair value estimate in the future for any of our reporting units could result in goodwill impairments. Factors that could trigger a lower fair value estimate include sustained price declines of the reporting unit’s products and services, cost increases, regulatory or political environment changes, changes in customer demand, and other changes in market conditions, which may affect certain market participant assumptions used in the discounted future cash flow model based on internal forecasts of revenues and expenses over a specified period plus a terminal value (the income approach).
111
The income approach estimates fair value by discounting each reporting unit’s estimated future cash flows using a weighted-average cost of capital that reflects current market conditions and the risk profile of the reporting unit. To arrive at our future cash flows, we use estimates of economic and market assumptions, including growth rates in revenues, costs, estimates of future expected changes in operating margins, tax rates and cash expenditures. Future revenues are also adjusted to match changes in our business strategy. We believe this approach is an appropriate valuation method. Under the market multiple approach, we determine the estimated fair value of each of our reporting units by applying transaction multiples to each reporting unit’s projected EBITDA and then averaging that estimate with similar historical calculations using either a one, two or three year average. Our reporting unit valuations were determined primarily by utilizing the income approach and the market multiple approach.
During the first quarter of 2020, triggering events were identified which led to performing interim goodwill impairment testing in our reporting units as of March 31, 2020. These events included the COVID-19 pandemic breakout, commodity price declines, and a significant decrease in our market capitalization as well as those of our peers and customers. The fair value for our reporting units for the interim testing was valued using a market approach. An appropriate control premium was considered for each of the reporting units and applied to the output of the market approach. An interim impairment test during the first quarter of 2020 resulted in $2,747.5 million and $335.9 million of goodwill impairment charges recorded in our Subsea and Surface Technologies segments, respectively.
During our annual impairment tests the following significant estimates were used by management in determining the fair values of reporting units in order to test the goodwill at October 31:
| 2020 | 2019 | 2018 | |||||||||||||||
| Year of cash flows before terminal value | 4 | 4 | 5 | ||||||||||||||
| Discount rates | 15.0% | 12.5% to 15.0% | 12.0% to 13.0% | ||||||||||||||
| EBITDA multiples | N/A | 6.0 - 8.5x | 7.0 - 8.5x | ||||||||||||||
During the year ended December 31, 2020, the significant estimates used by management in determining the fair value described above relate to Technip Energies reporting unit only. The fair value over carrying amount for our Technip Energies segment was in excess of 300% of its carrying amount at October 31, 2020.
Based on the impairment tests performed during the year ended December 31, 2020 we recorded $2,747.5 million and $335.9 million of goodwill impairment charges recorded in our Subsea and Surface Technologies reporting units, respectively. No goodwill impairment charges were recorded in our Technip Energies reporting unit.
During the year ended December 31, 2019, we recorded $1,321.9 million and $666.8 million of goodwill impairment charges in our Subsea and Surface Technologies reporting units, respectively. See Note 19 for further details.
112
The carrying amount of goodwill by reporting segment was as follows:
| (In millions) | Subsea | Technip Energies | Surface Technologies | Total | |||||||||||||||||||
| December 31, 2018 | 4,142.4 | 2,447.7 | 1,017.5 | 7,607.6 | |||||||||||||||||||
| Impairments | (1,321.9) | — | (666.8) | (1,988.7) | |||||||||||||||||||
| Purchase accounting adjustment | — | — | 9.9 | 9.9 | |||||||||||||||||||
| Other | — | (17.7) | — | (17.7) | |||||||||||||||||||
| Translation | (6.4) | (6.4) | — | (12.8) | |||||||||||||||||||
| December 31, 2019 | 2,814.1 | 2,423.6 | 360.6 | 5,598.3 | |||||||||||||||||||
| Impairments | (2,747.5) | 0 | (335.9) | (3,083.4) | |||||||||||||||||||
Transfers (a) | (21.2) | 46.1 | (24.9) | — | |||||||||||||||||||
| Translation | (45.4) | 42.8 | 0.2 | (2.4) | |||||||||||||||||||
| December 31, 2020 | $ | — | $ | 2,512.5 | $ | — | $ | 2,512.5 | |||||||||||||||
(a) Beginning in the first quarter of 2020, Technip Energies includes our Loading Systems business that was previously reported in the Surface Technologies segment and our process automation business, Cybernetix, that was previously reported in the Subsea segment. See Note 7 for further details.
As of December 31, 2020 and 2019, accumulated goodwill impairment was $6,455.1 million and $3,371.7 million, respectively.
Intangible assets - The components of intangible assets were as follows:
| December 31, | |||||||||||||||||||||||
| 2020 | 2019 | ||||||||||||||||||||||
| (In millions) | Gross Carrying Amount | Accumulated Amortization | Gross Carrying Amount | Accumulated Amortization | |||||||||||||||||||
| Acquired technology | $ | 247.1 | $ | 98.1 | $ | 246.7 | $ | 73.6 | |||||||||||||||
| Backlog | 0 | 0 | 175.0 | 175.0 | |||||||||||||||||||
| Customer relationships | 285.4 | 114.4 | 285.4 | 85.9 | |||||||||||||||||||
| Licenses, patents and trademarks | 816.8 | 264.0 | 811.1 | 227.6 | |||||||||||||||||||
| Software | 232.1 | 178.9 | 215.9 | 151.1 | |||||||||||||||||||
| Other | 120.2 | 65.1 | 115.9 | 50.2 | |||||||||||||||||||
| Total intangible assets | $ | 1,701.6 | $ | 720.5 | $ | 1,850.0 | $ | 763.4 | |||||||||||||||
We recorded $123.7 million, $126.1 million and $182.6 million in amortization expense related to intangible assets during the years ended December 31, 2020, 2019 and 2018, respectively. During the years 2021 through 2025, annual amortization expense is expected to be as follows: $117 million in 2021, $114 million in 2022, $110 million in 2023, $96 million in 2024, $93 million in 2025 and $451 million thereafter.
NOTE 16. DEBT
Overview
Short-term debt and current portion of long-term debt - Short-term debt and current portion of long-term debt consisted of the following:
| December 31, | |||||||||||
| (In millions) | 2020 | 2019 | |||||||||
| Bank borrowings and other | $ | 85.0 | $ | 270.8 | |||||||
| Synthetic bonds due 2021 | 551.2 | 0 | |||||||||
| 5.00% 2010 Private placement notes due 2020 | 0 | 224.6 | |||||||||
| Total short-term debt and current portion of long-term debt | $ | 636.2 | $ | 495.4 | |||||||
113
Long-term debt consisted of the following:
| December 31, | |||||||||||
| (In millions) | 2020 | 2019 | |||||||||
| Commercial paper | $ | 1,525.9 | $ | 1,967.0 | |||||||
| Synthetic bonds due 2021 | 551.2 | 492.9 | |||||||||
| 3.45% Senior Notes due 2022 | 500.0 | 500.0 | |||||||||
| 5.00% 2010 Private placement notes due 2020 | 0 | 224.6 | |||||||||
| 3.40% 2012 Private placement notes due 2022 | 184.0 | 168.5 | |||||||||
| 3.15% 2013 Private placement notes due 2023 | 159.5 | 146.0 | |||||||||
| 3.15% 2013 Private placement notes due 2023 | 153.4 | 140.4 | |||||||||
| 4.50% 2020 Private placement notes due 2025 | 245.4 | 0 | |||||||||
| 4.00% 2012 Private placement notes due 2027 | 92.0 | 84.2 | |||||||||
| 4.00% 2012 Private placement notes due 2032 | 122.7 | 112.3 | |||||||||
| 3.75% 2013 Private placement notes due 2033 | 122.7 | 112.3 | |||||||||
| Bank borrowings and other | 309.9 | 536.3 | |||||||||
| Unamortized debt issuance costs and discounts | (12.8) | (9.1) | |||||||||
| Total debt | 3,953.9 | 4,475.4 | |||||||||
| Less: current borrowings | 636.2 | 495.4 | |||||||||
| Long-term debt | $ | 3,317.7 | $ | 3,980.0 | |||||||
Debt maturities as of December 31, 2020, are as follows:
| Payments Due by Period | |||||||||||||||||||||||||||||
| (In millions) | Total payments | Less than 1 year | 1-3 years | 3-5 years | After 5 years | ||||||||||||||||||||||||
| Total debt | $ | 3,953.9 | $ | 636.2 | $ | 2,589.1 | $ | 294.0 | $ | 434.6 | |||||||||||||||||||
Subsequent to the Spin-off, we expect the total future principal payments on debt to be approximately $2,376.8 million. Refer to Note 26 for further details.
Significant Funding and Liquidity Activities
During 2020, we completed the following transactions in order to enhance our total liquidity position:
•Repaid $233.9 million of 5.00% 2010 private placement notes;
•Repaid the remaining outstanding balance of $190.0 million of the term loan assumed in connection with the acquisition of the remaining 50% interest in TOP CV.
•Issued €200 million aggregate principal amount of 4.500% 2020 Private Placement Notes due June 30, 2025. Within three months of the effective date of the Spin-off of Technip Energies, if there is a downgrade by a nationally recognized rating agency of the corporate rating of TechnipFMC from an investment grade to a non-investment grade rating or a withdrawal of any such rating, the interest rate applicable to the 2020 Private Placement Notes will be increased to 5.75%;
•Entered into a new, six-month €500 million senior unsecured revolving credit facility agreement, which may be extended for two additional three-month periods (the “Euro Facility”); and
•Entered into the Bank of England’s COVID Corporate Financing Facility program (the “CCFF Program”), which allows us to issue up to £600 million of unsecured commercial paper notes.
114
Credit Facilities and Debt
Revolving credit facility - On January 17, 2017, we acceded to a new $2.5 billion senior unsecured revolving credit facility agreement (“Facility Agreement”) between FMC Technologies, Inc., Technip Eurocash SNC (the “Borrowers”), and TechnipFMC plc (the “Additional Borrower”) with JPMorgan Chase Bank, National Association (“JPMorgan”), as agent and an arranger, SG Americas Securities LLC as an arranger, and the lenders party thereto.
The Facility Agreement provides for the establishment of a multicurrency, revolving credit facility, which includes a $1.5 billion letter of credit subfacility. Subject to certain conditions, the Borrowers may request the aggregate commitments under the facility agreement be increased by an additional $500.0 million. On November 26, 2018, we entered into an extension which extends the expiration date to January 2023.
Borrowings under the facility agreement bear interest at the following rates, plus an applicable margin, depending on currency:
•U.S. dollar-denominated loans bear interest, at the Borrowers’ option, at a base rate or an adjusted rate linked to the London interbank offered rate (“Adjusted LIBOR”);
•sterling-denominated loans bear interest at Adjusted LIBOR; and
•euro-denominated loans bear interest at the Euro interbank offered rate (“EURIBOR”).
Depending on the credit rating of TechnipFMC, the applicable margin for revolving loans varies (i) in the case of Adjusted LIBOR and EURIBOR loans, from 0.820% to 1.300% and (ii) in the case of base rate loans, from 0.000% to 0.300%. The “base rate” is the highest of (a) the prime rate announced by JPMorgan, (b) the greater of the Federal Funds Rate and the Overnight Bank Funding Rate plus 0.5% or (c) one-month Adjusted LIBOR plus 1.0%. As of December 31, 2020, there were no outstanding borrowings under our revolving credit facility.
Euro Facility – On May 19, 2020, we entered into the Euro Facility with HSBC France, as agent, and the lenders party thereto, which provides for the establishment of a six-month revolving credit facility denominated in Euros with total commitments of €500 million, which may be extended by us for two additional three-month periods. Borrowings under the Euro Facility bear interest at the Euro interbank offered rate for a period equal in length to the interest period of a given loan (which may be three or six months), plus an applicable margin. As of December 31, 2020, there were no outstanding borrowings under Euro Facility.
On June 12, 2020, we entered into Amendment No. 1 to the Facility Agreement and into an Amendment and Restatement Agreement to our Euro Facility. The amendments, which are includedeffective through the respective expirations of the Facility Agreement and Euro Facility, permit us to include the gross book value of $3.2 billion of goodwill (fully impaired in the quarter ended March 31, 2020) in the calculation of consolidated net worth, which is used in the calculation of our quarterly compliance with the total capitalization ratio under the Facility Agreement and Euro Facility.
The Facility Agreement and Euro Facility contain usual and customary covenants, representations and warranties, and events of default for credit facilities of this type, including financial covenants requiring that our total capitalization ratio not exceed 60% at the end of any financial quarter. The Facility Agreement and Euro Facility also contain covenants restricting our ability and our subsidiaries’ ability to incur additional liens and indebtedness, enter into asset sales, or make certain investments.
As of December 31, 2020, we were in compliance with all restrictive covenants under our credit facilities.
CCFF Program - On May 19, 2020, we entered into a dealer agreement (the “Dealer Agreement”) with Bank of America Merrill Lynch International DAC (the “Dealer”) and an Issuing and Paying Agency Agreement (the “Agency Agreement”, and together with the Dealer Agreement, the “Agreements”) with Bank of America, National Association, London Branch, relating to the European commercial paper program established under the CCFF Program as a source of additional liquidity.
The Agreements provide the terms under which we may issue, and the Dealer will arrange for, the sale of short-term, unsecured commercial paper notes (the “Notes”) to reduce existing debt or decrease overall borrowing costs. The Notes contain customary representations, warranties, covenants, defaults, and indemnification provisions, and will be sold at such discounts from their face amounts as shall be agreed between us and the Dealer. The Notes will be fully payable at maturity, and the maturities of the Notes will vary but may not exceed 364 days. The principal amount of outstanding Notes may not exceed £600 million. The Agency Agreement provides for the terms of
115
issuance and payment of the Notes. As of December 31, 2020, our commercial paper borrowings under the CCFF Program had a weighted average interest rate of0.43%. As of December 31, 2020, we had $817.9 million of Notes outstanding and recorded as long-term borrowings under the CCFF Program. When we have both the ability and intent to refinance certain obligations on a long-term basis, the obligations are classified as long-term, as such, the outstanding borrowings of the CCFF Program were classified as long-term debt in our consolidated financial statementsbalance sheet as of December 31, 2020.
Bilateral credit facility - We have access to a €100.0 million bilateral credit facility expiring in May 2021.
The bilateral credit facility contains usual and customary covenants, representations and warranties and events of default for all transactionscredit facilities of this type.
As of December 31, 2020, there were no outstanding borrowings under our bilateral credit facility.
Commercial paper - Under our commercial paper program, we have the ability to access $1.5 billion and €1.0 billion of short-term financing through our commercial paper dealers, subject to the limit of unused capacity of our facility agreement. When we have both the ability and intent to refinance certain obligations on a long-term basis, the obligations are classified as long-term, as such, the commercial paper borrowings were classified as long-term debt in our consolidated balance sheets as of December 31, 2020 and 2019.Commercial paper borrowings are issued at market interest rates. As of December 31, 2020, our commercial paper borrowings had a weighted average interest rate of 0.34% on the U.S. dollar denominated borrowings and (0.06)% on the Euro denominated borrowings. As of December 31, 2020, we had $708.0 million of outstanding commercial paper borrowings under this program.
Synthetic bonds - On January 25, 2016, we issued €375.0 million principal amount of 0.875% convertible bonds with related parties, defined as entities relateda maturity date of January 25, 2021 and a redemption at par of the bonds which have not been converted. On March 3, 2016, we issued additional convertible bonds for a principal amount of €75.0 million issued on the same terms, fully fungible with and assimilated to the bonds issued on January 25, 2016. The issuance of these non-dilutive cash-settled convertible bonds (“Synthetic Bonds”), which are linked to our directorsordinary shares were backed simultaneously by the purchase of cash-settled equity call options in order to hedge our economic exposure to the potential exercise of the conversion rights embedded in the Synthetic Bonds. As the Synthetic Bonds could only be cash settled, they did not result in the issuance of new ordinary shares or the delivery of existing ordinary shares upon conversion. Interest on the Synthetic Bonds is payable semi-annually in arrears on January 25 and main shareholdersJuly 25 of each year, beginning July 26, 2016. The synthetic bonds were repaid during the first quarter of 2021.
Senior Notes - We have outstanding 3.45% $500.0 million senior notes due October 1, 2022 (the “Senior Notes”). The terms of the Senior Notes are governed by the indenture, dated as wellof March 29, 2017 between TechnipFMC and U.S. Bank National Association, as trustee (the “Trustee”), as amended and supplemented by the First Supplemental Indenture between TechnipFMC and the Trustee (the “First Supplemental Indenture”) relating to the issuance of the 2017 Notes and the Second Supplemental Indenture between TechnipFMC and the Trustee (the “Second Supplemental Indenture”) relating to the issuance of the 2022 Notes.
At any time prior to July 1, 2022, in the case of the 2022 Notes, we may redeem some or all of the Senior Notes at the redemption prices specified in the First Supplemental Indenture and Second Supplemental Indenture, respectively. At any time on or after July 1, 2022, we may redeem the 2022 Notes at the redemption price equal to 100% of the principal amount of the 2022 Notes redeemed. The Senior Notes are our senior unsecured obligations. The Senior Notes will rank equally in right of payment with all of our existing and future unsubordinated debt, and will rank senior in right of payment to all of our future subordinated debt.
Private Placement Notes
2020 Issuance:
During 2020, we completed the private placement of €200 million aggregate principal amount of the 2020 Private Placement Notes. The 2020 Private Placement Notes bear interest of 4.50% and are due June 2025. Interest on the notes is payable annually in arrears on June 30 of each year beginning June 30, 2020. The 2020 Private Placement Notes contain usual and customary covenants and events of default for notes of this type. In addition, within three months of the effective date of the Spin-off of Technip Energies, if there is a downgrade by a nationally recognized rating agency of the corporate rating of TechnipFMC from an investment grade to a non-investment grade rating or a withdrawal of any such rating, the interest rate applicable to the 2020 Private Placement Notes will be increased to 5.75%.
116
2013 Issuances:
In October 2013, we completed the private placement of €355.0 million aggregate principal amount of senior notes. The notes were issued in three tranches with €100.0 million bearing interest at 3.75% and due October 2033 (the “Tranche A 2033 Notes”), €130.0 million bearing interest of 3.15% and due October 2023 (the “Tranche B 2023 Notes) and €125.0 million bearing interest of 3.15% and due October 2023 (the “Tranche C 2023 Notes” and, collectively with the “Tranche A 2033 Notes and the “Tranche B 2023 Notes”, the “2013 Private Placement Notes”).
Interest on the Tranche A 2033 Notes is payable annually in arrears on October 7 each year, beginning October 7, 2014. Interest on the Tranche B 2023 Notes is payable annually in arrears on October 16 of each year beginning October 16, 2014. Interest on the Tranche C 2023 Notes is payable annually in arrears on October 18 of each year, beginning October 18, 2014.
2012 Issuances:
In June 2012, we completed the private placement of €325.0 million aggregate principal amount of notes. The notes were issued in three tranches with €150.0 million bearing interest at 3.40% and due June 2022 (the “Tranche A 2022 Notes”), €75.0 million bearing interest of 4.0% and due June 2027 (the “Tranche B 2027 Notes”) and €100.0 million bearing interest of 4.0% and due June 2032 (the “Tranche C 2032 Notes” and, collectively with the “Tranche A 2022 Notes and the “Tranche B 2027 Notes,” the “2012 Private Placement Notes”). Interest on the Tranche A 2022 Notes and the Tranche C 2032 Notes is payable annually in arrears on June 14 of each year beginning June 14, 2013. Interest on the Tranche B 2027 Notes is payable annually in arrears on June 15 of each year, beginning June 15, 2013.
The 2013 and 2012 Private Placement Notes contain usual and customary covenants and events of default for notes of this type. In the event of a change of control resulting in a downgrade in the rating of the notes below BBB-, the 2013 and 2012 Private Placement Notes may be redeemed early at the request of any bondholder, at its sole discretion. The 2013 and 2012 Private Placement Notes are our unsecured obligations. The 2013 and 2012 Private Placement Notes will rank equally in right of payment with all of our existing and future unsubordinated debt.
Term loan - In December 2016, we entered into a £160.0 million term loan agreement to finance the Deep Explorer, a diving support vessel (“DSV��), maturing December 2028. Under the loan agreement, interest accrues at an annual rate of 2.813%. This loan agreement contains usual and customary covenants and events of default for loans of this type.
Bank borrowings - In January 2019, we executed a sale-leaseback transaction to finance the purchase of a deepwater dive support vessel, Deep Discoverer (the “Vessel”) for the full transaction price of $116.8 million. The sale-leaseback agreement (“Charter”) was entered into with a French joint-stock company, owned by Credit Industrial et Commercial (“CIC”) which was formed for the sole purpose to purchase and act as the partnerslessor of the Vessel. It is a variable interest entity, which is fully consolidated in our condensed consolidated financial statements. The transaction was funded through debt of $96.2 million which is primarily long-term, expiring on January 8, 2031.
Foreign committed credit - We have committed credit lines at many of our consolidated joint ventures,international subsidiaries for immaterial amounts. We utilize these facilities for asset financing and to provide a more efficient daily source of liquidity. The effective interest rates depend upon the local national market.
NOTE 17. STOCKHOLDERS’ EQUITY
Cash dividends paid during the years ended December 31, 2020, 2019 and 2018 were as follows.$59.2 million, $232.8 million and $238.1 million, respectively. In April 2020, our Board of Directors announced its decision to lower the annual dividend by 75% to $0.13 per share.
As an English public limited company, we are required under U.K. law to have available “distributable reserves” to conduct share repurchases or pay dividends to shareholders. Distributable reserves are a statutory requirement and are not linked to a GAAP reported amount (e.g. retained earnings). The declaration and payment of receivables due from following related parties:
| December 31, | |||||||
| (In millions) | 2018 | 2017 | |||||
| TP JGC Coral France SNC | $ | 31.6 | $ | 42.5 | |||
| Technip Odebrecht PLSV CV | 10.9 | 13.8 | |||||
| Anadarko Petroleum Company | 4.9 | 22.3 | |||||
| Others | 14.3 | 19.8 | |||||
| Total trade receivables | $ | 61.7 | $ | 98.4 | |||
117
dividends out of share capital, which includes share premium. On November 27, 2019, we redeemed 50,000 redeemable shares of £1 each and cancelled one deferred ordinary share of £1 in the capital of TechnipFMC.
The following is a summary of our capital stock activity for the years ended December 31, 2020, 2019 and 2018:
| (Number of shares in millions) | Ordinary Shares Issued | Ordinary Shares Held in Employee Benefit Trust | Treasury Stock | ||||||||||||||
| December 31, 2017 | 465.1 | — | — | ||||||||||||||
| Stock awards | 0.2 | — | — | ||||||||||||||
| Treasury stock purchases | — | — | 14.8 | ||||||||||||||
| Treasury stock cancellation | (14.8) | — | (14.8) | ||||||||||||||
| Net stock purchased for employee benefit trust | — | 0.1 | — | ||||||||||||||
| December 31, 2018 | 450.5 | 0.1 | — | ||||||||||||||
| Stock awards | 0.6 | — | — | ||||||||||||||
| Treasury stock purchases | — | — | 4.0 | ||||||||||||||
| Treasury stock cancellation | (4.0) | — | (4.0) | ||||||||||||||
| Net stock purchased for employee benefit trust | — | (0.1) | — | ||||||||||||||
| December 31, 2019 | 447.1 | — | — | ||||||||||||||
| Stock awards | 2.4 | — | — | ||||||||||||||
| December 31, 2020 | 449.5 | — | — | ||||||||||||||
In 2017, the Board of Directors authorized a share repurchase program of Anadarko Petroleum Company.
| December 31, | |||||||
| (In millions) | 2018 | 2017 | |||||
| Dofcon Navegacao | $ | 2.5 | $ | 12.3 | |||
| Chiyoda | 70.0 | 48.3 | |||||
| JGC Corporation | 69.5 | 52.4 | |||||
| IFP Energies nouvelles | 2.4 | — | |||||
| Anadarko Petroleum Company | 0.7 | — | |||||
| Magma Global Limited | 0.6 | — | |||||
| Others | 2.9 | 8.8 | |||||
| Total trade payables | $ | 148.6 | $ | 121.8 | |||
Accumulated other comprehensive income (loss) - Accumulated other comprehensive income (loss) consisted of the following:
| (In millions) | Foreign Currency Translation | Hedging | Defined Pension and Other Post-Retirement Benefits | Accumulated Other Comprehensive Loss Attributable to TechnipFMC plc | Accumulated Other Comprehensive Loss Attributable to Non-Controlling Interest | ||||||||||||||||||||||||||||||
| December 31, 2018 | $ | (1,234.4) | $ | (32.9) | $ | (92.4) | $ | (1,359.7) | $ | (4.0) | |||||||||||||||||||||||||
| Other comprehensive income (loss) before reclassifications, net of tax | 16.3 | 8.9 | (82.2) | (57.0) | (0.7) | ||||||||||||||||||||||||||||||
| Reclassification adjustment for net (gains) losses included in net income, net of tax | (12.0) | 18.2 | 3.0 | 9.2 | — | ||||||||||||||||||||||||||||||
| Other comprehensive income (loss), net of tax | 4.3 | 27.1 | (79.2) | (47.8) | (0.7) | ||||||||||||||||||||||||||||||
| December 31, 2019 | (1,230.1) | (5.8) | (171.6) | (1,407.5) | (4.7) | ||||||||||||||||||||||||||||||
| Other comprehensive income (loss) before reclassifications, net of tax | (171.1) | 26.8 | (92.9) | (237.2) | 0.6 | ||||||||||||||||||||||||||||||
| Reclassification adjustment for net (gains) losses included in net income, net of tax | — | 13.0 | 9.2 | 22.2 | — | ||||||||||||||||||||||||||||||
| Other comprehensive income (loss), net of tax | (171.1) | 39.8 | (83.7) | (215.0) | 0.6 | ||||||||||||||||||||||||||||||
| December 31, 2020 | $ | (1,401.2) | $ | 34.0 | $ | (255.3) | $ | (1,622.5) | $ | (4.1) | |||||||||||||||||||||||||
118
Reclassifications out of accumulated other comprehensive income (loss) - Reclassifications out of accumulated other comprehensive income (loss) consisted of the following:
| Year Ended December 31, | ||||||||||||||||||||||||||
| (In millions) | 2020 | 2019 | 2018 | |||||||||||||||||||||||
| Details about Accumulated Other Comprehensive Loss Components | Amount Reclassified out of Accumulated Other Comprehensive Loss | Affected Line Item in the Consolidated Statement of Income | ||||||||||||||||||||||||
| Gains on foreign currency translation | $ | 0 | $ | 12.0 | $ | 41.1 | Other income (expense), net | |||||||||||||||||||
| Gains (losses) on hedging instruments | ||||||||||||||||||||||||||
| Foreign exchange contracts | $ | (83.7) | $ | (26.6) | $ | (2.4) | Revenue | |||||||||||||||||||
| 68.5 | 12.0 | 3.4 | Costs of sales | |||||||||||||||||||||||
| (0.4) | 0 | (0.1) | Selling, general and administrative expense | |||||||||||||||||||||||
| (4.4) | (9.1) | 1.0 | Other Income (expense), net | |||||||||||||||||||||||
| (20.0) | (23.7) | 1.9 | Income (loss) before income taxes | |||||||||||||||||||||||
| (7.0) | (5.5) | (0.1) | Provision (benefit) for income taxes | |||||||||||||||||||||||
| $ | (13.0) | $ | (18.2) | $ | 2.0 | Net income (loss) | ||||||||||||||||||||
| Pension and other post-retirement benefits | ||||||||||||||||||||||||||
| Settlements and curtailments | (2.2) | (0.3) | 3.0 | (a) | ||||||||||||||||||||||
| Amortization of actuarial gain (loss) | (9.0) | (2.5) | (0.6) | (a) | ||||||||||||||||||||||
| Amortization of prior service credit (cost) | (1.2) | (1.0) | (1.3) | (a) | ||||||||||||||||||||||
| (12.4) | (3.8) | 1.1 | Income (loss) before income taxes | |||||||||||||||||||||||
| (3.2) | (0.8) | 0.1 | Provision (benefit) for income taxes | |||||||||||||||||||||||
| $ | (9.2) | $ | (3.0) | $ | 1.0 | Net income (loss) | ||||||||||||||||||||
(a) These accumulated other comprehensive income components are included in other noncurrent assets on our consolidated balance sheets.the computation of net periodic pension cost (See Note 22 for further details).
| Year Ended December 31, | |||||||||||
| (In millions) | 2018 | 2017 | 2016 | ||||||||
| Anadarko Petroleum Company | $ | 124.8 | $ | 111.3 | $ | — | |||||
| TP JGC Coral France SNC | $ | 118.2 | $ | — | $ | — | |||||
| Yamgaz | — | — | 196.7 | ||||||||
| Others | 50.3 | 126.8 | 87.8 | ||||||||
| Total revenue | $ | 293.3 | $ | 238.1 | $ | 284.5 | |||||
| Year Ended December 31, | |||||||||||
| (In millions) | 2018 | 2017 | 2016 | ||||||||
| Chiyoda | $ | 53.0 | $ | 44.1 | $ | — | |||||
| JGC Corporation | 81.2 | 46.8 | — | ||||||||
| Heerema | — | — | 71.3 | ||||||||
| IFP Energy nouvelles | 4.4 | — | — | ||||||||
| Creowave OY | 1.9 | 4.7 | — | ||||||||
| Arkema S.A. | 2.6 | �� | — | — | |||||||
| Magma Global Limited | 3.0 | — | — | ||||||||
| Others | 8.6 | 45.8 | 34.2 | ||||||||
| Total expenses | $ | 154.7 | $ | 141.4 | $ | 105.5 | |||||
| December 31, | |||||||
| (In millions) | 2018 | 2017 | |||||
| Land and land improvements | $ | 103.5 | $ | 105.2 | |||
| Buildings | 656.7 | 691.2 | |||||
| Vessels | 1,893.3 | 2,246.0 | |||||
| Machinery and equipment | 1,905.7 | 1,892.2 | |||||
| Office fixtures and furniture | 300.0 | 350.4 | |||||
| Construction in process | 179.0 | 136.7 | |||||
| Other | 290.1 | 397.7 | |||||
| 5,328.3 | 5,819.4 | ||||||
| Accumulated depreciation | (2,068.5 | ) | (1,947.9 | ) | |||
| Property, plant and equipment, net | $ | 3,259.8 | $ | 3,871.5 | |||
NOTE 12. GOODWILL AND INTANGIBLE ASSETS18. SHARE-BASED COMPENSATION
The exercise price overfor options is determined by the Committee but cannot be less than the fair market value of our ordinary shares at the grant date. Restricted share and performance share unit grants generally vest after three years of service.
Under the Plan, our Board of Directors has the authority to grant non-employee directors share options, restricted shares, restricted share units and performance shares. Unless otherwise determined by our Board of Directors, awards to non-employee directors generally vest one year from the date of grant. All restricted share units awarded prior to 2020 will be settled when a non-executive director ceases services on the Board of Directors. Beginning with the 2020 equity award, non-executive directors now have the opportunity to elect the year in which they will take receipt of the equity grants from either (a) a period of 1 to 10 years from the grant date or (b) upon their separation from Board service. The elections are made prior to the beginning of the grant year and are irrevocable after December 31 of the year prior to grant. Restricted share units are settled when a director ceases services to the Board of Directors. As of December 31, 2020, outstanding awards to active and retired non-employee directors included 254.3 thousand of share units.
119
The measurement of share-based compensation expense on restricted share awards is based on the market price and fair value at the grant date and the number of shares awarded. The fair value of performance shares is estimated using a combination of the closing stock price on the grant date and the Monte Carlo simulation model. We use Black-Scholes options pricing model to measure the fair value of stock options granted on or after January 1, 2017.
The share-based compensation expense for each award is recognized ratably over the net assets acquired in acquisitions accountedapplicable service period or the period beginning at the start of the service period and ending when an employee becomes eligible for retirement (currently age 62 under the purchase methodPlan), after taking into account estimated forfeitures.
We recognize compensation expense and the corresponding tax benefits for awards under the Plan. The compensation expense under the Plan was as follows:
| Year Ended December 31, | |||||||||||||||||
| (In millions) | 2020 | 2019 | 2018 | ||||||||||||||
| Share-based compensation expense | $ | 69.0 | $ | 74.5 | $ | 49.1 | |||||||||||
| Income tax benefits related to share-based compensation expense | $ | 18.6 | $ | 20.1 | $ | 13.2 | |||||||||||
As of accounting. We test goodwill for impairment annually,December 31, 2020, the portion of share-based compensation expense related to outstanding awards to be recognized in future periods is as follows:
| December 31, 2020 | |||||
| Share-based compensation expense not yet recognized (in millions) | $ | 68.1 | |||
| Weighted-average recognition period (in years) | 1.8 | ||||
Restricted Share Units
A summary of the non-vested restricted share units’ activity is as follows:
| (Shares in thousands) | Shares | Weighted-Average Grant Date Fair Value | |||||||||
| Non-vested as of December 31, 2019 | 4,525.9 | $ | 27.44 | ||||||||
| Granted | 3,836.0 | $ | 9.27 | ||||||||
| Vested | (1,909.1) | $ | 27.16 | ||||||||
| Cancelled/forfeited | (330.9) | $ | 15.71 | ||||||||
| Non-vested as of December 31, 2020 | 6,121.9 | $ | 18.43 | ||||||||
The total grant date fair value of restricted stock share units vested during the years ended December 31, 2020 and 2019 was $51.8 million and $10.2 million, respectively.
Performance Share Units
The Board of Directors has granted certain employees, senior executives and directors performance share units that vest subject to achieving satisfactory performances. For performance share units issued on or more frequently if circumstances indicate possible impairment. We identify a potential impairment by comparingafter January 1, 2017, performance is based on results of return on invested capital and total shareholder return (“TSR”).
For the performance share units which vest based on TSR, the fair value of performance shares is estimated using a combination of the applicable reporting unitclosing stock price on the grant date and the Monte Carlo simulation model. The weighted-average fair value and the assumptions used to its net book value, including goodwill. If the net book value exceedsmeasure the fair value of performance share units subject to performance-adjusted vesting conditions in the reporting unit, we measureMonte Carlo simulation model were as follows:
| Year Ended December 31, | |||||||||||||||||
| 2020 | 2019 | 2018 | |||||||||||||||
Weighted-average fair value (a) | $10.02 | $29.04 | $41.97 | ||||||||||||||
Expected volatility (b) | 38.30 | % | 34.00 | % | 34.00 | % | |||||||||||
Risk-free interest rate (c) | 0.40 | % | 2.42 | % | 2.37 | % | |||||||||||
Expected performance period in years (d) | 3.0 | 3.0 | 3.0 | ||||||||||||||
(a) The weighted-average fair value was based on performance share units granted during the impairment by comparingperiod.
120
(b) Expected volatility is based on normalized historical volatility of our shares over a preceding period commensurate with the carryingexpected term of the performance share units.
(c) The risk-free rate for the expected term of the performance share units is based on the U.S. Treasury yield curve in effect at the time of grant.
(d) For awards subject to service-based vesting, due to the lack of historical exercise and post-vesting termination patterns of the post-Merger employee base, the expected term was estimated using a simplified method for all awards granted in 2020, 2019 and 2018.
A summary of the non-vested performance share units’ activity is as follows:
| (Shares in thousands) | Shares | Weighted-Average Grant Date Fair Value | |||||||||
| Non-vested as of December 31, 2019 | 3,817.7 | $ | 28.52 | ||||||||
| Granted | 2,828.4 | $ | 10.02 | ||||||||
| Vested | (1,364.4) | $ | 31.65 | ||||||||
| Cancelled/forfeited | (441.0) | $ | 20.62 | ||||||||
| Non-vested as of December 31, 2020 | 4,840.7 | $ | 17.55 | ||||||||
The total grant date fair value of the reporting unit to its fair value.performance share units vested during years ended December 31, 2020, 2019 and 2018 was $43.2 million, $13.3 million and $7.0 million, respectively.
The fair value of each share option award is estimated as of the date of grant using the Black-Scholes options pricing model.
Share options awarded prior to 2017 were granted subject to performance criteria based upon certain targets, such as TSR, return on capital employed, and operating income from recurring activities. Subsequent share options granted are time-based awards vesting over three years.
The weighted-average fair value and the assumptions used to measure fair value are as follows:
| Year Ended December 31, | |||||||||||||||||
| 2020 | 2019 | 2018 | |||||||||||||||
Weighted-average fair value (a) | $ | 0 | $ | 5.64 | $ | 9.07 | |||||||||||
Expected volatility (b) | 0 | % | 32.5 | % | 32.5 | % | |||||||||||
Risk-free interest rate (c) | 0 | % | 2.5 | % | 2.7 | % | |||||||||||
Expected dividend yield (d) | 0 | % | 2.6 | % | 2.0 | % | |||||||||||
Expected term in years (e) | 0 | 6.5 | 6.5 | ||||||||||||||
(a)The weighted-average fair value was based on stock options granted during the period.
(b)Expected volatility is based on normalized historical volatility of our reporting unitsshares over a preceding period commensurate with the expected term of the option.
(c)The risk-free rate for the expected term of the option is based on the U.S. Treasury yield curve in effect at the time of grant.
(d)There were 0 share options awarded in 2020. Share options awarded in 2019 and 2018 were valued using an expected dividend yield of 2.6% and 2.0%, respectively.
(e)For awards subject to service-based vesting, due to the lack of historical exercise and post-vesting termination patterns of the post-Merger employee base, the expected term was estimated using a simplified method for all awards granted in 2020, 2019 and 2018.
The following is a summary of share option transactions during the year ended December 31, 2020:
121
| Number of Shares | Weighted average exercise price | Weighted average remaining life (in years) | |||||||||||||||||||||
| Balance as of December 31, 2019 | 4,842.4 | $ | 29.68 | 5.3 | |||||||||||||||||||
| Granted | 0 | $ | 0 | ||||||||||||||||||||
| Exercised | 0 | $ | 0 | ||||||||||||||||||||
| Cancelled | (244.0) | $ | 28.08 | ||||||||||||||||||||
| Balance as of December 31, 2020 | 4,598.4 | $ | 29.77 | 4.2 | |||||||||||||||||||
| Exercisable as of December 31, 2020 | 3,460.8 | $ | 31.47 | 3.0 | |||||||||||||||||||
The aggregate intrinsic value of stock options outstanding and stock options exercisable as of December 31, 2020 was NaN and NaN, respectively.
Cash received from the share option exercises was NaN, during each of the years ended December 31, 2020, 2019 and 2018. The total intrinsic value of share options exercised during each of the years ended December 31, 2020, 2019 and 2018 was NaN. To exercise share options, an employee may choose (1) to pay, either directly or by way of the group savings plan, the share option strike price to obtain shares, or (2) to sell the shares immediately after having exercised the share option (in this case, the employee does not pay the strike price but instead receives the intrinsic value of the share options in cash).
The following summarizes significant ranges of outstanding and exercisable share options as of December 31, 2020:
| Options Outstanding | Options Exercisable | ||||||||||||||||||||||||||||
| Exercise Price Range | Number of options (in thousands) | Weighted average remaining life (in years) | Weighted average exercise price | Number of options (in thousands) | Weighted average exercise price | ||||||||||||||||||||||||
| $20.00-$33.00 | 4,087.2 | 4.6 | $ | 26.68 | 2,949.5 | $ | 26.90 | ||||||||||||||||||||||
| $45.00-$51.00 | 33.0 | 1.0 | $ | 45.49 | 33.0 | $ | 45.49 | ||||||||||||||||||||||
| $55.00-$57.00 | 478.2 | 0.4 | $ | 56.93 | 478.3 | $ | 56.93 | ||||||||||||||||||||||
| Total | 4,598.4 | 4.2 | $ | 29.77 | 3,460.8 | $ | 31.47 | ||||||||||||||||||||||
122
NOTE 19. IMPAIRMENT, RESTRUCTURING AND OTHER EXPENSES
Impairment, restructuring and other expenses were as follows:
| Year Ended December 31, | |||||||||||||||||
| (In millions) | 2020 | 2019 | 2018 | ||||||||||||||
| Subsea | $ | 2,957.5 | $ | 1,752.2 | $ | 1,801.9 | |||||||||||
| Technip Energies | 93.6 | 17.0 | (3.4) | ||||||||||||||
| Surface Technologies | 440.2 | 704.2 | 13.8 | ||||||||||||||
| Corporate and other | 10.0 | 17.4 | 18.9 | ||||||||||||||
| Total impairment, restructuring and other expenses | $ | 3,501.3 | $ | 2,490.8 | $ | 1,831.2 | |||||||||||
Goodwill and Long-Lived Assets Impairments
Goodwill and long-lived assets impairments were as follows:
| Year Ended December 31, | |||||||||||||||||
| (In millions) | 2020 | 2019 | 2018 | ||||||||||||||
| Subsea | $ | 2,854.5 | $ | 1,798.6 | $ | 1,784.2 | |||||||||||
| Technip Energies | 10.3 | 0 | 0 | ||||||||||||||
| Surface Technologies | 419.3 | 685.5 | 4.5 | ||||||||||||||
| Corporate and other | 3.3 | 0 | 3.9 | ||||||||||||||
| Total impairments | $ | 3,287.4 | $ | 2,484.1 | $ | 1,792.6 | |||||||||||
Due to the substantial decline in global demand for oil caused by the COVID-19 pandemic in 2020 we reviewed the future utilization of our vessels and service potential of our subsea service and surface equipment and determined that the carrying amount of our goodwill and some of our long-lived assets exceeded their netrespective fair values. We recorded $3,083.4 million and $204.0 million, respectively, related to goodwill and long-lived assets impairments. The $204.0 million of long-lived asset impairments during the year ended December 31, 2020 consisted of $88.4 million attributable to plant, equipment and various machinery infrastructure in our Subsea operating segment; $82.0 million mainly related to building and surface equipment in our Surface reportable segment; and $33.6 million of operating lease right-of-use assets impairments.
The prolonged downturn in the energy market and its corresponding impact on our business outlook in 2019 led us to conclude the carrying amount of certain of our assets in our Subsea and Surface Technologies segments exceeded their fair value as of OctoberDecember 31, 2019. During the 2019 year we recorded $1,988.7 million and $495.4 million, respectively, related to goodwill and long-lived assets impairments. The $495.4 million of each year. Our impairment analysis is quantitative; however, it includes subjective estimates basedlong-lived asset impairments during the year ended December 31, 2019 primarily consisted of $153.8 million related to vessels in our Subsea operating segment and $168.9 million related to our flexible pipe and umbilical manufacturing facilities in our Surface reportable segment due to the prolonged downturn in the energy market and its corresponding impact on assumptions regarding future growth rates, interest ratesour business outlook.
The prolonged downturn in the energy market and its corresponding impact on our business outlook in 2018 led us to conclude the carrying amount of certain of our assets in our Subsea operating expenses.
December 31, 2018. During the year ended December 31, 2018, we recorded $1,383.0 million ofand $372.9 million, respectively, related to goodwill impairment chargesand vessel impairments in our Subsea reporting unit. Referoperating segment.
Long-lived assets are reviewed for impairment whenever events or changes in circumstances indicate that carrying amounts of such assets may not be recoverable. Assessing the recoverability of assets to Note 17 to these consolidated financial statements for additional disclosure related to impairment of goodwill during the year ended December 31, 2018.
123
Restructuring and Other Expenses
Restructuring and other charges primarily consisted of severance and other employee related costs and COVID-19 related expenses across all segments. Restructuring and other expenses were as follows:
| Year Ended December 31, | |||||||||||||||||||||||
| 2020 | 2019 | 2018 | |||||||||||||||||||||
| (In millions) | Restructuring and other charges | COVID-19 expenses | Restructuring and other charges | Restructuring and other charges | |||||||||||||||||||
| Subsea | $ | 52.9 | $ | 50.1 | $ | (46.4) | $ | 17.7 | |||||||||||||||
| Technip Energies | 39.3 | 44.0 | 17.0 | (3.4) | |||||||||||||||||||
| Surface Technologies | 13.2 | 7.7 | 18.7 | 9.3 | |||||||||||||||||||
| Corporate and other | 6.7 | 0 | 17.4 | 15.0 | |||||||||||||||||||
| Total | $ | 112.1 | $ | 101.8 | $ | 6.7 | $ | 38.6 | |||||||||||||||
COVID-19 related expenses represent unplanned, one-off, incremental and non-recoverable costs incurred solely as a result of the COVID-19 pandemic situation, which would not have been incurred otherwise. COVID-19 related expenses primarily included (a) employee payroll and travel, operational disruptions associated with quarantining, personnel travel restrictions to job sites, and shutdown of manufacturing plants and sites; (b) supply chain and related expediting costs of accelerated shipments for previously ordered and undelivered products; (c) costs associated with implementing additional information technology to support remote working environments; and (d) facilities-related expenses to ensure safe working environments.
Prolonged uncertainty in energy markets could lead to further future reductions in capital spending from our customer base. In turn, this may lead to changes in our strategy. We will continue to take actions designed to mitigate the adverse effects of the rapidly changing market environment and expect to continue to adjust our cost structure to market conditions. If market conditions continue to deteriorate, we may record additional restructuring charges and additional impairments of our reporting units at December 31, 2018:
| (In millions) | Subsea | Onshore/Offshore | Surface Technologies | Total | |||||||||||
| December 31, 2015 | $ | 2,977.4 | $ | 809.1 | $ | — | $ | 3,786.5 | |||||||
| Additions due to business combinations | — | — | — | — | |||||||||||
| Impairment | — | — | — | — | |||||||||||
| Translation | (46.3 | ) | (21.9 | ) | — | (68.2 | ) | ||||||||
| December 31, 2016 | 2,931.1 | 787.2 | — | 3,718.3 | |||||||||||
| Additions due to business combinations | 2,532.6 | 1,635.5 | 997.8 | 5,165.9 | |||||||||||
| Impairment | — | — | — | — | |||||||||||
| Translation | 6.7 | 38.9 | — | 45.6 | |||||||||||
| December 31, 2017 | 5,470.4 | 2,461.6 | 997.8 | 8,929.8 | |||||||||||
| Additions due to business combinations | 85.0 | — | — | 85.0 | |||||||||||
| Impairment | (1,383.0 | ) | — | — | (1,383.0 | ) | |||||||||
| Purchase accounting adjustments | — | — | 19.7 | 19.7 | |||||||||||
| Translation | (30.0 | ) | (13.9 | ) | — | (43.9 | ) | ||||||||
| December 31, 2018 | $ | 4,142.4 | $ | 2,447.7 | $ | 1,017.5 | $ | 7,607.6 | |||||||
| December 31, | |||||||||||||||
| 2018 | 2017 | ||||||||||||||
| (In millions) | Gross Carrying Amount | Accumulated Amortization | Gross Carrying Amount | Accumulated Amortization | |||||||||||
| Acquired technology | $ | 246.7 | $ | 49.3 | $ | 240.0 | $ | 25.0 | |||||||
| Backlog | 175.0 | 175.0 | 175.0 | 118.0 | |||||||||||
| Customer relationships | 285.0 | 57.4 | 285.0 | 29.0 | |||||||||||
| Licenses, patents and trademarks | 812.6 | 194.8 | 810.1 | 157.7 | |||||||||||
| Software | 232.1 | 159.1 | 237.9 | 145.5 | |||||||||||
| Other | 84.3 | 23.4 | 72.7 | 11.7 | |||||||||||
| Total intangible assets | $ | 1,835.7 | $ | 659.0 | $ | 1,820.7 | $ | 486.9 | |||||||
| December 31, | |||||||
| (In millions) | 2018 | 2017 | |||||
| Bank borrowings | 44.2 | 48.9 | |||||
| Other | 23.2 | 28.2 | |||||
| Total short-term debt and current portion of long-term debt | $ | 67.4 | $ | 77.1 | |||
| December 31, | |||||||
| (In millions) | 2018 | 2017 | |||||
| Revolving credit facility | $ | — | $ | — | |||
| Bilateral credit facilities | — | — | |||||
Commercial paper (a) | 1,916.1 | 1,450.4 | |||||
| Synthetic bonds due 2021 | 490.9 | 502.4 | |||||
| 3.45% Senior Notes due 2022 | 500.0 | 500.0 | |||||
| 5.00% 2010 Private placement notes due 2020 | 229.0 | 239.9 | |||||
| 3.40% 2012 Private placement notes due 2022 | 171.8 | 179.9 | |||||
| 3.15% 2013 Private placement notes due 2023 | 148.9 | 155.9 | |||||
| 3.15% 2013 Private placement notes due 2023 | 143.1 | 149.9 | |||||
| 4.00% 2012 Private placement notes due 2027 | 85.9 | 89.9 | |||||
| 4.00% 2012 Private placement notes due 2032 | 114.5 | 119.9 | |||||
| 3.75% 2013 Private placement notes due 2033 | 114.5 | 119.9 | |||||
| Bank borrowings | 265.2 | 332.5 | |||||
| Other | 23.2 | 28.2 | |||||
| Unamortized issuing fees | (11.4 | ) | (13.8 | ) | |||
| Total debt | 4,191.7 | 3,855.0 | |||||
| Less: current borrowings | 67.4 | 77.1 | |||||
| Long-term debt | $ | 4,124.3 | $ | 3,777.9 | |||
| Payments Due by Period | |||||||||||||||||||
| (In millions) | Total payments | Less than 1 year | 1-3 years | 3-5 years | After 5 years | ||||||||||||||
| Total debt | $ | 4,191.7 | $ | 67.4 | $ | 2,854.2 | $ | 962.9 | $ | 307.2 | |||||||||
| (Number of shares in millions) | Ordinary Shares Issued | Ordinary Shares Held in Employee Benefit Trust | Treasury Stock | |||||
| December 31, 2015 | 119.0 | — | 0.8 | |||||
| Stock awards | 0.2 | — | (0.4 | ) | ||||
| Treasury stock purchases | — | — | 3.2 | |||||
| Dividend payment in shares | 3.2 | — | — | |||||
| Shares acquired pursuant to liquidity contract | — | — | 1.3 | |||||
| Shares sold pursuant to liquidity contract | — | — | (1.4 | ) | ||||
| Cancellation of treasury shares | (3.2 | ) | — | (3.2 | ) | |||
| December 31, 2016 | 119.2 | — | 0.3 | |||||
| Net capital increases due to the merger of FMC Technologies and Technip | 347.4 | — | — | |||||
| Stock awards | 0.6 | — | — | |||||
| Treasury stock cancellation due to the merger of FMC Technologies and Technip | — | — | (0.3 | ) | ||||
| Treasury stock purchases | — | — | 2.1 | |||||
| Treasury stock cancellation | (2.1 | ) | — | (2.1 | ) | |||
| Net stock purchased for employee benefit trust | — | 0.1 | — | |||||
| December 31, 2017 | 465.1 | 0.1 | — | |||||
| Net capital increase as per merger | — | — | — | |||||
| Stock awards | 0.2 | — | — | |||||
| Treasury stock purchases | — | — | 14.8 | |||||
| Treasury stock cancellation | (14.8 | ) | — | (14.8 | ) | |||
| Net stock purchased for employee benefit trust | — | — | — | |||||
| December 31, 2018 | 450.5 | 0.1 | — | |||||
| (In millions) | Foreign Currency Translation | Hedging | Defined Pension and Other Post-Retirement Benefits | Accumulated Other Comprehensive Loss attributable to TechnipFMC plc | Accumulated Other Comprehensive Loss attributable to Non-controlling interest | ||||||||||||||
| December 31, 2016 | $ | (927.1 | ) | $ | (127.1 | ) | $ | (47.4 | ) | $ | (1,101.6 | ) | $ | 0.2 | |||||
| Other comprehensive income (loss) before reclassifications, net of tax | (87.5 | ) | 53.7 | 43.2 | 9.4 | 0.4 | |||||||||||||
| Reclassification adjustment for net (gains) losses included in net income, net of tax | — | 101.2 | (12.7 | ) | 88.5 | — | |||||||||||||
| Other comprehensive income (loss), net of tax | (87.5 | ) | 154.9 | 30.5 | 97.9 | 0.4 | |||||||||||||
| December 31, 2017 | (1,014.6 | ) | 27.8 | (16.9 | ) | (1,003.7 | ) | 0.6 | |||||||||||
| Other comprehensive income (loss) before reclassifications, net of tax | (178.7 | ) | (58.7 | ) | (74.5 | ) | (311.9 | ) | (4.6 | ) | |||||||||
| Reclassification adjustment for net (gains) losses included in net income, net of tax | (41.1 | ) | (2.0 | ) | (1.0 | ) | (44.1 | ) | — | ||||||||||
| Other comprehensive income (loss), net of tax | (219.8 | ) | (60.7 | ) | (75.5 | ) | (356.0 | ) | (4.6 | ) | |||||||||
| December 31, 2018 | $ | (1,234.4 | ) | $ | (32.9 | ) | $ | (92.4 | ) | $ | (1,359.7 | ) | $ | (4.0 | ) | ||||
| Year Ended | ||||||||||||||
| (In millions) | December 31, 2018 | December 31, 2017 | December 31, 2016 | |||||||||||
| Details about Accumulated Other Comprehensive Loss Components | Amount Reclassified out of Accumulated Other Comprehensive Loss | Affected Line Item in the Consolidated Statement of Income | ||||||||||||
| Gains on foreign currency translation | $ | 41.1 | $ | — | — | Other income (expense), net | ||||||||
| Gains (losses) on hedging instruments | ||||||||||||||
| Foreign exchange contracts | $ | (2.4 | ) | $ | (39.3 | ) | $ | — | Revenue | |||||
| 3.4 | 5.3 | — | Costs of sales | |||||||||||
| (0.1 | ) | 0.8 | — | Selling, general and administrative expense | ||||||||||
| 1.0 | (102.2 | ) | (165.7 | ) | Other (expense), net | |||||||||
| 1.9 | (135.4 | ) | (165.7 | ) | Income before income taxes | |||||||||
| (0.1 | ) | (34.2 | ) | (45.6 | ) | Provision (benefit) for income taxes | ||||||||
| $ | 2.0 | $ | (101.2 | ) | $ | (120.1 | ) | Net income | ||||||
| Pension and other post-retirement benefits | ||||||||||||||
| Settlements and curtailments | $ | 3.0 | $ | 25.3 | $ | 10.7 | (a) | |||||||
| Amortization of actuarial gain (loss) | (0.6 | ) | (2.5 | ) | (1.0 | ) | (a) | |||||||
| Amortization of prior service credit (cost) | (1.3 | ) | (1.0 | ) | (0.7 | ) | (a) | |||||||
| 1.1 | 21.8 | 9.0 | Income before income taxes | |||||||||||
| 0.1 | 9.1 | 2.8 | Provision (benefit) for income taxes | |||||||||||
| $ | 1.0 | $ | 12.7 | $ | 6.2 | Net income | ||||||||
NOTE 16. SHARE-BASED COMPENSATION20. COMMITMENTS AND CONTINGENT LIABILITIES
Guarantees of our consolidated subsidiaries consisted of the following:
| (In millions) | December 31, 2020 | ||||
Financial guarantees (a) | $ | 310.1 | |||
Performance guarantees (b) | 4,659.6 | ||||
| Maximum potential undiscounted payments | $ | 4,969.7 | |||
(a)Financial guarantees represent contracts that contingently require a guarantor to make payments to a guaranteed party based on changes in an underlying agreement that is related to an asset, a liability or an equity security of the guaranteed party. These tend to be drawn down only if there is a failure to fulfill our financial obligations.
(b)Performance guarantees represent contracts that contingently require a guarantor to make payments to a guaranteed party based on another entity's failure to perform under a nonfinancial obligating agreement. Events that trigger payment are performance-related, such as failure to ship a product or provide a service.
We believe the ultimate resolution of our known contingencies will not materially adversely affect our consolidated financial position, results of operations, or cash flows.
Contingent liabilities associated with legal and tax matters - We are involved in various pending or potential legal and tax actions or disputes in the ordinary course of our business. These actions and disputes can involve our agents, suppliers, clients, and venture partners, and can include claims related to payment of fees, service quality,
124
and ownership arrangements, including certain put or call options. We are unable to predict the ultimate outcome of these actions because of their inherent uncertainty. However, we believe that the most probable, ultimate resolution of these matters will not have a material adverse effect on our consolidated financial position, results of operations or cash flows.
On January 11,March 28, 2016, FMC Technologies received an inquiry from the U.S. Department of Justice (“DOJ”) related to the DOJ's investigation of whether certain services Unaoil S.A.M. provided to its clients, including FMC Technologies, violated the U.S. Foreign Corrupt Practices Act (“FCPA”). On March 29, 2016, Technip S.A. also received an inquiry from the DOJ related to Unaoil. We cooperated with the DOJ's investigations and, with regard to FMC Technologies, a related investigation by the SEC.
In late 2016, Technip S.A. was contacted by the DOJ regarding its investigation of offshore platform projects awarded between 2003 and 2007, performed in Brazil by a joint venture company in which Technip S.A. was a minority participant, and we have also raised with the DOJ certain other projects performed by Technip S.A. subsidiaries in Brazil between 2002 and 2013. The DOJ has also inquired about projects in Ghana and Equatorial Guinea that were awarded to Technip S.A. subsidiaries in 2008 and 2009, respectively. We cooperated with the DOJ in its investigation into potential violations of the FCPA in connection with these projects. We contacted and cooperated with the Brazilian authorities (Federal Prosecution Service (“MPF”), the Comptroller General of Brazil (“CGU”) and the Attorney General of Brazil (“AGU”)) with their investigation concerning the projects in Brazil and have also contacted and are cooperating with French authorities (the Parquet National Financier (“PNF”)) with their investigation about these existing matters.
On June 25, 2019, we announced a global resolution to pay a total of $301.3 million to the DOJ, the SEC, the MPF, and the CGU/AGU to resolve these anti-corruption investigations. We will not be required to have a monitor and will, instead, provide reports on our anti-corruption program to the Brazilian and U.S. authorities for two and three years, respectively.
As part of this resolution, we entered into a three-year Deferred Prosecution Agreement (“DPA”) with the DOJ related to charges of conspiracy to violate the FCPA related to conduct in Brazil and with Unaoil. In addition, Technip USA, Inc., a U.S. subsidiary, pled guilty to one count of conspiracy to violate the FCPA related to conduct in Brazil. We will also provide the DOJ reports on our anti-corruption program during the term of the DPA.
In Brazil, our subsidiaries Technip Brasil - Engenharia, Instalações E Apoio Marítimo Ltda. and Flexibrás Tubos Flexíveis Ltda. entered into leniency agreements with both the MPF and the CGU/AGU. We have committed, as part of those agreements, to make certain enhancements to their compliance programs in Brazil during a two-year self-reporting period, which aligns with our commitment to cooperation and transparency with the compliance community in Brazil and globally.
In September 2019, the SEC approved our previously disclosed agreement in principle with the SEC Staff and issued an Administrative Order, pursuant to which we paid the SEC $5.1 million, which was included in the global resolution of $301.3 million.
To date, the investigation by PNF related to historical projects in Equatorial Guinea and Ghana has not reached resolution. We remain committed to finding a resolution with the PNF and will maintain a $70.0 million provision related to this investigation. As we continue to progress our discussions with PNF towards resolution, the amount of a settlement could exceed this provision.
There is no certainty that a settlement with PNF will be reached or that the settlement will not exceed current accruals. The PNF has a broad range of potential sanctions under anticorruption laws and regulations that it may seek to impose in appropriate circumstances including, but not limited to, fines, penalties, and modifications to business practices and compliance programs. Any of these measures, if applicable to us, as well as potential customer reaction to such measures, could have a material adverse impact on our business, results of operations, and financial condition. If we cannot reach a resolution with the PNF, we could be subject to criminal proceedings in France, the outcome of which cannot be predicted.
125
Contingent liabilities associated with liquidated damages - Some of our contracts contain provisions that require us to pay liquidated damages if we are responsible for the failure to meet specified contractual milestone dates and the applicable customer asserts a conforming claim under these provisions. These contracts define the conditions under which our customers may make claims against us for liquidated damages. Based upon the evaluation of our performance and other commercial and legal analysis, management believes we have appropriately recognized probable liquidated damages as of December 31, 2020 and 2019, and that the ultimate resolution of such matters will not materially affect our consolidated financial position, results of operations, or cash flows.
NOTE 21. INCOME TAXES
Components of income (loss) before income taxes - U.S. and outside U.S. components of income (loss) before income taxes were as follows:
| Year Ended December 31, | |||||||||||||||||
| (In millions) | 2020 | 2019 | 2018 | ||||||||||||||
| United States | $ | (3,073.5) | $ | (1,406.5) | $ | (197.0) | |||||||||||
| Outside United States | $ | (11.5) | $ | (729.3) | $ | (1,291.1) | |||||||||||
| Loss before income taxes | $ | (3,085.0) | $ | (2,135.8) | $ | (1,488.1) | |||||||||||
Provision for income tax - The provision for income taxes consisted of:
| Year Ended December 31, | |||||||||||||||||
| (In millions) | 2020 | 2019 | 2018 | ||||||||||||||
| Current | |||||||||||||||||
| United States | $ | (4.7) | $ | 34.7 | $ | 52.1 | |||||||||||
| Outside United States | 164.8 | 317.0 | 321.8 | ||||||||||||||
| Total current income taxes | 160.1 | 351.7 | 373.9 | ||||||||||||||
| Deferred | |||||||||||||||||
| United States | (3.1) | 2.6 | 19.5 | ||||||||||||||
| Outside United States | (3.6) | (78.0) | 29.3 | ||||||||||||||
| Total deferred income taxes | (6.7) | (75.4) | 48.8 | ||||||||||||||
| Provision for income taxes | $ | 153.4 | $ | 276.3 | $ | 422.7 | |||||||||||
126
Deferred tax assets and liabilities - Significant components of deferred tax assets and liabilities were as follows:
| December 31, | |||||||||||
| (In millions) | 2020 | 2019 | |||||||||
| Deferred tax assets attributable to | |||||||||||
| Accrued expenses | $ | 147.8 | $ | 124.4 | |||||||
| Capital loss | 21.1 | 21.1 | |||||||||
| Non-deductible interest | 77.0 | 84.7 | |||||||||
| Foreign tax credit carryforwards | 145.8 | 135.3 | |||||||||
| Other tax credits | 166.8 | 113.2 | |||||||||
| Net operating loss carryforwards | 489.0 | 430.5 | |||||||||
| Inventories | 16.5 | 6.3 | |||||||||
| Research and development credit | 3.4 | 7.6 | |||||||||
| Foreign exchange | — | 20.4 | |||||||||
| Provisions for pensions and other long-term employee benefits | 96.1 | 84.1 | |||||||||
| Contingencies | 43.4 | 163.3 | |||||||||
| Margin recognition on construction contracts | 113.9 | 115.9 | |||||||||
| Leases | 254.9 | 219.8 | |||||||||
| Revenue in excess of billings on contracts accounted for under the percentage of completion method | 0 | 10.9 | |||||||||
| Other | — | 6.9 | |||||||||
| Deferred tax assets | 1,575.7 | 1,544.4 | |||||||||
| Valuation allowance | (935.3) | (916.9) | |||||||||
| Deferred tax assets, net of valuation allowance | 640.4 | 627.5 | |||||||||
| Deferred tax liabilities attributable to | |||||||||||
| Revenue in excess of billings on contracts accounted for under the percentage of completion method | 42.6 | — | |||||||||
| U.S. tax on foreign subsidiaries’ undistributed earnings not indefinitely reinvested | 4.2 | 10.4 | |||||||||
| Property, plant and equipment, intangibles and other assets | 185.8 | 279.6 | |||||||||
| Foreign exchange | 27.8 | 0 | |||||||||
| Leases | 237.0 | 215.2 | |||||||||
| Other | 4.7 | 0 | |||||||||
| Deferred tax liabilities | 502.1 | 505.2 | |||||||||
| Net deferred tax assets | $ | 138.3 | $ | 122.3 | |||||||
At December 31, 2020 and 2019, the carrying amount of net deferred tax assets and the related valuation allowance included the impact of foreign currency translation adjustments.
Non-deductible interest. At December 31, 2020, deferred tax assets include tax benefits related to certain intercompany interest costs which are not currently deductible, but which may be deductible in future periods. If not utilized, these costs will become permanently non-deductible beginning in 2025. Management believes that it is more likely than not that we will not be able to deduct these costs before expiration of the carry forward period; therefore, we have established a valuation allowance against the related deferred tax assets.
Foreign tax credit carryforwards. At December 31, 2020, deferred tax assets included U.S. foreign tax credit carryforwards of $145.8 million, which, if not utilized, will begin to expire in 2024. Realization of these deferred tax assets is dependent on the generation of sufficient U.S. taxable income prior to the above date. Based on long-term forecasts of operating results, management believes that it is more likely than not that our U.S. earnings over the forecast period will not result in sufficient U.S. taxable income to fully realize these deferred tax assets; therefore, we have established a valuation allowance against the related deferred tax assets. In its analysis, management has considered the effect of deemed dividends and other expected adjustments to U.S. earnings that are required in determining U.S. taxable income. Non-U.S. earnings subject to U.S. tax, including deemed dividends for U.S. tax purposes, were $61 thousand in 2020, $3.8 million in 2019 and $307.6 million in 2018.
127
Net operating loss carryforwards. As of December 31, 2020, deferred tax assets include tax benefits relating to net operating loss carryforwards. If not utilized, these net operating loss carryforward will begin to expire in 2021. Except in Norway (net operating losses of $373.7 million), management believes it is more likely than not that we will not be able to utilize these operating loss carryforwards before expiration; thus, we have established a valuation allowance against the related deferred tax assets (inclusive of NOL’s generated in United Kingdom, Saudi Arabia, Netherlands, Mexico, Brazil, Canada, United States, Luxembourg, and Germany). Except in Canada, Mexico, and Netherlands, all of these tax loss carryforwards extend indefinitely.
Certain Adjustments to Valuation Allowance. The net increase in valuation allowance from December 31, 2019 to December 31, 2020 includes certain adjustments which did not impact net tax expense. These adjustments include $62.0 million of deferred tax assets which were recorded in 2020 and are related to certain previously unrecorded tax credits in the Netherlands that are subject to a full valuation allowance. In addition, the Company wrote off $15.3 million and $11.3 million of deferred tax assets in Italy and Mexico, respectively, that had been subject to a full valuation allowance.
Unrecognized tax benefits - The following table presents a summary of changes in our unrecognized tax benefits:
| (In millions) | Federal, State and Foreign Tax | ||||||||||||||||
| Balance at December 31, 2018 | $ | 91.0 | |||||||||||||||
| Reductions for tax positions related to prior years | (62.4) | ||||||||||||||||
| Additions for tax positions related to current year | 72.9 | ||||||||||||||||
| Reductions for tax positions due to settlements | (20.8) | ||||||||||||||||
| Balance at December 31, 2019 | $ | 80.7 | |||||||||||||||
| Reductions for tax positions related to prior years | (7.9) | ||||||||||||||||
| Additions for tax positions related to current year | 0.9 | ||||||||||||||||
| Reductions for tax positions due to settlements | (2.6) | ||||||||||||||||
| Balance at December 31, 2020 | $ | 71.1 | |||||||||||||||
The amounts reported above for uncertain tax positions excludes interest and penalties of $3.7 million, $0.1 million, and $2.8 million for the years ended December 31, 2020, 2019, and 2018, respectively. Interest and penalties relating to these uncertain tax positions were included in income tax expense in our consolidated statements of income. It is reasonably possible that within twelve months, $4.2 million of liabilities for unrecognized tax benefits will be settled. This amount is reflected in income taxes payable, the remaining balance of the unrecognized tax benefits is recorded in other long term liabilities.
We operate in numerous jurisdictions around the world and could be subject to multiple tax audits at any given time. Most notably, the following tax years and thereafter remain subject to examination: 2010 for Norway, 2016 for Nigeria, 2016 for Brazil, 2017 we adoptedfor France, and 2016 for the United States.
TechnipFMC plc Incentive Award Plan (the “Plan”). The Plan provides certain incentives and awards to officers, employees, non-employee directors and consultants of TechnipFMC and its subsidiaries. The Plan allows our Board of Directors to make various types of awards to non-employee directors and the Compensation Committee (the “Committee”) of the Board of Directors to make various types of awards to other eligible individuals. Awards may include share options, share appreciation rights, performance share units, restricted share units, restricted shares or other awards authorizedis a public limited company incorporated under the Plan. All awardslaws of England and Wales. Therefore, our earnings are subject to the Plan’s provisions, includingU.K. statutory rate which is 19.0% for 2020, 2019, and 2018.
128
Effective income tax rate reconciliation - The effective income tax rate was different from the statutory U.K. income tax rate due to the following:
| Year Ended December 31, | |||||||||||||||||
| 2020 | 2019 | 2018 | |||||||||||||||
| Statutory income tax rate | 19.0 | % | 19.0 | % | 19.0 | % | |||||||||||
| Net difference resulting from | |||||||||||||||||
| Foreign earnings subject to different tax rates | (1.5) | % | 0.3 | % | (9.7) | % | |||||||||||
| Adjustments to prior year taxes | (1.3) | % | (0.4) | % | (0.7) | % | |||||||||||
| Changes in valuation allowance | 0 | % | (8.8) | % | (14.4) | % | |||||||||||
| Deferred tax asset/liability revaluation for tax rate change | — | % | (0.5) | % | (1.7) | % | |||||||||||
| Impairments | (22.5) | % | (21.9) | % | (16.5) | % | |||||||||||
| Non-deductible legal provision | 0 | % | (0.8) | % | (3.8) | % | |||||||||||
| Other | 1.3 | % | 0.2 | % | (0.6) | % | |||||||||||
| Effective income tax rate | (5.0) | % | (12.9) | % | (28.4) | % | |||||||||||
Income tax holidays. We benefit from income tax holidays in Singapore and Malaysia which will expire after 2023 for Singapore and 2020 for Malaysia. For the year ended December 31, 2020, these tax holidays reduced our provision for income taxes by $5.8 million, or $0.01 per share on a diluted basis.
NOTE 22. PENSION AND OTHER POST-RETIREMENT BENEFIT PLANS
We have funded and unfunded defined benefit pension plans, which provide defined benefits based on years of service and final average salary.
On December 31, 2017, we amended the U.S. retirement plans (the “Plans”) to freeze benefit accruals for all share-based grants previously issued by FMC Technologies and Technip prior to consummationparticipants of the Merger. Under the Plan, 24.1 million ordinary shares were authorized for awards. AtPlans as of December 31, 2018, 18.2 million ordinary shares were available2017. After that date, participants in the Plans will no longer accrue any further benefits and participants’ benefits under the Plans will be determined based on credited service and eligible earnings as of December 31, 2017.
Foreign-based employees are eligible to participate in TechnipFMC-sponsored or government-sponsored benefit plans to which we contribute. Several of the foreign defined benefit pension plans sponsored by us provide for future grant.employee contributions; the remaining plans are noncontributory. The most significant of these plans are in the Netherlands, France, and the United Kingdom.
We are required to recognize the funded status of defined benefit post-retirement plans as an asset or liability in the consolidated balance sheet and performance share unit grants generally vest after three years of service.
| Year Ended December 31, | |||||||||||
| (In millions) | 2018 | 2017 | 2016 | ||||||||
Share-based compensation expense (1) | $ | 49.1 | $ | 44.4 | $ | 22.0 | |||||
| Income tax benefits related to share-based compensation expense | $ | 13.2 | $ | 12.0 | $ | 5.9 | |||||
| December 31, 2018 | |||
| Share-based compensation expense not yet recognized (in millions) | $ | 83.4 | |
| Weighted-average recognition period (in years) | 1.7 | ||
| (Shares in thousands) | Shares | Weighted-Average Grant Date Fair Value | ||||
| Nonvested at December 31, 2017 | 1,722.3 | $ | 28.53 | |||
| Granted | 1,516.0 | $ | 31.57 | |||
| Vested | (165.4 | ) | $ | 28.94 | ||
| Cancelled/forfeited | (95.5 | ) | $ | 27.85 | ||
| Nonvested at December 31, 2018 | 2,977.4 | $ | 30.10 | |||
| Year Ended December 31, | ||||||||
| 2018 | 2017 | 2016 | ||||||
Weighted-average fair value (a) | $41.97 | $34.42 | $22.47 | |||||
Expected volatility (b) | 34.00 | % | 34.87 | % | 31.30 | % | ||
Risk-free interest rate (c) | 2.37 | % | 1.50 | % | 0.85 | % | ||
Expected performance period in years (d) | 3.0 | 3.0 | 2.8 | |||||
| (Shares in thousands) | Shares | Weighted-Average Grant Date Fair Value | ||||
| Nonvested at December 31, 2017 | 2,748.8 | $ | 25.59 | |||
| Granted | 623.0 | $ | 36.06 | |||
| Vested | (203.6 | ) | $ | 34.55 | ||
| Cancelled/forfeited | (124.4 | ) | $ | 28.45 | ||
| Nonvested at December 31, 2018 | 3,043.8 | $ | 27.02 | |||
| Year Ended December 31, | |||||||||||
| 2018 | 2017 | 2016 | |||||||||
Weighted-average fair value (a) | $ | 9.07 | $ | 8.79 | € | 7.7 | |||||
Expected volatility (b) | 32.5 | % | 35.7 | % | 34.5 | % | |||||
Risk-free interest rate (c) | 2.7 | % | 2.1 | % | — | % | |||||
Expected dividend yield (d) | 2.0 | % | 2.0 | % | 2.0%-4.5% | ||||||
Expected term in years (e) | 6.5 | 6.5 | 4.2 | ||||||||
| (Shares in thousands) | Number of shares | Weighted average exercise price | Weighted average remaining life (in years) | |||||
| Balance as of December 31, 2015 | 2,420.5 | € | 61.88 | 3.5 | ||||
| Granted | 595.1 | € | 48.33 | |||||
| Exercised | (25.5 | ) | € | 57.22 | ||||
| Cancelled | (801.3 | ) | € | 52.43 | ||||
| Balance as of December 31, 2016 | 2,188.8 | € | 61.72 | 5.0 | ||||
Adjustment due to FMC Technologies transaction (a) | 2,188.8 | $ | — | |||||
| Granted | 798.4 | $ | 29.29 | |||||
| Exercised | — | $ | — | |||||
| Cancelled | (292.2 | ) | $ | 47.60 | ||||
| Balance as of December 31, 2017 | 4,883.8 | $ | 36.35 | 4.6 | ||||
| Granted | 602.2 | $ | 30.70 | |||||
| Exercised | — | $ | — | |||||
| Cancelled | (827.6 | ) | $ | 47.20 | ||||
| Balance as of December 31, 2018 | 4,658.4 | $ | 33.68 | 4.8 | ||||
| Exercisable at December 31, 2018 | 1,114.9 | $ | 52.37 | 1.3 | ||||
locally reported pension expense.
The aggregate intrinsic valuefunded status of stock options outstandingour U.S. Pension Plans, certain foreign pension plans and stock options exercisableU.S. post-retirement health care and life insurance benefit plans, together with the associated balances recognized in our consolidated balance sheets as of December 31, 2018 was nil2020 and nil, respectively.2019, were as follows:
129
| Pensions | Other Post-retirement Benefits | ||||||||||||||||||||||||||||||||||
| 2020 | 2019 | 2020 | 2019 | ||||||||||||||||||||||||||||||||
| (In millions) | U.S. | Int’l | U.S. | Int’l | |||||||||||||||||||||||||||||||
| Accumulated benefit obligation | $ | 684.7 | $ | 873.0 | $ | 669.6 | $ | 773.3 | |||||||||||||||||||||||||||
| Projected benefit obligation at January 1 | $ | 669.7 | $ | 881.0 | $ | 598.1 | $ | 753.4 | $ | 10.6 | $ | 9.5 | |||||||||||||||||||||||
| Service cost | — | 19.1 | — | 16.3 | — | — | |||||||||||||||||||||||||||||
| Interest cost | 22.2 | 14.1 | 25.6 | 18.3 | 0.4 | 0.5 | |||||||||||||||||||||||||||||
| Actuarial (gain) loss | 53.9 | 35.5 | 80.7 | 102.8 | (0.2) | 1.4 | |||||||||||||||||||||||||||||
| Amendments | — | 0.1 | — | 0.9 | — | — | |||||||||||||||||||||||||||||
| Curtailments | — | (0.2) | — | — | — | — | |||||||||||||||||||||||||||||
| Settlements | (25.6) | (3.5) | — | (0.6) | — | — | |||||||||||||||||||||||||||||
| Foreign currency exchange rate changes | — | 48.0 | — | 11.1 | (0.5) | (0.1) | |||||||||||||||||||||||||||||
| Plan participants’ contributions | — | 1.1 | — | 1.1 | — | — | |||||||||||||||||||||||||||||
| Benefits paid | (35.5) | (27.2) | (34.7) | (25.7) | (0.5) | (0.5) | |||||||||||||||||||||||||||||
| Other | — | 2.1 | — | 3.4 | — | (0.2) | |||||||||||||||||||||||||||||
| Projected benefit obligation as of December 31 | 684.7 | 970.1 | 669.7 | 881.0 | 9.8 | 10.6 | |||||||||||||||||||||||||||||
| Fair value of plan assets at January 1 | 520.0 | 657.8 | 477.4 | 570.6 | — | — | |||||||||||||||||||||||||||||
| Actual return on plan assets | 14.3 | 45.9 | 72.0 | 89.1 | — | — | |||||||||||||||||||||||||||||
| Company contributions | — | 28.7 | — | 6.9 | — | — | |||||||||||||||||||||||||||||
| Foreign currency exchange rate changes | — | 33.4 | — | 13.5 | — | — | |||||||||||||||||||||||||||||
| Settlements | (19.6) | (1.9) | — | — | — | — | |||||||||||||||||||||||||||||
| Plan participants’ contributions | — | 1.1 | — | 1.1 | — | — | |||||||||||||||||||||||||||||
| Benefits paid | (31.0) | (20.8) | (29.4) | (19.6) | — | — | |||||||||||||||||||||||||||||
| Other | — | 2.0 | — | (3.8) | — | — | |||||||||||||||||||||||||||||
| Fair value of plan assets as of December 31 | 483.7 | 746.2 | 520.0 | 657.8 | — | — | |||||||||||||||||||||||||||||
| Funded status of the plans (liability) as of December 31 | $ | (201.0) | $ | (223.9) | $ | (149.7) | $ | (223.2) | $ | (9.8) | $ | (10.6) | |||||||||||||||||||||||
| Pensions | Other Post-retirement Benefits | ||||||||||||||||||||||||||||||||||
| 2020 | 2019 | 2020 | 2019 | ||||||||||||||||||||||||||||||||
| (In millions) | U.S. | Int’l | U.S. | Int’l | |||||||||||||||||||||||||||||||
| Current portion of accrued pension and other post-retirement benefits | (4.6) | (8.6) | (5.5) | (8.8) | (0.7) | (0.6) | |||||||||||||||||||||||||||||
| Accrued pension and other post-retirement benefits, net of current portion | (196.4) | (215.3) | (144.2) | (214.4) | (9.1) | (10.0) | |||||||||||||||||||||||||||||
| Funded status as of December 31 | $ | (201.0) | $ | (223.9) | $ | (149.7) | $ | (223.2) | $ | (9.8) | $ | (10.6) | |||||||||||||||||||||||
130
The following table summarizes the option exercises was nil, nil and €1.5 million during years endedpre-tax amounts in accumulated other comprehensive (income) loss as of December 31, 2018, 20172020 and 2016, respectively. 2019 that have not been recognized as components of net periodic benefit cost:
| Pensions | Other Post-retirement Benefits | ||||||||||||||||||||||||||||||||||
| 2020 | 2019 | 2020 | 2019 | ||||||||||||||||||||||||||||||||
| (In millions) | U.S. | Int’l | U.S. | Int’l | |||||||||||||||||||||||||||||||
| Pre-tax amounts recognized in accumulated other comprehensive (income) loss | |||||||||||||||||||||||||||||||||||
| Unrecognized actuarial loss | $ | 198.4 | $ | 122.3 | $ | 121.6 | $ | 90.7 | $ | 1.3 | $ | 1.9 | |||||||||||||||||||||||
| Unrecognized prior service cost | — | 6.2 | — | 7.0 | — | — | |||||||||||||||||||||||||||||
| Accumulated other comprehensive (income) loss as of December 31 | $ | 198.4 | $ | 128.5 | $ | 121.6 | $ | 97.7 | $ | 1.3 | $ | 1.9 | |||||||||||||||||||||||
The total intrinsicfollowing tables summarize the projected and accumulated benefit obligations and fair values of plan assets where the projected or accumulated benefit obligation exceeds the fair value of options exercised duringplan assets as of December 31, 2020 and 2019:
| Pensions | Other Post-retirement Benefits | ||||||||||||||||||||||||||||||||||
| 2020 | 2019 | 2020 | 2019 | ||||||||||||||||||||||||||||||||
| (In millions) | U.S. | Int’l | U.S. | Int’l | |||||||||||||||||||||||||||||||
| Plans with underfunded or non-funded projected benefit obligation | |||||||||||||||||||||||||||||||||||
| Aggregate projected benefit obligation | $ | 684.7 | $ | 818.7 | $ | 668.4 | $ | 741.2 | $ | 9.8 | $ | 10.7 | |||||||||||||||||||||||
| Aggregate fair value of plan assets | $ | 483.7 | $ | 596.7 | $ | 518.8 | $ | 522.8 | $ | — | $ | — | |||||||||||||||||||||||
| Pensions | Other Post-retirement Benefits | ||||||||||||||||||||||||||||||||||
| 2020 | 2019 | 2020 | 2019 | ||||||||||||||||||||||||||||||||
| (In millions) | U.S. | Int’l | U.S. | Int’l | |||||||||||||||||||||||||||||||
| Plans with underfunded or non-funded accumulated benefit obligation | |||||||||||||||||||||||||||||||||||
| Aggregate accumulated benefit obligation | $ | 684.7 | $ | 325.7 | $ | 668.4 | $ | 292.1 | $ | — | $ | — | |||||||||||||||||||||||
| Aggregate fair value of plan assets | $ | 483.7 | $ | 154.0 | $ | 518.8 | $ | 140.3 | $ | — | $ | — | |||||||||||||||||||||||
131
The following table summarizes the components of net periodic benefit cost (income) for the years ended December 31, 2018, 20172020, 2019 and 2016 was nil, nil2018:
| Pensions | Other Post-retirement Benefits | ||||||||||||||||||||||||||||||||||||||||||||||||||||
| 2020 | 2019 | 2018 | 2020 | 2019 | 2018 | ||||||||||||||||||||||||||||||||||||||||||||||||
| (In millions) | U.S. | Int’l | U.S. | Int’l | U.S. | Int’l | |||||||||||||||||||||||||||||||||||||||||||||||
| Components of net periodic benefit cost (income) | |||||||||||||||||||||||||||||||||||||||||||||||||||||
| Service cost | $ | — | $ | 19.1 | $ | — | $ | 16.3 | $ | 0.2 | $ | 21.2 | $ | — | $ | — | $ | — | |||||||||||||||||||||||||||||||||||
| Interest cost | 22.2 | 14.1 | 25.6 | 18.3 | 23.8 | 20.9 | 0.4 | 0.5 | 0.4 | ||||||||||||||||||||||||||||||||||||||||||||
| Expected return on plan assets | (45.4) | (37.9) | (41.6) | (33.5) | (50.1) | (41.2) | — | — | — | ||||||||||||||||||||||||||||||||||||||||||||
| Settlement cost | 1.4 | 0.8 | — | 0.3 | 0.4 | 0.4 | — | — | — | ||||||||||||||||||||||||||||||||||||||||||||
| Curtailment benefit | — | — | — | — | — | (3.8) | — | — | — | ||||||||||||||||||||||||||||||||||||||||||||
| Amortization of net actuarial loss (gain) | 6.9 | 2.1 | 1.8 | 0.7 | — | 0.6 | 0.1 | — | — | ||||||||||||||||||||||||||||||||||||||||||||
| Amortization of prior service cost (credit) | — | 1.2 | — | 1.0 | — | 1.3 | — | — | — | ||||||||||||||||||||||||||||||||||||||||||||
| Net periodic benefit cost (income) | $ | (14.9) | $ | (0.6) | $ | (14.2) | $ | 3.1 | $ | (25.7) | $ | (0.6) | $ | 0.5 | $ | 0.5 | $ | 0.4 | |||||||||||||||||||||||||||||||||||
The following table summarizes changes in plan assets and nil, respectively. To exercise stock options, an employee may choose (1)benefit obligations recognized in other comprehensive income (loss) for the years ended December 31, 2020, 2019 and 2018:
| Pensions | Other Post-retirement Benefits | ||||||||||||||||||||||||||||||||||||||||||||||||||||
| 2020 | 2019 | 2018 | 2020 | 2019 | 2018 | ||||||||||||||||||||||||||||||||||||||||||||||||
| (In millions) | U.S. | Int’l | U.S. | Int’l | U.S. | Int’l | |||||||||||||||||||||||||||||||||||||||||||||||
| Changes in plan assets and benefit obligations recognized in other comprehensive income (loss) | |||||||||||||||||||||||||||||||||||||||||||||||||||||
| Net actuarial gain (loss) arising during period | $ | (85.1) | $ | (27.2) | $ | (50.2) | $ | (47.3) | $ | (73.5) | $ | (15.3) | $ | — | $ | — | $ | — | |||||||||||||||||||||||||||||||||||
| Prior service (cost) credit arising during period | — | (0.1) | — | (0.9) | 0.2 | (2.7) | — | — | — | ||||||||||||||||||||||||||||||||||||||||||||
| Settlements and curtailments | 1.4 | 0.8 | — | 0.3 | 0.4 | (3.4) | — | — | — | ||||||||||||||||||||||||||||||||||||||||||||
| Amortization of net actuarial loss (gain) | 6.9 | 2.1 | 1.8 | 0.7 | — | 0.6 | (0.1) | — | — | ||||||||||||||||||||||||||||||||||||||||||||
| Amortization of prior service cost (credit) | — | 1.2 | — | 1.0 | — | 1.3 | — | — | — | ||||||||||||||||||||||||||||||||||||||||||||
| Other | — | (7.5) | — | (0.8) | — | 1.4 | (0.6) | (0.1) | (0.1) | ||||||||||||||||||||||||||||||||||||||||||||
| Total recognized in other comprehensive income (loss) | $ | (76.8) | $ | (30.7) | $ | (48.4) | $ | (47.0) | $ | (72.9) | $ | (18.1) | $ | (0.7) | $ | (0.1) | $ | (0.1) | |||||||||||||||||||||||||||||||||||
Included in accumulated other comprehensive income (loss) as of December 31, 2020, are noncash, pre-tax charges which have not yet been recognized in net periodic benefit cost (income). The estimated amounts expected to pay, either directly or by waybe amortized from the portion of each component of accumulated other comprehensive income (loss) as a component of net period benefit cost (income), during the next fiscal year are as follows:
| Pensions | Other Post-retirement Benefits | ||||||||||||||||
| (In millions) | U.S. | Int’l | |||||||||||||||
| Net actuarial losses | $ | 16.8 | $ | 4.0 | $ | — | |||||||||||
| Prior service cost | $ | — | $ | 1.2 | $ | — | |||||||||||
132
Key assumptions - The following weighted-average assumptions were used to determine the benefit obligations:
| Pensions | Other Post-retirement Benefits | ||||||||||||||||||||||||||||||||||
| 2020 | 2019 | 2020 | 2019 | ||||||||||||||||||||||||||||||||
| U.S. | Int’l | U.S. | Int’l | ||||||||||||||||||||||||||||||||
| Discount rate | 2.70 | % | 1.23 | % | 3.40 | % | 1.70 | % | 3.47 | % | 4.31 | % | |||||||||||||||||||||||
| Rate of compensation increase | N/A | 1.92 | % | N/A | 2.39 | % | 4.00 | % | 4.00 | % | |||||||||||||||||||||||||
The following weighted-average assumptions were used to determine net periodic benefit cost:
| Pensions | Other Post-retirement Benefits | ||||||||||||||||||||||||||||||||||||||||||||||||||||
| 2020 | 2019 | 2018 | 2020 | 2019 | 2018 | ||||||||||||||||||||||||||||||||||||||||||||||||
| U.S. | Int’l | U.S. | Int’l | U.S. | Int’l | ||||||||||||||||||||||||||||||||||||||||||||||||
| Discount rate | 3.40 | % | 1.65 | % | 4.40 | % | 2.56 | % | 3.70 | % | 2.39 | % | 4.31 | % | 5.04 | % | 4.33 | % | |||||||||||||||||||||||||||||||||||
| Rate of compensation increase | N/A | 2.33 | % | N/A | 2.34 | % | N/A | 2.39 | % | 4.00 | % | 4.00 | % | 4.00 | % | ||||||||||||||||||||||||||||||||||||||
| Expected rate of return on plan assets | 7.75 | % | 4.84 | % | 8.65 | % | 5.04 | % | 8.57 | % | 4.90 | % | N/A | N/A | N/A | ||||||||||||||||||||||||||||||||||||||
Our estimate of expected rate of return on plan assets is primarily based on the historical performance of plan assets, current market conditions, our asset allocation and long-term growth expectations.
Plan assets - We actively monitor how the duration and the expected yield of the group savingsinvestments are matching the expected cash outflows arising from the pension obligations. We have not changed the processes used to manage its risks from previous periods. Investments are well diversified, such that the failure of any single investment would not have a material impact on the overall level of assets. Our pension investment strategy emphasizes maximizing returns consistent with balancing risk. Excluding our international plans with insurance-based investments, 86% of our total pension plan assets represent the stock option strikeU.S. qualified plan and the U.K. plan. These plans are primarily invested in equity securities to maximize the long-term returns of the plans. The investment managers of these assets, including the hedge funds and limited partnerships, use Graham and Dodd fundamental investment analysis to select securities that have a margin of safety between the price to obtain shares, or (2) to sellof the shares immediately after having exercisedsecurity and the stock option (in this case, the employee does not pay the strike price but instead receives the intrinsicestimated value of the stock options in cash).security. This value-oriented approach tends to mitigate the risk of a large equity allocation.
The following summarizes significant rangesis a description of outstanding and exercisable options atthe valuation methodologies used for the pension plan assets. There have been no changes in the methodologies used as of December 31, 2018:2020 and 2019.
| Options Outstanding | Options Exercisable | ||||||||||||||
| Exercise Price Range | Number of options (in thousands) | Weighted average remaining life (in years) | Weighted average exercise price | Number of options (in thousands) | Weighted average exercise price | ||||||||||
| $24.00-$33.00 | 3,543.5 | 5.9 | $ | 27.80 | — | $ | — | ||||||||
| $45.00-$51.00 | 570.0 | 0.4 | $ | 48.12 | 570.0 | $ | 48.12 | ||||||||
| $55.00-$57.00 | 544.9 | 2.2 | $ | 56.82 | 544.9 | $ | 56.82 | ||||||||
| Total | 4,658.4 | 4.8 | $ | 33.67 | 1,114.9 | $ | 52.37 | ||||||||
•Equity securities are comprised of common stock and preferred stock. The fair values of equity securities are valued at the closing price reported on the active market on which the securities are traded.
•The fair values of hedge funds are valued using the NAV as determined by the administrator or custodian of the fund. The funds primarily invest in U.S. and international equities, debt securities and other expense werehedge funds.
•The fair values of limited partnerships are valued using the NAV as follows:
| Year Ended December 31, | |||||||||||
| (In millions) | 2018 | 2017 | 2016 | ||||||||
| Impairment expense | |||||||||||
| Subsea | $ | 1,784.2 | $ | 11.5 | $ | 23.0 | |||||
| Onshore/Offshore | — | — | 14.6 | ||||||||
| Surface Technologies | 4.5 | 10.2 | — | ||||||||
| Corporate and other | 3.9 | 12.6 | 0.6 | ||||||||
| Total impairment expense | 1,792.6 | 34.3 | 38.2 | ||||||||
| Restructuring and other expense | |||||||||||
| Subsea | $ | 17.7 | $ | 88.4 | $ | 58.7 | |||||
| Onshore/Offshore | (3.4 | ) | 27.0 | 214.4 | |||||||
| Surface Technologies | 9.3 | 9.0 | — | ||||||||
| Corporate and other | 15.0 | 32.8 | 31.7 | ||||||||
| Total restructuring and other expense | 38.6 | 157.2 | 304.8 | ||||||||
| Total impairment, restructuring and other expense | $ | 1,831.2 | $ | 191.5 | $ | 343.0 | |||||
133
•Real estate and other investments primarily consist of real estate investment trusts and other investments. These investments are measured at quoted market prices, which represent the use and eventual disposition over the asset’s remaining useful life. Our review of recoverabilityNAV of the carryingsecurities held in such funds at year end.
Our pension plan assets measured at fair value on a recurring basis are as follows as of our assets considers several assumptions including the intended useDecember 31, 2020 and service potential of the asset.2019. Refer to “Fair value measurements” in Note 221 to these consolidated financial statements for a discussiondescription of the method usedlevels.
| (In millions) | U.S. | International | |||||||||||||||||||||||||||||||||||||||||||||||||||||||||
| December 31, 2020 | Total | Level 1 | Level 2 | Level 3 | Net Asset Value (a) | Total | Level 1 | Level 2 | Level 3 | Net Asset Value (a) | |||||||||||||||||||||||||||||||||||||||||||||||||
| Cash and cash equivalents | $ | 38.1 | $ | 38.1 | $ | — | $ | — | $ | — | $ | 66.3 | $ | 66.3 | $ | — | $ | — | $ | — | |||||||||||||||||||||||||||||||||||||||
| Equity securities | |||||||||||||||||||||||||||||||||||||||||||||||||||||||||||
| U.S. companies | 83.3 | 83.3 | — | — | — | 96.3 | 96.3 | — | — | — | |||||||||||||||||||||||||||||||||||||||||||||||||
| International companies | 1.1 | 1.1 | — | — | — | 209.1 | 209.1 | — | — | — | |||||||||||||||||||||||||||||||||||||||||||||||||
| Registered investment companies | 38.4 | — | — | — | 38.4 | 68.2 | — | — | — | 68.2 | |||||||||||||||||||||||||||||||||||||||||||||||||
| Insurance contracts | — | — | — | — | — | 154.0 | — | 154.0 | — | — | |||||||||||||||||||||||||||||||||||||||||||||||||
| Hedge funds | 160.9 | — | — | — | 160.9 | 98.3 | — | — | — | 98.3 | |||||||||||||||||||||||||||||||||||||||||||||||||
| Limited partnerships | 160.9 | — | — | — | 160.9 | 14.5 | — | — | — | 14.5 | |||||||||||||||||||||||||||||||||||||||||||||||||
| Real estate and other investments | 1.0 | 1.0 | — | — | — | 39.5 | 39.5 | — | — | — | |||||||||||||||||||||||||||||||||||||||||||||||||
| Total assets | $ | 483.7 | $ | 123.5 | $ | — | $ | — | $ | 360.2 | $ | 746.2 | $ | 411.2 | $ | 154.0 | $ | — | $ | 181.0 | |||||||||||||||||||||||||||||||||||||||
| December 31, 2019 | |||||||||||||||||||||||||||||||||||||||||||||||||||||||||||
| Cash and cash equivalents | $ | 50.5 | $ | 50.5 | $ | — | $ | — | $ | — | $ | 10.0 | $ | 10.0 | $ | — | $ | — | $ | — | |||||||||||||||||||||||||||||||||||||||
| Equity securities | |||||||||||||||||||||||||||||||||||||||||||||||||||||||||||
| U.S. companies | 110.3 | 110.3 | — | — | — | 70.4 | 70.4 | — | — | — | |||||||||||||||||||||||||||||||||||||||||||||||||
| International companies | 5.4 | 5.4 | — | — | — | 251.5 | 251.5 | — | — | — | |||||||||||||||||||||||||||||||||||||||||||||||||
| Registered investment companies | 36.3 | — | — | — | 36.3 | 63.4 | — | — | — | 63.4 | |||||||||||||||||||||||||||||||||||||||||||||||||
| Common/collective trusts | 12.5 | — | — | — | 12.5 | — | — | — | — | — | |||||||||||||||||||||||||||||||||||||||||||||||||
| Insurance contracts | — | — | — | — | — | 138.5 | — | 138.5 | — | — | |||||||||||||||||||||||||||||||||||||||||||||||||
| Hedge funds | 164.3 | — | — | — | 164.3 | 82.0 | — | — | — | 82.0 | |||||||||||||||||||||||||||||||||||||||||||||||||
| Limited partnerships | 139.4 | — | — | — | 139.4 | 7.9 | — | — | — | 7.9 | |||||||||||||||||||||||||||||||||||||||||||||||||
| Real estate and other investments | 1.3 | 1.3 | — | — | — | 36.0 | 36.0 | — | — | — | |||||||||||||||||||||||||||||||||||||||||||||||||
| Total assets | $ | 520.0 | $ | 167.5 | $ | 0 | $ | 0 | $ | 352.5 | $ | 659.7 | $ | 367.9 | $ | 138.5 | $ | 0 | $ | 153.3 | |||||||||||||||||||||||||||||||||||||||
(a)Certain investments that are measured at fair value using net asset value per share (or its equivalent) have not been classified in the fair value hierarchy.
Contributions - We expect to determinecontribute approximately $20.7 million to our international pension plans, representing primarily the Netherlands qualified pension plans and U.K. qualified pension plans. We do not expect to make any contributions to our U.S. Qualified Pension Plan and our U.S. Non-Qualified Defined Benefit Pension Plan in 2021. All of the contributions are expected to be in the form of cash. In 2020 and 2019, we contributed $28.7 million and $6.9 million to all pension plans, respectively. Subsequent to the Spin-off, we expect to contribute approximately $18.9 million to our non-U.S. pension plans.
134
Estimated future benefit payments - The following table summarizes expected benefit payments from our various pension and post-retirement benefit plans through 2028. Actual benefit payments may differ from expected benefit payments.
| Pensions | Other Post-retirement Benefits | ||||||||||||||||
| (In millions) | U.S. | International | |||||||||||||||
| 2021 | $ | 47.6 | $ | 36.6 | $ | 0.6 | |||||||||||
| 2022 | 32.4 | 30.6 | 0.6 | ||||||||||||||
| 2023 | 31.0 | 32.8 | 0.6 | ||||||||||||||
| 2024 | 31.7 | 34.8 | 0.6 | ||||||||||||||
| 2025 | 31.9 | 34.8 | 0.6 | ||||||||||||||
| 2025-2029 | $ | 164.3 | $ | 198.3 | $ | 2.6 | |||||||||||
Savings plans - The TechnipFMC Retirement Savings Plan (“Qualified Plan”), a qualified salary reduction plan under Section 401(k) of the Internal Revenue Code, is a defined contribution plan. Additionally, we have a non-qualified deferred compensation plan, the Non-Qualified Plan, which allows certain highly compensated employees the option to defer the receipt of a portion of their salary. We match a portion of the participants’ deferrals to both plans. Both plans relate to FMC Technologies, Inc.
Participants in the Non-Qualified Plan earn a return based on hypothetical investments in the same options as our 401(k) plan. Changes in the market value of these participant investments are reflected as an adjustment to the deferred compensation liability with an offset to other income (expense), net. As of December 31, 2020 and 2019, our liability for the Non-Qualified Plan was $22.8 million and $26.3 million, respectively, and was recorded in other liabilities in our consolidated balance sheets. We hedge the financial impact of changes in the participants’ hypothetical investments by purchasing the investments that the participants have chosen. Changes in the fair value of these assets.
During the yearyears ended December 31, 2018,2020, and 2019 we recorded $1,784.2 millionrecognized expense of impairment charges in our Subsea segment. These charges included impairment of goodwill and vessels of $1,383.0$29.9 million and $372.9$34.0 million, respectively for matching contributions to these plans in 2020 and 2019, respectively.
NOTE 18. COMMITMENTS AND CONTINGENT LIABILITIES23. DERIVATIVE FINANCIAL INSTRUMENTS
| (In millions) | |||
| 2019 | $ | 329.8 | |
| 2020 | 286.1 | ||
| 2021 | 192.3 | ||
| 2022 | 123.8 | ||
| 2023 | 102.1 | ||
| Thereafter | 485.6 | ||
| Total | 1,519.7 | ||
| Less income from sub-leases | 25.6 | ||
| Net minimum operating lease payments | $ | 1,494.1 | |
Generally, we enter into standby lettershedging relationships such that changes in the fair values or cash flows of credit, performance bonds, surety bondsthe transactions being hedged are expected to be offset by corresponding changes in the fair value of the derivatives. For derivative instruments that qualify as a cash flow hedge, the effective portion of the gain or loss of the derivative, which does not include the time value component of a forward currency rate, is reported as a component of other comprehensive income (“OCI”) and other guarantees with financial institutions forreclassified into earnings in the benefitsame period or periods during which the hedged transaction affects earnings. For derivative instruments not designated as hedging instruments, any change in the fair value of our customers, vendors and other parties.those instruments is reflected in earnings in the period such change occurs.
We hold the following types of derivative instruments:
Foreign exchange rate forward contracts – The majoritypurpose of these financial instruments expire within five years. Management does not expect anyis to hedge the risk of these financial instruments to resultchanges in losses that, if incurred, would have a material adverse effect on our consolidated financial position, resultsfuture cash flows of operationsanticipated purchase or cash flows.
| (In millions) | December 31, 2018 | ||
Financial guarantees (a) | $ | 750.4 | |
Performance guarantees (b) | 4,047.6 | ||
| Maximum potential undiscounted payments | $ | 4,798.0 | |
| Year Ended December 31, | |||||||||||
| (In millions) | 2018 | 2017 | 2016 | ||||||||
| United States | $ | (197.0 | ) | $ | 284.3 | $ | 154.3 | ||||
| Outside United States | $ | (1,291.1 | ) | $ | 395.4 | $ | 397.1 | ||||
| Income (loss) before income taxes | $ | (1,488.1 | ) | $ | 679.7 | $ | 551.4 | ||||
| Year Ended December 31, | |||||||||||
| (In millions) | 2018 | 2017 | 2016 | ||||||||
| Current | |||||||||||
| United States | $ | 52.1 | $ | 30.2 | $ | 54.1 | |||||
| Outside United States | 321.8 | 373.7 | 298.3 | ||||||||
| Total current | 373.9 | 403.9 | 352.4 | ||||||||
| Deferred | |||||||||||
| United States | 19.5 | 71.4 | (7.2 | ) | |||||||
| Outside United States | 29.3 | 70.2 | (164.9 | ) | |||||||
| Total deferred | 48.8 | 141.6 | (172.1 | ) | |||||||
| Provision for income taxes | $ | 422.7 | $ | 545.5 | $ | 180.3 | |||||
| December 31, | |||||||
| (In millions) | 2018 | 2017 | |||||
| Deferred tax assets attributable to | |||||||
| Accrued expenses | $ | 128.0 | $ | 155.2 | |||
| Capital Loss | 21.2 | — | |||||
| Non-deductible interest | 89.3 | 85.9 | |||||
| Foreign tax credit carryforwards | 105.9 | 34.9 | |||||
| Net operating loss carryforwards | 382.8 | 390.7 | |||||
| Inventories | 3.2 | 13.4 | |||||
| Research and development credit | 6.5 | 7.5 | |||||
| Foreign exchange | 32.5 | — | |||||
| Provisions for pensions and other long-term employee benefits | 72.4 | 86.4 | |||||
| Contingencies related to contracts | 83.7 | 111.3 | |||||
| Other contingencies | 28.7 | 33.5 | |||||
| Fair value losses/gains | — | 12.4 | |||||
| Margin recognition on construction contracts | 34.4 | — | |||||
| Other | 15.2 | 11.1 | |||||
| Deferred tax assets | 1,003.8 | 942.3 | |||||
| Valuation allowance | (683.4 | ) | (430.0 | ) | |||
| Deferred tax assets, net of valuation allowance | 320.4 | 512.3 | |||||
| Deferred tax liabilities attributable to | |||||||
| Revenue in excess of billings on contracts accounted for under the percentage of completion method | 9.2 | 41.2 | |||||
| U.S. tax on foreign subsidiaries’ undistributed earnings not indefinitely reinvested | 9.4 | 4.9 | |||||
| Foreign exchange | — | 21.5 | |||||
| Property, plant and equipment, intangibles and other assets | 278.6 | 403.3 | |||||
| Margin recognition on construction contracts | — | 6.4 | |||||
| Deferred tax liabilities | 297.2 | 477.3 | |||||
| Net deferred tax assets/(liabilities) | $ | 23.2 | $ | 35.0 | |||
135
| Net Notional Amount Bought (Sold) | |||||||||||
| (In millions) | USD Equivalent | ||||||||||
| Euro | 1,794.5 | 2,201.8 | |||||||||
| British pound | 771.7 | 1,054.3 | |||||||||
| Malaysian ringgit | 891.0 | 221.5 | |||||||||
| Norwegian krone | 1,721.6 | 201.7 | |||||||||
| Brazilian real | 681.4 | 131.1 | |||||||||
| Singapore dollar | 171.2 | 129.4 | |||||||||
| Mexican peso | 1,288.0 | 64.7 | |||||||||
| Australian dollar | 78.2 | 60.3 | |||||||||
| Indian rupee | 3,172.0 | 43.4 | |||||||||
| Japanese yen | 1,124.4 | 10.9 | |||||||||
| Columbian peso | 37,142.2 | 10.8 | |||||||||
| Hong Kong dollar | (97.6) | (12.6) | |||||||||
| Indonesian rupiah | (201,679.7) | (14.3) | |||||||||
| U.S. dollar | (2,922.1) | (2,922.1) | |||||||||
Foreign exchange rate instruments embedded in purchase and sale contracts – The purpose of these instruments is to match offsetting currency payments and receipts for particular projects, or comply with government restrictions on the currency used to purchase goods in certain countries. As of December 31, 2020, our portfolio of these instruments included tax benefits related tothe following material net operating loss carryforwards. Ifpositions:
| Net Notional Amount Bought (Sold) | |||||||||||
| (In millions) | USD Equivalent | ||||||||||
| Brazilian real | 77.9 | 15.0 | |||||||||
| Hong Kong dollar | 48.3 | 6.2 | |||||||||
| Euro | (8.7) | (10.7) | |||||||||
| Norwegian krone | (142.8) | (16.7) | |||||||||
| U.S. dollar | 5.2 | 5.2 | |||||||||
Fair value amounts for all outstanding derivative instruments have been determined using available market information and commonly accepted valuation methodologies. See Note 24 for further details. Accordingly, the estimates presented may not utilized, these net operating loss carryforwards will begin to expire in 2019. Management believes it is more likely than notbe indicative of the amounts that we willwould realize in a current market exchange and may not be able to utilize certain of these operating loss carryforwards before expiration; therefore, we have established a valuation allowance against the related deferred tax assets.
136
The following table presents a summarythe location and fair value amounts of changesderivative instruments reported in our unrecognizedthe consolidated balance sheets:
| December 31, 2020 | December 31, 2019 | ||||||||||||||||||||||
| (In millions) | Assets | Liabilities | Assets | Liabilities | |||||||||||||||||||
| Derivatives designated as hedging instruments | |||||||||||||||||||||||
| Foreign exchange contracts | |||||||||||||||||||||||
| Current - Derivative financial instruments | $ | 215.8 | $ | 151.6 | $ | 94.3 | $ | 125.0 | |||||||||||||||
| Long-term - Derivative financial instruments | 35.6 | 23.3 | 34.8 | 48.0 | |||||||||||||||||||
| Total derivatives designated as hedging instruments | 251.4 | 174.9 | 129.1 | 173.0 | |||||||||||||||||||
| Derivatives not designated as hedging instruments | |||||||||||||||||||||||
| Foreign exchange contracts | |||||||||||||||||||||||
| Current - Derivative financial instruments | 85.6 | 15.6 | 7.6 | 16.3 | |||||||||||||||||||
| Long-term - Derivative financial instruments | 0.3 | 0 | 0.4 | 0.4 | |||||||||||||||||||
| Total derivatives not designated as hedging instruments | 85.9 | 15.6 | 8.0 | 16.7 | |||||||||||||||||||
| Long-term - Derivative financial instruments - Synthetic Bonds - Call Option Premium | 0 | — | 4.3 | — | |||||||||||||||||||
| Long-term - Derivative financial instruments - Synthetic Bonds - Embedded Derivatives | — | 0 | — | 4.3 | |||||||||||||||||||
| Total derivatives | $ | 337.3 | $ | 190.5 | $ | 141.4 | $ | 194.0 | |||||||||||||||
Cash flow hedges of forecasted transactions, net of tax, benefits:
| (In millions) | Federal, State and Foreign Tax | ||
| Balance as of December 31, 2016 | $ | 16.6 | |
| Reductions for tax positions related to prior years | (13.6 | ) | |
| Additions for tax positions related to current year | 39.5 | ||
| Reductions for tax positions due to settlements | (0.2 | ) | |
| Additions for tax positions related to purchase accounting | 48.1 | ||
| Balance as of December 31, 2017 | $ | 90.4 | |
| Reductions for tax positions related to prior years | (11.5 | ) | |
| Additions for tax positions related to current year | 21.1 | ||
| Reductions for tax positions due to settlements | (9.0 | ) | |
| Balance as of December 31, 2018 | $ | 91.0 | |
| Year Ended December 31, | ||||||||
| 2018 | 2017 | 2016 | ||||||
| Statutory income tax rate | 19.0 | % | 19.3 | % | 34.4 | % | ||
| Net difference resulting from | ||||||||
| Foreign earnings subject to different tax rates | (9.7 | )% | 18.2 | % | (18.5 | )% | ||
| Net change in unrecognized tax benefits | (0.7 | )% | 4.3 | % | 3.0 | % | ||
| Adjustments on prior year taxes | (0.7 | )% | (4.4 | )% | 2.4 | % | ||
| Change in valuation allowance | (14.4 | )% | 19.3 | % | 13.1 | % | ||
| Deferred tax asset/liability revaluation for tax rate change | (1.7 | )% | 1.4 | % | (0.8 | )% | ||
| U.S. transition tax | (0.8 | )% | 17.1 | % | — | % | ||
| Impairments | (16.5 | )% | — | % | — | % | ||
| Non-deductible legal provision | (3.8 | )% | — | % | — | % | ||
| Other | 0.9 | % | 5.1 | % | (0.9 | )% | ||
| Effective income tax rate | (28.4 | )% | 80.3 | % | 32.7 | % | ||
The cumulative balancefollowing tables present the location of these undistributed earnings was approximately $2.9 billion as of December 31, 2017.
| Gain (Loss) Recognized in OCI | |||||||||||||||||
| Year Ended December 31, | |||||||||||||||||
| (In millions) | 2020 | 2019 | 2018 | ||||||||||||||
| Foreign exchange contracts | $ | 28.0 | $ | 10.3 | $ | (75.4) | |||||||||||
The following represents the company’s liabilityeffect of cash flow hedge accounting on such earnings.
| Year Ended December 31, | |||||||||||||||||||||||||||||||||||||||||||||||||||||||||||||||||||||||
| (In millions) | 2020 | 2019 | 2018 | ||||||||||||||||||||||||||||||||||||||||||||||||||||||||||||||||||||
| Total amount of income (expense) presented in the consolidated statements of income associated with hedges and derivatives | Revenue | Cost of sales | Selling, general and administrative expense | Other income (expense), net | Revenue | Cost of sales | Selling, general and administrative expense | Other income (expense), net | Revenue | Cost of sales | Selling, general and administrative expense | Other income (expense), net | |||||||||||||||||||||||||||||||||||||||||||||||||||||||||||
| Cash Flow hedge gain (loss) recognized in income | |||||||||||||||||||||||||||||||||||||||||||||||||||||||||||||||||||||||
| Foreign Exchange Contracts | |||||||||||||||||||||||||||||||||||||||||||||||||||||||||||||||||||||||
| Amounts reclassified from accumulated OCI to income (loss) | $ | (83.7) | $ | 68.5 | $ | (0.4) | $ | (4.4) | $ | (26.6) | $ | 12.0 | $ | — | $ | (9.1) | $ | (2.4) | $ | 3.4 | $ | (0.1) | $ | 1.0 | |||||||||||||||||||||||||||||||||||||||||||||||
| Amounts excluded from effectiveness testing | 7.7 | (9.8) | (0.2) | 34.2 | 0.6 | (7.6) | 0 | (34.9) | (2.2) | (4.8) | 0 | (12.3) | |||||||||||||||||||||||||||||||||||||||||||||||||||||||||||
| Total cash flow hedge gain (loss) recognized in income | (76.0) | 58.7 | (0.6) | 29.8 | (26.0) | 4.4 | — | (44.0) | (4.6) | (1.4) | (0.1) | (11.3) | |||||||||||||||||||||||||||||||||||||||||||||||||||||||||||
| Gain (loss) recognized in income on derivatives not designated as hedging instruments | (0.8) | 3.4 | 0 | 22.7 | (1.6) | 0.2 | 0 | (10.2) | (1.7) | 0.2 | 0 | (11.4) | |||||||||||||||||||||||||||||||||||||||||||||||||||||||||||
| Total | $ | (76.8) | $ | 62.1 | $ | (0.6) | $ | 52.5 | $ | (27.6) | $ | 4.6 | $ | — | $ | (54.2) | $ | (6.3) | $ | (1.2) | $ | (0.1) | $ | (22.7) | |||||||||||||||||||||||||||||||||||||||||||||||
137
Balance Sheet Offsetting - We execute derivative contracts with counterparties that consent to a diluted basis.
| Pensions | Other Post-retirement Benefits | ||||||||||||||||||||||
| 2018 | 2017 | 2018 | 2017 | ||||||||||||||||||||
| (In millions) | U.S. | Int’l | U.S. | Int’l | |||||||||||||||||||
| Accumulated benefit obligation | $ | 598.1 | $ | 664.3 | $ | 659.8 | $ | 769.9 | |||||||||||||||
| Projected benefit obligation at January 1 | $ | 659.8 | $ | 898.1 | $ | — | $ | 399.6 | $ | 10.0 | $ | 0.9 | |||||||||||
| Service cost | 0.2 | 21.2 | 10.3 | 21.0 | — | — | |||||||||||||||||
| Interest cost | 23.8 | 20.9 | 26.7 | 19.6 | 0.4 | 0.3 | |||||||||||||||||
| Actuarial (gain) loss | (47.9 | ) | (40.0 | ) | 56.2 | (13.5 | ) | (0.2 | ) | 0.8 | |||||||||||||
| Amendments | 0.3 | 2.7 | 0.2 | — | 0.1 | — | |||||||||||||||||
| Curtailments | — | (4.0 | ) | (67.9 | ) | (2.8 | ) | — | — | ||||||||||||||
| Settlements | (5.3 | ) | (89.0 | ) | — | (13.5 | ) | (0.1 | ) | — | |||||||||||||
| Foreign currency exchange rate changes | — | (25.7 | ) | — | 68.9 | — | — | ||||||||||||||||
| Plan participants’ contributions | — | 1.2 | — | 1.4 | — | — | |||||||||||||||||
| Benefits paid | (32.8 | ) | (31.7 | ) | (27.5 | ) | (27.6 | ) | (0.5 | ) | (0.6 | ) | |||||||||||
| Acquisition/Business Combination/Divestiture | — | — | 661.9 | 432.3 | — | 7.7 | |||||||||||||||||
| Other | — | (0.3 | ) | (0.1 | ) | 12.7 | (0.2 | ) | 0.9 | ||||||||||||||
| Projected benefit obligation at December 31 | 598.1 | 753.4 | 659.8 | 898.1 | 9.5 | 10.0 | |||||||||||||||||
| Fair value of plan assets at January 1 | 576.4 | 699.2 | — | 229.7 | — | — | |||||||||||||||||
| Actual return on plan assets | (70.7 | ) | (16.0 | ) | 60.4 | 63.3 | — | — | |||||||||||||||
| Company contributions | — | 18.5 | — | 19.1 | — | — | |||||||||||||||||
| Foreign currency exchange rate changes | — | (20.9 | ) | — | 50.4 | — | — | ||||||||||||||||
| Settlements | — | (87.6 | ) | — | (7.0 | ) | — | — | |||||||||||||||
| Plan participants’ contributions | — | 1.2 | — | 1.4 | — | — | |||||||||||||||||
| Benefits paid | (28.3 | ) | (23.3 | ) | (24.8 | ) | (21.5 | ) | — | — | |||||||||||||
| Acquisition/Business Combination/Divestiture | — | — | 540.8 | 361.4 | — | — | |||||||||||||||||
| Other | — | (0.5 | ) | — | 2.4 | — | — | ||||||||||||||||
| Fair value of plan assets at December 31 | 477.4 | 570.6 | 576.4 | 699.2 | — | — | |||||||||||||||||
| Funded status of the plans (liability) at December 31 | $ | (120.7 | ) | $ | (182.8 | ) | $ | (83.4 | ) | $ | (198.9 | ) | $ | (9.5 | ) | $ | (10.0 | ) | |||||
| Pensions | Other Post-retirement Benefits | ||||||||||||||||||||||
| 2018 | 2017 | 2018 | 2017 | ||||||||||||||||||||
| (In millions) | U.S. | Int’l | U.S. | Int’l | |||||||||||||||||||
| Current portion of accrued pension and other post-retirement benefits | $ | (5.5 | ) | $ | (7.9 | ) | $ | (5.4 | ) | $ | (4.1 | ) | $ | (0.7 | ) | $ | (0.7 | ) | |||||
| Accrued pension and other post-retirement benefits, net of current portion | (115.2 | ) | (174.9 | ) | (78.0 | ) | (194.8 | ) | (8.8 | ) | (9.3 | ) | |||||||||||
| Funded status recognized in the consolidated balance sheets at December 31 | $ | (120.7 | ) | $ | (182.8 | ) | $ | (83.4 | ) | $ | (198.9 | ) | $ | (9.5 | ) | $ | (10.0 | ) | |||||
| Pensions | Other Post-retirement Benefits | ||||||||||||||||||||||
| 2018 | 2017 | 2018 | 2017 | ||||||||||||||||||||
| (In millions) | U.S. | Int’l | U.S. | Int’l | |||||||||||||||||||
| Pre-tax amounts recognized in accumulated other comprehensive (income) loss | |||||||||||||||||||||||
| Unrecognized actuarial (gain) loss | $ | 73.2 | $ | 43.7 | $ | 0.1 | $ | 21.2 | $ | 0.6 | $ | 0.8 | |||||||||||
| Unrecognized prior service (credit) cost | — | 7.0 | 0.2 | 5.5 | — | — | |||||||||||||||||
| Accumulated other comprehensive (income) loss at December 31 | $ | 73.2 | $ | 50.7 | $ | 0.3 | $ | 26.7 | $ | 0.6 | $ | 0.8 | |||||||||||
collateralized derivative contracts. The following tables summarize the projectedpresent both gross information and accumulated benefit obligationsnet information of recognized derivative instruments:
| December 31, 2020 | December 31, 2019 | ||||||||||||||||||||||||||||||||||
| (In millions) | Gross Amount Recognized | Gross Amounts Not Offset Permitted Under Master Netting Agreements | Net Amount | Gross Amount Recognized | Gross Amounts Not Offset Permitted Under Master Netting Agreements | Net Amount | |||||||||||||||||||||||||||||
| Derivative assets | $ | 337.3 | $ | (134.0) | $ | 203.3 | $ | 141.4 | $ | (112.5) | $ | 28.9 | |||||||||||||||||||||||
| Derivative liabilities | $ | 190.5 | $ | (134.0) | $ | 56.5 | $ | 194.0 | $ | (112.5) | $ | 81.5 | |||||||||||||||||||||||
NOTE 24. FAIR VALUE MEASUREMENTS
Recurring Fair Value Measurements
Assets and fair values of plan assets where the projected or accumulated benefit obligation exceeds the fair value of plan assets at December 31, 2018 and 2017:
| Pensions | Other Post-retirement Benefits | ||||||||||||||||||||||
| 2018 | 2017 | 2018 | 2017 | ||||||||||||||||||||
| (In millions) | U.S. | Int’l | U.S. | Int’l | |||||||||||||||||||
| Plans with underfunded or non-funded projected benefit obligation | |||||||||||||||||||||||
| Aggregate projected benefit obligation | $ | 598.1 | $ | 621.1 | $ | 659.8 | $ | 744.3 | $ | 9.5 | $ | 9.9 | |||||||||||
| Aggregate fair value of plan assets | $ | 477.4 | $ | 439.8 | $ | 576.4 | $ | 558.0 | $ | — | $ | — | |||||||||||
| Pensions | Other Post-retirement Benefits | ||||||||||||||||||||||
| 2018 | 2017 | 2018 | 2017 | ||||||||||||||||||||
| (In millions) | U.S. | Int’l | U.S. | Int’l | |||||||||||||||||||
| Plans with underfunded or non-funded accumulated benefit obligation | |||||||||||||||||||||||
| Aggregate accumulated benefit obligation | $ | 598.1 | $ | 269.2 | $ | 659.8 | $ | 212.5 | $ | — | $ | — | |||||||||||
| Aggregate fair value of plan assets | $ | 477.4 | $ | 126.6 | $ | 576.4 | $ | 82.2 | $ | — | $ | — | |||||||||||
| Pensions | Other Post-retirement Benefits | ||||||||||||||||||||||||||||||||||
| 2018 | 2017 | 2016 | 2018 | 2017 | 2016 | ||||||||||||||||||||||||||||||
| (In millions) | U.S. | Int’l | U.S. | Int’l | U.S. | Int’l | |||||||||||||||||||||||||||||
| Components of net periodic benefit cost (income) | |||||||||||||||||||||||||||||||||||
| Service cost | $ | 0.2 | $ | 21.2 | $ | 10.3 | $ | 21.0 | $ | — | $ | 11.7 | $ | — | $ | — | $ | — | |||||||||||||||||
| Interest cost | 23.8 | 20.9 | 26.7 | 19.6 | — | 10.9 | 0.4 | 0.3 | — | ||||||||||||||||||||||||||
| Expected return on plan assets | (50.1 | ) | (41.2 | ) | (45.5 | ) | (36.3 | ) | — | (8.2 | ) | — | — | — | |||||||||||||||||||||
| Settlement cost | 0.4 | 0.4 | — | 1.5 | — | — | — | — | — | ||||||||||||||||||||||||||
| Curtailment benefit | — | (3.8 | ) | (26.8 | ) | — | — | (10.7 | ) | — | — | — | |||||||||||||||||||||||
| Amortization of net actuarial loss (gain) | — | 0.6 | — | 2.5 | — | 1.0 | — | — | — | ||||||||||||||||||||||||||
| Amortization of prior service cost (credit) | — | 1.3 | — | 1.0 | — | 0.7 | — | — | — | ||||||||||||||||||||||||||
| Net periodic benefit cost (income) | $ | (25.7 | ) | $ | (0.6 | ) | $ | (35.3 | ) | $ | 9.3 | $ | — | $ | 5.4 | $ | 0.4 | $ | 0.3 | $ | — | ||||||||||||||
| Pensions | Other Post-retirement Benefits | ||||||||||||||||||||||||||||||||||
| 2018 | 2017 | 2016 | 2018 | 2017 | 2016 | ||||||||||||||||||||||||||||||
| (In millions) | U.S. | Int’l | U.S. | Int’l | U.S. | Int’l | |||||||||||||||||||||||||||||
| Changes in plan assets and benefit obligations recognized in other comprehensive income (loss) | |||||||||||||||||||||||||||||||||||
| Net actuarial gain (loss) arising during period | $ | (73.5 | ) | $ | (15.3 | ) | $ | 26.7 | $ | 43.3 | $ | — | $ | (10.5 | ) | $ | — | $ | (0.8 | ) | $ | — | |||||||||||||
| Prior service (cost) credit arising during period | 0.2 | (2.7 | ) | (0.2 | ) | 0.1 | — | 0.1 | — | — | — | ||||||||||||||||||||||||
| Settlements and curtailments | 0.4 | (3.4 | ) | (26.8 | ) | 1.5 | — | (10.7 | ) | — | — | — | |||||||||||||||||||||||
| Amortization of net actuarial loss (gain) | — | 0.6 | — | 2.5 | — | 1.0 | — | — | — | ||||||||||||||||||||||||||
| Amortization of prior service cost (credit) | — | 1.3 | — | 1.0 | — | 0.7 | — | — | — | ||||||||||||||||||||||||||
| Other | — | 1.4 | — | (5.1 | ) | — | 17.6 | (0.1 | ) | — | — | ||||||||||||||||||||||||
| Total recognized in other comprehensive income (loss) | $ | (72.9 | ) | $ | (18.1 | ) | $ | (0.3 | ) | $ | 43.3 | $ | — | $ | (1.8 | ) | $ | (0.1 | ) | $ | (0.8 | ) | $ | — | |||||||||||
| Pensions | Other Post-retirement Benefits | ||||||||||
| (In millions) | U.S. | Int’l | |||||||||
| Net actuarial losses (gains) | $ | 1.8 | $ | 0.9 | $ | — | |||||
| Prior service cost (credit) | $ | — | $ | 1.2 | $ | — | |||||
| Pensions | Other Post-retirement Benefits | ||||||||||||||||
| 2018 | 2017 | 2018 | 2017 | ||||||||||||||
| U.S. | Int’l | U.S. | Int’l | ||||||||||||||
| Discount rate | 4.40 | % | 2.54 | % | 3.70 | % | 2.42 | % | 5.04 | % | 4.33 | % | |||||
| Rate of compensation increase | N/A | 2.24 | % | N/A | 2.37 | % | 4.00 | % | 4.00 | % | |||||||
| Pensions | Other Post-retirement Benefits | ||||||||||||||||||||||||
| 2018 | 2017 | 2016 | 2018 | 2017 | 2016 | ||||||||||||||||||||
| U.S. | Int’l | U.S. | Int’l | U.S. | Int’l | ||||||||||||||||||||
| Discount rate | 3.70 | % | 2.39 | % | 4.30 | % | 2.37 | % | N/A | 2.80 | % | 4.33 | % | 4.05 | % | 2.20 | % | ||||||||
| Rate of compensation increase | N/A | 2.39 | % | 4.00 | % | 2.39 | % | N/A | 2.30 | % | 4.00 | % | 4.00 | % | 3.00 | % | |||||||||
| Expected rate of return on plan assets | 8.57 | % | 4.90 | % | 9.00 | % | 6.24 | % | N/A | 2.80 | % | N/A | N/A | N/A | |||||||||||
| December 31, 2020 | December 31, 2019 | ||||||||||||||||||||||||||||||||||||||||||||||
| (In millions) | Total | Level 1 | Level 2 | Level 3 | Total | Level 1 | Level 2 | Level 3 | |||||||||||||||||||||||||||||||||||||||
| Assets | |||||||||||||||||||||||||||||||||||||||||||||||
| Investments | |||||||||||||||||||||||||||||||||||||||||||||||
Equity securities(a) | $ | 65.6 | $ | 65.6 | $ | — | $ | — | $ | 54.8 | $ | 54.8 | $ | 0 | $ | — | |||||||||||||||||||||||||||||||
| Money market fund | 1.7 | — | 1.7 | — | 1.5 | — | 1.5 | — | |||||||||||||||||||||||||||||||||||||||
Stable value fund(b) | 0.9 | — | — | — | 2.1 | — | — | — | |||||||||||||||||||||||||||||||||||||||
| Held-to-maturity debt securities | 24.2 | — | 24.2 | — | 71.9 | 0 | 71.9 | 0 | |||||||||||||||||||||||||||||||||||||||
| Derivative financial instruments | |||||||||||||||||||||||||||||||||||||||||||||||
| Synthetic bonds - call option premium | — | — | — | — | 4.3 | — | 4.3 | — | |||||||||||||||||||||||||||||||||||||||
| Foreign exchange contracts | 337.3 | — | 337.3 | — | 137.1 | — | 137.1 | — | |||||||||||||||||||||||||||||||||||||||
| Assets held for sale | 47.3 | — | — | 47.3 | 25.8 | — | — | 25.8 | |||||||||||||||||||||||||||||||||||||||
| Total assets | $ | 477.0 | $ | 65.6 | $ | 363.2 | $ | 47.3 | $ | 297.5 | $ | 54.8 | $ | 214.8 | $ | 25.8 | |||||||||||||||||||||||||||||||
| Liabilities | |||||||||||||||||||||||||||||||||||||||||||||||
| Redeemable financial liability | $ | 246.6 | $ | — | $ | — | $ | 246.6 | $ | 268.8 | $ | — | $ | — | $ | 268.8 | |||||||||||||||||||||||||||||||
| Derivative financial instruments | |||||||||||||||||||||||||||||||||||||||||||||||
| Synthetic bonds - embedded derivatives | — | 0 | — | — | 4.3 | — | 4.3 | — | |||||||||||||||||||||||||||||||||||||||
| Foreign exchange contracts | 190.5 | — | 190.5 | — | 189.7 | — | 189.7 | — | |||||||||||||||||||||||||||||||||||||||
| Liabilities held for sale | — | — | — | — | 9.3 | — | — | 9.3 | |||||||||||||||||||||||||||||||||||||||
| Total liabilities | $ | 437.1 | $ | — | $ | 190.5 | $ | 246.6 | $ | 472.1 | $ | — | $ | 194.0 | $ | 278.1 | |||||||||||||||||||||||||||||||
(a)Includes fixed income and other investments measured at fair value.
(b)Certain investments that are measured at fair value using net asset value per share (or its equivalent) have not been classified in the fair value hierarchy.
Equity securities and Available-for-sale Securities - The fair value measurement of our traded securities and Available-for-sale-Securities is based on quoted prices that we have the ability to access in public markets.
Stable value fund and Money market fund - Stable value fund and money market fund are valued at the net asset value of the shares held at the end of the quarter, which is based on the fair value of the underlying investments using information reported by our investment advisor at quarter-end.
Held-to-maturity debt securities - Held-to-maturity debt securities consist of government bonds. These investments are stated at amortized cost, which approximates fair value.
138
Assets and liabilities held for sale - The fair value of our assets and liabilities held for sale was determined using a market approach that took into consideration the expected sales price.
Mandatorily redeemable financial liability - We have a mandatorily redeemable financial liability which is recorded at its fair value. The mandatorily redeemable financial liability relates to our voting control interests in legal Technip Energies contract entities which own and account for the design, engineering and construction of the Yamal LNG plant. The fair value is determined using a discounted cash flow model. The key assumptions used in applying the income approach are the selected discount rates and the expected dividends to be distributed in the future to the non-controlling interest holders. Expected dividends to be distributed are based on the non-controlling interests’ share of the expected profitability of the underlying contract, a 15.0% discount rate and the overall timing of completion of the project.
A mandatorily redeemable financial liability of $246.6 million, $268.8 million and $408.5 million was recognized as follows atof December 31, 2020, 2019 and 2018, and 2017. Referrespectively, to “Fairaccount for the fair value measurements” in Note 1 to these consolidated financial statements for a description of the levels.
| (In millions) | U.S. | International | |||||||||||||||||||||||||||||
| December 31, 2018 | Total | Level 1 | Level 2 | Level 3 | Total | Level 1 | Level 2 | Level 3 | |||||||||||||||||||||||
| Cash and cash equivalents | $ | 46.8 | $ | 46.8 | $ | — | $ | — | $ | 11.1 | $ | 11.1 | $ | — | $ | — | |||||||||||||||
| Equity securities | |||||||||||||||||||||||||||||||
| U.S. companies | 109.4 | 109.4 | — | — | 92.2 | 92.2 | — | — | |||||||||||||||||||||||
| International companies | 8.5 | 8.5 | — | — | 186.8 | 186.8 | — | — | |||||||||||||||||||||||
Registered investment companies (a) | 32.6 | — | — | — | 44.4 | — | — | — | |||||||||||||||||||||||
Common/collective trusts (a) | 11.7 | — | — | — | 10.0 | — | — | — | |||||||||||||||||||||||
| Insurance contracts | — | — | — | — | 125.0 | — | 125.0 | — | |||||||||||||||||||||||
Hedge funds (a) | 176.5 | — | — | — | 99.1 | — | — | — | |||||||||||||||||||||||
Limited partnerships (a) | 89.7 | — | — | — | — | — | — | — | |||||||||||||||||||||||
| Real estate and other investments | 2.2 | 2.2 | — | — | 1.2 | 1.2 | — | — | |||||||||||||||||||||||
| Total assets | $ | 477.4 | $ | 166.9 | $ | — | $ | — | $ | 569.8 | $ | 291.3 | $ | 125.0 | $ | — | |||||||||||||||
| December 31, 2017 | |||||||||||||||||||||||||||||||
| Cash and cash equivalents | $ | 41.2 | $ | 41.2 | $ | — | $ | — | $ | 4.8 | $ | 4.8 | $ | — | $ | — | |||||||||||||||
| Equity securities | |||||||||||||||||||||||||||||||
| U.S. companies | 131.7 | 131.7 | — | — | 106.9 | 106.9 | — | — | |||||||||||||||||||||||
| International companies | 33.7 | 33.7 | — | — | 216.7 | 216.7 | — | — | |||||||||||||||||||||||
Registered investment companies (a) | 33.6 | — | — | — | 72.6 | — | — | — | |||||||||||||||||||||||
Common/collective trusts (a) | 31.2 | — | — | — | 13.0 | — | — | — | |||||||||||||||||||||||
| Insurance contracts | — | — | — | — | 208.2 | — | 208.2 | — | |||||||||||||||||||||||
Hedge funds (a) | 194.3 | — | — | — | 74.7 | — | — | — | |||||||||||||||||||||||
Limited partnerships (a) | 109.7 | — | — | — | — | — | — | — | |||||||||||||||||||||||
| Real estate and other investments | 0.8 | 0.8 | — | — | 1.5 | 1.5 | — | — | |||||||||||||||||||||||
| Total assets | $ | 576.2 | $ | 207.4 | $ | — | $ | — | $ | 698.4 | $ | 329.9 | $ | 208.2 | $ | — | |||||||||||||||
| Pensions | Other Post-retirement Benefits | ||||||||||
| (In millions) | U.S. | International | |||||||||
| 2019 | $ | 34.9 | $ | 28.3 | $ | 0.7 | |||||
| 2020 | $ | 35.2 | $ | 30.4 | $ | 0.7 | |||||
| 2021 | $ | 35.7 | $ | 31.8 | $ | 0.7 | |||||
| 2022 | $ | 35.1 | $ | 32.0 | $ | 0.6 | |||||
| 2023 | $ | 33.7 | $ | 33.8 | $ | 0.6 | |||||
| 2024-2028 | $ | 175.8 | $ | 189.3 | $ | 2.7 | |||||
Change in the fair value of these investments are recognizedour Level 3 mandatorily redeemable financial liability is recorded as an offsetinterest expense on the consolidated statements of income and was as follows:
| Year Ended December 31, | ||||||||||||||||||||
| (In millions) | 2020 | 2019 | 2018 | |||||||||||||||||
| Balance at beginning of period | $ | 268.8 | $ | 408.5 | $ | 312.0 | ||||||||||||||
| Less: Expenses recognized in net interest expense | (202.0) | (423.1) | (322.3) | |||||||||||||||||
| Less: Settlements | 224.2 | 562.8 | 225.8 | |||||||||||||||||
| Balance at end of period | $ | 246.6 | $ | 268.8 | $ | 408.5 | ||||||||||||||
Redeemable non-controlling interest - We own a 51% share in Island Offshore Subsea AS that was subsequently renamed to other income (expense), net.TIOS AS. The non-controlling interest is recorded as mezzanine equity at fair value.The fair value measurement is based upon significant unobservable inputs not observable in the market and is consequently classified as a Level 3 fair value measurement. As of December 31, 20182020 and 2017, we had investments2019, the fair value of our redeemable non-controlling interest was $43.7 million and $41.1 million, respectively. See Note 2 for further details.
Derivative financial instruments - We use the income approach as the valuation technique to measure the fair value of foreign currency derivative instruments on a recurring basis. This approach calculates the present value of the future cash flow by measuring the change from the derivative contract rate and the published market indicative currency rate, multiplied by the contract notional values. Credit risk is then incorporated by reducing the derivative’s fair value in asset positions by the result of multiplying the present value of the portfolio by the counterparty’s published credit spread. Portfolios in a liability position are adjusted by the same calculation; however, a spread representing our credit spread is used. Our credit spread, and the credit spread of other counterparties not publicly available, are approximated by using the spread of similar companies in the same industry, of similar size and with the same credit rating. We have no credit-risk-related contingent features in our agreements with the financial institutions that would require us to post collateral for derivative positions in a liability position. See Note 23 for further details.
Nonrecurring Fair Value Measurements
Fair value of long-lived, non-financial assets - Long-lived assets are reviewed for impairment whenever events or changes in circumstances indicate that carrying amounts of such assets may not be recoverable.
The following summarizes impairments of long-lived assets and related post-impairment fair value for the Non-Qualified Plan totaling $21.4years ended December 31, 2020 and 2019:
139
| Year Ended December 31, | |||||||||||||||||||||||||||||||||||
| 2020 | 2019 | ||||||||||||||||||||||||||||||||||
| (In millions) | Impairment | Fair Value (a) | Impairment | Fair Value (a) | |||||||||||||||||||||||||||||||
| Long-lived assets | $ | 204.0 | $ | 464.7 | $ | 495.4 | $ | 342.5 | (b) | ||||||||||||||||||||||||||
(a)Measured as of the impairment date using the income approach and a 10.8% risk-adjusted rate of interest, resulting in a Level 3 fair value measurement.
(b)Includes $104.0 million fair value of vessels determined using the transaction price of a similar vessel, resulting in a Level 2 fair value measurement.
Other fair value disclosures
Fair value of debt - The fair value of our Synthetic Bonds, Senior Notes and private placement notes are as follows:
| December 31, 2020 | December 31, 2019 | ||||||||||||||||||||||
| (In millions) | Carrying Amount (a) | Fair Value (b) | Carrying Amount (a) | Fair Value (b) | |||||||||||||||||||
| Synthetic bonds due 2021 | $ | 551.2 | $ | 552.0 | $ | 492.9 | $ | 513.1 | |||||||||||||||
| 3.45% Senior Notes due 2022 | 500.0 | 513.2 | 500.0 | 499.2 | |||||||||||||||||||
| 5.00% Notes due 2020 | 0 | 0 | 224.6 | 230.0 | |||||||||||||||||||
| 3.40% Notes due 2022 | 184.0 | 188.8 | 168.5 | 180.6 | |||||||||||||||||||
| 3.15% Notes due 2023 | 159.5 | 163.7 | 146.0 | 156.8 | |||||||||||||||||||
| 3.15% Notes due 2023 | 153.4 | 161.8 | 140.4 | 150.5 | |||||||||||||||||||
| 4.50% Notes due 2025 | 245.4 | 256.8 | 0 | 0 | |||||||||||||||||||
| 4.00% Notes due 2027 | 92.0 | 99.7 | 84.2 | 96.4 | |||||||||||||||||||
| 4.00% Notes due 2032 | 122.7 | 136.8 | 112.3 | 127.8 | |||||||||||||||||||
| 3.75% Notes due 2033 | 122.7 | 126.4 | 112.3 | 123.8 | |||||||||||||||||||
(a)Carrying amounts include unamortized debt discounts and premiums and unamortized debt issuance costs of $12.8 million and $25.1$9.1 million at fair market value, respectively. Asas of December 31, 20182020, and 2017, TechnipFMC stock held in trust of $2.4 million and $4.8 million at its cost basis,2019, respectively. Refer to Note 22 to these consolidated financial statements for
(b)Fair values are based on Level 2 quoted market prices.
Other fair value disclosuredisclosures - The carrying amounts of cash and cash equivalents, trade receivables, accounts payable, short-term debt, commercial paper, debt associated with our bank borrowings, credit facilities, as well as amounts included in other current assets and other current liabilities that meet the definition of financial instruments, approximate fair value.
Credit risk - By their nature, financial instruments involve risk, including credit risk, for non-performance by counterparties. Financial instruments that potentially subject us to credit risk primarily consist of trade receivables and derivative contracts. We manage the credit risk on financial instruments by transacting only with what management believes are financially secure counterparties, requiring credit approvals and credit limits, and monitoring counterparties’ financial condition. Our maximum exposure to credit loss in the event of non-performance by the counterparty is limited to the amount drawn and outstanding on the financial instrument. Allowances for losses on trade receivables are established based on collectability assessments. We mitigate credit risk on derivative contracts by executing contracts only with counterparties that consent to a master netting agreement, which permits the net settlement of gross derivative assets against gross derivative liabilities.
140
NOTE 25. QUARTERLY INFORMATION (UNAUDITED)
| 2020 | 2019 | ||||||||||||||||||||||||||||||||||||||||||||||
| (In millions, except per share data) | 4th Qtr. | 3rd Qtr. | 2nd Qtr. | 1st Qtr. | 4th Qtr. | 3rd Qtr. | 2nd Qtr. | 1st Qtr. | |||||||||||||||||||||||||||||||||||||||
| Revenue | $ | 3,426.1 | $ | 3,335.7 | $ | 3,158.5 | $ | 3,130.3 | $ | 3,726.8 | $ | 3,335.1 | $ | 3,434.2 | $ | 2,913.0 | |||||||||||||||||||||||||||||||
| Cost of sales | 2,973.8 | 2,882.3 | 2,647.0 | 2,706.3 | 3,067.2 | 2,726.4 | 2,745.2 | 2,411.9 | |||||||||||||||||||||||||||||||||||||||
| Net income (loss) | (13.9) | 6.4 | 15.3 | (3,245.7) | (2,430.3) | (115.3) | 113.7 | 19.8 | |||||||||||||||||||||||||||||||||||||||
| Net income (loss) attributable to TechnipFMC plc | $ | (39.3) | $ | (3.9) | $ | 11.7 | $ | (3,256.1) | $ | (2,414.0) | $ | (119.1) | $ | 97.0 | $ | 20.9 | |||||||||||||||||||||||||||||||
Basic earnings (loss) per share (1) | $ | (0.09) | $ | (0.01) | $ | 0.03 | $ | (7.28) | $ | (5.40) | $ | (0.27) | $ | 0.22 | $ | 0.05 | |||||||||||||||||||||||||||||||
Diluted earnings (loss) per share (1) | $ | (0.09) | $ | (0.01) | $ | 0.03 | $ | (7.28) | $ | (5.40) | $ | (0.27) | $ | 0.21 | $ | 0.05 | |||||||||||||||||||||||||||||||
(1) Basic and diluted earnings (loss) per share are computed independently for each of the Non-Qualified Plan investments.quarters presented. Therefore, the sum of quarterly basic and diluted per share information may not equal annual basic and diluted earnings (loss) per share.
NOTE 26. SUBSEQUENT EVENT
On February 16, 2021, we completed the Spin-off, see Note 3 for further details. In connection with the Spin-off, we executed a series of $31.8refinancing transactions, in order to provide a capital structure with sufficient cash resources to support future operating and investment plans.
On February 16, 2021, we entered into a new senior secured revolving credit facility (the “Revolving Credit Facility”) that provides for aggregate revolving capacity of up to $1.0 billion. Availability of borrowings under the Revolving Credit Facility is reduced by any outstanding letters of credit issued against the facility. At February 25, 2021, there were no outstanding letters of credit and availability of borrowings under the Revolving Credit Facility was $800 million.
On January 29, 2021, we issued $1.0 billion of 6.5% senior notes due 2026 (the “2021 Notes”). The interest on the 2021 Notes is paid semi-annually on February 1 and August 1 of each year, beginning on August 1, 2021. The 2021 Notes are senior unsecured obligations and are guaranteed on a senior unsecured basis by substantially all of our wholly-owned U.S. subsidiaries and non-U.S. subsidiaries in Brazil, the Netherlands, Norway, Singapore and the United Kingdom.
The proceeds from the debt issuance described above along with the available cash on hand were used to fund the repayment of all $522.8 million of the outstanding Synthetic Convertible Bonds that matured in January 2021 and $20.3the repayment of all $500.0 million for matching contributions toaggregate principal amount of outstanding 3.45% Senior Notes due 2022.
In addition, we terminated the $2.5 billion senior unsecured revolving credit facility we entered into on January 17, 2017 and terminated the €500.0 million Euro Facility and CCFF Program we entered into on May 19, 2020. In connection with the termination of these plans in 2018 and 2017, respectively. Additionally,credit facilities, we recognized expenserepaid most of $14.3the outstanding commercial paper borrowings, which were $1,525.9 million and $12.5 million for non-elective contributions in 2018 and 2017, respectively.as December 31, 2020.
ITEM 9A. CONTROLS AND PROCEDURES
Evaluation of mitigating the effect of changes in exchange rates, we hold derivative financial instruments to hedge the risks of certain identifiableDisclosure Controls and anticipated transactions and recorded assets and liabilities in our consolidated balance sheets. The types of risks hedged are those relating to the variability of future earnings and cash flows caused by movements in foreign currency exchange rates. Our policy is to hold derivatives only for the purpose of hedging risks associated with anticipated foreign currency purchases and sales created in the normal course of business, and not for trading purposes where the objective is solely to generate profit.Procedures
Net Notional Amount Bought (Sold) | |||||
| (In millions) | USD Equivalent | ||||
| Euro | 725.9 | 831.1 | |||
| Norwegian krone | 2,264.7 | 260.6 | |||
| Brazilian real | 752.3 | 194.2 | |||
| Australian dollar | 183.2 | 129.3 | |||
| Malaysian ringgit | 397.0 | 96.1 | |||
| Singapore dollar | 108.2 | 79.4 | |||
| Japanese yen | 8,118.0 | 73.9 | |||
| British pound | 52.4 | 67.0 | |||
| Canadian dollar | (247.0 | ) | (181.0 | ) | |
| U.S. dollar | (1,051.8 | ) | (1,051.8 | ) | |
Net Notional Amount Bought (Sold) | |||||
| (In millions) | USD Equivalent | ||||
| Norwegian krone | (104.3 | ) | (12.0 | ) | |
| U.S. dollar | 13.1 | 13.1 | |||
| December 31, 2018 | December 31, 2017 | ||||||||||||||
| (In millions) | Assets | Liabilities | Assets | Liabilities | |||||||||||
| Derivatives designated as hedging instruments | |||||||||||||||
| Foreign exchange contracts | |||||||||||||||
| Current - Derivative financial instruments | $ | 83.8 | $ | 127.7 | $ | 65.6 | $ | 51.0 | |||||||
| Long-term - Derivative financial instruments | 9.0 | 35.6 | 28.0 | 1.7 | |||||||||||
| Total derivatives designated as hedging instruments | 92.8 | 163.3 | 93.6 | 52.7 | |||||||||||
| Derivatives not designated as hedging instruments | |||||||||||||||
| Foreign exchange contracts | |||||||||||||||
| Current - Derivative financial instruments | 11.9 | 10.7 | 12.7 | 18.0 | |||||||||||
| Long-term - Derivative financial instruments | 0.1 | 0.1 | 4.7 | 4.2 | |||||||||||
| Total derivatives not designated as hedging instruments | 12.0 | 10.8 | 17.4 | 22.2 | |||||||||||
| Long-term - Derivative financial instruments - Synthetic Bonds - Call Option Premium | 9.2 | — | 62.2 | — | |||||||||||
| Long-term - Derivative financial instruments - Synthetic Bonds - Embedded Derivatives | — | 9.2 | — | 62.2 | |||||||||||
| Total derivatives | $ | 114.0 | $ | 183.3 | $ | 173.2 | $ | 137.1 | |||||||
| Location of Fair Value Hedge Gain (Loss) Recognized in Income | Gain (Loss) Recognized in Income | ||||||||||
| Year Ended December 31, | |||||||||||
| (In millions) | 2018 | 2017 | 2016 | ||||||||
| Other income (expense), net | $ | (18.1 | ) | $ | 44.9 | $ | 32.8 | ||||
| Gain (Loss) Recognized in OCI (Effective Portion) | |||||||||||
| Year Ended December 31, | |||||||||||
| (In millions) | 2018 | 2017 | 2016 | ||||||||
| Foreign exchange contracts | $ | (75.4 | ) | $ | 72.1 | $ | (86.1 | ) | |||
| Location of Cash Flow Hedge Gain (Loss) Reclassified from Accumulated OCI into Income | Gain (Loss) Reclassified From Accumulated OCI into Income (Effective Portion) | ||||||||||
| Year Ended December 31, | |||||||||||
| (In millions) | 2018 | 2017 | 2016 | ||||||||
| Foreign exchange contracts | |||||||||||
| Revenue | $ | (2.4 | ) | $ | (39.3 | ) | $ | — | |||
| Cost of sales | 3.4 | 5.3 | — | ||||||||
| Selling, general and administrative expense | (0.1 | ) | 0.8 | — | |||||||
| Other (expense), net | 1.0 | (102.2 | ) | (165.7 | ) | ||||||
| Total | $ | 1.9 | $ | (135.4 | ) | $ | (165.7 | ) | |||
| Location of Cash Flow Hedge Gain (Loss) Recognized in Income | Gain (Loss) Recognized in Income (Ineffective Portion and Amount Excluded from Effectiveness Testing) | ||||||||||
| Year Ended December 31, | |||||||||||
| (In millions) | 2018 | 2017 | 2016 | ||||||||
| Foreign exchange contracts | |||||||||||
| Revenue | $ | (2.2 | ) | $ | 9.5 | $ | — | ||||
| Cost of sales | (4.8 | ) | (9.0 | ) | — | ||||||
| Selling, general and administrative expense | — | 0.1 | — | ||||||||
| Other income (expense), net | (12.3 | ) | 23.0 | (13.2 | ) | ||||||
| Total | $ | (19.3 | ) | $ | 23.6 | $ | (13.2 | ) | |||
| Location of Gain (Loss) Recognized in Income | Gain (Loss) Recognized in Income on Derivatives (Instruments Not Designated as Hedging Instruments) | ||||||||||
| Year Ended December 31, | |||||||||||
| (In millions) | 2018 | 2017 | 2016 | ||||||||
| Foreign exchange contracts | |||||||||||
| Revenue | $ | (1.7 | ) | $ | 0.9 | $ | — | ||||
| Cost of sales | 0.2 | (0.3 | ) | — | |||||||
| Other income, net | (11.4 | ) | 43.0 | 0.1 | |||||||
| Total | $ | (12.9 | ) | $ | 43.6 | $ | 0.1 | ||||
| December 31, 2018 | December 31, 2017 | ||||||||||||||||||||||
| (In millions) | Gross Amount Recognized | Gross Amounts Not Offset Permitted Under Master Netting Agreements | Net Amount | Gross Amount Recognized | Gross Amounts Not Offset Permitted Under Master Netting Agreements | Net Amount | |||||||||||||||||
| Derivative assets | $ | 114.0 | $ | (105.9 | ) | $ | 8.1 | $ | 173.2 | $ | (114.4 | ) | $ | 58.8 | |||||||||
| Derivative liabilities | $ | 183.3 | $ | (105.9 | ) | $ | 77.4 | $ | 137.1 | $ | (114.4 | ) | $ | 22.7 | |||||||||
| December 31, 2018 | December 31, 2017 | ||||||||||||||||||||||||||||||
| (In millions) | Total | Level 1 | Level 2 | Level 3 | Total | Level 1 | Level 2 | Level 3 | |||||||||||||||||||||||
| Assets | |||||||||||||||||||||||||||||||
| Investments | |||||||||||||||||||||||||||||||
| Nonqualified Plan: | |||||||||||||||||||||||||||||||
Equity securities(a) | $ | 40.4 | $ | 40.4 | $ | — | $ | — | $ | 63.7 | $ | 63.7 | $ | — | $ | — | |||||||||||||||
| Money market fund | 1.6 | — | 1.6 | — | 2.4 | — | 2.4 | — | |||||||||||||||||||||||
Stable value fund(b) | 0.5 | — | — | — | 0.6 | — | — | — | |||||||||||||||||||||||
| Derivative financial instruments | |||||||||||||||||||||||||||||||
| Synthetic bonds - call option premium | 9.2 | — | 9.2 | — | 62.2 | — | 62.2 | — | |||||||||||||||||||||||
| Foreign exchange contracts | 104.8 | — | 104.8 | — | 111.0 | — | 111.0 | — | |||||||||||||||||||||||
| Asset held for sale | 9.6 | — | — | 9.6 | 50.2 | — | — | 50.2 | |||||||||||||||||||||||
| Total assets | $ | 166.1 | $ | 40.4 | $ | 115.6 | $ | 9.6 | $ | 290.1 | $ | 63.7 | $ | 175.6 | $ | 50.2 | |||||||||||||||
| Liabilities | |||||||||||||||||||||||||||||||
| Redeemable financial liability | $ | 408.5 | $ | — | $ | — | $ | 408.5 | $ | 312.0 | $ | — | $ | — | $ | 312.0 | |||||||||||||||
| Derivative financial instruments | |||||||||||||||||||||||||||||||
| Synthetic bonds - embedded derivatives | 9.2 | — | 9.2 | — | 62.2 | — | 62.2 | — | |||||||||||||||||||||||
| Foreign exchange contracts | 174.1 | — | 174.1 | — | 74.9 | — | 74.9 | — | |||||||||||||||||||||||
| Liabilities held for sale | 16.2 | — | — | 16.2 | 13.7 | — | — | 13.7 | |||||||||||||||||||||||
| Total liabilities | $ | 608.0 | $ | — | $ | 183.3 | $ | 424.7 | $ | 462.8 | $ | — | $ | 137.1 | $ | 325.7 | |||||||||||||||
Management’s Annual Report on Internal Control over Financial Reporting
141
Management is responsible for establishing and maintaining adequate internal control over financial reporting as defined in Rule 13a-15(f) under the fair valueExchange Act.
Management evaluated the effectiveness of the non-controlling interests. During the twelve months ended December 31, 2018 and 2017, we revalued the liability to reflect current expectations about the obligation, which resulted in the recognition of a loss of $322.3 million and $293.7 million, respectively.
| Year Ended December 31, | ||||||||
| (In millions) | 2018 | 2017 | ||||||
| Balance at beginning of period | $ | 312.0 | $ | 174.8 | ||||
| Less: Gains (losses) recognized in net interest expense | (322.3 | ) | (293.7 | ) | ||||
| Less: Settlements | 225.8 | 156.5 | ||||||
| Balance at end of period | $ | 408.5 | $ | 312.0 | ||||
The effectiveness of our redeemable noncontrolling interest was $38.5 million. Refer to Note 2 to these consolidatedinternal control over financial statements for additional disclosure related to the acquisition.reporting as of December 31, 2020, has been audited by PricewaterhouseCoopers LLP, an independent registered public accounting firm, as stated in their report included herein.
Changes in asset positions by the result of multiplying the present value of the portfolio by the counterparty’s published credit spread. Portfolios in a liability position are adjusted by the same calculation; however, a spread representing our credit spread is used. Our credit spread, and the credit spread of other counterparties not publicly available, are approximated by using the spread of similar companies in the same industry, of similar size and with the same credit rating.Internal Control over Financial Reporting
There were no credit-risk-related contingent featureschanges in our agreements withinternal control over financial reporting during the year ended December 31, 2020 that have materially affected, or are reasonably likely to materially affect, our internal control over financial institutions that would require us to post collateral for derivative positions in a liability position.reporting.
| December 31, 2018 | December 31, 2017 | ||||||||||||||
| (In millions) | Carrying Amount (a) | Fair Value (b) | Carrying Amount (a) | Fair Value (b) | |||||||||||
| Synthetic bonds due 2021 | $ | 490.9 | $ | 532.4 | $ | 502.4 | $ | 647.4 | |||||||
| 3.45% Senior Notes due 2022 | 500.0 | 489.7 | 500.0 | 497.7 | |||||||||||
| 5.00% Notes due 2020 | 229.0 | 244.0 | 239.9 | 265.2 | |||||||||||
| 3.40% Notes due 2022 | 171.8 | 186.9 | 179.9 | 199.4 | |||||||||||
| 3.15% Notes due 2023 | 148.9 | 161.3 | 155.9 | 167.6 | |||||||||||
| 3.15% Notes due 2023 | 143.1 | 153.3 | 149.9 | 161.4 | |||||||||||
| 4.00% Notes due 2027 | 85.9 | 95.8 | 89.9 | 99.9 | |||||||||||
| 4.00% Notes due 2032 | 114.5 | 120.2 | 119.9 | 142.9 | |||||||||||
| 3.75% Notes due 2033 | 114.5 | 126.1 | 119.9 | 126.7 | |||||||||||
| 2018 | 2017 | ||||||||||||||||||||||||||||||
| (In millions, except per share data) | 4th Qtr. | 3rd Qtr. | 2nd Qtr. | 1st Qtr. | 4th Qtr. | 3rd Qtr. | 2nd Qtr. | 1st Qtr. | |||||||||||||||||||||||
| Revenue | $ | 3,323.0 | $ | 3,143.8 | $ | 2,960.9 | $ | 3,125.2 | $ | 3,683.0 | $ | 4,140.9 | $ | 3,845.0 | $ | 3,388.0 | |||||||||||||||
| Cost of sales | 2,767.7 | 2,558.5 | 2,422.2 | 2,524.6 | 2,914.1 | 3,468.2 | 3,162.0 | 2,980.3 | |||||||||||||||||||||||
| Net income (loss) | (2,246.5 | ) | 134.2 | 110.1 | 91.4 | (127.5 | ) | 117.9 | 159.0 | (15.2 | ) | ||||||||||||||||||||
| Net income (loss) attributable to TechnipFMC plc | $ | (2,259.3 | ) | $ | 136.9 | $ | 105.7 | $ | 95.1 | $ | (153.9 | ) | $ | 121.0 | $ | 164.9 | $ | (18.7 | ) | ||||||||||||
Basic earnings (loss) per share (1) | $ | (5.00 | ) | $ | 0.30 | $ | 0.23 | $ | 0.20 | $ | (0.33 | ) | $ | 0.26 | $ | 0.35 | $ | (0.04 | ) | ||||||||||||
Diluted earnings (loss) per share (1) | $ | (5.00 | ) | $ | 0.30 | $ | 0.23 | $ | 0.20 | $ | (0.33 | ) | $ | 0.26 | $ | 0.35 | $ | (0.04 | ) | ||||||||||||
ITEM 9. CHANGES IN AND DISAGREEMENTS WITH ACCOUNTANTS ON ACCOUNTING AND FINANCIAL DISCLOSURE9B. OTHER INFORMATION
None.
ITEM 9A. CONTROLS AND PROCEDURES3. LEGAL PROCEEDINGS
announced on July 24, 2017. On January 18, 2019, the District Court dismissed claims under Section 10(b) and 20(a) of the Securities Exchange Act of 1934, as amended, and Section 15 of the Securities Act of 1933, as amended (“Securities Act”). The shareholder also asserted a claim for alleged violation of Section 11 of the Securities Act in connection with the reporting of certain financial results in our Form S-4 Registration Statement filed in 2016. On December 13, 2020, the parties filed a Stipulation and Agreement of Settlement to settle all claims asserted in the suit with prejudice. The defendants entered into the Stipulation solely to eliminate the burden, expense, uncertainty and risk of further litigation, and denied, and continue to deny, each and all of the claims and contentions alleged by the shareholder plaintiff in this action. On December 16, 2020, the District Court entered an order preliminarily approving the settlement and ordering notice to the settlement class. A settlement hearing is scheduled in the first quarter 2021.
In responseaddition to the identificationabove-referenced matter, we are involved in various other pending or potential legal actions or disputes in the ordinary course of our business. These actions and disputes can involve our agents, suppliers, clients, and join venture partners and can include claims related to payment of fees, service quality, and ownership arrangements including certain put or call options. Management is unable to predict the material weaknesses described below, the Company performed additional analysis and other post-closing procedures. Based upon the work performed,ultimate outcome of these actions because of their inherent uncertainty. However, management believes that the Company’smost probable, ultimate resolution of these matters will not have a material adverse effect on our consolidated financial statements for the periods covered by and included in this Annual Report on Form 10-K fairly present in all material respects the Company’s financial position, results of operations, andor cash flows, in conformity with U.S. generally accepted accounting principles.flows.
ITEM 9B. OTHER INFORMATION4. MINE SAFETY DISCLOSURES
142
PART III
ITEM 10. DIRECTORS, EXECUTIVE OFFICERS AND CORPORATE GOVERNANCE
We have adopted a Code of Business Conduct, which is applicable to our directors, officers, and employees, including our principal executive officer, financial and other senior financialaccounting officers, including our principal financial officer, principal accounting officer or controller, and persons performing similar functions. TheOur Code of Business Conduct may be found on our website at www.technipfmc.com under “About us—Governance”us-Governance” and is available in print to shareholders without charge by submitting a request to 11740 Katy Freeway, Energy Tower 3, Houston, Texas 77079, Attention: Corporate Secretary. We intend to satisfy the disclosure requirements under the Securities and Exchange Act of 1934, as amended, regarding an amendment to or waiver from a provision of our Code of Business Conduct by posting such information on our website.
| Name | Principal Occupation | ||||||||||
| Executive Chairman | |||||||||||
| and Chief Executive Officer of TechnipFMC | |||||||||||
| Eleazar de Carvalho Filho | Founding Partner of Virtus BR Partners Assessoria Corporativa Ltda. and Founding Partner of Sinfonia Consultoria Financeira e Participações Ltda., financial advisory and consulting firms | ||||||||||
| Claire S. Farley | Vice Chairman in the Energy & Infrastructure business of KKR & Co. L.P., a global investment firm | ||||||||||
| Peter Mellbye | Former Executive Vice President, Development & Production, International, of Statoil ASA, an international oil and gas company | ||||||||||
| John O’Leary | Chief Executive Officer of Strand Energy, a Dubai-based company specializing in business development in the oil and gas industry | ||||||||||
| Kay G. Priestly | Former Chief Executive Officer of Turquoise Hill Resources Ltd., an international mining company | ||||||||||
| James M. Ringler | |||||||||||
| John Yearwood | Former Chief Executive Officer, President, and Chief Operating Officer of Smith International, Inc., a supplier of services and manufactured products to oil and gas exploration and production companies | ||||||||||
ITEM 11. EXECUTIVE COMPENSATION
Information required by this item is incorporated herein by reference from the sections entitled “Director Compensation,” “Corporate Governance - Compensation Committee Interlocks and Insider Participation in Compensation Decisions” and “Executive Compensation Discussion and Analysis” of our Proxy Statement for the 20192021 Annual General Meeting of Shareholders.
ITEM 12. SECURITY OWNERSHIP OF CERTAIN BENEFICIAL OWNERS AND MANAGEMENT AND RELATED SHAREHOLDER MATTERS
Information required by this item is incorporated herein by reference from the section entitled “Security Ownership of Our Management and Holders of More Than 5% of our Outstanding Ordinary Shares” of our Proxy Statement for the 20192021 Annual General Meeting of Shareholders.
As of December 31, 2018,2020, our securities authorized for issuance under equity compensation plans were as follows:
| (shares in thousands) | Number of Securities to be Issued Upon Exercise of Outstanding Options, Warrants and Rights | Weighted Average Exercise Price of Outstanding Options, Warrants and Rights | Number of Securities Remaining Available for Future Issuance under Equity Compensation Plans | (shares in thousands) | Number of Securities to be Issued Upon Exercise of Outstanding Options, Warrants and Rights | Weighted Average Exercise Price of Outstanding Options, Warrants and Rights | Number of Securities Remaining Available for Future Issuance under Equity Compensation Plans | |||||||||||||||||||
| Equity compensation plans approved by security holders | 4,658.4 | $ | 33.68 | 26,304.6 | Equity compensation plans approved by security holders | 4,598.4 | $ | 29.77 | 14,250.2 | |||||||||||||||||
| Equity compensation plans not approved by security holders | — | — | — | Equity compensation plans not approved by security holders | — | — | — | |||||||||||||||||||
| Total | 4,658.4 | $ | 33.68 | 26,304.6 | Total | 4,598.4 | $ | 29.77 | 14,250.2 | |||||||||||||||||
ITEM 13. CERTAIN RELATIONSHIPS AND RELATED TRANSACTIONS, AND DIRECTOR INDEPENDENCE
Information required by this item is incorporated herein by reference from the sections entitled “Transactions with Related Persons” and “Corporate Governance - Director Independence” of our Proxy Statement for the 20192021 Annual General Meeting of Shareholders.
ITEM 14. PRINCIPAL ACCOUNTINGACCOUNTANT FEES AND SERVICES
Information required by this item is incorporated herein by reference from the sections entitled “Proposal 65 — Ratification of U.S. Auditor” of our Proxy Statement for the 20192021 Annual General Meeting of Shareholders.
144
PART IV
ITEM 15. EXHIBITS AND FINANCIAL STATEMENT SCHEDULES
(a)The following documents are filed as part of this Annual Report on Form 10-K:
1.The following consolidated financial statements of TechnipFMC plc and subsidiaries are filed as part of this Annual Report on Form 10-K under Part II, Item 8:
Reports of Independent Registered Public Accounting Firm on Consolidated Financial Statements
Consolidated Statements of Income for the Years Ended December 31, 2018, 20172020, 2019 and 20162018
Consolidated Statements of Comprehensive Income for the Years Ended December 31, 2018, 2017,2020, 2019, and 20162018
Consolidated Balance Sheets as of December 31, 20182020 and 20172019
Consolidated Statements of Cash Flows for the Years Ended December 31, 2018, 20172020, 2019 and 20162018
Consolidated Statements of Changes in Stockholders’ Equity for the Years Ended December 31, 2018, 20172020, 2019 and 20162018
Notes to Consolidated Financial Statements
2.Financial Statement Schedule:
See “Schedule II - Valuation and Qualifying Accounts” included herein. All other schedules are omitted because of the absence of conditions under which they are required or because information called for is shown in the consolidated financial statements and notes thereto in Part II, Item 8 of this Annual Report on Form 10-K.
3.Exhibits:
See “Index of Exhibits” filed as part of this Annual Report on Form 10-K.
145
Schedule II—Valuation and Qualifying Accounts
| (In millions) | Additions | (In millions) | Additions | |||||||||||||||||||||||||||||||||||||||||||||
| Description | Balance at Beginning of Period | Charged to Costs and Expenses | Charged to Other Accounts (a) | Deductions and Adjustments (b) | Balance at End of Period | Description | Balance at Beginning of Period | Charged to Costs and Expenses | Charged to Other Accounts (a) | Deductions and Adjustments (b) | Balance at End of Period | |||||||||||||||||||||||||||||||||||||
| Year Ended December 31, 2016 | ||||||||||||||||||||||||||||||||||||||||||||||||
| Allowance for doubtful accounts | $ | 48.2 | $ | 58.4 | $ | — | $ | (21.0 | ) | $ | 85.6 | |||||||||||||||||||||||||||||||||||||
| Year Ended December 31, 2018 | Year Ended December 31, 2018 | |||||||||||||||||||||||||||||||||||||||||||||||
| Trade receivables allowance for doubtful accounts | Trade receivables allowance for doubtful accounts | $ | 117.4 | $ | 54.7 | $ | 0.3 | $ | (52.8) | $ | 119.6 | |||||||||||||||||||||||||||||||||||||
| Valuation allowance for deferred tax assets | $ | 133.8 | $ | 38.9 | $ | — | $ | — | $ | 172.7 | Valuation allowance for deferred tax assets | $ | 430.0 | $ | 213.8 | $ | (21.3) | $ | 60.9 | $ | 683.4 | |||||||||||||||||||||||||||
| Year Ended December 31, 2017 | ||||||||||||||||||||||||||||||||||||||||||||||||
| Allowance for doubtful accounts | $ | 85.6 | $ | 15.5 | $ | 19.8 | $ | (3.5 | ) | $ | 117.4 | |||||||||||||||||||||||||||||||||||||
| Year Ended December 31, 2019 | Year Ended December 31, 2019 | |||||||||||||||||||||||||||||||||||||||||||||||
| Trade receivables allowance for doubtful accounts | Trade receivables allowance for doubtful accounts | $ | 119.6 | $ | 22.0 | $ | (2.9) | $ | (43.3) | $ | 95.4 | |||||||||||||||||||||||||||||||||||||
| Valuation allowance for deferred tax assets | $ | 172.7 | $ | 258.7 | $ | 4.4 | $ | (5.8 | ) | $ | 430.0 | Valuation allowance for deferred tax assets | $ | 683.4 | $ | 187.0 | $ | (2.1) | $ | 48.6 | $ | 916.9 | ||||||||||||||||||||||||||
| Year Ended December 31, 2018 | ||||||||||||||||||||||||||||||||||||||||||||||||
| Allowance for doubtful accounts | $ | 117.4 | $ | 54.7 | $ | 0.3 | $ | (52.8 | ) | $ | 119.6 | |||||||||||||||||||||||||||||||||||||
| Year Ended December 31, 2020 | Year Ended December 31, 2020 | |||||||||||||||||||||||||||||||||||||||||||||||
Trade receivables allowance for doubtful accounts (c) | Trade receivables allowance for doubtful accounts (c) | $ | 95.4 | $ | 66.8 | $ | 11.9 | $ | (65.2) | $ | 108.9 | |||||||||||||||||||||||||||||||||||||
| Valuation allowance for deferred tax assets | $ | 430.0 | $ | 213.8 | $ | (21.3 | ) | $ | 60.9 | $ | 683.4 | Valuation allowance for deferred tax assets | $ | 916.9 | $ | 94.7 | $ | (7.3) | $ | (69.0) | $ | 935.3 | ||||||||||||||||||||||||||
(a)"Additions charged to other accounts” includes translation adjustments.
(b)“Deductions and adjustments” includes write-offs, net of recoveries, increases in allowances offset by increases to deferred tax assets, and reductions in the allowances credited to expense.
(c)On January 1, 2020, we adopted ASU 2016-13, resulting in a $3.8 million increase to our trade receivables allowance for doubtful accounts. See Note 4 for further details.
See accompanying Report of Independent Registered Public Accounting Firm.
146
ITEM 16. SUMMARY
None.
147
INDEX OF EXHIBITS
Exhibit | Exhibit Description | |||||||
| 2.1 | ||||||||
| 2.1.a | ||||||||
| 2.3 | ||||||||
| 3.1 | ||||||||
| 4.1 | ||||||||
| 4.1.a | ||||||||
| 4.2.a | ||||||||
| 4.3 | ||||||||
| 10.1* | ||||||||
| 10.1.a* | ||||||||
| 10.1.b* | ||||||||
| 10.2* | ||||||||
| 10.3* | ||||||||
| 10.3b* | ||||||||
| 10.4* | ||||||||
| 10.5* | ||||||||
| 10.5b* | ||||||||
| 10.26 | ||||||||
| 10.29 | ||||||||
| 10.30 | ||||||||
| 10.31 | ||||||||
| 10.32 | ||||||||
| 10.33 | ||||||||
| 10.34 | ||||||||
| 10.35 | ||||||||
| 10.36 | ||||||||
| 10.37 | ||||||||
| 10.38 | ||||||||
| 10.39 | ||||||||
| 10.40 | ||||||||
| 10.41 | ||||||||
| 10.42 | ||||||||
| 21.1 | ||||||||
| 23.1 | ||||||||
| 31.2 | ||||||||
| 32.1** | ||||||||
| 32.2** | ||||||||
| 101.INS | XBRL Instance Document – the instance document does not appear in the Interactive Data File because its XBRL tags are embedded within the Inline XBRL document. | |||||||
| 101.SCH | Inline XBRL Taxonomy Extension Schema | |||||||
| 101.CAL | Inline XBRL Taxonomy Extension Calculation Linkbase | |||||||
| 101.DEF | Inline XBRL Taxonomy Extension Definition Linkbase | |||||||
| 101.LAB | Inline XBRL Taxonomy Extension Label Linkbase | |||||||
| 101.PRE | Inline XBRL Taxonomy Extension Presentation Linkbase | |||||||
| 104 | Cover Page Interactive Data File (formatted as Inline XBRL and contained in Exhibit 101). | |||||||
* Indicates a management contract or compensatory plan or arrangementarrangement.
** Furnished with this Form 10-K
10-K.
148
SIGNATURES
Pursuant to the requirements of Section 13 or 15(d) of the Securities Exchange Act of 1934, the Registrant has duly caused this report to be signed on its behalf by the undersigned, thereunto duly authorized.
| TechnipFMC plc (Registrant) | ||||||||
| By: | ||||||||
Krisztina Doroghazi Senior Vice President, Controller and Chief Accounting Officer (Principal Accounting Officer and a Duly Authorized Officer) | ||||||||
Date: March 11, 20195, 2021
Pursuant to the requirements of the Securities Exchange Act of 1934, this report has been signed below by the following persons on behalf of the registrant and in the capacities and on the dates indicated.
| Date | Signature | |||||||
/ | ||||||||
Douglas J. Pferdehirt Chairman and Chief Executive Officer (Principal Executive Officer) | ||||||||
| March 5, 2021 | /S/ ALF MELIN | |||||||
Alf Melin Executive Vice President and Chief Financial Officer (Principal Financial Officer) | ||||||||
| March 5, 2021 | /S/ ELEAZAR DE CARVALHO FILHO | |||||||
| Eleazar de Carvalho Filho, Director | ||||||||
| March | /S/ | |||||||
| Claire S. Farley, Director | ||||||||
| March 5, 2021 | ||||||||
| Peter Mellbye, Director | ||||||||
| March | /S/ | |||||||
| John O’Leary, Director | ||||||||
| March 5, 2021 | ||||||||
| Margareth Øvrum, Director | ||||||||
| March | /S/KAY G. P | |||||||
| Kay G. Priestly, Director | ||||||||
| March 5, 2021 | ||||||||
| James M. Ringler, Director | ||||||||
| March | /S/ | |||||||
John Yearwood, Director | ||||||||