false--12-31FY20190001681459falseLarge Accelerated Filerfalsefalse1480000040000008.57.08.560.1300.1200.1500.125119600000954000000.130.520.5211.00618300000.0618300000.01000001000004505000004505000004471000000.050.0340.03150.03150.040.040.03750.020.03450.050.0340.03150.03150.040.040.03750.020.034500008000000018410000084200000159900000184400000108000000941000002613000002495000001686000002020-12-312055.0045.0033.0057.0051.002024-12-310001681459us-gaap:ForeignExchangeContractMemberus-gaap:FairValueMeasurementsRecurringMember2021-12-31


UNITED STATES
SECURITIES AND EXCHANGE COMMISSION
WASHINGTON,Washington, D.C. 20549
FORM 10-K

ANNUALLY    ANNUAL REPORT PURSUANT TO SECTION 13 OR 15(d) OF THE SECURITIES EXCHANGE ACT OF 1934
For the fiscal year ended December 31, 20192021
or
TRANSITION REPORT PURSUANT TO SECTION 13 OR 15(d) OF THE SECURITIES EXCHANGE ACT OF 1934
or
For the transition period from            to            
Commission file number 001-37983
TechnipFMC plc
(Exact name of registrant as specified in its charter)
United Kingdom98-1283037
(State or other jurisdiction of incorporation or organization)(I.R.S. Employer Identification No.)
One St. Paul’s ChurchyardHadrian House,
Wincomblee Road
LondonNewcastle Upon Tyne
United KingdomEC4M 8APNE6 3PL
(Address of principal executive offices)(Zip Code)
+44203-429-3950 191-295-0303
(Registrant’s telephone number, including area code)

Securities registered pursuant to Section 12(b) of the Act:
Title of Each ClassTrading SymbolName of Each Exchange on Which Registered
Ordinary shares, $1.00 par value per shareFTINew York Stock Exchange
Securities registered pursuant to Section 12(g) of the Act: None.
Indicate by check mark if the registrant is a well-known seasoned issuer, as defined in Rule 405 of the Securities Act. Yes ý    No  ¨ 
Indicate by check mark if the registrant is not required to file reports pursuant to Section 13 or Section 15(d) of the Act. Yes  ¨   No  ý
Indicate by check mark whether the registrant (1) has filed all reports required to be filed by Section 13 or 15(d) of the Securities Exchange Act of 1934 during the preceding 12 months (or for such shorter period that the registrant was required to file such reports), and (2) has been subject to such filing requirements for the past 90 days.    Yes   ý    No  ¨
Indicate by check mark whether the registrant has submitted electronically every Interactive Data File required to be submitted pursuant to Rule 405 of Regulation S-T (§232.405 of this chapter) during the preceding 12 months (or for such shorter period that the registrant was required to submit such files).     Yes  ý    No  ¨
Indicate by check mark whether the registrant is a large accelerated filer, an accelerated filer, a non-accelerated filer, a smaller reporting company, or an emerging growth company. See the definitions of “large accelerated filer,” “accelerated filer,” “smaller reporting company,” and “emerging growth company” in Rule 12b-2 of the Exchange Act.

Large accelerated filerAccelerated filer
Non-accelerated filerSmaller reporting company
Emerging growth company

If an emerging growth company, indicate by check mark if the registrant has elected not to use the extended transition period for complying with any new or revised financial accounting standards provided pursuant to Section 13(a) of the Exchange Act. ¨
Indicate by check mark whether the registrant has filed a report on and attestation to its management’s assessment of the effectiveness of its internal control over financial reporting under Section 404(b) of the Sarbanes-Oxley Act (15 U.S.C. 7262(b)) by the registered public accounting firm that prepared or issued its audit report.
Indicate by check mark whether the registrant is a shell company (as defined in Rule 12b-2 of the Act).  YES      NO  ý
The aggregate market value of the registrant’s ordinary shares held by non-affiliates of the registrant, determined by multiplying the outstanding shares on June 28, 2019,30, 2021, by the closing price on such day of $25.94$9.05 as reported on the New York Stock Exchange, was $8.4 billion.
$3.3 billion.
ClassOutstanding at February 25, 202022, 2022
Ordinary shares, $1.00 par value per share447,064,767
450,700,480
DOCUMENTS INCORPORATED BY REFERENCE
Portions of the registrant’s definitive Proxy Statement relating to its 20202022 Annual General Meeting of Shareholders are incorporated by reference into Part III of this Annual Report on Form 10-K where indicated. The 20202022 Proxy Statement will be filed with the U.S. Securities and Exchange Commission within 120 days after the end of the fiscal year to which this report relates.


TABLE OF CONTENTS

2


CAUTIONARY NOTE REGARDING FORWARD-LOOKING STATEMENTS
This Annual Report on Form 10-K contains “forward-looking statements” as defined in Section 27A of the United States Securities Act of 1933, as amended, and Section 21E of the United States Securities Exchange Act of 1934, as amended (the “Exchange Act”). Forward-looking statements usually relate to future events, market growth and recovery, growth of our new energies business and anticipated revenues, earnings, cash flows or other aspects of our operations or operating results. Forward-looking statements are often identified by the words “believe,” “expect,” “anticipate,” “plan,” “intend,” “foresee,” “should,” “would,” “could,” “may,” “estimate,” “outlook” and similar expressions, including the negative thereof. The absence of these words, however, does not mean that the statements are not forward-looking. These forward-looking statements are based on our current expectations, beliefs and assumptions concerning future developments and business conditions and their potential effect on us. While management believes that these forward-looking statements are reasonable as and when made, there can be no assurance that future developments affecting us will be those that we anticipate.
All of our forward-looking statements involve risks and uncertainties (some of which are significant or beyond our control) and assumptions that could cause actual results to differ materially from our historical experience and our present expectations or projections. Known material factors that could cause actual results to differ materially from those contemplated in the forward-looking statements include unpredictable trends in the demand for and price of crude oil and natural gas; competition and unanticipated changes relating to competitive factors in our industry, including ongoing industry consolidation; the COVID-19 pandemic, its impact on the demand for our products and services and global shipping and logistics challenges caused by it; our inability to develop, implement and protect new technologies and services, including new technologies and services for our New Energy Ventures; the cumulative loss of major contracts, customers or alliances and unfavorable credit and commercial terms of certain contracts; the refusal of DTC to act as depository agency for our shares; disruptions in the political, regulatory, economic and social conditions of the countries in which we conduct business; the United Kingdom’s withdrawal from the European Union; the impact of our existing and future indebtedness and the restrictions on our operations by terms of the agreements governing our existing indebtedness; the risks caused by our acquisition and divestiture activities; our inability to address increasing attention to ESG matters; certainties related to our investments in new energy industries; the risks caused by fixed-price contracts; any delays and cost overruns of new capital asset construction projects for vessels and manufacturing facilities; our failure to deliver our backlog; our reliance on subcontractors, suppliers and our joint venture partners; a failure or breach of our IT infrastructure or that of our subcontractors, suppliers or joint venture partners, including as a result of cyber-attacks; risks of pirates endangering our maritime employees and assets; potential liabilities inherent in the industries in which we operate or have operated; our failure to comply with numerous laws and regulations, including those related to environmental protection, climate change, health and safety, labor and employment, import/export controls, currency exchange, bribery and corruption, taxation, privacy, data protection and data security; the additional restrictions on dividend payouts or share repurchases as an English public limited company; uninsured claims and litigation against us, including intellectual property litigation; tax laws, treaties and regulations and any unfavorable findings by relevant tax authorities; potential departure of our key managers and employees; adverse seasonal and weather conditions and unfavorable currency exchange rates; and risk in connection with our defined benefit pension plan commitments, as well as those set forth in Part I, Item 1A, “Risk Factors” and elsewhere ofin this Annual Report on Form 10-K. We caution you not to place undue reliance on any forward-looking statements, which speak only as of the date hereof. We undertake no obligation to publicly update or revise any of our forward-looking statements after the date they are made, whether as a result of new information, future events or otherwise, except to the extent required by law.

3


PART I
ITEM 1. BUSINESS
Company Overview
TechnipFMC plc, a public limited company incorporated and organized under the laws of England and Wales, with registered number 09909709, and with registered office at One St. Paul’s Churchyard, London EC4M 8AP,Hadrian House, Wincomblee Road, Newcastle Upon Tyne, NE6 3PL, United Kingdom (“TechnipFMC”,TechnipFMC,” the “Company,” “we,” or “our”) is a global leader in the energy service company with a portfolio of solutions for the productionindustry, delivering projects, products, technologies, and transformation of hydrocarbons and renewable energy sources. These solutions range from discreet products and services to fully integrated solutions based onservices. With our proprietary technologies with a clear focusand production systems, integrated expertise, and comprehensive solutions, we are transforming our customers’ project economics. We have operational headquarters in Houston, Texas, United States, and in 2021 we principally operated across two business segments: Subsea and Surface Technologies.

We are uniquely positioned to deliver greater efficiency across project lifecycles, from concept to project delivery and beyond.
We have operational headquarters in Paris, France and Houston, Texas, United States. We operate across three business segments: Subsea, Onshore/Offshore, and Surface Technologies. Through these segments, we are levered to the three energy growth areas of unconventionals, liquefied natural gas (“LNG”), and deepwater developments.
We have a unique and comprehensive set of capabilities to serve the oil and gas industry. With our proprietaryinnovative technologies and production systems, integration expertise,improved efficiencies, our offering unlocks new possibilities for our customers in developing their energy resources and comprehensive solutions, we are transformingin their positioning to meet the energy transition challenge.
Enhancing our clients’ project economics.
Enhancement of the Company’s performance and competitiveness is a key component of thisour strategy, thatwhich is achieved through technology and innovation differentiation, seamless execution, and reliance on simplification to drive costs down. We are targeting profitable and sustainable growth by seizing market growth opportunities and expanding our range of services, and weservices. We are managing our assets efficiently to ensure that we are well-prepared to drive and benefit from the opportunities we are experiencing in many of the segmentsmarkets we serve.
Each of our more than 37,00020,000 employees is driven by a steadfaststeady commitment to clients and a culture of project execution, purposeful innovation, challenging industry conventions, and finding new and better ways of working to unlock possibilities.rethinking how the best results are achieved. This leads to fresh thinking, streamlined decisions, and smarter results, enabling us to achieve our vision of enhancing the performance of the world’s energy industry.
History
In March 2015, FMC Technologies, Inc., a U.S. Delaware corporation (“FMC Technologies”), and Technip S.A., a French société anonyme (“Technip”), signed an agreement to form an exclusive alliance and to launch Forsys Subsea, a 50/50 joint venture, that would unite the subsea skills and capabilities of two industry leaders. This alliance, which became operational on June 1, 2015, was established to identify new and innovative approaches to the design, delivery, and maintenance of subsea fields.
Forsys Subsea brought the industry's most talentedindustry’s most-talented subsea professionals together early in operators’ project concept phase with the technical capabilities to design and integrate products, systems, and installation to significantly reduce the cost of subsea field development and enhance overall project economics.
Based on the success of the Forsys Subsea joint venture and its innovative approach to integrated solutions, in May 2016 Technip and FMC Technologies announced in May 2016 that the companies would combine through a merger of equals to create a global subsea leader, TechnipFMC, that would drive change by redefining the production of oil and gas. The business combination was completed on January 16, 2017 (the “Merger”), and on January 17, 2017, TechnipFMC began operating as a unified, combined company trading on the New York Stock Exchange (“NYSE”) and on the Euronext Paris Stock Exchange (“Euronext Paris”) under the symbol “FTI.”
In 2017, our first year as a merged company, TechnipFMC secured several project awards as many operators moved forward with final investment decisions for major onshore projects and subsea developments. Several of the subsea awards incorporated the use of our integrated approach to project delivery, validating our unique business model aimed at lowering project costs and accelerating the delivery of initial hydrocarbon production. This was made possible by bringing together the complimentarycomplementary subsea work scopes of the merged companies.


In 2018, TechnipFMC delivered the industry'sindustry’s first three full-cycle, integrated projects and realized considerable growth in Subsea order inbound, driven in part by its unique integrated offering, iEPCI™ (“iEPCI”). For all of 2019, the value of integrated subsea awards to TechnipFMC more than doubled versus the prior year, representing more than 50 percent50% of all Subsea project order inbound. The increase was driven by a wider adoption of the integrated business model, particularly withby those clients wherewith whom we have unique alliances. With the industry’s most comprehensive and only truly integrated subsea market offering, we have continued to expand the deepwater opportunity set for our customers.clients.
TechnipFMC’s expertise does not end with the production of hydrocarbons. Because of its best in class Engineering and Construction (“E&C”) project design and execution capabilities, enabled by a portfolio of proprietary technologies, TechnipFMC continues to secure and deliver projects that further enable our clients to monetize resources - from liquefaction of gas, both onshore and on floating vessels, through refining and product facilities and with green chemistry and renewables.
4


On August 26, 2019, the Companywe announced that it willour intention to separate into two diversified pure-play market leaders - TechnipFMC, focused on subsea and surface hydrocarbon production, and Technip Energies, focused on downstream engineering, procurement, and construction (“EPC”) project execution.
On February 16, 2021, we completed the separation of the Technip Energies business segment. The separation will enable both companiestransaction was structured as a spin-off (the “Spin-off”), which occurred by way of a pro rata dividend (the “Distribution”) to benefitour shareholders of 50.1 percent of the outstanding shares in Technip Energies N.V. Each of our shareholders received one ordinary share of Technip Energies N.V. for every five ordinary shares of TechnipFMC held at 5:00 p.m., New York City time on the record date, February 17, 2021. Immediately following the completion of the Spin-off, we owned 49.9% of the outstanding shares of Technip Energies. During 2021, we sold approximately 75% of the original ownership stake for proceeds of $900.9 million. As of December 31, 2021, we retained 12.2% ownership of Technip Energies’ issued and outstanding share capital. In January 2022, we sold an additional 9.0 million Technip Energies shares for total proceeds of €118.4 million, or $135.1 million. As of February 25, 2022, we retain a direct stake of 12.9 million shares, representing 7.1% of Technip Energies’ issued and outstanding share capital and valued at $155.3 million.
On January 10, 2022, we announced that following a comprehensive review of the Company’s strategic objectives, we were proceeding with the voluntary delisting of our shares from distinctEuronext Paris. The delisting was completed on February 18, 2022.

BUSINESS SEGMENTS
Subsea
We are transforming subsea energy production by safely providing innovative solutions that improve economics, enhance performance, and compelling market opportunities across the energy value chain; dedicated focus of management, resources and capital; and unique value propositions with differentiated investment appeal.
TechnipFMC will bereduce emissions. As a fully-integrated technology and services provider, driving energy development across deepwater, conventional, and unconventional resources. The Company continues to successfully demonstrate leadership in integrated subsea project delivery and is focused on replicating this success through the development of integrated production models for the surface market. TechnipFMC is also poised to benefit from service opportunities resulting from the world’s largest installed base of subsea production equipment, umbilicals, risers, and flowlines.
Technip Energies will be a leading engineering and construction player, with a robust project delivery model, strong technical capabilities, and proven track record as demonstrated by the successful execution of some of the world’s most iconic EPC projects. The new company willwe continue to leverage its industry-leading process technology portfolio, particularly in the areas of ethylene and hydrogen, while pursuing further opportunities to enhance and differentiate this portfolio.drive responsible energy development.
The Company continues to innovate and introduce new technologies across our portfolio of products and services. TechnipFMC’s strong operational performance in 2019 was driven by a relentless focus on operational execution, while our significant growth in project backlog provides improved visibility for our businesses for 2020 and beyond.
BUSINESS SEGMENTS
Subsea
TheOur Subsea segment provides integrated design, engineering, procurement, manufacturing, fabrication, installation, and life of field services for subsea systems, subsea field infrastructure, and subsea pipe systems used in oil and gas production and transportation. We are a fully-integrated technology and services provider, continuing to drive responsible energy development.

We are an industry leader in front-end engineering and design (“FEED”), subsea production systems (“SPS”), subsea flexible pipe, and subsea umbilicals, risers, and flowlines (“SURF”). and subsea robotics. We also have the capability to install these products and related subsea infrastructure withusing our fleet of highly specialized vessels. By integrating the SPS and SURF work scopes, we are uniquely able to drive greater value to our clients through more efficient field layout and execution of the installation campaign. This capability, in conjunction with our strong commercial focus, has enabled the successful market introduction of an integrated subsea business model, iEPCI, which spans a project’s early phase design through the life of field. Our integrated business model is unlocking incremental opportunities and materially expanding the deepwater opportunity set. Since the first iEPCI project was awarded in 2016, market adoption of the business model has accelerated each year, and in 2019 we secured more than 75 percent of the industry’s integrated project awards.field services.


Through integrated FEED studies, or iFEED™ (“iFEED”), we are uniquely positioned to influence project concept and design. Using innovative solutions for field architecture, including standardized configurable equipment, new technologies, digital services, and simplified installation, we can significantly reduce subsea development costs and accelerate time to first production.

iEPCI is our unique, fully integrated approach to designing, managing, and executing subsea projects. By combining complementary skills with innovative technologies, we boost efficiency, lower costs, and accelerate time to first oil and gas for our clients. As the first and only subsea provider to integrate SPS with SURF and a fleet of installation vessels, we successfully created a new market opportunity in 2016 through our iEPCI offering. iEPCI projects are partnerships based on knowledge sharing and mutual trust. Success is based on early engagement and a collaborative, cooperative approach, both internally and with our clients.

Our first-mover advantage and ability to convert iFEED studies into iEPCI contracts, often as a direct award,awards, creates a unique set of opportunities for the Companyus that are not available to our peers. This allows us to deliver a fully integrated - and technologically differentiated - subsea system, and to better manage the complete work scope through a single contracting mechanism and a single interface, yielding meaningful improvements in project economics and time to first oil.

We continue to support our clients following project delivery by offering aftermarket and life of field services. Our wide range of capabilities and solutions, including integrated life of field, or iLOF™ (“iLOF”), allows TechnipFMCus to help clients
5


increase oil and gas recovery and equipment uptime while reducing overall cost. Our iLOF offering is designed to unlock the full potential of subsea infrastructures during operations by transforming the way subsea services are delivered and proactively addressing the challenges operators face over the life of subsea fields. We provide production optimization, asset life extension insight, proactive debottlenecking,de-bottlenecking, and condition basedcondition-based maintenance.

Our Subsea business depends on our ability to maintain a cost-effective and efficient production system, achieve planned equipment production targets, successfully develop new products, and meet or exceed stringent performance and reliability standards.
Principal
Subsea Segment Products and Services
Subsea Production Systems. Our systems are used in the offshore production of crude oil and natural gas. Subsea production systems are placed on the seafloor and are used to control the flow of crude oil and natural gas from the reservoir to a host processing facility, such as a floating production facility, a fixed platform, or an onshore facility.

Our subsea production systems and products include subsea trees, chokes and flow modules, manifold pipeline systems, controlcontrols and data managementautomation systems, well access systems, multiphase and wetgaswet-gas flow meters, and additional technologies. The design and manufacture of our subsea systems requires a high degree of technical expertise and innovation. Some of our systems are designed to withstand exposure to the extreme hydrostatic pressure of deepwater environments, as well as internal pressures of up to 20,000 pounds per square inch (“psi”("psi") and temperatures of up to 400º F. The development of our integrated subsea production systems includes initial engineering design studies and field development planning and considers all relevant aspects and project requirements, including optimization of drilling programs and subsea architecture.

Subsea Processing Systems. Our subsea processing systems, which include subsea boosting, subsea gas compression, and subsea separation, are designed to accelerate production, increase recovery, extend field life, lower greenhouse gas emissions, and/or lower operators’ production costs for greenfield, subsea tie-backstie-back and brownfield applications. To provide these products, systems, and services, we utilize our engineering, project management, procurement, manufacturing, and assembly and test capabilities.
Flexible Pipe
Subsea Umbilicals, Risers and Umbilical Supply.Flowlines. We are a leading provider of SURF infrastructure. We develop, engineer, manufacture and manufactureinstall umbilicals, rigid pipelines and flexible pipes, as well as steel tube, thermoplastic hose, powerconnections and communicationtie-ins for subsea systems. Our rigid pipes are installed using our fleet of differentiated rigid pipelay vessels and hybrid (a combination of steel tube, thermoplastic hose,are designed to optimize flow assurance through innovative insulation coatings, electric trace heating, plastic liners, and electrical cables) umbilicals. TechnipFMCpipe-in-pipe systems.
Our vessels will typically perform the installation of the flexible pipes and umbilicals, but we also sell these products directly to oilenergy companies or to other vessel operators. We offer a comprehensive range of umbilical systems including steel tube umbilicals, thermoplastic hose umbilicals, power and communication systems and hybrid umbilicals. We are also qualifying a hybrid flexible pipe system, which is highly resistant to corrosive compounds, and will extend the operating envelope of flexible systems while reducing cost and weight.

Vessels. We operatehave a fleet of 18 vessels. Of17 vessels that are used for the 18 vessels currently in operation, weinstallation and servicing of our products. We have sole ownership of tennine vessels, ownership of six vessels as part of joint ventures, and operate two vessels operated under long-term charter.charter agreements.

We wholly own four pipelay support vessels and jointly own six subsea construction vessels. The jointly-owned vessels operate under a 50/50 ownership structure exclusively in the Brazilian market. These vessels are primarily contracted to Petróleo Brasileiro S.A. - Petrobras (“Petrobras”), principally to install umbilical and flexible flowlines and risers to connect subsea wells to floating production units across a range of water depths. We also own three subsea construction vessels and have long-term charter agreements for two other construction vessels. The Company also owns three dive support vessels.
Subsea Services. We provideSubsea services provides a portfolio of well and asset services that improve uptime, lower lifecycle costsdrive value and increase recovery overefficiency throughout the life of our clients' subsea development cycle. Our vision is to deliver customer service excellence every day, with the field forpurpose of maximizing the performance of our clients’ subsea assets. Thesewell and asset operations.

Well Services include all service offerings for the well:
ROV Services: remotely operated vehicle ("ROV") drill support services, include: (i) provision of explorationenabled by Schilling Robotics, TechnipFMC’s underwater robotics group;


Drilling Services: exploration and production wellhead systems and services; (ii) remotely operated vehicle (“ROV”) services; (iii) installationand
Installation Services: Installation of trees, tubing hangers and well completion rig services; (iv) maintenance servicesof the well.

Asset Services include all service offerings for the asset:
Maintenance Services: test, modification, refurbishment and upgrade of subsea equipment and tooling; (v) asset integrity services based on product and field data to optimize
Asset Integrity Services: optimizing the performance of the subsea asset through product and field data, including proactive inspection, maintenance and repair (“IMR”) of subsea infrastructure; (vi) well access and intervention services, both rig-based and vessel-based (riserless light well intervention or “RLWI”("IMR"); (vii) production management services to enhanceand
6


Production Management Services: enhanced well and field production, including subsea multiphase boosting and real timereal-time virtual metering services; and (viii) well plug, abandonmentflow assurance services.

Intervention and decommissioning. Our vision is to transform the customer experience with an agile services culturePlug and grow our business across the life of the field.Abandonment Services:
Key drivers of subsea services market activity are the inspection Rig and maintenance of subsea infrastructure, driven in large part by aging infrastructure on mature fields. The need forvessel-based well intervention services also continuesand subsea plug and abandonment.

Subsea Studio™ Digital Platform. Through Subsea Studio™, we connect data, technology, and expertise to grow,optimize the development, execution, and operation of current and future subsea fields. Our open and connected ecosystem can exchange data efficiently with more than 6,500 wells operated globally.suppliers, partners, and clients, providing immediate access to relevant information, and improving efficiency and quality of decisions and planning. Subsea Studio™ establishes a data flow, or a “digital thread,” that connects applications using common data models throughout a project’s lifecycle. Each decision is data-driven and each piece of actionable data is made readily available. We utilize this data to create value for our clients through efficiency gains, optimized productivity, and increased reliability.

WithOur Subsea Studio™ portfolio of digital solutions is comprised of:
Subsea Studio™ FD, which combines our extensive experience in subsea equipment, our large installed base of subsea production equipment, our broad range of services,expertise and our historical technicaldigital technologies to design, optimize, and manufacturing leadership, we are inselect the best field development, thereby increasing quality and reliability and accelerating time to first oil;
Subsea Studio™ EX, which increases execution efficiency and speed by using a unique position to offer integrated solutions across the “life of field” services combining asset light solutions (e.g. RLWI), digital services (e.g. data driven monitoring, surveillancedata-centric approach, automation, collaboration, and seamless interfaces; and
Subsea Studio™ LOF, which enhances performance and production management suite of applications),targets through digitally enabled operations and leading edge automated systems (e.g. Schilling ROVs) to enhance the economics of producing fields through maximization of asset uptime, higher production volumes, and lower operating expense.services.
Robotics, Controls and Automation.
We design and manufacture ROVs and manipulator arms that are used in subsea drilling, construction, IMR, and life of field services. Our product offering includes electric and hydraulic work-class ROVs, tether-management systems, launch and recovery systems, remote manipulator arms, and modular control systems. We also provide support and services such as product training, pilot simulator training, spare parts, and technical assistance.
We also provide electro-hydraulic and electric production and intervention control systems, allowing accurate control and monitoring of subsea installations to ensure the highest production availability that can ensure safe and environmentally friendly field operations. These include the sensors, multiphase flow meters, digital infrastructure, integrity monitoring, control functionality, and automation features needed for subsea systems. Robotics capabilities are now being used in the control of manifold valves during production, which demonstrates a convergence of our technologies in order to provide better systems for our customers.
Research, Engineering, Manufacturing and Supply Chain (“REMS”). REMS is an organization we formed in September of 2019 to support accelerated technology innovation,development and product delivery improvements.manufacturing innovation. We accomplish this by reducing the cycle-time of engineering and manufacturing our products, including working with our suppliers to reduce their costs, and optimizing our processes and how we manage workflow.workflow management. Through REMS, we are focused on challenging the existing technologies and implementing world-class manufacturing practices, including LEAN and process automation, to improve reliability while reducing total product cost and lead time to delivery. Our REMS organization primarily supports both our Subsea segment but is also integrated across ourand Surface Technologies business.segments.
Also this year,
Product Management. In 2019, we established a Product Management function to furtherexpand our capabilities to understand,assess, define, and deliver the technologies and products of the future. This function will provide a complement tohelps our REMS organization and Subsea and Surface business, and willTechnologies businesses to drive the understanding of customer requirements, the competitive landscape, and investment prioritization.
Capital Intensity
Many of the systems and products we supply for subsea applications are highly engineered to meet the unique demands of our customers’ field properties and are typically ordered one to two years prior to installation. We often receive advance payments and progress billings from our customers to fund initial development and working capital requirements.
Dependence on Key Customers
Generally, our customers in the Subsea segment are major integrated oil companies, national oil companies, and independent exploration and production companies.


We actively pursue alliances with companies that are engaged in the subsea development of oil and natural gas to promote our integrated systems for subsea production. These alliances are typically related to the procurement of subsea production equipment, although some alliancesof them are related to EPCI services. Development of subsea fields, particularly in deepwater environments, involves substantial capital investments. Operators have also sought the security of alliances with us to ensure timely and cost-effective delivery of subsea and other energy-related systems that provide integrated solutions to meet their needs.

Our alliances establish important ongoing relationships with our customers. While these alliances do not contractually commit our customers to purchase our systems and services, they have historically led to, and we expect that they would continue to result in, such purchases.

The commitment to our customers goes beyond project delivery, and we nurture these alliances with transparency and collaboration to better understand their needs to ensure customer success.

No single Subsea customer accounted for 10% or more of our 20192021 consolidated revenue.

7


Competition
We are the only fully integrated company that can provide the complete suite of subsea production equipment, umbilicals, and flowlines with the complete portfolio of installation and LOF services, enabling us to develop a subsea field as a single company. Our company competesWe compete with companies that supply some of the components, as well as installation companies. Our competitors include Aker Solutions ASA, Baker Hughes Company (“Baker Hughes”), Dril-Quip, Inc., McDermott International, Inc. (“McDermott”), National Oilwell Varco, Oceaneering International, Inc., Saipem S.p.A. (“Saipem”), Schlumberger, Ltd. (“Schlumberger”), and Subsea 7 S.A.

Seasonality
In the North Sea, winter weather generally subdues drilling activity, reducing vessel utilization and demand for subsea services as certain activities cannot be performed. As a result, the level of offshore activity in our Subsea segment is negatively impacted in the first quarter of each year.

Market Environment
The volatile, and generally low, crude oil price environment overOur Subsea inbound orders in 2021 increased more than 20 percent versus the last four years led many of our customers to reduce their capital spending plans or defer new deepwater projects. The reduction and deferral of projects resulted in delayed subsea project inbound forprior year reflecting the industry. In response to the lower commodity prices and reduced cash flow, operators took actions needed to improve their subsea project economics, and suppliers, in turn, took the steps necessary to further reduce project break-even levels by offering cost-effective approaches for project developments. These actions continue.
The rate of project sanctioning for new subsea developments has moved higher since thecontinued offshore market trough as project economics and operator confidence have improved. Similarly to other parts of the market (e.g. onshore), the trajectory and pace of further recovery and expansion in the subsea market is subject to the allocation of capital our clients dedicate to developing offshore oil and gas fields amongst their entire portfolio of projects and drivers of capital expansion or discipline. The risk of project sanctioning delays is still present in the current environment; however, innovativeexpansion. Innovative approaches to subsea projects, like our iEPCI solution, have improved project economics, and many offshore discoveries can be developed economically atwell below today’s crude oil prices. In the long-term,We believe deepwater development is expectedlikely to remain a significant part of many of our customers’ portfolios.
Strategy
WithAs the subsea industry continues to evolve, we have taken actions to further streamline our proprietary technologiesorganization, achieve standardization and reduce cycle times. The rationalization of our global footprint will also further leverage the benefits of our integrated offering. We aim to continuously align our operations with activity levels, while preserving our core capacity in order to deliver current projects in backlog and fulfill future orders.

While still impacted by the pandemic, economic activity improved over the course of 2021. Increased global demand and production systems, integration expertise,curtailments by the OPEC+ countries have resulted in improved oil prices, which in turn support market supply growth. Long-term demand for energy is forecast to rise, and comprehensive solutions, we believe this outlook provides our customers with the confidence to increase investments in new sources of oil and natural gas production.

Strategy
We are transforming our clients’ project economics. We have used these capabilities to develop a new subsea commercial modelenergy production by safely providing innovative solutions that improve economics, enhance performance, and reduce emissions.

The energy landscape is transforming the way we interact with our customers and create value with them.
Our strategy includes the following priorities:
Engagement in the conceptual design and integrated front-end engineering, or iFEED, of subsea development projects to create value through technology and integration of scopes (iEPCI) by simplifying field architecture and accelerating both delivery schedules and time to first production;


Innovative research and development (“R&D”), often in collaboration with clients and partners, to develop leading products and technologies that deliver greater efficiency to the client, lower development costs, unlock stranded and/or marginal fields, and enable frontier developments;
Focus on selecting the right projects to ensure a strong and healthy backlog;
Superior project execution capabilities allowing the Company to mobilize the right teams, assets, and facilities to capture and profitably execute complex subsea projects and services;
Capitalize on combined competencies coming from alliances and partnerships with both clients and suppliers; and
Leverage supplier relationships to optimize supply chain market dynamics and implement greater simplification and standardization in products and processes.
TechnipFMC is a clear leader in the subsea industry. Our success has been built on our technological strength, innovation, focus on digitalization, and strong partnerships with major oil companies to expand market opportunities.
Recent and Future Developments
In 2019, our Subsea inbound orders increased more than 50 percent versus the prior year, driven by further adoption of the integrated model and growth in services activity. The value of integrated project awards also more than doubled from the levels we recorded in 2018. Subsea services continued to benefit from the industry's largest and expanding installed base, with growth in the year reflecting increased installation, asset refurbishment and well intervention activities. Subsea services remains on track for double-digit growth in 2020.
We continue to focus on performance improvement and optimization strategies that will improve our profitability. Our investments decisions fully support our business with technologies that will differentiate our portfolio.
In December 2019, we completed the sale of the G1201 vessel as part of our overall strategy to optimize the profile and size of its subsea fleet. In addition to the sale transaction we also executed a Memorandum of Agreement which includes a Collaboration Agreement with the buyer that provides 5 years of exclusivity for a list of named subsea projects in a specific jurisdiction and the right of first refusal for other projects. This followed the announcement of our Strategic Collaboration Agreement with Allseas aimed at jointly pursuing specific deepwater projects where the assets, products and capabilities of both companies are complementary. This supports the Company’s intent to use collaboration agreements, where possible, to execute its differentiated iEPCI™ business model.
We received the industry’s first award of a 20K high-pressure, high-temperature system for LLOG’s Shenandoah project in the Gulf of Mexico. This new technology was the result of our joint industry program that included 5 major operators. This was the first time the industry collaborated to develop a new subsea system focused on the delivery of a single-part number and designed to handle hydrocarbons under the industry's most extreme pressure and temperature conditions to date.
We have accelerated our digital journey to deliver an integrated digital thread from Front End to Services, thus enhancing the performance of our products and services as well as safety and asset integrity. With its presence all along theevolving rapidly, yet oil and gas value chain, TechnipFMC is well-placedwill remain important to leverage data to improve and enhance the performance of our clients’ assets, optimize operational costs, deliver predictive and preventive maintenance, and enable remote operations.
Our inbound order growth for the full year was significantly better than the total Subsea market growth. This high level of growth cameenergy mix in the third year of a market recovery anddecades to come. Our vision for Subsea, which is the highest annual growth rate we have experienced in a decade. Strength in project activity, as well as our expectation for double-digit revenue growth in Subsea Services, provides the framework for 2020 Subsea orders to approach the level achieved in 2019, although this remains dependentfocused on the timing of one or two major project awards. We expect our iEPCI capabilities to provide a competitive advantage as we deliver comprehensive and differentiated solutions. In addition, we anticipate the following longer-term trends in the subsea market:
Increased market adoption of integrated subsea projects, leading to further penetration of our integrated business modeloffering and higher levelsenabled by our digital solutions and innovative products, unlocks new possibilities for growth both in oil and gas and in new energy sources. By capitalizing on our subsea expertise, core competencies, and integration capabilities, we will empower the production of oil and gas and new energies, while reducing carbon emissions.

Through our established Subsea services and our transformative offerings including iEPCI order activity for our Company;and Subsea 2.0™, we are making all types of energy produced offshore more sustainable, economical, and competitive.


Growing service opportunities, driven by (i) higher levels of project activity, (ii) increased asset integrity and production management activitiesAs we look to the future, we remain focused on improving uptimeour innovative technologies and production volumesolutions, client relationships, and lowering emissions,execution excellence. We will accomplish this by:

Developing and (iii) increased maintenanceempowering our people;
Becoming a data-centric organization;
Advancing automation and intervention activity resulting from an expandingrobotics; and aging installed equipment base;
Smaller projects and direct awards will continue to contribute meaningfully to our order mix. In 2018 and 2019, these awards collectively represented just under one-half of our total subsea inbound orders, with the remainder being publicly announced projects and subsea service activities. Subsea tiebacks are often part of this mix, and these shorter cycle brownfield expansions provide operators with faster paybacks and higher returns;Working towards all-electric fields.
There is a growing trend towards independent operators and new entrants undertaking subsea developments; we are a natural partner for this customer group because of our ability to offer fully integrated solutions; and
Natural gas developments are growing in prominence. We believe that more than 20 percent of offshore capital expenditures could be directed at natural gas developments by early next decade. We also anticipate that 45 percent of gas production will come from offshore, with significant growth in the Middle East (shallow water) followed by Australia (deep water) in the next five years.
We continue to work closely with our customers and believe that, in the context of lower oil prices, with our unique business model we can further reduce their project break-even levels by offering cost-effective approaches to their project developments and accelerate time to first oil and gas.
Product Development
We are industrializing our Subsea business with Subsea 2.0 by using pre-engineered modular architectures to achieve a fully flexible suite of product offerings, while making an evolutionary shift from unique project requirements to a Configure to Order ("CTO") execution model.

8


Our Subsea 2.0 configurable product platform consists of pre-engineered products designed to provide the flexibility to accommodate customer needs and functional requirements, combining field-proven and new technologies.

Our CTO execution model requires no product engineering work to deliver these configurable products to our clients, ensuring quality, manufacturing, supply chain, and services are fully industrialized to deliver the value offered with Subsea 2.0.

Our CTO Subsea 2.0 program attributes include:
Pre-engineered standard configurations;
Pre-approved and qualified supply chain;
Pre-defined quality, code, and surveillance requirements;
Optimized manufacturing with dedicated capacity; and
Pre-defined and developed services.

Pivoting from bespoke Engineer to Order ("ETO") solutions unique to every project to pre-engineered CTO products, we can leverage the efficiencies our execution model creates and bring value to our clients through reduced lead time, an optimized execution model, and improved predictability and reliability for delivery.

Partnerships and Acquisitions
Acquisitions

In 2014,2018, we entered into a joint development agreementventure with several major operators to develop common standards for subsea production equipment capableIsland Offshore Management AS ("Island Offshore") called TIOS AS. In August 2021, we acquired the remaining 49% interest in TIOS AS at a total price of operating at pressures as high as 20,000 psi and temperatures up to 350º F.$48.6 million. This joint development agreement is delivering standardized design, materials, processes, and interfaces to provide improved reliability and operations over the life of the field. The first major achievement of this joint development effort, and further highlighting our technology-based solutions focused on creating customer success, we delivered a complete production system for Shell’s high-pressure and high-temperature Appomattox field in the Gulf of Mexico in 2018, and Shell began producing from Appomattox in May of 2019.
Technology development progressed on our Subsea 2.0 product platform, the next generation of subsea equipment, using designs that are significantly simpler, leaner, and smarter than current designs. These new products incorporate a modular product architecture and component level standardization to enable a flexible configure-to-order approach, reducing hardware delivery time for clients. The products are expected to deliver breakthroughs in the way subsea products are manufactured, assembled, installed, and maintained over the life of the field. The smaller, lighter products achieve up to a 50 percent reduction in size, weight, and part count, while maintaining the same or improved functionality. When combined with iEPCI, our powerful integrated approach to field architecture, and project execution, Subsea 2.0 improves project economics and unlocks first oil and gas faster.
In addition to investments to develop lower cost production solutions, we also invest inwill accelerate the development of technologyTechnipFMC’s integrated service model focused on maximizing value to expand our service portfolio. We have qualified new technology to enable the inspection of flexible risers and flowlines. We also are advancing subsea robotic productivity through the development of more efficient ROV systems that are easier to operate and maintain.clients.
Acquisitions and Investments
In February 2018, we signed an agreement with the Island Offshore Group to acquire a 51 percent stake in Island Offshore’s wholly-owned subsidiary, Island Offshore Subsea AS. Island Offshore Subsea AS provides RLWI project management and engineering services for plug and abandonment (“P&A”), riserless coiled tubing, and well completion operations. In connection with the acquisition of the controlling interest, TechnipFMC and Island Offshore entered into a strategic cooperation agreement to deliver RLWI services on a worldwide basis, which also include TechnipFMC’s RLWI capabilities. Island Offshore Subsea AS has been rebranded to TechnipFMC Island Offshore Subsea (“TIOS”) and is now the operating unit for TechnipFMC’s RLWI activities worldwide.


In March 2018, we announced a collaboration agreement with Magma Global Ltd. (“Magma Global”) to develop a new generation of hybrid flexible pipe (“HFP”) for use in offshore applications. HFP is expected to provide increased strengththe traditional and fatigue performance, while also achieving dramatic weight and cost reductions, for subsea fluid transport applications.new energy industries. As part of the collaboration, TechnipFMCwe purchased a minority stakeownership interest in Magma Global. We are advanced in creating our new HFP and continue working towards important milestones in the qualification process.
In January 2019,October 2021, we acquired a new dive support vessel, the Deep Discoverer, to replace a vessel we retired in support of our fleet optimization strategy. The acquisition was somewhat opportunistic, but allowed us to obtain a high-quality, top-tier vessel significantly below newbuild cost and without a protracted delivery schedule. The vessel will operate primarily in the dive construction, inspection, maintenance and repair markets in the North Sea and can also support our iEPCI™ initiative in the region.
In December 2019, we completed the acquisition ofpurchased the remaining 50%ownership interest in Technip Odebrecht PLSV CV (“TOP CV”). TOP CV was formed as a joint venture between Technip SA and Ocyan SA to provide pipeline installation ships to PetrobrasMagma Global for its work in oil and gas fields offshore Brazil.$64.0 million.

Onshore/OffshorePartnerships
The Onshore/Offshore segment offers a full range of design, project management and construction services to our customers spanning the entire downstream value chain, including technical consulting, concept selection, and final acceptance test. We have been successful in meeting our clients’ needs given our proven skills in managing large EPC projects. When our announced separation is complete, this segment will be the cornerstone of Technip Energies.
Our Onshore business combines the study, engineering, procurement, construction, and project management of the entire range of onshore facilities relatedRefer to the production, treatment, and transportationOther Business Information Relevant to Our Business Segments section of oil and gas, the transformation of petrochemicals such as ethylene, polymers, and fertilizers, as well as other activities, and the commercialization of renewable energy and feedstocks.
We conduct large-scale, complex, and challenging projects that involve extreme climatic conditions and non-conventional resources and are subject to increasing environmental and regulatory performance standards. We relythis Annual Report on technological know-howForm 10-K for process design and engineering, either through the integration of technologies from leading alliance partners or throughinformation about our own technologies. We seek to integrate and develop advanced technologies and reinforce our strong project execution capabilities in each of our Onshore activities.
Our Offshore business combines the study, engineering, procurement, construction, and project management within the entire range of fixed and floating offshore facilities, many of which were the first of their kind, including the development of floating liquefied natural gas (“FLNG”) facilities.
Principal Products and Servicespartnerships.
Onshore E&C. We design and build different types of facilities for the development of onshore oil and gas, processing facilities, and product export systems. In addition, we renovate existing facilities by modernizing production equipment and control systems, in accordance with applicable environmental standards.
Refining. We are a leader in the design and construction of oil refineries. We manage many aspects of these projects, including the preparation of concept and feasibility studies, and the design, construction, and start-up of complex refineries or single refinery units. We have been involved in the design and construction of over 30 new refineries or major refinery expansions, and are one of the few contractors in the world to have built seven new refineries since 2000. We have extensive experience with technologies related to refining and have completed more than 840 individual process units within major expansion or refurbishment projects, implemented in more than 75 countries. As a result of our cooperation with the most highly renowned technology licensors and catalyst suppliers and our strong technological expertise and refinery consulting services, we are able to provide an independent selection of appropriate technologies to meet specific project and client targets. These technologies result in direct benefits to the client, such as emission control and environmental protection, including hydrogen and carbon dioxide management, sulfur recovery units, water treatment, and zero flaring. With a strong record of accomplishment in refinery optimization projects, we have experience and competence in relevant technological fields in the oil refining sector.


Natural Gas Treatment and Liquefaction. We offer a complete range of services across the gas value chain to support our clients’ capital projects from concept to delivery. Our capabilities include the design and construction of facilities for LNG, gas-to-liquids (“GTL”), natural gas liquids (“NGL”) recovery, and gas treatment.
In the field of LNG, we pioneered base-load LNG plant construction through the first-ever facility in Arzew, Algeria. Working with our partners, we have constructed facilities that can deliver more than 105 million metric tonnes per annum (“Mtpa”), which is a significant portion of the global liquefaction capacity in operation today. TechnipFMC brings knowledge and conceptual design capabilities that are unique among engineering and construction companies involved in LNG. We have engineered and delivered a broad range of LNG plants, including mid-scale and very large-scale plants, both onshore and offshore, and plants in remote locations. We have experience in the complete range of services for LNG receiving terminals from conceptual design studies to EPC. Reference projects include LNG trains in Qatar (the six largest ever constructed), Yemen, and a series of mid-scale LNG plants in China, and together with our joint venture partners, we delivered first phase of the Yamal LNG plant (“Yamal”) in the Russian Arctic with all three trains put in production before the end of 2018. During 2019, the Arctic LNG 2 project for Novatek was sanctioned following award of the EPC contract to us, together with our joint venture partners.
We are also well positioned in the GTL market and are one of the few contractors with experience in large GTL facilities. We have unique experience in delivering plants using Sasol’s “Slurry Phase Distillate” technology, and we have provided front-end engineering design for the Fischer-Tropsch section of more than 60 percent of commercial liquids conversion capacity worldwide. Our clients also benefit from our development of environmental protection measures, including low nitrogen oxide and sulfur oxide emissions, waste-water treatment, and waste management.
We specialize in the design and construction of large-scale gas treatment complexes as well as existing facility upgrades. Gas treatment includes the removal of carbon dioxide and sulfur components from natural gas using chemical or physical solvents, sulfur recovery, and gas sweetening processes based on the use of an amine solvent. The Company ranks among the top contractors in the field in relation to sulfur recovery units installed in refineries or natural gas processing plants. Given our long-term experience in the field of sour gas processing, we can provide support to clients for the overall evaluation of the gas sweetening/sulfur recovery chain and the selection of optimum technologies.
Ethylene. We hold proprietary technologies and are a leader in the design, construction, and commissioning of ethylene production plants. We design steam crackers, from concept stage through construction and commissioning, for both new plants (including mega-crackers) and plant expansions. We have a portfolio of the latest generation of commercially proven technologies and are uniquely positioned to be both a licensor and an EPC contractor. Our technological developments have improved the energy efficiency in ethylene plants by improving thermal efficiency of the furnaces and reducing the compression power required per ton, thereby reducing carbon dioxide emissions per ton of ethylene by 30 percent over the last 25 years.
Petrochemicals and Fertilizers. We are one of the world leaders in the process design, licensing, and realization of petrochemical units, including basic chemicals, intermediate and derivative plants. We provide a range of services that includes process technology licensing and development and full EPC complexes. We license a portfolio of chemical technologies through long-standing alliances and relationships with leading manufacturing companies and technology providers. We have research centers to develop and test technologies for polymer and petrochemical applications, where fully automated pilot plants gather design data to scale-up processes for commercialization.
Hydrogen. Hydrogen is the most widely used industrial gas in the refining, chemical, and petrochemical industries, and is also widely used in the production of cleaner transport fuels. We offer a single point of responsibility for the design and construction of hydrogen and synthesis gas production units, with solutions ranging from Process Design Packages to full lump-sum turnkey projects. We also offer services for maintenance and performance optimization of running units. We have solutions in place for carbon capture readiness in future hydrogen plants, targeting more than a two-thirds reduction in carbon dioxide release from the hydrogen plant.
Fixed Platforms. We offer a broad range of fixed platform solutions in shallow water, including: (i) large conventional platforms with pile steel jackets whose topsides are installed offshore either by heavy lift vessel or floatover; (ii) small, conventional platforms installed by small crane vessel; (iii) steel gravity-based structure platforms, generally with floatover topsides; and (iv) small to large self-installing platforms.
Floating Production Units. We offer a broad range of floating platform solutions for moderate to ultra-deepwater applications, including:


Spar Platforms: Capable of operating in a wide range of water depths, the Spar is a low motion floater that can support full drilling with dry trees or with tender assist and flexible or steel catenary risers. The Spar topside is installed offshore either by heavy lift vessel or floatover.
Semi-Submersible Platforms: These platforms are well-suited for oil field developments where subsea wells drilled by a mobile offshore drilling unit are appropriate. Semi-Submersibles can operate in a wide range of water depths and may have full drilling and large topside capabilities. We have our own unique design of low-motion Semi-Submersible platforms that can accommodate dry trees.
Tension-Leg Platforms (“TLP”): An appropriate platform for deepwater drilling and production in water depths up to approximately 1,500 meters, the TLP can be configured with full drilling or with tender assist and is generally a dry tree unit. The TLP and our topside can be integrated onto the substructure in a cost-effective manner at quayside.
Floating Production, Storage and Offloading (“FPSO”). Working with our construction partners, we have delivered some of the largest FPSOs in the world. FPSOs enable offshore production and storage of oil which is then transported by a tanker where pipeline export is uneconomic or technically challenged (e.g., ultra-deepwater). FPSOs utilize onshore processes adapted to a floating marine environment. They can support large topsides and hence large production capacities. Leveraging our industry-leading capabilities in gas monetization, particularly FLNG, we are currently well-positioned to leverage the global offshore gas cycle with gas FPSOs.
Floating Liquefied Natural Gas (“FLNG”). FLNG is an innovative alternative to traditional onshore LNG plants and is suitable for remote and stranded gas fields that were previously deemed uneconomical. FLNG is a commercially attractive approach to the monetization of offshore gas fields. It avoids the cost of building and operating long-distance pipelines and extensive onshore infrastructure. We pioneered the FLNG industry and are the only contractor to integrate all of the core activities required to deliver an FLNG project: LNG process, offshore facilities, loading systems, and subsea infrastructure. We delivered the industry’s first and largest FLNG facilities and are currently executing ENI’s Coral South FLNG, which will be installed offshore Mozambique in East Africa.
Capital Intensity
Our Onshore/Offshore business executes turnkey contracts on a lump-sum or reimbursable basis through engineering, procurement, construction, and project management services on both brownfield and greenfield developments and projects. We can execute EPC contracts through sole responsibility, joint ventures, or consortiums with other companies. We often receive advance payments and progress billings from our customers to fund initial development and working capital requirements. However, our working capital balances can vary significantly through the project lifecycle depending on the payment terms and timing on contracts.
Dependence on Key Customers
Generally, our Onshore/Offshore customers are major integrated oil companies or national oil companies. We have developed long-term relationships with our main clients around our portfolio of technologies, expertise in project management, and strong execution. Our customers have sought the security of partnerships with us to ensure timely and cost-effective delivery of their projects.
One customer, JSC Yamal LNG, represented more than 10 percent of 2019 consolidated revenue. We do not anticipate JSC Yamal LNG representing more than 10 percent of our consolidated revenue beyond 2019 as the project nears completion. We consolidate all revenue from the JSC Yamal LNG partnership, including revenue associated with the minority partners of the joint venture.

Competition
In the onshore market, we face a large number of competitors, including U.S. companies (Bechtel Corporation, Fluor Corporation,, KBR, Inc. (“KBR”), and McDermott), Asian and Australian companies (Chiyoda Corporation, JGC Corporation, Hyundai Oilbank, Samsung Engineering Co., Ltd, SK Energy Co., Ltd and WorleyParsons Limited), European companies (John Wood Group plc, Maire Tecnimont Group, Petrofac, Ltd., Saipem, and Tecnicas Reunidas, S.A.),. In addition, we compete against smaller, specialized, and locally-based engineering and construction companies in certain countries or for specific units such as petrochemicals.


Competition in the Offshore market is relatively fragmented and includes various players with different core capabilities, including offshore construction contractors, shipyards, leasing contractors, and local yards in Asia Pacific, the Middle East, and Africa. Competitors include China Offshore Oil Engineering Co., Ltd., Daewoo Shipbuilding & Marine Engineering Co., Ltd., Hyundai Heavy Industries Co., Ltd., JGC Corporation, KBR, McDermott, MODEC Inc., Saipem, and Samsung Heavy Industries Co., Ltd.
Seasonality
Our Onshore business is generally not impacted by seasonality. Our Offshore business could be impacted by seasonality in the North Sea and other harsh environment regions during the offshore installation campaign at the end of a project.
Market Environment
The onshore market is impacted by changes in oil and gas prices, but is typically more resilient than offshore markets. Indeed, some downstream markets have benefited from low commodity prices where market fundamentals are influenced by other economic factors (e.g., petrochemicals and fertilizers that are linked to global growth). This market dynamic is mostly present in developing countries with rapidly growing energy demand (in particular, Asia) and countries with abundant oil and gas reserves that have decided to expand downstream (in particular, the Middle East and Russia). The onshore market remains relatively small in Western Europe with a diversity of projects, including a second generation of bio ethanol plants. The North American onshore market is experiencing a strong recovery in the wake of the oil and gas shale revolution.
The offshore market is more directly impacted by changes in oil prices. Offshore fields in the Gulf of Mexico, the Middle East, and the North Sea were the traditional backbone for investments in the last decade. Recent discoveries of offshore fields with reserves in other regions such as Brazil, Australia, and East Africa are expected to become drivers of increased investment. In the long-term, gas is expected to become a bigger portion of the global energy mix, requiring new investments in the upstream industry.
Strategy
Our strategy is based on the following:
Selectivity of clients, projects, and geographies, which serves to maintain early engagement, leading to influence over technological choices, design considerations, and project specifications that make projects economically viable;
Technology-driven differentiation with strong project management, which eliminates or significantly reduces technical and project risks, leading to both schedule and cost certainty without compromising safety; and
Excellence in project execution, because of our global, multi-center project delivery model complemented by deep partnerships and alliances to ensure the best possible execution for complex projects.
TechnipFMC’s Onshore/Offshore segment continually invests in innovation and technology. The Company is at the forefront of digital solutions due in part to our investment in 3D models, often referred to as digital twin, and interfaces.
Recent and Future Developments
In response to industry challenges to improve project economics in the Offshore market, we are continuing our cost reduction efforts to align capacity and capabilities with market demands. As such, in 2018 we sold our interest in the Pori Offshore yard in Finland.
Onshore market activity continues to provide a tangible set of opportunities, including natural gas, refining, and petrochemical projects.


Activity in LNG is fueled by higher demand for natural gas, a fuel source that continues to command a greater share of global energy demand. Natural gas will play an essential role as an energy transition fuel, helping to meet the increasing demand for energy while lowering greenhouse gases when compared to current fuel sources. This trend is structural, driven by market preference for cleaner energy sources and the need to satisfy growing domestic demand in markets such as Asia and the Middle East. To meet this demand, we believe that large gas projects will need to be sanctioned in the near future, as evidenced by both the significant increase in pre-FEED and FEED contract awards and higher levels of pre-bid project planning experienced in 2019. The award of Novatek’s Arctic LNG 2 project and its sanction in late 2019 confirmed this trend.
As onshore market activity levels remain stable, it provides our business with the opportunity to engage early with our clients and pursue additional front-end engineering studies, which serve to optimize project economics while also mitigating risks during project execution. Market opportunities for downstream front-end engineering studies and full EPC projects in both LNG and refining are most prevalent in the Middle East, Africa, and Asia. We continue to track near-term prospects for petrochemical and fertilizer projects as well. We believe this broad opportunity set could generate additional inbound orders in the coming years.
In response to an increase in demand for gas, Offshore continued as a leader in gas FPSO projects. In addition to the ongoing Karish project for Energean, we were awarded the EPCI contract for BP’s Tortue gas FPSO, which will be deployed offshore West Africa.
Product Development
We are positioned as a premier provider of project execution and technology solutions, which enables our customers to unlock resources at advantaged capital and operating economics. We invest in these main Onshore R&D areas: (i) the development of process technology and equipment for economy of scale; (ii) continuous improvement of our proprietary process technologies and other solutions to reduce operating and investment cost; and (iii) diversification of our proprietary technology offering.
Our Offshore R&D efforts are focused on improving the economics of our clients’ diverse fixed and floating platform projects. Additionally, to further reduce operating and investment costs, we continue to progress the development of robotic solutions for offshore platforms and work towards a standard and adaptable design for Normally Unmanned Installations (“NUI”). We are also evaluating the various opportunities that will emerge as the industry and societal demands shift as part of the energy transition. The Company continues to assess and implement the best digital technologies to support the business.
Acquisitions and Investments
No acquisitions or significant investments occurred during 2019 or 2018.
Surface Technologies
The Surface Technologies segment designs, manufactures, and services products and systems used by companies involved in land and shallow water exploration and production of crude oil and natural gas. Such productsOur Surface Technologies product families include drilling, stimulation, production, measurement, and systems include: (i) wellhead systems, (ii) hydraulic fracturing systems, including fracturing valves, pumps, rigid flowlines, and flexible flowlines, (iii) production, separation, and flow processing systems, and (iv) measurement products and integrated systems.services. We manufacture most of our products internally and onin facilities located worldwide.
Principal Products and Services
Upstream Production.Drilling. Our upstream production offering includes well control, safety and integrity systems, multiphase meter modules, in-line separation and processing systems, and standard pumps. These offerings are differentiated by our comprehensive portfolio of in-house compact, modular, and digital technologies, and are designed to enhance field project economics and reduce operating expenditures with an integrated system that spans from wellhead to pipeline.
Our high-efficiency solutions, such as our separation portfolio and measurement technologies, combined with our expertise in modularization, enable our customers to achieve first production faster with fully optimized and environmentally-conscious, compact systems.


Well Control and Integrity Systems: We supply control components and safety systems designed to safely and efficiently run either a wellpad, modules on an offshore platform, or a production facility. Our systems are based on standard, field-proven building blocks and designed for minimal maintenance during life of field operations.
Surface Multiphase Meter: Our multiphase meters (“MPMs”) are a collection of technologically-advanced innovations that provide a differentiated approach to multiphase measurement. The patented technology in our MPMs offers many unique features that provide a step change in allocation measurement and allows for continuous surveillance of wells across a full range of operating conditions. Our MPMs provide real-time data to a central facility, ordrilling and completion systems for both standard and custom engineered applications. The customer base of our cloud portal, for production reportingdrilling and remote notification and system troubleshooting.
Separation and Processing Systems: TechnipFMC provides industry-leading technology for the separation of oil, gas, sand, and water. These solutions are used in onshore production facilities and on offshore platforms worldwide. Our family of separation products delivers client success by increasing efficiency and throughput and reducing the footprint of processing facilities. Our separation systems offering includes internal components forcompletion offerings is oil and gas multiphase separation, in-line deliquidisers,exploration and solids removal,production companies.
Surface Wellheads and Production Trees. Our products are used to control and regulate the flow of crude oil and natural gas from the well. The wellhead is a system of spools and sealing devices from which the entire downhole well string hangs and provides the structural support for surface production trees. Production trees are comprised of valves, actuators and chokes which can be combined into various configurations, depending on customer-specific requirements.
Surface wellheads and production trees are “per-well” systems which are designed for onshore shale, onshore conventional, and offshore shallow water platform applications, and are typically sold directly to exploration and production operators during the drilling and completion phases of the well lifecycle. Our surface wellhead and
9


production tree systems are used worldwide, and we are one of the few companies that provide global coverage and a full range of system configurations, including conventional wellheads, Unihead® drill-thru wellheads designed for faster installation and drill-time optimization, and high-pressure, high-temperature (“HPHT”) systems for extreme production applications.

We also provide services associated with our surface wellhead and production tree portfolio, including service personnel and rental tooling for wellhead and production tree installation and life of field repair, refurbishment, and general maintenance. Our wellhead and production tree business relies on our ability to successfully provide the necessary field operations coverage, responsiveness, and reliability to prevent downtime and non-productive time during the drilling and completion phases.

Stimulation and Pressure Pumping. Our iComplete™ (“iComplete”) offering is the first integrated pressure containment kit for the onshore conventional stimulation market. Its CyberFrac™ digital platform reduces manpower in the red zone and enables efficiencies that significantly reduce greenhouse gas (“GHG”) emissions, lower downtime, and eliminate the integration burden for operators.

We are one of the few oilfield service providers that can offer an integrated solution covering the fracturing through flowback phases. iComplete provides our exploration and production customers with an integrated rental and service offering, including fracturing tree and manifold systems, as well as fully assembled separation modulespressure control flowlines, flowback and packages designedwell testing equipment, and fabricated for oil and gas separation, fracturing flowback treatment, solids removal, and primary produced water treatment.field services.

Standard PumpsFracturing Tree and Skid SystemsManifold Systems.: TechnipFMC provides complete skid solutions, from design consultation During the completion of a shale well, the well undergoes hydraulic fracturing. During this phase, durable and wear-resistant wellsite equipment is temporarily deployed. Our equipment is designed to sustain the high pressure and highly erosive fracturing fluid which is pumped through startup and commissioning. We offer a diverse line of reciprocating pumps, customized according to the application with pressure ranges available up to 10,000 psi and flow rates up to 1,500 gpm.well into the formation.
Automation
Our equipment (fracturing tree systems, fracturing valve greasing systems, hydraulic control units, fracturing manifold systems, and Digital Systems: TechnipFMC provides hardwarerigid and software solutions to automateflexible flowlines) is temporarily laid out between the wellhead and provide simple human interfacesthe fracturing pump truck during hydraulic fracturing. Exploration and production operators typically rent this equipment directly from us during the hydraulic fracturing activities. Associated with our fracturing equipment rental is fracturing rig-up / rig-down field service personnel as well as oversight and operation of the equipment during the multiple fracturing stages for a shale well.

TechnipFMC’s manifold solutions help increase operational efficiency for a pad site with multiple wells. Our SuperFrac™ manifold provides time savings and pumping efficiencies when stimulating multiple wells on a single pad. The manifolds are installed and connected to multiple trees off the critical path, which allows our customers to fracture more stages per day in a compact footprint and efficiently move operations from one well to another, saving time and money. We also offer conventional and articulating arm manifold trailers, which are used as the connection point between fracturing pump trucks and the fracturing flowline and manifold system.

Our Ground Level Fracturing System is an essential tool for unconventional operators who use simultaneous operations to efficiently run completions in multi-well pads. The innovative system design uses various lengths of trunkline to align the SuperFrac™ manifold and fracturing tree at ground level, which minimizes the number of its critical products. These digital offerings help enableflowline connections for safer operation. We are a significant supplier of flowline pipework (rigid and flexible) that is used to move the removal of personnelfracturing product from critical zones either offshore or onshore. In addition the digital signatures from our products can then be interpreted and usedpump truck, via condition performance monitoring to eliminate unplanned downtime.the manifold, into the fracturing trees.

Pressure Control.Pumping. We design and manufacture equipment used in well completion and stimulation activities by major oilfield seviceservice and drilling companies, as well as by oil and gas exploration and production operators directly.
Flowline:
Flexibles.TechnipFMC isWe have been a leading supplier of flexible lines since the 1970s and have successfully introduced our Coflexip® portfolio of flexible solutions for the onshore market. Our PumpFlex™ and WellFlex™ products can be incorporated into most shale operations and are an integral part of our iComplete system.

Flowline. We are a leading supplier of flowline products and services to the oilfield industry. From the original Chiksan® and Weco® products to our revolutionary equipment designs and integrated services, our family of flowline products and services provides our customers with reliable and durable pressure pumping equipment. Our facilities stock flowline products in the specific sizes, pressures, and materials common to each region. Our commitment is to help our customers worldwide attain maximum value from their pressure pumping assets by guaranteeing that the right products arrive at the job site in top working condition. Our total solutions approach
10


includes the InteServ tracking and management system, mobile inspection and repair, strategically located service centers, and genuine Chiksan® and Weco® spare parts.

Well Service PumpsPumps.: TechnipFMC offers We offer a diverse line of well service pumps for use in high-pressure pumping operations such as hydraulic fracturing and stimulation, including triplex and quintuplex pumps, each with its own industry-leading features, including: (i) heavy-duty power ends, paired with main journal roller bearings and heavy-duty rod journal bearings, (ii) heavy-duty crankshafts, (iii) fluid cylinders, with accessible packing and valves, and (iv) made-to-order pumps. Our pumps can withstand some of the harshest operating conditions, with pressure ranges up to 20,000 psi and flow rates up to 1,500 gallons per minute.
All of our pumps are supported by dedicated service staff. We have the industry’s largest fleet of mobile units to perform complete inspection
Production. Our upstream production offering includes well control, safety and repair services at customer locations around the world. The mobile services include inspection, testing, repair, documentation,integrity systems, multiphase meter modules, in-line separation and certification, with the goal of extending product lifeprocessing systems, and reducing operator costs.
Drilling and Completion. We provide a full range of drilling and completion systems for both standard and custom engineered applications. The customer base of our drilling and completionpumps. These offerings are oildifferentiated by our comprehensive portfolio of in-house compact, modular, and gas explorationdigital technologies, and production companies.are designed to enhance field project economics and reduce operating expenditures with an integrated system that spans from wellhead to pipeline.
Surface Wellheads
Our iProduction™ system is the first automated integrated production platform for onshore unconventional. Our digital interface enables operators to manage their production operations remotely, leveraging Insitex data-monitoring technology. Our separation portfolio and Production Trees: Our products are usedmeasurement technologies, combined with our expertise in modularization, enable our customers to control and regulate the flow of crude oil and natural gas from the well. The wellhead is a system of spools and sealing devices from which the entire downhole well string hangs and provides the structural support for surfaceachieve first production trees. Production trees are comprised of valves, actuators and chokes which can be combined in both vertical and horizontal configurations, depending on customer-specific requirements.


Surface wellheads and production trees are “per-well”faster with compact systems which are designed for onshore shale, onshore conventional,fully optimized and offshore shallow water platform applications, and are typically sold directly to exploration and production operators during the drilling and completion phases of the well lifecycle. Our surface wellhead and production tree systems are used worldwide, and we are one of the few companies that provide global coverage and a full range of system configurations, including (i) conventional wellheads, (ii) Unihead® drill-thru wellheads designed for faster installation and drill-time optimization, (iii) high-pressure, high-temperature (“HPHT”) systems for extreme production applications, and (iv) steam-assisted gravity drainage (“SAGD”) and cyclic steam injection (“CSS”) thermal systems for heavy oil applications.
We also provide services associated to our surface wellhead and production tree portfolio including service personnel and rental tooling for wellhead and production tree installation and life of field repair, refurbishment, and general maintenance. Our wellhead and production tree business relies on our ability to successfully provide the necessary field operations coverage, responsiveness, and reliability to prevent downtime and nonproductive time during the drilling and completion phases.environmentally conscious.
Fracturing Tree and Manifold Systems
: During the completion of a shale well, the well undergoes hydraulic fracturing. During this phase, durable and wear resistant wellsite equipment is temporarily deployed, designed to sustain the high pressure and highly erosive fracturing fluid which is pumped through the well into the formation.
Our surface completions portfolio includes fracturing tree systems, fracturing valve greasing systems, hydraulic control units, fracturing manifold systems, and rigid and flexible flowlines. This equipment is temporarily laid out between the wellhead and the fracturing pump truck during hydraulic fracturing. These products are typically supplied to exploration and production operators who rent this equipment directly from us during the hydraulic fracturing activities. Associated with our fracturing equipment rental is fracturing rig-up / rig-down field service personnel as well as oversight and operation of the equipment during the multiple fracturing stages for a shale well.
TechnipFMC’s manifold solutions help increase operational efficiency for a pad site with multiple wells. Our TE Manifold provides time savings and pumping efficiencies when stimulating multiple wells on a single pad. The manifolds are installed and connected to multiple trees off the critical path, which allows our customers to fracture more stages per day in a compact footprint and efficiently move operations from one well to another, saving time and money. We also offer conventional and articulating arm manifold trailers which are used as the connection point between fracturing pump trucks and the fracturing flowline and manifold system.
Our Ground Level Fracturing System is an essential tool for unconventional operators who use simultaneous operations to efficiently run completions in multi-well pads. The innovative system design uses various lengths of trunkline to align the TE Manifold and fracturing tree at ground level, which minimizes the number of flowline connections for safer operation. We are a significant supplier of flowline pipework (rigid and flexible) that is used to move the fracturing product from the pump truck, via the manifold and into the fracturing trees.
With a presence in all the major shale plays worldwide, our fracturing offering is recognized for its reliability and durability.
Flowback and Well Testing Services:. After a shale well is hydraulically fractured, the well moves to the flowback phase in which much of the fracturing fluid pumped into the well flows back out through the wellhead and fracturing tree system. This phase lasts until the wellbore flow is adequate for flow through the production facilities downstream of the wellsite. Our flowback and well testing offering includes chokes, de-sanders,desanders, and advanced well testing equipment and related services which are provided to exploration and production operators during the flowback phase. Our Automated Well Testing Package (“AWT™”) is now widely used in North America, enabling operators to remove personnel from processes and its digital package anticipates service. These offerings enable a substantial reduction in downtime and enhanced safety.
Fracturing Integrated Offering
Well Control and Integrity Systems. (“Frac I/O”): We supply control components and safety systems designed to safely and efficiently run a wellpad, modules on an offshore platform, or a production facility. Our systems are onebased on standard, field-proven building blocks and designed for minimal maintenance during life of field operations.

Surface Multiphase Meter. Our multiphase meters (“MPMs”) are a collection of technologically advanced innovations that provide a differentiated approach to multiphase measurement. The patented technology in our MPMs offers many unique features that provide a step change in allocation measurement and allows for continuous surveillance of wells across a full range of operating conditions. Our MPMs provide real-time data to a central facility, or our cloud portal, for production reporting and remote notification and system troubleshooting.

Separation and Processing Systems. TechnipFMC provides industry-leading technology for the few oilfield service providers that can offer an integrated solution coveringseparation of oil, gas, sand, and water. These solutions are used in onshore production facilities and on offshore platforms worldwide. Our family of separation products delivers client success by increasing efficiency and throughput and reducing the fracturing through flowback phases.footprint of processing facilities. Our Frac I/O provides our explorationseparation systems offering includes internal components for oil and production customers with an integrated rentalgas multiphase separation, in-line deliquidizers, and service offering, including fracturing tree and manifold systems,solids removal, as well as fully assembled separation modules and packages designed and fabricated for oil and gas separation, fracturing flowback treatment, solids removal, and primary produced water treatment.

Standard Pumps and Skid Systems. We provide complete skid solutions, from design consultation through startup and commissioning. We offer a diverse line of reciprocating pumps, customized according to the application with pressure ranges available up to 10,000 psi and flow rates up to 1,500 gallons per minute.

Automation and Digital Systems. Our hardware and software solutions automate and provide simple human interfaces for a number of our critical products. These digital offerings help enable the removal of personnel from critical zones, either offshore or onshore. In addition, the digital signatures from our products can then be interpreted and used via condition performance monitoring to eliminate unplanned downtime.

11


Our recently launched E-Mission™(“E-Mission”) digital solution is the next level of optimization for surface production facilities. Using process automation and data, the system provides constant monitoring and adjustments in real time to minimize flaring by up to 50% while maximizing oil production. The technology is core to our iProduction™ offering and can be applied in existing facilities globally.

Measurement. We are making measurement smarter with integrated flow measurement and automation solutions, from the wellhead to the final point of sale. We deliver accurate and reliable measurement for the transportation, distribution, and storage of energy products by truck, rail, vessel, aircraft, and pipeline. We have the right products and systems to help with any application challenge. Our customers can reduce complexity by dealing with one supplier as we bring together reliable and accurate measurement and control flowlines, flowbacksystems, automation, and well testing equipment, and field services.key data insights.

Services. We offer our customers a comprehensive suite of service packages to ensure optimal performance and reliability of our equipment. These service packages include all phases of the asset’s life cycle: from the early planning stages through testing and installation, commissioning, and operations, replacement and upgrade, maintenance, storage, preservation, intervention, integrity, decommissioning, and abandonment.


Measurement Solutions. We design, manufacture,Our field proven integrated iExplore™(“iExplore”) services are designed to meet customer needs, minimize non-productive time, increase safety and service measurement products for theoptimize well economics long before oil and gas industry. Our flow computers and control systems manage and monitor liquid and gas measurement for applications such as custody transfer, fiscal measurement, and batch loading and deliveries. Our FPSO metering systems provide the precision and reliability required for measuring large flow rates of marine loading operations. Our gas and liquid measurement systems are utilized in multiple energy-related applications, including crude oil and natural gas production and transportation, refined product transportation, petroleum refining, and petroleum marketing and distribution. We combine advanced measurement technology with state-of-the-art electronics and supervisory control systems to provide the measurement of both liquids and gases. This ensures processes operate efficiently while reducing operating costs and minimizing the risks associated with custody transfer.
Loading Systems. We lead the market with reliable loading system solutions. We are globally recognized for setting technical and performance standards in fluid transfer, delivering liquid and gas loading systems to the most challenging applications, both onshore and offshore.
TechnipFMC leads the market with 10,000 marine loading arms supplied, including more than 500 arms for LNG applications. We have developed unique offshore LNG transfer systems for all FLNG facilities operating to date. We offer equipment design and fabrication projects, as well as services over the life of our systems. Our proven ability to innovate, coupled with our modern manufacturing and assembly techniques, serve as the foundation for the future development of fluid transfer systems capable of operating in the most hostile and challenging environments.
By offering both types of products covering the fullis online. iExplore covers an extensive range of midstreamdrilling and downstream applications, we can recommendwell testing requirements and provide the best solutionaccessories that deliver robust exploration solutions to our clients.
Capital Intensity
Surface Technologies manufactures most of its products, resulting in a reliance on manufacturing locations throughout the world, including fully owned manufacturing hubs in Stephenville, Texas, United States and Singapore, and a wide global network of third party suppliers. We also maintainmeet any onshore or offshore jackup rig challenges. iExplore is backed by a large quantity ofglobal rental equipment relatedfleet that provides fast asset deployment to our drilling & completion and pressure control offerings.support any local market across various regions.

Dependence on Key Customers
Generally, Surface Technologies’ customers are major integrated oil companies, national oil companies, independent exploration and production companies and oil and gas service companies. No single Surface Technologies customer accounted for 10%10 percent or more of our 20192021 consolidated revenue.
Competition

Surface Technologies is a market leader for many of our products and services. Some of the factors that distinguish us from other companies in the same sector include our technological innovation, reliability, product quality, and ability to integrate across a broad portfolio scope. Surface Technologies competes with other companies that supply surface production equipment and pressure control products. Some of our major competitors in Surface Technologies include Baker Hughes, Cactus, Inc., Forum Energy Technologies, Inc., Gardner Denver, Inc., Schlumberger, Haliburton, and The Weir Group plc.SPM Oil and Gas.

Market Environment
Surface Technologies’ performance is typically driven by variationsThe global economic recovery in global2021 resulted in higher drilling and completion activity creating a dynamic environment. Operating results can be further impacted by pressure pumping activity and the completions intensity of shale applications in the Americas.
The North America shale market is sensitivewhen compared to oil price fluctuations. For a global oilfield service company such as ourselves, this is partially offset by the less cyclical drilling activity in the international markets where most of the activity is driven by national oil companies (NOCs), which tend to maintain longer term and more capital intense drilling programs.
Global activity is still below levels achieved in the prior industry cycle and pricing remains competitive. Drilling activity2020. Activity in North America during 2019 declined approximately 12% compared to 2018,remained below pre-pandemic levels despite a significant market recovery. Outside of North America, which represented 65 percent of total segment revenue in terms of rig count and number of wells drilled. Completion2021, activity contracted approximately 10% in 2019 in terms of number of wells fractured and a decrease of approximately 7% in 2019 in terms of pressure pumping horsepower demand. The activity decline was driven by pipeline takeaway capacity constraints, lower commodity prices, and lower spending by our customers.


Our business outside of the Americasremained resilient. We continued to experience competitive pricing pressure throughout much of 2019. We believe market pricing has since stabilized and expect this more stable pricing environmentbenefit from our exposure to continue throughout 2020. Confidence in an improved outlook for our business, based on an expected 4% to 5% increase in rig count and number of wells drilled in 2020, is further supported by the strong growth experienced in inbound orders and backlog in late 2019, about 25% inbound increase in Q4 compared to the average in Q1 to Q3. We believe that the Middle East, Asia Pacific and Northern Europe, are best poised for new order growth.all of which were supported by strength in gas-related activity. We believe the Middle East represents one of our largest opportunities in the current decade.

Strategy
Our strategy is focused on being a leading provider of best-costWe exist to transform the surface market to provide customers with breakthrough reductions in cost and high-performance integrated assets and services for our customerscarbon intensity in the drilling, completion, upstream production, and midstream and downstream transportation sectors. We distinguishwill achieve this through:

Technology. We are committed to differentiated core products that enable integrated solutions to leverage the benefits of smarter designs.

Integration. Integrated ecosystems that reduce costs and increase uptime through pre-engineered, modular solutions which drive improvements in greenhouse gas emissions.

12


Automation. Intelligent products that are remotely managed using actionable data, reducing manpower in the field, maximizing uptime, and enabling enhanced production.

Carbon reduction
Core competencies and capabilities in technology, innovation, project execution and services position us well as we drive opportunities in decarbonization and the energy transition. We are committed to reducing GHG emissions and our offering by combining four elements – innovative product design, exceptional customer experience, leading digital tools,carbon footprint using lean processes and integrated systems.
Webreakthrough technologies. Through our automation and software, we can prevent emissions before they occur. Our upstream production ecosystem iProduction™ eliminates the need for storage tanks and our measurement technologies have developed the digital toolsbeen used on biodiesel facilities and customer-centric organizational culture that help enable customer success.terminals. Our system integration capabilities and automation technologies (i) reduce cycle time, lowering both capital and operating expenditures and allowingiComplete ecosystem also helps our customers to achieve first oil faster,reduce their carbon footprint by fully integrating wellsite operations, generating significant efficiencies through autonomous maintenance and (ii) optimize the production process, minimizing facility footprint, manual interventions, and environmental impacts.remote data access.
Recent and Future Developments
We continue to operate in a challenging environment as global activity is still below levels achieved in the prior industry cycle and pricing remains competitive. In 2019 well completion activity in North America moved lower, negatively impacting demand for pressure control equipment. The activity decline was driven by pipeline takeaway capacity constraints, lower commodity prices, and lower operator budgets.
North American drilling and completion activity continued to move higher throughout 2018, peaking in the first quarter of 2019, and then declining throughout the remainder of 2019. Forecasts for 2020 activity are heavily dependent on commodity prices. Our current outlook is that activity in early 2020 will remain near the fourth quarter of 2019 exit levels and then gradually increase in the second half of the year.
Outside of the Americas, drilling and completion activity increased 7 percent from 2018 to 2019 and is now planned to stabilize on a 4 to 5 percent increase in the next three years.
Product Development
In 2019, we expandedLeveraging the successful Subsea iEPCI model, Shallow Water iEPCI is our desanding product offering by introducing our Desander Pro which can handle upunique, fully integrated approach to 30 percent higher drill out sand volumes during the flowback phase in shale applications. We areconfiguring, managing, and executing marginal field development projects in the final stagesjackup drilling environment.
This ecosystem includes shallow water trees, modular platform solutions, SURF and associated installation, and tie-in solutions, all of testingwhich are designed to be standardized, fit for purpose and lighter weight for faster installation and transportation. Shallow Water iEPCI utilizes one single digital interface by combining our high gas desander, specifically designed for gas shale plays in Canadacontrol and automation platform UCOS and the United Statescloud-based data capabilities of insiteX. Our products stay connected to facilitate full remote control and we have high hopesmonitoring, enabling time-based maintenance and improved safety offshore for unattended installations.

Our approach allows us to reduce complexity with seamless hardware and software systems integration, optimize installation activities, and reduce client risk. This allows us to transform our clients' marginal fields and meaningfully impact the life cycle costs on their projects.

TechnipFMC is the only company that this technology can be utilized in conventional applications. We have introducedconfigure, manufacture, install and service an integrated system from the wellhead to the platform using a numberjackup rig or our owned fleet of products that are specifically orientated to improving the safety and efficiencyvessels.

Our Shallow Water iEPCI differentiators:

Shallow Water iEPCI™ leverages on the Fracturing Pad, including SAFlex - large bore flexible Fracturing lines, 7” Check Valves, Speedloc Quick Connectorproven success of the Subsea iEPCI model;
Simplicity of dealing with one supplier;
Modular platform solutions for wireline intervention. These newa range of applications;
Proven pre-engineered solutions for the jack-up drilling environment;
Connected products will all become important element in our integrated fracturing offering. Further, we have expanded our suitethe field, using one single digital interface; and
Integrated seamless planning for operations, execution and life of high-pressure, high-temperature wellheads and trees, and continue to expand our digital product offering with automated desanding dumps, tank level monitoring, automatic valve greasing units, and automated well testing system, all in an effort to further reduce manning and increase remote oversight of drilling and completion operations.field services.

Acquisitions and Investments
In October 2017,December 2021, we announced an agreement to acquire Plexus Holding plc’s (“Plexus”) wellhead exploration equipment and services business for jack-up applications. In conjunction withofficially inaugurated our global footprint and market presence, this portfolio expansion in the mudline and high-pressure, high-temperature arena has enabled us to be a leading provider of products and services to the global jack-up exploration drilling market. This acquisition fits within our strategy to extend and strengthen our position in exploration drilling products and services while leveraging our global field presence. The acquisition closed in the first quarter of 2018.
The business has been integrated into our Surface Technologies segment, including the transfer of key personnel from Plexus, with their specialized expertise, to ensure continuity and ongoing customer support. The business continues to operate from its existing location in Dyce, Aberdeen, United Kingdom.


In December 2017, we opened a new 18,00056,000 square meter facility in Abu Dhabi’s Industrial City 2, which has been further expanded in 2019 to provide customer inventory management services and position the Company for the construction of integrated skids and modules in support of our Production Systems business. In June 2018, we broke ground on a new 52,000 square meterfeet facility in Dhahran, Saudi Arabia. These facilities areThe facility, comprising two stories and a 13,000 square meter manufacturing space, is part of our continued investment in the United Arab Emirates and Saudi ArabiaMiddle East to reinforce our leading position in delivering local solutions that extend asset life and improve project returns. They positionThe new facility positions us to respond to the expected increase in activity for Abu Dhabi National Oil Company (“ADNOC”) and Saudi Aramco in 2020 and beyondthe area while strengthening our capabilities, providing a solid platform for us to grow in what is a strategic market for our integrated offerings in this region, including multiple product lines and aftermarket services that are key to our growth strategy.Surface Technologies business. The new facilitiesfacility will offer a broader range of capabilities and greater value-add in-country, supporting our full portfolio with high technology equipment in the drilling, completion, production, and pressure control sectors.

Also in December 2021 a 10-year framework agreement for wellheads, trees and associated services by the Abu Dhabi National Oil Company (ADNOC), our largest-ever Surface Technologies contract. Under the framework agreement, TechnipFMC will further grow in-country talent and expand existing manufacturing, assembly and test capabilities in Abu Dhabi in order to deliver the Company’s complete portfolio of surface wellheads and trees locally.
13


OTHER BUSINESS INFORMATION RELEVANT TO OUR BUSINESS SEGMENTS

Capitalizing on Energy Transition

Since our inception as an integrated company in 2017, TechnipFMC has been pursuing innovation to reduce emissions within the conventional energy space. We have also been exploring ways to position ourselves in the energy transition by delivering differentiated solutions and leveraging our core competencies and existing resources. We believe offshore will be the next frontier of the energy transition and are ready to accelerate and grow our contribution. This is the role of our New Energy Ventures.

Our goal is to be a key enabler of the offshore renewables industry. To get there, we will leverage our subsea and surface expertise, our technology know-how, our collaborative and innovative mindset, as well as our demonstrated capabilities in project integration.

We will continue collaborating with energy companies and technology providers to bring to market innovative solutions that are best-suited for offshore applications, while maintaining an asset-light model within our business. Utilizing our expertise in integrated projects, we are able to serve as a system architect, from technology development to project delivery and life of field services.

As a result of our evolution in the new energies arena, we are further refining our market approach, which we define through three main pillars:

Greenhouse gas removal;
Offshore floating renewables; and
Hydrogen.

Project integration is perhaps TechnipFMC’s strongest point of differentiation. We see strong integration potential across offshore renewable markets. For example, by combining wind and wave, or wind and hydrogen, we could maximize energy generation and efficiency, since the incremental capital expenditure and operational expenditure needed is much lower than a standalone product for the same energy generation. We will approach these new integration opportunities in renewable energies with a new execution model, which is integrated Offshore Novel Energies, or simply iONE™(“iONE”). iONE builds on the success of our iEPCI model in oil and gas, and leverages that experience in the new energy space. By acting as system integrator in a complex and rapidly changing environment, we can play a meaningful role in enabling offshore renewable solutions.

The Pillars

We will begin addressing greenhouse gas removal with carbon transportation and storage, a key enabler of the energy transition. We believe one of the safest and most efficient storage locations for greenhouse gases is offshore, is naturally occurring reservoirs and saline aquifers. Existing equipment developed by our Surface Technologies and Subsea businesses can be leveraged to achieve this aim. Our efforts in this area include:

Development of our iCTS™ - Integrated Carbon Transportation and Storage System;
A strategic alliance with Talos Energy to accelerate carbon capture and storage;
The acquisition of Magma Global, manufacturer of the key gas transportation technologies thermoplastic composite pipe and hybrid flexible pipe; and
An agreement to commercialize PETRONAS’ unique natural gas processing membrane which reduces emissions of CO2 and hydrogen sulfide by integrating the technology into our onshore and offshore production portfolio.

TechnipFMC aspires to lead the offshore floating renewables industry by leveraging our differentiated technologies, product standardization, and integrated approach. This emerging market is predicted to grow from near zero to an installed base of 30 gigawatts by 2030. Our efforts in this area include:

A partnership with Magnora ASA, Magnora Offshore Wind, to develop floating offshore wind projects;
A partnership with Bombora to develop the InSPIRE™ offshore wind and wave power solution;
A partnership with Floating Power Plant, a renewable energy technology company, for an offshore green hydrogen pilot for the Canary Islands which will leverage Deep Purple™ (see below); and
14


A strategic investment in Orbital Marine Power, the world's most powerful floating tidal energy turbine, which we believe to be the most mature tidal technology.

We believe hydrogen will become a crucial carrier for the storage and transportation of energy, as well as bringing reliability, stability, and efficiency to renewable sources. Our strategy covers two areas: green hydrogen produced offshore by the electrolysis of water using renewable energy, and off-grid energy systems delivering renewable, stable power to traditional energy installations and remote islands. Our efforts in this area include:

Deep Purple™ is our system to provide sustainable offshore renewable energy production by integrating wind energy and hydrogen production and storage;
A partnership with Energias de Portugal (EDP) and others to develop a new platform for green hydrogen production offshore Portugal; and
Working with renewable energy provider Statkraft towards a trial of large-scale offshore hydrogen storage at Hardanger Hydrogen Hub.

Sources and Availability of Raw Materials
Our business segments purchase carbon steel, stainless steel, aluminum, and steel castings and forgings from the global marketplace. We typically do not use single source suppliers for the majority of our raw material purchases; however, certain geographic areas of our businesses, or a project or group of projects, may heavily depend on certain suppliers for raw materials or supply of semi-finished goods. We believe the available supplies of raw materials are adequate to meet our needs.

Research and Development
We are engaged in research and development (“R&D&D”) activities directed toward the improvement of existing products and services, the design of specialized products to meet customer needs, and the development of new products, processes, and services. A large part of our product development spending has focused on the improved design and standardization of our Subsea and Onshore/Offshore products to meet our customer needs.

Patents, Trademarks, and Other Intellectual Property
We own a number of patents, trademarks, and licenses that are cumulatively important to our businesses. As part of our ongoing R&D focus, we seek patents when appropriate for new products, product improvements, and related service innovations. We have approximately 6,8003,800 issued patents and pending patent applications worldwide. Further, we license intellectual property rights to or from third parties. We also own numerous trademarks and trade names and have approximately 550410 registrations and pending applications worldwide.

We protect and promote our intellectual property portfolio and take actions we deem appropriate to enforce and defend our intellectual property rights. We do not believe, however, that the loss of any one patent, trademark, or license, or group of related patents, trademarks, or licenses would have a material adverse effect on our overall business.
Employees
As of December 31, 2019, we had more than 37,000 employees.
Segment and Geographic Financial Information

The majority of our consolidated revenue and segment operating profits areis generated in markets outside of the United States. Each segment’s revenue is dependent upon worldwide oil and gas exploration, production and petrochemical activity. Financial information about our segments and geographic areas is incorporated herein by reference from Note 7 to our consolidated financial statements in Part II, Item 8 of this Annual Report on Form 10-K.

Order Backlog
Information regarding order backlog is incorporated herein by reference from the section entitled “Inbound Orders and Order Backlog” in Part II, Item 7 of this Annual Report on Form 10-K.

15


Website Access to Reports and Proxy Statement

Our Annual Reports on Form 10-K, Quarterly Reports on Form 10-Q, Current Reports on Form 8-K, Proxy Statements, and Forms 3, 4, and 5 filed on behalf of directors and executive officers, and amendments to each of those reports and statements, are available free of charge through our website at www.technipfmc.com, under “Investors” as soon as reasonably practicable after such material is electronically filed with, or furnished to, the U.S. Securities and Exchange Commission (the “SEC”). Alternatively, our reports may be accessed through the website maintained by the SEC at www.sec.gov. Unless expressly noted, the information on our website or any other website is not incorporated by reference in this Annual Report on Form 10-K and should not be considered part of this Annual Report on Form 10-K or any other filing we make with the SEC.

HUMAN CAPITAL

People and culture are at the heart of our development strategy. People are our wealth and strength. We are committed to our employees, and our employee guidelines are specified in our Code of Business Conduct, which applies to all employees, regardless of their roles, and no matter where they work.

We believe that all our employees are entitled to fair treatment, courtesy, and respect, wherever they work: in the office, on vessels, on industrial and construction sites, or in client offices. We do not tolerate any form of abuse or harassment, and we will not tolerate any action, conduct, or behavior that is humiliating, intimidating, or hostile.

Furthermore, our hiring and employee development decisions are fair and objective. Employment decisions are based only on relevant qualifications, performance, demonstrated skills, experience, and other job-related factors, with our goal of creating a diverse, tolerant, and inclusive workforce.

Workforce Overview
Our workforce consists of the following:
As of December 31,
202120202019
Permanent employees19,10319,07821,522
Temporary employees (fixed-term)1,5071,0541,637
Employees on payroll20,61020,13223,159
Contracted workforce1,3926352,560
Total workforce22,00220,76725,719
Attracting Talent
To position ourselves as an employer of choice, we continued to bring our Employee Value Proposition ("EVP") to life. We encouraged and included more people from our business to share their inspiring experiences and stories that truly reflects the diversity and plurality we have in the company. People from different cultures, generations, gender, races, disabilities and sexual preferences are represented by what they all have in common: inspiring experiences lived at TechnipFMC. We continue to explore how best we can share these experiences with external candidates as well as internally through different channels. A significant effort in 2021 was to improve the candidate experience when accessing our website’s new career page as well as on our internal EVP-dedicated web page.

The career pages aim to reflect key EVP messages as well as our commitments to Diversity and Inclusion and ESG to attract the right talent to our company.

Our recruitment system is becoming more standardized worldwide to improve the selection process. Global programs are being revised to provide a more dynamic, modern and attractive experience with relevant content. Our onboarding program will be further simplified, with better global alignment and more efficient communication to make the experience of new employees and line managers more efficient and connected. Our graduate program gained more global representation with an increase in participation across our business.

21
16


Key performance indicators linked to talent acquisition are now available and accessible to key stakeholders through our internal tracking platform. These include the results of the exit interview, onboarding program and new employees; and evaluation of the selection process.

Developing and Keeping Talent
In 2021, we have further simplified the design and process of identifying key talents that was launched in 2020. We saw an improvement in our Leadership Succession Planning both in terms of depth and representation of underrepresented nationalities and U.S. minorities and gender. We have continued to work on Talking Talents (a process launched in 2020 to identify and support development of our key talents). As of December 31, 2021, we have 14 percent (an increase from 6 percent in 2020) of our employee population identified as flagged talents in our three main Career Pathways: Leadership, Technology and Project Management. This includes our Technical Expertise Program, which was also launched in 2020, where we welcomed new experts in 2021.

Leadership You was introduced in 2021, which provides leadership development opportunities not only for our leaders, but for all of our employees. We have also made other talent development tools available for all employees. Examples include Individual Development Plan, Continuous Multi Source Feedback and Inclusive Leadership Training.

Employee attrition in 2021 was 6.4 percent compared to 2.5 percent in 2020, attributable to a significant extent to the great reshuffle we witnessed across industries globally. Through dedicated efforts focused on key talents we managed to keep attrition rate lower at 5.6 percent.

In 2022, we will further improve our Performance Process and move from annual performance reviews and ratings to continuous feedback and check-ins between employees and managers thereby enabling an environment where our employees will have boundless opportunities to grow, contribute and their best. This will further improve our business and individual performance and focus on people development for our people.

As we continued to manage the ever-changing COVID-19 landscape, we have carried on sharpening our focus on enabling our people to grow, develop and share knowledge. The importance of being able to offer learning and knowledge-sharing opportunities in a digital, 24/7, and global environment has been key to our success. Building on our solid foundations, we delivered impactful courses, initiatives and solutions across all of our business segments, in addition to being particularly focused on leadership, technology and project management.

Technical Expertise Program

Building on the launch of the global Technical Expertise Program in late 2020, we executed the first-ever application and selection process for the program. It recognizes and rewards employees who have demonstrated technical mastery in their discipline, as well as:

Technical impact. whether it is operational performance, product development or project management;
People development. by inspiring others, enabling the full potential of people and teams, mentoring, sharing knowledge and expertise, and attracting other technical talent;
Business impact. by developing business with existing or new customers, new solutions in existing markets, or new markets altogether; and
Industry leadership. through internal and external professional visibility as a thought leader, both individually and as a representative of the Company’s technical leadership.

The Technical Expertise Program has more than 650 members, who share their knowledge broadly across the Company’s learning ecosystem, using knowledge management platforms such as The Bridge to connect with employees in almost 40 chartered global knowledge-sharing networks. The related knowledge repository, The Well, has more than 4,000 pages, which received in excess of 600,000 visits in 2021. The Well is connected with the Company’s competency management platform and provides direct access to competency-based content. Employees in all regions access these and other knowledge management social learning tools such as an Experts Explain webinar series and Illuminate podcasts to increase their knowledge about business and technical topics, and to share their own knowledge.


17


Learning and Training

Engagement in the iLearn learning platform has seen a significant rebound in use in 2021, as we continue to embrace our digital transformation. In 2021, there were more than 26,000 pieces of creative and innovative learning content available, with ongoing releases of new and meaningful courses, to support skills development for our employees and enhance their performance in their role. In 2021, 76 percent of our training hours (up from 50 percent in 2020) and 96 percent of our course completions (up from 95 percent in 2020) were done in a digital or virtual environment, which resulted in 15.5 training hours per employee (up from 5.85 hours per employee in 2020). The areas of learning in 2021 were Health, Safety, Environment and Security; Human Resources; Legal; and Personal Effectiveness.

Promoting Cultural and Ethnic Diversity

We focus on our broad cultural and ethnic diversity, which we constantly promote and develop throughout the Company, through the internationalization of our teams, multicultural programs, and international mobility.

Providing Equal Employment Opportunities

Three of our Foundational Beliefs – integrity, respect, and sustainability – are tangibly embedded in fair employment practices and equal opportunity. The Company’s policy is that our employment decisions related to recruitment, selection, evaluation, compensation, and development, among others, are not influenced by unlawful or unfair discrimination on the basis of race, religion, gender, age, ethnic origin, nationality, sexual orientation, gender or gender reassignment, marital status, or disability.

It is our policy to encourage and give full and fair consideration to applications for employment from disabled people, and to assist with their training and development in light of their aptitudes and abilities. If an existing employee becomes disabled, it is the Company’s policy wherever practicable to provide continuing employment under our usual terms and conditions, and to provide training, career development, promotion opportunities and a safe work environment based on the requested, reasonable needs to disabled employees to the fullest extent possible.

In December 2021, we celebrated International Day of Persons with Disabilities. We had various initiatives to promote inclusion and respect featuring our colleagues throughout the globe, including:

Inspiring stories featuring perspectives from leadership, disabled individuals and careers of disabled children;
Creating awareness of invisible disabilities in a podcast; and
Virtual iVolunteer event for People & Culture where senior managers recorded holiday greetings for Helping Hands for the Deaf through sign language and many other local events.

Strengthening Social Dialogue

The Company has developed a culture that is based on the values of trust, mutual respect, and dialogue. In accordance with local legislation, regular meetings with trade union-appointed and/or works council representatives are organized for information and/or consultation. The Company’s European Works Council (“EWC”) meets regularly and all of our European entities joined the EWC by the end of 2019. In 2021, the EWC elected its new members, who consist of employee representatives from France, Germany, the Netherlands, Norway, Poland, Portugal, and the United Kingdom.

Employee Engagement and Well-being

In 2021, we launched our first Company-wide employee engagement survey, with a remarkable 70 percent response rate.

The results were consistent with the oil and gas industry, but certainly have room for improvement. The results achieved and the commitments made by our Executive Leadership Team and business executives illustrate the importance of the survey initiative to the Company. The robust and analytical platform gives all managers the opportunity to work autonomously on their action plans.

18


We continued to build on the strong foundations we laid in 2020, with the launch of our Well-being program in September 2021, in partnership with our Workplace Options platform, to help all employees be more successful at meeting their responsibilities at home and at work. Among the extensive resources available, we focused on mental health and all of our more than 20,000 people now have access to mental health resources and counselling. During the month of September 2021, webinars and Experts Explain webcasts were made available to stimulate discussion on the topic. As committed by our Chair and CEO in 2020, we annually celebrate the month of October as mental health awareness month with several activities to promote awareness. TechnipFMC also celebrates International Women's Day, PRIDE month and International Women in Engineering Day, among others.

Internal Communication

We have a robust internal communications strategy and support communication channels that ensure that we communicate with our employees in a timely and effective way. The effectiveness of internal communication is continually monitored and adjusted based on a focus group feedback program that reaches multiple levels across the Company. New digital tools help us gauge the effectiveness of our digital communication platforms. Employees are regularly consulted and provided with information on changes and events that may affect them through channels such as regular meetings, employee representatives, and the Company’s intranet site. These consultations and meetings ensure that employees are kept informed of the financial and economic factors affecting the Company’s performance and matters of concern to them.

Labor Relations and Collective Agreements
We seek to maintain constructive relationships with works councils and trades unions, and to comply with relevant local laws and collective agreements in relation to collective or individual labor relations. The Company also operates through local subsidiaries in many countries, a number of which, including those in France, Germany, and Norway, have legal requirements for works councils, which include employee representatives. We send regular information to all employees to share information about business success, changes to the organizational structure, and any major impact to the business or the Company. The same approach to sharing information and maintaining a regular dialogue with employees exists at a local level through the action of the local communications teams and managers. In countries where employee representatives or works councils are in place, the Company seeks to maintain an effective and regular dialogue. To get the direct feedback of employees, we performed an employee engagement survey globally in 2021. The results have been communicated and actions are being taken in all of our operations to improve employee relations and engagement. Every quarter, all employees receive a direct message from the Chair and CEO about the financial results of the Company and main business information.
19


INFORMATION ABOUT OUR EXECUTIVE OFFICERS OF THE REGISTRANT
Information regarding our executive officers called for by Item 401(b) of Regulation S-K is hereby included in Part I, Item 1 “Business” of this Annual Report on Form 10-K.
The following table indicates the names and ages of our executive officers as of March 2, 2020,February 28, 2022, including all offices and positions held by each in the past five years:
NameAgeCurrent Position and Business Experience (Start Date)
Douglas J. Pferdehirt1(a)
5658
Executive ChairmanChair and Chief Executive Officer (2019)
Chief Executive Officer (2017)
President and Chief Executive Officer of FMC Technologies (2016)
President and Chief Operating Officer of FMC Technologies (2015)
Maryann T. MannenAlf Melin 1(a)
5752
Executive Vice President and Chief Financial Officer (2017)(2021)
ExecutiveSenior Vice President, and Chief Financial Officer of FMC Technologies (2014)Finance Operations (2017)
Senior Vice President, Surface Americas (2017)
Dianne B. RalstonVictoria Lazar 1(a)
5356
Executive Vice President, Chief Legal Officer and Secretary (2017)(2020)
Senior Vice President, General Counsel and Corporate Secretary of FMC Technologies (2015)Bristow Group (2020)
Executive Counsel, M&A of General Electric (2019)
Associate General Counsel of Baker Hughes, a GE Company (2018)
Associate General Counsel of GE Oil & Gas (2017)
Luana Duffé (a)
40
Executive Vice President, New Energy Ventures (2021)
Vice President, Subsea Projects & Commercial and Country Manager for Brazil (2020)
Vice President, Subsea Projects and Brazil Country Manager (2019)
Vice President, Subsea Strategy (2018)
Corporate Development Director (2018)
Nisha Rai (a)
46
Executive Vice President, People and Culture (2021)
Vice President of Total Rewards (2020)
Vice President, Head of Human Resources of MRC Global (2017)
Justin Rounce1(a)
5355
Executive Vice President and Chief Technology Officer (2018)
President—President, Valves & Measurement forof Schlumberger Limited (2018)
Senior Vice President—President, Marketing & Technology forof Schlumberger Limited (2016)
Vice President—Marketing & Chief Technology Officer for Cameron International Corporation (2015)
Agnieszka KmieciakJonathan Landes 1(a)
4649
ExecutivePresident, Subsea (2020)
Senior Vice President—People and Culture (2018)
HR Director—Production Group for Schlumberger LimitedPresident, Subsea Commercial (2017)
Talent Manager and Workforce Planning Manager for Schlumberger Limited (2015)
Arnaud Piéton1
46
President—President, Subsea (2018)
Executive Vice President—People and CultureProjects North America (2017)
President—Asia-Pacific Region of Technip (2016)
Chief Operating Officer, Subsea—Asia-Pacific Region of Technip (2014)
Richard G. Alabaster1
59
Transition Manager (2019)
President—Surface Technologies (2017)
Vice President—Surface Technologies of FMC Technologies (2015)
Barry Glickman1(a)
5153
President, —SurfaceSurface Technologies (2019)
President—President, Engineering, Manufacturing and Supply Chain (2017)
Vice President—Subsea Services of FMC Technologies (2015)
Nello Uccelletti1
66
President and Advisor to the CEO (2019)
President—Onshore/Offshore (2017)
President—Onshore/Offshore of Technip (2014)
Catherine MacGregor1
47
President—Onshore/Offshore (2019)
President—New Ventures (2019)
President—Drilling Group of Schlumberger Limited (2017)
President—Reservoir Characterization of Schlumberger Limited (2016)
President—Europe and Africa Region of Schlumberger Limited (2013)
Christophe Bélorgeot2
53
Senior Vice President, Corporate Engagement (2018)
Vice President, Corporate Communications (2017)
Senior Vice President, Communications and CEO Office of Technip (2014)
Krisztina Doroghazi3(b)
4850
Senior Vice President, Controller, and Chief Accounting Officer (2018)
Senior Vice President, Financing Planning and Reporting of MOL Group (2015)
__________________
1 (a)    Member of the Executive Leadership Team and a Rule 3b-7 executive officer and Section 16 officer under the Exchange ActAct.
2 Member of the Executive Leadership Team
3 (b)    Section 16 officer under the Exchange ActAct.
No family relationships exist among any of the above-listed officers, and there are no arrangements or understandings between any of the above-listed officers and any other person pursuant to which they serve as an officer. During the past 10 years, none of the above-listed officers was involved in any legal proceedings as defined in Item 401(f) of Regulation S-K. All officers are appointed by the Board of Directors to hold office until their successors are appointed.

22


ITEM 1A. RISK FACTORS
Important risk factors that could impact our ability to achieve our anticipated operating results and growth plan goals are presented below. The following risk factors should be read in conjunction with discussions of our business and the factors affecting our business located elsewhere in this Annual Report on Form 10-K and in our other filings with the SEC.
Summary Risk Factors
The following is a summary of some of the risks and uncertainties that could materially adversely affect our business, financial condition and results of operations. You should read this summary together with the more detailed description of each risk factor contained below.
20


Risks Related to Our Business and Industry
Demand for our products and services depends on oil and gas industry activity and expenditure levels, which are directly affected by trends in the demand for and price of crude oil and natural gas.

We operate in a highly competitive environment and unanticipated changes relating to competitive factors in our industry, including ongoing industry consolidation, may impact our results of operations.
We competeOur success depends on the basis of a number of different factors, such as product offerings, project execution, customer service, and price. In order to compete effectively we must develop and implement innovative technologies and processes, and execute our clients’ projects effectively. We can give no assurances that we will continue to be able to compete effectively with the products and services or prices offered by our competitors.
Our industry, including our customers and competitors, has experienced unanticipated changes in recent years.  Moreover, the industry is undergoing vertical and horizontal consolidation to create economies of scale and control the value chain, which may affect demand for our products and services because of price concessions for our competitors or decreased customer capital spending. This consolidation activity could impact our ability to maintain market share, maintaindevelop, implement, and protect new technologies and services.
Cumulative loss of several major contracts, customers, or increase pricingalliances may have an adverse effect on us, and the credit and commercial terms of certain contracts may subject us to further risks.
The COVID-19 pandemic, the United Kingdom’s withdrawal from the European Union, and disruptions in the political, regulatory, economic, and social conditions of the countries in which we conduct business, could adversely affect our business or results of operations.
DTC may cease to act as a depository and clearing agency for our shares.

Our existing and future debt may limit cash flow available to invest in the ongoing needs of our business and could prevent us from fulfilling our obligations under our outstanding debt.
A downgrade in our debt rating could restrict our ability to access the capital markets.

Our acquisition and divestiture activities involve substantial risks.
Demands to address Environmental, Social and Governance (“ESG”) matters could surpass our ability to meet demands and thus adversely affect our business.

Uncertainties with respect to the energy transition may adversely affect our business.

Risks Related to Our Operations
We may lose money on fixed-price contracts.
New capital asset construction projects for vessels and manufacturing facilities are subject to risks, including delays and cost overruns.
Our failure to timely deliver our backlog could affect future sales, profitability, and customer relationships.
We face risks relating to our reliance on subcontractors, suppliers, and our joint venture partners.
A failure or breach of our IT infrastructure or that of our subcontractors, suppliers or joint venture partners, including as a result of cyber-attacks, could adversely impact our business and results of operations.
Pirates endanger our maritime employees and assets.
Risks Related to Legal Proceedings, Tax, and Regulatory Matters
The industries in which we operate or have operated expose us to potential liabilities, including the installation or use of our products, which may not be covered by insurance or may be in excess of policy limits, or for which expected recoveries may not be realized.
Our operations require us to comply with numerous laws and services or negotiate favorable contract terms with our customersregulations, including those related to environmental protection and suppliers,climate change, health and safety, privacy, data protection and data security, labor and employment, import/export controls, currency exchange, bribery and corruption, and taxation, violations of which could have a significant negative impactmaterial adverse effect on our financial condition, results of operations, or cash flows. We are unable
As an English public limited company, we must meet certain additional financial requirements before we may declare dividends or repurchase shares and certain capital structure decisions may require stockholder approval which may limit our flexibility to predict what effect consolidationsmanage our capital structure.
21


Uninsured claims and other competitive factors in the industrylitigation against us, including intellectual property litigation, could adversely impact our financial condition, results of operations, or cash flows.
The IRS may havenot agree that we should be treated as a foreign corporation for U.S. federal tax purposes and may seek to impose an excise tax on prices, capital spendinggains recognized by our customers, our selling strategies, our competitive position,certain individuals.
U.S. tax laws and/or guidance could also affect our ability to retain customersengage in certain acquisition strategies and certain internal restructurings.
We are subject to the tax laws of numerous jurisdictions; and challenges to the interpretation of, or future changes to, such laws could adversely affect us.
We intend to be treated exclusively as a resident of the United Kingdom for tax purposes, but other tax authorities may seek to treat us as a tax resident of another jurisdiction, and we may not qualify for benefits under tax treaties entered into between the United Kingdom and other countries.
General Risk Factors
We are a shareholder of Technip Energies and the value of our abilityinvestment in Technip Energies may fluctuate and may result in an impact to negotiate favorable agreementsour results of operations.

Our businesses are dependent on the continuing services of our key managers and employees.

Seasonal and weather conditions could adversely affect demand for our services and operations.
Currency exchange rate fluctuations could adversely affect our financial condition, results of operations, or cash flows.
We are exposed to risks in connection with our customers.defined benefit pension plan commitments.
We may be unable to obtain sufficient bonding capacity for certain contracts, and the need for performance and surety bonds could reduce availability under our credit facility.

Risks Related to Our Business and Industry
Demand for our products and services depends on oil and gas industry activity and expenditure levels, which are directly affected by trends in the demand for and price of crude oil and natural gas.
We are substantially dependent on conditions in the oil and gas industry, including (i) the level of exploration, development and production activity and (ii) capital spending, and (iii) the processing of oil and natural gas in refining units, petrochemical sites, and natural gas liquefaction plants by energy companies that are our customers.spending. Any substantial or extended decline in these expenditures may result in the reduced pace of discovery and development of new reserves of oil and gas and the reduced exploration of existing wells, which could adversely affect demand for our products and services and, in certain instances, result in the cancellation, modification, or re-scheduling of existing orders in our backlog. These factors could have an adverse effect on our revenue and profitability. The level of exploration, development, and production activity is directly affected by trends in oil and natural gas prices, which historically have been volatile and are likely to continue to be volatile in the future.
Factors affecting the prices of oil and natural gas include, but are not limited to, the following:
demand for hydrocarbons, which is affected by worldwide population growth, economic growth rates, and general economic and business conditions;conditions, including reductions in travel and commerce relating to the COVID-19 pandemic;
costs of exploring for, producing, and delivering oil and natural gas;
political and economic uncertainty, and socio-political unrest;
governmental laws, policies, regulations and subsidies related to or affecting the production, use, and exportation/importation of oil and natural gas;
available excess production capacity within
22


the ability or willingness of the Organization of Petroleum Exporting Countries (“OPEC”) and the 10 other oil producing countries, including Russia, Mexico and Kazakhstan (“OPEC+”) to set and maintain production level of oil production by non-OPEC countries;for oil;
oil refining and transportation capacity and shifts in end-customer preferences toward fuel efficiency and the use of natural gas;
technological advances affecting energy consumption;
development, exploitation, relative price, and availability of alternative sources of energy and our customers’ shift of capital to the development of these sources;


volatility in, and access to, capital and credit markets, which may affect our customers’ activity levels, and spending for our products and services;
decrease in investors’ interest in hydrocarbon producers because of environmental and sustainability initiatives; and
natural disasters.
The oil and gas industry has historically experienced periodic downturns, which have been characterized by diminished demand for oilfield services and downward pressure on the prices we charge. WhileThe oil and natural gas prices have partially rebounded from the downturn that began in 2014, the market remains quite volatile, and the sustainability of the price recovery and business activity levels isare dependent on variables beyond our control, such as geopolitical stability, OPEC’sincreasing attention to global climate change resulting in pressure upon shareholders, financial institutions and/or financial markets to modify their relationships with oil and gas companies and to limit investments and/or funding to such companies, increasing likelihood of governmental regulations, enforcement, and investigations and private litigation due to increasing attention to global climate change, OPEC+’s actions to regulate its production capacity, changes in demand patterns, and international sanctions and tariffs. Continued volatility or any future reduction in demand for oilfield services could further adversely affect our financial condition, results of operations, or cash flows.
We operate in a highly competitive environment and unanticipated changes relating to competitive factors in our industry, including ongoing industry consolidation, may impact our results of operations.
We compete on the basis of a number of different factors, such as product offerings, project execution, customer service, and price. In order to compete effectively we must develop and implement innovative technologies and processes, and execute our clients’ projects effectively. We can give no assurances that we will continue to be able to compete effectively with the products and services or prices offered by our competitors.
Our industry, including our customers and competitors, has experienced unanticipated changes in recent years. Moreover, the industry is undergoing consolidation to create economies of scale and to control the value chain, which may affect demand for our products and services because of price concessions from our competitors or decreased customer capital spending. This consolidation activity could impact our ability to maintain market share, maintain or increase pricing for our products and services or negotiate favorable contract terms with our customers and suppliers, which could have a significant negative impact on our financial condition, results of operations or cash flows. We are unable to predict what effect consolidations and other competitive factors in the industry may have on pricing, capital spending by our customers, our selling strategies, our competitive position, our ability to retain customers or our ability to negotiate favorable agreements with our customers and suppliers.
The COVID-19 pandemic has reduced demand for our products and services, and has had, and may continue to have, an adverse impact on our financial condition, results of operations, and cash flows.
The COVID-19 pandemic, including actions taken by governments and businesses, has resulted in a reduction in global economic activity, including increased volatility in global oil and natural gas markets. Measures taken to address and limit the spread of the disease, such as stay-at-home orders, social distancing guidelines, and travel restrictions, have adversely affected the economies and financial markets of many countries. The resulting disruption to our operations, communications, travel, and supply chain may continue or increase in the future, and could limit the ability of our employees, partners, or vendors to operate efficiently or at all, and has had, and is reasonably likely to continue to have, an adverse impact on our financial condition, operating results, and cash flows.
23


Uncertainty remains as to the potential impact of the COVID-19 pandemic on our operations, and we are closely monitoring the effects of the pandemic on commodity demands and on our customers. These effects may include adverse revenue and net income effects; disruptions to our operations; potential project delays or cancellations; employee impacts from illness, school closures, and other community response measures, which may lead to disruptions and decreased productivity; and temporary closures of our facilities or the facilities of our customers and suppliers. The pandemic has led to global supply chain challenges, which could adversely impact our ability to acquire certain equipment and materials, impact our ability complete projects and cause delays in completing projects, and materially and negatively impact our business results, operations, revenue, growth and overall financial condition.
COVID-19, and the uncertain regional and global economic conditions stemming from the pandemic, could also aggravate the other risk factors discussed herein, including but not limited to risks related to the demand for oil and gas, which may not recover immediately. The full extent to which the COVID-19 pandemic will impact our results is unknown and evolving and will depend on various factors and consequences beyond our control, such as the severity, duration, and spread of COVID-19; the development of new variants; the success of actions taken by governments and health organizations to combat the disease and treat its effects, including vaccine mandates, acceptance, distribution and efficacy; decisions by our alliance partners and customers regarding their business plans and capital expenditures; and the extent to which, and the timing of, general economic and operating conditions recover.
Our success depends on our ability to develop, implement, and protect new technologies and services.services and the intellectual property related thereto.
Our success depends on the ongoing development and implementation of new product designs, including the processes used by us to produce and market our products.
We continually attempt to develop new technologies for use in our business. However, there is no guarantee of future demand for those technologies because customers may be reluctant or unwilling to adopt our new technologies. In addition, we may also have difficulty negotiating satisfactory terms that would provide acceptable returns on our investment in the research and development of new technologies.

Development of new technology is critical to maintaining our competitiveness. However, we cannot assure that we will be able to successfully develop technology that our customers demand. Demand for our products and services may decline if we cannot keep pace with technological advances. Technology that is unavailable to us or that does not work as we expect, could adversely affect us. New technologies, services or standards could render some of our products and services obsolete, which could reduce our competitiveness and have a material adverse impact on our business, financial condition, cash flows and results of operation.

Additionally, we are exploring opportunities in greenhouse gas removal, offshore floating renewables (wind, wave and tidal energy), and hydrogen. Many technologies involved in those projects are novel and will need to be further developed before we can determine whether a renewable energy project is technologically feasible.

Our success also depends on our ability to protect and maintain critical intellectual property assets related to these developments. If we are not able to obtain patents, maintain trade secrets or obtain other protection of our intellectual property rights, if our patents are unenforceable or the claims allowed under our patents are not sufficient to protect our technology, or if we are not able to adequately protect our patents or trade secrets, we may not be able to continue to develop our services, products and related technologies. Additionally, our competitors may be able to independently develop technology that is similar to ours without infringing on our patents or gaining access to our trade secrets. If any of these events occurs, we may be unable to meet evolving industry requirements or do so at prices acceptable to our customers, which could adversely affect our financial condition, results of operations, or cash flows.
The industriesDue to the types of contracts we enter into and the markets in which we operate, the cumulative loss of several major contracts, customers, or alliances may have operated exposean adverse effect on our results of operations, and the credit and commercial terms of certain contracts may subject us to potential liabilities, includingfurther risks.
We often enter into large, long-term contracts that, collectively, represent a significant portion of our revenue. These agreements, if terminated or breached, may have a larger impact on our operating results or our financial condition than shorter-term contracts due to the installationvalue at risk. Moreover, the global market for the production, transportation, and transformation of hydrocarbons and by-products, as well as the other industrial markets in which we operate, is
24


dominated by a small number of companies. As a result, our business relies on a limited number of customers. If we were to lose several key contracts, customers, or alliances over a relatively short period of time, we could experience a significant adverse impact on our financial condition, results of operations, or cash flows.
Additionally, certain of our customers may require us to provide extended payment terms or other forms of financial support as a condition to obtaining commercial contracts.We have long-term contracts involving significant amounts to be paid by our customers toward the later stage of a project. Pursuant to these contracts, we may deliver products and services representing an important portion of the contract price before receiving any significant payment from the customer. Such arrangements could restrict the use of our cash and other resources for other projects and opportunities and our business could also be adversely affected if the financial condition of our customers erodes.

Disruptions in the political, regulatory, economic, and social conditions of the countries in which we conduct business could adversely affect our business or results of operations.
We operate in various countries across the world. Instability and unforeseen changes in any of the markets in which we conduct business, including economically and politically volatile areas or conflict or rumor of conflict could have an adverse effect on the demand for our services and products, our financial condition, or our results of operations. These factors include, but are not limited to, the following:
nationalization and expropriation;
potentially burdensome taxation;
inflationary and recessionary markets, including capital and equity markets;
civil unrest, labor issues, political instability, disease outbreaks, terrorist attacks, cyber terrorism, military activity, and wars;
increasing attention to global climate change resulting in pressure from shareholders, financial institutions and/or financial markets;

supply disruptions in key oil producing countries;
the ability of OPEC+ to set and maintain production levels and pricing;
trade restrictions, trade protection measures, price controls, or trade disputes;
sanctions, such as prohibitions or restrictions by the United States against countries that are the targets of economic sanctions, or are designated as state sponsors of terrorism;
foreign ownership restrictions;
import or export licensing requirements;
restrictions on operations, trade practices, trade partners, and investment decisions resulting from domestic and foreign laws, and regulations;
regime changes;
changes in, and the administration of, treaties, laws, and regulations including in response to public health issues;
inability to repatriate income or capital;
reductions in the availability of qualified personnel;
foreign currency fluctuations or currency restrictions; and
fluctuations in the interest rate component of forward foreign currency rates.
25


DTC may cease to act as the depository and clearing agency for our shares.

Our shares were issued into the facilities of The Depository Trust Company (“DTC”) with respect to shares listed on the NYSE. DTC is a widely used mechanism that allows for rapid electronic transfers of securities between the participants in their respective systems, which mayinclude many large banks and brokerage firms. DTC has general discretion to cease to act as the depository and clearing agency for our shares. If DTC determines at any time that our shares are not eligible for continued deposit and clearance within its facilities, then we believe that our shares would not be covered by insurance oreligible for continued listing on the NYSE, and trading in our shares would be disrupted. Any such disruption could have a material adverse effect on the trading price of our shares.

The United Kingdom’s withdrawal from the European Union may be in excess of policy limits, or for which expected recoveries may not be realized.have a negative effect on global economic conditions, financial markets, and our business.
We are incorporated under the laws of England and Wales and have an operational headquarters in Houston, Texas, United States, with worldwide operations, including material business operations in Europe. The United Kingdom withdrew from the European Union on January 31, 2020 (“Brexit”). In connection with Brexit, the United Kingdom and the European Union agreed on the Trade and Cooperation Agreement (“TCA”) that governs the future trading relationship between the United Kingdom and the European Union in specified areas. The TCA took effect on January 1, 2021. The United Kingdom is no longer in the European Union customs union and is outside of the European Union single market. The TCA addresses trade, economic arrangements, law enforcement, judicial cooperation and a governance framework including procedures for dispute resolution, among other things. Because the agreement merely sets forth a framework in many respects and will require complex additional bilateral negotiations between the United Kingdom and the European Union as both parties continue to work on the rules for implementation, significant political and economic uncertainty remains about whether the terms of the relationship will differ materially from the terms before withdrawal.
These developments could have a material adverse effect on global economic conditions and the stability of the global financial markets and could significantly reduce global market liquidity and restrict the ability of key market participants to operate in certain financial markets. Asset valuations, currency exchange rates, and credit ratings may be especially subject to potential liabilities arising from, amongincreased market volatility. In addition, there is a lack of clarity about the future United Kingdom laws and regulations as the United Kingdom determines which European Union laws to replicate or replace, including financial laws and regulations, tax and free trade agreements, intellectual property rights, supply chain logistics, environmental, health and safety laws and regulations, immigration laws, employment laws, and other possibilities, equipment malfunctions, equipment misuse, personal injuries,rules that would apply to us and natural disasters, any of which may result in hazardous situations, including uncontrollable flows of gas or well fluids, fires,our subsidiaries, could increase our costs, restrict our access to capital within the United Kingdom and explosions. Our insurance against these risks may not be adequate to cover our liabilities. Further, the insurance may not generally be availableEuropean Union, depress economic activity, and further decrease foreign direct investment in the future or, if available, premiums may not be commercially justifiable. If we incur substantial liability and the damages are not covered by insurance or are in excessUnited Kingdom.
Any of policy limits, or if we were to incur liability at a time when we were not able to obtain liability insurance, such potential liabilitiesthese factors could have a material adverse effect on our business, results of operations, financial condition, or results of operations.
Our existing and future debt may limit cash flows.flow available to invest in the ongoing needs of our business and could prevent us from fulfilling our obligations under our outstanding debt.
We have substantial existing debt. As of December 31, 2021, our total debt was $2.0 billion. We also have the capacity under our debt agreements to incur substantial additional debt.
Our level of debt could have important consequences. For example, it could:
require us to dedicate a substantial portion of our cash flow from operations to the payment of debt service, reducing the availability of our cash flow to fund working capital, capital expenditures, acquisitions, distributions, and other general partnership purposes;
increase our vulnerability to adverse economic or industry conditions;
limit our ability to obtain additional financing to react to changes in our business; or
place us at a competitive disadvantage compared to businesses in our industry that have less debt.
Additionally, any failure to meet required payments on our debt or to comply with any covenants in the instruments governing our debt, could result in an event of default under the terms of those instruments. In the event of such
26


default, the holders of such debt could elect to declare all the amounts outstanding under such instruments to be due and payable. Such default could also trigger a cross default on our other debt.
Our loans denominated in United States dollars (“USD”), at our option, and sterling-denominated loans, under our Revolving Credit Facility bear interest at an adjusted rate linked to the London Interbank Offered Rate (“LIBOR”) and our euro-denominated loans under the Revolving Credit Facility bear interest at an adjusted rate linked to the Euro Interbank Offered Rate (“EURIBOR”). LIBOR, EURIBOR and certain other interest “benchmarks” may be subject to further regulatory guidance and/or reform that could cause interest rates under our current or future debt agreements to perform differently than in the past or cause other unanticipated consequences. The United Kingdom’s Financial Conduct Authority (the “FCA”), which regulates LIBOR, has announced that the publication of LIBOR on the current basis would cease and no longer be representative immediately after December 31, 2021 (in the case of all sterling, euro, Swiss franc and Japanese yen settings, and one-week and two-month USD settings) and immediately after June 30, 2023 (in the case of all remaining USD settings). Despite this deferral in regard to USD, the FCA has confirmed that use of USD LIBOR will not be permitted in most new contracts after December 31, 2021 and while the FCA is requiring the LIBOR administrator to publish one-, three- and six-month sterling and Japanese yen LIBOR rates for a limited time following December 31, 2021 using a synthetic methodology, such synthetic LIBOR rates are also only permitted for legacy use. If the methods of calculating LIBOR change from their current form while we continue to rely on LIBOR, or if we adopt alternative benchmarks for our current or future debt, interest rates on our debt obligations may be adversely affected.

The terms of the agreements governing our existing indebtedness restrict our current and future operations, particularly our ability to respond to changes or to take certain actions.
The terms of the agreements governing our indebtedness contain a number of restrictive covenants that limit our flexibility in conducting our business and restrict our ability to take specific actions, including (subject to various exceptions) restrictions on incurring indebtedness, paying dividends, making certain loans and investments, selling assets or incurring liens which may limit our ability to compete effectively, or to take advantage of new business opportunities. In addition, the restrictive covenants in the credit agreement, dated February 16, 2021, that governs our $1,000,000,000 three-year senior secured multi-currency revolving credit facility (the “Revolving Credit Facility”) require us to maintain specified financial ratios and satisfy other financial condition tests.
A breach of the covenants or restrictions under our existing indebtedness could result in an event of default under the applicable indebtedness. Such default may allow the creditors to accelerate the related debt and may result in the acceleration of any other debt to which a cross-acceleration or cross-default provision applies. An event of default under our Revolving Credit Facility would also permit the lenders to terminate all commitments to extend further credit under that facility. Furthermore, if we were unable to repay the amounts due and payable under our Revolving Credit Facility, lenders thereunder could proceed against the collateral granted to them to secure that indebtedness. In the event our lenders or noteholders accelerate the repayment of our borrowings, we and our subsidiaries may not have sufficient assets to repay that indebtedness.
These restrictions may affect our ability to grow in accordance with our strategy. In addition, our financial results, our substantial indebtedness and our credit ratings could adversely affect the availability and terms of our financing.
Our acquisition and divestiture activities involve substantial risks.
We have made and expect to continue to pursue acquisitions, dispositions, or other investments that may strategically fit our business and/or growth objectives. We cannot provide assurances that we will be able to locate suitable acquisitions, dispositions, or investments, or that we will be able to consummate any such transactions on terms and conditions acceptable to us. Even if we do successfully execute such transactions, they may not result in anticipated benefits, which could have a material adverse effect on our financial results. If we are unable to successfully integrate and develop acquired businesses, we could fail to achieve anticipated synergies and cost savings, including any expected increases in revenues and operating results. We may not be able to successfully cause a buyer of a divested business to assume the liabilities of that business or, even if such liabilities are assumed, we may have difficulties enforcing our rights, contractual or otherwise, against the buyer. We may invest in companies or businesses that fail, causing a loss of all or part of our investment. In addition, if we determine that an other-than-temporary decline in the fair value exists for a company in which we have invested, we may have to write down that investment to its fair value and recognize the related write-down as an investment loss.
In connection with the Spin-off, we agreed to indemnify Technip Energies for certain liabilities, and Technip Energies agreed to indemnify us for certain liabilities. If we are required to act on these indemnities to Technip Energies, our
27


financial results could be negatively impacted. Additionally, any indemnity from Technip Energies may not be sufficient to insure us against the full amount of liabilities for which we are responsible and Technip Energies may not be able to satisfy its indemnification obligations in the future.
Demands to address ESG matters could surpass our ability to meet demands and thus adversely affect our business.

There has been increasing attention from stakeholders, investors, customers on renewable energy and ESG practices and disclosures, including practices and disclosures related to greenhouse gases and climate change, and diversity and inclusion initiatives and governance standards. If we are unable to meet the ESG standards, investment and/or lending criteria set by these investors, we may lose investment and our reputation may be negatively affected. The increasing attention and pressure from the shareholders, financial institutions and/or financial markets could also increase the likelihood of governmental investigations and private litigation.

We are exploring investments in energy transition, and uncertainties with respect to these markets may adversely affect our business.

Uncertainties with respect to the energy transition may adversely affect our business. As a result of our evolution in the renewable energies arena, we are exploring opportunities in greenhouse gas removal, offshore floating renewables, and hydrogen. While we have subsea and surface expertise, as well as capabilities in project integration, we are exploring opportunities that are new to us, and therefore involve uncertainties and risks.

The market for renewable energy is also intensively competitive and rapidly evolving. If the demand for renewable energy fails to grow sufficiently, if new geopolitical, legislative or regulatory initiatives emerge and governments around the world reduce subsidies and economic incentives on renewable energy projects, or if market opportunities manifest themselves in areas that we do not focus on, our ventures in new energy may not succeed.

Limited operating experience or limited brand recognition in new energy markets may also limit our goals and targets on business expansion.

Risks Related to Our Operations
We may lose money on fixed-price contracts.
As is customary for some of our projects, we often agree to provide products and services under fixed-price contracts. We are subject to material risks in connection with such fixed-price contracts. It is not possible to estimate with complete certainty the final cost or margin of a project at the time of bidding or during the early phases of its execution. Actual expenses incurred in executing these fixed-price contracts can vary substantially from those originally anticipated for several reasons including, but not limited to, the following:
unforeseen additional costs related to the purchase of substantial equipment, material, and components necessary for contract fulfillment or labor shortages in the markets where the contracts are performed;
mechanical failure of our production equipment and machinery;
delays caused by local weather conditions and/or natural disasters (including earthquakes, floods and floods)public health crises such as the COVID-19 pandemic); and
a failure of suppliers, subcontractors, or joint venture partners to perform their contractual obligations.
The realization of any material risks and unforeseen circumstances could also lead to delays in the execution schedule of a project. We may be held liable to a customer should we fail to meet project milestones or deadlines or to comply with other contractual provisions. Additionally, delays in certain projects could lead to delays in subsequent projects that were scheduled to use equipment and machinery still being utilized on a delayed project.


Pursuant to the terms of fixed-price contracts, we are not always able to increase the price of the contract to reflect factors that were unforeseen at the time our bid was submitted, and this risk may be heightened for projects with longer terms. Depending on the size of a project, variations from estimated contract performance, or variations in multiple contracts, could have a significant impact on our financial condition, results of operations or cash flows.
New capital asset construction projects for vessels and manufacturing facilities are subject to risks, including delays and cost overruns, which could have a material adverse effect on our financial condition, or results of operations.
28

We regularly carry out capital asset construction projects to maintain, upgrade, and develop our asset base, and such projects are subject to risks of delay and cost overruns that are inherent in any large construction project, resulting from numerous factors including, but not limited to, the following:
shortages of key equipment, materials or skilled labor;
delays in the delivery of ordered materials and equipment;
design and engineering issues; and
shipyard delays and performance issues.
Failure to complete construction in time, or the inability to complete construction in accordance with design specifications, may result in the loss of revenue. Additionally, capital expenditures for construction projects could materially exceed the initially planned investments
, or there could be delays in putting such assets into operation.
Our failure to timely deliver our backlog could affect future sales, profitability, and relationships with our customers.
Many of the contracts we enter into with our customers require long manufacturing lead times due to complex technical and logistical requirements. These contracts may contain clauses related to liquidated damages or financial incentives regarding on-time delivery, and a failure by us to deliver in accordance with customer expectations could subject us to liquidated damages or loss of financial incentives, reduce our margins on these contracts, or result in damage to existing customer relationships. The ability to meet customer delivery schedules for this backlog is dependent upon a number of factors, including, but not limited to, access to the raw materials required for production, an adequately trained and capable workforce, subcontractor performance, project engineering expertise and execution, sufficient manufacturing plant capacity, and appropriate planning and scheduling of manufacturing resources. Failure to deliver backlog in accordance with expectations could negatively impact our financial performance.
We face risks relating to our reliance on subcontractors, suppliers, and our joint venture partners.
We generally rely on subcontractors, suppliers, and our joint venture partners for the performance of our contracts. Although we are not dependent upon any single supplier, certain geographic areas of our business or a project or group of projects may depend heavily on certain suppliers for raw materials or semi-finished goods.
Any difficulty in engaging suitable subcontractors or acquiring equipment and materials could compromise our ability to generate a significant margin on a project or to complete such project within the allocated time frame. If subcontractors, suppliers or joint venture partners refuse to adhere to their contractual obligations with us, or are unable to do so due to a deterioration of their financial condition, we may be unable to find a suitable replacement at a comparable price, or at all. Moreover, the failure of one of our joint venture partners to perform their obligations in a timely and satisfactory manner could lead to additional obligations and costs being imposed on us as we may be obligated to assume our defaulting partner’s obligations or compensate our customers. Additionally, our supply chain, subcontractors, suppliers, and our joint venture partners may be adversely affected by the COVID-19 pandemic, which has created global shipping and logistics challenges such as extended shipping lead times and pricing pressures on transportation and logistics.

Any delay, failure to meet contractual obligations, or other event beyond our control or not foreseeable by us, that is attributable to a subcontractor, supplier or joint venture partner, could lead to delays in the overall progress of the project and/or generate significant extra costs. Even if we are entitled to make a claim for these extra costs against the defaulting supplier, subcontractor or joint venture partner, we may be unable to recover the entirety of these costs and this could materially adversely affect our business, financial condition or results of operations.
Our businesses are dependent on the continuing services of certainA failure or breach of our key managers and employees.


We depend on key personnel. The lossIT infrastructure or that of any key personnelour subcontractors, suppliers or joint venture partners, including as a result of cyber-attacks, could adversely impact our business if we are unable to implement key strategies or transactions in their absence. and results of operations.
The loss of qualified employees or failure to retain and motivate additional highly-skilled employees required for theefficient operation and expansion of our business could hinderis dependent on the security and integrity of our IT systems, physical assets, and data that we process and maintain. Accordingly, we rely upon the capacity, reliability, and security of our IT hardware and software infrastructure and our ability to successfully conduct research activitiesexpand and develop marketable productsupdate this infrastructure in response to changing needs and services.evolving threats. We have been subject to cyber-attacks in the past, including phishing, malware, ransomware and other security incidents. No such attack has had a material adverse effect on our business, however, this may not be the case with future attacks. Our systems and physical assets may be vulnerable to damages from such attacks, as well as from natural disasters, failures in hardware or software, power fluctuations, unauthorized access to data and systems, theft, loss or destruction of data (including confidential customer, employee or contractor information), human error, and other similar disruptions, and we cannot give assurance that any security measures we have implemented or may in the future implement will be sufficient to identify and prevent or mitigate such disruptions. In response to the COVID-19 pandemic, we have transitioned many of our employees to remote working arrangements which presents increased cybersecurity risks. If a cyber-attack, power outage, connectivity issue, or other event occurred that impacted our employees’ ability to work remotely, it may be difficult or, in certain cases, impossible, for us to continue our business for a substantial period of time.
Seasonal
We rely on third parties to support the operation of our IT hardware, software infrastructure, and weather conditions could adversely affect demand for ourcloud services, and operations.in certain instances, utilize web-based and software-as-a-service applications, across a broad array of services and functions (e.g., human resources, finance, data transmission, communications, risk compliance, among others). The security and privacy measures implemented by such third parties, as well as the measures implemented by any
Our
29


entities we acquire or with whom we do business, may not be materially affected by variation from normal weather patterns,sufficient to identify or prevent cyber-attacks, and any such attacks may have a material adverse effect on our business. While our agreements with third parties, such as coolervendors, typically contain provisions that seek to eliminate or warmer summerslimit our exposure to liability for damages from a cyber-attack, we cannot ensure such provisions will withstand legal challenges or cover all or any such damages.

Threats to our IT systems and winters. Adverse weather conditions, such as hurricanes into those of our subcontractors, suppliers and joint venture partners arise from numerous sources, not all of which are within our or their control, including fraud or malice on the Gulfpart of Mexicothird parties, accidental technological failure, electrical or extreme winter conditions in Canada, Russia, and the North Sea, may interrupttelecommunication outages, failures of computer servers or curtail our operations, or our customers’ operations, cause supply disruptions or loss of productivity, and may result in a loss of revenue orother damage to our equipmentproperty or assets, outbreaks of hostilities, terrorist acts, and facilities,social engineering (e.g., phishing). The frequency and magnitude of cyberattacks and other security incidents is expected to increase in the future and attackers are becoming more sophisticated. We, as well as other critical business partners, may be unable to anticipate, detect or prevent future attacks, particularly because the methodologies utilized by attackers change frequently or are not recognized until launched, and attackers are increasingly using techniques and tools designed to circumvent controls, to avoid detection, and to remove or obfuscate forensic evidence. The failure of our or others’ security controls and measures to prevent, detect, contain or remediate cyberattacks or other significant security incidents could disrupt our business and result in numerous adverse consequences, including reduced effectiveness and efficiency of operations, inappropriate disclosure of confidential and proprietary information, including personal data, litigation or regulatory investigations, actions and fines included for a breach of data protection laws, reputational harm, increased overhead costs including due to compliance requirements, and loss of important information, which may or may not be insured. Any of these events or outcomes could have a material adverse effect on our business and results of operations. In addition, we may be required to incur significant costs to protect against or to mitigate damage caused by these attacks, disruptions or other security incidents in the future. Our insurance coverage may not cover all of the costs and liabilities we incur as the result of these events, and if our business continuity and/or disaster recovery plans do not effectively and timely resolve issues resulting from a cyber-attack, we may suffer material adverse effects on our business.

Pirates endanger our maritime employees and assets.
We face material piracy risks in the Gulf of Guinea, the Somali Basin, and the Gulf of Aden, and, to a lesser extent, in Southeast Asia, Malacca, and the Singapore Straits. Piracy represents a risk for both our projects and our vessels, which operate and transport through sensitive maritime areas. Such risks have the potential to significantly harm our crews and to negatively impact the execution schedule for our projects. If our maritime employees or assets are endangered, additional time may be required to find an alternative solution, which may delay project realization and negatively impact our business, financial condition, cash flows, or results of operations.
DueNew capital asset construction projects for vessels and manufacturing facilities are subject to risks, including delays and cost overruns, which could have a material adverse effect on our financial condition, or results of operations.

From time to time, we carry out capital asset construction projects to maintain, upgrade, and develop our asset base, and such projects are subject to risks of delay and cost overruns that are inherent in any large construction project, resulting from numerous factors including, but not limited to, the typesfollowing:
shortages of contracts we enterkey equipment, materials or skilled labor;
delays in the delivery of ordered materials and equipment;
design and engineering issues; and
shipyard delays and performance issues.

Failure to complete construction in time, or the inability to complete construction in accordance with design specifications, may result in the loss of revenue. Additionally, capital expenditures for construction projects could materially exceed the initially planned investments, or there could be delays in putting such assets into operation.

Risks Related to Legal Proceedings,Tax and the marketsRegulatory Matters
The industries in which we operate or have operated expose us to potential liabilities, including the cumulative lossinstallation or use of several major contracts, customers,our products, which may not be covered by insurance or alliances may be in excess of policy limits, or for which expected recoveries may not be realized.
We are subject to potential liabilities arising from, among other possibilities, equipment malfunctions, equipment misuse, personal injuries, and natural disasters, any of which may result in hazardous situations, including
30


uncontrollable flows of oil, gas or well fluids, or other sources of energy, fires, and explosions. Our insurance against these risks may not be adequate to cover our liabilities. Further, the insurance may not generally be available in the future or, if available, premiums may not be commercially justifiable. If we incur substantial liability and the damages are not covered by insurance or are in excess of policy limits, or if we were to incur liability at a time when we were not able to obtain liability insurance, such potential liabilities could have ana material adverse effect on our results of operations.
We often enter into large, long-term contracts that, collectively, represent a significant portion of our revenue. These agreements, if terminated or breached, may have a larger impact on our operating results or our financial condition than shorter-term contracts due to the value at risk. Moreover, the global market for the production, transportation, and transformation of hydrocarbons and by-products, as well as the other industrial markets in which we operate, is dominated by a small number of companies. As a result, our business, relies on a limited number of customers. If we were to lose several key contracts, customers, or alliances over a relatively short period of time, we could experience a significant adverse impact on our financial condition, results of operations, financial condition or cash flows.
Our operations require us to comply with numerous regulations, violations of which could have a material adverse effect on our financial condition, results of operations, or cash flows.
Our operations and manufacturing activities are governed by international, regional, transnational, and national laws and regulations in every place where we operate relating to matters such as environmental protection, health and safety, labor and employment, import/export controls, currency exchange, bribery and corruption, and taxation. These laws and regulations are complex, frequently change, and have tended to become more stringent over time. In the event the scope of these laws and regulations expand in the future, the incremental cost of compliance could adversely impact our financial condition, results of operations, or cash flows.
Our international operations are subject to anti-corruption laws and regulations, such as the U.S. Foreign Corrupt Practices Act (“FCPA”), the U.K. Bribery Act of 2010 (the “Bribery Act”), the anti-corruption provisions of French law n° 2016-1691 dated December 9, 2016 relating to Transparency, Anti-corruption and Modernization of the Business Practice (“Sapin II Law”), the Brazilian law nº 12,846/13, or the Brazilian Anti-Bribery Act (also known as the Brazilian Clean Company Act), and economic and trade sanctions, including those administered by the United Nations, the European Union, the Office of Foreign Assets Control of the U.S. Department of the Treasury (“U.S. Treasury”), and the U.S. Department of State. The FCPA prohibits corruptly providing anything of value to foreign officials for the purposes of obtaining or retaining business or securing any improper business advantage. We may deal with both governments and state-owned business enterprises, the employees of which are considered foreign officials for purposes of the FCPA. The provisions of the Bribery Act extend beyond bribery of foreign public officials and are more onerous than the FCPA in a number of other respects, including jurisdiction, non-exemption of facilitation payments, and penalties. Economic and trade sanctions restrict our transactions or dealings with certain sanctioned countries, territories, and designated persons.
As a result of doing business in foreign countries throughout the world, including through partners and agents, we are exposed to a risk of violating anti-corruption laws and sanctions regulations. Some of the international locations in which we currently operate or may operate, in the future, operate, have developing legal systems and may have higher levels of corruption than more developed nations. Our continued expansion and worldwide operations, including in developing countries, our development of joint venture relationships worldwide, and the employment of local agents in the countries in which we operate increasesincrease the risk of violations of anti-corruption laws and economic and trade sanctions. Violations of anti-corruption laws and economic and trade sanctions are punishable by civil penalties, including fines, denial of export privileges, injunctions, asset seizures, debarment from government contracts (and termination of existing contracts), and revocations or restrictions of licenses, as well as criminal fines and imprisonment. In addition, any major violations could have a significant impact on our reputation and, consequently, on our ability to win future business.


We have implemented internal controlspolicies and procedures designed to minimize and detect potential violations of laws and regulations in a timely manner but we can provide no assurance that such policies and procedures will be followed at all times or will effectively detect and prevent violations of the applicable laws by one or more of our employees, consultants, agents, or partners. The occurrence of any such violation could subject us to penalties and material adverse consequences on our business, financial condition, results of operations, or cash flows.
Compliance with environmental and climate change-relatedchange-related laws and regulations may adversely affect our business and results of operations.
Environmental laws and regulations in various countries affect the equipment, systems, and services we design, market, and sell, as well as the facilities where we manufacture our equipment and systems, and any other operations we undertake. We are required to invest financial and managerial resources to comply with environmental laws and regulations, and believe that we will continue to be required to do so in the future. Failure to comply with these laws and regulations may result in the assessment of administrative, civil, and criminal penalties, the imposition of remedial obligations, the issuance of orders enjoining our operations, or other claims and complaints. Additionally, our insurance and compliance costs may increase as a result of changes in environmental laws and regulations or changes in enforcement. These laws and regulations, as well as any new laws and
31


regulations affecting exploration and development of drilling for crude oil and natural gas, are becoming increasingly strict and could adversely affect our business and operating results by increasing our costs, limiting the demand for our products and services, or restricting our operations.
Regulatory requirements related to ESG (including sustainability) matters have been, and are being, implemented in the European Union in particular, in relation to financial market participants. Such regulatory requirements are being implemented on a phased basis. We expect regulatory requirements related to, and investor focus on, ESG (including sustainability) matters to continue to expand in the EU, the United States, and more globally. We establish ESG objectives that align with our foundational beliefs and corporate strategy with an aim toward reducing our carbon footprint, while raising awareness and making advancements in inclusion and diversity. If, in relation to ESG (including sustainability) matters, we are not able to meet current and future regulatory requirements, the reporting requirements of regulators, or the current and future expectations of investors, customers or other stakeholders, our business and ability to raise capital may be adversely affected. In addition, negative attitudes toward or perceptions of fossil fuel products and their relationship to the environment and climate change may reduce the demand for production of oil and gas in areas of the world where our customers operate or otherwise limit our customers’ access to capital and thus reduce future demand for our products and services. Any of these trends may, in turn, adversely affect our financial condition, results of operations and cash flows.

Existing or future laws and regulations relating to greenhouse gas emissions and climate change may adversely affect our business.
Climate change continues to attract considerable public and scientific attention. As a result, numerous laws, regulations, and proposals have been made and are likely to continue to be made at the international, national, regional, and state levels of government to monitor and limit emissions of carbon dioxide, methane, and other “greenhouse gases” (“GHGs”). These efforts have included cap-and-trade programs, carbon taxes, GHG reporting and tracking programs and regulations that directly limit GHG emissions from certain sources. Such existing or future laws, regulations,, and proposals concerning the release of GHGs or that concern climate change (including laws, regulations,, and proposals that seek to mitigate the effects of climate change) may adversely impact demand for the equipment, systems and services we design, market and sell. For example, oil and natural gas exploration and production may decline as a result of such laws, regulations,, and proposals,, and as a consequence,, demand for our equipment, systems and services may also decline. In addition, such laws, regulations,, and proposals may also result in more onerous obligations with respect to our operations, including the facilities where we manufacture our equipment and systems. Such decline in demand for our equipment, systems and services and such onerous obligations in respect of our operations may adversely affect our financial condition, results of operations, or cash flows.
Disruptions in the political, regulatory, economic, and social conditions of the countries in which we conduct business could adversely affect our business or results of operations.
We operate in various countries across the world. Instability and unforeseen changes in any of the markets in which we conduct business, including economically and politically volatile areas could have an adverse effect on the demand for our services and products, our financial condition, or our results of operations. These factors include, but are not limited to, the following:
nationalization and expropriation;
potentially burdensome taxation;
inflationary and recessionary markets, including capital and equity markets;
civil unrest, labor issues, political instability, disease outbreaks, terrorist attacks, cyber terrorism, military activity, and wars;
supply disruptions in key oil producing countries;
the ability of OPEC to set and maintain production levels and pricing;
trade restrictions, trade protection measures, price controls, or trade disputes;


sanctions, such as prohibitions or restrictions by the United States against countries that are the targets of economic sanctions, or are designated as state sponsors of terrorism;
foreign ownership restrictions;
import or export licensing requirements;
restrictions on operations, trade practices, trade partners, and investment decisions resulting from domestic and foreign laws, and regulations;
regime changes;
changes in, and the administration of, treaties, laws, and regulations including in response to public health issues;
inability to repatriate income or capital;
reductions in the availability of qualified personnel;
foreign currency fluctuations or currency restrictions; and
fluctuations in the interest rate component of forward foreign currency rates.
DTC and Euroclear may cease to act as depository and clearing agencies for our shares.
Our shares were issued into the facilities of The Depository Trust Company (“DTC”) with respect to shares listed on the NYSE and Euroclear with respect to shares listed on Euronext Paris (DTC and Euroclear being referred to as the “Clearance Services”). The Clearance Services are widely used mechanisms that allow for rapid electronic transfers of securities between the participants in their respective systems, which include many large banks and brokerage firms. The Clearance Services have general discretion to cease to act as a depository and clearing agencies for our shares. If either of the Clearance Services determine at any time that our shares are not eligible for continued deposit and clearance within its facilities, then we believe that our shares would not be eligible for continued listing on the NYSE or Euronext Paris, as applicable, and trading in our shares would be disrupted. Any such disruption could have a material adverse effect on the trading price of our shares.
The United Kingdom’s withdrawal from the European Union may have a negative effect on global economic conditions, financial markets, and our business.
We are based in the United Kingdom and have operational headquarters in Paris, France; Houston, Texas, United States; and in London, United Kingdom, with worldwide operations, including material business operations in Europe. The United Kingdom formally withdrew from the European Union on January 31, 2020 and entered into a transition period, which will end on or after December 31, 2020. During the transition period, the United Kingdom and the European Union will continue to negotiate their future customs and trading arrangements, and other aspects of their relationship. Political and economic uncertainty remains about whether the terms of the relationship will differ materially from the terms before withdrawal, as well as the possibility that a so-called “no deal” separation will occur if negotiations are not completed by the end of the transition period.

These developments could have a material adverse effect on global economic conditions and the stability of the global financial markets and could significantly reduce global market liquidity and restrict the ability of key market participants to operate in certain financial markets. Asset valuations, currency exchange rates, and credit ratings may be especially subject to increased market volatility. In addition, a lack of clarity about the future relationship between the United Kingdom and the European Union, and their respective laws and regulations, including financial laws and regulations, tax and free trade agreements, intellectual property rights, supply chain logistics, environmental, health and safety laws and regulations, immigration laws, employment laws, and other rules that would apply to us and our subsidiaries, could increase our costs, restrict our access to capital within the United Kingdom and the European Union, depress economic activity, and further decrease foreign direct investment in the United Kingdom. For example, withdrawal from the European Union could, depending on the negotiated terms of such withdrawal, eliminate the benefit of certain tax-related E.U. directives currently applicable to U.K. companies such as us, including the Parent-Subsidiary Directive and the Interest and Royalties Directive, which could, subject to any relief under an available tax treaty, raise our tax costs.


Any of these factors could have a material adverse effect on our business, financial condition, or results of operations.
As an English public limited company, we must meet certain additional financial requirements before we may declare dividends or repurchase shares and certain capital structure decisions may require stockholder approval which may limit our flexibility to manage our capital structure. We may not be able to pay dividends or repurchase shares of our ordinary shares in accordance with our announced intent, or at all.
Under English law, we will only be able to declare dividends, make distributions, or repurchase shares (other than out of the proceeds of a new issuance of shares for that purpose) out of “distributable profits.” Distributable profits are a company’s accumulated, realized profits, to the extent that they have not been previously utilized by distribution or capitalization, less its accumulated, realized losses, to the extent that they have not been previously written off in a reduction or reorganization of capital duly made. In addition, as a public limited company incorporated in England and Wales, we may only make a distribution if the amount of our net assets is not less than the aggregate of our called-up share capital and non-distributable reserves, and to the extent that the distribution does not reduce the amount of those assets to less than that aggregate.
Following the Merger, we implemented a court-approved reduction of our capital, which was completed on June 29, 2017, in order to create distributable profits to support the payment of possible future dividends or future share repurchases. Our articles of association permit us by ordinary resolution of the stockholders to declare dividends, provided that the directors have made a recommendation as to its amount. The dividend shall not exceed the amount recommended by the Board of Directors. The directors may also decide to pay interim dividends if it appears to them that the profits available for distribution justify thesuch payment. When recommending or declaring payment of a dividend, the directors are required under English law to comply with their duties, including considering our future financial requirements.
In addition, the Board of Directors’ determinations regarding dividends and share repurchases will depend on a variety of other factors, including our net income, cash flow generated from operations or other sources, liquidity position, and potential alternative uses of cash, such as acquisitions, as well as economic conditions and expected future financial results. Our ability to declare and pay future dividends and make future share repurchases will
32


depend on our future financial performance, which in turn depends on the successful implementation of our strategy and on financial, competitive, regulatory, technical, general economic conditions, demand and selling prices for our products and services, and other factors specific to our industry or specific projects, many of which are beyond our control. Therefore, our ability to generate cash depends on the performance of our operations and could be limited by decreases in our profitability or increases in costs, regulatory changes, capital expenditures, or debt servicing requirements.
Any failure to pay dividends or repurchase shares of our ordinary shares could negatively impact our reputation, harm investor confidence in us, and cause the market price of our ordinary shares to decline.
Our existing and future debt may limit cash flow available to invest in the ongoing needs of our business and could prevent us from fulfilling our obligations under our outstanding debt.
We have substantial existing debt. As of December 31, 2019, our total debt is $4.5 billion. We also have the capacity under our $2.5 billion credit facility, in addition to our bilateral facility, to incur substantial additional debt. Our level of debt could have important consequences. For example, it could:
make it more difficult for us to make payments on our debt;
require us to dedicate a substantial portion of our cash flow from operations to the payment of debt service, reducing the availability of our cash flow to fund working capital, capital expenditures, acquisitions, distributions, and other general partnership purposes;
increase our vulnerability to adverse economic or industry conditions;
limit our ability to obtain additional financing to react to changes in our business; or
place us at a competitive disadvantage compared to businesses in our industry that have less debt.
Additionally, any failure to meet required payments on our debt or to comply with any covenants in the instruments governing our debt, could result in an event of default under the terms of those instruments. In the event of such


default, the holders of such debt could elect to declare all the amounts outstanding under such instruments to be due and payable.
The London Interbank Offered Rate (“LIBOR”) and certain other interest “benchmarks” may be subject to regulatory guidance and/or reform that could cause interest rates under our current or future debt agreements to perform differently than in the past or cause other unanticipated consequences. The United Kingdom’s Financial Conduct Authority, which regulates LIBOR, has announced that it intends to stop encouraging or requiring banks to submit LIBOR rates after 2021, and it is unclear if LIBOR will cease to exist or if new methods of calculating LIBOR will evolve. If LIBOR ceases to exist or if the methods of calculating LIBOR change from their current form, interest rates on our current or future debt obligations may be adversely affected.
A downgrade in our debt rating could restrict our ability to access the capital markets.
The terms of our financing are, in part, dependent on the credit ratings assigned to our debt by independent credit rating agencies. We cannot provide assurance that any of our current credit ratings will remain in effect for any given period of time or that a rating will not be lowered or withdrawn entirely by a rating agency. Factors that may impact our credit ratings include debt levels, capital structure, planned asset purchases or sales, near- and long-term production growth opportunities, market position, liquidity, asset quality, cost structure, product mix, customer and geographic diversification, and commodity price levels. A downgrade in our credit ratings, particularly to non-investment grade levels, could limit our ability to access the debt capital markets or refinance our existing debt or cause us to refinance or issue debt with less favorable terms and conditions. Moreover, our revolving credit agreement includes an increase in interest rates if the ratings for our debt are downgraded, which could have an adverse effect on our results of operations. An increase in the level of our indebtedness and related interest costs may increase our vulnerability to adverse general economic and industry conditions and may affect our ability to obtain additional financing, as well as have a material adverse effect on our business, financial condition, or results of operations.
Uninsured claims and litigation against us, including product liability and claims and intellectual property litigation, could adversely impact our financial condition, results of operations, or cash flows.
We could be impacted by the outcome of pending litigation, as well as unexpected litigation or proceedings. We have insurance coverage against operating hazards, including product liability claims and personal injury claims related to our products or operating environments in which our employees operate, to the extent deemed prudent by our management and to the extent insurance is available. However, our insurance policies are subject to exclusions, limitations, and other conditions and may not apply in all cases, for example, where willful wrongdoing on our part is alleged. Additionally, the nature and amount of that insurance may not be sufficient to fully indemnify us against liabilities arising out of pending and future claims and litigation. Additionally, in individual circumstances, certain proceedings or cases may also lead to our formal or informal exclusion from tenders or the revocation or loss of business licenses or permits. Our financial condition, results of operations, or cash flows could be adversely affected by unexpected claims not covered by insurance.
In addition, the tools, techniques, methodologies, programs, and components we use to provide our services may infringe upon the intellectual property rights of others. Infringement claims generally result in significant legal and other costs. The resolution of these claims could require us to pay damages, enter into license agreements or develop alternative technologies. The development of these technologies or the payment of royalties under licenses from third parties, if available, would increase our costs. If a license were not available, or we are not able to develop alternative technologies, we might not be able to continue providing a particular service or product, which could adversely affect our financial condition, results of operations, or cash flows.
Currency exchange rate fluctuations could adversely affect our financial condition, results of operations, or cash flows.
We conduct operations around the world in many different currencies. Because a significant portion of our revenue is denominated in currencies other than our reporting currency, the U.S. dollar, changes in exchange rates will produce fluctuations in our revenue, costs, and earnings, and may also affect the book value of our assets and liabilities and related equity. We hedge transaction impacts on margins and earnings where a transaction is not in the functional currency of the business unit, but we do not hedge translation impacts on earnings. Our efforts to minimize our currency exposure through such hedging transactions may not be successful depending on market and business conditions. Moreover, certain currencies in which we conduct operations, specifically currencies in countries such as Angola and Nigeria, do not actively trade in the global foreign exchange markets and may subject


us to increased foreign currency exposures. As a result, fluctuations in foreign currency exchange rates may adversely affect our financial condition, results of operations, or cash flows.
Our acquisition and divestiture activities involve substantial risks.
We have made and expect to continue to pursue acquisitions, dispositions, or other investments that may strategically fit our business and/or growth objectives. We cannot provide assurances that we will be able to locate suitable acquisitions, dispositions, or investments, or that we will be able to consummate any such transactions on terms and conditions acceptable to us. Even if we do successfully execute such transactions, they may not result in anticipated benefits, which could have a material adverse effect on our financial results. If we are unable to successfully integrate and develop acquired businesses, we could fail to achieve anticipated synergies and cost savings, including any expected increases in revenues and operating results. We may not be able to successfully cause a buyer of a divested business to assume the liabilities of that business or, even if such liabilities are assumed, we may have difficulties enforcing our rights, contractual or otherwise, against the buyer. We may invest in companies or businesses that fail, causing a loss of all or part of our investment. In addition, if we determine that an other-than-temporary decline in the fair value exists for a company in which we have invested, we may have to write down that investment to its fair value and recognize the related write-down as an investment loss.
A failure of our IT infrastructure, including as a result of cyber attacks, could adversely impact our business and results of operations.
The efficient operation of our business is dependent on our IT systems. Accordingly, we rely upon the capacity, reliability, and security of our IT hardware and software infrastructure and our ability to expand and update this infrastructure in response to changing needs. We have been subject to cyber attacks in the past, including phishing, malware, and ransomware. No such attack has had a material adverse effect on our business, however this may not be the case with future attacks. Our systems may be vulnerable to damages from such attacks, as well as from natural disasters, failures in hardware or software, power fluctuations, unauthorized access to data and systems, loss or destruction of data (including confidential customer information), human error, and other similar disruptions, and we cannot give assurance that any security measures we have implemented or may in the future implement will be sufficient to identify and prevent or mitigate such disruptions.
We rely on third parties to support the operation of our IT hardware, software infrastructure, and cloud services, and in certain instances, utilize web-based and software-as-a-service applications. The security and privacy measures implemented by such third parties, as well as the measures implemented by any entities we acquire or with whom we do business, may not be sufficient to identify or prevent cyber attacks, and any such attacks may have a material adverse effect on our business. While our IT vendor agreements typically contain provisions that seek to eliminate or limit our exposure to liability for damages from a cyber attack, we cannot ensure such provisions will withstand legal challenges or cover all or any such damages.
Threats to our IT systems arise from numerous sources, not all of which are within our control, including fraud or malice on the part of third parties, accidental technological failure, electrical or telecommunication outages, failures of computer servers or other damage to our property or assets, outbreaks of hostilities, or terrorist acts. The failure of our IT systems or those of our vendors to perform as anticipated for any reason or any significant breach of security could disrupt our business and result in numerous adverse consequences, including reduced effectiveness and efficiency of operations, inappropriate disclosure of confidential and proprietary information, reputational harm, increased overhead costs, and loss of important information, which could have a material adverse effect on our business and results of operations. In addition, we may be required to incur significant costs to protect against damage caused by these disruptions or security breaches in the future. Our insurance coverage may not cover all of the costs and liabilities we incur as the result of any disruptions or security breaches, and if our business continuity and/or disaster recovery plans do not effectively and timely resolve issues resulting from a cyber attack, we may suffer material adverse effects on our business.
We are subject to governmental regulation and other legal obligations related to privacy, data protection, and data security. Our actual or perceived failure to comply with such obligations could harm our business.
We are subject to international data protection laws, such as the General Data Protection Regulation 2016/679, or GDPR, in the European Economic Area, or EEA.EEA, and the UK equivalent (“UK GDPR”). The GDPR, imposesUK GDPR and implementing legislation in the EEA and UK impose several stringent requirements for controllers and processors of personal data which have increased our obligations, including, for example, by requiring more robust disclosures to individuals, notifications, in some cases, of data breaches to regulators and data subjects, and a record of processing and other policies and procedures to be maintained to adhere to the accountability principle.
In addition, we are subject to the GDPR and UK GDPR’s rules on transferring personal data outside of the EEA and UK (including to the


United States), and somerecent legal developments in Europe have created complexity and uncertainty regarding such transfers. Most recently, on July 16, 2020, the Court of these rulesJustice of the European Union (“CJEU”) invalidated the EU-US Privacy Shield Framework (“Privacy Shield”) under which personal data could be transferred from the European Union to US entities who had self-certified under the Privacy Shield scheme, and the decision cast uncertainly on when transfers could be made under the standard contractual clauses; compliance with such may require us to change processes by which we transfer data outside of the European Union and United Kingdom, including to the United States. As supervisory authorities issue further guidance on personal data export mechanisms, including circumstances where the standard contractual clauses cannot be used, and/or start taking enforcement action, we could suffer additional costs, complaints and/or regulatory investigations or fines, and/or if we are currently being challengedotherwise unable to transfer personal data between and among countries and regions in which we operate, it could affect the manner in which we provide our services, the geographical location or segregation of our relevant systems and operations, and could adversely affect our financial results.
We are also subject to evolving EU and UK privacy laws on cookies and e-marketing. In the European Union and the United Kingdom, regulators are increasingly focusing on compliance with requirements in the courts. online behavioral advertising ecosystem, and current national laws that implement the ePrivacy Directive are highly likely to be replaced by an EU regulation known as the ePrivacy Regulation which will significantly increase fines for non-
33


compliance. If regulators start to enforce the strict approach in recent guidance, this could lead to substantial costs, and require significant systems changes.
Failure to comply with the requirements of GDPR, UK GDPR and the local laws implementing or supplementing the GDPR could result in fines of(for example, non-compliance with the GDPR or UK GDPR, specifically, may result in administrative fines or monetary penalties, by each regime, up to €20,000,000the greater of €20,000,000/ £17,000,000 or up to 4%4 percent of the total worldwide annual turnover of the preceding financial year, whichever is higher,year). In addition, we may also face regulatory investigations and enforcement action, reputational damage, and civil claims including representative actions and other class action type litigation, potentially amounting to significant compensation or damages liabilities, as well as other administrative penalties. associated costs, diversion of internal resources, and reputational harm.
We are likely to be required to expend significant capital and other resources to ensure ongoing compliance with the GDPR, UK GDPR and other applicable data protection legislation, and we may be required to put in place additional control mechanisms which could be onerous and adversely affect our business, financial condition, results of operations, or cash flows.
The IRS may not agree that we should be treated as a foreign corporation for U.S. federal tax purposes and may seek to impose an excise tax on gains recognized by certain individuals.
Although we are incorporated in the United Kingdom, the U.S. Internal Revenue Service (the “IRS”) may assert that we should be treated as a U.S. “domestic” corporation (and, therefore, a U.S. tax resident) for U.S. federal income tax purposes pursuant to Section 7874 of the U.S. Internal Revenue Code of 1986, as amended (the “Code”). For U.S. federal income tax purposes, a corporation (i) is generally considered a “domestic” corporation (or U.S. tax resident) if it is organized in the United States or of any state or political subdivision therein, and (ii) is generally considered a “foreign” corporation (or non-U.S. tax resident) if it is not considered a domestic corporation. Because we are a U.K. incorporated entity, we would be considered a foreign corporation (and, therefore, a non-U.S. tax resident) under these rules. Section 7874 of the Code (“Section 7874”) provides an exception under which a foreign incorporated entity may, in certain circumstances, be treated as a domestic corporation for U.S. federal income tax purposes.
We do not believe this exception applies. However, the Section 7874 rules are complex and subject to detailed regulations, the application of which is uncertain in various respects. It is possible that the IRS will not agree with our position. Should the IRS successfully challenge our position, it is also possible that an excise tax under Section 4985 of the Code (the “Section 4985 Excise Tax”) may be assessed against certain “disqualified individuals” (including former officers and directors of FMC Technologies, Inc.) on certain stock-based compensation held thereby. We may, if we determine that it is appropriate, provide disqualified individuals with a payment with respect to the Section 4985 Excise Tax, so that, on a net after-tax basis, they would be in the same position as if no such Section 4985 Excise Tax had been applied.
In addition, there can be no assurance that there will not be a change in law or interpretation, including with retroactive effect, that might cause us to be treated as a domestic corporation for U.S. federal income tax purposes.
U.S. tax laws and/or guidance could affect our ability to engage in certain acquisition strategies and certain internal restructurings.
Even if we are treated as a foreign corporation for U.S. federal income tax purposes, Section 7874, U.S. Treasury regulations, and other guidance promulgated thereunder may adversely affect our ability to engage in certain future acquisitions of U.S. businesses or to restructure the non-U.S. members of our group. These limitations, if applicable, may affect the tax efficiencies that otherwise might be achieved in such potential future transactions or restructurings.
In addition, the IRS and the U.S. Treasury have issued final and temporary regulations providing that, even if we are treated as a foreign corporation for U.S. federal income tax purposes, certain intercompany debt instruments issued on or after April 4, 2016 will be treated as equity for U.S. federal income tax purposes, therefore limiting U.S. tax benefits and resulting in possible U.S. withholding taxes. Although recent guidance from the U.S. Treasury, through recent guidance, removes certain documentation requirements that would otherwise be imposed with respect to covered debt instruments, announces an intention to further modify and possibly withdraw certain classification rules relating to covered debt instruments, and further indicates that these rules generally are the subject of continuing study and may be further materially modified, the current regulations may adversely affect our future effective tax rate and could also impact our ability to engage in future restructurings if such transactions cause an existing intercompany debt instrument to be treated as reissued for U.S. federal income tax purposes.
34


We are subject to the tax laws of numerous jurisdictions; challenges to the interpretation of, or future changes to, such laws could adversely affect us.
We and our subsidiaries are subject to tax laws and regulations in the United Kingdom, the United States, France, and numerous other jurisdictions in which we and our subsidiaries operate. These laws and regulations are inherently complex, and we are, and will continue to be, obligated to make judgments and interpretations about the application of these laws and regulations to our operations and businesses. The interpretation and application of


these laws and regulations could be challenged by the relevant governmental authorities, which could result in administrative or judicial procedures, actions, or sanctions, which could be material.
On December 22, 2017, the Tax Cuts and Jobs Act was signed into law in the United States, which made extensive changes to the U.S. taxation of multinational companies, and is subject to futurecontinuing regulatory and possible legislative changes.changes, especially given the new Administration and Congress in the United States. In addition, the U.S. Congress, the U.K. Government, the European Union, the Organization for Economic Co-operation and Development (the “OECD”), and other government agencies in jurisdictions where we and our affiliates do business have had an extended focus on issues related to the taxation of multinational corporations. For instance, in October 2021, the OECD released additional proposals under Base Erosion and Profit Shifting that provide for a global minimum tax of 15%, and to date approximately 140 countries have tentatively signed a framework agreeing in principle to this initiative. The implementation of this global minimum tax, however, is contingent upon the independent actions of participating countries and is subject to further negotiation among OECD member states. New tax initiatives, directives, and rules, such as the U.S. Tax Cuts and Jobs Act, the OECD’s Base Erosion and Profit Shifting initiative, and the European Union’s Anti-Tax Avoidance Directives, may increase our tax burden and require additional compliance-related expenditures. As a result, our financial condition, results of operations, or cash flows may be adversely affected. Moreover, the U.S. government, and other jurisdictions in which we do business, may enact significant changes to the taxation of business entities including, among others, the imposition of minimum taxes or surtaxes on certain types of income. The likelihood of these changes being enacted or implemented is unclear. Further changes, including with retroactive effect, in the tax laws of the United States, the United Kingdom, the European Union, or other countries in which we and our affiliates do business could also adversely affect us.

We may not qualify for benefits under tax treaties entered into between the United Kingdom and other countries.
We operate in a manner such that we believe we are eligible for benefits under tax treaties between the United Kingdom and other countries. However, our ability to qualify for such benefits will depend on whether we are treated as a U.K. tax resident, the requirements contained in each treaty and applicable domestic laws, on the facts and circumstances surrounding our operations and management, and on the relevant interpretation of the tax authorities and courts. For example, because of Brexit, we may lose some or all of the benefits of tax treaties between the United States and the remaining members of the European Union, and face higher tax liabilities, which may be significant. Another example is the Multilateral Convention to Implement Tax Treaty Related Measures to Prevent Base Erosion and Profit Shifting (the “MLI”), which entered into force for participating jurisdictions on July 1, 2018. The MLI recommends that countries adopt a “limitation-on-benefit” (“LOB”) rule and/or a “principle purposes“principal purpose test” (“PPT”) rule with regards to their tax treaties. The scope and interpretation of these rules as adopted pursuant to the MLI are presently under development, but the application of eitherthe LOB rule mightor the PPT rule could deny us tax treaty benefits (such as a reduced rate of withholding tax) that were previously available and as such there remains uncertainty as to whether and, if so, to what extent such treaty benefits will continue to be available. The position is likely to remain uncertain for a number of years.
The failure by us or our subsidiaries to qualify for benefits under tax treaties entered into between the United Kingdom and other countries could result in adverse tax consequences to us (including an increased tax burden and increased filing obligations) and could result in certain tax consequences of owning and disposing of our shares.
We intend to be treated exclusively as a resident of the United Kingdom for tax purposes, but French or other tax authorities may seek to treat us as a tax resident of another jurisdiction.
We are incorporated in the United Kingdom. English law currently provides that we will be regarded as a U.K. resident for tax purposes from incorporation and shall remain so unless (i) we are concurrently a resident in another jurisdiction (applying the tax residence rules of that jurisdiction) that has a double tax treaty with the United Kingdom and (ii) there is a tiebreaker provision in that tax treaty which allocates exclusive residence to that other jurisdiction.
35


In this regard, we have a permanent establishment in France to satisfy certain French tax requirements imposed by the French Tax Code with respect to the Merger. Although it is intended that we will be treated as having our exclusive place of tax residence in the United Kingdom, the French tax authorities may claim that we are a tax resident of France if we were to fail to maintain our “place of effective management” in the United Kingdom. Any such claim would be settled between the French and U.K. tax authorities pursuant to the mutual assistance procedure provided for by the tax treaty concluded between France and the United Kingdom. There is no assurance that these authorities would reach an agreement that we will remain exclusively a U.K. tax resident; an adverse determination could materially and adversely affect our business, financial condition, results of operations, or cash flows. A failure to maintain exclusive tax residency in the United Kingdom could result in adverse tax consequences to us and our subsidiaries and could result in certain adverse changes in the tax consequences of owning and disposing of our shares.
Pirates endangerGeneral Risk Factors
Our businesses are dependent on the continuing services of our maritime employeeskey managers and assets.employees.
We face material piracy risksdepend on key personnel. The loss of any key personnel could adversely impact our business if we are unable to implement key strategies or transactions in their absence. The loss of qualified employees or failure to retain and motivate additional highly skilled employees required for the operation and expansion of our business could hinder our operation and expansion, as well as our ability to successfully conduct research activities and develop marketable products and services.
Seasonal and weather conditions could adversely affect demand for our services and operations.
Our business may be materially affected by variation from normal weather patterns, such as cooler or warmer summers and winters. Adverse weather conditions, such as hurricanes in the Gulf of Guinea, the Somali Basin,Mexico or extreme winter conditions in Canada, and the GulfNorth Sea, may interrupt or curtail our operations, or our customers’ operations, cause supply disruptions or loss of Aden,productivity, and may result in a loss of revenue or damage to a lesser extent, in Southeast Asia, Malacca,our equipment and the Singapore Straits. Piracy represents a risk for both our projects and our vessels, which operate and transport through sensitive maritime areas. Such risks have the potential to significantly


harm our crews and to negatively impact the execution schedule for our projects. If our maritime employees or assets are endangered, additional time may be required to find an alternative solution,facilities, which may delay project realization and negatively impact our business, financial condition, or results of operations.
Risks Related to the Proposed Separation Transaction
The proposed separation transaction announced on August 26, 2019 is contingent upon the satisfaction of a number of conditions, may require significant time and attention of our management, and may not achieve the intended results.
As previously disclosed, our Board of Directors unanimously approved a plan to separate into two independent, publicly traded companies. For more information, please refer to Note 3 to our consolidated financial statements of this Annual Report on Form 10-K. The completion of the transaction, which is expected to be structured as a separation of our Onshore/Offshore segment including Genesis, a leader in front-end engineering and design, as well as Loading Systems, a leader in cryogenic material transfer products, and Cybernetix, a technology leader in process automation, is contingent upon the final approval of our Board of Directors as well as market conditions and the receipt of regulatory approvals, which are beyond our control, as well as consultation of employee representatives, where applicable. We may also choose to abandon the separation at any time. For these and other reasons, the separation may not be completedinsured. In addition, acute or chronic physical impacts of climate change, such as sea level rise, coastal storm surge, inland flooding from intense rainfall and hurricane-strength winds may damage our facilities or the facilities of key third parties. Increasing concentrations of greenhouse gases in the expected timeframe or at all. Additionally, the executionEarth’s atmosphere may produce climate changes that increase variation from normal weather patterns, such as increased frequency and severity of the proposed separation will likely continue to require significant timestorms, floods, droughts, and attention of our management,other climatic events, which could further impact other strategic initiatives. Our employees mayour operations. Significant physical effects of climate change could also be uncertain about their future roles withinhave a direct effect on our operations and an indirect effect on our business by interrupting the separate companies pending the completionoperations of the separation, which could lead to departures.

Also, in connectionthose with the separation,whom we will indemnify Technip Energies for certain liabilities and Technip Energies will indemnify us for certain liabilities. If we are required to act ondo business. Any of these indemnities to Technip Energies, our financial results could be negatively impacted. Additionally, any indemnity from Technip Energies may not be sufficient to insure us against the full amount of liabilities for which we are responsible and Technip Energies may not be able to satisfy its indemnification obligations in the future.

Any such difficultiesevents or outcomes could have ana material adverse effect on our business, financial condition, cash flows, or results of operations.

Currency exchange rate fluctuations could adversely affect our financial condition, results of operations, or cash flows.
We conduct operations around the world in many different currencies. Because a significant portion of our revenue is denominated in currencies other than our reporting currency, the U.S. dollar, changes in exchange rates will produce fluctuations in our revenue, costs, and causeearnings, and may also affect the combined market value of us and Technip Energies after the separation to fall short of the marketbook value of our shares priorassets and liabilities and related equity. We hedge transaction impacts on margins and earnings where a transaction is not in the functional currency of the business unit, but we do not hedge translation impacts on earnings. Our efforts to minimize our currency exposure through such hedging transactions may not be successful depending on market and business conditions. Moreover, certain currencies in which we conduct operations, specifically currencies in countries such as Angola and Nigeria, do not actively trade in the separation. Substantial salesglobal foreign exchange markets and may subject us to increased foreign currency exposures. As a result, fluctuations in foreign currency exchange rates may adversely affect our financial condition, results of operations, or cash flows.
We are exposed to risks in connection with our sharesdefined benefit pension plan commitments.
We have funded and unfunded defined benefit pension plans, which provide defined benefits based on years of service and salary. We are required to recognize the funded status of defined benefit post-retirement plans as an asset or liability in the consolidated balance sheet and recognize changes in that funded status in comprehensive income in the year in which the changes occur. Further, we are required to measure each plan’s assets and its obligations that determine its funded status as of the date of the consolidated balance sheet. Each defined benefit pension plan’s assets are invested in different asset classes and their value may also occurfluctuate in accordance with market conditions. Any deterioration in the value of the defined benefit pension plan assets could therefore increase
36


our obligations. Any such increases in our net pension obligations could adversely affect our financial condition due to increased additional outflow of funds to finance the pension obligations.
In addition, applicable law and/or the terms of the relevant defined benefit pension plan may require us to make cash contributions or provide financial support upon the occurrence of certain events. We cannot predict whether, or to what extent, changing market or economic conditions, regulatory changes or other factors will further increase our pension expense or funding obligations. For further information regarding our pension liabilities, see Note 22 for further information.
We may be unable to obtain sufficient bonding capacity for certain contracts, and the need for performance and surety bonds could reduce availability under our credit facility.

In line with industry practice, we are often required to post standby letters of credit to customers or enter into surety bond arrangements in favor of customers. Those letters of credit and surety bond arrangements generally protect customers against our failure to perform our obligations under the applicable contracts. If we are unable to renew or obtain a sufficient level of bonding capacity in the future, we may be precluded from bidding for certain contracts or contracting with certain customers. Additionally, even if we are able to successfully renew or obtain performance or payment bonds, we may be required to post letters of credit in connection with the separation, which could causebonds. The letters of credit would reduce availability under our share pricecredit facility. Furthermore, under standard terms in the surety market, sureties issue bonds on a project-by-project basis and can decline to decline.issue bonds at any time or require the posting of additional collateral as a condition to issuing or renewing any bonds. If we were to experience an interruption or reduction in the availability of bonding capacity as a result of these or any other reasons, we may be unable to compete for or work on projects that require bonding.

ITEM 1B. UNRESOLVED STAFF COMMENTS
None.

34


ITEM 2. PROPERTIES
Our corporate headquarters is in London,Newcastle, England. We also maintain corporate offices in Houston, Texas, and Paris, France, where significant worldwide global support activity occurs. In addition, we own or lease numerous properties throughout the world.
We believe our properties and facilities are suitable for their present and intended purposes and are operating at a level consistent with the requirements of the industry in which we operate. We also believe that our leases are at competitive or market rates and do not anticipate any difficulty in leasing suitable additional space upon expiration of our current lease terms.
The following table shows our principal properties by reporting segment at December 31, 2019:
2021:
LocationSegment
Africa
Hassi Messaoud, AlgeriaSurface
Lagos, NigeriaSubsea
Lobito, AngolaSubsea
Luanda, AngolaSubsea
Malabo, Equatorial GuineaSubsea
Port Harcourt, NigeriaSubsea
Takoradi, GhanaSubsea
Asia
Chennai, IndiaSubsea
Hyderabad, IndiaSurface
Jakarta, IndonesiaSurface
Johor, MalaysiaSubsea
Kuala Lumpur, MalaysiaSubsea
LocationNoida, IndiaSegmentSubsea, Surface
37


AfricaLocationSegment
Dande, AngolaNusajaya, MalaysiaSubsea, Surface
Hassi-Messaoud, AlgeriaSingaporeSubsea, Surface
Lagos, NigeriaAustraliaSubsea
Lobito, AngolaHenderson, AustraliaSubsea
Luanda, AngolaPerth, AustraliaSubsea
Malabo, Equatorial GuineaEuropeSubsea
Port Harcourt, NigeriaSubsea
Takoradi, GhanaSubsea
Asia
Chennai, IndiaOnshore/Offshore
Dahej, IndiaOnshore/Offshore
Hyderabad, IndiaSurface
Jakarta, IndonesiaSubsea, Onshore/Offshore, Surface
Johor, MalaysiaSubsea
Kuala Lumpur, MalaysiaSubsea, Onshore/Offshore
Mumbai, IndiaOnshore/Offshore
New Delhi, IndiaOnshore/Offshore
Noida, IndiaSubsea, Onshore/Offshore, Surface
Nusajaya, MalaysiaSubsea, Surface
SingaporeSubsea, Surface, Onshore/Offshore
Australia
Henderson, AustraliaSubsea
Perth, AustraliaSubsea, Onshore/Offshore
Europe
Aberdeen, United KingdomSubsea, Surface
Aktau, KazakhstanSubsea, Surface
Atyrau, KazakhstanSubsea, Surface
Arnhem, The NetherlandsSurface
Barcelona, SpainAtyrau, KazakhstanOnshore/OffshoreSubsea, Surface
Bergen, NorwaySubsea Surface
Compiegne, FranceSubsea
Courbevoie (Paris - La Défense), FranceSubsea Onshore/Offshore
Dunfermline, United KingdomSubsea, Surface
Ellerbek, GermanySurface
Evanton, United KingdomSubsea
Horten, NorwaySubsea
Kongsberg, NorwaySubsea, Surface
Krakow, PolandSubsea
La Garenne Colombes, FranceOnshore/Offshore
Le Trait, FranceSubsea


Lisbon, PortugalSubsea
Lysaker, NorwaySubsea
Moscow, RussiaSubsea, Surface
Newcastle, United KingdomSubsea
Orkanger, NorwaySubsea
Sens, FranceSurface
Stavanger, NorwaySubsea, Surface
Veenord, NetherlandsSurface
Westhill, United KingdomSubsea
Middle East
Lisbon, PortugalSubsea
London, United KingdomSubsea, Onshore/Offshore
Lyon, FranceOnshore/Offshore
Moscow, RussiaSubsea, Onshore/Offshore, Surface
Newcastle, United KingdomSubsea
Lysaker, NorwaySubsea, Onshore/Offshore
Orkanger, NorwaySubsea
Rome, ItalyOnshore/Offshore
Schoonebeek, NetherlandsSurface
Sens, FranceSurface
St. Petersburg, RussiaSubsea, Onshore/Offshore
Stavanger, NorwaySubsea, Surface
Zoetermeer, NetherlandsOnshore/Offshore
Middle East
Abu Dhabi, United Arab EmiratesOnshore/Offshore, Surface
Dammam, Saudi ArabiaSurface
North AmericaDoha, QatarSurface
North America
Brighton (Colorado), United StatesSurface
Calgary (Alberta), CanadaSurface
Corpus Christi (Texas)Charleroi (Pennsylvania), United StatesSurface
Davis (California), United StatesSubsea
Erie (Pennsylvania), United StatesSurface
Houston (Texas), United StatesSubsea, Onshore/Offshore, Surface
Edmonton (Alberta), CanadaSurface
Erie (Pennsylvania), United StatesSurface
Odessa (Texas), United StatesSurface
Oklahoma City (Oklahoma), United StatesSurface
San Antonio (Texas), United StatesSurface
Stephenville (Texas), United StatesSurface
St. John’s (Newfoundland), CanadaSubsea
Theodore (Alabama), United StatesSubsea
South America
Bogota, ColombiaGeorgetown, GuyanaOnshore/OffshoreSubsea
Macaé, BrazilSubsea
Neuquén, ArgentinaSurface
38


LocationSegment
Rio de Janeiro, BrazilSubsea, Surface
São João da Barra, BrazilSubsea
Vitória, BrazilVeracruz, MexicoSubseaSurface
Yopal, ColumbiaSurface


The following table shows marine vessels in which we held an interest or operated as of December 31, 2019:
2021:
Vessel NameVessel TypeSpecial Equipment
Deep BluePLSVReeled pipelay/flexible pipelay/umbilical systems
Deep EnergyPLSVReeled pipelay/flexible pipelay/umbilical systems
Apache IIPLSVReeled pipelay/umbilical systems
Global 1200Deep OrientPLSV/HCVConventional pipelay/Heavy handling operationsConstruction/installation systems
Deep OrientHCVConstruction/installation systems
North Sea Atlantic(a)
HCVConstruction/installation systems
Skandi Africa(a)
HCVConstruction/installation systems
Deep ArcticDSV/HCVDiver support systems
Deep DiscovererDSV/HCVDiver support systems
Deep ExplorerDSV/HCVDiver support systems
Skandi VitóriaPLSVFlexible pipelay/umbilical systems
Skandi NiteróiPLSVFlexible pipelay/umbilical systems
Coral do AtlanticoPLSVFlexible pipelay/umbilical systems
Deep Star (previously Estrela do Mar)PLSVFlexible pipelay/umbilical systems
Skandi AçuPLSVFlexible pipelay/umbilical systems
Skandi BúziosPLSVFlexible pipelay/umbilical systems
Skandi OlindaPLSVFlexible pipelay/umbilical systems
Skandi RecifePLSVFlexible pipelay/umbilical systems
(a)Vessels under long term charter.     
PLSV: Pipelay Support Vessel
HCV: Heavy Duty Construction Vessel
DSV: Diving Support Vessel


ITEM 3. LEGAL PROCEEDINGS
A purported shareholder class action filed in 2017 and amended in January 2018 and captioned Prause v. TechnipFMC, et al., No. 4:17-cv-02368 (S.D. Texas) is pending in the U.S. District Court for the Southern District of Texas against the Company and certain current and former officers and employees of the Company. The suit alleged violations of the federal securities laws in connection with the Company's restatement of our first quarter 2017 financial results and a material weakness in our internal control over financial reporting announced on July 24, 2017. On January 18, 2019, the District Court dismissed claims under Section 10(b) and 20(a) of the Securities Exchange Act of 1934, as amended, and Section 15 of the Securities Act of 1933, as amended (“Securities Act”). A remaining claim for alleged violation of Section 11 of the Securities Act in connection with the reporting of certain financial results in the Company’s Form S-4 Registration Statement filed in 2016 is pending and seeks unspecified damages. The Company is vigorously contesting the litigation and cannot predict its duration or outcome.
In addition to the above-referenced matters, weWe are involved in various other pending or potential legal actions or disputes in the ordinary course of our business. These actions and disputes can involve our agents, suppliers, clients, and join venture partners and can include claims related to payment of fees, service quality, and ownership arrangements, including certain put or call options. Management is unable to predict the ultimate outcome of these actions because of their inherent uncertainty. However, management believes that the most probable, ultimate resolution of these matters will not have a material adverse effect on our consolidated financial position, results of operations, or cash flows.

ITEM 4. MINE SAFETY DISCLOSURES
Not applicable.

37


PART II
ITEM 5. MARKET FOR REGISTRANT’S COMMON EQUITY, RELATED STOCKHOLDER MATTERS AND ISSUER PURCHASES OF EQUITY SECURITIES
Our ordinary shares are listed on the NYSE and the regulated market of Euronext Paris, in each case tradingtrade under the “FTI” symbol.symbol “FTI.”
For information about dividends, see Item 6 “Selected Financial Data” and Note 18 “Stockholders’ Equity” to the Consolidated Financial Statements in Item 8.
39


As of February 25, 2020,18, 2022, according to data provided by our transfer agent, there were 83105 shareholders of record. However, many of our shareholders hold their shares in "street name" by a nominee of Depository Trust Company, which is a single shareholder of record. We estimate that there were approximately 22,40020,900 shareholders whose shares were held in “street name” by banks, brokers, or other financial institutions at February 25, 2020.as of December 31, 2021.
We had no unregistered sales of equity securities during the year ended December 31, 2019.2021.
Issuer Purchases of Equity Securities


Period
Total Number
of Shares
Purchased
Average Price 
Paid per Share
Total Number of
Shares Purchased 
as Part of Publicly
Announced Plans 
or Programs
Maximum
Number of Shares 
That May Yet
Be Purchased
Under the Plans
or Programs (a)
October 1, 2019 – October 31, 2019
$

14,286,427
November 1, 2019 – November 30, 2019
$

14,286,427
December 1, 2019 – December 31, 2019
$

14,286,427
Total

14,286,427
(a)In December 2018, our Board of Directors authorized an extension of our share repurchase program for $300 million for the purchase of ordinary shares.


We did not have any purchases of equity securities during the year ended December 31, 2021.
Performance Graph
The graph below compares the cumulative total shareholder return on our ordinary shares for the period from January 17, 2017 to December 31, 20192021 with the Standard & Poor’s 500 Index (“S&P 500 Index”) and PHLX Oil Services Index. The comparison assumes $100 was invested, including reinvestment of dividends, if any, in our ordinary shares on January 17, 2017 and in both of the indexes on the same date. The results shown in the graph below are not necessarily indicative of future performance.
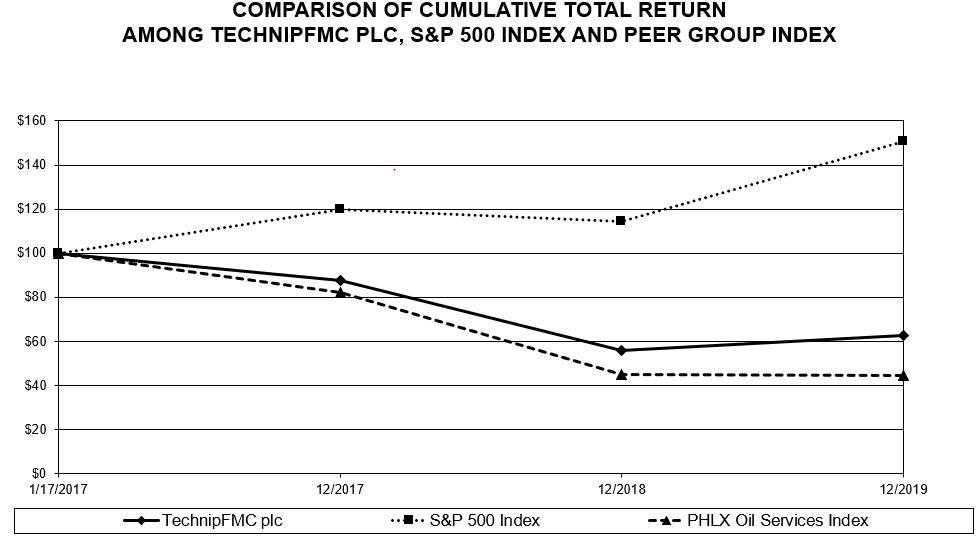
charta01.jpgfti-20211231_g1.jpg
As of December 31,
20172018201920202021
TechnipFMC plc$87.76 $55.89 $62.63 $28.03 $23.73 
S&P 500 Index119.82 114.56 150.62 178.32 229.46 
PHLX Oil Services Index82.00 44.93 44.68 25.88 31.25 
 December 31
 2017 2018 2019
TechnipFMC plc$87.76
 $55.89
 $62.63
S&P 500 Index119.82
 114.56
 150.62
PHLX Oil Services Index82.00
 44.93
 44.68

39


ITEM 6. SELECTED FINANCIAL DATA[RESERVED]
The following tables set forth selected financial data of the Company for each of the five years in the period ended December 31, 2019. This information should be read in conjunction with Part I, Item 1 “Business,” Part II, Item 7 “Management’s Discussion and Analysis of Financial Condition and Results of Operations” and the audited consolidated financial statements and notes thereto included in Part II, Item 8 of this Annual Report on Form 10-K.
 Year Ended December 31,
(In millions, except per share data)
2019(a)
 
2018 (a)
 
2017(b)
 2016 2015
Statement of income data         
Total revenue$13,409.1
 $12,552.9
 $15,056.9
 $9,199.6
 $11,471.9
Total costs and expenses$14,935.8
 $13,470.5
 $14,091.7
 $8,743.6
 $11,198.3
Net income (loss)$(2,412.1) $(1,910.8) $134.2
 $371.1
 $14.0
Net income (loss) attributable to TechnipFMC plc$(2,415.2) $(1,921.6) $113.3
 $393.3
 $14.4
          
Earnings (loss) per share from continuing operations attributable to TechnipFMC plc         
Basic earnings (loss) per share$(5.39) $(4.20) $0.24
 $3.29
 $0.13
Diluted earnings (loss) per share$(5.39) $(4.20) $0.24
 $3.16
 $0.13
 December 31,
(In millions)
2019(a)
 
2018(a)
 
2017(b)
 2016 2015
Balance sheet data         
Total assets$23,518.8
 $24,784.5
 $28,263.7
 $18,679.3
 $14,953.6
Long-term debt, less current portion$3,980.0
 $4,124.3
 $3,777.9
 $1,869.3
 $2,005.0
Total TechnipFMC plc stockholders’ equity$7,659.3
 $10,357.6
 $13,345.9
 $5,013.8
 $4,947.2
 Year Ended December 31,
(In millions)2019 2018 
2017 (b)
 2016 2015
Other financial information         
Capital expenditures$454.4
 $368.1
 $255.7
 $312.9
 $325.5
Cash flows provided (required) by operating activities$848.5
 $(185.4) $210.7
 $493.8
 $700.3
Net cash (c)
$714.8
 $1,348.3
 $2,882.4
 $3,716.4
 $370.4
Order backlog (d)
$24,251.1
 $14,560.0
 $12,982.8
 $15,002.0
 $18,475.5
(a)The results of our operations for the year ended December 31, 2019 includes goodwill and long-lived asset impairment charges of $1,988.7 million and $495.4 million. The results of our operations for the year ended December 31, 2018 includes goodwill and vessels impairment charges of $1,383.0 million and $372.9 million, respectively, and a legal provision of $280.0 million. Refer to Note 20 and Note 21 to our consolidated financial statements included in Part II, Item 8 of this Annual Report on Form 10-K for additional information on the impairments and legal provision, respectively.
(b)The results of our operations for the year ended December 31, 2017 consist of the combined results of operations of Technip and FMC Technologies. Due to the Merger, FMC Technologies’ results of operations have been included in our financial statements for periods subsequent to the consummation of the merger on January 16, 2017 and as result data presented for the year December 31, 2017 is not comparable to actual results presented in prior periods. Since Technip was identified as the accounting acquiree for the Merger, our actual results for the years ended December 31, 2016 and 2015 represent Technip only.
Refer to Note 2 to our consolidated financial statements included in Part II, Item 8 of this Annual Report on Form 10-K for further information related to the Merger.
(c)Net (debt) cash consists of cash and cash equivalents less short-term debt, long-term debt and the current portion of long-term debt. Net (debt) cash is a non-GAAP measure that management uses to evaluate our capital structure and financial leverage. See “Liquidity and Capital Resources” in Part II, Item 7 of this Annual Report on Form 10-K for additional discussion and reconciliations of net (debt) cash.
(d)Order backlog is calculated as the estimated sales value of unfilled, confirmed customer orders at the reporting date.


40


ITEM 7. MANAGEMENT’S DISCUSSION AND ANALYSIS OF FINANCIAL CONDITION AND RESULTS OF OPERATIONS
EXECUTIVE OVERVIEW
We are a global leader in energy projects, technologies, systems and services. We have manufacturing operations worldwide, strategically located to facilitate efficient delivery of these products, technologies, systems and services to our customers. We report our results of operations in the followingtwo segments: Subsea Onshore/Offshore and Surface Technologies. Management’s determination of the Company’sour reporting segments was made on the basis of our strategic priorities and corresponds to the manner in which our Chief Executive Officer reviews and evaluates operating performance to make decisions about resource allocations to each segment.
A summarized description of our products and services and annual financial data for each segment can be found in Part I, Item 1, “Business” and Note 7 to our consolidated financial statements in Part II, Item 8 of this Annual Report on Form 10-K.statements.
We focus on economic-economic and industry-specific drivers and key risk factors affecting our business segments as we formulate our strategic plans and make decisions related to allocating capital and human resources. The results of our segments are primarily driven by changes in capital spending by oil and gas companies, which largely depend upon current and anticipated future crude oil and natural gas demand, production volumes, and consequently, commodity prices. We use crude oil and natural gas prices as an indicator of demand. Additionally, we use both onshore and offshore rig count as an indicator of demand, which consequently influences the level of worldwide production activity and spending decisions. We also focus on key risk factors when determining our overall strategy and making decisions for capital allocation. These factors include risks associated with the global economic outlook, product obsolescence and the competitive environment. We address these risks in our business strategies, which incorporate continuing development of leading edge technologies and cultivating strong customer relationships.
Our Subsea segment is affected by changes in commodity prices and trends in deepwater oil and natural gas production. Our Onshore/Offshore segment is impacted by change in commodity prices, population growthproduction and demand for natural gas, although the onshore market is typically more resilient to these changes impacting the segment. Our Subsea and Onshore/Offshore segments both benefitbenefits from the current market fundamentals supporting the demand for new liquefied natural gas facilities. Onshore/Offshore also benefits from the construction of petrochemical and fertilizer plants.
Our Surface Technologies segment is primarily affected by changes in commodity prices and trends in land-based and shallow water oil and natural gas production. We have developed close working relationships with our customers. Our results reflect our ability to build long-term alliances with oil and natural gas companies and to provide solutions for their needs in a timely and cost-effective manner. We believe that by closely working with our customers, we enhance our competitive advantage, improve our operating results and strengthen our market positions.
As we evaluate our operating results, we consider business segment performance indicators like segment revenue, operating profit and capital employed, in addition to the level of inbound orders and order backlog. A significant proportion of our revenue is recognized under the percentage of completion method of accounting. Cash receipts from such arrangements typically occur at milestones achieved under stated contract terms. Consequently, the timing of revenue recognition is not always correlated with the timing of customer payments. We aim to structure our contracts to receive advance payments that we typically use to fund engineering efforts and inventory purchases. Working capital (excluding cash) and net (debt) cashdebt are therefore key performance indicators of cash flows.
In eachboth of our segments, we serve customers from around the world. During 2019,2021, approximately 7880 percent of our total sales were recognized outside of the United States. We evaluate international markets and pursue opportunities that fit our technological capabilities and strategies.

The Spin-off

On February 16, 2021, we completed the separation of the Technip Energies business segment. The transaction was structured as a Spin-off, which occurred by way of a Distribution to our shareholders of 50.1 percent of the outstanding shares in Technip Energies N.V. Each of our shareholders received one ordinary share of Technip Energies N.V. for every five ordinary shares of TechnipFMC held at 5:00 p.m., New York City time on the record date, February 17, 2021. Technip Energies N.V. is now an independent public company and its shares trade under the ticker symbol “TE” on the Euronext Paris stock exchange. During 2021, we have sold approximately 75 percent of the original ownership stake in Technip Energies N.V. as a public company for proceeds of $900.9 million. As of December 31, 2021, we retained 12.2 percent ownership of Technip Energies’ issued and outstanding share capital. In January 2022, we sold an additional 9.0 million Technip Energies shares for total net proceeds of €118.4 million,
41


or $135.1 million. As of February 25, 2022, we retain a direct stake of 12.9 million shares, representing 7.1% percent of Technip Energies’ issued and outstanding share capital and valued at $155.3 million.

Beginning in the first quarter of 2021, Technip Energies’ historical financial results for periods prior to the Distribution are reflected in our consolidated financial statements as discontinued operations.
BUSINESS OUTLOOK
Overall Outlook - The price of crude oil remains volatile but continued to trade throughout 2019 well above the cyclical trough experienced in early 2016. The continued sustainability of the price recovery and business – Economic activity levels is dependent on several variables, including geopolitical stability, OPEC’s actions to regulate its production capacity, changes in demand patterns, and international sanctions and tariffs. However, as long-term demand is


forecast to rise and base production continues to naturally decline,expand, driven by strong fiscal stimulus, COVID vaccinations and the re-opening of local economies. Oil prices have been supported by the industry’s more disciplined capital spend, particularly for OPEC+ countries which appear to be focused on realizing a price that supports both economic growth and continued energy investment. These conditions could also provide greater price stability over the intermediate term.

Long-term demand for energy is forecasted to increase. Our conversations with clients remain constructive, and we believesee continued improvement in the macroeconomic backdrop will provide our customers with greater confidence to increase theirbroader market outlook as investments in new sources of oil and natural gas production.production increase over the intermediate-term. We continueare confident that we have entered a multi-year upcycle for energy demand, with continued strength in inbound orders expected for our Company through at least 2025.

We believe that oil and gas will remain an important part of the energy mix for an extended period of time. We are also committed to the energy transition, where we believe that offshore will play a meaningful role in the transition to renewable energy resources and reduction of carbon emissions.

We are making real progress through our three main pillars of greenhouse gas removal, offshore floating renewables and hydrogen. We have made announcements regarding several strategic agreements and partnerships, some of which have already resulted in real project opportunities. In 2021, we formed a strategic alliance with Talos Energy to develop and deliver technical and commercial solutions for Carbon Capture and Storage projects along the U.S. Gulf Coast. More recently, one of our partnerships in offshore renewables, Magnora Offshore Wind, was successful in the ScotWind Leasing Round Application, where the proposed development project will have a total capacity of approximately 500 megawatts which could power more than 600,000 homes in the United Kingdom. We also acquired the remaining shares of Magma Global, a leader in advanced composite technologies with applications for the transportation of green hydrogen and CO2. These strategic actions will expand our capabilities and provide us with new opportunities to address carbon emissions.

Subsea – Our Subsea inbound orders in 2021 increased more than 20 percent versus the prior year, reflecting the continued offshore market recovery and expansion. Innovative approaches to subsea projects, like our iEPCI solution, have improved project economics, and many offshore discoveries can be developed economically well below today’s crude oil prices. We believe deepwater developments willdevelopment is likely to remain a significant part of our customers’ portfolios in the long-term.
Subsea - The impact of the low crude oil price environment has led many of our customerscustomers’ portfolios.

As the subsea industry continues to reduce their capital spending plans and defer new offshore projects. In response to these actions,evolve, we have loweredtaken actions to further streamline our cost base through reductions in workforce as well as in manufacturing. This has helpedorganization, achieve standardization and reduce cycle times. The rationalization of our global footprint will also further leverage the benefits of our integrated offering. We aim to continuously align our operations with the lower activity levels, in order to mitigate some of the negative impact towhile preserving our operating profit. We have taken additional actions in 2019, but we have balanced further reductions with the need to preserve ourcore capacity in order to deliver current projects in backlog and ensurefulfill future orders.

We have experienced renewed operator confidence in advancing subsea activity as a result of the improved economic outlook, higher oil price and more robust project economics. The continued growth in part reflects the strong front-end activity experienced throughout 2021. With crude above $90 per barrel, the opportunity set of large subsea projects to be sanctioned over the next 24 months has expanded.

For the year ahead, our early engagement and client partnerships support our view that subsea tree awards for the total industry are likely to exceed 350 – a level not seen since 2013. For TechnipFMC, we anticipate subsea inbound order growth of up to 30 percent in 2022, with iEPCI projects, direct project awards – many of which may come from our alliance partners – and Subsea services to approach 75 percent of inbound orders.

Our growth expectations highlight the continued expansion in greenfield opportunities. We also expect increased tie-back activity, with growth from these smaller projects to come primarily from the North Sea, Gulf of Mexico and West Africa – all regions in which we have a strong presence and are prepared for increasedwell-positioned due to our extensive installed base.
42


Since 2015, offshore economics have materially improved, and subsea cycle-times have become significantly shorter. This has resulted in new subsea investments coming much earlier in the cycle and more in parallel with U.S. land markets. We believe these changes are fundamental and sustainable as a result of new business models and technology pioneered by our company.

Surface Technologies – Our performance is typically driven by variations in global drilling activity, creating a dynamic environment. Operating results can be further impacted by stimulation activity and the completions intensity of shale applications in North America.

In 2021, our completions-related revenue recovered, driven by the North America market activity increase and higher order inbound as industry activity moves higher.the successful adoption of iComplete – our fully integrated, digitally enabled pressure control system. iComplete has already achieved significant market penetration since its introduction in 2020, with more than 10 different customers utilizing the new integrated system. We also successfully introduced our E-Mission solution for onshore production facilities. The digital offering uses proprietary process automation to provide the industry’s only real-time monitoring and control system that both reduces methane flaring by up to 50 percent and maximizes oil production.

Continued rationalizationDrilling activity in international markets is less cyclical than North America as most activities are driven by national oil companies which tend to maintain a longer term view that exhibits less variability in capital spend. Additionally, we continue to benefit from our exposure to the North Sea, Asia Pacific and the Middle East, one of our global footprint will  further leveragelargest market opportunities in the benefits of our integrated offering, providing us with the ability to respondcurrent decade.

Well count steadily recovered during 2021, which led to increased order activity despite reductionsspending by national oil companies, particularly in both personnelthe Middle East. Our inbound orders outside North America more than doubled when compared to 2020 and manufacturing capacity. These actions are particularly important asincluded the subsea industry continues to have both underutilized manufacturing and vessel capacity, which may lead to continued pricing pressure throughout 2020. We also recognize the need to further develop and invest in our people to ensure we have the core competencies and capabilities necessary for continued success.
Our lowered cost base combined with the aggressive cost reductions taken by our customers has led to an improvement in project economics. Many current and future offshore projects are deemed to be economic at prices below those experienced in 2019. We continue to work closely with our customers through early engagement in iFEED™ and the use of iEPCI™ to allow more project final investment decisions through the cycle. iEPCI™ can support clients’ initiatives to improve subsea project economics by helping to reduce cost and accelerate time to first oil. Our integrated commercial model now accounts forsegment’s largest ever award, a significant portion of our business and going forward will serve as our standard approach to new business.
Onshore/Offshore - Onshore market activity continuesmulti-year contract from Abu Dhabi National Oil Company to provide a tangible setwellheads, trees and associated services.

International markets represented 65 percent of opportunities, particularly for natural gas monetization projects, as natural gastotal segment revenue in 2021. Our unique capabilities in these markets, which demand higher specification equipment, global services and renewables continue to take a larger share of global energy demand. Despite more recent softness in the spot price for LNG, the long-term outlook continues to remain strong, given the role of natural gas as a critical energy transition fuel. The market experienced a record level of new capacity final investment decisions in 2019, significantly benefitting our Company. We are confident that new LNG investments will continue in the near and intermediate term.
As an industry leader, we are well positioned for the growth in new liquefaction and regasification capacity as well as opportunities in biofuels, green chemistry, and other energy alternatives. We are actively engaged in several LNG FEED studies across multiple geographies. These FEED studieslocal content, provide a platform for early engagement with clients and can significantly de-risk project execution while also supporting our pursuit of the EPC contract. Additionally, we continue to selectively pursue refining, petrochemical, fertilizer and renewables project opportunities in the Middle East, Africa, Asia, and North American markets.
Offshore market activity is expected to benefit in the near-term as macro conditions continue to support the international growth cycle, resulting in increased activity in offshore and deepwater exploration and development. Recent discoveries of offshore fields with reserves in regions such as Brazil, Australia, and East Africa are expected to become drivers of increased investment. In the long-term, gas is expected to become a bigger portion of the global energy mix, requiring new investments in the upstream industry.
Surface Technologies - North American activity continued to decline in the fourth quarter of 2019 in both drilling and completions-related activities impacted negatively volume and prices. Operators have adjusted their spending downward. In that context, we took actions to reduce inventory levels, and our cost structure in terms of workforce and facility capacity. These actions will extend into 2020.
We believe that initiatives launched to propose new commercial offerings will drive market share gain and give us access to new markets which will help us to improve volume and margins.extend our leadership positions.
Activity outside North America is resilient and has continued to increase in fourth quarter. We expect that activity to continue to grow in 2020 for both onshore and shallow water offshore.

42
43


CONSOLIDATED RESULTS OF OPERATIONS
This section of this Form 10-K generally discusses 20192021 and 20182020 items and year-to-year comparisons between 20192021 and 2018.2020. Discussions of 20172019 items and year-to-year comparisons between 20182020 and 20172019 that are not included in this Form 10-K can be found in “Management’s Discussion and Analysis of Financial Condition and Results of Operations” in Part II, Item 7 of the Company’sour Annual Report on Form 10-K for the year ended December 31, 2018.
2020.
Year Ended December 31, Change Year Ended December 31,Change
(In millions, except percentages)2019 2018 2017 2019 vs. 2018 2018 vs. 2017(In millions, except percentages)2021202020192021 vs. 20202020 vs. 2019
Revenue$13,409.1
 $12,552.9
 $15,056.9
 $856.2
 6.8 % $(2,504.0) (16.6)%Revenue$6,403.5 $6,530.6 $6,950.2 $(127.1)(1.9)%$(419.6)(6.0)%
             
Costs and expenses      
 
    Costs and expenses
Cost of sales10,950.7
 10,273.0
 12,524.6
 677.7
 6.6 % (2,251.6) (18.0)%Cost of sales5,579.6 5,835.8 5,892.1 (256.2)(4.4)%(56.3)(1.0)%
Selling, general and administrative expense1,228.1
 1,140.6
 1,060.9
 87.5
 7.7 % 79.7
 7.5 %Selling, general and administrative expense644.9 724.1 795.7 (79.2)(10.9)%(71.6)(9.0)%
Research and development expense162.9
 189.2
 212.9
 (26.3) (13.9)% (23.7) (11.1)%Research and development expense78.4 75.3 149.5 3.1 4.1 %(74.2)(49.6)%
Impairment, restructuring and other expense2,490.8
 1,831.2
 191.5
 659.6
 36.0 % 1,639.7
 856.2 %Impairment, restructuring and other expense66.7 3,402.0 2,456.7 (3,335.3)(98.0)%945.3 38.5 %
Separation costs72.1
 
 
 72.1
 n/a
 
  %
Merger transaction and integration costs (a)
31.2
 36.5
 101.8
 (5.3) (14.5)% (65.3) (64.1)%
Merger transaction and integration costsMerger transaction and integration costs— — 14.2 — — %(14.2)(100.0)%
Total costs and expenses14,935.8
 13,470.5
 14,091.7
 1,465.3
 10.9 % (621.2) (4.4)%Total costs and expenses6,369.6 10,037.2 9,308.2 (3,667.6)(36.5)%729.0 7.8 %
             
Other income (expense), net(220.7) (323.9) (25.9) 103.2
 31.9 % (298.0) (1,150.6)%Other income (expense), net46.6 25.1 (181.6)21.5 85.7 %206.7 113.8 %
Income from equity affiliates62.9
 114.3
 55.6
 (51.4) (45.0)% 58.7
 105.6 %Income from equity affiliates0.6 64.6 59.8 (64.0)(99.1)%4.8 8.0 %
Income from investment in Technip EnergiesIncome from investment in Technip Energies322.2 — — 322.2 — %— — %
Loss on early extinguishment of debtLoss on early extinguishment of debt(61.9)— — (61.9)— %— — %
Net interest expense(451.3) (360.9) (315.2) (90.4) (25.0)% (45.7) (14.5)%Net interest expense(143.3)(81.8)(91.3)(61.5)(75.2)%9.5 10.4 %
Income (loss) before income taxes(2,135.8) (1,488.1) 679.7
 (647.7) (43.5)% (2,167.8) (318.9)%Income (loss) before income taxes198.1 (3,498.7)(2,571.1)3,696.8 105.7 %(927.6)(36.1)%
Provision for income taxes276.3
 422.7
 545.5
 (146.4) (34.6)% (122.8) (22.5)%Provision for income taxes111.1 19.4 79.0 91.7 472.7 %(59.6)(75.4)%
Net income (loss)(2,412.1) (1,910.8) 134.2
 (501.3) (26.2)% (2,045.0) (1,523.8)%
Net income attributable to noncontrolling interests(3.1) (10.8) (20.9) 7.7
 71.3 % 10.1
 48.3 %
Income (loss) from continuing operationsIncome (loss) from continuing operations87.0 (3,518.1)(2,650.1)3,605.1 102.5 %(868.0)(32.8)%
(Income) loss from continuing operations attributable to non-controlling interests(Income) loss from continuing operations attributable to non-controlling interests0.8 (34.5)4.6 35.3 102.3 %(39.1)(850.0)%
Income (loss) from continuing operations attributable to TechnipFMC plcIncome (loss) from continuing operations attributable to TechnipFMC plc87.8 (3,552.6)(2,645.5)3,640.4 102.5 %(907.1)(34.3)%
Income (loss) from discontinued operationsIncome (loss) from discontinued operations(72.6)280.2 238.0 (352.8)(125.9)%42.2 17.7 %
Income from discontinued operations attributable to non-controlling interestsIncome from discontinued operations attributable to non-controlling interests(1.9)(15.2)(7.7)13.3 87.5 %(7.5)(97.4)%
Net income (loss) attributable to TechnipFMC plc$(2,415.2) $(1,921.6) $113.3
 $(493.6) (25.7)% $(2,034.9) (1,796.0)%Net income (loss) attributable to TechnipFMC plc$13.3 $(3,287.6)$(2,415.2)$3,300.9 100.4 %$(872.4)(36.1)%
a) Merger transaction costs are incurred
Results of Operations in the first half of 2019.

20192021 Compared With 2018to 2020
Revenue
Revenue increased $856.2decreased by $127.1 million in 20192021 compared to the prior-year period, primarily as a result of improved project activity.2020. Subsea revenue increaseddecreased year-over-year, with higher project-related activity, including increased revenue from integrated project execution (iEPCI) and increased demandprimarily driven by a lower starting backlog due to deteriorated market conditions in subsea services. Onshore/Offshore revenue was stable as a decrease in revenues from projects progressing towards completion, primarily Yamal LNG, was largely offset by increased project activity in the Middle East and Asia Pacific regions.2020 which negatively impacted order intake for future delivery. Surface Technologies revenue increased, primarily as a result of improving order backlog from international markets, primarilythe increase in theoperator activity in Middle East, Latin America and Asia Pacific regions.North America.
Gross profitProfit
Gross profit (revenue less cost of sales) as a percentage of sales increased marginally to 18.3%12.9% in 2019 and 18.2%2021 compared to 10.6% in the prior-year period. Strong project execution and completion of Yamal LNG milestones improved gross profits in Onshore/Offshore offset by lower2020. Subsea gross profit increased due to a more competitively priced Subsea backlogsignificant prior year cost reduction activities and weaker demandincreased services activities. Surface Technologies gross profit improved year-over-year, primarily due to higher operator activity in Middle East, Latin America and North America, for Surface Technologies productsfavorable product mix and services due to a challenged shale market.lower operating costs.

44


Selling, generalGeneral and administrative expenseAdministrative Expense
Selling, general and administrative expense increased $87.5decreased by $79.2 million year-over-year, primarily as a result of increaseddecreased corporate expenseexpenses. During the first half of 2020, in response to a deteriorated market environment driven largelyin part by accelerated IT spending as well as additional performance incentive compensation awards.the COVID-19 pandemic, we implemented a series of cost reduction initiatives that resulted in significant reduction in year-over-year selling, general and administrative expense.

Impairment, restructuringRestructuring and other expenseOther Expenses
We incurred $2.5 billion$66.7 million of restructuring, impairment and other expenses in 2019,2021, compared to $3,402.0 million in 2020. Impairment, restructuring and other charges incurred during 2021, included $24.2 million of impairment charges of our operating lease right-of-use assets and $24.9 million impairment of property, plant and equipment. Impairment, restructuring and other charges incurred during 2020, primarily driven by $2.0 billionincluded $3,083.4 million of goodwill impairment, and $495.4$190.4 million of long-lived asset impairment.assets impairment, $57.8 million of COVID-19 related expenses, and $70.4 million for restructuring and severance expenses. See Note 20 for further details.
Separation costs
We have incurred $72.1 million associated with the preparation of the separation during 2019. Refer to Note 3 for further information regarding the planned transaction.
Merger transaction and integration costs
We incurred merger transaction and integration costs of $31.2 million during the first half of 2019, before the announcement of the planned separation transaction due to the continuation of the integration activities pertaining to combining the two legacy companies.
Refer to Note 2 to our consolidated financial statements included in Part II, Item 8 of this Annual Report on Form 10-K for additional information related to the Merger.further details.

Other income (expense)Income (Expense), netNet
Other income (expense), net, primarily reflects foreign currency gains and losses, non-recurring expensesincluding gains and resultslosses associated with the remeasurement of disposalsnet cash positions, gains and losses on sales of assets. In 2019,property, plant and equipment and other non-operating gains and losses. The foreign currency impact was a net gain in 2021 and a net loss in 2020, which was offset by gains on sales of property, plant and equipment and other one-off, non-operating type transactions.
Income from Equity Affiliates

For the years ended December 31, 2021 and 2020, we recorded an income of $0.6 million and $64.6 million, respectively, from equity method affiliates. Income generated by our equity method investments during 2021 was offset by a $36.7 million impairment of our Magma Global equity method investment recorded in the third quarter of 2021. See Note 13 to our consolidated financial statements for further details.

Income from Investment in Technip Energies

For the year ended December 31, 2021, we recorded $322.2 million as income as a result of our investment in Technip Energies. The amount recognized $146.9represents a fair value revaluation gain of our investment, partially offset by purchase price discounts on the sales of shares. See Note 13 to our consolidated financial statements for further details.

Loss on Early Extinguishment of Debt

We recognized $(61.9) million of net foreign exchange losses, comparedloss on early extinguishment of debt during the year ended December 31, 2021. The loss on early extinguishment of debt related to premium paid and write-off of bond issuance costs in connection with $116.5 million of net foreign exchange loss in the prior year period, mainly due to the devaluationrepurchase of the Angolan kwanza,2021 Notes and premium paid in connection with the repayment of our 3.45% Senior Notes due 2022. See Note 17 to our consolidated financial statements for which there is no active forwards market, while in 2018 a $280 million legal provision was made.further details.

Net interest expenseInterest Expense
Net interest expense increased $90.4by $61.5 million in 20192021 compared to 2018,2020, primarily due to the change in the fair value of the redeemable financial liability. We revalued the mandatorily redeemable financial liability to reflect current expectations about the obligation and recognized a charge of $423.1 million. See Note 25 for further information regarding the fair value measurement assumptions of the mandatorily redeemable financial liability and related changes in its fair value. Nethigher interest expense in 2019, excludingassociated with the fair value measurement of$1.0 billion senior notes issued during the mandatorily redeemable financial liability, decreased by $10.4 million on a net basis compared to 2018.three months ended March 31, 2021.

Provision for income taxesIncome Taxes
Our provision for income tax provisionstaxes for 20192021 and 20182020 reflected effective tax rates of (12.9)%56.1% and (28.4)(0.6)%, respectively. The year-over-year changeincrease in the effective tax rate was primarily due to the increased impact of losses in jurisdictions with a decrease in the amount of tax expense associated with movements infull valuation allowances, the release of contingent tax accruals due to the favorable resolution of income tax audits, andallowance, a favorable change in actual countryuncertain tax positions, a change in geographical profit mix of earnings,year over year offset in part bywith the impact of nondeductible goodwill impairments.

Our effective tax rate can fluctuate depending on our country mix of earnings, which may change based on changes insince our foreign earnings are generally subject to higher tax rates than those of the jurisdictions in which we operate


United Kingdom.
44
45


OPERATING RESULTS OF BUSINESS SEGMENTSDiscontinued Operations
This section
Income (loss) from discontinued operations, net of this Form 10-K generally discusses 2019income taxes, was $(72.6) million and 2018 items and year-to-year comparisons between 2019 and 2018. Discussions of 2017 items and year-to-year comparisons between 2018 and 2017 that are not included in this Form 10-K can be found in “Management’s Discussion and Analysis of Financial Condition and Results of Operations” in Part II, Item 7 of the Company’s Annual Report on Form 10-K$280.2 million income for the year ended December 31, 2018.2021 and 2020, respectively. Income (loss) from discontinued operations included results for Technip Energies, which was spun-off on February 16, 2021. See Note 2 to our consolidated financial statements for further details.

OPERATING RESULTS OF BUSINESS SEGMENTS
Segment operating profit is defined as total segment revenue less segment operating expenses. Certain items have been excluded in computing segment operating profit and are included in corporate items. Refer toSee Note 7 to our consolidated financial statements included in Part II, Item 8 of this Annual Report on Form 10-K for further information.details.
We report our results of operations in U.S. dollars; however, our earnings are generated in various currencies worldwide. In order to provide worldwide consolidated results, the earnings of subsidiaries functioning in their local currencies are translated into U.S. dollars based upon the average exchange rate during the period. While the U.S. dollar results reported reflect the actual economics of the period reported upon, the variances from prior periods include the impact of translating earnings at different rates.

Subsea
 Year Ended December 31, Favorable/(Unfavorable)
(In millions, except %)2019 2018 
2017(a)
 2019 vs.
2018
 
2018 vs.
2017
Revenue$5,523.0
 $4,840.0
 $5,877.4
 $683.0
 14% $(1,037.4) (18)%
Operating profit (loss)$(1,447.7) $(1,529.5) $460.5
 $81.8
 5% $(1,990.0) (432)%
              
Operating profit (loss) as a percent of revenue(26.2)%
(31.6)% 7.8%   5.4 pts.   n/a
(a)Due to the Merger, there were 11.5 months included in the year ended 2017 for legacy FMC Technologies. Refer to Note 2 to our consolidated financial statements included in Part II, Item 8 of this Annual Report on Form 10-K for further information related to the Merger.
2019 Compared With 2018
 Year Ended December 31,Favorable/(Unfavorable)
(In millions, except %)2021202020192021 vs. 20202020 vs. 2019
Revenue$5,329.1 $5,471.4 $5,419.5 $(142.3)(2.6)%$51.9 1.0 %
Operating profit (loss)$141.4 $(2,815.5)$(1,442.7)$2,956.9 105.0 %$(1,372.8)(95.2)%
Operating profit (loss) as a percentage of revenue2.7 %(51.5)%(26.6)%54.2  pts.(24.9) pts.
Subsea revenue increased $683.0decreased by $142.3 million, year-over-year, primarily due to increased project revenue from iEPCI, particularly projects in Asia, the North Sea and the Mediterranean that progressed towards completion, partially offset by decreased activity in Australia. The increase of Subsea Services activity across the globe further added to the year-over-year growth in revenue.
Subsea operating loss improved primarily due to a more competitively pricedlower starting backlog being executed. Thisas market conditions linked to COVID-19 pandemic negatively impacted order intake in the prior year. Despite these challenges, we continued to demonstrate strong execution of our backlog.
Subsea operating loss included $1,798.6 million of assetprofit for the year ended December 31, 2021, improved versus the prior year, primarily due to the significant reduction in non-cash impairment charges primarily related to the impairment of goodwill and long-lived assets compared to $1,784.2 million in 2018. Refer to Note 20 to our consolidated financial statements included in Part II, Item 8 of this Annual Report on Form 10-K for additional information related to these asset impairments.as well as benefits from prior year cost reduction activities.

Refer to Non-GAAP MeasuresMeasures” for furthermore information regarding our segment operating results.

Surface Technologies

 Year Ended December 31,Favorable/(Unfavorable)
(In millions, except %)2021202020192021 vs. 20202020 vs. 2019
Revenue$1,074.4 $1,059.2 $1,530.7$15.2 1.4 %$(471.5)(30.8)%
Operating profit (loss)$42.0 $(429.3)$(662.7)$471.3 109.8 %$233.4 35.2 %
Operating profit (loss) as a percentage of revenue3.9 %(40.5)%(43.3)%44.4  pts.2.8  pts.

Onshore/Offshore
 Year Ended December 31, Favorable/(Unfavorable)
(In millions, except %)2019 2018 2017 2019 vs.
2018
 
2018 vs.
2017
Revenue$6,268.8
 $6,120.7
 $7,904.5
 $148.1
 2% $(1,783.8) (23)%
Operating profit$959.6
 $824.0
 $810.9
 $135.6
 16% $13.1
 2%
              
Operating profit as a percent of revenue15.3% 13.5% 10.3%   1.8 pts.   3.2 pts.
2019 Compared With 2018
Onshore/OffshoreSurface Technologies revenue increased $148.1by $15.2 million, year-over-year. The increase wasor 1.4% year-over-year, primarily driven by higher activity Europe,the increase in Middle East, AfricaLatin America and North American regionsAmerica. Revenue outside of North America represented 65% of total segment revenue in 2021.
Surface Technologies operating profit improved significantly versus the prior year, primarily due to the significant reduction in non-cash impairment charges as well as our Processfavorable product mix and Technology business. The increase was partially offset by lower activity on Yamal LNG as the project nears completion.benefits from prior year cost reduction initiatives.
Operating profit year-over-year was favorably impacted by reduced costs, strong project execution and bonus achievements on Yamal LNG due to completion of key milestones ahead of schedule. Additionally, 2019 included $17.0 million in restructuring and other expenses.

Onshore/Offshore operating profit as a percentage of revenue increased to 15.3% compared to 13.5% in 2018.

Refer to Non-GAAP MeasuresMeasures” for furthermore information regarding our segment operating results.

Surface Technologies
46


 Year Ended December 31,Favorable/(Unfavorable)
(In millions, except %)2019 2018 
2017(a)
 2019 vs.
2018
 
2018 vs.
2017
Revenue$1,617.3
 $1,592.2
 $1,274.6
 $25.1
 2% $317.6
 25%
Operating profit (loss)$(656.1) $172.8
 $82.7
 $(828.9) (480)% $90.1
 109%
              
Operating profit (loss) as a percent of revenue(40.6)% 10.9% 6.5%   (51.5) pts.   4.4 pts.
(a)Due to the Merger, there were 11.5 months included in the year ended 2017 for legacy FMC Technologies. Refer to Note 2 to our consolidated financial statements included in Part II, Item 8 of this Annual Report on Form 10-K.
2019 Compared With 2018Corporate Items
Surface Technologies revenue increased $25.1
 Year Ended December 31,Favorable/(Unfavorable)
(In millions, except %)2021202020192021 vs. 20202020 vs. 2019
Corporate expense$(118.1)$(131.9)$(238.9)$13.8 10.5 %$107.0 44.8 %
Corporate expenses decreased by $13.8 million or 10.5%year-over-year, primarily driven by increased activity in the Middle East & Asia Pacific markets primarily driven by increased demand for drilling & completion and pressure control equipment and services, offset by negative drilling and completions market activity in North America as customers curbed capital spending.
Surface Technologies operating profit as a percent of revenue decreased significantly year-over-year. The decrease was primarily due to a $704.2 million charge for impairment and restructuring and other charges, in particular related to goodwill. This compared to a $13.8 million charge in the prior year. Refer to Note 20 todecreased costs associated with our consolidated financial statements included in Part II, Item 8 of this Annual Report on Form 10-K for additional information related to these impairments. Operating profit was also negatively impacted by reduced demand for flowline, hydraulic fracturing services, wellhead systems and pressure control equipment in North America, partially offset by increased demand for products and services in the Middle East and Asia Pacific.corporate support functions.
Surface Technologies operating profit as a percentage of revenue decreased to (40.6)% compared to 10.9% in 2018.
Refer to Non-GAAP MeasuresMeasures” for furthermore information regarding our segment operating results.


Corporate Items
 Year Ended December 31,Favorable/(Unfavorable)
(In millions, except %)2019 2018 2017 2019 vs.
2018
 
2018 vs.
2017
Corporate expense$(540.3) $(594.5) $(359.2) $54.2
 9% $(235.3) (66)%
2019 Compared With 2018
Corporate expenses excluding foreign exchange losses and charges and credits increased by $66.1million as shown in the below non-GAAP table.


 Year Ended
 December 31,
 2019 2018
Corporate expense, reported$540.3
 $594.5
Less charges and (credits)184.5
 335.2
Corporate expense, adjusted355.8
 259.3
Less foreign exchange losses146.9
 116.5
Corporate expense, adjusted and before foreign exchange losses$208.9
 $142.8


47


NON-GAAP MEASURES
In addition to financial results determined in accordance with U.S. generally accepted accounting principles (GAAP)(“GAAP”), we provide non-GAAP financial measures (as defined in Item 10 of Regulation S-K of the Securities Exchange Act of 1934, as amended) below.below:
Net income,Income (loss) from continuing operations attributable to TechnipFMC plc, excluding charges and credits, as well as measures derived from it (including diluted earningsit;
Income (loss) per share, excluding charges and credits; Income before net interest expense and taxes, excluding charges and credits ("(“Adjusted Operating profit"operating profit”); and Adjusted operating profit margin;
Adjusted diluted earnings (loss) per share from continuing operations attributable to TechnipFMC plc;
Depreciation and amortization, excluding charges and credits; credits (“Adjusted depreciation and amortization”);
Earnings before net interest expense, income taxes, depreciation and amortization, excluding charges and credits ("(“Adjusted EBITDA"EBITDA”); and net cash) are non-GAAP financial measures.Adjusted EBITDA margin;
Corporate expenses excluding charges and credits;
Net (debt) cash; and
Free cash flow (deficit) from continuing operations.
Management believes that the exclusion of charges and credits from these financial measures enables investors and management to more effectively evaluate TechnipFMC'sour operations and consolidated results of operations period-over-period, and to identify operating trends that could otherwise be masked or misleading to both investors and management by the excluded items. These measures are also used by management as performance measures in determining certain incentive compensation. The foregoing non-GAAP financial measures should be considered in addition to, not as a substitute for or superior to, other measures of financial performance prepared in accordance with GAAP.
47


The following is a reconciliation of the most comparable financial measures under GAAP to the non-GAAP financial measures.
Year Ended
December 31, 2021
Income (loss) from continuing operations attributable to TechnipFMC plcLoss attributable to non-controlling interests from continuing operationsProvision for income taxesNet interest expense and loss on early extinguishment of debtIncome before net interest expense and income taxes (Operating profit)Depreciation and amortizationEarnings before net interest expense, income taxes, depreciation and amortization (EBITDA)
TechnipFMC plc, as reported$87.8 $(0.8)$111.1 $205.2 $403.3 $385.4 $788.7 
Charges and (credits):
Impairment and other charges*85.8 — — — 85.8 — 85.8 
Restructuring and other charges**27.3 — 0.8 — 28.1 — 28.1 
Income from investment in Technip Energies(322.2)— — — (322.2)— (322.2)
Adjusted financial measures$(121.3)$(0.8)$111.9 $205.2 $195.0 $385.4 $580.4 
Diluted earnings per share from continuing operations attributable to TechnipFMC plc, as reported$0.19 
Adjusted diluted loss per share from continuing operations attributable to TechnipFMC plc$(0.27)

*Includes $36.7 million impairment relating to our equity method investment.

** Includes inventory write off of approximately $10.5 million.


Year Ended
December 31, 2020
Loss from continuing operations attributable to TechnipFMC plcIncome attributable to non-controlling interests from continuing operationsProvision for income taxesNet interest expenseLoss before net interest expense and income taxes (Operating profit)Depreciation and amortizationEarnings before net interest expense, income taxes, depreciation and amortization (EBITDA)
TechnipFMC plc, as reported$(3,552.6)$34.5 $19.4 $81.8 $(3,416.9)$412.1 $(3,004.8)
Charges and (credits):
Impairment and other charges3,260.4 — 13.4 — 3,273.8 — 3,273.8 
Restructuring and other charges65.4 — 5.0 — 70.4 — 70.4 
Direct Covid-19 expenses51.6 — 6.2 — 57.8 — 57.8 
Purchase price accounting adjustment6.6 — 1.9 — 8.5 (8.5)— 
Adjusted financial measures$(168.6)$34.5 $45.9 $81.8 $(6.4)$403.6 $397.2 
Diluted loss per share from continuing operations attributable to TechnipFMC plc, as reported$(7.92)
Adjusted diluted loss per share from continuing operations attributable to TechnipFMC plc$(0.38)


48
 Year Ended
 December 31, 2019
 Net income (loss) attributable to TechnipFMC plc Net income (loss) attributable to noncontrolling interests Provision for income taxes Net interest expense Income (loss) before net interest expense and income taxes (Operating profit) Depreciation and amortization Earnings before net interest expense, income taxes, depreciation and amortization (EBITDA)
TechnipFMC plc, as reported$(2,415.2) $3.1
 $276.3
 $451.3
 $(1,684.5) $509.6
 $(1,174.9)


Charges and (credits):


Impairment and other charges2,364.2
 
 119.9
 
 2,484.1
 
 2,484.1
Restructuring and other charges27.7
 
 9.3
 
 37.0
 
 37.0
Business combination transaction and integration costs23.1
 
 8.1
 
 31.2
 
 31.2
Separation costs54.2
 
 17.9
 
 72.1
 
 72.1
Reorganization17.2
 
 8.1
 
 25.3
 
 25.3
Legal provision, net46.3
 
 8.3
 
 54.6
 
 54.6
Purchase price accounting adjustment26.0
 
 8.0
 
 34.0
 (34.0) 
Valuation allowance187.0
 
 (187.0) 


Adjusted financial measures$330.5
 $3.1
 $268.9
 $451.3
 $1,053.8
 $475.6
 $1,529.4
              
Diluted earnings (loss) per share attributable to TechnipFMC plc, as reported$(5.39)            
Adjusted diluted earnings per share attributable to TechnipFMC plc$0.74


 Year Ended
 December 31, 2018
 Net income (loss) attributable to TechnipFMC plc Net income (loss) attributable to noncontrolling interests Provision for income taxes Net interest expense Income (loss) before net interest expense and income taxes (Operating profit) Depreciation and amortization Earnings before net interest expense, income taxes, depreciation and amortization (EBITDA)
TechnipFMC plc, as reported$(1,921.6) $(10.8) $422.7
 $(360.9) $(1,127.2) $550.4
 $(576.8)


Charges and (credits):


Impairment and other charges1,698.2
 
 94.4
 
 1,792.6
 
 1,792.6
Restructuring and other severance charges23.9
 
 14.7
 
 38.6
 
 38.6
Business combination transaction and integration costs22.6
 
 13.9
 
 36.5
 
 36.5
Legal provision280.0


 280.0
 
 280.0
Gain on divestitures(19.5) 
 (12.1) 
 (31.6) 
 (31.6)
Purchase price accounting adjustment67.9
 
 20.9
 
 88.8
 (91.3) (2.5)
Tax reform11.8
 
 (11.8) 


Valuation allowance213.8
 
 (213.8) 


Adjusted financial measures$377.1
 $10.8
 $328.9
 $360.9
 $1,077.7
 $459.1
 $1,536.8
              
Diluted earnings per share attributable to TechnipFMC plc, as reported$(4.20)            
Adjusted diluted earnings per share attributable to TechnipFMC plc$0.82


 Year Ended
 December 31, 2019
 Subsea Onshore/
Offshore
 Surface Technologies Corporate and Other Total
Revenue$5,523.0
 $6,268.8
 $1,617.3
 $
 $13,409.1
          
Operating profit (loss), as reported (pre-tax)$(1,447.7) $959.6
 $(656.1) $(540.3) $(1,684.5)
          
Charges and (credits):         
Impairment and other charges*1,798.6
 
 685.5
 
 2,484.1
Restructuring and other charges*(46.4) 17.0
 39.8
 26.6
 37.0
Business combination transaction and integration costs
 
 
 31.2
 31.2
Separation costs
 
 
 72.1
 72.1
Reorganization
 25.3
 
 
 25.3
Legal provision, net
 
 
 54.6
 54.6
Purchase price accounting adjustments34.0


 34.0
Subtotal1,786.2

42.3

725.3

184.5

2,738.3
          
Adjusted Operating profit (loss)338.5
 1,001.9
 69.2
 (355.8) 1,053.8
          
Adjusted Depreciation and amortization311.6
 38.7
 107.9
 17.4
 475.6
          
Adjusted EBITDA$650.1
 $1,040.6
 $177.1
 $(338.4) $1,529.4
          
Operating profit margin(26.2)% 15.3% (40.6)%   (12.6)%
          
Adjusted Operating profit margin6.1 % 16.0% 4.3 %   7.9 %
          
Adjusted EBITDA margin11.8 % 16.6% 11.0 %   11.4 %
*On December 30, 2019, the Company completed the acquisition of the remaining 50 percent of Technip Odebrecht PLSV CV, which resulted in a net loss of $0.9 million that was recorded in the Subsea segment. The net loss is comprised of an impairment charge of $84.2 million included within impairment and other charges and a bargain purchase gain of $83.3 million included within restructuring and other charges.


 Year Ended
 December 31, 2018
 Subsea Onshore/
Offshore
 Surface Technologies Corporate and Other Total
Revenue$4,840.0
 $6,120.7
 $1,592.2
 $
 $12,552.9
          
Operating profit (loss), as reported (pre-tax)$(1,529.5) $824.0
 $172.8
 $(594.5) $(1,127.2)
          
Charges and (credits):         
Impairment and other charges1,784.2
 
 4.5
 3.9
 1,792.6
Restructuring and other severance charges17.7
 (3.4) 9.3
 15.0
 38.6
Business combination transaction and integration costs
 
 
 36.5
 36.5
Legal provision
 
 
 280.0
 280.0
Gain on divestitures(3.3) (28.3) 
 
 (31.6)
Purchase price accounting adjustments - non-amortization related(9.4) 
 7.1
 (0.2) (2.5)
Purchase price accounting adjustments - amortization related91.3


 91.3
Subtotal1,880.5
 (31.7) 20.9
 335.2
 2,204.9
          
Adjusted Operating profit (loss)351.0

792.3

193.7

(259.3)
1,077.7
          
Adjusted Depreciation and amortization349.2
 38.1
 66.6
 5.2
 459.1
          
Adjusted EBITDA$700.2

$830.4

$260.3

$(254.1)
$1,536.8
          
Operating profit margin-31.6 % 13.5% 10.9%   -9.0 %
          
Adjusted Operating profit margin7.3 % 12.9% 12.2%   8.6 %
          
Adjusted EBITDA margin14.5 % 13.6% 16.3%   12.2 %


51


Year Ended
December 31, 2021
SubseaSurface TechnologiesCorporate ExpenseForeign Exchange, netTotal
Revenue$5,329.1 $1,074.4 $— $— $6,403.5 
Operating profit (loss), as reported (pre-tax)$141.4 $42.0 $(118.1)$338.0 $403.3 
Charges and (credits):
Impairment and other charges*80.9 1.9 3.0 — 85.8 
Restructuring and other charges**19.8 5.7 2.6 — 28.1 
Income from investment in Technip Energies— — — (322.2)(322.2)
Subtotal100.7 7.6 5.6 (322.2)(208.3)
Adjusted Operating profit (loss)242.1 49.6 (112.5)15.8 195.0 
Depreciation and amortization317.2 64.8 3.4 — 385.4 
Adjusted EBITDA$559.3 $114.4 $(109.1)$15.8 $580.4 
Operating profit margin, as reported2.7 %3.9 %6.3 %
Adjusted operating profit margin4.5 %4.6 %3.0 %
Adjusted EBITDA margin10.5 %10.6 %9.1 %
*Includes $36.7 million impairment relating to our equity method investment.
** Includes inventory write off of approximately $10.5 million.

49


Year Ended
December 31, 2020
SubseaSurface TechnologiesCorporate ExpenseForeign Exchange, netTotal
Revenue$5,471.4 $1,059.2 $— $— $6,530.6 
Operating loss, as reported (pre-tax)$(2,815.5)$(429.3)$(131.9)$(40.2)$(3,416.9)
Charges and (credits):
Impairment and other charges2,854.5 419.3 — — 3,273.8 
Restructuring and other charges52.9 13.2 4.3 — 70.4 
Direct COVID - 19 expenses50.1 7.7 — — 57.8 
Purchase price accounting adjustments8.5 — — — 8.5 
Subtotal2,966.0 440.2 4.3 — 3,410.5 
Adjusted operating profit (loss)150.5 10.9 (127.6)(40.2)(6.4)
Adjusted depreciation and amortization316.4 70.1 17.1 — 403.6 
Adjusted EBITDA$466.9 $81.0 $(110.5)$(40.2)$397.2 
Operating profit margin, as reported(51.5)%(40.5)%(52.3)%
Adjusted operating profit margin2.8 %1.0 %(0.1)%
Adjusted EBITDA margin8.5 %7.6 %6.1 %


INBOUND ORDERS AND ORDER BACKLOG
Inbound orders - Inbound orders represent the estimated sales value of confirmed customer orders received during the reporting period.
Inbound Orders
Year Ended December 31,
Inbound Orders
Year Ended December 31,
(In millions)2019 2018(In millions)20212020
Subsea$7,992.6
 $5,178.5
Subsea$4,960.9 $4,003.0 
Onshore/Offshore13,080.5
 7,425.9
Surface Technologies1,619.9
 1,686.6
Surface Technologies1,793.3 1,061.2 
Total inbound orders$22,693.0
 $14,291.0
Total inbound orders$6,754.2 $5,064.2 
Order backlog - Order backlog is calculated as the estimated sales value of unfilled, confirmed customer orders at the reporting date. See “Transaction Price AllocatedBacklog reflects the current expectations for the timing of project execution. The scheduling of some future work included in our order backlog has been impacted by COVID-19 related disruptions and remains subject to the Remaining Unsatisfied Performance Obligations” infuture adjustment. See Note 6 to our consolidated financial statements included in Part II, Item 8 of this Annual Report on Form 10-K for more information on order backlog.further details.
 Order Backlog
December 31,
(In millions)20212020
Subsea$6,533.0 $6,876.0 
Surface Technologies1,124.7 413.5 
Total order backlog$7,657.7 $7,289.5 
50

 
Order Backlog
December 31,
(In millions)2019 2018
Subsea$8,479.8
 $5,999.6
Onshore/Offshore15,298.1
 8,090.5
Surface Technologies473.2
 469.9
Total order backlog$24,251.1
 $14,560.0

Subsea - Order backlog for Subsea atas of December 31, 2019, increased2021, decreased by $2.5$0.3 billion from December 31, 2018.2020. Subsea backlog of $8.5$6.5 billion atas of December 31, 2019,2021, was composed of various subsea projects, including Total Golfinho;Mozambique LNG; Eni CoralCoral; Petrobras Buzios, Mero I, Mero II and Merakes; Petrobras Mero I; Energean Karish;Marlim; ExxonMobil Liza Phase 2; Neptune Duva & Giøa P1 and Seagull;Payara; Petronas Limbayong; Reliance MJ1; Lundin Edvard Grieg; BP Thunderhorse South Extension 2;MJ-1; Equinor Johan Sverdrup Phase 2 ; Woodside Pyxis, andBreidablikk; Husky West White Rose.Rose; Santos Barossa Phase I and Tullow Jubilee South East.
Onshore/Offshore - Onshore/Offshore order backlog at December 31, 2019, increased by $7.2 billion compared to December 31, 2018. Onshore/Offshore backlog of $15.3 billion was composed of various projects,including Arctic LNG 2, Yamal LNG; Midor refinery expansion; BP Tortue FPSO; Long Son Petrochemicals; ExxonMobil Beaumont refinery expansion; HURL fertilizer plants;Petronas Kasawari; Energean Karish; Neste bio-diesel expansion; and Motor Oil Hellas New Naphta Complex.
Surface Technologies - Order backlog for Surface Technologies atas of December 31, 2019,2021, increased by $3.3$711.2 million compared to December 31, 2018.2020, driven by a ten-year contract awarded in 2021 from ADNOC. Given the short-cycle nature of the business, most orders are quickly converted into sales revenue; longer contracts are typically converted within twelve months.
Non-consolidated backlog - As of December 31, 2021, we had $578.7 million of non-consolidated order backlog in our Subsea segment. Non-consolidated order backlog reflects the proportional share of backlogbacklog related to joint ventures that is not consolidated due to our minority ownership position.
 Non-consolidated backlog
(In millions)December 31,
2019
Subsea$799.2
Onshore/Offshore2,976.0
Total order backlog$3,775.2

52


LIQUIDITY AND CAPITAL RESOURCES
Most of our cash is managed centrally and flowedflows through centralized bank accounts controlled and maintained by TechnipFMC in the USglobally and in othermany operating jurisdictions to best meet the liquidity needs of our global operations.
We expect to meet the continuing funding requirements of our global operations with cash generated by such operations, our commercial paper programs, and our existing revolving credit facility.
Net (Debt) CashDebt - Net (debt) cash,debt, is a non-GAAP financial measure reflecting cash and cash equivalents, net of debt. Management uses this non-GAAP financial measure to evaluate our capital structure and financial leverage. We believe net debt or net cash, is a meaningful financial measure that may assist investors in understanding our financial condition and recognizing underlying trends in our capital structure. Net (debt) cashdebt should not be considered an alternative to, or more meaningful than, cash and cash equivalents as determined in accordance with GAAP or as an indicator of our operating performance or liquidity.
The following table provides a reconciliation of our cash and cash equivalents to net (debt) cash,debt, utilizing details of classifications from our consolidated balance sheets.
(In millions)December 31, 2019 December 31, 2018(In millions)December 31, 2021December 31, 2020
Cash and cash equivalents$5,190.2
 $5,540.0
Cash and cash equivalents$1,327.4 $1,269.2 
Short-term debt and current portion of long-term debt(495.4) (67.4)Short-term debt and current portion of long-term debt(277.6)(624.7)
Long-term debt, less current portion(3,980.0) (4,124.3)Long-term debt, less current portion(1,727.3)(2,835.5)
Net cash$714.8
 $1,348.3
Net debtNet debt$(677.5)$(2,191.0)
Cash Flows
Cash flows for each of the years in the three-year period ended December 31, 2021, 2020 and 2019 were as follows:
 Year Ended December 31,
(In millions)2019 2018 2017
Cash provided (required) by operating activities$848.5
 $(185.4) $210.7
Cash provided (required) by investing activities(419.8) (460.2) 1,250.0
Cash required by financing activities(784.4) (444.8) (1,054.8)
Effect of exchange rate changes on cash and cash equivalents5.9
 (107.0) 62.2
Increase (decrease) in cash and cash equivalents$(349.8) $(1,197.4) $468.1
      
Working capital$(82.2) $(759.0) $(725.2)
 Year Ended December 31,
(In millions)202120202019
Cash provided by operating activities from continuing operations$715.0 $772.4 $357.7 
Cash provided (required) by investing activities from continuing operations821.8 (120.8)(378.5)
Cash required by financing activities from continuing operations(1,447.3)(651.9)(165.6)
Net cash attributable to discontinued operations(3,555.9)(605.6)(169.3)
Effect of exchange rate changes on cash and cash equivalents(14.0)223.5 5.9 
Decrease in cash and cash equivalents$(3,480.4)$(382.4)$(349.8)
Working capital from continuing operations$497.5 $717.7 $91.0 
Free cash flow (deficit) from continuing operations$523.3 $516.3 $(55.0)
Operating cash flows from continuing operations - During 2019,2021 and 2020, we generated $848.5$715.0 million and $772.4 million, respectively, in operating cash flows from continuing operations. The decrease of $57.4 million in cash flowsgenerated by operating activities from operating activitiescontinuing operations in 2021 as compared to $185.4 million consumed in 2018, resulting in a $1,033.9 million increase compared to 2018. 65.9% of the annual operating cash flow2020 was generated in the fourth quarter, primarily due to timing differences on project milestones and vendor payments.
51


Investing cash flows from continuing operations- Investing activities from continuing operations provided $821.8 million in 2021 and used $419.8 million and $460.2$120.8 million of cash in 2019 and 2018, respectively.2020. The decreaseincrease of $942.6 million in cash usedprovided by investing activities was primarily due to the proceeds received from repaymentthe sale of advance to joint ventureour investment in Technip Energies, the sales of $62.0 million, decrease in cash used for acquisitions, partially offset by increasedassets and decreased capital expenditures and payment to acquire debt securities in 2019. In 2019, we purchased a deepwater dive support vessel, Deep Discoverer, that was subsequently funded through a sale-leaseback transaction.during 2021.
Financing cash flows from continuing operations- Financing activities from continuing operations used $784.4$1,447.3 million and $444.8$651.9 million in 20192021 and 2018,2020, respectively. The increase of $339.6$795.4 million in cash requiredused for financing activities was due primarily due to the increased settlement of mandatorily redeemable financial liability and decreased borrowings of commercial paper, partially offset by decreased purchases of treasury stock in 2019.debt pay down activity during 2021.

Working capital represents total changes in operating current assets and liabilities.

Free cash flow (deficit) from continuing operations is defined as operating cash flows from continuing operations less capital expenditures. The following table reconciles cash provided by operating activities from continuing operations, which is the most directly comparable financial measure determined in accordance with GAAP, to free cash flow (non-GAAP measure).
Year Ended December 31,
(In millions)202120202019
Cash provided by operating activities from continuing operations$715.0 $772.4 $357.7 
Capital expenditures(191.7)(256.1)(412.7)
Free cash flow (deficit) from continuing operations$523.3 $516.3 $(55.0)

Debt and Liquidity
Total borrowings at December 31, 2019
Debt Financing Transactions

During 2021, we executed a series of refinancing transactions in connection with the Spin-off, in order to provide a capital structure with sufficient cash resources to support future operating and 2018, comprised the following: investment plans.

(In millions)December 31,
2019
 December 31,
2018
Commercial paper1,967.0
 1,916.1
Synthetic bonds due 2021492.9
 490.9
3.45% Senior Notes due 2022500.0
 500.0
5.00% Notes due 2020224.6
 229.0
3.40% Notes due 2022168.5
 171.8
3.15% Notes due 2023146.0
 148.9
3.15% Notes due 2023140.4
 143.1
4.00% Notes due 202784.2
 85.9
4.00% Notes due 2032112.3
 114.5
3.75% Notes due 2033112.3
 114.5
Bank borrowings513.3
 265.2
Other23.0
 23.2
Unamortized debt issuance costs and discounts(9.1) (11.4)
Total borrowings$4,475.4
 $4,191.7
Debt Issuance
The following isOn February 16, 2021, we entered into a summary of ourcredit agreement, which provides for a $1.0 billion three-year senior secured multi-currency revolving credit facility at December 31, 2019:(“Revolving Credit Facility”), including a $450.0 million letter of credit subfacility; and

(In millions)
Description
Amount 
Debt
Outstanding
 
Commercial
Paper
Outstanding 
(a)
 
Letters
of Credit
 
Unused
Capacity
 Maturity
Five-year revolving credit facility$2,500.0
 $
 $1,967.0
 $
 $533.0
 January 2023
On January 29, 2021, we issued $1.0 billion of 6.50% senior notes due 2026 (the “2021 Notes”).
(a)Under our commercial paper program, we have

Repayment of Debt

The proceeds from the debt issuance described above along with the ability to access up to $1.5 billion and €1.0 billion of financing through our commercial paper dealers. Our available capacity under our revolving credit facility is reduced by any outstanding commercial paper.
Committed credit available under ourcash on hand were used to fund:
the repayment of all $542.4 million of the outstanding Synthetic Convertible Bonds that matured in January 2021;

the repayment of all $500.0 million aggregate principal amount of outstanding 3.45% Senior Notes due 2022;

the termination of the $2.5 billion senior unsecured revolving credit facility provideswe entered into on January 17, 2017; the ability to issue ourtermination of the €500.0 million Euro Facility entered into on May 19, 2020; and the termination of the CCFF Program entered into on May 19, 2020. In connection with the termination of these credit facilities, we repaid $830.9 million of the outstanding commercial paper obligations on a long-term basis. We had $1,967.0 millionborrowings.

Availability of commercial paper issuedborrowings under our facilities at December 31, 2019. As we had both the ability and intent to refinance these obligations on a long-term basis, our commercial paper borrowings were classified as long-term debt in the accompanying consolidated balance sheets at December 31, 2019.
Our revolving credit facility contains customary covenants as definedRevolving Credit Facility is reduced by the outstanding letters of credit facility agreement which includes a financial covenant requiring that our total capitalization ratio not exceed 60% atissued against the end of any financial quarter. The facility agreement also contains covenants restricting our ability and our subsidiaries ability to incur additional liens and indebtedness, enter into asset sales, make certain investments.facility. As of December 31, 2019,2021, there were $16.7 million letters of credit outstanding and availability of borrowings under the Revolving Credit Facility was $983.3 million.

During 2021, we completed two tender offers and purchased for cash $366.9 million of the outstanding 2021 Notes.We paid a cash premium of $29.5 million to the note holders who tendered and wrote-off $8.9 million of bond issuance costs. In connection with the repayment of all $500.0 million aggregate principal amount of outstanding 3.45% Senior Notes due 2022, we recorded a loss on extinguishment of debt of $23.5 million. As of December 31,
52


2021, we were in compliance with all restrictive covenants under our revolving credit facility.
Refer to Note 16 and debt covenants. See Note 17 to our consolidatedconsolidated financial statements included in Part II, Item 8 of this Annual Report on Form 10-K for further information related todetails.

Credit Ratings - Our credit ratings with Standard and Poor’s (“S&P”) are BB+ for our long-term unsecured, guaranteed debt (2021 Notes) and BB for our long-term unsecured debt (the Private Placement notes). Our credit facility andratings with Moody’s are Ba1 for our mandatorily redeemable liability, respectively.long-term unsecured, guaranteed debt.


Credit Risk Analysis
For the purposes of mitigating the effect of the changes in exchange rates, we hold derivative financial instruments.
Valuations of derivative assets and liabilities reflect the fair value of the instruments, including the values associated with counterparty risk. These values must also take into account our credit standing, thus including in the valuation of the derivative instrument and the value of the net credit differential between the counterparties to the derivative contract. Adjustments to our derivative assets and liabilities related to credit risk were not material for any period presented.
We use theThe income approach was used as the valuation technique to measure the fair value of foreign currency derivative instruments on a recurring basis. This approach calculates the present value of the future cash flow by measuring the change from the derivative contract rate and the published market indicative currency rate, multiplied by the contract notional values. Credit risk is then incorporated by reducing the derivative’s fair value in asset positions by the result of multiplying the present value of the portfolio by the counterparty’s published credit spread. Portfolios in a liability position are adjusted by the same calculation; however, a spread representing our credit spread is used.
Our credit spread, and the credit spread of other counterparties not publicly available, are approximated by using the spread of similar companies in the same industry, of similar size, and with the same credit rating. See Notes 24 and 25 to our consolidated financial statements for further details.
At this time, we have no credit-risk-related contingent features in our agreements with the financial institutions that would require us to post collateral for derivative positions in a liability position.
Additional information about credit risk is incorporated herein by reference to Note 24Contractual and Note 25 toOther Obligations
For a description of our consolidated financial statements included incontractual obligations such as debt and leases, see Part II, Item 8 Notes to Consolidated Financial Statements Note 5 (Leases) and Note 17 (Debt).
Purchase obligations - In the normal course of this Annual Report on Form 10-K.business, we enter into agreements with our suppliers to purchase raw materials or services. These agreements include a requirements that our suppliers provide products or services to our specifications and requires us to make a firm purchase commitment to suppliers. As substantially all of these commitments are associated with purchases made to fulfill our customer’s orders, the costs associated with these agreements will ultimately be reflected in cost of sales in our consolidated statement of income. The future purchase obligations as of December 31, 2021 are as follows:
Liquidity
 Payments Due by Period
(In millions)Total
payments
Less than
1 year
1-3
years
3-5
years
After 5
years
Purchase obligations$636.4 $564.9 $71.2 $0.3 $— 
Financial Position Outlook
Historically, we have generatedWe are committed to a strong balance sheet and ample liquidity that will enable us to access capital markets throughout the cycle. We believe our liquidity continues to exceed the level required to achieve this goal. Our capital expenditures can be adjusted and capital resources primarily through operationsmanaged to match market demand and when needed, throughactivity levels.Based on current market conditions and our credit facility. We have $533.0 million of capacity available underfuture expectations, our revolving credit facility that we expect to utilize if working capital needs temporarily increase. The volatility in credit, equity and commodity markets creates some uncertainty for our business. Any payment deferrals or discounts on pricing granted to clients in prior years may adversely affect our results of operations and cash flows in 2020 and beyond.
We project spending approximately $450 million in 2020 for capital expenditures. However, projected capital expenditures for 20202022 are estimated to be approximately $230.0 million. Projected capital expenditures do not include any contingent capital that may be needed to respond to a contract award.awards.
During 2020,
In addition, we expectintend to make contributionsconduct an orderly sale of approximately $6.9 millionour remaining stake in Technip Energies over time and will use the proceeds from future sales to further reduce our international pension plans, representing primarily the Netherlands and the U.K. pension plans. Actual contribution amounts are dependent upon plan investment returns, changes in pension obligations, regulatory environments and other economic factors. We update our pension estimates annually during the fourth quarter or more frequently upon the occurrence of significant events.net leverage. We do not expectintend to make any contributions toremain a long-term shareholder of Technip Energies and anticipate that we will exit our U.S. Qualified Pension Planownership stake in an orderly manner within a year. The carrying amount of the investment as of December 31, 2021 was $317.3 million. In January 2022, we sold
53


an additional 9.0 million Technip Energies shares and our U.S. Non-Qualified Defined Benefit Pension Planreceived €118.4 million, or $135.1 million in 2020.
CONTRACTUAL OBLIGATIONS
The following is a summarynet proceeds. As of February 25, 2022, the value of our contractual obligations at December 31, 2019:
 Payments Due by Period
(In millions)
Total
payments
 
Less than
1 year
 
1-3
years
 
3-5
years
 
After 5
years
Debt (a)
$4,475.4
 $495.4
 $3,392.4
 $285.6
 $302.0
Interest on debt (a)
232.6
 54.9
 68.6
 31.3
 77.8
Operating leases (b)
956.8
 291.2
 279.0
 155.1
 231.5
Purchase obligations (c)
6,025.9
 3,872.0
 1,995.7
 125.1
 33.1
Pension and other post-retirement benefits (d)
18.8
 18.8


Unrecognized tax benefits (e)
62.7
 2.1
 13.8
 46.8
 
Other contractual obligations (f)
268.8
 129.1
 107.8
 31.9
 
Total contractual obligations$12,041.0
 $4,863.5
 $5,857.3
 $675.8
 $644.4
(a)Our available debt is dependent upon our compliance with covenants, including negative covenants related to liens and our total capitalization ratio. Any violation of covenants or other events of default, which are not waived or cured, or changes in our credit rating could have a material impact on our ability to maintain our committed financing arrangements.


Due to our intent and ability to refinance commercial paper obligations on a long-term basis under our revolving credit facility and the variable interest rates associated with these debt instruments, only interest on our Senior Notes is includedinvestment in the table. During 2019, we paid $109.4 million for interest charges, net of interest capitalized.
(b)We lease office space, manufacturing facilities and various types of manufacturing and data processing equipment. Leases of real estate generally provide for payment of property taxes, insurance and repairs by us. Substantially all of our leases are classified as operating leases. In addition, in 2014 we entered into construction and operating lease agreements to finance the construction of manufacturing and office facilities located in the USA. In January 2016, construction of the facilities was completed and the operating lease commenced. Upon expiration of the lease term in September 2021, we have the option to renew the lease, purchase the facilities or re-market the facilities on behalf of the lessor, including certain guarantees of residual value under the re-marketing option.
(c)In the normal course of business, we enter into agreements with our suppliers to purchase raw materials or services. These agreements include a requirement that our supplier provide products or services to our specifications and require us to make a firm purchase commitment to our supplier. As substantially all of these commitments are associated with purchases made to fulfill our customers’ orders, the costs associated with these agreements will ultimately be reflected in cost of sales on our consolidated statements of income.
(d)We expect to contribute approximately $6.9 million to our international pension plans during 2020. Required contributions for future years depend on factors that cannot be determined at this time. Additionally, we expect to pay directly to beneficiaries approximately $13.3 million for international unfunded pension plan and $5.5 million for U.S. Non-Qualified unfunded pension plan during 2019.
(e)It is reasonably possible that $2.1 million of liabilities for unrecognized tax benefits will be settled during 2020, and this amount is reflected in income taxes payable in our consolidated balance sheet as of December 31, 2019. Although unrecognized tax benefits are not contractual obligations, they are presented in this table because they represent demands on our liquidity.
(f)Other contractual obligations represents our share of the mandatorily redeemable financial liability. In the fourth quarter of 2016, we obtained voting control interests in legal onshore/offshore contract entities which own and account for the design, engineering and construction of the Yamal LNG plant. Prior to the amendments of the contractual terms that provided us with voting interest control, we accounted for these entities under the equity method of accounting based on our previously held interests in each of these entities. A mandatorily redeemable financial liability of $174.8 million was recognized as of December 31, 2016 to account for the fair value of the non-controlling interests. During the year ended December 31, 2019 we revalued the liability to reflect current expectations about the obligation. Refer to Note 25 for further information regarding the fair value measurement assumptions of the mandatorily redeemable financial liability and related changes in its fair value.
OTHER OFF-BALANCE SHEET ARRANGEMENTSTechnip Energies was $155.3 million.
The following is a summary of other off-balance sheet arrangements at December 31, 2019:
 Amount of Commitment Expiration per Period
(In millions)
Total
amount
 
Less than
1 year
 
1-3
years
 
3-5
years
 
After 5
years
Letters of credit and bank guarantees (a)
$5,857.5
 $2,240.8
 $2,150.3
 $894.9
 $571.5
Surety bonds (a)
4.0
 3.9
 
 
 0.1
Total other off-balance sheet arrangements$5,861.5
 $2,244.7
 $2,150.3
 $894.9
 $571.6
(a)As collateral for our performance on certain sales contracts or as part of our agreements with insurance companies, we are liable under letters of credit, surety bonds and other bank guarantees. Our ability to generate revenue from certain contracts is dependent upon our ability to obtain these off-balance sheet financial instruments. These off-balance sheet financial instruments may be renewed, revised or released based on changes in the underlying commitment. Historically, our commercial commitments have not been drawn upon to a material extent; consequently, management believes it is not reasonably likely there will be material claims against these commitments. However, should these financial instruments become unavailable to us, our operations and liquidity could be negatively impacted.
CRITICAL ACCOUNTING ESTIMATES
The preparation of financial statements in conformity with GAAP requires management to make certain estimates, judgments and assumptions about future events that affect the reported amounts of assets and liabilities at the date of the financial statements, the reported amounts of revenue and expenses during the periods presented and the related disclosures in the accompanying notes to the financial statements. Management has reviewed these critical accounting estimates with the Audit Committee of our Board of Directors. We believe the following critical accounting estimates used in preparing our financial statements address all important accounting areas where the nature of the estimates or assumptions is material due to the levels of subjectivity and judgment necessary to account for highly uncertain matters or the susceptibility of such matters to change. See Note 1 to our consolidated financial statements included in Part II, Item 8 of this Annual Report on Form 10-K for a description of our significant accounting policies.


further details.
Revenue Recognition
The majority of our revenue is derived from long-term contracts that can span several years. We account for revenue in accordance with Accounting Standard Codification (“ASC”) Topic 606, Revenues from Contracts with Customers. The unit of account in ASC Topic 606 is a performance obligation. A contract’s transaction price is allocated to each distinct performance obligation and recognized as revenue when, or as, the performance obligation is satisfied. Our performance obligations are satisfied over time as work progresses or at a point in time.
A significant portion of our total revenue recognized over time relates to our Onshore/Offshore and Subsea segments,segment, primarily for the entire range of onshore facilities, fixed and floating offshore oil and gas facilities, and subsea exploration and production equipment projects that involve the design, engineering, manufacturing, construction, and assembly of complex customer-specific systems. Because of control transferring over time, revenue is recognized based on the extent of progress towards completion of the performance obligation. The selection of the method to measure progress towards completion requires judgment and is based on the nature of the products or services to be provided. We generally use the cost-to-cost measure of progress for our contracts because it best depicts the transfer of control to the customer that occurs as we incur costs on our contracts. Under the cost-to-cost measure of progress, the extent of progress towards completion is measured based on the ratio of costs incurred to date to the total estimated costs at completion of the performance obligation. Revenues, including estimated fees or profits, are recorded proportionally as costs are incurred.
Due to the nature of the work required to be performed on many of our performance obligations, the estimation of total revenue and cost at completion is complex, subject to many variables, and requires significant judgment. It is common for our long-term contracts to contain award fees, incentive fees, or other provisions that can either increase or decrease the transaction price. We include estimated amounts in the transaction price when we believe we have an enforceable right to the modification, the amount can be estimated reliably, and its realization is probable. The estimated amounts are included in the transaction price to the extent it is probable that a significant reversal of cumulative revenue recognized will not occur when the uncertainty associated with the variable consideration is resolved.
We execute contracts with our customers that clearly describe the equipment, systems, and/or services. After analyzing the drawings and specifications of the contract requirements, our project engineers estimate total contract costs based on their experience with similar projects and then adjust these estimates for specific risks associated with each project, such as technical risks associated with a new design. Costs associated with specific risks are estimated by assessing the probability that conditions arising from these specific risks will affect our total cost to complete the project. After work on a project begins, assumptions that form the basis for our calculation of total project cost are examined on a regular basis and our estimates are updated to reflect the most current information and management’s best judgment.
54


Adjustments to estimates of contract revenue, total contract cost, or extent of progress toward completion are often required as work progresses under the contract and as experience is gained, even though the scope of work required under the contract may not change. The nature of accounting for long-term contracts is such that refinements of the estimating process for changing conditions and new developments are continuous and characteristic of the process. Consequently, the amount of revenue recognized over time is sensitive to changes in our estimates of total contract costs. There are many factors, including, but not limited to, the ability to properly execute the engineering and design phases consistent with our customers’ expectations, the availability and costs of labor and material resources, productivity, and weather, all of which can affect the accuracy of our cost estimates, and ultimately, our future profitability.
Our operating lossincome for the year ended December 31, 20192021 was positivelynegatively impacted by approximately $1,114.3$68.4 million, as a result of changes in contract estimates related to projects that were in progress atas of December 31, 2018.2020. During the year ended December 31, 2019,2021, we recognized changes in our estimates that had an impact on our margin in the amounts of $797.2 million, $324.7$(72.5) million and $(7.6)$4.1 million in our Onshore/Offshore, Subsea and Surface Technologies segments, respectively. The changes in contract estimates are attributed to better than expected performance throughout our execution of our projects.


Our operating profit for the year ended December 31, 2018 was positively impacted by approximately $553.4 million, as a result of changes in contract estimates related to projects that were in progress at December 31, 2017. During the year ended December 31, 2018, we recognized changes in our estimates that had an impact on our margin in the amounts of $379.2 million, $169.9 million and $4.3 million in our Onshore/Offshore, Subsea and Surface technologies segments, respectively. The changes in contract estimates are attributed to betterworse than expected performance throughout our execution of our projects.
Accounting for Income Taxes
Our income tax expense, deferred tax assets and liabilities, and reserves for uncertain tax positions reflect management’s best assessment of estimated future taxes to be paid. We are subject to income taxes in the United Kingdom and numerous foreign jurisdictions. Significant judgments and estimates are required in determining our consolidated income tax expense.
In determining our current income tax provision, we assess temporary differences resulting from differing treatments of items for tax and accounting purposes. These differences result in deferred tax assets and liabilities, which are recorded in our consolidated balance sheets. When we maintain deferred tax assets, we must assess the likelihood that these assets will be recovered through adjustments to future taxable income. To the extent we believe recovery is not likely, we establish a valuation allowance. We record a valuation allowance to reduce the asset to a value we believe will be recoverable based on our expectation of future taxable income. We believe the accounting estimate related to the valuation allowance is a critical accounting estimate because it is highly susceptible to change from period to period, requires management to make assumptions about our future income over the lives of the deferred tax assets, and finally, the impact of increasing or decreasing the valuation allowance is potentially material to our results of operations.
Forecasting future income requires us to use a significant amount of judgment. In estimating future income, we use our internal operating budgets and long-range planning projections. We develop our budgets and long-range projections based on recent results, trends, economic and industry forecasts influencing our segments’ performance, our backlog, planned timing of new product launches and customer sales commitments. Significant changes in our judgment related to the expected realizability of a deferred tax asset results in an adjustment to the associated valuation allowance.
As of December 31, 2019,2021, we have provided a valuation allowance against the related deferred tax assets where we believe it is not more likely than not that we will generate future taxable income sufficient to realize such assets.
The calculation of our income tax expense involves dealing with uncertainties in the application of complex tax laws and regulations in numerous jurisdictions in which we operate. We recognize tax benefits related to uncertain tax positions when, in our judgment, it is more likely than not that such positions will be sustained on examination, including resolutions of any related appeals or litigation, based on the technical merits. We adjust our liabilities for uncertain tax positions when our judgment changes as a result of new information previously unavailable. Due to the complexity of some of these uncertainties, their ultimate resolution may result in payments that are materially different from our current estimates. Any such differences will be reflected as adjustments to income tax expense in the periods in which they are determined.
Accounting for Pension and Other Post-retirement Benefit Plans
The determination of the projected benefit obligations of our pension and other post-retirement benefit plans are important to the recorded amounts of such obligations onin our consolidated balance sheetsheets and to the amount of pension expense in our consolidated statements of income. In order to measure the obligations and expense associated with our pension benefits, management must make a variety of estimates, including discount rates used to value certain liabilities, expected return on plan assets set aside to fund these costs, rate of compensation
55


increase, employee turnover rates, retirement rates, mortality rates and other factors. We update these estimates on an annual basis or more frequently upon the occurrence of significant events. These accounting estimates bear the risk of change due to the uncertainty and difficulty in estimating these measures. Different estimates used by management could result in our recognition of different amounts of expense over different periods of time.
Due to the specialized and statistical nature of these calculations which attempt to anticipate future events, we engage third-party specialists to assist management in evaluating our assumptions as well as appropriately measuring the costs and obligations associated with these pension benefits. The discount rate and expected long-term rate of return on plan assets are primarily based on investment yields available and the historical performance


of our plan assets, respectively. The timing and amount of cash outflows related to the bonds included in the indices matches estimated defined benefits payments. These measures are critical accounting estimates because they are subject to management’s judgment and can materially affect net income.
The actuarial assumptions and estimates made by management in determining our pension benefit obligations may materially differ from actual results as a result of changing market and economic conditions and changes in plan participant assumptions. While we believe the assumptions and estimates used are appropriate, differences in actual experience or changes in plan participant assumptions may materially affect our financial position or results of operations.
The following tabletable illustrates the sensitivity of changes in the discount rate and expected long-term return on plan assets on pension expense and the projected benefit obligation:
(In millions, except basis points)Increase (Decrease) in 2019 Pension Expense Before Income Taxes Increase (Decrease) in Projected Benefit Obligation at December 31, 2019(In millions, except basis points)Increase (Decrease) in 2021 Pension Expense Before Income TaxesIncrease (Decrease) in Projected Benefit Obligation as of December 31, 2021
25 basis point decrease in discount rate$3.0
 $58.9
25 basis point decrease in discount rate$0.9 $(2.2)
25 basis point increase in discount rate$(1.4) $(55.8)25 basis point increase in discount rate$(0.9)$2.1 
25 basis point decrease in expected long-term rate of return on plan assets$(2.9) N/A
25 basis point decrease in expected long-term rate of return on plan assets$2.8 N/A
25 basis point increase in expected long-term rate of return on plan assets$2.9
 N/A
25 basis point increase in expected long-term rate of return on plan assets$(2.8)N/A

Determination of Fair Value in Business Combinations
Accounting for the acquisition of a business requires the allocation of the purchase price to the various assets acquired and liabilities assumed at their respective fair values. The determination of fair value requires the use of significant estimates and assumptions, and in making these determinations, management uses all available information. If necessary, we have up to one year after the acquisition closing date to finalize these fair value determinations. For tangible and identifiable intangible assets acquired in a business combination, the determination of fair value utilizes several valuation methodologies including discounted cash flows which has assumptions with respect to the timing and amount of future revenue and expenses associated with an asset. The assumptions made in performing these valuations include, but are not limited to, discount rates, future revenues and operating costs, projections of capital costs, and other assumptions believed to be consistent with those used by principal market participants. Due to the specialized nature of these calculations, we engage third-party specialists to assist management in evaluating our assumptions as well as appropriately measuring the fair value of assets acquired and liabilities assumed. Business combinations are described inSee Note 23 to our consolidated financial statements included in Part II, Item 8 of this Annual Report on Form 10-K.for further details.
56


Impairment of Long-Lived and Intangible Assets
Long-lived assets, including vessels, property, plant and equipment, identifiable intangible assets being amortized and capitalized software costs are reviewed for impairment whenever events or changes in circumstances indicate the carrying amount of the long-lived asset may not be recoverable. The carrying amount of a long-lived asset is not recoverable if it exceeds the sum of the undiscounted cash flows expected to result from the use and eventual disposition of the asset. If it is determined that an impairment loss has occurred, the loss is measured as the amount by which the carrying amount of the long-lived asset exceeds its fair value. The determination of future cash flows as well as the estimated fair value of long-lived assets involves significant estimates on the part of management. Because there usually is a lack of quoted market prices for long-lived assets, fair value of impaired assets is typically determined based on the present values of expected future cash flows using discount rates believed to be consistent with those used by principal market participants, or based on a multiple of operating cash flowflows validated with historical market transactions of similar assets where possible. The expected future cash flows used for impairment reviews and related fair value calculations are based on judgmental assessments of future productivity of the asset,revenue, forecasted utilization, operating costs and capital decisions and all available information at the date of review. If future market conditions deteriorate beyond our current expectations and assumptions, impairments of long-lived assets may be identified if we conclude that the carrying amounts are no longer recoverable.


Impairment of Goodwill
Goodwill represents the excess of cost over the fair market value of net assets acquired in business combinations. Goodwill is not subject to amortization but is tested for impairment at a reporting unit level on an annual basis, at a reporting level unit, or more frequently if impairment indicators arise. We have established October 31 as the date of our annual test for impairment of goodwill. We identify a potential impairment by comparing the fair value of the applicable reporting unit to its net book value, including goodwill. If the net book value exceeds the fair value of the reporting unit, we measure the impairment by comparing the carrying value of the reporting unit to its fair value. Reporting units with goodwill are tested for impairment using a quantitative impairment test.
When using the quantitative impairment test, determining the fair value of a reporting unit is judgmental in nature and involves the use of significant estimates and assumptions. We estimate the fair value of our reporting units using a discounted future cash flow model. The majority of the estimates and assumptions used in a discounted future cash flow model involve unobservable inputs reflecting management’s own assumptions about the assumptions market participants would use in estimating the fair value of a business. These estimates and assumptions include revenue growth rates and operating margins used to calculate projected future cash flows, discount rates and future economic and market conditions. Our estimates are based upon assumptions believed to be reasonable, but whichthey are inherently uncertain and unpredictable and do not reflect unanticipated events and circumstances that may occur.
A lower fair value estimate in the future for any of our reporting units could result in goodwill impairments. Factors that could trigger a lower fair value estimate include sustained price declines of the reporting unit’s products and services, cost increases, regulatory or political environment changes, changes in customer demand, and other changes in market conditions, which may affect certain market participant assumptions used in the discounted future cash flow model based on internal forecasts of revenues and expenses over a specified period plus a terminal value (the income approach). When assessing triggering factors, on a quarterly and also on an annual basis, we also analyze the relationship between our market capitalization and our consolidated book value of equity.
The income approach estimates fair value by discounting each reporting unit’s estimated future cash flows using a weighted-average cost of capital that reflects current market conditions and the risk profile of the reporting unit. To arrive at our future cash flows, we use estimates of economic and market assumptions, including growth rates in revenues, costs, estimates of future expected changes in operating margins, tax rates and cash expenditures. Future revenues are also adjusted to match changes in our business strategy. We believe this approach is an appropriate valuation method. Under the market multiple approach, we determine the estimated fair value of each of our reporting units by applying transaction multiples to each reporting unit’s projected EBITDA and then averaging that estimate with similar historical calculations using either a one, two or three year average. Our reporting unit valuations were determined primarily by utilizing the income approach, with a lesser weighting attributed the market multiple approach.
Late in the fourth quarterAs of 2019, oil prices fell dramatically and our market capitalization declined significantly, together with other companies in the oil service industry. This event is not expected to have significant negative impact on our performance and it is not changing materially our medium-term and long-term cash flow projections.
During the year ended December 31, 2019,2021, we recorded $1,321.9 milliondid not have any goodwill balance outstanding.
See Notes 16 and $666.8 million of goodwill impairment charges in our Subsea and Surface Technologies reporting units, respectively. During the year ended December 31, 2018, we recorded $1,383.0 million of goodwill impairment charges in our Subsea reporting unit. Refer to Note 20 to these consolidated financial statements for additional disclosure related to impairment of goodwill during the year ended December 31, 2019 and 2018.
The fair value over carrying amount for our Onshore/Offshore reporting unit was in excess of 400% of its carrying amount.
The following table presents the significant estimates used by management in determining the fair values of our reporting units at December 31, 2019:
2019
Year of cash flows before terminal value4
Discount rates12.5% to 15.0%
EBITDA multiples6.0 - 8.5x


Refer to Note 15 to our consolidated financial statements included in Part II, Item 8 of this Annual Report on Form 10-K for additional information related to goodwill impairment testing during 2019.further details.
OTHER MATTERS
On March 28, 2016, FMC Technologies received an inquiry from the U.S. Department of Justice ("DOJ"(“DOJ”) related to the DOJ's investigation of whether certain services Unaoil S.A.M. provided to its clients, including FMC Technologies, violated the FCPA. On March 29, 2016, Technip S.A. also received an inquiry from the DOJ related to
57


Unaoil. We cooperated with the DOJ's investigations and, with regard to FMC Technologies, a related investigation by the SEC.
In late 2016, Technip S.A. was contacted by the DOJ regarding its investigation of offshore platform projects awarded between 2003 and 2007, performed in Brazil by a joint venture company in which Technip S.A. was a minority participant, and we have also raised with DOJ certain other projects performed by Technip S.A. subsidiaries in Brazil between 2002 and 2013. The DOJ has also inquired about projects in Ghana and Equatorial Guinea that were awarded to Technip S.A. subsidiaries in 2008 and 2009, respectively. We cooperated with the DOJ in its investigation into potential violations of the FCPA in connection with these projects. We contacted and cooperated with the Brazilian authorities (Federal Prosecution Service (“MPF”), the Comptroller General of Brazil (“CGU”) and the Attorney General of Brazil (“AGU”)) with their investigation concerning the projects in Brazil and have also contacted and are cooperating with French authorities (the Parquet National Financier (“PNF”)) about these existing matters.
On June 25, 2019, we announced a global resolution to pay a total of $301.3 million to the DOJ, the SEC, the MPF, and the CGU/AGU to resolve these anti-corruption investigations. We will not be required to have a monitor and will, instead, provide reports on our anti-corruption program to the Brazilian and U.S. authorities for two and three years, respectively.
As part of this resolution, we entered into a three-year Deferred Prosecution Agreement (“DPA”) with the DOJ related to charges of conspiracy to violate the FCPA related to conduct in Brazil and with Unaoil. In addition, Technip USA, Inc., a U.S. subsidiary, pled guilty to one count of conspiracy to violate the FCPA related to conduct in Brazil. We will also provide the DOJ reports on our anti-corruption program during the term of the DPA.
In Brazil, our subsidiaries Technip Brasil - Engenharia, Instalações E Apoio Marítimo Ltda. and Flexibrás Tubos Flexíveis Ltda. entered into leniency agreements with both the MPF and the CGU/AGU. We have committed, as part of those agreements, to make certain enhancements to their compliance programs in Brazil during a two-year self-reporting period, which aligns with our commitment to cooperation and transparency with the compliance community in Brazil and globally.
In September 2019, the SEC approved our previously disclosed agreement in principle with the SEC Staff and issued an Administrative Order, pursuant to which we paid the SEC $5.1 million, which was included in the global resolution of $301.3 million.
To date, the investigation by PNF related to historical projects in Equatorial Guinea and Ghana has not reached resolution. We remain committed to finding a resolution with the PNF and will maintain a $70.0 million provision related to this investigation. Additionally, the PNF recently informed us that it is reviewing historical projects in Angola.We are not aware of any evidence that would support a finding of liability with respect to these projects, whether the PNF would seek any additional penalty. As we continue to progress our discussions with PNF towards a potential resolution of all of these matters, the amount of a settlement could exceed this provision.

There is no certainty that a settlement with PNF will be reached or that the settlement will not exceed current accruals. The PNF has a broad range of potential sanctions under anticorruptionanti-corruption laws and regulations that it may seek to impose in appropriate circumstances including, but not limited to, fines, penalties, confiscations and modifications to business practices and compliance programs. Any of these measures, if applicable to us, as well as potential customer reaction to such measures, could have a material adverse impact on our business, results of operations, and financial condition. If we cannot reach a resolution with the PNF, we could be subject to criminal proceedings in France, the outcome of which cannot be predicted.
RECENTLY ISSUED ACCOUNTING STANDARDS
Refer toSee Note 4 to our consolidated financial statements included in Part II, Item 8 of this Annual Report on Form 10-K.for further details.

61


ITEM 7A. QUANTITATIVE AND QUALITATIVE DISCLOSURES ABOUT MARKET RISK
We are subject to financial market risks, including fluctuations in foreign currency exchange rates andand interest rates. In order to manage and mitigate our exposure to these risks, we may use derivative financial instruments in accordance with established policies and procedures. We do not use derivative financial instruments where the objective is to generate profits solely from trading activities. Atfor speculative purposes. As of December 31, 20192021 and December 31, 2018,2020, substantially all of our derivative holdings consisted of foreign currency forward contracts and foreign currency instruments embedded in purchase and sale contracts.
58


These forward-looking disclosures only address potential impacts from market risks as they affect our financial instruments and do not include other potential effects that could impact our business as a result of changes in foreign currency exchange rates, interest rates, commodity prices or equity prices.
Foreign Currency Exchange Rate Risk
We conduct operations around the world in a number of different currencies. Many of our significant foreign subsidiaries have designated the local currency as their functional currency. Our earnings are therefore subject to change due to fluctuations in foreign currency exchange rates when the earnings in foreign currencies are translated into U.S. dollars. We do not hedge this translation impact on earnings. A 10% increase or decrease in the average exchange rates of all foreign currencies atas of December 31, 2019,2021, would have changed our revenue and income before income taxes attributable to TechnipFMC by approximately $140.6$303.5 million and $5.5$16.8 million, respectively.
When transactions are denominated in currencies other than our subsidiaries’ respective functional currencies, we manage these exposures through the use of derivative instruments. We primarily use foreign currency forward contracts to hedge the foreign currency fluctuation associated with firmly committed and forecasted foreign currency denominated payments and receipts. The derivative instruments associated with these anticipated transactions are usually designated and qualify as cash flow hedges, and as such the gains and losses associated with these instruments are recorded in other comprehensive income until such time that the underlying transactions are recognized. Unless these cash flow contracts are deemed to be ineffective or are not designated as cash flow hedges at inception, changes in the derivative fair value will not have an immediate impact on our results of operations since the gains and losses associated with these instruments are recorded in other comprehensive income. When the anticipated transactions occur, these changes in value of derivative instrument positions will be offset against changes in the value of the underlying transaction. When an anticipated transaction in a currency other than the functional currency of an entity is recognized as an asset or liability on the balance sheet, we also hedge the foreign currency fluctuation of these assets and liabilities with derivative instruments after netting our exposures worldwide. These derivative instruments do not qualify as cash flow hedges.
Occasionally, we enter into contracts or other arrangements containing terms and conditions that qualify as embedded derivative instruments and are subject to fluctuations in foreign exchange rates. In those situations, we enter into derivative foreign exchange contracts that hedge the price or cost fluctuations due to movements in the foreign exchange rates. These derivative instruments are not designated as cash flow hedges.
For our foreign currency forward contracts hedging anticipated transactions that are accounted for as cash flow hedges, a 10% increase in the value of the U.S. dollar would have resulted in an additional loss of $83.8$55.4 million in the net fair value of cash flow hedges reflected in our consolidated balance sheet atas of December 31, 2019.2021.
Interest Rate Risk
At December 31, 2019, we had commercial paper of approximately $2.0 billion with a weighted average interest rate of 1.41%. Using sensitivity analysis to measure the impact of a 10% adverse movement in the interest rate, or eighteen basis points, would result in an increase to interest expense of $2.8 million.


We assess effectiveness of forward foreign currency contracts designated as cash flow hedges based on changes in fair value attributable to changes in spot rates. We exclude the impact attributable to changes in the difference between the spot rate and the forward rate for the assessment of hedge effectiveness and recognize the change in fair value of this component immediately in earnings. Considering that the difference between the spot rate and the forward rate is proportional to the differences in the interest rates of the countries of the currencies being traded, we do not have significant exposure in the unrealizedunrealized valuation of our forward foreign currency contracts to relative changes in interest rates between countries in our results of operations. To the extent any one interest rate increases by 10% across all tenors and other countries’ interest rates remain fixed, and assuming no change in discount rates, we would expect to recognize a decrease of $0.5$3.0 million in unrealized earnings in the period of change. Based on our portfolio as of December 31, 2019,2021, we have material positions with exposure to interest rates in the United States, Canada, Australia, Brazil, the United Kingdom, Singapore, the European Community, and Norway.

63
59


ITEM 8. FINANCIAL STATEMENTS AND SUPPLEMENTARY DATA
Report of Independent Registered Public Accounting Firm

To the Board of Directors and Stockholders of TechnipFMC plc

Opinions on the Financial Statements and Internal Control over Financial Reporting

We have audited the accompanying consolidatedbalance sheets of TechnipFMC plcand its subsidiaries (the(the “Company”) as of December 31, 20192021 and 2018, 2020,and the related consolidated statements of income, of comprehensive income, of changes in stockholders’ equity and of cash flows for each of the three years in the period ended December 31, 2019,2021, including the related notes and schedule of valuation and qualifying accounts for each of the three years in the period ended December 31, 20192021 appearing under Item 15(a)(2)15 (collectively referred to as the “consolidatedfinancial statements”).We also have audited the Company's internal control over financial reporting as of December 31, 2019,2021, based on criteria established in Internal Control - Integrated Framework (2013)issued by the Committee of Sponsoring Organizations of the Treadway Commission (COSO).

In our opinion, the consolidatedfinancial statements referred to above present fairly, in all material respects, the financial position of the Company as of December 31, 20192021 and 2018 2020,and the results of itsoperations and itscash flows for each of the three years in the period ended December 31, 20192021 in conformity with accounting principles generally accepted in the United States of America. Also in our opinion, the Company maintained, in all material respects, effective internal control over financial reporting as of December 31, 2019,2021, based on criteria established in Internal Control - Integrated Framework (2013)issued by the COSO.

Change in Accounting Principle

As discussed in Note 1 to the consolidated financial statements, the Company changed the manner in which it accounts for leases in 2019.

Basis for Opinions

The Company's management is responsible for these consolidated financial statements, for maintaining effective internal control over financial reporting, and for its assessment of the effectiveness of internal control over financial reporting, included in Management’s Annual Report on Internal Control over Financial Reporting appearing under Item 9A. Our responsibility is to express opinions on the Company’s consolidatedfinancial statements and on the Company's internal control over financial reporting based on our audits. We are a public accounting firm registered with the Public Company Accounting Oversight Board (United States) (PCAOB) and are required to be independent with respect to the Company in accordance with the U.S. federal securities laws and the applicable rules and regulations of the Securities and Exchange Commission and the PCAOB.

We conducted our audits in accordance with the standards of the PCAOB. Those standards require that we plan and perform the audits to obtain reasonable assurance about whether the consolidated financial statements are free of material misstatement, whether due to error or fraud, and whether effective internal control over financial reporting was maintained in all material respects.

Our audits of the consolidatedfinancial statements included performing procedures to assess the risks of material misstatement of the consolidatedfinancial statements, whether due to error or fraud, and performing procedures that respond to those risks. Such procedures included examining, on a test basis, evidence regarding the amounts and disclosures in the consolidatedfinancial statements. Our audits also included evaluating the accounting principles used and significant estimates made by management, as well as evaluating the overall presentation of the consolidatedfinancial statements. Our audit of internal control over financial reporting included obtaining an understanding of internal control over financial reporting, assessing the risk that a material weakness exists, and testing and evaluating the design and operating effectiveness of internal control based on the assessed risk. Our audits also included performing such other procedures as we considered necessary in the circumstances. We believe that our audits provide a reasonable basis for our opinions.

Definition and Limitations of Internal Control over Financial Reporting

A company’s internal control over financial reporting is a process designed to provide reasonable assurance regarding the reliability of financial reporting and the preparation of financial statements for external purposes in


accordance with generally accepted accounting principles. A company’s internal control over financial reporting includes those policies and procedures that (i) pertain to the maintenance of records that, in reasonable detail, accurately and fairly reflect the transactions and dispositions of the assets of the company; (ii) provide reasonable
60


assurance that transactions are recorded as necessary to permit preparation of financial statements in accordance with generally accepted accounting principles, and that receipts and expenditures of the company are being made only in accordance with authorizations of management and directors of the company; and (iii) provide reasonable assurance regarding prevention or timely detection of unauthorized acquisition, use, or disposition of the company’s assets that could have a material effect on the financial statements.

Because of its inherent limitations, internal control over financial reporting may not prevent or detect misstatements. Also, projections of any evaluation of effectiveness to future periods are subject to the risk that controls may become inadequate because of changes in conditions, or that the degree of compliance with the policies or procedures may deteriorate.

Critical Audit Matters

The critical audit mattersmatter communicated below are mattersis a matter arising from the current period audit of the consolidated financial statements that werewas communicated or required to be communicated to the audit committee and that (i) relaterelates to accounts or disclosures that are material to theconsolidated financial statements and (ii) involved our especially challenging, subjective, or complex judgments. The communication of critical audit matters does not alter in any way our opinion on the consolidated financial statements, taken as a whole, and we are not, by communicating the critical audit mattersmatter below, providing a separate opinionsopinion on the critical audit mattersmatter or on the accounts or disclosures to which they relate.it relates.

Revenue Recognition - Determination of Estimated Costs to Complete for Long-Term Contracts

As described in Note 6 to the consolidated financial statements, approximately 82%68% of the total revenue of $13$6.4 billion for the year ended December 31, 20192021 is generated from long-term contracts. As disclosed by management, forFor the Company’s long-term contracts, because of control transferring over time, revenue is recognized based on the extent of progress towards completion of the performance obligation. TheAs disclosed by management, the selection of the method to measure progress towards completion requires judgment and is based on the nature of the products or services to be provided. The Company generally uses the cost-to-cost measure of progress for its contracts because it best depicts the transfer of control to the customer whichthat occurs as the Company incurs costs on the contracts. Under the cost-to-cost measure of progress, the extent of progress towards completion is measured based on the ratio of costs incurred to date to the total estimated costs at completion of the performance obligation. Revenues, including estimated fees or profits, are recorded proportionally as costs are incurred. Due to the nature of the work required to be performed on many of the performance obligations, management’s estimation of total revenue and cost at completion is complex, subject to many variables and requires significant judgment. There are many factors, including, but not limited to, the ability to properly execute the engineering and design phases consistent with customers’ expectations, the availability and costs of labor and materials resources, productivity, and weather, all of which can affect the accuracy of cost estimates, and ultimately, future profitability.

The principal considerations for our determination that performing procedures relating to revenue recognition - determination of estimated costs to complete for long-term contracts is a critical audit matter are there wasthe significant judgment by management when developingdetermining the estimated costs to complete for long-term contracts. Thiscontracts, which in turn led to a high degree of auditor judgment, subjectivity and effort in performing procedures and evaluating audit evidencemanagement’s significant assumptions related to the estimates ofestimated costs to complete.

Addressing the matter involved performing procedures and evaluating audit evidence in connection with forming our overall opinion on the consolidated financial statements. These procedures included testing the effectiveness of controls relating to the revenue recognition process, including controls over the determination of estimated costs to complete for long-term contracts. These procedures also included, among others, evaluating and testing management’s process for determining estimates ofthe estimated costs to complete for a sampleselection of long-term contracts by (i) obtaining executed purchase orders and agreementsagreements; (ii) evaluating the appropriateness of the method to measure progress towards completion; (iii) testing the completeness and accuracy of the underlying data used by management; and (iv) evaluating the reasonableness of significant assumptions used by management.related to the estimated costs to complete. Evaluating the reasonableness of significant assumptions used involved assessing management’s ability to reasonably estimate costs to complete long-term contracts, as applicable, by (i) performing a comparisonprocedures to assess the reasonableness of the estimated and actual costs incurred related to completed similar contracts,complete; (ii) evaluatingtesting management’s process to evaluate the timely identification of circumstances which may warrant a modification to a previous cost estimate,estimate; (iii) testing management’s process to


evaluate contract contingencies relative to the contractual terms and actual progress of contracts,contracts; and (iv) performing a look-back analysisprocedures to assess variances between actual and estimated costs to complete.

Goodwill Impairment - Subsea and Surface Technologies Segments

As described in Notes 1, 15 and 20 to the consolidated financial statements, the Company’s consolidated goodwill balance was $5.6 billion as of December 31, 2019, and the goodwill associated with the Subsea and Surface Technologies segments was $2.8 billion and 0.4 billion, respectively. For the year ended December 31, 2019, the Company recorded an impairment charge in relation to goodwill associated with the Subsea and Surface Technologies segments in the amount of $1.3 billion and $0.7 billion, respectively. As disclosed by management, the Company conducts an impairment test as of October 31 of each year, or more frequently if events or circumstances indicate that the carrying value of goodwill may be impaired. Potential impairment is identified by comparing the fair value of a reporting unit to its net book value, including goodwill. Management estimates the fair value of the reporting units using the income approach, which estimates fair value by discounting the reporting units’ estimated future cash flows using a weighted-average cost of capital that reflects current market conditions and the risk profile of the respective reporting unit. To arrive at its future cash flows, management uses estimates of economic and market assumptions, including growth rates in revenues, costs, estimates of future expected changes in operating margins, tax rates and cash expenditures.

The principal considerations for our determination that performing procedures relating to the goodwill impairment test for the Subsea and Surface Technologies segments is a critical audit matter are there was significant judgment by management when developing the fair value measurement of the underlying reporting units. This in turn led to a high degree of auditor judgment, subjectivity and effort in performing procedures and evaluating audit evidence related to management’s discounted cash flow models and significant assumptions, including the weighted-average cost of capital, revenue growth rates, and projected operating margins. In addition, the audit effort involved the use of professionals with specialized skill and knowledge to assist in performing these procedures and evaluating audit evidence obtained.

Addressing the matter involved performing procedures and evaluating audit evidence in connection with forming our overall opinion on the consolidated financial statements. These procedures included testing the effectiveness of controls relating to management’s goodwill impairment test, including controls over the determination of the fair value of the Company’s reporting units. These procedures also included, among others, evaluating the appropriateness of the discounted cash flow models and the reasonableness of significant assumptions related to the weighted-average cost of capital, revenue growth rates, and projected operating margins used by management in determining the fair values of the reporting units in the Subsea and Surface Technologies segments. Evaluating management’s assumptions related to revenue growth rates and projected operating margins involved evaluating whether the assumptions used by management were reasonable considering (i) the current and past performance of the reporting units, (ii) contractually secured order intake and industry forecasts, and (iii) whether these assumptions were consistent with evidence obtained in other areas of the audit. Professionals with specialized skill and knowledge were used to assist in the evaluation of the Company’s discounted cash flow model and certain significant assumptions, including the weighted-average cost of capital.

Long-Lived Asset Impairments - Certain Flexible Pipe and Umbilical Manufacturing Facilities

As described in Notes 1, 20 and 25 to the consolidated financial statements, the Company’s consolidated net property, plant and equipment was $3.2 billion as of December 31, 2019. For the year ended December 31, 2019, the Company recorded an impairment charge in relation to certain flexible pipe and umbilical manufacturing facilities in the amount of $168.9 million. Management conducts impairment tests on long-lived assets whenever events or changes in circumstances indicate the carrying value may not be recoverable. The carrying valuelife of a long-lived asset is not recoverable if it exceeds the sum of the undiscounted cash flows expected to result from the use and eventual disposition over the asset’s remaining useful life. The prolonged downturn in the energy market and its corresponding impact on the Company’s business outlook led management to conclude the carrying amount of the flexible pipe and umbilical manufacturing facilities exceeded their fair value. For the fair value assessment performed as of December 31, 2019, management measured fair value by estimating the amount and timing of net future cash flows and discounting them using a risk-adjusted rate of interest.project margin.


The principal considerations for our determination that performing procedures relating to the long-lived asset impairments - certain flexible pipe and umbilical manufacturing facilities is a critical audit matter are there was significant judgment by management when estimating the future cash flows of the assets. This in turn led to a high

61


degree of auditor judgment, subjectivity and effort in performing procedures and evaluating audit evidence obtained related to management’s significant assumptions, including the amount and timing of net future cash flows.

Addressing the matter involved performing procedures and evaluating audit evidence in connection with forming our overall opinion on the consolidated financial statements. These procedures included testing the effectiveness of controls relating to management’s long-lived assets impairments, including controls over management’s development of assumptions used in the estimated future cash flows. These procedures also included, among others, evaluating the appropriateness of the method used; testing the completeness and accuracy of the underlying data used in estimating the cash flows; and evaluating the reasonableness of significant assumptions used by management in developing the amount and timing of net future cash flows. Evaluating management’s significant assumptions, including the amount and timing of net future cash flows, involved evaluating whether the significant assumptions used by management were reasonable considering the current and past performance of the business associated with the assets and considering whether they were consistent with evidence obtained in other areas of the audit.
/s/PricewaterhouseCoopers LLP
Houston, Texas
March 2, 2020February 28, 2022

We have served as the Company’s auditor since 2017.

62
67


TECHNIPFMC PLC AND CONSOLIDATED SUBSIDIARIES
CONSOLIDATED STATEMENTS OF INCOME
 Year Ended
(In millions, except per share data)202120202019
Revenue
Service revenue$3,440.7 $3,266.8 $3,412.0 
Product revenue2,804.4 3,121.8 3,271.7 
Lease revenue158.4 142.0 266.5 
Total revenue6,403.5 6,530.6 6,950.2 
Costs and expenses
Cost of service revenue3,084.7 2,946.9 2,769.5 
Cost of product revenue2,366.5 2,772.2 2,954.7 
Cost of lease revenue128.4 116.7 167.9 
Selling, general and administrative expense644.9 724.1 795.7 
Research and development expense78.4 75.3 149.5 
Impairment, restructuring and other expense (Note 20)66.7 3,402.0 2,456.7 
Merger transaction and integration costs— — 14.2 
Total costs and expenses6,369.6 10,037.2 9,308.2 
Other income (expense), net46.6 25.1 (181.6)
Income from equity affiliates (Note 13)0.6 64.6 59.8 
Income from Investment in Technip Energies322.2 — — 
Income (loss) before net interest expense and income taxes403.3 (3,416.9)(2,479.8)
Interest income14.0 52.3 43.6 
Interest expense(157.3)(134.1)(134.9)
Loss on early extinguishment of debt(61.9)— — 
Income (loss) before income taxes198.1 (3,498.7)(2,571.1)
Provision for income taxes (Note 22)111.1 19.4 79.0 
Income (loss) from continuing operations87.0 (3,518.1)(2,650.1)
(Income) loss from continuing operations attributable to non-controlling interests0.8 (34.5)4.6 
Income (loss) from continuing operations attributable to TechnipFMC plc87.8 (3,552.6)(2,645.5)
Income (loss) from discontinued operations(72.6)280.2 238.0 
Income from discontinued operations attributable to non-controlling interests(1.9)(15.2)(7.7)
Net income (loss) attributable to TechnipFMC plc$13.3 $(3,287.6)$(2,415.2)
Earnings (loss) per share from continuing operations attributable to TechnipFMC plc
Basic$0.19 $(7.92)$(5.91)
Diluted$0.19 $(7.92)$(5.91)
Earnings (loss) per share from discontinued operations attributable to TechnipFMC
Basic$(0.17)$0.59 $0.51 
Diluted$(0.16)$0.59 $0.51 
Total earnings (loss) per share attributable to TechnipFMC plc
Basic$0.03 $(7.33)$(5.39)
Diluted$0.03 $(7.33)$(5.39)
Weighted average shares outstanding (Note 8)
Basic450.5 448.7 448.0 
Diluted454.6 448.7 448.0 
 Year Ended
(In millions, except per share data)2019 2018 2017
Revenue     
Service revenue$9,789.7
 $9,057.6
 $11,445.9
Product revenue3,352.9
 3,272.6
 3,416.4
Lease revenue266.5
 222.7
 194.6
Total revenue13,409.1
 12,552.9
 15,056.9
      
Costs and expenses     
Cost of service revenue7,767.2
 7,452.7
 9,433.1
Cost of product revenue3,015.6
 2,676.9
 2,954.3
Cost of lease revenue167.9
 143.4
 137.2
Selling, general and administrative expense1,228.1
 1,140.6
 1,060.9
Research and development expense162.9
 189.2
 212.9
Impairment, restructuring and other expense (Note 20)2,490.8
 1,831.2
 191.5
Separation costs (Note 3)72.1
 
 
Merger transaction and integration costs (Note 2)31.2
 36.5
 101.8
Total costs and expenses14,935.8
 13,470.5
 14,091.7
      
Other income (expense), net(220.7) (323.9) (25.9)
Income from equity affiliates (Note 12)62.9
 114.3

55.6
Income (loss) before interest income, interest expense and income taxes(1,684.5) (1,127.2) 994.9
Interest income116.5
 121.4
 140.8
Interest expense(567.8) (482.3) (456.0)
Income (loss) before income taxes(2,135.8) (1,488.1) 679.7
Provision for income taxes (Note 22)276.3
 422.7
 545.5
Net income (loss)(2,412.1) (1,910.8) 134.2
Net profit attributable to noncontrolling interests(3.1) (10.8) (20.9)
Net income (loss) attributable to TechnipFMC plc$(2,415.2) $(1,921.6) $113.3
      
Earnings (loss) per share attributable to TechnipFMC plc (Note 8)     
Basic$(5.39) $(4.20) $0.24
Diluted$(5.39) $(4.20) $0.24
Weighted average shares outstanding (Note 8)     
Basic448.0
 458.0
 466.7
Diluted448.0
 458.0
 468.3
The accompanying notes are an integral part of the consolidated financial statements.
63


TECHNIPFMC PLC AND CONSOLIDATED SUBSIDIARIES
CONSOLIDATED STATEMENTS OF COMPREHENSIVE INCOME
 Year Ended
(In millions)202120202019
Net income (loss) attributable to TechnipFMC plc$13.3 $(3,287.6)$(2,415.2)
(Income) loss from continuing operations attributable to non-controlling interests0.8 (34.5)4.6 
Income from discontinued operations attributable to non-controlling interests(1.9)(15.2)(7.7)
Net income (loss) attributable to TechnipFMC plc, including non-controlling interests14.4 (3,237.9)(2,412.1)
Foreign currency translation adjustments
Net gains (losses) arising during the period27.6 (169.1)15.6 
Reclassification adjustment for net gains included in net loss— — (12.0)
Foreign currency translation adjustments(a)
27.6 (169.1)3.6 
Net gains (losses) on hedging instruments
Net gains (losses) arising during the period(19.8)25.4 8.9 
Reclassification adjustment for net (gains) losses included in net income(11.8)13.0 18.2 
Net gains (losses) on hedging instruments (b)
(31.6)38.4 27.1 
Pension and other post-retirement benefits
Net gains (losses) arising during the period71.2 (88.3)(81.5)
Prior service cost arising during the period(0.4)(4.6)(0.7)
Reclassification adjustment for settlement losses included in net income2.7 1.4 0.2 
Reclassification adjustment for amortization of prior service cost included in net income0.4 0.9 2.0 
Reclassification adjustment for amortization of net actuarial loss included in net income14.9 6.9 0.8 
Net pension and other post-retirement benefits (c)
88.8 (83.7)(79.2)
Other comprehensive income (loss), net of tax84.8 (214.4)(48.5)
Comprehensive income (loss)99.2 (3,452.3)(2,460.6)
Comprehensive income attributable to non-controlling interests0.5 (50.3)(2.4)
Comprehensive income (loss) attributable to TechnipFMC plc$99.7 $(3,502.6)$(2,463.0)
(a)Net of income tax (expense) benefit of nil, nil and $7.9 million for the years ended December 31, 2021, 2020 and 2019, respectively.
(b)Net of income tax (expense) benefit of $8.8 million, $(9.7) million and $(6.9) million for the years ended December 31, 2021, 2020 and 2019, respectively.
(c)Net of income tax (expense) benefit of $(19.6) million, $25.5 million and $20.3 million for the years ended December 31, 2021, 2020 and 2019, respectively.


The accompanying notes are an integral part of the consolidated financial statements.
64


TECHNIPFMC PLC AND CONSOLIDATED SUBSIDIARIES
CONSOLIDATED BALANCE SHEETS
(In millions, except par value data)December 31,
Assets20212020
Cash and cash equivalents$1,327.4 $1,269.2 
Trade receivables, net of allowances of $38.1 in 2021 and $40.2 in 2020911.9 987.7 
Contract assets, net of allowances of $1.1 in 2021 and $2.4 in 2020966.0 886.8 
Inventories, net (Note 10)1,031.9 1,252.8 
Derivative financial instruments (Note 24)110.3 268.7 
Income taxes receivable85.0 274.7 
Advances paid to suppliers79.4 96.3 
Other current assets (Note 11)512.3 683.4 
Investment in Technip Energies317.3 — 
Current assets of discontinued operations— 5,725.1 
Total current assets5,341.5 11,444.7 
Investments in equity affiliates (Note 13)292.4 305.5 
Property, plant and equipment, net (Note 15)2,597.2 2,756.2 
Operating lease right-of-use assets (Note 5)707.9 784.9 
Finance lease right-of-use assets (Note 5)52.2 27.5 
Intangible assets, net (Note 16)813.7 851.3 
Deferred income taxes (Note 22)74.3 34.2 
Derivative financial instruments (Note 24)10.5 29.2 
Other assets130.4 175.6 
Non-current assets of discontinued operations— 3,283.5 
Total assets$10,020.1 $19,692.6 
Liabilities and equity
Short-term debt and current portion of long-term debt (Note 17)$277.6 $624.7 
Operating lease liabilities (Note 5)126.2 195.5 
Finance lease liabilities (Note 5)0.7 26.9 
Accounts payable, trade1,294.3 1,201.0 
Contract liabilities1,012.9 1,046.8 
Accrued payroll194.1 186.8 
Derivative financial instruments (Note 24)161.0 157.5 
Income taxes payable124.6 61.2 
Other current liabilities (Note 11)660.4 818.3 
Current liabilities of discontinued operations— 6,096.5 
Total current liabilities3,851.8 10,415.2 
Long-term debt, less current portion (Note 17)1,727.3 2,835.5 
Operating lease liabilities, less current portion (Note 5)646.8 632.8 
Finance lease liabilities (Note 5)51.1 — 
Deferred income taxes (Note 22)47.5 79.3 
Accrued pension and other post-retirement benefits, less current portion (Note 23)113.4 268.4 
Derivative financial instruments (Note 24)15.5 18.8 
Other liabilities148.3 103.3 
Non-current liabilities of discontinued operations— 1,081.3 
Total liabilities6,601.7 15,434.6 
Commitments and contingent liabilities (Note 21)00
Mezzanine equity
Redeemable non-controlling interest— 43.7 
Stockholders’ equity (Note 18)
Ordinary shares, $1 par value; 618.3 shares authorized in 2021 and 2020; 450.7 shares and 449.5 shares issued and outstanding in 2021 and 2020, respectively; nil shares canceled in 2021 and 2020, respectively450.7 449.5 
Capital in excess of par value of ordinary shares9,160.8 10,242.4 
Accumulated deficit(4,903.8)(4,915.2)
Accumulated other comprehensive loss(1,305.0)(1,622.5)
Total TechnipFMC plc stockholders’ equity3,402.7 4,154.2 
Non-controlling interests15.7 40.4 
Non-controlling interests of discontinued operations— 19.7 
Total equity3,418.4 4,214.3 
Total liabilities and equity$10,020.1 $19,692.6 
The accompanying notes are an integral part of the consolidated financial statements.
68
65


TECHNIPFMC PLC AND CONSOLIDATED SUBSIDIARIES
CONSOLIDATED STATEMENTS OF COMPREHENSIVE INCOMECASH FLOWS
 Year Ended December 31,
(In millions)202120202019
Cash provided (required) by operating activities
Net income (loss)$14.4 $(3,237.9)$(2,412.1)
Net (income) loss from discontinued operations72.6 (280.2)(238.0)
Adjustments to reconcile net loss to cash provided (required) by operating activities
Depreciation291.3 308.7 363.0 
Amortization94.1 103.4 104.7 
Impairments (Note 20)49.1 3,273.8 2,480.3 
Employee benefit plan and share-based compensation costs34.3 36.4 48.6 
Deferred income tax provision (benefit), net(95.1)(31.8)27.9 
Income from investment in Technip Energies(322.2)— — 
Unrealized loss (gain) on derivative instruments and foreign exchange30.8 (13.3)22.4 
Loss from equity affiliates, net of dividends received(0.6)(58.2)(58.9)
Loss on early extinguishment of debt61.9 — — 
Other(5.5)(32.7)(97.1)
Changes in operating assets and liabilities, net of effects of acquisitions
Trade receivables, net and contract assets(73.1)433.4 (142.5)
Inventories, net197.7 87.4 (173.3)
Accounts payable, trade93.8 (236.4)(56.1)
Contract liabilities0.9 (61.8)352.0 
Income taxes payable (receivable), net214.7 (56.1)(31.1)
Other current assets and liabilities, net63.5 551.2 142.0 
Other non-current assets and liabilities, net(7.6)(13.5)25.9 
Cash provided by operating activities from continuing operations715.0 772.4 357.7 
Cash provided (required) by operating activities from discontinued operations66.3 (115.5)490.8 
Cash provided by operating activities781.3 656.9 848.5 
Cash provided (required) by investing activities
Capital expenditures(191.7)(256.1)(412.7)
Payment to acquire debt securities(29.1)(3.9)(71.6)
Proceeds from sale of debt securities27.4 51.5 18.9 
Acquisitions, net of cash acquired(15.3)— 16.0 
Proceeds from sale of assets104.6 45.5 7.4 
Proceeds from sales of investment in Technip Energies900.9 — — 
Proceeds from repayment of advance to joint venture25.0 26.7 62.0 
Other— 15.5 1.5 
Cash provided (required) by investing activities from continuing operations821.8 (120.8)(378.5)
Cash required by investing activities from discontinued operations(4.5)(59.8)(41.3)
Cash provided (required) by investing activities817.3 (180.6)(419.8)
Cash required by financing activities
Net decrease in short-term debt(62.0)(31.9)(49.6)
Net increase (decrease) in commercial paper(974.3)(340.9)113.3 
Proceeds from issuance of long-term debt1,164.4 223.2 96.2 
Repayments of long-term debt(1,462.2)(423.9)— 
Payments for debt issuance cost(60.4)— — 
Purchase of ordinary shares— — (92.7)
Dividends paid— (59.2)(232.8)
Acquisition of non-controlling interest(48.6)— — 
Other(4.2)(19.2)— 
Cash required by financing activities from continuing operations(1,447.3)(651.9)(165.6)
Cash required by financing activities from discontinued operations(3,617.7)(430.3)(618.8)
Cash required by financing activities(5,065.0)(1,082.2)(784.4)
Effect of changes in foreign exchange rates on cash and cash equivalents(14.0)223.5 5.9 
Decrease in cash and cash equivalents(3,480.4)(382.4)(349.8)
Cash and cash equivalents in the statement of cash flows, beginning of year4,807.8 5,190.2 5,540.0 
Cash and cash equivalents in the statement of cash flows, end of year$1,327.4 $4,807.8 $5,190.2 
66


 Year Ended
(In millions)2019 2018 2017
Net income (loss)$(2,412.1) $(1,910.8) $134.2
Foreign currency translation adjustments     
Net gain (losses) arising during the period15.6
 (183.3) (87.2)
Reclassification adjustment for net gains included in net income(12.0) (41.1) 
Foreign currency translation adjustments(a)
3.6
 (224.4) (87.2)
      
Net gains (losses) on hedging instruments     
Net gains (losses) arising during the period8.9
 (58.7) 53.8
Reclassification adjustment for net losses (gains) included in net income18.2
 (2.0) 101.2
Net gains (losses) on hedging instruments (b)
27.1
 (60.7) 155.0
      
Pension and other post-retirement benefits     
Net gains (losses) arising during the period(81.5) (72.4) 43.2
Prior service cost arising during the period(0.7) (2.1) 
Reclassification adjustment for settlement losses (gains) included in net income0.2
 (2.5) (15.2)
Reclassification adjustment for amortization of prior service cost included in net income2.0
 1.2
 0.7
Reclassification adjustment for amortization of net actuarial loss included in net income0.8
 0.3
 1.8
Net pension and other post-retirement benefits (c)
(79.2) (75.5) 30.5
Other comprehensive income (loss), net of tax(48.5) (360.6) 98.3
Comprehensive income (loss)(2,460.6) (2,271.4) 232.5
Comprehensive income attributable to noncontrolling interest(2.4) (6.2) (21.3)
Comprehensive income (loss) attributable to TechnipFMC plc$(2,463.0) $(2,277.6) $211.2
(a)Net of income tax (expense) benefit of $7.9, $3.6 and $(11.5) for the years ended December 31, 2019, 2018 and 2017, respectively.
(b)Net of income tax (expense) benefit of $(6.9), $16.6 and $(52.5) for the years ended December 31, 2019, 2018 and 2017, respectively.
(c)Net of income tax (expense) benefit of $20.3, $15.5 and $(11.7) for the years ended December 31, 2019, 2018 and 2017, respectively.

Year Ended December 31,
(In millions)202120202019
Supplemental disclosures of cash flow information attributable to continuing operations
Cash paid for interest (net of interest capitalized)$104.1 $96.0 $91.5 
Cash paid for income taxes (net of refunds received)$25.1 $107.8 $104.2 


The following table provides a reconciliation of cash, cash equivalents reported in the consolidated balance sheets to the total of the amounts in the consolidated statements of cash flows:
Year Ended December 31,
(In millions)202120202019
Cash and cash equivalents$1,327.4 $1,269.2 $1,563.1 
Cash and cash equivalents attributable to discontinued operations— 3,538.6 3,627.1 
Total cash and cash equivalents in the statement of cash flows$1,327.4 $4,807.8 $5,190.2 
The accompanying notes are an integral part of the consolidated financial statements.

67
69


TECHNIPFMC PLC AND CONSOLIDATED SUBSIDIARIES
CONSOLIDATED BALANCE SHEETS
(In millions, except par value data)December 31,
Assets2019 2018
Cash and cash equivalents$5,190.2
 $5,540.0
Trade receivables, net of allowances of $95.4 in 2019 and $119.6 in 20182,287.1
 2,469.7
Contract assets1,520.0
 1,295.0
Inventories, net (Note 9)1,416.0
 1,251.2
Derivative financial instruments (Note 24)101.9
 95.7
Income taxes receivable264.6
 284.3
Advances paid to suppliers242.9
 189.7
Other current assets (Note 10)863.7
 655.6
Total current assets11,886.4
 11,781.2
Investments in equity affiliates (Note 12)300.4
 394.5
Property, plant and equipment, net (Note 14)3,162.0
 3,259.8
Operating lease right-of-use assets (Note 5)892.6
 
Goodwill (Note 15)5,598.3
 7,607.6
Intangible assets, net (Note 15)1,086.6
 1,176.7
Deferred income taxes (Note 22)260.5
 232.4
Derivative financial instruments (Note 24)39.5
 18.3
Other assets292.5
 314.0
Total assets$23,518.8
 $24,784.5
    
Liabilities and equity   
Short-term debt and current portion of long-term debt (Note 16)$495.4
 $67.4
Operating lease liabilities (Note 5)275.1
 
Accounts payable, trade2,659.8
 2,600.3
Contract liabilities4,585.1
 4,085.1
Accrued payroll411.5
 394.7
Derivative financial instruments (Note 24)141.3
 138.4
Income taxes payable75.7
 81.9
Other current liabilities (Note 10)1,494.5
 1,771.6
Total current liabilities10,138.4
 9,139.4
Long-term debt, less current portion (Note 16)3,980.0
 4,124.3
Operating lease liabilities (Note 5)681.7
 
Deferred income taxes (Note 22)138.2
 209.2
Accrued pension and other post-retirement benefits, less current portion (Note 23)368.6
 298.9
Derivative financial instruments (Note 24)52.7
 44.9
Other liabilities430.0
 540.4
Total liabilities15,789.6
 14,357.1
Commitments and contingent liabilities (Note 21)


Mezzanine equity   
Redeemable noncontrolling interest41.1
 38.5
Stockholders’ equity (Note 18)   
Ordinary shares, $1.00 par value; 618.3 shares and 618.3 shares authorized in 2019 and 2018, respectively; 447.1 shares and 450.5 shares issued and outstanding in 2019 and 2018, respectively; 4.0 and 14.8 shares canceled in 2019 and 2018, respectively447.1
 450.5
Ordinary shares held in employee benefit trust, at cost; nil and 0.1 shares in 2019 and 2018, respectively
 (2.4)
Capital in excess of par value of ordinary shares10,182.8
 10,197.0
(Accumulated deficit) retained earnings(1,563.1) 1,072.2
Accumulated other comprehensive loss(1,407.5) (1,359.7)
Total TechnipFMC plc stockholders’ equity7,659.3
 10,357.6
Noncontrolling interests28.8
 31.3
Total equity7,688.1
 10,388.9
Total liabilities and equity$23,518.8
 $24,784.5
The accompanying notes are an integral part of the consolidated financial statements.


70


TECHNIPFMC PLC AND CONSOLIDATED SUBSIDIARIES
CONSOLIDATED STATEMENTS OF CASH FLOWS
 Year Ended December 31,
(In millions)2019 2018 2017
Cash provided (required) by operating activities     
Net income (loss)$(2,412.1) $(1,910.8) $134.2
Adjustments to reconcile net income to cash provided (required) by operating activities     
Depreciation383.5
 367.8
 370.2
Amortization126.1
 182.6
 244.5
Impairments (Note 20)2,484.1
 1,792.6
 34.3
Employee benefit plan and share-based compensation costs63.3
 22.4
 18.7
Deferred income tax provision (benefit), net(75.4) 48.8
 141.6
Unrealized loss (gain) on derivative instruments and foreign exchange32.5
 102.7
 (73.5)
Income from equity affiliates, net of dividends received(58.8) (110.7) (37.9)
Other364.4
 291.8
 4.7
Changes in operating assets and liabilities, net of effects of acquisitions     
Trade receivables, net and contract assets(39.7) (664.1) 286.8
Inventories, net(169.6) (339.4) 130.9
Accounts payable, trade26.1
 (1,248.7) (525.8)
Contract liabilities520.1
 762.7
 (1,111.4)
Income taxes payable (receivable), net12.7
 (190.7) (152.2)
Other current assets and liabilities, net(431.8) 921.2
 646.5
Other noncurrent assets and liabilities, net23.1
 (213.6) 99.1
Cash provided (required) by operating activities848.5
 (185.4) 210.7
      
Cash provided (required) by investing activities     
Capital expenditures(454.4) (368.1) (255.7)
Cash acquired in merger of FMC Technologies, Inc. and Technip S.A. (Note 2)
 
 1,479.2
Payment to acquire debt securities(71.6) 
 
Proceeds from sale of debt securities18.9
 
 
Acquisitions, net of cash acquired16.0
 (104.9) 
Cash divested from deconsolidation(2.1) (6.7) 
Proceeds from sale of assets7.8
 19.5
 14.4
Proceeds from repayment of advance to joint venture62.0
 
 
Other3.6
 
 12.1
Cash provided (required) by investing activities(419.8) (460.2) 1,250.0
      
Cash provided (required) by financing activities     
Net decrease in short-term debt(49.6) (34.9) (106.4)
Net increase in commercial paper57.3
 496.6
 234.9
Proceeds from issuance of long-term debt96.2
 
 25.7
Repayments of long-term debt
 
 (888.0)
Purchase of ordinary shares(92.7) (442.6) (58.5)
Dividends paid(232.8) (238.1) (60.6)
Payments related to taxes withheld on share-based compensation
 
 (46.6)
Settlements of mandatorily redeemable financial liability(562.8) (225.8) (156.5)
Other
 
 1.2
Cash provided (required) by financing activities(784.4)
(444.8) (1,054.8)
Effect of changes in foreign exchange rates on cash and cash equivalents5.9
 (107.0) 62.2
Increase (decrease) in cash and cash equivalents(349.8)
(1,197.4) 468.1
Cash and cash equivalents, beginning of year5,540.0

6,737.4
 6,269.3
Cash and cash equivalents, end of year$5,190.2
 $5,540.0
 $6,737.4


 Year Ended December 31,
(In millions)2019 2018 2017
Supplemental disclosures of cash flow information     
Cash paid for interest (net of interest capitalized)$109.4
 $99.0
 $50.3
Cash paid for income taxes (net of refunds received)$374.5
 $410.6
 $424.7
The accompanying notes are an integral part of the consolidated financial statements.

72


TECHNIPFMC PLC AND CONSOLIDATED SUBSIDIARIES
CONSOLIDATED STATEMENTS OF CHANGES IN STOCKHOLDERS’ EQUITY
(In millions)Ordinary Shares 
Ordinary Shares Held in
Treasury and
Employee
Benefit
Trust
 
Capital in
Excess of Par
Value of
Ordinary Shares
 
Retained
Earnings
(Accumulated
Deficit)
 
Accumulated
Other
Comprehensive
Income
(Loss)
 
Non-
controlling
Interest
 
Total
Stockholders’
Equity
(In millions)Ordinary SharesOrdinary Shares Held in
Treasury and
Employee
Benefit
Trust
Capital in
Excess of Par
Value of
Ordinary Shares
Retained
Earnings
(Accumulated
Deficit)
Accumulated
Other
Comprehensive
Income
(Loss)
Non-
controlling
Interest
Total
Stockholders’
Equity
Balance as of December 31, 2016$114.7
 $(44.5) $2,683.1
 $3,362.1
 $(1,101.6) $(11.7) $5,002.1
Net income
 
 
 113.3
 
 20.9
 134.2
Other comprehensive income


 97.9
 0.4
 98.3
Issuance of ordinary shares due to the merger of FMC Technologies and Technip351.9
 (6.6) 7,825.4


 8,170.7
Cancellation of treasury shares due to the merger of FMC Technologies and Technip
 44.5
 (23.3) 
 
 
 21.2
Cancellation treasury shares (Note 18)(2.1) 
 (47.6) (8.8) 
 
 (58.5)
Net sales of ordinary shares for employee benefit trust
 1.8


 1.8
Issuance of ordinary shares0.6
 
 0.6


 1.2
Dividends ($0.13 per share) (Note 18)
 
 
 (60.6) 
 
 (60.6)
Share-based compensation (Note 19)
 
 44.4


 44.4
Other
 
 0.7
 
 
 11.9
 12.6
Balance as of December 31, 2017$465.1
 $(4.8) $10,483.3
 $3,406.0
 $(1,003.7)
$21.5

$13,367.4
Adoption of accounting standards (Note 6)
 
 
 (91.5) 
 0.1
 (91.4)
Balance as of December 31, 2018Balance as of December 31, 2018$450.5 $(2.4)$10,197.0 $1,072.2 $(1,359.7)$31.3 $10,388.9 
Adoption of accounting standardsAdoption of accounting standards— — — 1.8 — — 1.8 
Net income (loss)
 
 
 (1,921.6) 
 10.8
 (1,910.8)Net income (loss)— — — (2,415.2)— 3.1 (2,412.1)
Other comprehensive loss


 (356.0) (4.6) (360.6)Other comprehensive loss— — — — (47.8)(0.7)(48.5)
Cancellation of treasury shares (Note 18)(14.8) 
 (333.5) (94.5) 
 
 (442.8)Cancellation of treasury shares (Note 18)(4.0)— (88.7)— — — (92.7)
Issuance of ordinary shares0.2


 0.2
Issuance of ordinary shares0.6 — — — — — 0.6 
Net sales of ordinary shares for employee benefit trust
 2.4


 2.4
Net sales of ordinary shares for employee benefit trust— 2.4 — — — — 2.4 
Dividends ($0.52 per share) (Note 18)
 
 
 (238.1) 
 
 (238.1)
Share-based compensation (Note 19)
 
 49.1


 49.1
Other
 
 (1.9) 11.9
 
 3.5
 13.5
Balance as of December 31, 2018$450.5
 $(2.4) $10,197.0
 $1,072.2
 $(1,359.7) $31.3
 $10,388.9
Adoption of accounting standards (Note 5)
 
 
 1.8
 
 
 1.8
Net income (loss)
 
 
 (2,415.2) 
 3.1
 (2,412.1)
Other comprehensive loss


 (47.8) (0.7) (48.5)
Cancellation of treasury shares (Note 18)(4.0) 
 (88.7) 
 
 
 (92.7)
Issuance of ordinary shares0.6


 0.6
Net sales of ordinary shares for employee benefit trust
 2.4


 2.4
Dividends ($0.52 per share) (Note 18)
 
 
 (232.8) 
 
 (232.8)
Cash dividends declared ($0.52 per share) (Note 18)Cash dividends declared ($0.52 per share) (Note 18)— — — (232.8)— — (232.8)
Share-based compensation (Note 19)
 
 74.5


 74.5
Share-based compensation (Note 19)— — 74.5 — — — 74.5 
Other
 
 
 10.9
 
 (4.9) 6.0
Other— — — 10.9 — (4.9)6.0 
Balance as of December 31, 2019$447.1
 $
 $10,182.8
 $(1,563.1) $(1,407.5) $28.8
 $7,688.1
Balance as of December 31, 2019$447.1 $— $10,182.8 $(1,563.1)$(1,407.5)$28.8 $7,688.1 
Adoption of accounting standardsAdoption of accounting standards— — — (7.8)— — (7.8)
Net income (loss)Net income (loss)— — — (3,287.6)— 49.7 (3,237.9)
Other comprehensive lossOther comprehensive loss— — — — (215.0)0.6 (214.4)
Issuance of ordinary sharesIssuance of ordinary shares2.4 — (9.4)— — — (7.0)
Cash dividends declared ($0.13 per share) (Note 18)Cash dividends declared ($0.13 per share) (Note 18)— — — (59.2)— — (59.2)
Share-based compensation (Note 19)Share-based compensation (Note 19)— — 69.0 — — — 69.0 
Distributions to non-controlling interestDistributions to non-controlling interest— — — (9.4)— (2.1)(11.5)
OtherOther— — — 11.9 — (16.9)(5.0)
Balance as of December 31, 2020Balance as of December 31, 2020$449.5 $— $10,242.4 $(4,915.2)$(1,622.5)$60.1 $4,214.3 
Net incomeNet income— — — 13.3 — 1.1 14.4 
Other comprehensive incomeOther comprehensive income— — — — 86.4 (1.6)84.8 
Issuance of ordinary sharesIssuance of ordinary shares1.2 — — — — — 1.2 
Share-based compensation (Note 19)Share-based compensation (Note 19)— — 26.8 — — — 26.8 
Spin-off of Technip Energies (Note 2)Spin-off of Technip Energies (Note 2)— — (1,108.4)— 231.1 (19.9)(897.2)
Accrued distributions to non-controlling interestAccrued distributions to non-controlling interest— — — — — (15.0)(15.0)
OtherOther— — — (1.9)— (9.0)(10.9)
Balance as of December 31, 2021Balance as of December 31, 2021$450.7 $— $9,160.8 $(4,903.8)$(1,305.0)$15.7 $3,418.4 
The accompanying notes are an integral part of the consolidated financial statements.

68
73


TECHNIPFMC PLC AND CONSOLIDATED SUBSIDIARIES
NOTES TO CONSOLIDATED FINANCIAL STATEMENTS
NOTE 1. BASIS OF PRESENTATION AND SUMMARY OF SIGNIFICANT ACCOUNTING POLICIES
Nature of operations - TechnipFMC plc and consolidated subsidiaries (“TechnipFMC,” “we,” “us” or “our”) is a global leader in oil and gas projects, technologies, systems and services through our business segments: Subsea Onshore/Offshore and Surface Technologies. We have manufacturing operations worldwide, strategically located to facilitate delivery of our products, systems and services to our customers.
Basis of presentation - Our consolidated financial statements were prepared in U.S. dollars and in accordance with accounting principles generally accepted in the United States of America (“GAAP”) and rules and regulations of the Securities and Exchange Commission (“SEC”) pertaining to annual financial information. The preparation of financial statements in conformity with these accounting principles requires us to make estimates and assumptions that affect the reported amounts of assets and liabilities at the date of the financial statements and the reported amounts of revenue and expenses during the reporting period. Ultimate results could differ from our estimates.
In this Annual Report on Form 10-K, we are reporting the results of our operations for the year ended December 31, 2019, which consist of the combined results of operations of Technip S.A. (“Technip”) and FMC Technologies, Inc. (“FMC Technologies”). Due to the merger of FMC Technologies and Technip, FMC Technologies’ results of operations have been included in our financial statements for periods subsequent to the consummation of the merger on January 16, 2017. Refer to Note 2 for further information related to the merger of FMC Technologies and Technip.
Principles of consolidation - The consolidated financial statements include the accounts of TechnipFMC and its majority-owned subsidiaries and affiliates. Intercompany accounts and transactions are eliminated in consolidation.
Use of estimates - The preparation of financial statements in conformity with GAAP requires management to make estimates and assumptions that affect the reported amounts of assets and liabilities and disclosures of contingent assets and liabilities at the date of the financial statements and the reported amounts of revenue and expenses during the reporting period. Actual results could differ from those estimates. Such estimates include, but are not limited to, estimates of total contract profit or loss on long-term construction-type contracts; estimated realizable value on excess and obsolete inventory; estimates related to pension accounting; estimates related to fair value for purposes of assessing goodwill, long-lived assets and intangible assets for impairment; estimates of fair value in business combinations and estimates related to income taxes.
Investments in the common stock of unconsolidated affiliates - The equity method of accounting is used to account for investments in unconsolidated affiliates where we have the ability to exert significant influence over the affiliates’ operating and financial policies. We measure equity investments not accounted for under the equity method at fair value and recognize any changes in fair value in net income. For certain construction joint ventures, we use the proportionate consolidation method, whereby our proportionate share of each entity’s assets, liabilities, revenues and expenses are included in the appropriate classifications in the accompanying consolidated financial statements. Intercompany balances and transactions have been eliminated in preparing the accompanying consolidated financial statements.
Investments in unconsolidated affiliates are assessed for impairment whenever events or changes in facts and circumstances indicate the carrying value of the investments may not be fully recoverable. When such a condition is subjectively determined to be other than temporary, the carrying value of the investment is written down to fair value. Management’s assessment as to whether any decline in value is other than temporary is based on our ability and intent to hold the investment and whether evidence indicating the carrying value of the investment is recoverable within a reasonable period of time outweighs evidence to the contrary. Management generally considers our investments in equity method investees to be strategic, long-term investments and completes its assessments for impairment with a long-term viewpoint.
Investments in which ownership is less than 20% or that do not represent significant investments are reported in other assets onin the consolidated balance sheets. Where no active market exists and where no other valuation method can be used, these financial assets are maintained at cost minus impairment, if any, plus or minus changes resulting from observable price changes in orderly transactions for the identical or a similar investment of the same issuer.


We determine whether investments involve a variable interest entity (“VIE”) based on the characteristics of the subject entity. If the entity is determined to be a VIE, then management determines if we are the primary beneficiary of the entity and whether or not consolidation of the VIE is required. The primary beneficiary consolidating the VIE must normally have both (i) the power to direct the activities that most significantly affect the VIE’s economic performance and (ii) the obligation to absorb significant losses of or the right to receive significant benefits from the VIE. If we are deemed to be the primary beneficiary, the VIE is consolidated and the other party’s equity interest in the VIE is accounted for as a noncontrollingnon-controlling interest. Our unconsolidated VIEs are accounted for using the equity method of accounting.
69


Business combinations - Business combinations are accounted for using the acquisition method of accounting. Under the acquisition method, assets acquired and liabilities assumed are recorded at their respective fair values as of the acquisition date. Determining the fair value of assets and liabilities involves significant judgment regarding methods and assumptions used to calculate estimated fair values. The purchase price is allocated to the acquired assets, assumed liabilities and identifiable intangible assets based on their estimated fair values. Any excess of the purchase price over the estimated fair values of the net assets acquired is recorded as goodwill. Transaction related costs are expensed as incurred. 
Leases - The majority of our leases are operating leases. We account for leases in accordance with Accounting Standard Codification (“ASC”)Topic 842, Leases, which we adopted on January 1, 2019 using the modified retrospective method. Refer toSee Note 5 for further discussion of the adoption, including the impact on our 2019 financial statements.details.
Revenue recognition - The majority of our revenue is derived from long-term contracts that can span several years. We account for revenue in accordance with ASC Topic 606, Revenue from Contracts with Customers, which we adopted on January 1, 2018, using the modified retrospective method. Refer to. See Note 6 for further discussion of the adoption, including the impact on our 2018 financial statements.details.
Contract costs to obtain a contract - Our incremental direct costs of obtaining a contract are deferred and amortized over the period of contract performance or a longer period, generally the estimated life of the customer relationship, if renewals are expected and the renewal commission is not commensurate with the initial commission. We classify deferred commissions as current or noncurrentnon-current based on the timing of when we expect to recognize the expense. The current and noncurrentnon-current portions of deferred commissions are included in other current assets and other assets, respectively, in our consolidated balance sheets.
Amortization of deferred commissions is included in selling, general and administrative expenses.expenses in our consolidated statements of income.
Cash equivalents - Cash equivalents are highly-liquid, short-term instrumentsinvestments with original maturities of generally three months or less from their date of purchase.
Trade receivables, net of allowances - An allowance for doubtful accounts is provided on receivables equal to the estimated uncollectible amounts. This estimateamounts and is calculated based on loss rates from historical collection experiencedata. We develop loss-rate statistics on the basis of the amount written off over the life of the receivable and aadjust these historical credit loss trends for forward-looking factors specific review of each customer’s receivables balance.to the debtors and the economic environment to determine lifetime expected losses.
Inventories - Inventories are stated at the lower of cost or net realizable value, except as it relates to inventory measured using the last-in, first-out (“LIFO”) method, for which the inventories are stated at the lower of cost or market. Inventory costs include those costs directly attributable to products, including all manufacturing overhead, but excluding costs to distribute. Cost for a significant portion of the U.S. domiciled inventories is determined on the LIFO method. The first-in, first-out (“FIFO”) or weighted average methods are used to determine the cost for the remaining inventories. Write-down onof inventories areis recorded when the net realizable value of inventories is lower than their net book value.
Property, plant and equipment - Property, plant, and equipment is recorded at cost. Depreciation is principally provided on the straight-line basis over the estimated useful lives of the assets (vessels - 10 to 30 years; buildings - 10 to 50 years; and machinery and equipment - 3 to 20 years). Gains and losses are realized upon the sale or retirement of assets and are recorded in other income (expense), net on our consolidated statements of income. Maintenance and repair costs are expensed as incurred. Expenditures that extend the useful lives of property, plant and equipment are capitalized and depreciated over the estimated new remaining life of the asset.


Impairment of property, plant and equipment - Property, plant and equipment are reviewed for impairment whenever events or changes in circumstances indicate the carrying value of the long-lived asset may not be recoverable. The carrying value of an asset group is not recoverable if it exceeds the sum of the undiscounted cash flows expected to result from the use and eventual disposition of the asset. If it is determined that an impairment loss has occurred, the impairment loss is measured as the amount by which the carrying value of the long-lived asset exceeds its fair value.
Long-lived assets classified as held for sale are reported at the lower of carrying value or fair value less cost to sell.
70


Goodwill - Goodwill is not subject to amortization but is tested for impairment on an annual basis (or more frequently if impairment indicators arise) by comparing the estimated fair value of each reporting unit to its carrying value, including goodwill. A reporting unit is defined as an operating segment or one level below the operating segment. We have established October 31 as the date of our annual test for impairment of goodwill. Reporting units with goodwill are tested for impairment using a quantitative impairment test known as the income approach, which estimates fair value by discounting each reporting unit’s estimated future cash flows using a weighted-average cost of capital that reflects current market conditions and the risk profile of the reporting unit. To arrive at our future cash flows, we use estimates of economic and market assumptions, including growth rates in revenues, costs, estimates of future expected changes in operating margins, tax rates and cash expenditures. Future revenues are also adjusted to match changes in our business strategy. If the fair value of the reporting unit is less than its carrying amount as a result of this method, then an impairment loss is recorded.
A lower fair value estimate in the future for any of our reporting units could result in goodwill impairments. Factors that could trigger a lower fair value estimate include sustained price declines of the reporting unit’s products and services, cost increases, regulatory or political environment changes, changes in customer demand, and other changes in market conditions, which may affect certain market participant assumptions used in the discounted future cash flow model. As of December 31, 2021, we did not have any goodwill outstanding.
Intangible assets - Our acquired intangible assets are generally amortized on a straight-line basis over their estimated useful lives, which generally range from 2 to 20years. Our acquired intangible assets do not have indefinite lives. Intangible assets are reviewed for impairment whenever events or changes in circumstances indicate the carrying amount of the intangible asset may not be recoverable. The carrying amount of an intangible asset is not recoverable if it exceeds the sum of the undiscounted cash flows expected to result from the use and eventual disposition of the asset. If it is determined that an impairment loss has occurred, the loss is measured as the amount by which the carrying amount of the intangible asset exceeds its fair value.
Capitalized software costs are recorded at cost. Capitalized software costs include purchases of software and internal and external costs incurred during the application development stage of software projects. These costs are amortized on a straight-line basis over the estimated useful lives. For internal use software, the useful lives range from3 to 10years. For Internet website costs, the estimated useful lives do not exceed 3 years.
Research and development expense is expensed as incurred. Research and development expense includes improvement of existing products and services, design and development of new products and services and test of new technologies.
Debt instruments - Debt instruments include synthetic bonds, senior and private placement notes and other borrowings. Issuance fees and redemption premium on debt instruments are included in the cost of debt in the consolidated balance sheets, as an adjustment to the nominal amount of the debt. Loan origination costs for revolving credit facilities are recorded as an asset and amortized over the life of the underlying debt.
Fair value measurements - Fair value is defined as the price that would be received to sell an asset or paid to transfer a liability (an exit price) in an orderly transaction between market participants at the reporting date. The fair value framework requires the categorization of assets and liabilities measured at fair value into three levels based upon the assumptions (inputs) used to price the assets or liabilities, with the exception of certain assets and liabilities measured using the net asset value practical expedient, which are not required to be leveled. Level 1 provides the most reliable measure of fair value, whereas Level 3 generally requires significant management judgment. The three levels are defined as follows:
Level 1: Unadjusted quoted prices in active markets for identical assets and liabilities.
Level 2: Observable inputs other than quoted prices included in Level 1. For example, quoted prices for similar assets or liabilities in active markets or quoted prices for identical assets or liabilities in inactive markets.

Level 2: Observable inputs other than quoted prices included in Level 1. For example, quoted prices for similar assets or liabilities in active markets or quoted prices for identical assets or liabilities in inactive markets.
Level 3: Unobservable inputs reflecting management’s own assumptions about the assumptions market participants would use in pricing the asset or liability.
71


Level 3: Unobservable inputs reflecting management’s own assumptions about the assumptions market participants would use in pricing the asset or liability.
Income taxes - Current income taxes are provided on income reported for financial statement purposes, adjusted for transactions that do not enter into the computation of income taxes payable in the same year. Deferred tax assets and liabilities are measured using enacted tax rates for the expected future tax consequences of temporary differences between the carrying amounts and the tax basis of assets and liabilities. A valuation allowance is established whenever management believes that it is more likely than not that deferred tax assets may not be realizable.
Income taxes are not provided on our equity in undistributed earnings of foreign subsidiaries or affiliates to the extent we have determined that the earnings are indefinitely reinvested. Income taxes are provided on such earnings in the period in which we can no longer support that such earnings are indefinitely reinvested.
Tax benefits related to uncertain tax positions are recognized when it is more likely than not, based on the technical merits, that the position will be sustained upon examination.
We classify interest expense and penalties recognized on underpayments of income taxes as income tax expense.
Share-based employee compensation - The measurement of share-based compensation expense on restricted share awards and performance share awards is based on the market price at the grant date and the number of shares awarded. We use Black-Scholes options pricing model to measure the fair value of stock options granted on or after January 1, 2017. The stock-based compensation expense for each award is recognized ratably over the applicable service period or the period beginning at the start of the service period and ending when an employee becomes eligible for retirement, after taking into account estimated forfeitures.
Ordinary shares held in employee benefit trust - Our ordinary shares are purchased by the plan administrator of the FMC Technologies, Inc. Non-Qualified Savings and Investment Plan and placed in a trust that we own. Purchased shares are recorded at cost and classified as a reduction of stockholders’ equity on the consolidated balance sheets.
Earnings per ordinary share (“EPS”) - Basic EPS is computed using the weighted-average number of ordinary shares outstanding during the year. We use the treasury stock method to compute diluted EPS which gives effect to the potential dilution of earnings that could have occurred if additional shares were issued for awards granted under our incentive compensation and stock plan. The treasury stock method assumes proceeds that would be obtained upon exercise of awards granted under our incentive compensation and stock plan are used to purchase outstanding ordinary shares at the average market price during the period.
Foreign currency - Financial statements of operations for which the U.S. dollar is not the functional currency, and which are located in non-highly inflationary countries, are translated into U.S. dollars prior to consolidation. Assets and liabilities are translated at the exchange rate in effect at the balance sheet date, while income statement accounts are translated at the average exchange rate for each period. For these operations, translation gains and losses are recorded as a component of accumulated other comprehensive income (loss) in stockholders’ equity until the foreign entity is sold or liquidated. For operations in highly inflationary countries and where the local currency is not the functional currency, inventories, property, plant and equipment, and other non-current assets are converted to U.S. dollars at historical exchange rates, and all gains or losses from conversion are included in net income. Foreign currency effects on cash, cash equivalents and debt in highly inflationary economies are included in interest income or expense.
For certain committed and anticipated future cash flows and recognized assets and liabilities which are denominated in a foreign currency, we may choose to manage our risk against changes in the exchange rates, when compared against the functional currency, through the economic netting of exposures instead of derivative instruments. Cash outflows or liabilities in a foreign currency are matched against cash inflows or assets in the same currency, such that movements in exchange rates will result in offsetting gains or losses. Due to the inherent unpredictability of the timing of cash flows, gains and losses in the current period may be economically offset by gains and losses in a future period. All gains and losses are recorded in our consolidated statements of income in the period in which they are incurred. Gains and losses from the remeasurement of assets and liabilities are recognized in other income (expense), net.
During the second half of 2018, Argentina’s three year cumulative inflation rate exceeded 100% based on published inflation data, and effective July 1, 2018, Argentina’s currency is considered highly inflationary. Our local operations


in Argentina use U.S. dollars as the functional currency and both monetary and non-monetary assets and liabilities denominated in Argentina pesos were remeasured into U.S. dollars with gains and losses resulting from foreign currency transactions included in current results of operations. This event did not have a material impact on the Company’s condensed consolidated financial statements.
Derivative instruments - Derivatives are recognized on the consolidated balance sheets at fair value, with classification as current or non-current based upon the maturity of the derivative instrument. Changes in the fair value of derivative instruments are recorded in current earnings or deferred in accumulated other comprehensive income (loss), depending on the type of hedging transaction and whether a derivative is designated as, and is effective as, a hedge. Each instrument is accounted for individually and assets and liabilities are not offset.
72


Hedge accounting is only applied when the derivative is deemed to be highly effective at offsetting changes in anticipated cash flows of the hedged item or transaction. Changes in fair value of derivatives that are designated as cash flow hedges are deferred in accumulated other comprehensive income (loss) until the underlying transactions are recognized in earnings. At such time, related deferred hedging gains or losses are recorded in earnings on the same line as the hedged item. Effectiveness is assessed at the inception of the hedge and on a quarterly basis. Effectiveness of forward contract cash flow hedges are assessed based solely on changes in fair value attributable to the change in the spot rate. The change in the fair value of the contract related to the change in forward rates is excluded from the assessment of hedge effectiveness. Changes in this excluded component of the derivative instrument, along with any ineffectiveness identified, are recorded in earnings as incurred. We document our risk management strategy and hedge effectiveness at the inception of, and during the term of, each hedge.
We also use forward contracts to hedge foreign currency assets and liabilities, for which we do not apply hedge accounting. The changes in fair value of these contracts are recognized in other income (expense), net on our consolidated statements of income, as they occur and offset gains or losses on the remeasurement of the related asset or liability.
Reclassifications - Certain prior-year amounts have been reclassified to conform to the current year’s presentation.
Revision
NOTE 2. DISCONTINUED OPERATIONS
The Spin-off
On February 16, 2021, we completed our separation of Prior Period Financial Statements - the Technip Energies business segment. The transaction was structured as a spin-off (the “Spin-off”), which occurred by way of a pro rata dividend (the “Distribution”) to our shareholders of 50.1% of the outstanding shares in Technip Energies N.V. Each of our shareholders received one ordinary share of Technip Energies N.V. for every five ordinary shares of TechnipFMC held at 5:00 p.m., Eastern Standard Time, on the record date, February 17, 2021. Technip Energies N.V. is now an independent public company and its shares trade under the ticker symbol “TE” on the Euronext Paris Stock Exchange.

In connection with the preparationSpin-off, TechnipFMC and Technip Energies entered into a separation and distribution agreement, as well as various other agreements, including, among others, a tax matters agreement, an employee matters agreement and a transition services agreement and certain agreements relating to intellectual property. These agreements provide for the allocation between TechnipFMC and Technip Energies of assets, employees, taxes, liabilities and obligations attributable to periods prior to, at and after the Spin-off.

Discontinued Operations
The Spin-off represented a strategic shift that will have a major impact on our operations and consolidated financial statements for the year ended December 31, 2019, we identified errors in our previously issued financial statements relatedstatements. Accordingly, historical results of Technip Energies prior to the classification between service revenue, product revenue and the related cost of sales. The correction had no effectDistribution on the reported total revenues, consolidated net income (loss) or stockholders’ equity for any periods previously presented.
In accordance with Staff Accounting Bulletin (“SAB”) No. 99, Materiality, and SAB No. 108, Considering the Effects of Prior Year Misstatements when Quantifying MisstatementsFebruary 16, 2021 have been presented as discontinued operations in Current Year Financial Statements, we evaluated the errors and, based on an analysis of quantitative and qualitative factors, determined that the related impact was not material to our consolidated financial statements for any prior annual or interim period. Therefore, amendments of previously filed reports are not required.
In accordance with ASC 250, Accounting Changes and Error Corrections, we corrected the errors for the year ended December 31, 2018 and 2017 by revising the consolidated financial statements appearing herein.


The effects of the revision on our consolidated statements of income, for the year ended December 31, 2018consolidated balance sheets and 2017 are as follows:
 Year Ended
 December 31, 2018 December 31, 2017
(In millions, except per share data)As Previously Reported Adjustments As Revised As Previously Reported Adjustments As Revised
Revenue           
Service revenue$9,765.0
 $(707.4) $9,057.6
 $12,210.5
 $(764.6) $11,445.9
Product revenue2,565.2
 707.4
 3,272.6
 2,651.8
 764.6
 3,416.4
Total revenue12,552.9
 
 12,552.9
 15,056.9
 
 15,056.9
            
Costs and expenses           
Cost of service revenue7,895.1
 (442.4) 7,452.7
 9,984.0
 (550.9) 9,433.1
Cost of product revenue2,234.5
 442.4
 2,676.9
 2,403.4
 550.9
 2,954.3
Total costs and expenses13,470.5
 
 13,470.5
 14,091.7
 
 14,091.7
            
Net income (loss) attributable to TechnipFMC plc$(1,921.6) $
 $(1,921.6) $113.3
 $
 $113.3
            
Earnings (loss) per share attributable to TechnipFMC plc (Note 8)           
Basic$(4.20) $
 $(4.20) $0.24
 $
 $0.24
Diluted$(4.20) $
 $(4.20) $0.24
 $
 $0.24
            
Weighted average shares outstanding (Note 8)           
Basic458.0
 
 458.0
 466.7
 
 466.7
Diluted458.0
 
 458.0
 468.3
 
 468.3


NOTE 2. BUSINESS COMBINATION TRANSACTIONS
Descriptionconsolidated statements of the merger of FMC Technologies and Technip
On June 14, 2016, FMC Technologies and Technip entered into a definitive business combination agreement providingcash flows for the business combination among FMC Technologies, FMC Technologies SIS Limited, a private limited company incorporated under the laws of England and Wales and a wholly-owned subsidiary of FMC Technologies, and Technip. On August 4, 2016, the legal name of FMC Technologies SIS Limited was changed to TechnipFMC Limited, and on January 11, 2017, was subsequently re-registered as TechnipFMC plc, a public limited company incorporated under the laws of England and Wales.
On January 16, 2017, the business combination was completed. Pursuant to the terms of the definitive business combination agreement, Technip merged with and into TechnipFMC, with TechnipFMC continuing as the surviving company (the “Technip Merger”), and each ordinary share of Technip (the “Technip Shares”), other than Technip Shares owned by Technip or its wholly-owned subsidiaries, were exchanged for 2.0 ordinary shares of TechnipFMC, subject to the terms of the definitive business combination agreement. Immediately following the Technip Merger, a wholly-owned indirect subsidiary of TechnipFMC (“Merger Sub”) merged with and into FMC Technologies, with FMC Technologies continuing as the surviving company and as a wholly-owned indirect subsidiary of TechnipFMC (the “FMCTI Merger”), and each share of common stock of FMC Technologies (the “FMCTI Shares”), other than FMCTI Shares owned by FMC Technologies, TechnipFMC, Merger Sub or their wholly-owned subsidiaries, were exchanged for 1.0 ordinary share of TechnipFMC, subject to the terms of the definitive business combination agreement.
Under the acquisition method of accounting, Technip was identified as the accounting acquirer and acquired a 100% interest in FMC Technologies.


The merger of FMC Technologies and Technip (the “Merger”) has created a larger and more diversified company that is better equipped to respond to economic and industry developments and better positioned to develop and build on its offerings in the subsea, surface, and onshore/offshore markets as compared to the former companies on a standalone basis. More importantly, the Merger has brought about the ability of the combined company to (i) standardize its product and service offerings to customers, (ii) reduce costs to customers, and (iii) provide integrated product offerings to the oil and gas industry with the aim to innovate the markets in which the combined company operates.
We incurred merger transaction and integration costs of $31.2 million, $36.5 million and $101.8 million during the years ended December 31, 2019, 20182021, 2020 and 2017, respectively.2019. Our consolidated statements of income, consolidated balance sheets and consolidated statements of cash flows and notes to the consolidated financial statements have been updated to reflect continuing operations only.
Description of FMC Technologies as Accounting Acquiree - FMC Technologies is a global provider of technology solutions for the energy industry. FMC Technologies designs, manufactures and services technologically sophisticated systems and products, including subsea production and processing systems, surface wellhead production systems, high pressure fluid control equipment, measurement solutions and marine loading systems for the energy industry. Subsea systems produced by FMC Technologies are used in the offshore production of crude oil and natural gas and are placed on the seafloor to control the flow of crude oil and natural gas from the reservoir to a host processing facility. Additionally, FMC Technologies provides a full range of drilling, completion and production wellhead systems for both standard and custom-engineered applications. Surface wellhead production systems, or trees, are used to control and regulate the flow of crude oil and natural gas from the well and are used in both onshore and offshore applications.
Consideration Transferred - The acquisition-date fair value of the consideration transferred consisted of the following:
(In millions, except per share data)  
Total FMC Technologies, Inc. shares subject to exchange as of January 16, 2017 228.9
FMC Technologies, Inc. exchange ratio (a)
 0.5
Shares of TechnipFMC issued 114.4
Value per share of Technip as of January 16, 2017 (b)
 $71.4
Total purchase consideration $8,170.7
(a)As the calculation is deemed to reflect a share capital increase of the accounting acquirer, the FMC Technologies exchange ratio (1 share of TechnipFMC for 1 share of FMC Technologies as provided in the business combination agreement) is adjusted by dividing the FMC Technologies exchange ratio by the Technip exchange ratio (2 shares of TechnipFMC for 1 share of Technip as provided in the business combination agreement), i.e.,  1 ⁄ 2 = 0.5 in order to reflect the number of shares of Technip that FMC Technologies stockholders would have received if Technip was to have issued its own shares.
(b)Closing price of Technip’s ordinary shares on Euronext Paris on January 16, 2017 in Euro converted at the Euro to U.S. dollar exchange rate of $1.0594 on January 16, 2017.


Assets Acquired and Liabilities Assumed - The following table summarizes the final allocationcomponents of the fair valuesincome from discontinued operations, net of the assets acquiredtax:
Year Ended
(In millions)202120202019
Revenue$906.0 $6,520.0 $6,458.9 
Costs and expenses(932.0)(5,899.0)(5,627.6)
Other income and (expense), net(18.6)(206.8)(396.0)
Income (loss) from discontinued operations before income taxes$(44.6)$414.2 $435.3 
Income (loss) from discontinued operations, net of income taxes$(72.6)$280.2 $238.0 
73


Supplemental information:
Year Ended
(In millions)202120202019
Capital expenditures$5.1 $35.7 $41.7 
Depreciation and amortization expense17.1 35.1 41.9 
Research and development expense4.4 44.5 13.4 
Assets and liabilities assumed atof discontinued operations are summarized below:
December 31,
(In millions)2020
Assets
Cash and cash equivalents$3,538.6 
Trade receivables, net of allowances1,302.1 
Contract assets380.8 
Other current assets503.6 
Total current assets of discontinued operations5,725.1 
Property, plant and equipment, net of accumulated depreciation105.6 
Goodwill2,512.5 
Other assets665.4 
Total non-current assets of discontinued operations3,283.5 
Total assets of discontinued operations$9,008.6 
Liabilities
Accounts payable, trade$1,539.5 
Contract liabilities3,689.3 
Other current liabilities867.7 
Total current liabilities of discontinued operations6,096.5 
Long-term debt, less current portion482.2 
Operating lease liabilities248.2 
Other liabilities350.9 
Total non-current liabilities of discontinued operations1,081.3 
Total liabilities of discontinued operations$7,177.8 
On February 16, 2021, all assets and liabilities of Technip Energies were spun-off; therefore, as of December 31, 2021, there were no assets and liabilities classified as discontinued operations. During the acquisition date:
(In millions)  
Assets  
Cash $1,479.2
Accounts receivable 647.8
Costs and estimated earnings in excess of billings on uncompleted contracts 599.6
Inventory 764.8
Income taxes receivable 139.2
Other current assets 282.2
Property, plant and equipment 1,293.3
Intangible assets 1,390.3
Other long-term assets 167.3
Total identifiable assets acquired 6,763.7
Liabilities  
Short-term and current portion of long-term debt 319.5
Accounts payable, trade 386.0
Billings in excess of costs and estimated earnings on uncompleted contracts 454.0
Income taxes payable 92.1
Other current liabilities 524.3
Long-term debt, less current portion 1,444.2
Accrued pension and other post-retirement benefits, less current portion 195.5
Deferred income taxes 219.4
Other long-term liabilities 138.7
Total liabilities assumed 3,773.7
Net identifiable assets acquired 2,990.0
Goodwill 5,180.7
Net assets acquired $8,170.7

Segment Allocationfourth quarter of Goodwill - The final allocation of goodwill2021, we finalized the disposition process, which resulted in an immaterial adjustment to the reporting segments based on the final valuation is as follows:
(In millions)Allocated Goodwill
Subsea$2,527.7
Onshore/Offshore1,635.5
Surface Technologies1,017.5
Total$5,180.7

Goodwill is calculated as the excess of the consideration transferred over the net assets recognizedtransferred to Technip Energies in the statement of stockholders’ equity. As of December 31, 2021, we had $84.4 million and represents the expected revenue$72.2 million of accounts receivable and cost synergies of the combined company, which are further described above. Goodwill recognized as a result of the acquisition is not deductible for tax purposes.accounts payable, respectively, outstanding with Technip Energies.
Acquired Identifiable Intangible Assets - The identifiable intangible assets acquired include the following:
(In millions, except estimated useful lives)Fair Value 
Estimated
Useful Lives
Acquired technology$240.0
 10
Backlog175.0
 2
Customer relationships285.0
 10
Tradenames635.0
 20
Software55.3
 Various
Total identifiable intangible assets acquired$1,390.3


NOTE 3. BUSINESS COMBINATION AND OTHER TRANSACTIONS
FMC Technologies’ results2021
Magma Global Ltd.
In 2018, we entered into a collaboration agreement with Magma Global Ltd. (“Magma Global”) to develop a new generation of operations have been includedhybrid flexible pipe for use in our financial statements for periods subsequent to the consummation of the Merger on January 16, 2017. FMC Technologies contributed revenuestraditional and a net loss of $3,441.1 million and $251.2 million, respectively, for the period from January 17, 2017 through December 31, 2017.
new energy industries. As part of the ongoing reviewcollaboration, we purchased a minority ownership interest in Magma Global.
In October 2021, we entered into a transaction to purchase the remaining ownership interest in Magma Global for $64.0 million. The cash consideration will be paid to the shareholders of Magma Global in 3 annual installments. The first payment of $23.9 million was paid on October 12, 2021. Magma technology enables the manufacture of
74


Thermoplastic Composite Pipe (TCP) using Polyether Ether Ketone (PEEK) polymer, which is highly resistant to corrosive compounds, such as CO2.
With the step acquisition of the remaining outstanding shares of Magma Global and our resulting control of the company, we recorded a $36.7 million impairment during the third quarter of 2021 to adjust our equity method investment to its estimated fair market value. The impairment charge is included in income/loss from equity affiliates line in our consolidated statement of income.
As a result of the purchase price allocation of the remaining interest, we recognized $50.2 million of intangible assets consisting primarily of in-process research and development and trademarks, which are being amortized on a $19.7straight-line basis over 15 years. The fair value of the identifiable intangible assets has been estimated using an income approach.
TIOS
In accordance with the Share Purchase Agreement between Technip-Coflexip UK Holdings Limited (“TUK”) and Island Offshore Management AS (“Island Offshore”) that was executed on March 12, 2018, whereby TUK initially purchased 51% of the shares of TIOS AS (“TIOS”), a joint venture between TUK and Island Offshore, TUK acquired the remaining 49% interest in TIOS at a total price of $48.6 million adjustment to our deferred tax liability balanceduring the third quarter of 2021. As of December 31, 2020, we owned a 51% share in TIOS and the redeemable non-controlling interest was recorded during the first quarteras mezzanine equity at fair value of 2018 which increased Surface Technologies goodwill.$43.7 million. As of December 31, 2021 and 2020, TIOS was fully consolidated.
Pro Forma Impact of the Merger (unaudited) - The following unaudited supplemental pro forma results present consolidated information as if the Merger had been completed as of January 1, 2016. The pro forma results do not include any potential synergies, cost savings or other expected benefits of the Merger. Accordingly, the pro forma results should not be considered indicative of the results that would have occurred if the Merger had been consummated as of January 1, 2016, nor are they indicative of future results.
 Unaudited
 Year Ended December 31,
(In millions, except per share data)
2017
Pro Forma
Revenue$15,169.8
Net income attributable to TechnipFMC adjusted for dilutive effects$28.5
Diluted earnings per share0.06

Other Transactions2019
On December 30, 2019, we completed the acquisition of the remaining 50% interest in Technip Odebrecht PLSV CV (“TOP CV”). TOP CV was formed as a joint venture between Technip SA and Ocyan SA to provide pipeline installation ships to Petroleo Brasileiro SA (“Petrobras”) for their work in oil and gas fields offshore Brazil with results reported in our Subsea segment using the equity method of accounting. Subsequent to this transaction the investment became a fully consolidated entity. In connection with the acquisition, we acquired $391.0 million in assets, including two2 vessels valued at $335.2 million. In addition, we assumed $239.9 million of liabilities, including a $203.1 million term loan. The valuation of these assets and liabilities are preliminary and remain ongoing. As a result of the acquisition, we recorded a net loss of $0.9 million, themillion. The net resultsloss on acquisition was comprised of the impairment charge of $84.2$84.2 million and partially offset by a gain on bargain purchase gain of $83.3$83.3 million included within restructuring and other charges.
In February 2018, we signed an agreement with the Island Offshore Group to acquire a 51% stakecharges in Island Offshore’s wholly-owned subsidiary, Island Offshore Subsea AS. Island Offshore Subsea AS provides RLWI project management and engineering services for plug and abandonment (“P&A”), riserless coiled tubing, and well completion operations. In connection with the acquisition of the controlling interest, TechnipFMC and Island Offshore entered into a strategic cooperation agreement to deliver RLWI services on a worldwide basis, which also include TechnipFMC’s RLWI capabilities. Island Offshore Subsea AS has been rebranded to TIOS and is now the operating unit for TechnipFMC’s RLWI activities worldwide. The acquisition was completed on April 18, 2018 for total cash consideration of $42.4 million. As a result of the acquisition, we recorded a redeemable financial liability equal to the fair value of a written put option. Finally, we increased goodwill by $85.0 million.
On July 18, 2018, we entered into a share sale and purchase agreement with POC Holding Oy to sell 100% of the outstanding shares of Technip Offshore Finland Oy. The total gain before tax recognized in the third quarter of 2018 was $27.8 million.
Additional acquisitions, including purchased interests in equity method investments, during the year ended December 31, 2018 totaled $62.5 million in consideration paid.
NOTE 3. PLANNED SEPARATION TRANSACTION
On August 26, 2019, we announced that our Board of Directors had unanimously approved a plan to separate our Onshore/Offshore segment and loading systems business into an independent, publicly traded company (“Technip Energies”). The transaction is expected to be tax free to certain shareholders where permissible, including the U.S. We expect to complete the transaction in the second quarter of 2020, subject to general market conditions, regulatory approvals and final approval from our Board of Directors. Upon completion of the separation, the historical results of Technip Energies will be presented as discontinued operations as the separation represents a


strategic shift in operations with a major impact to our consolidated financial statements. We have incurred $72.1 millionstatement of separation costs associated with the planned transaction during the year ended December 31, 2019.income.

NOTE 4. NEW ACCOUNTING STANDARDS
Recently Adopted Accounting Standards under U.S. GAAP
Effective January 1, 2019, we adopted (1) Accounting Standards Update (“ASU”) No. “2016-02, Leases (Topic 842).”, (2) ASU 2018-01, “Leases (Topic 842): Land Easement Practical Expedient for Transition to Topic 842.” (3) ASU 2018-10, “Codification Improvements to Topic 842, Lease.”, (4)ASU 2018-20, “Narrow-scope Improvements for Lessors.”, (5) ASU 2018-11, “Leases (Topic 842): Targeted Improvements.”, (6) ASU No. 2019-01, “Leases (Topic 842) —Codification Improvements.”. These updates require lessees to recognize a right-of-use (“ROU”) asset and a lease liability for virtually all of their leases. See Note 5 to our consolidated financial statements of this Annual Report for more information.
Effective January 1, 2019, we adopted ASU No. 2017-12, “Targeted Improvements to Accounting for Hedging Activities.” This update improves the financial reporting of hedging relationships to better portray the economic results of an entity’s risk management activities in its financial statements and make certain targeted improvements to simplify the application of the hedge accounting guidance in current GAAP. The amendments in this update better align an entity's risk management activities and financial reporting for hedging relationships through changes to both the designation and measurement guidance for qualifying hedging relationships and presentation of hedge results. For cash flow and net investment hedges as of the adoption date, the guidance requires a modified retrospective approach. The amended presentation and disclosure guidance is required to be adopted prospectively. The adoption of this update did not have an impact on our consolidated financial statements.
Effective January 1, 2019, we adopted ASU No. 2018-02, “Income Statement-Reporting Comprehensive Income (Topic 220): Reclassification of Certain Tax Effects from Accumulated Other Comprehensive Income (AOCI).” This update provides an option to reclassify stranded tax effects within AOCI to retained earnings in each period in which the effect of the change in the U.S. federal corporate tax rate in the Tax Cuts and Jobs Act (or portion thereof) is recorded. The ASU requires financial statement disclosures that indicate a description of the accounting policy for releasing income tax effects from AOCI; whether there is an election to reclassify the stranded income tax effects from the Tax Cuts and Jobs Act and information about the other income tax effects are reclassified. These amendments affect any organization that is required to apply the provisions of Topic 220, Income Statement-Reporting Comprehensive Income, and has items of other comprehensive income for which the related tax effects are presented in other comprehensive income as required by GAAP. The adoption of this update did not have an impact on our consolidated financial statements.
Effective January 1, 2019, we adopted ASU No. 2018-07, “Compensation - Stock Compensation (Topic 718): Improvements to Nonemployee Share-Based Payment Accounting.” This update expands the scope of Topic 718 to include all share-based payment transactions for acquiring goods and services from nonemployees. The amendments in this update specify that Topic 718 applies to all share-based payment transactions in which the grantor acquires goods and services to be used or consumed in its own operations by issuing share-based payment awards. The amendments in this update also clarify that Topic 718 does not apply to share-based payments used to effectively provide (1) financing to the issuer or (2) awards granted in conjunction with selling goods or services to customers as part of a contract accounted for under ASC Topic 606. The adoption of this update did not have a material impact on our consolidated financial statements.
Recently Issued Accounting Standards under U.S. GAAP
In June 2016, the Financial Accounting Standard Board (“FASB”) issued ASU No. 2016-13, “Financial Instruments—Credit Losses (Topic 326): Measurement of Credit Losses on Financial Instruments.” This update introduces a new model for recognizing credit losses on financial instruments based on an estimate of current expected credit losses. The updated guidance applies to (1) loans, accounts receivable, trade receivables and other financial assets measured at amortized cost, (2) loan commitments and other off-balance sheet credit exposures, (iii) debt securities and other financial assets measured at fair value through other comprehensive income and (iv) beneficial interests in securitized financial assets. In May 2019, the FASB issued a new update ASU No.2019-05, that eases transition to the credit losses standard by providing the option to measure certain types of assets at fair value, allowing an option for preparers to irrevocably elect the fair value option for eligible financial assets measured at amortized cost basis on an instrument-by-instrument basis. In November 2019, the FASB issued ASU No. 2019-11, the amendments in this Update clarify or address stakeholders’ specific issues about certain aspects of this amendments and clarifies guidance around how to report expected recoveries. The amendments in this ASU are


effective for us on January 1, 2020 and are required to be adopted on a modified retrospective basis. Early adoption is not permitted. We do not anticipate a material impact to our consolidated financial statements as a result of the adoption of this ASU.
In November 2018, the FASB also issued ASU No. 2018-19, “Codification Improvements to Topic 326, Financial Instruments-Credit Losses.” The update amends the transition requirements and scope of the credit losses standard issued in 2016. This update clarifies that receivables arising from operating leases are not within the scope of the credit losses standard, but rather, should be accounted for in accordance with the leases standard. The amendments in this ASU are effective for us on January 1, 2020 and are required to be adopted on a modified retrospective basis. Early adoption is not permitted. We do not anticipate a material impact to our consolidated financial statements as a result of the adoption of this ASU.
In August 2018, the FASB issued ASU No. 2018-13, “Fair Value Measurement (Topic 820): Disclosure Framework—Changes to the Disclosure Requirements for Fair Value Measurement.” This update modifies the disclosure requirement on fair value measurements in Topic 820. The amendments in this ASU are effective for us January 1, 2020. Early adoption is permitted. The amendments on changes in unrealized gains and losses, the range and weighted average of significant unobservable inputs used to develop Level 3 fair value measurements, and the narrative description of measurement uncertainty should be applied prospectively. All other amendments should be applied retrospectively. The adoption of this update concerns presentation and disclosure only as it relates to our consolidated financial statements.
In August 2018, the FASB issued ASU No. 2018-14, “Compensation—Retirement Benefits—Defined Benefit Plans—General (Subtopic 715-20): Disclosure Framework—Changes to the Disclosure Requirements for Defined Benefit Plans.”This update amends ASC 715 to add, remove, and clarify disclosure requirements related to defined benefit pension and other post-retirement plans. The amendments inWe adopted this ASU are effective for usamendment as of January 1, 2021. Early adoption is permitted. The amendments in this update are required to be adopted retrospectively. We are currently evaluating the2021, which did not have a material impact of this ASU on our consolidated financial statements.
In August 2018, the FASB issued ASU No. 2018-15, “Intangibles—Goodwill and Other—Internal-Use Software (Subtopic 350-40): Customer’s Accounting for Implementation Costs Incurred in a Cloud Computing Arrangement That Is a Service Contract (a consensus of the FASB Emerging Issues Task Force).” This update requires that the implementation costs incurred in a cloud computing arrangement that is a service contract are deferred if they would be capitalized based on the requirements for capitalizing implementation costs incurred to develop or obtain internal-use software. The amendments in this ASU are effective for us January 1, 2020. Early adoption is permitted. The amendments in this update are required to be adopted either retrospectively or prospectively. We do not anticipate a material impact to our consolidated financial statements as a result of the adoption of this ASU.
In November 2018, the FASB issued ASU No. 2018-18, “Collaborative Arrangements (Topic 808) -Clarifying the Interaction between Topic 808 and Topic 606.” This update clarifies the interaction between the guidance for certain collaborative arrangements and the Revenue Recognition financial accounting and reporting standard. The amendments in this ASU are effective for us January 1, 2020. Early adoption is permitted. The amendments in this update are required to be adopted retrospectively to the date of initial application of Topic 606. An entity should recognize the cumulative effect of initially applying the amendments as an adjustment to the opening balance of retained earnings of the later of the earliest annual period presented and the annual period that includes the date of the entity’s initial application of Topic 606. We do not anticipate a material impact to our consolidated financial statements as a result of the adoption of this ASU.
In April 2019, the FASB issued ASU No. 2019-04, “Codification Improvements to Topic 326, Financial Instruments - Credit Losses, Topic 815, Derivatives and Hedging, and Topic 825, Financial Instruments.” The update clarifies and improves areas of guidance related to the recently issued standards including (1) ASU No. 2016-01, “Financial Instruments—Overall (Subtopic 825-10): Recognition and Measurement of Financial Assets and Liabilities.”, (2) ASU No. 2016-13, “Financial Instruments—Credit Losses (Topic 326): Measurement of Credit Losses on Financial Instruments.”, and (3) ASU No. 2017-12, “Derivatives and Hedging (Topic 815): Targeted Improvements to Accounting for Hedging Activities.” Early adoption is permitted. The amendments in this update to ASU No. 2016-01 and No. 2016-13 are required to be adopted on a modified retrospective basis. The amendments in this update to ASU No. 2017-12 are required to be adopted either retrospectively or prospectively. This new update will be effective on January 1, 2020. We do not anticipate a material impact to our consolidated financial statements as a result of the adoption of this ASU.


In November 2019 the FASB issued ASU No. 2019-10, to apply changes in philosophy to the effective dates for the following major updates (including amendments issued after the issuance of the original Update): ASU No. 2016-13, “Financial Instruments—Credit Losses (Topic 326)”,“Measurement of Credit Losses on Financial Instruments (Credit Losses)”, ASU No. 2017-12, “Derivatives and Hedging (Topic 815)”: Targeted Improvements to Accounting for Hedging Activities (Hedging)”, ASU No. 2016-02, “Leases (Topic 842) (Leases)”. We do not anticipate a material impact to our consolidated financial statements as a result of the adoption of this ASU.
In December 2019, the FASB issued ASU No. 2019-12, Income Taxes to Topic 740 - 740—Simplifying the Accounting for Income Taxes”. Taxes.”The amendments simplify the accounting for income taxes by removing certain exceptions to the general principles in Topic 740. This update also improveimproves and simplifysimplifies areas of generally accepted accounting principles (GAAP)GAAP for which cost and complexity can be reduced while maintaining or improving the usefulness of the information provided to users of financial statements. This update is effective for usWe adopted this amendment as of January 1, 2021, and early adoption is permitted. We are currently evaluating thewhich did not have a material impact of this ASU on our consolidated financial statements.

In January 2020, the FASB issued ASU No. 2020-01, "Investments —Equity“Investments—Equity Securities (Topic 321)",“Investments —Equity” “Investments—Equity Method and Joint Ventures (Topic 323),, and “Derivatives and Hedging (Topic 815) —Clarifying—Clarifying the Interactions between Topic 321, Topic 323, and Topic 815”815,”, and made targeted improvements to address certain aspects of accounting for financial instruments. This update clarifies that a company should consider observable transactions that require a company to either apply or discontinue the equity method of accounting underTopic 323, Investments—Equity Method and Joint Ventures, for the purposes of applying the measurement alternative in accordance with Topic 321 immediately before applying or upon discontinuing the equity method. The new ASU
75


also clarifies that, when determining the accounting for certain forward contracts and purchased options, a company should not consider whether upon settlement or exercise, if the underlying securities would be accounted for under the equity method or fair value option. This amendments is effective for us January 1, 2021 and early adoption is permitted.option upon settlement or exercise. We are currently evaluating the impact ofadopted this ASU on our consolidated financial statements.
NOTE 5. LEASES
In February 2016, the FASB issued ASU 2016-02, Leases (Topic 842). Lessees are required to recognize a ROU asset and a lease liability for all outstanding leases excluding short-term leases. The liability is equal to the present value of the remaining lease payments. The ROU asset is based on the liability, subject to certain adjustments (e.g., initial direct costs, payments made by the lessee prior to lease commencement and any lessor incentives). For income statement purposes, lessees are required to classify leases as either operating or finance leases. Operating leases result in straight-line expense while finance leases result in a front-loaded expense pattern. Lessor accounting is largely unchanged but has been updated to align with certain changes to the lessee model and the new revenue recognition standard.
Topic 842 was subsequently amended to provide practical expedient for transition and targeted improvements to the new lease standard. The FASB issued in March 2019, ASU 2019-01, “Leases (Topic 842): Codification Improvements” to clarify certain transition disclosure requirements. The Company adopted the new lease standardamendment as of January 1, 2019, using a modified retrospective transition method and applying the new standard to all leases through a cumulative-effect adjustment to beginning retained earnings in the period of adoption. In our first annual period after adoption, the year ending December 31, 2019, the comparative periods will not be restated and will be presented under legacy lease accounting guidance in effect for those periods, Topic 840.
The new standard provides a number of practical expedients specific to transition. We have elected the “package of practical expedients”,2021, which permits us not to reassess (1) whether any expired or existing arrangements are or contain leases, (2) the lease classification for any expired or existing leases, and (3) any initial direct costs for any existing leases as of the effective date.
The new standard also provides practical expedients for an entity’s ongoing accounting, including a practical expedient which allows lessees and lessors to elect to not separate lease and non-lease components. We have elected the practical expedient available for lessees to not separate lease and non-lease components for all asset classes other than vessels, which typically include significant non-lease components. We have elected the practical expedient available for lessors to not separate lease and non-lease components for vessels. The Company also elected not to recognize right of use assets and lease liabilities on the balance sheet for short-term leases, which have a lease term of 12 months or less and do not include an option to purchase the underlying asset that the Company is reasonably certain to exercise. Lease cost of short-term leases are recognized on a straight-line basis over the lease term and disclosed within our financial statements. We believe short-term lease commitments are not materially different than the short-term lease cost for the period.


Adoption of the new lease accounting guidance had a material impact on our consolidated balance sheets but did not have a material impact on our consolidated incomefinancial statements.

In October 2020, the FASB issued ASU No. 2020-10, “Codification Improvements.” The amendments in this update improve consistency by amending the accounting standards codification (the “Codification”) to include all disclosure guidance in the appropriate sections and clarify the application of various provisions in the Codification by amending and adding new headings, cross-referencing to other guidance, and refining or correcting terminology. We recognized on January 1, 2019, (1) a lease liability of approximately $1,189.6 million which represents the present value of the remaining lease payments, discounted using the Company’s applicable weighted average incremental borrowing rates, and (2) an ROU asset of approximately $1,115.5 million which represents the lease liability of $1,189.6 million adjusted for accrued and prepaid rent, lease incentives, and other balances. The impact was recorded as an adjustment to increase retained earnings by approximately $1.8 million.
In connection with the adoption of the new lease standard, we corrected our balance sheetadopted this update as of January 1, 2016 to include an additional $42.0 million2021, which did not have a material impact on our consolidated financial statements.

In August 2020, the FASB issued ASU No. 2020-06, “Debt – Debt with Conversion and Other Options (Subtopic 470-20) and Derivatives and Hedging – Contracts in Entity’s Own Equity (Subtopic 815 – 40).” This update simplifies the accounting for certain financial instruments with characteristics of liabilities of which $5.0 million and $37.0 million were other current liabilitiesequity, including convertible instruments and other liabilities, respectively, with a corresponding decreasecontracts in retained earnings to reflect additional rent expense which was not historically recorded prior to fiscal 2016. Accordingly, the revised other current liabilities, other liabilities and retained earnings balancesan entity’s own equity. We adopted this update as of January 1, 20162021, which did not have a material impact on our consolidated financial statements.

Recently Issued Accounting Standards under GAAP
In March 2020, the FASB issued ASU No. 2020-04, “Facilitation of the Effects of Reference Rate Reform on Financial Reporting (Topic 848).” In addition, in January 2021, FASB issued ASU No. 2021-01, “Reference Rate Reform (Topic 848)” which clarifies the scope of Topic 848. The amendments in these updates apply only to contracts, hedging relationships, and other transactions that reference the London interbank offered rate (“LIBOR”) or another reference rate expected to be discontinued because of reference rate reform. The expedients and exceptions provided by the amendments do not apply to contract modifications made and hedging relationships entered into or evaluated after December 31, 2022, except for hedging relationships existing as of December 31, 2022, that an entity has elected certain optional expedients for and that are retained through the end of the hedging relationship. The amendments in this update were $1,044.4 million, $131.3 million,issued as of March 12, 2020, effective through December 31, 2022. We do not anticipate the adoption of this update to have a material impact on our consolidated financial statements.
In October 2021, the FASB issued ASU No. 2021-08, “Business Combinations (Topic 805): Accounting for Contract Assets and $3,231.4 million, respectively. These historical errorsContract Liabilities from Contracts with Customers.” This ASU requires entities to apply Topic 606 to recognize and measure contract assets and contract liabilities in a business combination. The amendments are effective for public business entities for fiscal years, including interim periods within those fiscal years, beginning after December 15, 2022. The amendment is this update should be applied with early adoption permitted. We do not anticipate the adoption of this update to have a material to any prior interim or annualimpact on our consolidated financial statements.

We consider the applicability and impact of all ASUs. We assessed ASUs not listed above and determined that they either were not applicable or were not expected to have a material impact on our financial statements.

NOTE 5. LEASES
Lessee Arrangements
We lease real estate, including land, buildings and warehouses, machinery/equipment, vessels, vehicles, and various types of manufacturing and data processing equipment, from a lessee perspective. Leases of real estate generally provide for payment of property taxes, insurance, and repairs by us. Substantially all our leases are classified as operating leases.
We determine if an arrangement is a lease at inception by assessing whether an identified asset exists and if we have the right to control the use of the identified asset. Operating leases are included in Operating lease right-of-use assets, Operating lease liabilities (current), and Operating lease liabilities (non-current) onin our consolidated balance sheets. Right-of-use assets represent our right to use an underlying asset for the lease term and lease liabilities represent our obligation to make lease payments arising from the lease. Operating lease right-of-use assets and liabilities are recognized at the commencement date based on the present value of the remaining lease payments over the lease term. With the exception of rare cases in which the implicit rate is readily determinable, we use our incremental borrowing rate based on the information available at the commencement date in determining the present value of lease payments. The Operating lease right-of-use assets also includes any lease prepayments
76


made and excludes lease incentives we received from the lessor. Lease cost for lease payments is recognized on a straight-line basis over the lease term. Several of our leases provide for certain guarantees of residual value. We estimate and include in the determination of lease payments any amount probable of being owed under these residual value guarantees. At the date of adoption and December 31, 2019, we determined that there were no residual value guarantees which were probable of being owed. Our leases do not contain any material restrictive covenants.
Lease terms within our lessee arrangements may include options to extend/renew or terminate the lease and/or purchase the underlying asset when it is reasonably certain that we will exercise that option. The CompanyTechnipFMC applies a portfolio approach by asset class to determine lease term renewals. The leases within these portfolios are categorized by asset class and have initial lease terms that vary depending on the asset class. The renewal terms range from 60 days to 5 years for asset classes such as temporary residential housing, forklifts, vehicles, vessels, office and IT equipment, and tool rentals, and up to 15 years or more for commercial real estate. Short-term leases with an initial term of 12 months or less that do not include a purchase option are not recorded on the balance sheet. Lease costs for short-term leases are recognized on a straight-line basis over the lease term and amounts related to short-term leases are disclosed within our financial statements.
The CompanyTechnipFMC has variable lease payments, including adjustments to lease payments based on an index or rate (such as the Consumer Price Index), fair value adjustments to lease payments, and common area maintenance, real estate taxes, and insurance payments in triple-net real estate leases. Variable lease payments that depend on an index or a rate (such as the Consumer Price Index or a market interest rate) are included when measuring consideration within our lease arrangements using the payments’ base rate or index. Variable payments that do not depend on an index or rate are recognized in profit or lossthe consolidated income statements and are disclosed as ‘variable“variable lease cost’costs” in the period they are incurred.
We adopted the practical expedient to not separate lease and non-lease components for all asset classes except for vessels, which have significant non-lease components.


The CompanyTechnipFMC currently subleases certain of its leased real estate and vessels to third parties. It is expected that most subleases will be classified as operating leases by the sublessor under GAAP.
The following table is a summary of the Company’s components of net lease cost for the yearyears ended December 31, 2019:2021 and 2020:

 Year Ended
In millionsDecember 31, 2019
Operating lease cost including variable costs$362.4
Short-term lease costs20.8
Less: sublease income8.9
Net lease cost$374.3

Year Ended December 31,
(In millions)20212020
Operating lease costs including variable costs$175.9 $195.6 
Short-term lease costs5.2 11.0 
Less: sublease income2.4 2.8 
Net lease cost$178.7 $203.8 

Supplemental cash flow information related to leases for the yearyears ended December 31, 20192021 and 2020 is as follows:

 Year Ended
In millionsDecember 31, 2019
Cash paid for amounts included in the measurement of lease liabilities
Operating cash flows from operating leases$384.7
  
Right-of-use assets obtained in exchange for lease liabilities
Operating leases$125.4

Year Ended December 31,
(In millions)20212020
Cash paid for amounts included in the measurement of lease liabilities
Operating cash flows from operating leases$176.5 $206.5 
Right-of-use assets obtained in exchange for lease liabilities
Operating leases$114.9 $421.3 
Finance leases$24.6 $26.9 

Supplemental balance sheet information related to leases as of December 31, 20192021 and 2020 is as follows:

(In millions, except lease term and discount rate)December 31, 2019
Weighted average remaining lease term
Operating leases7.5 years
Weighted average discount rate
Operating leases4.4%

77


The following table is a summary
December 31,
(In millions, except lease term and discount rate)20212020
Weighted average remaining lease term
Operating leases13.3 years13.6 years
Finance leases1.1 years0.6 years
Weighted average discount rate
Operating leases5.86 %5.35 %
Finance leases1.2 %2.1 %

Maturities of the maturity ofoperating and finance lease liabilities under operating leases as of December 31, 2019:2021 are as follows:

(in millions)
Operating Leases 
2020$305.3
2021184.6
2022128.0
2023101.9
202489.7
Thereafter330.4
Total lease payments1,139.9
Less: Imputed interest (a)
183.1
Total lease liabilities (b)
$956.8


(In millions)Maturity of Operating Lease LiabilitiesMaturity of Finance Lease Liabilities
2022$150.2 $1.0 
2023108.3 103.0 
2024102.3 — 
202583.1 — 
202674.7 — 
Thereafter675.9 — 
Total lease payments1,194.5 104.0 
Less: Imputed interest (a)
421.5 52.2 
Total lease liabilities (b)
$773.0 $51.8 
Note: For leases commencingthat commenced prior to 2019, minimum lease payments exclude payments to landlords for real estate taxes and common area maintenance.
(a)Calculated using the interest rate for each lease.
(b)Includes the current portion of 275.1 million for operating leases.
At(a)Calculated using the interest rate for each lease.
(b)Includes the current portion of $126.9 million.
In December 2020, TechnipFMC sold its leased office building at Gremp Campus in Houston, Texas on behalf of the existing lessor to Oak Street Real Estate Capital, LLC (“New Lessor”). TechnipFMC also sold the underlying land at Gremp Campus, which the Company owned, to the New Lessor. TechnipFMC concurrently executed a new lease agreement for both the land and the office building (collectively, “Gremp Campus Properties”) with New Lessor.
The new lease agreement of Gremp Campus Properties commenced on December 11, 2020 and the initial term ends on December 31, 2018, future minimum rental payments under noncancellable operating leases under ASC Topic 840 were:
(In millions) 
2019$329.8
2020286.1
2021192.3
2022123.8
2023102.1
Thereafter485.6
Total lease payment1,519.7
Less: income from sub-leases25.6
Net minimum operating lease payments$1,494.1

As2042. TechnipFMC paid net cash of December 31, 2019, we have an additional operating$1.8 million in connection with the new lease for our future office building in Paris, France, that has not yet commenced for 236.2 million. This operating lease will commence in fiscal year 2021 withagreement and recognized a lease termloss of 10 years.$3.1 million from derecognition of the existing lease. There was no gain or loss from the sale of the land at Gremp Campus.
Lessor Arrangements
We lease real estate including land, buildings and warehouses, machinery/equipment, and vessels from a lessor perspective. We determine if an arrangement is a lease at inception by assessing whether an identified asset exists and if the customer has the right to control the use of the identified asset. We use our implicit rate for our lessor arrangements. We have elected the practical expedient available for lessors to not separate lease and non-lease components for vessels. If the non-lease component is predominant in our contracts, we account for the contracts under the revenue recognition guidance in ASC 606.ASU 2014-09, “Revenue from Contracts with Customers” (Topic 606). If the lease component is predominant in our contracts, we account for the contracts under the lease guidance in ASC Topic842. We estimate the amount we expect to derive from the underlying asset following the end of the lease term based on remaining economic life. Our lessor arrangements generally do not include any residual value guarantees. We recognize lessee payments of lessor costs such as taxes and insurance on a net basis when the lessee pays those costs directly to a third party or when the amount paid by the lessee is not readily determinable.
The following table is a summary of the Company’s components ofOur operating lease revenue, including variable revenue, was $158.4 million and $142.0 million for the yearyears ended December 31, 2019:


2021 and 2020, respectively. During the next five years, we expect to receive $19.3 million in
 Year Ended
(In millions)December 31, 2019
Operating lease revenue including variable revenue$266.5
78


The following table is a summary of the maturity analysis of thetotal undiscounted cash flows, of which $18.3 million is expected to be received on an annual basis for each of the first five years,in 2022 and a total of the amounts for the remaining years:$1.0 million is expected to be received in 2023.


(in millions)Operating Leases
2020$29.4
202117.5
202214.3
20231.0
2024
Thereafter
Total undiscounted cash flows$62.2


NOTE 6. REVENUE
The majority of our revenue is from long-term contracts associated with designing and manufacturing products and systems and providing services to customers involved in exploration and production of crude oil and natural gas. On January 1, 2018, we adopted ASC Topic 606 of GAAP using the modified retrospective method applied to those contracts that were not completed as of January 1, 2018 resulting in a $91.5 million reduction to retained earnings. Results for reporting periods beginning after January 1, 2018 are presented under ASC Topic 606, while prior period amounts are not adjusted and continue to be reported in accordance with our historic accounting under Topic 605.
Significant Revenue Recognition Criteria Explained
Allocation of transaction price to performance obligations - A contract’s transaction price is allocated to each distinct performance obligation and recognized as revenue, when, or as, the performance obligation is satisfied. To determine the proper revenue recognition method, we evaluate whether two or more contracts should be combined and accounted for as one single contract and whether the combined or single contract should be accounted for as more than one performance obligation. This evaluation requires significant judgment; some of our contracts have a single performance obligation as the promise to transfer the individual goods or services is not separately identifiable from other promises in the contracts and, therefore, not distinct.
Variable consideration - Due to the nature of the work required to be performed on many of our performance obligations, the estimation of total revenue and cost at completion is complex, subject to many variables and requires significant judgment. It is common for our long-term contracts to contain variable considerations that can either increase or decrease the transaction price. Variability in the transaction price arises primarily due to liquidated damages. The Company considers itsWe consider our experience with similar transactions and expectations regarding the contract in estimating the amount of variable consideration to which itwe will be entitled, and determining whether the estimated variable consideration should be constrained. We include estimated amounts in the transaction price to the extent it is probable that a significant reversal of cumulative revenue recognized will not occur when the uncertainty associated with the variable consideration is resolved. Our estimates of variable consideration are based largely on an assessment of our anticipated performance and all information (historical, current and forecasted) that is reasonably available to us.
Payment terms - Progress billings are generally issued upon completion of certain phases of the work as stipulated in the contract. Payment terms may either be fixed, lump-sum or driven by time and materials (e.g., daily or hourly rates, plus materials). Because typically the customer retains a small portion of the contract price until completion of the contract, our contracts generally result in revenue recognized in excess of billings which we present as contract assets on the balance sheet. Amounts billed and due from our customers are classified as receivables onin the consolidated balance sheet.sheets. The portion of the payments retained by the customer until final contract settlement is not considered a significant financing component because the intent is to protect the customer. For some contracts, we may be entitled to receive an advance payment. We recognize a liability for these advance payments in excess of revenue recognized and present it as contract liabilities onin the consolidated balance sheet.sheets. The advance payment typically is not considered a significant financing component because it is used to meet working capital demands that can be higher in the early stages of a contract and to protect us from the other party failing to adequately complete some or all of its obligations under the contract.


Warranty - Certain contracts include an assurance-type warranty clause, typically between 18 to 36 months, to guarantee that the products comply with agreed specifications. A service-type warranty may also be provided to the customer; in such a case, management allocates a portion of the transaction price to the warranty based on the estimated stand-alone selling price of the service-type warranty.
Revenue recognized over time - Our performance obligations are satisfied over time as work progresses or at a point in time. Revenue from products and services transferred to customers over time accounted for approximately 81.7%68%, 72% and 68% of our revenue for the yearyears ended December 31, 2021, 2020 and 2019, respectively. Typically, revenue is recognized over time using an input measure (e.g., costs incurred to date relative to total estimated costs at completion) to measure progress.
79


Cost-to-cost method - For our long-term contracts, because of control transferring over time, revenue is recognized based on the extent of progress towards completion of the performance obligation. Upon adoption of the new standard weWe generally use the cost-to-cost measure of progress for our contracts because it best depicts the transfer of control to the customer which occurs as we incur costs on our contracts. Under the cost-to-cost measure of progress, the extent of progress towards completion is measured based on the ratio of costs incurred to date to the total estimated costs at completion of the performance obligation. Revenues, including estimated fees or profits, are recorded proportionally as costs are incurred. Any expected losses on construction-type contracts in progress are charged to earnings, in total, in the period the losses are identified.
Right to invoice practical expedient - The right-to-invoice practical expedient can be applied to a performance obligation satisfied over time if we have a right to invoice the customer for an amount that corresponds directly with the value transferred to the customer for our performance completed to date. When this practical expedient is used, we do not estimate variable consideration at the inception of the contract to determine the transaction price or for disclosure purposes. We have contracts which have payment terms dictated by daily or hourly rates where some contracts may have mixed pricing terms which include a fixed fee portion. For contracts in which we charge the customer a fixed rate based on the time or materials spent during the project that correspond to the value transferred to the customer, we recognize revenue in the amount to which we have the right to invoice.
Contract modifications - Contracts are often modified to account for changes in contract specifications and requirements. We consider contract modifications to exist when the modification either creates new, or changes the existing, enforceable rights and obligations. Most of our contract modifications are for goods or services that are not distinct from the existing contract due to the significant integration service provided in the context of the contract and are accounted for as if they were part of that existing contract. The effect of a contract modification on the transaction price and our measure of progress for the performance obligation to which it relates is recognized as an adjustment to revenue (either as an increase in or a reduction of revenue) on a cumulative catch-up basis.
Revenue Recognition by Segment
The following is a description of principal activities separated by reportable segments from which the CompanyTechnipFMC generates its revenue. See Note 7 for more detailed information about reportable segments.
a.Subsea
Subsea
Our Subsea segment manufactures and designs products and systems, performs engineering, procurement and project management and provides services used by oil and gas companies involved in offshore exploration and production of crude oil and natural gas. Systems and services may be sold separately or as combined integrated systems and services offered within one contract. Many of the systems and products the CompanyTechnipFMC supplies for subsea applications are highly engineered to meet the unique demands of our customers’ field properties and are typically ordered one to two years prior to installation. We often receive advance payments and progress billings from our customers in order to fund initial development and working capital requirements.
Under Subsea engineering, procurement, construction and installation contracts, revenue is principally generated from long-term contracts with customers. We have determined these contracts generally have one performance obligation as the delivered product is highly customized to customer and field specifications. We generally recognize revenue over time for such contracts as the customized products do not have an alternative use for the CompanyTechnipFMC and we have an enforceable right to payment plus a reasonable profit for performance completed to date.


Our Subsea segment also performs an array of subsea services including (i) installation services, (ii) asset management services (iii) product optimization, (iv) inspection, maintenance and repair services, and (v) well access and intervention services, where revenue is generally earned through the execution of either installation-type or maintenance-type contracts. For either contract-type, management has determined that the performance of the service generally represents one single performance obligation. We have determined that revenue from these contracts is recognized over time as the customer simultaneously receives and consumes the benefit of the services.
b.Onshore/Offshore
Our Onshore/Offshore segment designs and builds onshore facilities related to the production, treatment, transformation and transportation of hydrocarbons and renewable feedstock; and designs, manufactures and installs fixed and floating platforms for the offshore production and processing of oil and gas reserves.Surface Technologies
Our onshore business combines the design, engineering, procurement, construction and project management of the entire range of onshore facilities. Our onshore activity covers all types of onshore facilities related to the production, treatment and transportation of oil and gas, as well as transformation with petrochemicals such as ethylene, polymers and fertilizers. Some of the onshore activities include the development of onshore fields, refining, natural gas treatment and liquefaction, and design and construction of hydrogen and synthesis gas production units.
Many of these contracts provide a combination of engineering, procurement, construction, project management and installation services, which may last several years. We have determined that contracts of this nature have generally one performance obligation. In these contracts, the final product is highly customized to the specifications of the field and the customer’s requirements. Therefore, the customer obtains control of the asset over time, and thus revenue is recognized over time.
Our offshore business combines the design, engineering, procurement, construction and project management within the entire range of fixed and floating offshore oil and gas facilities, many of which were the first of their kind, including the development of floating liquefied natural gas (“FLNG”) facilities. Similar to onshore contracts, contracts grouped under this segment provide a combination of services, which may last several years.
We have determined that contracts of this nature have one performance obligation. In these contracts, the final product is highly customized to the specifications of the field and the customer’s requirements. We have determined that the customer obtains control of the asset over time, and thus revenue is recognized over time as the customized products do not have an alternative use for us and we have an enforceable right to payment plus reasonable profit for performance completed to date.
c.Surface Technologies
Our Surface Technologies segment designs, manufactures and supplies technologically advanced wellhead systems and high pressure valves and pumps used in stimulation activities for oilfield service companies and provides installation, flowback and other services for exploration and production companies.
80


We provide a full range of drilling, completion and production wellhead systems for both standard and custom-engineered applications. Under pressure control product contracts, we design and manufacture flowline products, under the Weco®/Chiksan® trademarks, articulating frac arm manifold trailers, well service pumps, compact valves and reciprocating pumps used in well completion and stimulation activities by major oilfield service companies. Performance obligations within these systems are satisfied either through delivery of a standardized product or equipment or the delivery of a customized product or equipment.
For contracts with a standardized product or equipment performance obligation, management has determined that because there is limited customization to products sold within such contracts and the asset delivered can be resold to another customer, revenue should be recognized as of a point in time, upon transfer of control to the customer and after the customer acceptance provisions have been met.
For contracts with a customized product or equipment performance obligation, the revenue is recognized over time, as the manufacturing of our product does not create an asset with an alternative use for us.us and we have an enforceable right to payment plus a reasonable profit for performance completed to date.
This segment also designs, manufactures and services measurement products globally. Contract-types include standard product or equipment and maintenance-type services where we have determined that each contract under this product line represents one performance obligation.


Revenue from standard measurement equipment contracts is recognized at a point in time, while maintenance-type contracts are typically priced at a daily or hourly rate. We have determined that revenue for these contracts is recognized over time because the customer simultaneously receives and consumes the benefit of the services.
Disaggregation of Revenue
The Company disaggregatesWe disaggregate revenue by geographic location and contract types. The tables also include a reconciliation of the disaggregated revenue with the reportable segments.
type. The following tables present products and servicestable presents total revenue by geography for each reportable segment for the yearyears ended December 31, 20192021, 2020 and 2018:
2019:
Reportable SegmentsReportable Segments
Year EndedYear Ended December 31,
December 31, 2019 December 31, 2018202120202019
(In millions)Subsea Onshore/
Offshore
 Surface Technologies Subsea Onshore/
Offshore
 Surface Technologies(In millions)SubseaSurface TechnologiesSubseaSurface TechnologiesSubseaSurface Technologies
Europe, Russia, Central Asia$1,745.2
 $2,813.1
 $236.7
 $1,528.1
 $3,506.1
 $227.7
America1,770.0
 766.2
 732.1
 1,721.5
 365.1
 865.5
Europe, Central AsiaEurope, Central Asia$1,404.4 $191.5 $1,664.1 $192.7 1,690.2 160.1 
North AmericaNorth America753.6 372.7 899.7 367.9 660.8 751.9 
Latin AmericaLatin America1,157.7 86.7 1,042.4 76.6 1,139.5 108.6 
Asia Pacific659.9
 1,152.5
 189.3
 532.9
 1,236.1
 123.2
Asia Pacific927.4 104.2 772.1 131.0 673.3 195.4 
Africa824.8
 526.0
 61.1
 758.1
 252.7
 57.9
Africa1,057.3 44.0 908.6 46.9 836.4 62.7 
Middle East407.1
 1,011.0
 247.6
 181.2
 760.7
 213.4
Middle East28.7 275.3 184.5 244.1 419.3 252.0 
Total products and services revenue$5,407.0
 $6,268.8
 $1,466.8
 $4,721.8
 $6,120.7
 $1,487.7
Total revenueTotal revenue$5,329.1 $1,074.4 $5,471.4 $1,059.2 $5,419.5 $1,530.7 
The following tables representtable represents revenue by contract type for each reportable segment for the yearyears ended December 31, 20192021, 2020 and 2018:2019:
Reportable Segments
Year Ended December 31,
202120202019
(In millions)SubseaSurface TechnologiesSubseaSurface TechnologiesSubseaSurface Technologies
Services$3,282.0 $158.7 $3,121.1 $150.2 $3,141.0 $271.0 
Products2,002.5 801.9 2,295.4 821.9 2,162.5 1,109.2 
Lease(a)
44.6 113.8 54.9 87.1 116.0 150.5 
Total revenue$5,329.1 $1,074.4 $5,471.4 $1,059.2 $5,419.5 $1,530.7 
(a)Represents revenue not subject to ASC Topic 606.
81

 Reportable Segments
 Year Ended
 December 31, 2019 December 31, 2018
(In millions)Subsea Onshore/
Offshore
 Surface Technologies 
Subsea(b)
 Onshore/
Offshore
 Surface Technologies
Services$3,244.5
 $6,268.8
 $276.4
 $2,687.1
 $6,120.7
 $249.8
Products2,162.5
 
 1,190.4
 2,034.7
 
 1,237.9
Total products and services revenue5,407.0
 6,268.8
 1,466.8
 4,721.8
 6,120.7
 1,487.7
Lease and other(a)
116.0
 
 150.5
 118.2
 
 104.5
Total revenue$5,523.0
 $6,268.8
 $1,617.3
 $4,840.0
 $6,120.7
 $1,592.2

(a)Represents revenue not subject to ASC Topic 606.
(b)We revised the consolidated statement of operations to correct the classification of service revenue and product revenue in the amount of $707.4 million for the year ended December 31, 2018. See Note 1 to our consolidated financial statements included in Part II, Item 8 of this Annual Report on Form 10-K for additional disclosure related to the revision.
Contract Balances
The timing of revenue recognition, billings and cash collections results in billed accounts receivable, costs and estimated earnings in excess of billings on uncompleted contracts (contract assets), and billings in excess of costs and estimated earnings on uncompleted contracts (contract liabilities) onin the consolidated balance sheets. Any expected contract losses are recorded in the period in which they become probable.
Contract Assets - Contract Assets previously disclosed as costs and estimated earnings in excess of billings on uncompleted contracts,include unbilled amounts typically resulting from sales under long-term contracts when revenue is recognized over time and revenue recognized exceeds the amount billed to the customer, and right to payment is not just subject to the passage of time. Amounts may not exceed their net realizable value. Costs and estimated earnings in excess of billings on uncompleted contracts are generally classified as current.
Contract Liabilities - We sometimes receive advances or deposits from our customers, before revenue is recognized, resulting in contract liabilities.


The following table provides information about net contract assets (liabilities) as of December 31, 20192021 and December 31, 2018:2020:
(In millions)December 31,
2019
 December 31,
2018
 $ change % change
Contract assets$1,520.0
 $1,295.0
 $225.0
 17.4
Contract (liabilities)(4,585.1) (4,085.1) (500.0) (12.2)
Net contract assets (liabilities)$(3,065.1) $(2,790.1) $(275.0) (9.9)

December 31,
(In millions)20212020$ change% change
Contract assets$966.0 $886.8 $79.2 8.9 
Contract (liabilities)(1,012.9)(1,046.8)33.9 3.2 
Net contract (liabilities)$(46.9)$(160.0)$113.1 70.7 
The increase in our contract assets from December 31, 20182020 to December 31, 20192021 was primarily due to the timing of project milestones.
The remaining increasedecrease in our contract liabilities was primarily due to additional cashcompletion of performance obligations for contracts, for which consideration was received excluding amounts recognized as revenuein advance of the work performed during the period.
In order to determine revenue recognized in the period from contract liabilities, we first allocate revenue to the individual contract liability balance outstanding at the beginning of the period until the revenue exceeds that balance. Any subsequent revenue we recognize increases contract asset balance. Revenue recognized for the yearyears ended December 31, 20192021 and 2020 that were included in the contract liabilities balance atas of December 31, 20182020 and 2019 was $2,414.0 million. Revenue recognized for the year ended December 31, 2018 that were included in the contract liabilities balance at December 31, 2017 was $2,814.6 million.$305.3 million and $484.3 million, respectively.
In addition, net revenue recognized for the yearyears ended December 31, 20192021 and 20182020 from our performance obligations satisfied in previous periods hashad favorable impact(unfavorable) impacts of $1,176.5$25.9 million and $596.9$(21.7) million, respectively. This primarily relates to the changes in the estimate of the stage of completion that impacted revenue.
Transaction Price Allocated to the Remaining Unsatisfied Performance Obligations
Remaining unsatisfied performance obligations (“RUPO” or “order backlog”) represent the transaction price for products and services for which we have a material right, but work has not been performed. Transaction price of the order backlog includes the base transaction price, variable consideration and changes in transaction price. The order backlog table does not include contracts for which we recognize revenue at the amount to which we have the right to invoice for services performed. The transaction price of order backlog related to unfilled, confirmed customer orders is estimated at each reporting date. As of December 31, 2019,2021, the aggregate amount of the transaction price allocated to order backlog was $24,251.1$7,657.7 million. The CompanyTechnipFMC expects to recognize revenue on approximately 47.4%49.0% of the order backlog through 20202022 and 52.6%51.0% thereafter.
The following table details the order backlog for each business segment as of December 31, 2019:2021:
(In millions)2020 2021 Thereafter(In millions)20222023Thereafter
Subsea$4,506.8
 $2,472.4
 $1,500.6
Subsea$3,372.8 $2,227.5 $932.7 
Onshore/Offshore6,581.3
 5,127.8
 3,589.0
Surface Technologies411.7
 61.5
 
Surface Technologies376.8 95.2 652.7 
Total remaining unsatisfied performance obligations$11,499.8

$7,661.7
 $5,089.6
Total remaining unsatisfied performance obligations$3,749.6 $2,322.7 $1,585.4 
82


NOTE 7. BUSINESS SEGMENTS
Management’s determination of our reporting segments was made on the basis of our strategic priorities within each segment and the differences in the products and services we provide, which corresponds to the manner in which our Chair and Chief Executive Officer, as our chief operating decision maker, reviews and evaluates operating performance to make decisions about resources to be allocated to the segment.
Upon completion of the Merger, we reorganized our reporting structure and aligned our segments and the underlying businesses to execute the strategy of TechnipFMC. As a result, we report the results of operations in the following We now operate under 2 reportable segments: Subsea Onshore/Offshore and Surface Technologies.

Subsea - designs and manufactures products and systems, performs engineering, procurement and project management, and provides services used by oil and gas companies involved in offshore exploration and production of crude oil and natural gas.

Our reportable segments are:
Subsea - manufactures and designs products and systems, performs engineering, procurement and project management and provides services used by oil and gas companies involved in offshore exploration and production of crude oil and natural gas.
Onshore/Offshore - designs and builds onshore facilities related to the production, treatment, transformation and transportation of hydrocarbons; and designs, manufactures and installs fixed and floating platforms for the production and processing of oil and gas reserves.
Surface Technologies - designs and manufactures systems and provides services used by oil and gas companies involved in land and shallow water exploration and production of crude oil and natural gas; designs, manufactures and supplies technologically advanced high pressureSurface Technologies - designs and manufactures products and systems and provides services used by oil and gas companies involved in land and shallow water exploration and production of crude oil and natural gas; designs, manufactures, and supplies technologically advanced high-pressure valves and fittings for oilfield service companies; and also provides flowback and well testing services.
Segment operating profit (loss) is defined as total segment revenue less segment operating expenses. Income (loss) from equity method investments is included in computing segment operating profit. Refer to Note 12 for additional information. The following items have been excluded in computing segment operating profit:profit (loss): corporate staff expense, foreign exchange gains (losses), income from investment in Technip Energies, net interest income (expense) associated with corporate debt facilities and income taxes, and other revenue and other expense, net.taxes.
Information by business segment
Segment revenue and segment operating profit (loss) were as follows:
 Year Ended December 31,
(In millions)202120202019
Segment revenue
Subsea$5,329.1 $5,471.4 $5,419.5 
Surface Technologies1,074.4 1,059.2 1,530.7 
Total revenue$6,403.5 $6,530.6 $6,950.2 
Segment operating profit (loss)
Subsea$141.4 $(2,815.5)$(1,442.7)
Surface Technologies42.0 (429.3)(662.7)
Total segment operating profit (loss)183.4 (3,244.8)(2,105.4)
Corporate items
Merger transaction and integration costs— — (14.2)
Legal expenses— — (33.0)
Other corporate expenses (a)
(118.1)(131.9)(191.7)
Net interest expense(143.3)(81.8)(91.3)
Loss on early extinguishment of debt(61.9)— — 
Income from investment in Technip Energies322.2 — — 
Foreign exchange gains (losses)15.8 (40.2)(135.5)
Total corporate items14.7 (253.9)(465.7)
Income (loss) before income taxes(b)
$198.1 $(3,498.7)$(2,571.1)
(a)
 Year Ended December 31,
(In millions)2019 2018 2017
Segment revenue     
Subsea$5,523.0
 $4,840.0
 $5,877.4
Onshore/Offshore6,268.8
 6,120.7
 7,904.5
Surface Technologies1,617.3
 1,592.2
 1,274.6
Other revenue and intercompany eliminations
 
 0.4
Total revenue$13,409.1
 $12,552.9
 $15,056.9
      
Segment operating profit (loss)     
Subsea$(1,447.7) $(1,529.5) $460.5
Onshore/Offshore959.6
 824.0
 810.9
Surface Technologies(656.1) 172.8
 82.7
Total segment operating profit (loss)(1,144.2) (532.7) 1,354.1
      
Corporate items     
Corporate expense (a)
(540.3) (594.5) (359.2)
Interest income116.5
 121.4
 140.8
Interest expense(567.8) (482.3) (456.0)
Total corporate items(991.6) (955.4) (674.4)
Income (loss) before income taxes (b)
$(2,135.8) $(1,488.1) $679.7
Other corporate expenses primarily include corporate staff expenses, share-based compensation expenses, certain long-lived assets impairments, restructuring and other expenses and other employee benefits.
(a)Corporate expense primarily includes corporate staff expenses, legal reserve, stock-based compensation expenses, other employee benefits, certain foreign exchange gains and losses, and merger transaction and integration expenses and separation expenses.
(b)Includes amounts attributable to noncontrolling interests.
During the years ended December 31, 2019, 2018 and 2017, revenue from JSC Yamal LNG exceeded 10% of our consolidated revenue.(b)Includes amounts attributable to non-controlling interests.

83


Segment assets were as follows:
December 31, December 31,
(In millions)2019 2018(In millions)20212020
Segment assets   Segment assets
Subsea$10,824.2
 $11,037.8
Subsea$6,532.5 $6,796.6 
Onshore/Offshore4,448.8
 4,355.2
Surface Technologies2,246.4
 2,825.6
Surface Technologies1,420.0 1,758.3 
Intercompany eliminations(33.9) (26.4)
Total segment assets17,485.5
 18,192.2
Total segment assets7,952.5 8,554.9 
Corporate (a)
6,033.3
 6,592.3
Corporate (a)
2,067.6 2,129.1 
Assets from discontinued operationsAssets from discontinued operations— 9,008.6 
Total assets$23,518.8
 $24,784.5
Total assets$10,020.1 $19,692.6 
(a)Corporate includes cash, investment in Technip Energies, LIFO adjustments, deferred income tax balances, property, plant and equipment and intercompany eliminations not associated with a specific segment, pension assets and the fair value of derivative financial instruments.
Other business segment information is as follows:
Capital ExpendituresDepreciation and
Amortization
Research and
Development Expense
 Year Ended December 31,Year Ended December 31,Year Ended December 31,
(In millions)202120202019202120202019202120202019
Subsea$149.4 $213.6 $287.5 $317.2 $324.9 $345.0 $73.2 $66.5 $134.2 
Surface Technologies36.8 38.5 96.0 64.8 70.1 107.1 5.2 8.8 15.3 
Corporate5.5 4.0 29.2 3.4 17.1 15.6 — — — 
Total$191.7 $256.1 $412.7 $385.4 $412.1 $467.7 $78.4 $75.3 $149.5 

(a)Corporate includes cash, LIFO adjustments, deferred income tax balances, property, plant and equipment not associated with a specific segment, pension assets and the fair value of derivative financial instruments.
Geographic segment informationInformation by geography
Geographic segment sales wereRevenue by geography was identified based on the country where our products and services were delivered.delivered, and is as follows:
Year Ended December 31,
(In millions)202120202019
Revenue
United States$1,137.2 $1,320.1 $1,458.6 
Norway979.9 1,216.6 1,352.6 
Brazil767.8 600.6 1,086.2 
United Kingdom542.5 489.0 535.8 
Mozambique472.0 320.4 80.0 
Australia419.8 122.5 133.4 
Angola406.3 482.8 498.1 
Guyana314.7 330.1 7.2 
Indonesia224.9 280.0 262.6 
Singapore216.3 219.9 190.5 
Malaysia206.9 190.0 197.2 
India109.8 26.8 — 
Trinidad78.1 106.3 42.8 
Israel26.8 179.3 319.6 
All other countries500.5 646.2 785.6 
Total revenue$6,403.5 $6,530.6 $6,950.2 

84


(In millions)Year Ended December 31,
Revenue:2019 2018 2017
Russia$2,378.0

$2,773.3
 $4,894.2
USA1,931.2

1,275.8
 1,534.7
Norway1,371.1

1,202.6
 971.2
Brazil1,099.7

1,478.7
 911.1
Israel757.0

243.8
 6.9
United Kingdom540.8

442.1
 465.9
India518.0

214.0
 135.2
Angola447.8

385.7
 1,016.2
Australia372.8

926.6
 953.9
United Arab Emirates327.2

460.3
 308.5
Malaysia283.8

362.3
 374.8
China272.9

112.3
 104.7
Indonesia237.6

130.7
 295.4
All other countries2,871.2

2,544.7
 3,084.2
Total revenue$13,409.1

$12,552.9
 $15,056.9
Geographic segment long-livedLong-lived assets by geography represent property, plant and equipment, net.net, and are as follows:
December 31, December 31,
(In millions)2019 2018(In millions)20212020
Long-lived assets   Long-lived assets
United Kingdom$957.1
 $925.6
United Kingdom$882.9 $928.8 
NetherlandsNetherlands414.7 417.6 
United States558.1
 589.9
United States383.4 439.1 
Netherlands493.0
 360.5
Norway333.0
 311.4
Norway271.9 312.1 
Brazil313.2
 325.8
Brazil265.5 259.9 
All other countries507.6
 746.6
All other countries378.8 398.7 
Total long-lived assets$3,162.0
 $3,259.8
Total long-lived assets$2,597.2 $2,756.2 

Other business segment information


 Capital Expenditures 
Depreciation and
Amortization
 
Research and
Development Expense
 Year Ended December 31, Year Ended December 31, Year Ended December 31,
(In millions)2019 2018 2017 2019 2018 2017 2019 2018 2017
Subsea$287.7
 $223.2
 $179.1
 $345.6
 $440.4
 $507.2
 $134.4
 $145.2
 $169.2
Onshore/Offshore22.6
 7.6
 16.2
 38.7
 38.2
 41.1
 13.2
 29.7
 31.4
Surface Technologies96.6
 111.9
 35.4
 107.9
 66.6
 63.6
 15.3
 14.3
 12.3
Corporate47.5
 25.4
 25.0
 17.4
 5.2
 2.8


Total$454.4
 $368.1
 $255.7
 $509.6
 $550.4
 $614.7
 $162.9
 $189.2
 $212.9


NOTE 8. EARNINGS (LOSS) PER SHARE
A reconciliation of the number of shares used for the basic and diluted earnings (loss) per share calculation was as follows:
Year Ended December 31,
(In millions, except per share data)202120202019
Income (loss) from continuing operations attributable to TechnipFMC plc$87.8 $(3,552.6)$(2,645.5)
Income (loss) from discontinued operations attributable to TechnipFMC plc(74.5)265.0 230.3 
Net income (loss) attributable to TechnipFMC plc$13.3 $(3,287.6)$(2,415.2)
Weighted average number of shares outstanding450.5 448.7 448.0 
Dilutive effect of restricted stock units4.1 — — 
Total shares and dilutive securities454.6 448.7 448.0 
Basic and diluted earnings (loss) per share attributable to TechnipFMC plc:
Earnings (loss) per share from continuing operations attributable to TechnipFMC plc
Basic$0.19 $(7.92)$(5.91)
Diluted$0.19 $(7.92)$(5.91)
Earnings (loss) per share from discontinued operations attributable to TechnipFMC plc
Basic$(0.17)$0.59 $0.51 
Diluted$(0.16)$0.59 $0.51 
Total earnings (loss) per share attributable to TechnipFMC plc
Basic and diluted$0.03 $(7.33)$(5.39)
85


 Year Ended December 31,
(In millions, except per share data)2019 2018 2017
Net income (loss) attributable to TechnipFMC plc$(2,415.2) $(1,921.6) $113.3
      
Weighted average number of shares outstanding448.0
 458.0
 466.7
Dilutive effect of restricted stock units
 
 0.2
Dilutive effect of performance shares
 
 1.4
Total shares and dilutive securities448.0
 458.0
 468.3
      
Basic earnings (loss) per share attributable to TechnipFMC plc$(5.39) $(4.20) $0.24
Diluted earnings (loss) per share attributable to TechnipFMC plc$(5.39) $(4.20) $0.24

For the years ended December 31, 2020 and 2019, we incurred net losses; therefore, the impact of any incremental shares from our share-based compensation awards would be anti-dilutive. For the years ended December 31, 2020 and 2019, 3.8 million shares and 4.3 million shares, respectively, were anti-dilutive due to a net loss position.
Weighted average shares of the following share-based compensation awards were excluded from the calculation of diluted weighted average number of shares where the assumed proceeds exceed the average market price from the calculation of diluted weighted average number of shares, because their effect would be anti-dilutive:
Year Ended December 31,
(millions of shares)202120202019
Share option awards1.7 4.6 4.0 
Restricted share units0.1 1.8 — 
Performance shares— 1.9 1.6 
Total1.8 8.3 5.6 
NOTE 9. RECEIVABLES
We manage our receivables portfolios using published default risk as a key credit quality indicator for our loans and receivables. Our loans receivable and security deposits were related to sales of long-lived assets or businesses, loans to related parties for capital expenditure purposes, or security deposits for lease arrangements.
We manage our held-to-maturity debt securities using published credit ratings as a key credit quality indicator as our held-to-maturity debt securities consist of government bonds.
The table below summarizes the amortized cost basis of financial assets by years of origination and credit quality. The key credit quality indicator is updated as of December 31, 2021.
(In millions)Year of originationBalance as of December 31, 2021Balance as of December 31, 2020
Loans receivables, security deposits and other
Moody’s rating Ba22019$50.9 $107.6 
Debt securities at amortized cost
Moody’s rating B3201924.0 23.7 
Total financial assets$74.9 $131.3 
Credit Losses
For contract assets, trade receivables, loans receivable, and security deposits and other, we have elected to calculate an expected credit loss based on loss rates from historical data. We develop loss-rate statistics on the basis of the amount written-off over the life of the financial assets and contract assets and adjust these historical credit loss trends for forward-looking factors specific to the debtors and the economic environment to determine lifetime expected losses.
For held-to-maturity debt securities at amortized cost, we evaluate whether the debt securities are considered to have low credit risk at the reporting date using available, reasonable and supportable information.
86


The table below shows the roll-forward of allowance for credit losses as of December 31, 2021 and 2020, respectively.
Balance as of December 31, 2021
(In millions)Trade receivablesContract assetsLoans receivableSecurity deposit and otherHeld-to-maturity debt securities
Allowance for credit losses at December 31, 2020$40.2 $2.4 $7.5 $0.4 $0.5 
Current period provision (release) for expected credit losses3.5 (1.3)(7.2)(0.1)2.2 
Recoveries(5.6)— — — — 
Allowance for credit losses at December 31, 2021$38.1 $1.1 $0.3 $0.3 $2.7 
Balance as of December 31, 2020
(In millions)Trade receivablesContract assetsLoans receivableSecurity deposit and otherHeld-to-maturity debt securities
Allowance for credit losses at December 31, 2019$59.4 $4.5 $9.5 $0.7 $1.1 
Current period provision for expected credit losses27.2 0.5 (0.2)(0.3)(0.6)
Write-offs charged against the allowance(43.0)— — — — 
Recoveries(3.4)(2.6)(1.8)— — 
Allowance for credit losses at December 31, 2020$40.2 $2.4 $7.5 $0.4 $0.5 
Certain trade receivables are due in one year or less.

NOTE 10. INVENTORIES
Inventories consisted of the following:
 December 31,
(In millions)2019 2018
Raw materials$347.5
 $366.4
Work in process290.2
 146.4
Finished goods778.3
 738.4
Inventory, net$1,416.0
 $1,251.2

December 31,
(In millions)20212020
Raw materials$250.1 $270.3 
Work in process178.7 242.7 
Finished goods603.1 739.8 
Inventories, net$1,031.9 $1,252.8 
All amounts in the table above are reported net of obsolescence reserves of $135.7$116.6 million and $97.5$155.7 million atas of December 31, 20192021 and 2018,2020, respectively.
Net inventories accounted for under the LIFO method totaled $386.6$350.1 million and $387.2$408.5 million atas of December 31, 20192021 and 2018,2020, respectively. The current replacement costs of LIFO inventories exceeded their recorded values by $10.9 million and $7.9$11.6 million atas of December 31, 20192021 and 2018,2020, respectively. There was 0 reduction to the base LIFO inventory in 2019.

96
87


NOTE 10.11. OTHER CURRENT ASSETS & OTHER CURRENT LIABILITIES
Other current assets consisted of the following:
 December 31,
(In millions)2019 2018
Value-added tax receivables$395.2
 $305.8
Other taxes receivables100.7
 85.0
Sundry receivables69.6
 87.0
Prepaid expenses66.8
 91.3
Held-to-maturity investments49.7
 
Current financial assets at amortized cost42.0
 
Asset held for sale25.8
 9.6
Other113.9
 76.9
Other current assets$863.7
 $655.6

December 31,
(In millions)20212020
Value - added tax receivables$222.4 $256.9 
Sundry receivables106.1 138.4 
Other taxes receivables70.6 73.8 
Prepaid expenses50.7 78.1 
Current financial assets at amortized cost21.9 40.6 
Held-to-maturity investments8.8 24.2 
Assets held for sale5.0 47.3 
Other26.8 24.1 
Total other current assets$512.3 $683.4 
Other current liabilities consisted of the following:
December 31,December 31,
(In millions)2019 2018(In millions)20212020
Warranty accruals and project contingencies$310.1
 $418.2
Warranty accruals and project contingencies$119.5 $168.8 
Value added tax and other taxes payable240.4
 214.3
Legal provisions183.6
 418.2
Legal provisions121.7 127.6 
Value - added tax and other taxes payableValue - added tax and other taxes payable71.0 109.6 
Compensation accrualCompensation accrual85.7 54.3 
Social security liability116.5
 112.3
Social security liability70.4 67.9 
Redeemable financial liability129.1
 173.0
Compensation accrual89.6
 87.3
Provision53.2
 135.5
ProvisionsProvisions23.6 53.0 
Current portion of accrued pension and other post-retirement benefits14.9
 14.0
Current portion of accrued pension and other post-retirement benefits5.2 6.9 
Liabilities held for sale9.3
 16.2
Other accrued liabilities347.8
 182.6
Other accrued liabilities163.3 230.2 
Total other current liabilities$1,494.5
 $1,771.6
Total other current liabilities$660.4 $818.3 

NOTE 11.12. WARRANTY OBLIGATIONS
Our warrantiesWarranty obligations are excluded from the estimated total costsincluded within other current liabilities in the measurement of progress and accrued when or as we transfer control of the goods or services to the customer. Refer to Note 6 to theseour consolidated financial statements for additional information regarding warranties. Our accrued warrantiesbalance sheets as of December 31, 2019 were $193.5 million. During 2019, we had new2021 and 2020. A reconciliation of warranty expenses of $78.8 million, adjustments to existing accruals of $(57.5) millionobligations for the years ended December 31, 2021 and claims paid of $62.2 million.2020 is as follows:
Year Ended December 31,
(In millions)20212020
Balance at beginning of period$109.6 $121.7 
Warranty expenses54.0 52.0 
Adjustment to existing accruals(56.5)(48.2)
Claims paid(20.9)(15.9)
Balance at end of period$86.2 $109.6 
NOTE 12. EQUITY METHOD13. INVESTMENTS
Equity Method Investments
The equity method of accounting is used to account for investments in unconsolidated affiliates where we can have the ability to exert significant influence over the affiliates operating and financial policies.
For certain construction joint ventures, we use the proportionate consolidation method, whereby our proportionate share of each entity’s assets, liabilities, revenues, and expenses are included in the appropriate classifications in the accompanying consolidated financial statements. None of our proportionate consolidation investments, individually or in the aggregate, are significant to our consolidated results for 2019, 2018, or 2017.
Our equity investments were as follows as of December 31, 20192021 and 2018:


2020:
 December 31, 2019
 Percentage Owned 
Carrying Value
(in millions)
Dofcon Brasil AS50.0% 167.4
Serimax Holdings SAS20.0% 21.5
Magma Global Limited25.0% 50.2
Other  61.3
Investments in equity affiliates  $300.4
88


December 31,
20212020
(In millions, except %)Percentage OwnedCarrying Value
Dofcon Brasil AS50.0 %276.9 234.7 
Magma Global Limited— %— 51.4 
Serimax Holdings SAS20.0 %15.0 18.8 
Other0.5 0.6 
Investments in equity affiliates$292.4 $305.5 
 December 31, 2018
 Percentage Owned 
Carrying Value
(in millions)
Technip Odebrecht PLSV CV (“TOP CV”)50.0% $136.1
Dofcon Brasil AS50.0% 126.2
Serimax Holdings SAS20.0% 23.2
Magma Global Limited25.0% 49.8
Other  59.2
Investments in equity affiliates  $394.5

Our income from equity affiliates for the years ended December 31, 2021, 2020 and 2019, was $0.6 million, $64.6 million and $59.8 million, respectively and included within our Subsea segment.
Our major equity method investments are as follows:
TOP CV - was an affiliated company in the form of a joint venture between Technip SA and Ocyan SA (formerly known as Odebrecht). Technip Odebrecht was formed in 2011 when awarded a contract to provide pipeline installation ships to state-controlled Petrobras for its work in oil and gas fields offshore Brazil. On December 30, 2019, we completed the acquisition of the remaining 50% interest in TOP CV. Prior to the acquisition, we accounted for our 50% investment using the equity method of accounting with results reported in our Subsea segment. Subsequent to this transaction we recorded the results in our consolidated financial information.
Dofcon Brasil AS (“Dofcon”) - is an affiliated company in the form of a joint venture between Technip SATechnipFMC and DOF Subsea and was founded in 2006. Dofcon provides Pipe-Laying Support Vessels (PLSVs) for work in oil and gas fields offshore Brazil. Dofcon is considered a VIE because it does not have sufficient equity to finance its activities without additional subordinated financial support from other parties. We are not the primary beneficiary of the VIE. As such, we have accounted for our 50% investment using the equity method of accounting with results reported in our Subsea segment.
Magma Global Limited (“Magma Global”) - In 2018, we entered into a collaboration agreement with Magma Global to develop a new generation of hybrid flexible pipe for use in the traditional and new energy industries. As part of the collaboration, we purchased a 25% ownership interest in Magma Global. In October 2021, we purchased the remaining ownership interest in Magma Global for $64.0 million. See Note 3 for further details.
Serimax Holdings SAS (“Serimax”) - is an affiliated company in the form of a joint venture between Technip SATechnipFMC and Vallourec SA and was founded in 2016. Serimax is headquartered in Paris, France and provides rigid pipes welding services for work in oil and gas fields around the world. We have accounted for our 20% investment using the equity method of accounting with results reported in our Subsea segment.
Magma Global Limited (“Magma Global”) - is an affiliated companyInvestment in Technip Energies
As discussed in Note 2, immediately following the form of a collaborative agreement signed in 2018 between Technip-Coflexip UK Holdings Limited and Magma Global to develop hybrid flexible pipe for use in offshore applications. As partcompletion of the collaboration, TechnipFMC holds a minority stake. We have accountedSpin-off, we owned 49.9% of the outstanding shares of Technip Energies. At the Spin-off date, on initial recognition of the investment, we elected to account for our 25% investment usingin Technip Energies at fair value with all subsequent changes in fair value for the equity method investment of accounting with results reported in our Subsea segment.consolidated statement of income.
Our income from equity affiliates included in eachOn January 7, 2021, Bpifrance Participations SA (“BPI”) entered into the Share Purchase Agreement with us pursuant to which BPI agreed to purchase a portion of our reporting segmentsretained stake in Technip Energies N.V. (the “BPI Investment”) for $200.0 million (the “Purchase Price”), subject to certain adjustments. On March 31, 2021, BPI ultimately purchased 7.5 million shares in Technip Energies from us for $100.0 million. Accordingly, on April 8, 2021, we refunded $100.0 million to BPI as a result of their revised level of investment.
On April 27, 2021 we sold 25.0 million Technip Energies shares, representing 14% of Technip Energies’ share capital, through a private placement by way of an accelerated bookbuild offering (the “April Placement”). The sale price of the shares in the April Placement was as follows:set at €11.10 per share, yielding total gross proceeds of €277.5 million, or $335.2 million.
Concurrently with the April Placement, Technip Energies purchased from us 1.8 million shares of Technip Energies (equivalent to 1% of share capital) at €11.10 per share, corresponding to the price of the April Placement (the “Concurrent Sale to Technip Energies”). The sale of shares to Technip Energies yielded total gross proceeds of €20.0 million or $24.2 million. This purchase was separate from the April Placement.
On July 29, 2021 we announced the sale of 16.0 million Technip Energies shares, representing approximately 9% of Technip Energies’ issued and outstanding share capital, through a private placement by way of an accelerated bookbuild offering (the “July Placement”). The sale price of the shares in the July Placement was set at €11.20 per share, yielding total gross proceeds of €179.2 million, or $213.1 million. We agreed to a 60-day lock-up for our remaining shares in Technip Energies, subject to waiver from the Joint Global Coordinators and certain other customary exceptions.
89


 Year Ended December 31,
(In millions)2019 2018 2017
Subsea$59.8
 $80.9
 $55.3
Onshore/Offshore3.1
 33.4
 0.3
Income from equity affiliates$62.9
 $114.3
 $55.6


On September 2, 2021 we announced the sale of 17.6 million Technip Energies shares, representing approximately 10% of Technip Energies’ issued and outstanding share capital, through a private sale transaction with HAL Investments, the Dutch investment subsidiary of HAL Holding, N.V. (the “September Sale”). The sale price of the shares in the September Sale was set at €11.15 per share, yielding total gross proceeds of €196.2 million, or $231.5 million. The Joint Global Coordinators from the July Placement granted a waiver of the 60-day lock-up solely for the purpose of the September Sale.

98

The September Sale was completed in 2 tranches. The first tranche of 8.6 million shares was sold and settled in September for gross proceeds of €96.3 million, or $114.4 million. The second tranche of 9.0 million shares was settled on October 22, 2021 for gross proceeds of €99.9 million, or $116.4 million.

As a result of the reduced ownership interest in Technip Energies and related loss of significant influence, we discontinued the use of equity method of accounting for our interest in Technip Energies. Following the September sale, we account for our remaining ownership interest in Technip Energies as equity security at fair value.

As of December 31, 2021, we retained a direct stake of 21.9 million shares, representing 12.2% of Technip Energies’ issued and outstanding share capital. There is no lock-up associated with our remaining stake in Technip Energies. The carrying amount of our investment in Technip Energies as of December 31, 2021 was $317.3 million.

For the year ended December 31, 2021, we recognized $322.2 million of income related to our investment in Technip Energies. The amounts recognized include purchase price discounts on the sales of shares and a fair value revaluation gains and losses of our investment. See Note 26 for further details.
NOTE 13.14. RELATED PARTY TRANSACTIONS
Receivables, payables, revenues and expenses which are included in our consolidated financial statements for all transactions with related parties, defined as entities related to our directors and main shareholders as well as the partners of our consolidated joint ventures, were as follows.
Trade receivables consisted of trade receivables due from the following related parties:
December 31,
(In millions)20212020
Equinor ASA$— $24.1 
Dofcon Navegacao22.7 4.2 
Techdof Brasil AS4.5 8.0 
Others2.5 1.7 
Total trade receivables$29.7 $38.0 

Dofcon Navegacao and Dofcon Brasil AS are our equity method investments and Techdof Brasil AS is a wholly owned subsidiary of Dofcon Brasil AS. In October 2020, we added a new member to our Board of Directors who was an executive of Equinor ASA up through January 2021.
Payables consisted of payables due to the following related parties:
December 31,
(In millions)20212020
Crescent Energy$2.7 $— 
Dofcon Navegacao$— $1.5 
Arkema S.A.0.9 0.5 
Others1.9 2.6 
Total trade payables$5.5 $4.6 

Additionally, we have a note receivable balance of $12.6 million and $37.6 million with Dofcon Brasil AS as of December 31, 2021 and 2020, respectively. These are included in other assets in our consolidated balance sheets.
90


Revenue consisted of amount from following related parties:
December 31,Year Ended December 31,
(In millions)2019 2018(In millions)202120202019
TP JGC Coral France SNC$40.1
 $31.6
TTSJV WLL22.4
 
Equinor ASAEquinor ASA$— $119.6 $— 
Anadarko Petroleum CompanyAnadarko Petroleum Company— — 67.1 
TOP CV
 10.9
TOP CV— — 11.9 
Anadarko Petroleum Company
 4.9
Dofcon NavegacaoDofcon Navegacao9.9 3.4 8.4 
Techdof Brasil ASTechdof Brasil AS15.8 11.2 8.3 
Others14.3
 14.3
Others14.0 18.5 14.4 
Total trade receivables$76.8
 $61.7
Total revenueTotal revenue$39.7 $152.7 $110.1 

TP JGC Coral France SNC and TTSJV W.L.L. are equity method affiliates. TOP CV was previously an equity method affiliate.
A member of our Board of Directors (the “Director”) served on the Board of Directors of Anadarko Petroleum Company (“Anadarko”) until August 2019. In August 2019, Anadarko was acquired by Occidental Petroleum Corporation (“Occidental”). As a result, the Director no longer serves as a member of the Board of Directors of Anadarko. The Director is not an officer or director of Occidental.
Trade payablesTOP CV was previously an equity method affiliate that became a fully consolidated subsidiary on December 30, 2019. See Note 3 for further details.
Expenses consisted of payables dueamounts to following related parties:
 December 31,
(In millions)2019 2018
Chiyoda$24.8
 $70.0
JGC Corporation15.1
 69.5
IFP Energies nouvelles2.4
 2.4
Dofcon Navegacao2.1
 2.5
Magma Global Limited
 0.6
Anadarko Petroleum Company
 0.7
Others6.7
 2.9
Total trade payables$51.1
 $148.6

Dofcon Navegacao and Magma Global Limited are equity method affiliates. JGC Corporation and Chiyoda are joint venture partners on our Yamal project. A member of our Board of Directors is an executive officer of IFP Energies nouvelles.
Additionally, we have note receivable balance of $65.2 million and $130.0 million as of December 31, 2019 and 2018, respectively. The note receivables balance includes $62.5 million and $119.9 million with Dofcon Brasil AS at December 31, 2019 and 2018, respectively. Dofcon Brasil AS is a VIE and accounted for as an equity method affiliate. These are included in other assets on our consolidated balance sheets.


Revenue consisted of amount from following related parties:
 Year Ended December 31,
(In millions)2019 2018 2017
TTSJV W.L.L.$127.9
 $
 $
TP JGC Coral France SNC110.4
 118.2
 69.9
Anadarko Petroleum Company67.1
 124.8
 111.3
TOP CV11.9
 7.2
 
Storengy8.8
 
 
Dofcon Navegacao8.4
 2.9
 
Techdof Brasil AS8.3
 7.0
 
JGC Corporation6.7
 
 
Others30.1
 33.2
 56.9
Total revenue$379.6
 $293.3
 $238.1
A member of our Board of Directors serve on the Board of Directors for Storengy.
Expenses consisted of amount to following related parties:
 Year Ended December 31,
(In millions)2019 2018 2017
Chiyoda$25.1
 $53.0
 $44.1
JGC Corporation20.8
 81.2
 46.8
Arkema S.A.18.9
 2.6
 
Serimax Holdings SAS17.7
 0.1
 
Magma Global Limited7.3
 3.0
 
TP JGC Coral France SNC5.0
 
 
Jumbo Shipping4.5
 
 
IFP Energies nouvelles3.8
 4.4
 
Creowave OY2.6
 1.9
 4.7
Amaja Oil2.0
 
 
Altus Intervention1.8
 
 
Competentia1.6
 
 
Others31.3
 8.5
 45.8
Total expenses$142.4
 $154.7
 $141.4

Year Ended December 31,
(In millions)202120202019
Arkema S.A.$3.8 $1.5 $3.8 
Serimax Holdings SAS7.6 0.4 17.7 
Magma Global Limited8.8 14.0 7.3 
Jumbo Shipping— 16.0 4.5 
Dofcon Navegacao26.7 24.0 1.8 
Altus Intervention— 3.6 1.8 
Others18.5 17.6 17.8 
Total expenses$65.4 $77.1 $54.7 
Serimax Holdings SAS is an equity method affiliate. Amaja Oil is a joint venture partner. We own a minority interest in a Creowave OY joint venture. Members of our Board of Directors serveserved on the Board of Directors for Arkema S.A., Altus Intervention, Jumbo Shipping and Competentia.Shipping. Magma Global Limited was an equity method affiliate through September 30, 2021. In October 2021, we purchased the remaining ownership interest in Magma Global, see Note 3 for further details.


100
91


NOTE 14.15. PROPERTY, PLANT AND EQUIPMENT
Property, plant and equipment consisted of the following: 
 December 31,
(In millions)2019 2018
Land and land improvements$108.4
 $103.5
Buildings626.9
 656.7
Vessels2,091.9
 1,893.3
Machinery and equipment1,930.6
 1,905.7
Office fixtures and furniture285.0
 300.0
Construction in process130.9
 179.0
Other277.1
 290.1
 5,450.8
 5,328.3
Accumulated depreciation(2,288.8) (2,068.5)
Property, plant and equipment, net$3,162.0
 $3,259.8

December 31,
(In millions)20212020
Land and land improvements$79.4 $80.0 
Buildings471.6 514.6 
Vessels1,979.0 1,968.1 
Machinery and equipment1,849.0 1,871.8 
Office fixtures and furniture121.9 125.4 
Construction in process110.5 147.3 
Other189.8 203.2 
4,801.2 4,910.4 
Accumulated depreciation(2,204.0)(2,154.2)
Property, plant and equipment, net$2,597.2 $2,756.2 
Depreciation expense was $383.5$291.3 million, $367.8$308.7 million and $370.2$363.0 million in 2019, 20182021, 2020 and 2017,2019, respectively. The amount of interest cost capitalized was not material for the years presented.
During 20192021 and 2018,2020, we determined the carrying amount of certain of our long-lived assets exceeded their fair value and recorded an impairment. Refer toimpairments. See Note 20 to these consolidated financial statements for additional information regarding this impairment.further details.
In January 2019, we purchased a deepwater dive support vessel, Deep Discoverer, for $116.8 million. The purchase of this vessel was funded through debt. Refer to Note 16 to these consolidated financial statements for additional information.
In December 2019, we completed the sale of our G1201 vessel as part of our overall strategy to optimize the profile and size of our subsea fleet. As a result of the sale, a net loss of $7.1 million is included in other income (expense), net in our consolidated statements of income.
NOTE 15.16. GOODWILL AND INTANGIBLE ASSETS
Goodwill - We record goodwill as the excess of the purchase price over the fair value of the net assets acquired in acquisitions accounted for under the purchase method of accounting. We test goodwill for impairment annually as of October 31 of each year, or more frequently if circumstances indicate possible impairment. We identify a potential impairment by comparing the fair value of the applicable reporting unit (which is consistent with our business segments) to its net book value, including goodwill. If the net book value exceeds the fair value of the reporting unit, we measure the impairment by comparing the carrying value of the reporting unit to its fair value.
We test our goodwill for impairment by comparing the fair value of each of our reporting units to their net carrying value as of October 31 of each year.value. Our impairment analysis is quantitative; however, it includes subjective estimates based on assumptions regarding future growth rates, interest rates and operating expenses.
A lower fair value estimate in the future for any of our reporting units could result in goodwill impairments. Factors that could trigger a lower fair value estimate include sustained price declines of the reporting unit’s products and services, cost increases, regulatory or political environment changes, changes in customer demand, and other changes in market conditions, which may affect certain market participant assumptions used in the discounted future cash flow model based on internal forecasts of revenues and expenses over a specified period plus a terminal value (the income approach).


The income approach estimates fair value by discounting each reporting unit’s estimated future cash flows using a weighted-average cost of capital that reflects current market conditions and the risk profile of the reporting unit. To arrive at our future cash flows, we use estimates of economic and market assumptions, including growth rates in revenues, costs, estimates of future expected changes in operating margins, tax rates and cashcapital expenditures. Future revenues are also adjusted to match changes in our business strategy. We believe this approach is an appropriate valuation method. Under the market multiple approach, we determine the estimated fair value of each of our reporting units by applying transaction multiples to each reporting unit’s projected EBITDA and then averaging that estimate with similar historical calculations using either a one, two or three year average. Our reporting unit valuations were determined primarily by utilizing the income approach and the market multiple approach.
As partDuring the first quarter of the Company’s annual2020, triggering events were identified which led to performing interim goodwill impairment test,testing in our reporting units as of March 31, 2020. These events included the Company’sCOVID-19 pandemic breakout, commodity price declines, and a significant decrease in our market capitalization was compared toas well as those of our estimate ofpeers and customers. The fair value for our reporting units for the interim testing was valued using a market approach. An appropriate control premium was considered for each of the reporting segment. TechnipFMC’s market capitalization on its testing date had declined significantly when comparedunits and applied to the prior-year’s assessment, driven in part by greater geopolitical uncertainty and lower commodity prices. As a result, our estimateoutput of business fair value could not be supported by the market capitalization onapproach. An interim impairment test during the testing date.

During the year ended December 31, 2019, we recorded $1,321.9first quarter of 2020 resulted in $2,747.5 million and $666.8$335.9 million of goodwill impairment charges recorded in our Subsea and Surface Technologies reporting units,segments, respectively. DuringSubsequent to the year ended December 31, 2018,charges, we do not have any goodwill recorded $1,383.0 million of goodwill impairment charges in our Subsea reporting unit. Refer to Note 20 to these consolidated financial statements for additional disclosure related to impairment of goodwill during the year ended December 31, 2019 and 2018.
The fair value over carrying amount for our Onshore/Offshore reporting unit was in excess of 400% of its carrying amount.
The following table presents the significant estimates used by management in determining the fair valueseither of our reporting units for the years ended December 31, 2019 and 2018:segment.
 2019 2018
Year of cash flows before terminal value4 5
Discount rates12.5% to 15.0% 12% to 13.0%
EBITDA multiples6.0 - 8.5x 7.0 - 8.5x
92


For recently acquired reporting units, a quantitative impairment test may indicate a fair value that is substantially similar to the reporting unit’s carrying amount. Such similarities in value are generally an indication that management’s estimates of future cash flows associated with the recently acquired reporting unit remain relatively consistent with the assumptions that were used to derive its initial fair value.
As discussed above, when evaluating the 2019 quantitative impairment test results, management considered many factors in determining whether an impairment of goodwill for any reporting unit was reasonably likely to occur in future periods, including future market conditions and the economic environment. Circumstances such as market declines, unfavorable economic conditions, loss of a major customer or other factors could increase the risk of impairment of goodwill for this reporting unit in future periods.


The carrying amount of goodwill by reporting segment was as follows:
(In millions)Subsea Onshore/Offshore Surface Technologies Total
December 31, 2016$2,931.1
 $787.2
 $
 $3,718.3
Additions due to business combinations2,532.6
 1,635.5
 997.8
 5,165.9
Impairment


Translation6.7
 38.9
 
 45.6
December 31, 20175,470.4
 2,461.6
 997.8
 8,929.8
Additions due to business combinations85.0
 
 
 85.0
Impairment(1,383.0) 
 
 (1,383.0)
Purchase accounting adjustments
 
 19.7
 19.7
Translation(30.0) (13.9) 
 (43.9)
December 31, 20184,142.4
 2,447.7
 1,017.5
 7,607.6
Impairments(1,321.9) 
 (666.8) (1,988.7)
Purchase accounting adjustment
 
 9.9
 9.9
Other
 (17.7) 
 (17.7)
Translation(6.4) (6.4) 
 (12.8)
December 31, 2019$2,814.1
 $2,423.6
 $360.6
 $5,598.3
(In millions)SubseaSurface TechnologiesTotal
December 31, 2019$2,792.8 $335.7 $3,128.5 
Impairments(2,747.5)(335.9)(3,083.4)
Translation(45.3)0.2 (45.1)
December 31, 2020$— $— $— 

Intangible assets - The components of intangible assets were as follows:
 December 31,
 2019 2018
(In millions)
Gross
Carrying
Amount
 
Accumulated
Amortization
 
Gross
Carrying
Amount
 
Accumulated
Amortization
Acquired technology$246.7
 $73.6
 $246.7
 $49.3
Backlog175.0
 175.0
 175.0
 175.0
Customer relationships285.4
 85.9
 285.0
 57.4
Licenses, patents and trademarks811.1
 227.6
 812.6
 194.8
Software215.9
 151.1
 232.1
 159.1
Other115.9
 50.2
 84.3
 23.4
Total intangible assets$1,850.0
 $763.4
 $1,835.7
 $659.0

December 31,
20212020
(In millions)Gross
Carrying
Amount
Accumulated
Amortization
Gross
Carrying
Amount
Accumulated
Amortization
Acquired technology$247.0 $122.4 $247.1 $98.1 
Customer relationships285.4 142.9 285.3 114.4 
Licenses, patents and trademarks694.6 220.7 690.3 189.3 
Software108.2 84.8 111.3 81.1 
Other54.0 4.7 10.4 10.2 
Total intangible assets$1,389.2 $575.5 $1,344.4 $493.1 
We recorded $126.1recorded $94.1 million, $182.6$103.4 million and $244.5$104.7 million in amortization expense related to intangible assets during the years ended December 31, 2019, 20182021, 2020 and 2017,2019, respectively. During the years 20202022 through 2024,2026, annual amortization expense is expected to be as follows: $125$87 million in 2020, $120each of the five years and $351 million thereafter in 2021, $115 million in 2022, $112 million in 2023, $109 million in 2024 and $507 million thereafter.the aggregate.
NOTE 16.17. DEBT
Short-term debt and current portion of long-term debt - Short-term debt and current portion of long-term debt consisted of the following:
 December 31,
(In millions)2019 2018
Bank borrowings247.8
 44.2
5.00% 2010 Private placement notes due 2020224.6
 
Other23.0
 23.2
Total short-term debt and current portion of long-term debt$495.4
 $67.4

Overview


Long-term debt - Long-term debt consisted of the following:
December 31,
(In millions)20212020
Commercial paper$— $1,043.7 
Synthetic bonds due 2021— 551.2 
3.45% Senior Notes due 2022— 500.0 
3.40% 2012 Private placement notes due 2022169.9 184.0 
3.15% 2013 Private placement notes due 2023288.8 312.9 
5.75% 2020 Private placement notes due 2025226.5 245.4 
6.50% Senior notes due 2026633.1 — 
4.00% 2012 Private placement notes due 202784.9 92.0 
4.00% 2012 Private placement notes due 2032113.3 122.7 
3.75% 2013 Private placement notes due 2033113.3 122.7 
Bank borrowings and other397.4 298.4 
Unamortized debt issuance costs and discounts(22.3)(12.8)
Total debt2,004.9 3,460.2 
Less: current borrowings277.6 624.7 
Long-term debt$1,727.3 $2,835.5 
 December 31,
(In millions)2019 2018
Revolving credit facility$
 $
Bilateral credit facilities
 
Commercial paper1,967.0
 1,916.1
Synthetic bonds due 2021492.9
 490.9
3.45% Senior Notes due 2022500.0
 500.0
5.00% 2010 Private placement notes due 2020224.6
 229.0
3.40% 2012 Private placement notes due 2022168.5
 171.8
3.15% 2013 Private placement notes due 2023146.0
 148.9
3.15% 2013 Private placement notes due 2023140.4
 143.1
4.00% 2012 Private placement notes due 202784.2
 85.9
4.00% 2012 Private placement notes due 2032112.3
 114.5
3.75% 2013 Private placement notes due 2033112.3
 114.5
Bank borrowings513.3
 265.2
Other23.0
 23.2
Unamortized issuing fees(9.1) (11.4)
Total debt4,475.4
 4,191.7
Less: current borrowings495.4
 67.4
Long-term debt$3,980.0
 $4,124.3

Maturities of debtDebt maturities as of December 31, 2019,2021, are payable as follows:
93


Payments Due by Period Payments Due by Period
(In millions)Total
payments
 Less than
1 year
 1-3
years
 3-5
years
 After 5
years
(In millions)Total
payments
Less than
1 year
1-3
years
3-5
years
After 5
years
Total debt$4,475.4
 $495.4
 $3,392.4
 $285.6
 $302.0
Total debt$2,004.9 $277.6 $402.1 $942.9 $382.3 

Debt Financing Transactions in Connection with the Spin-off

In connection with the Spin-off, we executed a series of refinancing transactions, in order to provide a capital structure with sufficient cash resources to support future operating and investment plans.

Debt Issuance

RevolvingOn February 16, 2021, we entered into a credit agreement, which provides for a $1.0 billion three-year senior secured multi-currency revolving credit facility (“Revolving Credit Facility”) including a $450.0 million letter of credit sub-facility; and
-
On January 17, 2017,29, 2021, we accededissued $1.0 billion of 6.50% senior notes due 2026 (the “2021 Notes”).

Repayment of Debt

The proceeds from the debt issuance described above along with the available cash on hand, were used to fund:

the repayment of all $542.4 million of the outstanding Synthetic Convertible Bonds that matured in January 2021;

the repayment of all $500.0 million aggregate principal amount of outstanding 3.45% Senior Notes due 2022. In connection with the repayment, we recorded a newloss on extinguishment of debt of $23.5 million related to the difference between the amount paid and the net carrying value of the debt; and

the termination of the $2.5 billion senior unsecured revolving credit facility agreement (“facility agreement”) between FMC Technologies, Inc., Technip Eurocash SNC (the “Borrowers”), and TechnipFMC plc (the “Additional Borrower”) with JPMorgan Chase Bank, National Association (“JPMorgan”), as agent and an arranger, SG Americas Securities LLC as an arranger,entered into on January 17, 2017; the termination of the €500.0 million Euro Facility entered into on May 19, 2020, and the lenders party thereto.termination of the CCFF Program entered into on May 19, 2020. In connection with the termination of these credit facilities, we repaid $830.9 million of the outstanding commercial paper borrowings.
The facility
Credit Facilities and Debt

Revolving Credit Facility - On February 16, 2021, we entered into a credit agreement, which provides for the establishment of a multicurrency, revolving credit facility, which includes$1.0 billion three-year senior secured multi-currency Revolving Credit Facility including a $1.5 billion$450.0 million letter of credit subfacility. Subjectsub-facility. We incurred $34.8 million of debt issuance costs in connection with the Revolving Credit Facility. These debt issuance costs are deferred and are included in other assets in our consolidated balance sheet as of December 31, 2021. The deferred debt issuance costs are amortized to certain conditions,interest expense over the Borrowers may requestterm of the aggregate commitmentsRevolving Credit Facility.

Availability of borrowings under the facility agreement be increasedRevolving Credit Facility is reduced by an additional $500.0the outstanding letters of credit issued against the facility.As of December 31, 2021, there were $16.7 million letters of credit outstanding and availability of borrowings under the Revolving Credit Facility was $983.3 million. On November 26, 2018, we entered into an extension which extends the expiration date to January 2023.

Borrowings under the facility agreementRevolving Credit Facility bear interest at the following rates, plus an applicable margin, depending on currency:

U.S. dollar-denominated loans bear interest, at the Borrowers’Company’s option, at a base rate or an adjusted rate linked to the London interbank offered rate (“Adjusted LIBOR”); and
sterling-denominated
94


Euro-denominated loans bear interest at Adjusted LIBOR; and
euro-denominated loans bear interest aton an adjusted rate linked to the Euro interbank offered rate (“EURIBOR”).rate.
Depending on the credit rating of TechnipFMC, the
The applicable margin for revolvingborrowings under the Revolving Credit Facility ranges from 2.50% to 3.50% for Eurocurrency loans varies (i) in the case of Adjusted LIBOR and EURIBOR loans, from 0.820%1.50% to 1.300% and (ii) in the case of2.50% for base rate loans, from 0.000%depending on a total leverage ratio. The Revolving Credit Facility is subject to 0.300%. The “base rate” is the highest of (a) the prime rate announced by JPMorgan, (b) the greater of the Federal Funds Rate and the Overnight Bank Funding Rate plus 0.5% or (c) one-month Adjusted LIBOR plus 1.0%.


The facility agreement contains usual and customary covenants, representations and warranties, andcovenants, events of default, mandatory repayment provisions and financial covenants.

2021 Notes - On January 29, 2021, we issued $1.0 billion of 6.50% senior notes due 2026. The interest on the 2021 Notes is paid semi-annually on February 1 and August 1 of each year, beginning on August 1, 2021. The 2021 Notes are senior unsecured obligations and are guaranteed on a senior unsecured basis by substantially all of our wholly-owned U.S. subsidiaries and non-U.S. subsidiaries in Brazil, the Netherlands, Norway, Singapore and the United Kingdom. We incurred $25.7 million of debt issuance costs in connection with issuance of the 2021 Notes.These debt issuance costs are deferred and are included in long-term debt in our consolidated balance sheet as of December 31, 2021. The deferred debt issuance costs are amortized to interest expense over the term of the 2021 Notes, which approximates the effective interest method.

During 2021, we completed 2 tender offers and purchased for credit facilitiescash $366.9 million of this type, including financial covenants requiring that our total capitalization ratio not exceed 60% at the endoutstanding 2021 Notes.We paid a cash premium of any financial quarter. The facility agreement also contains covenants restricting our ability$29.5 million to the note holders who tendered and our subsidiaries’ ability to incur additional liens and indebtedness, enter into asset sales or make certain investments.wrote-off $8.9 million of bond issuance costs.

As of December 31, 2019,2021, we were in compliance with all restrictive covenants under our revolving credit facility.debt covenants.
Bilateral credit facilities
- We have access to a €100.0 million bilateral credit facility expiring in May 2021. Two bilateral credit facilities of €80.0 million each and a bilateral credit facility of €60.0 million expired in May and June 2019, respectively.
Each bilateral credit facility contains usual and customary covenants, representations and warranties and events of default for credit facilities of this type.
Commercial paper - Under our commercial paper program, we have the ability to access $1.5 billion and €1.0 billion of short-term financing through our commercial paper dealers, subject to the limit of unused capacity of our facility agreement. As we have both the ability and intent to refinance these obligations on a long-term basis, our commercial paper borrowings were classified as long-term in the consolidated balance sheets as of December 31, 2019 and December 31, 2018. Commercial paper borrowings are issued at market interest rates.- As of December 31, 2019,2021, we had 0 commercial paper outstanding. In accordance with the terms of the new Revolving Credit Facility, we do not have an ability to issue any new commercial paper notes going forward. As of December 31, 2020, our commercial paper borrowings had a weighted average interest rate of 2.23%0.34% on the U.S. dollar denominated borrowings. Commercial paper borrowings and (0.28)% on the Euro denominated borrowings.were issued at market interest rates. As of December 31, 2020, we had $225.8 million of outstanding commercial paper borrowings under this program.

Synthetic bonds - On January 25, In2016, we issued €375.0€450.0 million principal amount of 0.875% convertible bonds with a maturity date of January 25, 2021 and a redemption at par of the bonds which have not been converted. On March 3, 2016, we issued additional convertible bonds for a principal amount of €75.0 million issued on the same terms, fully fungible with and assimilated to the bonds issued on January 25, 2016. The issuance of these non-dilutive cash-settled convertible bonds (“Synthetic Bonds”), which are linked to our ordinary shares were backed simultaneously by the purchase of cash-settled equity call options in order to hedge our economic exposure to the potential exercise of the conversion rights embedded in the Synthetic Bonds. As the Synthetic Bonds will only be cash settled, they will not result in the issuance of new ordinary shares or the delivery of existing ordinary shares upon conversion.bonds. Interest on the Synthetic Bonds issynthetic bonds was payable semi-annually in arrears on January 25 and July 25 of each year, beginning July 26, 2016. Net proceeds fromThe synthetic bonds were repaid during the Synthetic Bonds were used for general corporate purposes and to finance the purchasefirst quarter of the call options. The Synthetic Bonds are our unsecured obligations. The Synthetic Bonds will rank equally in right of payment with all of our existing and future unsubordinated debt.2021.
The Synthetic Bonds issued on January 25, 2016 were issued at par. The Synthetic Bonds issued on March 3, 2016 were issued at a premium of 112.44% resulting from an adjustment over the 3-day trading period following the issuance resulting in a share reference price of €48.8355.
A 40.0% conversion premium was applied to the share reference price of €40.7940. The share reference price was computed using the average of the daily volume weighted average price of our ordinary shares on the Euronext Paris market over the 10 consecutive trading days from January 21 to February 3, 2016. The initial conversion price of the bonds was then fixed at €57.1116.
The Synthetic Bonds each have a nominal value of €100.0 thousand with a conversion ratio of 3,337.3493 and a conversion price of €29.9639. Any bondholder may, at its sole option, request the conversion in cash of all or part of the bonds it owns, beginning November 15, 2020 to the 38th business day before the maturity date.
Senior Notes - On April 3, 2018,As of December 31, 2020, we commenced offers to exchange up to $459.8had outstanding 3.45% $500.0 million in aggregate principal amount of new 3.45% senior notes due October 1, 2022 (the “Senior Notes”), Series B, which have been registered under2022. The senior notes were redeemed during the U.S. Securities Actfirst quarter of 1933, as amended (the “Securities Act”), for any and all of our outstanding restricted 3.45% Senior Notes due 2022, Series A (the “Outstanding Notes”), which we previously issued in a private transaction that was not subject to the registration requirements of the Securities Act (the “Initial Offering”). We refer to the Exchange Notes and the Outstanding Notes collectively as the “Notes”.2021.
The terms of the Senior Notes are governed by the indenture, dated as of March 29, 2017 between TechnipFMC and U.S. Bank National Association, as trustee (the “Trustee”), as amended and supplemented by the First Supplemental Indenture between TechnipFMC and the Trustee (the “First Supplemental Indenture”) relating to the issuance of the 2017 Notes and the Second Supplemental Indenture between TechnipFMC and the Trustee (the “Second Supplemental Indenture”) relating to the issuance of the 2022 Notes.


At any time prior to July 1, 2022, in the case of the 2022 Notes, we may redeem some or all of the Senior Notes at the redemption prices specified in the First Supplemental Indenture and Second Supplemental Indenture, respectively. At any time on or after July 1, 2022, we may redeem the 2022 Notes at the redemption price equal to 100% of the principal amount of the 2022 Notes redeemed. The Senior Notes are our senior unsecured obligations. The Senior Notes will rank equally in right of payment with all of our existing and future unsubordinated debt, and will rank senior in right of payment to all of our future subordinated debt.
Private Placement Notes - On July 27, 2010,
2020 Issuance:
During 2020, we completed the private placement of €200.0€200 million aggregate principal amount of 5.0%the 2020 Private Placement Notes. The 2020 Private Placement Notes bear interest of 5.75% and are due June 2025. Prior to 2021, these notes due July 2020 (the “2020 Notes”)had an interest of 4.50%. Interest on the 2020 Notes is payable annually in arrears on July 27 of each year, beginning July 27, 2011. Net proceeds of the 2020 Notes were used to partially finance the 2004-2011 bond issue, which was repaid at its maturity date on May 26, 2011. The 2020 Notes contain contains usual and customary covenants and events of default for notes of this type. In the event of a change of control resulting in a downgrade in the rating of the notes below BBB-, the 2020 Notes may be redeemed early by any bondholder, at its sole discretion. The 2020 Notes are our unsecured obligations. The 2020 Notes will rank equally in right of payment with all of our existing and future unsubordinated debt.
In June 2012, we completed the private placement of €325.0 million aggregate principal amount of notes. The notes were issued in three tranches with €150.0 million bearing interest at 3.40% and due June 2022 (the “Tranche A 2022 Notes”), €75.0 million bearing interest of 4.0% and due June 2027 (the “Tranche B 2027 Notes”) and €100.0 million bearing interest of 4.0% and due June 2032 (the “Tranche C 2032 Notes” and, collectively with the “Tranche A 2022 Notes and the “Tranche B 2027 Notes”, the “2012 Private Placement Notes”). Interest on the Tranche A 2022 Notes and the Tranche C 2032 Notes is payable annually in arrears on June 1430 of each year beginning June 14, 2013. Interest on the Tranche B 2027 Notes is payable annually in arrears on June 15 of each year, beginning June 15, 2013. Net proceeds of the 2012 Private Placement Notes were used for general corporate purposes.30, 2020. The 20122020 Private Placement Notes contain usual and customary covenants and events of default for notes of this type. In the event of a change of control resulting in a downgrade in the rating of the notes below BBB-, the 2012 Private Placement Notes may be redeemed early by any bondholder, at its sole discretion. The 2012 Private Placement Notes are our unsecured obligations. The 2012 Private Placement Notes will rank equally in right of payment with all of our existing and future unsubordinated debt.

2013 Issuances:

In October 2013, we completed the private placement of €355.0 million aggregate principal amount of senior notes. The notes were issued in three3 tranches with €100.0 million bearing interest at 3.75% and due October 2033 (the “Tranche A 2033 Notes”), €130.0 million bearing interest of 3.15% and due October 2023 (the “Tranche B 2023 Notes) and €125.0 million bearing interest of 3.15% and due October 2023 (the “Tranche C 2023 Notes” and, collectively with the “Tranche A 2033 Notes and the “Tranche B 2023 Notes”, the “2013 Private Placement Notes”).

Interest on the Tranche A 2033 Notes is payable annually in arrears on October 7 each year, beginning October 7, 2014. Interest on the Tranche B 2023 Notes is payable annually in arrears on October 16 of each year beginning October 16, 2014. Interest on the Tranche C 2023 Notes is payable annually in arrears on October 18 of each year, beginning October 18, 2014. Net proceeds
95


2012 Issuances:

In June 2012, we completed the private placement of €325.0 million aggregate principal amount of notes. The notes were issued in 3 tranches with €150.0 million bearing interest at 3.40% and due June 2022 (the “Tranche A 2022 Notes”), €75.0 million bearing interest of 4.0% and due June 2027 (the “Tranche B 2027 Notes”) and €100.0 million bearing interest of 4.0% and due June 2032 (the “Tranche C 2032 Notes” and, collectively with the “Tranche A 2022 Notes and the “Tranche B 2027 Notes,” the “2012 Private Placement Notes”). Interest on the Tranche A 2022 Notes and the Tranche C 2032 Notes is payable annually in arrears on June 14 of each year beginning June 14, 2013. Interest on the Tranche B 2027 Notes is payable annually in arrears on June 15 of each year, beginning June 15, 2013.
The 2013 and 2012 Private Placement Notes were used for general corporate purposes. The 2013 Private Placement Notes contain contains usual and customary covenants and events of default for notes of this type. In the event of a change of control resulting in a downgrade in the rating of the notes below BBB-, the 2013 and 2012 Private Placement Notes may be redeemed early byat the request of any bondholder, at its sole discretion. The 2013 and 2012 Private Placement Notes are our unsecured obligations. The 2013 and 2012 Private Placement Notes will rank equally in right of payment with all of our existing and future unsubordinated debt.
Term loan - In December 2016, we entered into a £160.0 million term loan agreement to finance the Deep Explorer, a diving support vessel (“DSV”), maturing December 2028. Under the loan agreement, interest accrues at an annual rate of 2.813%. This loan agreement contains usual and customary covenants and events of default for loans of this type.
On December 30, 2019, we completed the acquisition of the remaining 50% interest in Technip Odebrecht. In connection with the acquisition, we assumed liabilities that included a $203.1 million term loan of which $16.0 million is due June 30, 2020 with the remaining balance due September 30, 2020. Immediately following the acquisition, we paid $13.1 million towards the outstanding balance. The debt is fully collateralized against our two vessels, Coral do Atlantico and Deep Star (previously referred to as Estrela do Mar).
Bank borrowings - In January 2019, we executed a sale-leaseback transaction to finance the purchase of a deepwater dive support vessel, Deep Discoverer (the “Vessel”) for the full transaction price of $116.8 million. The sale-leaseback agreement (“Charter”) was entered into with a French joint-stock company, owned by Credit Industrial et Commercial (“CIC”) which was formed for the sole purpose to purchase and act as the lessor of the Vessel. It is a variable interest


entity, which is fully consolidated in our condensed consolidated financial statements. The transaction was funded through debt of $96.2 million which is primarily long-term, expiring on January 8, 2031.
Foreign committed credit - We have committed credit lines at many of our international subsidiaries for immaterial amounts. We utilize these facilities for asset financing and to provide a more efficient daily source of liquidity. The effective interest rates depend upon the local national market.
NOTE 17. OTHER LIABILITIES
In the fourth quarter of 2016, we obtained voting control interests in legal Onshore/Offshore contract entities which own and account for the design, engineering and construction of the Yamal LNG plant. As part of this transaction, we recognized the fair value of the mandatorily redeemable financial liability.
A mandatorily redeemable financial liability of $268.8 million and $408.5 million was recognized as of December 31, 2019 and 2018, respectively, to account for the fair value of the non-controlling interests, for which $129.1 million and $173.0 million, respectively, was recorded as other current liabilities. During the year ended December 31, 2019 we revalued the liability to reflect current expectations about the obligation which resulted in the recognition of an expense of $423.1 million for the year ended December 31, 2019. Changes in the fair value of the financial liability are recorded as interest expense on the consolidated statements of income. Refer to Note 10 for further information regarding our other current liabilities. Refer to Note 25 for further information regarding the fair value measurement assumptions of the mandatorily redeemable financial liability and related changes in its fair value.
NOTE 18. STOCKHOLDERS’ EQUITY
Dividends declared andCash dividends paid during the years ended December 31, 2021, 2020 and 2019 2018 and 2017 were $232.8 million, $238.1nil, $59.2 million and $60.6$232.8 million, respectively.
As an English public limited company, we are required under U.K. law to have available “distributable reserves” to conduct share repurchases or pay dividends to shareholders. Distributable reserves are a statutory requirement and are not linked to a U.S. GAAP reported amount (e.g., retained earnings). The declaration and payment of dividends require the authorization of our Board of Directors, provided that such dividends on issued share capital may be paid only out of our “distributable reserves” on our statutory balance sheet. Therefore, we are not permitted to pay dividends out of share capital, which includes share premium. On November 27, 2019, we redeemed 50,000 redeemable shares of £1 each and cancelled one1 deferred ordinary share of £1 in the capital of TechnipFMC.
96


The following is a summary of our capital stock activity for the years ended December 31, 2019, 20182021, 2020 and 2017:2019:
(Number of shares in millions)
Ordinary
Shares Issued
 
Ordinary Shares
Held in 
Employee
Benefit Trust
 Treasury Stock(Number of shares in millions)Ordinary
Shares Issued
Ordinary Shares
Held in 
Employee
Benefit Trust
Treasury Stock
December 31, 2016119.2
 
 0.3
Net capital increases due to the merger of FMC Technologies and Technip347.4
 
 
December 31, 2018December 31, 2018450.5 0.1 — 
Stock awards0.6
 
 
Stock awards0.6 — — 
Treasury stock cancellation due to the merger of FMC Technologies and Technip
 
 (0.3)
Treasury stock purchases
 
 2.1
Treasury stock cancellation(2.1) 
 (2.1)
Net stock purchased for employee benefit trust
 0.1
 
December 31, 2017465.1
 0.1
 
Stock awards0.2
 
 
Treasury stock purchases
 
 14.8
Treasury stock cancellation(14.8) 
 (14.8)
Net stock purchased for employee benefit trust
 
 
December 31, 2018450.5
 0.1
 
Stock awards0.6
 
 
Treasury stock purchases
 
 4.0
Treasury stock purchases— — 4.0 
Treasury stock cancellation(4.0) 
 (4.0)Treasury stock cancellation(4.0)— (4.0)
Net stock purchased for employee benefit trust
 (0.1) 
Net stock purchased for employee benefit trust— (0.1)— 
December 31, 2019447.1
 
 
December 31, 2019447.1 — — 
Stock awardsStock awards2.4 — — 
December 31, 2020December 31, 2020449.5 — — 
Stock awardsStock awards1.2 — — 
December 31, 2021December 31, 2021450.7 — — 


The plan administrator of the Non-Qualified Plan purchases shares of our ordinary shares on the open market. Such shares are placed in a trust owned by a subsidiary.
In April 2017, the Board of Directors authorized thea share repurchase program of up to $500.0 million in ordinary shares under our share repurchase program. We implemented our share repurchase planand in September 2017. TheDecember 2018, the Board of Directors authorized an extension of thisthe share repurchase program addingof up to $300.0 million in December 2018 for a total of $800.0 million in ordinaryadditional shares. We repurchased 4.0 million of ordinary shares for a total consideration of $92.7 million duringDuring the yearyears ended December 31, 2021, 2020 and 2019, under ourwe repurchased nil, nil and $92.7 million of shares, respectively. As of December 31, 2021, we had $207.8 million of shares authorized share repurchase program. The $500.0 million part of the program was completed on December 20, 2018. We intend to cancel repurchasedfor repurchase. Repurchased shares are canceled and not hold themheld in treasury. Canceled treasury shares are accounted for using the constructive retirement method.
Accumulated other comprehensive income (loss) - Accumulated other comprehensive income (loss) consisted of the following:
(In millions)Foreign Currency
Translation
HedgingDefined Pension 
and Other
Post-Retirement
Benefits
Accumulated Other
Comprehensive 
Loss Attributable to
TechnipFMC plc
Accumulated Other
Comprehensive 
Loss Attributable
to Non-Controlling Interest
December 31, 2019$(1,230.1)$(5.8)$(171.6)$(1,407.5)$(4.7)
Other comprehensive income (loss) before reclassifications, net of tax(171.1)26.8 (92.9)(237.2)0.6 
Reclassification adjustment for net (gains) losses included in net income, net of tax— 13.0 9.2 22.2 — 
Other comprehensive income (loss), net of tax(171.1)39.8 (83.7)(215.0)0.6 
December 31, 2020$(1,401.2)$34.0 $(255.3)$(1,622.5)$(4.1)
Other comprehensive income (loss) before reclassifications, net of tax29.2 (19.8)70.8 80.2 (1.6)
Reclassification adjustment for net (gains) losses included in net income, net of tax— (11.8)18.0 6.2 — 
Other comprehensive income (loss), net of tax29.2 (31.6)88.8 86.4 (1.6)
Spin-off of Technip Energies213.6 (19.7)37.2 231.1 — 
December 31, 2021$(1,158.4)$(17.3)$(129.3)$(1,305.0)$(5.7)
(In millions)Foreign Currency
Translation
 Hedging Defined Pension 
and Other
Post-Retirement
Benefits
 Accumulated Other
Comprehensive 
Loss attributable to
TechnipFMC plc
 Accumulated Other
Comprehensive 
Loss attributable
to Noncontrolling interest
December 31, 2017$(1,014.6) $27.8
 $(16.9) $(1,003.7) $0.6
Other comprehensive income (loss) before reclassifications, net of tax(178.7) (58.7) (74.5) (311.9) (4.6)
Reclassification adjustment for net (gains) losses included in net income, net of tax(41.1) (2.0) (1.0) (44.1) 
Other comprehensive income (loss), net of tax(219.8) (60.7) (75.5) (356.0) (4.6)
December 31, 2018(1,234.4) (32.9) (92.4) (1,359.7) (4.0)
Other comprehensive income (loss) before reclassifications, net of tax16.3
 8.9
 (82.2) (57.0) (0.7)
Reclassification adjustment for net (gains) losses included in net income, net of tax(12.0) 18.2
 3.0
 9.2
 
Other comprehensive income (loss), net of tax4.3
 27.1
 (79.2) (47.8) (0.7)
December 31, 2019$(1,230.1) $(5.8) $(171.6) $(1,407.5) $(4.7)
97


Reclassifications out of accumulated other comprehensive income (loss) - Reclassifications out of accumulated other comprehensive income (loss) consisted of the following:
Year Ended December 31,
(In millions)202120202019
Details about Accumulated Other Comprehensive Loss ComponentsAmount Reclassified out of Accumulated Other Comprehensive LossAffected Line Item in the Consolidated Statement of Income
Gains on foreign currency translation$— $— $12.0 Other income (expense), net
Gains (losses) on hedging instruments
Foreign exchange contracts$(29.7)$(83.7)$(26.6)Revenue
10.7 68.5 12.0 Costs of sales
0.2 (0.4)— Selling, general and administrative expense
32.9 (4.4)(9.1)Other Income (expense), net
14.1 (20.0)(23.7)Income (loss) before income taxes
2.3 (7.0)(5.5)Provision (benefit) for income taxes
$11.8 $(13.0)$(18.2)Net income (loss)
Pension and other post-retirement benefits
Settlements and curtailments$(3.3)$(2.2)$(0.3)(a)
Amortization of actuarial gain (loss)(18.2)(9.0)(2.5)(a)
Amortization of prior service credit (cost)(0.5)(1.2)(1.0)(a)
(22.0)(12.4)(3.8)Income (loss) before income taxes
(4.0)(3.2)(0.8)Provision (benefit) for income taxes
$(18.0)$(9.2)$(3.0)Net income (loss)
(a)    These accumulated other comprehensive income components are included in the computation of net periodic pension cost (See Note 23 for further details).

  Year Ended  
(In millions) December 31, 2019 December 31, 2018 December 31, 2017  
Details about Accumulated Other Comprehensive Loss Components Amount Reclassified out of Accumulated Other Comprehensive Loss Affected Line Item in the Consolidated Statement of Income
Gains on foreign currency translation $12.0
 $41.1
 $
 Other income (expense), net
         
Gains (losses) on hedging instruments        
Foreign exchange contracts $(26.6) $(2.4) $(39.3) Revenue
  12.0
 3.4
 5.3
 Costs of sales
  
 (0.1) 0.8
 Selling, general and administrative expense
  (9.1) 1.0
 (102.2) Other Income (expense), net
  (23.7) 1.9
 (135.4) Income (loss) before income taxes
  (5.5) (0.1) (34.2) Provision (benefit) for income taxes
  $(18.2) $2.0
 $(101.2) Net income (loss)
         
Pension and other post-retirement benefits        
Settlements and curtailments (0.3) 3.0
 25.3
 (a)
Amortization of actuarial gain (loss) (2.5) (0.6) (2.5) (a)
Amortization of prior service credit (cost) (1.0) (1.3) (1.0) (a)
  (3.8) 1.1
 21.8
 Income (loss) before income taxes
  (0.8) 0.1
 9.1
 Provision (benefit) for income taxes
  $(3.0) $1.0
 $12.7
 Net income (loss)
(a)These accumulated other comprehensive income components are included in the computation of net periodic pension cost (see Note 23 for additional details).
NOTE 19. SHARE-BASED COMPENSATION
Incentive compensation and award plan - On January 11, 2017, we adopted the TechnipFMC plc Incentive Award Plan (the “Plan”). The Plan provides certain incentives and awards to officers, employees, non-employee directors and consultants of TechnipFMC and its subsidiaries. The Plan allows our Board of Directors to make various types of awards to non-employee directors and the Compensation Committee (the “Committee”) of the Board of Directors to make various types of awards to other eligible individuals. Awards may include share options, share appreciation rights, performance share units, restricted share units, restricted shares or other awards authorized under the Plan. All awards are subject to the Plan’s provisions, including all share-based grants previously issued by FMC Technologies and Technip prior to consummation of the Merger.merger of FMC Technologies and Technip S.A. (the “Merger”). Under the Plan, 24.1 million ordinary shares were authorized for awards. Atawards in 2017. On the record date of the Spin-off, 11.9 million shares remained available under the Plan, which were adjusted to reflect the Spin-off using an adjustment ratio, calculated as the ratio of the closing price of shares of TechnipFMC on the NYSE on the date immediately after the Spin-off. After this adjustment, 15.2 million ordinary shares remained authorized for awards under the Plan as of February 17, 2021. As of  December 31, 2019, 14.42021, 7.8 million ordinary shares were available for future grant.grant
The exercise price for options is determined by the Committee but cannot be less than the fair market value of our ordinary shares at the grant date. Restricted share and performance share unit grants generally vest after three years of service.
98


Under the Plan, our Board of Directors has the authority to grant non-employee directors share options, restricted shares, restricted share units and performance shares. Unless otherwise determined by our Board of Directors, awards to non-employee directors generally vest one year from the date of grant. All restricted share units awarded prior to 2020 will be settled when a non-executive director ceases services on the Board of Directors. Beginning with the 2020 equity award, non-executive directors now have the opportunity to elect the year in which they will take receipt of the equity grants from either (a) a period of 1 to 10 years from the grant date or (b) upon their separation from Board service. The elections are made prior to the beginning of the grant year and are irrevocable after December 31 of the year prior to grant. Restricted share units are settled when a director ceases services to the Board of Directors. AtAs of December 31, 2019,2021, outstanding awards to active and retired non-employee directors included 83.4184.6 thousand of share units.
The measurement of share-based compensation expense on restricted share awards is based on the market price and fair value at the grant date and the number of shares awarded. The fair value of performance shares is estimated using a combination of the closing stock price on the grant date and the Monte Carlo simulation model. We use Black-Scholes options pricing model to measure the fair value of stock options granted on or after January 1, 2017.


The share-based compensation expense for each award is recognized ratably over the applicable service period or the period beginning at the start of the service period and ending when an employee becomes eligible for retirement (currently age 62 under the plan)Plan), after taking into account estimated forfeitures.
We recognize compensation expense and the corresponding tax benefits for awards under the Plan. The compensation expense under the Plan isfor continuing operations was as follows:
 Year Ended December 31,
(In millions)2019 2018 2017
Share-based compensation expense$74.5
 $49.1
 $44.4
Income tax benefits related to share-based compensation expense$20.1
 $13.2
 $12.0

Year Ended December 31,
(In millions)202120202019
Share-based compensation expense$26.8 $38.3 $44.4 
Income tax benefits related to share-based compensation expense7.2 10.3 12.0 
In connection with the Spin-off and in accordance with the employee matters agreement, TechnipFMC has made certain adjustments to the exercise price and the number of share-based compensation awards. Share options and restricted share units were modified and converted into similar awards of the entity where the employee is working post the Spin-off using an adjustment ratio with the intention of preserving the intrinsic value of the awards prior to the Spin-off. Performance share units have been modified and converted to restricted share units at the target value using the adjustment ratio. The pre-tax share-based compensation expense due to the adjustments was $5.2 million in fiscal year 2021. All outstanding share awards and share options for employees transferred to Technip Energies were cancelled in connection with the Spin-off.
Additionally, in connection with the Spin-off, the Board of Directors approved amendments to certain outstanding long-term incentive awards on January 28, 2021. The amendments provided for the accelerated vesting on February 2, 2021 of certain stock-based awards that were otherwise scheduled to vest between June 1, 2021 and November 31, 2021.
As of December 31, 2019,2021, the portion of share-based compensation expense related to outstanding awards to be recognized in future periods is as follows:
 December 31, 2019
Share-based compensation expense not yet recognized (in millions)$76.9
Weighted-average recognition period (in years)1.7

December 31, 2021
Share-based compensation expense not yet recognized (in millions)$51.6 
Weighted-average recognition period (in years)1.4
Restricted Share Units
A summary of the non-vested restricted share unitsunits’ activity is as follows:
(Shares in thousands)Shares 
Weighted-Average 
Grant Date 
Fair Value
Non-vested at December 31, 20182,977.4
 $30.10
Granted1,969.1
 $21.24
Vested(347.1) $29.44
Cancelled/forfeited(73.5) $27.79
Non-vested at December 31, 20194,525.9
 $27.44
99


(Shares in thousands)SharesWeighted-Average 
Grant Date 
Fair Value
Non-vested as of December 31, 20206,121.9 $18.43 
Granted2,893.0 $7.97 
Vested(667.1)$37.57 
Cancelled/forfeited(882.6)$13.75 
Adjustment due to the Spin-off2,124.3 $12.37 
Non-vested as of December 31, 20219,589.5 $11.35 
The total grant date fair value of restricted stock share units vested during the years ended December 31, 2021, 2020 and 2019 and 2018 was $10.2$25.1 million, $51.8 million and $4.8$10.2 million, respectively.
Performance SharesShare Units
The Board of Directors has granted certain employees, senior executives and Directors or Officers restricteddirectors performance share units that vest subject to achieving satisfactory performances. For performance share units issued on or after January 1, 2017, performance is based on results of return on invested capital and total shareholder return (“TSR”).
For the performance share units which vest based on TSR, the fair value of performance shares is estimated using a combination of the closing stock price on the grant date and the Monte Carlo simulation model. The weighted-average fair value and the assumptions used to measure the fair value of performance share units subject to performance-adjusted vesting conditions in the Monte Carlo simulation model were as follows:
Year Ended December 31,Year Ended December 31,
2019 2018 2017202120202019
Weighted-average fair value (a)
$29.04 $41.97 $34.42
Weighted-average fair value (a)
$11.50$10.02$29.04
Expected volatility (b)
34.00% 34.00% 34.87%
Expected volatility (b)
62.70 %38.30 %34.00 %
Risk-free interest rate (c)
2.42% 2.37% 1.50%
Risk-free interest rate (c)
0.35 %0.40 %2.42 %
Expected performance period in years (d)
3.0
 3.0
 3.0
Expected performance period in years (d)
2.93.03.0
(a) The weighted-average fair value was based on performance share units granted during the period.
(b) Expected volatility is based on normalized historical volatility of our shares over a preceding period commensurate with the expected term of the option.performance share units.
(c) From 2017, theThe risk-free rate for the expected term of the optionperformance share units is based on the U.S. Treasury yield curve in effect at the time of grant.


(d) For awards subject to service-based vesting, due to the lack of historical exercise and post-vesting termination patterns of the post-Merger employee base, the expected term was estimated using a simplified method for all awards granted in 2019, 20182021, 2020 and 2017.2019.
A summary of the non-vested performance share unitunits’ activity is as follows:
(Shares in thousands)Shares Weighted-Average 
Grant Date 
Fair Value
Non-vested at December 31, 20183,043.8
 $27.02
Granted1,514.7
 $24.99
Vested(597.6) $22.30
Cancelled/forfeited(143.2) $27.94
Non-vested at December 31, 20193,817.7
 $28.52

(Shares in thousands)SharesWeighted-Average 
Grant Date 
Fair Value
Non-vested as of December 31, 20204,840.7 $17.55 
Granted2,426.2 $11.50 
Vested(111.3)$30.42 
Cancelled/forfeited(1,723.2)$16.03 
Adjustment due to the Spin-off(3,122.8)$12.37 
Non-vested as of December 31, 20212,309.6 $13.26 
The total grant date fair value of performance share units vested during years ended December 31, 2021, 2020 and 2019 2018 and 2017 was $13.3$3.4 million, $7.0$43.2 million and $33.3$13.3 million, respectively.
Share Option Awards
The fair value of each share option award is estimated as of the date of grant using the Black-Scholes options pricing model.
100


Share options awarded prior to 2017 were granted subject to performance criteria based upon certain targets, such as TSR, return on capital employed, and operating income from recurring activities. Subsequent share options granted are time basedtime-based awards vesting over three years.
There were no share option awards granted in 2021 or 2020. The weighted-average fair value and the assumptions used to measure fair value areof 2019 grant were as follows:
 Year Ended December 31,
 2019 2018 2017
Weighted-average fair value (a)
$5.64
 $9.07
 $8.79
Expected volatility (b)
32.5% 32.5% 35.7%
Risk-free interest rate (c)
2.5% 2.7% 2.1%
Expected dividend yield (d)
2.6% 2.0% 2.0%
Expected term in years (e)
6.5
 6.5
 6.5
(a)The weighted-averageDecember 31, 2019
Weighted-average fair value was based on stock options granted during the period.(a)
$5.64 
(b)
Expected volatility is based on normalized historical volatility of our shares over a preceding period commensurate with the expected term of the option.(b)
32.5 %
(c)From 2017, the risk-free
Risk-free interest rate for the expected term of the option is based on the U.S. Treasury yield curve in effect at the time of grant. Prior to 2017, the risk free rate was based on the bond yields from the European Central Bank.(c)
2.5 %
(d)Share options awarded in 2019, 2018 and 2017 were valued using an expectedExpected dividend yield of 2.6%, 2.0% and 2.0%, respectively.
2.6 %
(e)
Expected term in years (d)
For awards subject to service-based vesting, due to the lack of historical exercise and post-vesting termination patterns of the post-Merger employee base, the expected term was estimated using a simplified method for all awards granted in 2019, 2018 and 2017.6.5


(a)The weighted-average fair value was based on stock options granted during the period.
(b)Expected volatility is based on normalized historical volatility of our shares over a preceding period commensurate with the expected term of the option.
(c)The risk-free rate for the expected term of the option is based on the U.S. Treasury yield curve in effect at the time of grant.
(d)For awards subject to service-based vesting, due to the lack of historical exercise and post-vesting termination patterns of the post-Merger employee base, the expected term was estimated using a simplified method for all awards granted in 2019.
The following is a summary of share option transactions during yearsthe year ended December 31, 2019, 2018 and 2017:
2021:
Number of SharesWeighted average exercise priceWeighted average remaining life
(in years)
Number of Shares Weighted average exercise price Weighted average remaining life
(in years)
Balance as of December 31, 20162,188.8
 61.72
 5.0
Adjustments due to Merger (a)
2,188.8
 
 
Balance as of December 31, 2020Balance as of December 31, 20204,598.4 $29.77 4.2
Granted798.4
 29.29
 Granted— $— 
Exercised
 
 Exercised— $— 
Cancelled(292.2) 47.60
 Cancelled(532.0)$24.10 
Balance as of December 31, 20174,883.8
 36.35
 4.6
Granted602.2
 $30.70
 
Exercised
 $
 
Cancelled(827.6) $47.20
 
Balance as of December 31, 20184,658.4
 $33.68
 4.8
Granted800.0
 $20.98
 
Exercised
 $
 
Cancelled(616.0) $48.65
 
Balance as of December 31, 20194,842.4
 $29.68
 5.3
Exercisable at December 31, 20191,617.7
 $35.92
 3.0
Adjustment due to the Spin-offAdjustment due to the Spin-off(2,490.3)$— 
Balance as of December 31, 2021Balance as of December 31, 20211,576.1 $20.17 6.3
Exercisable as of December 31, 2021Exercisable as of December 31, 2021939.3 $22.99 5.6
(a)The Weighted-Average Grant Date Fair Value for the increase in shares due to the merger remains at $0.00 in order to recalculate the new weighted average for the December 31, 2016 non-vested shares (see Note 2).

The aggregate intrinsic value of stock options outstanding and stock options exercisable as of December 31, 20192021 was $0.4 millionNaN and NaN, respectively.
Cash received from the share option exercises was NaN, NaN and NaNnil, during each of the years ended December 31, 2019, 20182021, 2020 and 2017, respectively.2019. The total intrinsic value of share options exercised during each of the years ended December 31, 2021, 2020 and 2019 2018 and 2017 was NaN, NaN and NaN, respectively.nil. To exercise stockshare options, an employee may choose (1) to pay, either directly or by way of the group savings plan, the stockshare option strike price to obtain shares, or (2) to sell the shares immediately after having exercised the stockshare option (in this case, the employee does not pay the strike price but instead receives the intrinsic value of the stockshare options in cash).
The following summarizes significant ranges of outstanding and exercisable share options atas of December 31, 2019:2021:
 Options Outstanding Options Exercisable
Exercise Price Range
Number of options
(in thousands)
 Weighted average remaining life (in years) Weighted average exercise price 
Number of options
(in thousands)
 Weighted average exercise price
$20.00-$33.004,330.4
 5.7 $26.55
 1,105.7
 $26.54
$45.00-$51.0033.0
 2.0 $45.49
 33.0
 $45.49
$55.00-$57.00479.0
 1.4 $56.93
 479.0
 $56.93
Total4,842.4
 5.3 $29.68
 1,617.7
 $35.92
Options OutstandingOptions Exercisable
Exercise Price RangeNumber of options
(in thousands)
Weighted average remaining life (in years)Weighted average exercise priceNumber of options
(in thousands)
Weighted average exercise price
$16.00-$19.00636.7 7.2$16.46 — $— 
$20.00-$24.00721.2 5.6$22.28 721.2 $22.28 
$25.00-$26.00218.2 5.6$25.32 218.1 $25.32 
Total1,576.1 6.3$20.17 939.3 $22.99 
101


112


NOTE 20. IMPAIRMENT, RESTRUCTURING AND OTHER EXPENSEEXPENSES
Impairment, restructuring and other expenseexpenses were as follows:
Year Ended December 31,Year Ended December 31,
(In millions)2019 2018 2017(In millions)202120202019
Impairment expense     
Subsea$1,798.6
 $1,784.2
 $11.5
Subsea$53.5 $2,957.5 $1,748.4 
Onshore/Offshore
 
 
Surface Technologies685.5
 4.5
 10.2
Surface Technologies7.6 440.2 704.2 
Corporate and other
 3.9
 12.6
Corporate and other5.6 4.3 4.1 
Total impairment expense2,484.1
 1,792.6
 34.3
     
Restructuring and other expense     
Subsea$(46.4) $17.7
 $88.4
Onshore/Offshore17.0
 (3.4) 27.0
Surface Technologies18.7
 9.3
 9.0
Corporate and other17.4
 15.0
 32.8
Total restructuring and other expense6.7
 38.6
 157.2
Total impairment, restructuring and other expense$2,490.8
 $1,831.2
 $191.5
Total impairment, restructuring and other expensesTotal impairment, restructuring and other expenses$66.7 $3,402.0 $2,456.7 
Goodwill and Long-Lived Assets Impairments
Goodwill and long-lived assets impairments were as follows:
Year Ended December 31,
(In millions)202120202019
Subsea$44.2 $2,854.5 $1,794.8 
Surface Technologies1.9 419.3 685.5 
Corporate and other3.0 — — 
Total impairments$49.1 $3,273.8 $2,480.3 

Asset impairments - We conductSubsequent to the Spin-off, certain real estate rationalization actions were taken, and as a result, we recorded $24.2 million of impairment tests on long-livedcharges relating to our operating lease right-of-use assets whenever events or changesand $24.9 million of impairment of property, plant and equipment during the year ended December 31, 2021.
Due to the substantial decline in circumstances indicateglobal demand for oil caused by the carrying value may not be recoverable. The carrying value of a long-lived asset is not recoverable if it exceedsCOVID-19 pandemic in 2020 we reviewed the sum of the undiscounted cash flows expected to result from the use and eventual disposition over the asset’s remaining useful life. Our review of recoverability of the carrying valuefuture utilization of our assets considers several assumptions including the intended usevessels and service potential of our subsea service and surface equipment and determined that the asset. Refercarrying amount of our goodwill and some of our long-lived assets exceeded their respective fair values. We recorded $3,083.4 million and $190.4 million, respectively, related to Note 25goodwill and long-lived assets impairments. The $190.4 million of long-lived asset impairments during the year ended December 31, 2020 consisted of $88.4 million attributable to these consolidated financial statements for a discussionplant, equipment and various machinery infrastructure in our Subsea operating segment; $82.0 million mainly related to building and surface equipment in our Surface Technologies reportable segment; and $20.0 million of the method used to determine the fair value of these assets.operating lease right-of-use assets impairments.
The prolonged downturn in the energy market and its corresponding impact on our business outlook in 2019 led us to conclude the carrying amount of certain of our assets in our Subsea and Surface Technologies segments exceeded their fair value.value as of December 31, 2019. During the 2019 year we recorded $1,988.7 million and $491.6 million, respectively, related to goodwill and long-lived assets impairments. The $491.6 million of long-lived asset impairments during the year ended December 31, 2019, we recorded $2,484.1 millionprimarily consisted of impairment charges. These charges included the impairment of goodwill of $1,321.9 million and $666.8 million in our Subsea and Surface Technologies segments, respectively. These charges also included $495.4 million of asset impairments, including $153.8 million related to vessels in our Subsea operating segment and $168.9 million related to our flexible pipe and umbilical manufacturing facilities.
During the year ended December 31, 2018, we recorded $1,784.2 million of impairment chargesfacilities in our Subsea segment. These charges includedSurface Technologies reportable segment due to the prolonged downturn in the energy market and its corresponding impact on our business outlook.
Long-lived assets are reviewed for impairment whenever events or changes in circumstances indicate that carrying amounts of goodwillsuch assets may not be recoverable. Assessing the recoverability of assets to be held and vesselsused requires the use of $1,383.0 million and $372.9 million, respectively.
During the year ended December 31, 2017, our impairment expense was primarily relatedunobservable inputs, which involves significant judgment. Such judgments include expected future asset utilization while taking into account reduced future capital spending by certain customers in response to leasehold improvements, decommissioning vacant buildings and other long-lived assets.market conditions.

102


Restructuring and other - In December 2019, we initiated a company-wide reduction in workforce intended to reduce costs and better align our workforce with current and anticipated activity levels, which resulted in the recognition of severance costs relating to termination benefits and other restructuring charges. The initial plan included a workforce reduction of approximately 1,600 employees. Restructuring charges related to this global initiative was $32.4 millionOther Expenses
On December 30, 2019, the Company completed the acquisition of the remaining 50% of TOP CV, which resulted in a net loss of $0.9 million that was recorded in the Subsea segment. The net loss is comprised of an impairment charge of $84.2 million included within impairmentRestructuring and other charges and a bargain purchase gainprimarily consisted of $83.3 million included within restructuringseverance and other charges.employee related costs and COVID-19 related expenses across all segments. Restructuring and other expenses were as follows:
During 2018
Year Ended December 31,
202120202019
(In millions)Restructuring and other chargesRestructuring and other chargesCOVID-19 expensesRestructuring and other charges
Subsea$9.3 $52.9 $50.1 $(46.4)
Surface Technologies5.7 13.2 7.7 18.7 
Corporate and other2.6 4.3 — 4.1 
Total$17.6 $70.4 $57.8 $(23.6)
COVID-19 related expenses represent unplanned, one-off, incremental and 2017non-recoverable costs incurred solely as a result of the COVID-19 pandemic situation, which would not have been incurred otherwise. COVID-19 related expenses primarily included (a) employee payroll and travel, operational disruptions associated with quarantining, personnel travel restrictions to job sites, and shutdown of manufacturing plants and sites; (b) supply chain and related expediting costs of accelerated shipments for previously ordered and undelivered products; (c) costs associated with implementing additional information technology to support remote working environments; and (d) facilities-related expenses to ensure safe working environments.
Prolonged uncertainty in energy markets could lead to further future reductions in capital spending from our customer base. In turn, this may lead to changes in our strategy. We will continue to take actions designed to mitigate the adverse effects of the rapidly changing market environment and expect to continue to adjust our cost structure to market conditions. If market conditions continue to deteriorate, we initiated cost cutting measures resulting in the recognition of severance costs related to employee termination benefits, expenses related to the consolidationmay record additional restructuring charges and additional impairments of our facilitieslong-lived assets, operating lease right-of-use assets and other non-recurring charges.equity method investments.


NOTE 21. COMMITMENTS AND CONTINGENT LIABILITIES
Contingent liabilities associated with guarantees - In the ordinary course of business, we enter into standby letters of credit, performance bonds, surety bonds, and other guarantees with financial institutions for the benefit of our customers, vendors, and other parties. The majority of these financial instruments expire within five years. Management does not expect any of these financial instruments to result in losses that, if incurred, would have a material adverse effect on our consolidated financial position, results of operations, or cash flows.
Guarantees made by our consolidated subsidiaries consisted of the following:
(In millions)December 31, 2019
Financial guarantees (a)
$945.5
Performance guarantees (b)
4,916.0
Maximum potential undiscounted payments$5,861.5
(a)(In millions)December 31, 2021
Financial guarantees represent contracts that contingently require a guarantor to make payments to a guaranteed party based on changes in an underlying agreement that is related to an asset, a liability, or an equity security of the guaranteed party. These tend to be drawn down only if there is a failure to fulfill our financial obligations.(a)
$177.4 
(b)
Performance guarantees represent contracts that contingently require a guarantor to make(b)
1,069.0 
Maximum potential undiscounted payments to a guaranteed party based on another entity's failure to perform under a nonfinancial obligating agreement. Events that trigger payment are performance-related, such as failure to ship a product or provide a service.$1,246.4 
Management believes(a)Financial guarantees represent contracts that contingently require a guarantor to make payments to a guaranteed party based on changes in an underlying agreement that is related to an asset, a liability or an equity security of the guaranteed party. These tend to be drawn down only if there is a failure to fulfill our financial obligations.
(b)Performance guarantees represent contracts that contingently require a guarantor to make payments to a guaranteed party based on another entity's failure to perform under a nonfinancial obligating agreement. Events that trigger payment are performance-related, such as failure to ship a product or provide a service.
We believe the ultimate resolution of our known contingencies will not materially adversely affect our consolidated financial position, results of operations, or cash flows.
103


Contingent liabilities associated with legal and tax matters - We are involved in various pending or potential legal and tax actions or disputes in the ordinary course of our business. Management isThese actions and disputes can involve our agents, suppliers, clients, and venture partners, and can include claims related to payment of fees, service quality, and ownership arrangements, including certain put or call options. We are unable to predict the ultimate outcome of these actions because of their inherent uncertainty. However, management believeswe believe that the most probable, ultimate resolution of these matters will not have a material adverse effect on our consolidated financial position, results of operations or cash flows.
On March 28, 2016, FMC Technologies received an inquiry from the U.S. Department of Justice (“DOJ”) related to the DOJ's investigation of whether certain services Unaoil S.A.M. provided to its clients, including FMC Technologies, violated the U.S. Foreign Corrupt Practices Act (“FCPA”). On March 29, 2016, Technip S.A. also received an inquiry from the DOJ related to Unaoil. We cooperated with the DOJ's investigations and, with regard to FMC Technologies, a related investigation by the SEC.
In late 2016, Technip S.A. was contacted by the DOJ regarding its investigation of offshore platform projects awarded between 2003 and 2007, performed in Brazil by a joint venture company in which Technip S.A. was a minority participant, and we have also raised with the DOJ certain other projects performed by Technip S.A. subsidiaries in Brazil between 2002 and 2013. The DOJ has also inquired about projects in Ghana and Equatorial Guinea that were awarded to Technip S.A. subsidiaries in 2008 and 2009, respectively. We cooperated with the DOJ in its investigation into potential violations of the FCPA in connection with these projects. We contacted and cooperated with the Brazilian authorities (Federal Prosecution Service (“MPF”), the Comptroller General of Brazil (“CGU”) and the Attorney General of Brazil (“AGU”)) with their investigation concerning the projects in Brazil and have also contacted and are cooperating with French authorities (the Parquet National Financier (“PNF”)) with their investigation about these existing matters.
On June 25, 2019, we announced a global resolution to pay a total of $301.3 million to the DOJ, the SEC, the MPF, and the CGU/AGU to resolve these anti-corruption investigations. We will not be required to have a monitor and will, instead, provide reports on our anti-corruption program to the Brazilian and U.S. authorities for two and three years, respectively.
As part of this resolution, we entered into a three-year Deferred Prosecution Agreement (“DPA”) with the DOJ related to charges of conspiracy to violate the FCPA related to conduct in Brazil and with Unaoil. In addition, Technip USA, Inc., a U.S. subsidiary, pled guilty to one1 count of conspiracy to violate the FCPA related to conduct in Brazil. We will also provide the DOJ reports on our anti-corruption program during the term of the DPA.


In Brazil, our subsidiaries Technip Brasil - Engenharia, Instalações E Apoio Marítimo Ltda. and Flexibrás Tubos Flexíveis Ltda. entered into leniency agreements with both the MPF and the CGU/AGU. We have committed, as part of those agreements, to make certain enhancements to their compliance programs in Brazil during a two-year self-reporting period, which aligns with our commitment to cooperation and transparency with the compliance community in Brazil and globally.
In September 2019, the SEC approved our previously disclosed agreement in principle with the SEC Staff and issued an Administrative Order, pursuant to which we paid the SEC $5.1 million, which was included in the global resolution of $301.3 million.
To date, the investigation by PNF related to historical projects in Equatorial Guinea and Ghana has not reached resolution. We remain committed to finding a resolution with the PNF and will maintain a $70.0 million provision related to this investigation. Additionally, the PNF recently informed us that it is reviewing other historical projects in Angola. We are not aware of any evidence that would support a finding of liability with respect to these projects, whether the PNF would seek to impose any additional penalty. As we continue to progress our discussions with PNF towards a potential resolution of all of these matters, the amount of a settlement could exceed this provision.

There is no certainty that a settlement with PNF will be reached or that the settlement will not exceed current accruals. The PNF has a broad range of potential sanctions under anticorruption laws and regulations that it may seek to impose in appropriate circumstances including, but not limited to, fines, penalties, confiscations and modifications to business practices and compliance programs. Any of these measures, if applicable to us, as well as potential customer reaction to such measures, could have a material adverse impact on our business, results of operations, and financial condition. If we cannot reach a resolution with the PNF, we could be subject to criminal proceedings in France, the outcome of which cannot be predicted.
104


Contingent liabilities associated with liquidated damages - Some of our contracts contain provisions that require us to pay liquidated damages if we are responsible for the failure to meet specified contractual milestone dates and the applicable customer asserts a conforming claim under these provisions. These contracts define the conditions under which our customers may make claims against us for liquidated damages. Based upon the evaluation of our performance and other commercial and legal analysis, management believes we have appropriately recognized probable liquidated damages atas of December 31, 20192021 and 2018,2020, and that the ultimate resolution of such matters will not materially affect our consolidated financial position, results of operations, or cash flows.

NOTE 22. INCOME TAXES
Components of income (loss) from continuing operations before income taxes - U.S. and outside U.S. components of income (loss) from continuing operations before income taxes were as follows:
 Year Ended December 31,
(In millions)2019 2018 2017
United States$(1,406.5) $(197.0) $284.3
Outside United States$(729.3) $(1,291.1) $395.4
Income (loss) before income taxes$(2,135.8) $(1,488.1) $679.7

 Year Ended December 31,
(In millions)202120202019
United States$(288.2)$(2,169.3)$(2,376.4)
Outside United States486.3 (1,329.4)(194.7)
Income (loss) from continuing operations before income taxes$198.1 $(3,498.7)$(2,571.1)
Provision (benefit) for income tax - The provision for income taxes consisted of:
Year Ended December 31, Year Ended December 31,
(In millions)2019 2018 2017(In millions)202120202019
Current     Current
United States$34.7
 $52.1
 $30.2
United States$0.2 $(18.3)$39.1 
Outside United States317.0
 321.8
 373.7
Outside United States206.0 69.5 12.0 
Total current351.7
 373.9
 403.9
Total current income taxesTotal current income taxes206.2 51.2 51.1 
Deferred     Deferred
United States2.6
 19.5
 71.4
United States— (2.8)3.8 
Outside United States(78.0) 29.3
 70.2
Outside United States(95.1)(29.0)24.1 
Total deferred(75.4) 48.8
 141.6
Total deferred income taxesTotal deferred income taxes(95.1)(31.8)27.9 
Provision for income taxes$276.3
 $422.7
 $545.5
Provision for income taxes$111.1 $19.4 $79.0 
105


Deferred tax assets and liabilities - Significant components of deferred tax assets and liabilities were as follows: 
 December 31,
(In millions)2019 2018
Deferred tax assets attributable to   
Accrued expenses$124.4
 $128.0
Capital Loss21.1
 21.2
Non-deductible interest84.7
 89.3
Foreign tax credit carryforwards135.3
 105.9
Other tax credits113.2
 
Net operating loss carryforwards430.5
 382.8
Inventories6.3
 3.2
Research and development credit7.6
 6.5
Foreign exchange20.4
 32.5
Provisions for pensions and other long-term employee benefits84.1
 72.4
Contingencies related to contracts89.9
 83.7
Other contingencies73.4
 28.7
Margin recognition on construction contracts115.9
 34.4
Leasing219.8
 
Revenue in excess of billings on contracts accounted for under the percentage of completion method10.9
 
Other6.9
 15.2
Deferred tax assets1,544.4
 1,003.8
Valuation allowance(916.9) (683.4)
Deferred tax assets, net of valuation allowance627.5
 320.4
    
Deferred tax liabilities attributable to   
Revenue in excess of billings on contracts accounted for under the percentage of completion method
 9.2
U.S. tax on foreign subsidiaries’ undistributed earnings not indefinitely reinvested10.4
 9.4
Property, plant and equipment, intangibles and other assets279.6
 278.6
Leasing215.2
 
Deferred tax liabilities505.2
 297.2
Net deferred tax assets/(liabilities)$122.3
 $23.2

 December 31,
(In millions)20212020
Deferred tax assets attributable to
Accrued expenses$173.0 $133.0 
Capital loss21.1 21.1 
Non-deductible interest95.4 77.0 
Foreign tax credit carryforwards136.5 134.4 
Other tax credits146.0 163.8 
Net operating loss carryforwards455.5 383.5 
Inventories1.2 16.6 
Research and development credit3.8 2.9 
Foreign exchange17.2 — 
Provisions for pensions and other long-term employee benefits31.9 66.1 
Contingencies38.3 2.9 
Margin recognition on construction contracts18.0 20.6 
Leases183.4 170.4 
Other5.4 0.6 
Deferred tax assets1,326.7 1,192.9 
Valuation allowance(935.5)(815.1)
Deferred tax assets, net of valuation allowance391.2 377.8 
Deferred tax liabilities attributable to
Revenue in excess of billings on contracts accounted for under the percentage of completion method32.2 33.6 
U.S. tax on foreign subsidiaries’ undistributed earnings not indefinitely reinvested— 4.2 
Property, plant and equipment, intangibles and other assets162.8 180.1 
Foreign exchange— 43.9 
Leases169.4 161.1 
Deferred tax liabilities364.4 422.9 
Net deferred tax assets/(liabilities)$26.8 $(45.1)
At December 31, 20192021 and 2018,2020, the carrying amount of net deferred tax assets and the related valuation allowance included the impact of foreign currency translation adjustments.
Non-deductible interest. At December 31, 2019,2021, deferred tax assets include tax benefits related to certain intercompany interest costs which are not currently deductible, but which may be deductible in future periods. If not utilized, these costs will become permanently non-deductible beginning in 2025. Management believes that it is more likely than not that we will not be able to deduct these costs before expiration of the carry forward period; therefore, we have established aan uncertain tax position and valuation allowance against the related deferred tax assets.
Foreign tax credit carryforwards. At December 31, 2019,2021, deferred tax assets included U.S. foreign tax credit carryforwards of $135.3$136.5 million, which, if not utilized, will begin to expire in 2024.2023. Realization of these deferred tax assets is dependent on the generation of sufficient U.S. taxable income prior to the above date. Based on long-term forecasts of operating results, management believes that it is more likely than not that our U.S. earnings over the forecast period will not result in sufficient U.S. taxable income to fully realize these deferred tax assets; therefore, we have established a valuation allowance against the related deferred tax assets. In its analysis, management has considered the effect of deemed dividends and other expected adjustments to U.S. earnings that are required in determining U.S. taxable income. Non-U.S. earnings subject to U.S. tax, including deemed dividends for U.S. tax purposes, were $3.8$19.5 million in 2019, $307.62021, $0.1 million in 20182020 and $1.3 billion$21.4 million in 2017.2019.

106


Net operating loss carryforwards. As ofAt December 31, 2019, deferred tax assets included tax benefits related to net operating loss carryforwards. If not utilized, these2021, we had $455.5 million of tax-effected net operating loss carryforwards, will beginwith approximately $23.5 million estimated to expire in 2020. Management believes it is more likely than not that we will not be able to utilize certainutilized against our unrecognized tax benefits. The ultimate realization of these operating loss carryforwards before expiration; therefore, we have established a valuation allowance against the related deferred tax assets.
The majority of the net operating loss carryforwards are in Brazil, Canada, Malaysia, Mexico, Netherlands, Norway , Saudi Arabia, U.K., and United States. Except in Canada, Mexico, and Netherlands, all of these tax loss carryforwards extend indefinitely.
Certain Adjustments to Valuation Allowance. The net increase in valuation allowance from December 31, 2018 to December 31, 2019 includes certain adjustments which did not impact net tax expense. These adjustments include $105.9 million of deferred tax assets which were recorded in 2019 and are relateddepends on our ability to certain previously unrecorded tax creditsgenerate sufficient taxable income in the Netherlands and Malaysia that are subject to a full valuation allowance. In addition, the Company wrote off $42.0 million of fully valuedappropriate taxing jurisdiction. Our deferred tax assets including $33.0 million that were recorded by certain affiliates that were sold in 2018 and 2019. The Company also reclassified $17.9 million of fully valued deferred tax assets the future tax benefits of which are based on uncertain tax positions.from net operating losses will expire as follows:
(In millions)Net Operating Loss
2022 – 2026$55.4 
2027 – 203142.0 
2032 – 204270.1 
Non-Expiring288.0 
$455.5 
Unrecognized tax benefits - The following table presents a summary of changes in our unrecognized tax benefits: 
(In millions)
Federal,
State and
Foreign
Tax
Balance as of December 31, 2017$90.4
Reductions for tax positions related to prior years(11.5)
Additions for tax positions related to current year21.1
Reductions for tax positions due to settlements(9.0)
Balance as of December 31, 2018$91.0
Reductions for tax positions related to prior years(62.4)
Additions for tax positions related to current year72.9
Reductions for tax positions due to settlements(20.8)
Balance as of December 31, 2019$80.7

(In millions)Federal,
State and
Foreign
Tax
Balance at December 31, 2019$57.6 
Reductions for tax positions related to prior years(7.9)
Reductions for tax positions related to current year(2.9)
Reductions for tax positions due to settlements(0.6)
Balance at December 31, 202046.2 
Reductions for tax positions related to prior years(15.2)
Additions for tax positions related to current year39.9 
Reductions for tax positions due to settlements(2.1)
Balance at December 31, 2021$68.8 
The amounts reported above for uncertain tax positions excludes interest and penalties of $0.1$0.2 million, $2.8$0.6 million, and $5.9 million atNaN for the years ended December 31, 2019, 2018,2021, 2020, and 2017,2019, respectively. Interest and penalties relating to these uncertain tax positions arewere included in income tax expense in our Consolidated Financial Statements.consolidated statements of income. It is reasonably possible that within twelve months, $2.1$14.3 million of liabilitiesassets for unrecognized tax benefits will be settled. This amount is reflected in income taxes payable, the remaining balance of the unrecognized tax benefitsbenefit is recorded in other long term liabilities. As of December 31, 2021, a net $32.5 million unrecognized tax benefit, without a net operating loss carryforward or other deferred tax asset to offset, would positively impact the effective tax rate and be recognized as additional tax benefits in our statement of operations if resolved in our favor.
We operate in numerous jurisdictions around the world and could be subject to multiple tax audits at any given time. Most notably, the following tax years and thereafter remain subject to examination: 20102012 for Norway, 2016 for Nigeria, 20152017 for Brazil, 20172019 for France, and 20162018 for the United States.
TechnipFMC plc is a public limited company incorporated under the laws of England and Wales. Therefore, our earnings are subject to the United KingdomU.K. statutory rate which is 19.0% for 20192021, 2020, and 2018, and 19.3% for 2017.2019.

107


Effective income tax rate reconciliation - The effective income tax rate was different from the statutory U.K. income tax rate due to the following:
 Year Ended December 31,
 2019 2018 2017
Statutory income tax rate19.0 % 19.0 % 19.3 %
Net difference resulting from     
Foreign earnings subject to different tax rates0.3 % (9.7)% 18.2 %
Net change in unrecognized tax benefits1.3 % (0.7)% 4.3 %
Adjustments on prior year taxes(0.4)% (0.7)% (4.4)%
Change in valuation allowance(8.8)% (14.4)% 19.3 %
Deferred tax asset/liability revaluation for tax rate change(0.5)% (1.7)% 1.4 %
U.S. transition tax % (0.8)% 17.1 %
Impairments(21.9)% (16.5)%  %
Non-deductible legal provision(0.8)% (3.8)%  %
Other(1.1)% 0.9 % 5.1 %
Effective income tax rate(12.9)% (28.4)% 80.3 %

U.S. Tax Cuts and Jobs Act (TCJA) and Other Jurisdictional Tax Reform. Included in the 2017 and 2018 provisions for income taxes are taxes related to the deemed repatriation to the United States of foreign earnings. The Tax Cuts and Jobs Act (TCJA), signed into U.S. law on December 22, 2017, made significant changes to the U.S. federal income taxation of non-U.S. corporate subsidiaries that are controlled by one or more U.S. shareholders. As part of these changes, the TCJA required a deemed repatriation of all accumulated non-U.S. earnings.
The TCJA generally requires that, for the last taxable year of a non-U.S. corporation beginning before January 1, 2018, all U.S. shareholders of such a corporation that is at least 10-percent U.S.-owned must include in income their pro rata share of the corporation’s accumulated post-1986 deferred foreign income that was not previously subject to U.S. tax. Accordingly, the Company recorded income tax expense of approximately $148.7 million in 2017 associated with the deemed repatriation of approximately $2.6 billion of non-U.S. earnings that were not previously subject to U.S. tax. The company recorded additional income tax expense of $11.8 million in 2018 associated with the deemed repatriation of approximately $307 million of non-U.S. earnings that were not previously subject to U.S. tax.
As a result of the deemed repatriation, U.S. income tax has been provided on all undistributed earnings of non-U.S. subsidiaries of the Company’s U.S. affiliates as of December 31, 2017. The cumulative balance of these undistributed earnings was approximately $2.9 billion as of December 31, 2017.
Also included in the 2017 provision for income taxes is the result of the revaluation of deferred tax attributes as a result of changes in corporate tax rates as part of jurisdictional tax reform. The tax expense from the revaluation of U.S. deferred tax attributes is $18.9 million. The tax benefit from the revaluation of deferred tax attributes in other foreign jurisdictions is $9.7 million. For 2018, the tax expense from jurisdictional corporate tax rate reform is $25.6 million.
 Year Ended December 31,
 202120202019
Statutory income tax rate19.0 %19.0 %19.0 %
Net difference resulting from
Foreign earnings subject to different tax rates24.4 %1.3 %3.4 %
Adjustments to prior year taxes(52.4)%(1.2)%0.8 %
Net change in unrecognized tax benefits12.3 %— %— %
Changes in valuation allowance65.4 %(0.9)%(7.2)%
Deferred tax asset/liability revaluation for tax rate change(12.2)%0.3 %(0.4)%
Impairments— %(19.5)%(19.7)%
Non-deductible legal provision— %0.3 %1.1 %
Other(0.4)%0.1 %(0.1)%
Effective income tax rate56.1 %(0.6)%(3.1)%
Income tax holidays. We did not benefit from income tax holidays in Singapore and Malaysia which will expire after 2023 for Singapore and 2020 for Malaysia. For the year ended December 31, 2019, these tax holidays reduced our provision for income taxes by $3.4 million, or $0.01 per share on a diluted basis.2021.

NOTE 23. PENSION AND OTHER POST-RETIREMENT BENEFIT PLANS
We have funded and unfunded defined benefit pension plans, which provide defined benefits based on years of service and final average salary.
On December 31, 2017, we amended the U.S. retirement plans (the “Plans”) to freeze benefit accruals for all participants of the Plans as of December 31, 2017. After that date, participants in the Plans will no longer accrue any further benefits and participants’ benefits under the Plans will be determined based on credited service and eligible earnings as of December 31, 2017.


Foreign-based employees are eligible to participate in TechnipFMC-sponsored or government-sponsored benefit plans to which we contribute. Several of the foreign defined benefit pension plans sponsored by us provide for employee contributions; the remaining plans are noncontributory. The most significant of these plans are in the Netherlands, France, and the United Kingdom.
We have other post-retirement benefit plans covering substantially all of our U.S. unionized employees. The post-retirement health care plans are contributory; the post-retirement life insurance plans are noncontributory.
We are required to recognize the funded status of defined benefit post-retirement plans as an asset or liability in the consolidated balance sheet and recognize changes in that funded status in comprehensive income (loss) in the year in which the changes occur. Further, we are required to measure the plan’s assets and its obligations that determine its funded status as of the date of the consolidated balance sheet. We have applied this guidance to our domestic pension and other post-retirement benefit plans as well as for many of our non-U.S. plans, including those in the United Kingdom, Germany, France and Canada. Pension expense measured in compliance with GAAP for the other non-U.S. pension plans is not materially different from the locally reported pension expense.

In connection with the Spin-off, certain international plans were transferred to Technip Energies and reported as discontinued operations for the years ended December 31, 2020 and 2019.

The funded status of our U.S. Pension Plans, certain foreign pension plans and U.S. post-retirement health care and life insurance benefit plans, together with the associated balances recognized in our consolidated balance sheets as of December 31, 20192021 and 2018,2020, were as follows:
 Pensions 
Other
Post-retirement
Benefits
 2019 2018 2019 2018
(In millions)U.S. Int’l U.S. Int’l    
Accumulated benefit obligation$669.6
 $773.3
 $598.1
 $664.3
    
Projected benefit obligation at January 1$598.1
 $753.4
 $659.8
 $898.1
 $9.5
 $10.0
Service cost
 16.3
 0.2
 21.2
 
 
Interest cost25.6
 18.3
 23.8
 20.9
 0.5
 0.4
Actuarial (gain) loss80.7
 102.8
 (47.9) (40.0) 1.4
 (0.2)
Amendments
 0.9
 0.3
 2.7
 
 0.1
Curtailments
 
 
 (4.0) 
 
Settlements
 (0.6) (5.3) (89.0) 
 (0.1)
Foreign currency exchange rate changes
 11.1
 
 (25.7) (0.1) 
Plan participants’ contributions
 1.1
 
 1.2
 
 
Benefits paid(34.7) (25.7) (32.8) (31.7) (0.5) (0.5)
Other
 3.4
 
 (0.3) (0.2) (0.2)
Projected benefit obligation at December 31669.7
 881.0
 598.1
 753.4
 10.6
 9.5
Fair value of plan assets at January 1477.4
 570.6
 576.4
 699.2
 
 
Actual return on plan assets72.0
 89.1
 (70.7) (16.0) 
 
Company contributions
 6.9
 
 18.5
 
 
Foreign currency exchange rate changes
 13.5
 
 (20.9) 
 
Settlements
 
 
 (87.6) 
 
Plan participants’ contributions
 1.1
 
 1.2
 
 
Benefits paid(29.4) (19.6) (28.3) (23.3) 
 
Other
 (3.8) 
 (0.5) 
 
Fair value of plan assets at December 31520.0
 657.8
 477.4
 570.6
 
 
Funded status of the plans (liability) at December 31$(149.7) $(223.2) $(120.7) $(182.8) $(10.6) $(9.5)
 Pensions 
Other
Post-retirement
Benefits
 2019 2018 2019 2018
(In millions)U.S. Int’l U.S. Int’l    
Current portion of accrued pension and other post-retirement benefits(5.5) (8.8) (5.5) (7.9) (0.6) (0.7)
Accrued pension and other post-retirement benefits, net of current portion(144.2) (214.4) (115.2) (174.9) (10.0) (8.8)
Funded status recognized in the consolidated balance sheets at December 31$(149.7) $(223.2) $(120.7) $(182.8) $(10.6) $(9.5)
108


 PensionsOther
Post-retirement
Benefits
 2021202020212020
(In millions)U.S.Int’lU.S.Int’l  
Accumulated benefit obligation$653.6 $589.1 $684.7 $598.1 
Projected benefit obligation at January 1$684.7 $656.4 $669.7 $585.1 $9.4 $10.2 
Service cost— 10.0 — 10.4 — — 
Interest cost18.0 9.8 22.2 11.3 0.3 0.4 
Actuarial (gain) loss7.1 (32.5)53.9 30.4 (0.7)(0.2)
Settlements(22.6)— (25.6)(2.6)— — 
Foreign currency exchange rate changes— (11.9)— 23.6 (0.2)(0.6)
Plan participants’ contributions— 0.9 — 1.1 — — 
Benefits paid(33.6)(22.0)(35.5)(17.8)(0.4)(0.4)
Other— (9.1)— 14.9 — — 
Projected benefit obligation as of December 31653.6 601.6 684.7 656.4 8.4 9.4 
Fair value of plan assets at January 1483.7 591.5 520.0 521.2 — — 
Actual return on plan assets61.1 46.4 14.3 40.1 — — 
Company contributions28.9 19.6 — 27.1 — — 
Foreign currency exchange rate changes— (8.9)— 20.4 — — 
Settlements(22.6)— (19.6)(1.9)— — 
Plan participants’ contributions— 0.9 — 1.1 — — 
Benefits paid(33.6)(22.0)(31.0)(15.8)— — 
Other— — — (0.7)— — 
Fair value of plan assets as of December 31517.5 627.5 483.7 591.5 — — 
Funded status of the plans (liability) as of December 31$(136.1)$25.9 $(201.0)$(64.9)$(8.4)$(9.4)
 PensionsOther
Post-retirement
Benefits
 2021202020212020
(In millions)U.S.Int’lU.S.Int’l  
Current portion of accrued pension and other post-retirement benefits$(2.9)$(1.7)$(4.6)$(1.6)$(0.6)$(0.7)
Accrued pension and other post-retirement benefits, net of current portion(133.2)27.6 (196.4)(63.3)(7.8)(8.7)
Funded status as of December 31$(136.1)$25.9 $(201.0)$(64.9)$(8.4)$(9.4)
109


The following table summarizes the pre-tax amounts in accumulated other comprehensive (income) loss atas of December 31, 20192021 and 20182020 that have not been recognized as components of net periodic benefit cost:
 Pensions 
Other
Post-retirement
Benefits
 2019 2018 2019 2018
(In millions)U.S. Int’l U.S. Int’l    
Pre-tax amounts recognized in accumulated other comprehensive (income) loss           
Unrecognized actuarial (gain) loss$121.6
 $90.7
 $73.2
 $43.7
 $1.9
 $0.6
Unrecognized prior service (credit) cost
 7.0
 
 7.0
 
 
Accumulated other comprehensive (income) loss at December 31$121.6
 $97.7
 $73.2
 $50.7
 $1.9
 $0.6

 PensionsOther
Post-retirement
Benefits
 2021202020212020
(In millions)U.S.Int’lU.S.Int’l  
Pre-tax amounts recognized in accumulated other comprehensive (income) loss
Unrecognized actuarial loss$156.6 $15.9 $198.4 $79.1 $0.4 $1.3 
Unrecognized prior service cost— 3.4 — 3.9 — — 
Accumulated other comprehensive (income) loss as of December 31$156.6 $19.3 $198.4 $83.0 $0.4 $1.3 
The following tables summarize the projected and accumulated benefit obligations and fair values of plan assets where the projected or accumulated benefit obligation exceeds the fair value of plan assets atas of December 31, 20192021 and 2018:2020:
Pensions 
Other
Post-retirement
Benefits
PensionsOther
Post-retirement
Benefits
2019 2018 2019 2018 2021202020212020
(In millions)U.S. Int’l U.S. Int’l    (In millions)U.S.Int’lU.S.Int’l  
Plans with underfunded or non-funded projected benefit obligation           Plans with underfunded or non-funded projected benefit obligation
Aggregate projected benefit obligation$668.4
 $741.2
 $598.1
 $621.1
 $10.7
 $9.5
Aggregate projected benefit obligation$652.2 $57.9 $684.7 $513.1 $8.4 $9.4 
Aggregate fair value of plan assets$518.8
 $522.8
 $477.4
 $439.8
 $
 $
Aggregate fair value of plan assets$516.0 $— $483.7 $442.7 $— $— 
 PensionsOther
Post-retirement
Benefits
 2021202020212020
(In millions)U.S.Int’lU.S.Int’l  
Plans with underfunded or non-funded accumulated benefit obligation
Aggregate accumulated benefit obligation$652.2 $46.7 $684.7 $50.8 $— $— 
Aggregate fair value of plan assets$516.0 $— $483.7 $— $— $— 
110


 Pensions 
Other
Post-retirement
Benefits
 2019 2018 2019 2018
(In millions)U.S. Int’l U.S. Int’l    
Plans with underfunded or non-funded accumulated benefit obligation           
Aggregate accumulated benefit obligation$668.4
 $292.1
 $598.1
 $269.2
 $
 $
Aggregate fair value of plan assets$518.8
 $140.3
 $477.4
 $126.6
 $
 $


The following table summarizes the components of net periodic benefit cost (income) for the years ended December 31, 2019, 20182021, 2020 and 2017:
 Pensions 
Other Post-retirement
Benefits
 2019 2018 2017 2019 2018 2017
(In millions)U.S. Int’l U.S. Int’l U.S. Int’l      
Components of net periodic benefit cost (income)                 
Service cost$
 $16.3
 $0.2
 $21.2
 $10.3
 $21.0
 $
 $
 $
Interest cost25.6
 18.3
 23.8
 20.9
 26.7
 19.6
 0.5
 0.4
 0.3
Expected return on plan assets(41.6) (33.5) (50.1) (41.2) (45.5) (36.3) 
 
 
Settlement cost
 0.3
 0.4
 0.4
 
 1.5


Curtailment benefit
 
 
 (3.8) (26.8) 


Amortization of net actuarial loss (gain)1.8
 0.7
 
 0.6
 
 2.5


Amortization of prior service cost (credit)
 1.0
 
 1.3
 
 1.0


Net periodic benefit cost (income)$(14.2) $3.1
 $(25.7) $(0.6) $(35.3) $9.3
 $0.5
 $0.4
 $0.3

2019:
 PensionsOther Post-retirement
Benefits
 202120202019202120202019
(In millions)U.S.Int’lU.S.Int’lU.S.Int’l   
Components of net periodic benefit cost (income)
Service cost$— $10.0 $— $10.4 $— $7.0 $— $— $— 
Interest cost18.0 9.8 22.2 11.3 25.6 13.7 0.3 0.4 0.5 
Expected return on plan assets(31.9)(25.0)(45.4)(36.5)(41.6)(31.3)— — — 
Settlement cost2.8 — 1.4 0.5 — — — — — 
Curtailment benefit— 0.4 — — — — — — — 
Amortization of net actuarial loss (gain)16.8 1.4 6.9 0.6 1.8 0.3 0.1 0.1 — 
Amortization of prior service cost (credit)— 0.5 — 0.6 — 0.4 — — — 
Net periodic benefit cost (income)$5.7 $(2.9)$(14.9)$(13.1)$(14.2)$(9.9)$0.4 $0.5 $0.5 
The following table summarizes changes in plan assets and benefit obligations recognized in other comprehensive income (loss) for the years ended December 31, 2019, 20182021, 2020 and 2017:
 Pensions 
Other Post-retirement
Benefits
 2019 2018 2017 2019 2018 2017
(In millions)U.S. Int’l U.S. Int’l U.S. Int’l      
Changes in plan assets and benefit obligations recognized in other comprehensive income (loss)                 
Net actuarial gain (loss) arising during period$(50.2) $(47.3) $(73.5) $(15.3) $26.7
 $43.3
 $
 $
 $(0.8)
Prior service (cost) credit arising during period
 (0.9) 0.2
 (2.7) (0.2) 0.1


Settlements and curtailments
 0.3
 0.4
 (3.4) (26.8) 1.5


Amortization of net actuarial loss (gain)1.8
 0.7
 
 0.6
 
 2.5


Amortization of prior service cost (credit)
 1.0
 
 1.3
 
 1.0


Other
 (0.8) 
 1.4
 
 (5.1) (0.1) (0.1) 
Total recognized in other comprehensive income (loss)$(48.4) $(47.0) $(72.9) $(18.1) $(0.3) $43.3
 $(0.1) $(0.1) $(0.8)

2019:
 PensionsOther Post-retirement
Benefits
 202120202019202120202019
(In millions)U.S.Int’lU.S.Int’lU.S.Int’l   
Changes in plan assets and benefit obligations recognized in other comprehensive income (loss)
Net actuarial gain (loss) arising during period$(22.1)$(58.4)$(85.1)$(26.8)$(50.2)$(37.5)$— $— $— 
Prior service (cost) credit arising during period— 0.6 — — — (0.9)— — — 
Settlements and curtailments(2.8)(0.4)1.4 0.4 — — — — — 
Amortization of net actuarial loss (gain)(16.8)(1.4)6.9 0.6 1.8 0.3 — (0.1)— 
Amortization of prior service cost (credit)— (0.5)— 0.6 — 0.4 — — — 
Other— — — (7.5)— (1.5)(0.9)(0.6)1.5 
Total recognized in other comprehensive income (loss)$(41.7)$(60.1)$(76.8)$(32.7)$(48.4)$(39.2)$(0.9)$(0.7)$1.5 
Included in accumulated other comprehensive income (loss) atas of December 31, 2019,2021, are noncash, pre-tax charges which have not yet been recognized in net periodic benefit cost (income). The estimated amounts expected to be amortized from the portion of each component of accumulated other comprehensive income (loss) as a component of net period benefit cost (income), during the next fiscal year are as follows:
 Pensions 
Other
Post-retirement
Benefits
(In millions)U.S. Int’l  
Net actuarial losses (gains)$6.9
 $1.9
 $
Prior service cost (credit)$
 $1.1
 $
PensionsOther
Post-retirement
Benefits
(In millions)U.S.Int’l
Net actuarial losses$12.0 $— $— 
Prior service cost$— $0.4 $— 
111


Key assumptions - The following weighted-average assumptions were used to determine the benefit obligations: 
 Pensions 
Other
Post-retirement
Benefits
 2019 2018 2019 2018
 U.S. Int’l U.S. Int’l    
Discount rate3.40% 1.70% 4.40% 2.54% 4.31% 5.04%
Rate of compensation increaseN/A
 2.39% N/A
 2.24% 4.00% 4.00%

 PensionsOther
Post-retirement
Benefits
 2021202020212020
 U.S.Int’lU.S.Int’l  
Discount rate2.90 %1.99 %2.70 %1.48 %5.26 %3.63 %
Rate of compensation increaseN/A3.15 %N/A2.93 %4.00 %4.00 %
The following weighted-average assumptions were used to determine net periodic benefit cost: 
 Pensions 
Other
Post-retirement
Benefits
 2019 2018 2017 2019 2018 2017
 U.S. Int’l U.S. Int’l U.S. Int’l      
Discount rate4.40% 2.56% 3.70% 2.39% 4.30% 2.37% 5.04% 4.33% 4.05%
Rate of compensation increaseN/A
 2.34% N/A
 2.39% 4.00% 2.39% 4.00% 4.00% 4.00%
Expected rate of return on plan assets8.65% 5.04% 8.57% 4.90% 9.00% 6.24% N/A
 N/A
 N/A

 PensionsOther
Post-retirement
Benefits
202120202019202120202019
 U.S.Int’lU.S.Int’lU.S.Int’l   
Discount rate2.70 %3.09 %3.40 %2.01 %4.40 %2.89 %4.46 %4.48 %5.32 %
Rate of compensation increaseN/A3.15 %N/A3.84 %N/A3.80 %4.00 %4.00 %4.00 %
Expected rate of return on plan assets6.75 %2.22 %7.75 %7.27 %8.65 %7.15 %N/AN/AN/A
Our estimate of expected rate of return on plan assets is primarily based on the historical performance of plan assets, current market conditions, our asset allocation and long-term growth expectations.
Plan assets - We actively monitor how the duration and the expected yield of the investments are matching the expected cash outflows arising from the pension obligations. We have not changed the processes used to manage its risks from previous periods. Investments are well diversified, such that the failure of any single investment would not have a material impact on the overall level of assets. Our pension investment strategy emphasizesemphasizes maximizing returns consistent with balancing risk. Excluding our international plans with insurance-based investments, 99% of98.8% of our total pension plan assets represent the U.S. qualified plan the U.K. plan and the NetherlandsU.K. plan. These plans are primarily invested in equity securities to maximize the long-term returns of the plans. The investment managers of these assets, including the hedge funds and limited partnerships, use Graham and Dodd fundamental investment analysis to select securities that have a margin of safety between the price of the security and the estimated value of the security. This value-oriented approach tends to mitigate the risk of a large equity allocation.
The following is a description of the valuation methodologies used for the pension plan assets. There have been no changes in the methodologies used atas of December 31, 20192021 and 2018.2020.
Cash is valued at cost, which approximates fair value.
Equity securities are comprised of common stock and preferred stock. The fair values of equity securities are valued at the closing price reported on the active market on which the securities are traded.
Fair values of registered investment companies and common/collective trusts are valued based on quoted market prices, which represent the net asset value (“NAV”) of shares held. Registered investment companies primarily include investments in emerging market bonds. Common/collective trusts primarily includes money market instruments with short maturities.
Insurance contracts are valued at book value, which approximates fair value, and is calculated using the prior-year balance plus or minus investment returns and changes in cash flows.
The fair values of hedge funds are valued using the NAV as determined by the administrator or custodian of the fund. The funds primarily invest in U.S. and international equities, debt securities and other hedge funds.
The fair values of limited partnerships are valued using the NAV as determined by the administrator or custodian of the fund. The partnerships primarily invest in U.S. and international equities and debt securities.
112


Real estate and other investments primarily consistsconsist of real estate investment trusts and other investments. These investments are measured at quoted market prices, which represent the NAV of the securities held in such funds at year end.


Our pension plan assets measured at fairfair value on a recurring basis are as follows atas of December 31, 20192021 and 2018.2020. Refer to “Fair value measurements” in Note 1 to these consolidated financial statements for a description of the levels.
(In millions)U.S. International(In millions)U.S.International
December 31, 2019Total Level 1 Level 2 Level 3 Total Level 1 Level 2 Level 3
December 31, 2021December 31, 2021TotalLevel 1Level 2Level 3
Net Asset Value (a)
TotalLevel 1Level 2Level 3
Net Asset Value (a)
Cash and cash equivalents$50.5
 $50.5
 $
 $
 $10.0
 $10.0
 $
 $
Cash and cash equivalents$43.4 $43.4 $— $— $— $40.5 $40.5 $— $— $— 
Equity securities               Equity securities
U.S. companies110.3
 110.3
 
 
 70.4
 70.4
 
 
U.S. companies102.1 102.1 — — — 45.5 45.5 — — — 
International companies5.4
 5.4
 
 
 251.5
 251.5
 
 
International companies2.1 2.1 — — — 143.4 143.4 — — — 
Registered investment companies (a)
36.3


 63.4


Common/collective trusts (a)
12.5


Registered investment companiesRegistered investment companies37.9 — — — 37.9 36.0 — — — 36.0 
Insurance contracts


 138.5
 
 138.5
 
Insurance contracts— — — — — — — — — — 
Hedge fundsHedge funds138.8 — — — 138.8 291.0 — — — 291.0 
Limited partnershipsLimited partnerships192.5 — — — 192.5 3.6 — — — 3.6 
Real estate and other investmentsReal estate and other investments0.6 0.6 — — — 69.7 69.7 — — — 
Total assetsTotal assets$517.4 $148.2 $— $— $369.2 $629.7 $299.1 $— $— $330.6 
December 31, 2020December 31, 2020        
Cash and cash equivalentsCash and cash equivalents$38.1 $38.1 $— $— $— $66.3 $66.3 $— $— $— 
Equity securitiesEquity securities
U.S. companiesU.S. companies83.3 83.3 — — — 96.3 96.3 — — — 
International companiesInternational companies1.1 1.1 — — — 208.4 208.4 — — — 
Registered investment companiesRegistered investment companies38.4 — — — 38.4 68.2 — — — 68.2 
Hedge funds (a)
164.3


 82.0


160.9 — — — 160.9 98.3 — — — 98.3 
Limited partnerships (a)
139.4


 7.9


160.9 — — — 160.9 14.5 — — — 14.5 
Real estate and other investments1.3
 1.3
 
 
 36.0
 36.0
 
 
Real estate and other investments1.0 1.0 — — — 39.5 39.5 — — — 
Total assets$520.0
 $167.5
 $
 $
 $659.7
 $367.9
 $138.5
 $
Total assets$483.7 $123.5 $— $— $360.2 $591.5 $410.5 $— $— $181.0 
               
December 31, 2018               
Cash and cash equivalents$46.8
 $46.8
 $
 $
 $11.1
 $11.1
 $
 $
Equity securities               
U.S. companies109.4
 109.4
 
 
 92.2
 92.2
 
 
International companies8.5
 8.5
 
 
 186.8
 186.8
 
 
Registered investment companies (a)
32.6


 44.4


Common/collective trusts (a)
11.7


 10.0


Insurance contracts


 125.0
 
 125.0
 
Hedge funds (a)
176.5


 99.1


Limited partnerships (a)
89.7


Real estate and other investments2.2
 2.2
 
 
 1.2
 1.2
 
 
Total assets$477.4
 $166.9
 $
 $
 $569.8
 $291.3
 $125.0
 $

(a)
Certain investments that are measured at fair value using net asset value per share (or its equivalent) have not been classified in the fair value hierarchy.
(a)Certain investments that are measured at fair value using net asset value per share (or its equivalent) have not been classified in the fair value hierarchy.
Contributions - We expect to contribute approximately $6.9$12.3 million to our international pension plans, representing primarily the NetherlandsU.K. qualified pension plans and U.K. qualified pension plans.in 2022. We do not expect to make any contributions to our U.S. Qualified Pension Plan and our U.S. Non-Qualified Defined Benefit Pension Plan in 2020.2022. All of the contributions are expected to be in the form of cash. In 20192021 and 2018,2020, we contributed $6.9$34.3 million and $18.5$27.1 million to all pension plans, respectively.

113


Estimated future benefit payments - The following table summarizes expected benefit payments from our various pension and post-retirement benefit plans through 2028.2031. Actual benefit payments may differ from expected benefit payments.
 Pensions 
Other
Post-retirement
Benefits
(In millions)U.S. International  
2020$35.9
 $32.8
 $0.6
202136.3
 28.4
 0.6
202235.7
 29.5
 0.6
202334.1
 31.1
 0.6
202434.6
 33.2
 0.6
2025-2029$177.1
 $181.5
 $2.6

 PensionsOther
Post-retirement
Benefits
(In millions)U.S.International 
2022$33.3 $22.0 $0.6 
202331.4 22.4 0.6 
202431.7 23.8 0.6 
202532.3 24.4 0.5 
202632.7 25.6 0.5 
2027-2031165.9 149.9 2.3 
Savings plans - The TechnipFMC Retirement Savings Plan (“Qualified Plan”), a qualified salary reduction plan under Section 401(k) of the Internal Revenue Code, is a defined contribution plan. Additionally, we have a non-qualified deferred compensation plan, the Non-Qualified Plan, which allows certain highly compensated employees the option to defer the receipt of a portion of their salary. We match a portion of the participants’ deferrals to both plans. Both plans relate to FMC Technologies, Inc.
Participants in the Non-Qualified Plan earn a return based on hypothetical investments in the same options as our 401(k) plan, including TechnipFMC plc stock (“FTI Stock Fund”). In March 2019, the FTI Stock Fund was removed from the Non-Qualified Plan.plan. Changes in the market value of these participant investments are reflected as an adjustment to the deferred compensation liability with an offset to other income (expense), net. As of December 31, 20192021 and 2018,2020, our liability for the Non-Qualified Plan was $26.3$24.1 million and $22.8 million, respectively, and was recorded in other liabilities.liabilities in our consolidated balance sheets. We hedge the financial impact of changes in the participants’ hypothetical investments by purchasing the investments that the participants have chosen. With the exception of TechnipFMC plc stock, which is maintained at its cost basis, changesChanges in the fair value of these investments are recognized as an offset to other income (expense), net.net in our consolidated statements of income. As of December 31, 20192021 and 2018,2020, we had investments for the Non-Qualified Plan totaling $26.3$24.1 million and $21.4$22.8 million at fair market value, respectively. As of
During the years ended December 31, 20192021, and 2018, TechnipFMC stock held in trust of NaN and $2.4 million at its cost basis, respectively. Refer to Note 25 to these consolidated financial statements for fair value disclosure of the Non-Qualified Plan investments.
We2020 we recognized expense of $34.0$21.5 million and $31.8$21.3 million, respectively for matching contributions to these plans in 20192021 and 2018,2020, respectively. Additionally, during the years ended December 31, 2021 and 2020, we recognized expense of $13.2$9.0 million and $14.3$8.3 million, respectively, for non-elective contributions in 2019 and 2018, respectively.contributions.

NOTE 24. DERIVATIVE FINANCIAL INSTRUMENTS
For purposes of mitigating the effect of changes in exchange rates, we hold derivative financial instruments to hedge the risks of certain identifiable and anticipated transactions and recorded assets and liabilities in our consolidated balance sheets. The types of risks hedged are those relating to the variability of future earnings and cash flows caused by movements in foreign currency exchange rates. Our policy is to hold derivatives only for the purpose of hedging risks associated with anticipated foreign currency purchases and sales created in the normal course of business, and not for trading purposes where the objective is solely to generate profit.speculative purposes.
Generally, we enter into hedging relationships such that changes in the fair values or cash flows of the transactions being hedged are expected to be offset by corresponding changes in the fair value of the derivatives. For derivative instruments that qualify as a cash flow hedge, the effective portion of the gain or loss of the derivative, which does not include the time value component of a forward currency rate, is reported as a component of other comprehensive income (“OCI”) and reclassified into earnings in the same period or periods during which the hedged transaction affects earnings. For derivative instruments not designated as hedging instruments, any change in the fair value of those instruments areis reflected in earnings in the period such change occurs.


We hold the following types of derivative instruments:
Foreign exchange rate forward contracts – The purpose of these instruments is to hedge the risk of changes in future cash flows of anticipated purchase or sale commitments denominated in foreign currencies and recorded assets and liabilities in our consolidated balance sheets. AtAs of December 31, 2019,2021, we held the following material net positions: 
 
Net Notional Amount
Bought (Sold)
(In millions)  USD Equivalent
Euro1,109.3
 1,245.8
British pound114.8
 151.5
Norwegian krone2,682.6
 305.4
Brazilian real798.6
 198.1
Singapore dollar208.1
 154.7
Malaysian ringgit413.6
 101.2
Japanese yen4,376.7
 40.3
Australian dollar51.3
 36.0
Indonesian rupiah240,584.6
 17.3
Swedish krona105.7
 11.4
Mexican peso(300.0) (15.9)
Honk Kong dollar(138.0) (17.7)
Canadian dollar(89.9) (69.1)
U.S. dollar(1,078.8) (1,078.8)
114


 Net Notional Amount
Bought (Sold)
(In millions) USD Equivalent
Euro775.4 878.2 
British pound(197.2)(265.9)
Malaysian ringgit(627.4)(150.5)
Norwegian krone967.9 109.8 
Brazilian real1,299.8 232.9 
Singapore dollar125.4 92.9 
Mexican peso(116.7)(5.7)
Australian dollar182.4 132.2 
Indian rupee881.4 11.8 
Kuwaiti Dinar(3.3)(10.9)
Russian Ruble925.0 12.5 
Canadian dollar19.2 15.1 
Indonesian rupiah(45,656.9)(3.2)
U.S. dollar(1,119.9)(1,119.9)
Foreign exchange rate instruments embedded in purchase and sale contracts – The purpose of these instruments is to match offsetting currency payments and receipts for particular projects, or comply with government restrictions on the currency used to purchase goods in certain countries. AtAs of December 31, 2019,2021, our portfolio of these instruments included the following material net positions: 
 
Net Notional Amount
Bought (Sold)
(In millions)  USD Equivalent
Brazilian real57.6
 14.3
Euro(6.8) (7.6)
Norwegian krone(124.7) (14.2)
U.S. dollar7.9
 7.9

 Net Notional Amount
Bought (Sold)
(In millions) USD Equivalent
Brazilian real52.5 9.4 
Euro(7.3)(8.3)
Norwegian krone6.1 0.7 
U.S. dollar(1.2)(1.2)
Fair value amounts for all outstanding derivative instruments have been determined using available market information and commonly accepted valuation methodologies. Refer toSee Note 25 to these consolidated financial statements for further disclosures related to the fair value measurement process.details. Accordingly, the estimates presented may not be indicative of the amounts that we would realize in a current market exchange and may not be indicative of the gains or losses we may ultimately incur when these contracts are settled.


The following table presents the location and fair value amounts of derivative instruments reported in the consolidated balance sheets:
December 31, 2019 December 31, 2018 December 31, 2021December 31, 2020
(In millions)Assets Liabilities Assets Liabilities(In millions)AssetsLiabilitiesAssetsLiabilities
Derivatives designated as hedging instruments       Derivatives designated as hedging instruments
Foreign exchange contracts       Foreign exchange contracts
Current - Derivative financial instruments$94.3
 $125.0
 $83.8
 $127.7
Current - Derivative financial instruments$106.4 $139.5 $189.5 $141.9 
Long-term - Derivative financial instruments34.8
 48.0
 9.0
 35.6
Long-term - Derivative financial instruments10.5 15.5 28.9 18.8 
Total derivatives designated as hedging instruments129.1
 173.0
 92.8
 163.3
Total derivatives designated as hedging instruments116.9 155.0 218.4 160.7 
Derivatives not designated as hedging instruments       Derivatives not designated as hedging instruments
Foreign exchange contracts       Foreign exchange contracts
Current - Derivative financial instruments7.6
 16.3
 11.9
 10.7
Current - Derivative financial instruments3.9 21.5 79.2 15.6 
Long-term - Derivative financial instruments0.4
 0.4
 0.1
 0.1
Long-term - Derivative financial instruments— — 0.3 — 
Total derivatives not designated as hedging instruments8.0
 16.7
 12.0
 10.8
Total derivatives not designated as hedging instruments3.9 21.5 79.5 15.6 
Long-term - Derivative financial instruments - Synthetic Bonds - Call Option Premium4.3
 
 9.2
 
Long-term - Derivative financial instruments - Synthetic Bonds - Embedded Derivatives
 4.3
 
 9.2
Total derivatives$141.4
 $194.0
 $114.0
 $183.3
Total derivatives$120.8 $176.5 $297.9 $176.3 
115


Cash flow hedges of forecasted transactions, net of tax, which qualify for hedge accounting, resulted in accumulated other comprehensive lossesgains (losses) of $5.8$(18.7) million and $33.0$12.9 million atas of December 31, 20192021 and 2018,2020, respectively. We expect to transfer an approximately $3.6$3.4 million lossgain from accumulated OCI to earnings during the next 12 months when the anticipated transactions actually occur. All anticipated transactions currently being hedged are expected to occur by the second half of 2023.2024.
The following tables present the location of gains (losses) onin the consolidated statements of income related to derivative instruments designated as cash flow hedges. 
 Gain (Loss) Recognized in OCI 
 Year Ended December 31,
(In millions)202120202019
Foreign exchange contracts$(26.3)$3.8 $12.2 
 Gain (Loss) Recognized in OCI 
 Year Ended December 31,
(In millions)2019 2018 2017
Foreign exchange contracts$10.3
 $(75.4) $72.1


The following represents the effect of cash flow hedge accounting on the consolidated statements of income for the year ended December 31, 2019, 20182021, 2020 and 2017:2019:
Year Ended December 31,
(In millions)202120202019
Total amount of income (expense) presented in the consolidated statements of income associated with hedges and derivativesRevenueCost of salesSelling,
general
and
administrative
expense
Other income (expense), netRevenueCost of salesSelling,
general
and
administrative
expense
Other income (expense), netRevenueCost of salesOther income (expense), net
Amounts reclassified from accumulated OCI to income (loss)$(29.7)$10.7 $0.2 $32.9 $(83.7)$68.5 $(0.4)$(0.2)$(26.6)$12.0 $(1.3)
Amounts excluded from effectiveness testing(1.8)(3.3)— 3.8 7.7 (9.8)(0.2)0.3 0.6 (7.6)(7.2)
Total cash flow hedge gain (loss) recognized in income(31.5)7.4 0.2 36.7 (76.0)58.7 (0.6)0.1 (26.0)4.4 (8.5)
Gain (loss) recognized in income on derivatives not designated as hedging instruments1.3 0.3 — (13.3)(0.8)3.4 — 35.9 (1.6)0.2 (21.4)
Total$(30.2)$7.7 $0.2 $23.4 $(76.8)$62.1 $(0.6)$36.0 $(27.6)$4.6 $(29.9)
 Year Ended December 31,
(In millions)2019 2018 2017
Total amount of income (expense) presented in the consolidated statements of income associated with hedges and derivativesRevenue Cost of sales Selling,
general
and
administrative
expense
 Other income (expense), net Revenue Cost of sales Selling,
general
and
administrative
expense
 Other income (expense), net Revenue Cost of sales Selling,
general
and
administrative
expense
 Other income (expense), net
Cash Flow hedge gain (loss) recognized in income                       
Foreign Exchange Contracts                       
Amounts reclassified from accumulated OCI to income (loss)$(26.6) $12.0
 $
 $(9.1) $(2.4) $3.4
 $(0.1) $1.0
 $(39.3) $5.3
 $0.8
 $(102.2)
Amounts excluded from effectiveness testing0.6
 (7.6) 
 (34.9) (2.2) (4.8) 
 (12.3) 9.5
 (9.0) 0.1
 23.0
Total cash flow hedge gain (loss) recognized in income(26.0) 4.4
 
 (44.0) (4.6) (1.4) (0.1) (11.3) (29.8) (3.7) 0.9
 (79.2)
                        
Gain (loss) recognized in income on derivatives not designated as hedging instruments(1.6) 0.2
 
 (10.2) (1.7) 0.2
 
 (11.4) 0.9
 (0.3) 
 43.0
Total$(27.6) $4.6
 $
 $(54.2) $(6.3) $(1.2) $(0.1) $(22.7) $(28.9) $(4.0) $0.9
 $(36.2)

Balance Sheet Offsetting - We execute derivative contracts with counterparties that consent to a master netting agreement which permits net settlement of the gross derivative assets against gross derivative liabilities. Each instrument is accounted for individually and assets and liabilities are not offset. As of December 31, 20192021 and 2018,2020, we had no collateralized derivative contracts. The following tables present both gross information and net information of recognized derivative instruments:
December 31, 2021December 31, 2020
(In millions)Gross Amount RecognizedGross Amounts Not Offset Permitted Under Master Netting AgreementsNet AmountGross Amount RecognizedGross Amounts Not Offset Permitted Under Master Netting AgreementsNet Amount
Derivative assets$120.8 $(78.6)$42.2 $297.9 $(128.7)$169.2 
Derivative liabilities$176.5 $(78.6)$97.9 $176.3 $(128.7)$47.6 
 December 31, 2019 December 31, 2018
(In millions)Gross Amount Recognized Gross Amounts Not Offset Permitted Under Master Netting Agreements Net Amount Gross Amount Recognized Gross Amounts Not Offset Permitted Under Master Netting Agreements Net Amount
Derivative assets$141.4
 $(112.5) $28.9
 $114.0
 $(105.9) $8.1
Derivative liabilities$194.0
 $(112.5) $81.5
 $183.3
 $(105.9) $77.4


116
128


NOTE 25. FAIR VALUE MEASUREMENTS
Recurring Fair Value Measurements
Assets and liabilities measured at fair value on a recurring basis were as follows: 
 December 31, 2021December 31, 2020
(In millions)TotalLevel 1Level 2Level 3TotalLevel 1Level 2Level 3
Assets
Investments
Investment in Technip Energies$317.3 $317.3 $— $— $— $— $— $— 
Equity securities(a)
25.0 25.0 — — 23.4 23.4 — — 
Money market fund2.4 — 2.4 — 1.7 — 1.7 — 
Stable value fund(b)
0.3 — — — 0.9 — — — 
Held-to-maturity debt securities24.0 — 24.0 — 24.2 — 24.2 — 
Derivative financial instruments
Foreign exchange contracts120.8 — 120.8 — 297.9 — 297.9 — 
Assets held for sale5.0 — — 5.0 47.3 — — 47.3 
Total assets$494.8 $342.3 $147.2 $5.0 $395.4 $23.4 $323.8 $47.3 
Liabilities
Derivative financial instruments
Foreign exchange contracts176.5 — 176.5 — 176.3 — 176.3 — 
Total liabilities$176.5 $— $176.5 $— $176.3 $— $176.3 $— 
 December 31, 2019 December 31, 2018
(In millions)Total Level 1 Level 2 Level 3 Total Level 1 Level 2 Level 3
Assets               
Investments               
Equity securities(a)
$54.8
 $54.8
 $
 $
 $40.4
 $40.4
 $
 $
Money market fund1.5
 
 1.5
 
 1.6
 
 1.6
 
Stable value fund(b)
2.1


 0.5


Held to maturity71.9
 
 71.9
 
 20.0
 
 20.0
 
Derivative financial instruments               
Synthetic bonds - call option premium4.3
 
 4.3
 
 9.2
 
 9.2
 
Foreign exchange contracts137.1
 
 137.1
 
 104.8
 
 104.8
 
Assets held for sale25.8
 
 
 25.8
 9.6
 
 
 9.6
Total assets$297.5
 $54.8
 $214.8
 $25.8
 $186.1
 $40.4
 $135.6
 $9.6
Liabilities               
Redeemable financial liability$268.8
 $
 $
 $268.8
 $408.5
 $
 $
 $408.5
Derivative financial instruments               
Synthetic bonds - embedded derivatives4.3
 
 4.3
 
 9.2
 
 9.2
 
Foreign exchange contracts189.7
 
 189.7
 
 174.1
 
 174.1
 
Liabilities held for sale9.3
 
 
 9.3
 16.2
 
 
 16.2
Total liabilities$472.1
 $
 $194.0
 $278.1
 $608.0
 $
 $183.3
 $424.7
(a)Includes fixed income and other investments measured at fair value.
(b)Certain investments that are measured at fair value using net asset value per share (or its equivalent) have not been classified in the fair value hierarchy.
Investment in Technip Energies - The fair value of our investment in Technip Energies is based on quoted prices that we have the ability to access in public markets, see Note 13 for further details.
Equity securities and Available-for-SaleAvailable-for-sale Securities - The fair value measurement of our traded securities and Available-for-Sale-SecuritiesAvailable-for-sale-Securities is based on quoted prices that we have the ability to access in public markets.
Stable value fund and Money market fund - Stable value fund and money market fund are valued at the net asset value of the shares held at the end of the quarter, which is based on the fair value of the underlying investments using information reported by our investment advisor at quarter-end.
Held-to-maturity debt securities - held-to-maturityHeld-to-maturity debt securities consist of government bonds. These investments are stated at amortized cost, which approximates fair value.
Assets and liabilities held for sale - The fair value of our assets and liabilities held for sale was determined using a market approach that took into consideration the expected sales price.
Mandatorily redeemable financial liability - In the fourth quarter of 2016, we obtained voting control interests in legal Onshore/Offshore contract entities which own and account for the design, engineering and construction of the Yamal LNG plant. As part of this transaction, we recognized the fair value of the mandatorily redeemable financial liability using a discounted cash flow model. The key assumptions used in applying the income approach are the selected discount rates and the expected dividends to be distributed in the future to the noncontrolling interest holders. Expected dividends to be distributed are based on the noncontrolling interests’ share of the expected profitability of the underlying contract, the selected discount rate and the overall timing of completion of the project.
A mandatorily redeemable financial liability of $268.8 million, $408.5 million and $312.0 million was recognized as of December 31, 2019, 2018 and 2017, respectively, to account for the fair value of the non-controlling interests. During the year ended December 31, 2019, 2018 and 2017, we revalued the liability to reflect current expectations about the obligation, which resulted in the recognition of a loss of $423.1 million, $322.3 million and $293.7million, respectively.


A decrease of one percentage point in the discount rate would have increased the liability by $3.4 million as of December 31, 2019. The fair value measurement2020, our G1200 vessel is based upon significant unobservable inputs not observable in the market and is consequently classified as held for sale. In March 2021, we entered into a Level 3 fair value measurement.
ChangeMemorandum of Agreement to sell the vessel. We completed the sale and received $48.0 million in cash proceeds during the fair valuesecond quarter of our Level 3 mandatorily redeemable financial liability is recorded as interest expense on the consolidated statements of income and is presented below:
  Year Ended December 31,
(In millions) 2019 2018 2017
Balance at beginning of period $408.5
 $312.0
 $174.8
Less: Expenses recognized in net interest expense (423.1) (322.3) (293.7)
Less: Settlements 562.8
 225.8
 156.5
Balance at end of period $268.8
 $408.5
 $312.0

2021.
Redeemable noncontrollingnon-controlling interest - In accordance with the firstShare Purchase Agreement between Technip-Coflexip UK Holdings Limited (“TUK”) and Island Offshore Management AS (“Island Offshore”) that was executed on March 12, 2018, whereby TUK initially purchased 51% of the shares of TIOS AS, a joint venture between TUK and Island Offshore, TUK acquired the remaining 49% interest in TIOS at a total price of $48.6 million during the third quarter of 2018,2021. As of December 31, 2020, we acquiredowned a 51% share in Island Offshore. The noncontrollingTIOS and the redeemable non-controlling interest iswas recorded as mezzanine equity at fair value.The fair value measurement is based upon significant unobservable inputs not observable in the market and is consequently classified as a Level 3 fair value measurement. As of December 31, 2019, the fair value of our redeemable noncontrolling interest was $41.1$43.7 million. Refer to Note 2 to these consolidated financial statements for additional disclosure related to the acquisition.
117


Derivative financial instruments - We use the income approach as the valuation technique to measure the fair value of foreign currency derivative instruments on a recurring basis. This approach calculates the present value of the future cash flow by measuring the change from the derivative contract rate and the published market indicative currency rate, multiplied by the contract notional values. Credit risk is then incorporated by reducing the derivative’s fair value in asset positions by the result of multiplying the present value of the portfolio by the counterparty’s published credit spread. Portfolios in a liability position are adjusted by the same calculation; however, a spread representing our credit spread is used. Our credit spread, and the credit spread of other counterparties not publicly available, are approximated by using the spread of similar companies in the same industry, of similar size and with the same credit rating.
At the present time, weWe currently have no credit-risk-related contingent features in our agreements with the financial institutions that would require us to post collateral for derivative positions in a liability position.
Refer to See Note 24 to these consolidated financial statements for additional disclosure related to derivative financial instruments.further details.
Nonrecurring Fair Value Measurements
Fair value of long-lived, non-financial assets - Long-lived non-financial assets are measured atreviewed for impairment whenever events or changes in circumstances indicate that carrying amounts of such assets may not be recoverable.
The following summarizes impairments of long-lived assets and related post-impairment fair value on a non-recurring basis for the purposesyears ended December 31, 2021 and 2020:
Year Ended December 31,
20212020
(In millions)ImpairmentFair ValueImpairmentFair Value
Long-lived assets(a)
$49.1 $25.5 $190.4 $452.5 
(a)Measuring these asset groups for recoverability required the use of calculating impairment, when the recoverable amount of the assets has been determined to be less than the book value of the assets. During 2019, we recorded certain long-lived asset impairments primarily related to vessels and machinery and equipment in our Subsea segment. Due to the intent to sell our G1201 vessel and subsequently signed Memorandum of Agreement (MOA) with a third party, we reviewed the carrying value of its sister vessel, the G1200, as of September 30, 2019. As a result of this assessment, an impairment charge was recorded on the two vessels to bring their carrying value to a combined fair value of $104.0 million as of September 30, 2019. The fair value measurements of these vessels were based on the transaction price in the MOA, which is a Level 2 observable input as per the fair value hierarchy. For the remaining long-lived assets which we impaired in 2019, we measured their fair value by estimating the amount and timing of net future cash flows, which are Level 3 unobservable inputs and discounting them using a risk-adjusted rate of interest of 10.8%. As of December 31, 2019, these impaired assets were recorded at their fair value of $238.5 million. Referthat require significant judgment. Such judgments include expected future asset utilization while taking into account reduced future capital spending by certain customers in response to Note 20 for additional disclosure related to these asset impairments.market conditions.


Other fair value disclosures
Fair value of debt - The fair value of our Synthetic Bonds, Senior Notes and private placement notes are as follows:
 December 31, 2019 December 31, 2018
(In millions)
Carrying Amount (a)
 
Fair Value (b)
 
Carrying Amount (a)
 
Fair Value (b)
Synthetic bonds due 2021$492.9
 $513.1
 $490.9
 $532.4
3.45% Senior Notes due 2022500.0
 499.2
 500.0
 489.7
5.00% Notes due 2020224.6
 230.0
 229.0
 244.0
3.40% Notes due 2022168.5
 180.6
 171.8
 186.9
3.15% Notes due 2023146.0
 156.8
 148.9
 161.3
3.15% Notes due 2023140.4
 150.5
 143.1
 153.3
4.00% Notes due 202784.2
 96.4
 85.9
 95.8
4.00% Notes due 2032112.3
 127.8
 114.5
 120.2
3.75% Notes due 2033112.3
 123.8
 114.5
 126.1
(a)Carrying amounts include unamortized debt discounts and premiums and unamortized debt issuance costs of $9.1 million and $11.4 million as of 2019 and 2018, respectively.
(b)Fair values are based on Level 2 quoted market rates.
Other fair value disclosures - The carrying amounts of cash and cash equivalents, trade receivables, accounts payable, short-term debt, commercial paper, debt associated with our bank borrowings, credit facilities, convertible bonds, as well as amounts included in other current assets and other current liabilities that meet the definition of financial instruments, approximate fair value.
Fair value of debt - We use a market approach to determine the fair value of our fixed-rate debt using observable market data, which results in a Level 2 fair value measurement. The estimated fair value of our private placement notes, senior notes and synthetic bonds was $1,706.1 million and $2,199.2 million as of December 31, 2021 and December 31, 2020, respectively.
Credit risk - By their nature, financial instruments involve risk, including credit risk, for non-performance by counterparties. Financial instruments that potentially subject us to credit risk primarily consist of trade receivables and derivative contracts. We manage the credit risk on financial instruments by transacting only with what management believes are financially secure counterparties, requiring credit approvals and credit limits and monitoring counterparties’ financial condition. Our maximum exposure to credit loss in the event of non-performance by the counterparty is limited to the amount drawn and outstanding on the financial instrument. Allowances for losses on trade receivables are established based on collectibilitycollectability assessments. We mitigate credit risk on derivative contracts by executing contracts only with counterparties that consent to a master netting agreement, which permits the net settlement of gross derivative assets against gross derivative liabilities.

NOTE 26. SUBSEQUENT EVENTS

On January 10, 2022 we announced the sale of 9.0 million Technip Energies shares, representing approximately 5% of Technip Energies’ issued and outstanding share capital, through a private sale transaction (the “January Sale”). The sale price of the shares in the January Sale was set at €13.15 per share, yielding total net proceeds of €118.4 million, or $135.1 million. Upon completion of the January Sale, we retain a direct stake of 12.9 million
131
118


NOTE 26. QUARTERLY INFORMATION (UNAUDITED)
 2019 2018
(In millions, except per share data)4th Qtr. 3rd Qtr. 2nd Qtr. 1st Qtr. 4th Qtr. 3rd Qtr. 2nd Qtr. 1st Qtr.
Revenue$3,726.8
 $3,335.1
 $3,434.2
 $2,913.0
 $3,323.0
 $3,143.8
 $2,960.9
 $3,125.2
Cost of sales3,067.2
 2,726.4
 2,745.2
 2,411.9
 2,767.7
 2,558.5
 2,422.2
 2,524.6
Net income (loss)(2,430.3) (115.3) 113.7
 19.8
 (2,246.5) 134.2
 110.1
 91.4
Net income (loss) attributable to TechnipFMC plc$(2,414.0) $(119.1) $97.0
 $20.9
 $(2,259.3) $136.9
 $105.7
 $95.1
Basic earnings (loss) per share (1)
$(5.40) $(0.27) $0.22
 $0.05
 $(5.00) $0.30
 $0.23
 $0.20
Diluted earnings (loss) per share (1)
$(5.40) $(0.27) $0.21
 $0.05
 $(5.00) $0.30
 $0.23
 $0.20

shares, representing 7.1% of Technip Energies’ issued and outstanding share capital. As of February 25, 2022, the value of our investment in Technip Energies was $155.3 million.
On January 14, 2022 we paid £6 million, or $8.3 million for 750,000 ordinary shares in Orbital Marine Power (Orbital) to complete the investment in accordance with the Memorandum of Understanding between Technip Holding Benelux B.V. and Orbital. Orbital is a Scotland-based renewable energy company focused on the development and global application of its floating turbine technology. Upon completion of the investment, we will hold approximately 10.2% of the ordinary shares in Orbital.
(1)
Basic and diluted earnings (loss) per share are computed independently for each of the quarters presented. Therefore, the sum of quarterly basic and diluted per share information may not equal annual basic and diluted earnings (loss) per share.
ITEM 9. CHANGES IN AND DISAGREEMENTS WITH ACCOUNTANTS ON ACCOUNTING AND FINANCIAL DISCLOSURE
None.
ITEM 9A. CONTROLS AND PROCEDURES
Evaluation of Disclosure Controls and Procedures

As of December 31, 2019,2021, and under the direction of our Chief Executive Officer and Chief Financial Officer, we evaluated the effectiveness of our disclosure controls and procedures, as defined in Rule 13a-15(e) under the Exchange Act. Based upon this evaluation, our Chief Executive Officer and Chief Financial Officer concluded as of December 31, 2019,2021, that our disclosure controls and procedures were effective.

Management’s Annual Report on Internal Control over Financial Reporting

Management is responsible for establishing and maintaining adequate internal control over financial reporting as defined in Rule 13a-15(f) under the Exchange Act.

Management evaluated the effectiveness of our internal control over financial reporting as of December 31, 20192021 based on the framework in Internal Control-Integrated Framework (2013) issued by the Committee of Sponsoring Organizations of the Treadway Commission (COSO). As a result of this evaluation, management concluded that our internal control over financial reporting was effective as of December 31, 2019.2021.

The effectiveness of our internal control over financial reporting as of December 31, 2019,2021, has been audited by PricewaterhouseCoopers LLP, an independent registered public accounting firm, as stated in their report included herein.
Remediation Activities of Previously Disclosed Material Weaknesses

As of December 31, 2018, our management concluded that we had not maintained effective internal control over financial reporting in the following areas:

(i)period-end financial reporting
(ii)accounting for income taxes.

Both material weaknesses were remediated as of December 31, 2019, as noted below.

Period-end Financial Reporting - Remediated as of December 31, 2019


We previously reported that in certain locations, we did not design and maintain effective controls over the period-end financial reporting process. We had ineffective controls over the documentation, authorization, and review of adjustments to and reconciliations of financial information.

These deficiencies did not result in a material misstatement of the financial statements; however, the deficiencies, when aggregated, could have resulted in material misstatements of the consolidated financial statements and disclosures that would not have been prevented or detected. Accordingly, our management determined that these deficiencies, in the aggregate, constituted a material weakness.

Management took the following corrective actions to address this material weakness:

Provided additional training and continuous guidance to finance team members on the requirements around control processes;
Improved the timeliness and effectiveness of our review and approval procedures; and
Improved the control activities and execution thereof related to the review of adjustments to and reconciliations of financial information.

As a result of these remediation activities and based on testing of the new and modified controls for operating effectiveness, our management concluded that we remediated the material weakness related to period-end financial reporting as of December 31, 2019.

Accounting for income taxes - Remediated as of December 31, 2019

We previously reported that we did not design and maintain effective controls over the completeness, accuracy, and presentation of our accounting for income taxes, including the income tax provision and related income tax assets and liabilities.

These deficiencies did not result in a material misstatement of the financial statements; however, the deficiencies, when aggregated, could have resulted in material misstatements of the consolidated financial statements and disclosures that would not have been prevented or detected. Accordingly, our management determined that these deficiencies, in the aggregate, constituted a material weakness.
Management took the following corrective actions to address this material weakness:

Reinforced the proper usage of the Company’s global taxation tool, implemented in 2018, by issuing detailed instructions and application descriptions;
Provided additional training to finance team members on the appropriate use of the global taxation tool;
Improved the timeliness and effectiveness of our review and approval procedures; and
Improved the control activities and execution thereof related to our accounting for income taxes.

As a result of these remediation activities and based on testing of the new and modified controls for operating effectiveness, our management concluded that we remediated the material weakness related to accounting for income taxes as of December 31, 2019.
Changes in Internal Control over Financial Reporting

Other than steps taken in connection with the completion of the remediation activities described above, thereThere were no changes in our internal control over financial reporting during the three monthsquarter ended December 31, 20192021 that have materially affected, or are reasonably likely to materially affect, our internal control over financial reporting.

ITEM 9B. OTHER INFORMATION
None.

133


ITEM 9C. DISCLOSURE REGARDING FOREIGN JURISDICTIONS THAT PREVENT INSPECTIONS
Not applicable.

PART III
119


ITEM 10. DIRECTORS, EXECUTIVE OFFICERS AND CORPORATE GOVERNANCE
See Part I, Item 1 “Executive Officers of the Registrant” of this Annual Report on Form 10-K for information regarding our executive officers. The information set forth under the sections “Corporate Governance,” “Proposals 1(a) - 1(n)1(i) - Election of Directors”, and if applicable, “Delinquent Section 16(a) Reports” in our 20202022 Proxy Statement is incorporated herein by reference.
We have adopted a Code of Business Conduct, which is applicable to our directors, officers, and employees, including our principal executive officer, financial and accounting officers, and persons performing similar functions. Our Code of Business Conduct may be found on our website at www.technipfmc.com under “About us-Governance”us-Ethics and Compliance” and is available in print to shareholders without charge by submitting a request to 11740 Katy Freeway, Energy Tower 3,13460 Lockwood Rd., Houston, Texas 77079,77044, Attention: Corporate Secretary. We intend to satisfy the disclosure requirements under the Securities and Exchange Act of 1934, as amended, regarding an amendment to or waiver from a provision of our Code of Business Conduct by posting such information on our website.
NamePrincipal Occupation
Douglas J. PferdehirtExecutive ChairmanChair and Chief Executive Officer of TechnipFMCTechnipFMC.
Eleazar de Carvalho FilhoFounding Partner of Virtus BR Partners Assessoria Corporativa Ltda. and Founding Partner of Sinfonia Consultoria Financeira e Participações Ltda., financial advisory and consulting firmsfirms.
Arnaud CaudouxDeputy Chief Executive Officer of Banque publique d'investissement, a French state-owned investment bank
Pascal ColombaniPresident of TII Strategies SASU, a consulting and investment company
Marie-Ange DebonFormer Senior Executive Vice President of the Suez Group, a global water and waste company, managing France, Italy, and Central and Eastern Europe operations of the Suez Group
Claire S. Farley Former Vice Chairman in the Energy & Infrastructure business of KKR & Co. L.P., a global investment firmfirm.
Didier HoussinChairman and Chief Executive Officer of IFP Énergies nouvelles, a research and training company in the fields of energy, transport, and the environment
Peter MellbyeFormer Executive Vice President, Development & Production, International, of Statoil ASA, an international oil and gas companycompany.
John O’LearyChief Executive Officer of Strand Energy, a Dubai-based company specializing in business development in the oil and gas industryindustry.
Olivier PiouMargareth ØvrumFormer Chief Executive OfficerVice President of Development and Board memberProduction Brazil of Gemalto N.V.,Equinor ASA, an international digital security companyoil and gas company.
Kay G. PriestlyFormer Chief Executive Officer of Turquoise Hill Resources Ltd., an international mining companycompany.
Joseph RinaldiManaging Partner of Fennecourt Partners, LLC, an investment management and consulting firm
James M. RinglerFormer non-executive Chairman of the Board of Teradata Corporation, a provider of database software, data warehousing and analytics
John YearwoodFormer Chief Executive Officer, President, and Chief Operating Officer of Smith International, Inc., a supplier of services and manufactured products to oil and gas exploration and production companiescompanies.
Sophie ZurquiyahChief Executive Officer of CGG S.A., a global geoscience technology leader.
ITEM 11. EXECUTIVE COMPENSATION
Information required by this item is incorporated herein by reference from the sections entitled “Director Compensation,” “Corporate Governance - Compensation Committee Interlocks and Insider Participation in Compensation Decisions” andDecisions,” “Executive Compensation Discussion and Analysis” and “Compensation Committee Report” of our Proxy Statement for the 20202022 Annual General Meeting of Shareholders.
ITEM 12. SECURITY OWNERSHIP OF CERTAIN BENEFICIAL OWNERS AND MANAGEMENT AND RELATED SHAREHOLDER MATTERS
Information required by this item is incorporated herein by reference from the section entitled “Security Ownership of Our ManagementCertain Beneficial Owners and Holders of More Than 5% of our Outstanding Ordinary Shares”Management” of our Proxy Statement for the 20202022 Annual General Meeting of Shareholders.


As of December 31, 2019,2021, our securities authorized for issuance under equity compensation plans were as follows:
(shares in thousands)
Number of Securities 
to be Issued 
Upon Exercise of Outstanding Options,
Warrants and Rights
 
Weighted Average 
Exercise Price of 
Outstanding Options,
Warrants and Rights
 
Number of Securities
Remaining Available
for Future Issuance
under Equity
Compensation Plans
(shares in thousands)Number of Securities 
to be Issued 
Upon Exercise of Outstanding Options,
Warrants and Rights
Weighted Average 
Exercise Price of 
Outstanding Options,
Warrants and Rights
Number of Securities
Remaining Available
for Future Issuance
under Equity
Compensation Plans
Equity compensation plans approved by security holders4,842.4
 $29.68
 21,350.2
Equity compensation plans approved by security holders1,576.1 $20.17 14,352.3 
Equity compensation plans not approved by security holders
 
 
Equity compensation plans not approved by security holders— — — 
Total4,842.4
 $29.68
 21,350.2
Total1,576.1 $20.17 14,352.3 
120


ITEM 13. CERTAIN RELATIONSHIPS AND RELATED TRANSACTIONS, AND DIRECTOR INDEPENDENCE
Information required by this item is incorporated herein by reference from the sections entitled “Transactions with Related Persons” and “Corporate Governance - Director Independence” of our Proxy Statement for the 20202022 Annual General Meeting of Shareholders.
ITEM 14. PRINCIPAL ACCOUNTINGACCOUNTANT FEES AND SERVICES
Information required by this item is incorporated herein by reference from the sections entitled “Proposal 5 — Ratification of U.S. Auditor” of our Proxy Statement for the 20202022 Annual General Meeting of Shareholders.

135


PART IV
ITEM 15. EXHIBITS,EXHIBIT AND FINANCIAL STATEMENT SCHEDULES
(a)The following documents are filed as part of this Annual Report on Form 10-K:
1.The following consolidated financial statements of TechnipFMC plc and subsidiaries are filed as part of this Annual Report on Form 10-K under Part II, Item 8:
(a)The following documents are filed as part of this Annual Report on Form 10-K:
1.The following consolidated financial statements of TechnipFMC plc and subsidiaries are filed as part of this Annual Report on Form 10-K under Part II, Item 8:
Reports of Independent Registered Public Accounting Firm on Consolidated Financial Statements (PCAOB ID: 238)
Consolidated Statements of Income for the Years Ended December 31, 2019, 20182021, 2020 and 20172019
Consolidated Statements of Comprehensive Income for the Years Ended December 31, 2019, 2018,2021, 2020, and 20172019
Consolidated Balance Sheets as of December 31, 20192021 and 20182020
Consolidated Statements of Cash Flows for the Years Ended December 31, 2019, 20182021, 2020 and 20172019
Consolidated Statements of Changes in Stockholders’ Equity for the Years Ended December 31, 2019, 20182021, 2020 and 20172019
Notes to Consolidated Financial Statements
2.Financial Statement Schedule:
See “Schedule II - Valuation and Qualifying Accounts” included herein. All other schedules are omitted because of the absence of conditions under which they are required or because information called for is shown in the consolidated financial statements and notes thereto in Part II, Item 8 of this Annual Report on Form 10-K.
3.Exhibits:
3.Exhibits:
See “Index of Exhibits” filed as part of this Annual Report on Form 10-K.

136
121


Part IV
Item 15 (a) (2), Financial Statement Schedule
Schedule II—Valuation and Qualifying Accounts
(In millions)Additions
DescriptionBalance at
Beginning of 
Period
Charged to 
Costs
and Expenses
Charged to Other Accounts (a)
Deductions
and Adjustments (b)
Balance at
End of Period
Year Ended December 31, 2019
Trade receivables allowance for doubtful accounts$58.7 $27.7 $3.5 $(32.5)$57.4 
Valuation allowance for deferred tax assets$496.6 $184.9 $— $47.6 $729.1 
Year Ended December 31, 2020
Trade receivables allowance for doubtful accounts (c)
$57.4 $38.0 $1.3 $(56.5)$40.2 
Valuation allowance for deferred tax assets$729.1 $104.4 $(11.3)$(7.1)$815.1 
Year Ended December 31, 2021
Trade receivables allowance for doubtful accounts$40.2 $17.0 $(10.8)$(8.3)$38.1 
Valuation allowance for deferred tax assets$815.1 $129.7 $(12.0)$2.7 $935.5 
(In millions)  Additions    
Description
Balance at
Beginning of 
Period
 
Charged to 
Costs
and Expenses
 
Charged to
Other 
Accounts (a)
 
Deductions
and Adjustments (b)
 
Balance at
End of Period
Year Ended December 31, 2017         
Allowance for doubtful accounts$85.6
 $15.5
 $19.8
 $(3.5) $117.4
Valuation allowance for deferred tax assets$172.7
 $258.7
 $4.4
 $(5.8) $430.0
Year Ended December 31, 2018         
Allowance for doubtful accounts$117.4
 $54.7
 $0.3
 $(52.8) $119.6
Valuation allowance for deferred tax assets$430.0
 $213.8
 $(21.3) $60.9
 $683.4
Year Ended December 31, 2019         
Allowance for doubtful accounts$119.6
 $22.0
 $(2.9) $(43.3) $95.4
Valuation allowance for deferred tax assets$683.4
 $187.0
 $(2.1) $48.6
 $916.9
(a)"Additions charged to other accounts” includes translation adjustments.
(a)“Additions charged to other accounts” includes translation adjustments.
(b)“Deductions and adjustments” includes write-offs, net of recoveries, increases in allowances offset by increases to deferred tax assets, and reductions in the allowances credited to expense.
(c)On January 1, 2020, we adopted ASU 2016-13, resulting in a $2.0 million increase to our trade receivables allowance for credit losses.
See accompanying Report of Independent Registered Public Accounting Firm.

137


ITEM 16. SUMMARY
None.

122

138


INDEX OF EXHIBITS
Exhibit     
Number
Exhibit Description
2.1
2.1.a
2.32.2
3.1
4.1
4.1.a
4.2
4.2.a
4.3
10.1*
10.1.a*10.1a*
10.1.b*10.1b*
10.2*
10.3*
10.4*10.3a*
10.5*10.3b*
10.4*
10.6*10.5*
10.7*10.5a*
10.8*10.5b*
10.9*10.6*
10.10*10.6a*
10.11*10.7*
10.12*
10.13*
10.14*
10.15*10.8*
10.16*10.9*
10.17*10.10*
10.18*10.11*
10.19*10.12*
10.20*10.13*
10.21*10.14*
10.22*10.15*
10.23*10.16*
10.24*10.17*
10.25*10.18*
10.2610.19*
10.2710.20
10.2810.21
10.2910.22*
10.3010.23
10.3110.24*
10.25
10.3210.26
21.110.27
10.28
10.28a
10.29
10.29a
10.30
10.31
10.32
10.33
10.34
10.35
10.36
10.37
10.38
10.39
10.40
10.41
10.41a
10.41b
10.42
10.43
21.1
23.1
31.1
31.2
32.1**
32.2**
101.INSXBRL Instance Document – the instance document does not appear in the Interactive Data File because its XBRL tags are embedded within the Inline XBRL document.
101.SCHInline XBRL Taxonomy Extension Schema Document.
101.CALInline XBRL Taxonomy Extension Calculation Linkbase Document.
101.DEFInline XBRL Taxonomy Extension Definition Linkbase Document.
101.LABInline XBRL Taxonomy Extension Label Linkbase Document.
101.PREInline XBRL Taxonomy Extension Presentation Linkbase Document.
104Cover Page Interactive Data File (formatted as Inline XBRL and contained in Exhibit 101).
* Indicates a management contract or compensatory plan or arrangement.

** Furnished with this Form 10-K.

123
139


SIGNATURES
Pursuant to the requirements of Section 13 or 15(d) of the Securities Exchange Act of 1934, the Registrantregistrant has duly caused this report to be signed on its behalf by the undersigned, thereunto duly authorized.
TechnipFMC plc
(Registrant)
TechnipFMC plc
(Registrant)
By:
/S/    KRISZTINA DOROGHAZI      
Krisztina Doroghazi

Senior Vice President, Controller and Chief Accounting Officer

(Principal Accounting Officer and a Duly Authorized Officer)
Date: March 2, 2020February 28, 2022
Pursuant to the requirements of the Securities Exchange Act of 1934, this report has been signed below by the following persons on behalf of the registrant and in the capacities and on the dates indicated.
SignatureTitleDate
/S/   DOUGLAS J. PFERDEHIRTChair and Chief Executive Officer
(Principal Executive Officer)
February 28, 2022
Douglas J. Pferdehirt
DateSignature
/S/    ALF MELIN
March 2, 2020
/S/   DOUGLAS J. PFERDEHIRT
Douglas J. Pferdehirt
Chairman and Chief Executive Officer
(Principal Executive Officer)
March 2, 2020
/S/    MARYANN T. MANNEN
Maryann T. Mannen
Executive Vice President, and Chief Financial Officer

(Principal Financial Officer)
February 28, 2022
Alf Melin
March 2, 2020
/S/    ELEAZAR DE CARVALHO FILHO
/S/    ELEAZAR DE CARVALHO FILHO
Director
February 28, 2022
Eleazar de Carvalho Filho
Director
March 2, 2020/S/    CLAIRE S. FARLEY
/Director
SFebruary 28, 2022/    ARNAUD CAUDOUX
Arnaud Caudoux,
Director
March 2, 2020
/S/    PASCAL COLOMBANI
Pascal Colombani, Director
March 2, 2020
/S/    MARIE-ANGE DEBON
Marie-Ange Debon,
Director
March 2, 2020
/S/    CLAIRE S. FARLEY
Claire S. Farley
Director
March 2, 2020/S/    PETER MELLBYE
/Director
SFebruary 28, 2022/    DIDIER HOUSSIN
Peter Mellbye
Didier Houssin,
Director
March 2, 2020/S/    JOHN O’LEARY
/Director
SFebruary 28, 2022/    PETER MELLBYE
John O’Leary
Peter Mellbye,
Director
March 2, 2020/S/   MARGARETH ØVRUM
/Director
SFebruary 28, 2022/    JOHN O’LEARY
Margareth Øvrum
John O’Leary,
Director
March 2, 2020/S/    KAY G. PRIESTLY
/Director
SFebruary 28, 2022/   OLIVIER PIOU
Oliver Piou,
Director
March 2, 2020
/S/KAY G. PRIESTLY
Kay G. Priestly
Director
March 2, 2020/S/    JOHN YEARWOOD
/Director
SFebruary 28, 2022/    JOSEPH RINALDI
John Yearwood
Joseph Rinaldi,
Director
March 2, 2020/S/    SOPHIE ZURQUIYAH
/Director
SFebruary 28, 2022/    JAMES M. RINGLER
Sophie Zurquiyah
James M. Ringler,
Director
March 2, 2020
/S/    JOHN YEARWOOD
John Yearwood, Director

140124