UNITED STATES SECURITIES AND EXCHANGE COMMISSION WASHINGTON, DC 20549 | |
| FORM | 10-K |
(Mark One)
| ANNUAL REPORT PURSUANT TO SECTION 13 OR 15(d) OF THE SECURITIES EXCHANGE ACT OF 1934 | |
For the fiscal year ended December 31, 20172019
OR
| TRANSITION REPORT PURSUANT TO SECTION 13 OR 15(d) OF THE SECURITIES EXCHANGE ACT OF 1934 | |
For the transition period from _____ to _____
Commission File Number 001-37988
(Exact Name of Registrant as Specified in its Charter)
| Delaware | 38-4016639 | ||
(State or other jurisdiction of incorporation or organization) | (I.R.S. Employer Identification No.) | ||
| Texas | 77042 | ||
| (Address of principal executive offices) | (Zip code) | ||
(713) 325-6000
(Registrant’s telephone number, including area code: (713) 960-0381code)
Not Applicable.
(Former Name, Former Address, if Changed Since Last Report)
| Securities registered pursuant to Section 12(b) of the Act: | |||
| Title of Each Class | Trading Symbol | Name of Each Exchange On Which Registered | |
| Common Stock, $0.01 par value | NEX | New York Stock Exchange | |
Securities registered pursuant to Section 12(g) of the Act: None
_______________
Indicate by check mark if the registrant is a well-known seasoned issuer, as defined in Rule 405 of the Securities Act. Yes x☐No¨☒
Indicate by check mark if the registrant is not required to file reports pursuant to Section 13 or Section 15(d) of the Act. Yes ¨☐Nox☒
Indicate by check mark whether the registrant (1) has filed all reports required to be filed by Section 13 or 15(d) of the Securities Exchange Act of 1934 during the preceding 12 months (or for such shorter period that the registrant was required to file such reports), and (2) has been subject to such filing requirements for the past 90 days. Yesx☒ No ¨☐
Indicate by check mark whether the registrant has submitted electronically and posted on its corporate Web site, if any, every Interactive Data File required to be submitted and posted pursuant to Rule 405 of Regulation S-T (§ 232.405 of this chapter) during the preceding 12 months (or for such shorter period that the registrant was required to submit and post such files). Yesx☒ No ¨☐
Indicate by check mark whether the registrant is a large accelerated filer, an accelerated filer, a non-accelerated filer, or a smaller reporting company or an emerging growth company. See the definitions of “large accelerated filer,” “accelerated filer”filer,” “smaller reporting company” and “smaller reporting“emerging growth company” in Rule 12b-2 of the Exchange Act.
| Large accelerated filer | Accelerated filer | ||
| Non-accelerated filer | Smaller reporting company | ||
| Emerging Growth Company | |||
If an emerging growth company, indicate by check mark if the registrant has elected to not use the extended transition period for complying with any new or revised financial accounting standards provided pursuant to Section 13(a) of the Exchange Act. ¨☐
Indicate by check mark whether the registrant is a shell company (as defined in Rule 12b-2 of the Exchange Act). Yes ¨☐ No x☒
The aggregate market value of the common stock of the registrant held by non-affiliates of the registrant, computed by reference to the price at which the common stock was last sold on June 30, 2017,28, 2019, was approximately $492.4$353.0 million.
As of February 26, 2018, March 9, 2020, the registrant had 112,243,769213,193,419 shares of common stock outstanding.
DOCUMENTS INCORPORATED BY REFERENCE
Portions of the registrant’s definitive proxy statement for its 2020 Annual Meeting of Stockholders, which will be filed with the United States Securities and Exchange Commission within 120 days of December 31, 2019, are incorporated by reference into Part III of this Annual Report on Form 10-K.
TABLE OF CONTENTS
| Item 1. | ||
| Item 1A. | ||
| Item 1B. | ||
| Item 2. | ||
| Item 3. | ||
| Item 4. | ||
| Item 5. | ||
| Item 6. | ||
| Item 7. | ||
| Item 7A. | ||
| Item 8. | ||
| Item 9. | ||
| Item 9A. | ||
| Item 9B. | ||
| Item 10. | ||
| Item 11. | ||
| Item 12. | ||
| Item 13. | ||
| Item | ||
| Item 15. | ||
| Item 16. | ||
CAUTIONARY STATEMENT REGARDING FORWARD-LOOKING STATEMENTS AND INFORMATION
This Annual Report on Form 10-K contains forward-looking statements, within the meaning of the Private Securities Litigation Reform Act of 1995, which are subject to risks and uncertainties. All statements other than statements of historical facts contained in this Annual Report on Form 10-K, including statements regarding our future operating results and financial position, business strategy and plans and objectives of management for future operations, are forward-looking statements. Our forward-looking statements are generally accompanied by words such as “may,” “should,” “expect,” “believe,” “plan,” “anticipate,” “could,” “intend,” “target,” “goal,” “project,” “contemplate,” “believe,” “estimate,” “predict,” “potential,” or “continue” or the negative of these terms or other similar expressions. Any forward-looking statements contained in this Annual Report on Form 10-K speak only as of the date on which we make them and are based upon our historical performance and on current plans, estimates and expectations. Except as required by law, we have no obligation to update any forward-looking statements.statements made in this Annual Report on Form 10-K to reflect events or circumstances after the date of this Annual Report on Form 10-K or to reflect new information or the occurrence of unanticipated events. Forward-looking statements contained in this Annual Report on Form 10-K include, but are not limited to, statements about:
• our business strategy;
• our plans, objectives, expectations and intentions;
• our future operating results;
• the competitive nature of the industry in which we conduct our business, including pricing pressures;
• crude oil and natural gas commodity prices;
• demand for services in our industry;
• the impact of pipeline capacity constraints;
• the impact of adverse weather conditions;
• the effects of government regulation;
• legal proceedings, liability claims and effect of external investigations;
• the effect of a loss of, or the financial distress of, one or more key customers;
• our ability to obtain or renew customer contracts;
• the effect of a loss of, or interruption in operations of, one or more key suppliers;
• our ability to maintain the right level of commitments under our supply agreements;
• the market price and availability of materials or equipment;
• the impact of new technology;
• our ability to employ a sufficient number of skilled and qualified workers;
• our ability to obtain permits, approvals and authorizations from governmental and third parties and the effects of government regulation;parties;
• planned acquisitions and future capital expenditures;
• our ability to successfully integrate RockPile;maintain effective information technology systems;
• our ability to maintain an effective system of internal controls over financial reporting;
• our ability to service our debt obligations;
• financial strategy, liquidity or capital required for our ongoing operations and acquisitions, and our ability to raise additional capital;
• the market volatility of our status as a controlled company; andstock;
• our ability or intention to pay dividends or to effectuate repurchases of our common stock.stock;
• the impact of ownerships by Keane Investor and Cerberus; and
• the impact of our corporate governance structure.
We caution you that the foregoing list may not contain all of the forward-looking statements made in this Annual Report on Form 10-K.
You should not rely upon forward-looking statements as predictions of future events. We have based the forward-looking statements contained in this Annual Report on Form 10-K primarily on our current expectations and projections about future events and trends that we believe may affect our business, financial condition, results of operations and
prospects. The outcome of the events described in these forward-looking statements is subject to risks, uncertainties and other factors described in the section entitled Part I, “Item 1A. Risk Factors” and elsewhere in this Annual Report on Form 10-K. Moreover, we operate in a very competitive and rapidly changing environment. New risks and uncertainties emerge from time to time, and it is not possible for us to predict all risks and uncertainties that could have an impact on the forward-looking statements contained in this Annual Report on Form 10-K. We cannot assure you that the results, events, and circumstances, plans, intentions or expectations reflected in any forward-looking statements will be achieved or occur, and actualoccur. Actual results, events or circumstances could differ materially from those described in such forward-looking statements. The forward-looking statements made in this Annual Report on Form 10-K relate only to events as of the date on which the statements are made. We undertake no obligation to update any forward-looking statements made in this Annual Report on Form 10-K to reflect events or circumstances after the date of this Annual Report on Form 10-K or to reflect new information or the occurrence of unanticipated events, except as required by law. We may not actually achieve the plans, intentions or expectations disclosed in our forward-looking statements, and you should not place undue reliance on our forward-looking statements. Our forward-looking statements do not reflect the potential impact of any future acquisitions, mergers, dispositions, joint ventures or investments we may make.We undertake no obligation to revise or update any forward-looking statements for any reason, except as required by law.
This Annual Report on Form 10-K includes market and industry data and certain other statistical information based on third-party sources including independent industry publications, government publications and other published independent sources, such as content and estimates provided by Coras Research, LLC as of December 2017. Coras Research, LLC is not a member of the FINRA or the SIPC and is not a registered broker dealer or investment advisor.sources. Although we believe these third-party sources are reliable as of their respective dates, we have not independently verified the accuracy or completeness of this information. Some data is also based on our own good faith estimates, which are supported by our management’s knowledge of and experience in the markets and businesses in which we operate.
While we are not aware of any misstatements regarding any market, industry or similar data presented herein, such data involves risks and uncertainties and is subject to change based on various factors, including those discussed above and in Part 1, “Item 1A. Risk Factors” in this Annual Report on Form 10-K.
References Within This Annual Report on Form 10-K includes references to utilization of hydraulic fracturing assets. Utilization for our own fleets, as
As used in this Annual Report on Form 10-K, is definedunless the context otherwise requires, references to (i) the terms “Company,” “NexTier,” “we,” “us” and “our” refer to Keane Group Holdings, LLC and its consolidated subsidiaries for periods prior to our initial public offering (“IPO”), and, for periods as of and following the ratioIPO, NexTier Oilfield Solutions Inc. and its consolidated subsidiaries; (ii) the term “Keane Group” refers to Keane Group Holdings, LLC and its consolidated subsidiaries; (iii) the term “Trican Parent” refers to Trican Well Service Ltd. and, where appropriate, its subsidiaries; (iv) the term “Trican U.S.” refers to Trican Well Service L.P.; (v) the term “Trican” refers to Trican Parent and Trican U.S., collectively; (vi) the term “RockPile” refers to RockPile Energy Services, LLC and its consolidated subsidiaries; (vii) the term “RSI” refers to Refinery Specialties, Incorporated; (viii) the term “Keane Investor” refers to Keane Investor Holdings LLC; (ix) the term “Cerberus” refers to Cerberus Capital Management, L.P. and its controlled affiliates and investment funds; (x) the term “C&J” refers to C&J Energy Services, Inc.; (xi) the term “C&J Merger” refers to the consummation of the average numbertransactions described in that certain Agreement and Plan of deployed fleets toMerger, dated as of June 16, 2019 (the “Merger Agreement”), by and among the number of total fleets for a given time period. For the purposes of this Annual Report on Form 10-K, we considerC&J, us and King Merger Sub Corp., one of our fleets deployed if the fleet has been put in service at least one day during the period for which we calculate utilization. Furthermore, we define active fleets as fleets available for deployment and commissioning fleets as idle hydraulic horsepower being converted to active fleets. As a result, as additional fleets are incrementally deployed, our utilization rate increases.
As used in this Annual Report on Form 10-K, capacity in the hydraulic fracturing business refers to the total number of hydraulic horsepower, regardless of whether such hydraulic horsepower is active and deployed, active and not deployed or inactive. While the equipment and amount of hydraulic horsepower required for a customer project varies, we calculate our total number of fleets, as used in this Annual Report on Form 10-K, by dividing our total hydraulic horsepower by approximately 45,000 hydraulic horsepower.
As used in this Annual Report on Form 10-K, references to cannibalization of parked equipment refer to the removal of parts and components (such as the engine or transmission of a fracturing pump) from an idle hydraulic fracturing fleet in order to service an active hydraulic fracturing fleet.
BASIS OF PRESENTATION IN THIS ANNUAL REPORT ON FORM 10-K
On January 25, 2017, we consummated an initial public offering (“IPO”).offering. Our business prior to the IPO was conducted through Keane Group Holdings, LLC and its consolidated subsidiaries (“Keane Group”). To effectuate the IPO, we completed a series of transactions that resulted in a reorganization of our business, resulting in Keane Group, Inc. as a
holding company with no material assets other than its ownership of Keane Group. The consolidated and combined financial statements for the period from January 1, 2017 to July 2, 2017 reflect only the historical results of the Company prior to the completion of the Company’s acquisition of RockPile (as defined herein). The consolidated and combined financial statements for the period from January 1, 2019 to October 31, 2019 reflect only the historical results of the Company prior to the completion of the C&J Merger. The financial statements have been prepared using the acquisition method of accounting under existing U.S. GAAP, which requires that one of the two companies in the C&J Merger be designated as the acquirer for accounting purposes. C&J and Keane determined that Keane was the accounting acquirer. Accordingly, consideration given by Keane to complete the C&J Merger was allocated to the underlying tangible and intangible assets and liabilities acquired based on their estimated fair values as of the date of completion of the C&J Merger, with any excess purchase price allocated to goodwill.
For further details, see Note (1) Basis of Presentation and Nature of Operations of Part II, “Item 8. Financial Statements and Supplemental Data.” For more details regarding the C&J Merger, refer to Note (3) Mergers and Acquisitions.
Unless otherwise indicated, or the context otherwise requires, for periods prior to the completion of the IPO, (i) the historical financial data in this Annual Report on Form 10-K and (ii) the operating and other non-financial data disclosed in Part II, “Item 6. Selected Financial Data” and Part II, “Item 7. Management’s Discussion and Analysis of Financial Condition and Results of Operations” (collectively, the “Financial Statement Sections”) reflect the consolidated business and operations of Keane Group. Financial results for 2016 are the financial results of Keane Group, Inc. and Keane Group Holdings, LLC, the Company'sCompany’s predecessor for accounting purposes, as there was no activity under Keane Group, Inc. in 2016.
All information presented herein is based on our fiscal calendar. Unless otherwise stated, references to particular years, quarters, months or periods refer to our fiscal years and the associated quarters, months and periods of those fiscal years.
3
PART I
Item 1. Business
General description of the business
We were formed under the name Keane Group, Inc. as a Delaware corporation on October 13, 2016, to be a holding corporation as part of an organizational restructuring of Keane Group Holdings, LLC, which was formed March 1, 2011, and its subsidiaries, for the purpose of facilitating the initial public offering of shares of common stock of the highest quality and safety standardsCompany in 2017. In connection with the restructuring, the Keane Group entities became wholly owned subsidiaries of the Company.
In continuation of our growth through acquisition strategy - which, since 2013 has notably resulted in the industry. Through organic growth of the location and four opportunistic acquisitions between 2013 and 2017, we operate in the most active unconventional oil and natural gas basins in the U.S., including the Permian Basin, the Marcellus Shale/Utica Shale, the Eagle Ford Formation and the Bakken Formation, with approximately 1.2 million hydraulic horsepower spread across 26 hydraulic fracturing fleets, 31 wireline trucks, 24 cementing pumps and other ancillary assets. The five cornerstonesscale of our operating principles and culture continue to be focus on health, safety and environment; efficiency and operational excellence;footprint, expansion of our partnership with our customers; transparencycustomer base, addition of wireline operations, increase in our value creation;pumping capacity and our responsibilities to our stakeholders.
Following the second and third quarters of 2018.
Completion Services, includingwhich consists of the following business lines: (1) fracturing services; (2) wireline and pumping services; and (3) completion support services, which includes our hydraulic fracturingresearch and wireline divisions;technology (“R&T”) department;
Well Construction and OtherIntervention Services including our(“WC&I”), which consists of the following business lines: (1) cementing services and drilling divisions. Our Completion(2) coiled tubing services; and
Well Support Services, segment accounted for 99%, 98%,which consists of the following business lines: (1) rig services; (2) fluids management services; and 99% of consolidated revenue during the years ended December 31, 2017, 2016 and 2015, respectively. For further discussion on financial information about our segments, see Note (22) Business Segmentsof Part II, “Item 8. Financial Statements and Supplementary Data.”
(3) specialty well site services.
Completion Services segment
Our completion services are designed in partnership with our customers to enhance both initial production rates and estimated ultimate recovery from new and existing wells. The core services provided through our Completion Services segment are hydraulic fracturing, wireline and pumping services. We utilize our in-house capabilities, including our R&T department and data control instruments business, to offer a technologically advanced and efficiency focused range of completion techniques. The majority of revenue for this segment is generated by our fracturing business.
Hydraulic Fracturing. Hydraulic fracturing services are performed to enhance production of oil and natural gas from formations with low permeability and restricted flow of hydrocarbons. The process of hydraulic fracturing involves pumping a highly viscous, pressurized fracturing fluid, -typicallytypically a mixture of water, chemicals and proppant, into a well casing or tubing in order to fracture underground mineral formations. These fractures release trapped hydrocarbon particles and free a channel for the oil or natural gas to flow freely to the wellbore for
collection. Fracturing fluid mixtures include proppant which becomethat becomes lodged in the cracks created by the hydraulic fracturing process, “propping” them open to facilitate the flow of hydrocarbons upward through the well.
Wireline Technologies. Our wireline services involve the use of a single truck equipped with a spool of wireline that is unwound and lowered into oil and natural gas wells to convey specialized tools or equipment for well completion, well intervention, pipe recovery and reservoir evaluation purposes. We typically provideoffer our wireline services in conjunction with our hydraulic fracturing services in “plug-and-perf” well completions to maximize efficiency for our customers. “Plug-and-perf” is a multi-stage well completion technique for cased-hole wells that consists of pumping a plug and perforating guns to a specified depth. Once the plug is set, the zone is perforated and the tools are removed from the well, a ball is pumped down to isolate the zones below the plug and the hydraulic fracturing treatment is applied.
Well Construction and Intervention Services segment
Cementing. Our cementing services incorporate custom engineered mixing and blending equipment to ensure precision and accuracy in providing annualannulus isolation and hydraulic seal, while protecting fresh water zones offrom our customers’ zone of interest. Our cement division has the expertise to cement shallow to complex high temperature, high pressure wells. We also offer engineering software and technical guidance for remedial cementing applications and acidizing to optimize the performance of our customers'customers’ wells.
Coiled Tubing. We offer a broad range of coiled tubing services to provide top-hole airhelp customers accomplish a wide variety of goals in their horizontal completion, workover and well maintenance projects. The majority of our coiled tubing fleet consists of large diameter coil, meaning two inches or larger in diameter, which allows us to service wells with longer lateral lengths. Our coiled tubing services allow customers to complete projects quickly and safely across a wide spectrum of pressures, without having to shut in their wells.
Well Support Services segment
On March 9, we sold our Well Support Services Segment. For additional information on this transaction, see Note (24) Subsequent Events of Part II, “Item 8. Financial Statements and Supplemental Data.” Prior to the sale, our Well Support Services segment focused on post-completion activities at the well site, and includes rig services, such as workover, fluids management, and other specialty well site services. The majority of revenue for this segment was generated by our rig services business, and we considered our rig services and fluids management businesses to be our primary service lines within this reportable segment.
Rig Services. As part of our services that helped prolong the productive life of an oil or gas well, we operated one of the largest rig fleets in the United States. These rigs were involved in the routine repair and maintenance of oil and gas wells, re-drilling operations and plug and abandonment operations. Workover services can include deepening or extending wellbores into new formations by drilling services. Our drillinghorizontal or lateral wellbores, sealing off depleted production zones and accessing previously bypassed production zones, converting former production wells into injection wells for enhanced recovery operations and conducting major subsurface repairs due to equipment failures. Workover services may last from a few days to several weeks, depending on the complexity of the workover. Maintenance services provided with our rig fleet were generally required throughout the life cycle of an oil or gas well. Examples of these maintenance services include routine mechanical repairs to the pumps, tubing
and other equipment, removing debris and formation material from wellbores, and pulling rods and other downhole equipment from wellbores to identify and resolve production problems. Maintenance services were idledgenerally less complicated than completion and workover related services and required less time to perform. Our rig fleet was also used in May 2015.the process of permanently shutting-in oil or gas wells that were at the end of their productive lives. These plugging and abandonment services generally required auxiliary equipment in addition to a well servicing rig. The demand for plugging and abandonment services was not significantly impacted by the demand for oil and gas because well operators are required within a specified period of time by state regulations to plug wells that are no longer productive.
Fluids Management. We provided a full range of fluid services, including the storage, transportation and disposal of various fluids used in various phases including drilling, completion and workover of oil and gas wells. Our fleet of trucks and trailers and portable tanks enabled us to rapidly deploy our equipment across a broad geographic area. Included in our fleet of fluid trucks and trailers were specialized trucks and trailers that were optimized to transport condensate. We also owned private saltwater disposal wells. Demand and pricing for our fluids management services generally corresponded to demand for our rig services.
Business strategy
Our principal business objective is tohelping our customers win by safely unlocking affordable, reliable and plentiful sources of energy. We believe that by successfully deploying this strategy, we can deliver industry leading returns and increase shareholder value by profitably growing our business, while providing best-in-class completion services, withvalue. We maintain a strict focus on health, safety and environmental stewardship and cost-effective customer-centric solutions. We expect to achieve this objective through:
developing and expanding our relationships with existing and new customers;
continuing our industry leading safety performance and focus on the environment;
investing further in driving efficiencies, including our robust maintenance program;
maintaining a conservative balance sheet to preserve operational and strategic flexibility; and
continuing to evaluate potential consolidation opportunities that strengthen our capabilities, increase our scale and create shareholder value.
For further discussion on the business strategies we plan to continue executing in 2018,2020, see Part II, “Item 7. Management’s Discussion and Analysis of Financial Condition and Results of Operations.”
Customers
Our customers primarily include major integrated and large independent oil and natural gas E&P companies. For the year ended December 31, 2017, no customer represented more than 10% of our consolidated revenue. For the year ended December 31, 2016, three2019, we had four customers Shell Exploration & Production, XTO Energy and Seneca Resources Corporation,who individually represented more than 10% of our consolidated revenue. These four customers collectively represented 55% of our consolidated revenue and 21% of our total accounts receivable for the fiscal year ended December 31, 2019. For the year ended December 31, 2015, four2018, we had three customers EQT Production Company, XTO Energy, Shell Exploration & Production and Southwestern Energy Company,who individually represented more than 10% of our consolidated revenue. These three customers collectively represented 39% of our consolidated revenue and 45% of our total accounts receivable for the fiscal year ended December 31, 2018. For the year ended December 31, 2017, no customer individually represented more than 10% of our consolidated revenue.
Competition and Sales
The markets in which we operate are highly competitive.competitive with significant potential for excess capacity. We provide services in various geographic regions across the U.S., and the competitive landscape varies in each. Utilization and pricing for our services have from time to time been negatively affected by increases in supply relative to demand in our operating areas and geographic markets. Our major competitors for both our Completions Services and Well Construction and Intervention Services segments include many large and small oilfield service providers, including some of the largest integrated service companies. In addition, the business segments in which we compete are highly fragmented. Our integrated hydraulic fracturing and wireline services compete with large, integrated oilfield service companies such asFTS International, Inc., Halliburton Company, Schlumberger Limited, Weatherford International plc and Baker Hughes Incorporated, as well as other companies such as RPC, Inc., Superior EnergyLiberty Oilfield Services Inc., C&J Energy Services, Inc., Basic Energy Services, Inc. and FTS International, Inc. Our hydraulic fracturing services also compete with Calfrac Well Services Ltd., U.S. Well Services, Patterson-UTI Energy, Inc., ProPetro Services, Inc., RPC, Inc.,
Schlumberger Limited, Superior Energy Services, Inc. and Liberty OilfieldU.S. Well Services. Our major competitors for our Well Support Services include Key Energy Services, Basic Energy Services, Superior Energy Services, Precision Drilling, Forbes Energy Services, Pioneer Energy Services and Ranger Energy Services. We also compete regionally in each segment with a significant number of smaller service providers.
We believe the principal competitive factors in the markets we serve are our multi-basin service capability and close proximity to our customers, our technical expertise, our equipment capacity, ourreliability, work force competency, our efficiency, our safety record, our reputation, our experience and our prices. Additionally, projects are often awarded on a bid basis, which tends to create a highly competitive environment. While we seek to be competitive in our pricing, we believe many of our customers elect to work with us based on our customer-tailored partnership approach, our safety record, the performance and qualitycompetency of our crews and the quality of our equipment and our services. We seek to differentiate ourselves from our competitors by delivering the highest-quality services and equipment possible, coupled with superior execution and operating efficiency, resulting in cost effective operations and a safe working environment.
Raw materials
We purchase a wide variety of raw materials, parts and components that are manufactured and supplied for our operations. We are not dependent on any single source of supply for those parts, supplies or materials. To date, we have generally been able to obtain the equipment, parts and supplies necessary to support our operations on a timely basis. While we believe we will be able to make satisfactory alternative arrangements in the event of any interruption in the supply of these materials and/or products by one of our suppliers, this may not always be the case. In addition, certain materials for which we do not currently have long-term supply agreements such as guar (which experienced a shortage and significant price increase in 2012), could experience shortages and significant price increases in the future.
Research & technology and intellectual property
We have invested in technological advancement, including the rightdevelopment of a state-of-the-art research and technology center staffed by a team of highly skilled engineers. Our efforts to use certain Trican proprietary fracking-related fluids as of the closing date of the Trican transaction, such as MVP Frac™ and TriVert™ (the “Fracking Fluids”), for Keane’s pressure pumping serviceshave been focused on developing innovative, fit-for-purpose solutions designed to its customers. The license does not allow Keane to manufacture the Fracking Fluids, but allows Keane to purchase the Fracking Fluids from Trican’s suppliers.
We own a number of substantially all intellectual property relating primarilypatents and have pending certain patent applications covering various products and services. We are also licensed to Trican’s U.S. oilfield services business, which includes know-how, trade secrets, formulas, processes, customer lists and other non-registered intellectual property primarily used in connection with that business. Keane also entered into two fully paid-up, perpetual, non-exclusive licenses to certain intellectual propertyutilize technology covered by patents owned by Trican or its affiliates. See Part III, “Item 13. Certain Relationships and Related-Party Transactions and Director Independence-Trican Transaction” for more information. We believe the proprietary technology and engineering capabilities acquired in the Trican transaction have enhanced our integrated services solutions and better positioned our company to meet our customers’ technical demands.
Seasonality
Employees
As of December 31, 2017,2019, we employed 2,748 people,had 6,525 employees, of which, approximately 80%77% were compensated on an hourly basis. Our employees are not covered by collective bargaining agreements, nor are they members of labor unions. While we consider our relationship with our employees to be satisfactory, disputes may arise over certain classifications of employees that are customary in the oilfield services industry. We are not aware of any other potentially adverse matters involving our employment practices.practices on a company-wide level.
Environmental, health and safety regulation
Our operations are subject to stringent and complex federal, state and local laws, rules and regulations relating to the oil and natural gas industry, including the discharge of materials into the environment or otherwise relating to health and safety or the protection of the environment. Numerous governmental agencies, such as the Environmental Protection Agency (the “EPA”), issue regulations to implement and enforce these laws, which often require costly compliance measures. Failure to comply with these laws and regulations may result in the assessment of substantial administrative, civil and criminal penalties, expenditures associated with exposure to hazardous materials, remediation of contamination, property damage and personal injuries, imposition of bond requirements, and restricting permits or other authorizations, as well as the issuance of injunctions limiting or prohibiting our activities. In addition, some laws and regulations relating to
protection of the environment may, in certain circumstances, impose strict liability for environmental contamination, rendering a person liable for environmental damages and clean-up costs without regard to negligence or fault on the part of that person. Strict adherencecompliance with these regulatory requirements increases our cost of doing business and consequently affects our profitability. However, environmental laws and regulations have been subject to frequent changes over the years, and the imposition of more stringent requirements, including those that result in any limitation, suspension or moratorium on the services we provide, whether or not short-term in nature, by federal, state, regional or local governmental authority, could have a material adverse effect on our business, financial condition and results of operations.
The Comprehensive Environmental Response, Compensation and Liability Act (“CERCLA” or the “Superfund law”), and comparable state laws impose liability on certain classes of persons that are considered to be responsible for the release of hazardous or other state-regulated substances into the environment. These persons include the current or former owner or operator of the site whereand the owner or operator of the site at the time of the release occurred and the parties that disposed or arranged for the disposal or treatment of hazardous or other state-regulated substances that have been released at the site. Under CERCLA, these persons may be subject to strict liability, joint and several liability, or both, for the costs of investigating and cleaning up hazardous substances that have been released into the environment, damages to natural resources and human health studies without regard to fault. In addition, companies that incur a CERCLA liability frequently confront claims by neighboring landowners and other third parties for personal injury and property damage allegedly caused by the release of hazardous or other regulated substances or pollutants into the environment.
The federal Solid Waste Disposal Act, as amended by the Resource Conservation and Recovery Act of 1976, (“RCRA”) and analogous state lawlaws generally excludes oil and gas exploration and production wastes (e.g., drilling fluids, produced waters) from regulation as hazardous wastes. However, these wastes remain subject to potential regulation as solid wastes under RCRA and as hazardous waste under other state and local laws. Moreover, wastesWastes from some of our operations (such as, but not limited to, our chemical development, blending and distribution operations, as well as some maintenance and manufacturing operations) are or may be regulated under RCRA and
analogous state lawlaws under certain circumstances. Further, any exemption or regulation under RCRA does not alter treatment of the substance under CERCLA. The impact of future revisions to environmental laws and regulations cannot be predicted. Moreover, stricter standards for waste handling and disposal may be imposed on the oil and natural gas industry in the future. Removal of RCRA’s exemption for exploration and production wastes has the potential to significantly increase waste disposal costs, which in turn will result in increased operating costs and could adversely impact our business and results of operations. Naturally Occurring Radioactive Materials (“NORM”) may contaminate extraction and processing equipment used in the oil and natural gas industry. The waste resulting from such contamination is regulated by federal and state laws. Standards have been developed for: worker protection; treatment, storage, and disposal of NORM and NORM waste; management of NORM-contaminated waste piles, containers and tanks; and limitations on the relinquishment of NORM contaminated land for unrestricted use under RCRA and state laws. It is possible that we may incur costs or liabilities associated with elevated levels of NORM.
The Federal Water Pollution Control Act (the “Clean Water Act”), and comparable state statutes impose restrictions and strict controls regarding the discharge of pollutants into state waters or waters of the United States. The discharge of pollutants into jurisdictional waters is prohibited unless the discharge is permitted by the EPA or applicable state agencies. The Clean Water Act also prohibits the discharge of dredge and fill material into regulated waters, including jurisdictional wetlands, unless authorized by an appropriately issued permit. CWA program predictability and consistency have been uncertain for several years due to regulatory changes concerning clarity as to the scope of ‘waters of the United States’ federally regulated under the Act and litigation over those changes. The process for obtaining permits has the potential to delay the development of natural gas and oil projects. Also, spill prevention, control and countermeasure regulations under federal law require appropriate containment berms and similar structures to help prevent the contamination of navigable waters in the event of a petroleum hydrocarbon tank spill, rupture or leak.
In addition, the Clean Water Act and analogous state laws require individual permits or coverage under general permits for discharges of storm water runoff from certain types of facilities. Moreover, the Oil Pollution Act of 1990 (“OPA”) imposes a variety of requirements on responsible parties related to the prevention of oil spills and liability for damages, including natural resource damages, resulting from such spills in waters of the United States. A responsible party includes the owner or operator of an onshore facility. The Clean Water Act and analogous state laws provide for administrative, civil and criminal penalties for unauthorized discharges and, together with the OPA, impose rigorous requirements for spill prevention and response planning, as well as substantial potential liability for the costs of removal, remediation, and damages in connection with any unauthorized discharges.
From time to time, releases of materials or wastes have occurred at locations we own or at which we have operations. These properties and the materials or wastes released thereon may be subject to CERCLA, RCRA, the federal Clean Water Act, the Safe Drinking Water Act (the “SDWA”) and analogous state laws. Under these laws or other laws and regulations, we have been and may be required to remove or remediate these materials or wastes and make expenditures associated with personal injury or property damage. At this time, with respect to any properties where materials or wastes may have been released, it is not possible to estimate the potential costs that may arise from unknown, latent liability risks.
There has been increasing public controversy regarding hydraulic fracturing with regard to theand its use of fracturing fluids, including potential impacts of the process on drinking water supplies, on the use of water and the potential for impacts to surface water, groundwater and the environment generally.general environment. Companion bills entitled the Fracturing Responsibility and Awareness Chemicals Act (“FRAC Act”) were first introduced in the United States Congress in 2009 and successor bills have been reintroduced in the House of Representatives on multiple occasions, most recently in May 2013 and in the United States Senate in June 2013.July 2019. If the FRAC Act and other similar legislation were to pass, the legislation could significantly alter regulatory oversight of hydraulic fracturing. Currently, unless the fracturing fluid used in the hydraulic fracturing process contains diesel fuel, hydraulic fracturing operations are exempt from permitting under the Underground Injection Control (“UIC”) program inestablished by the SDWA.SDWA, but subject to regulation by state oil and gas commissions. The FRAC Act would remove this exemption and subject hydraulic fracturing operations to permitting requirements under the UIC program. The FRAC Act and other similar bills propose to also require
persons conducting hydraulic fracturing to disclose the chemical constituents of their fracturing fluids to a regulatory agency, although they would not require the disclosure of the proprietary formulas except in cases of emergency. Currently, several states already require public disclosure of non-proprietary chemicals on FracFocus.org and other equivalent Internet sites. Disclosure of our proprietary chemical formulas to third parties or to the public, even if inadvertent, could diminish the value of those formulas and could result in
competitive harm to our business. Moreover, in response to seismic events near underground injection wells used for the disposal of oil and gas-related wastewater, federal and some state agencies have begun investigating whether such wells have caused increased seismic activity, and some states have imposed volumetric injection limits, shut down or imposed moratorium on the use of such injection wells. At this time, it is not clear what action, if any, the United States Congress will take on the FRAC Act or other related federal and state bills, or the ultimate impact of any such legislation.
If the FRAC Act or similar legislation becomes law, or the Department of the Interior or another federal agency asserts jurisdiction over certain aspects of hydraulic fracturing operations, additional regulatory requirements could be established at the federal level that could lead to operational delays or increased operating costs, making it more difficult to perform hydraulic fracturing and increasing the costs of compliance and doing business for us and our customers. States in which we operate have considered and may again consider legislation that could impose additional regulations and/or restrictions on hydraulic fracturing operations. At this time, it is not possible to estimate the potential impact on our business of these state actions or the enactment of additional federal or state legislation or regulations affecting hydraulic fracturing.
In addition, at the direction of Congress, the EPA undertook a study of the potential impacts of hydraulic fracturing on drinking water and groundwater and issued its report in December 2016. The EPA report states that there is scientific evidence that hydraulic fracturing activities can impact drinking water resources under some circumstances and identifies certain conditions in which the EPA believes the impact of such activities on drinking water and groundwater can be more frequent or severe. The EPA study could spur further initiatives to regulate hydraulic fracturing under the SDWA or otherwise. Similarly, other federal and state studies such as those currently being conducted by, for example, the Secretary of Energy’s Advisory Board and the New York Department of Environmental Conservation, may recommend additional requirements or restrictions on hydraulic fracturing operations.
Any regulation that restricts the ability to dispose of produced waters or increases the cost of doing business could cause curtailed or decreased demand for our services and have a material adverse effect on our business. Local governments also may seek to adopt ordinances within their jurisdictions regulating the time, place and manner of drilling activities in general or hydraulic fracturing activities in particular or prohibit the performance of well drilling in general or hydraulic fracturing in particular. We believe that we follow applicable standard industry practices and legal requirements for groundwater protection in our hydraulic fracturing activities. If new federal, state or local laws or regulations that significantly restrict hydraulic fracturing are adopted, such legal requirements could result in delays, eliminate certain drilling and injection activities and make it more difficult or costly to perform hydraulic fracturing. Any such regulations limiting or prohibiting hydraulic fracturing could result in decreased oil and natural gas exploration and production activities and, therefore, adversely affect demand for our services and our business.
The federal Clean Air Act and comparable state laws regulate emissions of various air pollutants through air emissions permitting programs and the imposition of other requirements. In addition, the EPA has developed and continues to develop stringent regulations governing emissions of toxic air pollutants from specified sources. We are or may be required to obtain federal and state permits in connection with certain operations ofconducted in our manufacturing and maintenance facilities. These permits impose certain conditions and restrictions on our operations, some of which require significant expenditures for filtering or other emissions control devices at each of our manufacturing and maintenance facilities. Changes in these requirements, or in the permits we operate under, could increase our costs or limit certain activities. Additionally,Many of these regulatory requirements, including New Source Performance Standards and Maximum Achievable Control Technology standards have been made more stringent over time as a result of stricter national ambient air quality standards (“NAAQS”) and other air quality protection goals adopted by the EPA’s Transition Program for Equipment Manufacturers regulations apply to certain off-road diesel engines used by us to power equipmentEPA. State implementation of the revised NAAQS could result in the field. Under these regulations, we are subject to certainstricter permitting requirements, with respect to retrofittingdelay or retiring certain engines, and we are limited in the number of new non-compliant off-road diesel engines we can purchase. Engines that are compliant with the current emissions standards can be costlier and can be subject to limited availability. It is possible that these regulations could limitprohibit our ability to acquire a sufficient numberobtain such permits, and result in increased expenditures for pollution control equipment, the costs of diesel engines to expand our fleet and/or upgrade our existing equipment by replacing older engines as they are taken out of service.which could be significant.
Exploration and production activities on federal lands may be subject to review under the National Environmental Policy Act (“NEPA”). NEPA requires federal agencies, including the Department of the Interior, to evaluate major agency actions that have the potential to significantly impact the environment. In the course of such evaluations, an agency will prepare an environmental assessment of the potential direct, indirect and cumulative impacts of a proposed project and, if necessary, will prepare a more detailed environmental impact statement that may be made available for public review and comment. All of our activities and our customers’ current E&P activities, as well as proposed exploration and development plans, on federal lands require governmental permits that are subject to the requirements of NEPA. ThisThe NEPA review process has the potential to delay the permitting and subsequent development of oil and natural gas projects.
Various state and federal statutes prohibit certain actions that adversely affect endangered or threatened species and their habitat, migratory birds, wetlands and natural resources. These statutes include the Endangered Species Act, the Migratory Bird Treaty Act, the Clean Water Act and CERCLA. Government entities or private parties may act to prevent oil and gas exploration activities or seek damages where harm to species, habitat or natural resources may result from the filling of jurisdictional streams or wetlands, or the construction of oil and gas facilities or the release of oil, wastes, hazardous substances or other regulated materials. The U.S. Fish and Wildlife Service must also designate the species’ critical habitat and suitable habitat as part of the effort to ensure survival of the species. A critical habitat or suitable habitat designation could result in further material restrictions to land use and may materially delay or prohibit land access for oil and natural gas development. If our customers were to have areas within their business and operations designated as critical or suitable habitat or a protected species, it could decrease demand for our services and have a material adverse effect on our business. At this time, it is not possible to estimate the potential impact on our business of these speculative federal, state or private actions or the enactment of additional federal or state legislation or regulations with respect to these matters.
More stringent laws and regulations relating to climate change may be adopted in the future and could cause us to incur additional operating costs or reduce the demand for our services. The EPA has determined that emissions of carbon dioxide, methane, and other greenhouse gases (“GHGs”) present an endangerment to the environment because emissions of such gases are, according to the EPA and many scientists, contributing to the warming of the earth’s atmosphere and other climatic changes. Based on these findings, EPA has adopted regulations that restrict emissions of GHGs under existing provisions of the CAA, including rules that require preconstruction and operating permit reviews for GHG emissions from certain large stationary sources.
The EPA has proposed and finalized a number of rules requiring various industry sectors to track and report, and, in some cases, control greenhouse gas emissions. The EPA’s Mandatory ReportingEPA has also adopted rules requiring the monitoring and reporting of Greenhouse Gases Rule was published in October 2009. This rule requires largeGHG emissions from specified GHG sources, and suppliers in the U.S. to track and report greenhouse gas emissions. In June 2010, the EPA’s Greenhouse Gas Tailoring Rule became effective. For this rule to apply initially, the source must already be subject to the Clean Air Act Prevention of Significant Deterioration program or Title V permit program; we are not currently subject to either Clean Air Act program. On November 8, 2010, the EPA finalized a rule that sets forth reporting requirements for the petroleumincluding, among others, certain oil and natural gas industry. Among other things, thisproduction facilities, on an annual basis. Implementation and status of 2016 final rules that establish new air emission controls for emissions of methane from certain equipment and processes in the oil and natural gas source category, including production, processing transmission and storage activities. The EPA’s final rule requires persons that hold state permits for onshorepackage included first-time standards to address emissions of methane from equipment and processes across the source category, including hydraulically fractured oil and natural gas well completions. However, regulatory developments to ease or rescind these rules have created uncertainty as to their impact on the oil and gas exploration and production and that emit 25,000 metric tons or more of carbon dioxide equivalent per year to annually report carbon dioxide, methane and nitrous oxide combustion emissions from (i) stationary and portable equipment and (ii) flaring. Under the final rule, our customers may be required to include calculated emissions from our hydraulic fracturing equipment located on their well sites in their emission inventory.industry.
The trajectory of future greenhouse regulations remains unsettled. In March 2014, the White House announced its intention to consider further regulation of methane emissions from the oil and gas sector. It is unclear whether Congress will take further action on greenhouse gases, for example, to further regulate greenhouse gas emissions or alternatively to statutorily limit the EPA’s authority over greenhouse gases. Even without federal legislationHowever, almost one-half of the states have established or regulationjoined GHG cap and trade programs. Most of these cap and trade programs work by requiring major sources of emissions or major producers of fuels, to acquire and surrender emission allowances. The number of allowances available for purchase is reduced each year in an effort to achieve the overall greenhouse gas emissions, states may pursue the issue either directly or indirectly.emission reduction goal. Restrictions on emissions of methane or carbon dioxide that may be imposed in various states could adversely affect the oil and natural gas industry and, therefore, could reduce the demand for our products and services.
Recently, activists concerned about the potential effects of climate change have directed their attention at sources of funding for fossil-fuel energy companies, which has resulted in certain financial institutions, funds and other sources of capital restricting or eliminating their investment in oil and natural gas activities. Ultimately, this could make it more difficult to secure funding for exploration and production activities, which could have a material adverse effect on our business and results of operations. Moreover, incentives to conserve energy or use alternative energy sources as a means of addressing climate change could reduce demand for the oil and natural gas our customers produce. Finally, it should be noted that many scientists have concluded that increasing concentrations of GHGs in the earth’s atmosphere may produce climatic changes that have significant physical effects, such as increased frequency and severity of storms, droughts, and floods and other climatic events; if any such effects were to occur, they could have an adverse effect on our assets and operations.
Climate change regulation may also impact our business positively by increasing demand for natural gas for use in producing electricity and as a transportation fuel. Currently, our operations are not materially adversely impacted by existing state and local climate change initiatives. At this time, we cannot accurately estimate how potential future laws or regulations addressing greenhouse gas emissions would impact our business.
Safety is our highest priority, and we believe we are among the safest service providers in the industry. For example, we achieved a total recordable incident rate of0.68in 2019, which is substantially less than the industry average of 1.07 from 2015 to 2018. We believe total recordable incident rate is a reliable measure of safety performance.
We are subject to the requirements of the federal Occupational Safety and Health Act, which is administered and enforced by the Occupational Safety and Health Administration, commonly referred to as OSHA, and of comparable state laws that regulate the protection of the health and safety of workers. In addition, the OSHA hazard communication standard requires that information be maintained about hazardous materials used or produced in operations and that this information be provided to employees, state and local government authorities and the public. We believe that our operations are in substantial compliance with the OSHA requirements, including general industry standards, record keeping requirements and monitoring of occupational exposure to regulated substances. OSHA continues to evaluate worker safety and to propose new regulations, such as but not limited to, the new rule regarding respirable silica sand, which requires the oil and gas industry to implement engineering controls and work practices to limit exposures below the new limits by June 23, 2021.
Among the services we provide, we operate as a motor carrier and therefore are subject to regulation by the United States Department of Transportation (“DOT”) and various state agencies. These regulatory authorities exercise broad powers, governing activities such as the authorization to engage in motor carrier operations; regulatory safety; hazardous materials labeling, placarding and marking; financial reporting; and certain mergers, consolidations and acquisitions. There are additional regulations specifically relating to the trucking industry, including testing and specification of equipment and product handling requirements. The trucking industry is subject to possible regulatory and legislative changes that may affect the economics of the industry by requiring changes in operating practices or by changing the demand for common or contract carrier services or the cost of providing truckload services. Some of these possible changes include increasingly stringent environmental regulations, changes in the hours of service regulations which govern the amount of time a driver may drive in any specific period and requiring onboard black box recorder devices or limits on vehicle weight and size, and setting minimum training standards for new drivers seeking a commercial driver’s license. Certain motor vehicle operators are required to register with the DOT. This registration requires an acceptable operating record. The DOT periodically conducts compliance reviews and may revoke registration privileges based on certain safety performance criteria, and a revocation could result in a suspension of operations.
Interstate motor carrier operations are subject to safety requirements prescribed by DOT. To a large degree, intrastate motor carrier operations are subject to safety regulations that mirror federal regulations. Such matters as weight and dimension of equipment are also subject to federal and state regulations. DOT regulations also mandate drug testing of drivers. From time to time, various legislative proposals are introduced, including proposals to increase federal, state or local taxes, including taxes on motor fuels, which may increase our costs or adversely
impact the recruitment of drivers. We cannot predict whether, or in what form, any increase in such taxes applicable to us will be enacted.
In addition, some of our operations utilize equipment that contains sealed, low-grade radioactive sources. Our activities involving the use of radioactive materials are regulated by the United States Nuclear Regulatory Commission (“NRC”) and state regulatory agencies under agreement with the NRC. Standards implemented by these regulatory agencies require us to obtain licenses or other approvals for the use of such radioactive materials. We believe that we have obtained these licenses and approvals as necessary and applicable. Numerous governmental agencies issue regulations to implement and enforce these laws, for which compliance is often costly and difficult. The violation of these laws and regulations may result in the denial or revocation of permits, issuance of corrective action orders, injunctions prohibiting some or all of our operations, assessment of administrative and civil penalties, and even criminal prosecution. In addition, releases of radioactive material could result in substantial remediation costs and potentially expose us to third-party property damage or personal injury claims.
We seek to minimize the possibility of a pollution event through equipment and job design, as well as through training of employees. We also maintain a pollution risk management program that is activated in the event a pollution event occurs. This program includes an internal emergency response plan that provides specific procedures for our employees to follow in the event of a chemical release or spill. In addition, we have contracted with several third-party emergency responders in our various operating areas that are available on a 24-hour basis to handle the remediation and clean-up of any chemical release or spill. We carry insurance designed to respond to foreseeablefortuitous environmental pollution events. This insurance portfolio has been structured in an effort to address pollution incidents that result in bodily injury or property damage and any ensuing clean up required at our owned facilities, as a result of the mobilization and utilization of our fleets, as well as any environmental claims resulting from our operations.
We also seek to manage environmental liability risks through provisions in our contracts with our customers that generally allocate risks relating to surface activities associated with the hydraulic fracturing process, other than water disposal, to us and risks relating to “down-hole” liabilities to our customers. Our customers are responsible for the disposal of the fracturing fluid that flows back out of the well as waste water, for which they use a controlled flow-back process. We are not involved in that process or the disposal of the resulting fluid. Our contracts generally require our customers to indemnify us against pollution and environmental damages originating below the surface of the ground or arising out of water disposal, or otherwise caused by the customer, other contractors or other third parties. In turn, we generally indemnify our customers for pollution and environmental damages originating at or above the surface caused solely by us. We seek to maintain consistent risk-allocation and indemnification provisions in our customer agreements to the extent possible. Some of our contracts, however, contain less explicit indemnification provisions, which typically provide that each party will indemnify the other against liabilities to third parties resulting from the indemnifying party’s actions, except to the extent such liability results from the indemnified party’s gross negligence, willful misconduct or intentional act.
Insurance
Our operations are subject to hazards inherent in the oil and natural gas industry, including accidents, blowouts, explosions, craterings,cratering, fires, oil spills, surface and underground pollution and contamination, hazardous material spills, loss of well control, damage to or loss of the wellbore, formation or underground reservoir, damage or loss from the use of explosives and radioactive materials, spills.and damage or loss from inclement weather or natural disasters. These conditions can cause personal injury or loss of life, damage to or destruction of property, equipment, the environment and wildlife, and interruption or suspension of operations, among other adverse effects. In addition, claims for loss of oil and natural gas production and damage to formations can occur in the well services industry. If
Additionally, our business involves, and is subject to hazards associated with, the transportation of heavy equipment and materials, as well as heavily regulated explosive and radioactive materials. Regularly having a significant number of both commercial and non-commercial motor vehicles on the road creates a high risk of vehicle accidents. The occurrence of a serious accident were to occur at a location whereinvolving our employees, equipment andand/or services, are being used, it could result in our being named as a defendant to a lawsuit asserting significant claims.
claims, and we may also be liable to indemnify certain third-parties, specifically including its customers, for large claims for damages in situations where our employees, equipment and/or services were involved.
Despite our efforts to maintain high safety standards, we from time to time have sufferedexperienced accidents in the past, and we anticipate that we could experience accidents in the future. In addition to the property and personal losses from these accidents, the frequency and severity of these incidents affect our operating costs and insurability, as well as our relationships with customers, employees and regulatory agencies. Any significant increase in the frequency or severity of these incidents, or the general level of compensation awards, could adversely affect the cost of, or our ability to obtain, workers’ compensation and other forms of insurance, and could have other adverse effects on our financial condition and results of operations.
We carry a variety of insurance coverages for our operations, and we are partially self-insured for certain claims, in amounts that we believe to be customary and reasonable. However, our insurance may not be sufficient to cover any particular loss or may not cover all losses. Historically, insurance rates have been subject to various market fluctuations that may result in less coverage, increased premium costs, or higher deductibles or self-insured retentions.
Availability of filings
Our Annual reports on Form 10-K, Quarterly reports on Form 10-Q, current reports on Form 8-K and amendments to those reports filed or furnished pursuant to Section 13(a) or 15(d) of the Securities Exchange Act of 1934, as amended (the “Exchange Act”), are made available free of charge on our internet web site at www.keanegrp.com,www.nextierofs.com, as soon as reasonably practicable after we have electronically filed the material with, or furnished it to, the Securities and Exchange Commission (the “SEC”). The public may read and copy any materials we have filed with the SEC at the SEC’s Public Reference Room at 100 F Street, NE, Washington, DC 20549. Information on the operation of the Public Reference Room may be obtained by calling the SEC at 1-800-SEC-0330. The SEC maintains an internet site that contains our reports, proxy and information statements and our other SEC filings. The address of that web site is https://www.sec.gov/.
We webcast our earnings calls and certain events we participate in or host with members of the investment community on our investor relations website at https://investors.keanegrp.com/.investors.nextierofs.com/ir-home. Additionally, we provide notifications of news or announcements regarding our financial performance, including SEC filings, investor events, press and earnings releases and blogs as part of our investor relations website. We have used, and intend to continue to use, our investor relations website as means of disclosing material information and for complying with our disclosure obligations under Regulation Fair Disclosure. Further corporate governance information, including our certificate of incorporation, bylaws, governance guidelines, board committee charters and code of business conduct and ethics, is also available on our investor relations website under the heading “Corporate Governance.” The contents of our websites are not intended to be incorporated by reference into this Annual Report on Form 10-K or in any other report or document we file with the SEC, and any references to our websites are intended to be inactive textual references only.
14
Item 1A. Risk Factors
RISK FACTORS
Risks Related to Our Business and Industry
Our business is cyclical and depends on spending and well completions by the onshore oil and natural gas industry predominately in the U.S.,United States, and the level of such activity is volatile. Our business has been, and may continue to be, adversely affected by industry and financial marketconditions that are beyond our control.
Our business is cyclical, and we depend on the willingness of our customers to make expenditures to explore for, develop and produce oil and natural gas from onshore unconventional resources located predominantly in the United States (“U.S.”). The willingness of our customers to undertake these activities depends largely upon prevailing industry and financial market conditions that are influenced by numerous factors over which we have no control, including:
prices and expectations about future prices for oil and natural gas;
domestic and foreign supply of, and demand for, oil and natural gas and related products;
the level of global and domestic oil and natural gas inventories;
the supply of and demand for hydraulic fracturing and other oilfield services and equipment in the United States;U.S. and the areas in which we operate;
the cost of exploring for, developing, producing and delivering oil and natural gas;
lead times associated with acquiring equipment and products and availability of qualified personnel;
the discovery rates ofat which new oil and natural gas reserves;reserves are discovered;
federal, state and local regulation of hydraulic fracturing and other oilfield service activities, as well as exploration and production activities, including public pressure on governmental bodies and regulatory agencies to regulate our industry;
the availability of water resources, suitable proppant and chemicals in sufficient quantities for use in hydraulic fracturing fluids;
geopolitical developments, and political instability and recent (and potential future) armed hostilities in oil and natural gas producing countries;
actions of the Organization of the Petroleum Exporting Countries (“OPEC”), its members and other state-controlled oil companies relating to oil price and production controls;
advances in exploration, development and production technologies or in technologies affecting energy consumption;
the price and availability of alternative fuels and energy sources;
disruptions due to natural disasters, unexpected or extreme weather conditions, etc.;public health crises (such as coronavirus) and similar factors;
merger and divestiture activity amongst oil and natural gas producers;
uncertainty in capital and commodities markets and the ability of oil and natural gas producers and oil and natural gas midstream operators to raise equity capital and debt financing;
investor and activist focus on corporate social responsibility and sustainability; and
U.S. federal, state and local and non-U.S. governmental regulations and taxes.
The volatility of the oil and natural gas industry and the resulting impact on exploration and production activity could adversely impact the level of drilling and completion activity by some of our customers. This volatility may result in a decline in the demand for our services or adversely affect the price of our services. In addition, material declines in oil and natural gas prices, or drilling or completion activity in the U.S. oil and natural gas shale regions, could have a material adverse effect on our business, financial condition, prospects, results of operations and cash flows. In addition,Furthermore, a decrease in the development of oil and natural gas reserves in our market areasthe U.S. may also have an adverse impact on our business, even in an environment of strong oil and natural gas prices.
A decline in or substantial volatility of crude oil and natural gas commodity prices could adversely affect the demand for our services.
The demand for our services is substantially influenced by current and anticipated crude oil and natural gas commodity prices, and the related level of drilling and completion activity and general production spending in the areas in which we have operations. Volatility or weakness in crude oil and natural gas commodity prices (or the perception that crude oil and natural gas commodity prices will decrease) affects the operational and capital spending patterns of our customers, and the products and services we provide are, to a substantial extent, deferrable in the event oil and natural gas companies reduce capital expenditures. As a result, weDuring periods of declining oil and natural gas prices, or when pricing remains depressed, our customer base may experience lowersignificant declines in drilling, completion and production activities, which in turn may result in reduced utilization of, and may be forcedincreased competition and pricing pressure to lowervarying degrees across our rates for, our equipmentservice lines and services.operating areas.
Worldwide military, political and natural gas prices have recovered to $60.46 per barreleconomic events, including initiatives by OPEC, affect both the demand for, and $3.69 per MMbtu, respectively, asthe supply of, December 29, 2017, the volatility of our industry persists.
Adverse weather conditions could impact demand for our services or materially impact our costs.
Our business could be materially adversely affected by adverse weather conditions. Our operations and the operations of our customers may be adversely affected by seasonal weather conditions, severe weather events and natural disasters. For example, periods of drought, hurricanes, tropical storms, heavy snow, ice or rain may result in customer delays and other disruptions to our services, including availability of key products such as sand and water. Repercussions of adverse weather conditions may include:
curtailment of services;
weather-related damage to facilities and equipment, resulting in delays in operations;
inability to deliver equipment, personnel and products to job sites in accordance with contract schedules;
increase in the price of key products or insurance; and
loss of productivity.
Competition and availability of excess equipment within the oilfield services industry may adversely affect our ability to market and price our services.
The oilfield services industry is highly competitive. The principal competitive tactics in our markets are generally price, technical expertise, the availability and condition of equipment, work force capability, safety record, reputation and experience. Furthermore, as a result of this competition, available equipment in the markets in which one or more of our product lines competes at times may exceed the demand for such equipment. This excess supply of equipment may result from many factors, including without limitation, a low commodity price environment, increase in the construction of new equipment, or reactivation and improvement of existing equipment. Excess capacity may result in (1) substantial competition for a diminishing amount of demand and/or (2) significant price competition, which could have a material adverse effect on our results of operations, financial condition and prospects.
The oilfield services industry is highly fragmented and includes several large companies that compete in many of the markets we serve, as well as numerous small companies that compete with us on a local basis. Some of our competitors may have greater resources and/or name recognition, which could allow them to better withstand industry downturns and to compete more effectively on the revenuebasis of technology, geographic scope, retained skilled personnel and economies of scale. In addition, our industry has experienced recent consolidation through mergers and acquisitions, which could lead to increased resources and capabilities for our competitors. There may also be new companies that enter our business, or re-enter our business with significantly reduced indebtedness following emergence from bankruptcy, or our existing and potential future customers may develop their own oilfield solutions. Our operations may be adversely affected if our current competitors or new market entrants introduce new products, technology or services with better features, performance, prices or other characteristics than our products and services or expand in service areas where we operate.
We periodically seek to increase prices of our services to offset rising costs and to generate higher returns for our stockholders. Because we operate in a very competitive industry, however, we are not always successful in raising or maintaining our existing prices. Even if we are able to derive from such services, as they are dependentincrease our prices, we may not be able to do so at a rate that is sufficient to offset rising costs without adversely affecting our activity levels. The inability to maintain our pricing and to increase our pricing could have a material adverse effect on our business, financial condition, cash flows and results of operations. In addition, we may be unable to replace dedicated contracts that were terminated early, extend expiring contracts or obtain new contracts in the spot market, and the rates and other material terms under any new or extended contracts may be on substantially less favorable rates and terms.
Accordingly, high competition and excess equipment in the market can cause us to have difficulty maintaining pricing, utilization and profit margins and, at times, result in operating losses. We cannot predict the
future level of competition or excess equipment in the oil and natural gas commodity prices.
service businesses or the level of demand for our services.
Our operations are subject to hazards inherent in the energy services industry.
Risks inherent to our industry can cause personal injury, loss of life, suspension of or impact upon operations, damage to geological formations, damage to facilities, business interruption and damage to, or destruction of, property, equipment and the environment. Such risks may include, but are not limited to:
equipment defects;
vehicle accidents;
fires, explosions and uncontrollable flows of gas or well fluids;
unusual or unexpected geological formations or pressures and industrial accidents;
blowouts;
cratering;
loss of well control;
collapse of the borehole; and
damaged or lost drilling and well completions equipment.
Catastrophic or significantly adverse events can occur at well sites where we conduct our operations, including blow outs resulting in explosions, fires, personal injuries, property damage, pollution, clean-up responsibility and regulatory responsibility. In response, we typically require indemnities, releases and limitations on liability in our contracts with our customers, together with liability insurance coverage, to protect us from potential liability related to such occurrences. However, it is possible that customers or insurers could seek to avoid or be financially unable to meet their obligations, or a court may decline to enforce such provisions. Damages that are not indemnified or released could greatly exceed available insurance coverage and could have a material adverse effect on our business, financial condition, prospects and results of operations.
Catastrophic or significantly adverse events can also occur at our facilities and during transport of our equipment, commodities and personnel to well sites. Our safety procedures may not always prevent such damages. Our insurance coverage or coverage of applicable vendors and service providers may be inadequate to cover our liabilities. In addition, we may not be able to maintain adequate insurance in the future at rates we consider reasonable and commercially justifiable or on terms as favorable as our current arrangements. The occurrence of a significant uninsured claim, a claim in excess of the insurance coverage limits maintained by us or a claim at a time when we are not able to obtain liability insurance could have a material adverse effect on our ability to conduct normal business operations and on our financial condition, results of operations and cash flows.
In addition, our hydraulic fracturing and well completion services could become a source of spills or releases of fluids, including chemicals used during hydraulic fracturing activities, at the site where such services are performed, or could result in the discharge of such fluids into underground formations that were not targeted for fracturing or well completion activities, such as potable aquifers. These risks could expose us to substantial liability for personal injury, wrongful death, property damage, loss of oil and natural gas production, pollution and other environmental damages and could result in a variety of claims, losses and remedial obligations that could have an adverse effect on our business and results of operations. The existence, frequency and severity of such incidents could affect operating costs, insurability, reputation and relationships with customers, employees and regulators. In particular, our customers may elect not to purchase our services if they view our safety record as unacceptable, which could cause us to lose customers and substantial revenue, and anyAny litigation or claims, even if fully indemnified or insured, could negatively affect our reputation with our customers and the public and make it more difficult for us to compete effectively or obtain adequate insurance in the future.
Competition among oilfield service and equipment providers is affected by each provider’s reputation for environmental impact, safety and quality.
Our activities are subject to a wide range of national, state and local environmental, occupational health and safety laws and regulations. In addition, customers maintain their own compliance and reporting requirements. Failure to comply with these environmental, health and safety laws and regulations, or failure to comply with our customers’ compliance or reporting requirements, could tarnish our reputation for safety and quality and have a material adverse effect on our competitive position. In particular, our customers may elect not to purchase our services if they view our environmental or safety record as unsatisfactory, which could cause us to lose customers and substantial revenue.
Oilfield anti-indemnity provisions enacted by many states may restrict or prohibit a party’s indemnification of us.
We typically enter into agreements with our customers governing the provision of our services, which usually include certain indemnification provisions for losses resulting from operations. Such agreements may require each party to indemnify the other against certain claims regardless of the negligence or other fault of the indemnified party; however, many states place limitations on contractual indemnity agreements, particularly agreements that indemnify a party against the consequences of its own negligence. Furthermore, certain states, including Louisiana, New Mexico, Texas and Wyoming, have enacted statutes generally referred to as “oilfield anti-indemnity acts” expressly prohibiting certain indemnity agreements contained in or related to oilfield services agreements. Such oilfield anti-indemnity acts may restrict or void a party’s indemnification of us, which could have a material adverse effect on our business, financial condition, prospects and results of operations.
New technology may cause us to become less competitive.
The oilfield services industry is subject to the introduction of new drilling and completion techniques and services using new technologies, some of which may be subject to patent or other intellectual property protections. As competitors and others use or develop new or comparable technologies in the future, we may lose market share or be placed at a competitive disadvantage. In addition, technological changes, process improvements and other factors that increase operational efficiencies could continue to result in oil and natural gas wells being completed more quickly, which could reduce the number of revenue earning days. Furthermore, we may face competitive pressure to develop, implement or acquire certain new technologies at a substantial cost. Some of our competitors have greater financial, technical and personnel resources that may allow them to enjoy technological advantages and develop and implement new products on a timely basis or at an acceptable cost. We cannot be certain that we will be able to develop and implement new technologies or products on a timely basis or at an acceptable cost. Limits on our ability to develop, acquire, effectively use and implement new and emerging technologies may have a material adverse effect on our business, financial condition, prospects or results of operations.
We are subject to federal, state and local laws and regulations regarding issues of health, safety and protection of the environment. Under these laws and regulations, we may become liable for penalties, damages or costs of remediation or other corrective measures. Any changes in laws or government regulations could increase our costs of doing business.
Our operations are subject to stringent federal, state, local and tribal laws and regulations relating to, among other things, protection of natural resources, clean air and drinking water, wetlands, endangered species, greenhouse gasses, nonattainment areas that are not in attainment with air quality standards, the environment, health and safety, chemical use and storage, waste management, waste disposal and transportation of waste and other hazardous and nonhazardous materials. Our operations involve risks of environmental liability, including leakage from an operator’s casing during our operations or accidental spills onto or into surface or subsurface soils, surface water or groundwater. Some environmental laws and regulations
may impose strict liability, joint and several liability or both. In some situations, we could be exposed to liability as a result of our conduct that was lawful at the time it occurred or the conduct of, or conditions caused by, third parties without regard to whether we caused or contributed to the conditions. Additionally, environmental concerns, including potential emissions affecting clean air, drinking water contamination and seismic activity, have prompted investigations that could lead to the enactment of regulations,
limitations, restrictions or moratoria that could potentially have a material adverse impact on our business. Actions arising under these laws and regulations could result in the shutdown of our operations, fines and penalties (administrative, civil or criminal), revocations of or restrictions in permits to conduct business, expenditures for remediation or other corrective measures and/or claims for liability for property damage, exposure to hazardous materials, exposure to hazardous waste, nuisance or personal injuries. Sanctions for noncompliance with applicable environmental laws and regulations may also include the assessment of administrative, civil or criminal penalties, revocation of or restrictions in permits and temporary or permanent cessation of operations in a particular location and issuance of corrective action orders. Such claims or sanctions and related costs could cause us to incur substantial costs or losses and could have a material adverse effect on our business, financial condition, prospects and results of operations. Additionally, an increase in regulatory requirements, limitations, restrictions or moratoria on oil and natural gas exploration and completion activities at a federal, state or local level could significantly delay or interrupt our operations, limit the amount of work we can perform, increase our costs of compliance, or increase the cost of our services,services; thereby possibly having a material adverse impact on our financial condition.
If we do not perform in accordance with government, industry, customer or our own health, safety and environmental standards, we could lose business from our customers, many of whom have an increased focus on environmental and safety issues.
We are subject to requirements imposed by the EPA, U.S. Department of Transportation, U.S. Nuclear RegulationRegulatory Commission, OSHA and state regulatory agencies that regulate operations to prevent air, soil and water pollution. The energy extraction sector is one of the sectors designated for increased enforcement by the EPA, which will continue to regulate our industry in the years to come, potentially resulting in additional regulations that could have a material adverse impact on our business, prospects or financial condition.pollution, and protect worker health and safety.
The EPA regulates air emissions from all engines, including off-road diesel engines that are used by us to power equipment in the field. Under these U.S. emission control regulations, we could be limited in the number of certain off-road diesel engines we can purchase. Further, the requirement to comply with emission control and fuel quality regulations could result in increased costs.
In addition, as part of our business, we handle, transport, and dispose of a variety of fluids and substances used by our customers in connection with their oil and natural gas exploration and production activities. We also generate and dispose of nonhazardous and hazardous wastes. The generation, handling, transportation, and disposal of these fluids, substances, and wastes are regulated by a number of laws, including CERCLA, RCRA, the Clean Water Act, the SDWA and analogous state laws. Under RCRA, the generation, transportation, treatment, storage, disposal and cleanup of hazardous and non-hazardous wastes are regulated. RCRA currently exempts many oil and gas exploration and production wastes from classification as hazardous waste. However, these oil and gas exploration and production wastes may still be regulated under state solid waste laws and regulations, and it is possible that certain oil and natural gas exploration and production wastes now classified as non-hazardous could be classified as hazardous waste in the future.
Failure to properly handle, transport or dispose of these materials or otherwise conduct our operations in accordance with these and other environmental laws could expose us to liability for governmental penalties, third-party claims, cleanup costs associated with releases of such materials, damages to natural resources, and other damages, as well as potentially impair our ability to conduct our operations. Moreover, certain of these environmental laws impose joint and several, strict liability even though our conduct in performing such activities was lawful at the time it occurred or the conduct of, or conditions caused by, prior operators or other third-parties was the basis for such liability. In addition, environmental laws and regulations are subject to frequent change and if existing laws, regulatory requirements or enforcement policies were to change in the future, we may be required to make significant unanticipated capital and operating expenditures.
Laws and regulations protecting the environment generally have become more stringent over time, and we expect them to continue to do so. This could lead to material increases in our costs, and liability exposure, for future environmental compliance and remediation. Additionally, if we expand the size or scope of our operations, we could be subject to existing regulations that are more stringent than the requirements under which we are currently allowed to operate or require additional authorizations to continue operations. Compliance with this additional regulatory burden could increase our operating or other costs.
Federal, state and local legislative and regulatory initiatives relating to hydraulic fracturing could prohibit, restrict or limit hydraulic fracturing operations, could increase our operating costs or could result in the disclosure of proprietary information resulting in competitive harm.
During recent sessions of the U.S. Congress, several pieces of legislation were introduced in the U.S. Senate and House of Representatives for the purpose of amending environmental laws such as the Clean Air Act, the SDWA and the Toxic SubstanceSubstances Control Act with respect to activities associated with extraction and energy production industries, especially the oil and gas industry. Furthermore, various items of legislation and rulemaking have been proposed that would regulate or prevent federal regulation of hydraulic fracturing on federally owned land. Proposed rulemaking from the EPA and OSHA such as the proposed regulation relating to respirable silica sand, could increase our regulatory requirements, which could increase our costs of compliance or increase the costs of our services, thereby possibly having a material adverse impact on our business and results of operations.
If the EPA or another federal or state-levelstate agency asserts jurisdiction over certain aspects of hydraulic fracturing operations, an additional level of regulation established at the federal or state level could lead to operational delays and increase our costs. TheIn December 2016, the EPA recently issued a study of the potential impacts of hydraulic fracturing on drinking water and groundwater. The EPA report states that there is scientific evidence that hydraulic fracturing activities can impact drinking resources under some circumstances, and identifies certain conditions in which the EPA believes the impact of such activities on drinking water and groundwater can be more frequent or severe. The EPA study could spur further initiatives to regulate hydraulic fracturing under the SDWA or otherwise. Many regulatory and legislative bodies routinely evaluate the adequacy and effectiveness of laws and regulations affecting the oil and gas industry. As a result, state legislatures, state regulatory agencies and local municipalities may consider legislation, regulations or ordinances, respectively, that could affect all aspects of the oil and natural gas industry and occasionally take action to restrict or further regulate hydraulic fracturing operations. At this time, it is not possible to estimate the potential impact on our business of these state and municipal actions or the enactment of additional federal or state legislation or regulations affecting hydraulic fracturing. Compliance, stricter regulations or the consequences of any failure to comply by us could have a material adverse effect on our business, financial condition, prospects and results of operations.
Many states in which we operate require the disclosure of some or all of the chemicals used in our hydraulic fracturing operations. Certain aspects of one or more of these chemicals may be considered proprietary by us or our chemical suppliers. Disclosure of our proprietary chemical information to third parties or to the public, even if inadvertent, could diminish the value of our trade secrets or those of our chemical suppliers and could result in competitive harm to us, which could have an adverse impact on our business, financial condition, prospects and results of operations.
We are also aware that some states, counties and municipalities have enacted or are considering moratoria on hydraulic fracturing. For example, New York and Vermont, states in which we have no operations, have banned or are in the process of banning the use of high volumehigh-volume hydraulic fracturing. Alternatively, some municipalities are considering or have considered zoning and other ordinances, the conditions of which could impose a de facto ban on drilling and/or hydraulic fracturing operations. Further, some states, counties and municipalities are closely examining water use issues, such as permit and disposal options for processed water, which could have a material adverse impact on our financial condition, prospects and results of operations, if such additional permitting requirements are imposed upon our industry. Additionally, our business could be affected by a moratorium or increased regulation of companies in our supply chain, such as sand mining by our proppant suppliers, which could limit our access to supplies and increase the costs of our raw materials. At this time, it is not possible to estimate how these various restrictions could affect our ongoing operations. For more information, see “Item 1. Business—Environmental regulation.”
Existing or future laws and regulations related to greenhouse gases and climate change could have a negative impact on our business and may result in additional compliance obligations with respect to the release, capture and use of carbon dioxide that could have a material adverse effect on our business, results of operations, prospects and financial condition.
Changes in environmental requirements related to greenhouse gases and climate change may negatively impact demand for our services. For example, oil and natural gas exploration and production may decline as a result of environmental requirements, including land use policies responsive to environmental concerns. Federal, state and local agencies have been evaluating climate-related legislation and other regulatory initiatives that would restrict emissions of greenhouse gases in areas in which we conduct business. Because our business depends on the level of activity in the oil and natural gas industry, existing or future laws and regulations related to emissions of greenhouse gases and climate change, including incentives to conserve energy or use alternative energy sources, could have a negative impact on our business if such laws or regulations reduce demand for oil and natural gas. Likewise, such restrictions may result in additional compliance obligations with respect to the release, capture, sequestration and use of carbon dioxide that could have a material adverse effect on our business, results of operations, prospects and financial condition.
Changes in transportation regulations may increase our costs and negatively impact our results of operations.
We are subject to various transportation regulations, including as aregulation of motor carriercarriers by the U.S. Department of Transportation and by various federal, state and tribal agencies, whose regulations include certain permit requirements ofimposed by highway and safety authorities. These regulatory authorities exercise broad powers over our trucking operations, generally governing such matters as the authorization to engage in motor carrier operations, safety, equipment testing, driver requirements and specifications and insurance requirements. The trucking industry is subject to possible regulatory and legislative changes that may impact our operations, such as changes in fuel emissions limits, hours of service regulations that govern the amount of time a driver may drive or work in any specific period and limits on vehicle weight and size. As the federal government continues to develop and propose regulations relating to fuel quality, engine efficiency and greenhouse gas emissions, we may experience an increase in costs related to truck purchases and maintenance, impairment of equipment productivity, a decrease in the residual value of vehicles, unpredictable fluctuations in fuel prices and an increase in operating expenses. Increased truck traffic may contribute to deteriorating road conditions in some areas where our operations are performed. Our operations, including routing and weight restrictions, could be affected by road construction, road repairs, detours and state and local regulations and ordinances restricting access to certain roads. Proposals to increase federal, state or local taxes, including taxes on motor fuels, are also made from time to time, and any such increase would increase our operating costs. Also, state and local regulation of permitted routes and times on specific roadways could
adversely affect our operations. We cannot predict whether, or in what form, any legislative or regulatory changes or municipal ordinances applicable to our logistics operations will be enacted and to what extent any such legislation or regulations could increase our costs or otherwise adversely affect our business or operations.
We could be negatively impacted by the recent outbreak of coronavirus (COVID-19).
In light of the uncertain and rapidly evolving situation relating to the spread of the coronavirus (COVID-19), this public health concern could pose a risk to our employees, our customers, our vendors and the communities in which we operate, which could negatively impact our business. The extent to which the coronavirus (COVID-19) may impact our business will depend on future developments, which are highly uncertain and cannot be predicted at this time. We may experience an impact to the timing and availability of key products from suppliers, customer shutdowns to prevent spread of the virus, employee impacts from illness, school closures and other community response measures, all of which could negatively impact our business. We continue to monitor the situation and may adjust our current policies and practices as more information and guidance become available.
Risks Related to Our Recent Merger
We may not be able to retain customers or suppliers or customers or suppliers may seek to modify contractual obligations with us, which could have an adverse effect on our business and operations. Third parties may terminate or alter existing contracts or relationships with us.
As a result of the C&J Merger, we may experience impacts on relationships with customers and suppliers that may harm our business and results of operations. Certain customers or suppliers may seek to terminate or modify contractual obligations following the C&J Merger whether or not contractual rights are triggered as a result of the C&J Merger. There can be no guarantee that customers and suppliers will remain with or continue to have a relationship with us or do so on the same or similar contractual terms following the C&J Merger. If any customers or suppliers seek to terminate or modify contractual obligations or discontinue the relationship with us, then our business and results of operations may be harmed. Furthermore, we do not have long-term arrangements with many of our significant suppliers. If our suppliers were to seek to terminate or modify an arrangement with us, then we may be unable to procure necessary supplies from other suppliers in a timely and efficient manner and on acceptable terms, or at all.
Combining the businesses of legacy Keane and C&J may be more difficult, costly or time-consuming than expected and we may fail to realize the anticipated benefits of the C&J Merger, which may adversely affect our business results and negatively affect the value of our common stock.
The success of the C&J Merger will depend on, among other things, our ability to combine the legacy Keane and C&J in a manner that realizes cost savings and facilitates growth opportunities. However, we must successfully integrate the legacy Keane and C&J businesses in a manner that permits these benefits to be realized. In addition, we must achieve the cost savings and anticipated growth without adversely affecting current revenues and investments in future growth. If we are not able to successfully achieve these objectives, the anticipated benefits of the C&J Merger may not be realized fully, or at all, or may take longer to realize than expected.
An inability to realize the full extent of the anticipated benefits of the C&J Merger and the other transactions contemplated by the C&J Merger Agreement, as well as any delays encountered in the integration process, could have an adverse effect upon our revenues, level of expenses and operating results of the Company, which may adversely affect the value of our common stock.
In addition, the actual integration may result in additional and unforeseen expenses and may cost more than anticipated, and the anticipated benefits of the integration plan may not be realized. Actual cost savings, if achieved, may be lower than what we expect and may take longer to achieve than anticipated. If we are not able to adequately address integration challenges, it may be unable to successfully integrate the operations of legacy Keane and C&J or realize the anticipated benefits of the integration of the two companies.
The failure to successfully integrate the businesses and operations of the Company and C&J in the expected time frame may adversely affect the Company's future results.
There can be no assurances that the businesses of the Company and C&J can be integrated successfully. It is possible that the integration process could result in the loss of key employees, the loss of customers, the disruption of ongoing businesses, inconsistencies in standards, controls, procedures and policies, unexpected integration issues, higher than expected integration costs and an overall post-completion integration process that takes longer than originally anticipated. Specifically, the following issues, among others, must be addressed in integrating the operations of the two businesses in order to realize the anticipated benefits of the C&J Merger so the Company performs as expected:
combining the businesses operations and corporate functions of the Company and C&J, in a manner that permits the Company to achieve any cost savings or revenue synergies anticipated to result from the C&J Merger, the failure of which would result in the anticipated benefits of the C&J Merger not being realized in the time frame currently anticipated or at all;
reducing additional and unforeseen expenses to prevent integration costs from more than anticipated;
avoiding delays in the integration process;
integrating personnel from the two companies and retaining key employees;
integrating the companies' technologies;
integrating and standardizing the offerings and services available to customers;
identifying and eliminating redundant and underperforming functions and assets;
harmonizing the companies' operating practices, employee development and compensation programs, internal controls and other policies, procedures and processes;
maintaining existing agreements with customers, distributors, providers and vendors and avoiding delays in entering into new agreements with prospective customers, distributors, providers and vendors;
addressing possible differences in business backgrounds, corporate cultures and management philosophies;
consolidating the companies' administrative and information technology infrastructure;
coordinating distribution and marketing efforts;
managing the movement of certain positions to different locations; and
effecting actions that may be required in connection with obtaining regulatory approvals.
In addition, at times the attention of certain members of the Company's management and resources may be focused on the integration of the businesses of the two companies and diverted from day-to-day business operations or other opportunities that may have been beneficial to the Company, which may disrupt the business of the Company.
Furthermore, the Company's board of directors and executive leadership of the Company consists of former directors and executive officers from each of the Company and C&J. Combining the boards of directors and management teams of each company into a single board and a single management team could require the reconciliation of differing priorities and philosophies.
Risks Related to Our Business
The loss of one or more significant customers could adversely affect our financial condition, prospects and results of operations.
Our business, financial condition, prospects and results of operations could be materially adversely affected, if one or more of our significant customers ceases to engage us for our services on favorable terms or at all, or fails to pay or delays in paying us significant amounts of our outstanding receivables. Our completions business has historically had contracts with a portion of our customers that are annual to multi-year.
Additionally, the E&P industry is characterized by frequent consolidation activity. Changes in ownership of our customers may result in the loss of, or reduction in, business from those customers, which could materially and adversely affect our business, financial condition, prospects or results of operations.
We are exposed to the credit risk of our customers, and any material nonpayment or nonperformance by our customers could adversely affect our financial results.
We are subject to the risk of loss resulting from nonpayment or nonperformance by our customers, many of whose operations are concentrated solely in the domestic E&P industry which, as described above, is subject to
volatility and, therefore, credit risk. Our credit procedures and policies may not be adequate to fully reduce customer credit risk. If we are unable to adequately assess the creditworthiness of existing or future customers or unanticipated deterioration in their creditworthiness, any resulting increase in nonpayment or nonperformance by them and our inability to re-market or otherwise use our equipment could have a material adverse effect on our business, financial condition, prospects and results of operations.
Our assets require significant amounts of capital for maintenance, upgrades and refurbishment and may require significant capital expenditures for new equipment.
Our hydraulic fracturing fleets and other service-related equipment require significant capital investment in maintenance, upgrades and refurbishment to maintain their competitiveness. Our fleets and other equipment typically do not generate revenue while they are undergoing maintenance, refurbishment or upgrades. Any maintenance, upgrade or refurbishment project for our assets could increase our indebtedness or reduce cash available for other opportunities. Furthermore, such projects may require proportionally greater capital investments as a percentage of total asset value, which may make such projects difficult to finance on acceptable terms. To the extent we are unable to fund such projects, we may have less equipment available for service, or our equipment may not be attractive to potential or current customers. Additionally, increased demand, competition, environmental and safety requirements or advances in technology within our industry may require us to update or replace existing fleets or build or acquire new fleets. For example, in 2018, we purchased approximately 150,000 newbuild hydraulic horsepower, representing three additional hydraulic fracturing fleets, for approximately $129.4 million. Such demands on our capital or reductions in demand for our hydraulic fracturing fleets and other service-related equipment and the increase in cost to maintain labor necessary for such maintenance and improvement, in each case, could have a material adverse effect on our business, liquidity position, financial condition, prospects and results of operations.
We may be unable to employ a sufficient number of key employees, technical personnel and other skilled or qualified workers.
The delivery of our services and products requires personnel with specialized skills and experience who can perform physically demanding work. As a result of the volatility in the energy service industry and the demanding nature of the work, workers may choose to pursue employment with our competitors or in fields that offer a more desirableless demanding work environment. Furthermore, we require full compliance with the Immigration Reform and Control Act of 1986 and other laws concerning immigration and the hiring of legally documented workers. We recognize that foreign nationals may be a valuable source of talent, but that not all foreign nationals are authorized to work for U.S. companies immediately, without first obtaining a required work authorization from the U.S. Department of Homeland Security or similar government agency. Our ability to be productive and profitable will depend upon our ability to employ and retain skilled workers. In addition, our ability to further expandadjust our operations according to geographic demand for our services depends in part on our ability to relocate or increase the size of our skilled labor force. The demand for skilled workers in our areas of operations can be high, the supply may be limited, and we may be unable to relocate our employees from areas of lower utilization to areas of higher demand. A significant increase in the wages paid by competing employers could result in a reduction of our skilled labor force, increases in the wage rates that we must pay, or both. Further,Furthermore, a significant decrease in the wages paid by us or our competitors as a result of reduced industry demand could result in a reduction of the available skilled labor force, and there is no assurance that the availability of skilled labor will improve following a subsequent increase in demand for our services or an increase in wage rates. If any of these events were to occur, our capacity and profitability could be diminished and our growth potential could be impaired.
We depend heavily on the efforts of executive officers, managers and other key employees to manage our operations. The unexpected loss or unavailability of key members of management or technical personnel may have a material adverse effect on our business, financial condition, prospects or results of operations.
We have purchase commitments with certain vendors to supply a majority of the proppant that we may provide in our operations. Some of these agreements are take-or-pay agreements with minimum purchase obligations. If demand for our hydraulic fracturing services decreases from current levels, demand for the raw materials and products we supply as part of these services will also decrease. If demand decreases enough, we could have contractual minimum commitments that exceed the required amount of goods we need to supply to our customers. In this instance, we could be required to purchase goods that we do not have a present need for, pay for goods that we do not take delivery of or pay prices in excess of market prices at the time of purchase.
Delays in deliveries of key raw materials or increases in the cost of key raw materials could harm our business, results of operations and financial condition.
We have established relationships with a limited number of suppliers of our raw materials (such as proppant, guar, chemicals or coiled tubing) and finished products (such as fluid-handling equipment). Raw materials essential to our business are normally readily available. However, high levels of demand for raw materials, such as gels, guar, proppant and hydrochloric acid, have triggered constraints in the supply chain of those raw materials and could dramatically increase the prices of such raw materials. Should any of our current suppliers be unable to provide the necessary raw materials or finished products or otherwise fail to deliver the products in a timely manner and in the quantities required, any resulting delays in the provision of services could have a material adverse effect on our business, financial condition, results of operations and cash flows. Additionally, increasing costs of certain raw materials, including guar or proppant, may negatively impact demand for our services or materially impactthe profitability of our costs.business operations. In the past, our industry faced sporadic shortages associated with hydraulic fracturing operations, such as proppant and guar, requiring work stoppages, which adversely impacted the operating results of several competitors. We may not be able to mitigate any future shortages of raw materials, including proppants.
Our services are subject to perform our services dueinherent risks that can cause personal injury or loss of life, damage to delays inor destruction of property, equipment or the deliveryenvironment or the suspension of products that we need to provide our services. For example, recent weather-induced rail congestion, combined with flooding impacts at suppliers’ mines, has contributed to a reduction in the availability of sands used in our operations. Our operations are subject to, and exposed to, employee/employer liabilities and risks such as wrongful termination, discrimination, labor organizing, retaliation claims and general human resource related matters. Litigation arising from operations where our facilities are located, or our services are provided, may cause us to be named as a defendant in arid regions can alsolawsuits asserting potentially large claims including claims for exemplary damages. We maintain what we believe is customary and reasonable insurance to protect our business against these potential losses, but such insurance may not be affected by droughtsadequate to cover our liabilities, and limited accesswe are not fully insured against all risks. Further, our insurance has deductibles or self-insured retentions and contains certain coverage exclusions. The current trend in the insurance industry is towards larger deductibles and self-insured retentions. In addition, insurance may not be available in the future at rates that we consider reasonable and commercially justifiable, compelling us to water usedhave larger deductibles or self-insured retentions to effectively manage expenses. As a result, we could become subject to material uninsured liabilities or situations where we have high deductibles or self-insured retentions that expose us to liabilities that could have a material adverse effect on our business, financial condition, prospects or results of operations.
Litigation and other proceedings could have a negative impact on our business.
The nature of our business makes us susceptible to legal proceedings and governmental audits and investigations from time to time. In addition, during periods of depressed market conditions, we may be subject to an increased risk of our customers, vendors, current and former employees and others initiating legal proceedings against us that could have a material adverse effect on our business, financial condition and results of operations. Similarly, any legal proceedings or claims, even if fully indemnified or insured, could negatively impact our reputation among our customers and the public, and make it more difficult for us to compete effectively or obtain adequate insurance in the future. See Note (18) Commitments and Contingenciesof Part II, “Item 8. Financial Statements and Supplementary Data” for further discussion of our hydraulic fracturing operations. Adverse weather can also directly impede our own operations. Repercussions of adverse weather conditions may include:legal and environmental contingencies for the years ended December 31, 2019, 2018 and 2017.
Delays in obtaining, or inability to obtain or renew, permits or authorizations by our customers for their operations or by us for our operations could impair our business.
In most states, our customers are required to obtain permits or authorizations from one or more governmental agencies or other third parties to perform drilling and completion activities, including hydraulic
fracturing. Such permits or approvals are typically required by state agencies, but can also be required by federal and local governmental agencies or other third parties. The requirements for such permits or authorizations vary depending on the location where such drilling and completion activities will be conducted. As with most permitting and authorization processes, there is a degree of uncertainty as to whether a permit will be granted, the time it will take for a permit or approval to be issued and the conditions which may be imposed in connection with the granting of the permit. In some jurisdictions, such as New York State and within the jurisdiction of the Delaware River Basin Commission, certain regulatory authorities have delayed or suspended the issuance of permits or authorizations, while the potential environmental impacts associated with issuing such permits can be studied and appropriate mitigation measures evaluated. New York and Vermont, states in which we have no operations, have prohibited hydraulic fracturing statewide. In Texas, rural water districts have begun to impose restrictions on water use and may require permits for water used in drilling and completion activities. Permitting, authorization or renewal delays, the inability to obtain new permits or the revocation of current permits could cause a loss of revenue and potentially have a materially adverse effect on our business, financial condition, prospects or results of operations.
We are also required to obtain federal, state, local and/or third-party permits and authorizations in some jurisdictions in connection with our wireline services. These permits, when required, impose certain conditions on our operations. Any changes in these requirements could have a material adverse effect on our business, financial condition, prospects and results of operations.
We may not be successful in identifying and making acquisitions.
Part of our strategy is to continue to expand our geographic scope and customer relationships, increase our access to technology and to grow our business, which is dependent on our ability to make acquisitions that result in accretive revenues and earnings. We may be unable to make accretive acquisitions or realize expected benefits of any acquisitions for any of the following reasons:
failure to identify attractive targets;
incorrect assumptions regarding the future liabilities or future results of acquired operations or assets or expected cost reductions or other synergies expected to be realized as a result of acquiring operations or assets;
failure to obtain financing on acceptable terms or at all;
restrictions in our debt agreements;
failure to successfully integrate the operations or management of any acquired operations or assets;assets (particularly as we undertake the integration of the legacy Keane and C&J businesses);
failure to retain or attract key employees;
new or expanded areas of operational risk (such as offshore or international operations) and related costs and demands of any applicable regulatory compliance; and
diversion of management’s attention from existing operations or other priorities.
Our acquisition strategy requires that we successfully integrate acquired companies into our business practices, as well as our procurement, management and enterprise-wide information technology systems. We may not be successful in implementing our business practices at acquired companies, and our acquisitions could face difficulty in transitioning from their previous information technology systems to our own. Furthermore, unexpected costs and challenges may arise whenever businesses with different operations ofor management are combined. Any
such difficulties, or increased costs associated with such integration, could affect our business, financial performance and operations.
If we are unable to identify, complete and integrate acquisitions, it could have a material adverse effect on our growth strategy, business, financial condition, prospects and results of operations.
Integrating acquisitions may be time-consuming and create costs that could reduce our net income and cash flows.
Part of our strategy includes pursuing acquisitions that we believe will be accretive to our business. If we consummate an acquisition, the process of integrating the acquired business may be complex and time consuming, may be disruptive to the business and may cause an interruption of, or a distraction of management’s attention from, the business as a result of a number of obstacles, including, but not limited to:
a failure of our due diligence process to identify significant risks or issues;
the loss of customers of the acquired company or our company;
negative impact on the brands or banners of the acquired company or our company;
a failure to maintain or improve the quality of our customer service;
difficulties assimilating the operations and personnel of the acquired company;
our inability to retain key personnel of the acquired company;
the incurrence of unexpected expenses and working capital requirements;
our inability to achieve the financial and strategic goals, including synergies, for the combined businesses;
difficulty in maintaining internal controls, procedures and policies;
mistaken assumptions about the overall costs of equity or debt; and
unforeseen difficulties operating in new product areas or new geographic areas.
Any of the foregoing obstacles, or a combination of them, could decrease gross profit margins or increase selling, general and administrative expenses in absolute terms and/or as a percentage of net sales, which could in turn negatively impact our net income and cash flows. The foregoing obstacles could prove to be especially difficult in light of the C&J Merger since we are a newly combined company in the process of integrating the legacy Keane and C&J businesses.
We may not be able to consummate acquisitions in the future on terms acceptable to us, or at all. In addition, future acquisitions are accompanied by the risk that the obligations and liabilities of an acquired company may not be adequately reflected in the historical financial statements of that company and the risk that those historical financial statements may be based on assumptions which are incorrect or inconsistent with our assumptions or approach to accounting policies. Any of these material obligations, liabilities or incorrect or inconsistent assumptions could adversely impact our results of operations, prospects and financial condition.
If labor costs increase or we fail to attract and retain qualified employees our business, results of operations, cash flows and financial condition may be adversely affected.
The labor markets in the industries in which we operate are competitive. We must attract, train and retain a large number of qualified employees while controlling related labor costs. We face significant competition for these employees from the industries in which we operate as well as from other industries. Tighter labor markets may make it even more difficult for us to hire and retain qualified employees and control labor costs. Our historicalability to attract
qualified employees and control labor costs is subject to numerous external factors, including prevailing wage rates, employee preferences, employment law and regulation, environmental, health and safety regulation, labor relations and immigration policy. A significant increase in competition or cost increase arising from any of the aforementioned factors in may have a material adverse impact on our business, results of operations and financial statementscondition.
A failure of our information technology systems, including the implementation of our new enterprise resource planning system, could have a material adverse effect on our business, financial condition, results of operations and cash flows and could adversely affect the effectiveness of our internal control over financial reporting.
We rely on sophisticated information technology systems and infrastructure to support our business. Any of these systems may be susceptible to outages due to fire, floods, power loss, telecommunications failures, usage errors by employees, computer viruses, cyber-attacks or other security breaches or similar events. A failure or prolonged interruption in our information technology systems, or difficulties encountered in upgrading our systems or implementing new systems that compromises our ability to meet our customers’ needs or impairs our ability to record, process and report accurate information, could have a material adverse effect on our business, financial condition, results of operations and cash flows.
We are in the process of integrating our enterprise resource planning (“ERP”) systems from each of the legacy entities to the C&J Merger that assist with the collection, storage, management and interpretation of data from our business activities to support future growth and to integrate significant processes. Our ERP system is critical to our ability to accurately maintain books and records, record transactions, provide important information to our management and prepare our consolidated financial statements. ERP system integration is complex and time-consuming and involves substantial expenditures on system software and integration activities, as well as changes to business processes and, possibly, adjustments to internal control over financial reporting. The integration of the ERP system may prove to be more difficult, costly, or time consuming than expected, and there can be no assurance that this system will continue to be beneficial to the extent anticipated. Any disruptions, delays or deficiencies in the integration of our ERP system, particularly ones that impact our financial reporting and accounting systems or our ability to provide services, send invoices, track payments or fulfill contractual obligations, could adversely affect our business, financial condition, results of operations and cash flows. Additionally, if the ERP system does not operate as intended, the effectiveness of our internal control over financial reporting could be adversely affected or our ability to assess it adequately could be impacted, which could cause us to fail to meet our reporting obligations.
We are subject to cyber security risks. A cyber incident could occur and result in information theft, data corruption, operational disruption and/or financial loss.
The oil and natural gas industry has become increasingly dependent on digital technologies to conduct certain processing activities. We use these technologies for internal purposes, including data storage (which may include personal identification information of our employees as well as our proprietary business information and that of our customers, suppliers, investors and other stakeholders), processing, and transmissions, as well as in our interactions with customers and suppliers. For example, we depend on digital technologies to perform many of our services and processes and to record operational and financial data. At the same time, cyber incidents, which could include, among other things, deliberate attacks, unintentional events, computer viruses, malicious or destructive code, ransomware, social engineering attacks (including phishing and impersonation), hacking, denial-of-service attacks and other attacks and similar disruptions from the unauthorized use of or access to computer systems, have increased. The U.S. government has issued public warnings that indicate that energy assets might be specific targets of cyber security threats. Our technologies, systems and networks, as well as those of our customers, suppliers and other business partners, may become the target of cyberattacks or information security breaches that could result in the unauthorized release, gathering, monitoring, misuse, loss or destruction of proprietary information, personal information and other data, or other disruption of our business operations. In addition, certain cyber incidents, such as unauthorized surveillance, may remain undetected for an extended period of time. Our systems and insurance coverage for protecting against cyber security risks, including cyberattacks, may not be indicative of future performance.
parties, and may result in claims against us, including liability under laws that protect the completionprivacy of personal information. As cyber incidents continue to evolve, we may be required to expend additional resources to continue to modify or enhance our protective measures or to investigate and remediate the effects of cyber incidents.
If we fail to maintain an effective system of internal controls as required by Section 404 of the TricanSarbanes-Oxley Act of 2002, we may not be able to report our financial results accurately or prevent fraud, which could adversely affect our business and RockPile transactions,result in material misstatements in our historicalfinancial statements.
Effective internal controls are necessary for us to provide timely and reliable financial reports, prevent fraud and to operate successfully as a publicly traded company. Our efforts to maintain our internal controls may not be successful, and we may be unable to maintain effective controls over our financial processes and reporting in the future or to comply with our obligations under Section 404 of the Sarbanes-Oxley Act of 2002 (“Section 404”). For example, Section 404 requires us, among other things, to annually review and report on, and our independent registered public accounting firm to attest to, the effectiveness of our internal controls over financial reporting. This assessment includes disclosure of any deficiencies or material weaknesses identified by our management in our internal control over financial reporting. Any failure to develop, implement or maintain effective internal controls or to improve our internal controls could harm our operating results, prevent us from identifying future deficiencies and material weaknesses or cause us to fail to meet our reporting obligations. Given the difficulties inherent in the design and operation of internal controls over financial reporting, we can provide no assurance as to our, or our independent registered public accounting firm’s conclusions, about the effectiveness of our internal controls, and we may incur significant costs in our efforts to comply with Section 404. Ineffective internal controls could result in material misstatements in our financial statements and subject us to increased regulatory scrutiny and a loss of confidence in our reported financial information, which could have an adverse effect on our business.
We could be adversely affected by violations of the U.S. Foreign Corrupt Practices Act and similar foreign anti-bribery laws.
The United States Foreign Corrupt Practices Act (the “FCPA”) and similar worldwide anti-bribery laws generally prohibit companies and their intermediaries and partners from making, offering or authorizing improper payments to non-U.S. government officials for the purpose of obtaining or retaining business. Although we currently have limited international operations, we may do business in the future in countries or regions where strict compliance with anti-bribery laws may conflict with local customs and practices. Our employees, intermediaries, and partners may face, directly or indirectly, corrupt demands by government officials, political parties and officials, tribal or insurgent organizations, or private entities in the countries in which we operate or may operate in the future. As a result, we face the risk that an unauthorized payment or offer of payment could be made by one of our employees, intermediaries, or partners even if such parties are not necessarily indicativealways subject to our control or are not themselves subject to the FCPA or other anti-bribery laws to which we may be subject. We are committed to doing business in accordance with applicable anti-bribery laws and have implemented policies and procedures concerning compliance with such laws. Our existing safeguards and any future improvements, however, may prove to be less than effective, and our employees, intermediaries, and partners may engage in conduct for which we might be held responsible. Violations of the FCPA and other anti-bribery laws (either due to our acts, the acts of our ongoing operationsintermediaries or partners, or our inadvertence) may result in criminal and the operating resultscivil sanctions and could subject us to be expectedother liabilities in the future.U.S. and elsewhere. Even allegations of such violations could disrupt our business and result in a material adverse effect on our business and operations.
Risks Related to Owning Our Indebtedness
Our substantial level of indebtedness could adversely affect our financial condition and prevent us from fulfilling our obligations under our indebtedness.
We have a significant amount of indebtedness. As of December 31, 2017,2019, we had $275.1$337.6 million of debt outstanding, net of discounts and deferred financing costs (not including capital lease obligations). After giving effect to our borrowing base, we had approximately $199.7$303.8 million of availability under our 20172019 ABL Facility.Facility (as defined herein).
Our substantial indebtedness could have important consequences to you. For example, it could:
adversely affect the market price of our common stock;
increase our vulnerability to interest rate increases and general adverse economic and industry conditions;
require us to dedicate a substantial portion of our cash flow from operations to payments on our indebtedness, thereby reducing the availability of our cash flow to fund working capital, capital expenditures and other general corporate purposes, including acquisitions;
limit our flexibility in planning for, or reacting to, changes in our business and the industry in which we operate;
limit our ability to obtain additional financing on satisfactory terms to fund our working capital requirements, capital expenditures, acquisitions, investments, debt service requirements and other general corporate requirements; and
place us at a competitive disadvantage compared to our competitors that have less debt.
In addition, we cannot assure you that we will be able to refinance any of our debt, or that we will be able to refinance our debt on commercially reasonable terms. If we were unable to make payments or refinance our debt or obtain new financing under these circumstances, we would have to consider other options, such as:
sales of assets;
sales of equity; or
negotiations with our lenders to restructure the applicable debt.
Our debt instruments may restrict, or market or business conditions may limit, our ability to use some of our options.
Despite our significant indebtedness levels, we may still be able to incur additional debt, which could further exacerbate the risks associated with our substantial leverage.
We and our subsidiaries may be able to incur additional indebtedness in the future. The terms of the credit agreements that govern the 20172019 ABL Facility (as defined herein) and the 20172018 Term Loan Facility (as defined herein and, together with the 20172019 ABL Facility, the “Senior Secured Debt Facilities”) permit us to incur additional indebtedness, subject to certain limitations. If new indebtedness is added to our and our subsidiaries’ current debt levels, the related risks that we and they now face would intensify. See Part II, “Item 7. Management’s Discussion and Analysis of Financial Condition and Results of Operations–PrincipalOperations-Principal Debt Agreements” for further details.
The agreements governing our indebtedness contain operating covenants and restrictions that limit our operations and could lead to adverse consequences if we fail to comply with them.
The agreements governing our indebtedness contain certain operating covenants and other restrictions relating to, among other things, limitations on indebtedness (including guarantees of additional indebtedness) and liens, mergers, consolidations and dissolutions, sales of assets, investments and acquisitions, dividends and other restricted payments, repurchase of shares of capital stock and options to purchase shares of capital stock and certain transactions with affiliates. In addition, our Senior Secured Debt Facilities include certain financial covenants.
The restrictions in the agreements governing our indebtedness may prevent us from taking actions that we believe would be in the best interest of our business and may make it difficult for us to successfully execute our business strategy or effectively compete with companies that are not similarly restricted. We may also incur future debt obligations that might subject us to additional restrictive covenants that could affect our financial and operational flexibility.
Failure to comply with these financial and operating covenants could result from, among other things, changes in our results of operations, the incurrence of additional indebtedness, declines in the pricing of our services and products, our success atdifficulties in implementing cost reduction initiatives, our ability to successfully implementdifficulties in implementing our overall business strategy or changes in general economic conditions, which may be beyond our control. The breach of any of these covenants or restrictions could result in a default under the agreements that govern these facilities that would permit the lenders to declare all amounts outstanding thereunder to be due and payable, together with accrued and unpaid interest. If we are unable to repay such amounts, lenders having secured obligations could proceed against the collateral securing these obligations. The collateral includes the capital stock of our domestic subsidiaries and substantially all of our and our subsidiaries’ other tangible and intangible assets, subject in each case to certain exceptions. This could have serious consequences on our financial condition and results of operations and could cause us to become bankrupt or otherwise insolvent. In addition, these covenants may restrict our ability to engage in transactions that we believe would otherwise be in the best interests of our business and stockholders.
See Part II, “Item 7. Management’s Discussion and Analysis of Financial Condition and Results of Operations–PrincipalOperations-Principal Debt Agreements” for further details.
Substantially all of our debt is variable rate and increases in interest rates could negatively affect our financing costs and our ability to access capital.
We have exposure to future interest rates based on the variable rate debt under the Senior Secured Debt Facilities, and to the extent we raise additional debt in the capital markets to meet maturing debt obligations, to fund our capital expenditures and working capital needs and to finance future acquisitions. Daily working capital requirements are typically financed with operational cash flow and through borrowings under our 20172019 ABL Facility, if needed. The interest rate on these borrowing arrangements is generally determined from the inter-bank offering rate at the borrowing date plus a pre-set margin. Although we employ risk management techniques to hedge against interest rate volatility, significant and sustained increases in market interest rates could materially increase our financing costs and negatively impact our reported results.
In addition, in certain circumstances, our variable rate indebtedness uses the London Interbank Offer Rate (“LIBOR”) as a benchmark for establishing the interest rate. The LIBOR has been subject of national, international,
and other regulatory guidance and proposals for reform. In July 2017, the U.K. Financial Conduct Authority announced that it intends to stop persuading or compelling banks to submit rates for calculation of LIBOR after 2021. These reforms and other pressures may cause LIBOR to disappear entirely or to perform differently than in the past. The consequences of these developments cannot be entirely predicted, but could include an increase in our financing costs and our ability to access capital.
Disruptions in the capital and credit markets, continued low commodity prices, our debt level and other factors may restrict our ability to raise capital on favorable terms, or at all.
Disruptions in the capital and credit markets, in particular with respect to companies in the energy sector, could limit our ability to access these markets or may significantly increase our cost to borrow. Continued low commodity prices, among other factors, have caused some lenders to increase interest rates, enact tighter lending standards which we may not satisfy as a result of our debt level or otherwise, refuse to refinance existing debt at maturity on favorable terms, or at all, and in certain instances have reduced or ceased to provide funding to borrowers. If we are unable to access the capital and credit markets on favorable terms or at all, it could adversely affect our business, financial condition and results of operations.
Ability to use net operating loss carryforwards to offset future taxable income for U.S. federal income tax purposes is subject to limitation under Section 382 of the Internal Revenue Code, and NOLs and other tax attributes is subject to reduction, causing less NOL or tax deductions to be available to offset future taxable income for U.S. federal income tax purpose.
Under U.S. federal income tax law, a corporation is generally permitted to deduct from taxable income net operating losses (“NOLs”) carried forward from prior years. As of December 31, 2019, we reported consolidated federal NOL carryforwards of approximately $787.6 million of which $721.3 million are pre-change NOL's subject to limitation. Our ability to utilize our NOL carryforwards to offset future taxable income and to reduce U.S. federal income tax liability is subject to certain requirements and restrictions. In general, under Section 382 of the Internal Revenue Code of 1986, as amended (the “Code”), a corporation that undergoes an “ownership change” is subject to limitations on its ability to utilize its pre-change NOLs to offset future taxable income. An ownership change generally occurs if one or more shareholders (or groups of shareholders) who are each deemed to own at least 5% of our stock have aggregate increases in their ownership of such stock of more than 50 percentage points over such stockholders’ lowest ownership percentage during the testing period (generally a rolling three year period). We believe we experienced an ownership change in October 2019 as a result of the C&J Merger. We also believe we experienced an ownership change in January 2017 as a result of the implementation of the IPO. Thus our pre-change NOLs are subject to limitation under Section 382 of the Code as a result. Such limitation may cause U.S. federal income taxes to be paid earlier than otherwise would be paid if such limitation were not in effect and could cause a portion of our pre-change NOLs generated prior to 2018 to expire unused, in each case reducing or eliminating the benefit of such NOLs. Similar rules and limitations may apply for state income tax purposes.
Risks Related to Owning Our Common Stock
The price of our common stock may be volatile or may decline regardless of our operating performance, and you may not be able to resell your shares at or above the public offering price.
The market price for our common stock is volatile. In addition, the market price of our common stock may fluctuate significantly in response to a number of factors, most of which we cannot control, including
the failure of securities analysts to cover, or continue to cover, our common stock or changes in financial estimates by analysts;
changes in, or investors’ perception of, the oil field services industry, including hydraulic fracturing industry;
fracturing;
the activities of competitors;
future issuances and sales of our common stock, including in connection with acquisitions;
our quarterly or annual earnings or those of other companies in our industry;
the public’s reaction to our press releases, our other public announcements and our filings with the SEC;
regulatory or legal developments in the United States;U.S.;
litigation involving us, our industry, or both; and
general economic conditions.
If a substantial number of shares becomes available for sale and are sold in a short period of time, the market price of our common stock could decline and our stockholders may be diluted.
As of March 9, 2019, 213,193,419 shares of common stock were outstanding, of which approximately 19.1% of the shares were held by Cerberus through Keane Investor. If they sell substantial amounts of our common stock in the public market, the market price of our common stock could decrease. The perception in the public market that Keane Investor might sell shares of common stock could also create a perceived overhang and depress our market price.
Because we do not currently pay dividends, our stockholders may not receive any return on investment, unless they sell their common stock for a price greater than that which they paid for it.
We do not currently pay dividends, and our stockholders do not have contractual or other rights, to receive dividends. Our board of directors may, in its discretion, modify or repeal our dividend policy. The declaration and payment of dividends depends on various factors, including: our net income, financial condition, cash requirements, future prospects and other factors deemed relevant by our board of directors.
In addition, we are a holding company that does not conduct any business operations of our own. As a result, we would be dependent upon cash dividends and distributions and other transfers from our subsidiaries to make dividend payments. Our subsidiaries’ ability to pay dividends is restricted by agreements governing their debt instruments and may be restricted by agreements governing any of our subsidiaries’ future indebtedness. Furthermore, our subsidiaries are permitted under the terms of their debt agreements to incur additional indebtedness that may severely restrict or prohibit the payment of dividends.See Part II, “Item 7. Management’s Discussion and Analysis of Financial Condition and Results of Operations-Liquidity and Capital Resources.”
Under the Delaware General Corporation Law (the “DGCL”), our board of directors may not authorize payment of a dividend unless it is either paid out of our surplus, as calculated in accordance with the DGCL, or if we do not have a surplus, it is paid out of our net profits for the fiscal year in which the dividend is declared and/or the preceding fiscal year.
We may not execute our capital return program, including the repurchase of our common stock pursuant to our share repurchase program under the capital return program, and such programs may not have the desired effect.
In December 2019, our board of directors approved a capital return program under which we may expend a total of up to $100 million through December 31, 2020, through stock repurchases, dividends or other capital return strategies. As part of the capital return program, our board of directors approved a stock repurchase program of up to $50 million of the Company's common stock, subject to U.S. Securities and Exchange Commission regulations, stock market conditions, capital needs of the business and other factors. Since the inception of our share repurchase program through December 31, 2019, we have made no share repurchases. We can provide no assurance that we will repurchase our common stock pursuant to our share repurchase program or that our share repurchase program will
enhance long-term stockholder value. Share repurchases could also increase the volatility of the price of our common stock and could diminish our cash reserves.
Although our board of directors has approved a share repurchase program, the share repurchase program does not obligate us to repurchase any specific dollar amount or to acquire any specific number of shares. The timing and amount of repurchases, if any, will depend upon several factors, including market and business conditions, the trading price of our common stock and the nature of other investment opportunities. The repurchase program may be limited, suspended or discontinued at any time without prior notice. In addition, repurchases of our common stock pursuant to our share repurchase program could cause our stock price to be higher than it would be in the absence of such a program and could potentially reduce the market liquidity for our stock. Furthermore, our share repurchase program could diminish our cash reserves, which may impact our ability to finance future growth and to pursue possible future strategic opportunities and acquisitions. Although our share repurchase program is intended to enhance long-term stockholder value, there is no assurance that it will do so and short-term stock price fluctuations could reduce the program’s effectiveness.
Our stockholders may be diluted by the future issuance of additional common stock in connection with our equity incentive plans, acquisitions or otherwise.
We have 286,806,581 shares of common stock authorized but unissued under our certificate of incorporation. We will be authorized to issue these shares of common stock and options, rights, warrants and appreciation rights relating to common stock for consideration and on terms and conditions established by our board of directors in its sole discretion, whether in connection with acquisitions or otherwise. We have 14,054,982 shares of our common stock available for award that may be issued under our equity incentive plans. Any common stock that we issue, including under our equity incentive plans or other equity incentive plans that we may adopt in the future, may result in additional dilution to our stockholders.
In the future, we may also issue our securities, including shares of our common stock, in connection with investments or acquisitions. We regularly evaluate potential acquisition opportunities, including ones that would be significant to us, and at any one time we may be participating in processes regarding several potential acquisition opportunities, including ones that would be significant to us. We cannot predict the timing of any contemplated transactions, and none are currently probable. The number of shares of our common stock issued in connection with an investment or acquisition could constitute a material portion of our then-outstanding shares of common stock. Any issuance of additional securities in connection with investments or acquisitions may result in additional dilution to our stockholders.
Keane Investor and Cerberus own a significant amount of our Sponsor controlcommon stock and continue to have significant influence over us, and may have conflictswhich could limit your ability to influence the outcome of interest with other stockholders in the future.key transactions, including a change of control.
Provisions in our charter documents, certain agreements governing our indebtedness, our Stockholders’ Agreement (as defined herein) and Delaware law could make an acquisition ofacquiring us more difficult and may prevent attempts by our stockholders to replace or remove our current management, even if beneficial to our stockholders.
Provisions in our certificate of incorporation, our bylaws and our bylaws,Stockholders’ Agreement, may discourage, delay or prevent a merger, acquisition or other change in control that some stockholders may consider favorable, including transactions in which our stockholders might otherwise receive a premium for their shares of our common stock. These provisions could also limit the price that investors might be willing to pay in the future for shares of our common stock, possibly depressing the market price of our common stock.
In addition, these provisions may frustrate or prevent any attempts by our stockholders to replace members of our board of directors. Because our board of directors is responsible for appointing the members of our management team, these provisions could in turn affect any attempt by our stockholders to replace members of our management team. Examples of such provisions are as follows:
certificate of incorporation (and such assignee’s or designee’s Affiliates)) (of these entities, the entity that is the beneficial owner of the largest number of shares is referred to as the “Designated Controlling Stockholder”) ceases to own, in the aggregate, at least 50% of the then-outstanding shares of our common stock (the “50% Trigger Date”),the authorized number of our directors may be increased or decreased only by the affirmative vote of two-thirds of the then-outstanding shares of our common stock or by resolution of our board of directors;
Our certificate of incorporation authorizes our board of directors to issue up to 50,000,000 shares of preferred stock. The preferred stock may be issued in one or more series, the terms of which may be determined by our board of directors at the time of issuance or fixed by resolution without further action by the stockholders. These terms may include voting rights, preferences as to dividends and liquidation, conversion rights, redemption rights and sinking fund provisions. The issuance of preferred stock could diminish the rights of holders of our common stock, and therefore, could reduce the value of our common stock. In addition, specific rights granted to holders of preferred stock could be used to restrict our ability to merge with, or sell assets to, a third party. The ability of our board of directors to issue preferred stock could delay, discourage, prevent or make it more difficult or costly to acquire or effect a change in control, thereby preserving the current stockholders’ control.
In addition, under the agreements governing the Senior Secured Debt Facilities, a change in control may lead the lenders and/or holders to exercise remedies such as acceleration of the obligations thereunder, termination of their commitments to fund additional advances and collection against the collateral securing such obligations.
Our certificate of incorporation and bylaws designate the Court of Chancery of the State of Delaware as the sole and exclusive forum for certain types of actions and proceedings that may be initiated by our stockholders, which could limit our stockholders’ ability to obtain a favorable judicial forum for disputes with us or our directors, officers or other employees.
Our certificate of incorporation provides that, unless we consent in writing to the selection of an alternative forum, the Court of Chancery of the State of Delaware will be the exclusive forum for: (a) any derivative action or proceeding brought on our behalf; (b) any action asserting a claim for breach of a fiduciary duty owed by any of our directors, officers, employees or agents to us or our stockholders; (c) any action asserting a claim arising pursuant to any provision of the Delaware General Corporation Law (the “DGCL”),DGCL, our certificate of incorporation or our bylaws; or (d) any action asserting a claim governed by the internal affairs doctrine. Any person or entity purchasing or otherwise acquiring any interest in shares of our capital stock is deemed to have received notice of and consented to the foregoing provisions. This choice of forum provision may limit a stockholder’s ability to bring a claim in a judicial forum that it finds more favorable for disputes with us or our directors, officers or other employees, which may discourage such lawsuits against us and our directors, officers and employees. Alternatively, if a court were to find this choice of forum provision inapplicable to, or unenforceable in respect of, one or more of the specified types of actions or proceedings, we may incur additional costs associated with resolving such matters in other jurisdictions, which could adversely affect our business, financial condition, prospects or results of operations.
37
Item 1B. Unresolved Staff Comments
None.
38
Item 2. Properties
Properties
In addition, we own or lease numerous other smaller facilities and administrative offices across the hydraulic fracturing unitsgeographic regions in which we operate to support our ongoing operations, including district offices, local sales offices, yard facilities and other equipmenttemporary facilities to house employees in regions where infrastructure is limited. Our leased properties are subject to various lease terms and vehicles operating out of these facilities.expirations. We believe that our existing facilities are in good condition and suitableadequate for our current operations. Below is a table detailingoperations and our locations allow us to efficiently serve our customers. However, we continue to evaluate the purchase or lease of additional properties or the consolidation of our properties, in the United States as of December 31, 2017:our business requires. We do not believe that any single facility is material to our operations and, if necessary, we could readily obtain a replacement facility.
39
Item 3. Legal Proceedings
Legal Proceedings
Due to the nature of our business, we are, from time to time and in the ordinary course of business, involved in routine litigation or subject to disputes or claims related to our business activities. It is our management’s opinion that although the amount of liability with respect to certain of the matters described hereinthese known legal proceedings and claims cannot be ascertained at this time, any resulting liability will not have a material adverse effect individually or in the aggregate on our financial condition, cash flows or results of operations; however, there can be no assurance as to the ultimate outcome of these matters.
In connection with the Merger Agreement and the transactions contemplated thereby the following complaints have been filed: (i) one putative class action complaint was filed in the United States District Court for the District of Colorado by a purported C&J stockholder on behalf of himself and all other C&J stockholders (excluding defendants and related or affiliated persons) against C&J and members of the C&J board of directors, (ii) two former employeesputative class action complaints were filed in the United States District Court for the District of Delaware by a purported C&J stockholder on behalf of himself and all other C&J stockholders (excluding defendants and related or affiliated persons) against C&J, members of the C&J board of directors, the Company and Merger Sub, (iii) one putative class action complaint for a proposed collective actionwas filed in the United States District Court for the Southern District of Texas entitled Hicksonby a purported stockholder of the Company on behalf of himself and Villaall other stockholders of the Company (excluding defendants and related or affiliated persons) against the Company and members of its board of directors, and (iv) one putative class action was filed in the Delaware Chancery Court by a purported stockholder of the Company on behalf of himself and all other stockholders of the Company (excluding defendants and related or affiliated persons) against members of the Company's board of directors. The five stockholder actions are captioned as follows: Palumbos v. C&J Energy Services, Inc., et al., Case No. 1:19-cv-02386 (D. Colo.), Wuollet v. C&J Energy Services, Inc., et al., Case No. 1:19-cv-01411 (D. Del.), Plumley v. C&J Energy Services, Inc., et al., Case No. 1:19-cv-01446 (D. Del.), Bushansky v. Keane Group, Holdings, LLC,Inc. et al., allegingCase No. 4:19-cb-02924 (S.D. Tex) and Woods v. Keane Group, Inc., et al., Case No. 2019-0590 (Del. Chan.) (collectively, the "Stockholder Actions").
In general, the Stockholder Actions allege that the defendants violated Sections 14(a) and 20(a) of the Exchange Act, or aided and abetted in such alleged violations, because the Registration Statement on Form S-4 filed with the SEC on July 16, 2019 in connection with the proposed C&J Merger allegedly omitted or misstated material information.
The Stockholder Actions seek, among other things, injunctive relief preventing the consummation of the C&J Merger, unspecified damages and attorneys' fees. C&J, the Company and the other named defendants believe that no supplemental disclosures were required under applicable laws; however, to avoid the risk of the Stockholder Actions delaying the C&J Merger and to minimize the expense of defending the Stockholder Actions, and without admitting any liability or wrongdoing, C&J and the Company filed a Form 8-K on October 11, 2019 making certain field professionals were not properly classified undersupplemental disclosures in connection with the Fair Labor Standards Act ("FLSA") and Pennsylvania law. The parties agreed to settle the claimsC&J Merger. Following those supplemental disclosures, plaintiffs in the first quarter of 2018 for $4.2 million. Settlement of this collective action is subjectWoods and Bushansky actions voluntarily dismissed their claims as moot on October 16, 2019 and October 29, 2019, respectively. The defendants have not yet answered or otherwise responded to court approval. Additionally, we are involvedthe complaints in a commercial dispute whereby a former customer has commenced an arbitration proceeding, captioned Halcon Operating Co., Inc.the remaining Stockholder Actions, but the Company continues to believe that the allegations therein lack merit and Halcon Energy Properties, Inc. v. Keane Frac LPno supplemental disclosures were required under applicable law, and Keane Frac GP, LLC, and on December 15, 2017, made a claim for contractual damages of approximately $4.0 million. The Company intends to vigorously dispute the merits of this asserted claim and plans to assert affirmative counterclaims for unpaid bills and other damages. Other than amounts previously accrued and disclosed, we are currently unable to estimate the range of loss, if any, that may result from these matters.defend itself vigorously.
Item 4. Mine Safety Disclosures
Not applicable.
41
PART II
Item 5. Market for Registrant’s Common Equity, Related Shareholder Matters and Issuer Purchases of Equity Securities
Market Information
| 2017 | ||||||||
| High | Low | |||||||
| First Quarter (January 25, 2017 - March 31, 2017) | $ | 22.93 | $ | 13.68 | ||||
| Second Quarter | $ | 16.81 | $ | 12.42 | ||||
| Third Quarter | $ | 16.92 | $ | 12.51 | ||||
| Fourth Quarter | $ | 19.13 | $ | 13.63 | ||||
NYSE was $2.03 per share.
Comparative Stock Performance Graph
The information contained in this Comparative Stock Performance Graph section shall not be deemed to be “soliciting material” or “filed” or incorporated by reference in future filings with the SEC, or subject to the liabilities of Section 18 of the Exchange Act, except to the extent that we specifically incorporate it by reference into a document filed under the Securities Act or the Exchange Act.
The graph below compares the cumulative total shareholder return on our common stock, the cumulative total return on the Standard & Poor'sPoor’s 500 Stock Index, the Standard & Poor'sPoor’s MidCap Index, the Oilfield Service Index and a composite average of publicly traded peer companies (C&J(Basic Energy Services, Inc., FTS International, Inc., Liberty Oilfield Services Inc., Patterson-UTI Energy, Inc., ProPetro Holding Corp., Quintana Energy Services, RPC, Inc., and Superior Energy Services, Inc. and Weatherford International plc)), since January 20, 2017, the first day our common stock traded on the NYSE.2017.
The graph assumes $100 was invested on January 20, 2017 the first day our stock was traded on the NYSE, in our common stock, the Standard & Poor'sPoor’s 500 Stock Index, the Standard & Poor'sPoor’s MidCap Index, the Oilfield Service Index and a composite of publicly traded peer companies. The cumulative total return assumes the reinvestment of all dividends. We elected to include the stock performance of a composite of our publicly traded peers, as we believe it is an appropriate benchmark for our line of business/industry.
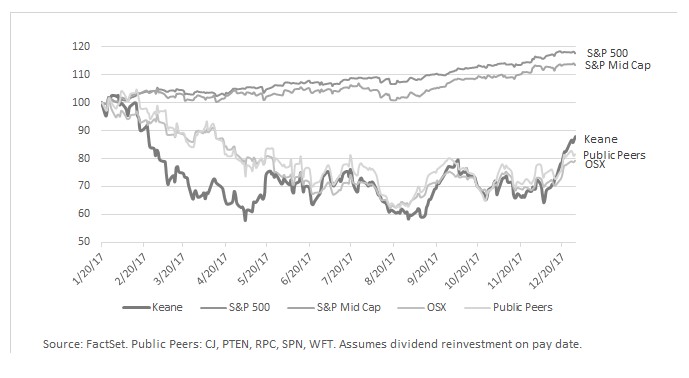
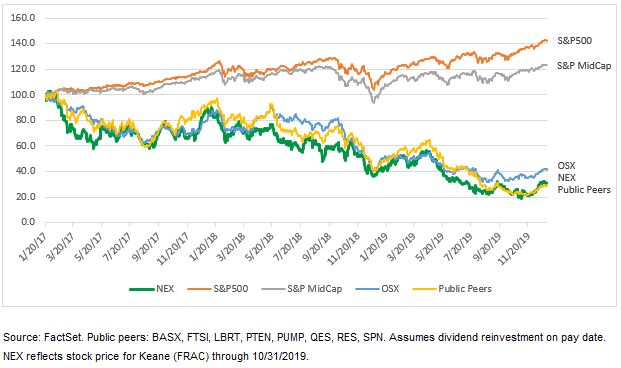
Holders
As of February 23, 2018, there were 10 shareholdersMarch 9, 2020, we had 213,193,419 shares of record of our common stock.stock issued and outstanding, held by approximately 8 registered holders. The number of recordregistered holders does not include persons whoholders that have common stock held shares offor them in “street name,” meaning that the stock is held for their accounts by a broker or other nominee.
Dividends
We have not paid any cash dividends on our common stock to date. However, we anticipate that our board of directors will consider the payment of dividends in nominee or “street name” accounts through brokers.
may decide, in its discretion, at any time, to modify or repeal the dividend policy or discontinue entirely the payment of dividends.
The ability of our board of directors to declare a dividend is also subject to limits imposed by Delaware corporate law. Under Delaware law, our board of directors and the boards of directors of our corporate subsidiaries incorporated in Delaware may declare dividends only to the extent of our “surplus,” which is defined as total assets at fair market value minus total liabilities, minus statutory capital, or if there is no surplus, out of net profits for the fiscal year in which the dividend is declared and/or the preceding fiscal year.
On February 26, 2018,December 11, 2019, we announced that our Boardboard of Directors hasdirectors had authorized a stock repurchase program of up to $100$50 million of the Company’sour outstanding common stock, with the intent of returning value to our shareholders, as we continue to expect further growth and profitability. The duration of the stock buy-back program will be 12 months. The program does not obligate us to purchase any particular number of shares of common stock during any period, and the program may be modified or suspended at any time at our discretion. The duration of the stock buy-back program was through December 31, 2020.
| Issuer Purchases of Equity Securities | ||||||||||||||
| Settlement Period | (a) Total Number of Shares Purchased(3) | (b) Average Price Paid per Share | (c) Total Number of Shares Purchased as Part of Publicly Announced Plans or Programs | (d) Dollar Value of Shares that May Yet be Purchased Under the Plans or Programs(1)(2) | ||||||||||
| October 1, 2019 through October 31, 2019 | 407,023 | $ | 4.32 | — | $ | 100,000,000 | ||||||||
| November 1, 2019 through November 30, 2019 | 36,952 | $ | 4.61 | — | $ | 100,000,000 | ||||||||
| December 1, 2019 through December 31, 2019 | 137,890 | $ | 6.02 | — | $ | 150,000,000 | ||||||||
| Total | 581,865 | $ | 4.74 | — | $ | 150,000,000 | ||||||||
(1) On February 26, 2018, we announced that our board of directors authorized a12-month stock repurchase program of up to $100.0 million of the Company’s outstanding common stock. Effective February 25, 2019, our board of directors authorized a reset of capacity on the existing stock repurchase program back to $100.0 million. Additionally, the program’s expiration date was extended to December 2019 from a previous expiration of September 2019.
(2) On December 11, 2019, the Company announced the board of directors approved a new share repurchase program for up to $50.0 million through December 2020.
(3)Consists of shares that were withheld by us to satisfy tax withholding obligations of employees that arose upon the vesting of restricted shares. The value of such shares is based on the closing price of our common stock were repurchased duringshares on the three months ended December 31, 2017.vesting date.
44
Item 6. Selected Financial Data
The selected financial data for the periods presented was derived from theour audited consolidated and combined financial statements of Keane. The selected historical financial data presented below is not intended to replace our historical financial statements, and should be read in conjunction with Part I, “Item 1A. Risk Factors,” Part II, “Item 7. Management’s Discussion and Analysis of Financial and Results of Operations” and our audited consolidated and combined financial statements included in Part II, “Item 8. Financial Statements and Supplementary Data” of this Annual Report in order to understand those factors, such as the C&J Merger, which may affect the comparability of the Selected Financial Data."
Year ended December 31, 2017(1) | Year ended December 31, 2016(2) | Year Ended December 31, 2015 | ||||||||||
| (in thousands of dollars, except per share amounts) | ||||||||||||
| Statement of Operations Data: | ||||||||||||
| Revenue | $ | 1,542,081 | $ | 420,570 | $ | 366,157 | ||||||
Cost of services(3) | 1,282,561 | 416,342 | 306,596 | |||||||||
| Depreciation and amortization | 159,280 | 100,979 | 69,547 | |||||||||
| Selling, general and administrative expenses | 93,526 | 53,155 | 26,081 | |||||||||
| Gain on disposal of assets | (2,555 | ) | (387 | ) | (270 | ) | ||||||
| Impairment | — | 185 | 3,914 | |||||||||
| Total operating costs and expenses | 1,532,812 | 570,274 | 405,868 | |||||||||
| Operating income (loss) | 9,269 | (149,704 | ) | (39,711 | ) | |||||||
| Other expense (income), net | 13,963 | 916 | (1,481 | ) | ||||||||
Interest expense(4) | (59,223 | ) | (38,299 | ) | (23,450 | ) | ||||||
| Total other expenses | (45,260 | ) | (37,383 | ) | (24,931 | ) | ||||||
| Loss before income taxes | $ | (35,991 | ) | $ | (187,087 | ) | $ | (64,642 | ) | |||
| Income tax expense | $ | (150 | ) | $ | — | $ | — | |||||
| Net loss | $ | (36,141 | ) | $ | (187,087 | ) | $ | (64,642 | ) | |||
Per Share Data(5) | ||||||||||||
| Net loss per share - basic and diluted | $ | (0.34 | ) | $ | (2.14 | ) | $ | (0.74 | ) | |||
| Weighted average number of shares - basic and diluted | 106,321 | 87,313 | 87,313 | |||||||||
| Statement of Cash Flows Data: | ||||||||||||
| Cash flows from operating activities | $ | 79,691 | $ | (54,054 | ) | $ | 37,521 | |||||
| Cash flows from investing activities | (250,776 | ) | (227,161 | ) | (26,038 | ) | ||||||
| Cash flows from financing activities | 218,122 | 276,633 | (10,518 | ) | ||||||||
| Other Financial Data: | ||||||||||||
Capital expenditures(6) | $ | 189,629 | $ | 23,545 | $ | 27,246 | ||||||
Adjusted EBITDA(8) | 214,525 | 1,921 | 41,885 | |||||||||
| Balance Sheet Data (at end of period): | ||||||||||||
| Total assets | $ | 1,043,116 | $ | 536,940 | $ | 324,795 | ||||||
Long-term debt (including current portion) (7) | 275,055 | 269,750 | 207,067 | |||||||||
| Total liabilities | 530,024 | 374,688 | 244,635 | |||||||||
| Total members’ equity | 513,092 | 162,252 | 80,160 | |||||||||
| Years Ended December 31, | ||||||||||||||||||||
2019(1) | 2018 | 2017(2) | 2016(3) | 2015 | ||||||||||||||||
| (in thousands of dollars, except per share amounts) | ||||||||||||||||||||
| Statement of Operations Data: | ||||||||||||||||||||
| Revenue | $ | 1,821,556 | $ | 2,137,006 | $ | 1,542,081 | $ | 420,570 | $ | 366,157 | ||||||||||
Cost of services(4) | 1,403,932 | 1,660,546 | 1,282,561 | 416,342 | 306,596 | |||||||||||||||
| Depreciation and amortization | 292,150 | 259,145 | 159,280 | 100,979 | 69,547 | |||||||||||||||
| Selling, general and administrative expenses | 123,676 | 113,810 | 84,853 | 36,615 | 26,081 | |||||||||||||||
| Merger and integration | 68,731 | 448 | 8,673 | 16,540 | — | |||||||||||||||
| (Gain) loss on disposal of assets | 4,470 | 5,047 | (2,555 | ) | (387 | ) | (270 | ) | ||||||||||||
| Impairment | 12,346 | — | — | 185 | 3,914 | |||||||||||||||
| Total operating costs and expenses | 1,905,305 | 2,038,996 | 1,532,812 | 570,274 | 405,868 | |||||||||||||||
| Operating income (loss) | (83,749 | ) | 98,010 | 9,269 | (149,704 | ) | (39,711 | ) | ||||||||||||
| Other income (expense), net | 453 | (905 | ) | 13,963 | 916 | (1,481 | ) | |||||||||||||
Interest expense(5) | (21,856 | ) | (33,504 | ) | (59,223 | ) | (38,299 | ) | (23,450 | ) | ||||||||||
| Total other expenses | (21,403 | ) | (34,409 | ) | (45,260 | ) | (37,383 | ) | (24,931 | ) | ||||||||||
| Income (loss) before income taxes | (105,152 | ) | 63,601 | (35,991 | ) | (187,087 | ) | (64,642 | ) | |||||||||||
| Income tax expense | (1,005 | ) | (4,270 | ) | (150 | ) | — | — | ||||||||||||
| Net income (loss) | $ | (106,157 | ) | $ | 59,331 | $ | (36,141 | ) | $ | (187,087 | ) | $ | (64,642 | ) | ||||||
Per Share Data(6) | ||||||||||||||||||||
| Basic net income (loss) per share | $ | (0.86 | ) | $ | 0.54 | $ | (0.34 | ) | $ | (2.14 | ) | $ | (0.74 | ) | ||||||
| Diluted net income (loss) per share | (0.86 | ) | 0.54 | (0.34 | ) | (2.14 | ) | (0.74 | ) | |||||||||||
Weighted average number of shares: basic | 122,977 | 109,335 | 106,321 | 87,313 | 87,313 | |||||||||||||||
Weighted average number of shares: diluted | 122,977 | 109,660 | 106,321 | 87,313 | 87,313 | |||||||||||||||
| Years Ended December 31, | ||||||||||||||||||||
| Statement of Cash Flows Data: | ||||||||||||||||||||
| Cash flows from operating activities | $ | 305,463 | $ | 350,311 | $ | 79,691 | $ | (54,054 | ) | $ | 37,521 | |||||||||
| Cash flows from investing activities | (114,100 | ) | (297,506 | ) | (250,776 | ) | (227,161 | ) | (26,038 | ) | ||||||||||
| Cash flows from financing activities | (16,746 | ) | (68,554 | ) | 218,122 | 276,633 | (10,518 | ) | ||||||||||||
| Other Financial Data: | ||||||||||||||||||||
Capital expenditures(7) | $ | 193,187 | $ | 291,543 | $ | 189,629 | $ | 23,545 | $ | 27,246 | ||||||||||
| Balance Sheet Data (at end of period): | ||||||||||||||||||||
| Total assets | $ | 1,664,907 | $ | 1,054,579 | $ | 1,043,116 | $ | 536,940 | $ | 324,795 | ||||||||||
Long-term debt (including current portion) (8) | 337,623 | 340,730 | 275,055 | 269,750 | 207,067 | |||||||||||||||
| Total liabilities | 778,135 | 567,398 | 530,024 | 374,688 | 244,635 | |||||||||||||||
| Total stockholders’ equity | 886,772 | 487,181 | 513,092 | 162,252 | 80,160 | |||||||||||||||
| (1) | Commencing on November 1, 2019, our consolidated and combined financial statements also include the financial position, results of operations and cash flows of C&J. |
| (2) | Commencing on July 3, 2017, our consolidated and combined financial statements also include the financial position, results of operations and cash flows of RockPile. |
| Commencing on March 16, 2016, our consolidated and combined financial statements also include the financial position, results of operations and cash flows of the Acquired Trican |
| Excludes depreciation and amortization, shown separately. |
| Interest expense during the year ended December 31, 2019 includes $0.5 million in write-offs in connection with the modification of the 2017 ABL Facility. Interest expense during the year ended December 31, 2018 includes $7.6 million in write-offs of deferred financing costs, incurred in connection with the early debt extinguishment of our 2017 Term Loan Facility (as defined herein). Interest expense during the year ended December 31, 2017 includes $15.8 million of prepayment penalties and $15.3 million in write-offs of deferred financing costs, incurred in connection with the refinancing |
| The pro forma earnings per unit amounts for 2017, 2016 and 2015 have been computed to give effect to the Organizational Transactions, including the limited liability company agreement of Keane Investor to, among other things, exchange all of our Existing Owners’ membership interests for the newly-created ownership interests. The computations of pro forma earnings per unit do not consider the 15,700,000 shares of common stock newly-issued by the Company to investors in the IPO. |
| Capital expenditures do not include, for the year ended December 31, 2018, $35.0 million of capital expenditures related to the asset acquisition from RSI, for the year ended December 31, 2017, $116.6 million of capital expenditures related to the acquisition of RockPile and, for the year ended December 31, 2016, $205.4 million of capital expenditures related to the acquisition of the Acquired Trican Operations. |
| Long-term debt includes |
46
(Thousands of Dollars) Year Ended December 31, | |||||||||||||
| 2017 | 2016 | 2015 | |||||||||||
| Net loss | $ | (36,141 | ) | $ | (187,087 | ) | $ | (64,642 | ) | ||||
| Depreciation and amortization | 159,280 | 100,979 | 69,547 | ||||||||||
| Interest expense, net | 59,223 | 38,299 | 23,450 | ||||||||||
Income tax (benefit) expense(a) | 150 | (114 | ) | 793 | |||||||||
| EBITDA | $ | 182,512 | $ | (47,923 | ) | $ | 29,148 | ||||||
Acquisition, integration and expansion(b) | (4,674 | ) | 35,630 | 6,272 | |||||||||
Offering-related expenses(c) | 7,069 | 1,672 | — | ||||||||||
| Commissioning costs | 12,565 | 9,998 | — | ||||||||||
Impairment of assets(d) | — | 185 | 3,914 | ||||||||||
Non-cash stock compensation(e) | 10,578 | 1,985 | 312 | ||||||||||
Other(f) | 6,475 | 374 | 2,239 | ||||||||||
| Adjusted EBITDA | $ | 214,525 | $ | 1,921 | $ | 41,885 | |||||||
| Other income (expense) | (13,963 | ) | (916 | ) | $ | 1,481 | |||||||
Selling, general and administrative(a) | 93,526 | 53,271 | $ | 25,288 | |||||||||
| Management Adjustments not associated with Cost of Services | (19,128 | ) | (26,451 | ) | $ | (7,740 | ) | ||||||
| Adjusted gross profit | $ | 274,960 | $ | 27,825 | $ | 60,914 | |||||||
Item 7. Management’s Discussion and Analysis of Financial Condition and Results of Operations
The following discussion and analysis of our financial condition and results of operations should be read in conjunction with our consolidated and combined financial statements and related notes included within Part II, “Item 8. Financial Statements and Supplementary Data” in this Annual Report on Form 10-K.
We provide our services in several of the most active basins in the U.S.,United States, including the Permian, Basin, the Marcellus Shale/Utica, Shale, the Eagle Ford Formation and the Bakken Formation.Bakken/Rockies. These regions are expected to account for approximately 70%73% of all new horizontal wells anticipated to be drilled during 2018 and 2019.through 2021. In addition, the high density of our operations in the basins in which we are most active provides us the opportunity to leverage our fixed costs and to quickly respond with what we believe are highly efficient, integrated solutions that are best suited to address customer requirements.
In particular, we are one of the largest providers of completion services in the Permian Basin, Eagle Ford Basin and the Marcellus Shale/Utica Shale, the most prolific and cost-competitive oil and natural gas basinsbasin in the United States. According to Spears & Associates, theThe Permian Basin, Eagle Ford Basin and the Marcellus Shale/Utica ShaleBasins are expected to account for 61%56% of total active rigs in the U.S. during 2018United States through 2022 based on forecasted rig counts.2022. These basins have experienced a recovery in activity since the spring of 2016, with an 166%156% increase in rig count from their combined Maysecond quarter of 2016 low of 194185 to 516475 as of December 31, 2017.2019. Our financial performance is significantly affected by rig and well count in North America, as well as oil and natural gas prices, which are summarized in the tables below.
Activity within our business segments is significantly impacted by spending on upstream exploration, development and production programs by our customers. Also impacting our activity is the status of the global economy, which impacts oil and natural gas consumption.
demand. Some of the more significant determinants of current and future spending levels of our customers are oil and natural gas prices, global oil supply, the world economy, the availability of credit, government regulation and global stability, which together drive worldwide drilling activity. Our financial performance is significantly affected by rig and well count in North America, as well as oil and natural gas prices, which are summarized in the tables below.
| Year Ended December 31, | ||||||||||||
| 2017 | 2016 | 2015 | ||||||||||
Oil price - WTI(1) | $ | 50.88 | $ | 43.14 | $ | 48.69 | ||||||
Natural gas price - Henry Hub(2) | 2.99 | 2.52 | 2.63 | |||||||||
(1) Oil price measured in dollars per barrel (2) Natural gas price measured in dollars per million British thermal units (Btu), or MMBtu | ||||||||||||
| Year Ended December 31, | |||||||||
| Product Type | 2017 | 2016 | 2015 | ||||||
| Oil | 703 | 408 | 750 | ||||||
| Natural Gas | 172 | 100 | 227 | ||||||
| Other | 1 | 1 | 1 | ||||||
| Total | 876 | 509 | 978 | ||||||
| Year Ended December 31, | |||||||||
| Drilling Type | 2017 | 2016 | 2015 | ||||||
| Horizontal | 736 | 400 | 744 | ||||||
| Vertical | 70 | 60 | 139 | ||||||
| Directional | 70 | 49 | 95 | ||||||
| Total | 876 | 509 | 978 | ||||||
crude oil prices. Our customers’ cash flows, in most instances, depend upon the revenue they generate from the sale of oil and natural gas. Lower oil and natural gas prices usually translate into lower exploration and production budgets. We are closely monitoring the situation including potential activity responses by our E&P customers.
| Year Ended December 31, | ||||||||||||
| 2019 | 2018 | 2017 | ||||||||||
Oil price - WTI(1) | $ | 56.98 | $ | 64.94 | $ | 50.88 | ||||||
Natural gas price - Henry Hub(2) | $ | 2.57 | $ | 3.17 | $ | 2.99 | ||||||
(1) Oil price measured in dollars per barrel (2) Natural gas price measured in dollars per million British thermal units (Btu), or MMBtu | ||||||||||||
The historical average $2.88 and $2.92 in 2018 and 2019, respectively.
| Year Ended December 31, | |||||||||
| Product Type | 2019 | 2018 | 2017 | ||||||
| Oil | 773 | 841 | 703 | ||||||
| Natural Gas | 169 | 190 | 172 | ||||||
| Other | 1 | 1 | 1 | ||||||
| Total | 943 | 1,032 | 876 | ||||||
| Year Ended December 31, | |||||||||
| Drilling Type | 2019 | 2018 | 2017 | ||||||
| Horizontal | 826 | 900 | 736 | ||||||
| Vertical | 54 | 63 | 70 | ||||||
| Directional | 63 | 69 | 70 | ||||||
| Total | 943 | 1,032 | 876 | ||||||
As of oil and gas prices over the near and immediate term, and market volatility has continued to persist. Despite this market volatility, we continue to experience increased demand for our services and believe we are in a more stable demand environment than existed during the above-mentioned market decline.
Operating Approach & Strategy
We believe our integrated approach and proven capabilities enable us to deliver cost-effective solutions for increasingly complex and technically demanding well completion requirements, which include longer lateral segments, higher pressure rates and proppant intensity and multiple fracturing stages in challenging high-pressure formations. In addition, our technical team and our three innovation centers, provide us with the ability to supplement our service offerings with engineered solutions specifically tailored to address customers’ completion requirements and unique challenges.
Our revenues and profits are generated by providing services and equipment to customers who operate oil and gas properties and invest capital to drill new wells and enhance production or perform maintenance on existing wells. Our results of operations in our core service lines are driven primarily by five interrelated, fluctuating variables: (1) the drilling, completion and production activities of our customers, which is primarily driven by oil and natural gas prices and directly affects the demand for our services; (2) the price we are able to charge for our services and equipment, which is primarily driven by the level of demand for our services and the supply of equipment capacity in the market; (3) the cost of materials, supplies and labor involved in providing our services, and our ability to pass those costs on to our customers; (4) our activity, or deployed equipment “utilization” levels; and (5) the quality, safety and efficiency of our service execution.
Our operating strategy is focused on maintaining high utilization levels of deployed equipment to maximize revenue generation while controlling costs to gain a competitive advantage and drive returns. We believe that the quality and efficiency of our service execution and aligning with customers who recognize the value that we provide through service quality and efficiency gains are central to our efforts to support equipment utilization and grow our business.
However, equipment utilization cannot be relied on as wholly indicative of our financial or operating performance due to variations in revenue and profitability from job to job, the type of service to be performed and the equipment, personnel and consumables required for the job, as well as competitive factors and market conditions in the region in which the services are performed. Given the volatile and cyclical nature of activity drivers in the U.S. onshore oilfield services industry, coupled with the varying prices we are able to charge for our services and the cost of providing those services, among other factors, operating margins can fluctuate widely depending on supply and demand at a given point in the cycle.
Historically, our utilization levels have been highly correlated to U.S. onshore spending by our customers, which is heavily driven by the price of oil and natural gas. Generally, as capital spending by our customers increases, drilling, completion and production activity also increases, resulting in increased demand for our services, and therefore more days or hours worked (as the case may be). Conversely, when drilling, completion and production activity levels decline due to lower spending by our customers, we generally provide fewer services, which results in fewer days or hours worked (as the case may be). Additionally, during periods of decreased spending by our customers, we may be required to discount our rates or provide other pricing concessions to remain competitive and support deployed equipment utilization, which negatively impacts our revenue and operating margins. During periods of pricing weakness for our services, we may not be able to reduce our costs accordingly, and our ability to achieve any cost reductions from our suppliers typically lags behind the decline in pricing for our services, which could further adversely affect our results. Furthermore, when demand for our services increases following a period of low demand, our ability to capitalize on such increased demand may be delayed while we reengage and redeploy equipment and crews that have been idled during a downturn. The mix of customers that we are working for, as well as limited periods of exposure to the spot market, also impacts our deployed equipment utilization.
49
Our Reportable Segments
As of December 31, 2019, we were organized into three reportable segments:
Completion Services, which consists of the following businesses and services lines: (1) hydraulic fracturing; (2) wireline and pumpdown services; and (3) completion support services, which includes our innovation centers and activities.
Well Construction and Intervention Services, which consists of the following businesses and service lines: (1) cementing services and (2) coiled tubing services.
Well Support Services, which consists of the following businesses and service lines: (1) rig services; (2) fluids management; and (3) other special well site services.
Completion Services
The core services provided through our Completion Services segment are hydraulic fracturing, wireline and pumpdown services. As of December 31, 2019, we had approximately 45 hydraulic fracturing fleets, 118 wireline trucks and 80 pumpdown units capable of being deployed. Our completion support services are focused on supporting the efficiency, reliability and quality of our operations. Our Innovation Centers provide in-house manufacturing capabilities that help to reduce operating cost and enable us to offer more technologically advanced and efficiency focused completion services, which we believe is a competitive differentiator. For example, through our Innovation Centers we manufacture the data control instruments used in our fracturing operations and the perforating guns and addressable switches used in our wireline operations; these products are also available for sale to third-parties. The majority of revenue for this segment is generated by our fracturing business.
Well Construction and Intervention Services
The core services provided through our Well Construction and Intervention Services segment are cementing and coiled tubing services. The majority of revenue for this segment is generated by our cementing business. As of December 31, 2019, we had approximately 25 coiled tubing units and 101 cementing units capable of being deployed.
Well Support Services
Our Well Support Services segment was divested in a transaction that closed on March 9, 2020. It focused on post-completion activities at the well site, including rig services, such as workover and plug and abandonment, fluids management services, and other specialty well site services. Since early 2017, in response to 2018.the highly competitive landscape and reflecting our returns-focused strategy, we had focused on operational rightsizing measures to better align these businesses with current market conditions. This strategy resulted in closing facilities and idling unproductive equipment. For example, we either sold or shut down numerous businesses or asset packages, which included the divestiture of the majority of our fluids management assets in both West and South Texas in the third quarter of 2019. As of December 31, 2019, we had approximately 276 workover rigs and 348 fluids management trucks capable of being deployed. The majority of revenue for this segment is generated by our rig services business, and we consider rig services and fluids management to be the primary businesses within this segment.
Our management team monitors asset utilization, among other factors, for purposes of assessing our overall activity levels and customer demand. For our Completion Services segment, asset utilization levels for our own fleets is defined as the ratio of the average number of deployed fleets to the number of total fleets for a given time period. We define active fleets as fleets available for deployment; we consider one of our fleets deployed if the fleet has been put in service at least one day during the period for which we calculate utilization; and we define fully-
utilized fleets per month as fleets that were deployed and working with our customers for a significant portion of a given month. As a result, as additional fleets are incrementally deployed, our utilization rate increases. We define industry utilization of fracturing assets as the ratio of the total industry demand of hydraulic horsepower to the total available capacity of hydraulic horsepower, in each case as reported by an independent industry source. Our method for calculating the utilization rate for our own fracturing fleets or the industry may differ from the method used by other companies or industry sources which could, for example, be based off a ratio of the total number of days a fleet is put in service to the total number of days in the relevant period. We believe that our measures of utilization, based on the number of deployed fleets, provide an accurate representation of existing, available capacity for additional revenue generating activity.
In our Well Construction and Intervention Services segment, we measure our asset utilization levels for our cementing business primarily by the total number of days that our asset base works on a monthly basis, based on the available working days per month. In our coiled tubing business, we measure certain asset utilization levels by the hour to better understand measures between daylight and 24-hour operations. Both the financial and operating performance of our coiled tubing and cement units can vary in revenue and profitability from job to job depending on the type of service to be performed and the equipment, personnel and consumables required for the job, as well as competitive factors and market conditions in the region in which the services are performed.
In our Well Support Services segment, we measured asset utilization levels primarily by the number of hours our assets work on a monthly basis, based on the available working days per month.
Our operating strategy is focused on maintaining high asset utilization levels to maximize revenue generation while controlling costs to gain a competitive advantage and drive returns. We believe that the safety, quality and efficiency of our service execution and our alignment with customers who recognize the value that we provide are executing well designscentral to our efforts to support utilization and grow our business. Given the volatile and cyclical nature of activity drivers in the U.S. onshore oilfield services industry, coupled with increased sand tonnage pumpedthe varying prices we are able to help supersize their wellscharge for our services and the cost of providing those services, among other factors, operating margins can fluctuate widely depending on supply and demand at a given point in the cycle. For additional information about factors impacting our business and results of operations, please see “Industry Trends and Outlook” in Part II, “Item 7. Management’s Discussion and Analysis of Financial Condition and Results of Operations” in this Annual Report.
RESULTS OF OPERATIONS
The following table sets forth our financial results for the year ended December 31, 2019 as compared to increase well productivity. This increasethe year ended the year ended December 31, 2018. Our financial results for 2019 include the financial and operating results of the businesses acquired in sand tonnage pumped has led to a significantthe C&J Merger for the partial period beginning November 1, 2019 through December 31, 2019.
A comparison of our financial results for the year ended December 31, 2018 and for the year ended December 31, 2017 can be found in the "Item 7. Management's Discussion and Analysis of Financial Condition and Results of Operations - Results of Operations" section in our Annual Report on Form 10-K for the fiscal year ended December 31, 2018, filed on February 27, 2019.
Year Ended December 31, 20172019 Compared with Year Ended December 31, 20162018
| Year Ended December 31, | Year Ended December 31, | |||||||||||||||||||||||||||||||||||||||||
| (Thousands of Dollars) | As a % of Revenue | Variance | As a % of Revenue | Variance | ||||||||||||||||||||||||||||||||||||||
| Description | 2017 | 2016 | 2017 | 2016 | $ | % | 2019 | 2018 | 2019 | 2018 | $ | % | ||||||||||||||||||||||||||||||
| Completion Services | $ | 1,527,287 | $ | 410,854 | 99 | % | 98 | % | $ | 1,116,433 | 272 | % | $ | 1,709,934 | $ | 2,100,956 | 94 | % | 98 | % | $ | (391,022 | ) | (19 | %) | |||||||||||||||||
| Other Services | 14,794 | 9,716 | 1 | % | 2 | % | 5,078 | 52 | % | |||||||||||||||||||||||||||||||||
| Well Construction and Intervention Services | 63,039 | 36,050 | 3 | % | 2 | % | 26,989 | 75 | % | |||||||||||||||||||||||||||||||||
| Well Support Services | 48,583 | — | 3 | % | 0 | % | 48,583 | 0 | % | |||||||||||||||||||||||||||||||||
| Revenue | 1,542,081 | 420,570 | 100 | % | 100 | % | 1,121,511 | 267 | % | 1,821,556 | 2,137,006 | 100 | % | 100 | % | (315,450 | ) | (15 | %) | |||||||||||||||||||||||
| Completion Services | 1,269,263 | 401,891 | 82 | % | 96 | % | 867,372 | 216 | % | 1,308,089 | 1,622,106 | 72 | % | 76 | % | (314,017 | ) | (19 | %) | |||||||||||||||||||||||
| Other Services | 13,298 | 14,451 | 1 | % | 3 | % | (1,153 | ) | (8 | %) | ||||||||||||||||||||||||||||||||
| Costs of services (excluding depreciation and amortization, shown separately) | 1,282,561 | 416,342 | 83 | % | 99 | % | 866,219 | 208 | % | |||||||||||||||||||||||||||||||||
| Completion Services | 258,024 | 8,963 | 17 | % | 2 | % | 249,061 | 2,779 | % | |||||||||||||||||||||||||||||||||
| Other Services | 1,496 | (4,735 | ) | 0 | % | (1 | %) | 6,231 | (132 | %) | ||||||||||||||||||||||||||||||||
| Gross profit | 259,520 | 4,228 | 17 | % | 1 | % | 255,292 | 6,038 | % | |||||||||||||||||||||||||||||||||
| Well Construction and Intervention Services | 55,227 | 38,440 | 3 | % | 2 | % | 16,787 | 44 | % | |||||||||||||||||||||||||||||||||
| Well Support Services | 40,616 | — | 2 | % | 0 | % | 40,616 | 0 | % | |||||||||||||||||||||||||||||||||
| Costs of services | 1,403,932 | 1,660,546 | 77 | % | 78 | % | (256,614 | ) | (15 | %) | ||||||||||||||||||||||||||||||||
| Depreciation and amortization | 159,280 | 100,979 | 10 | % | 24 | % | 58,301 | 58 | % | 292,150 | 259,145 | 16 | % | 12 | % | 33,005 | 13 | % | ||||||||||||||||||||||||
| Selling, general and administrative expenses | 93,526 | 53,155 | 6 | % | 13 | % | 40,371 | 76 | % | 123,676 | 113,810 | 7 | % | 5 | % | 9,866 | 9 | % | ||||||||||||||||||||||||
| (Gain) on disposal of assets | (2,555 | ) | (387 | ) | 0 | % | 0 | % | (2,168 | ) | 560 | % | ||||||||||||||||||||||||||||||
| Merger and integration | 68,731 | 448 | 4 | % | 0 | % | 68,283 | 15,242 | % | |||||||||||||||||||||||||||||||||
| (Gain) loss on disposal of assets | 4,470 | 5,047 | 0 | % | 0 | % | (577 | ) | (11 | %) | ||||||||||||||||||||||||||||||||
| Impairment | — | 185 | 0 | % | 0 | % | (185 | ) | (100 | %) | 12,346 | — | 1 | % | 0 | % | 12,346 | 0 | % | |||||||||||||||||||||||
| Operating income (loss) | 9,269 | (149,704 | ) | 1 | % | (36 | %) | 158,973 | (106 | %) | ||||||||||||||||||||||||||||||||
| Other income, net | 13,963 | 916 | 1 | % | 0 | % | 13,047 | 1,424 | % | |||||||||||||||||||||||||||||||||
| Operating income | (83,749 | ) | 98,010 | (5 | %) | 5 | % | (181,759 | ) | (185 | %) | |||||||||||||||||||||||||||||||
| Other income (expense), net | 453 | (905 | ) | 0 | % | 0 | % | 1,358 | (150 | %) | ||||||||||||||||||||||||||||||||
| Interest expense | (59,223 | ) | (38,299 | ) | (4 | %) | (9 | %) | (20,924 | ) | 55 | % | (21,856 | ) | (33,504 | ) | (1 | %) | (2 | %) | 11,648 | (35 | %) | |||||||||||||||||||
| Total other expenses | (45,260 | ) | (37,383 | ) | (3 | %) | (9 | %) | (7,877 | ) | 21 | % | (21,403 | ) | (34,409 | ) | (1 | %) | (2 | %) | 13,006 | (38 | %) | |||||||||||||||||||
| Income tax expense | (150 | ) | — | 0 | % | 0 | % | (150 | ) | 0 | % | (1,005 | ) | (4,270 | ) | 0 | % | 0 | % | 3,265 | (76 | %) | ||||||||||||||||||||
| Net income (loss) | $ | (36,141 | ) | $ | (187,087 | ) | (2 | %) | (44 | %) | $ | 150,946 | (81 | %) | $ | (106,157 | ) | $ | 59,331 | (6 | %) | 3 | % | $ | (165,488 | ) | (279 | %) | ||||||||||||||
Revenue. Total revenue is comprised of revenue from our Completion Services, Well Construction and Other Services.Intervention Services and Well Support Services segments. Revenue in 2017 increased2019 decreased by $1.1 billion,$315.5 million, or 267%15%, to $1.5$1.8 billion from $420.6 million$2.1 billion in 2016.2018. The net decline was driven primarily by a decrease in rig count and fleet utilization, combined with pricing pressures from macroeconomic market conditions. This decrease in utilization was primarily from our customers shifting their focus to capital discipline through reduced activity levels and pricing. Despite pricing pressures, we retained our core customer base by aligning with high quality and efficient customers under dedicated agreements. This change in revenue by reportable segment is discussed below.
Completion Services:Completion Services segment revenue decreased by $391.0 million, or 19%, to $1.7 billion in 2019 from $2.1 billion in 2018. The segment revenue decline was driven by lower fleet utilization and decreased activity levels year over year, in addition to continued pricing pressures from market conditions. This was offset by an increase in revenue attributable to the C&J Merger.
Well Construction and Intervention: Well Construction and Intervention Services segment revenue increased by $1.1 billion,$27.0 million, or 272%75%, to $1.5 billion in 2017 from $410.9$63.0 million in 2016. This change was primarily attributable to a 105% growth in our average number of deployed fleets, as a result of increased utilization of our combined asset base following our acquisition of RockPile and our acquisition of the majority of the U.S. assets and assumptions of certain liabilities of Trican Well Service, L.P. (the “Acquired Trican Operations”), as well as increased stage count and efficiency2019 from both our existing and newly-deployed recommissioned fleets. In addition, annualized revenue per deployed fleet increased 81%.
Well Support Services: Well Support Services segment revenue was $48.6 million in 2019 with no comparison period in 2018. This increase in revenue was solely attributable to the acquisition of Other Services divisions from RockPile. Revenue in 2017 was earned in our cementing and workover divisions and revenue in 2016 was earned in our cementing and coiled tubing divisions. We idled our coiled tubing division inthe segment through the C&J Merger.
Cost of services. Cost of services in 2017 increased2019 decreased by $866.2$256.6 million, or 208%15%, to $1.3$1.4 billion from $416.3 million$1.7 billion in 2016.2018. This change was driven by several factors including (i) higherlower overall activity in the Completion Services segment (asand fleet utilization, as discussed above under Revenue,), (ii) price inflation in our key input costs, including labor, sand and sand trucking, (iii) increased maintenance costs associated with increased service intensity stemming from larger sand volumes and well configurations, such as zipper designs, (iv) an increase in fleets working twenty-four hour operations and (v) rapid deployment and commissioning of our idle fleets. In 2017, we incurred $12.4 million of fleet commissioning costs, $1.7 million of acquisition and integration costs associated with the acquisition of RockPile and $1.3 million for bonuses paid out to key operational employees in connection with our IPO. In 2016, we had management adjustments of $13.9 million primarily related to acquisition and integration costs associated with the acquisition of the Acquired Trican Operations and $10.0 million primarily related to commissioning of our idle fleets. Cost of services as a percentage of total revenue in 2017 was 83%, which represented a decrease of 16% from 99% in 2016. Excluding the above-mentioned management adjustments, total cost of services was $1.27 billion and $392.4 million in 2017 and 2016 or 82% and 93% of revenue, respectively, a decrease as a percentage of revenue of 11%.
| Year Ended December 31, | |||||||||
| Description | 2017 | 2016 | % Change | ||||||
| Segment cost of services as a percentage of segment revenue: | |||||||||
| Completion Services | 83 | % | 98 | % | (15 | )% | |||
| Other Services | 90 | % | 149 | % | (59 | )% | |||
| Total cost of services as a percentage of total revenue | 83 | % | 99 | % | (16 | )% | |||
Selling, general and administrative expense. Selling, general and administrative (“SG&A”) expense, which represents costs associated with managing and supporting our operations, increased by $40.4$9.9 million, or 76%9%, to $93.5$123.7 million in 20172019 from $53.2$113.8 million in 2016.2018. This change in SG&A was primarily related to non-cash amortizationcompensation expense of equity awards issued under our Equity$19.4 million and Incentive Award Planlitigation contingencies of $3.8 million.
Merger and integration expense. Merger and integration expense increased by $68.3 million to $68.7 million in 20172019 from $0.4 million in 2018. The $68.7 million in merger and transactions driving overall company growthintegration expense in 2019 was due to the C&J Merger, which consisted primarily of professional services, severance costs, and facility consolidation. The $0.4 million in 2018 is related to transaction cost associated with the acquisitionRSI Acquisition.
Other income (expense), net. Other income (expense), net, in 2019 increased by $1.4 million, or 150%, to income of RockPile. SG&A as a percentage of total revenue was 6% in 2017 compared with 13% in 2016. Total management adjustments were $34.5$0.5 million in 2017, driven by $10.72019 from expense of $0.9 million of transaction costsin 2018. In 2018, other expense, net was primarily incurred for the acquisition of RockPile, $10.6due to a $13.2 million of non-cash compensation expense for the restricted stock units and stock options awarded to certain of our employees in connection with our IPO, $5.8 million of organizational restructuring costs and bonuses to key personnel in connection with our IPO, as well as transaction costs relatedadjustment to our secondary offering in 2018, $7.2Rockpile CVR liability, $2.7 million primarily related to litigation contingencies and $0.2 million related to acquisition and integration costs associated with the acquisition of RockPile. Management adjustments in 2016 were $26.9 million, primarily driven by $23.2 million of transaction costs and lease exit costsloss on foreign currency related to the integrationwind-down of the Acquired Trican Operations, $2.0Canadian entity, offset by a $14.9 million gain on the insurance proceeds received for losses resulting from the July 1, 2018 accidental fire.
Interest expense, net. Interest expense, net of interest income, decreased by $11.6 million, or 35%, to $21.9 million in non-cash compensation expense of our unit-based awards and $1.72019 from $33.5 million in IPO-readiness costs. Excluding these management adjustments, SG&A expense was $59.0 million and $26.3 million in 2017 and 2016, respectively, which represents an increase of 124%.
Effective tax rate. Upon consummation of the IPO, the Company became a corporation subject to federal income taxes. Our effective tax rate on continuing operations in 20172019 was (0.53)(0.96)%. The, as compared to 6.71% in 2018. For 2019, the effective rate is primarily made up of state taxes and a tax benefit derived from the current period operating loss offset by a valuation allowance. For 2018, the effective rate was primarily made up of state taxes and tax benefits derived from the current period operating income offset by a valuation allowance. As a result of market conditions and their corresponding impact on our business outlook, we determined that a valuation allowance was appropriate as it is not more likely than not that we will utilize our net deferred tax assets. The remaining tax impact not offset by a valuation allowance is related to tax amortization onindefinite-lived assets.
Industry Drivers of 2019 Operations
Between January and April 2019, the increase in oil prices incentivized many of our indefinite-lived intangible assets.
| Year Ended December 31, | |||||||||||||||||||||
| (Thousands of Dollars) | As a % of Revenue | Variance | |||||||||||||||||||
| Description | 2016 | 2015 | 2016 | 2015 | $ | % | |||||||||||||||
| Completion Services | $ | 410,854 | $ | 363,820 | 98 | % | 99 | % | $ | 47,034 | 13 | % | |||||||||
| Other Services | 9,716 | 2,337 | 2 | % | 1 | % | 7,379 | 316 | % | ||||||||||||
| Revenue | 420,570 | 366,157 | 100 | % | 100 | % | 54,413 | 15 | % | ||||||||||||
| Completion Services | 401,891 | 305,036 | 96 | % | 83 | % | 96,855 | 32 | % | ||||||||||||
| Other Services | 14,451 | 1,560 | 3 | % | 0 | % | 12,891 | 826 | % | ||||||||||||
| Cost of services (excluding depreciation and amortization, shown separately) | 416,342 | 306,596 | 99 | % | 84 | % | 109,746 | 36 | % | ||||||||||||
| Completion Services | 8,963 | 58,784 | 2 | % | 16 | % | (49,821 | ) | (85 | %) | |||||||||||
| Other Services | (4,735 | ) | 777 | (1 | %) | 0 | % | (5,512 | ) | (709 | %) | ||||||||||
| Gross profit | 4,228 | 59,561 | 1 | % | 16 | % | (55,333 | ) | (93 | %) | |||||||||||
| Depreciation and amortization | 100,979 | 69,547 | 24 | % | 19 | % | 31,432 | 45 | % | ||||||||||||
| Selling, general and administrative expenses | 53,155 | 26,081 | 13 | % | 7 | % | 27,074 | 104 | % | ||||||||||||
| (Gain) on disposal of assets | (387 | ) | (270 | ) | 0 | % | 0 | % | (117 | ) | 43 | % | |||||||||
| Impairment | 185 | 3,914 | 0 | % | 1 | % | (3,729 | ) | (95 | %) | |||||||||||
| Operating loss | (149,704 | ) | (39,711 | ) | (36 | %) | (11 | %) | (109,993 | ) | 277 | % | |||||||||
| Other income, net | 916 | (1,481 | ) | 0 | % | 0 | % | 2,397 | (162 | %) | |||||||||||
| Interest expense | (38,299 | ) | (23,450 | ) | (9 | %) | (6 | %) | (14,849 | ) | 63 | % | |||||||||
| Total other expenses | (37,383 | ) | (24,931 | ) | (9 | %) | (7 | %) | (12,452 | ) | 50 | % | |||||||||
| Income tax expense | — | — | 0 | % | 0 | % | — | — | % | ||||||||||||
| Net loss | $ | (187,087 | ) | $ | (64,642 | ) | (44 | %) | (18 | %) | $ | (122,445 | ) | 189 | % | ||||||
We are committed to continuing to manage our business in line with demand for our services and make adjustments as necessary to effectively respond to changes in market conditions, customer activity levels, pricing for our services and equipment, and utilization of our combineddeployed equipment and personnel. Our response to the industry's persistent uncertainty is to maintain sufficient liquidity, preserve our conservative capital structure and closely monitor our discretionary spending. We take a measured approach to asset base followingdeployment, balancing our acquisitionview of current and expected customer activity levels with a focus on generating positive returns for our shareholders. Our priorities remain to drive revenue by maximizing deployed equipment utilization, to improve margins through cost controls, to protect and grow our market share by focusing on the Acquired Trican Operations. This increase was offset by a 43% decreasequality, safety and efficiency of our service execution, and to ensure that we are strategically positioned to capitalize on constructive market dynamics.
Looking Ahead to 2020
We face many challenges and risks in the revenue per deployed hydraulic fracturing fleetindustry in which we operate. Although many factors contributing to these risks are beyond our ability to control, we continuously monitor these risks and have taken steps to mitigate them to the extent practicable. In addition, while we believe that we are well positioned to capitalize on available growth opportunities, we may not be able to achieve our business objectives and, consequently, our results of operations may be adversely affected. Please read the factors described in the sections titled “Cautionary Note Regarding Forward-Looking Statements” and “Risk Factors” in Part I, Item 1A of this Annual Report for additional information about the known material risks that we face.
Fiscal 2020 Objectives
With recent commodity price volatility, we intend to closely monitor the market and will adjust our approach as the situation develops. At this time, in 2020, our principal business objective continues to be growing our business and safely providing best-in-class services in all of our operating segments, while delivering shareholder value and maintaining a resultdisciplined capital deployment strategy. We expect to achieve our objective through:
partnering and growing with well-capitalized customers under dedicated agreements who focus their efforts on safety, high-efficiency completions, continuous improvement and innovation;
allocating our assets to maximize utilization and returns, including diversification of competitivegeographies and commodities;
maximizing profitability of fully-utilized fleets through leading-edge pricing driven by current market conditions.and efficiencies;
leveraging our flexible and scalable logistics infrastructure to revenuesprovide assurance of supply at lowest landed cost;
leveraging our platform to identify, retain and promote talent to sustain growth and support operational and commercial excellence; maintaining agreements with our existing strategic suppliers and identify and develop relationships with additional strategic suppliers to ensure continuity of supply and optimize efficiency;
maintaining our conservative and flexible capital position, supporting continued growth and maintenance of active equipment;
gaining scale, enhancing our service offering, and capturing targeted cost synergies from the coiled tubingC&J Merger; and cementing divisions acquired
returning capital to shareholders in connection with the Acquired Trican Operations in 2016. This increase was offset by a $2.3 million reduction in revenues from the drilling division, which was idled in May 2015, as a result of the significant decrease in rig count.disciplined fashion.
| Year Ended December 31, | |||||||||
| Description | 2016 | 2015 | % Change | ||||||
| Segment cost of services as a percentage of segment revenue: | |||||||||
| Completion Services | 98 | % | 84 | % | 14 | % | |||
| Other Services | 149 | % | 67 | % | 82 | % | |||
| Total cost of services as a percentage of total revenue | 99 | % | 84 | % | 15 | % | |||
Well Construction and Intervention Services
In our Well Construction and Intervention Services segment, our strategy remains focused on deploying our market-ready cementing equipment and two newbuild coiled tubing units that we will take delivery of in the first quarter of 2020. In our cementing business, even though market conditions remain challenged due to customers releasing drilling businessrigs and declining E&P capital spending in 2020, we remain focused on providing high-quality, timely service and deploying more of our stacked units with efficient customers with deep inventories of work in our Othercore operating basins. We will stay focused on controlling costs, improving market share with an efficient customer base that plan to maintain stable drilling rig counts in 2020. In our coiled tubing business, we are focused on deploying two newbuild, large-diameter units into our core operating basins and increasing market share with large, efficient customers with deep inventories of completion-oriented work that will keep our new units highly utilized.
Well Support Services
We divested our Well Support Services segment and a $0.3 million impairment on our drilling rig fleet in our Other Services segment.
LIQUIDITY AND CAPITAL RESOURCES
Liquidity represents a company'scompany’s ability to adjust its future cash flows to meet needs and opportunities, both expected and unexpected.
| (Thousands of Dollars) | ||||||||
| Year Ended December 31, | ||||||||
| 2019 | 2018 | |||||||
| Cash | $ | 255,015 | $ | 80,206 | ||||
| Debt, net of deferred financing costs and debt discount | $ | 337,623 | $ | 340,730 | ||||
| (Thousands of Dollars) | (Thousands of Dollars) | |||||||||||||||||||||||
| Year Ended December 31, | Year Ended December 31, | |||||||||||||||||||||||
| 2017 | 2016 | 2015 | 2019 | 2018 | 2017 | |||||||||||||||||||
| Net cash provided by (used) in operating activities | $ | 79,691 | $ | (54,054 | ) | $ | 37,521 | |||||||||||||||||
| Net cash provided by operating activities | $ | 305,463 | $ | 350,311 | $ | 79,691 | ||||||||||||||||||
| Net cash used in investing activities | $ | (250,776 | ) | $ | (227,161 | ) | $ | (26,038 | ) | $ | (114,100 | ) | $ | (297,506 | ) | $ | (250,776 | ) | ||||||
| Net cash provided by (used in) financing activities | $ | 218,122 | $ | 276,633 | $ | (10,518 | ) | $ | (16,746 | ) | $ | (68,554 | ) | $ | 218,122 | |||||||||
Significant sources and uses of cash during 2017the year ended December 31, 2019
Sources of cash:
Operating activities:
| – | Net cash generated by operating activities during the year ended December 31, 2019 of $305.5 million was a result of our thoroughness in receiving collections from our customers and controlling costs. We continue to focus on maintaining operational and spend efficiencies, resulting in positive working capital and net operating cash to support our capital expenditures and other investing activities. |
Uses of cash:
Operating activities:
| – | Net cash used in operating activities for the year ended December 31, 2019, included $61.9 million of merger and integration costs in connection with the C&J Merger. |
Investing activities:
| – | Net cash used in investing activities for the year ended December 31, 2019 consisted primarily of capital expenditures. This activity primarily related to our Completion Services segment. |
Financing activities:
| – | Cash used to repay our debt facilities, excluding leases and interest, during the year ended December 31, 2019 was $3.5 million. |
| – | Cash used to repay our finance leases during the year ended December 31, 2019 was $6.0 million. |
| – | Shares withheld and retired related to stock-based compensation during the year ended December 31, 2019 totaled $6.0 million. |
Significant sources and uses of cash during the year ended December 31, 2018
Sources of cash:
Operating activities:
| – | Net cash generated by operating activities in 2018 of $350.3 million was primarily driven by higher utilization of our combined asset base and increased gross profit in our Completion Services segment. |
Investing activities:
| – | Cash provided by the insurance proceeds received for losses resulting from the July 1, 2018 accidental fire was $18.1 million. For further details see Note (7) Property and Equipment, netof Part II, “Item 8. Financial Statements and Supplementary Data.” |
| – | $4.7 million in proceeds from sales of various assets, including our idle field operations facility in Mathis, Texas, within the Corporate segment, and hydraulic tractors and light general-purpose vehicles within the Completion Services segment. |
Financing activities:
| – | Cash provided by the 2018 Term Loan Facility, net of debt discount, was $348.2 million. |
Uses of cash:
Operating activities:
| – | $13.0 million of transaction costs, including underwriting discounts paid by the Company, primarily incurred to consummate the secondary stock offering completed in January 2018. |
| – | $7.9 million related to the portion of the cash settlement of our RockPile CVR liability that exceeded its acquisition-date fair value, with the remaining $12.0 million of the cash settlement cost reflected in the use of cash in financing activities as described below. |
Investing activities:
| – | Net cash used in investing activities of $297.5 million was primarily associated with our asset acquisition from RSI and our newbuild and maintenance capital spend on active fleets, offset by insurance proceeds and proceeds from various asset sales, as discussed above under “Sources of cash.” This activity primarily related to our Completion Services segment. |
Financing activities:
| – | Cash used to repay our debt facilities, including capital leases but excluding interest, was $289.1 million. |
| – | Cash used to pay debt issuance costs associated with our debt facilities was $7.3 million. |
| – | Shares repurchased and retired related to our stock repurchase program totaled$104.9 million. |
| – | Shares repurchased and retired related to payroll tax withholdings on our share-based compensation totaled $3.6 million. |
| – | $12.0 million related to the portion of the cash settlement of our RockPile CVR liability that was reflective of its acquisition-date fair value. |
Significant sources and uses of cash during the year ended December 31, 2017
Sources of cash:
Operating activities:
| – | Net cash generated by operating activities in 2017 of $79.7 million was primarily driven by higher utilization of our combined asset base and increased gross profit in our Completion Services segment. We also had proceeds of $2.1 million and $4.2 million from the indemnification settlement with Trican and our insurance company related to the acquisition of |
the Acquired Trican Operations. See Note (18) Commitments and ContingenciesofPart II, “Item 8. Financial Statements and Supplementary Data.”
Investing activities:
| – | Total proceeds of $30.6 million from the sale of assets relating to our facilities in Woodward, Oklahoma and Searcy, Arkansas, certain air compressor units, coiled tubing assets and the twelve workover rigs acquired in the acquisition of RockPile. See Note |
Financing activities:
| – | Cash provided from IPO proceeds, $255.5 million. See Note (1)(a) Initial Public Offering ofPart II, |
| – | The 2017 Term Loan Facility, entered into on March 15, 2017, provided for $145.0 million, net of associated origination and other transactions fees. Proceeds received were primarily used to fully repay our Senior Secured Notes. |
| – |
Uses of cash:
Investing activities:
| – | Cash consideration of $116.6 million associated with the acquisition of RockPile, inclusive of a $7.8 million net working capital settlement. |
| – | Cash used for capital expenditures of $164.4 million, associated with maintenance capital spend on active fleets, commissioning costs associated with the deployment of our idle fleets, the newbuild acquired as part of the acquisition of RockPile and deposits on new equipment. This activity primarily related to our Completion Services segment. |
Financing activities: Cash used to repay our debt facilities, including capital leases but excluding interest, in 2017 was $310.8 million. We used a portion of our IPO proceeds and the proceeds of the 2017 Term Loan Facility to repay our 2016 Term Loan Facility and Senior Secured Notes.
Future sources and use of cash
Our primary sources of liquidity have historically included, and we have funded our capital expenditures with, cash flows from operations, proceeds from public offerings of our common stock and borrowings under debt facilities. Our ability to generate future cash flows is subject to a number of variables, many of which are outside of our control, including the drilling, completion and production activity by our customers, which is highly dependent on oil and gas prices. See Part II, “Item 7. Management’s Discussion and Analysis of Financial Condition and Results of Operations - Overview” for additional discussion of certain factors that impact our results and the market challenges within our industry.
Our primary uses of cash are for operating costs, capital expenditures, debt service and our stock repurchase program.
Capital expenditures for 2018 will2020 are projected to be primarily related to maintenance capital spend to support our existing active fleets, wireline trucks, coil units, and the completion of the three newbuild hydraulic fracturing fleets of approximately 150,000 hydraulic horsepower and three wireline spreads, which are anticipated to be delivered in the second and third quarters of 2018. We anticipate our capital expenditures will be funded by cash flows from operations. We currently estimate that our capital expenditures for 2018 will range between $230.0 million and $240.0 million.cementing units.
Debt service for the twelve months periodyear ended December 31, 20182020 is projected to be $31.5 million.$30.9 million, of which $3.5 million is related to capital leases. We anticipate our debt service will be funded by cash flows from operations.
On February 26, 2018, weDecember 11, 2019, the Company announced that our Boardthe board of Directors has authorizeddirectors approved a new $100 million capital return program, which includes a $50 million stock repurchase program through December 2020. No share repurchases were made under the share repurchase program in 2019. Although our board of up to $100.0 million ofdirectors has approved a share repurchase program, the Company’s outstanding common stock, with the intent of returning value to our shareholders as we continue to expect further growth and profitability. The duration of the stock buy-back program will be 12 months. Theshare repurchase program does not obligate us to purchaserepurchase any particularspecific dollar amount or to acquire any specific number of sharesshares. The timing and amount of repurchases, if any, will depend upon several factors, including market and business conditions, the trading price of our common stock during any period, and the nature of other investment opportunities. The repurchase program may be modifiedlimited, suspended or suspendeddiscontinued at any time at our discretion.without prior notice. We anticipate any share repurchases will be funded by cash flows from operations.
Other factors affecting liquidity
Financial position in current market. As of December 31, 2017,2019, we had $96.1$255.0 million of cash and a total of $199.7$303.8 million available under our revolving credit facility. Furthermore, we have no material adverse change provisions in our bank agreements, and our debt maturities extend over a long period of time. We currently believe that our cash on hand, cash flow generated from operations and availability under our revolving credit facility will provide sufficient liquidity for at least the next 12 months, including for capital expenditures, debt service, working capital investments contingent liabilities and stock repurchase.repurchases.
Guarantee agreements. In Under the normal course of business, we have agreements with a financial institution under which $2.02019 ABL Facility $31.8 million of letters of credit were outstanding as of December 31, 2017.2019.
Customer receivables. In line with industry practice, we bill our customers for our services in arrears and are, therefore, subject to our customers delaying or failing to pay our invoices. The majority of our trade receivables have payment terms of 30 days or less. In weak economic environments, we may experience increased delays and failures to pay our invoices due to, among other reasons, a reduction in our customers’ cash flow from operations and their access to the credit markets, as well as unsettled political conditions.markets. If our customers delay paying or fail to pay us a significant amount of our outstanding receivables, it could have a material adverse effect on our liquidity, consolidated results of operations and consolidated financial condition.
Contractual Obligations
In the normal course of business, we enter into various contractual obligations that impact or could impact our liquidity. The table below contains our known contractual commitments as of December 31, 2017.2019.
(Thousands of Dollars) Contractual obligations | Total | 2018 | 2019-2021 | 2022-2024 | 2025+ | Total | 2020 | 2021-2022 | 2023-2024 | 2025+ | ||||||||||||||||||||||||||||||
Long-term debt, including current portion(1) | $ | 283,200 | $ | 2,850 | $ | 8,550 | $ | 271,800 | $ | — | $ | 344,750 | $ | 3,500 | $ | 7,000 | $ | 7,000 | $ | 327,250 | ||||||||||||||||||||
Estimated interest payments(2) | 108,841 | 23,559 | 70,726 | 14,556 | — | 115,729 | 22,262 | 43,572 | 42,031 | 7,864 | ||||||||||||||||||||||||||||||
Capital lease obligations(3) | 8,518 | 3,633 | 4,885 | — | — | |||||||||||||||||||||||||||||||||||
Finance lease obligations(3) | 10,061 | 4,977 | 4,811 | 273 | — | |||||||||||||||||||||||||||||||||||
Operating lease obligations(4) | 47,572 | 16,173 | 26,608 | 4,791 | — | 68,344 | 26,068 | 22,096 | 9,259 | 10,921 | ||||||||||||||||||||||||||||||
Purchase commitments(5) | 211,957 | 133,070 | 78,887 | — | — | 119,710 | 93,985 | 24,225 | 1,500 | — | ||||||||||||||||||||||||||||||
| Equity method investment | 1,138 | 1,138 | — | — | — | |||||||||||||||||||||||||||||||||||
Equity-method investment(6) | 1,302 | 1,302 | — | — | — | |||||||||||||||||||||||||||||||||||
| Legal contingency | 4,250 | 4,250 | — | — | — | 10,059 | 10,059 | — | — | — | ||||||||||||||||||||||||||||||
| $ | 665,476 | $ | 184,673 | $ | 189,656 | $ | 291,147 | $ | — | $ | 669,955 | $ | 162,153 | $ | 101,704 | $ | 60,063 | $ | 346,035 | |||||||||||||||||||||
| (1) | Long-term debt |
| (2) | Estimated interest payments are based on debt balances outstanding as of December 31, |
| (3) |
| (4) | Operating lease obligations are related to our real estate, rail cars, and light duty |
| (5) | Purchase commitments primarily relate to our agreements with vendors for sand purchases and deposits on equipment. The purchase commitments to sand suppliers represent our annual obligations to purchase a minimum amount of sand from vendors. If the minimum purchase requirement is not met, the shortfall at the end of the year is settled in cash or, in some cases, carried forward to the next year. |
| (6) | Equity-method investment is related to our research and development commitments with our equity-method investee. See Notes (18) Commitments and Contingencies and (19) Related Party Transactions of Part II, “Item 8. Financial Statements and Supplementary Data” for further details. |
.
Principal Debt Agreements
Origination. On the October 31, 2019, we, and certain of our other subsidiaries as additional borrowers and guarantors, entered into a Second Amended and Restated Asset-Based Revolving Credit Agreement (the “2019 ABL Facility”) to the original Asset-Based Revolving Credit Agreement, dated as of February 17, 2017, Keane Group Holdings, LLC, Keane Frac, LP and KS Drilling, LLC (together with Keane Group Holdings, LLC, Keane Frac, LP and each other person that becomes an ABL Borrower under theas amended December 22, 2017 ABL Facility (as defined herein) in accordance with the terms thereof, collectively, the “ABL Borrowers”) and the ABL Guarantors (as defined below) entered into an asset-based revolving credit agreement (the “February 2017 ABL Facility”) with each lender from time to time party thereto (the “2017 ABL Lenders”Facility”) and Bank of America, N.A., as administrative agent and collateral agent. The following is a summary of the material provisions of the 2017 ABL Facility. It does not include all of the provisions of the 2017.
Structure. Our 2019 ABL Facility does not purport to be complete and is qualified in its entirety by reference to the 2017 ABL Facility described.
Maturity. The loans arising under the initial commitments under the 20172019 ABL Facility mature on December 22, 2022.October 31, 2024. The loans arising under any tranche of extended loans or additional commitments mature as specified in the applicable extension amendment or increase joinder, respectively.
average excess availability is greater than or equal to 33% but less than 66%, 0.75% or (z) if the average excess availability is greater than or equal to 66%, 0.50%, or (b) the adjusted London Interbank Offered Rate (“LIBOR”)LIBOR rate for such interest period, plus an applicable margin equal to (x) if the average excess availability is less than 33%, 2.00%, (y) if the average excess availability is greater than or equal to 33% but less than 66%, 1.75% or (z) if the average excess availability is greater than or equal to 66%, 1.50%. The, to a rate per annum equal to, at Keane Group Holdings, LLC’s option, (a) the base rate, plus an applicable margin equal to (x) if the average excess availability is set onless than 33%, 0.75%, (y) if the first day of each full fiscal quarter ending after December, 22, 2017. On or after June 22, 2018, at any time when Consolidated EBITDA (as defined herein) as of the then most recently ended four fiscal quarters for which financial statements are required to be deliveredaverage excess availability is greater than or equal to $250.0 million,33% but less than 66%, 0.50% or (z) if the average excess availability is greater than or equal to 66%, 0.25%, or (b) the adjusted LIBOR rate for such interest period, plus an applicable margin will be reduced by 0.25%; provided thatequal to (x) if Consolidated EBITDAthe average excess availability is less than $250.0 million as of a later four consecutive fiscal quarters,33%, 1.75%, (y) if the applicable margin will revertaverage excess availability is greater than or equal to 33% but less than 66%, 1.50% or (z) if the levels set forth above.average excess availability is greater than or equal to 66%, 1.25%.
On March 15, 2017,May 25, 2018, Keane Group Keane Frac, LP and KS Drilling, LLC (together with Keane Group, Keane Frac, LP and each other person that becomes a New Term Loan Borrower under the New Term Loan Facility in accordance with the terms thereof, collectively, the “New Term Loan Borrowers”) and the New2018 Term Loan Guarantors (as defined below) entered into a term loan facility (the “2017the 2018 Term Loan Facility”)Facility with each lender from time to time party thereto and Owl Rock, as administrative agent and collateral agent. On the RockPile Closing Date, the New Term Loan Borrowers and the New Term Loan Guarantors (as defined below) entered in an incremental term loan facility (the “Incremental Term Loan Facility” and, together with the 2017 Term Loan Facility, collectively, the “New Term Loan Facility”) with each of the incremental lenders party thereto, each of the existing lenders party thereto and Owl Rock,Barclays Bank PLC, as administrative agent and collateral agent. The following is a summaryproceeds of the material provisions of the New Term Loan Facility. It does not include all of the provisions of the New2018 Term Loan Facility does not purportwere used to be completerefinance Keane Group’s then-existing term loan facility and is qualified in its entirety by reference to repay related fees and expenses, with the New Term Loan Facility described.excess proceeds to fund general corporate purposes.
Structure. The 20172018 Term Loan Facility provides for a $150.0 million initial term loan facility andin an initial aggregate principal amount of $350.0 million (the loans incurred under the Incremental2018 Term Loan Facility, provides for a $135.0the “2018 Term Loans”). As of December 31, 2019, there was $337.6 million incremental term loan facility (collectively, the “Term Loans”).principal amount of 2018 Term Loans outstanding. In addition, subject to certain customary conditions, as of July 3, 2017, the New2018 Term Loan Facility allows for additional incremental term loans to be incurred thereunder in an amount equal to the sum of (a) $50.0$200.0 million plus the aggregate principal amount of voluntary prepayments of 2018 Term Loans made on or prior to the date of determination (less certain amounts incurred in connection with permitted notes and subordinated indebtedness)reliance on the capacity described in this subclause (a)), plus (b) an unlimited amount, subject to, (x) in the case of subclause (b),debt secured on a pari passu basis with the 2018 Term Loans, immediately after giving effect thereto,to the incurrence thereof, a first lien net leverage ratio being less than or equal to 2.00:1.00, (y) in the case of debt secured on a junior basis with the 2018 Term Loans, immediately after giving effect to the incurrence thereof, a secured net leverage ratio being less than or equal to 3.00:1.00 and (z) in the case of unsecured debt, immediately after giving effect to the incurrence thereof, a total net leverage ratio being less than 1.75:or equal to 3.50:1.00.
Maturity. August 18, 2022May 25, 2025 or, if earlier, the stated maturity date of any other term loans or term commitments.
Amortization. The loans under the 20172018 Term Loan FacilityLoans amortize in quarterly installments equal to 1.00% per annum of the aggregate principal amount of all initial term loans outstanding, commencing with June 30, 2017. outstanding.
Interest. The loans under the Incremental Term Loan Facility amortize in quarterly installments equal to (a) the aggregate original principal amount of the loans under the Incremental Term Loan Facility, times (b) the ratio of (x) the amount of all loans under the 2017 Term Loan Facility that are being repaid on such date to (y) the total aggregate principal amount of all loans under the 2017 Term Loan Facility that remained outstanding as of the RockPile Closing Date, but giving pro forma effect to the amortization payment to be made on June 30, 2017, commencing with September 30, 2017.
Prepayments. The New2018 Term Loan Facility is required to be prepaid with: (a) 100% of the net cash proceeds of certain asset sales, casualty events and other dispositions, subject to the terms of an intercreditor
agreement between the agent for the New2018 Term Loan Facility and the agent for the 20172019 ABL Facility and certain exceptions; (b) 100% of the net cash proceeds of debt incurrences or issuances (other than debt incurrences permitted under the New2018 Term Loan Agreement)Facility, which exclusion is not applicable to permitted refinancing debt) and (c) 50% (subject to step-downs to zero, in accordance with the Total Net Leverage Ratio (as defined below)25% and 0%, upon and during achievement of certain total net leverage ratios) of excess cash flow in excess of a certain amount, minus certain voluntary prepayments made under the New2018 Term Loan Facility or other debt secured on a pari passu basis with the 2018 Term Loans and all voluntary prepayments of loans under the 20172019 ABL Facility to the extent the commitments under the 20172019 ABL Facility are permanently reduced by such prepayments.
Guarantees. Subject to certain exceptions as set forth in the definitive documentation for the New2018 Term Loan Facility, the amounts outstanding under the New2018 Term Loan Facility are guaranteed by KGI,the Company, Keane Frac, LP, KS Drilling, LLC, KGH Intermediate Holdco I, LLC, KGH Intermediate Holdco II, LLC, and Keane Frac GP, LLC, each New Term Loan Borrower (other than with respect to its own obligations) and each subsidiary of KGIthe Company that will be required to execute and deliver a facility guaranty after March 15, 2017in the future pursuant to the terms of the 2018 Term Loan Facility (collectively, the “New“2018 Term Loan Guarantors”).
Security. Subject to certain exceptions as set forth in the definitive documentation for the New2018 Term Loan Facility, the obligations under the New2018 Term Loan Facility are secured by (a) a first-priority security interest in and lien on substantially all of the assets of the New Term Loan BorrowersKeane Group and the New2018 Term Loan Guarantors to the extent not constituting 2017 ABL Facility Priority Collateral (as defined below) and (b) a second-priority security interest in and lien on substantially all of the 2017accounts receivable, inventory, and frac iron equipment, and certain other assets and property related to the foregoing including certain chattel paper, investment property, documents, letter of credit rights, payment intangibles, general intangibles, commercial tort claims, books and records and supporting obligations of the borrowers and guarantors under the 2019 ABL Facility (the “ABL Facility Priority Collateral.Collateral”).
Fees. Certain customary fees are payable to the lenders and the agents under the New2018 Term Loan Facility.
Restricted Payment Covenant. The New2018 Term Loan Facility includes a covenant restricting ourthe ability of the Company and its restricted subsidiaries to pay dividends and make certain other restricted payments, subject to certain exceptions. The New2018 Term Loan Facility provides that KGIthe Company and its restricted subsidiaries may, among things, make cash dividends and other restricted payments in an aggregate amount during the life of the facility not to exceed $25.0(a) $100.0 million, (subject to reduction based on certain outstanding investments and prepaymentsplus (b) the amount of indebtedness) duringnet proceeds received by Keane Group from the termfunding of the facility. If2018 Term Loans in excess of the pro forma Total Net Leverage Ratio (as defined below) is no greater than 3.0of such net proceeds required to 1.0finance the refinancing of the pre-existing term loan facility and pay fees and expenses related thereto and to the entry into the 2018 Term Loan Facility, plus (c) an unlimited amount so long as, after giving effect to such restricted payment, we can also pay dividends orthe total net leverage ratio would not exceed 2.00:1.00. In addition, the Company and its restricted subsidiaries may make other restricted payments up to the amount ofutilizing the Cumulative Credit (as defined below). Both of these exceptions are also, subject to certain conditions including, if any portion of the requirements that thereCumulative Credit utilized is comprised of amounts under clause (b) of the definition thereof below, the pro forma total net leverage ratio being no event of default and that we have unrestricted cash plus loan availability under the 2017 ABL Facility of at least $35.0 million after the making of any cash dividend or other restricted payment.
“Cumulative Credit”, generally, is defined as an amount equal to (a) $25.0 million, (b) 50% of consolidated net income of the excess cash flowCompany and its restricted subsidiaries on a cumulative basis from April 1, 2018 (which cumulative amount shall not required to repay the Term Loansbe less than zero), plus (c) other customary additions, and reduced by the amount of Cumulative Credit used prior to such time. However,time (whether for so long as the Total Net Leverage Ratio is less than 1.75:1:00 after giving effect to any proposed restricted payments, the amount of Cumulative Credit is unlimited.junior debt payments or investments).
Affirmative and Negative Covenants. The New2018 Term Loan Facility contains various affirmative and negative covenants (in each case, subject to customary exceptions as set forth in the definitive documentation for the New2018 Term Loan Facility).
Events of Default.The New2018 Term Loan Facility contains customary events of default (subject to exceptions, thresholds and grace periods as set forth in the definitive documentation for the New2018 Term Loan Facility).
Off-Balance Sheet Arrangements
Related Party Transactions
Our board of directors has adopted a written policy and procedures (the “Related Party Policy”) for the review, approval and ratification of the related party transactions by the independent members of the audit and risk committee of our board of directors. For purposes of the Related Party Policy, a “Related Party Transaction” is any transaction, arrangement or relationship or series of similar transactions, arrangements or relationships (including the incurrence or issuance of any indebtedness or the guarantee of indebtedness) in which (1) the aggregate amount involved will or may be reasonably expected to exceed $120,000 in any fiscal year, (2) the company or any of its subsidiaries is a participant, and (3) any Related Party (as defined herein) has or will have a direct or indirect material interest. All Related Party Transactions will be reviewed in accordance with the standards set forth in the Related Party Policy after full disclosure of the Related Party’s interests in the transaction.
The Related Party Policy defines “Related Party” as any person who is, or, at any time since the beginning of the company’sCompany’s last fiscal year, was (1) an executive officer, director or nominee for election as a director of the companyCompany or any of its subsidiaries, (2) a person with greater than five percent (5%) beneficial interest in the company,Company, (3) an immediate family member of any of the individuals or entities identified in (1) or (2) of this paragraph, and (4) any firm, corporation or other entity in which any of the foregoing individuals or entities is employed or is a general partner or principal or in a similar position or in which such person or entity has a five percent (5%) or greater beneficial interest. Immediate family members (each, a “Family Member”) includes a person’s spouse, parents, stepparents, children, stepchildren, siblings, mothers- and fathers-in-law, sons- and daughters-in-law, brothers- and sisters-in-law and anyone residing in such person’s home, other than a tenant or employee.
Transaction prices with our related parties are commensurate with transaction prices in arms-length transactions. For further details about our transactions with Related Parties, see Note (19) Related Party Transactionsof Part II, “Item 8. Financial Statements and Supplementary Data"Data.”
Recently Issued Accounting Standards
For discussion on the impact of accounting standards issued but not yet adopted to our consolidated and combined financial statements, see Note (23) New Accounting Pronouncementsof Part II, “Item 13. "Certain Relationships8. Financial Statements and Related-Party Transactions and Director Independence."
Supplementary Data.”
Critical Accounting Policies and Estimates
The preparation of our consolidated and combined financial statements and related notes to the consolidated and combined financial statements included within Part II, “Item 8. Financial Statements and Supplementary Data” requires us to make estimates that affect the reported amounts of assets, liabilities, revenue and expenses and related disclosures of contingent assets and liabilities. We base these estimates on historical results and various other assumptions believed to be reasonable, all of which form the basis for making estimates concerning the carrying values of assets and liabilities that are not readily available from other sources. Actual results may differ from these estimates.
A critical accounting estimate is one that requires a high level of subjective judgment by management and has a material impact to our financial condition or results of operations. We believe the following are the critical accounting policies used in the preparation of our consolidated and combined financial statements, as well as the significant estimates and judgments affecting the application of these policies. This discussion and analysis should be read in conjunction with our consolidationconsolidated and combined financial statements and related notes included within Part II, “Item 8. Financial Statements and Supplementary Data.”
Business combinations
We allocate the purchase price of businesses we acquire to the identifiable assets acquired and liabilities assumed based on their estimated fair values. Any excess purchase price over the fair value of the net identifiable assets acquired is recorded as goodwill. We use all available information to estimate fair values, including quoted market prices, the carrying value of acquired assets and assumed liabilities and valuation techniques such as discounted cash flows, multi-period excess earning or income-based-relief-from-royalty methods. We engage third-party appraisal firms to assist in the fair value determination of inventories, identifiable long-lived assets, identifiable intangible assets, as well as any contingent consideration or earn-out provisions that provide for additional consideration to be paid to the seller if certain future conditions are met. These estimates are reviewed during the 12-month measurement period and adjusted based on actual results. The judgments made in determining the estimated fair value assigned to each class of assets acquired and liabilities assumed, as well as asset lives, can materially impact our financial condition or results of operations. See Note (3) Mergers and Acquisitions of Part II, "“Item 8. Financial Statements and Supplementary Data"Data” for further discussion onof our recently completed merger and acquisition during 2019 and 2017, respectively.
Asset acquisitions
Asset acquisitions duringare measured based on their cost to us, including transaction costs incurred by us. An asset acquisition’s cost or the years ended December 31, 2017consideration transferred by us is assumed to be equal to the fair value of the net assets acquired. If the consideration transferred is cash, measurement is based on the amount of cash we paid to the seller, as well as transaction costs incurred by us. Consideration given in the form of nonmonetary assets, liabilities incurred or equity interests issued is measured based on either the cost to us or the fair value of the assets or net assets acquired, whichever is more clearly evident. The cost of an asset acquisition is allocated to the assets acquired based on their estimated relative fair values. We engage third-party appraisal firms to assist in the fair value determination of inventories, identifiable long-lived assets and 2016identifiable intangible assets. Goodwill is not recognized in an asset acquisition. See Note (3) Mergers and Acquisitions of Part II, “Item 8. Financial Statements and Supplementary Data” for our asset acquisition from RSI in 2018.
Legal and environmental contingencies
From time to time, we are subject to legal and administrative proceedings, settlements, investigations, claims and actions, as is typical of the industry. These claims include, but are not limited to, contract claims, environmental claims, employment related claims, claims alleging injury or claims related to operational issues. Our assessment of the likely outcome of litigation matters is based on our judgment of a number of factors, including experience with similar matters, past history, precedents, relevant financial information and other evidence and facts specific to the matter. We accrue for contingencies wherewhen the occurrence of a material loss is probable and can be reasonably estimated, based on our best estimate of the expected liability. The estimate of probable costs related to a contingency is developed in consultation with internal and outside legal counsel representing us. The accuracy of these estimates is impacted by, among other things, the complexity of the issues and the amount of due diligence we have been able to perform. Differences between the actual settlement costs, final judgments or fines from our estimates could have a material adverse effect on our financial position or results of operations. See Note (18) Commitments and Contingenciesof Part II, "“Item 8. Financial Statements and Supplementary Data"Data” for further discussion of our legal, environmental and other regulatory contingencies for the years ended December 31, 2017, 2016 and 2015.contingencies.
Valuation of long-lived assets, indefinite-lived assets and goodwill
We assess our long-lived assets, such as definite-lived intangible assets and property and equipment, for impairment whenever events or circumstances indicate that the carrying amount of an asset may not be recoverable.
We assess our goodwill and indefinite-lived assets for impairment annually, as of October 31, or whenever events or circumstances indicate that the carrying amount of goodwill or the indefinite-lived assets may not be recoverable. If the carrying value of an asset exceeds its fair value, we record an impairment charge that reduces our earnings.
We perform our qualitative assessments of the likelihood of impairment by considering qualitative factors relevant to each of our reporting segments, such as macroeconomic, industry, market or any other factors that have a significant bearing on fair value. The expected future cash flows used for impairment reviews and related fair value
calculations are based on subjective, judgmental assessments of projected revenue growth, fleet count, utilization, gross margin rates, SG&A rates, working capital fluctuations, capital expenditures, discount rates and terminal growth rates. Many of these judgments are driven by crude oil prices. If the crude oil market declines and remains at low levels for a sustained period of time, we would expect to perform our impairment assessments more frequently and could record impairment charges.
See Note (2)(j)(h)Goodwill and Indefinite-Lived Intangible Assetsand (2)(k)(i)Long-Lived Assets with Definite Lives of Part II, "“Item 8. Financial Statements and Supplementary Data"Data” for further discussion on our impairment assessments of our long-lived assets, indefinite-lived assets and goodwill for the years ended December 31, 20172019, 20162018 and 20152017.
Well Construction and Intervention Services
The core services provided through our Well Construction and Intervention Services segment are cementing and coiled tubing services. The majority of revenue for this segment is generated by our cementing business. As of December 31, 2019, we had approximately 25 coiled tubing units and 101 cementing units capable of being deployed.
Well Support Services
Our Well Support Services segment was divested in accordancea transaction that closed on March 9, 2020. It focused on post-completion activities at the well site, including rig services, such as workover and plug and abandonment, fluids management services, and other specialty well site services. Since early 2017, in response to the highly competitive landscape and reflecting our returns-focused strategy, we had focused on operational rightsizing measures to better align these businesses with ASC 740, “Income Taxes,”current market conditions. This strategy resulted in closing facilities and idling unproductive equipment. For example, we either sold or shut down numerous businesses or asset packages, which requires an assetincluded the divestiture of the majority of our fluids management assets in both West and liability approach for financial accounting and reporting of income taxes. Under ASC 740, income taxes are accounted for based upon the future tax consequences attributable to differences between the financial statement carrying amounts of existing assets and liabilities and their respective tax basis and operating loss carry-forwards using enacted tax rates in effectSouth Texas in the yearthird quarter of 2019. As of December 31, 2019, we had approximately 276 workover rigs and 348 fluids management trucks capable of being deployed. The majority of revenue for this segment is generated by our rig services business, and we consider rig services and fluids management to be the differencesprimary businesses within this segment.
How we calculate utilization for each segment
Our management team monitors asset utilization, among other factors, for purposes of assessing our overall activity levels and customer demand. For our Completion Services segment, asset utilization levels for our own fleets is defined as the ratio of the average number of deployed fleets to the number of total fleets for a given time period. We define active fleets as fleets available for deployment; we consider one of our fleets deployed if the fleet has been put in service at least one day during the period for which we calculate utilization; and we define fully-
utilized fleets per month as fleets that were deployed and working with our customers for a significant portion of a given month. As a result, as additional fleets are expectedincrementally deployed, our utilization rate increases. We define industry utilization of fracturing assets as the ratio of the total industry demand of hydraulic horsepower to reverse.the total available capacity of hydraulic horsepower, in each case as reported by an independent industry source. Our method for calculating the utilization rate for our own fracturing fleets or the industry may differ from the method used by other companies or industry sources which could, for example, be based off a ratio of the total number of days a fleet is put in service to the total number of days in the relevant period. We estimatebelieve that our annual effective tax rate at each interim periodmeasures of utilization, based on the factsnumber of deployed fleets, provide an accurate representation of existing, available capacity for additional revenue generating activity.
In our Well Construction and circumstancesIntervention Services segment, we measure our asset utilization levels for our cementing business primarily by the total number of days that our asset base works on a monthly basis, based on the available at that time, whileworking days per month. In our coiled tubing business, we measure certain asset utilization levels by the actual effective tax rate is calculated at year-end. Our effective tax rates will vary duehour to changes in estimatesbetter understand measures between daylight and 24-hour operations. Both the financial and operating performance of our future taxable income or losses, fluctuationscoiled tubing and cement units can vary in revenue and profitability from job to job depending on the type of service to be performed and the equipment, personnel and consumables required for the job, as well as competitive factors and market conditions in the tax jurisdictionsregion in which the services are performed.
In our Well Support Services segment, we operatemeasured asset utilization levels primarily by the number of hours our assets work on a monthly basis, based on the available working days per month.
Our operating strategy is focused on maintaining high asset utilization levels to maximize revenue generation while controlling costs to gain a competitive advantage and favorable or unfavorable adjustmentsdrive returns. We believe that the safety, quality and efficiency of our service execution and our alignment with customers who recognize the value that we provide are central to our estimated tax liabilities relatedefforts to proposed or probable assessments. As a result,support utilization and grow our effective tax rate may fluctuate significantly on a quarterly or annual basis.
RESULTS OF OPERATIONS
The following table sets forth our financial results for the contractual commitments and obligations table as ofyear ended December 31, 2017.
A comparison of our financial results for the year periodended December 31, 2018 and for the year ended December 31, 2017 and the related notes (collectively, the consolidated and combined financial statements). In our opinion, the consolidated and combined financial statements present fairly, in all material respects, the financial position of the Company as of December 31, 2017 and 2016, and the results of its operations and its cash flows for each of the yearscan be found in the three‑"Item 7. Management's Discussion and Analysis of Financial Condition and Results of Operations - Results of Operations" section in our Annual Report on Form 10-K for the fiscal year period ended December 31, 2017,2018, filed on February 27, 2019.
Year Ended December 31, 2019 Compared with Year Ended December 31, 2018
| Year Ended December 31, | |||||||||||||||||||||
| (Thousands of Dollars) | As a % of Revenue | Variance | |||||||||||||||||||
| Description | 2019 | 2018 | 2019 | 2018 | $ | % | |||||||||||||||
| Completion Services | $ | 1,709,934 | $ | 2,100,956 | 94 | % | 98 | % | $ | (391,022 | ) | (19 | %) | ||||||||
| Well Construction and Intervention Services | 63,039 | 36,050 | 3 | % | 2 | % | 26,989 | 75 | % | ||||||||||||
| Well Support Services | 48,583 | — | 3 | % | 0 | % | 48,583 | 0 | % | ||||||||||||
| Revenue | 1,821,556 | 2,137,006 | 100 | % | 100 | % | (315,450 | ) | (15 | %) | |||||||||||
| Completion Services | 1,308,089 | 1,622,106 | 72 | % | 76 | % | (314,017 | ) | (19 | %) | |||||||||||
| Well Construction and Intervention Services | 55,227 | 38,440 | 3 | % | 2 | % | 16,787 | 44 | % | ||||||||||||
| Well Support Services | 40,616 | — | 2 | % | 0 | % | 40,616 | 0 | % | ||||||||||||
| Costs of services | 1,403,932 | 1,660,546 | 77 | % | 78 | % | (256,614 | ) | (15 | %) | |||||||||||
| Depreciation and amortization | 292,150 | 259,145 | 16 | % | 12 | % | 33,005 | 13 | % | ||||||||||||
| Selling, general and administrative expenses | 123,676 | 113,810 | 7 | % | 5 | % | 9,866 | 9 | % | ||||||||||||
| Merger and integration | 68,731 | 448 | 4 | % | 0 | % | 68,283 | 15,242 | % | ||||||||||||
| (Gain) loss on disposal of assets | 4,470 | 5,047 | 0 | % | 0 | % | (577 | ) | (11 | %) | |||||||||||
| Impairment | 12,346 | — | 1 | % | 0 | % | 12,346 | 0 | % | ||||||||||||
| Operating income | (83,749 | ) | 98,010 | (5 | %) | 5 | % | (181,759 | ) | (185 | %) | ||||||||||
| Other income (expense), net | 453 | (905 | ) | 0 | % | 0 | % | 1,358 | (150 | %) | |||||||||||
| Interest expense | (21,856 | ) | (33,504 | ) | (1 | %) | (2 | %) | 11,648 | (35 | %) | ||||||||||
| Total other expenses | (21,403 | ) | (34,409 | ) | (1 | %) | (2 | %) | 13,006 | (38 | %) | ||||||||||
| Income tax expense | (1,005 | ) | (4,270 | ) | 0 | % | 0 | % | 3,265 | (76 | %) | ||||||||||
| Net income (loss) | $ | (106,157 | ) | $ | 59,331 | (6 | %) | 3 | % | $ | (165,488 | ) | (279 | %) | |||||||
Revenue. Total revenue is comprised of revenue from our Completion Services, Well Construction and Intervention Services and Well Support Services segments. Revenue in conformity2019 decreased by$315.5 million, or 15%, to $1.8 billion from $2.1 billion in 2018. The net decline was driven primarily by a decrease in rig count and fleet utilization, combined with U.S. generally accepted accounting principles.pricing pressures from macroeconomic market conditions. This decrease in utilization was primarily from our customers shifting their focus to capital discipline through reduced activity levels and pricing. Despite pricing pressures, we retained our core customer base by aligning with high quality and efficient customers under dedicated agreements. This change in revenue by reportable segment is discussed below.
Well Construction and combined financial statements areIntervention: Well Construction and Intervention Services segment revenue increased by $27.0 million, or 75%, to $63.0 million in 2019 from $36.1 million in 2018. This increase in revenue was primarily attributable to the responsibilityC&J Merger.
Well Support Services: Well Support Services segment revenue was $48.6 million in 2019 with no comparison period in 2018. This increase in revenue was solely attributable to the acquisition of the Company’s management.segment through the C&J Merger.
Cost of services. Cost of services in 2019 decreased by $256.6 million, or 15%, to $1.4 billion from $1.7 billion in 2018. This change was driven by several factors including lower overall activity and fleet utilization, as discussed above under Revenue, in addition to the impact of cost optimization from cost management efforts and input cost deflation.
Equipment Utilization. Depreciation and amortization expense increased by $33.0 million, or 13%, to $292.2 million in 2019 from $259.1 million in 2018. The change in depreciation and amortization was primarily related to additional equipment purchases from the RSI Acquisition in late 2018, maintenance spend for fleet readiness, and other equipment used for continuing to enhance safety and efficiency through our multi-faceted approach of surface, digital and downhole technologies. Loss on disposal of assets in 2019 decreased by $0.6 million, to a loss of $4.5 million in 2019 from a loss of $5.0 million in 2018. The decrease in loss on disposal of assets is primarily related to a larger number of early failures of major components in 2018 compared to 2019, primarily due to higher activity and use of equipment in 2018.
Selling, general and administrative expense. Selling, general and administrative (“SG&A”) expense, which represents costs associated with managing and supporting our operations, increased by $9.9 million, or 9%, to $123.7 million in 2019 from $113.8 million in 2018. This change in SG&A was primarily related to non-cash compensation expense of $19.4 million and litigation contingencies of $3.8 million.
Merger and integration expense. Merger and integration expense increased by $68.3 million to $68.7 million in 2019 from $0.4 million in 2018. The $68.7 million in merger and integration expense in 2019 was due to the C&J Merger, which consisted primarily of professional services, severance costs, and facility consolidation. The $0.4 million in 2018 is related to transaction cost associated with the RSI Acquisition.
Other income (expense), net. Other income (expense), net, in 2019 increased by $1.4 million, or 150%, to income of $0.5 million in 2019 from expense of $0.9 million in 2018. In 2018, other expense, net was primarily due to a $13.2 million adjustment to our Rockpile CVR liability, $2.7 million loss on foreign currency related to the wind-down of the Canadian entity, offset by a $14.9 million gain on the insurance proceeds received for losses resulting from the July 1, 2018 accidental fire.
Interest expense, net. Interest expense, net of interest income, decreased by $11.6 million, or 35%, to $21.9 million in 2019 from $33.5 million in 2018. This change was primarily attributable to the $7.6 million write-offs of deferred financing costs in 2018, in connection with the debt extinguishment of our 2017 Term Loan Facility.
Effective tax rate. Upon consummation of the IPO, the Company became a corporation subject to federal income taxes. Our responsibilityeffective tax rate on continuing operations in 2019 was (0.96)%, as compared to 6.71% in 2018. For 2019, the effective rate is primarily made up of state taxes and a tax benefit derived from the current period operating loss offset by a valuation allowance. For 2018, the effective rate was primarily made up of state taxes and tax benefits derived from the current period operating income offset by a valuation allowance. As a result of market conditions and their corresponding impact on our business outlook, we determined that a valuation allowance was appropriate as it is not more likely than not that we will utilize our net deferred tax assets. The remaining tax impact not offset by a valuation allowance is related to indefinite-lived assets.
Industry Drivers of 2019 Operations
Between January and April 2019, the increase in oil prices incentivized many of our customers to significantly increase activity levels early in 2019. This resulted in E&P capital budget exhaustion and early
achievement of E&P production targets, and in combination with normal year-end seasonality, resulted in softening demand for completions services by the fourth quarter of 2019. In addition, lackluster oil and gas prices in 2019 resulted in the E&P budgeting process to be more muted, causing many E&P companies to delay activity start-up into early 2020. Furthermore, the current market oversupply of fracturing equipment created a competitive pricing environment at year-end 2019 during E&P budgeting season, which resulted in pricing pressure in order win new work or extend existing dedicated agreements that were up for renewal. With that said, most of our customers see value in a long-term partnership with us, and as a result, traded some price concessions by us for extended terms or additional work scope.
We are committed to continuing to manage our business in line with demand for our services and make adjustments as necessary to effectively respond to changes in market conditions, customer activity levels, pricing for our services and equipment, and utilization of our deployed equipment and personnel. Our response to the industry's persistent uncertainty is to express an opinionmaintain sufficient liquidity, preserve our conservative capital structure and closely monitor our discretionary spending. We take a measured approach to asset deployment, balancing our view of current and expected customer activity levels with a focus on generating positive returns for our shareholders. Our priorities remain to drive revenue by maximizing deployed equipment utilization, to improve margins through cost controls, to protect and grow our market share by focusing on the quality, safety and efficiency of our service execution, and to ensure that we are strategically positioned to capitalize on constructive market dynamics.
Looking Ahead to 2020
We face many challenges and risks in the industry in which we operate. Although many factors contributing to these consolidatedrisks are beyond our ability to control, we continuously monitor these risks and combined financial statements basedhave taken steps to mitigate them to the extent practicable. In addition, while we believe that we are well positioned to capitalize on available growth opportunities, we may not be able to achieve our audits.business objectives and, consequently, our results of operations may be adversely affected. Please read the factors described in the sections titled “Cautionary Note Regarding Forward-Looking Statements” and “Risk Factors” in Part I, Item 1A of this Annual Report for additional information about the known material risks that we face.
Fiscal 2020 Objectives
With recent commodity price volatility, we intend to closely monitor the market and will adjust our approach as the situation develops. At this time, in 2020, our principal business objective continues to be growing our business and safely providing best-in-class services in all of our operating segments, while delivering shareholder value and maintaining a disciplined capital deployment strategy. We expect to achieve our objective through:
partnering and growing with well-capitalized customers under dedicated agreements who focus their efforts on safety, high-efficiency completions, continuous improvement and innovation;
allocating our assets to maximize utilization and returns, including diversification of geographies and commodities;
maximizing profitability of fully-utilized fleets through leading-edge pricing and efficiencies;
investing in technology to further drive efficiencies, enable differentiation of service offerings, and reduce our overall cost structure;
leveraging our flexible and scalable logistics infrastructure to provide assurance of supply at lowest landed cost;
leveraging our platform to identify, retain and promote talent to sustain growth and support operational and commercial excellence; maintaining agreements with our existing strategic suppliers and identify and develop relationships with additional strategic suppliers to ensure continuity of supply and optimize efficiency;
maintaining our conservative and flexible capital position, supporting continued growth and maintenance of active equipment;
gaining scale, enhancing our service offering, and capturing targeted cost synergies from the C&J Merger; and
returning capital to shareholders in a disciplined fashion.
Completion Services
In our Completion Services segment, our strategy remains focused on deploying our market-ready fracturing fleets and bundling more of our wireline and pumpdown units with our deployed fracturing fleets and on a stand-alone basis. We are a public accounting firm registeredfocused on increasing our dedicated fracturing fleet count with efficient customers that allow us to achieve high equipment utilization, which should result in improved financial performance. Additionally, we are focused on bundling more of our wireline and pumpdown units with our fracturing fleets to increase operational efficiencies and profitability. With that said, current market conditions remain challenging, and our primary focus remains to lower our overall cost structure by aligning with efficient, dedicated customers with deep inventories of work and proven track records of efficient operations, many of which we have created long-term relationships with over the Public Company Accounting Oversight Board (United States) (PCAOB)past several years.
Well Construction and Intervention Services
In our Well Construction and Intervention Services segment, our strategy remains focused on deploying our market-ready cementing equipment and two newbuild coiled tubing units that we will take delivery of in the first quarter of 2020. In our cementing business, even though market conditions remain challenged due to customers releasing drilling rigs and declining E&P capital spending in 2020, we remain focused on providing high-quality, timely service and deploying more of our stacked units with efficient customers with deep inventories of work in our core operating basins. We will stay focused on controlling costs, improving market share with an efficient customer base that plan to maintain stable drilling rig counts in 2020. In our coiled tubing business, we are required to be independentfocused on deploying two newbuild, large-diameter units into our core operating basins and increasing market share with respect to the Company in accordancelarge, efficient customers with the U.S. federal securities laws and the applicable rules and regulationsdeep inventories of the Securities and Exchange Commission and the PCAOB.completion-oriented work that will keep our new units highly utilized.
Well Support Services
We conducteddivested our audits in accordance with the standardsWell Support Services segment on March 9, 2020, for total consideration of the PCAOB. Those standards require that we plan$93.7 million.
LIQUIDITY AND CAPITAL RESOURCES
Liquidity represents a company’s ability to adjust its future cash flows to meet needs and perform the audit to obtain reasonable assurance about whether the consolidatedopportunities, both expected and combined financial statements are free of material misstatement, whether due to error or fraud. Our audits included performing procedures to assess the risks of material misstatement of the consolidated and combined financial statements, whether due to error or fraud, and performing procedures that respond to those risks. Such procedures included examining, on a test basis, evidence regarding the amounts and disclosures in the consolidated and combined financial statements. Our audits also included evaluating the accounting principles used and significant estimates made by management, as well as evaluating the overall presentation of the consolidated and combined financial statements. We believe that our audits provide a reasonable basis for our opinion. unexpected.
| December 31, 2017 | December 31, 2016 | ||||||||
| Assets | |||||||||
| Current assets: | |||||||||
| Cash and cash equivalents | $ | 96,120 | $ | 48,920 | |||||
| Trade and other accounts receivable, net | 238,018 | 66,277 | |||||||
| Inventories, net | 33,437 | 15,891 | |||||||
| Prepaid and other current assets | 8,519 | 14,618 | |||||||
| Total current assets | 376,094 | 145,706 | |||||||
| Property and equipment, net | 468,000 | 294,209 | |||||||
| Goodwill | 134,967 | 50,478 | |||||||
| Intangible assets | 57,280 | 44,015 | |||||||
| Other noncurrent assets | 6,775 | 2,532 | |||||||
| Total assets | $ | 1,043,116 | $ | 536,940 | |||||
| Liabilities and Owners' Equity | |||||||||
| Liabilities | |||||||||
| Current liabilities: | |||||||||
| Accounts payable | $ | 92,348 | $ | 48,484 | |||||
| Accrued expenses | 135,175 | 42,892 | |||||||
| Current maturities of capital lease obligations | 3,097 | 2,633 | |||||||
| Current maturities of long-term debt | 1,339 | 2,512 | |||||||
| Stock based compensation - current | 4,281 | — | |||||||
| Deferred revenue | 5,000 | — | |||||||
| Other current liabilities | 914 | 3,171 | |||||||
| Total current liabilities | 242,154 | 99,692 | |||||||
| Capital lease obligations, less current maturities | 4,796 | 5,442 | |||||||
| Long-term debt, net of unamortized deferred financing costs and unamortized debt discount, less current maturities | 273,715 | 267,238 | |||||||
| Stock based compensation - noncurrent | 4,281 | — | |||||||
| Other noncurrent liabilities | 5,078 | 2,316 | |||||||
| Total noncurrent liabilities | 287,870 | 274,996 | |||||||
| Total liabilities | 530,024 | 374,688 | |||||||
| Owners’ equity | |||||||||
| Members' equity | — | 453,810 | |||||||
| Common stock, par value $0.01 per share (authorized 500,000 shares, issued 111,831 shares) | 1,118 | — | |||||||
| Paid-in capital in excess of par value | 541,074 | — | |||||||
| Retained deficit | (27,372 | ) | (288,771 | ) | |||||
| Accumulated other comprehensive (loss) | (1,728 | ) | (2,787 | ) | |||||
| Total owners’ equity | 513,092 | 162,252 | |||||||
| (Thousands of Dollars) | ||||||||
| Year Ended December 31, | ||||||||
| 2019 | 2018 | |||||||
| Cash | $ | 255,015 | $ | 80,206 | ||||
| Debt, net of deferred financing costs and debt discount | $ | 337,623 | $ | 340,730 | ||||
| Total liabilities and owners’ equity | $ | 1,043,116 | $ | 536,940 | |||||
| (Thousands of Dollars) | ||||||||||||
| Year Ended December 31, | ||||||||||||
| 2019 | 2018 | 2017 | ||||||||||
| Net cash provided by operating activities | $ | 305,463 | $ | 350,311 | $ | 79,691 | ||||||
| Net cash used in investing activities | $ | (114,100 | ) | $ | (297,506 | ) | $ | (250,776 | ) | |||
| Net cash provided by (used in) financing activities | $ | (16,746 | ) | $ | (68,554 | ) | $ | 218,122 | ||||
Sources of cash:
| Twelve Months Ended December 31, | ||||||||||||
| 2017 | 2016 | 2015 | ||||||||||
| Revenue | $ | 1,542,081 | $ | 420,570 | $ | 366,157 | ||||||
| Operating costs and expenses: | ||||||||||||
Cost of services (1) | 1,282,561 | 416,342 | 306,596 | |||||||||
| Depreciation and amortization | 159,280 | 100,979 | 69,547 | |||||||||
| Selling, general and administrative expenses | 93,526 | 53,155 | 26,081 | |||||||||
| Gain on disposal of assets | (2,555 | ) | (387 | ) | (270 | ) | ||||||
| Impairment | — | 185 | 3,914 | |||||||||
| Total operating costs and expenses | 1,532,812 | 570,274 | 405,868 | |||||||||
| Operating income (loss) | 9,269 | (149,704 | ) | (39,711 | ) | |||||||
| Other income (expense): | ||||||||||||
| Other income (expense), net | 13,963 | 916 | (1,481 | ) | ||||||||
Interest expense(2) | (59,223 | ) | (38,299 | ) | (23,450 | ) | ||||||
| Total other expenses | (45,260 | ) | (37,383 | ) | (24,931 | ) | ||||||
| Loss before income taxes | (35,991 | ) | (187,087 | ) | (64,642 | ) | ||||||
Income tax expense(3) | (150 | ) | — | — | ||||||||
| Net loss | (36,141 | ) | (187,087 | ) | (64,642 | ) | ||||||
| Net loss attributable to predecessor | (7,918 | ) | — | — | ||||||||
| Net loss attributable to Keane Group, Inc. | (28,223 | ) | (187,087 | ) | (64,642 | ) | ||||||
| Other comprehensive income (loss), net of tax: | ||||||||||||
| Foreign currency translation adjustments | 96 | 22 | (741 | ) | ||||||||
| Hedging activities | 791 | 1,857 | (1,187 | ) | ||||||||
| Total comprehensive loss | $ | (35,254 | ) | $ | (185,208 | ) | $ | (66,570 | ) | |||
Net loss per share(4): | ||||||||||||
| Basic net loss per share | $ | (0.34 | ) | $ | (2.14 | ) | $ | (0.74 | ) | |||
Diluted net loss per share | $ | (0.34 | ) | $ | (2.14 | ) | $ | (0.74 | ) | |||
Weighted-average shares outstanding: basic(3) | 106,321 | 87,313 | 87,313 | |||||||||
Weighted-average shares outstanding: diluted(3) | 106,321 | 87,313 | 87,313 | |||||||||
Net cash generated by operating activities during the |
Uses of cash:
Operating activities:
| – | Net cash used in operating activities for the year ended December 31, 2019, included $61.9 million of |
Investing activities:
| – | Net cash used in investing activities for the year ended December 31, 2019 consisted primarily of capital expenditures. This activity primarily related to |
Financing activities:
| – | Cash used to repay our debt facilities, excluding leases and |
| – | Shares withheld and |
Sources of operations does not include the provision for Texas margin tax for 2016 and the provisions for Texas margin tax and Canadian federal tax for 2015.cash:
Operating activities:
| – | Net cash generated by operating activities in 2018 of $350.3 million was primarily driven by higher utilization of our combined asset base and increased gross profit in our Completion Services segment. |
Investing activities:
| – |
| – | $4.7 million in proceeds from sales of various assets, including our idle field operations facility in Mathis, Texas, within the Corporate segment, and hydraulic tractors and light general-purpose vehicles within the Completion Services segment. |
Financing activities:
| – | Cash provided by the 2018 Term Loan Facility, net of debt discount, was $348.2 million. |
Uses of cash:
Operating activities:
| – | $13.0 million of transaction costs, including underwriting discounts paid by the Company, primarily incurred to |
| – | $7.9 million related to the |
Investing activities:
| – | Net cash used in investing activities of $297.5 million was primarily associated with our asset acquisition from RSI and our newbuild and maintenance capital spend on active fleets, offset by insurance proceeds and proceeds from various asset sales, as discussed above under “Sources of cash.” This activity primarily related to our Completion Services segment. |
Financing activities:
| – | Cash used to repay our debt facilities, including capital leases but excluding interest, was $289.1 million. |
| – | Cash used to pay debt issuance costs associated with our debt facilities was $7.3 million. |
| – | Shares repurchased and retired related to our stock repurchase program totaled$104.9 million. |
| – | Shares repurchased and retired related to payroll tax withholdings on our share-based compensation totaled $3.6 million. |
| – | $12.0 million related to the portion of the cash settlement of our RockPile CVR liability that was reflective of its acquisition-date fair value. |
Significant sources and uses of cash during the year ended December 31, 2017
Sources of cash:
Operating activities:
| – | Net cash generated by operating activities in 2017 of $79.7 million was primarily driven by higher utilization of our combined asset base and increased gross profit in our Completion Services segment. We also had proceeds of $2.1 million and $4.2 million from the indemnification settlement with Trican and our insurance company related to the acquisition of |
the Acquired Trican Operations. See accompanying notesNote (18) Commitments and ContingenciesofPart II, “Item 8. Financial Statements and Supplementary Data.”
Investing activities:
| – | Total proceeds of $30.6 million from the sale of assets relating to our facilities in Woodward, Oklahoma and Searcy, Arkansas, certain air compressor units, coiled tubing assets and the twelve workover rigs acquired in the acquisition of RockPile. See Note (7) Property and Equipment, netofPart II, “Item 8. Financial Statements and Supplementary Data.” |
Financing activities:
| – | Cash provided from IPO proceeds, $255.5 million. See Note (1)(a) Initial Public Offering ofPart II, “Item 8. Financial Statements and Supplementary Data.” |
| – | The 2017 Term Loan Facility, entered into on March 15, 2017, provided for $145.0 million, net of associated origination and other transactions fees. Proceeds received were primarily used to fully repay our Senior Secured Notes. statements. |
| – | An incremental term loan facility, entered into on July 3, 2017, provided for $131.1 million, net of associated origination and other transaction fees. Proceeds received were primarily used to fund the acquisition of RockPile. |
Uses of cash:
Investing activities:
| – | Cash consideration of $116.6 million associated with the acquisition of RockPile, inclusive of a $7.8 million net working capital settlement. |
| – | Cash used for capital expenditures of $164.4 million, associated with maintenance capital spend on active fleets, commissioning costs associated with the deployment of our idle fleets, the newbuild acquired as part of the acquisition of RockPile and deposits on new equipment. This activity primarily related to our Completion Services segment. |
Financing activities: Cash used to consolidatedrepay our debt facilities, including capital leases but excluding interest, in 2017 was $310.8 million. We used a portion of our IPO proceeds and combined financial statements.
the proceeds of the 2017 Term Loan Facility to repay our 2016 Term Loan Facility and Senior Secured Notes.
Capital expenditures for 2020 are projected to be primarily related to maintenance capital spend to support our existing active fleets, wireline trucks, coil units, and cementing units.
Debt service for the year ended December 31, 2020 is projected to be $30.9 million, of which $3.5 million is related to capital leases. We anticipate our debt service will be funded by cash flows from operations.
| Members’ equity | Common Stock | Paid-in Capital in Excess of Par Value | Retained Earnings (deficit) | Accumulated other comprehensive income (loss) | Total | |||||||||||||||||||
| Balance as of December 31, 2014 | $ | 186,420 | $ | — | $ | — | $ | (37,042 | ) | $ | (2,738 | ) | $ | 146,640 | ||||||||||
| Distributions | (222 | ) | — | — | — | — | (222 | ) | ||||||||||||||||
| Unit awards amortization | 312 | — | — | — | — | 312 | ||||||||||||||||||
| Other comprehensive loss | — | — | — | — | (1,928 | ) | (1,928 | ) | ||||||||||||||||
| Net loss | — | — | — | (64,642 | ) | — | (64,642 | ) | ||||||||||||||||
| Balance as of December 31, 2015 | $ | 186,510 | $ | — | $ | — | $ | (101,684 | ) | $ | (4,666 | ) | $ | 80,160 | ||||||||||
| Contribution of equity | 222,646 | — | — | — | — | 222,646 | ||||||||||||||||||
| Issuance of Class A and Class C Units | 42,669 | — | — | — | — | 42,669 | ||||||||||||||||||
| Unit awards amortization | 1,985 | — | — | — | — | 1,985 | ||||||||||||||||||
| Other comprehensive income | — | — | — | — | 1,879 | 1,879 | ||||||||||||||||||
| Net loss | — | — | — | (187,087 | ) | — | (187,087 | ) | ||||||||||||||||
| Balance as of December 31, 2016 | $ | 453,810 | $ | — | $ | — | $ | (288,771 | ) | $ | (2,787 | ) | $ | 162,252 | ||||||||||
| Net loss prior to the Organizational Transactions | — | — | — | (7,918 | ) | — | (7,918 | ) | ||||||||||||||||
| Effect of the Organizational Transactions | (453,810 | ) | — | 156,270 | 297,540 | — | — | |||||||||||||||||
| Issuance of common stock sold in initial public offering, net of offering costs and deferred stock awards for executives | — | 1,031 | 245,902 | — | — | 246,933 | ||||||||||||||||||
| Equity-based compensation recognized subsequent to the Organizational Transactions | — | — | 10,578 | — | — | 10,578 | ||||||||||||||||||
| Effect of RockPile acquisition | — | 87 | 130,203 | — | — | 130,290 | ||||||||||||||||||
| Other comprehensive income | — | — | — | — | 1,059 | 1,059 | ||||||||||||||||||
| Deferred tax adjustment | — | — | (1,879 | ) | — | — | (1,879 | ) | ||||||||||||||||
| Net loss subsequent to Organizational Transactions | — | — | — | (28,223 | ) | — | (28,223 | ) | ||||||||||||||||
| Balance as of December 31, 2017 | $ | — | $ | 1,118 | $ | 541,074 | $ | (27,372 | ) | $ | (1,728 | ) | $ | 513,092 | ||||||||||
| Twelve Months Ended December 31, | ||||||||||||
| 2017 | 2016 | 2015 | ||||||||||
| Cash flows from operating activities: | ||||||||||||
| Net loss | $ | (36,141 | ) | $ | (187,087 | ) | $ | (64,642 | ) | |||
| Adjustments to reconcile net loss to net cash provided by operating activities | ||||||||||||
| Depreciation and amortization | 159,280 | 100,979 | 69,547 | |||||||||
| Amortization of deferred financing fees | 5,241 | 4,152 | 2,112 | |||||||||
| Loss on debt extinguishment, including prepayment premiums | 31,084 | — | — | |||||||||
| Gain on disposal of assets | (2,555 | ) | (387 | ) | (270 | ) | ||||||
| Unrealized loss on de-designation of a derivative | 963 | 3,038 | — | |||||||||
| Accrued interest on loan—related party | — | 471 | 2,174 | |||||||||
| Loss on impairment of assets | — | 185 | 3,914 | |||||||||
| Equity-based compensation | 10,578 | 1,985 | 312 | |||||||||
| Other non-cash (expense) | (322 | ) | — | — | ||||||||
| Changes in operating assets and liabilities | ||||||||||||
| Decrease (increase) in trade and other accounts receivable, net | (113,047 | ) | (13,027 | ) | 36,933 | |||||||
| Decrease (increase) in inventories | (15,475 | ) | 8,485 | 11,841 | ||||||||
| Decrease (increase) in prepaid and other current assets | 20,294 | (5,994 | ) | 105 | ||||||||
| Decrease (increase) in other assets | (336 | ) | 32 | 1,047 | ||||||||
| Increase (decrease) in accounts payable | (141 | ) | 14,214 | (12,650 | ) | |||||||
| Increase (decrease) in accrued expenses | 41,446 | 19,735 | (13,185 | ) | ||||||||
| Increase (decrease) in other liabilities | (21,178 | ) | (835 | ) | 283 | |||||||
| Net cash provided by (used) in operating activities | 79,691 | (54,054 | ) | 37,521 | ||||||||
| Cash flows from investing activities | ||||||||||||
| Acquisition of business | (116,576 | ) | (203,900 | ) | — | |||||||
| Purchase of property and equipment | (141,340 | ) | (23,126 | ) | (26,086 | ) | ||||||
| Advances of deposit on equipment | (23,096 | ) | (420 | ) | (1,114 | ) | ||||||
| Implementation of software | (687 | ) | (453 | ) | (69 | ) | ||||||
| Proceeds from sale of assets | 30,565 | 711 | 1,278 | |||||||||
| Payments for leasehold improvements | (157 | ) | — | (46 | ) | |||||||
| Proceeds from insurance recoveries | 515 | 22 | — | |||||||||
| Payments received (advances) on note receivable | — | 5 | (1 | ) | ||||||||
| Net cash used in investing activities | (250,776 | ) | (227,161 | ) | (26,038 | ) | ||||||
| Cash flows from financing activities: | ||||||||||||
| Proceeds from issuance of common stock | 255,494 | — | — | |||||||||
| Proceeds from the secured notes and term loan facility | 285,000 | 100,000 | — | |||||||||
| Payments on the secured notes and term loan facility | (289,902 | ) | (5,647 | ) | (5,000 | ) | ||||||
| Payments on capital leases | (2,861 | ) | (2,668 | ) | (1,661 | ) | ||||||
| Prepayment premiums on early debt extinguishment | (15,817 | ) | — | — | ||||||||
| Payment of debt issuance costs | (13,792 | ) | (15,052 | ) | (1,135 | ) | ||||||
| Payments on contingent consideration liability | — | — | (2,500 | ) | ||||||||
| Contributions (distributions) | — | 200,000 | (222 | ) | ||||||||
| Net cash provided by (used in) financing activities | 218,122 | 276,633 | (10,518 | ) | ||||||||
| Non-cash effect of foreign translation adjustments | 163 | 80 | 250 | |||||||||
| Net increase in cash, cash equivalents and restricted cash | 47,200 | (4,502 | ) | 1,215 | ||||||||
| Cash, cash equivalents and restricted cash, beginning | 48,920 | 53,422 | 52,207 | |||||||||
| Cash, cash equivalents and restricted cash, ending | $ | 96,120 | $ | 48,920 | $ | 53,422 | ||||||
| Supplemental disclosure of cash flow information: | ||||||||||||
| Cash paid during the period for: | ||||||||||||
| Interest expense, net | $ | 30,104 | $ | 25,516 | $ | 19,157 | ||||||
| Income taxes | — | — | 220 | |||||||||
| Non-cash investing and financing activities: | ||||||||||||
| Non-cash purchases of property and equipment | $ | 25,193 | $ | 9,364 | $ | 3,138 | ||||||
| Non-cash forgiveness of related party loan | — | 22,646 | — | |||||||||
| Non-cash issuance of acquisition shares | 130,290 | — | — | |||||||||
| Non-cash issuance of Class A and C Units | — | 42,669 | — | |||||||||
| Non-cash reduction in capital lease obligations | 20 | 1,281 | — | |||||||||
| Non-cash additions to capital lease obligations | 2,739 | — | — | |||||||||
Other factors affecting liquidity
Financial position in current market. As of December 31, 2019, we had $255.0 million of cash and Regulation S-X.a total of $303.8 million available under our revolving credit facility. We currently believe that our cash on hand, cash flow generated from operations and availability under our revolving credit facility will provide sufficient liquidity for at least the next 12 months, including for capital expenditures, debt service, working capital investments and stock repurchases.
Customer receivables. In line with industry practice, we bill our customers for our services in arrears and are, therefore, subject to our customers delaying or failing to pay our invoices. The majority of our trade receivables have payment terms of 30 days or less. In weak economic environments, we may experience increased delays and failures to pay our invoices due to, among other reasons, a reduction in our customers’ cash flow from operations and their access to the credit markets. If our customers delay paying or fail to pay us a significant amount of our outstanding receivables, it could have a material adverse effect on our liquidity, consolidated results of its operations and its cash flows forconsolidated financial condition.
Contractual Obligations
In the years endednormal course of business, we enter into various contractual obligations that impact or could impact our liquidity. The table below contains our known contractual commitments as of December 31, 2019.
(Thousands of Dollars) Contractual obligations | Total | 2020 | 2021-2022 | 2023-2024 | 2025+ | |||||||||||||||
Long-term debt, including current portion(1) | $ | 344,750 | $ | 3,500 | $ | 7,000 | $ | 7,000 | $ | 327,250 | ||||||||||
Estimated interest payments(2) | 115,729 | 22,262 | 43,572 | 42,031 | 7,864 | |||||||||||||||
Finance lease obligations(3) | 10,061 | 4,977 | 4,811 | 273 | — | |||||||||||||||
Operating lease obligations(4) | 68,344 | 26,068 | 22,096 | 9,259 | 10,921 | |||||||||||||||
Purchase commitments(5) | 119,710 | 93,985 | 24,225 | 1,500 | — | |||||||||||||||
Equity-method investment(6) | 1,302 | 1,302 | — | — | — | |||||||||||||||
| Legal contingency | 10,059 | 10,059 | — | — | — | |||||||||||||||
| $ | 669,955 | $ | 162,153 | $ | 101,704 | $ | 60,063 | $ | 346,035 | |||||||||||
| (1) | Long-term debt represents our obligations under our 2018 Term Loan Facility, exclusive of interest payments. In addition, these amounts exclude $7.1 million of unamortized debt discount and debt issuance costs associated with our 2018 Term Loan Facility. |
| (2) | Estimated interest payments are based on debt balances outstanding as of December 31, 2019 and include interest related to the 2018 Term Loan Facility.Interest rates used for variable rate debt are based on the prevailing current London Interbank Offer Rate (“LIBOR”). |
| (3) | Finance lease obligations primarily consist of obligations on our finance leases of light weight vehicles with ARI Financial Services Inc. and Enterprise FM Trust and includes interest payments. |
| (4) | Operating lease obligations are related to our real estate, rail cars, and light duty vehicles. |
| (5) | Purchase commitments primarily relate to our agreements with vendors for sand purchases and deposits on equipment. The purchase commitments to sand suppliers represent our annual obligations to purchase a minimum amount of sand from vendors. If the minimum purchase requirement is not met, the shortfall at the end of the year is settled in cash or, in some cases, carried forward to the next year. |
| (6) | Equity-method investment is related to our research and development commitments with our equity-method investee. See Notes (18) Commitments and Contingencies and (19) Related Party Transactions of Part II, “Item 8. Financial Statements and Supplementary Data” for further details. |
.
Principal Debt Agreements
2019 ABL Facility
Origination. On the October 31, 2019, we, and certain of our other subsidiaries as additional borrowers and guarantors, entered into a Second Amended and Restated Asset-Based Revolving Credit Agreement (the “2019 ABL Facility”) to the original Asset-Based Revolving Credit Agreement, dated as of February 17, 2017, 2016,as amended December 22, 2017 (the “2017 ABL Facility”).
Structure. Our 2019 ABL Facility provides for a $450.0 million revolving credit facility (with a $100.0 million subfacility for letters of credit), subject to a borrowing base in accordance with the terms agreed between us and 2015. Such adjustments arethe lenders. In addition, subject to approval by the applicable lenders and other customary conditions, the 2019 ABL Facility allows for an additional increase in commitments of up to $200.0 million. The 2019 ABL Facility is subject to customary fees, guarantees of subsidiaries, restrictions and covenants, including certain restricted payments.
Maturity. The loans arising under the initial commitments under the 2019 ABL Facility mature on October 31, 2024. The loans arising under any tranche of extended loans or additional commitments mature as specified in the applicable extension amendment or increase joinder, respectively.
Interest. Pursuant to the terms of the 2019 ABL Facility, amounts outstanding under the 2019 ABL Facility bear interest at a normal recurring nature.rate per annum equal to, at Keane Group Holdings, LLC’s option, (a) the base rate, plus an applicable margin equal to (x) if the average excess availability is less than 33%, 1.00%, (y) if the
average excess availability is greater than or equal to 33% but less than 66%, 0.75% or (z) if the average excess availability is greater than or equal to 66%, 0.50%, or (b) the adjusted LIBOR rate for such interest period, plus an applicable margin equal to (x) if the average excess availability is less than 33%, 2.00%, (y) if the average excess availability is greater than or equal to 33% but less than 66%, 1.75% or (z) if the average excess availability is greater than or equal to 66%, 1.50%, to a rate per annum equal to, at Keane Group Holdings, LLC’s option, (a) the base rate, plus an applicable margin equal to (x) if the average excess availability is less than 33%, 0.75%, (y) if the average excess availability is greater than or equal to 33% but less than 66%, 0.50% or (z) if the average excess availability is greater than or equal to 66%, 0.25%, or (b) the adjusted LIBOR rate for such interest period, plus an applicable margin equal to (x) if the average excess availability is less than 33%, 1.75%, (y) if the average excess availability is greater than or equal to 33% but less than 66%, 1.50% or (z) if the average excess availability is greater than or equal to 66%, 1.25%.
Financial Covenants. The 2019 ABL Facility requires that, under certain circumstances, the consolidated and combinedfixed charge coverage ratio not be lower than 1.0:1.0 as of the last day of the most recently completed four consecutive fiscal quarters for which financial statements includewere required to have been delivered, including if excess availability (or liquidity if no loan or letter of credit, other than any letter of credit that has been cash collateralized, is outstanding) is less than the accountsgreater of (i) 10% of the loan cap and (ii) $30.0 million at any time. As of December 31, 2019, the Company was in compliance with all covenants.
2018 Term Loan Facility
On May 25, 2018, Keane Group Inc. and Keane Group,the 2018 Term Loan Guarantors (as defined below) entered into the 2018 Term Loan Facility with each together with their consolidated subsidiaries.
lender from time to time party thereto and Barclays Bank PLC, as administrative agent and collateral agent. The consolidated financial statements for the period from January 1, 2016 to March 15, 2016 reflect only the historical resultsproceeds of the Company2018 Term Loan Facility were used to refinance Keane Group’s then-existing term loan facility and to repay related fees and expenses, with the excess proceeds to fund general corporate purposes.
Structure. The 2018 Term Loan Facility provides for a term loan facility in an initial aggregate principal amount of $350.0 million (the loans incurred under the 2018 Term Loan Facility, the “2018 Term Loans”). As of December 31, 2019, there was $337.6 million principal amount of 2018 Term Loans outstanding. In addition, subject to certain customary conditions, the 2018 Term Loan Facility allows for additional incremental term loans to be incurred thereunder in an amount equal to the sum of (a) $200.0 million plus the aggregate principal amount of voluntary prepayments of 2018 Term Loans made on or prior to the completiondate of determination (less amounts incurred in reliance on the Company's acquisitioncapacity described in this subclause (a)), plus (b) an unlimited amount, subject to, (x) in the case of debt secured on a pari passu basis with the Acquired Trican Operations (as defined herein). The consolidated and combined financial statements for the period from January 1, 2017 to July 2, 2017 reflect only the historical results of the Company prior to the completion of the Company's acquisition of RockPile.
Maturity. May 25, 2025 or, if they had occurredearlier, the stated maturity date of any other term loans or term commitments.
Amortization. The 2018 Term Loans amortize in quarterly installments equal to 1.00% per annum of the aggregate principal amount of all initial term loans outstanding.
Interest. The 2018 Term Loans bear interest at a rate per annum equal to, at Keane Group’s option, (a) the base rate plus 2.75%, or (b) the adjusted LIBOR for such interest period (subject to a 1.00% floor) plus 3.75%, subject to, on January 1, 2016. Financial resultsand after the fiscal quarter ending September 30, 2018, a pricing grid with three 0.25% per annum step-ups and one 0.25% per annum step-down determined based on total net leverage for the years ended December 31, 2017, 2016, and 2015 arerelevant period. Following a payment event of default, the financial results of Keane Group, Inc. and Keane Group Holdings, LLC, the Company's predecessor for accounting purposes, as there was no activity under Keane Group, Inc. prior to 2017.
Prepayments. The 2018 Term Loan Facility is required to be prepaid with: (a) 100% of the net cash proceeds of certain asset sales, casualty events and other dispositions, subject to the terms of an intercreditor
agreement between the agent for the 2018 Term Loan Facility and the agent for the 2019 ABL Facility and certain exceptions; (b) 100% of the net cash proceeds of debt incurrences or issuances (other than debt incurrences permitted under the 2018 Term Loan Facility, which included 15,700,000 shares offeredexclusion is not applicable to permitted refinancing debt) and (c) 50% (subject to step-downs to 25% and 0%, upon and during achievement of certain total net leverage ratios) of excess cash flow in excess of a certain amount, minus certain voluntary prepayments made under the 2018 Term Loan Facility or other debt secured on a pari passu basis with the 2018 Term Loans and voluntary prepayments of loans under the 2019 ABL Facility to the extent the commitments under the 2019 ABL Facility are permanently reduced by such prepayments.
Guarantees. Subject to certain exceptions as set forth in the definitive documentation for the 2018 Term Loan Facility, the amounts outstanding under the 2018 Term Loan Facility are guaranteed by the Company, and 15,074,000 shares offered by the selling stockholder, including 4,014,000 shares sold as a result of the underwriters’ exercise of their overallotment option. The IPO proceeds to the Company, net of underwriters’ fees and capitalized cash payments of $4.8 million for professional services and other direct IPO related activities, was $255.5 million. The net proceeds were used to fully repay KGH Intermediate Holdco II, LLC (“Holdco II”)’s term loan balance of $99.0 million and the associated prepayment premium of $13.8 million, and to repay $50.0 million of its 12% secured notes due 2019 (“Senior Secured Notes”) and the associated prepayment premium of approximately $0.5 million. The remaining proceeds were used for general corporate purposes, including capital expenditures, working capital and potential acquisitions and strategic transactions. Upon completion of the IPO and the reorganization, the Company had 103,128,019 shares of common stock outstanding.
Security. Subject to certain exceptions as set forth in the definitive documentation for the 2018 Term Loan Facility, the obligations under the 2018 Term Loan Facility are secured by (a) a first-priority security interest in and Combined Financial Statementslien on substantially all of the assets of Keane Group and the 2018 Term Loan Guarantors to the extent not constituting ABL Facility Priority Collateral (as defined below) and (b) a second-priority security interest in and lien on substantially all of the accounts receivable, inventory, and frac iron equipment, and certain other assets and property related to the foregoing including certain chattel paper, investment property, documents, letter of credit rights, payment intangibles, general intangibles, commercial tort claims, books and records and supporting obligations of the borrowers and guarantors under the 2019 ABL Facility (the “ABL Facility Priority Collateral”).
Fees. Certain customary fees are payable to the lenders and the agents under the 2018 Term Loan Facility.
Restricted Payment Covenant. The 2018 Term Loan Facility includes a covenant restricting the ability of the Company and its restricted subsidiaries to pay dividends and make certain other restricted payments, subject to certain exceptions. The 2018 Term Loan Facility provides that the Company and its restricted subsidiaries may, among things, make cash dividends and other restricted payments in an aggregate amount during the life of the facility not to exceed (a) $100.0 million, plus (b) the amount of net proceeds received by Keane Group from the funding of the 2018 Term Loans in excess of the of such net proceeds required to finance the refinancing of the pre-existing term loan facility and pay fees and expenses related thereto and to the entry into the 2018 Term Loan Facility, plus (c) an unlimited amount so long as, after giving effect to such restricted payment, the total net leverage ratio would not exceed 2.00:1.00. In addition, the Company and its restricted subsidiaries may make restricted payments utilizing the Cumulative Credit (as defined below), subject to certain conditions including, if any portion of the Cumulative Credit utilized is comprised of amounts under clause (b) of the definition thereof below, the pro forma total net leverage ratio being no greater than 2.50:1.00.
“Cumulative Credit”, generally, is defined as an amount equal to (a) $25.0 million, (b) 50% of consolidated net income of the Company and its restricted subsidiaries on a cumulative basis from April 1, 2018 (which cumulative amount shall not be less than zero), plus (c) other customary additions, and reduced by the amount of Cumulative Credit used prior to such time (whether for restricted payments, junior debt payments or investments).
Affirmative and Negative Covenants. The 2018 Term Loan Facility contains various affirmative and negative covenants (in each case, subject to customary exceptions as set forth in the definitive documentation for the 2018 Term Loan Facility). The 2018 Term Loan Facility does not contain any financial maintenance covenants. As of December 31, 2019, the Company was in compliance with all covenants.
Events of Default. The 2018 Term Loan Facility contains customary events of default (subject to exceptions, thresholds and grace periods as set forth in the definitive documentation for the 2018 Term Loan Facility).
Related Party Transactions
Our board of directors has adopted a written policy and procedures (the “Related Party Policy”) for using the acquisition methodreview, approval and ratification of accountingthe related party transactions by the independent members of the audit and risk committee of our board of directors. For purposes of the Related Party Policy, a “Related Party Transaction” is any transaction, arrangement or relationship or series of similar transactions, arrangements or relationships (including the incurrence or issuance of any indebtedness or the guarantee of indebtedness) in which (1) the aggregate amount involved will or may be reasonably expected to exceed $120,000 in any fiscal year, (2) the company or any of its subsidiaries is a participant, and (3) any Related Party (as defined herein) has or will have a direct or indirect material interest. All Related Party Transactions will be reviewed in accordance with ASC 805, “Business Combinations”the standards set forth in the Related Party Policy after full disclosure of the Related Party’s interests in the transaction.
The Related Party Policy defines “Related Party” as any person who is, or, at any time since the beginning of the Company’s last fiscal year, was (1) an executive officer, director or nominee for election as a director of the Company or any of its subsidiaries, (2) a person with greater than five percent (5%) beneficial interest in the Company, (3) an immediate family member of any of the individuals or entities identified in (1) or (2) of this paragraph, and (4) any firm, corporation or other entity in which any of the foregoing individuals or entities is employed or is a general partner or principal or in a similar position or in which such person or entity has a five percent (5%) or greater beneficial interest. Immediate family members includes a person’s spouse, parents, stepparents, children, stepchildren, siblings, mothers- and fathers-in-law, sons- and daughters-in-law, brothers- and sisters-in-law and anyone residing in such person’s home, other than a tenant or employee.
Transaction prices with our related parties are commensurate with transaction prices in arms-length transactions. For further details about our transactions with Related Parties, see Note (19) Related Party Transactionsof Part II, “Item 8. Financial Statements and Supplementary Data.”
Recently Issued Accounting Standards
For discussion on the impact of accounting standards issued but not yet adopted to our consolidated and combined financial statements, see Note (23) New Accounting Pronouncementsof Part II, “Item 8. Financial Statements and Supplementary Data.”
Critical Accounting Policies and Estimates
The preparation of our consolidated and combined financial statements and related notes included within Part II, “Item 8. Financial Statements and Supplementary Data” requires us to make estimates that affect the reported amounts of assets, liabilities, revenue and expenses and related disclosures of contingent assets and liabilities. We base these estimates on historical results and various other assumptions believed to be reasonable, all of which form the basis for making estimates concerning the carrying values of assets and liabilities that are not readily available from other sources. Actual results may differ from these estimates.
A critical accounting estimate is one that requires a high level of subjective judgment by management and has a material impact to our financial condition or results of operations. We believe the following are the critical accounting policies used in the preparation of our consolidated and combined financial statements, as well as the significant estimates and judgments affecting the application of these policies. This discussion and analysis should be read in conjunction with our consolidated and combined financial statements and related notes included within Part II, “Item 8. Financial Statements and Supplementary Data.”
Business combinations
We allocate the purchase price is allocatedof businesses we acquire to the identifiable assets acquired and liabilities assumed based on their estimated fair values. Fair value of the acquired assets and liabilities is measured in accordance with the guidance of ASC 850, “Fair Value Measurements”, using discounted cash flows and other applicable valuation techniques. Any acquisition related costs incurred by the Company are expensed as incurred. Any excess purchase price over the fair value of the net identifiable assets acquired is recorded as goodwill. FairWe use all available information to estimate fair values, including quoted market prices, the carrying value of acquired assets and assumed liabilities and valuation techniques such as discounted cash flows, multi-period excess earning or income-based-relief-from-royalty methods. We engage third-party appraisal firms to assist in the fair value determination of inventories, identifiable long-lived assets, identifiable intangible assets, as well as any contingent consideration or earn-out provisions that provide for additional consideration to be paid to the seller if certain future conditions are met. These estimates are reviewed during the 12-month measurement period and adjusted based on actual results. The judgments made in determining the estimated fair value assigned to each class of assets acquired and liabilities assumed, as well as asset lives, can materially impact our financial condition or results of operations. See Note (3) Mergers and Acquisitions of Part II, “Item 8. Financial Statements and Supplementary Data” for further discussion of our recently completed merger and acquisition during 2019 and 2017, respectively.
Asset acquisitions
Asset acquisitions are measured based on their cost to us, including transaction costs incurred by us. An asset acquisition’s cost or the consideration transferred by us is assumed to be equal to the fair value of the acquirednet assets and liabilitiesacquired. If the consideration transferred is measured in accordance with the guidance of ASC 850, “Fair Value Measurements” using discounted cash, flows and other applicable valuation techniques. Operating results of an acquired business are included in our results of operations from the date of acquisition. Refer to Note (3) Acquisitions for discussion of the acquisitions completed during 2017 and 2016.
Legal and environmental contingencies
From time to time, we are subject to legal and administrative proceedings, settlements, investigations, claims and actions, as is typical of the industry. These claims include, purchase, conversion and condition. As inventorybut are not limited to, contract claims, environmental claims, employment related claims, claims alleging injury or claims related to operational issues. Our assessment of the likely outcome of litigation matters is consumed, the expense is recorded in cost of services in the consolidated and combined statements of operations using the weighted average cost method for all inventories.
Valuation of long-lived assets, indefinite-lived assets and goodwill
We assess our long-lived assets, such as definite-lived intangible assets and property and equipment, for impairment whenever events or circumstances indicate that the extentcarrying amount of an asset may not be recoverable. We assess our goodwill and indefinite-lived assets for impairment annually, as of October 31, or whenever events or circumstances indicate that the carrying amount of goodwill or the indefinite-lived assets may not be recoverable. If the carrying value of an asset exceeds its fair value, we record an impairment charge that reduces our earnings.
We perform our qualitative assessments of the likelihood of impairment by considering qualitative factors relevant to each of our reporting segments, such costsas macroeconomic, industry, market or any other factors that have a significant bearing on fair value. The expected future cash flows used for impairment reviews and related fair value
calculations are billablebased on subjective, judgmental assessments of projected revenue growth, fleet count, utilization, gross margin rates, SG&A rates, working capital fluctuations, capital expenditures, discount rates and terminal growth rates. Many of these judgments are driven by crude oil prices. If the crude oil market declines and remains at low levels for a sustained period of time, we would expect to perform our impairment assessments more frequently and could record impairment charges.
See Note (2)(h)Goodwill and Indefinite-Lived Intangible Assetsand (2)(i)Long-Lived Assets with Definite Lives of Part II, “Item 8. Financial Statements and Supplementary Data” for further discussion on our impairment assessments of our long-lived assets, indefinite-lived assets and goodwill for the customer, the amounts are recorded as revenue. Taxes collected from customersyears ended December 31, 2019, 2018 and remitted to governmental authorities are accounted for on a net basis and, therefore, are excluded from revenues in the consolidated and combined statements of operations and net cash provided by operating activities in the consolidated and combined statements of cash flows.2017.
Completion Services
The core services provided through our Completion Services segment are hydraulic fracturing, wireline and pumpdown services. As of December 31, 2019, we had approximately 45 hydraulic fracturing fleets, 118 wireline trucks and 80 pumpdown units capable of being deployed. Our completion support services are focused on supporting the efficiency, reliability and quality of our operations. Our Innovation Centers provide in-house manufacturing capabilities that help to reduce operating cost and enable us to offer more technologically advanced and efficiency focused completion services, which we believe is a competitive differentiator. For example, through our Innovation Centers we manufacture the data control instruments used in our fracturing operations and the perforating guns and addressable switches used in our wireline operations; these products are also available for sale to third-parties. The majority of revenue for this segment is generated by our fracturing business.
Well Construction and Intervention Services
The core services provided through our Well Construction and Intervention Services segment are cementing and coiled tubing services. The majority of revenue for this segment is generated by our cementing business. As of December 31, 2019, we had approximately 25 coiled tubing units and 101 cementing units capable of being deployed.
Well Support Services
Our Well Support Services segment was divested in a transaction that closed on March 9, 2020. It focused on post-completion activities at the well site, including rig services, such as workover and plug and abandonment, fluids management services, and other specialty well site services. Since early 2017, in response to the highly competitive landscape and reflecting our returns-focused strategy, we had focused on operational rightsizing measures to better align these businesses with current market conditions. This strategy resulted in closing facilities and idling unproductive equipment. For example, we either sold or shut down numerous businesses or asset packages, which included the divestiture of the majority of our fluids management assets in both West and South Texas in the third quarter of 2019. As of December 31, 2019, we had approximately 276 workover rigs and 348 fluids management trucks capable of being deployed. The majority of revenue for this segment is generated by our rig services business, and we consider rig services and fluids management to be the primary businesses within this segment.
How we calculate utilization for each segment
Our management team monitors asset utilization, among other factors, for purposes of assessing our overall activity levels and customer demand. For our Completion Services segment, asset utilization levels for our own fleets is defined as the ratio of the average number of deployed fleets to the number of total fleets for a given time period. We define active fleets as fleets available for deployment; we consider one of our fleets deployed if the fleet has been put in service at least one day during the period for which we calculate utilization; and we define fully-
utilized fleets per month as fleets that were deployed and working with our customers for a significant portion of a given month. As a result, as additional fleets are incrementally deployed, our utilization rate increases. We define industry utilization of fracturing assets as the ratio of the total industry demand of hydraulic horsepower to the total available capacity of hydraulic horsepower, in each case as reported by an independent industry source. Our method for calculating the utilization rate for our own fracturing fleets or the industry may differ from the method used by other companies or industry sources which could, for example, be based off a ratio of the total number of days a fleet is put in service to the total number of days in the relevant period. We believe that our measures of utilization, based on the number of deployed fleets, provide an accurate representation of existing, available capacity for additional revenue generating activity.
In our Well Construction and Intervention Services segment, we measure our asset utilization levels for our cementing business primarily by the total number of days that our asset base works on a monthly basis, based on the available working days per month. In our coiled tubing business, we measure certain asset utilization levels by the hour to better understand measures between daylight and 24-hour operations. Both the financial and operating performance of our coiled tubing and cement units can vary in revenue and profitability from job to job depending on the type of service to be performed and the equipment, personnel and consumables required for the job, as well as competitive factors and market conditions in the region in which the services are performed.
In our Well Support Services segment, we measured asset utilization levels primarily by the number of hours our assets work on a monthly basis, based on the available working days per month.
Our operating strategy is focused on maintaining high asset utilization levels to maximize revenue generation while controlling costs to gain a competitive advantage and drive returns. We believe that the safety, quality and efficiency of our service execution and our alignment with customers who recognize the value that we provide are central to our efforts to support utilization and grow our business. Given the volatile and cyclical nature of activity drivers in the U.S. onshore oilfield services industry, coupled with the varying prices we are able to charge for our services and the cost of providing those services, among other factors, operating margins can fluctuate widely depending on supply and demand at a given point in the cycle. For additional information about factors impacting our business and results of operations, please see “Industry Trends and Outlook” in Part II, “Item 7. Management’s Discussion and Analysis of Financial Condition and Results of Operations” in this Annual Report.
RESULTS OF OPERATIONS
The following table sets forth our financial results for the year ended December 31, 2019 as compared to the year ended the year ended December 31, 2018. Our financial results for 2019 include the financial and operating results of the businesses acquired in the C&J Merger for the partial period beginning November 1, 2019 through December 31, 2019.
A comparison of our financial results for the year ended December 31, 2018 and for the year ended December 31, 2017 can be found in the "Item 7. Management's Discussion and Analysis of Financial Condition and Results of Operations - Results of Operations" section in our Annual Report on Form 10-K for the fiscal year ended December 31, 2018, filed on February 27, 2019.
Year Ended December 31, 2019 Compared with Year Ended December 31, 2018
| Year Ended December 31, | |||||||||||||||||||||
| (Thousands of Dollars) | As a % of Revenue | Variance | |||||||||||||||||||
| Description | 2019 | 2018 | 2019 | 2018 | $ | % | |||||||||||||||
| Completion Services | $ | 1,709,934 | $ | 2,100,956 | 94 | % | 98 | % | $ | (391,022 | ) | (19 | %) | ||||||||
| Well Construction and Intervention Services | 63,039 | 36,050 | 3 | % | 2 | % | 26,989 | 75 | % | ||||||||||||
| Well Support Services | 48,583 | — | 3 | % | 0 | % | 48,583 | 0 | % | ||||||||||||
| Revenue | 1,821,556 | 2,137,006 | 100 | % | 100 | % | (315,450 | ) | (15 | %) | |||||||||||
| Completion Services | 1,308,089 | 1,622,106 | 72 | % | 76 | % | (314,017 | ) | (19 | %) | |||||||||||
| Well Construction and Intervention Services | 55,227 | 38,440 | 3 | % | 2 | % | 16,787 | 44 | % | ||||||||||||
| Well Support Services | 40,616 | — | 2 | % | 0 | % | 40,616 | 0 | % | ||||||||||||
| Costs of services | 1,403,932 | 1,660,546 | 77 | % | 78 | % | (256,614 | ) | (15 | %) | |||||||||||
| Depreciation and amortization | 292,150 | 259,145 | 16 | % | 12 | % | 33,005 | 13 | % | ||||||||||||
| Selling, general and administrative expenses | 123,676 | 113,810 | 7 | % | 5 | % | 9,866 | 9 | % | ||||||||||||
| Merger and integration | 68,731 | 448 | 4 | % | 0 | % | 68,283 | 15,242 | % | ||||||||||||
| (Gain) loss on disposal of assets | 4,470 | 5,047 | 0 | % | 0 | % | (577 | ) | (11 | %) | |||||||||||
| Impairment | 12,346 | — | 1 | % | 0 | % | 12,346 | 0 | % | ||||||||||||
| Operating income | (83,749 | ) | 98,010 | (5 | %) | 5 | % | (181,759 | ) | (185 | %) | ||||||||||
| Other income (expense), net | 453 | (905 | ) | 0 | % | 0 | % | 1,358 | (150 | %) | |||||||||||
| Interest expense | (21,856 | ) | (33,504 | ) | (1 | %) | (2 | %) | 11,648 | (35 | %) | ||||||||||
| Total other expenses | (21,403 | ) | (34,409 | ) | (1 | %) | (2 | %) | 13,006 | (38 | %) | ||||||||||
| Income tax expense | (1,005 | ) | (4,270 | ) | 0 | % | 0 | % | 3,265 | (76 | %) | ||||||||||
| Net income (loss) | $ | (106,157 | ) | $ | 59,331 | (6 | %) | 3 | % | $ | (165,488 | ) | (279 | %) | |||||||
Revenue. Total revenue is comprised of revenue from our Completion Services, Well Construction and Intervention Services and Well Support Services segments. Revenue in 2019 decreased by$315.5 million, or 15%, to $1.8 billion from $2.1 billion in 2018. The net decline was driven primarily by a decrease in rig count and fleet utilization, combined with pricing pressures from macroeconomic market conditions. This decrease in utilization was primarily from our customers shifting their focus to capital discipline through reduced activity levels and pricing. Despite pricing pressures, we retained our core customer base by aligning with high quality and efficient customers under dedicated agreements. This change in revenue by reportable segment is discussed below.
Completion Services:Completion Services segment revenue decreased by $391.0 million, or 19%, to $1.7 billion in 2019 from $2.1 billion in 2018. The segment revenue decline was driven by lower fleet utilization and decreased activity levels year over year, in addition to continued pricing pressures from market conditions. This was offset by an increase in revenue attributable to the C&J Merger.
Well Construction and Intervention: Well Construction and Intervention Services segment revenue increased by $27.0 million, or 75%, to $63.0 million in 2019 from $36.1 million in 2018. This increase in revenue was primarily attributable to the C&J Merger.
Well Support Services: Well Support Services segment revenue was $48.6 million in 2019 with no comparison period in 2018. This increase in revenue was solely attributable to the acquisition of the segment through the C&J Merger.
Cost of services. Cost of services in 2019 decreased by $256.6 million, or 15%, to $1.4 billion from $1.7 billion in 2018. This change was driven by several factors including lower overall activity and fleet utilization, as discussed above under Revenue, in addition to the impact of cost optimization from cost management efforts and input cost deflation.
Equipment Utilization. Depreciation and amortization expense increased by $33.0 million, or 13%, to $292.2 million in 2019 from $259.1 million in 2018. The change in depreciation and amortization was primarily related to additional equipment purchases from the RSI Acquisition in late 2018, maintenance spend for fleet readiness, and other equipment used for continuing to enhance safety and efficiency through our multi-faceted approach of surface, digital and downhole technologies. Loss on disposal of assets in 2019 decreased by $0.6 million, to a loss of $4.5 million in 2019 from a loss of $5.0 million in 2018. The decrease in loss on disposal of assets is primarily related to a larger number of early failures of major components in 2018 compared to 2019, primarily due to higher activity and use of equipment in 2018.
Selling, general and administrative expense. Selling, general and administrative (“SG&A”) expense, which represents costs associated with managing and supporting our operations, increased by $9.9 million, or 9%, to $123.7 million in 2019 from $113.8 million in 2018. This change in SG&A was primarily related to non-cash compensation expense of $19.4 million and litigation contingencies of $3.8 million.
Merger and integration expense. Merger and integration expense increased by $68.3 million to $68.7 million in 2019 from $0.4 million in 2018. The $68.7 million in merger and integration expense in 2019 was due to the C&J Merger, which consisted primarily of professional services, severance costs, and facility consolidation. The $0.4 million in 2018 is related to transaction cost associated with the RSI Acquisition.
Other income (expense), net. Other income (expense), net, in 2019 increased by $1.4 million, or 150%, to income of $0.5 million in 2019 from expense of $0.9 million in 2018. In 2018, other expense, net was primarily due to a $13.2 million adjustment to our Rockpile CVR liability, $2.7 million loss on foreign currency related to the wind-down of the Canadian entity, offset by a $14.9 million gain on the insurance proceeds received for losses resulting from the July 1, 2018 accidental fire.
Interest expense, net. Interest expense, net of interest income, decreased by $11.6 million, or 35%, to $21.9 million in 2019 from $33.5 million in 2018. This change was primarily attributable to the $7.6 million write-offs of deferred financing costs in 2018, in connection with the debt extinguishment of our 2017 Term Loan Facility.
Effective tax rate. Upon consummation of the IPO, the Company became a corporation subject to federal income taxes. Our effective tax rate on continuing operations in 2019 was (0.96)%, as compared to 6.71% in 2018. For 2019, the effective rate is primarily made up of state taxes and a tax benefit derived from the current period operating loss offset by a valuation allowance. For 2018, the effective rate was primarily made up of state taxes and tax benefits derived from the current period operating income offset by a valuation allowance. As a result of market conditions and their corresponding impact on our business outlook, we determined that a valuation allowance was appropriate as it is not more likely than not that we will utilize our net deferred tax assets. The remaining tax impact not offset by a valuation allowance is related to indefinite-lived assets.
Industry Drivers of 2019 Operations
Between January and April 2019, the increase in oil prices incentivized many of our customers to significantly increase activity levels early in 2019. This resulted in E&P capital budget exhaustion and early
achievement of E&P production targets, and in combination with normal year-end seasonality, resulted in softening demand for completions services by the fourth quarter of 2019. In addition, lackluster oil and gas prices in 2019 resulted in the E&P budgeting process to be more muted, causing many E&P companies to delay activity start-up into early 2020. Furthermore, the current market oversupply of fracturing equipment created a competitive pricing environment at year-end 2019 during E&P budgeting season, which resulted in pricing pressure in order win new work or extend existing dedicated agreements that were up for renewal. With that said, most of our customers see value in a long-term partnership with us, and as a result, traded some price concessions by us for extended terms or additional work scope.
We are committed to continuing to manage our business in line with demand for our services and make adjustments as necessary to effectively respond to changes in market conditions, customer activity levels, pricing for our services and equipment, and utilization of our deployed equipment and personnel. Our response to the industry's persistent uncertainty is to maintain sufficient liquidity, preserve our conservative capital structure and closely monitor our discretionary spending. We take a measured approach to asset deployment, balancing our view of current and expected customer activity levels with a focus on generating positive returns for our shareholders. Our priorities remain to drive revenue by maximizing deployed equipment utilization, to improve margins through cost controls, to protect and grow our market share by focusing on the quality, safety and efficiency of our service execution, and to ensure that we are strategically positioned to capitalize on constructive market dynamics.
Looking Ahead to 2020
We face many challenges and risks in the industry in which we operate. Although many factors contributing to these risks are beyond our ability to control, we continuously monitor these risks and have taken steps to mitigate them to the extent practicable. In addition, while we believe that we are well positioned to capitalize on available growth opportunities, we may not be able to achieve our business objectives and, consequently, our results of operations may be adversely affected. Please read the factors described in the sections titled “Cautionary Note Regarding Forward-Looking Statements” and “Risk Factors” in Part I, Item 1A of this Annual Report for additional information about the known material risks that we face.
Fiscal 2020 Objectives
With recent commodity price volatility, we intend to closely monitor the market and will adjust our approach as the situation develops. At this time, in 2020, our principal business objective continues to be growing our business and safely providing best-in-class services in all of our operating segments, while delivering shareholder value and maintaining a disciplined capital deployment strategy. We expect to achieve our objective through:
partnering and growing with well-capitalized customers under dedicated agreements who focus their efforts on safety, high-efficiency completions, continuous improvement and innovation;
allocating our assets to maximize utilization and returns, including diversification of geographies and commodities;
maximizing profitability of fully-utilized fleets through leading-edge pricing and efficiencies;
investing in technology to further drive efficiencies, enable differentiation of service offerings, and reduce our overall cost structure;
leveraging our flexible and scalable logistics infrastructure to provide assurance of supply at lowest landed cost;
leveraging our platform to identify, retain and promote talent to sustain growth and support operational and commercial excellence; maintaining agreements with our existing strategic suppliers and identify and develop relationships with additional strategic suppliers to ensure continuity of supply and optimize efficiency;
maintaining our conservative and flexible capital position, supporting continued growth and maintenance of active equipment;
gaining scale, enhancing our service offering, and capturing targeted cost synergies from the C&J Merger; and
returning capital to shareholders in a disciplined fashion.
Completion Services
In our Completion Services segment, our strategy remains focused on deploying our market-ready fracturing fleets and bundling more of our wireline and pumpdown units with our deployed fracturing fleets and on a stand-alone basis. We are focused on increasing our dedicated fracturing fleet count with efficient customers that allow us to achieve high equipment utilization, which should result in improved financial performance. Additionally, we are focused on bundling more of our wireline and pumpdown units with our fracturing fleets to increase operational efficiencies and profitability. With that said, current market conditions remain challenging, and our primary focus remains to lower our overall cost structure by aligning with efficient, dedicated customers with deep inventories of work and proven track records of efficient operations, many of which we have created long-term relationships with over the past several years.
Well Construction and Intervention Services
In our Well Construction and Intervention Services segment, our strategy remains focused on deploying our market-ready cementing equipment and two newbuild coiled tubing units that we will take delivery of in the first quarter of 2020. In our cementing business, even though market conditions remain challenged due to customers releasing drilling rigs and declining E&P capital spending in 2020, we remain focused on providing high-quality, timely service and deploying more of our stacked units with efficient customers with deep inventories of work in our core operating basins. We will stay focused on controlling costs, improving market share with an efficient customer base that plan to maintain stable drilling rig counts in 2020. In our coiled tubing business, we are focused on deploying two newbuild, large-diameter units into our core operating basins and increasing market share with large, efficient customers with deep inventories of completion-oriented work that will keep our new units highly utilized.
Well Support Services
We divested our Well Support Services segment on March 9, 2020, for total consideration of $93.7 million.
LIQUIDITY AND CAPITAL RESOURCES
Liquidity represents a company’s ability to adjust its future cash flows to meet needs and opportunities, both expected and unexpected.
| (Thousands of Dollars) | ||||||||
| Year Ended December 31, | ||||||||
| 2019 | 2018 | |||||||
| Cash | $ | 255,015 | $ | 80,206 | ||||
| Debt, net of deferred financing costs and debt discount | $ | 337,623 | $ | 340,730 | ||||
| (Thousands of Dollars) | ||||||||||||
| Year Ended December 31, | ||||||||||||
| 2019 | 2018 | 2017 | ||||||||||
| Net cash provided by operating activities | $ | 305,463 | $ | 350,311 | $ | 79,691 | ||||||
| Net cash used in investing activities | $ | (114,100 | ) | $ | (297,506 | ) | $ | (250,776 | ) | |||
| Net cash provided by (used in) financing activities | $ | (16,746 | ) | $ | (68,554 | ) | $ | 218,122 | ||||
Significant sources and uses of cash during the year ended December 31, 2019
Sources of cash:
Operating activities:
| – | Net cash generated by operating activities during the year ended December 31, 2019 of $305.5 million was a result of our thoroughness in receiving collections from our customers and controlling costs. We continue to focus on maintaining operational and spend efficiencies, resulting in positive working capital and net operating cash to support our capital expenditures and other investing activities. |
Uses of cash:
Operating activities:
| – | Net cash used in operating activities for the year ended December 31, 2019, included $61.9 million of merger and integration costs in connection with the C&J Merger. |
Investing activities:
| – | Net cash used in investing activities for the year ended December 31, 2019 consisted primarily of capital expenditures. This activity primarily related to our Completion Services segment. |
Financing activities:
| – | Cash used to repay our debt facilities, excluding leases and interest, during the year ended December 31, 2019 was $3.5 million. |
| – | Cash used to repay our finance leases during the year ended December 31, 2019 was $6.0 million. |
| – | Shares withheld and retired related to stock-based compensation during the year ended December 31, 2019 totaled $6.0 million. |
Significant sources and uses of cash during the year ended December 31, 2018
Sources of cash:
Operating activities:
| – | Net cash generated by operating activities in 2018 of $350.3 million was primarily driven by higher utilization of our combined asset base and increased gross profit in our Completion Services segment. |
Investing activities:
| – | Cash provided by the insurance proceeds received for losses resulting from the July 1, 2018 accidental fire was $18.1 million. For further details see Note (7) Property and Equipment, netof Part II, “Item 8. Financial Statements and Supplementary Data.” |
| – | $4.7 million in proceeds from sales of various assets, including our idle field operations facility in Mathis, Texas, within the Corporate segment, and hydraulic tractors and light general-purpose vehicles within the Completion Services segment. |
Financing activities:
| – | Cash provided by the 2018 Term Loan Facility, net of debt discount, was $348.2 million. |
Uses of cash:
Operating activities:
| – | $13.0 million of transaction costs, including underwriting discounts paid by the Company, primarily incurred to consummate the secondary stock offering completed in January 2018. |
| – | $7.9 million related to the portion of the cash settlement of our RockPile CVR liability that exceeded its acquisition-date fair value, with the remaining $12.0 million of the cash settlement cost reflected in the use of cash in financing activities as described below. |
Investing activities:
| – | Net cash used in investing activities of $297.5 million was primarily associated with our asset acquisition from RSI and our newbuild and maintenance capital spend on active fleets, offset by insurance proceeds and proceeds from various asset sales, as discussed above under “Sources of cash.” This activity primarily related to our Completion Services segment. |
Financing activities:
| – | Cash used to repay our debt facilities, including capital leases but excluding interest, was $289.1 million. |
| – | Cash used to pay debt issuance costs associated with our debt facilities was $7.3 million. |
| – | Shares repurchased and retired related to our stock repurchase program totaled$104.9 million. |
| – | Shares repurchased and retired related to payroll tax withholdings on our share-based compensation totaled $3.6 million. |
| – | $12.0 million related to the portion of the cash settlement of our RockPile CVR liability that was reflective of its acquisition-date fair value. |
Significant sources and uses of cash during the year ended December 31, 2017
Sources of cash:
Operating activities:
| – | Net cash generated by operating activities in 2017 of $79.7 million was primarily driven by higher utilization of our combined asset base and increased gross profit in our Completion Services segment. We also had proceeds of $2.1 million and $4.2 million from the indemnification settlement with Trican and our insurance company related to the acquisition of |
the Acquired Trican Operations. See Note (18) Commitments and ContingenciesofPart II, “Item 8. Financial Statements and Supplementary Data.”
Investing activities:
| – | Total proceeds of $30.6 million from the sale of assets relating to our facilities in Woodward, Oklahoma and Searcy, Arkansas, certain air compressor units, coiled tubing assets and the twelve workover rigs acquired in the acquisition of RockPile. See Note (7) Property and Equipment, netofPart II, “Item 8. Financial Statements and Supplementary Data.” |
Financing activities:
| – | Cash provided from IPO proceeds, $255.5 million. See Note (1)(a) Initial Public Offering ofPart II, “Item 8. Financial Statements and Supplementary Data.” |
| – | The 2017 Term Loan Facility, entered into on March 15, 2017, provided for $145.0 million, net of associated origination and other transactions fees. Proceeds received were primarily used to fully repay our Senior Secured Notes. statements. |
| – | An incremental term loan facility, entered into on July 3, 2017, provided for $131.1 million, net of associated origination and other transaction fees. Proceeds received were primarily used to fund the acquisition of RockPile. |
Uses of cash:
Investing activities:
| – | Cash consideration of $116.6 million associated with the acquisition of RockPile, inclusive of a $7.8 million net working capital settlement. |
| – | Cash used for capital expenditures of $164.4 million, associated with maintenance capital spend on active fleets, commissioning costs associated with the deployment of our idle fleets, the newbuild acquired as part of the acquisition of RockPile and deposits on new equipment. This activity primarily related to our Completion Services segment. |
Financing activities: Cash used to repay our debt facilities, including capital leases but excluding interest, in 2017 was $310.8 million. We used a portion of our IPO proceeds and the proceeds of the 2017 Term Loan Facility to repay our 2016 Term Loan Facility and Senior Secured Notes.
Future sources and use of cash
Our primary sources of liquidity have historically included, and we have funded our capital expenditures with, cash flows from operations, proceeds from public offerings of our common stock and borrowings under debt facilities. Our ability to generate future cash flows is subject to a number of variables, many of which are outside of our control, including the drilling, completion and production activity by our customers, which is highly dependent on oil and gas prices. See Part II, “Item 7. Management’s Discussion and Analysis of Financial Condition and Results of Operations - Overview” for additional discussion of certain factors that impact our results and the market challenges within our industry.
Our primary uses of cash are for operating costs, capital expenditures, debt service and our stock repurchase program.
Capital expenditures for 2020 are projected to be primarily related to maintenance capital spend to support our existing active fleets, wireline trucks, coil units, and cementing units.
Debt service for the year ended December 31, 2020 is projected to be $30.9 million, of which $3.5 million is related to capital leases. We anticipate our debt service will be funded by cash flows from operations.
On December 11, 2019, the Company announced the board of directors approved a new $100 million capital return program, which includes a $50 million stock repurchase program through December 2020. No share repurchases were made under the share repurchase program in 2019. Although our board of directors has approved a share repurchase program, the share repurchase program does not obligate us to repurchase any specific dollar amount or to acquire any specific number of shares. The timing and amount of repurchases, if any, will depend upon several factors, including market and business conditions, the trading price of our common stock and the nature of other investment opportunities. The repurchase program may be limited, suspended or discontinued at any time without prior notice. We anticipate any share repurchases will be funded by cash flows from operations.
Other factors affecting liquidity
Financial position in current market. As of December 31, 2019, we had $255.0 million of cash and a total of $303.8 million available under our revolving credit facility. We currently believe that our cash on hand, cash flow generated from operations and availability under our revolving credit facility will provide sufficient liquidity for at least the next 12 months, including for capital expenditures, debt service, working capital investments and stock repurchases.
Guarantee agreements. Under the 2019 ABL Facility $31.8 million of letters of credit were outstanding as of December 31, 2019.
Customer receivables. In line with industry practice, we bill our customers for our services in arrears and are, therefore, subject to our customers delaying or failing to pay our invoices. The majority of our trade receivables have payment terms of 30 days or less. In weak economic environments, we may experience increased delays and failures to pay our invoices due to, among other reasons, a reduction in our customers’ cash flow from operations and their access to the credit markets. If our customers delay paying or fail to pay us a significant amount of our outstanding receivables, it could have a material adverse effect on our liquidity, consolidated results of operations and consolidated financial condition.
Contractual Obligations
In the normal course of business, we enter into various contractual obligations that impact or could impact our liquidity. The table below contains our known contractual commitments as of December 31, 2019.
(Thousands of Dollars) Contractual obligations | Total | 2020 | 2021-2022 | 2023-2024 | 2025+ | |||||||||||||||
Long-term debt, including current portion(1) | $ | 344,750 | $ | 3,500 | $ | 7,000 | $ | 7,000 | $ | 327,250 | ||||||||||
Estimated interest payments(2) | 115,729 | 22,262 | 43,572 | 42,031 | 7,864 | |||||||||||||||
Finance lease obligations(3) | 10,061 | 4,977 | 4,811 | 273 | — | |||||||||||||||
Operating lease obligations(4) | 68,344 | 26,068 | 22,096 | 9,259 | 10,921 | |||||||||||||||
Purchase commitments(5) | 119,710 | 93,985 | 24,225 | 1,500 | — | |||||||||||||||
Equity-method investment(6) | 1,302 | 1,302 | — | — | — | |||||||||||||||
| Legal contingency | 10,059 | 10,059 | — | — | — | |||||||||||||||
| $ | 669,955 | $ | 162,153 | $ | 101,704 | $ | 60,063 | $ | 346,035 | |||||||||||
| (1) | Long-term debt represents our obligations under our 2018 Term Loan Facility, exclusive of interest payments. In addition, these amounts exclude $7.1 million of unamortized debt discount and debt issuance costs associated with our 2018 Term Loan Facility. |
| (2) | Estimated interest payments are based on debt balances outstanding as of December 31, 2019 and include interest related to the 2018 Term Loan Facility.Interest rates used for variable rate debt are based on the prevailing current London Interbank Offer Rate (“LIBOR”). |
| (3) | Finance lease obligations primarily consist of obligations on our finance leases of light weight vehicles with ARI Financial Services Inc. and Enterprise FM Trust and includes interest payments. |
| (4) | Operating lease obligations are related to our real estate, rail cars, and light duty vehicles. |
| (5) | Purchase commitments primarily relate to our agreements with vendors for sand purchases and deposits on equipment. The purchase commitments to sand suppliers represent our annual obligations to purchase a minimum amount of sand from vendors. If the minimum purchase requirement is not met, the shortfall at the end of the year is settled in cash or, in some cases, carried forward to the next year. |
| (6) | Equity-method investment is related to our research and development commitments with our equity-method investee. See Notes (18) Commitments and Contingencies and (19) Related Party Transactions of Part II, “Item 8. Financial Statements and Supplementary Data” for further details. |
.
Principal Debt Agreements
2019 ABL Facility
Origination. On the October 31, 2019, we, and certain of our other subsidiaries as additional borrowers and guarantors, entered into a Second Amended and Restated Asset-Based Revolving Credit Agreement (the “2019 ABL Facility”) to the original Asset-Based Revolving Credit Agreement, dated as of February 17, 2017, as amended December 22, 2017 (the “2017 ABL Facility”).
Structure. Our 2019 ABL Facility provides for a $450.0 million revolving credit facility (with a $100.0 million subfacility for letters of credit), subject to a borrowing base in accordance with the terms agreed between us and the lenders. In addition, subject to approval by the applicable lenders and other customary conditions, the 2019 ABL Facility allows for an additional increase in commitments of up to $200.0 million. The 2019 ABL Facility is subject to customary fees, guarantees of subsidiaries, restrictions and covenants, including certain restricted payments.
Maturity. The loans arising under the initial commitments under the 2019 ABL Facility mature on October 31, 2024. The loans arising under any tranche of extended loans or additional commitments mature as specified in the applicable extension amendment or increase joinder, respectively.
Interest. Pursuant to the terms of the 2019 ABL Facility, amounts outstanding under the 2019 ABL Facility bear interest at a rate per annum equal to, at Keane Group Holdings, LLC’s option, (a) the base rate, plus an applicable margin equal to (x) if the average excess availability is less than 33%, 1.00%, (y) if the
average excess availability is greater than or equal to 33% but less than 66%, 0.75% or (z) if the average excess availability is greater than or equal to 66%, 0.50%, or (b) the adjusted LIBOR rate for such interest period, plus an applicable margin equal to (x) if the average excess availability is less than 33%, 2.00%, (y) if the average excess availability is greater than or equal to 33% but less than 66%, 1.75% or (z) if the average excess availability is greater than or equal to 66%, 1.50%, to a rate per annum equal to, at Keane Group Holdings, LLC’s option, (a) the base rate, plus an applicable margin equal to (x) if the average excess availability is less than 33%, 0.75%, (y) if the average excess availability is greater than or equal to 33% but less than 66%, 0.50% or (z) if the average excess availability is greater than or equal to 66%, 0.25%, or (b) the adjusted LIBOR rate for such interest period, plus an applicable margin equal to (x) if the average excess availability is less than 33%, 1.75%, (y) if the average excess availability is greater than or equal to 33% but less than 66%, 1.50% or (z) if the average excess availability is greater than or equal to 66%, 1.25%.
Financial Covenants. The 2019 ABL Facility requires that, under certain circumstances, the consolidated fixed charge coverage ratio not be lower than 1.0:1.0 as of the last day of the most recently completed four consecutive fiscal quarters for which financial statements were required to have been delivered, including if excess availability (or liquidity if no loan or letter of credit, other than any letter of credit that has been cash collateralized, is outstanding) is less than the greater of (i) 10% of the loan cap and (ii) $30.0 million at any time. As of December 31, 2019, the Company was in compliance with all covenants.
2018 Term Loan Facility
On May 25, 2018, Keane Group and the 2018 Term Loan Guarantors (as defined below) entered into the 2018 Term Loan Facility with each lender from time to time party thereto and Barclays Bank PLC, as administrative agent and collateral agent. The proceeds of the 2018 Term Loan Facility were used to refinance Keane Group’s then-existing term loan facility and to repay related fees and expenses, with the excess proceeds to fund general corporate purposes.
Structure. The 2018 Term Loan Facility provides for a term loan facility in an initial aggregate principal amount of $350.0 million (the loans incurred under the 2018 Term Loan Facility, the “2018 Term Loans”). As of December 31, 2019, there was $337.6 million principal amount of 2018 Term Loans outstanding. In addition, subject to certain customary conditions, the 2018 Term Loan Facility allows for additional incremental term loans to be incurred thereunder in an amount equal to the sum of (a) $200.0 million plus the aggregate principal amount of voluntary prepayments of 2018 Term Loans made on or prior to the date of determination (less amounts incurred in reliance on the capacity described in this subclause (a)), plus (b) an unlimited amount, subject to, (x) in the case of debt secured on a pari passu basis with the 2018 Term Loans, immediately after giving effect to the incurrence thereof, a first lien net leverage ratio being less than or equal to 2.00:1.00, (y) in the case of debt secured on a junior basis with the 2018 Term Loans, immediately after giving effect to the incurrence thereof, a secured net leverage ratio being less than or equal to 3.00:1.00 and (z) in the case of unsecured debt, immediately after giving effect to the incurrence thereof, a total net leverage ratio being less than or equal to 3.50:1.00.
Maturity. May 25, 2025 or, if earlier, the stated maturity date of any other term loans or term commitments.
Amortization. The 2018 Term Loans amortize in quarterly installments equal to 1.00% per annum of the aggregate principal amount of all initial term loans outstanding.
Interest. The 2018 Term Loans bear interest at a rate per annum equal to, at Keane Group’s option, (a) the base rate plus 2.75%, or (b) the adjusted LIBOR for such interest period (subject to a 1.00% floor) plus 3.75%, subject to, on and after the fiscal quarter ending September 30, 2018, a pricing grid with three 0.25% per annum step-ups and one 0.25% per annum step-down determined based on total net leverage for the relevant period. Following a payment event of default, the 2018 Term Loans bear interest at the rate otherwise applicable to such 2018 Term Loans at such time plus an additional 2.00% per annum during the continuance of such event of default.
Prepayments. The 2018 Term Loan Facility is required to be prepaid with: (a) 100% of the net cash proceeds of certain asset sales, casualty events and other dispositions, subject to the terms of an intercreditor
agreement between the agent for the 2018 Term Loan Facility and the agent for the 2019 ABL Facility and certain exceptions; (b) 100% of the net cash proceeds of debt incurrences or issuances (other than debt incurrences permitted under the 2018 Term Loan Facility, which exclusion is not applicable to permitted refinancing debt) and (c) 50% (subject to step-downs to 25% and 0%, upon and during achievement of certain total net leverage ratios) of excess cash flow in excess of a certain amount, minus certain voluntary prepayments made under the 2018 Term Loan Facility or other debt secured on a pari passu basis with the 2018 Term Loans and voluntary prepayments of loans under the 2019 ABL Facility to the extent the commitments under the 2019 ABL Facility are permanently reduced by such prepayments.
Guarantees. Subject to certain exceptions as set forth in the definitive documentation for the 2018 Term Loan Facility, the amounts outstanding under the 2018 Term Loan Facility are guaranteed by the Company, Keane Frac, LP, KS Drilling, LLC, KGH Intermediate Holdco I, LLC, KGH Intermediate Holdco II, LLC, and Keane Frac GP, LLC, and each subsidiary of the Company that will be required to execute and deliver a facility guaranty in the future pursuant to the terms of the 2018 Term Loan Facility (collectively, the “2018 Term Loan Guarantors”).
Security. Subject to certain exceptions as set forth in the definitive documentation for the 2018 Term Loan Facility, the obligations under the 2018 Term Loan Facility are secured by (a) a first-priority security interest in and lien on substantially all of the assets of Keane Group and the 2018 Term Loan Guarantors to the extent not constituting ABL Facility Priority Collateral (as defined below) and (b) a second-priority security interest in and lien on substantially all of the accounts receivable, inventory, and frac iron equipment, and certain other assets and property related to the foregoing including certain chattel paper, investment property, documents, letter of credit rights, payment intangibles, general intangibles, commercial tort claims, books and records and supporting obligations of the borrowers and guarantors under the 2019 ABL Facility (the “ABL Facility Priority Collateral”).
Fees. Certain customary fees are payable to the lenders and the agents under the 2018 Term Loan Facility.
Restricted Payment Covenant. The 2018 Term Loan Facility includes a covenant restricting the ability of the Company and its restricted subsidiaries to pay dividends and make certain other restricted payments, subject to certain exceptions. The 2018 Term Loan Facility provides that the Company and its restricted subsidiaries may, among things, make cash dividends and other restricted payments in an aggregate amount during the life of the facility not to exceed (a) $100.0 million, plus (b) the amount of net proceeds received by Keane Group from the funding of the 2018 Term Loans in excess of the of such net proceeds required to finance the refinancing of the pre-existing term loan facility and pay fees and expenses related thereto and to the entry into the 2018 Term Loan Facility, plus (c) an unlimited amount so long as, after giving effect to such restricted payment, the total net leverage ratio would not exceed 2.00:1.00. In addition, the Company and its restricted subsidiaries may make restricted payments utilizing the Cumulative Credit (as defined below), subject to certain conditions including, if any portion of the Cumulative Credit utilized is comprised of amounts under clause (b) of the definition thereof below, the pro forma total net leverage ratio being no greater than 2.50:1.00.
“Cumulative Credit”, generally, is defined as an amount equal to (a) $25.0 million, (b) 50% of consolidated net income of the Company and its restricted subsidiaries on a cumulative basis from April 1, 2018 (which cumulative amount shall not be less than zero), plus (c) other customary additions, and reduced by the amount of Cumulative Credit used prior to such time (whether for restricted payments, junior debt payments or investments).
Affirmative and Negative Covenants. The 2018 Term Loan Facility contains various affirmative and negative covenants (in each case, subject to customary exceptions as set forth in the definitive documentation for the 2018 Term Loan Facility). The 2018 Term Loan Facility does not contain any financial maintenance covenants. As of December 31, 2019, the Company was in compliance with all covenants.
Events of Default. The 2018 Term Loan Facility contains customary events of default (subject to exceptions, thresholds and grace periods as set forth in the definitive documentation for the 2018 Term Loan Facility).
Off-Balance Sheet Arrangements
We do not have any material off-balance sheet financing arrangements, transactions or special purpose entities.
Related Party Transactions
Our board of directors has adopted a written policy and procedures (the “Related Party Policy”) for the review, approval and ratification of the related party transactions by the independent members of the audit and risk committee of our board of directors. For purposes of the Related Party Policy, a “Related Party Transaction” is any transaction, arrangement or relationship or series of similar transactions, arrangements or relationships (including the incurrence or issuance of any indebtedness or the guarantee of indebtedness) in which (1) the aggregate amount involved will or may be reasonably expected to exceed $120,000 in any fiscal year, (2) the company or any of its subsidiaries is a participant, and (3) any Related Party (as defined herein) has or will have a direct or indirect material interest. All Related Party Transactions will be reviewed in accordance with the standards set forth in the Related Party Policy after full disclosure of the Related Party’s interests in the transaction.
The Related Party Policy defines “Related Party” as any person who is, or, at any time since the beginning of the Company’s last fiscal year, was (1) an executive officer, director or nominee for election as a director of the Company or any of its subsidiaries, (2) a person with greater than five percent (5%) beneficial interest in the Company, (3) an immediate family member of any of the individuals or entities identified in (1) or (2) of this paragraph, and (4) any firm, corporation or other entity in which any of the foregoing individuals or entities is employed or is a general partner or principal or in a similar position or in which such person or entity has a five percent (5%) or greater beneficial interest. Immediate family members includes a person’s spouse, parents, stepparents, children, stepchildren, siblings, mothers- and fathers-in-law, sons- and daughters-in-law, brothers- and sisters-in-law and anyone residing in such person’s home, other than a tenant or employee.
Transaction prices with our related parties are commensurate with transaction prices in arms-length transactions. For further details about our transactions with Related Parties, see Note (19) Related Party Transactionsof Part II, “Item 8. Financial Statements and Supplementary Data.”
Recently Issued Accounting Standards
For discussion on the impact of accounting standards issued but not yet adopted to our consolidated and combined financial statements, see Note (23) New Accounting Pronouncementsof Part II, “Item 8. Financial Statements and Supplementary Data.”
Critical Accounting Policies and Estimates
The preparation of our consolidated and combined financial statements and related notes included within Part II, “Item 8. Financial Statements and Supplementary Data” requires us to make estimates that affect the reported amounts of assets, liabilities, revenue and expenses and related disclosures of contingent assets and liabilities. We base these estimates on historical results and various other assumptions believed to be reasonable, all of which form the basis for making estimates concerning the carrying values of assets and liabilities that are not readily available from other sources. Actual results may differ from these estimates.
A critical accounting estimate is one that requires a high level of subjective judgment by management and has a material impact to our financial condition or results of operations. We believe the following are the critical accounting policies used in the preparation of our consolidated and combined financial statements, as well as the significant estimates and judgments affecting the application of these policies. This discussion and analysis should be read in conjunction with our consolidated and combined financial statements and related notes included within Part II, “Item 8. Financial Statements and Supplementary Data.”
Business combinations
We allocate the purchase price of businesses we acquire to the identifiable assets acquired and liabilities assumed based on their estimated fair values. Any excess purchase price over the fair value of the net identifiable assets acquired is recorded as goodwill. We use all available information to estimate fair values, including quoted market prices, the carrying value of acquired assets and assumed liabilities and valuation techniques such as discounted cash flows, multi-period excess earning or income-based-relief-from-royalty methods. We engage third-party appraisal firms to assist in the fair value determination of inventories, identifiable long-lived assets, identifiable intangible assets, as well as any contingent consideration or earn-out provisions that provide for additional consideration to be paid to the seller if certain future conditions are met. These estimates are reviewed during the 12-month measurement period and adjusted based on actual results. The judgments made in determining the estimated fair value assigned to each class of assets acquired and liabilities assumed, as well as asset lives, can materially impact our financial condition or results of operations. See Note (3) Mergers and Acquisitions of Part II, “Item 8. Financial Statements and Supplementary Data” for further discussion of our recently completed merger and acquisition during 2019 and 2017, respectively.
Asset acquisitions
Asset acquisitions are measured based on their cost to us, including transaction costs incurred by us. An asset acquisition’s cost or the consideration transferred by us is assumed to be equal to the fair value of the net assets acquired. If the consideration transferred is cash, measurement is based on the amount of cash we paid to the seller, as well as transaction costs incurred by us. Consideration given in the form of nonmonetary assets, liabilities incurred or equity interests issued is measured based on either the cost to us or the fair value of the assets or net assets acquired, whichever is more clearly evident. The cost of an asset acquisition is allocated to the assets acquired based on their estimated relative fair values. We engage third-party appraisal firms to assist in the fair value determination of inventories, identifiable long-lived assets and identifiable intangible assets. Goodwill is not recognized in an asset acquisition. See Note (3) Mergers and Acquisitions of Part II, “Item 8. Financial Statements and Supplementary Data” for our asset acquisition from RSI in 2018.
Legal and environmental contingencies
From time to time, we are subject to legal and administrative proceedings, settlements, investigations, claims and actions, as is typical of the industry. These claims include, but are not limited to, contract claims, environmental claims, employment related claims, claims alleging injury or claims related to operational issues. Our assessment of the likely outcome of litigation matters is based on our judgment of a number of factors, including experience with similar matters, past history, precedents, relevant financial information and other evidence and facts specific to the matter. We accrue for contingencies when the occurrence of a material loss is probable and can be reasonably estimated, based on our best estimate of the expected liability. The estimate of probable costs related to a contingency is developed in consultation with internal and outside legal counsel representing us. The accuracy of these estimates is impacted by, among other things, the complexity of the issues and the amount of due diligence we have been able to perform. Differences between the actual settlement costs, final judgments or fines from our estimates could have a material adverse effect on our financial position or results of operations. See Note (18) Commitments and Contingenciesof Part II, “Item 8. Financial Statements and Supplementary Data” for further discussion of our legal, environmental and other regulatory contingencies.
Valuation of long-lived assets, indefinite-lived assets and goodwill
We assess our long-lived assets, such as definite-lived intangible assets and property and equipment, for impairment whenever events or circumstances indicate that the carrying amount of an asset may not be recoverable. We assess our goodwill and indefinite-lived assets for impairment annually, as of October 31, or whenever events or circumstances indicate that the carrying amount of goodwill or the indefinite-lived assets may not be recoverable. If the carrying value of an asset exceeds its fair value, we record an impairment charge that reduces our earnings.
We perform our qualitative assessments of the likelihood of impairment by considering qualitative factors relevant to each of our reporting segments, such as macroeconomic, industry, market or any other factors that have a significant bearing on fair value. The expected future cash flows used for impairment reviews and related fair value
calculations are based on subjective, judgmental assessments of projected revenue growth, fleet count, utilization, gross margin rates, SG&A rates, working capital fluctuations, capital expenditures, discount rates and terminal growth rates. Many of these judgments are driven by crude oil prices. If the crude oil market declines and remains at low levels for a sustained period of time, we would expect to perform our impairment assessments more frequently and could record impairment charges.
See Note (2)(h)Goodwill and Indefinite-Lived Intangible Assetsand (2)(i)Long-Lived Assets with Definite Lives of Part II, “Item 8. Financial Statements and Supplementary Data” for further discussion on our impairment assessments of our long-lived assets, indefinite-lived assets and goodwill for the years ended December 31, 2019, 2018 and 2017.
Income Taxes
We account for income taxes in accordance with Accounting Standards Codification (“ASC”) 740, “Income Taxes,” which requires an asset and liability approach for financial accounting and reporting of income taxes. Under ASC 740, income taxes are accounted for based upon the future tax consequences attributable to differences between the financial statement carrying amounts of existing assets and liabilities and their respective tax basis and operating loss carry-forwards using enacted tax rates in effect in the year the differences are expected to reverse. We estimate our annual effective tax rate at each interim period based on the facts and circumstances available at that time, while the actual effective tax rate is calculated at year-end. Our effective tax rates will vary due to changes in estimates of our future taxable income or losses, fluctuations in the tax jurisdictions in which we operate and favorable or unfavorable adjustments to our estimated tax liabilities related to proposed or probable assessments. As a result, our effective tax rate may fluctuate significantly on a quarterly or annual basis.
In evaluating our ability to recover our deferred tax assets, we consider all available positive and negative evidence, including scheduled reversals of deferred tax liabilities, projected future taxable income, tax planning strategies and recent financial operations. In addition to our historical financial results, we consider forecasted market growth, earnings and taxable income, the mix of earnings in the jurisdictions in which we operate and the implementation of prudent and feasible tax planning strategies. These assumptions require significant judgment about the forecasts of future taxable income and are consistent with the plans and estimates we use to manage our underlying businesses. We establish a valuation allowance against the carrying value of deferred tax assets when we determine that it is more likely than not that the asset will not be realized through future taxable income. Such amounts are charged to earnings in the period in which we make such determination. Likewise, if we later determine that it is more likely than not that the net deferred tax assets would be realized, we would reverse the applicable portion of the previously provided valuation allowance.
We calculate our income tax liability based on estimates and assumptions that could differ from the actual results reflected in income tax returns filed during the subsequent year. Significant judgment is required in assessing, among other things, the timing and amounts of deductible and taxable items. Due to the complexity of some of these uncertainties, the ultimate resolution may result in payment that is materially different from our current estimate of our tax liabilities. These differences are reflected as increases or decreases to income tax expense in the period in which they are determined.
The amount of income tax we pay is subject to ongoing audits by federal and state tax authorities, which may result in proposed assessments. Our estimate for the potential outcome for any uncertain tax issue is highly judgmental. We believe we have adequately provided for any reasonably foreseeable outcome related to these matters. However, our future results may include favorable or unfavorable adjustments to our estimated tax liabilities in the period the assessments are made or resolved or when statutes of limitation on potential assessments expire. Additionally, the jurisdictions in which our earnings or deductions are realized may differ from our current estimates. We recognize interest and penalties, if any, related to uncertain tax positions in income tax expense.
On December 22, 2017, the U.S. government enacted comprehensive tax legislation commonly referred to as the Tax Cuts and Jobs Act (the “Tax Act”). The Tax Act makes broad and complex changes to the U.S. tax code, including but not limited to, (1) the requirement to pay a one-time transition tax on all undistributed earnings of
foreign subsidiaries; (2) reducing the U.S. federal corporate income tax rate from 35% to 21%; (3) eliminating the alternative minimum tax; (4) creating a new limitation on deductible interest expense; and (5) changing rules related to use and limitations of net operating loss carryforwards created in tax years beginning after December 31, 2017. We evaluated the provisions of the Tax Act and determined only the reduced corporate tax rate from 35% to 21% would have an impact on our consolidated and combined financial statements as of December 31, 2017. Accordingly, we recorded a provision to income taxes for our assessment of the tax impact of the Tax Act on ending deferred tax assets and liabilities and the corresponding valuation allowance. The effects of other provisions of the Tax Act are not expected to have an adverse impact on our consolidated and combined financial statements. We will continue to assess the impact of other aspects of U.S. tax reform on our tax positions and our consolidated and combined financial statements.
See Note (17) Income Taxesof Part II, “Item 8. Financial Statements and Supplementary Data” for further discussion on income taxes for the years ended December 31, 2019, 2018 and 2017.
Leases
Per ASU 2016-02, "Leases (Topic 842)," lessees can classify leases as finance leases or operating leases, while lessors can classify leases as sales-type, direct financing or operating leases. All leases, with the exception of short-term leases, are capitalized on the balance sheet by recording a lease liability, which represents our obligation to make lease payments arising from the lease, along with a corresponding right-of-use asset, which represents our right to use the underlying asset being leased. For leases in which we are the lessee, we use a collateralized incremental borrowing rate to calculate the lease liability, as in most cases we do not know the lessor's implicit rate in the lease. Establishing our lease obligations on our unaudited condensed consolidated balance sheets require judgmental assessments of the term lengths of each and the interest rate yield curve that best represents the collateralized incremental borrowing rate to apply to each lease. We engage third-party specialists to assist us in determining the collateralized incremental borrowing rate yield curve. Errors in determining the lease term lengths and/or selecting the best representative collateralized incremental borrowing rate can have a material adverse effect on our unaudited condensed consolidated financial statements. For further details about our leases, see Note (16) Leases of Part II, "Item 8. Financial Statements and Supplementary Data".
New Accounting Pronouncements
For discussion on the potential impact of new accounting pronouncements issued but not yet adopted, see Note (23) New Accounting Pronouncementsof Part II, “Item 8. Financial Statements and Supplementary Data.”
66
Item 7A. Quantitative and Qualitative Disclosure About Market Risk
Exchange Rate Risk. Our operations are currently conducted predominantly within the U.S.; therefore, we had no significant exposure to foreign currency exchange rate risk during 2019.
Interest Rate Risk. As of December 31, 2019, we held variable-rate debt, the exposure to which we manage with our interest-rate-related derivative instrument. We held no derivative instruments that increased our exposure to market risks for foreign currency rates, commodity prices or other market price risks. We are exposed to changes in interest rates on our floating rate borrowings under our 2019 ABL Facility and 2018 Term Loan. As of December 31, 2019, we had no debt outstanding under our 2019 ABL Facility and $337.6 million aggregate principal amount outstanding under the 2018 Term Loan. The impact of a 1.0% increase in interest rates under the terms of the 2019 ABL Facility would have no impact on interest expense for the 2019 year, and a 1.0% increase in interest rates under the terms of the 2018 Term Loan would have a $3.5 million impact on interest expense for the 2019 year.
Commodity Price Risk. Our material and fuel purchases expose us to commodity price risk. Our material costs primarily include the cost of inventory consumed while performing our stimulation services such as proppant, chemicals and guar. Our fuel costs consist primarily of diesel fuel used by our various trucks and other motorized equipment. The prices for fuel and the raw materials (particularly guar and proppant) in our inventory are volatile and are impacted by changes in supply and demand, as well as market uncertainty and regional shortages. Depending on market conditions, we have generally been able to pass along price increases to our customers; however, we may be unable to do so in the future. We generally do not engage in commodity price hedging activities. However, we have purchase commitments with certain vendors to supply a majority of the proppant used in our operations. Some of these agreements are take-or-pay agreements with minimum purchase obligations. As a result of future decreases in the market price of proppants, we could be required to purchase goods and pay prices in excess of market prices at the time of purchase.
For further quantitative disclosure about our market risk related to our variable-rate debt, interest-rate-related derivative instrument and purchase commitments, see Part II, “Item 7. Management Discussion and Analysis of Financial Condition and Results of Operations” for the contractual commitments and obligations table as of December 31, 2019.Customer Credit Risk. Financial instruments that potentially subject us to concentrations of credit risk are trade receivables. We extend credit to customers and other parties in the normal course of business. We have established various procedures to manage our credit exposure, including credit evaluations and maintaining an allowance for doubtful accounts.
67
Item 8. Financial Statements and Supplementary Data
INDEX TO FINANCIAL STATEMENTS
| NexTier Oilfield Solutions Inc. | |
| Audited Consolidated and Combined Financial Statements | |
| Reports of Independent Registered Public Accounting Firm | |
| Consolidated Balance Sheets | |
| Consolidated and Combined Statements of Operations and Comprehensive Income (Loss) | |
| Consolidated and Combined Statements of Changes in Stockholders’ Equity | |
| Consolidated and Combined Statements of Cash Flows | |
| Notes to Consolidated and Combined Financial Statements | |
68
Report of Independent Registered Public Accounting Firm
To the Stockholders and Board of Directors
NexTier Oilfield Solutions Inc.:
Opinion on the Consolidated and Combined Financial Statements
We have audited the accompanying consolidatedbalance sheets of NexTier Oilfield Solutions Inc. and subsidiaries (the Company) as of December 31, 2019 and 2018, the related consolidated and combined statements of operations and comprehensive income (loss), changes in stockholders’ equity, and cash flows for each of the years in the three-year period ended December 31, 2019, and the related notes (collectively, the consolidated and combined financial statements). In our opinion, the consolidated and combined financial statements present fairly, in all material respects, the financial position of the Company as of December 31, 2019 and 2018, and the results of its operations and its cash flows for each of the years in the three-year period ended December 31, 2019, in conformity with U.S. generally accepted accounting principles.
We also have audited, in accordance with the standards of the Public Company Accounting Oversight Board (United States) (PCAOB), the Company’s internal control over financial reporting as of December 31, 2019, based on criteria established in Internal Control - Integrated Framework (2013) issued by the Committee of Sponsoring Organizations of the Treadway Commission, and our report dated March 12, 2020 expressed an unqualified opinion on the effectiveness of the Company’s internal control over financial reporting.
Change in Accounting Principle
As discussed in Note 2 and 16 to the consolidated and combined financial statements, the Company has changed its method of accounting for leases as of January 1, 2019 due to the adoption of Accounting Standards Update 2016-02, Leases (Topic 842), and related amendments.
Basis for Opinion
These consolidated and combined financial statements are the responsibility of the Company’s management. Our responsibility is to express an opinion on these consolidated and combined financial statements based on our audits. We are a public accounting firm registered with the PCAOB and are required to be independent with respect to the Company in accordance with the U.S. federal securities laws and the applicable rules and regulations of the Securities and Exchange Commission and the PCAOB.
We conducted our audits in accordance with the standards of the PCAOB. Those standards require that we plan and perform the audit to obtain reasonable assurance about whether the consolidated and combined financial statements are free of material misstatement, whether due to error or fraud. Our audits included performing procedures to assess the risks of material misstatement of the consolidated and combined financial statements, whether due to error or fraud, and performing procedures that respond to those risks. Such procedures included examining, on a test basis, evidence regarding the amounts and disclosures in the consolidated and combined financial statements. Our audits also included evaluating the accounting principles used and significant estimates made by management, as well as evaluating the overall presentation of the consolidated and combined financial statements. We believe that our audits provide a reasonable basis for our opinion.
/s/ KPMG LLP
We have served as the Company’s auditor since 2011.
Houston, Texas
March 12, 2020
Report of Independent Registered Public Accounting Firm
To the Stockholders and Board of Directors
NexTier Oilfield Solutions Inc.:
Opinion on Internal Control Over Financial Reporting
We have audited NexTier Oilfield Solutions Inc. and subsidiaries’ (the Company) internal control over financial reporting as of December 31, 2019, based on criteria established in Internal Control - Integrated Framework (2013) issued by the Committee of Sponsoring Organizations of the Treadway Commission. In our opinion, the Company maintained, in all material respects, effective internal control over financial reporting as of December 31, 2019, based on criteria established in Internal Control - Integrated Framework (2013) issued by the Committee of Sponsoring Organizations of the Treadway Commission.
We also have audited, in accordance with the standards of the Public Company Accounting Oversight Board (United States) (PCAOB), the consolidated balance sheets of the Company as of December 31, 2019 and 2018, and the related consolidated and combined statements of operations and comprehensive income (loss), changes in stockholders’ equity, and cash flows for each of the years in the three-year period ended December 31, 2019, and related notes (collectively, the consolidated and combined financial statements), and our report dated March 12, 2020 expressed an unqualified opinion on those consolidated and combined financial statements.
The Company acquired C&J Energy Services, Inc. during 2019, and management excluded from its assessment of the effectiveness of the Company’s internal control over financial reporting as of December 31, 2019, C&J Energy Services, Inc.’s internal control over financial reporting associated with total assets of $708.5 million and total revenues of $196.7 million included in the consolidated financial statements of the Company as of and for the year ended December 31, 2019. Our audit of internal control over financial reporting of the Company also excluded an evaluation of the internal control over financial reporting of C&J Energy Services, Inc.
Basis for Opinion
The Company’s management is responsible for maintaining effective internal control over financial reporting and for its assessment of the effectiveness of internal control over financial reporting, included in the accompanying Management’s Report on Internal Control Over Financial Reporting. Our responsibility is to express an opinion on the Company’s internal control over financial reporting based on our audit. We are a public accounting firm registered with the PCAOB and are required to be independent with respect to the Company in accordance with the U.S. federal securities laws and the applicable rules and regulations of the Securities and Exchange Commission and the PCAOB.
We conducted our audit in accordance with the standards of the PCAOB. Those standards require that we plan and perform the audit to obtain reasonable assurance about whether effective internal control over financial reporting was maintained in all material respects. Our audit of internal control over financial reporting included obtaining an understanding of internal control over financial reporting, assessing the risk that a material weakness exists, and testing and evaluating the design and operating effectiveness of internal control based on the assessed risk. Our audit also included performing such other procedures as we considered necessary in the circumstances. We believe that our audit provides a reasonable basis for our opinion.
Definition and Limitations of Internal Control Over Financial Reporting
A company’s internal control over financial reporting is a process designed to provide reasonable assurance regarding the reliability of financial reporting and the preparation of financial statements for external purposes in accordance with generally accepted accounting principles. A company’s internal control over financial reporting includes those policies and procedures that (1) pertain to the maintenance of records that, in reasonable detail, accurately and fairly reflect the transactions and dispositions of the assets of the company; (2) provide reasonable assurance that transactions are recorded as necessary to permit preparation of financial statements in accordance
with generally accepted accounting principles, and that receipts and expenditures of the company are being made only in accordance with authorizations of management and directors of the company; and (3) provide reasonable assurance regarding prevention or timely detection of unauthorized acquisition, use, or disposition of the company’s assets that could have a material effect on the financial statements.
Because of its inherent limitations, internal control over financial reporting may not prevent or detect misstatements. Also, projections of any evaluation of effectiveness to future periods are subject to the risk that controls may become inadequate because of changes in conditions, or that the degree of compliance with the policies or procedures may deteriorate.
/s/ KPMG LLP
Houston, Texas
March 12, 2020
71
NEXTIER OILFIELD SOLUTIONS INC. AND SUBSIDIARIES
Consolidated Balance Sheets
(Amounts in thousands)
| December 31, 2019 | December 31, 2018 | ||||||||
| Assets | |||||||||
| Current assets: | |||||||||
| Cash and cash equivalents | $ | 255,015 | $ | 80,206 | |||||
| Trade and other accounts receivable, net | 350,765 | 210,428 | |||||||
| Inventories, net | 61,641 | 35,669 | |||||||
| Assets held for sale | 141 | 176 | |||||||
| Prepaid and other current assets | 20,492 | 5,784 | |||||||
| Total current assets | 688,054 | 332,263 | |||||||
| Operating lease right-of-use assets | 54,503 | — | |||||||
| Finance lease right-of-use assets | 9,511 | — | |||||||
| Property and equipment, net | 709,404 | 531,319 | |||||||
| Goodwill | 137,458 | 132,524 | |||||||
| Intangible assets | 55,021 | 51,904 | |||||||
| Other noncurrent assets | 10,956 | 6,569 | |||||||
| Total assets | $ | 1,664,907 | $ | 1,054,579 | |||||
| Liabilities and Stockholders’ Equity | |||||||||
| Liabilities | |||||||||
| Current liabilities: | |||||||||
| Accounts payable | $ | 115,251 | $ | 106,702 | |||||
| Accrued expenses | 234,895 | 101,539 | |||||||
| Current maturities of long-term operating lease liabilities | 23,473 | — | |||||||
| Current maturities of long-term finance lease liabilities | 4,594 | 4,928 | |||||||
| Current maturities of long-term debt | 2,311 | 2,776 | |||||||
| Stock-based compensation | — | 4,281 | |||||||
| Other current liabilities | 5,670 | 354 | |||||||
| Total current liabilities | 386,194 | 220,580 | |||||||
| Long-term operating lease liabilities, less current maturities | 35,123 | — | |||||||
| Long-term finance lease liabilities, less current maturities | 4,844 | 5,581 | |||||||
| Long-term debt, net of deferred financing costs and debt discount, less current maturities | 335,312 | 337,954 | |||||||
| Other noncurrent liabilities | 16,662 | 3,283 | |||||||
| Total noncurrent liabilities | 391,941 | 346,818 | |||||||
| Total liabilities | 778,135 | 567,398 | |||||||
| Stockholders’ equity | |||||||||
| Common stock, par value $0.01 per share (authorized 500,000 shares, issued and outstanding 212,410 and 104,188 shares, respectively) | 2,124 | 1,038 | |||||||
| Paid-in capital in excess of par value | 966,762 | 455,447 | |||||||
| Retained earnings (deficit) | (73,333 | ) | 31,494 | ||||||
| Accumulated other comprehensive loss | (8,781 | ) | (798 | ) | |||||
| Total stockholders’ equity | 886,772 | 487,181 | |||||||
| Total liabilities and stockholders’ equity | $ | 1,664,907 | $ | 1,054,579 | |||||
See accompanying notes to the consolidated and combined financial statements.
72
NEXTIER OILFIELD SOLUTIONS INC. AND SUBSIDIARIES
Consolidated and Combined Statements of Operations and Comprehensive (Loss) Income
(Amounts in thousands, except for per share amounts)
| Year Ended December 31, | ||||||||||||
| 2019 | 2018 | 2017 | ||||||||||
| Revenue | $ | 1,821,556 | $ | 2,137,006 | $ | 1,542,081 | ||||||
| Operating costs and expenses: | ||||||||||||
Cost of services (1) | 1,403,932 | 1,660,546 | 1,282,561 | |||||||||
| Depreciation and amortization | 292,150 | 259,145 | 159,280 | |||||||||
| Selling, general and administrative expenses | 123,676 | 113,810 | 84,853 | |||||||||
| Merger and integration | 68,731 | 448 | 8,673 | |||||||||
| (Gain) loss on disposal of assets | 4,470 | 5,047 | (2,555 | ) | ||||||||
| Impairment expense | 12,346 | — | — | |||||||||
| Total operating costs and expenses | 1,905,305 | 2,038,996 | 1,532,812 | |||||||||
| Operating income (loss) | (83,749 | ) | 98,010 | 9,269 | ||||||||
| Other income (expense): | ||||||||||||
| Other income (expense), net | 453 | (905 | ) | 13,963 | ||||||||
| Interest expense | (21,856 | ) | (33,504 | ) | (59,223 | ) | ||||||
| Total other expenses | (21,403 | ) | (34,409 | ) | (45,260 | ) | ||||||
| Income (loss) before income taxes | (105,152 | ) | 63,601 | (35,991 | ) | |||||||
| Income tax expense | (1,005 | ) | (4,270 | ) | (150 | ) | ||||||
| Net income (loss) | (106,157 | ) | 59,331 | (36,141 | ) | |||||||
| Net loss attributable to predecessor | — | — | (7,918 | ) | ||||||||
| Net income (loss) attributable to NexTier | (106,157 | ) | 59,331 | (28,223 | ) | |||||||
| Other comprehensive income (loss), net of tax: | ||||||||||||
| Foreign currency translation adjustments | (116 | ) | (114 | ) | 96 | |||||||
| Hedging activities | (7,628 | ) | (880 | ) | 791 | |||||||
| Total comprehensive income (loss) | $ | (113,901 | ) | $ | 58,337 | $ | (35,254 | ) | ||||
| Net income (loss) per share: | ||||||||||||
| Basic net income (loss) per share | $ | (0.86 | ) | $ | 0.54 | $ | (0.34 | ) | ||||
| Diluted net income (loss) per share | $ | (0.86 | ) | $ | 0.54 | $ | (0.34 | ) | ||||
| Weighted-average shares outstanding: basic | 122,977 | 109,335 | 106,321 | |||||||||
| Weighted-average shares outstanding: diluted | 122,977 | 109,660 | 106,321 | |||||||||
(1) | Cost of services during the years ended December 31, 2019, 2018, and 2017 excludes depreciation of $276.8 million, $245.6 million, and $150.6 million, respectively. Depreciation related to cost of services is presented within depreciation and amortization separately. |
See accompanying notes to the consolidated and combined financial statements.
73
NEXTIER OILFIELD SOLUTIONS INC. AND SUBSIDIARIES
Consolidated and Combined Statements of Changes in Stockholders’ Equity
(Amounts in thousands)
| Members’ equity | Common Stock | Paid-in Capital in Excess of Par Value | Retained Earnings (deficit) | Accumulated other comprehensive income (loss) | Total | |||||||||||||||||||
| Balance as of December 31, 2016 | $ | 453,810 | $ | — | $ | — | $ | (288,771 | ) | $ | (2,787 | ) | $ | 162,252 | ||||||||||
| Net loss prior to the Organizational Transactions | — | — | — | (7,918 | ) | — | (7,918 | ) | ||||||||||||||||
| Effect of the Organizational Transactions | (453,810 | ) | — | 156,270 | 297,540 | — | — | |||||||||||||||||
| Issuance of common stock sold in initial public offering, net of offering costs and deferred stock awards for executives | — | 1,031 | 245,902 | — | — | 246,933 | ||||||||||||||||||
| Stock-based compensation recognized subsequent to the Organizational Transactions | — | — | 10,578 | — | — | 10,578 | ||||||||||||||||||
| Effect of RockPile acquisition | — | 87 | 130,203 | — | — | 130,290 | ||||||||||||||||||
| Other comprehensive income | — | — | — | — | 1,059 | 1,059 | ||||||||||||||||||
| Deferred tax adjustment | — | — | (1,879 | ) | — | — | (1,879 | ) | ||||||||||||||||
| Net loss subsequent to Organizational Transactions | — | — | — | (28,223 | ) | — | (28,223 | ) | ||||||||||||||||
| Balance as of December 31, 2017 | $ | — | $ | 1,118 | $ | 541,074 | $ | (27,372 | ) | $ | (1,728 | ) | $ | 513,092 | ||||||||||
Stock-based compensation(1) | — | 2 | 21,458 | — | — | 21,460 | ||||||||||||||||||
| Shares repurchased and retired related to stock-based compensation | — | (1 | ) | (3,578 | ) | — | — | (3,579 | ) | |||||||||||||||
| Shares repurchased and retired related to stock repurchase program | — | (81 | ) | (103,507 | ) | (1,273 | ) | — | (104,861 | ) | ||||||||||||||
| Other comprehensive income | — | — | — | 808 | 930 | 1,738 | ||||||||||||||||||
| Net income | — | — | — | 59,331 | — | 59,331 | ||||||||||||||||||
| Balance as of December 31, 2018 | $ | — | $ | 1,038 | $ | 455,447 | $ | 31,494 | $ | (798 | ) | $ | 487,181 | |||||||||||
| New lease standard implementation | — | — | — | 1,330 | — | 1,330 | ||||||||||||||||||
Stock-based compensation(1) | — | 33 | 33,226 | — | — | 33,259 | ||||||||||||||||||
| Shares repurchased and retired related to stock-based compensation | — | (6 | ) | (5,976 | ) | — | — | (5,982 | ) | |||||||||||||||
| Other comprehensive income (loss) | — | — | — | — | (7,983 | ) | (7,983 | ) | ||||||||||||||||
| Equity issued in connection with the C&J Merger | — | 1,059 | 484,065 | — | — | 485,124 | ||||||||||||||||||
| Net loss | — | — | — | (106,157 | ) | — | (106,157 | ) | ||||||||||||||||
| Balance as of December 31, 2019 | $ | — | $ | 2,124 | $ | 966,762 | $ | (73,333 | ) | $ | (8,781 | ) | $ | 886,772 | ||||||||||
(1) | Stock-based compensation during 2019 and 2018 includes stock-based compensation expense recognized during the period of $29.0 million and $17.2 million and the vested deferred stock awards of $4.3 million and $4.3 million, respectively. Refer to Note (12) Stock-Based Compensation for further discussion of the Company’s stock-based compensation. |
See accompanying notes to the consolidated and combined financial statements.
74
NEXTIER OILFIELD SOLUTIONS INC. AND SUBSIDIARIES
Consolidated and Combined Statements of Cash Flows
(Amounts in thousands)
| Year Ended December 31, | ||||||||||||
| 2019 | 2018 | 2017 | ||||||||||
| Cash flows from operating activities: | ||||||||||||
| Net income (loss) | $ | (106,157 | ) | $ | 59,331 | $ | (36,141 | ) | ||||
| Adjustments to reconcile net income (loss) to net cash provided by operating activities | ||||||||||||
| Depreciation and amortization | 292,150 | 259,145 | 159,280 | |||||||||
| Amortization of deferred financing fees | 1,360 | 3,147 | 5,241 | |||||||||
| (Gain) loss on disposal of assets | 4,470 | 5,047 | (2,555 | ) | ||||||||
| Stock-based compensation | 28,977 | 17,166 | 10,578 | |||||||||
| Loss on debt extinguishment/modification, including prepayment premiums | 526 | 7,563 | 31,084 | |||||||||
| Loss on contingent consideration liability | — | 13,254 | — | |||||||||
| Loss on foreign currency translation | — | 2,621 | — | |||||||||
| Unrealized gain (loss) on derivatives | (7,628 | ) | (880 | ) | 791 | |||||||
| Realized (gain) loss on derivatives | (239 | ) | (697 | ) | 172 | |||||||
| Gain on insurance proceeds recognized in other income | — | (14,892 | ) | — | ||||||||
| Loss on impairment of assets | 12,346 | — | — | |||||||||
| Other non-cash expenses | — | — | (322 | ) | ||||||||
| Changes in operating assets and liabilities | ||||||||||||
| Decrease (increase) in trade and other accounts receivable, net | 172,566 | 27,485 | (113,047 | ) | ||||||||
| Decrease (increase) in inventories | 17,181 | (2,725 | ) | (15,475 | ) | |||||||
| Decrease in prepaid and other current assets | 3,703 | 2,734 | 20,294 | |||||||||
| Decrease (increase) in other assets | (242 | ) | 362 | (336 | ) | |||||||
| Increase (decrease) in accounts payable | (17,799 | ) | 11,304 | (141 | ) | |||||||
| Decrease in customer contract liabilities | — | (4,940 | ) | — | ||||||||
| Increase (decrease) in accrued expenses | (103,609 | ) | (32,318 | ) | 41,446 | |||||||
| Increase (decrease) in other liabilities | 7,858 | (2,396 | ) | (21,178 | ) | |||||||
| Net cash provided by operating activities | 305,463 | 350,311 | 79,691 | |||||||||
| Cash flows from investing activities | ||||||||||||
| Asset and business acquisitions, including cash acquired | 68,807 | (35,003 | ) | (116,576 | ) | |||||||
| Purchase of property and equipment | (200,385 | ) | (277,569 | ) | (141,340 | ) | ||||||
| Advances of deposit on equipment | (7,451 | ) | (4,153 | ) | (23,096 | ) | ||||||
| Payments for leasehold improvements | — | (1,651 | ) | (157 | ) | |||||||
| Implementation of software | (4,408 | ) | (883 | ) | (687 | ) | ||||||
| Proceeds from sale of assets | 29,114 | 4,652 | 30,565 | |||||||||
| Proceeds from insurance recoveries | 223 | 18,247 | 515 | |||||||||
| Equity-method investment | — | (1,146 | ) | — | ||||||||
| Net cash used in investing activities | (114,100 | ) | (297,506 | ) | (250,776 | ) | ||||||
| Cash flows from financing activities: | ||||||||||||
| Proceeds from issuance of common stock | — | — | 255,494 | |||||||||
75
NEXTIER OILFIELD SOLUTIONS INC. AND SUBSIDIARIES
Consolidated and Combined Statements of Cash Flows
(Amounts in thousands)
| Proceeds from the secured notes and term loan facilities | — | 348,250 | 285,000 | |||||||||
| Payments on the secured notes and term loan facilities | (3,500 | ) | (284,952 | ) | (289,902 | ) | ||||||
| Payments on finance leases | (6,035 | ) | (4,119 | ) | (2,861 | ) | ||||||
| Prepayment premiums on early debt extinguishment | — | — | (15,817 | ) | ||||||||
| Payment of debt issuance costs | (1,229 | ) | (7,331 | ) | (13,792 | ) | ||||||
| Payment of contingent consideration liability | — | (11,962 | ) | — | ||||||||
| Shares repurchased and retired related to share repurchase program | — | (104,861 | ) | — | ||||||||
| Shares repurchased and retired related to stock-based compensation | (5,982 | ) | (3,579 | ) | — | |||||||
| Net cash provided by (used in) financing activities | (16,746 | ) | (68,554 | ) | 218,122 | |||||||
| Non-cash effect of foreign translation adjustments | 192 | (165 | ) | 163 | ||||||||
| Net increase (decrease) in cash, cash equivalents and restricted cash | 174,809 | (15,914 | ) | 47,200 | ||||||||
| Cash, cash equivalents and restricted cash, beginning | 80,206 | 96,120 | 48,920 | |||||||||
| Cash, cash equivalents and restricted cash, ending | $ | 255,015 | $ | 80,206 | $ | 96,120 | ||||||
| Supplemental disclosure of cash flow information: | ||||||||||||
| Cash paid during the period for: | ||||||||||||
| Interest expense, net | $ | 20,836 | $ | 24,528 | $ | 30,104 | ||||||
| CVR settlement | — | 19,918 | — | |||||||||
| Income taxes | 1,726 | 5,529 | — | |||||||||
| Non-cash investing and financing activities: | ||||||||||||
| Change in accrued capital expenditures | $ | (17,274 | ) | $ | 2,930 | $ | 21,549 | |||||
| Non-cash additions to finance right-of use assets | 6,269 | — | — | |||||||||
| Non-cash additions to finance lease liabilities, including current maturities | (6,286 | ) | — | — | ||||||||
| Non-cash additions to operating right-of-use assets | 65,551 | — | — | |||||||||
| Non-cash additions to operating lease liabilities, including current maturities | (65,297 | ) | — | — | ||||||||
| Fair value of C&J assets acquired | 806,218 | — | — | |||||||||
| 106,627 shares of NexTier common stock issued in exchange for C&J capital stock and replacement awards | (485,124 | ) | — | — | ||||||||
| C&J liabilities assumed | (321,094 | ) | — | — | ||||||||
See accompanying notes to the consolidated and combined financial statements.
76
NEXTIER OILFIELD SOLUTIONS INC. AND SUBSIDIARIES
Notes to the Consolidated and Combined Financial Statements
(1) Basis of Presentation and Nature of Operations
On October 13, 2016, NexTier Oilfield Solutions Inc. (the “Company” or “NexTier”) was formed as Keane Group, Inc. ("Keane"), a Delaware corporation to be a holding corporation for Keane Group Holdings, LLC and its subsidiaries (collectively referred to as “Keane Group”), for the purpose of facilitating the initial public offering (the “IPO”) of shares of common stock of the Company.
On October 31, 2019, the Company completed its merger (the “C&J Merger”) with C&J Energy Services, Inc. (“C&J”) and changed its name to "NexTier Oilfield Solutions Inc." For more details regarding the C&J Merger, refer to Note (3) Mergers and Acquisitions.
The accompanying consolidated and combined financial statements were prepared using United States Generally Accepted Accounting Principles (“GAAP”) and the instructions to Form 10-K and Regulation S-X and include all of the accounts of NexTier and its consolidated subsidiaries. All intercompany transactions and balances have been eliminated.
The Company’s accounting policies are in accordance with GAAP. The preparation of financial statements in conformity with these accounting principles requires the Company to make estimates and assumptions that affect (1) the reported amounts of assets and liabilities and disclosure of contingent assets and liabilities at the date of the financial statements and (2) the reported amounts of revenue and expenses during the reporting period. Ultimate results could differ from the Company’s estimates. Significant items subject to such estimates and assumptions include the useful lives of property and equipment and intangible assets; allowances for doubtful accounts; inventory reserves; acquisition accounting; contingent liabilities; and the valuation of property and equipment, intangible assets, equity issued as consideration in an acquisition, income taxes, stock-based incentive plan awards and derivatives.
Management believes the consolidated and combined financial statements included herein contain all adjustments necessary to present fairly the Company’s financial position as of December 31, 2019 and 2018 and the results of its operations and cash flows for the years ended December 31, 2019, 2018 and 2017. Such adjustments are of a normal recurring nature.
The consolidated and combined financial statements for the period from January 1, 2017 to July 2, 2017 reflect only the historical results of the Company prior to the completion of the Company’s acquisition of RockPile (as defined herein). The consolidated and combined financial statements for the period from January 1, 2019 to October 31, 2019 reflect only the historical results of the Company prior to the completion of the C&J Merger. The financial statements have been prepared using the acquisition method of accounting under existing U.S. GAAP, which requires that one of the two companies in the C&J Merger be designated as the acquirer for accounting purposes. C&J and Keane determined that Keane was the accounting acquirer. Accordingly, consideration given by Keane to complete the C&J Merger was allocated to the underlying tangible and intangible assets and liabilities acquired based on their estimated fair values as of the date of completion of the C&J Merger, with any excess purchase price allocated to goodwill.
Earnings per share and weighted-average shares outstanding for the year ended December 31, 2017 have been presented giving pro forma effect to the Organizational Transactions (as defined herein) as if they had occurred on January 1, 2016. Financial results for the years ended December 31, 2017 are the financial results of Keane and Keane Group, the Company’s predecessor for accounting purposes, as there was no activity under Keane prior to 2017.
77
NEXTIER OILFIELD SOLUTIONS INC. AND SUBSIDIARIES
Notes to the Consolidated and Combined Financial Statements
(a) Initial Public Offering
On January 25, 2017, the Company completed the IPO of 30,774,000 shares of its common stock at the public offering price of $19.00 per share, which included 15,700,000 shares offered by the Company and 15,074,000 shares offered by the selling stockholder, including 4,014,000 shares sold as a result of the underwriters’ exercise of their overallotment option. The IPO proceeds to the Company, net of underwriters’ fees and capitalized cash payments of $4.8 million for professional services and other direct IPO related activities, was $255.5 million. The net proceeds were used to fully repay KGH Intermediate Holdco II, LLC’s (“Holdco II”) term loan balance of $99.0 million and the associated prepayment premium of $13.8 million, and to repay $50.0 million of its 12% secured notes due 2019 (“Senior Secured Notes”) and the associated prepayment premium of approximately $0.5 million. The remaining proceeds were used for general corporate purposes, including capital expenditures, working capital and potential acquisitions and strategic transactions. Upon completion of the IPO and the reorganization, the Company had 103,128,019 shares of common stock outstanding.
All underwriting discounts and commissions and other specific costs directly attributable to the IPO were deferred and netted against the gross proceeds of the offering through paid-in capital in excess of par value.
(b) Organizational Transactions
In connection with the IPO, the Company completed a series of organizational transactions (the “Organizational Transactions”), including the following:
Certain entities affiliated with Cerberus Capital Management, L.P., certain members of the Keane family, Trican Well Service Ltd. (“Trican”) and certain members of the Company’s management team (collectively, the “Existing Owners”) contributed all of their direct and indirect equity interests in Keane Group to Keane Investor Holdings LLC (“Keane Investor”);
Keane Investor contributed all of its equity interests in Keane Group to the Company in exchange for common stock of the Company; and
The Company’s independent directors received grants of restricted stock of the Company in substitution for their interests in Keane Group.
The Organizational Transactions represented a transaction between entities under common control and were accounted for similarly to pooling of interests in a business combination. The common stock of the Company issued to Keane Investor in exchange for its equity interests in Keane Group was recognized by the Company at the carrying value of the equity interests in Keane Group. In addition, the Company became the successor and Keane Group the predecessor for the purposes of financial reporting. The financial statements for the periods prior to the IPO and Organizational Transactions have been adjusted to combine and consolidate the previously separate entities for presentation purposes.
As a result of the Organizational Transactions and the IPO, (i) the Company became a holding company with no material assets other than its ownership of Keane Group, (ii) an aggregate of 72,354,019 shares of the Company’s common stock were owned by Keane Investor and certain of the Company’s independent directors, and Keane Investor entered into a Stockholders’ Agreement with the Company, (iii) the Existing Owners became holders of equity interests in the Company’s controlling stockholder, Keane Investor (and holders of Keane Group’s Class B and Class C Units became holders of Class B and Class C Units in Keane Investor) and (iv) the capital stock of the Company consists of (x) common stock, entitled to 1 vote per share on all matters submitted to a vote of stockholders and (y) undesignated and unissued preferred stock.
78
NEXTIER OILFIELD SOLUTIONS INC. AND SUBSIDIARIES
Notes to the Consolidated and Combined Financial Statements
(2) Summary of Significant Accounting Policies
(a) Business Combinations and Asset Acquisitions
Business combinations are accounted for using the acquisition method of accounting in accordance with the Accounting Standards Codification (“ASC”) 805, “Business Combinations”, as amended by Accounting Standards Update (“ASU”) 2017-01, “Business Combinations (Topic 805), Clarifying the Definition of a Business.” The purchase price is allocated to the assets acquired and liabilities assumed based on their estimated fair values. Fair value of the acquired assets and liabilities is measured in accordance with the guidance of ASC 820, using discounted cash flows and other applicable valuation techniques. Any acquisition related costs incurred by the Company are expensed as incurred. Any excess purchase price over the fair value of the net identifiable assets acquired is recorded as goodwill if the definition of a business is met. Operating results of an acquired business are included in the Company’s results of operations from the date of acquisition.
Asset acquisitions are measured based on their cost to the Company, including transaction costs. Asset acquisition costs, or the consideration transferred by the Company, are assumed to be equal to the fair value of the net assets acquired. If the consideration transferred is cash, measurement is based on the amount of cash the Company paid to the seller as well as transaction costs incurred. Consideration given in the form of nonmonetary assets, liabilities incurred or equity interests issued is measured based on either the cost to the Company or the fair value of the assets or net assets acquired, whichever is more clearly evident. The cost of an asset acquisition is allocated to the assets acquired based on their estimated relative fair values. Goodwill is not recognized in an asset acquisition.
Refer to Note (3)Mergers and Acquisitionsfor discussion of the mergers and acquisitions completed in 2019, 2018, and 2017.
(b) Cash and Cash Equivalents
The Company considers all highly liquid investments with a maturity of three months or less when purchased to be cash equivalents. The Company’s cash is invested in overnight repurchase agreements and certificates of deposit with an initial term of less than three months.
Net cash received from certain dispositions or casualty events of more than $25.0 million per single transaction or $50.0 million per series of related transactions, under the 2018 Term Loan Facility (as defined herein), and of more than $50.0 million, under the 2019 ABL Facility (as defined herein), is not considered to be restricted as long as the Company, at management’s discretion, reinvests any part of such proceeds in assets (other than current assets) to be used for its business (in the case of the 2018 Term Loan Facility) and for replacing or repairing the assets in respect of which such proceeds were received (in the case of the 2019 ABL Facility), in each case within 12 months from the receipt date of such proceeds. Otherwise, the proceeds are required to be applied as a prepayment of the 2018 Term Loan Facility or any outstanding commitments under the 2019 ABL Facility. The Company did 0t have any qualifying asset sale proceeds or insurance proceeds that exceeded the dollar thresholds described above for the year ended December 31, 2019 and 2018.
Cash balances related to the Company's captive insurance subsidiary, which totaled 20.1 million at December 31, 2019, are included in cash and cash equivalents in the consolidated balance sheets, and the Company expects to use these cash balances to fund the operations of the captive insurance subsidiaries and to settle future anticipated claims.
The Company did 0t have any restricted cash as of December 31, 2019 and 2018.
(c) Trade Accounts Receivable
Trade accounts receivable are generally recorded at the invoiced amount. Amounts collected on trade accounts receivable are included in net cash provided by operating activities in the consolidated and combined statements of cash flows. The Company analyzes the need for an allowance for doubtful accounts for estimated losses related to potentially uncollectible accounts receivable on a case by case basis throughout the year. In establishing the required allowance, management considers historical losses, adjusted to take into account current
79
NEXTIER OILFIELD SOLUTIONS INC. AND SUBSIDIARIES
Notes to the Consolidated and Combined Financial Statements
market conditions as well as the financial condition of the Company’s customers, the balance of receivables in dispute, the current receivables aging and current payment patterns. Trade accounts receivable were $350.6 million and $210.1 million at December 31, 2019and2018, respectively. As of December 31, 2019, and2018, the Company had an allowance for doubtful accounts of $0.7 million and $0.5 million, respectively.
(d) Inventories
Inventories are stated at the lower of cost or net realizable value. Costs of inventories include purchase, conversion and condition. As inventory is consumed, the expense is recorded in cost of services in the consolidated and combined statements of operations and comprehensive income (loss) using the weighted average cost method for all inventories.
The Company periodically reviews the nature and quantities of inventory on hand and evaluates the net realizable value of items based on historical usage patterns, known changes to equipment or processes and customer demand for specific products. Significant or unanticipated changes in business conditions could impact the magnitude and timing of impairment recognized. Provision for excess or obsolete inventories is determined based on historical usage of inventory on-hand, volume on-hand versus anticipated usage, technological advances and consideration of current market conditions. Inventories that have not turned over for more than a year are subject to a slow-moving reserve provision. In addition, inventories that have become obsolete due to technological advances, excess volume on-hand or no longer configured to operate with the Company’s equipment are written-off.
(e) Revenue Recognition
The Company adopted ASU 2014-09, “Revenue from Contracts with Customers,” which outlines a single comprehensive model for entities to use in accounting for revenue arising from contracts with customers, effective January 1, 2018, using the modified retrospective method. Changes were made to the relevant business processes and the related control activities, including information systems, in order to monitor and maintain appropriate controls over financial reporting. There were no significant changes to the Company’s internal control over financial reporting due to the Company’s adoption of ASU 2014-09.
The Company recognizes revenue when it satisfies a performance obligation by transferring control over a product or service to a customer. To achieve this core principle, ASC 606 requires the Company to apply the following five steps: (1) identify the contract with a customer, (2) identify the performance obligations in the contract, (3) determine the transaction price, (4) allocate the transaction price to performance obligations in the contract, and (5) recognize revenue when or as the Company satisfies a performance obligation. The five-step model requires management to exercise judgment when evaluating contracts and recognizing revenue.
Identify the Contract and Determine Transaction Price
The Company typically provides its services (i) under term pricing agreements; (ii) under contracts that include dedicated fleet or unit arrangements; (iii) on a spot market basis; and (iv) under term contracts that include “take-or-pay” provisions.
Under term pricing agreements, the Company and customer agree to set pricing for a specified period of time. The agreed-upon pricing is subject to periodic review, as specifically defined in the agreement, and may be adjusted upon the agreement of both parties. These agreements typically do not feature provisions obligating either party to commit to a certain utilization level. Additionally, these agreements typically allow either party to terminate the agreement for its convenience without incurring a termination penalty.
Under dedicated unit arrangements, customers typically commit to targeted utilization levels based on a specified number of fracturing stages per calendar month or fulfilling the customer's requirements, in either instance at agreed-upon pricing. These agreements typically do not feature obligations to pay for services not used by the customer. In addition, the agreed-upon pricing is typically subject to periodic review, as specifically defined in the agreement, and may be adjusted upon the agreement of both parties. These contracts also typically allow for termination for either party's convenience with a brief notice period and may feature a termination penalty in the event the customer terminates the contract for its convenience.
80
NEXTIER OILFIELD SOLUTIONS INC. AND SUBSIDIARIES
Notes to the Consolidated and Combined Financial Statements
Rates for services performed on a spot market basis are based on an agreed-upon spot market rate unique to each service line.
Under term contracts with “take-or-pay” provisions, the Company’s customers are typically obligated to pay on a monthly basis for a specified quantity of services, whether or not those services are actually utilized. To the extent customers use more than the specified contracted minimums, the Company will charge a pre-agreed amount for the provision of such additional services, which amounts are typically subject to periodic review. In addition, these contracts typically feature a termination penalty in the event the customer terminates the contract for its convenience.
"Take-or-pay" provisions are considered stand ready performance obligations. The Company recognizes "take-or-pay" revenues using a time-based measure of progress, as the Company cannot reasonably estimate if and when the customer will require the Company to provide the services; likewise, the customer benefits as the Company is standing by to provide such services.
Identify and Satisfy the Performance Obligations
The majority of the Company’s performance obligations are satisfied over time. The Company has determined this best represents the transfer of value from its services to the customer as performance by the Company helps to enhance a customer controlled asset (e.g., unplugging a well, enabling a well to produce oil or natural gas). Measurement of the satisfaction of the performance obligation is measured using the output method, which is typically evidenced by a field ticket. A field ticket includes items such as services performed, consumables used, and man hours incurred to complete the job for the customer. Each field ticket is used to invoice customers. Payment terms for invoices issued are in accordance with a master services agreement with each customer, which typically require payment within 30 days of the invoice issuance.
A portion of the Company’s contracts contain variable consideration; however, this variable consideration is typically unknown at the time of contract inception, and is not known until the job is complete, at which time the variability is resolved. Examples of variable consideration include the number of hours that will be incurred and the amount of consumables (such as chemicals and proppants) that will be used to complete a job.
In the course of providing services to its customers, the Company may use consumables; for example, in the Company’s fracturing business, chemicals and proppants are used in the fracturing service for the customer. ASC 606 requires that goods or services promised to a customer be identified separately when they are distinct within the contract. However, the consumables are used to complete the service for the customer and are not beneficial to the customer on their own. As such, the consumables are not a separate performance obligation, but instead are combined with the other services within the context of the contract and accounted for as a single performance obligation.
Remaining Performance Obligations
The Company invoices its customers for the services provided at contractual rates multiplied by the applicable unit of measurement, including volume of consumables used and hours incurred. In accordance with ASC 606, the Company has elected the “Right to Invoice” practical expedient for all contracts, which allows the Company to invoice its customers in an amount that corresponds directly with the value to the customer of the entity’s performance completed to date. With this election, the Company is not required to disclose information about the variable consideration related to its remaining performance obligations. The Company has also elected the practical expedient to expense immediately mobilization costs, as the amortization period would always be less than one year. As a result of electing these practical expedients, there was no material impact on the Company’s current revenue recognition processes and no retrospective adjustments were necessary. For those contracts with a term of more than one year, the Company had approximately $31.0 million of unsatisfied performance obligations as of December 31, 2019, which will be recognized as services are performed over the remaining contractual terms.
The Company’s obligations for refunds as well as the warranties and related obligations stated in its contracts with its customers are standard to the industry and are related to the correction of any defectiveness in the execution of its performance obligations.
81
NEXTIER OILFIELD SOLUTIONS INC. AND SUBSIDIARIES
Notes to the Consolidated and Combined Financial Statements
Contract Balances
In line with industry practice, the Company bills its customers for its services in arrears, typically when the stage or well is completed or at month-end. The majority of the Company’s jobs are completed in less than 30 days. Furthermore, it is currently not standard practice for the Company to execute contracts with prepayment features. As such, the Company’s contract liabilities are immaterial to its consolidated balance sheets. Payment terms after invoicing are typically 30 days or less.
The Company does not have any significant contract costs to obtain or fulfill contracts with customers; as such, no amounts are recognized on the consolidated balance sheet. Taxes collected from customers and remitted to governmental authorities are accounted for on a net basis and, therefore, are excluded from revenues in the consolidated and combined statements of operations and comprehensive income (loss) and net cash provided by operating activities in the consolidated and combined statements of cash flows.
The following is a description of the Company’s core service lines separated by reportable segments from which the Company generates its revenue. For additional detailed information regarding reportable segments, see (21)Business Segments.
Revenue from the Company’s Completion Services, Well Construction and Intervention (“WC&I”), and Well Support Services segments are recognized as follows:
Completion Services
The Company provides hydraulic fracturing, wireline and wirelinepumpdown services pursuant to contractual arrangements, such as term contracts and pricing agreements, oragreements. Revenue from these services are earned as services are rendered, which is generally on a spot market basis. Revenueper stage or fixed monthly rate. All revenue is recognized uponwhen a contract with a customer exists, the completionperformance obligations under the contract have been satisfied over time, the amount to which the Company has the right to invoice has been determined and collectability of each job. amounts subject to invoice is probable. Contract fulfillment costs, such as mobilization costs and shipping and handling costs, are expensed as incurred and are recorded in cost of services in the consolidated and combined statements of operations and comprehensive income (loss). To the extent fulfillment costs are considered separate performance obligations that are billable to the customer, the amounts billed are recorded as revenue in the consolidated and combined statements of operations and comprehensive income (loss).
Once a jobstage has been completed, to the customer’s satisfaction, a field ticket is created that includes charges for the service performed and the chemicals and proppant consumed during the course of the service. The field ticket may also include charges for the mobilization of the equipment to the location, which is recognized at the beginning of the job upon arriving on location,any additional equipment used on the job if any, and other miscellaneous items. ThisThe field ticket is usedrepresents the amounts to create anwhich the Company has the right to invoice which is sentand to the customer upon the completion of each job.recognize as revenue.
The Company provides certain complementarycementing services such as cementing and drilling pursuant to contractual arrangements, such as term contracts. The Company typically charges the customer for the services performed and resources providedcontracts, or on a daily, hourlyspot market basis. Revenue is recognized upon the completion of each performance obligation, which for cementing services, represents the portion of the well cemented: surface casing, intermediate casing or per job basis.production liner. The performance obligations are satisfied over time. Jobs for these services are typically short term in nature, with most jobs completed in a day. Once the well has been cemented, a field ticket is created that includes charges for the services performed and the consumables used during the course of service. The field ticket represents the amounts to which the Company has the right to invoice and to recognize as revenue.
The Company provides a range of coiled tubing services primarily used for fracturing plug drill-out during completion operations and for well workover and maintenance, primarily on a spot market basis. Jobs for these services are typically short-term in nature, lasting anywhere from a few hours to severalmultiple days. Revenue is recognized upon completion of each day’s work based upon a completed field ticket. The field ticket includes charges for the services performed and the consumables used during the course of service. The field ticket may also include charges for the mobilization and set-up of equipment, the personnel on the job, any additional equipment
82
NEXTIER OILFIELD SOLUTIONS INC. AND SUBSIDIARIES
Notes to the Consolidated and Combined Financial Statements
used on the job, and other miscellaneous items.consumables. The Company typically charges the customer for the services performed and resources provided on a dailyan hourly basis at agreed-upon spot market rates, at times, or pursuant to pricing agreements.
Well Support Services Segment
Through its rig services line, the Company provides workover and well servicing rigs that are primarily used for routine repair and maintenance of oil and gas wells, re-drilling operations and plug and abandonment operations. These services are provided on an hourly basis at prices that approximate spot market rates. A field ticket is generated and revenue is recognized upon the earliest of the completion of a job or at the end of each day. A rig services job can last anywhere from a few hours to multiple days depending on the type of work being performed. The field ticket includes the base hourly rate charge and, if applicable, charges for additional personnel or equipment not contemplated in the base hourly rate. The field ticket may also include charges for the mobilization and set-up of equipment.
Through its fluids management service line, the Company primarily provides storage, transportation and disposal services for fluids used in the drilling, completion and workover of oil and gas wells. Rates for these services vary and can be on a per job, per hour, or per load basis, or on the basis of quantities sold or disposed. Revenue is recognized upon the completion of each job or load, or delivered product, based on a completed field ticket.
Through its other special well site service line, the Company primarily provides fishing, contract labor and tool rental services for completion and workover of oil and gas wells. Rates for these services vary and can be on a per job, per hour or on the basis of rental days per month. Revenue is recognized based on a field ticket issued upon the completion of each job or on a monthly billing for rental services provided.
Disaggregation of Revenue
Revenue activities during the years ended December 31, 2019, 2018 and 2017 were as follows:
| Year Ended December 31, 2019 | ||||||||||||||||
| Completion Services | WC&I | Well Support Services | Total | |||||||||||||
| (In thousands) | ||||||||||||||||
| Geography | ||||||||||||||||
| Northeast | $ | 479,685 | $ | 5,193 | $ | — | $ | 484,878 | ||||||||
| Central | 104,225 | 5,741 | — | 109,966 | ||||||||||||
| West Texas | 839,652 | 24,575 | 9,336 | 873,563 | ||||||||||||
| West | 273,364 | 27,530 | 39,247 | 340,141 | ||||||||||||
| International | 13,008 | — | — | 13,008 | ||||||||||||
| $ | 1,709,934 | $ | 63,039 | $ | 48,583 | $ | 1,821,556 | |||||||||
83
NEXTIER OILFIELD SOLUTIONS INC. AND SUBSIDIARIES
Notes to the Consolidated and Combined Financial Statements
| Year Ended December 31, 2018 | ||||||||||||||||
| Completion Services | WC&I | Well Support Services | Total | |||||||||||||
| (In thousands) | ||||||||||||||||
| Geography | ||||||||||||||||
| Northeast | $ | 790,026 | $ | — | $ | — | $ | 790,026 | ||||||||
| Central | 61,083 | — | — | 61,083 | ||||||||||||
| West Texas | 1,005,630 | 12,256 | — | 1,017,886 | ||||||||||||
| West | 244,217 | 23,794 | — | 268,011 | ||||||||||||
| $ | 2,100,956 | $ | 36,050 | $ | — | $ | 2,137,006 | |||||||||
| Year Ended December 31, 2017 | ||||||||||||||||
| Completion Services | WC&I | Well Support Services | Total | |||||||||||||
| (In thousands) | ||||||||||||||||
| Geography | ||||||||||||||||
| Northeast | $ | 566,931 | $ | — | $ | — | $ | 566,931 | ||||||||
| Central | 103,857 | — | — | 103,857 | ||||||||||||
| West Texas | 635,877 | — | — | 635,877 | ||||||||||||
| West | 220,623 | 7,526 | 7,267 | 235,416 | ||||||||||||
| $ | 1,527,288 | $ | 7,526 | $ | 7,267 | $ | 1,542,081 | |||||||||
(f) Property and Equipment
Property and equipment, inclusive of equipment under capital lease, are generally stated at cost.
Depreciation on property and equipment is calculated using the straight-line method over the estimated useful lives of the assets, which range from 13 months to 40 years. Management bases the estimate of the useful lifelives and salvage valuevalues of property and equipment on expected utilization, technological change and effectiveness of its maintenance programs. When partscomponents of an item of property and equipment are identifiable and have different useful lives, they are accounted for separately as separate items (major components)major components of property and equipment. Equipment held under capital leases are generally amortized on a straight-line basis over the shorter of the estimated useful life of the underlying asset andor the term of the lease.
Gains and losses on disposal of property and equipment are determined by comparing the proceeds from disposal with the carrying amount of property and equipment and are recognized net within operating costs and expenses in the consolidated and combined statements of operations.operations and comprehensive income (loss).
Major classifications of property and equipment and their respective useful lives are as follows:
| Land | Indefinite life |
| Building and leasehold improvements | |
| Machinery and equipment | 13 months – 10 years |
| Office furniture, fixtures and equipment | 3 years – 5 years |
Leasehold improvements are assigned a useful life equal to the term of the related lease.lease, or its expected period of use.
In the first quarter of 2018, the Company reassessed the estimated useful lives of select machinery and equipment. The Company concluded that due to an increase in service intensity driven by a shift to more 24-hour
84
NEXTIER OILFIELD SOLUTIONS INC. AND SUBSIDIARIES
Notes to the Consolidated and Combined Financial Statements
work, higher stage volumes, larger stages and more proppant usage per stage, the estimated useful lives of these select machinery and equipment should be reduced by approximately 50%.
In accordance with ASC 250, “Accounting Changes and Error Corrections,” the change in the estimated useful lives of the Company’s property and equipment was accounted for as a change in accounting estimate, on a prospective basis, effective January 1, 2018. This change resulted in an increase in depreciation expense and decrease in net income during the year ended December 31, 2018 of $15.0 million in the consolidated and combined statement of operations and comprehensive income (loss).
The Company uses the days straight-line depreciation method. Depreciation methods, useful lives and residual values are reviewed annually.annually or as needed based on activities related to specific assets.
The Company incurs maintenance costs on its major equipment. The determination of whether an expenditure should be capitalized or expensed requires management judgment in the application of how the costs benefit future periods, relative to the Company’s capitalization policy. Costs that either establish or increase the efficiency, productivity, functionality or life of a fixed asset by greater than 12 months are capitalized.
Goodwill represents the excess of the purchase price of aan acquired business over the estimated fair value of the identifiable assets acquired and liabilities assumed by the Company. For the purposes of goodwill impairment analysis,assessment, the Company evaluates goodwill for impairment annually, as of October 31, or more often as facts and circumstances warrant. When performing the impairment assessment, the Company evaluates factors, such as unexpected adverse economic conditions, competition and market changes. Goodwill is allocated to one reporting unit, Completion Services.
units.
Before employing detailed impairment testing methodologies, the Company may first evaluate the likelihood of impairment by considering qualitative factors relevant to each reporting segment,unit, such as macroeconomic, industry, market or any other factors that have a significant bearing on fair value. If the Company first utilizes a qualitative approach and determines that it is more likely than not that goodwill is impaired, detailed testing methodologies are then applied. Otherwise, the Company concludes that no impairment has occurred. The Company may also choose to bypass a qualitative approach and opt instead to employ detailed testing methodologies, regardless of a possible more likely than not outcome. The first step in the goodwill impairment test is to compare the fair value of each reporting unit to which goodwill has been assigned to the carrying amount of net assets, including goodwill, of the respective reporting unit. The Company’s goodwill is allocated solely toacross its Completion Services, segment.Well Construction and Intervention, and Well Support Services segments. If the carrying amount of the reportable segmentreporting unit exceeds its fair value, step two in the goodwill impairment test requires goodwill to be written down to its implied fair value through a charge to operating expense based on a hypothetical purchase price allocation method.
In 2017,2019, the Company performed Step 0the qualitative analysis (step zero) of the goodwill impairment assessment for the goodwill associated with the Completion Services reporting unit, by reviewing relevant qualitative factors. The Company determined there were no events that would indicate the carrying amount of its goodwill may not be recoverable, and as such, no0 impairment charge was recognized. The Company's assessment was based on the following factors: commodity prices have stabilized, the Company continued to experience strong growth throughout 2017 in both revenue and EBITDA, the performance of the Company's stock price subsequent to its IPO, the enactment of the "Tax Relief for Individuals and Families" tax reform legislation and improved market conditions, as evidenced by growth in the U.S. gross domestic product, growth in the average annual return for the S&P 500 and Dow Jones indexes, production cuts by members of the Organization of the Petroleum Exporting Countries ("OPEC") and non-OPEC members and positive trends and forecasts for the oil and gas industry,
The Company’s indefinite-lived assets consist of the Company’s trade names.name. The Company assesses its indefinite-lived intangible assets for impairment annually, as of October 31, or whenever events or circumstances indicate that the carrying amount of the assets may not be recoverable.
The Company impaired its Keane trade name in 2019. For additional detailed information regarding the impairment of the Keane trade name, see Note (4)Intangible Assets. There was no0 indefinite-lived asset impairment recognized during 2017, 20162018 or 2015.2017.
85
NEXTIER OILFIELD SOLUTIONS INC. AND SUBSIDIARIES
Notes to the Consolidated and Combined Financial Statements
(i)Long-Lived Assets with Definite Lives
The Company assesses its long-lived assets, such as definite-lived intangible assets and property and equipment, for impairment whenever events or changes in circumstances indicate that the carrying amount of an asset may not be recoverable. Recoverability is assessed using undiscounted future net cash flows of assets grouped at the lowest level for which there are identifiable cash flows independent of the cash flows of other groups of assets. For the Company’s property and equipment, the Company determined the lowest level of identifiable cash flows that are independent of other asset groups to be at the service line level, hydraulicare: fracturing, wireline drilling,and pumpdown, cementing, coiled tubing, and cementing, as well assupport services, except for an entity level asset group for assets that do not have identifiable independent cash flows. For the Company’s definite-lived intangible assets, the Company determined each intangible asset that generates identifiable cash flows independent of one another and independent of the other assets in the operating segment with which they are associated. As such, the Company concluded that each intangible asset should be individually assessed for impairment.
Impairments exist when the carrying amount of an asset group exceeds estimates of the undiscounted cash flows expected to result from the use and eventual disposition of the asset group. When alternative courses of action to recover the carrying amount of the asset are under consideration, estimates of future undiscounted cash flows take into account possible outcomes and probabilities of their occurrence. If the carrying amount of the asset is not recoverable based on the estimated future undiscounted cash flows, the impairment loss is measured as the excess of the asset group’s carrying amount over its estimated fair value, such that the asset group’s carrying amount is adjusted to its estimated fair value, with an offsetting charge to operating expense.
The Company measures the fair value of its property and equipment using the discounted cash flow method or the market approach, the fair value of its customer contracts using the multi-period excess earning method and income based “with and without” method, the fair value of its acquired fracking fluid software technology using the “income based relief-from-royalty” method and the fair value of its non-compete agreement using “lost income” approach. The expected future cash flows used for impairment reviews and related fair value calculations are based on judgmental assessments of projected revenue growth, fleet count, utilization, gross margin rates, SG&A rates, working capital fluctuations, capital expenditures, discount rates and terminal growth rates.
In 2017,2019 and 2018, for the Company’s property and equipment and definite-lived intangible assets, the Company determined there were no events that would indicate the carrying amount of these assets may not be recoverable, and as such, no0 impairment charge was recognized. For the property and equipment and definite-lived intangible assets in each of the asset groups within the Company’s Completion Services segment, the Company’s assessment was based on the following factors: commodity prices have stabilized, market conditions have improved as evidenced by an increase in overall demand and pricing power for the Company’s hydraulic fracturing and wireline services, and the Company experienced strong revenue growth throughout 2017. For the property and equipment and definite-lived intangible asset in each of the asset groups within the Company’s Other Services segment, the Company’s assessment was based on the following factors: at October 31, 2017, the fair values of the drilling services’ property and equipment and cementing services’ property and equipment, acquired as a result of the acquisition of Trican’s U.S. Operations, were reflective of the deteriorated market conditions experienced from late 2014 through the first quarter of 2016. From the second quarter of 2016, oil and natural gas prices and rig count estimates have improved significantly, a trend which Management believes will continue throughout 2018. Also at October 31, 2017, the fair values of the cementing services' property and equipment and definite-lived customer contract, acquired as a result of the acquisition of RockPile, were recorded at appraised fair market only four months prior to the Company's impairment analysis, and the Company has plans to ramp up its idle cementing assets in 2018, in response to strong customer demand.
Amortization on definite-lived intangible assets is calculated on the straight-line method over the estimated useful lives of the assets.
against the change in fair value of the hedged item attributable to the risk being hedged or recognized in accumulated other comprehensive income (loss) until the hedged item affects earnings.
The Company only enters into derivative contracts that it intends to designate as hedges for the variability of cash flows to be received or paid related to a recognized asset or liability (cash(i.e. cash flow hedge). For all hedging relationships, the Company formally documents the hedging relationship and its risk-management objective and strategy for undertaking the hedge, the hedging instrument, the hedged transaction, the nature of the risk being hedged and how the hedging instrument’s effectiveness in offsetting the hedged risk will be assessed prospectively and retrospectively. The Company also formally assesses, both at the inception of the hedging relationship and on an ongoing basis, whether the derivatives that are used in hedging relationships are highly effective in offsetting changes in cash flows of hedged transactions. For derivative instruments that are designated and qualify as part of a cash flow hedging relationship, the gain or loss on the derivative is reported as a component of other comprehensive
86
NEXTIER OILFIELD SOLUTIONS INC. AND SUBSIDIARIES
Notes to the Consolidated and Combined Financial Statements
income (loss) and reclassified into earnings in the same period or periods during which the hedged transaction affects earnings.
The Company discontinues hedge accounting prospectively, when it determines that the derivative is no longer highly effective in offsetting cash flows attributable to the hedged risk, the derivative expires or is sold, terminated, or exercised, the cash flow hedge is de-designated because aoriginally forecasted transaction is notno longer probable of occurring or if management determinesdecides to remove the designation of the cash flow hedge. The net derivative instrument gain or loss related to a discontinued cash flow hedge shall continue to be reported in accumulated other comprehensive income (loss) and reclassified into earnings in the same period or periods during which the originally hedged transaction affects earnings, unless it is probable that the forecasted transaction will not occur by the end of the originally specified time period. When it is probable that the originally forecasted transaction will not occur by the end of the originally specified time period, the Company recognizes immediately, in earnings, any gains and losses related to the hedging relationship that were recognized in accumulated other comprehensive income (loss). In all situations in which hedge accounting is discontinued and the derivative remains outstanding, the Company continues to carry the derivative at its fair value on the consolidated balance sheetsheets and recognizes any subsequent changes in itsthe derivative’s fair value in earnings. When it is probable that a forecasted transaction will not occur, the Company discontinues hedge accounting and recognizes immediately in earnings gains and losses related to the hedging relationship that were accumulated in other comprehensive income.
Fair value represents the price that would be received to sell thean asset or paid to transfer thea liability in an orderly transaction between market participants at the reporting date. The Company’s assets and liabilities that are measured at fair value at each reporting date are classified according to a hierarchy that prioritizes inputs and assumptions underlying the valuation techniques. The Company utilizes valuation techniques that maximize the use of observable inputs and minimize the use of unobservable inputs to the extent possible. The Company determines fair value based on assumptions that market participants would use in pricing an asset or liability in the principal or most advantageous market. When considering market participant assumptions in fair value measurements, the following fair value hierarchy distinguishes between observable and unobservable inputs, which are categorized in one of the following levels:
Level 1 Inputs: Quoted prices (unadjusted) in an active market for identical assets or liabilities.
Level 2 Inputs: Other than quoted prices included in Level 1 inputs that are observable for the asset or liability, either directly or indirectly, for substantially the full term of the asset or liability.
Level 3 Inputs: Unobservable inputs for the asset or liability used to measure fair value to the extent that observable inputs are not available, thereby allowing for situations in which there is little, if any, market activity for the asset or liability at measurement date.
Assets and liabilities are classified in their entirety based on the lowest priority level of input that is significant to the fair value measurement. The assessment of the significance of a particular input to the fair value measurement requires judgment and may affect the placement of assets and liabilities within the levels of the fair value hierarchy. Reclassifications of fair value between Level 1, Level 2 and Level 3 of the fair value hierarchy, if applicable, are made at the end of each quarter.
87
NEXTIER OILFIELD SOLUTIONS INC. AND SUBSIDIARIES
Notes to the affected employees, the Company records employee severance costs associated with these activities in accordance with ASC 712, Compensation—Nonretirement Post-Employment Benefits. In all other situations where the Company pays termination benefits, including supplemental benefits paid in excess of statutory minimum amountsConsolidated and benefits offered to affected employees based on management’s discretion, the Company records these termination costs in accordance with ASC 420, Exit or Disposal Cost Obligations. A liability is recognized for one time termination benefits when the Company is committed to i) make payments and the number of affected employees and the benefits received are known to both parties, and ii) terminating the employment of current employees according to a detailed formal plan without possibility of withdrawal and can reasonably estimate such amount.Combined Financial Statements
(l) Stock-based compensation
The Company recognizes compensation expense for restricted stock awards, restricted stock units to be settled in common stock (“RSUs”), performance based RSU award (“PSUs”), and non-qualified stock options (“stock options”) based on the fair value of the awards at the date of grant. The fair value of restricted stock awards and RSUs is determined based on the number of shares or RSUs granted and the closing price of the Company'sCompany’s common stock on the date of grant. The fair value of stock options is determined by applying the Black-Scholes model to the grant dategrant-date market value of the underlying common shares of the Company. AsThe fair value of PSUs with market conditions is determined using a newly established public company, the Company's attrition rate for key management personnel is insignificant.Monte Carlo simulation method. The Company has elected to recognize forfeiture credits for these awards as they are incurred, as this method betterbest reflects actual stock-based compensation expense. Restricted stock awards and RSUs are not considered issued and outstanding for purposes of earnings per share calculations until vested.
Compensation expense from time-based restricted stock awards, RSUs, PSUs, and stock options is amortized on a straight-line basis over the requisite service period, which is generally the vesting period.
Deferred compensation expense associated with liability basedliability-based awards, such as deferred stock awards that are expected to settle with the issuance of a variable number of shares based on a fixed monetary amount at inception, is recognized at the fixed monetary amount at inception and is amortized on a straight-line basis over the requisite service period, which is generally the vesting period. Upon settlement, the holders receive an amount of common stock equal to the fixed monetary amount at inception, based on the closing price of the Company'sCompany’s stock on the date of settlement.
Tax deductions on the stock-based compensation awards willare not be realized until the awards are vested or exercised. The Company recognizes deferred tax assets for stock-based compensation awards that will result in future deductions on its income tax returns, based on the amount of tax deduction for stock-based compensation recognized at the statutory tax rate in the jurisdiction in which the Company will receive a tax deduction. If the tax deduction for a stock-based award is greater than the cumulative GAAP compensation expense for that award upon realization of a tax deduction, an excess tax benefit will be recognized and recorded as a favorable impact on the effective tax rate. If the tax deduction for an award is less than the cumulative GAAP compensation expense for that award upon realization of the tax deduction, a tax shortfall will be recognized and recorded as an unfavorable impact on the effective tax rate. Any excess tax benefits or shortfalls will be recorded discretelyas discrete, adjustments in the period in which they occur. The cash flows resulting from any excess tax benefit will be classified as financing cash flows in the consolidated and combined statements of cash flows.
The Company provides its employees with the electionoption to settle the income tax obligations arising from the vesting of their restricted or deferred stock-based compensation awards by the Company withholding shares equal to such income tax obligations. Shares acquired from employees in connection with the settlement of the employees'employees’ income tax obligations are accounted for as treasury shares that are subsequently retired. Restricted stock awards, RSUs, and PSUs are not considered issued and outstanding for purposes of earnings per share calculations until vested.
For additional information, see Note (12)(Equity-BasedStock-Based Compensation).
Upon consummation of the Organizational Transactions and the IPO, the Company became subject to U.S. federal income taxes. A provision for U.S. federal income tax has been provided in the consolidated and combined financial statements for the yearyears ended December 31, 2019, 2018 and 2017.
The Company is responsible for certain state income and franchise taxes in the states in which it operates, which include, but not limited to California, Colorado, Louisiana, Montana, New Mexico, North Dakota, Oklahoma, Pennsylvania, Texas, Utah and New York. These amounts are reflected as selling, general and administrative expense in the consolidated financial statements of the Company.
West Virginia. Deferred tax assets and liabilities are recognized for the future tax
88
NEXTIER OILFIELD SOLUTIONS INC. AND SUBSIDIARIES
Notes to the Consolidated and Combined Financial Statements
consequences attributable to differences between the financial statement carrying amounts of existing assets and liabilities and their respective tax basis and tax carryforwards, if applicable.
Deferred tax assets and liabilities are measured using enacted tax rates expected to apply to taxable income in the years in which those temporary differences are expected to be recovered or settled. The effect on deferred tax assets and liabilities of a change in tax rates is recognized in incomeearnings in the period that includes the enactment date.
The Company recognizes interest accrued related to unrecognized tax benefits, if any, in income tax expense.
The Company accrues for contingent liabilities when such contingencies are probable and reasonably estimable. The Company generally records losses related to these types of contingencies as direct operating expenses or general and administrative expenses in the Consolidatedconsolidated and Combined Financial Statements
combined statements of operations and comprehensive income (loss).Legal costs associated with the Company’s loss contingencies are recognized immediately when incurred as general and administrative expenses in the Company’s consolidated and combined statements of operations and comprehensive income (loss).
Investments in non-controlled entities over which the Company has the ability to exercise significant influence over the non-controlled entities'noncontrolled entities’ operating and financial policies are accounted for under the equity-method. Under the equity-method, the investment in the non-controlled entity is initially recognized at cost and subsequently adjusted to reflect the Company'sCompany’s share of the entity'sentity’s income (losses), any dividends received by the Company and any other-than-temporary impairments.Investments accounted for under the equity-method are presented within other noncurrent assets in the consolidated balance sheets and combined balance sheets.
(p) Employee Benefits and Postemployment Benefits
Contractual termination benefits are payable when employment is terminated due to an event specified in the provisions of a social/labor plan, state or federal law. Accordingly, in situations where minimum statutory termination benefits must be paid to the affected employees, the Company records employee severance costs associated with these activities in accordance with ASC 712, “Compensation—Nonretirement Post-Employment Benefits.” In all other situations where the Company pays termination benefits, including supplemental benefits paid in excess of statutory minimum amounts and benefits offered to affected employees based on management’s discretion, the Company records these termination costs in accordance with ASC 420, “Exit or Disposal Cost Obligations.” A liability is recognized for one-time termination benefits when the Company is committed to 1) making payments and the number of affected employees and the benefits received are known to both parties and 2) terminating the employment of current employees according to a detailed formal plan without possibility of withdrawal for which such amount can be reasonably estimated.
89
NEXTIER OILFIELD SOLUTIONS INC. AND SUBSIDIARIES
Notes to the Consolidated and Combined Financial Statements
(q) Leases
Effective January 1, 2019, the Company adopted ASU 2016-02, "Leases (Topic 842)," and related amendments, which set out the principles for the recognition, measurement, presentation and disclosure of leases for both lessees and lessors, using the modified retrospective method. In connection with the adoption of these standards, the Company implemented internal controls to ensure that the Company's contracts are properly evaluated to determine applicability under ASU 2016-02 and that the Company properly applies ASU 2016-02 in accounting for and reporting on all its qualifying leases.
In accordance with ASU 2016-02, the Company considers any contract that conveys the right to control the use of identified property, plant or equipment for a period of time in exchange for consideration to be a lease. The Company determines whether the contract into which it has entered is a lease at the lease commencement date. Rental arrangements with term lengths of one month or less are expensed as incurred, but not recognized as qualifying leases.
For lessees, leases can be classified as finance leases or operating leases, while for lessors, leases can be classified as sales-type leases, direct financing leases or operating leases. As lessee, all leases, with the exception of short-term leases, are capitalized on the balance sheet by recording a lease liability, which represents the Company's obligation to make lease payments arising from the lease and a right-of-use asset, which represents the Company's right to use the underlying asset being leased.
For leases in which the Company is the lessee, the Company uses a collateralized incremental borrowing rate to calculate the lease liability, as for most leases, the implicit rate in the lease is unknown. The collateralized incremental borrowing rate is based on a yield curve over various term lengths that approximates the borrowing rate the Company would receive if it collateralized its lease arrangements with all of its assets. For leases in which the Company is the lessor, the Company uses the rate implicit in the lease.
For finance leases, the Company amortizes the right-of-use asset on a straight-line basis over the earlier of the useful life of the right-of-use asset or the end of the lease term and records this amortization in rent expense on the consolidated and combined statements of operations and comprehensive loss. The Company adjusts the lease liability to reflect lease payments made during the period and interest incurred on the lease liability using the effective interest method. The incurred interest expense is recorded in interest expense on the consolidated and combined statements of operations and comprehensive loss. For operating leases, the Company recognizes one single lease cost, comprised of the lease payments and amortization of any associated initial direct costs, within rent expense on the consolidated and combined statements of operations and comprehensive loss. Variable lease costs not included in the determination of the lease liability at the commencement of a lease are recognized in the period when the specified target that triggers the variable lease payments becomes probable.
In accordance with ASC 842, the Company has recognized $0.6made the following elections for its lease accounting:
all short-term leases with term lengths of 12 months or less will not be capitalized; the underlying class of assets to which the Company has applied this expedient is primarily its apartment leases;
for non-revenue contracts containing both lease and non-lease components, both components will be combined and accounted for as one lease component and accounted for under ASC 842; and
for revenue contracts containing both lease and non-lease components, both components will be combined and accounted for as one component and accounted for under ASC 606.
As part of the Company's adoption of ASU 2016-02, the Company elected to adopt the standard using the modified retrospective transition method and elected the practical expedient transition method package whereby the Company did not:
reassess whether any expired or existing contracts contained leases;
reassess the lease classification for any expired or existing leases; and
90
NEXTIER OILFIELD SOLUTIONS INC. AND SUBSIDIARIES
Notes to the Consolidated and Combined Financial Statements
reassess initial direct costs for any existing leases.
For additional information, see Note (16) Leases.
(r) Research and development costs
Research and development costs are expensed as incurred as general and administrative expenses in the Company’s consolidated and combined statements of operations and comprehensive income (loss). Research and development costs incurred directly by the Company were $7.1 million, $7.1 million and $3.7 million for its only equity-method investment.the years ended December 31, 2019, 2018 and 2017, respectively.
The earnings per unitshare amounts for the year ended December 31, 2017 have been computed to give effect to the Organizational Transactions, as if theyit had occurred at the beginning of the earliest period presented,on January 1, 2016, including the limited liability company agreement of Keane Investor to, among other things, exchange all of the pre-existing membership interests of the Company for the newly-created ownership interests for common stock of KGI. The computations of earnings per unitshare do not consider the 15,700,000 shares of common stock newly-issued by KGI to investors in the IPO.
(t) Reclassifications
Certain reclassifications have been made to prior period amounts to conform to current period financial statement presentation. These reclassifications did not affect previously reported results of operations, stockholders' equity, comprehensive income or cash flows.
(3) AcquisitionsMergers and Acquisitions
(a) TricanC&J Energy Services, Inc.
On March 16, 2016,October 31, 2019 (the “C&J Acquisition Date”), the Company acquiredcompleted the majorityC&J Merger in accordance with the terms of the U.S. assetsAgreement and assumed certain liabilitiesPlan of Trican Well Service, L.P.Merger, dated as of June 16, 2019 (the “Acquired Trican Operations”"Merger Agreement"), by and among NexTier, C&J and King Merger Sub Corp., a wholly owned subsidiary of NexTier ("Merger Sub"), pursuant to which Merger Sub merged with and into C&J, with C&J surviving the merger as a wholly owned subsidiary of NexTier, and immediately following the C&J Merger, C&J was merged with and into King Merger Sub II LLC ("LLC Sub"), with LLC Sub continuing as the surviving entity as a wholly-owned subsidiary of NexTier and the successor in interest to C&J.
The C&J Merger was completed for total consideration of $248.1approximately $485.1 million, comprisedconsisting of $199.4 million in cash, $6.0 million in adjustments pursuant to terms of the acquisition agreement to Trican and $42.7 million in Class A and C Units(i) equity consideration in the Company (the “Trican Transaction”).form of 105.9 million shares of Keane common stock issued to C&J stockholders with a value of $481.9 million and (ii) replacement share based compensation awards attributable to pre-merger services with a value of $3.2 million.
The Company accounted for the acquisition of the Acquired Trican OperationsC&J Merger using the acquisition method of accounting. AssetsThe aggregate purchase price noted above was allocated to the major categories of assets acquired and liabilities assumed in connection withbased upon their estimated fair values at the acquisition have been recordeddate of the acquisition. The majority of the measurements of assets acquired and liabilities assumed, are based on inputs that are not observable in the market and thus represent Level 3 inputs. The fair value of acquired inventory and property and equipment is based on both available market data and a cost approach. The fair value of the financial assets acquired includes trade receivables with a fair value of $312.6 million. The gross amount due under the contracts is $322.8 million, of which $10.2 million is expected to be uncollectible. A liability of $40.2 million has been recognized for legal reserves and sales and use tax assessments. As of December 31, 2019, there has been no change in the amount recognized for the liability or any change in the range of outcomes or assumptions used to develop the estimates on October 31, 2019.
The preliminary purchase price has been allocated to the net assets acquired and liabilities assumed based upon their estimated fair values. The Company finalizedestimated fair values of certain assets and liabilities, including accounts receivable, taxes (including uncertain tax positions), and contingencies require significant judgments and estimates. C&J is subject to the purchase price allocation in March 2017legal and recorded certain measurement period adjustments during the quarter ended March 31, 2017.regulatory requirements, including but not limited to those related to environmental
91
NEXTIER OILFIELD SOLUTIONS INC. AND SUBSIDIARIES
Notes to the Consolidated and Combined Financial Statements
matters and taxation. The Company has conducted a preliminary assessment of liabilities arising from these matters and has recognized provisional amounts in its initial accounting for the C&J Merger for all identified liabilities in accordance with the requirements of ASC Topic 805. Certain data necessary to complete the purchase price allocation is not yet available, including, but not limited to, valuation of pre-acquisition contingencies and final tax returns that provide underlying tax basis of assets acquired and liabilities assumed. However, the Company is continuing its review of these matters during the measurement period, and if new information obtained about facts and circumstances that existed at the acquisition date identifies adjustments to the liabilities initially recognized, as well as any additional liabilities that existed at the acquisition date, the acquisition accounting will be revised to reflect the resulting adjustments to the provisional amounts initially recognized. As a result, the provisional measurements below are preliminary and subject to change during the measurement period and such changes could be material. The Company will finalize the purchase price allocation during the 12-month period following the acquisition date, during which time the value of the assets and liabilities may be revised as appropriate. The Company continues to assess the fair values of the assets acquired and liabilities assumed.
The following table summarizes the fair value of the consideration transferred forin the acquisition of the Acquired Trican OperationsC&J Merger and the finalpreliminary allocation of the purchase price to the fair values of the assets acquired and liabilities assumed at the acquisition date:C&J Merger Date:
| Total Purchase Consideration: | (Thousands of Dollars) | |||
| Equity consideration | $ | 481,912 | ||
| Replacement awards attributable to pre-combination services | 3,212 | |||
| Less: Cash acquired | $ | (68,807 | ) | |
| Total purchase consideration | $ | 416,317 | ||
| Trade and accounts receivable | $ | 312,620 | ||
| Inventories | 43,142 | |||
| Prepaid and other current assets | 18,512 | |||
| Property and equipment | 311,886 | |||
| Intangible assets | 17,590 | |||
| Right of use assets | 24,318 | |||
| Other noncurrent assets | 4,409 | |||
| Total identifiable assets acquired | 732,477 | |||
| Accounts payable | 43,620 | |||
| Accrued expenses | 236,959 | |||
| Short term lease liability | 7,842 | |||
| Long term lease liability | 15,517 | |||
| Non-current liabilities | 17,156 | |||
| Total liabilities assumed | 321,094 | |||
| Goodwill | 4,934 | |||
| Total purchase consideration | $ | 416,317 | ||
| Total Purchase Consideration: | ||||||||||||
| (Thousands of Dollars) | ||||||||||||
| Preliminary Purchase Price Allocation | Adjustments | Final Purchase Price Allocation | ||||||||||
| Cash consideration | $ | 199,400 | $ | — | $ | 199,400 | ||||||
| Net working capital purchase price adjustment | 6,000 | — | 6,000 | |||||||||
| Class A and C Units issued | 42,669 | — | 42,669 | |||||||||
| Total consideration | $ | 248,069 | $ | — | $ | 248,069 | ||||||
| Accounts receivable | $ | 37,377 | $ | — | $ | 37,377 | ||||||
| Inventories | 20,006 | (202 | ) | 19,804 | ||||||||
| Prepaid expenses | 7,170 | — | 7,170 | |||||||||
| Property and equipment | 205,546 | (413 | ) | 205,133 | ||||||||
| Intangible assets | 3,880 | — | 3,880 | |||||||||
| Total identifiable assets acquired | 273,979 | (615 | ) | 273,364 | ||||||||
| Accounts payable | (12,630 | ) | 469 | (12,161 | ) | |||||||
| Accrued expenses | (9,524 | ) | (9,524 | ) | ||||||||
| Current maturities of capital lease obligations | (1,594 | ) | — | (1,594 | ) | |||||||
| Capital lease obligations, less current maturities | (2,386 | ) | — | (2,386 | ) | |||||||
| Other non-current liabilities | (1,372 | ) | — | (1,372 | ) | |||||||
| Total liabilities assumed | (27,506 | ) | 469 | (27,037 | ) | |||||||
| Goodwill | 1,596 | 146 | 1,742 | |||||||||
| Total purchase price consideration | $ | 248,069 | $ | — | $ | 248,069 | ||||||
92
NEXTIER OILFIELD SOLUTIONS INC. AND SUBSIDIARIES
Notes to the Consolidated and Combined Financial Statements
Intangible assets related to the C&J Merger consisted of the following:
| (Thousands of Dollars) | ||||||
| Weighted average remaining amortization period (Years) | Gross Carrying Amounts | |||||
| Technology | 3 | 17,590 | ||||
| Total | $ | 17,590 | ||||
Merger and integration related costs were recognized separately from the acquisition of assets and assumptions of liabilities in the C&J Merger. Merger costs consist of legal and professional fees and pre-merger notification fees. Integration costs consist of expenses incurred to integrate C&J’s operations, aligning accounting processes and procedures, and integrating its enterprise resource planning system with those of the Company. The expenses for all these transactions were expensed as incurred.
Merger and integration costs totaled $68.7 million for the year ended December 31, 2019 and are recorded within merger and integration costs on the Company’s Consolidated and Combined Statements of Operations and Comprehensive Income (Loss). The following table summarizes merger and integration costs for the year ended December 31, 2019.
Estimated useful life (in Years) | Fair value (Thousands of Dollars) | |||||
| Customer contracts | 1.8 | $ | 3,500 | |||
| Non-compete agreements | 2.0 | 50 | ||||
| Fracking Fluids | 4.8 | 330 | ||||
| Total intangible assets | $ | 3,880 | ||||
| Weighted average life of finite-lived intangibles | 2.1 | |||||
| (amounts in thousands) | ||||
| Transaction Type | Year Ended December 31, 2019 | |||
| Merger | $ | 23,775 | ||
| Integration | 44,956 | |||
| Total merger and integration costs | $ | 68,731 | ||
The following unauditedcombined pro forma information assumes the acquisition of the Acquired Trican OperationsC&J Merger occurred on January 1, 2015.2018. The pro forma information presented below is for illustrative purposes only and does not reflect future events that occurred after December 31, 2016,2019 or any operating efficiencies or inefficiencies that resulted from the acquisition of the Acquired Trican Operations.C&J Merger. The information is not necessarily indicative of the results that would have been achieved had the Company controlled the Acquired Trican OperationsC&J during the period presented.
| (unaudited, amounts in thousands) | ||||||||
| Year Ended December 31, 2019 | Year Ended December 31, 2018 | |||||||
| Revenue | $ | 3,406,288 | $ | 4,359,095 | ||||
| Net income (loss) | (196,577 | ) | 66,746 | |||||
| Net income (loss) per share (basic) | $ | (0.93 | ) | $ | 0.32 | |||
| Net income (loss) per share (diluted) | $ | (0.93 | ) | $ | 0.31 | |||
| Weighted-average shares outstanding (basic) | 211,376 | 210,945 | ||||||
| Weighted-average shares outstanding (diluted) | 211,376 | 212,964 | ||||||
The pro forma information does not include any integration or transactions costs thatCompany’s consolidated statement of operations and comprehensive income (loss) for 2019 includes revenue of $196.7 million and net loss of $21.4 million, from the Company incurred relatedC&J operations, from November 1, 2019 to the acquisition in the periods following the period presented.December 31, 2019.
93
NEXTIER OILFIELD SOLUTIONS INC. AND SUBSIDIARIES
Notes to the Consolidated and Combined Financial Statements
(b) Asset Acquisition from Refinery Specialties, Incorporated
| (Thousands of Dollars) | |||||
| Unaudited | |||||
| Year Ended December 31, 2016 | |||||
| Revenue | $ | 464,036 | |||
| Net Income | $ | (217,313 | ) | ||
The Company’s consolidatedCompany accounted for this acquisition as an asset acquisition pursuant to ASU 2017-01 and combined statementallocated the purchase price of operationsthe acquisition plus the transactions costs amongst the acquired hydraulic horsepower and comprehensive income (loss) include revenue (unaudited)related support equipment, as the fair value of $191.0 millionthe acquired hydraulic horsepower and related support equipment represented substantially all of the fair value of the gross profit (unaudited) of $10.4 million fromassets acquired in the Acquired Trican Operations from the date ofasset acquisition on March 16, 2016 to December 31, 2016.with RSI.
On July 3, 2017 (the “RockPile Closing Date” or the “RockPile Acquisition Date”), the Company acquired 100% of the outstanding equity interests of RockPile Energy Services, LLC and its subsidiaries (“RockPile”) from RockPile Energy Holdings, LLC (the “Principal Seller”). RockPile was a multi-basin provider of integrated well completion services in the United States,U.S., whose primary service offerings included hydraulic fracturing, wireline perforation and workover rigs. Through this acquisition, the Company deepened its existing presence in the Permian Basin and Bakken Formation and further solidified its position as one of the largest pure-play providers of integrated well completion services in the United States.U.S. This acquisition also enabled the Company to expand certain service offerings and capabilities within its Other Services segment.
The acquisition of RockPile was completed for cash consideration of $116.6 million, subject to post-closing adjustments, 8,684,210 shares of the Company’s common stock (the “Acquisition Shares”) and contingent value rights, as described below. The fair value of the Acquisition Shares, which is recorded in owners'stockholders’ equity in the consolidated and combined balance sheet, was calculated using the closing price of the Company'sCompany’s common stock on July 3, 2017, of $16.29, discounted by 7.9% to reflect the lack of marketability resulting from the 180-day lock-up period during which resale of the Acquisition Shares is restricted.
Subject to the terms and conditions of the Contingent Value Rights Agreement (the “CVR Agreement”) by and among the Company, the Principal Seller and Permitted Holders (as defined in the CVR Agreement and, together with the Principal Seller, the “RockPile Holders”), the Company agreed to pay contingent consideration (the “Aggregate CVR Payment Amount”), which would equal the product of the Acquisition Shares held by RockPile on April 10, 2018 and the CVR Payment Amount, provided that the CVR Payment Amount doesdid not exceed $2.30. The CVR“CVR Payment Amount isAmount” was the difference between (a) $19.00 and (b) the arithmetic average of the dollar volume weighted average price of the Company’s common stock on each trading day for twenty (20) trading days randomly selected by the Company during the thirty (30) trading day period immediately preceding the last business day prior to April 3, 2018 (the “Twenty-Day VWAP”). The Aggregate CVR Payment Amount shallwas agreed to be reduced on a dollar for dollar basis if the sum of the following exceeds $165.0 million:
(i) the aggregate gross proceeds received in connection with the resale of any Acquisition Shares, plus
(ii) the product of the number of Acquisition Shares held by the RockPile Holders on April 10, 2018 and the Twenty-Day VWAP, plus
(iii) the Aggregate CVR Payment Amount.
94
NEXTIER OILFIELD SOLUTIONS INC. AND SUBSIDIARIES
Notes to the Consolidated and Combined Financial Statements
The Company accounted for the acquisition of RockPile using the acquisition method of accounting. Assets acquired, liabilities assumed and equity issued in connection with the acquisition were recorded based on their fair values. The Company finalized the purchase accounting is subject toprice allocation in June 2018. Of the twelve-month measurement adjustment period to reflect any new information that may be obtainedadjustments noted in the future about factsfollowing table, $11.3 million were recorded in 2017 and circumstances that existed as of the RockPile Acquisition Date that, if known, would have affected the measurement of the amounts recognized as of that date.
$2.4 million were recorded in 2018.
The following tables summarizetable summarizes the fair value of the consideration transferred for the acquisition of RockPile and the preliminaryfinal allocation of the purchase price to the fair values of the assets acquired and liabilities assumed and equity consideration at the RockPile Acquisition Date:
| Total Purchase Consideration: | Preliminary Purchase Price Allocation | Adjustments | Final Purchase Price Allocation | |||||||||
| (Thousands of Dollars) | ||||||||||||
| Cash consideration | $ | 123,293 | $ | (6,717 | ) | $ | 116,576 | |||||
| Equity consideration | 130,290 | — | 130,290 | |||||||||
| Contingent consideration | 11,962 | — | 11,962 | |||||||||
| Less: Cash acquired | (20,379 | ) | 20,379 | — | ||||||||
| Total purchase consideration, less cash acquired | $ | 245,166 | $ | 13,662 | $ | 258,828 | ||||||
| Trade and other accounts receivable | $ | 57,117 | $ | 1,484 | $ | 58,601 | ||||||
| Inventories, net | 2,853 | 138 | 2,991 | |||||||||
| Prepaid and other current assets | 13,630 | (717 | ) | 12,913 | ||||||||
| Property and equipment, net | 157,654 | 8,653 | 166,307 | |||||||||
| Intangible assets | 20,967 | (1,267 | ) | 19,700 | ||||||||
| Notes receivable | 250 | (250 | ) | — | ||||||||
| Other noncurrent assets | 363 | (57 | ) | 306 | ||||||||
| Total identifiable assets acquired | 252,834 | 7,984 | 260,818 | |||||||||
| Accounts payable | (38,999 | ) | 16,180 | (22,819 | ) | |||||||
| Accrued expenses | (22,161 | ) | (13,315 | ) | (35,476 | ) | ||||||
| Deferred revenue | (23,053 | ) | 698 | (22,355 | ) | |||||||
| Other non-current liabilities | (827 | ) | (2,412 | ) | (3,239 | ) | ||||||
| Total liabilities assumed | (85,040 | ) | 1,151 | (83,889 | ) | |||||||
| Goodwill | 77,372 | 4,527 | 81,899 | |||||||||
| Total purchase price consideration | $ | 245,166 | $ | 13,662 | $ | 258,828 | ||||||
| Total Purchase Consideration: | Preliminary Purchase Price Allocation | Adjustments | Purchase Price Allocation as of December 31, 2017 | |||||||||
| (Thousands of Dollars) | ||||||||||||
| Cash consideration | $ | 123,293 | $ | (6,717 | ) | $ | 116,576 | |||||
| Equity consideration | 130,290 | — | 130,290 | |||||||||
| Contingent consideration | 11,962 | — | 11,962 | |||||||||
| Less: Cash acquired | (20,379 | ) | 20,379 | — | ||||||||
| Total purchase consideration, less cash acquired | $ | 245,166 | $ | 13,662 | $ | 258,828 | ||||||
| Trade and other accounts receivable | $ | 57,117 | $ | 1,588 | $ | 58,705 | ||||||
| Inventories, net | 2,853 | 138 | 2,991 | |||||||||
| Prepaid and other current assets | 13,630 | (717 | ) | 12,913 | ||||||||
| Property and equipment, net | 157,654 | 8,653 | 166,307 | |||||||||
| Intangible assets | 20,967 | (1,267 | ) | 19,700 | ||||||||
| Notes receivable | 250 | (250 | ) | — | ||||||||
| Other noncurrent assets | 363 | (57 | ) | 306 | ||||||||
| Total identifiable assets acquired | 252,834 | 8,088 | 260,922 | |||||||||
| Accounts payable | (38,999 | ) | 16,242 | (22,757 | ) | |||||||
| Accrued expenses | (22,161 | ) | (15,924 | ) | (38,085 | ) | ||||||
| Deferred revenue | (23,053 | ) | 698 | (22,355 | ) | |||||||
| Other non-current liabilities | (827 | ) | (2,412 | ) | (3,239 | ) | ||||||
| Total liabilities assumed | (85,040 | ) | (1,396 | ) | (86,436 | ) | ||||||
| Goodwill | 77,372 | 6,970 | 84,342 | |||||||||
| Total purchase price consideration | $ | 245,166 | $ | 13,662 | $ | 258,828 | ||||||
95
NEXTIER OILFIELD SOLUTIONS INC. AND SUBSIDIARIES
Notes to the Consolidated and Combined Financial Statements
Intangible assets related to the acquisition of RockPile consisted of the following:
| (Thousands of Dollars) | ||||||
| Weighted average remaining amortization period (Years) | Gross Carrying Amounts | |||||
| Customer contracts | 10.8 | $ | 19,700 | |||
| Total | $ | 19,700 | ||||
(Thousands of Dollars) | ||||||
| Weighted average remaining amortization period (Years) | Gross Carrying Amounts | |||||
| Customer contracts | 10.8 | $ | 19,700 | |||
| Total | $ | 19,700 | ||||
For the valuation of the customer relationship intangible asset within the Completions Services segment, management used the income based multi-period excess earning method, which utilized contributory asset charges. Under this method, the Company calculated cash flows derived from the customer relationships and then deducted portions of the cash flow that could be attributed to supporting assets that contribute to the generation of said cash flows. Estimated cash flows were discounted at the weighted average cost of capital, adjusted for an intangible asset risk component. This premium reflects increased risk related to the specific intangible asset as compared to the Company as a whole.
For the valuation of the customer relationship intangible asset within the Other Services segment, management used the income based “with and without” method, which is a specific application of the discounted cash flow method. Under this method, the Company calculated the present value of the after-tax cash flows expected to be generated by the business with and without the customer relationships. The forecasted cash flows in the “without” scenario included the cost of reestablishing customer relationships and were discounted at the Company’s weighted average cost of capital, adjusted for an intangible asset risk component.
The following transactions were recognized separately from the acquisition of assets and assumptions of liabilities in the acquisition of RockPile. Deal costs consist of legal and professional fees and pre-merger notification fees. Integration costs consist of expenses incurred to integrate RockPile'sRockPile’s operations with that of the Company, including retention bonuses and severance payments. Harmonization costs consist ofpayments and expenses incurred in connection with aligning RockPile'sRockPile’s accounting processes and procedures and integrating its enterprise resource planning system with those of the Company. The expenses for all these transactions were expensed as incurred.
| (Thousands of Dollars) | ||||
| Transaction Type | Year Ended December 31, 2017 | |||
| Deal costs | $ | 6,679 | ||
| Integration | 1,994 | |||
| $ | 8,673 | |||
| (Thousands of Dollars) | ||||||
| Transaction Type | Year Ended December 31, 2017 | Location | ||||
| Deal costs | $ | 513 | Cost of services | |||
| Deal costs | 6,166 | Selling, general and administrative expenses | ||||
| Integration | 214 | Cost of services | ||||
| Integration | 1,124 | Selling, general and administrative expenses | ||||
| Harmonization | 656 | Selling, general and administrative expenses | ||||
| $ | 8,673 | |||||
The following combined pro forma information assumes the acquisition of RockPile occurred on January 1, 2016. The pro forma information presented below is for illustrative purposes only and does not reflect future events that may occuroccurred after July 2, 2017 or any operating efficiencies or inefficiencies that may resultresulted from the acquisition of RockPile. The information is not necessarily indicative of results that would have been achieved had the Company controlled RockPile during the periods presented or the results that the Company will experience going forward.presented. Pro forma net loss for the twelve monthsyear ended December 31, 20162017 includes $0.8 million of non-recurring
retention bonuses associated with the acquisition,which were incurred after the closing and $1.8 million of compensation costs associated with the RockPile executives of RockPile whomretained by the Company retained.Company. In addition, the Company incurred $2.2 million of transaction costs that were not reflected in this pro forma financial information, since they were incurred prior to the closing. The pro forma information does not include any remaining future integration costs or transaction costs that the Company may incur related
96
NEXTIER OILFIELD SOLUTIONS INC. AND SUBSIDIARIES
Notes to the acquisition.Consolidated and Combined Financial Statements
| (Thousands of Dollars) | ||||||||
| Unaudited | ||||||||
| Year Ended December 31, | ||||||||
| 2017 | 2016 | |||||||
| Revenue | $ | 1,732,279 | $ | 543,966 | ||||
| Net loss | (49,348 | ) | (203,383 | ) | ||||
| Net loss per share (basic and diluted) | $ | (0.44 | ) | $ | (2.12 | ) | ||
| Weighted-average shares outstanding (basic and diluted) | 111,939 | 96,112 | ||||||
| (Thousands of Dollars) | ||||||||
| Unaudited | ||||||||
| Year Ended December 31, | ||||||||
| 2017 | 2016 | |||||||
| Revenue | $ | 1,732,279 | $ | 543,966 | ||||
| Net income (loss) | (49,584 | ) | (206,417 | ) | ||||
| Net loss per share (basic and diluted) | $ | (0.44 | ) | $ | (2.36 | ) | ||
| Weighted-average shares outstanding | ||||||||
| Basic | 111,735 | 87,313 | ||||||
| Diluted | 111,735 | 87,313 | ||||||
The Company’s consolidated and combined statement of operations and comprehensive income (loss) for 2017 includes revenue (unaudited) of $192.2 million and gross profit (unaudited) of $29.8 million from the RockPile operations, from the date of acquisition on July 3, 2017 to December 31, 2017.
(4) Intangible Assets
The definite-lived intangible assets balance in the Company’s consolidated and combined balance sheets represents the fair value measurement upon initial recognition, net of amortization, as applicable, related to the following:
| (Thousands of Dollars) | (Thousands of Dollars) | |||||||||||||||||||||||||
| December 31, 2017 | December 31, 2019 | |||||||||||||||||||||||||
| Weighted average remaining amortization period (Years) | Gross Carrying Amounts | Accumulated Amortization | Net Carrying Amount | Gross Carrying Amounts | Accumulated Amortization | Net Carrying Amount | ||||||||||||||||||||
| Customer contracts | 9.1 | $ | 68,600 | $ | (23,049 | ) | $ | 45,551 | $ | 67,600 | $ | (32,681 | ) | $ | 34,919 | |||||||||||
| Non-compete agreements | 8.1 | 750 | (360 | ) | 390 | 700 | (408 | ) | 292 | |||||||||||||||||
| Trade name | Indefinite life | 10,200 | — | 10,200 | ||||||||||||||||||||||
| Technology | 2.1 | 3,023 | (1,884 | ) | 1,139 | 22,054 | (2,244 | ) | 19,810 | |||||||||||||||||
| Total | $ | 82,573 | $ | (25,293 | ) | $ | 57,280 | $ | 90,354 | $ | (35,333 | ) | $ | 55,021 | ||||||||||||
| (Thousands of Dollars) | ||||||||||||
| December 31, 2018 | ||||||||||||
| Gross Carrying Amounts | Accumulated Amortization | Net Carrying Amount | ||||||||||
| Customer contracts | $ | 67,600 | $ | (27,755 | ) | $ | 39,845 | |||||
| Non-compete agreements | 700 | (362 | ) | 338 | ||||||||
| Trade name | 10,200 | — | 10,200 | |||||||||
| Technology | 2,262 | (741 | ) | 1,521 | ||||||||
| Total | $ | 80,762 | $ | (28,858 | ) | $ | 51,904 | |||||
| (Thousands of Dollars) | ||||||||||||||
| December 31, 2016 | ||||||||||||||
| Weighted average remaining amortization period (Years) | Gross Carrying Amounts | Accumulated Amortization | Net Carrying Amount | |||||||||||
| Customer contracts | 8.8 | $ | 52,400 | $ | (20,336 | ) | $ | 32,064 | ||||||
| Non-compete agreements | 8.7 | 750 | (288 | ) | 462 | |||||||||
| Trade name | 0.9 - Indefinite life | 11,090 | (686 | ) | 10,404 | |||||||||
| Technology | 2.3 | 2,324 | (1,239 | ) | 1,085 | |||||||||
| Total | $ | 66,564 | $ | (22,549 | ) | $ | 44,015 | |||||||
Amortization expense related to the intangible assets for the years ended December 31, 2019, 2018 and 2017 2016was $6.5 million, $6.3 million and 2015 was $7.1 million, $5.7respectively.
In connection with the C&J Merger, the Company was re-branded as NexTier and does not expect to obtain any further benefits or receive any cash flows associated with the Keane indefinite-lived trade name. As a result, the Company impaired $10.2 million related to the Keane trade name as of December 31, 2019. The impairment is recorded in impairment expense in the consolidated and $4.9 million, respectively.combined statements of operations and comprehensive income (loss).
97
NEXTIER OILFIELD SOLUTIONS INC. AND SUBSIDIARIES
Notes to the Consolidated and Combined Financial Statements
Amortization for the Company’s definite-lived intangible assets, excluding trade name of $10.2 million with indefinite useful life and in processin-process software, over the next five years, is as follows:
| Year-end December 31, | (Thousands of Dollars) | |||
| 2020 | $ | (11,239 | ) | |
| 2021 | (10,953 | ) | ||
| 2022 | (9,867 | ) | ||
| 2023 | (4,973 | ) | ||
| 2024 | (4,973 | ) | ||
| Year-end December 31, | (Thousands of Dollars) | |||
| 2018 | $ | 6,010 | ||
| 2019 | 5,128 | |||
| 2020 | 5,041 | |||
| 2021 | 4,973 | |||
| 2022 | 4,973 | |||
(5) Goodwill
The changes in the carrying amount of goodwill for the years ended December 31, 2017, 20162019, 2018 and 20152017 were as follows:
| (Thousands of Dollars) | |||
| Goodwill as of December 31, 2017 | $ | 134,967 | |
| Purchase price adjustment | (2,443 | ) | |
| Goodwill as of December 31, 2018 | 132,524 | ||
| C&J Merger | 4,934 | ||
| Goodwill as of December 31, 2019 | $ | 137,458 | |
| (Thousands of Dollars) | |||
| Goodwill as of December 31, 2015 | $ | 48,882 | |
| Acquisition of Trican's U.S. Operations | 1,596 | ||
| Goodwill as of December 31, 2016 | 50,478 | ||
| Acquisitions | 84,489 | ||
| Goodwill as of December 31, 2017 | $ | 134,967 | |
The changes in the carrying amount of goodwill for the yearyears ended December 31, 20172019 and 2018 consisted of $0.2 million ofamounts related to the C&J Merger and purchase price adjustments related to the acquisition of the Acquired Trican Operation and $84.3 million recognized in connection with the acquisition of RockPile. These additions to goodwill were allocated to the Completion Services segment. Goodwill recognized in connection with the acquisition of Trican's U.S. Operations was allocated to the Completion Services segment.RockPile, respectively. For additional information, see Note (3)(Mergers and Acquisitions). There were no triggering events identified and no0 impairment recorded since inception and for the years ended December 31, 2017, 20162019, 2018 and 2015.2017.
(6) Inventories, net
Inventories, net, consisted of the following at December 31, 20172019 and December 31, 2016:2018:
| (Thousands of Dollars) | ||||||||
| December 31, 2019 | December 31, 2018 | |||||||
| Sand, including freight | $ | 4,405 | $ | 14,697 | ||||
| Chemicals and consumables | 11,408 | 6,250 | ||||||
| Materials and supplies | 45,828 | 14,722 | ||||||
| Total inventory, net | $ | 61,641 | $ | 35,669 | ||||
| (Thousands of Dollars) | ||||||||
| December 31, 2017 | December 31, 2016 | |||||||
| Sand, including freight | $ | 11,551 | $ | 6,520 | ||||
| Chemicals and consumables | 7,940 | 4,774 | ||||||
| Materials and supplies | 13,946 | 4,597 | ||||||
| Total inventory, net | $ | 33,437 | $ | 15,891 | ||||
Inventories are reported net of obsolescence reserves of $0.3$1.8 million and $0.1$1.0 million as of December 31, 20172019 and 2016 ,2018, respectively. The Company recognized $0.3$0.8 million, $0.02$0.7 million and $0.05$0.3 million of obsolescence expense during the years ended December 31, 2017, 20162019, 2018 and 2015.2017.
98
NEXTIER OILFIELD SOLUTIONS INC. AND SUBSIDIARIES
Notes to the Consolidated and Combined Financial Statements
(7) Property and Equipment, net
Property and Equipment, net consisted of the following at December 31, 20172019 and December 31, 2016:2018:
| (Thousands of Dollars) | ||||||||
| December 31, 2019 | December 31, 2018 | |||||||
| Land | $ | 35,178 | $ | 4,771 | ||||
| Building and leasehold improvements | 90,950 | 32,134 | ||||||
| Office furniture, fixtures and equipment | 10,678 | 7,691 | ||||||
| Machinery and equipment | 1,259,697 | 1,041,212 | ||||||
| 1,396,503 | 1,085,808 | |||||||
| Less accumulated depreciation | (723,060 | ) | (562,813 | ) | ||||
| Construction in progress | 35,961 | 8,324 | ||||||
| Total property and equipment, net | $ | 709,404 | $ | 531,319 | ||||
| (Thousands of Dollars) | ||||||||
| December 31, 2017 | December 31, 2016 | |||||||
| Land | $ | 5,186 | $ | 5,166 | ||||
| Building and leasehold improvements | 30,322 | 30,750 | ||||||
| Office furniture, fixtures and equipment | 6,338 | 4,780 | ||||||
| Machinery and equipment | 773,516 | 514,017 | ||||||
| 815,362 | 554,713 | |||||||
| Less accumulated depreciation | (372,617 | ) | (261,292 | ) | ||||
| Construction in progress | 25,255 | 788 | ||||||
| Total property and equipment, net | $ | 468,000 | $ | 294,209 | ||||
All (gains) and losses are presented within (gain) loss on disposal of assets in the consolidated and combined statements of operations.operations and comprehensive income (loss). The following summarizesdescribes the proceeds received andtotal (gains) losses recognized on the disposal of certain assets of $4.5 million, $5.0 million and $(2.6) million for the years ended December 31, 2017, 20162019, 2018 and 2015:2017:
For the year ended December 31, 2018, the Company disposed of certain hydraulic fracturing components for a net loss of $3.5 million, net of salvage value on failed transmissions. The Company also divested of an idle field operations facility for a net loss of $2.7 million and recorded a net gain of $1.2 million on various other immaterial asset disposals throughout the year.
For the year ended December 31, 2017, the Company divested the following assets:
Casualty Loss
On July 1, 2018, 1 of the Company’s hydraulic frac fleets operating in the Permian Basin was involved in an accidental fire, which resulted in damage to a portion of the equipment in that fleet. In 2018, the Company received $18.1 million of insurance proceeds for replacement cost of the damaged equipment, which offset the $3.2 million impairment loss recognized on the damaged equipment. The resulting gain of $14.9 million was recognized in other income (expense), net in the consolidated and combined statements of operations and comprehensive income (loss) for the year ended December 31, 2018.
99
NEXTIER OILFIELD SOLUTIONS INC. AND SUBSIDIARIES
Notes to the Consolidated and Combined Financial Statements
(8) Long-Term Debt
Long-term debt at December 31, 20172019 and December 31, 20162018 consisted of the following:
| (Thousands of Dollars) | ||||||||
| December 31, 2019 | December 31, 2018 | |||||||
| 2018 Term Loan Facility | 344,750 | 348,250 | ||||||
| Less: Unamortized debt discount and debt issuance costs | (7,127 | ) | (7,520 | ) | ||||
| Total debt, net of unamortized debt discount and debt issuance costs | 337,623 | 340,730 | ||||||
| Less: Current portion | (2,311 | ) | (2,776 | ) | ||||
| Long-term debt, net of unamortized debt discount and debt issuance costs | $ | 335,312 | $ | 337,954 | ||||
Below is a summary of the Company’s credit facilities outstanding as of December 31, 2019:
| (Thousands of Dollars) | ||||||||
| December 31, 2017 | December 31, 2016 | |||||||
| New Term Loan Facility | $ | 283,202 | $ | — | ||||
| Senior Secured Notes | — | 190,000 | ||||||
| 2016 Term Loan Facility | — | 98,103 | ||||||
| Capital leases | 7,918 | 8,075 | ||||||
| Less: Unamortized debt discount and debt issuance costs | (8,173 | ) | (18,353 | ) | ||||
| Total debt, net of unamortized debt discount and debt issuance costs | 282,947 | 277,825 | ||||||
| Less: Current portion | (4,436 | ) | (5,145 | ) | ||||
| Long-term debt, net of unamortized debt discount and debt issuance costs, including capital leases | $ | 278,511 | $ | 272,680 | ||||
| (Thousands of Dollars) | ||||||||
| 2019 ABL Facility | 2018 Term Loan Facility | |||||||
| Original facility size | $ | 450,000 | $ | 350,000 | ||||
| Outstanding balance | $ | — | $ | 344,750 | ||||
| Letters of credit issued | $ | 31,840 | $ | — | ||||
| Available borrowing base commitment | $ | 303,837 | n/a | |||||
Interest Rate(1) | LIBOR or base rate plus applicable margin | LIBOR or base rate plus applicable margin | ||||||
| Maturity Date | October 31, 2024 | May 25, 2025 | ||||||
Maturities of the 2018 Term Loan Facility
| (Thousands of Dollars) | ||||
| Year-end December 31, | ||||
| 2020 | $ | 3,500 | ||
| 2021 | 3,500 | |||
| 2022 | 3,500 | |||
| 2023 | 3,500 | |||
| 2024 | 3,500 | |||
| $ | 17,500 | |||
Deferred charges include deferred financing costs and debt discounts or debt premiums. Deferred charges related to the Company replaced its 20162019 ABL Facility withare capitalized. Deferred charges related to the 2018 Term Loan Facility are netted against the carrying amount of term debt. Deferred charges are amortized to interest expense using the effective interest method. Interest expense related to the deferred financing costs for the years ended December 31, 2019, 2018 and 2017 ABL Facility (as described below).was $1.4 million, $3.1 million, and $5.2 million, respectively.
100
NEXTIER OILFIELD SOLUTIONS INC. AND SUBSIDIARIES
Notes to the Consolidated and Combined Financial Statements
On October 31, 2019, the Company entered into the Second Amended and Restated Asset-Based Revolving Credit Agreement (“2019 ABL Facility”), modifying the Company’s pre-existing asset-based revolving credit facility (“2017 ABL Facility”). Deferred charges associated with the 2019 ABL Facility were capitalized and totaled $1.2 million. In connection with the modification of the 2017 ABL Facility, the Company wrote off $0.5 million of deferred financing costs. The Company expensed $0.3 million inremaining deferred financing costs related to the proportionate decrease in the borrowing capacity with PNC Bank under the new 2017 ABL Facility. The remaining $1.0 million in deferred financing costs related to the 2016 ABL Facility is beingwill be amortized over the life of the 2019 ABL Facility. Unamortized deferred charges associated with the 2019 and 2017 ABL Facility.
| (Thousands of Dollars) | ||||
| Year-end December 31, | ||||
| 2018 | 2,850 | |||
| 2019 | 2,850 | |||
| 2020 | 2,850 | |||
| 2021 | 2,850 | |||
| 2022 | 271,800 | |||
| $ | 283,200 | |||
ABL Revolving Credit Facility
Interest expense incurred on this lease was $0.3 million, $0.3 million and $0.4 million forduring the yearsyear ended December 31, 2017, 2016 and 2015, respectively.
| Year-end December 31, | (Thousands of Dollars) | |||
| 2018 | $ | 3,633 | ||
| 2019 | 3,600 | |||
| 2020 | 758 | |||
| 2021 | 527 | |||
| 2022 | — | |||
| Subtotal | 8,518 | |||
| Less amount representing interest | (600) | |||
| $ | 7,918 | |||
(9) Significant Risks and Uncertainties
The Company operates in two3 reportable segments: Completion Services, Well Construction and OtherIntervention, and Well Support Services, with significant concentration in the Completion Services segment. During the years ended December 31, 2017, 20162019, 2018 and 2015,2017, sales to Completion Services customers represented 99%94%, 98%, and 99% of the Company’s consolidated revenue, respectively. During the years ended December 31, 2017, 2016 and 2015, sales to Completion Services customers represented 99%, 212%, and 99% of the Company's consolidated gross profit, respectively.
The Company depends on its customers’customers' willingness to make operating and capital expenditures to explore for, develop and produce oil and natural gas onshore in North America, which in turn,the U.S. This activity is affecteddriven by many factors, including current and expected levels ofcrude oil and natural gas prices. Oil and natural gas prices began to decline drastically beginning lateThe U.S. energy industry experienced a significant downturn in the second half of 2014 and remained low through early 2016. This decline, sustained2016, driven primarily by global oversupply of oil and natural gas, drovea decline in commodity prices. From early 2016 through late 2018, the industry into a downturn. Recent events have provided upward momentum for energy prices. With the reboundU.S. generally experienced some recovery in commodity prices from their lows in early 2016,and drilling and completion activity has continued to increase in 2017, withactivity. Over this time frame, the U.S. active rig count increased from a trough of 404 rigs in May 2016 to a peak of 1,083 rigs in December 2017 more than doubling2018, driving significant demand for the trough in theCompany's completion services. From December 28, 2018 through December 31, 2019, U.S. active rig count registereddecreased by approximately 26% to 805 rigs.
While U.S. active rig count increased from its low in May 2016. The2016, macro conditions remain range bound, and supply and demand for completion services remains challenged, resulting in adverse pricing, utilization impacts and ongoing commodity price volatility. In late 2019 and early 2020, and in response to the oversupply of hydraulic fracturing equipment, an increasing number of horsepower retirements were announced, removing a significant growth in production resultingbase of equipment from increased drilling activity has contributed to increased uncertainty concerning the direction of oil and gas prices overmarket. Despite the near and immediate term, andcontinued challenging market volatility has continued to persist. Despite this market volatility,conditions, the Company continueshas been able to experience increased demand for its servicesperform well, driven by a high level of efficiency achieved at the wellsite, a customer partnership model and believes itinvestments in innovation. In response to these ongoing pressures, the Company's continued success is in a more stable demand environment than existed during the above-mentioned market decline.attributable
101
NEXTIER OILFIELD SOLUTIONS INC. AND SUBSIDIARIES
Notes to the Consolidated and Combined Financial Statements
primarily to the Company's high level of efficiency achieved at the wellsite, as well as its high-quality customer base and dedicated contract model.
For the year ended December 31, 2019, revenue from four customers individually represented more than 10% and collectively represented 55% of the Company’s consolidated revenue. For the year ended December 31, 2018, three customers individually represented more than 10% and collectively represented 39% of the Company’s consolidated revenue. For the year ended December 31, 2017, no customer individually represented more than 10% of the Company'sCompany’s consolidated revenue.
For the year ended December 31, 2016, revenue2019, purchases from the Company's top three customers individuallyone supplier represented 18%, 15% and 15%5% of the Company's consolidated revenue, respectively.Company’s overall purchases. For the year ended December 31, 2015, revenue from the Company's top two customers represented 38% and 21% of the Company's consolidated revenue, respectively. Revenue is earned from each of these customers within the Completion Services segment.
(10) Derivatives
On June 22, 2018, the Company unwound its existing interest rate swapswaps and entered intoreceived $3.2 million in proceeds. The Company used the $3.2 million of proceeds to execute a new forward startingoff-market interest rate swap to protect against volatility of future cash flows and hedge a portion of the variable interest payments on the New Term Loan Facility.
The following tables present the fair value of the Company’s derivative instruments on a gross and net basis as of the periods shown below:
102
NEXTIER OILFIELD SOLUTIONS INC. AND SUBSIDIARIES
Notes to the Consolidated and Combined Financial Statements
| (Thousands of Dollars) | (Thousands of Dollars) | |||||||||||||||||||||||||||||||||||||
| Derivatives designated as hedging instruments | Derivatives not designated as hedging instruments | Gross Amounts of Recognized Assets and Liabilities | Gross Amounts Offset in the Balance Sheet(1) | Net Amounts Presented in the Balance Sheet(2) | Derivatives designated as hedging instruments | Derivatives not designated as hedging instruments | Gross Amounts of Recognized Assets and Liabilities | Gross Amounts Offset in the Balance Sheet(1) | Net Amounts Presented in the Balance Sheet(2) | |||||||||||||||||||||||||||||
| As of December 31, 2017: | ||||||||||||||||||||||||||||||||||||||
| As of December 31, 2019: | ||||||||||||||||||||||||||||||||||||||
| Other current asset | $ | — | $ | — | $ | — | $ | — | $ | — | $ | — | $ | — | $ | — | $ | — | $ | — | ||||||||||||||||||
| Other noncurrent asset | 324 | — | 324 | — | 324 | — | — | — | — | — | ||||||||||||||||||||||||||||
| Other current liability | (254 | ) | — | (254 | ) | — | (254 | ) | (1,729 | ) | — | (1,729 | ) | — | (1,729 | ) | ||||||||||||||||||||||
| Other noncurrent liability | — | — | — | — | — | (5,559 | ) | — | (5,559 | ) | — | (5,559 | ) | |||||||||||||||||||||||||
| As of December 31, 2016: | ||||||||||||||||||||||||||||||||||||||
| As of December 31, 2018: | ||||||||||||||||||||||||||||||||||||||
| Other current asset | $ | — | $ | 342 | $ | 342 | $ | (342 | ) | $ | — | $ | — | $ | — | $ | — | $ | — | $ | — | |||||||||||||||||
| Other noncurrent asset | 129 | — | 129 | (129 | ) | — | — | — | — | — | — | |||||||||||||||||||||||||||
| Other current liability | (313 | ) | (959 | ) | (1,272 | ) | 342 | (930 | ) | (129 | ) | — | (129 | ) | — | (129 | ) | |||||||||||||||||||||
| Other noncurrent liability | — | (1,473 | ) | (1,473 | ) | 129 | (1,344 | ) | (169 | ) | — | (169 | ) | — | (169 | ) | ||||||||||||||||||||||
(1) |
(2) | There are no amounts subject to an enforceable master netting arrangement that are not netted in these amounts. There are no amounts of related financial collateral received or pledged. |
The following table presents gains and losses for the Company’s interest rate derivatives designated as cash flow hedges (in thousands of dollars):
| Year Ended December 31, | ||||||||||||||
| 2019 | 2018 | 2017 | Location | |||||||||||
| Amount of gain (loss) recognized in other comprehensive income on derivative | $ | (7,628 | ) | $ | (880 | ) | $ | 791 | OCI | |||||
| Amount of gain (loss) reclassified from accumulated other comprehensive income (loss) (“AOCI”) into earnings | 239 | 697 | (72 | ) | Interest Expense | |||||||||
| Amount of loss reclassified from AOCI into earnings as a result of originally forecasted transaction becoming probable of not occurring | — | — | (100 | ) | Interest Expense | |||||||||
| Year Ended December 31, | ||||||||||||||
| 2017 | 2016 | 2015 | Location | |||||||||||
| Amount of gain (loss) recognized in other comprehensive income ("OCI") on derivative | $ | 791 | $ | (1,784 | ) | $ | (2,765 | ) | OCI | |||||
| Amount of loss reclassified from AOCI into income | (72 | ) | (603 | ) | (1,578 | ) | Interest Expense | |||||||
| Amount of loss reclassified from AOCI into income as a result of originally forecasted transaction becoming probable of not occurring | (100 | ) | (3,038 | ) | — | Interest Expense | ||||||||
The lossgain (loss) recognized in other comprehensive income for the derivative instrument is presented within the hedging activities line item in the consolidated and combined statements of operations and comprehensive income (loss).
There were no0 gains or losses recognized in income as a result of excluding amounts from the assessment of hedge effectiveness. Based on recorded values at December 31, 2017, $0.32019, $1.5 million of net gainslosses will be reclassified from accumulated other comprehensive income (loss) into earnings within the next 12 months.
The following table presents gains and losses for the Company’s interest rate derivatives not designated in a hedge relationship under the Financial Accounting Standards Board (the “FASB”) Accounting Standards Codification (“ASC”)ASC 815, “Derivative Financial Instruments,” (in thousands of dollars):
| Year Ended December 31, | ||||||||||||||
| Description | Location | 2019 | 2018 | 2017 | ||||||||||
| Gains (loss) on interest contracts | Interest expense | $ | — | $ | — | $ | (367 | ) | ||||||
103
NEXTIER OILFIELD SOLUTIONS INC. AND SUBSIDIARIES
Notes to the Consolidated and Combined Financial Statements
| Year Ended December 31, | ||||||||||||||
| Description | Location | 2017 | 2016 | 2015 | ||||||||||
| Gains (loss) on interest contracts | Interest expense | $ | (367 | ) | $ | 240 | $ | — | ||||||
See Note (11)(Fair Value Measurements and Financial Information) for further information related to the Company’s derivative instruments.
(11) Fair Value Measurements and Financial Information
The Company discloses the required fair values of financial instruments in its assets and liabilities under the hierarchy guidelines, in accordance with GAAP. The Company'sCompany’s financial instruments consist of cash and cash equivalents, accounts receivable, accounts payable, accrued expenses, derivative instruments, long-term debt capitaland finance lease obligations and contingent liability.obligations. As of December 31, 20172019, and 2016,2018, the carrying values of the Company'sCompany’s financial instruments, included in its consolidated and combined balance sheets, approximated or equaled their fair values. There were no transfers into or out of Levels 1, 2 and 3 during the years endedas of December 31, 20172019 and 2016.2018.
Recurring Fair Value Measurement
At December 31, 2017 and 2016,2019, the two financial instrumentsinstrument measured by the Company at fair value on a recurring basis werebases was its interest rate derivatives and the Aggregate CVR Payment Amount related to the Acquisition of RockPile.derivative.
The fair market value of the derivative financial instrument reflected on the consolidated balance sheetsheets as of December 31, 20172019, and 20162018 was determined using industry-standard models that consider various assumptions, including current market and contractual rates for the underlying instruments, time value, implied volatilities, nonperformance risk, as well as other relevant economic measures. Substantially all of these inputs are observable in the marketplace through the full term of the instrument and can be supported by observable data
The following tables present the placement in the fair value hierarchy of assets and liabilities that were measured at fair value on a recurring basis at December 31, 20172019, and 20162018 (in thousands of dollars):
| Fair value measurements at reporting date using | ||||||||||||||||
| December 31, 2017 | Level 1 | Level 2 | Level 3 | |||||||||||||
| Assets: | ||||||||||||||||
| Interest rate derivative | $ | 70 | $ | — | $ | 70 | $ | — | ||||||||
| Aggregate CVR Payment | — | — | — | — | ||||||||||||
| Liabilities: | ||||||||||||||||
| Interest rate derivatives | — | — | — | — | ||||||||||||
| Aggregate CVR Payment | 6,665 | — | 6,665 | — | ||||||||||||
| Fair value measurements at reporting date using | ||||||||||||||||
| December 31, 2019 | Level 1 | Level 2 | Level 3 | |||||||||||||
| Liabilities: | ||||||||||||||||
| Interest rate derivatives | $ | (7,288 | ) | $ | — | $ | (7,288 | ) | $ | — | ||||||
| Fair value measurements at reporting date using | ||||||||||||
| December 31, 2018 | Level 1 | Level 2 | Level 3 | |||||||||
| Liabilities: | ||||||||||||
| Interest rate derivatives | (298 | ) | — | (298 | ) | — | ||||||
| Fair value measurements at reporting date using | ||||||||||||
| December 31, 2016 | Level 1 | Level 2 | Level 3 | |||||||||
| Assets: | ||||||||||||
| Interest rate derivative | — | — | — | — | ||||||||
| Liabilities: | ||||||||||||
| Interest rate derivatives | 2,274 | — | 2,274 | — | ||||||||
The fair values of indefinite-lived assets and long-lived assets are determined with internal cash flow models based on significant unobservable inputs. The Company measures the fair value of its property, plant and equipment using the discounted cash flow method, the fair value of its customer contracts using the multi-period excess earning method and income based “with and without” method, the fair value of its trade names and acquired technology using the “income-based relief-from-royalty” method and the fair value of its non-compete agreement using the “lost income” approach. Assets acquired as a result of the acquisition of the Acquired Trican OperationsRockPile, RSI, and RockPileC&J transactions were recorded at their fair values on the date of acquisition. See Note (3)Mergers and Acquisitionsfor further details.
Given the unobservable nature of the inputs used in the Company’s internal cash flow models, the cash flows models are deemed to use Level 3 inputs.
Credit Risk
The Company’s financial instruments exposed to concentrations of credit risk consist primarily of cash and cash equivalents, derivative contracts and trade receivables.
104
NEXTIER OILFIELD SOLUTIONS INC. AND SUBSIDIARIES
Notes to the Consolidated and Combined Financial Statements
The Company’s cash balances on deposit with financial institutions totaled $96.1$255.0 million and $48.9$80.2 million as of December 31, 20172019 and 2016,2018, respectively, which exceeded Federal Deposit Insurance Corporation insured limits. The Company regularly monitors these institutions’ financial condition.
The credit risk from the derivative contract derives from the potential failure of the counterparty to perform under the terms of the derivative contracts. The Company minimizes counterparty credit risk in derivative instruments by entering into transactions with high-quality counterparties, whose Standard & Poor'sPoor’s credit rating is higher than BBB. The derivative instruments entered into by the Company do not contain credit-risk-related contingent features.
The majority of the Company’s trade receivables have payment terms of 30 days or less. AsSignificant customers are those that individually account for 10% or more of December 31, 2017, trade receivables from the Company's top customer represented 17% ofCompany’s consolidated revenue or total accounts receivable. As of December 31, 2016,2019, trade receivables from one customer individually represented 10% more of the top fourCompany’s total accounts receivable. As of December 31, 2018, trade receivables from three customers individually represented 15%, 14%, 13%more than 10% and 12%collectively represented 49% of the Company’s total accounts receivable. The Company mitigates the associated credit risk by performing credit evaluations and monitoring the payment patterns of its customers. The Company has not had to write-off any bad debts for its customers as of December 31, 2017 and 2016 and has a process in place to collect all receivables within 30 to 60 days of aging.As of December 31, 2019 and 2018, the Company had $0.7 million and $0.5 million in allowance for doubtful accounts, respectively, based on specific identification. The Company wrote-off $0.7 million of bad debts during the year ended 2019. In 2018, the Company wrote-off $0.6 million of bad debt in 2018, in connection with its litigation with Halcon Operating Co., Inc. and Halcon Energy Properties. The Company did not write-off any bad debts during 2017. For further detail, see Note (18) Commitments and Contingencies.
(12) Equity-BasedStock-Based Compensation
As of December 31, 2017,2019, the Company has fourhad 4 types of equity-basedstock-based compensation under theits Equity and Incentive Award Plan:Plans: (i) deferred stock awards for three3 executive officers, (ii) restricted stock awards issued to independent directors and certain executives and employees, (iii) restricted stock units issued to executive officers and key management employees and (iv) non-qualified stock options issued to executive officers. The Company has reserved 7,734,601approximately 5,899,928 shares of its common stock reserved and available for awards that may be issuedgrant under the Equity and Incentive Award Plan and approximately 8,155,054 shares of its common stock reserved and available for grant under the Management Incentive Plan.
105
| Twelve Months Ended December 31, | ||||||||||||
| 2017 | 2016 | 2015 | ||||||||||
| Class C Interests | $ | — | $ | — | $ | 313 | ||||||
| Class B Interests | — | 1,984 | — | |||||||||
| Deferred stock awards | 4,280 | — | — | |||||||||
| Restricted stock awards | 399 | — | — | |||||||||
| Restricted stock units | 4,766 | — | — | |||||||||
| Non-qualified stock options | 1,133 | — | $ | — | ||||||||
| Equity-based compensation cost | $ | 10,578 | $ | 1,984 | $ | 313 | ||||||
Notes to the Consolidated and Combined Financial Statements
| Year Ended December 31, | ||||||||||||
| 2019 | 2018 | 2017 | ||||||||||
| Deferred stock awards | — | 4,280 | 4,280 | |||||||||
| Restricted stock awards | 1,486 | 611 | 399 | |||||||||
| Restricted stock units | 20,426 | 9,822 | 4,766 | |||||||||
| Non-qualified stock options | 3,498 | 2,453 | 1,133 | |||||||||
| Restricted stock performance-based stock unit awards | 3,567 | — | — | |||||||||
| Stock-based compensation | $ | 28,977 | $ | 17,166 | $ | 10,578 | ||||||
| Tax benefit | $ | (6,954 | ) | (4,134 | ) | (2,532 | ) | |||||
| Stock-based compensation, net of tax | 22,023 | $ | 13,032 | $ | 8,046 | |||||||
(a) Deferred stock awards
Upon consummation of the IPO, the executive officers of the Company identified in the table below became eligible for retention payments, the first on January 1, 2018 and the second on January 1, 2019, in the bonus amounts set forth in the table below. On March 16, 2017, the compensation committee (the "Compensation Committee"“Compensation Committee”) of the boardBoard of directors of the Company (the "Board of Directors")Directors approved, and each executive officer agreed, that in lieu of the executive officer'sofficer’s cash retention payments, the executive officer was granted a deferred stock award under the Equity and Incentive Award Plan. Each executive officer’s deferred stock award provides that, subject to the executive officer remaining employed through the applicable vesting date and complying with the restrictive covenants imposed on him under his employment agreement with the Company, the executive officer will be entitled to receive payment of a stock bonus equal to the variable number of shares of the Company'sCompany’s common stock having a fair market value on the payment date equal to the bonus amount set forth in the table below:
| Bonus Amounts (In thousands) | ||||||||
| First | Second | |||||||
| James C. Stewart | $ | 1,976 | $ | 1,976 | ||||
| Gregory L. Powell | $ | 1,646 | $ | 1,646 | ||||
| M. Paul DeBonis Jr. | $ | 659 | $ | 659 | ||||
| Bonus Amounts | ||||||||
| First | Second | |||||||
| James C. Stewart | $ | 1,975,706 | $ | 1,975,706 | ||||
| Gregory L. Powell | $ | 1,646,422 | $ | 1,646,422 | ||||
| M. Paul DeBonis Jr. | $ | 658,569 | $ | 658,569 | ||||
The Company accounted for these deferred stock awards as liability classified awards and recorded them at fair value based on the fixed monetary value on the date of grant. The Company recognized $8.6 million as a deferred compensation expense liability and contra-equity during the first quarter of 2017.
The first stock bonuses vested on January 1, 2018 and were paid on February 15, 2018, and the2018. The second stock bonus will vest onvested January 1, 2019, to be paid onwith an original payout date of February 15, 2019, that was amended in February 2019 to a payout date of March 4, 2019. For the yearyears ended December 31, 2019, 2018 and 2017 the Company recognized NaN, $4.3 million and $4.3 million respectively of non-cash stock compensation expense into income, which is presented within selling, general and administrative expense in the consolidated and combined statements of operations and comprehensive income (loss).earnings. As of December 31, 2017, total2019, there was 0 remaining unamortized compensation cost related to unvested deferred stock awards was $4.3 million, whichawards.
106
NEXTIER OILFIELD SOLUTIONS INC. AND SUBSIDIARIES
Notes to the Company expects to recognize over the remaining weighted-average period of 1 year.Consolidated and Combined Financial Statements
(b) Restricted stock awards
For the three and twelve monthsyears ended December 31, 2019, 2018, and 2017 the Company recognized $1.5 million, $0.6 million, and $0.4 million respectively, of non-cash stock compensation expense into income, which is presented within selling, general and administrative expense in the consolidated and combined statements of operations and comprehensive income (loss).expense. As of December 31, 2017,2019, total unamortized compensation cost related to unvested restricted stock awards was $0.7 million, which the Company expects to recognize over the remaining weighted-average period of 1.940.94 years.
Rollforward of restricted stock awards as of December 31, 20172019 is as follows:
Number of Restricted Stock Awards (In thousands) | Weighted average grant date fair value | ||||||
| Total non-vested at December 31, 2018 | 94 | $ | 17.40 | ||||
| Shares issued | 678 | 4.99 | |||||
| Shares vested | (478 | ) | 7.70 | ||||
| Shares forfeited | (2 | ) | 4.55 | ||||
| Non-vested balance at December 31, 2019 | 292 | $ | 4.55 | ||||
| Number of Restricted Stock Awards | Weighted average grant date fair value | ||||||
| Total non-vested at January 20, 2017 | 114,580 | $ | 22.00 | ||||
| Shares issued | 18,947 | 14.49 | |||||
| Shares vested | (38,192 | ) | 22.00 | ||||
| Shares forfeited | — | — | |||||
| Non-vested balance at December 31, 2017 | 95,335 | $ | 20.51 | ||||
During 2019, the Company granted approximately 1.6 million restricted stock units to executive officers and key management employees. Additionally, the Company granted approximately $0.9 million replacement restricted stock units in connection with the C&J Merger. Restricted stock units are stock awards that vest over a one to three year service period.
For the years ended December 31, 2019, 2018 and 2017, the Company recognized $20.4 million, $9.8 million and $4.8 million, respectively, of non-cash stock compensation expense. As of December 31, 2019, total unamortized compensation cost related to unvested restricted stock units was $19.1 million, which the Company expects to recognize over the remaining weighted-average period of 1.84 years.
107
NEXTIER OILFIELD SOLUTIONS INC. AND SUBSIDIARIES
Notes to the Consolidated and Combined Financial Statements
Number of Restricted Stock Units (In thousands) | Weighted average grant date fair value | ||||||
| Total non-vested at December 31, 2018 | 1,947 | $ | 14.83 | ||||
| Units issued | 2,679 | 8.57 | |||||
| Units vested | (1,700 | ) | 11.58 | ||||
| Units forfeited | (166 | ) | 13.89 | ||||
| Non-vested balance at December 31, 2019 | 2,760 | $ | 10.82 | ||||
(d) Non-qualified stock options
During 2019, the Company granted approximately 0.5 million replacement stock options in connection with the C&J merger. When granted the stock options had a remaining vesting term of approximately one year ended December 31, 2017, executive officers and key management personnel received,or less. Stock options granted in total, 1,238,127 RSUs under the Equity and Incentive Award Plan. 1,104,208 of these RSU awards vest with respect to 33.33% beginning on January 20, 2018 and 133,919 of these RSU awards vest with respect to 33.33% beginning on the first anniversary of the date of grant. The remaining RSU awards vest with respect to an additional 33.33% on the next two anniversaries,2017 have a three-year vesting period, provided that the participant does not incur a termination before the applicable vesting date. RSUs are not considered issued and outstanding for purposes of earnings per share calculations until vested.
| Number of Restricted Stock Units | Weighted average grant date fair value | ||||||
| Total non-vested at December 31, 2016 | — | $ | — | ||||
| Units issued | 1,238,127 | 14.66 | |||||
| Units vested | — | — | |||||
| Actual units forfeited | (138,507 | ) | 14.95 | ||||
| Non-vested balance at December 31, 2017 | 1,099,620 | $ | 14.62 | ||||
Number of Stock Options (In thousands) | Weighted average grant date fair value | ||||||
| Total outstanding at December 31, 2018 | 1,219 | $ | 6.75 | ||||
| Options granted | 549 | 0.74 | |||||
| Options exercised | — | — | |||||
| Actual options forfeited | (25 | ) | 6.77 | ||||
| Options expired | — | — | |||||
| Total outstanding at December 31, 2019 | 1,743 | $ | 4.86 | ||||
There were 1.4 million stock options exercisable or vested at December 31, 2019.
108
NEXTIER OILFIELD SOLUTIONS INC. AND SUBSIDIARIES
Notes to the Consolidated and Combined Financial Statements
| Number of Stock Options | Weighted average grant date fair value | ||||||
| Total outstanding at December 31, 2016 | — | $ | — | ||||
| Options granted | 640,854 | 6.16 | |||||
| Options exercised | — | — | |||||
| Actual options forfeited | (50,877 | ) | 6.16 | ||||
| Options expired | — | — | |||||
| Total outstanding at December 31, 2017 | 589,977 | $ | 6.16 | ||||
Assumptions used in calculating the fair value of the stock options granted during the year are summarized below:
| 2019 Options Granted | 2018 Options Granted | 2017 Options Granted | |||||||||
| Valuation assumptions: | |||||||||||
| Expected dividend yield | 0 | % | 0 | % | 0 | % | |||||
| Expected equity volatility | 49.6 | % | 46.3 | % | 51.5 | % | |||||
| Expected term (years) | 7.3 - 8.1 | 6 | 6 | ||||||||
| Risk-free interest rate | 1.7 | % | 2.7 | % | 1.6 | % | |||||
| Weighted average: | |||||||||||
| Exercise price per stock option | $19.09 - $26.41 | $ | 15.31 | $ | 19.00 | ||||||
| Market price per share | $ | 4.55 | $ | 15.31 | $ | 14.49 | |||||
| Weighted average fair value per stock option | $ | 0.74 | $ | 7.28 | $ | 6.16 | |||||
(e) Performance-based RSU awards
On March 25, 2019, the Company issued 0.3 million performance-based RSUs to executive officers under the Equity Plan, which had a grant date fair valued at $3.6 million. One half of performance-based RSUs were scheduled to vest at December 31, 2020 (the "two-year performance-based RSUs"), while the remaining half were scheduled to vest at December 31, 2021 (the "three-year performance-based RSUs"). Each vesting was subject to a payout percentage based on the Company's annualized total stockholder return ranking relative to its total stockholder return peer group achieved during the performance period, which extends from January 1, 2019 to December 31, 2020 for the two-year performance-based RSUs and January 1, 2019 to December 31, 2021 for the three-year performance-based RSUs. The number of shares that could have been earned at the end of the vesting period ranged from 25% to 200% of the target award amount, if the threshold performance criteria was met. These performance-based RSUs were settled in the Company's common stock and are classified as equity awards. In connection with the Merger, the performance-based RSU’s immediately vested on the C&J Acquisition Date. The remaining compensation expense associated with these performance-based RSUs was amortized into earnings on the date of close. As of December 31, 2019, there was no remaining compensation cost related to performance-based RSUs.
Number of Performance-based RSU’s (In thousands) | Weighted average grant date fair value | ||||||
| Total outstanding at December 31, 2018 | — | $ | — | ||||
| Performance-based RSU’s issued | 327 | 11.00 | |||||
| Performance-based RSU’s vested | (327 | ) | — | ||||
| Performance-based RSU’s forfeited | — | — | |||||
| Total outstanding at December 31, 2019 | — | $ | — | ||||
Assumptions used in calculating the fair value of the performance-based RSU’s granted during the year are summarized below:
109
NEXTIER OILFIELD SOLUTIONS INC. AND SUBSIDIARIES
Notes to the Consolidated and Combined Financial Statements
| Weighted Average as of December 31, 2017 | ||||
| Valuation assumptions: | ||||
| Expected dividend yield | 0 | % | ||
| Expected equity volatility | 51.5 | % | ||
| Expected term (years) | 6 | |||
| Risk-free interest rate | 1.6 | % | ||
| Exercise price per stock option | $ | 19.00 | ||
| Market price per share | $ | 14.49 | ||
| Weighted average fair value per stock option | $ | 6.16 | ||
| 2019 Performance-based RSU’s Granted | |||
| Valuation assumptions: | |||
| Expected dividend yield | 0 | % | |
| Expected equity volatility, including peers | 40.2 % - 73.2% | ||
| Expected term (years) | 1.8 - 2.8 | ||
| Risk-free interest rate | 2.2% - 2.3% | ||
(13) Owners’Stockholders’ Equity
(a) Certificate of Incorporation
The Company was formed as a Delaware corporation on October 13, 2016. The Company'sCompany’s certificate of incorporation provides for (i) the authorization of 500,000,000 shares of common stock with a par value of $0.01 per share and (ii) the authorization of 50,000,000 shares of undesignated preferred stock with a par value of $0.01 per share that may be issued from time to time by the Company’s Board of Directors in one or more series.
Each holder of the Company'sCompany’s common stock is entitled to one vote per share and is entitled to receive dividends and any distributions upon the liquidation, dissolution or winding-up of the Company. The Company'sCompany’s common stock has no preemptive rights, no cumulative voting rights and no redemption, sinking fund or conversion provisions.
(b) Keane Group Holdings Recapitalization
As described in Note (1) (Basis of Presentation and Nature of Operations), the Company completed Organizational Transactions to effect the IPO that resulted in all equity interests in Keane Group, which consisted of 1,000,000 class A units, 176,471 class B units and 294,118 class C units, being converted to an aggregate of 87,428,019 shares of the Company'sCompany’s common stock on January 20, 2017. The Organizational Transactions represented a transaction between entities under common control and was accounted for similar to pooling of interests. In accordance with the requirements of ASC 805, the Company recognized the aggregate 87,428,019 shares of common stock at the carrying amount of the equity interests in Keane Group on January 20, 2017, which totaled $453.8 million. The Company recorded $0.9 million of par value common stock and the remaining $452.9 million as paid-in capital in excess of par value. Furthermore, as the Organizational Transactions resulted in a change in the reporting entity from Keane Group Holdings, LLC to Keane Group, Inc., paid-in capital in excess of par value for Keane Group, Inc. was reduced by Keane Group'sGroup’s retained deficit as of January 20, 2017 of $296.7 million.
(c) Initial Public Offering
As described in Note (1)(Basis of Presentation and Nature of Operations), on January 25, 2017, the Company completed the IPO of 30,774,000 shares of its common stock at the public offering price of $19.00 per share, which included 15,700,000 shares offered by the Company and 15,074,000 shares offered by the selling stockholder, including 4,014,000 shares sold as a result of the underwriters'underwriters’ exercise of their overallotment option. The net proceeds of the IPO to the Company was $255.5 million, which were used to fully repay Holdco II’s term loan balance of $99.0 million and the associated prepayment penalty of $13.8 million, and repay $50.0 million of its 12% secured notes due 2019 and the associated prepayment penalty of approximately $0.5 million. The remaining net proceeds were used for general corporate purposes, including capital expenditures, working capital and potential acquisitions and strategic transactions. Upon completion of the IPO and the reorganization, the Company had 103,128,019 shares of common stock outstanding.
110
NEXTIER OILFIELD SOLUTIONS INC. AND SUBSIDIARIES
Notes to the Consolidated and Combined Financial Statements
All underwriting discounts and commissions and other specific costs directly attributable to the IPO were deferred and applied to the gross proceeds of the offering through paid-in capital in excess of par value.
(d) RockPile Acquisition
As described in Note (3) (Mergers and Acquisitions), s, the Company completed its acquisition of RockPile on July 3, 2017 for cash consideration of $116.6 million, subject to post-closing adjustments, 8,684,210 shares of the Company’s common stock and contingent value rights, as described in Note (3) (Mergers and Acquisitions)s. The fair value of the Acquisition Shares was calculated using the closing price of the Company'sCompany’s common stock on July 3, 2017, of $16.29, discounted to reflect the lack of marketability resulting from the 180-day lock-up period during which resale of the Acquisition Shares is restricted. Upon completion of the acquisition of RockPile, the Company had 111,831,176 shares of common stock outstanding.
(e) Vesting of Stock Awards
During the year ended December 31, 2019, 1,962,809 shares were issued, net of share settlements for payment of payroll taxes, upon the vesting of stock-based compensation awards. Shares withheld during the period were immediately retired by the Company.
(f) Secondary Offerings
On January 17, 2018, the Company’s Registration Statement on Form S-1 (File No. 333-222500) was declared effective by the SEC for an offering on behalf of Keane Investor, pursuant to which 15,320,015 shares were sold by the selling stockholder (including 1,998,262 shares sold pursuant to the exercise of the underwriters’ over-allotment option) at a price to the public of $18.25 per share. The Company did not sell any common stock in, and did not receive any of the proceeds from, the offering. Upon completion of the offering, Keane Investor controlled 50.8% of the Company’s outstanding common stock. During the December 31, 2018, the Company incurred $13.0 million of transaction costs on behalf of the selling stockholder, which were included within selling, general and administrative expenses in the consolidated and combined statement of operations and comprehensive income (loss).
In February 2018, the Company filed a Registration Statement on Form S-3 (File No. 333-222831) that was effective upon its filing. In December 2018, a selling stockholder sold 5,251,249 of the Company’s common stock at a price to the public of $11.02 per share. In conjunction with this offering, the Company repurchased 520,000 shares. The Company did not sell any common stock in, and did not receive any of the proceeds from, this offering. As a result of this offering, Keane Investor owned approximately 49.6% of the Company’s outstanding common stock, and the Company ceased being a “controlled company” within the meaning of the NYSE rules.
(g) C&J Merger
As described in Note (3) Mergers and Acquisitions, the Company completed the C&J Merger on October 31, 2019 for total consideration of approximately $485.1 million, consisting of (i) equity consideration in the form of 105.9 million shares of Keane common stock issued to C&J stockholders with a value of $481.9 million and (ii) replacement share based compensation awards attributable to pre-Merger services with a value of $3.2 million.
111
NEXTIER OILFIELD SOLUTIONS INC. AND SUBSIDIARIES
Notes to the Consolidated and Combined Financial Statements
(h) Stock Repurchase
During the year ended December 31, 2018, the Company settled $105.0 million of total share repurchases of its common stock at an average price of $12.93 per share, representing a total of 8,111,764 common shares of the Company. As of December 31, 2018, the Company had approximately $150.0 million remaining for future share repurchases under its existing stock repurchase program. Of the total amount of shares repurchased in 2018, 1,248,440 shares and 520,000 shares were repurchased from White Deer Energy (as defined herein) and Keane Investor, respectively. The shares repurchased from Keane Investor were not repurchased under the Company’s existing stock repurchase program. For further details of these related-party transactions, see Note (19) Related Party Transactions.
On December 11, 2019, the Company announced the board of directors approved a new share repurchase program for up to $50.0 million through December 2020. NaN share repurchases were made under the share repurchase program in 2019.
(14) Accumulated Other Comprehensive (Loss)Loss
Accumulated other comprehensive (loss)loss in the equity section of the consolidated and combined balance sheets includes the following:
| (Thousands of Dollars) | |||||||||||
| Foreign currency items | Interest rate contract | AOCI | |||||||||
| December 31, 2018 | $ | — | $ | (798 | ) | $ | (798 | ) | |||
| Net income (loss) | — | (239 | ) | (239 | ) | ||||||
| Other comprehensive loss | (116 | ) | (7,628 | ) | (7,744 | ) | |||||
| December 31, 2019 | $ | (116 | ) | $ | (8,665 | ) | $ | (8,781 | ) | ||
| (Thousands of Dollars) | |||||||||||
| Foreign currency items | Interest rate contract | AOCI | |||||||||
| December 31, 2016 | $ | (2,603 | ) | $ | (184 | ) | $ | (2,787 | ) | ||
| Other comprehensive income, before tax | 96 | 963 | 1,059 | ||||||||
Income tax expense(1) | — | — | — | ||||||||
| December 31, 2017 | $ | (2,507 | ) | $ | 779 | $ | (1,728 | ) | |||
The following table summarizes reclassifications out of accumulated other comprehensive (loss)loss into earnings during years ended December 31, 2017, 20162019, 2018 and 20152017 (in thousands of dollars):
| Affected line item in the consolidated and combined statements of operations and comprehensive income (loss) | ||||||||||||||
| Year Ended December 31, | ||||||||||||||
| 2019 | 2018 | 2017 | ||||||||||||
| Interest rate derivatives, hedging | $ | 239 | $ | 697 | $ | (172 | ) | Interest expense | ||||||
Foreign currency items(1) | — | (2,621 | ) | — | Other income | |||||||||
| Total reclassifications | $ | 239 | $ | (1,924 | ) | $ | (172 | ) | ||||||
Affected line item in the consolidated and combined statements of operations and comprehensive income (loss) | ||||||||||||||
| Year Ended December 31, | ||||||||||||||
| 2017 | 2016 | 2015 | ||||||||||||
| Interest rate derivatives, hedging | $ | (172 | ) | $ | (3,641 | ) | $ | (1,578 | ) | Interest expense | ||||
| Foreign currency items | — | — | — | Other income | ||||||||||
| Total reclassifications | $ | (172 | ) | $ | (3,641 | ) | $ | (1,578 | ) | |||||
(15) Earnings per Share
Basic income or (loss) per share is based on the weighted average number of common shares outstanding during the period. Restricted stock awards and RSUs are not considered issued and outstanding for purposes of earnings per share calculations until vested.
112
NEXTIER OILFIELD SOLUTIONS INC. AND SUBSIDIARIES
Notes to the Consolidated and Combined Financial Statements
Diluted income or (loss) per share includes additional common shares that would have been outstanding if potential common shares with a dilutive effect, such as stock awards from the Company'sCompany’s Equity and Incentive Award Plan, had been issued. Anti-dilutive securities represent potentially dilutive securities whichthat are excluded from the computation of diluted income or (loss) per share as their impact would be anti-dilutive.
A reconciliation of the numerators and denominators used for the basic and diluted net loss per share computations is as follows:follows (in thousands):
| Year Ended December 31, | Year Ended December 31, | |||||||||||||||||||||||
| 2017 | 2016 | 2015 | 2019 | 2018 | 2017 | |||||||||||||||||||
| Numerator: | ||||||||||||||||||||||||
| Net income (loss) | $ | (36,141 | ) | $ | (187,087 | ) | $ | (64,642 | ) | $ | (106,157 | ) | $ | 59,331 | $ | (36,141 | ) | |||||||
| Denominator: | ||||||||||||||||||||||||
Basic weighted-average common shares outstanding(1) | 106,321 | 87,313 | 87,313 | 122,977 | 109,335 | 106,321 | ||||||||||||||||||
| Dilutive effect of restricted stock awards granted to Board of Directors | 36 | — | — | |||||||||||||||||||||
| Dilutive effect of restricted stock awards | 43 | 17 | 36 | |||||||||||||||||||||
| Dilutive effect of deferred stock award granted to NEOs | — | — | — | — | 214 | — | ||||||||||||||||||
| Dilutive effect of RSUs granted under stock incentive plans | 135 | — | — | 81 | 94 | 135 | ||||||||||||||||||
| Dilutive effect of options granted under stock incentive plans | — | — | — | |||||||||||||||||||||
Diluted weighted-average common shares outstanding(2) | 106,492 | 87,313 | 87,313 | 123,101 | 109,660 | 106,492 | ||||||||||||||||||
(1) | The basic weighted-average common shares outstanding for the year ended December 31, 2017 have been computed to give effect to the Organizational Transactions, including the limited liability company agreement of Keane Investor |
(2) | As a result of the net loss incurred by the Company for the years ended December 31, |
(16) Operating Leases
| Year-end December 31, | (Thousands of Dollars) | |||
| 2018 | $ | 16,173 | ||
| 2019 | 14,408 | |||
| 2020 | 8,210 | |||
| 2021 | 3,990 | |||
| 2022 | 2,606 | |||
| Total | $ | 45,387 | ||
| (Thousands of Dollars) | ||||
| Beginning balance at January 1, 2017 | $ | 1,670 | ||
| Exit costs | 1,164 | |||
| Cash buyout of lease | (702 | ) | ||
| Lease amortization and other adjustments | (862 | ) | ||
| Ending balance at December 31, 2017 | $ | 1,270 | ||
| (Thousands of Dollars) | ||||||||||||
| Year Ended December 31, | ||||||||||||
| 2017 | 2016 | 2015 | ||||||||||
| Domestic | $ | (35,904 | ) | $ | (187,308 | ) | $ | (64,470 | ) | |||
| Foreign | (87 | ) | 221 | (172 | ) | |||||||
| (35,991 | ) | (187,087 | ) | (64,642 | ) | |||||||
| (Thousands of Dollars) | ||||||||||||
| Year Ended December 31, | ||||||||||||
| 2017 | 2016 | 2015 | ||||||||||
| Current: | ||||||||||||
| Federal | $ | — | $ | — | $ | — | ||||||
| State | 614 | — | — | |||||||||
| Foreign | — | — | (197 | ) | ||||||||
| Total current income tax provision | 614 | — | (197 | ) | ||||||||
| Deferred: | ||||||||||||
| Federal | (536 | ) | — | — | ||||||||
| State | 72 | (114 | ) | — | ||||||||
| Foreign | — | — | 990 | |||||||||
| Total deferred income tax provision | (464 | ) | (114 | ) | 990 | |||||||
| $ | 150 | $ | (114 | ) | $ | 793 | ||||||
| (Thousands of Dollars) | ||||||||||||||||||
| December 31, 2017 | % of Income Before Income Taxes | December 31, 2016 | % of Income Before Income Taxes | December 31, 2015 | % of Income Before Income Taxes | |||||||||||||
| Income tax provision computed at the statutory federal rate | $ | (9,795 | ) | 35.00 | % | $ | (65,480 | ) | 35.00 | % | $ | (22,625 | ) | 35.00 | % | |||
| Reconciling items: | ||||||||||||||||||
| State income taxes, net of federal tax benefit | (334 | ) | 1.19 | % | (114 | ) | 0.06 | % | — | — | % | |||||||
| Deferred tax asset valuation adjustment | (32,593 | ) | 116.46 | % | — | — | % | — | — | % | ||||||||
| Tax rate change | 41,591 | (148.61 | )% | — | — | % | — | — | % | |||||||||
| Other | 1,281 | (4.57 | )% | — | — | % | — | — | % | |||||||||
| Flow through income not taxable | — | — | % | 65,480 | (35.00 | )% | 22,625 | (35.00 | )% | |||||||||
| Foreign taxes | — | — | % | — | — | % | 793 | (1.23 | )% | |||||||||
| Income tax provision | $ | 150 | (0.53 | )% | $ | (114 | ) | 0.06 | % | $ | 793 | (1.23 | )% | |||||
| (Thousands of Dollars) | ||||||||||||
| Year Ended December 31, | ||||||||||||
| 2017 | 2016 | 2015 | ||||||||||
| Deferred tax assets: | ||||||||||||
| Stock-based compensation | $ | 2,467 | $ | — | $ | — | ||||||
| Net operating loss carry-forwards | 70,745 | — | — | |||||||||
| Accruals and other | 3,994 | — | — | |||||||||
| Intangibles | — | 231 | 139 | |||||||||
| Gross deferred tax assets | 77,206 | 231 | 139 | |||||||||
| Valuation allowance | (65,347 | ) | (139 | ) | (139 | ) | ||||||
| Total deferred tax assets | 11,859 | 92 | — | |||||||||
| Deferred tax liability: | ||||||||||||
| PP&E and intangibles | (11,319 | ) | — | (22 | ) | |||||||
| Prepaids and other | (1,954 | ) | — | — | ||||||||
| Total deferred tax liability | (13,273 | ) | — | (22 | ) | |||||||
| Net deferred tax liability | $ | (1,414 | ) | $ | 92 | $ | (22 | ) | ||||
| (Thousands of Dollars) | ||||
| Valuation allowance as of the beginning of January 1, 2017 | $ | 139 | ||
| Charge as debit to equity | 97,801 | |||
| Charge as (benefit) expense to income tax provision for current year activity | 8,032 | |||
| Charge as (benefit) expense to income tax provision for change in deferred tax rate | (40,625 | ) | ||
| Changes to other comprehensive income | — | |||
| Valuation allowance as of December 31, 2017 | $ | 65,347 | ||
| (Thousands of Dollars) | |||
| Year-end December 31, | |||
| 2018 | $ | 45,942 | |
| 2019 | 42,717 | ||
| 2020 | 26,087 | ||
| 2021 | 10,083 | ||
| 2022 | — | ||
| $ | 124,829 | ||
| (Thousands of Dollars) | ||||
| Location in consolidated statements of operations and comprehensive loss | Description | Year ended December 31, 2015 | ||
| Costs of services | ||||
| Severance pay | $ | 208 | ||
| Selling, general and administrative expenses | ||||
| Severance pay | $ | 267 | ||
| Consulting and legal fees | 39 | |||
| Retention pay | 187 | |||
| Asset sales and disposals costs | 525 | |||
| Lease exit costs | 1,375 | |||
| Other costs | 121 | |||
| $ | 2,514 | |||
| (Thousands of Dollars) | ||||||||
| 2017 | 2016 | |||||||
| Beginning balance at January 1, | $ | 233 | $ | 759 | ||||
| Charges incurred | — | — | ||||||
| Cash payments net of cash receipts | (214 | ) | (290 | ) | ||||
| Currency lease accretion and other adjustments | 30 | (236 | ) | |||||
| Total lease obligations, ending balance | $ | 49 | $ | 233 | ||||
| Year Ended December 31, | ||||||||||||
| 2017 | 2016 | 2015 | ||||||||||
| Operations by business segment | ||||||||||||
| Revenue: | ||||||||||||
| Completion Services | $ | 1,527,287 | $ | 410,854 | $ | 363,820 | ||||||
| Other Services | 14,794 | 9,716 | 2,337 | |||||||||
| Total revenue | $ | 1,542,081 | $ | 420,570 | $ | 366,157 | ||||||
| Gross profit (loss): | ||||||||||||
| Completion Services | $ | 258,024 | $ | 8,963 | $ | 58,784 | ||||||
| Other Services | 1,496 | (4,735 | ) | 777 | ||||||||
| Total gross profit | $ | 259,520 | $ | 4,228 | $ | 59,561 | ||||||
| Operating income (loss): | ||||||||||||
| Completion Services | $ | 115,691 | $ | (80,563 | ) | $ | (11,260 | ) | ||||
| Other Services | (197 | ) | (10,156 | ) | (3,864 | ) | ||||||
| Corporate and Other | (106,225 | ) | (58,985 | ) | (24,587 | ) | ||||||
| Total operating income (loss) | $ | 9,269 | $ | (149,704 | ) | $ | (39,711 | ) | ||||
| Depreciation and amortization: | ||||||||||||
| Completion Services | $ | 141,385 | $ | 89,432 | $ | 65,114 | ||||||
| Other Services | 5,757 | 5,087 | 3,169 | |||||||||
| Corporate and Other | 12,138 | 6,460 | 1,264 | |||||||||
| Total depreciation and amortization | $ | 159,280 | $ | 100,979 | $ | 69,547 | ||||||
| (Gain) loss on disposal of assets | ||||||||||||
| Completion Services | $ | 948 | $ | (538 | ) | $ | 357 | |||||
| Other Services | (4,064 | ) | (44 | ) | (651 | ) | ||||||
| Corporate and Other | 561 | 195 | 24 | |||||||||
| Total (gain) on disposal of assets | $ | (2,555 | ) | $ | (387 | ) | $ | (270 | ) | |||
| Impairment: | ||||||||||||
| Completion Services | $ | — | $ | — | $ | 2,443 | ||||||
| Other Services | — | 185 | 1,471 | |||||||||
| Corporate and Other | — | — | — | |||||||||
| Total impairment | $ | — | $ | 185 | $ | 3,914 | ||||||
| Exit Costs: | ||||||||||||
| Completion Services | $ | — | $ | — | $ | 2,722 | ||||||
| Other Services | — | — | — | |||||||||
| Corporate and Other | $ | 1,221 | $ | 5,696 | $ | — | ||||||
| Total exit costs | $ | 1,221 | $ | 5,696 | $ | 2,722 | ||||||
Income tax provision(1): | ||||||||||||
| Completion Services | $ | — | $ | — | $ | — | ||||||
| Corporate and Other | $ | (150 | ) | $ | — | $ | — | |||||
| Total income tax: | $ | (150 | ) | $ | — | $ | — | |||||
| Net income (loss): | ||||||||||||
| Completion Services | $ | 115,691 | $ | (80,563 | ) | $ | (11,260 | ) | ||||
| Other Services | (197 | ) | (10,156 | ) | (3,864 | ) | ||||||
| Corporate and Other | (151,635 | ) | (96,368 | ) | (49,518 | ) | ||||||
| Total net loss | $ | (36,141 | ) | $ | (187,087 | ) | $ | (64,642 | ) | |||
Capital expenditures(2): | ||||||||||||
| Completion Services | $ | 185,329 | $ | 21,736 | $ | 27,228 | ||||||
| Other Services | 1,718 | 487 | 8 | |||||||||
| Corporate and Other | 2,582 | 1,322 | 10 | |||||||||
| Total capital expenditures | $ | 189,629 | $ | 23,545 | $ | 27,246 | ||||||
| (Thousands of Dollars) | ||||||||
| December 31, 2017 | December 31, 2016 | |||||||
| Total assets by segment: | ||||||||
| Completion Services | $ | 863,419 | $ | 412,947 | ||||
| Other Services | 21,877 | 18,485 | ||||||
| Corporate and Other | 157,820 | 105,508 | ||||||
| Total assets | $ | 1,043,116 | $ | 536,940 | ||||
| Total assets by geography: | ||||||||
| United States | $ | 1,041,596 | $ | 535,395 | ||||
| Canada | 1,520 | 1,545 | ||||||
| Total assets | $ | 1,043,116 | $ | 536,940 | ||||
| Goodwill by segment: | ||||||||
| Completion Services | $ | 134,967 | $ | 50,478 | ||||
| Total goodwill | $ | 134,967 | $ | 50,478 | ||||
| Year Ended December 31, 2017 | ||||||||||||||||
| (Unaudited) | ||||||||||||||||
| Selected Financial Data: | First Quarter | Second Quarter | Third Quarter | Fourth Quarter | ||||||||||||
| Revenue | $ | 240,153 | $ | 323,136 | $ | 477,302 | $ | 501,490 | ||||||||
| Costs of services (excluding depreciation and amortization, shown separately) | 223,992 | 278,384 | 391,089 | 389,096 | ||||||||||||
| Depreciation and amortization | 30,373 | 32,739 | 46,204 | 49,964 | ||||||||||||
| Selling, general and administrative expenses | 17,986 | 22,337 | 28,592 | 24,611 | ||||||||||||
| (Gain) loss on disposal of assets | (434 | ) | (5 | ) | 302 | (2,418 | ) | |||||||||
| Total operating costs and expenses | 271,917 | 333,455 | 466,187 | 461,253 | ||||||||||||
| Operating income (loss) | (31,764 | ) | (10,319 | ) | 11,115 | 40,237 | ||||||||||
| Other income, net | 4 | 3,701 | 942 | 9,316 | ||||||||||||
| Interest expense | (40,361 | ) | (4,349 | ) | (7,195 | ) | (7,318 | ) | ||||||||
| Total other expenses | (40,357 | ) | (648 | ) | (6,253 | ) | 1,998 | |||||||||
| Income tax income (expense) | (134 | ) | (931 | ) | (797 | ) | 1,712 | |||||||||
| Net income (loss) | $ | (72,255 | ) | $ | (11,898 | ) | $ | 4,065 | $ | 43,947 | ||||||
| Year Ended December 31, 2016 | ||||||||||||||||
| (Unaudited) | ||||||||||||||||
| Selected Financial Data: | First Quarter | Second Quarter | Third Quarter | Fourth Quarter | ||||||||||||
| Revenue | $ | 61,195 | $ | 91,589 | $ | 116,753 | $ | 151,033 | ||||||||
| Costs of services (excluding depreciation and amortization, shown separately) | 67,845 | 85,039 | 120,480 | 142,978 | ||||||||||||
| Depreciation and amortization | 13,968 | 27,723 | 30,256 | 29,032 | ||||||||||||
| Selling, general and administrative expenses | 20,168 | 15,820 | 9,218 | 7,949 | ||||||||||||
| (Gain) loss on disposal of assets | (8 | ) | (464 | ) | 176 | (91 | ) | |||||||||
| Impairment | — | — | — | 185 | ||||||||||||
| Total operating costs and expenses | 101,973 | 128,118 | 160,130 | 180,053 | ||||||||||||
| Operating loss | (40,778 | ) | (36,529 | ) | (43,377 | ) | (29,020 | ) | ||||||||
| Other expense (income), net | (133 | ) | (874 | ) | 470 | (379 | ) | |||||||||
| Interest expense | 8,408 | 10,037 | 9,963 | 9,891 | ||||||||||||
| Total other expenses | 8,275 | 9,163 | 10,433 | 9,512 | ||||||||||||
| Net loss | $ | (49,053 | ) | $ | (45,692 | ) | $ | (53,810 | ) | $ | (38,532 | ) | ||||
In February 2016, the FASB issued ASU 2016-02, “Leases"Leases (Topic 842),”" which sets out the principles for the recognition, measurement, presentation and disclosure of leases for both lessees and lessors. The new standard requires lessees to apply a dual approach, classifying leases as either finance or operating leases based on the principle of whether or not the lease is effectively a purchase financed by the lessee. This classification will determine whether lease expense is recognized based on an effective interest method or on a straight-line basis over the term of the lease. A lessee is also required to record a right-of-use asset and a lease liability for all leases with a term greater than 12 months, regardless of their classification. Leases with a term of 12 months or less may be accounted for similarly to existing guidance for operating leases today. The new standard requires lessors to account for leases using an approach that is substantially equivalent to existing guidance for sales-type leases, direct financing leases and operating leases. In December 2018, the FASB issued ASU 2019-20, "Leases (Topic 842): Narrow-Scope Improvements for Lessors," which allows lessors to make a policy election to exclude sales taxes and other similar taxes from determining the consideration in the contract and variable payments not included in the consideration in the contract, requires lessors to exclude from variable payments lessor costs paid by lessees directly to third parties and clarified the accounting for variable payments for contracts with lease and nonlease components. The Company anticipatesadopted these standards effective January 1, 2019, using the adoptionmodified retrospective transition method. The Company recognized a lease right-of-use asset and lease liability of this standard will result in a significant increase inapproximately$61.0 million on its assets and liabilities, as the Company has certain operating and real property lease arrangements for which it is the lessee. The standard is effective for the Company beginningconsolidated balance sheet on January 1, 2019.2019, for its operating leases that existed upon the effective date, with no additional impact to its consolidated and combined statements of operations and comprehensive loss or statements of cash flows. The Company also determined that while its hydraulic fracturing fleets represent lease components in its customer contracts, these lease components do not represent the predominant components in its customer contracts.
113
NEXTIER OILFIELD SOLUTIONS INC. AND SUBSIDIARIES
Notes to the Consolidated and Combined Financial Statements
As such the Company has elected to account for the combined components of its customer contracts under ASC 606. In connection with the adoption of these standards, the Company implemented internal controls to ensure that the Company's contracts are properly evaluated to determine applicability under ASU 2016-02 and that the Company properly applies ASU 2016-02 in accounting for and reporting on all its qualifying leases.
The effect of the lease standards adoption on the unaudited condensed consolidated balance sheet as of January 1, 2019 is as follows (in thousands of dollars):
| December 31, 2018 | January 1, 2019 | |||||||||||
| Balance sheet line item | As Previously Reported | ASU 2016-02 Adoption | As Adjusted | |||||||||
| Operating lease right-of-use assets | $ | — | $ | 60,946 | $ | 60,946 | ||||||
| Finance lease right-of-use assets | — | 7,864 | 7,864 | |||||||||
| Property and equipment, net | 531,319 | (7,864 | ) | 523,455 | ||||||||
| Other noncurrent assets | 6,569 | (9 | ) | 6,560 | ||||||||
| Accrued expenses and other current liabilities | (101,833 | ) | 1,066 | (100,767 | ) | |||||||
| Current maturities of operating lease liabilities | — | (25,211 | ) | (25,211 | ) | |||||||
| Current maturities of finance lease liabilities | — | (4,928 | ) | (4,928 | ) | |||||||
| Current maturities of capital lease obligations | (4,928 | ) | 4,928 | — | ||||||||
| Long-term operating lease liabilities, less current maturities | — | (35,512 | ) | (35,512 | ) | |||||||
| Long-term finance lease liabilities, less current maturities | — | (5,581 | ) | (5,581 | ) | |||||||
| Capital lease obligations, less current maturities | (5,581 | ) | 5,581 | — | ||||||||
| Other noncurrent liabilities | (3,283 | ) | 50 | (3,233 | ) | |||||||
| Retained earnings | 31,494 | (1,330 | ) | 30,164 | ||||||||
The Company has operating leases for certain of its corporate offices, field shops, apartments, warehouses, rail cars, frac pumps, trailers, tractors and certain other equipment. The Company also has both operating and finance leases for its light duty vehicles.
The Company's leases have variable payments with annual escalations that are based on the proportion by which the consumer price index ("CPI") for all urban consumers increased over the CPI index for the prior comparative year. The Company's leases have remaining lease terms of less than 1 year to 15 years, some of which include extension and termination option. None of these extension and termination options were used to determine the Company's right-of-use assets and lease liabilities, as the Company has not determined it is probable that it will exercise any of these options. None of the Company's leases have residual value guarantees.
114
NEXTIER OILFIELD SOLUTIONS INC. AND SUBSIDIARIES
Notes to the Consolidated and Combined Financial Statements
The components of the Company's lease costs are as follows:
| (Thousands of Dollars) | ||||
Year ended December 31, 2019 | ||||
| Operating lease cost | $ | 26,948 | ||
| Finance lease cost: | ||||
| Amortization of right-of-use assets | 3,356 | |||
| Interest on lease liabilities | 625 | |||
| Total finance lease cost | 3,981 | |||
| Short-term lease cost | 1,184 | |||
Variable lease cost(1) | 15,654 | |||
| Sublease income | (116 | ) | ||
| Total lease cost | $ | 47,651 | ||
(1)Cost from variable amounts excluded from determination of lease liability.
Supplemental cash flows related to leases are as follows:
| (Thousands of Dollars) | ||||
Year ended December 31, 2019 | ||||
| Cash paid for amounts included in the measurements of lease liabilities | ||||
| Operating cash flows from operating leases | $ | 25,318 | ||
| Operating cash flows from finance leases | 565 | |||
| Financing cash flows from finance leases | 6,035 | |||
Weighted average remaining lease terms are as follows:
Year ended December 31, 2019 | |
| Operating leases | 4.74 years |
| Finance leases | 2.28 years |
Weighted average discount rate on the Company's lease liabilities are as follows:
Year ended December 31, 2019 | |
| Operating leases | 5.73% |
| Finance leases | 5.53% |
115
NEXTIER OILFIELD SOLUTIONS INC. AND SUBSIDIARIES
Notes to the Consolidated and Combined Financial Statements
Maturities of the Company's lease liabilities as of December 31, 2019, per ASU 2016-02, were as follows:
| (Thousands of Dollars) | |||||||
| Year ending December 31, | Operating leases | Finance leases | |||||
| 2020 | $ | 26,068 | $ | 4,977 | |||
| 2021 | 12,084 | 3,168 | |||||
| 2022 | 10,012 | 1,643 | |||||
| 2023 | 7,088 | 273 | |||||
| 2024 | 2,171 | — | |||||
| Thereafter | 10,921 | — | |||||
| Total undiscounted remaining minimum lease payments | 68,344 | 10,061 | |||||
| Less imputed interest | (9,748 | ) | (623 | ) | |||
| Total discounted remaining minimum lease payments | $ | 58,596 | $ | 9,438 | |||
Prior to the adoption of the new lease accounting standard, minimum lease commitments, excluding early termination buyouts, remaining under the Company's operating leases and capital leases, for the next five years as of December 31, 2018 were as follows:
| (Thousands of Dollars) | |||||||
| Year ending December 31, | Operating leases | Capital leases | |||||
| 2019 | $ | 26,327 | $ | 5,484 | |||
| 2020 | 18,017 | 2,652 | |||||
| 2021 | 5,688 | 2,430 | |||||
| 2022 | 4,795 | 883 | |||||
| 2023 | 3,172 | — | |||||
| Total | $ | 57,999 | $ | 11,449 | |||
The Company did not make any lease reassessments or modifications nor did it recognize any gains or losses on sale-leaseback transactions during the year ended December 31, 2019.
As of December 31, 2019, the Company does not have additional operating and finance leases that have not yet commenced, nor did the Company have any lease transactions with any of its related parties.
(17) Income Taxes
NexTier Oilfield Solutions Inc. (formerly Keane Group, Inc.) was formed as a corporation as a result of the IPO and related Organizational Transactions on January 20, 2017. The Company established a provision for income taxes for operations beginning January 20, 2017. NexTier was formed to hold all of the operational assets of Keane Group Holdings, LLC, which was originally organized as a limited liability company and treated as a flow-through entity for federal and most state income tax purposes. As such, taxable income and any related tax credits were passed through to its members and included in their tax returns for periods prior to January 20, 2017.
The following table summarizes the income (loss) from continuing operations before income taxes in the following jurisdictions:
116
NEXTIER OILFIELD SOLUTIONS INC. AND SUBSIDIARIES
Notes to the Consolidated and Combined Financial Statements
| (Thousands of Dollars) | ||||||||||||
| Year Ended December 31, | ||||||||||||
| 2019 | 2018 | 2017 | ||||||||||
| Domestic | $ | (106,879 | ) | $ | 66,260 | $ | (35,904 | ) | ||||
| Foreign | 1,727 | (2,659 | ) | (87 | ) | |||||||
| $ | (105,152 | ) | $ | 63,601 | $ | (35,991 | ) | |||||
The components of the Company’s income tax provision are as follows:
| (Thousands of Dollars) | ||||||||||||
| Year Ended December 31, | ||||||||||||
| 2019 | 2018 | 2017 | ||||||||||
| Current: | ||||||||||||
| State | $ | 709 | $ | 5,387 | $ | 614 | ||||||
| Foreign | 627 | 31 | — | |||||||||
| Total current income tax provision | $ | 1,336 | $ | 5,418 | $ | 614 | ||||||
| Deferred: | ||||||||||||
| Federal | $ | (239 | ) | $ | (1,031 | ) | $ | (536 | ) | |||
| State | (92 | ) | (117 | ) | 72 | |||||||
| Total deferred income tax provision | (331 | ) | (1,148 | ) | (464 | ) | ||||||
| $ | 1,005 | $ | 4,270 | $ | 150 | |||||||
The following table presents the reconciliation of the Company’s income taxes calculated at the statutory federal tax rate, currently 21%, to the income tax provision in its consolidated and combined statements of operations and comprehensive (loss). The statutory federal tax rate for 2017 was 35% prior to the enactment of the Tax Cuts and Jobs Act in December 2017, which reduced the federal corporation rate from 35% to 21%, effective January 1, 2018. The Company’s effective tax rate for 2019 of (0.96)% differs from the statutory rate, primarily due to state taxes, and the change in the valuation allowance. The Company’s effective tax rate for 2018 was 6.71%.
| (Thousands of Dollars) | ||||||||||||
| December 31, 2019 | December 31, 2018 | December 31, 2017 | ||||||||||
| Income tax provision computed at the statutory federal rate | $ | (22,082 | ) | $ | 13,356 | $ | (9,795 | ) | ||||
| Reconciling items: | ||||||||||||
| State income taxes, net of federal tax benefit | (1,463 | ) | 1,408 | (334 | ) | |||||||
| Deferred tax asset valuation adjustment | 14,987 | (22,639 | ) | (32,593 | ) | |||||||
| Tax rate change | — | — | 41,591 | |||||||||
| Permanent differences | 9,962 | 5,237 | 630 | |||||||||
| Foreign withholding taxes | 627 | — | — | |||||||||
| Other | (1,026 | ) | 6,908 | 651 | ||||||||
| Income tax provision | $ | 1,005 | $ | 4,270 | $ | 150 | ||||||
Deferred income taxes are provided to reflect the future tax consequences or benefits of differences between the tax basis of assets and liabilities and their reported amounts in the financial statements using enacted tax rates. The Company adopted ASU 2015-17, “Balance Sheet Classification of Deferred Taxes”, during 2017, and thus has classified all deferred tax assets and liabilities as noncurrent.
117
NEXTIER OILFIELD SOLUTIONS INC. AND SUBSIDIARIES
Notes to the Consolidated and Combined Financial Statements
| (Thousands of Dollars) | ||||||||||||
| Year Ended December 31, | ||||||||||||
| 2019 | 2018 | 2017 | ||||||||||
| Deferred tax assets: | ||||||||||||
| Stock-based compensation | $ | 4,124 | $ | 3,979 | $ | 2,467 | ||||||
| Net operating loss carry-forwards | 196,949 | 90,565 | 70,745 | |||||||||
| Accruals and other | 21,411 | 4,524 | 3,994 | |||||||||
| PPE & Intangibles | 1,474 | — | — | |||||||||
| Gross deferred tax assets | 223,958 | 99,068 | 77,206 | |||||||||
| Valuation allowance | (223,419 | ) | (41,779 | ) | (65,347 | ) | ||||||
| Total deferred tax assets | $ | 539 | $ | 57,289 | $ | 11,859 | ||||||
| Deferred tax liability: | ||||||||||||
| PP&E and intangibles | $ | — | $ | (56,799 | ) | $ | (11,319 | ) | ||||
| Prepaids and other | (645 | ) | (756 | ) | (1,954 | ) | ||||||
| Total deferred tax liability | (645 | ) | (57,555 | ) | (13,273 | ) | ||||||
| Net deferred tax liability | $ | (106 | ) | $ | (266 | ) | $ | (1,414 | ) | |||
As of December 31, 2019, NexTier had total U.S. federal tax net operating loss (“NOL”) carryforwards of $787.6 million, of which, $380.2 million, if not utilized, will begin to expire in the year 2031. The remaining $407.3 million of federal NOLS can be carried forward indefinitely. Of this amount, $71.6 million related to the Company’s current year federal tax loss. The Company has state NOLS of $306.4 million, which if not utilized, will expire in various years between 2025 and 2038. Additionally, the Company has $20.1 million of NOLs in foreign jurisdictions that, if not utilized, will begin to expire in the year 2035.
As a result of the C&J Merger on October 31, 2019, NexTier had a change in ownership for purposes of Section 382 of the Internal Revenue Code (“IRC”). As a result, the amount of pre-change NOLs and other tax attributes that are available to offset future taxable income are subject to an annual limitation. The annual limitation is based on the value of the Company as of the effective date of the C&J Merger. The Company’s Section 382 annual limitation is $8.5 million. In addition, this annual limitation is subject to adjustments from the realization of net unrealized built-in gain (“NUBIG”) during a five-year recognition period ending October 31, 2024. As of December 31, 2019, it is expected that all of the Company’s pre-change NOLs of $398.7 million incurred prior to the C&J Merger will be available for use during the applicable carryforward period without becoming permanently lost by the Company due to expiration. The Company’s pre-change NOLs subject to expiration comprise $275.8 million out of the total $398.7 million.
C&J Energy Services, Inc. had Pre-change NOLs carry forward prior to the C&J Merger. As a result of the C&J Merger, such NOLs were carried over to the Company. These NOLs are also subject to an annual limitation under IRC Section 382. The Company’s annual limitation with respect to the C&J Energy NOLs is $8.6 million and is subject to adjustments from the realization of net unrealized built-in loss (“NUBIL”) during a five-year recognition period ending October 31, 2024. Due to this IRC Section 382 annual limitation, some of the NOLs carried over to the Company from C&J Energy Services, Inc. are expected to become permanently lost by the Company due to the expiration and will not be available for use by the Company during the applicable carryforward period. The Company has not reflected the NOLs expected to expire as a result of this limitation in its summary of deferred tax assets or in the NOLs disclosed within this paragraph. The pre-change NOLs carried over from C&J Energy Services, Inc. total $322.6 million of which $104.4 million are subject to expiration, but not expected to expire as a result of the IRC Section 382 limitation.
ASC 740, “Income Taxes,” requires the Company to reduce its deferred tax assets by a valuation allowance if, based on the weight of the available evidence, it is more likely than not that all or a portion of a deferred tax asset will not be realized. The ultimate realization of deferred tax assets is dependent upon the generation of future taxable income during the periods in which those temporary differences are deductible. As a result of the Company’s
118
NEXTIER OILFIELD SOLUTIONS INC. AND SUBSIDIARIES
Notes to the Consolidated and Combined Financial Statements
evaluation of both the positive and negative evidence, the Company determined it does not believe it is more likely than not that its deferred tax assets will be utilized in the foreseeable future and has recorded a valuation allowance. The valuation allowance as of December 31, 2019 fully offsets the net deferred tax assets, excluding deferred tax liabilities related to certain indefinite-lived assets. The valuation allowance as of December 31, 2017 fully offsets the impact of the initial benefit recorded related to the formation of NexTier Oilfield Solutions Inc., excluding deferred tax liabilities related to certain indefinite lived assets. This initial deferred impact was recorded as an adjustment to equity due to a transaction between entities under common control. The valuation allowances as of December 31, 2019, 2018, and 2017 were $223.4 million, $41.8 million and $65.3 million, respectively.
Changes in the valuation allowance for deferred tax assets were as follows:
| (Thousands of Dollars) | ||||
| Valuation allowance as of the beginning of January 1, 2019 | $ | 41,779 | ||
| Acquisition accounting | 164,950 | |||
| Charge as (benefit) expense to income tax provision for current activities | 14,987 | |||
| Changes to other comprehensive income (loss) | 1,703 | |||
| Valuation allowance as of December 31, 2019 | $ | 223,419 | ||
On December 22, 2017, the U.S. government enacted the Tax Act. The Tax Act makes broad and complex changes to the U.S. tax code, including but not limited to, (1) the requirement to pay a one-time transition tax on all undistributed earnings of foreign subsidiaries; (2) reducing the U.S. federal corporate income tax rate from 35% to 21%; (3) eliminating the alternative minimum tax; (4) creating a new limitation on deductible interest expense; and (5) changing rules related to use and limitations of net operating loss carryforwards created in tax years beginning after December 31, 2017.
The Company evaluated the provisions of the Tax Act and determined only the reduced corporate tax rate from 35% to 21% would have an impact on its consolidated and combined financial statements as of December 31, 2017. Accordingly, the Company recorded a provision to income taxes for the Company’s assessment of the tax impact of the Tax Act on ending deferred tax assets and liabilities and the corresponding valuation allowance. The effects of other provisions of the Tax Act are not expected to have an adverse impact on the Company’s consolidated and combined financial statements. The Company finalized its analysis of the Tax Act in 2018 and will continue to monitor guidance on provisions of the Tax Act to be issued by taxing authorities to assess the impact on the Company’s consolidated and combined financial statements.
There were 0 unrecognized tax benefits nor any accrued interest or penalties associated with unrecognized tax benefits during the years ended December 31, 2019, 2018 and 2017. The Company believes it has appropriate support for the income tax positions taken and to be taken on the Company’s tax returns, and its accruals for tax liabilities are adequate for all open years based on our assessment of many factors including past experience and interpretations of tax law applied to the facts of each matter. The Company classifies interest and penalties within the provision for income taxes. The Company’s tax returns are open to audit under the statute of limitations for the years ended December 31, 2016 through December 31, 2018 for federal tax purposes and for the years ended December 31, 2015 through December 31, 2018 for state tax purposes.
(18) Commitments and Contingencies
As of December 31, 2019, and 2018, the Company had $9.0 million, including deposits acquired through the C&J Merger, and $4.2 millionof deposits on equipment, respectively. Outstanding purchase commitments on equipment were $64.0 million and $43.6 million, as of December 31, 2019, and 2018, respectively.
As of December 31, 2019, the Company had committed $1.3 million to research and development with its equity-method investee. For additional information, see Note (2) Summary of Significant Accounting Policies.
119
NEXTIER OILFIELD SOLUTIONS INC. AND SUBSIDIARIES
Notes to the Consolidated and Combined Financial Statements
As of December 31, 2019, the Company has a letter of credit of $31.8 million under the 2019 ABL Facility.
In the normal course of operations, the Company enters into certain long-term raw material supply agreements for the supply of proppant to be used in hydraulic fracturing. As part of some of these agreements, the Company is subject to minimum tonnage purchase requirements and may pay penalties in the event of any shortfall. The Company purchased $160.0 million, $107.4 million and $150.0 million amounts of proppant under its take-or-pay agreements during the years ended December 31, 2019, 2018 and 2017.
Aggregate minimum commitments under long-term raw material supply agreements with payment penalties for minimum tonnage purchases for the next five years as of December 31, 2019 are listed below:
| (Thousands of Dollars) | |||
| Year-end December 31, | |||
| 2020 | $ | 30,007 | |
| 2021 | 14,925 | ||
| 2022 | 9,300 | ||
| 2023 | 1,500 | ||
| 2024 | — | ||
| $ | 55,732 | ||
Litigation
From time to time, the Company is subject to legal and administrative proceedings, settlements, investigations, claims and actions, as is typical of the industry. These claims include, but are not limited to, contract claims, environmental claims, employment related claims, claims alleging injury or claims related to operational issues and motor vehicle accidents. The Company’s assessment of the likely outcome of litigation matters is based on its judgment of a number of factors, including experience with similar matters, past history, precedents, relevant financial information and other evidence and facts specific to the matter. The Company may increase or decrease its legal accruals in the future, on a matter-by-matter basis, to account for developments in such matters. Notwithstanding the uncertainty as to the final outcome and based upon the information currently available to it, the Company does not currently believe these matters in aggregate will have a material adverse effect on its consolidated financial position, results of operations or liquidity.
Environmental
The Company is subject to various federal, state and local environmental laws and regulations that establish standards and requirements for protection of the environment. The Company cannot predict the future impact of such standards and requirements, which are subject to change and can have retroactive effectiveness. The Company continues to monitor the status of these laws and regulations. Currently, the Company has not been fined, cited or notified of any environmental violations that would have a material adverse effect upon its financial position, liquidity or capital resources. However, management does recognize that by the very nature of the Company’s business, material costs could be incurred in the near term to maintain compliance. The amount of such future expenditures is not determinable due to several factors, including the unknown magnitude of possible regulation or liabilities, the unknown timing and extent of the corrective actions which may be required, the determination of the Company’s liability in proportion to other responsible parties and the extent to which such expenditures are recoverable from insurance or indemnification.
120
NEXTIER OILFIELD SOLUTIONS INC. AND SUBSIDIARIES
Notes to the Consolidated and Combined Financial Statements
Regulatory Audits
In 2017, the Company was notified by the Texas Comptroller of Public Accounts that it would conduct a routine audit of Keane Frac TX, LLC's direct payment sales tax for the periods of January 2014 through May 2017. The Company initially anticipated and recorded an estimate for a potential assessment of approximately $3.2 million during the first quarter of 2019. Subsequently, the Company made a $2.1 million prepayment in June 2019. The Company made an additional payment of $0.3 million in the third quarter of 2019 after receiving the notification of the audit result, concluding the audit. These amounts are recorded in selling, general and administrative expenses in the Company's consolidated statements of operations and comprehensive income (loss).
Prior to the consummation of the C&J Merger, the Company and C&J had been notified by certain state taxing authorities that these taxing authorities would be conducting routine sales and use tax audits of certain wholly owned operating subsidiaries of the Company for tax periods ranging from January 2011 through December 2019. The Company has recorded estimates of potential assessments for each audit totaling in the aggregate approximately $32.6 million. For one audit, in particular, the Company disagrees with many aspects of the state’s preliminary report and intends to contest the state’s position through litigation, if necessary. In addition, this reserve does not take into account the potential for refund claims in which the Company has not recorded.
(19) Related Party Transactions
Cerberus Operations and Advisory Company and Cerberus Capital Management, L.P., affiliates of the Company’s principal equity holder, provide certain consulting services to the Company. The Company paid $4.1 million, $0.3 million and $0.3 million during the years ended December 31, 2019, 2018 and 2017, respectively.
In connection with the Organization Transaction, the Company engaged in transactions with affiliates. See Note (1)(Basis of Presentation and Nature of Operations) and Note (13) (Stockholders’ Equity) for a description of these transactions.
In connection with the Company’s research and development initiatives, the Company has engaged in transactions with its equity-method investee. For additional information, see Note (2) Summary of Significant Accounting Policies. As of December 31, 2019, the Company has purchased $1.7 million of shares in its equity-method investee.
On May 29, 2018, the Company repurchased 1,248,440 shares of its common stock from WDE RockPile Aggregate, LLC (“White Deer Energy”) for $16.02 per share or $20.0 million. At the time of the RockPile acquisition, the shares of the Company’s common stock that White Deer Energy acquired was valued at $15.00 per share. The Company recognized the entire transaction as treasury stock that was subsequently retired, whereby the RockPile acquisition value of the shares of $18.7 million was recorded against paid-in capital in excess of par value and the remaining $1.3 million was recorded against retained earnings on the consolidated balance sheet as of December 31, 2018.
During 2018, the Company completed two secondary offerings on behalf of Keane Investor Holdings LLC. For further details, see Note (13) Stockholders’ Equity: (f) Secondary Offerings.
(20) Retirement Benefits and Nonretirement Postemployment Benefits
Defined Contribution Plan
The Company sponsors two different 401(k) defined contribution retirement plans covering eligible employees. Through the first plan, the Company makes matching contributions of up to 3.5% of compensation. Through the second plan, Eligible employees can make annual contributions to the plan up to the maximum amount allowed by current federal regulations, but no more than 80.0% of compensation as noted in the plan document. Contributions made by the Company related to the years ended December 31, 2019, 2018, and 2017 were $8.1 million, $6.7 million and $4.0 million, respectively.
Severance
The Company provides severance benefits to certain of its employees in connection with the termination of their employment. Severance benefits offered by the Company were $16.7 million, $0.6 million and $2.0 million for the years ended December 31, 2019, 2018 and 2017, respectively.
(21) Business Segments
In accordance with Accounting Standard Codification (“ASC”) No. 280, Segment Reporting (“ASC 280”), the Company routinely evaluates whether its separate segments have changed. This determination is made based on the following factors: (1) the Company’s chief operating decision maker (“CODM”) is currently managing each operating segment as a separate business and evaluating the performance of each segment and making resource allocation decisions distinctly and expects to do so for the foreseeable future, and (2) discrete financial information for each operating segment is available.
Due to the transformative nature of the C&J Merger, the CODM changed the way in which the Company is managed, including the level at which to make performance evaluation and resource allocation decisions. Discrete financial information was created to provide the segment information necessary for the CODM to manage the Company under the revised operating segment structure. As a result of this change in operating segments, the Company revised its reportable segments subsequent to the completion of the C&J Merger. The Company’s revised reportable segments are: (i) Completion Services, (ii) Well Construction and Intervention (“WC&I”) and (iii) Well Support Services. This segment structure reflects the financial information and reports used by the Company’s management, specifically including its CODM, to make decisions regarding the Company’s business, including performance evaluation and resource allocation decisions. As a result of the revised reportable segment structure, the Company has restated the corresponding items of segment information for all periods presented.
The following is a description of each reportable segment:
Completion Services
The Company’s Completion Services segment consists of the following businesses and service lines: (1) fracturing services; (2) wireline and pumpdown services; and (3) completion support services, which includes the Company's research and technology department.
Well Construction and Intervention Services
The Company’s WC&I Services segment consists of the following businesses and service lines: (1) cementing services and (2) coiled tubing services.
Well Support Services
The Company’s Well Support Services segment consists of the following businesses and service lines: (1) rig services; (2) fluids management services; and (3) other specialty well site services.
122
NEXTIER OILFIELD SOLUTIONS INC. AND SUBSIDIARIES
Notes to the Consolidated and Combined Financial Statements
The following tables present financial information with respect to the Company’s segments. Corporate and Other represents costs not directly associated with a segment, such as interest expense, income taxes and corporate overhead. Corporate assets include cash, deferred financing costs, derivatives and entity-level machinery equipment.
| Year Ended December 31, | ||||||||||||
| 2019 | 2018 | 2017 | ||||||||||
| Operations by reportable segment | ||||||||||||
| Revenue: | ||||||||||||
| Completion Services | $ | 1,709,934 | $ | 2,100,956 | $ | 1,527,287 | ||||||
| WC&I | 63,039 | 36,050 | 14,794 | |||||||||
| Well Support Services | 48,583 | — | — | |||||||||
| Total revenue | $ | 1,821,556 | $ | 2,137,006 | $ | 1,542,081 | ||||||
| Adjusted gross profit (loss): | ||||||||||||
Completion Services(1) | $ | 401,845 | $ | 478,850 | $ | 258,024 | ||||||
WC&I(1) | 7,812 | (2,390 | ) | 1,496 | ||||||||
Well Support Services(1) | 7,967 | — | — | |||||||||
| Total adjusted gross profit | $ | 417,624 | $ | 476,460 | $ | 259,520 | ||||||
| Operating income (loss): | ||||||||||||
| Completion Services | $ | 126,698 | $ | 234,756 | $ | 115,691 | ||||||
| WC&I | 3,855 | (6,818 | ) | (197 | ) | |||||||
| Well Support Services | 6,959 | — | — | |||||||||
| Corporate and Other | (221,261 | ) | (129,928 | ) | (106,225 | ) | ||||||
| Total operating income (loss) | $ | (83,749 | ) | $ | 98,010 | $ | 9,269 | |||||
| Depreciation and amortization: | ||||||||||||
| Completion Services | $ | 270,918 | $ | 241,169 | $ | 141,385 | ||||||
| WC&I | 3,822 | 4,428 | 5,757 | |||||||||
| Well Support Services | 1,415 | — | — | |||||||||
| Corporate and Other | 15,995 | 13,548 | 12,138 | |||||||||
| Total depreciation and amortization | $ | 292,150 | $ | 259,145 | $ | 159,280 | ||||||
| Net income (loss): | ||||||||||||
| Completion Services | $ | 126,698 | $ | 234,756 | $ | 115,691 | ||||||
| WC&I | 3,855 | (6,818 | ) | (197 | ) | |||||||
| Well Support Services | 6,959 | — | — | |||||||||
| Corporate and Other | (243,669 | ) | (168,607 | ) | (151,635 | ) | ||||||
| Total net income (loss) | $ | (106,157 | ) | $ | 59,331 | $ | (36,141 | ) | ||||
Capital expenditures(2): | ||||||||||||
| Completion Services | $ | 179,044 | $ | 281,081 | $ | 185,329 | ||||||
| WC&I | 3,514 | 9,510 | 1,718 | |||||||||
| Well Support Services | 6,980 | — | — | |||||||||
| Corporate and Other | 3,649 | 952 | 2,582 | |||||||||
| Total capital expenditures | $ | 193,187 | $ | 291,543 | $ | 189,629 | ||||||
123
NEXTIER OILFIELD SOLUTIONS INC. AND SUBSIDIARIES
Notes to the Consolidated and Combined Financial Statements
(1) | Adjusted gross profit at the segment level is not considered to be a non-GAAP financial measure as it is the Company's segment measure of profitability and is required to be disclosed under GAAP pursuant to ASC 280. |
(2) | Capital expenditures do not include the asset acquisition of RSI on July 24, 2018 of $35.0 million, the business acquisition of RockPile on July 3, 2017 of $116.6 million |
| (Thousands of Dollars) | ||||||||
| December 31, 2019 | December 31, 2018 | |||||||
| Total assets by segment: | ||||||||
| Completion Services | $ | 1,091,965 | $ | 894,467 | ||||
| WC&I | 106,493 | 20,974 | ||||||
| Well Support Services | 109,792 | — | ||||||
| Corporate and Other | 356,657 | 139,138 | ||||||
| Total assets | $ | 1,664,907 | $ | 1,054,579 | ||||
| Goodwill by segment: | ||||||||
| Completion Services | $ | 136,425 | $ | 132,524 | ||||
| WC&I | 372 | — | ||||||
| Well Support Services | 661 | — | ||||||
| Corporate and Other | — | — | ||||||
| Total goodwill | $ | 137,458 | $ | 132,524 | ||||
124
NEXTIER OILFIELD SOLUTIONS INC. AND SUBSIDIARIES
Notes to the Consolidated and Combined Financial Statements
(22) Selected Quarterly Financial Data
The following table sets forth certain unaudited financial and operating information for each quarter of the years ended December 31, 2019 and 2018. The unaudited quarterly information includes all adjustments that, in the opinion of management, are necessary for the fair presentation of the information presented. Operating results for interim periods are not necessarily indicative of the results that may be expected for a full fiscal year.
| Year Ended December 31, 2019 | ||||||||||||||||
| (Unaudited) | ||||||||||||||||
| Selected Financial Data: | First Quarter | Second Quarter | Third Quarter | Fourth Quarter | ||||||||||||
| Revenue | $ | 421,654 | $ | 427,733 | $ | 443,953 | $ | 528,216 | ||||||||
| Costs of services (excluding depreciation and amortization, shown separately) | 337,646 | 324,503 | 333,438 | 408,345 | ||||||||||||
| Depreciation and amortization | 71,476 | 69,886 | 68,708 | 82,080 | ||||||||||||
| Selling, general and administrative expenses | 27,936 | 26,463 | 26,579 | 42,698 | ||||||||||||
| Merger and integration | — | 6,108 | 6,651 | 55,972 | ||||||||||||
| (Gain) loss on disposal of assets | 481 | (330 | ) | 679 | 3,640 | |||||||||||
| Impairment | — | — | — | 12,346 | ||||||||||||
| Total operating costs and expenses | 437,539 | 426,630 | 436,055 | 605,081 | ||||||||||||
| Operating income (loss) | (15,885 | ) | 1,103 | 7,898 | (76,865 | ) | ||||||||||
| Other income (expense), net | 448 | (43 | ) | 55 | (7 | ) | ||||||||||
| Interest expense | (5,395 | ) | (5,477 | ) | (5,215 | ) | (5,769 | ) | ||||||||
| Total other expenses | (4,947 | ) | (5,520 | ) | (5,160 | ) | (5,776 | ) | ||||||||
| Income tax income (expense) | (974 | ) | (564 | ) | 820 | (287 | ) | |||||||||
| Net income (loss) | $ | (21,806 | ) | $ | (4,981 | ) | $ | 3,558 | $ | (82,928 | ) | |||||
125
NEXTIER OILFIELD SOLUTIONS INC. AND SUBSIDIARIES
Notes to the Consolidated and Combined Financial Statements
| Year Ended December 31, 2018 | ||||||||||||||||
| (Unaudited) | ||||||||||||||||
| Selected Financial Data: | First Quarter | Second Quarter | Third Quarter | Fourth Quarter | ||||||||||||
| Revenue | $ | 513,016 | $ | 578,533 | $ | 558,908 | $ | 486,549 | ||||||||
| Costs of services (excluding depreciation and amortization, shown separately) | 403,408 | 447,685 | 436,799 | 372,654 | ||||||||||||
| Depreciation and amortization | 60,051 | 59,404 | 68,287 | 71,403 | ||||||||||||
| Selling, general and administrative expenses | 33,884 | 23,978 | 27,482 | 28,466 | ||||||||||||
| Merger and integration | — | 147 | 301 | — | ||||||||||||
| (Gain) loss on disposal of assets | 769 | 3,287 | 1,113 | (122 | ) | |||||||||||
| Total operating costs and expenses | 498,112 | 534,501 | 533,982 | 472,401 | ||||||||||||
| Operating income | 14,904 | 44,032 | 24,926 | 14,148 | ||||||||||||
| Other expense (income), net | (12,989 | ) | 16 | 14,454 | (2,386 | ) | ||||||||||
| Interest expense | (6,990 | ) | (14,317 | ) | (5,978 | ) | (6,219 | ) | ||||||||
| Total other income (expenses) | (19,979 | ) | (14,301 | ) | 8,476 | (8,605 | ) | |||||||||
| Income tax income (expense) | (3,168 | ) | 936 | (2,623 | ) | 585 | ||||||||||
| Net income (loss) | $ | (8,243 | ) | $ | 30,667 | $ | 30,779 | $ | 6,128 | |||||||
(23) New Accounting Pronouncements
(a) Recently Adopted Accounting Standards
In February 2018, the FASB issued ASU 2018-02, "Income Statement - Reporting Comprehensive Income (Topic 220): Reclassification of Certain Tax Effects from Accumulated Other Comprehensive Income," which allows companies to reclassify from accumulated other comprehensive income to retained earnings, any stranded tax effects resulting from complying with the Tax Cuts and Jobs Act legislation passed in December 2017. ASU 2018-02 is effective for annual periods beginning after December 15, 2018. The Company implemented the provisions of this ASU effective January 1, 2019, with no impact to its unaudited condensed consolidated financial statements, as due to the Company's valuation allowance, there is no net tax effect stranded within accumulated other comprehensive loss.
In July 2018, the FASB issued ASU 2018-09, "Codification Improvements," which made clarifications, correction of errors and minor improvements to ASC 220, "Income Statement - Reporting Comprehensive Income - Overall," ASC 470-50, "Debt Modifications and Extinguishments," ASC 480-10, "Distinguishing Liabilities from Equity -Overall," ASC 718-740, "Compensation - Stock Compensation - Income Taxes," ASC 805-740, "Business Combinations - Income Taxes," ASC 815-10, "Derivatives and Hedging - Overall," ASC 820-10, "Fair Value Measurement - Overall," ASC 940-405, "Financial Services - Brokers and Dealers - Liabilities," and ASC 962-325, "Plan Accounting - Defined Contribution to Pension Plans - Investments - Other." The Company adopted this standard effective January 1, 2019, with no significant impact to its unaudited condensed consolidated financial statements, as the transactions it conducts that qualify under ASU 2018-09 are only impacted by the amendments to ASC 718-740.
In October 2018, the FASB issued ASU 2018-16, "Derivatives and Hedging (Topic 815): Inclusion of the Secured Overnight Financing Rate (SOFR) Overnight Index Swap (OIS) Rate as a Benchmark Interest Rate for Hedge Accounting Purposes." The amendments in this standard permit use of the Overnight Index Swap rate based on Secured Overnight Financing Rate as a U.S. benchmark interest rate for hedge accounting purposes under ASC
126
NEXTIER OILFIELD SOLUTIONS INC. AND SUBSIDIARIES
Notes to the Consolidated and Combined Financial Statements
815. ASU 2018-16 is effective for annual periods beginning after December 15, 2018. The Company adopted this standard effective January 1, 2019, with no impact to its unaudited condensed consolidated financial statements, as the benchmark interest rate on its existing debt facility and interest rate swap is LIBOR.
In January 2019, the FASB issued ASU 2019-01, "Leases (Topic 842) - Codification Improvements." The amendments in this standard provide implementation guidance with regards to determining the fair value of an underlying leased asset by lessors that are not manufacturers or dealers, presentation of cash received from leases by lessors in sales-type or direct financing leases on the statement of cash flows and transition disclosures related to ASC 250, "Accounting Changes and Error Corrections." The amendments in this standard are effective January 1, 2020, except for those related to transition disclosures that are effective immediately on January 1, 2019. Early adoption was permitted. The Company adopted this standard effective January 1, 2019 with no impact to its unaudited condensed consolidated financial statements, as the Company does not have any leases for which lessor accounting is applied under ASC 842.
(b)Recently Issued Accounting Standards
In June 2016, the FASB issued ASU 2016-16, “Intra-Entity TransfersNo. 2016-13, "Financial Instruments-Credit Losses (Topic 326): Measurement of Asset Other Than Inventory,”Credit Losses on Financial Instruments," which requires entitiesintroduces a new impairment model for financial instruments that is based on expected credit losses rather than incurred credit losses. The new impairment model applies to recognizemost financial assets, including trade accounts receivable and lease receivables. In November 2018, the tax consequencesFASB issued ASU No. 2018-19, "Codification Improvements to Topic 326, Financial Instruments-Credit Losses," which clarified that receivables arising from operating leases are not within the scope of intercompany asset transfersASC 326-20, "Financial Instruments-Credit Losses-Measured at Amortized Cost," and should be accounted for in accordance with ASC 842. In April 2019, the periodFASB issued ASU No. 2019-04, "Codification Improvements to Topic 326, Financial Instruments—Credit Losses, Topic 815, Derivatives and Hedging, and Topic 825, Financial Instruments," which clarified certain amendments related to ASU 2016-13. In May 2019, the FASB issued ASU No. 2019-05, "Financial Instruments-Credit Losses (Topic 326): Targeted Transition Relief," which clarifies certain aspects of the amendments in whichASU 2016-13. In November 2019, the transfer takes place,FASB issued ASU No. 2019-10, "Financial Instruments - Credit Losses (Topic 326), Derivatives and Hedging (Topic 815, and Leases (Topic 842) and ASU 2019-11 Codification Improvements to Topic 326, Financial Instruments—Credit Losses.
The Company adopted these new standards effective January 1, 2020. The Company is finalizing its assessment related to its trade accounts receivable based on a risk assessed portfolio approach, incorporating current and forecasted economic conditions as of January 1, 2020. The Company continues to finalize its estimated credit losses and establish processes and internal controls that may be required to comply with the exceptionnew credit loss standard and related disclosure requirements. The Company does not expect the adoption of inventory transfers.these standards to have a significant impact on its consolidated financial statements.
In August 2018, the FASB issued ASU 2016-162018-13, "Fair Value Measurement (Topic 820): Disclosure Framework - Changes to the Disclosure Requirements for Fair Value Measurement." This standard removed, modified and added disclosure requirements from ASC 820. ASU 2018-13 is effective for fiscal years and interimannual periods within fiscal years beginning after December 15, 2017. Entities must adopt the standard using a modified retrospective approach with a cumulative effect adjustment to retained earnings as of the beginning of the period of adoption. The cumulative effect adjustments will include recognition of the income tax consequences of intra-entity transfers of assets, other than inventory, that occur before the adoption date. Early adoption is permitted, but only at the beginning of an annual period for which no financial statements (interim or annual) have already been issued or made available for issuance.2019. The Company does not expect the adoption of this standard to have a materialsignificant impact on its consolidated and combined financial statements, as thethis standard primarily addresses disclosure requirements for Level 3 fair value measurements. The Company has minimal intra-entity transfers of qualifying assets.does not currently have or anticipate having Level 3 fair value instruments.
In January 2017,August 2018, the FASB issued ASU 2017-01, “Business Combinations (Topic 805), Clarifying2018-15, "Intangibles - Goodwill and Other - Internal-Use Software: Customer's Accounting for Implementation Costs Incurred in a Cloud Computing Arrangement that is a Service Contract." The amendments in this standard aligned the Definition ofrequirements for capitalizing implementation costs incurred in a Business,” which clarifies the definition ofhosting arrangement that is a businessservice contract with the objective of adding guidancerequirements for capitalizing implementation costs incurred to assist entities with evaluating whether transactions should be accounted for as acquisitions (or disposals) of assetsdevelop or business. This updateobtain internal-use software (and hosting arrangements that include an internal-use software license). ASU 2018-15 is effective for fiscal years and interimannual periods within fiscal years beginning after December 15, 2017 and should be applied prospectively. Early adoption is allowed for transactions that occurred before the issuance date or effective date of the amendments only when the transaction has not been reported in the financial statements previously issued.2019. The Company does not expect the adoption of this standard to have a materialsignificant impact on its consolidated and combined financial statements.
In February 2017,November 2018, the FASB issued ASU 2017-05, “Other Income - Gains and Losses from the Derecognition of Nonfinancial Assets (Subtopic 610-20:2018-18, "Collaborative Arrangements (Topic 808): Clarifying the Scope of Asset Derecognition GuidanceInteraction between Topic 808 and Accounting for Partial Sales of Nonfinancial Asset”. Subtopic 610-20 was issued as part of the new revenue recognition standard and provides guidance for recognizing gains and losses from the transfer of nonfinancial assetsTopic 606." The amendments in contracts with non-customers. ASU 2017-05 (i) clarifies the definition of “in substance nonfinancial assets,” (ii) unifies guidance related to partial sales of nonfinancial assets, (iii) eliminates rules specifically addressing sales of real estate, (iv) removes exceptions to the financial asset derecognition model and (v) clarifies the accounting for contributions of nonfinancial assets to joint ventures. The Company will adopt this standard utilizing the modified retrospective method concurrently with the adoption of ASU 2014-09. The Company is currently evaluating the impact of the adoption of this ASU on its consolidated and combined financial statements.clarified that certain
127
NEXTIER OILFIELD SOLUTIONS INC. AND SUBSIDIARIES
Notes to the Consolidated and Combined Financial Statements
transactions should be accounted for under ASC 606 if one of the collaborative arrangement participants meets the definition of a customer and that transactions between collaborative participants not directly related to sales to third parties should not be recognized as revenue under Topic 606, if one of the collaborative arrangement participants is not a customer. ASU 2018-18 is effective for annual periods beginning after December 15, 2019. The Company is currently in the process of evaluating the impact the adoption of this standard will have on its consolidated financial statements.
In July 2019, the FASB issued ASU 2019-07, "Codification Updates to SEC Sections—Amendments to SEC Paragraphs Pursuant to SEC Final Rule Releases No. 33-10532, Disclosure Update and Simplification, and Nos. 33-10231 and 33-10442, Investment Company Reporting Modernization, and Miscellaneous Updates (SEC Update)". The Company does not expect the adoption of this standard to have a significant impact on its consolidated financial statements.
In August 2019, the FASB issued ASU 2019-08, "Compensation - Stock Repurchase ProgramCompensation (Topic 718) and Revenue from Contracts with Customers (Topic 606): Codification Improvements - Share-Based Consideration Payable to a Customer". ASU 2019-08 expands the scope of ASC Topic 718 to provide guidance for share-based payment awards granted to a customer in conjunction with selling goods or services accounted for under Topic 606. For entities that have adopted the amendments in ASU 2018-07, the amendments in ASU 2019-08 are effective in fiscal years beginning after December 15, 2019, and interim periods within those fiscal years. An entity may early adopt the amendments in ASU 2019-08, but not before it adopts the amendments in ASU 2018-07. The Company does not expect the adoption of this standard to have an impact on its consolidated and combined financial statements, as the Company has only issued shares to employees or nonemployee directors and has previously recognized its nonemployee directors share-based payments in line with its recognition of share-based payments to employees, using the grant-date fair value of the equity instruments issued, amortized over the requisite service period.
In December 2019, the Financial Accounting Standards Board issued ASU No 2019-12, “Income Taxes (Topic 740): Simplifying the Accounting for Income Taxes” (“ASU 2019-12”). ASU 2019-12 removes certain exceptions to the general principles in Topic 740 in Generally Accepted Accounting Principles. ASU 2019-12 is effective for public entities for fiscal years beginning after December 15, 2020, with early adoption permitted. The Company does not expect ASU 2019-12 to have a material effect on the Company’s current financial position, results of operations or financial statement disclosures.
(24) Subsequent Events
On February 26, 2018,March 9, 2020, the Company announced thatit had completed the divestiture of its Board of Directors has authorized a stock repurchase program of up to $100.0Well Support Services segment for approximately $93.7 million of total consideration to Basic Energy Services, Inc. (“Basic”). The consideration consisted of (i) $59.4 million of cash consideration before transaction costs, escrowed amounts and subject to customary working capital adjustments and (ii) and $34.3 million of par value senior secured notes (“Notes”) previously issued by Basic. Under the terms of the agreement, the Notes are accompanied bya make-whole guarantee at par value, which guarantees the payment of $34.3 million to NexTier after the Notes are held to the one year anniversary of March 9, 2021.
The Company is monitoring the recent reductions in commodity prices driven by the potential impact of the novel coronavirus and global supply and demand dynamics as potential triggering events that may indicate that the carrying value of certain assets may not be recoverable. The extent to which these events may impact the Company’s outstanding common stock, with the intent of returning value to its shareholders as management continues to expect further growthbusiness will depend on future developments, which are highly uncertain and profitability.cannot be predicted at this time. The duration and intensity of these impacts and resulting disruption to the stock buy-back program will be 12 months. The program does not obligateCompany’s operations is uncertain and the Company will continue to purchase any particular number of shares of common stock during any period, andassess the program may be modified or suspended at any time at the Company's discretion.financial impact.
Item 9. Changes in and Disagreements With Accountant on Accounting and Financial Disclosure
None.
128
Item 9A. Controls and Procedures
Disclosure Controls and Procedures
Under the supervision and with the participation of our management, including the Chief Executive Officer and Chief Financial Officer, we conducted an evaluation of the effectiveness of our disclosure controls and procedures (as such term is defined in Rules 13a-15(e) and 15d-15(e) under the Exchange Act) as of the end of the period covered by this report. Based on this evaluation, our Chief Executive Officer and Chief Financial Officer concluded that our disclosure controls and procedures were effective as of such date. Our disclosure controls and procedures are designed to ensure that information required to be disclosed in the reports we file or submit under the Exchange Act is recorded, processed, summarized and reported within the time periods specified in the SEC’s rules and forms and that such information is accumulated and communicated to management, including the Chief Executive Officer and Chief Financial Officer, to allow timely decisions regarding required disclosure.
Management’s Report on Internal Control Over Financial Reporting
Internal control over financial reporting, no matter how well designed, has inherent limitations. Therefore, even those systems determined to be effective can provide only reasonable assurance with respect to our independent registered public accounting firm was not requiredfinancial statement preparation and presentation. Further, because of changes in conditions, the effectiveness of internal control over financial reporting may vary over time.
Under the supervision and with the participation of our management, including our Chief Executive Officer and Chief Financial Officer, we conducted an evaluation to attest toassess the effectiveness of our internal control over financial reporting as of December 31, 2019, based upon criteria set forth in the “Internal Control - Integrated Framework (2013)” issued by the Committee of Sponsoring Organizations of the Treadway Commission. As permitted by SEC guidance for fiscalnewly acquired businesses, the scope of management’s assessment of the effectiveness of the Company’s internal control over financial reporting as of December 31, 2019, has excluded the acquired business of C&J Energy Services, Inc. and its subsidiaries. We completed the C&J Merger on October 31, 2019, and the excluded business represents approximately $708.5 million of total assets and total revenues of approximately $196.7 million included in the consolidated financial statements of the Company as of and for the year 2017. Asended December 31, 2019. Based on our assessment, we believe that as of January 1, 2018, we no longer qualifyDecember 31, 2019, our internal control over financial reporting is effective.
The effectiveness of our internal control over financial reporting as of December 31, 2019 has been audited by KPMG LLP, an emerging growth company.independent registered public accounting firm, as stated in their report that is included herein.
Changes in Internal Control Over Financial Reporting
On October 31, 2019, we completed the C&J Merger, which resulted in changes to internal controls over the consolidation and reporting of our financial results. As part of the Company’s ongoing integration activities, the Company’s financial reporting controls and procedures are in the process of being implemented at C&J. The two companies maintained separate accounting systems through 2019. The consolidated and combined financial
statements presented in this Annual Report on Form 10-K were prepared using information obtained from these separate accounting systems.
Except as described above, there were no changes to our internal control over financingfinancial reporting that occurred during the quarter ended December 31, 20172019 that has materially affected, or is reasonably likely to materially affect, our internal control over financial reporting.reporting.
Item 9B. Other Information
130
PART III
Item 10. Directors, Executive Officers and Corporate Governance
131
Item 11. Executive Compensation
This Compensation Discussion & Analysis (“CD&A”) explains our executive compensation program for our named executive officers (“NEOs”) listed below. This CD&A also describes the compensation committee’s process for making pay decisions, as well as its rationale for specific decisions related to the fiscal year ended December 31, 2017 (“fiscal year 2017”).
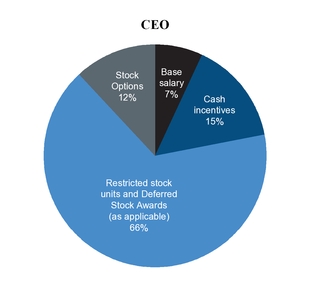

| Peer Group Data Summary | Revenue* | Market Cap** | ||||||||
| $ Millions | ||||||||||
| Percentile | ||||||||||
| 25th | $ | 775 | $ | 1,139 | ||||||
| 50th | $ | 1,338 | $ | 1,559 | ||||||
| 75th | $ | 1,768 | $ | 2,165 | ||||||
| FRAC | $ | 1,561 | $ | 1,673 | ||||||
| Percentile Rank | 56th | 55th | ||||||||
Base Salary Prior to Rescission Date | Base Salary Following Rescission Date | |||||||
| James C. Stewart | $ | 800,000 | $ | 1,000,000 | ||||
| Gregory L. Powell | $ | 450,000 | $ | 800,000 | ||||
| M. Paul DeBonis Jr. | $ | 300,000 | $ | 350,000 | ||||
132
Monthly Retention Payment Prior to Rescission Date | ||||
| James C. Stewart | $ | 13,333 | ||
| Gregory L. Powell | $ | 23,333 | ||
| M. Paul DeBonis Jr. | $ | 3,333 | ||
| Bonus Amounts | |||||||
| First Bonus | Second Bonus | ||||||
| James C. Stewart | $ | 1,975,706 | $ | 1,975,706 | |||
| Gregory L. Powell | $ | 1,646,422 | $ | 1,646,422 | |||
| M. Paul DeBonis Jr. | $ | 658,569 | $ | 658,569 | |||
| Ian J. Henkes | $ | 43,897 | $ | 43,897 | |||
| 2017 Annual Bonus | |||
| James C. Stewart | $ | 2,000,000 | |
| Gregory L. Powell | $ | 1,600,000 | |
| M. Paul DeBonis Jr. | $ | 700,000 | |
| Kevin M. McDonald | $ | 527,768 | |
| Ian J. Henkes | $ | 484,706 | |
NEO | Stock Option Awards | Restricted Stock Unit Awards | Total Grant Date Value ($)(1) | |||||
| James C. Stewart | 214,888 | 214,888 | 4,438,356 | |||||
| Gregory L. Powell | 174,775 | 174,775 | 3,609,852 | |||||
| M. Paul DeBonis Jr. | 56,454 | 56,454 | 1,166,016 | |||||
| Kevin M. McDonald | 80,702 | 80,702 | 1,666,842 | |||||
| Ian J. Henkes | 31,579 | 31,579 | 652,242 | |||||
| R. Curt Dacar | 35,088 | 35,088 | 787,876 | |||||
| Name and Principal Position | Year | Salary ($) | Bonus ($)(1) | Stock Awards ($)(2) | Option Awards ($)(3) | Non- Equity Incentive Plan Compensation ($)(4) | Change in Pension Value and Nonqualified Deferred Compensation Earnings ($) | All Other Compensation ($)(5) | Total ($) | |||||||||||||||
| (a) | (b) | (c) | (d) | (e) | (f) | (g) | (h) | (i) | (j) | |||||||||||||||
| James C. Stewart | 2017 | 813,077 | 80,000 | 7,065,139 | 1,324,629 | 3,333,334 | — | 45,000 | 12,661,179 | |||||||||||||||
| Chairman and Chief Executive Officer | 2016 | 640,000 | 133,333 | — | — | 1,466,667 | — | 30,742 | 2,270,742 | |||||||||||||||
| 2015 | 692,308 | — | — | — | 1,160,000 | — | 45,404 | 1,897,712 | ||||||||||||||||
| Gregory L. Powell | 2017 | 571,539 | 140,000 | 5,825,334 | 1,077,362 | 2,933,334 | — | 39,000 | 10,586,569 | |||||||||||||||
| President and Chief Financial Officer | 2016 | 360,000 | 233,333 | — | — | 1,306,667 | — | 29,673 | 1,929,673 | |||||||||||||||
| 2015 | 389,423 | — | — | — | 740,000 | — | 30,679 | 1,160,102 | ||||||||||||||||
| M. Paul DeBonis Jr. | 2017 | 292,885 | 20,000 | 2,135,156 | 347,998 | 1,033,334 | — | 45,000 | 3,874,373 | |||||||||||||||
| Chief Operating Officer | 2016 | 240,000 | 33,333 | — | — | 466,667 | — | 29,223 | 769,223 | |||||||||||||||
| 2015 | 259,615 | — | — | — | 460,000 | — | 34,385 | 754,000 | ||||||||||||||||
| Kevin M. McDonald | 2017 | 338,750 | — | 1,169,372 | 497,470 | 527,768 | — | 38,719 | 2,572,079 | |||||||||||||||
| Executive Vice President, Legal Counsel & Secretary | ||||||||||||||||||||||||
| Ian J. Henkes | 2017 | 271,154 | — | 457,580 | 194,662 | 484,706 | — | 38,400 | 1,446,502 | |||||||||||||||
| Vice President, Operations South & National Wireline GM | ||||||||||||||||||||||||
| Robert Dacar | 2017 | 76,155 | 1,260,000 | 571,584 | 216,292 | 0 | — | 76,000 | 2,200,031 | |||||||||||||||
| Former Chief Commercial Officer(6) | ||||||||||||||||||||||||
| ________________ | ||||||||||||||||||||||||
Name | Year | Automobile Allowance ($) | 401(k) Plan Company Contribution ($) | Severance ($) | Expenses ($) (a) | Total ($) | |||||||
| James C. Stewart | 2017 | 21,000 | 24,000 | — | — | 45,000 | |||||||
| 2016 | 21,000 | 9,742 | — | — | 30,742 | ||||||||
| 2015 | 21,404 | 24,000 | — | — | 45,404 | ||||||||
| Gregory L. Powell | 2017 | 21,000 | 18,000 | — | — | 39,000 | |||||||
| 2016 | 21,000 | 8,673 | — | — | 29,673 | ||||||||
| 2015 | 21,404 | 9,275 | — | — | 30,679 | ||||||||
| M. Paul DeBonis Jr. | 2017 | 21,000 | 24,000 | — | — | 45,000 | |||||||
| 2016 | 21,000 | 8,223 | — | — | 29,223 | ||||||||
| 2015 | 21,404 | 12,981 | — | — | 34,385 | ||||||||
| Kevin M. McDonald | 2017 | 20,400 | 18,319 | — | — | 38,719 | |||||||
| Ian J. Henkes | 2017 | 20,400 | 18,000 | — | — | 38,400 | |||||||
| Robert Dacar | 2017 | — | 1,290 | 73,333 | 1,377 | 76,000 | |||||||
Estimated Future Payouts Under Non-Equity Incentive Plan Awards(1) | Estimated Future Payouts Under Equity Incentive Plan Awards(4) | All Other Stock Awards: Number of Shares of Stock or Units (#)(5) | All Other Option Awards: Number of Securities Underlying Options (#)(6) | Exercise or Base Price of Option Awards ($/Share) | Grant Date Fair Value of Stock and Option Awards ($)(7) | |||||||||||||||||||||||
| Name | Grant Date | Threshold ($)(2) | Target ($)(2) | Maximum ($)(3) | Threshold ($)(2) | Target ($)(2) | Maximum ($)(3) | |||||||||||||||||||||
| James C. Stewart | 500,000 | 1,000,000 | 5,000,000 | — | — | — | — | — | — | — | ||||||||||||||||||
| 3/16/2017 | — | — | — | — | 3,951,412 | — | — | — | — | — | ||||||||||||||||||
| 4/3/2017 | — | — | — | — | — | — | 214,888 | — | — | 3,113,727 | ||||||||||||||||||
| 4/3/2017 | — | — | — | — | — | — | — | 214,888 | 19.00 | 1,324,629 | ||||||||||||||||||
| Gregory L. Powell | 400,000 | 800,000 | 5,000,000 | — | — | — | — | — | — | — | ||||||||||||||||||
| 3/16/2017 | — | — | — | — | 3,292,844 | — | — | — | — | — | ||||||||||||||||||
| 4/3/2017 | — | — | — | — | — | — | 174,775 | — | — | 2,532,490 | ||||||||||||||||||
| 4/3/2017 | — | — | — | — | — | — | — | 174,775 | 19.00 | 1,077,362 | ||||||||||||||||||
| M. Paul DeBonis Jr. | 175,000 | 350,000 | 5,000,000 | — | — | — | — | — | — | — | ||||||||||||||||||
| 3/16/2017 | — | — | — | — | 1,317,138 | — | — | — | — | — | ||||||||||||||||||
| 4/3/2017 | — | — | — | — | — | — | 56,454 | — | — | 818,018 | ||||||||||||||||||
| 4/3/2017 | — | — | — | — | — | — | — | 56,454 | 19.00 | 347,998 | ||||||||||||||||||
| Kevin M. McDonald | 191,942 | 263,884 | 5,000,000 | — | — | — | — | — | — | — | ||||||||||||||||||
| 4/3/2017 | — | — | — | — | — | — | 80,702 | — | — | 1,169,372 | ||||||||||||||||||
| 4/3/2017 | — | — | — | — | — | — | — | 80,702 | 19.00 | 497,470 | ||||||||||||||||||
| Ian J. Henkes | 121,177 | 242,353 | 5,000,000 | — | — | — | — | — | — | — | ||||||||||||||||||
| 4/3/2017 | — | — | — | — | — | — | 31,579 | — | — | 457,580 | ||||||||||||||||||
| 4/3/2017 | — | — | — | — | — | — | — | 31,579 | 19.00 | 194,662 | ||||||||||||||||||
| Robert Dacar | 109,096 | 218,192 | 5,000,000 | — | — | — | — | — | — | — | ||||||||||||||||||
| 7/3/2017 | — | — | — | — | — | — | 35,088 | — | — | 571,583 | ||||||||||||||||||
| 7/3/2017 | — | — | — | — | — | — | — | 35,088 | 19.00 | 216,292 | ||||||||||||||||||
| _______________ | ||||||||||||||||||||||||||||
| Option Awards | Stock Unit Awards | ||||||||||||||||||||||||||
| Name | Number of securities underlying unexercised options (#) exercisable | Number of securities underlying unexercised options (#) unexercisable (1) | Equity incentive plan awards: number of securities underlying unexercised unearned options (#) | Option exercise price ($) | Option expiration date | Number of shares or units of stock that have not vested (#) | Market value of shares or units of stock that have not vested ($) | Equity incentive plan awards: number of unearned shares, units or other rights that have not vested (#) | Equity incentive plan awards: market or payout value of unearned shares, units or other rights that have not vested ($) | ||||||||||||||||||
| (a) | (b) | (c) | (d) | (e) | (f) | (g) | (h) | (i) | (j) | ||||||||||||||||||
| James C. Stewart | — | 214,888 | — | 19.00 | 4/3/2023 | — | — | — | — | ||||||||||||||||||
| — | — | — | — | — | 214,888 | (2) | 4,085,021 | (4) | — | 3,951,412 | (5) | ||||||||||||||||
| Gregory L. Powell | — | 174,775 | — | 19.00 | 4/3/2023 | — | — | — | — | ||||||||||||||||||
| — | — | — | — | — | 174,775 | (2) | 3,322,473 | (4) | — | 3,292,844 | (5) | ||||||||||||||||
| M. Paul DeBonis Jr. | — | 56,454 | — | 19.00 | 4/3/2023 | — | — | — | — | ||||||||||||||||||
| — | — | — | — | — | 56,454 | (2) | 1,073,191 | (4) | — | 1,317,138 | (5) | ||||||||||||||||
| Kevin M. McDonald | — | 80,702 | — | 19.00 | 4/3/2023 | — | — | — | — | ||||||||||||||||||
| — | — | — | — | — | 80,702 | (2) | 1,534,145 | (4) | — | — | |||||||||||||||||
| — | 3,529 | (3) | — | — | (6) | — | (7) | — | — | — | — | ||||||||||||||||
| Ian J. Henkes | — | 31,579 | — | 19.00 | 4/3/2023 | — | — | — | — | ||||||||||||||||||
| — | — | — | — | — | 31,579 | (2) | 600,317 | ($) | — | — | |||||||||||||||||
| — | 3,529 | (3) | — | — | (6) | — | (7) | — | — | — | — | ||||||||||||||||
| Robert Dacar | — | — | — | — | — | — | — | — | — | ||||||||||||||||||
| _______________ | |||||||||||||||||||||||||||
| James C. Stewart | |||||||||||||||
| Payments and Benefits | Death or Disability ($) | For Cause or Without Good Reason ($) | Without Cause or for Good Reason, No Change in Control ($) | Without Cause or for Good Reason, Upon or Following Change in Control ($) | Change in Control, No Termination of Employment ($) | ||||||||||
| Cash Severance(1) | 250,000 | — | 2,000,000 | 2,000,000 | — | ||||||||||
| Annual Bonus(2) | 2,000,000 | — | 2,000,000 | 2,000,000 | — | ||||||||||
| Deferred Stock Award Vesting(3) | — | — | 3,951,412 | 3,951,412 | 3,951,412 | ||||||||||
| Stock Option Vesting(4) | — | — | — | 2,149 | — | ||||||||||
| Restricted Stock Unit Vesting(5) | — | — | — | 4,085,021 | — | ||||||||||
| Health Benefits | — | — | — | — | — | ||||||||||
| Total | 2,250,000 | — | 7,951,412 | 12,038,582 | 3,951,412 | ||||||||||
| _______________ | |||||||||||||||
| Gregory L. Powell | ||||||||||||||||||
| Payments and Benefits | Death ($) | Disability ($) | For Cause or Without Good Reason ($) | Without Cause or for Good Reason, No Change in Control ($) | Without Cause or for Good Reason, Upon or Following Change in Control ($) | Change in Control, No Termination of Employment ($) | ||||||||||||
| Cash Severance(1) | 200,000 | 200,000 | — | 1,600,000 | 1,600,000 | — | ||||||||||||
| Annual Bonus(2) | 1,600,000 | 1,600,000 | — | 1,600,000 | 1,600,000 | — | ||||||||||||
| Deferred Stock Award Vesting(3) | — | — | — | 3,292,844 | 3,292,844 | 3,292,844 | ||||||||||||
| Stock Option Vesting(4) | — | — | — | — | 1,748 | — | ||||||||||||
| Restricted Stock Unit Vesting(5) | — | — | — | — | 3,322,473 | — | ||||||||||||
| Health Benefits(6) | — | 18,730 | — | 18,730 | 18,730 | — | ||||||||||||
| Total | 1,800,000 | 1,818,730 | — | 6,511,574 | 9,835,795 | 3,292,844 | ||||||||||||
| _______________ | ||||||||||||||||||
| M. Paul DeBonis Jr. | |||||||||||||||
| Payments and Benefits | Death or Disability ($) | For Cause or Voluntary Terminations ($) | Without Cause, No Change in Control ($) | Without Cause, Upon or Following Change in Control ($) | Change in Control, No Termination of Employment ($) | ||||||||||
| Cash Severance(1) | — | — | 700,000 | 700,000 | — | ||||||||||
| Annual Bonus | — | — | — | — | — | ||||||||||
| Deferred Stock Award Vesting(2) | — | — | 1,317,138 | 1,317,138 | 1,317,138 | ||||||||||
| Stock Option Vesting(3) | — | — | — | 565 | — | ||||||||||
| Restricted Stock Unit Vesting(4) | — | — | — | 1,073,191 | — | ||||||||||
| Health Benefits | — | — | — | — | — | ||||||||||
| Total | — | — | 2,017,138 | 3,090,894 | 1,317,138 | ||||||||||
| _______________ | |||||||||||||||
| Kevin M. McDonald | |||||||||||||||
| Payments and Benefits | Death or Disability ($) | For Cause or Without Good Reason ($) | Without Cause or for Good Reason, No Change in Control ($) | Without Cause or for Good Reason, Upon or Following Change in Control ($) | Change in Control, No Termination of Employment ($) | ||||||||||
| Cash Severance(1) | — | — | 400,000 | 1,750,000 | — | ||||||||||
| Annual Bonus | — | — | — | — | — | ||||||||||
| Stock Option Vesting(2) | — | — | — | 807 | — | ||||||||||
| Restricted Stock Unit Vesting(3) | — | — | — | 1,534,145 | — | ||||||||||
| Class B Unit Vesting(4) | — | — | — | — | — | ||||||||||
| Health Benefits(5) | — | — | 13,276 | 13,276 | — | ||||||||||
| Total | — | — | 413,276 | 3,298,228 | — | ||||||||||
| _______________ | |||||||||||||||
| Ian J. Henkes | |||||||||||||||
| Payments and Benefits | Death or Disability ($) | For Cause or Without Good Reason ($) | Without Cause or for Good Reason, No Change in Control ($) | Without Cause or for Good Reason, Upon or Following Change in Control ($) | Change in Control, No Termination of Employment ($) | ||||||||||
| Cash Severance(1) | — | — | 300,000 | 300,000 | — | ||||||||||
| Annual Bonus | — | — | — | — | — | ||||||||||
| Stock Option Vesting(2) | — | — | — | 316 | — | ||||||||||
| Restricted Stock Unit Vesting(3) | — | — | — | 600,317 | — | ||||||||||
| Class B Unit Vesting(4) | — | — | — | — | — | ||||||||||
| Health Benefits(5) | — | — | 9,365 | 9,365 | — | ||||||||||
| Total | — | — | 309,365 | 909,998 | — | ||||||||||
| _______________ | |||||||||||||||
(in dollars) Name | Fees Earned or Paid in Cash $ | Stock Awards $(1) | Option Awards $ | Non-Equity Incentive Plan Compensation $ | Change in Pension Value and non- qualified Deferred Compensation Earnings $ | All Other Compensation $ | Total | |||||||
| Gary M. Halverson | 75,000 | — | — | — | — | — | 75,000 | |||||||
| Elmer D. Reed | 75,000 | — | — | — | — | — | 75,000 | |||||||
| Marc G. R. Edwards | 100,000 | — | — | — | — | — | 100,000 | |||||||
Christian A. Garcia(2) | 59,505 | 274,542 | — | — | — | — | 334,047 | |||||||
Lucas N. Batzer(3) | 75,000 | 75,000 | ||||||||||||
| Dale M. Dusterhoft | 75,000 | 75,000 | ||||||||||||
James E. Geisler(3) | 75,000 | 75,000 | ||||||||||||
Lisa A. Gray(3) | 75,000 | 75,000 | ||||||||||||
Shawn Keane(3) | 75,000 | 75,000 | ||||||||||||
Lenard B. Tessler(3) | 75,000 | 75,000 | ||||||||||||
Scott Wille(3) | 75,000 | 75,000 | ||||||||||||
Item 12. Security Ownership of Certain Beneficial Owners and Management and Related Shareholder Matters
133
Item 13. Certain Relationships and Related-Party Transactions and Director Independence
134
Item 14. Principal Accountant Fees and Services
| (Thousands of Dollars) | ||||||||
| 2017 | 2016 | |||||||
Audit Fees(1) | $ | 1,377 | $ | 671 | ||||
Audit –Related Fees(2) | 983 | 1,832 | ||||||
Tax Fees(3) | 690 | 231 | ||||||
All Other Fees(4) | 264 | 45 | ||||||
| Total | $ | 3,314 | $ | 2,779 | ||||
135
PART IV
Item 15. Exhibits and Financial Schedules
The following documents are filed as part of this report:
Financial Statements
| Audited Consolidated and Combined Financial Statements | |
| Consolidated Balance Sheets | |
| Consolidated and Combined Statements of Operations and Comprehensive Income (Loss) | |
| Consolidated and Combined Statements of Changes in | |
| Consolidated and Combined Statements of Cash Flows | |
| Notes to Consolidated and Combined Financial Statements | |
Financial Statement Schedules:
The schedules listed in Rule 5-04 of Regulation S-X (17 CFR 210.5-04) have been omitted because they are not applicable or the required information is shown in the consolidated and combined financial statements or notes thereto.
Exhibits
The documents listed in the Exhibit Index of this Annual Report on Form 10-K are incorporated by reference or are filed with this Annual Report on Form 10-K, in each case as indicated therein (numbered in accordance with Item 601 of Regulation S-K).
EXHIBIT INDEX
| Incorporated by Reference | ||||||||||||
| Exhibit Number | Exhibit Description | Filed/ Furnished Herewith | Form | File No. | Exhibit | Filing Date | ||||||
| S-1 | 333-215079 | 3.1 | 12/14/16 | |||||||||
| 10-K | 001-37988 | 3.2 | 3/21/17 | |||||||||
| 8-K | 001-37988 | 10.3 | 7/3/17 | |||||||||
| 8-K | 001-37988 | 10.1 | 12/28/17 | |||||||||
| 10-K | 001-37988 | 10.2 | 03/21/17 | |||||||||
| 8-K | 001-37988 | 10.4 | 7/3/17 | |||||||||
| S-1 | 333-215079 | 10.6 | 12/14/16 | |||||||||
| 10-K | 001-37988 | 10.4 | 3/21/17 | |||||||||
| Exhibit Number | Exhibit Description | |
| Agreement and Plan of Merger, dated as of June 16, 2019, by and among C&J Energy Services, Inc., Keane Group, Inc. and King Merger Sub Corp. (incorporated by reference to Exhibit 2.1 to the Registrant’s Current Report on Form 8-K filed on June 17, 2019). | ||
| Certificate of Incorporation of Keane Group, Inc. dated October 13, 2016 (incorporated by reference to Exhibit 3.1 to the Registrant’s Registration Statement on Form S-1 filed on December 14, 2016). | ||
| Certificate of Amendment to Certificate of Incorporation of Keane Group, Inc. dated October 31, 2019 (incorporated by reference to Exhibit 3.1 to the Registrant’s Current Report on Form 8-K filed on October 31, 2019). | ||
| Bylaws (incorporated by reference to Exhibit 3.2 to the Registrant’s Annual Report on Form 10-K filed on March 21, 2017). | ||
| Second Amended and Restated Stockholders' Agreement, dated October 31, 2019, by and among Keane Group, Inc. and Keane Investor Holdings LLC (incorporated by reference to Exhibit 10.1 to the Registrant’s Current Report on Form 8-K filed on October 31, 2019). | ||
4.2* | Description of Registrants Securities. | |
| Second Amended and Restated Asset-Based Revolving Credit Agreement, dated October 31, 2019, by and among NexTier Oilfield Solutions Inc. (f/k/a Keane Group, Inc.), Keane Group Holdings, LLC, as the Lead Borrower, certain other subsidiaries of NexTier Oilfield Solutions Inc. as additional borrowers, the guarantors party thereto, the lenders party thereto, and Bank of America, N.A., as administrative and collateral agent (incorporated by reference to Exhibit 10.2 to the Registrant’s Current Report on Form 8-K filed on October 31, 2019). | ||
| Term Loan Agreement, dated May 25, 2018, by and among Keane Group Inc., as the Parent, Keane Group Holdings, LLC, as the Lead Borrower, the Subsidiary Guarantors party thereto, Barclays Bank PLC, as Administrative Agent and Collateral Agent, and the Lenders from time to time party thereto (incorporated by reference to Exhibit 10.1 to the Registrant’s Current Report on Form 8-K filed on May 29, 2018). | ||
10.3† | Keane Management Holdings LLC Management Incentive Plan (incorporated by reference to Exhibit 10.6 to the Registrant’s Registration Statement on Form S-1 filed on December 14, 2016). | |
10.4* | NexTier Oilfield Solutions Inc. Equity and Incentive Award Plan, amended and restated on October 31, 2019. | |
10.5† | Form of Keane Group, Inc. Executive Incentive Bonus Plan (incorporated by referent to Exhibit 10.8 to the Registrant’s Registration Statement on Form S-1 filed on December 14, 2016). | |
10.6† | Form of Indemnification Agreement (incorporated by reference to Exhibit 10.9 of the Registrant’s Registration Statement on Form S-1 filed with the SEC on December 14, 2016). | |
10.7† | Form of Director Services Agreement (incorporated by reference to Exhibit 10.10 to the Registrant’s Registration Statement on Form S-1filed on December 14, 2016). | |
10.8† | Keane Group, Inc. Form of Restricted Stock Award (incorporated by reference to Exhibit 10.3 to the Registrant’s Current Report on Form 8-K filed on January 26, 2017). | |
10.9† | Keane Group, Inc. Form of Deferred Stock Award Agreement (incorporated by reference to Exhibit 10.23 to the Registrant’s Annual Report on Form 10-K filed on March 21, 2017). | |
| S-1 | 333-215079 | 10.8 | 12/14/16 | |||||||||
| S-1 | 333-215079 | 10.9 | 12/14/16 | |||||||||
| S-1 | 333-215079 | 10.10 | 12/14/16 | |||||||||
| S-1 | 333-215079 | 10.11 | 12/14/16 | |||||||||
| S-1 | 333-215079 | 10.12 | 12/14/16 | |||||||||
| S-1 | 333-215079 | 10.13 | 12/14/16 | |||||||||
| S-1 | 333-215079 | 10.14 | 12/14/16 | |||||||||
| S-1 | 333-215079 | 10.16 | 12/14/16 | |||||||||
| S-1 | 333-215079 | 10.18 | 12/14/16 | |||||||||
| S-1 | 333-215079 | 10.19 | 12/14/16 | |||||||||
| 8-K | 001-37988 | 10.1 | 4/4/17 | |||||||||
| S-1 | 333-215079 | 10.20 | 12/14/16 | |||||||||
| 8-K | 001-37988 | 10.4 | 1/26/17 | |||||||||
| S-1 | 333-215079 | 10.22 | 12/14/16 | |||||||||
| S-1 | 333-215079 | 10.23 | 12/14/16 | |||||||||
| S-1 | 333-215079 | 10.24 | 12/14/16 | |||||||||
| 8-K | 333-215079 | 10.1 | 5/19/17 | |||||||||
| 8-K | 001-37988 | 10.1 | 7/3/17 | |||||||||
| 8-K | 001-37988 | 10.3 | 1/26/17 | |||||||||
| 10-K | 001-37988 | 10.23 | 3/21/17 | |||||||||
| 10-Q | 001-37988 | 10.1 | 8/3/17 | |||||||||
| 10-Q | 001-37988 | 10.2 | 8/3/17 | |||||||||
| * | ||||||||||||
| * | ||||||||||||
| * | ||||||||||||
| * | ||||||||||||
| * | ||||||||||||
| ** | ||||||||||||
| 101.INS | XBRL Instance Document | * | ||||||||||
| 101.SCH | XBRL Taxonomy Extension Schema Document | * | ||||||||||
| 101.CAL | XBRL Taxonomy Extension Calculation Linkbase Document | * | ||||||||||
| 101.LAB | XBRL Taxonomy Extension Label Linkbase Document | * | ||||||||||
| Form of Keane Group, Inc. Equity and Incentive Award Plan Amendment to Deferred Stock Award Agreement(incorporated by reference to Exhibit 10.29 to the Registrant’s Annual Report on Form 10-K filed on February 27, 2019). | ||
| Form of RSU Award Agreement (incorporated by reference to Exhibit 10.1 to the Registrant’s Quarterly Report on Form 10-Q filed on August 3, 2017). | ||
| Form of Non-Qualified Stock Option Award Agreement (incorporated by reference to Exhibit 10.2 to the Registrant’s Quarterly Report on Form 10-Q filed on August 3, 2017). | ||
| Keane Group, Inc. Form of Restricted Stock Award Agreement for Non-Employee Directors (incorporated by reference to Exhibit 10.3 to the Registrant’s Quarterly Report on Form 10-Q filed on August 1, 2018). | ||
| Keane Group, Inc. Form of Restricted Stock Unit Award Agreement (incorporated by reference to Exhibit 10.4 to the Registrant’s Quarterly Report on Form 10-Q filed on August 1, 2018). | ||
| Keane Group, Inc. Form of Restricted Stock Unit Performance Award Agreement (incorporated by reference to Exhibit 10.1 to the Registrant’s Quarterly Report on Form 10Q filed on May 7, 2019). | ||
| Keane Group, Inc. Form of Non-Qualified Stock Option Award Agreement (incorporated by reference to Exhibit 10.5 to the Registrant’s Quarterly Report on Form 10-Q filed on August 1, 2018). | ||
| Form of Amendment to Keane Group, Inc. Restricted Unit Award Agreements with each of James Stewart, Greg Powell, Paul DeBonis and Kevin McDonald (incorporated by reference to Exhibit 10.6 to the Registrant’s Quarterly Report on Form 10-Q filed on August 1, 2018). | ||
| Form of Amendment to Keane Group, Inc. Non-Qualified Stock Option Award Agreements with each of James Stewart, Greg Powell, Paul DeBonis and Kevin McDonald (incorporated by reference to Exhibit 10.7 to the Registrant’s Quarterly Report on Form 10-Q filed on August 1, 2018). | ||
| NexTier Oilfield Solutions Inc. (Former C&J Energy) Management Incentive Plan, dated Effective October 31, 2019 (incorporated by reference to Exhibit 4.4 to the Registrant’s Registration Statement on Form S-8 filed with the SEC on November 1, 2019). | ||
| C&J Energy Services, Inc. 2017 Management Incentive Plan. (incorporated by reference to Exhibit 10.1 to C&J Energy Services Inc.’s Current Report on Form 8-K filed on January 13, 2017). | ||
| First Amendment to the C&J Energy Services, Inc. 2017 Management Incentive Plan (incorporated by reference to Exhibit 10.1 to C&J Energy Services Inc.’s Current Report on Form 8-K filed on February 6, 2017). | ||
10.22†* | Second Amendment to the C&J Energy Services, Inc. 2017 Management Incentive Plan. | |
| Restricted Share Agreement (C&J Executive Employment Agreements) under the 2017 Management Incentive Plan (incorporated by reference to Exhibit 10.2 to C&J Energy Services Inc.’s Current Report on Form 8-K filed on February 6, 2017). | ||
| Restricted Share Agreement (Restrictive Covenants) under the 2017 Management Incentive Plan (incorporated by reference to Exhibit 10.3 to C&J Energy Services Inc.’s Current Report on Form 8-K filed on February 6, 2017). | ||
| Restricted Share Agreement (Non-Employee Directors) under the 2017 Management Incentive Plan (incorporated by reference to Exhibit 10.4 to C&J Energy Services Inc.’s Current Report on Form 8-K filed on February 6, 2017). | ||
| Nonqualified Stock Option Agreement (C&J Executive Employment Agreements) under the 2017 Management Incentive Plan (incorporated by reference to Exhibit 10.5 to C&J Energy Services Inc.’s Current Report on Form 8-K filed on February 6, 2017). | ||
| Nonqualified Stock Option Agreement (Restrictive Covenants) under the 2017 Management Incentive Plan (incorporated by reference to Exhibit 10.6 to C&J Energy Services Inc.’s Current Report on Form 8-K filed on February 6, 2017). | ||
| Performance Share Agreement under the 2017 Management Incentive Plan (incorporated by reference to Exhibit 10.10 to C&J Energy Services Inc.’s Annual Report on Form 10-K filed on February 27, 2019). | ||
| Performance Share Agreement (C&J Employment Agreement - Tier I) under the 2017 Management Incentive Plan (incorporated by reference to Exhibit 10.11 to C&J Energy Services Inc.’s Annual Report on Form 10-K filed on February 27, 2019). | ||
| Performance Share Agreement (C&J Employment Agreement - Tier II) under the 2017 Management Incentive Plan (incorporated by reference to Exhibit 10.12 to C&J Energy Services Inc.’s Annual Report on Form 10-K filed on February 27, 2019). | ||||||||
| Restricted Share Unit Agreement (C&J Employment Agreement - Tier I) under the 2017 Management Incentive Plan (incorporated by reference to Exhibit 10.13 to C&J Energy Services Inc.’s Annual Report on Form 10-K filed on February 27, 2019). | ||||||||
| Restricted Share Unit Agreement (C&J Employment Agreement - Tier II) under the 2017 Management Incentive Plan (incorporated by reference to Exhibit 10.14 to C&J Energy Services Inc.’s Annual Report on Form 10-K filed on February 27, 2019). | ||||||||
| Cash Retention Award Agreement (C&J Employment Agreement - Tier I) under the 2017 Management Incentive Plan (incorporated by reference to Exhibit 10.15 to C&J Energy Services Inc.’s Annual Report on Form 10-K filed on February 27, 2019). | ||||||||
| Cash Retention Award Agreement (C&J Employment Agreement - Tier II) under the 2017 Management Incentive Plan (incorporated by reference to Exhibit 10.16 to C&J Energy Services Inc.’s Annual Report on Form 10-K filed on February 27, 2019). | ||||||||
10.35†* | Form of RSU Award Agreement 2020 (Executive). | |||||||
10.36†* | Form of PSU Agreement 2020. | |||||||
| Amended and Restated Employment Agreement, dated July 12, 2019, by and between Keane Group, Inc. and Robert Drummond (incorporated by reference to Exhibit 10.2 of the Registrant’s Registration Statement on Form S-4 filed with the SEC on July 16, 2019). | ||||||||
| Third Amended and Restated Employment Agreement, dated June 16, 2019, by and between Keane Group, Inc. and Greg Powell (incorporated by reference to Exhibit 10.3 of the Registrant’s Registration Statement on Form S-4 filed with the SEC on July 16, 2019). | ||||||||
| Amended and Restated Employment Agreement, dated July 12, 2019, by and between Keane Group, Inc. and Kevin M. McDonald (incorporated by reference to Exhibit 10.4 of the Registrant’s Registration Statement on Form S-4 filed with the SEC on July 16, 2019). | ||||||||
10.40†* | Amended and Restated Employment Agreement, dated as of November 1, 2019, by and between NexTier Oilfield Solutions Inc. and Ian J. Henkes. | |||||||
| First Amended and Restated Employment Agreement, dated December 16, 2019, by and between NexTier Oilfield Solutions Inc. and Kenny Pucheu (incorporated by reference to Exhibit 10.1 of the Registrant’s Current Report on Form 8-K filed with the SEC on December 16, 2019). | ||||||||
| Employment Agreement, effective as of December 11, 2018, by and between C&J Spec-Rent Services, Inc. and William Driver (incorporated by reference to Exhibit 10.25 of C&J Energy Services, Inc.’s Annual Report on Form 10-K filed with the SEC on February 27, 2019). | ||||||||
| Amended and Restated Employment Agreement, effective as of December 11, 2018, by and between C&J Spec-Rent Services, Inc. and Sterling Renshaw (incorporated by reference to Exhibit 10.19 of C&J Energy Services, Inc.’s Annual Report on Form 10-K filed with the SEC on February 27, 2019). | ||||||||
| Amended and Restated Employment Agreement, effective as of December 11, 2018, by and between C&J Spec-Rent Services, Inc. and Michael Galvan (incorporated by reference to Exhibit 10.18 of C&J Energy Services, Inc.’s Annual Report on Form 10-K filed with the SEC on February 27, 2019). | ||||||||
| Employment Agreement, dated September 17, 2018, by and between C&J Spec-Rent Services, Inc. and Jan Kees van Gaalen (incorporated by reference to Exhibit 10.1 to the C&J Energy Services, Inc.’s Current Report on Form 8-K/A filed on September 18, 2018). | ||||||||
| Form of Second Amended and Restated Employment Agreement by and among KGH Intermediate Holdco II, LLC, Keane Group, Inc. and M. Paul DeBonis Jr. (incorporated by reference to Exhibit 10.13 to the Registrant’s Registration Statement on Form S-1 filed on December 14, 2016). | ||||||||
| Form of Third Amended and Restated Employment Agreement by and among KGH Intermediate Holdco II, LLC, Keane Group, Inc. and James C. Stewart (incorporated by reference to Exhibit 10.11 to the Registrant’s Registration Statement on Form S-1 filed on December 14, 2016). | ||||||||
10.48†* | Separation Agreement for James Stewart. | |||||||
21.1* | Schedule of Subsidiaries of NexTier Completion Solutions Inc. | |||||||
23.1* | Consent of KPMG LLP, Independent Registered Public Accounting Firm | |||||||
31.1* | Certification of the Principal Executive Officer pursuant to Section 302 of the Sarbanes-Oxley Act of 2002 | |||||||||||
31.2* | Certification of the Principal Financial Officer pursuant to Section 302 of the Sarbanes-Oxley Act of 2002 | |||||||||||
32.1* | Certifications of the Principal Executive Officer and Principal Financial Officer pursuant to 18 U.S.C. Section 1350, as adopted pursuant to Section 906 of the Sarbanes-Oxley Act of 2002 | |||||||||||
| 101.INS | XBRL Instance Document | |||||||||||
| 101.SCH | XBRL Taxonomy Extension Schema Document | |||||||||||
| 101.CAL | XBRL Taxonomy Extension Calculation Linkbase Document | |||||||||||
| 101.LAB | XBRL Taxonomy Extension Label Linkbase Document | |||||||||||
| 101.PRE | XBRL Taxonomy Extension Presentation Linkbase Document | |||||||||||
| 101.DEF | XBRL Taxonomy Extension Definition Linkbase Document | |||||||||||
† Indicates a management contract or compensatory plan or arrangement.
* Filed herewith.
** Furnished herewith.
Item 16. Form 10-K Summary
None.
140
SIGNATURES
Pursuant to the requirements of the Securities Exchange Act of 1934, the registrant has duly caused this report to be signed on its behalf by the undersigned thereunto duly authorized on February 28, 2018.March 12, 2020.
(Registrant) | ||
| By: | /s/ | |
| (Principal Executive Officer) | ||
Pursuant to the requirements of the Securities Exchange Act of 1934, this report has been signed below by the following persons on behalf of the registrant and in the capacities and on the dates indicated.
| Signature | Title | Date | ||
| /s/ | (Principal Executive Officer) | |||
| Robert W. Drummond | ||||
| /s/ Kenneth Pucheu | Senior Vice President and Chief Financial Officer (Principal Financial Officer) | March 12, 2020 | ||
| Kenneth Pucheu | ||||
| /s/ Michael Galvan | Chief Accounting Officer and Treasurer (Principal Accounting Officer) | March 12, 2020 | ||
| Michael Galvan | ||||
| /s/ James C. Stewart | Director | March 12, 2020 | ||
| James C. Stewart | ||||
| /s/ | ||||
| /s/ Marc G. R. Edwards | ||||
| Marc G. R. Edwards | ||||
| /s/ Gary M. Halverson | Director | |||
| Gary M. Halverson | ||||
| /s/ | Director | |||
| /s/ | Director | |||
| /s/ | Director | |||
| /s/ Amy H. Nelson | Director | March 12, 2020 | ||
| Amy H. Nelson | ||||
| /s/ Mel Riggs | Director | March 12, 2020 | ||
| Mel Riggs | ||||
| /s/ Michael Roemer | Director | March 12, 2020 | ||
| Michael Roemer | ||||
| /s/ Scott Wille | Director | |||
| Scott Wille | ||||