Playa Hotels & Resorts N.V. TABLE OF CONTENTS FISCAL YEAR ENDED DECEMBER 31, | ||||||||
| Page | ||||||||
| Item 1. | ||||||||
| Item 1A. | ||||||||
| Item 1B. | ||||||||
| Item 2. | ||||||||
| Item 3. | ||||||||
| Item 4. | ||||||||
| Item 5. | ||||||||
| Item 6. | ||||||||
| Item 7. | ||||||||
| Item 7A. | ||||||||
| Item 8. | ||||||||
| Item 9. | ||||||||
| Item 9A. | ||||||||
| Item 9B. | ||||||||
| Item 9C. | ||||||||
| Item 10. | ||||||||
| Item 11. | ||||||||
| Item 12. | ||||||||
| Item 13. | ||||||||
| Item 14. | ||||||||
| Item 15. | ||||||||
| Item 16. | ||||||||
2
FORWARD-LOOKING STATEMENTS
This annual report contains “forward-looking statements” within the meaning of the Private Securities Litigation Reform Act of 1995. Forward-looking statements relate to expectations, beliefs, projections, future plans and strategies, anticipated events or trends and similar expressions concerning matters that are not historical facts. Forward-looking statements reflect our current views with respect to, among other things, our capital resources, portfolio performance, and results of operations.operations, liquidity and financial condition. Likewise, our consolidated financial statements and all of our statements regarding anticipated growth in our operations, anticipated market conditions, demographics and results of operations are forward-looking statements. In some cases, you can identify these forward-looking statements by the use of terminology such as “outlook,” “believes,” “expects,” “potential,” “continues,” “may,” “will,” “should,” “could,” “seeks,” “approximately,” “predicts,” “intends,” “plans,” “estimates,” “anticipates” or the negative version of these words or other comparable words or phrases.
The forward-looking statements contained in this annual report reflect our current views about future events and are subject to numerous known and unknown risks, uncertainties, assumptions and changes in circumstances that may cause our actual results to differ significantly from those expressed in any forward-looking statement. Currently, one of the most significant factors that could cause actual outcomes to differ materially from our forward-looking statements is the adverse effects of the current COVID-19 pandemic on our financial condition, results of operations and prospects, the airlines that service the locations where we own resorts, the short and longer-term demand for travel, the global economy and the local economies where we own resorts, and the financial markets. As a result of the COVID-19 pandemic, we have experienced severely reduced occupancy levels at our resorts compared to historic levels and we continue to experience lower occupancy as compared to pre-pandemic levels. The extent to which the COVID-19 pandemic will continue to impact us and consumer behavior will depend on future developments, which are highly uncertain and cannot be predicted with confidence, including the scope, severity and duration of the pandemic, continuing resurgences of the virus and its variants, including the Delta and Omicron variants, the government actions taken to contain the pandemic or mitigate its impact, the speed, continuing effectiveness and distribution of vaccines (including boosters) and treatment therapies, the rate of public adoption of COVID-19 vaccines, and the direct and indirect economic effects of the pandemic and containment measures, including the magnitude of its impact on unemployment rates, labor-force availability, disruption in the supply chain for materials, and consumer discretionary spending, among others. The following factors, among others, could also cause actual results and future events to differ materially from those set forth or contemplated in the forward-looking statements:
•general economic uncertainty and the effect of general economic conditions on the lodging industry in particular;
•the popularity of the all-inclusive resort model, particularly in the luxury segment of the resort market;
•changes in economic, social, or political conditions in the regions we operate, including changes in perception of public-safety and changes in the supply of rooms from competing resorts;
•the success and continuation of our relationships with Hyatt Hotels Corporation (“Hyatt”) and, Hilton Worldwide Holdings, Inc. (“Hilton”), and Wyndham Hotels & Resorts, Inc. (“Wyndham”);
•the volatility of currency exchange rates;
•the success of our branding or rebranding initiatives with our current portfolio and resorts that may be acquired in the future, including the recent rebranding of two of our resorts under the all-inclusive “Hilton” brand and rebranding of certain resorts acquired from Sagicor (as defined below) in Jamaica;future;
•our failure to successfully complete acquisition, expansion, repair and renovation projects in the timeframes and at the costs and returns anticipated;
•changes we may make in timing and scope of our development and renovation projects;
•significant increases in construction and development costs;
•significant increases in the cost of utilities;utilities, labor or other resort costs;
•our ability to obtain and maintain financing arrangements on attractive terms;terms or at all;
•our ability to obtain and maintain ample liquidity to fund operations and service debt;
•the impact of and changes in governmental regulations or the enforcement thereof, tax laws and rates, accounting guidance and similar matters in regions in which we operate;
3
•the ability of our guests to reach our resorts given government mandated travel restrictions, as well as changes in demand for our resorts resulting from government mandated safety protocols and/or health concerns;
•the effectiveness of our internal controls and our corporate policies and procedures and the success and timing of the remediation efforts for the material weakness that we identified in our internal control over financial reporting;procedures;
•changes in personnel and availability of qualified personnel;
•limited visibility with respect to future bookings;
•outbreak of widespread contagious diseases;diseases other than COVID-19;
•dependence on third parties to provide Internet, telecommunications and network connectivity to our data centers;
•the volatility of the market price and liquidity of our ordinary shares and other of our securities; and
•the increasingly competitive environment in which we operate.
While forward-looking statements reflect our good faith beliefs, they are not guarantees of future performance. The Company disclaims any obligation to publicly update or revise any forward-looking statement to reflect changes in underlying assumptions or factors, new information, data or methods, future events or other changes after the date of this annual report, except as required by applicable law. You should not place undue reliance on any forward-looking statements, which are based only on information currently available to us (or to third parties making the forward-looking statements).
Unless the context requires otherwise, in this annual report, we use the terms “the Company,” “Playa,” “our company,” “we,” “us,” “our” and similar references to refer to Playa Hotels & Resorts N.V., a Dutch public limited liability company (naamloze vennootschap), and, where appropriate, its subsidiaries.
We are providing the purposefollowing summary of effecting a merger or other similar business combination with one or more target businesses, and New Pace Holdings Corp. In connection with the Pace Business Combination, which is describedrisk factors contained in detail in our Currentthis Annual Report on Form 8-K filed with10-K to enhance the Securitiesreadability and Exchange Commission (“SEC”)accessibility of our risk factor disclosures.We encourage our shareholders to carefully review the full risk factors contained in this Annual Report on March 14, 2017,Form 10-K in their entirety for additional information regarding the risks and uncertainties that could cause our actual results to vary materially from recent results or from our anticipated future results.
•The effects of the ongoing COVID-19 pandemic are having a significant material adverse effect on our business, results of operations, cash flows and financial condition and if the pandemic is long-lasting these effects could be severe.
•General economic uncertainty and weak demand in the lodging industry could have a material adverse effect on us.
•We are exposed to significant risks related to the geographic concentration of our resorts, including weather-related emergencies, natural disasters, and instability in government and public safety, which could have a material adverse effect on us.
•Terrorist acts, armed conflict, civil unrest, criminal activity and threats thereof, and other international events impacting the security of travel or the perception of security of travel could adversely affect the demand for travel generally and demand for vacation packages at our resorts, which could have a material adverse effect on us.
•The success of our resorts that bear the name of our third-party brand partners will depend substantially on the success of such brands. There is a risk that we changed our name from Porto Holdco N.V. to Playa Hotels & Resorts N.V. In addition,and the third-party brands may not succeed in marketing these brands and that we may not receive the anticipated return on the investment incurred in connection with the Pace Business Combination, (i) priorrebranding, which could have a material adverse effect on us.
•If we are not able to satisfy the consummationrequirements imposed by our major brand partners, our relationship with these partners could deteriorate, which could have a material adverse effect on us.
•There are very limited restrictions on the ability of our brand partners, including Hyatt, to compete with us.
•There is increased competition from global hospitality branded companies in the all-inclusive market segment.
4
•We are exposed to fluctuations in currency exchange rates.
•Our resort development, acquisition, expansion, repositioning and rebranding projects will be subject to timing, budgeting and other risks, which could have a material adverse effect on us.
•Given the beachfront locations of our resorts, we are particularly vulnerable to extreme weather events, such as hurricanes, which may increase in frequency and severity as a result of climate change and adversely affect our business.
•The coastlines of a number of the Pace Business Combination,regions where our resorts are concentrated have experienced elevated levels of sargassum seaweed in recent years.
•Our insurance may not be adequate to cover our potential losses, liabilities and damages, the cost of insurance may continue to increase materially, including as a result of extreme weather events that may be related to climate change, and we may not be able to secure insurance to cover all of our Predecessor's cumulative redeemable preferred shares were purchasedrisks, all of which could have a material adverse effect on us.
•Labor shortages could restrict our ability to operate our properties or grow our business or result in increased labor costs that could adversely affect our results of operations and were subsequently extinguished upon the reverse mergercash flows.
•A significant number of our Predecessor withemployees are unionized, and into us, and (ii) Pace's former shareholders andif labor negotiations or work stoppages were to disrupt our Predecessor's former shareholders receivedoperations, it could have a material adverse effect on us.
•Many of our guests rely on a combination of scheduled commercial airline services and tour operator services for passenger connections, and price increases or service changes by airlines or tour operators could have a material adverse effect on us.
•The ongoing need for capital expenditures at our ordinary sharesresorts could have a material adverse effect on us, including our financial condition, liquidity and warrants as considerationresults of operations.
•We have substantial debt outstanding currently and may incur additional debt in the Pace Business Combination. future. The principal, premium, if any, and interest payment obligations of such debt may restrict our future operations and impair our ability to invest in our business.
•The agreements which govern our various debt obligations impose restrictions on our business and limit our ability to undertake certain actions.
•Our Predecessor wasvariable rate indebtedness is priced using a spread over the accounting acquirerLondon Interbank Offered Rate (“LIBOR”) and subjects us to interest rate risk, which could cause our debt service obligations to increase significantly.
•We may become subject to disputes or legal, regulatory or other proceedings that could involve significant expenditures by us, which could have a material adverse effect on us.
•Some of the resorts in our portfolio located in Mexico were constructed and renovated without certain approvals. The authority granted to the Mexican government is plenary and we can give no assurance it will not exercise its authority to impose fines, remediation measures or close part or all of the related resort(s).
•The seasonality and cyclical nature of the lodging industry could have a material adverse effect on us.
•The increasing use of Internet travel intermediaries by consumers could have a material adverse effect on us.
•Cyber risk and the failure to maintain the integrity of internal or guest data could harm our reputation and result in a loss of business and/or subject us to costs, fines, investigations, enforcement actions or lawsuits.
•Information technology systems, software or website failures or interruptions could have a material adverse effect on our business or results of operations.
•We could be exposed to liabilities under the FCPA and other anti-corruption laws and regulations, including non-U.S. laws, any of which could have a material adverse impact on us.
•Our existing resorts and resorts that we may acquire may contain or develop harmful mold that could lead to liability for adverse health effects and costs of remediating the problem, either of which could have a material adverse effect on us.
•Illiquidity of real estate investments could significantly impede our ability to sell resorts or otherwise respond to adverse changes in the Pace Business Combination,performance of our resorts, which could have a material adverse effect on us.
•We could incur significant costs related to government regulation and litigation with respect to environmental matters, which could have a material adverse effect on us.
5
•The rights of our shareholders and the business, properties, and management teamduties of our Predecessor prior to the Pace Business Combinationdirectors are the business, properties,governed by Dutch law, our Articles of Association and management teaminternal rules and policies adopted by our board of the Company following the Pace Business Combination.
•Provisions of our Articles of Association or Dutch corporate law might deter or discourage acquisition bids for us that shareholders might consider to be favorable and prevent or frustrate any attempt to replace or remove our Board at the time of such acquisition bid.
•If, based on Mexican law, the accounting value of our ordinary shares is derived more than 50% from property in cash. In addition, two individuals nominated by Sagicor joined Playa’s BoardMexico, it could result in the imposition of Directors upontax on a selling shareholder who is not eligible to claim benefits under the consummationincome tax treaty between Mexico and the United States or under any other favorable income tax treaty with Mexico.
6
PART I
Item 1. Business.
Overview
Playa is a leading owner, operator and developer of all-inclusive resorts in prime beachfront locations in popular vacation destinations in Mexico and the Caribbean. As of December 31, 2019,2021, we owned and/or managed a total portfolio consisting of 2322 resorts (8,690(8,366 rooms) located in Mexico, Jamaica and the Dominican Republic. Playa’s strategy is to leverage its globally recognized brand partnerships in orderand proprietary in-house direct booking capabilities to capitalize on the gap betweengrowing popularity of the 14% U.S. brand-affiliated room supplyall-inclusive resort model and reach first-time all-inclusive consumers in the regions in which we operate and the nearly 45% of visitorsa cost effective manner. We believe that come from the U.S. Thisthis strategy should drive outsizedposition us to generate attractive returns for our shareholders, build lasting relationships with our guests, and enhance the lives of our associates and the communities in which we operate.
We believe that the resorts we own and manage are among the finest all-inclusive resorts in the markets they serve. We believe that our resorts have a competitive advantage due to their location, brand affiliations, extensive amenities, scale and design. Our portfolio is comprised of all-inclusive resorts that share some combination of the following characteristics:
•Prime beachfront locations;
•Globally recognized U.S. hotel brand partners;
•Convenient air access from a number ofmajor and secondary North American markets and other international gateway markets;
•Strategic locations in popular vacation destinations in countries with strong local government commitments to tourism;
•High quality standards and physical condition; and
•Capacity for further revenues and earnings growth through incremental renovation or repositioning opportunities.
Our all-inclusive resorts provide guests an attractive vacation experience that offers both compelling value and price certainty, while at the same time providing Playa more predictable revenue, expense and occupancy rates than traditional full-service hotel business models. All-inclusiveGenerally, all-inclusive leisure guests book and pay further in advance, resulting in lower cancellation rates and incremental sales of upgrades, premium services and amenities not included in the all-inclusive package pricing.
We have strategic relationships with both Hyatt, Hilton and Hilton, twoWyndham, three of the preeminent globally recognized hotel brands. Hyatt’sWe believe that partnering with Hyatt, Hilton and Hilton’s selection of Playa as its strategic partnerWyndham in the development and management of all-inclusive resorts throughout the Caribbean, Mexico and Latin America reflects their confidence and conviction in Playa’s best-in-class stewardship of all-inclusive resorts and provides us with unique advantages, including the following:
•Access to worldwide reservation systems, global marketing scale, and approximately 125over 250 million combined hotel loyalty members to drive revenue growth;
•Higher propensity for guests to book direct, which results in significantly improved returns over bookings from wholesale channels such as tour operators and online tour operators;travel agencies;
•Lower customer acquisition costs, and higher net Average Daily Rates (ADRs);
•Higher Net Assetnet asset value for branded hotelsresorts affiliated with global franchisors;
•Brand partners are a second set of eyes,also focused on maximizing returns;
•Immediate customer recognition for a new or converted resort;resorts;
•Access to guests from different regions globally, creating a better segmentation mix, reducing the risk from an owner’s perspective;
•Stronger marketing and public relations presence;presence through affiliate global hospitality brands;
•Branded resorts, on average, have higher occupancy than non-branded resorts;
•Branded resorts have higher rates of group business; and
•Branded resorts have lower failure rates.rates; and
7
In the fourth quarter of 2019, we completed and opened our first ever ground-up development project, the 750-room Hyatt Ziva and Hyatt Zilara Cap Cana. We also completed significant renovation work at the 524-room Hilton Playa del Carmen All-Inclusive Resort, 356-room Hilton La Romana All-Inclusive Adult Resort and the 418-room Hilton La Romana All-Inclusive Family Resort during the fourth quarter of 2019 as part of the rebranding and conversion of those respective hotels.resorts. In the fourth quarter of 2021, we rebranded two of our existing resorts in Mexico and launched the new Wyndham Alltra all-inclusive brand.
Other resorts in our portfolio operate under the Dreams, Jewel and Sanctuary brands.
We consider each of our hotelsresorts to be an operating segment, none of which meets the threshold for a reportable segment. For further discussion about our operating segments and financial information about the geographic regions in which we operate, please see Segment Results in Part II, Item 7. Management's Discussion and Analysis of Financial Condition and Results of Operations and Note 20 and Note 18 to the accompanying Consolidated Financial Statements.
Impact of COVID-19
The COVID-19 pandemic and the public health measures that have been undertaken in response have had and continue to have a significant adverse impact on the global economy, the travel and hospitality industries and our business since the first quarter of 2020. Refer to Part II, Item 7. Management's Discussions and Analysis of Financial Condition and Results of Operations - Impact of COVID-19 Pandemicfor a discussion of the impact COVID-19 is having on our business, results of operations and financial condition.
Our Competitive Strengths
We believe the following competitive strengths distinguish us from other owners, operators, developers and acquirers of all-inclusive resorts:
•Premier Collection of All-Inclusive Resorts in Highly Desirable Locations. We believe that our portfolio represents a premier collection of all-inclusive resorts. Our award-winning resorts are located in prime beachfront locations in popular vacation destinations, including Cancún, Playa del Carmen, Puerto Vallarta and Los Cabos in Mexico, Punta Cana and La Romana in the Dominican Republic and Montego Bay in Jamaica. Guests may conveniently access our resorts from a number of North American and other international gateway markets. •Diversified Portfolio of All-Inclusive Resorts. We currently operate resorts located in four main geographic markets and feature a range of price points, which we believe diversifies our offering, helps foster loyalty among our guests and drives repeat business. We operate resorts under eight distinct brands. Having multiple brands to offer owners and developers is essential to our ability to secure management agreements and attractive acquisitions since having a portfolio of brands mitigates the risks of brand-on-brand supply growth and subsequent cannibalization and expands our addressable market. •Exclusive Focus on the All-Inclusive Model.We believe the all-inclusive resort model is increasing in popularity as more people come to appreciate the benefits of a high-quality vacation experience that offers value, ease of planning and a high degree of cost certainty. Because our guests have pre-purchased their vacation packages, we also have theopportunity to earn incremental revenue if our guests purchase upgrades, premium services and amenities that are not included in the all-inclusive package. •Strong Relationships with Top Brands. Our partnerships with Hyatt, Hilton and Wyndham, three globally recognized hospitality brands, differentiate our resorts from our competitors. The selection of Playa as a strategic partner of Hyatt, Hilton and Wyndham in the development and management of all-inclusive resorts throughout the Caribbean, Mexico and Latin America reflects their confidence and conviction in Playa’s best in-class stewardship of all-inclusive resorts. For the year ended December 31, 2021, $457.9 million, or 88.8%, of our Total Net Revenue (as defined in Part II, Item 7. Management's Discussion and Analysis of Financial Condition and Results of Operations) was generated from resorts under the Hyatt, Hilton and Wyndham brands. Our strategic relationship with Hyatt under our Hyatt Strategic Alliance Agreement, as amended, provides us with a range of benefits, including the right to operate certain of our existing resorts under the Hyatt Ziva and Hyatt Zilara brands (the “Hyatt All-Inclusive Resort Brands”) in certain countries. In 2021, we entered into an omnibus third amendment to our franchise agreements with Hyatt for our Hyatt Ziva and Hyatt Zilara resorts in Mexico and Jamaica which prohibits Hyatt from opening, owning or authorizing other parties (whether under a license or franchise agreement from Hyatt or otherwise) to open or operate Hyatt Ziva and Hyatt Zilara resorts in certain agreed upon geographical areas in proximity to our Hyatt Ziva and Hyatt Zilara resorts for a five year period after the effective date of the amendment. 8 |
The Hyatt Ziva brand is marketed as an all-inclusive resort brand for all-ages and the Hyatt Zilara brand is marketed as an all-inclusive resort brand for adults-only. We believe these brands are currently Hyatt’s primary vehicle for all-inclusive resort growth and demonstrate Hyatt’s commitment to the all-inclusive model. The Hyatt All-Inclusive Resort Brands have access to Hyatt’s low cost and high margin distribution channels, such as Hyatt guests using the World of Hyatt® guest loyalty program (which had approximately 22over 30 million members as of December 31, 2019)2021), Hyatt’s reservation system, Hyatt'sHyatt’s mobile application and website and Hyatt’s extensive group sales business. We believe that our strategic relationship with Hyatt and the increasing awareness of ourall-inclusive resort brands among potential guests will enable
us to increase the number of bookings made through lower cost sales channels, such as direct bookings through Hyatt andas well as our company and resort websites.
Our strategic alliance with Hilton affords us the opportunity to expand into markets in the Caribbean, Mexico, and South and Central America while obtaining access to Hilton’s global portfolio of brands and over 128 million Hilton Honors membersas of December 31, 2021. We have successfully converted two of our resorts into three Hilton all-inclusive resorts, and under our agreement with Hilton we have the potential to convert, develop or manage up to an additional eight resorts in certain locations in the Caribbean, Mexico, and South and Central America by 2025. Our strategic alliance with Wyndham affords us the opportunity to obtain access to Wyndham’s global portfolio of brands and over 92 million loyalty membersas of December 31, 2021 and provides us with an exclusive right to own or operate Wyndham Alltra all-inclusive resorts for a five year period commencing on December 1, 2021 (the “Brand Launch Date”) in Mexico, Jamaica, the Dominican Republic and certain other Caribbean and Latin American destinations (collectively, the “Exclusive Territories”), subject to certain termination rights by Wyndham on the third anniversary of the Brand Launch Date and the extension of our exclusivity right subject to achieving certain development milestones. Our strategic alliance also grants us a right of first offer to manage Wyndham Alltra all-inclusive resorts located outside of the Exclusive Territories during the initial exclusivity period and any extension. During 2021, we successfully converted two of our resorts in Mexico into Wyndham Alltra all-inclusive resorts. •Proprietary Direct Booking Capabilities.To further support the direct booking benefits of partnering with globally recognized brands, we have invested in our own in-house direct booking platform to optimize our customer acquisition costs and build guest loyalty. These investments allowed our resorts to recover faster from the COVID-19 pandemic given the slower pace of recovery in wholesale/third-party channels. Bookings generated on playaresorts.com have increased from $16.9 million in 2018 to $107.1 million in 2021 and accounted for 20.9%of our Owned Net Revenue (as defined in Part II, Item 7. Management's Discussion and Analysis of Financial Condition and Results of Operations) for the year ended December 31, 2021. We will continue to invest in this effort to improve our selling capabilities and adapt to consumer demand. •Integrated and Scalable Operating Platform.We believe we have developed a scalable resort management platform designed to improve operating efficiency at the 20 resorts we currently manage. Our platform enables us to integrate additional resorts we may acquire, manage resorts owned by third-parties and potentially internalize the management of the two resorts we own but do not manage. Our platform also enables managers of each of our key functions, including sales, marketing and resort management, to observe, analyze, share and respond to trends throughout our portfolio. As a result, we are able to implement management initiatives on a real-time, portfolio-wide basis. •Advantageous Exposure to Leisure Travel. Our beachfront resort portfolio skews our customer mix to be composed of approximately 90% leisure travelers. We believe that this concentration positions us to recover faster from the effects of the COVID-19 pandemic and market recessions than many of our lodging peers, as historically the leisure segment of the travel market has tended to rebound faster than the business-oriented segment. •Focus on Safety Measures. As we adjusted to a new operating environment during the COVID-19 pandemic, we have experienced the luxury of having expansive footprints, numerous dining outlets, and predominantly outdoor and open designs at the majority of our resorts, which has provided us flexibility to redesign the layout of our resorts with social distancing and safety precautions in mind. Furthermore, we have implemented an enhanced mobile app that incorporates contactless QR codes to augment and facilitate the guest experience at all of our managed properties. We have also incorporated safety practices from our brand partners, government agencies and various health experts to develop our Playa Safe StayTM operating protocols. We believe that our protocols and the association with globally recognized, responsible brands that consumers know and trust are a competitive advantage. •Experienced Leadership with a Proven Track Record. Our senior management team has significant experience in the lodging industry, including operating all-inclusive resorts. •Bruce Wardinski, our Chief Executive Officer has over 30 |
9
Corporation, an independent hotel owner, lessee and manager; and Crestline Capital Corporation, a New York Stock Exchange (“NYSE”) listed hotel owner, lessee and manager. Mr. Wardinski was also the non-executive chairman of the board of directors of Highland Hospitality Corporation, an NYSE-listed owner of upscale full-service, premium limited-service and extended-stay properties. Mr. Wardinski held other leadership roles within the industry including Senior Vice President and Treasurer of Host Marriott Corporation (now Host Hotels and Resorts (NYSE: HST)) and various roles with Marriott International, Inc. for 33 years during which he spent 12 years working on its expansion into Latin America.As of January 31, 2022, 1.6% of our outstanding ordinary shares were beneficially owned by Mr. Wardinski.
•Fernando Mulet, our Chief Investment Officer, has over 19 years of experience in the hospitality industry, and is a founding member of our management team, beginning with Playa at its inception in 2006. Mr. Mulet previously served as the Director of International Investments & Asset Management with Highland Hospitality Corporation and prior to that worked for Barceló Hotels & Resorts.
•Tracy Colden, our Executive Vice President and General Counsel, has over 30 years of experience in the hospitality and lodging industry. She previously served as Executive Vice President and General Counsel for Highland Hospitality Corporation, and as Executive Vice President and General Counsel of Crestline Capital Corporation. Ms. Colden was also an Assistant General Counsel at Host Marriott Corporation.
Our Business and Growth Strategies
Since the first quarter of 2020, our primary focus has been on responding to the operational, financial and safety challenges presented by the COVID-19 pandemic and that continues to be our primary focus, along with positioning ourselves to capitalize on what we believe to be significant pent-up demand for leisure travel to our markets as the travel restrictions and public health concerns imposed as a result of COVID-19 recede. As conditions continue to improve, our traditional business and growth strategies described below will move to the forefront.
Our goal is to be the leading owner, operator and developer of all-inclusive beachfront resorts in the markets we serve and to generate attractive risk-adjusted returns above our cost of capital and create value for our shareholders by implementing the following business and growth strategies:
•Selectively Pursue Strategic Growth Opportunities. The all-inclusive segment of the lodging industry is highly fragmented. We believe that we are well positioned to grow our portfolio through acquisitions and partnerships in the all-inclusive segment of the lodging industry. We believe that our extensive experience in all-inclusive resort operations, direct booking strategy, brand relationships, acquisition, expansion, renovation, repositioning and rebranding, established and scalable management platform and ability to offer Nasdaq-listed ordinary shares to potential resort sellers will make us a preferred asset acquirer. |
•Secure New Management Agreements.We intend to pursue opportunities to capitalize on our scalable and integrated resort management platform and our expertise and experience with managing all-inclusive resorts, by seeking to manage all-inclusive resorts owned by third parties for a fee and to potentially, over time, internalize the management of the resorts we own that are currently managed by a third-party. We will also look to make minority investments in high return projects to obtain management agreements.
•Utilization of New Technologies and Leverage of Big Data. We utilize numerous technologies aimed at improving guest satisfaction and shareholder returns. Our website uses search engine and metasearch optimization tools aimed at driving direct bookings (i.e., bookings through our website or our brand partner websites), which is our lowest cost customer acquisition channel. As a result, we benefited from more direct business at our Playa-managed hotelsresorts in 2019.2020 and 2021. Our percentage of direct stays increased from 17.2%37.6% of room nights in 20182020 to 23.1%47.1% in 20192021 and our percentage of direct bookings, including future stays, increased from 21.6%47.3% of room nights in 20182020 to 30.3%49.4% in 2019.2021.
We also recently launched a new end-to-end technology at select resorts which uses sophisticated algorithms to identify in real-time what upgrades, packages and pricing to offer guests. This enables us to provide guests with several options to enhance their
10
experience, while increasing revenue post-booking. Other new technological innovations underway include our recently launched travel agent portal, which facilitates travel agent bookings without the additional commission layer of a tour and travel operator, as well as the continued launch of our new yield management system, which should maximize guest revenues by optimizing both package rates and channel mix.
Additionally, by virtue of our partnerships with Hyatt, Hilton, and Hilton,Wyndham, we have greatly increased our direct access to member data and analytics with respect to millions of guests, further enabling us to drive lower customer acquisition costs, bookings and revenues.
•Disposition of non-core assets. We continuously monitor, review and optimize our portfolio to align with our strategic vision and maximize our return on invested capital. |
Distribution Channels and Sales and Reservations
Our experienced sales and marketing team uses a strategic sales and marketing program across a variety of distribution channels through which our all-inclusive offerings are sold. Key components of this sales and marketing program include:
•Developing programs aimed at targeting consumers directly through:
◦Our company and resort websites;
◦The Hyatt website and toll free reservation system;
◦The World of Hyatt® guest loyalty program;
◦The Hilton website and toll free reservation system;
◦The Hilton Honors guest loyalty program;
◦The Wyndham website and toll free reservation system;
◦The Wyndham Rewards guest loyalty program; and
◦Our toll free reservation system that provides a comprehensive view of inventory in real time, based on demand;
•Targeting the primary tour operators and the wholesale market for transient business with a scalable program that supports shoulder and lower-rate seasons while seeking to maximize revenue during high season, which also arrangesincludes:
◦Engaging in cooperative marketing programs with leading travel industry participants;
◦Participating in travel agent tour operator promotional campaigns; and
◦Utilizing online travel leaders, such as Expedia and Booking.com, to supplement sales during shoulder and lower-rate seasons;
•Targeting group and incentive markets to seek and grow a strong base of corporate and event business;
•Highlighting destination wedding and honeymoon programs;
•Participating in key industry trade shows targeted to the travel agent and wholesale market;
•Engaging in online and social media, including:
◦Search engine optimization;
◦Targeted online and bounce-back advertising;
11
◦Social media presence via channels such as Facebook, Twitter, Instagram and Pinterest; and
◦Flash sales and special offers for the provisionhigh need periods;
•Monitoring and managing TripAdvisor and other similar consumer sites; and
•Activating a targeted public relations plan to generate positive exposure and awareness in both traditional and digital media.
We also seek luxury transient business to provide high rate business during peak seasons, such as winter and spring holidays, while “bargain hunters” can be targeted for last minute high need periods. This multi-pronged strategy is designed to increase Net Package RevPAR (as defined in Part II, Item 7. Management's Discussion and Analysis of certain mandatory services,Financial Condition and Results of Operations) as well as (atgenerate strong occupancy through all of the Resort Owner’s option) certain non-mandatory services,resorts’ seasons.
Corporate Responsibility and Sustainability
Our ESG Committee, which is overseen by the Nominating and Governance Committee of our Board, is an organization-wide task force with representation from multiple areas of the Company dedicated to obtaining a broader reach for idea generation and effectively promoting best practices and cross-collaboration related to corporate social responsibility and sustainability. Our ESG Committee oversees Playa’s commitment to incorporating environmental sustainability, social responsibility and governance into our daily operations at all levels with an emphasis on reducing our environmental impact, mitigating risks, improving our communities and driving value for all our stakeholders. The ESG Committee reports directly to the Nominating and Governance Committee regarding Playa’s activities over corporate social responsibility and sustainability matters and the external reporting thereof (including matters relating to diversity and inclusion). The Nominating and Governance Committee updates the resort’sBoard on the activities of the ESG Committee.
Our Board and our ESG Committee are focused on cultivating an energetic, engaged and passionate culture that helps each of our employees achieve their own personal goals. Playa supports employees through learning and development opportunities, offering a competitive benefits package and operation. In return,spending time discussing performance and goals of each Resort Owner agreesemployee and how Playa can support them in their future. Playa employees understand and take advantage of our Open-Door Policy to operatecommunicate suggestions and concerns to Playa’s leadership team. We believe that every individual has a voice that adds value to our organization. By listening to our employees, we learn how to constantly improve and make changes to continuously enhance our working environment.
Environmental
We rely on the beautiful beaches and lush landscapes of our resort destinations to provide a backdrop for our signature service for our guests, and take responsibility to lead the way in our communities in order to sustain these natural environments and help them flourish. Our environmental sustainability program, Playa Green, aims to decrease water and energy consumption, reduce waste, and encourage employees to build and protect our shared communities.
Creating a culture of environmental consciousness with dedicated, focused leadership is of the utmost importance to progressing forward towards Playa’s sustainability objectives. We provide engaging training materials regarding environmental awareness and support our sustainability program with regular performance reviews and sharing of best practices among resort managers.
We seek certifications and alignment with leading verification firms and practices to further enhance our efforts. As such, 14 of our resorts are currently Green Globe certified, with two more underway in the certification process. We use third party energy audits at most of our resorts to monitor our practices and identify areas for improvement and investment. Additionally, we have a designated member of property management (who we refer to as a “Green Leader”) responsible for sustainability performance at each resort.
Social
Our associates and communities form the center of our company. We strive to foster a culture of inclusive growth and provide a respectful and professional workplace to empower all our associates to express what is important to them and to their communities.
We strongly believe that caring for our people is the first step in giving back to our communities. For this reason, we place a large emphasis on employee training and benefits to nurture a compassionate and productive workplace environment. Our comprehensive benefits package helps us attract and retain top talent. Furthermore, we provide ongoing training on safety, antibribery, harassment and discrimination to further nurture the workplace environment. Additionally, we proactively use survey tools and regular performance reviews to engage with our associates and help them achieve their goals and to improve the workplace.
12
Outside of the workplace, we do all we can to enrich our communities by partnering with local organizations, volunteering and creating opportunities like internship programs and youth career initiatives. One example of how we care for the communities in which our employees work and live includes the sponsorship of a local school in Jamaica to provide necessities, school supplies and computers, construct and improve facilities, and promote self-sustainability. We also contribute through wetlands restoration, constructing homes for employees, assisting local food banks, and supporting children in group homes and people with disabilities.
Although we are international in scope, each community has its own unique needs, characteristics and people. We take pride in our positive impact and investments we make in our local communities, including in times of disaster and giving our employees the creative freedom to guide our resources and attention.
Human Capital Resources
Each and every one of our employees plays an integral role in delivering Service From the Heart to our guests and separating us from our competition. “We take care and motivate our employees—and in turn—they take care of our guests with love” is the Company’s official philosophy. We stand behind this statement of taking care of our employees and continuously make their health and safety our top priority, especially amid the ongoing pandemic.
As a result of the COVID-19 pandemic, we have advanced health and safety measures in place and have implemented new standards and procedures in order to keep employees at all levels of the Company as safe as possible. Furthermore, new protocols and daily health and safety screenings are in place which include temperature checks and COVID-19 tests. All resort staff is provided with proper personal protective equipment according to Hyatt’s operating procedurestheir tasks and its brand, quality assurancehygiene conditions. Onsite medical consultants are conveniently available for resort employees at no extra cost. Additionally, health insurance is offered to all employees in each of our locations, for both permanent and other standardscontract positions. Employees that are not needed onsite, including corporate employees, are encouraged to work remotely with additional technical support and specifications. This includes complying with Hyatt’s requirements relatingresources provided as needed.
At the initial onset of the COVID-19 pandemic and at the request of employees throughout the organization, we established the Ernesto Oliver Lopez Memorial Fund in honor of a Playa employee who fell victim to the central reservation system, global distribution systemsvirus. This fund continues to actively accept donations from employees and alternative distribution systems.community members which directly benefit Playa employees in need, whether that be providing food and necessities for their family or paying health-related expenses.
All Playa employees undergo a comprehensive orientation and training. In addition to health and safety courses that include a specific course for respiratory disease prevention implemented in 2020, we offer continuous learning and development with courses on Playa’s culture, vision and philosophy, guest satisfaction, performance management for leadership, mentoring and coaching, stress management, emotional intelligence, effective interviewing and talent development, high impact teams, conflict resolution and quality management. For example, one growth and development opportunity for our high-potential employees is a talent program. Specific individuals are prepared for future leadership positions within the Hyatt franchise agreement, each Hyatt franchise Resort Owner enters into additional agreementsorganization through hands-on training, mentorship and education. All of our resort leadership teams participate in our talent program in order to allow identified employees to be promoted at their resort, at another resort within the country, or be relocated within the Playa organization. This program allows Playa to acquire the best talent, retain and motivate its employees, and succession plan.
The Company places a tremendous emphasis on health and wellness. Throughout the year, employees participate in educational health seminars, special events such as Breast Cancer Awareness Month and wellness programs both in-person and online, depending on the employee’s location. An emphasis is placed on preventative healthcare with Hyatt pertaining to the development and operation of such new Hyatt All-Inclusive Resort Brand resort,special efforts including a trademark sublicense agreement,mammogram truck for screenings and onsite flu shot distribution. Further, corporate employees are recognized for preventative health screenings, reading health-related articles and participating in educational wellness-related challenges that include eating a World of Hyatt® guest loyalty program agreement, a chain marketing services agreementnutritionally balanced diet and a reservations agreement.increasing physical activity.
AMResorts Management Agreements
13
The Panama Jack Agreement
On October 31, 2020, we terminated the management agreement for the Capri Resort, formerly known as the Secrets Capri, with AMResorts, which was subsequently sold in June 2021. In connection with the termination, we agreed to provide high rate business during peak seasons, such as winter and spring holidays, while “bargain hunters” can be targeted through social media for last minute high need periods. This multi-pronged strategy is designed to increase Net Package RevPAR (as defined in Item 7. Management's Discussion and Analysis of Financial Condition and Results of Operations) as well as generate strong Occupancy through allextend the term of the resort seasons.management agreement for Dreams Palm Beach to February 2025.
Competition
We face intense competition for guests from other participants in the all-inclusive segment of the lodging industry and, to a lesser extent, from traditional hotels and resorts that are not all-inclusive. The all-inclusive segment remains a relatively small part of the broadly defined global vacation market that has historically been dominated by hotels and resorts that are not all-inclusive. Our principal competitors include other operators of all-inclusive resorts and resort companies, such as Barceló Hotels & Resorts, RIU Hotels & Resorts, IBEROSTAR Hotels & Resorts, Karisma Hotels & Resorts, AMResorts (which was recently acquired by Hyatt), Meliá Hotels International, Excellence Resorts, RCD Hotels (Hard Rock Hotels & Resorts), Blue Diamond Resorts and Palace Resorts, as well as some smaller, independent and local owners and operators.
We compete for guests based primarily on brand name recognition and reputation, location, guest satisfaction, room rates, quality of service, amenities and quality of accommodations.
Additionally, we compete with other U.S. and European global hospitality brands, such as Marriott International, Inc., that have recently entered the all-inclusive segment as a result of increased demand for all-inclusive resort stays. We primarily compete with these global hospitality brands for third-party management contracts.
Seasonality
The seasonality of the lodging industry and the location of our resorts in Mexico, Jamaica and the CaribbeanDominican Republic generally result in the greatest demand for our resorts between mid-December and April of each year, yielding higher occupancy levels and package rates during this period. This seasonality in demand has resulted in predictable fluctuations in revenue, results of operations and liquidity, which are consistently higher during the first quarter of each year than in successive quarters.
The COVID-19 pandemic altered this seasonality trend in both 2020 and 2021 and Net Package ADR was progressively stronger during the second, third and fourth quarters of 2021 than it was in the first quarter of 2021 and in prior years. See “Impact of COVID-19 Pandemic” in Part II, Item 7. Management's Discussion and Analysis of Financial Condition and Results of Operations for more information regarding the effects of the COVID-19 pandemic on our results of operations.
Cyclicality
The lodging industry is highly cyclical in nature. Fluctuations in operating performance are caused largely by general economic and local market conditions, which subsequently affect levels of business and leisure travel. In addition to general economic conditions, new hotel and resort room supply is an important factor that can affect the lodging industry’s performance, and over-building has the potential to further exacerbate the negative impact of an economic recession. Room rates and Occupancy, and thus Net Package RevPAR (as defined in Part II, Item 7. Management's Discussion and Analysis of Financial Condition and Results of Operations), tend to increase when demand growth exceeds supply growth. A decline in lodging demand, or increase in lodging supply, could result in returns that are substantially below expectations, or result in losses, which could have a material adverse effect on our business, financial condition, liquidity and results of operations. Further, many of the costs of running a resort are fixed rather than variable. As a result, in an environment of declining revenues the rate of decline in earnings is likely to be higher than the rate of decline in revenues.
The COVID-19 pandemic has significantly impacted the lodging industry in 2020 and 2021. See “Impact of COVID-19 Pandemic” in Part II, Item 7. Management's Discussion and Analysis of Financial Condition and Results of Operations for more information regarding the effects of the COVID-19 pandemic on our results of operations.
14
Intellectual Property
We own or have rights to use the trademarks, service marks or trade names that we use or will use in conjunction with the operation of our business, including certain of Hyatt’s, Hilton’s and Hilton’sWyndham’s intellectual property under the Hyatt Resort Agreementstheir respective strategic alliance and our franchise agreements with Hilton. We also have rights to certain of Panama Jack’s intellectual property under the Panama Jack Agreement and related agreements. In the highly competitive lodging industry in which we operate, trademarks, service marks, trade names and logos are very important to the success of our business.
Insurance
Our resorts carry what we believe are appropriate levels of insurance coverage for a business operating in the lodging industry in Mexico, the Dominican Republic and Jamaica. This insurance includes coverage for general liability, property, workers’ compensation and other risks with respect to our business and business interruption coverage.
This general liability insurance provides coverage for any claim, including terrorism and hurricane damage, resulting from our operations, goods and services and vehicles. We believe these insurance policies are adequate for foreseeable losses and on terms and conditions that are reasonable and customary with solvent insurance carriers.
Government Regulation
We have operations and are subject to the laws of the United States and multiple foreign jurisdictions and the rules and regulations of various governing bodies, which may differ among jurisdictions. Compliance with these laws, rules and regulation has not had, and is not expected to have, a material effect on our capital expenditures, results of operations and competitive position as compared to prior periods.
See Item 1A. Risk Factorsfor further information regarding the potential impact of government regulations, including the following risk factors:
•“We may become subject to disputes or legal, regulatory or other proceedings that could involve significant expenditures by us, which could have a material adverse effect on us.”;
•“We could be exposed to liabilities under the FCPA and other anti-corruption laws and regulations, including non-U.S. laws, any of which could have a material adverse impact on us.”;
•“We could incur significant costs related to government regulation and litigation with respect to environmental matters, which could have a material adverse effect on us.”;
•“The tax laws, rules and regulations (or interpretations thereof) in the jurisdictions in which we operate may change, which could have a material adverse effect on us.”; and
•“Increases in property taxes would increase our operating costs, which could have a material adverse effect on us.”
Previously Disclosed Information
For additional information about our business, including information about our relationships and agreements with Hyatt and Hilton, please refer to Part I, Item 1. Business in our Annual Report on Form 10-K for the year ended December 31, 2019.
Corporate Information
Playa Hotels & Resorts N.V. was organized as a public limited company (naamloze vennootschap) under the laws of the Netherlands in December 2016. Our registered office in the Netherlands is located at Prins Bernhardplein 200, 1097 JBNieuwezijds Voorburgwal 104, 1012 SG Amsterdam. Our telephone number at that address is +31 20 571 12 02.6 82 55 84 30. We maintain a website at www.playaresorts.com, which includes additional contact information. All reports that we have filed with the Securities and Exchange Commission (the “SEC”) including this Annual
Report on Form 10-K and our current reports on Form 8-K, can be obtained free of charge from the SEC’s website at www.sec.gov or through our website.
15
Item 1A. Risk Factors.
Risk Factors
The following discussion concerns some of the risks associated with our businesssummarizes material factors that could make an investment in us speculative or risky and should be considered carefully. These risks are interrelated and you should treat them as a whole. Additional risks and uncertainties not presently known to us may also materially and adversely affect our business operations, the value of our ordinary shares and our ability to pay dividends to our shareholders. In connection with the forward-looking statements that appear in this Annual Report on Form 10-K, in these risk factors and elsewhere, you should carefully review the section entitled “Forward-Looking Statements.”
The effects of the ongoing COVID-19 pandemic are having a significant material adverse effect on our business, results of operations, cash flows and financial condition and if the pandemic is long-lasting these effects could be severe.
The outbreak of the coronavirus (COVID-19) pandemic has led governments and other authorities around the world to impose measures intended to control its spread, including restrictions on freedom of movement and business operations such as travel bans, border closings, business closures, testing requirements, quarantines and shelter-in-place orders. As a result, the pandemic has significantly disrupted global travel, and has adversely impacted global commercial activity across the travel, lodging and hospitality industries. The COVID-19 pandemic has had, and is expected to continue to have, significant adverse impacts on economic and market conditions and has resulted in a global economic contraction.
The effects of the COVID-19 pandemic on the lodging industry have been unprecedented with global demand for lodging drastically reduced and occupancy levels reaching historic lows. Due to the rapid and broad spread of the virus and in response to related governmental restrictions and advisories, reductions in scheduled airline services and potential health risks to our employees and guests, we temporarily suspended operations at all of our resorts in late March 2020. Our Businessresorts began reopening in July 2020, in stages, based on incremental easing of government restrictions and advisories and increases in scheduled commercial airline service. As a result of the suspension of operations at all of our resorts, we had no revenues from resort operations in the second quarter of 2020 and revenues have remained below historical levels, even after all of our resorts reopened. We are continuing to experience reduced occupancy at our resorts due to the effects of the pandemic, including government-imposed restrictions on travel, such as the re-entry requirements imposed by the U.S. Centers for Disease Control and Prevention. The extent to which the COVID-19 pandemic will continue to impact us and consumer behavior will depend on future developments, which are highly uncertain and cannot be predicted with confidence, including the scope, severity and duration of the pandemic, continuing resurgences of the virus and its variants, including the Delta and Omicron variants, the government actions taken to contain the pandemic or mitigate its impact, the speed, continuing effectiveness and distribution of vaccines (including boosters) and treatment therapies, the rate of public adoption of COVID-19 vaccines, and the direct and indirect economic effects of the pandemic and containment measures, including the magnitude of its impact on unemployment rates, labor-force availability (including as a result of vaccine mandates), disruption in the supply chain for materials and consumer discretionary spending, among others. The longer and more severe the pandemic, and actual or even the possibility of repeat or cyclical outbreaks of the COVID-19 virus, the greater the material adverse effect will be on our business, financial condition, liquidity, results of operations, prospects, access to equity and credit markets and ability to service our indebtedness.
There also can be no guarantee that when the effects of the pandemic subside the demand for lodging, and consumer confidence in travel generally, will recover as quickly and fully as other industries. Additionally, the effects of the pandemic have had, and we expect will continue to have, a material adverse effect on our ability to consummate acquisitions and dispositions of resorts and our ability to timely complete planned capital expenditures and other projects.
Additional risks to our business relating to the COVID-19 pandemic include the following:
•We have substantial debt outstanding currently, and our ongoing ability to service our significant financial obligations depends on our ability to generate significant free cash flow from operations. Our cash flow from operations has been materially reduced as a result of the COVID-19 pandemic and will continue to be materially reduced for as long as our resorts are operating below historical levels or if one or more of our resorts are closed again in the future. We cannot assure you that our business will generate cash flow from operations, that future borrowings will be available to us or permitted under our Revolving Credit Facility or otherwise, or that we will be able to complete any necessary financings or refinancings, in amounts sufficient to enable us to pay our debts and other obligations and fund our other liquidity needs;
•The agreements which govern our various debt obligations impose restrictions on our business, including certain covenants which limit/prohibit us from incurring additional indebtedness and may materially impact our liquidity and financial condition and could require us to seek to meet capital needs through asset sales or dilutive equity sales;
16
•Commercial airline service has been reduced to many of the regions in which our resorts are located. If scheduled airline service does not increase or return to normalized levels it could have a material adverse effect on our resort revenues;
•Adverse changes in our credit and any ratings could have an adverse impact on our interest expense;
•Safety protocols established by certain jurisdictions in which our resorts are located, for example, Jamaica, or re-entry requirements from countries where our guests originate, such as the United States, have made travel to our resorts more challenging and less attractive, adversely affecting demand at our resorts;
•Increases in crime, theft, vandalism, violence, and other safety and health concerns due to the economic fallout from the effects of the COVID-19 pandemic in the regions in which our resorts are located, or the perception of such risks among prospective guests, could reduce demand for our resorts;
•We have been and may continue to be required to recognize significant non-cash impairment charges as a result of material reductions in our cash flows from operations;
•We have incurred and will continue to incur additional costs related to sanitation and hygiene requirements, social distancing and other mitigation measures;
•Steps to reduce costs may negatively impact our reputation and guest loyalty, and future demand at our resorts may suffer as a result;
•We may experience disruptions as a result of corporate employees working remotely, including risk of cybersecurity incidents and disruptions to internal control procedures; and
•In order to raise additional capital to fund our operations and service our indebtedness, we have sold assets and issued equity securities and we may need to sell further assets or issue additional equity securities in the future at prices that are below the value of those assets or that may be dilutive to existing shareholders and that may be below what we believe to be the intrinsic value of our ordinary shares.
In addition, our business could be materially and adversely affected by the effect of, or the public perception or a risk of, other pandemic diseases. For example, the outbreaks of severe acute respiratory syndrome (“SARS”) and avian flu in 2003 had a severe impact on the travel industry, and the outbreaks of H1N1 flu in 2009 also had an adverse effect. Cases of the Zika virus have been reported in regions in which our resorts are located. Additionally, the public perception of a risk of another pandemic or media coverage of these diseases, or public perception of health risks linked to perceived regional food and beverage safety, particularly if focused on regions in which our resorts are located, may adversely affect us by reducing demand for our resorts or result in health or other government authorities imposing restrictions on travel. Any of these events could result in a significant drop in demand for our resorts and could have a material adverse effect on us.
General economic uncertainty and weak demand in the lodging industry could have a material adverse effect on us.
Our business strategy depends significantly on demand for vacations generally and, more specifically, on demand for all-inclusive vacation packages. WeakThe possibility of weak economic conditions and other factors beyond our control, includingsuch as high levels of unemployment and underemployment, in North America, especially the United States and Mexico, Europe and Asia, could reduce the level of discretionary income or consumer confidence in the countries from which we source our guests and have a negative impact on the lodging industry. We cannot provide any assurances that demand for all-inclusive vacation packages will remain consistent with or increase from current levels. Furthermore, our business is focused primarily on, and our acquisition strategy targets the acquisition of resorts in, the all-inclusive segment of the lodging industry (and properties that we believe can be converted into all-inclusive resorts in a manner consistent with our business strategy). This concentration exposes us to the risk of economic downturns in the lodging industry broadly and, more specifically, in the leisure dominated all-inclusive segment of the lodging industry. As a result of the foregoing, we could experience a prolonged period of decreased demand and price discounting in our markets, which would negatively affect our revenues and could have a material adverse effect on us, including our business, financial condition, liquidity, results of operations and prospects.
We are exposed to significant risks related to the geographic concentration of our resorts, including weather-related emergencies, natural disasters, and instability in government and public safety, which could have a material adverse effect on us.
Our resorts are concentrated in Mexico (which accounted for 51.5% of our Total Net Revenue as defined in Part II, Item 7. Management's Discussion and Analysis of Financial Condition and Results of Operations), Jamaica (18.8% of our Total Net Revenue) and the Dominican Republic (29.0% of our Total Net Revenue) for the year ended December 31, 2021. When the countries and/or the
17
regions of these countries in which our resorts are concentrated are adversely impacted by government instability, public-safety issues, such as crime or power outages, weather-related emergencies, such as hurricanes or floods, or natural disasters, such as earthquakes, a number of our resorts could be adversely impacted by the same event, which could have a material adverse effect on us, including our business, financial condition, liquidity, results of operations and prospects. We cannot assure you that any property or business interruption insurance will adequately address all losses, liabilities and damages.
Terrorist acts, armed conflict, civil unrest, criminal activity and threats thereof, and other international events impacting the security of travel or the perception of security of travel could adversely affect the demand for travel generally and demand for vacation packages at our resorts, which could have a material adverse effect on us.
Past acts of terrorism and violent crime have had an adverse effect on tourism, travel and the availability of air service and other forms of transportation. The threat or possibility of future terrorist acts, an outbreak, escalation and/or continuation of hostilities or armed conflict abroad, criminal violence, civil unrest or the possibility thereof, the issuance of travel advisories by sovereign governments, and other geo-political uncertainties have had and may have an adverse impact on the demand for vacation packages and consequently the pricing for vacation packages. Decreases in demand and reduced pricing in response to such decreased demand would adversely affect our business by reducing our profitability.
17 of the resorts are concentrated in Mexico (accounted for 52.9%our portfolio bear the name of our Total Net Revenue as defined in Item 7), Jamaica (31.9%one or both of our Total Net Revenue)the Hyatt All-Inclusive Resort Brands, the Hilton all-inclusive resort brand (the “Hilton Brand”) and the Dominican Republic (15.0%Wyndham all-inclusive resort brand (the “Wyndham Brand”). As a result of this concentration, our Total Net Revenue) forsuccess will depend, in part, on the year ended December 31, 2019. In additioncontinued success of these brands. We believe that building brand value is critical to increase demand and build guest loyalty. Consequently, if market recognition or the positive perception of any of the Hyatt All-Inclusive Resort Brands, Hilton Brand or Wyndham Brand is reduced or compromised, the goodwill associated with these resorts in our portfolio would likely be adversely affected. Under the applicable resort agreements with these partners, Hyatt, Hilton and Wyndham provide (or cause to be provided) various marketing services to the matters referredrelevant resorts, and we may conduct local and regional marketing, advertising and promotional programs, subject to in the preceding risk factor, damage to these resorts or a disruption ofcompliance with their operations or a reduction of travel to them due to a hurricane or other weather-related or other emergency could reduce their revenue, which could have a material adverse effect on us, including our business, financial condition, liquidity, results of operations and prospects.requirements. We cannot assure you that we and our applicable partners will be successful in our marketing efforts to grow any property or business interruption insurance will adequately address all losses, liabilities and damages. In addition, all of our resorts are located on beach front properties and are particularly susceptible to weather-related emergencies, such as hurricanes, or other marine environmental hazards, such as flooding, pollution or algae blooms.these brands.
Under the terms of luxury all-inclusive resorts. The all-inclusive resort market has not traditionally been associatedour franchise agreements with Hyatt, Hilton and Wyndham, we are required to meet specified operating standards and other terms and conditions. We expect that these brands will periodically inspect our resorts that carry the Hyatt All- Inclusive Resort Brand, Hilton Brand and Wyndham Brand, as applicable. If we fail to maintain brand standards at one or more of these resorts, or otherwise fail to comply with the high-endterms and luxury segmentsconditions of the lodging industryapplicable franchise agreements, then the applicable franchise agreements (and in some cases all franchise agreements related to the particular brand) could be terminated. In that situation, we may be subject to liquidated damage payments. If one or more of these franchise agreements is terminated, the underlying value and there is a risk thatperformance of our target guests, manyrelated resort(s) could decline significantly from the loss of whom have not experienced an all-inclusive model, will not findassociated name recognition, participation in applicable guest loyalty programs, reservation systems and websites, and access to group sales business, as well as from the all-inclusive model appealing. A failurecosts of “rebranding” such resorts.
There are very limited restrictions on the ability of our brand partners, including Hyatt, to attract our target guests could result in decreased revenue from our portfolio and could have a material adverse effect on us, including our business, financial condition, liquidity, results of operations and prospects.compete with us.
Our strategic relationship with our brand partners, including Hyatt, may deteriorate and disputes between Hyatt and us may arise. The Hyatt relationship is an important tocomponent of our business and if it deteriorates, the value ofbrand strategy. However, there are very limited restrictions on our portfolio could decline significantly, and it could have a material adverse effect onbrand partners competing with us.
18
Brands or any other Hyatt-sponsored brands. In addition, in the future, Hyatt, in its sole discretion, and subject to its obligations under the Hyatt Strategic Alliance Agreement in the Market Area, may designate other third parties as authorized operators of resorts or Hyatt may decide to directly operate resorts under the Hyatt All-Inclusive Resort Brands or any other Hyatt brand, whether owned by third parties or Hyatt itself.
In addition, Hyatt recently completed an acquisition of Apple Leisure Group (“ALG”), a luxury resort-management services, travel and hospitality group that manages all-inclusive resorts in many of the regions in which we operate. With ALG’s brand management platform AMResorts, Hyatt franchisemay therefore compete against us for contracts to manage all-inclusive resorts in the Caribbean, Mexico and Latin America, and its financial and marketing resources, brand name recognition and terms of its management agreements for all (but not less than all)may cause us to miss out on attractive business opportunities and adversely affect our revenues, growth strategy and profits. In addition, AMResorts, which currently also manages two of our resorts. Inresorts, may have interests that situation, we would be subjectconflict with our interests, such as incentives to liquidated damage payments to Hyatt, even for thosefavor its other resorts that areover our resorts as a result of more favorable compensation arrangements or by ownership interests in compliance with their Hyatt franchise agreements. If one or more Hyatt franchise agreements is terminated, the underlying value and performance of our related resort(s) could decline significantly from the loss of associated name recognition, participation in the World of Hyatt® guest loyalty program, Hyatt’s reservation system and website, and access to Hyatt group sales business, as well as from the costs of “rebranding” such resorts and the payment of liquidated damages to Hyatt.these resorts.
Under our Strategic Alliance Agreement decline to enter into Hyatt franchise agreements for other all-inclusive resort opportunities that we bring to Hyatt, whether we own the properties or manage them for third-party owners.
If any of the foregoing were to occur,our brand partners compete with us and our resorts, it could have a material adverse effect on us, including our business, financial condition, liquidity, results of operations and prospects and the market price of our ordinary shares, and could divert the attention of our senior management from other important activities.
There is increased competition from global hospitality branded companies in the Hilton Strategic Alliance Agreement will expire on August 7, 2023, and could be terminated earlier by Hilton if we fail to meet certain development milestones, and certain provisions of our Hilton Strategic Alliance Agreement impose certain restrictions on us, any of which could have a material adverse effect on us.all-inclusive market segment.
We are exposed to fluctuations in currency exchange rates, including fluctuations in (a) the value of the local currencies, in which we incur our costs at each resort, relative to the U.S. dollar, in which the revenue from each of our resorts is generally denominated, (b) the currency of our prospective guests, who may have a reduced ability to pay for travel to our resorts, relative to their ability to pay to travel to destinations with more attractive exchange rates, and (c) the value of local currencies relative to the U.S. dollar, which could impact our ability to meet our U.S. dollar-denominated obligations, including our debt service payments, any of which could have a material adverse effect on us.
The majority of our operating expenses are incurred locally at our resorts and are denominated in Mexican Pesos, the Dominican PesoPesos or the Jamaican dollar.dollars. The net proceeds from our outstanding debt borrowings were received and are payable by our subsidiary Playa Resorts Holding B.V.,subsidiaries in U.S. dollars and our functional reporting currency is U.S. dollars. An increase in the relative value of the local currencies, in which we incur our costs at each resort, relative to the U.S. dollar, in which our revenue from each resort is denominated, would adversely affect our results of operations for those resorts. Our current policy is not to hedge against changes in foreign exchange rates and we therefore may be adversely affected by appreciation in the value of other currencies against the U.S. dollar, or to prolonged periods of exchange rate volatility. These fluctuations may negatively impact our financial condition, liquidity and results of operations to the extent we are unable to adjust our pricing accordingly.
Additionally, in the event that the U.S. dollar increases in value relative to the currency of the prospective guests living outside the United States, our prospective guests may have a reduced ability to pay for travel to our resorts and this may lead to lower Occupancy rates and revenue, which could have a material adverse effect on us, including our financial results. An increase in the
19
value of the Mexican Peso, the Dominican Peso or the Jamaican dollar compared to the currencies of other potential destinations may disadvantage the tourism industry in Mexico, the Dominican Republic or Jamaica, respectively, and result in a corresponding decrease in the Occupancy rates and revenue of our resorts as consumers may choose destinations in countries with more attractive exchange rates. In the event that this appreciation occurs, it could lead to an increase in the rates we charge for rooms in our resorts, which could result in a decrease in Occupancy rates and revenue and, therefore, negatively impact our business, financial condition, liquidity, results of operations and prospects.
Furthermore, appreciation of local currencies relative to the U.S. dollar could make fulfillment of our and our subsidiaries’ U.S. dollar denominated obligations, including Playa Resorts Holding B.V.’sour subsidiaries' debt service payments, more challenging and could have a material adverse effect on us, including our business, financial condition, liquidity, results of operations and prospects.
Our resort development, acquisition, expansion, repositioning and rebranding projects will be subject to timing, budgeting and other risks, which could have a material adverse effect on us.
We may develop, acquire, expand, reposition or rebrand resorts (such as the two resorts we have rebranded under the Panama Jack brand and the two resorts we have rebranded under the Hilton Brand)Wyndham Alltra all-inclusive brand) from time to time as suitable opportunities arise, taking into consideration general economic conditions. To the extent that we determine to develop, acquire, expand, reposition or rebrand resorts, we could be subject to risks associated with, among others:
•construction delays or cost overruns that may increase project costs;
•receipt of zoning, Occupancyoccupancy and other required governmental permits and authorizations;
•strikes or other labor issues;
•development costs incurred for projects that are not pursued to completion;
•investment of substantial capital without, in the case of developed or repositioned resorts, immediate corresponding income;
•results that may not achieve our desired revenue or profit goals;
•acts of nature such as earthquakes, hurricanes, floods or fires that could adversely impact a resort;
•ability to raise capital, including construction or acquisition financing; and
•governmental restrictions on the nature or size of a project.
We have seen certain construction timelines lengthen due to competition for skilled construction labor, disruption in the supply chain for materials, and the impact of COVID-19 generally, and these circumstances could continue or worsen in the future. As a result of the foregoing, we cannot assure you that any development, acquisition, expansion, repositioning and rebranding project will be completed on time or within budget or if the ultimate rates of investment return are below the returns forecasted at the time the project was commenced. If we are unable to complete a project on time or within budget, the resort’s projected operating results may be adversely affected, which could have a material adverse effect on us, including our business, financial condition, liquidity, results of operations and prospects.
We have been and may continue to be adversely impacted by the consequences of climate change, such as changesincreases in the frequency, duration and severity of extreme weather events and changes in precipitation and temperature, which have resulted and may continue to result in physical damage or a decrease in demand for our properties, all of which are located in coastal beachfront locations that are vulnerable to significant property damage from severehurricanes, tropical storms and flooding. For example, in 2021, 2020 and 2019, we incurred hurricane and tropical storm repair expenses of $0.5 million, $1.5 million, and $0 million, respectively, which were not offset by insurance proceeds. Although a majority of our expenses have been offset by insurance proceeds, there is no assurance that, given the increasing burdens on insurance companies from extreme weather events, including hurricanes. Shouldwe will be able to continue to obtain adequate insurance against these types of losses, or that our insurers will in the impactfuture be in a position to satisfy our claims. In addition, the costs of climate change be materialinsurance against these types of events has increased in nature, we could be materially and adversely affected, includingrecent years. For example, in 2021 our financial condition, liquidity and resultsproperty insurance costs of operations. our comparable resorts were 17.1% higher than 2018.
In addition, changes in applicable legislation and regulation on climate change could result in increased capital expenditures, such as a result of changes in building codes or requirements to improve the energy efficiency of the properties.
Climate change also presents additional risks beyond our control which can adversely impact demand for hospitality products and services, our operations, and our financial results. For example, most of our properties are located at or around sea level, and are
20
therefore vulnerable to rising sea levels and erosion. Climate change-related impacts may also result in order to comply witha scarcity of resources, such regulations. Actualas water and energy, at some or anticipated losses resulting fromall of the consequencesregions in which our results are located. Furthermore, increasing awareness around sustainability, the impact of air travel on climate change could alsoand the impact of over-tourism may contribute to a reduction in demand from certain guests visiting our resorts.
The coastlines of a number of the cost or availabilityregions where our resorts are concentrated have experienced elevated levels of insurance.sargassum seaweed in recent years.
Many of our resorts are beach-front properties that have been exposed to elevated levels of sargassum seaweed. In recent years, the amount of sargassum that has washed up onshore in various geographies in Mexico has increased. If not removed promptly, the seaweed can overrun the beach, making it difficult to swim in the water and generating a foul odor if it is allowed to rot. The heightened level of sargassum in recent years has led to negative media coverage and increased awareness of the potential problem and has required additional operating expenses to remove it. Although we do our best to remove the seaweed and prevent the build-up, the exact cause of overgrowth is unknown.
Our insurance may not be adequate to cover our potential losses, liabilities and damages, the cost of insurance may continue to increase materially, including as a result of extreme weather events that may be related to climate change, and we may not be able to secure insurance to cover all of our risks, all of which could have a material adverse effect on us.
The business of owning and managing resorts is subject to a number of risks, hazards, adverse environmental conditions, labor disputes, changes in the regulatory environment and natural phenomena such as floods, hurricanes, earthquakes and earth movements. Such occurrences could result in damage or impairment to, or destruction of, our resorts, personal injury or death, environmental damage, business interruption, monetary losses and legal liability.
While insurance is not commonly available for all these risks, we maintain customary insurance against risks that we believe are typical and reasonably insurable in the lodging industry and in amounts that we believe to be reasonable but that contain limits, deductibles, exclusions and endorsements. However, we may decide not to insure against certain risks because of high premiums compared to the benefit offered by such insurance or for other reasons. In the event that costs or losses exceed our available insurance or additional liability is imposed on us for which we are not insured or are otherwise unable to seek reimbursement, we could be materially and adversely affected, including our financial results. We may not be able to continue to procure adequate insurance coverage at commercially reasonable rates in the future or at all, and some claims may not be paid. There can be no assurance that the coverage and amounts of our insurance will be sufficient for our needs.
Labor shortages could restrict our ability to operate our properties or grow our business or result in increased labor costs that could adversely affect our results of operations and cash flows.
Our success depends in large part on our ability to attract, retain, train, manage and engage skilled employees. As of December 31, 2019,2021, we directly and indirectly employed approximately 12,00012,300 employees worldwide at both our corporate offices and on-site at our resorts. If we are unable to attract, retain, train, manage, and engage skilled employees, our ability to manage and staff our resorts could be impaired, which could reduce guest satisfaction. Staffing shortages in places where our resorts are located also could hinder our ability to grow and expand our businesses. Because payroll costs are a major component of the operating expenses at our resorts, a shortage of skilled labor could also require higher wages that would increase labor costs, which could adversely affect our results of operations and cash flows.
A significant number of our employees are unionized, and if labor negotiations or work stoppages were to disrupt our operations, it could have a material adverse effect on us.
Approximately 39%41% of our full-time equivalent work force is unionized. As a result, we are required to negotiate the wages, salaries, benefits, staffing levels and other terms with many of our employees collectively and we are exposed to the risk of disruptions to our operations. Our results could be adversely affected if future labor negotiations were to disrupt our operations. If we were to experience labor unrest, strikes or other business interruptions in connection with labor negotiations or otherwise, or if we were unable to negotiate labor contracts on reasonable terms, we could be materially and adversely affected, including our results of operations. In addition, our ability to make adjustments to control compensation and benefits costs, rebalance our portfolio or otherwise adapt to changing business needs may be limited by the terms and duration of our collective bargaining agreements.
21
Many of our guests rely on a combination of scheduled commercial airline services and tour operator services for passenger connections, and price increases or service changes by airlines or tour operators could have a material adverse effect on us, including reducing our Occupancyoccupancy rates and revenue and, therefore, our liquidity and results of operations.
Many of our guests depend on a combination of scheduled commercial airline services and tour operator services to transport them to airports near our resorts. Increases in the price of airfare, due to increases in fuel prices, reductions in service, or other factors such as inflation, would increase the overall vacation cost to our guests and may adversely affect demand for our vacation packages. Changes in commercial airline services or tour operator services as a result of strikes, weather or other events, or the lack of availability due to schedule changes or a high level of airline bookings, could have a material adverse effect on us, including our Occupancyoccupancy rates and revenue and, therefore, our liquidity and results of operations.
The ongoing need for capital expenditures at our resorts could have a material adverse effect on us, including our financial condition, liquidity and results of operations.
Our resorts will have an ongoing need for renovations and other capital improvements, including replacements, from time to time, of furniture, fixtures and equipment. In addition, Hyatt, Hilton and HiltonWyndham will require periodic capital improvements by us as a condition of maintaining the use of their brands. TheseIn addition to liquidity risks, these capital improvements may give rise to the following risks:
risks. The costs of all these capital improvements or any of the above noted factors could have a material adverse effect on us, including our financial condition, liquidity and results of operations.
We have substantial debt outstanding currently and may incur additional debt in the future. The principal, premium, if any, and interest payment obligations of such debt may restrict our future operations and impair our ability to invest in our business.
As of December 31, 2019,2021, our total debt obligations were $1,046.4$1,151.2 million (whichwhich represents the principal amounts outstanding under our term loan (the “Term Loan”) and revolving credit facility (the “Revolving Credit Facility,” and, collectively with the Term Loan, the “Senior Secured Credit Facility”), our additional senior secured credit facility (the “Additional Credit Facility”), our property loan agreement (the “Property Loan”) and finance lease obligations, excluding a $2.2$4.3 million of issuance discountdiscounts and $3.6$7.7 million of unamortized debt issuance costs on our Term Loan.costs. In addition, the terms of the Senior Secured Credit Facility will permit us to incur additional indebtedness, subject to our ability to meet certain borrowing conditions.
Our substantial debt may have important consequences to you. For instance, it could:
•make it more difficult for us to satisfy our financial obligations;
•require us to dedicate a substantial portion of any cash flow from operations to the payment of interest and principal due under our debt, which would reduce funds available for other business purposes, including capital expenditures and acquisitions;
•place us at a competitive disadvantage compared to some of our competitors that may have less debt and better access to capital resources;
•limit our ability to respond to changing business, industry and economic conditions and to withstand competitive pressures, which may adversely affect our operations;
•cause us to incur higher interest expense in the event of increases in interest rates on our borrowings that have variable interest rates or in the event of refinancing existing debt at higher interest rates;
•limit our ability to make investments or acquisitions, dispose of assets, pay cash dividends or redeem or repurchase shares; and/or
•limit our ability to refinance existing debt or to obtain additional financing required to fund working capital and other business needs, including capital requirements and acquisitions.
Our ability to service our significant financial obligations depends on our ability to generate significant cash flow from operations, which is partially subject to general economic, financial, competitive, legislative, regulatory and other factors beyond our control, and we cannot assure you that our business will generate cash flow from operations, that future borrowings will be available to us under the Revolving Credit Facility, or that we will be able to complete any necessary financings or refinancings, in amounts sufficient to enable us to fund our operations, engage in acquisitions, capital improvements or other development activities, pay our debts and other obligations and fund our other liquidity needs. If we are not able to generate sufficient cash flow from operations, we may need to refinance or restructure our debt, sell assets, reduce or delay capital investments, or seek to raise additional capital. Additional debt or equity financing may not be available in sufficient amounts, at times or on terms acceptable to us, or at all, and any
additional debt financing we do obtain may significantly increase our leverage on unfavorable terms. If we are unable to implement one or more of these alternatives, we may not be able to service our debt or other obligations,
22
which could result in us being in default thereon, in which circumstances our lenders could cease making loans to us, lenders or other holders of our debt could accelerate and declare due all outstanding obligations due under the respective agreements and secured lenders could foreclose on their collateral, any of which could have a material adverse effect on us.
The agreements which govern our various debt obligations impose restrictions on our business and limit our ability to undertake certain actions.
The agreements which govern our various debt obligations, including the Senior Secured Credit Facility, include covenants imposing significant restrictions on our business. These restrictions may affect our ability to operate our business and may limit our ability to take advantage of potential business opportunities as they arise. These covenants place restrictions on our ability to, among other things:
•incur additional debt;
•pay dividends or repurchase shares or make other distributions to shareholders;
•make investments or acquisitions;
•create liens or use assets as security in other transactions;
•issue guarantees;
•merge or consolidate, or sell, transfer, lease or dispose of substantially all of our assets;
•amend our Articles of Association or bylaws;
•engage in transactions with affiliates; and
•purchase, sell or transfer certain assets.
The Senior Secured Credit Facility, also requiresAdditional Credit Facility and Property Loan require us to comply with certain financial and other covenants. Our ability to comply with these agreements may be affected by events beyond our control, including prevailing economic, financial and industry conditions. These covenants could have a material adverse effect on our business by limiting our ability to take advantage of financing, mergers, acquisitions or other corporate opportunities. The breach of any of these covenants could result in a default under the Senior Secured Credit Facility.Facility, Additional Credit Facility or Property Loan. An event of default under any of our debt agreements could permit such lenders to declare all amounts borrowed from them, together with accrued and unpaid interest, to be immediately due and payable, which could, in turn, trigger defaults under other debt obligations and could result in the termination of commitments of the lenders to make further extensions of credit under the Revolving Credit Facility. If we are unable to repay debt to our lenders, or are otherwise in default under any provision governing any secured debt obligations, our secured lenders could proceed against us and against any collateral securing that debt.
Our variable rate indebtedness is priced using a spread over the London Interbank Offered Rate (“LIBOR”) and subjects us to interest rate risk, which could cause our debt service obligations to increase significantly.
A portion of our borrowings, specifically $169.2 million under theour Senior Secured Credit Facility areand Additional Credit Facility, bears interest at variablefloating interest rates of interest and expose uspegged to LIBOR as it is not hedged by interest rate risk. If interest rates increase, our debt service obligations on our existingswaps. On November 30, 2020, the U.S. Federal Reserve Board, Federal Deposit Insurance Corporation and any future variable rate indebtedness would also increase and our cash available to service our other obligations and invest in our business would decrease. Furthermore, rising interest rates would likely increase our interest obligations on future fixed rate indebtedness. As a result, rising interest rates could materially and adversely affect our financial condition and liquidity.
23
Any mortgage debt we incur will expose us to increased risk of property losses due to foreclosure, which could have a material adverse effect on us.
Incurring mortgage debt increases our risk of property losses because any defaults on indebtedness secured by our resorts may result in foreclosure actions initiated by lenders and ultimately our loss of the property securing the loan for which we are in default. For tax purposes, a foreclosure of any nonrecourse mortgage on any of our resorts may be treated as a sale of the property for a purchase price equal to the outstanding balance of the debt secured by the mortgage. In certain of the jurisdictions in which we operate, if any such foreclosure is treated as a sale of the property and the outstanding balance of the debt secured by the mortgage exceeds our tax basis in the property, we could recognize taxable income upon foreclosure but may not receive any cash proceeds.
In addition, any default under our mortgage debt may increase the risk of default on our other indebtedness, including other mortgage debt. If this occurs, we may not be able to satisfy our obligations under our indebtedness, which could have a material adverse effect on us, including our financial condition, liquidity (including our future access to borrowing) and results of operations.
We may become subject to disputes or legal, regulatory or other proceedings that could involve significant expenditures by us, which could have a material adverse effect on us.
The nature of our business exposeshas exposed us to the potential for disputes or legal, regulatory orand other proceedings from time to time relating to tax matters, environmental matters, government regulations, including licensing and permitting requirements, food and beverages safety regulations, personal injury, labor and employment matters, contract disputes and other issues. In addition, amenities at our resorts, including restaurants, bars, casinos, and swimming pools, are subject to significant regulations, and government authorities may disagree with our interpretations of these regulations, or may enforce regulations that historically have not been enforced. Such disputes, individually or collectively, could adversely affect our business by distracting our management from the operation of our business or impacting our market reputation with our guests. If these disputes develop into proceedings or judgments, these proceedings or judgments, individually or collectively, could distract our senior management, disrupt our business or involve significant expenditures and our reserves relating to ongoing proceedings, if any, may ultimately prove to be inadequate, any of which could have a material adverse effect on us, including our financial results.
Some of the resorts in our portfolio located in Mexico were constructed and renovated without certain approvals. The authority granted to the Mexican government is plenary and we can give no assurance it will not exercise its authority to impose fines, remediation measures or close part or all of the related resort(s), which could have a material adverse effect on us.
Some of the resorts in our portfolio were constructed and renovated without certain approvals at the time the construction and renovation work was carried out, as the prior owners of such resorts determined that such approvals were not required under the Mexican law. We can give no assurance that the Mexican authorities will have the same interpretation of Mexican law as the prior owners. The authority granted to the Mexican government in this regard is plenary and we can give no assurance the Mexican government will not exercise its authority to impose fines, to require us to perform remediation/restoration activities and/or to contribute to environmental trusts, and/or to close part or all of the related resort(s), which could have a material adverse effect on us, including our business, financial condition, liquidity, results of operations and prospects.
As of 1988, Mexican environmental laws were amended in order to establish that, among other things, any new hotel construction and certain renovations require the preparation of an environmental impact statement (“MIA”) in order to obtain an Environmental Impact Authorization (Resolutivo de Impacto Ambiental). Furthermore, since 2003 depending on each specific project, a supporting technical report (“ETJ”) is required to obtain an Authorization to Change the Use of Soil of Forestal Land (Autorización de Cambio de Uso de Suelo en Terrenos Forestales).
With respect to the applicable resorts:
•Two of the acquired resorts, Panama Jack ResortsWyndham Alltra Cancún and Hyatt Zilara Cancún, were built prior to implementation of the MIA in 1988 and, therefore, required no such authorization. However, certain renovations to these resorts were carried out after 1988 without an MIA because the prior owner determined that no authorization was needed pursuant to an exception in the Mexican law. We can give no assurance that the Mexican authorities will have the same interpretation of the applicability of the exception as the prior owner.
•The remaining two resorts, Hilton Playa del Carmen All-Inclusive Resort and Panama Jack ResortsWyndham Alltra Playa del Carmen, were constructed after 1988 without the required MIA and ETJ authorizations. Notwithstanding the foregoing, those resorts were operated by the prior owner, and since our Predecessor’s acquisition at the time of our Predecessor’s formation transaction have been operated by our Predecessor and us, with no interference in the normal course of business.
The consequences of failing to obtain the MIA and/or ETJ, as applicable, could result in fines of up to approximately $300,000, obligations to perform remediation/restoration activities and/or contribute to environmental trusts, and, in the case of a severe
24
violation, a partial or total closing or a demolition of the relevant resort(s). Although we are not aware of closings or demolitions due to the failure to obtain the MIA and/or ETJ, no assurance can be given that such action will not be taken in the future.
Our wholly-owned subsidiary Playa Resorts Holding B.V. may be required to obtain a banking license and/or may be in violation of the prohibition to attract repayable funds as a result of having issued senior notes and borrowing under our Senior Secured Credit Facility, which could have a material adverse effect on us.
Under the Regulation (EU) No 575/2013 of the European Parliament and of the Council of June 26, 2013, on prudential requirements for credit institutions and investment firms and amending Regulation (EU) No 648/2012 (the “CRR”), which took effect on January 1, 2014, as amended by Regulation (EU) 2019/876 (the “CRR”), there is uncertainty regarding how certain key terms in the CRR are to be interpreted.
If such terms are not interpreted in a manner that is consistent with current Dutch national guidance on which Playa Resorts Holding B.V. (our wholly-owned subsidiary) relies, Playa Resorts Holding B.V. could be categorized as a “credit institution” as a consequence of borrowing under our Senior Secured Credit Facility if it is deemed to be “an undertaking the business of which is to receive deposits or other repayable funds from the public and to grant credits for its own account.” This would require it to obtain a banking license and it could be deemed to be in violation of the prohibition on conducting the business of a bank without such a license. With respect to the borrowing under our Senior Secured Credit Facility, Playa Resorts Holding B.V. could also be deemed to be in violation of the prohibition on attracting repayable funds from the public. In each such case, it could, as a result, be subject to certain enforcement measures such as a warning and/or instructions by the regulator, incremental penalty payments (last onder dwangsom) and administrative fines (bestuurlijke boete), which all may be disclosed publicly by the regulator.
There is limited official guidance at the EU level as to the key elements of the definition of “credit institution,” such as the terms “repayable funds” and “the public.” The Netherlands legislature has indicated that, as long as there is no clear guidance at the EU level, it is to be expected that the current Dutch national interpretation of these terms will continue to be taken into account for the use and interpretation thereof. Playa Resorts Holding B.V. relies on this national interpretation to reach the conclusion that a requirement to obtain a banking license is not triggered, and that the prohibitions on conducting the business of a bank without such a license and on attracting repayable funds from the public have not been violated, on the basis that (i) each lender under our Senior Secured Credit Facility has extended loans to Playa Resorts Holding B.V. for an initial amount of at least the U.S. dollar equivalent of €100,000 or has assumed rights and/or obligations vis-à-vis Playa Resorts Holding B.V. the value of which is at least the U.S. dollar equivalent of €100,000 and (ii) all senior notes which were issued by Playa Resorts Holding B.V. were in denominations which equal or are greater than the U.S. dollar equivalent of €100,000.
If European guidance is published on what constitutes “the public” as referred to in the CRR, and such guidance does not provide that the holder of a note of $150,000 or more, such as was the case with our senior notes, or the lenders under our Senior Secured Credit Facility, each providing a loan the initial amount of which exceeds the U.S. dollar equivalent of €100,000, are excluded from being considered part of “the public” and the current Dutch national interpretation of these terms is not considered to be “grandfathered,” then Playa Resorts Holding B.V. may be required to obtain a banking license, and/or may be deemed to be in violation of the prohibition on conducting the business of a bank without such a license and, with respect to our Senior Secured Credit Facility, the prohibition on attracting repayable funds from the public and, as a result may, in each case, be subject to certain enforcement measures as described above. If Playa Resorts Holding B.V. is required to obtain a banking license or becomes subject to such enforcement measures, we could be materially adversely affected.
The results of operations of our resorts may be adversely affected by various operating risks common to the lodging industry, including competition, over-supply and dependence on tourism, which could have a material adverse effect on us.
Our resorts are subject to various operating risks common to the lodging industry, many of which are beyond our control, including, among others, the following:
•the availability of and demand for hotel and resort rooms;
•over-building of hotels and resorts in the markets in which we operate, which results in increased supply and may adversely affect Occupancy and revenues at our resorts;
•pricing strategies of our competitors;
•increases in operating costs due to inflation and other factors that may not be offset by increased room rates or other income;
•international, national, and regional economic and geopolitical conditions;
•the impact of war, crime, actual or threatened terrorist activity and heightened travel security measures instituted in response to war, terrorist activity or threats (including Travel Advisories issued by the U.S. Department of State) and civil unrest;
25
•
•the impact of any economic or political instability in Mexico due to unsettled political conditions, including civil unrest, widespread criminal activity, acts of terrorism, force majeure, war or other armed conflict, strikes and governmental actions;
•the desirability of particular locations and changes in travel patterns;
•the occurrence of natural or man-made disasters, such as earthquakes, tsunamis, hurricanes, floods, and oil spills;
•events that may be beyond our control that could adversely affect the reputation of one or more of our resorts or that may disproportionately and adversely impact the reputation of our brands or resorts;
•taxes and government regulations that influence or determine wages, prices, interest rates, construction procedures, and costs;
•adverse effects of a downturn in the lodging industry, especially leisure travel and tourism spending;
•changes in interest rates and in the availability, cost and terms of debt financing;
•necessity for periodic capital reinvestment to maintain, repair, expand, renovate and reposition our resorts;
•the costs and administrative burdens associated with compliance with applicable laws and regulations, including, among others, those associated with privacy, marketing and sales, licensing, labor, employment, the environment, and the U.S. Department of the Treasury’s Office of Foreign Asset Control and the U.S. Foreign Corrupt Practices Act (“FCPA”); • |
the availability, cost and other terms of capital to allow us to fund investments in our portfolio and the acquisition of new resorts;
•regional, national and international development of competing resorts;
•increases in wages and other labor costs, energy, healthcare, insurance, transportation and fuel, and other expenses central to the conduct of our business or the cost of travel for our guests, including recent increases in energy costs and any resulting increase in travel costs or decrease in airline capacity;
•availability, cost and other terms of insurance;
•organized labor activities, which could cause the diversion of business from resorts involved in labor negotiations, loss of group business, and/or increased labor costs;
•currency exchange fluctuations;
•trademark or intellectual property infringement; and
•risks generally associated with the ownership of hotels, resorts and real estate, as we discuss in detail below.
Any one or more of these factors could limit or reduce the demand for our resorts or the prices our resorts are able to obtain or could increase our costs and therefore reduce the operating results of our resorts. Even where such factors do not reduce demand, resort-level profit margins may suffer if we are unable to fully recover increased operating costs from our guests. These factors could have a material adverse effect on us, including our business, financial condition, liquidity, results of operations and prospects.
The seasonality of the lodging industry could have a material adverse effect on us.
The lodging industry is seasonal in nature, which can be expected to cause quarterly fluctuations in our revenues. TheAlthough the trend has been disrupted in the last two years by the impacts of the COVID-19 pandemic, the seasonality of the lodging industry and the location of our resorts in Mexico and the Caribbean will generally result in the greatest demand for our resorts between mid-December and April of each year, yielding higher Occupancyoccupancy levels and package rates during this period. This seasonality in demand has resulted in predictable fluctuations in revenue, results of operations and liquidity, which are consistently higher during the first quarter of each year than in successive quarters. We can provide no assurances that these seasonal fluctuations will, in the future, be consistent with our historical experience or whether any shortfalls that occur as a result of these fluctuations will not have a material adverse effect on us.
The cyclical nature of the lodging industry may cause fluctuations in our operating performance, which could have a material adverse effect on us.
The lodging industry is highly cyclical in nature. Fluctuations in operating performance are caused largely by general economic and local market conditions, which subsequently affect levels of business and leisure travel. In addition to general economic conditions, new hotel and resort room supply is an important factor that can affect the lodging industry’s performance, and over-building has the potential to further exacerbate the negative impact of an economic recession. Room rates and Occupancy, and thus Net Package RevPAR (as defined in Part II, Item 7. Management's Discussion and Analysis of Financial Condition and Results of
26
Operations), tend to increase when demand growth exceeds supply growth. A decline in lodging demand, or increase in lodging supply, could result in returns that are substantially below expectations, or result in losses, which could have a material adverse effect on us, including our business, financial condition, liquidity, results of operations and prospects. Further, the costs of running a resort tend to be more fixed than variable. As a result, in an environment of declining revenue, the rate of decline in earnings is likely to be higher than the rate of decline in revenue.
The increasing use of Internet travel intermediaries by consumers could have a material adverse effect on us.
Some of our vacation packages are booked through Internet travel intermediaries, including, but not limited to, Travelocity.com, Expedia.com and Priceline.com. As these Internet bookings increase, these intermediaries may be able to obtain higher commissions, reduced room rates or other significant contract concessions from us. Moreover, some of these Internet travel intermediaries are attempting to offer lodging as a commodity, by increasing the importance of price and general indicators of quality, such as “three-star downtown hotel,” at the expense of brand identification or quality of product or service. If consumers develop loyalty to Internet reservations systems rather than to our booking system or the brands we own and operate, the value of our resorts could deteriorate and we could be materially and adversely affected, including our financial results.
Cyber risk and the failure to maintain the integrity of internal or guest data could harm our reputation and result in a loss of business and/or subject us to costs, fines, investigations, enforcement actions or lawsuits.
We, Hyatt, Hilton, Wyndham, our third-party resort manager and other third-party service providers collect, use and retain large volumes of guest data, including credit card numbers and other personally identifiable information, for business, marketing and other purposes in our, Hyatt’s, Hilton’s, Wyndham’s, our third-party resort manager'smanager’s and other third-party service providers'providers’ various information technology systems, which enter, process, summarize and report such data. We also maintain personally identifiable information about our employees. We, Hyatt, Hilton, Wyndham, our third-party resort manager and other third-party service providers store and process such internal and guest data both at on-site facilities and at third-party owned facilities including, for example, in a third-party hosted cloud environment. The integrity and protection of our guest, employee and company data, as well as the continuous operation of our, Hyatt’s, Hilton’s, Wyndham’s, our third-party resort manager'smanager’s and other third-party service providers'providers’ systems, is critical to our business. Our guests and employees expect that we will adequately protect their personal information. The regulations and contractual obligations applicable to security and privacy are increasingly demanding, both in the United States and in other jurisdictions where we operate, and cyber-criminals have been recently targeting the lodging industry. We continue to develop and enhance controls and security measures to protect against the risk of theft, loss or fraudulent or unlawful use of guest, employee or company data, and we maintain an ongoing process to re-evaluate the adequacy of our controls and measures.
Notwithstanding our efforts to protect against unauthorized access of our systems and sensitive information, because of the scope and complexity of their information technology structure, our reliance on third parties to support and protect our structure and data, and the constantly evolving cyber-threat landscape, our systems and those of third parties on which we rely are vulnerable to disruptions, failures, unauthorized access, cyber-terrorism, employee error, negligence, fraud or other misuse, and given the sophistication of hackers to gain unauthorized access to our sensitive information, we may not be able to detect the breach for long periods of time or at all. These or similar occurrences, whether accidental or intentional, could result in theft, unauthorized access or disclosure, loss, fraudulent or unlawful use of guest, employee or company data which could harm our reputation, result in an interruption or disruption of our services or result in a loss of business, as well as remedial and other costs, fines, investigations, enforcement actions, or lawsuits. As a result, future incidents could have a material adverse impact on us, including our business, our financial condition, liquidity and results of operations and prospects.
Information technology systems, software or website failures or interruptions could have a material adverse effect on our business or results of operations.
We rely on the uninterrupted and efficient operation of our information technology systems and software. Information technology is critical to our day-to-day operations, including, but not exclusive to guest check-in and check-out, housekeeping and room service, and reporting our financial results and the financial results of our resorts. We rely on certain third-party hardware, network and software vendors to maintain and upgrade many of our critical systems on an ongoing basis to support our business operations and to keep pace with technology developments in the hospitality industry. The software programs supporting many of our systems are
licensed to us by independent third-party software providers. An inability to continuously maintain and update our hardware and software programs or an inability for network providers to maintain their communications infrastructure would potentially disrupt or inhibit the efficiency of our operations if suitable alternatives could not be identified and implemented in a timely, efficient and cost-effective manner.
27
We may be subject to unknown or contingent liabilities related to our existing resorts and resorts that we acquire, which could have a material adverse effect on us.
Our existing resorts and resorts that we may in the future acquire may be subject to unknown or contingent liabilities for which we may have no recourse, or only limited recourse, against the sellers. In general, the representations and warranties provided under the transaction agreements related to our existing resorts and any future acquisitions of resorts by us may not survive the closing of the transactions. Furthermore, indemnification under such agreements may not exist or be limited and subject to various exceptions or materiality thresholds, a significant deductible or an aggregate cap on losses. As a result, there is no guarantee that we will recover any amounts with respect to losses due to breaches by the transferors or sellers of their representations and warranties or other prior actions by the sellers. In addition, the total amount of costs and expenses that may be incurred with respect to liabilities associated with these resorts may exceed our expectations, and we may experience other unanticipated adverse effects, all of which may materially and adversely affect us, including our business, financial condition, liquidity, results of operations and prospects.
We could be exposed to liabilities under the FCPA and other anti-corruption laws and regulations, including non-U.S. laws, any of which could have a material adverse impact on us.
We have international operations, and as a result are subject to compliance with various laws and regulations, including the FCPA and other anti-corruption laws in the jurisdictions in which we do business, which generally prohibit companies and their intermediaries or agents from engaging in bribery or making improper payments to foreign officials or their agents or other entities. The FCPA also requires companies to make and keep books and records and accounts which, in reasonable detail, reflect their transactions, including the disposition of their assets. We have implemented, and will continue to evaluate and improve, safeguards and policies designed to prevent violations of various anti-corruption laws that prohibit improper payments or offers of payments to foreign officials or their agents or other entities for the purpose of conducting business, and we are in the process of expanding our training program. The countries in which we own resorts have experienced governmental corruption to some degree and, in certain circumstances, compliance with anti-corruption laws may conflict with local customs and practices. Despite existing safeguards and any future improvements to our policies and training, we will be exposed to risks from deliberate, reckless or negligent acts committed by our employees or agents for which we might be held responsible. Failure to comply with these laws or our internal policies could lead to criminal and civil penalties and other legal and regulatory liabilities and require us to undertake remedial measures, any of
which could have a material adverse impact on us, including our business, financial condition, liquidity, results of operations and prospects.
Our existing resorts and resorts that we may acquire may contain or develop harmful mold that could lead to liability for adverse health effects and costs of remediating the problem, either of which could have a material adverse effect on us.
When excessive moisture accumulates in buildings or on building materials, mold growth may occur, particularly if the moisture problem remains undiscovered or is not addressed over a period of time. Some molds may produce airborne toxins or irritants. Concern about indoor exposure to mold has been increasing as exposure to mold may cause a variety of adverse health effects and symptoms, including allergic or other reactions. Some of the resorts in our portfolio or resorts that we may acquire may contain microbial matter, such as mold and mildew, which could require us to undertake a costly remediation program to contain or remove the mold from the affected resort. Furthermore, we can provide no assurances that we will be successful in identifying harmful mold and mildew at resorts that we seek to acquire, which could require us to take remedial action at acquired resorts. The presence of significant mold could expose us to liability from guests, employees and others if property damage or health concerns arise, which could have a material adverse effect on us, including our results of operations.
Illiquidity of real estate investments could significantly impede our ability to sell resorts or otherwise respond to adverse changes in the performance of our resorts, which could have a material adverse effect on us.
Because real estate investments are relatively illiquid, our ability to sell one or more resorts promptly for reasonable prices in response to changing economic, financial and investment conditions will be limited. The real estate market is affected by many factors beyond our control including:
that could impact the timing of a disposition, including adverse changes in international, national, regional and local economic and market conditions;
conditions, changes in interest and tax rates and in the availability and cost and other terms of debt financing;
financing, and changes in governmental laws and regulations, fiscal policies and zoning ordinances and the related costs of compliance with laws and regulations, fiscal policies and ordinances;
In addition, we may be required to expend funds to correct defects, terminate contracts or to make improvements before a resort can be sold. We can provide no assurances that we will have funds available, or access to such funds, to correct those defects or to make those improvements. In acquiring a resort, we may agree to lock-out provisions or tax protection agreements that materially restrict us from selling that property for a period of time or impose other restrictions, such as a limitation on the amount of debt that can be placed or repaid on that property. These factors and any others that would impede our ability to respond to adverse changes in the performance of our resorts or a need for liquidity could materially and adversely affect us, including our financial results.
28
We could incur significant costs related to government regulation and litigation with respect to environmental matters, which could have a material adverse effect on us.
Our resorts are subject to various international, national, regional and local environmental laws that impose liability for contamination. Under these laws, governmental entities have the authority to require us, as the current owner of property, to perform or pay for the clean-up of contamination (including hazardous substances, waste, or petroleum products) at, on, under or emanating from our property and to pay for natural resource damages arising from such contamination. Such laws often impose liability without regard to whether the owner or operator or other responsible party knew of, or caused, such contamination, and the liability may be
joint and several. Because these laws also impose liability on persons who owned a property at the time it was or became contaminated, it is possible we could incur cleanup costs or other environmental liabilities even after we sell resorts. Contamination at, on, under or emanating from our resorts also may expose us to liability to private parties for costs of remediation and/or personal injury or property damage. In addition, environmental laws may create liens on contaminated sites in favor of the government for damages and costs it incurs to address such contamination. If contamination is discovered on our resorts, environmental laws also may impose restrictions on the manner in which our property may be used or our business may be operated, and these restrictions may require substantial expenditures. Moreover, environmental contamination can affect the value of a property and, therefore, an owner’s ability to borrow funds using the property as collateral or to sell the property on favorable terms or at all. Furthermore, persons who sent waste to a waste disposal facility, such as a landfill or an incinerator, may be liable for costs associated with cleanup of that facility.
In addition, our resorts are subject to various international, national, regional and local environmental, health and safety regulatory requirements that address a wide variety of issues. Some of our resorts routinely handle and use hazardous or regulated substances and wastes as part of their operations, which are subject to regulation (e.g., swimming pool chemicals). Our resorts incur costs to comply with these environmental, health and safety laws and regulations and could be subject to fines and penalties for non-compliance with applicable laws.
Liabilities and costs associated with contamination at, on, under or emanating from our properties, defending against claims, or complying with environmental, health and safety laws could be significant and could have a material adverse effect on us, including our business, financial condition, liquidity, results of operations and prospects. We can provide no assurances that (i) changes in current laws or regulations or future laws or regulations will not impose additional or new material environmental liabilities or (ii) the current environmental condition of our resorts will not be affected by our operations, by the condition of the resorts in the vicinity of our resorts, or by third parties unrelated to us. The discovery of material environmental liabilities at our resorts could subject us to unanticipated significant costs, which could result in significant losses. Please see “Risk Factors — Risks Related to Our Business — We may become subject to disputes or legal, regulatory or other proceedings that could involve significant expenditures by us, which could have a material adverse effect on us” as to the possibility of disputes or legal, regulatory or other proceedings that could adversely affect us.
The tax laws, rules and regulations (or interpretations thereof) in the jurisdictions in which we operate may change, which could have a material adverse effect on us.
We generally seek to structure our business activities in the jurisdictions in which we operate in a manner that is tax-efficient, taking into account the relevant tax laws, rules and regulations. However, tax laws, rules and regulations in these jurisdictions are complex and are subject to change as well as subject to interpretation by local tax authorities and courts. There can be no assurance that these tax laws, rules and regulations (or interpretations thereof) will not change, possibly with retroactive effect, or that local tax authorities may not otherwise successfully assert positions contrary to those taken by us. In any such case, we may be required to operate in a less tax-efficient manner, incur costs and expenses to restructure our operations and/or owe past taxes (and potentially interest and penalties), which in each case could negatively impact our operations. For example, we will need to renegotiate our agreements which determine our taxes in the Dominican Republic, known as advanced pricing agreements, with The Ministry of Finance of the Dominican Republic at the end of 2020 when our current agreements expire.
In October 2021, the OECD released an outline that describes the conceptual agreement between 136 countries on fundamental reforms to international tax rules. The OECD outline suggests that these reforms be implemented by 2023, but implementation is contingent upon the independent actions of participating countries to enact law changes. If enacted into law, in whole or in part, this proposed change to international tax rules could have a negative impact to our effective tax rate. The outline provides for two primary “Pillars”, however only Pillar Two, which provides for a global minimum corporate tax rate of 15%, is expected to be applicable to us. Pillar One is not expected to be applicable as Playa does not expect to meet the €20 billion turnover threshold in the foreseeable future.
Increases in property taxes would increase our operating costs, which could have a material adverse effect on us.
Each of our resorts is subject to real estate and personal property taxes, especially upon any development, redevelopment, rebranding, repositioning and renovation. These taxes may increase as tax rates change and as our resorts are assessed or reassessed by
29
taxing authorities. If property taxes increase, we would incur a corresponding increase in our operating expenses, which could have a material adverse effect on us, including our business, financial condition, liquidity, results of operations and prospects.
Risks Related to Ownership of Our Ordinary Shares
The rights of our shareholders and the duties of our directors are governed by Dutch law, our Articles of Association and internal rules and policies adopted by our board of directors (the “Board”), and differ in some important respects from the rights of shareholders and the duties of members of a board of directors of a U.S. corporation.
Our corporate affairs, as a Dutch public limited liability company (naamloze vennootschap), are governed by our Articles of Association, internal rules and policies adopted by our Board and by the laws governing companies incorporated in the Netherlands. The rights of our shareholders and the duties of our directors under Dutch law are different from the rights of shareholders and/or the duties of directors of a corporation organized under the laws of U.S. jurisdictions. In the performance of its duties, our Board is required by Dutch law to consider our interests and the interests of our shareholders, our employees and other stakeholders (e.g., our
creditors, guests and suppliers) as a whole and not only those of our shareholders, which may negatively affect the value of your investment.
In addition, the rights of our shareholders, including for example the rights of shareholders as they relate to the exercise of shareholder rights, are governed by Dutch law and our Articles of Association and such rights differ from the rights of shareholders under U.S. law. For example, if we engaged in a merger, Dutch law would not grant appraisal rights to any of our shareholders who wished to challenge the consideration to be paid to them upon such merger (without prejudice, however, to certain cash exit rights offered under Dutch law in certain circumstances).
We are organized and existing under the laws of the Netherlands, and, as such, the rights of our shareholders and the civil liability of our directors and executive officers are governed in certain respects by the laws of the Netherlands.
We are organized and existing under the laws of the Netherlands, and, as such, the rights of our shareholders and the civil liability of our directors and executive officers are governed in certain respects by the laws of the Netherlands. The ability of our shareholders in certain countries other than the Netherlands to bring an action against us, our directors and executive officers may be limited under applicable law. In addition, substantially all of our assets are located outside the United States. As a result, it may not be possible for shareholders to effect service of process within the United States upon us or our directors and executive officers or to enforce judgments against us or them in U.S. courts, including judgments predicated upon the civil liability provisions of the federal securities laws of the United States. In addition, it is not clear whether a Dutch court would impose civil liability on us or any of our directors and executive officers in an original action based solely upon the federal securities laws of the United States brought in a court of competent jurisdiction in the Netherlands.
As of the date of this annual report, there is no treaty in effect between the United States and the Netherlands providing for the reciprocal recognition and enforcement of judgments, other than arbitration awards, in civil and commercial matters. With respect to choice of court agreements in civil or commercial matters, it is noted that the Hague Convention on Choice of Court Agreements entered into force for the Netherlands, but has not entered into force for the United States. Accordingly, a judgment rendered by a court in the United States, whether or not predicated solely upon U.S. securities laws, would not automatically be recognized and enforced by the competent Dutch courts. However, if a person has obtained a judgment for the payment of money rendered by a court in the United States and files a claim with the competent Dutch court, the Dutch court will in principle give binding effect to a foreign judgment if (i) the jurisdiction of the foreign court was based on a ground of jurisdiction that is generally acceptable according to international standards, (ii) the judgment by the foreign court was rendered in legal proceedings that comply with the Dutch standards of proper administration of justice including sufficient safeguards (behoorlijke rechtspleging) and, (iii) binding effect of such foreign judgment is not contrary to Dutch public order and (iv) the judgment by the foreign court is not incompatible with a decision rendered between the same parties by a Dutch court, or with a previous decision rendered between the same parties by a foreign court in a dispute that concerns the same subject and is based on the same cause, provided that the previous decision qualifies for acknowledgment in the Netherlands. Even if such a foreign judgment is giving binding effect, a claim based thereon may, however, still be rejected if the foreign judgment is not or no longer formally enforceable.
Based on the lack of a treaty as described above, U.S. investors may not be able to enforce against us or our directors, representatives or certain experts named herein who are residents of the Netherlands or countries other than the United States any judgments obtained in U.S. courts in civil and commercial matters, including judgments under the U.S. federal securities laws.
Under our Articles of Association, and certain other contractual arrangements between us and our directors, we indemnify and hold our directors harmless against all claims and suits brought against them, subject to limited exceptions. There is doubt, however, as to whether U.S. courts would enforce such indemnity provisions in an action brought against one of our directors in the United States under U.S. securities laws.
30
Sagicor and Hyatt ownowns a significant portionnumber of our ordinary shares and havehas representation on our Board. Any of these investorsBoard, and may have interests that differ from those of our other shareholders.
As of DecemberJanuary 31, 2019, 23.2%2022, approximately 7.5% of our outstanding ordinary shares were beneficially owned by Cabana Investors B.V.Sagicor Financial Corporation Limited and Playa Four Pack, L.L.C. (collectively, “Cabana”), each of which is an affiliate of Farallon Capital Management, L.L.C. (“Farallon”). In addition, two ofits designated director on our directors were designated by Cabana. As of December 31, 2019, 15.1% of our outstanding ordinary shares were beneficially owned by Jamziv Mobay Jamaica Limited (“Jamziv”), which is owned by JCSD Trustee Services Limited (“JCSD”) and X Fund Properties (“XFUND”), both affiliates of Sagicor. Two of our directors have been designated by JCSD and XFUND. As of December 31, 2019, 9.2% of our outstanding ordinary shares were beneficially owned by HI Holdings Playa B.V. (“HI Holdings Playa”), an affiliate of Hyatt. In addition, one of our directors was designated by HI Holdings Playa and is currently an employee of Hyatt. As of December 31, 2019, 6.7% of our outstanding ordinary shares were beneficially owned by TPG Pace Sponsor, LLC (“Pace Sponsor”), an affiliate of TPG Global, LLC. In addition, three of our directors were designated by Pace Sponsor.
Board. As a result, these shareholders, individually or collectively,Sagicor may be able to significantly influence the outcome of matters submitted for director action, subject to our directors’ obligation to act in the interest of all of our stakeholders, and for shareholder action, including the designation and appointment of our Board (and committees thereof) and approval of significant corporate transactions, including business combinations, consolidations and mergers. So long as these shareholdersthis shareholder and/or theirits affiliates continue to directly or indirectly own a significant amount of our outstanding equity interests and have the right to designate members of our Board and/or one or more committees thereof, these shareholdersthis shareholder may be able to exert substantial influence on us and may be able to exercise its influence in a manner that is not in the interests of our other stakeholders. These shareholders'This shareholder’s influence over our management could have the effect of delaying, deferring or preventing a change in control or otherwise discouraging a potential acquirer from attempting to obtain control of us, which could cause the market price of our ordinary shares to decline or prevent our shareholders from realizing a premium over the market price for our ordinary shares. Prospective investors in our ordinary shares should consider that the interests of these shareholdersthis shareholder may differ from their interests in material respects.
Provisions of our Articles of Association or Dutch corporate law might deter or discourage acquisition bids for us that shareholders might consider to be favorable and prevent or frustrate any attempt to replace or remove our Board at the time of such acquisition bid.
Certain provisions of our Articles of Association may make it more difficult for a third party to acquire control of us or effect a change in our Board. These provisions include:
•A provision that our directors are appointed by our General Meeting at the binding nomination of our Board. Such binding nomination may only be overruled by the General Meeting by a resolution adopted by at least a majority of the votes cast, if such votes represent more than 50% of our issued share capital.
•A provision that our shareholders at a General Meeting may suspend or remove directors at any time. A resolution of our General Meeting to suspend or remove a director may be passed by a majority of the votes cast, provided that the resolution is based on a proposal by our Board. In the absence of a proposal by our Board, a resolution of our General Meeting to suspend or remove a director shall require a vote of at least a majority of the votes cast, if such votes represent more than 50% of our issued share capital.
•A requirement that certain actions can only be taken by the General Meeting with at least two-thirds of the votes cast, unless such resolution is passed at the proposal by our Board, including an amendment of our Articles of Association, the issuance of shares or the granting of rights to subscribe for shares, the limitation or exclusion of preemptive rights, the reduction of our issued share capital, the application for bankruptcy, the making of a distribution from our profits or reserves on our ordinary shares, the making of a distribution in the form of shares in our capital or in the form of assets, instead of cash, the entering into of a merger or demerger, our dissolution and the designation or granting of authorizations such as the authorization to issue shares and to limit or exclude preemptive rights. Our General Meeting adopted a resolution to grant such authorizations to our Board.
•A provision prohibiting (a) a “Brand Owner” (which generally means a franchisor, licensor or owner of a hotel concept or brand that has at least 12 all-inclusive resorts and that competes with any Hyatt All-Inclusive Resort Brand resort) from acquiring our ordinary shares such that the Brand Owner (together with its affiliates) acquires beneficial ownership in excess of 15% of our outstanding shares, or (b) a “Restricted Brand Company” from acquiring our ordinary shares such that the Restricted Brand Company (together with its affiliates) acquires beneficial ownership in excess of 5% of our outstanding ordinary shares. Upon becoming aware of either share cap being exceeded, we will send a notice to such shareholder informing such shareholder of a violation of this provision and granting the shareholder two weeks to dispose of such excess ordinary shares to an unaffiliated third party. Such notice will immediately trigger the transfer obligation and suspend the right to attend our General Meeting and voting rights (together, “Shareholder Rights”) of the shares exceeding the cap. If such excess shares are not disposed by such time, (i) the Shareholder Rights on all shares held by the shareholder exceeding the share cap will be suspended until the transfer obligations have been complied with, (ii) we will be irrevocably authorized under our Articles of Association to transfer the excess shares to a foundation until sold to an unaffiliated third party and (iii) such foundation shall issue depositary receipts for the ordinary shares concerned to the relevant Brand Owner or Restricted Brand Company for as long as those ordinary shares are held by the foundation.
Such provisions could discourage a takeover attempt and impair the ability of shareholders to benefit from a change in control and realize any potential change of control premium. This may adversely affect the market price of the ordinary shares.
31
Our General Meeting has authorized our Board to issue and grant rights to subscribe for our ordinary shares, up to the amount of the authorized share capital (from time to time) and limit or exclude preemptive rights on those shares, in each case for a period of five
years from the date of the resolution. Accordingly, an issue of our ordinary shares may make it more difficult for a shareholder or potential acquirer to obtain control over our General Meeting or us.
Moreover, our Board can invoke a cooling-off period of up to 250 days in the event of certain unsolicited takeover offers and shareholder activism. During a cooling-off period, our General Meeting would not be able to dismiss, suspend or appoint members of the Board (or amend the provisions in our Articles of Association dealing with those matters) except at the proposal of our Board.
Provisions of our franchise agreements with Hyatt might deter acquisition bids for us that shareholders might consider to be favorable and/or give Hyatt the right to terminate such agreements if certain persons obtain and retain more than a specified percentage of our ordinary shares.
Certain provisions of our franchise agreements with Hyatt may make it more difficult for certain third parties to acquire more than a specified percentage of issued ordinary shares. Our franchise agreements with Hyatt and our Articles of Association both contain a provision prohibiting (a) a Brand Owner from acquiring issued ordinary shares such that the Brand Owner (together with its affiliates) acquires beneficial ownership in excess of 15% of issued and outstanding ordinary shares, and (b) a Restricted Brand Company from acquiring issued ordinary shares such that the Restricted Brand Company (together with its affiliates) acquires beneficial ownership in excess of 5% of issued and outstanding ordinary shares. Upon becoming aware of either share cap being exceeded, we must send a notice to such shareholder informing such shareholder of a violation of this provision and granting the shareholder two weeks to dispose of such excess ordinary shares to an unaffiliated third party. Such notice will immediately trigger the transfer obligation and suspend the Shareholder Rights of ordinary shares exceeding the share cap. If such excess ordinary shares are not disposed by such time, (i) the Shareholder Rights on all ordinary shares held by the shareholder exceeding the share cap will be suspended until the transfer obligations have been complied with and (ii) we will be irrevocably authorized under our Articles of Association to transfer the excess ordinary shares to a foundation until sold to an unaffiliated third party. Our franchise agreements provide that, if the excess ordinary shares are not transferred to a foundation or an unaffiliated third party within 30 days following the earlier of the date on which a public filing is made with respect to either share cap being exceeded and the date we become aware of either share cap being exceeded, Hyatt will have the right to terminate all (but not less than all) of its franchise agreements with us by providing the notice specified in the franchise agreement to us and we will be subject to liquidated damage payments to Hyatt. In the event that any Brand Owner or Restricted Brand Company acquires any ownership interest in us, we will be required to establish and maintain controls to protect the confidentiality of certain Hyatt information and will provide Hyatt with a detailed description and evidence of such controls.
Future issuances of debt securities and equity securities may adversely affect us, including the market price of our ordinary shares and may be dilutive to existing shareholders.
In the future, we may incur debt or issue equity ranking senior to our ordinary shares. Those securities will generally have priority upon liquidation. Such securities also may be governed by an indenture or other instrument containing covenants restricting its operating flexibility. Additionally, any convertible or exchangeable securities that we issue in the future may have rights, preferences and privileges more favorable than those of our ordinary shares. We may also issue ordinary shares in a public or private offering at prices below the current market price of the ordinary shares. Because our decision to issue debt or equity in the future will depend on market conditions and other factors beyond our control, we cannot predict or estimate the amount, timing, nature or success of our future capital raising efforts. As a result, future capital raising efforts may reduce the market price of our ordinary shares and be dilutive to existing shareholders.
Our shareholders may not have any preemptive rights in respect of future issuances of our ordinary shares.
In the event of an increase in our share capital, our ordinary shareholders are generally entitled under Dutch law to full preemptive rights, unless these rights are limited or excluded either by a resolution of the General Meeting or by a resolution of our Board (if our Board has been authorized by the General Meeting for this purpose), or where shares are issued to our employees or a group company (i.e., certain affiliates, subsidiaries or related companies) or where shares are issued against a non-cash contribution, or in case of an exercise of a previously acquired right to subscribe for shares. The same preemptive rights apply when rights to subscribe for shares are granted.
Preemptive rights may be excluded by our Board on the basis of the irrevocable authorization of the General Meeting to our Board for a period of five years from the date of this authorization with respect to the issue of our ordinary shares up to the amount of the authorized share capital (from time to time). The General Meeting has delegated the authority to issue our ordinary shares and grant rights to purchase our ordinary shares up to the amount of our authorized share capital (from time to time) to our Board for that same period.
32
Accordingly, holders of our ordinary shares may not have any preemptive rights in connection with, and may be diluted by an issue of our ordinary shares and it may be more difficult for a shareholder to obtain control over our General Meeting. Certain of our shareholders outside the Netherlands, in particular, U.S. shareholders, may not be allowed to exercise preemptive rights to which they are entitled, if any, unless a registration statement under the Securities Act of 1933, as amended (the “Securities Act”), is declared effective with respect to our ordinary shares issuable upon exercise of such rights or an exemption from the registration requirements is available.
We are not obligated to and do not comply with all the best practice provisions of the Dutch Corporate Governance Code (the “DCGC”). This could adversely affect your rights as a shareholder.
As we are incorporated under Dutch law and our ordinary shares have been listed on a government-recognized stock exchange (i.e., the NASDAQ)Nasdaq), we are subject to the DCGC. The DCGC contains both principles and best practice provisions for our Board, shareholders and the General Meeting, financial reporting, auditors, disclosure compliance and enforcement standards.
The DCGC is based on a “comply or explain” principle. Accordingly, we are required to disclose in our annual management report publicly filed in the Netherlands, whether or not we are complying with the various provisions of the DCGC. If we do not comply with one or more of those provisions (e.g., because of a conflicting NASDAQNasdaq requirement or U.S. market practice), we are required to explain the reasons for such non-compliance in our annual management report.
We acknowledge the importance of good corporate governance. However, we do not comply with all the provisions of the DCGC, to a large extent because such provisions conflict with or are inconsistent with the corporate governance rules of the NASDAQNasdaq and U.S. securities laws that apply to us, or because we believe such provisions do not reflect customary practices of global companies listed on the NASDAQ.Nasdaq. This could adversely affect your rights as a shareholder and you may not have the same level of protection as a shareholder in a Dutch company that fully complies with the DCGC.
If, based on Mexican law, the accounting value of our ordinary shares is derived more than 50% from property in Mexico, it could result in the imposition of tax on a selling shareholder who is not eligible to claim benefits under the income tax treaty between Mexico and the United States or under any other favorable income tax treaty with Mexico.
According to article 161 of the Income Tax Law of Mexico, the transfer by a nonresident of Mexico of shares in an entity where the accounting value of the transferred shares is derived, directly or indirectly, from more than 50% from immovable property located in Mexico could be subject to Mexican income tax. The applicable Mexican law does not provide for the method to be followed in making this calculation. The income tax rate in Mexico for the disposal of shares by nonresidents is currently either 25% of the gross sale proceeds or, if certain conditions are met, 35% of the net gain. Withholding of 25% of gross sale proceeds is required of the buyer only if the latter is a Mexican resident. A Mexican nonresident subject to tax under article 161 may be eligible to claim exemption from taxation or a reduced tax rate under an applicable income tax treaty with Mexico, such as the income tax treaty between Mexico and the United States. A determination of whether the accounting value of our ordinary shares is derived, directly or indirectly, more than 50% from immovable property located in Mexico is subject to interpretations of the applicable law and will be affected by various factors with regard to us that may change over time. If, at the time of a transfer of our ordinary shares, the accounting value of our ordinary shares is derived, directly or indirectly, from more than 50% from immovable property located in Mexico and article 161 were applied to such transfer, it could result in the imposition of the above-mentioned tax on a selling shareholder who is not eligible to claim benefits under the income tax treaty between Mexico and the United States or under any other favorable income tax treaty with Mexico.
Item 1B. Unresolved Staff Comments.
None.
33
Item 2. Properties.
As of December 31, 2019,2021, the following table presents an overview of our resorts and is organized by our four geographic business segments: the Yucatán Peninsula, the Pacific Coast, the Dominican Republic and Jamaica.
Name of Resort | Location | Brand and Type | Operator | Year Built; Significant Renovations | Rooms | |||||
| Owned Resorts | ||||||||||
| Yucatán Peninsula | ||||||||||
| Hyatt Ziva Cancún | Cancún, Mexico | Hyatt Ziva (all ages) | Playa | 1975; 1980; 1986; 2002; 2015 | 547 | |||||
| Hyatt Zilara Cancún | Cancún, Mexico | Hyatt Zilara (adults-only) | Playa | 2006; 2009; 2013; 2017 | 310 | |||||
| Panama Jack Resorts Cancún | Cancún, Mexico | Panama Jack (all ages) | Playa | 1985; 2009; 2017 | 458 | |||||
Hilton Playa del Carmen All-Inclusive Resort(1) | Playa del Carmen, Mexico | Hilton (adults-only) | Playa | 2002; 2009; 2019 | 524 | |||||
| Panama Jack Resorts Playa del Carmen | Playa del Carmen, Mexico | Panama Jack (all ages) | Playa | 1996; 2006; 2012; 2017 | 287 | |||||
| Secrets Capri | Riviera Maya, Mexico | Secrets (adults-only) | AMResorts | 2003 | 291 | |||||
| Dreams Puerto Aventuras | Riviera Maya, Mexico | Dreams (all ages) | AMResorts | 1991; 2009 | 305 | |||||
| Pacific Coast | ||||||||||
| Hyatt Ziva Los Cabos | Cabo San Lucas, Mexico | Hyatt Ziva (all ages) | Playa | 2007; 2009; 2015 | 591 | |||||
| Hyatt Ziva Puerto Vallarta | Puerto Vallarta, Mexico | Hyatt Ziva (all ages) | Playa | 1969; 1990; 2002; 2009; 2014; 2017 | 335 | |||||
| Dominican Republic | ||||||||||
Hilton La Romana All-Inclusive Resort(2) | La Romana, Dominican Republic | Hilton (adults-only) | Playa(2) | 1997; 2008; 2019 | 356 | |||||
Hilton La Romana All-Inclusive Resort(2) | La Romana, Dominican Republic | Hilton (all ages) | Playa(2) | 1997; 2008; 2019 | 418 | |||||
| Dreams Palm Beach | Punta Cana, Dominican Republic | Dreams (all ages) | AMResorts | 1994; 2008 | 500 | |||||
| Dreams Punta Cana | Punta Cana, Dominican Republic | Dreams (all ages) | AMResorts | 2004 | 620 | |||||
| Hyatt Ziva Cap Cana | Cap Cana, Dominican Republic | Hyatt Ziva (all ages) | Playa | 2019 | 375 | |||||
| Hyatt Zilara Cap Cana | Cap Cana, Dominican Republic | Hyatt Zilara (adults-only) | Playa | 2019 | 375 | |||||
| Jamaica | ||||||||||
| Hyatt Ziva Rose Hall | Montego Bay, Jamaica | Hyatt Ziva (all ages) | Playa | 2000; 2014; 2017 | 276 | |||||
| Hyatt Zilara Rose Hall | Montego Bay, Jamaica | Hyatt Zilara (adults-only) | Playa | 2000; 2014; 2017 | 344 | |||||
| Hilton Rose Hall Resort & Spa | Montego Bay, Jamaica | Hilton (all ages) | Playa | 1974; 2008; 2017 | 495 | |||||
| Jewel Runaway Bay Beach Resort & Waterpark | Runaway Bay, Jamaica | Jewel (all ages) | Playa | 1960; 1961; 1965; 2007; 2012 | 268 | |||||
| Jewel Dunn’s River Beach Resort & Spa | Ocho Rios, Jamaica | Jewel (adults-only) | Playa | 1957; 1970; 1980; 2010 | 250 | |||||
| Jewel Paradise Cove Beach Resort & Spa | Runaway Bay, Jamaica | Jewel (adults-only) | Playa | 2013 | 225 | |||||
Jewel Grande Montego Bay Resort & Spa(3) | Montego Bay, Jamaica | Jewel (all ages) | Playa | 2016; 2017 | 88 | |||||
| Total Rooms Owned | 8,238 | |||||||||
| Managed Resorts | ||||||||||
Sanctuary Cap Cana(4) | Punta Cana, Dominican Republic | Sanctuary (adults-only) | Playa | 2008; 2015; 2018 | 323 | |||||
Jewel Grande Montego Bay Resort & Spa(3) | Montego Bay, Jamaica | Jewel (condo-hotel) | Playa | 2016; 2017 | 129 | |||||
| Total Rooms Operated | 452 | |||||||||
| Total Rooms Owned and Operated | 8,690 | |||||||||
Name of Resort | Location | Brand and Type | Operator | Year Built; Significant Renovations | Rooms | |||||||||||||||||||||||||||
| Owned Resorts | ||||||||||||||||||||||||||||||||
| Yucatán Peninsula | ||||||||||||||||||||||||||||||||
| Hyatt Ziva Cancún | Cancún, Mexico | Hyatt Ziva (all ages) | Playa | 1975; 1980; 1986; 2002; 2015 | 547 | |||||||||||||||||||||||||||
| Hyatt Zilara Cancún | Cancún, Mexico | Hyatt Zilara (adults-only) | Playa | 2006; 2009; 2013; 2017 | 310 | |||||||||||||||||||||||||||
| Wyndham Alltra Cancún | Cancún, Mexico | Wyndham (all ages) | Playa | 1985; 2009; 2017 | 458 | |||||||||||||||||||||||||||
| Hilton Playa del Carmen All-Inclusive Resort | Playa del Carmen, Mexico | Hilton (adults-only) | Playa | 2002; 2009; 2019 | 524 | |||||||||||||||||||||||||||
| Wyndham Alltra Playa del Carmen | Playa del Carmen, Mexico | Wyndham (adults-only) | Playa | 1996; 2006; 2012; 2017 | 287 | |||||||||||||||||||||||||||
| Pacific Coast | ||||||||||||||||||||||||||||||||
| Hyatt Ziva Los Cabos | Cabo San Lucas, Mexico | Hyatt Ziva (all ages) | Playa | 2007; 2009; 2015 | 591 | |||||||||||||||||||||||||||
| Hyatt Ziva Puerto Vallarta | Puerto Vallarta, Mexico | Hyatt Ziva (all ages) | Playa | 1969; 1990; 2002; 2009; 2014; 2017 | 335 | |||||||||||||||||||||||||||
| Dominican Republic | ||||||||||||||||||||||||||||||||
| Hilton La Romana All-Inclusive Resort | La Romana, Dominican Republic | Hilton (adults-only) | Playa | 1997; 2008; 2019 | 356 | |||||||||||||||||||||||||||
| Hilton La Romana All-Inclusive Resort | La Romana, Dominican Republic | Hilton (all ages) | Playa | 1997; 2008; 2019 | 418 | |||||||||||||||||||||||||||
| Dreams Palm Beach | Punta Cana, Dominican Republic | Dreams (all ages) | AMResorts | 1994; 2008 | 500 | |||||||||||||||||||||||||||
| Dreams Punta Cana | Punta Cana, Dominican Republic | Dreams (all ages) | AMResorts | 2004 | 620 | |||||||||||||||||||||||||||
| Hyatt Ziva Cap Cana | Cap Cana, Dominican Republic | Hyatt Ziva (all ages) | Playa | 2019 | 375 | |||||||||||||||||||||||||||
| Hyatt Zilara Cap Cana | Cap Cana, Dominican Republic | Hyatt Zilara (adults-only) | Playa | 2019 | 375 | |||||||||||||||||||||||||||
| Jamaica | ||||||||||||||||||||||||||||||||
| Hyatt Ziva Rose Hall | Montego Bay, Jamaica | Hyatt Ziva (all ages) | Playa | 2000; 2014; 2017 | 276 | |||||||||||||||||||||||||||
| Hyatt Zilara Rose Hall | Montego Bay, Jamaica | Hyatt Zilara (adults-only) | Playa | 2000; 2014; 2017 | 344 | |||||||||||||||||||||||||||
| Hilton Rose Hall Resort & Spa | Montego Bay, Jamaica | Hilton (all ages) | Playa | 1974; 2008; 2017 | 495 | |||||||||||||||||||||||||||
| Jewel Paradise Cove Beach Resort & Spa | Runaway Bay, Jamaica | Jewel (adults-only) | Playa | 2013 | 225 | |||||||||||||||||||||||||||
Jewel Grande Montego Bay Resort & Spa(1) | Montego Bay, Jamaica | Jewel (all ages) | Playa | 2016; 2017 | 88 | |||||||||||||||||||||||||||
| Total Rooms Owned | 7,124 | |||||||||||||||||||||||||||||||
Managed Resorts (2) | ||||||||||||||||||||||||||||||||
| Sanctuary Cap Cana | Punta Cana, Dominican Republic | Sanctuary (adults-only) | Playa | 2008; 2015; 2018 | 324 | |||||||||||||||||||||||||||
| Jewel Grande Montego Bay Resort & Spa | Montego Bay, Jamaica | Jewel (condo-hotel) | Playa | 2016; 2017 | 129 | |||||||||||||||||||||||||||
| The Yucatán Playa Del Carmen All-Inclusive Resort | Playa del Carmen, Mexico | Tapestry Collection by Hilton (adults-only) | Playa | 2012 | 60 | |||||||||||||||||||||||||||
Hyatt Ziva Riviera Cancún(3) | Riviera Maya, Mexico | Hyatt Ziva (all ages) | Playa | 2008, 2021 | 438 | |||||||||||||||||||||||||||
Hyatt Zilara Riviera Maya(4) | Riviera Maya, Mexico | Hyatt Zilara (adults-only) | Playa | 2003 | 291 | |||||||||||||||||||||||||||
| Total Rooms Operated | 1,242 | |||||||||||||||||||||||||||||||
| Total Rooms Owned and Operated | 8,366 | |||||||||||||||||||||||||||||||
(1) Effective November 20, 2018, this resort was rebranded into Hilton all-inclusive resorts. Renovations were completed in 2019.
(4) We entered into a management agreement to operate this resort during the first quarter of 2021. The resort is currently closed for renovations but is expected to open in the first half of 2022.
34
Item 3. Legal Proceedings.
Item 4. Mine Safety Disclosures.
Not Applicable.
PART II
Item 5. Market for Registrant’s Common Equity, Related Stockholder Matters and Issuer Purchases of Equity Securities.
Our ordinary shares have been traded on NASDAQNasdaq under the symbol “PLYA” since March 13, 2017.
Shareholder Information
As of February 21, 2020,2022, we had 129,173,961165,778,067 ordinary shares outstanding that were held by approximately 3760 shareholders of record, which does not include Depository Trust Company participants, beneficial owners holding shares through nominee names or our employees holding restricted shares granted pursuant to our 2017 Omnibus Incentive Plan that have not vested.
Dividend Policy
We have never paid cash dividends on our ordinary shares and we do not anticipate paying cash dividends in the foreseeable future. In addition, payments of dividends are restricted by our Senior Secured Credit Facility. We currently intend to retain any earnings for future operations and expansion. Any future determination to pay dividends will be at the discretion of shareholders at a General Meeting, subject to a proposal from our Board, and will depend on our actual and projected financial condition, liquidity and results of operations, capital requirements, prohibitions and other restrictions contained in current or future financing instruments and applicable law, and such other factors as our Board deems relevant.
Performance Graph
The graph below compares the cumulative total return for our ordinary shares from March 13, 2017 through December 31, 20192021 with the comparable cumulative return of threetwo indices: the Dow Jones United States Travel and Leisure Index (“DOW JONES US TRAVEL & LEISURE”), the NASDAQ Composite Index (“NASDAQ”), and the Russell 2000 Index (“RUSSELL 2000”). The graph assumes $100 was invested on March 13, 2017 in our ordinary shares and the threetwo indices presented.
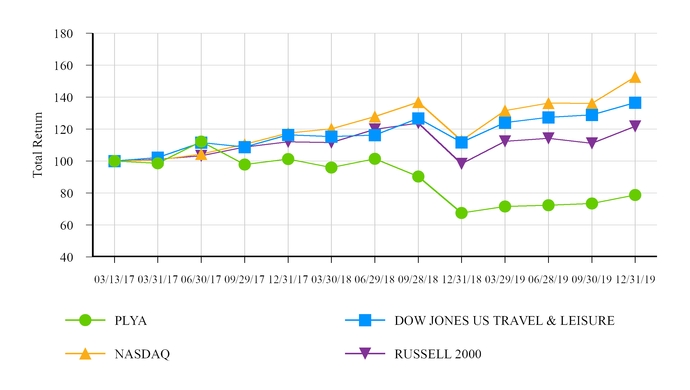
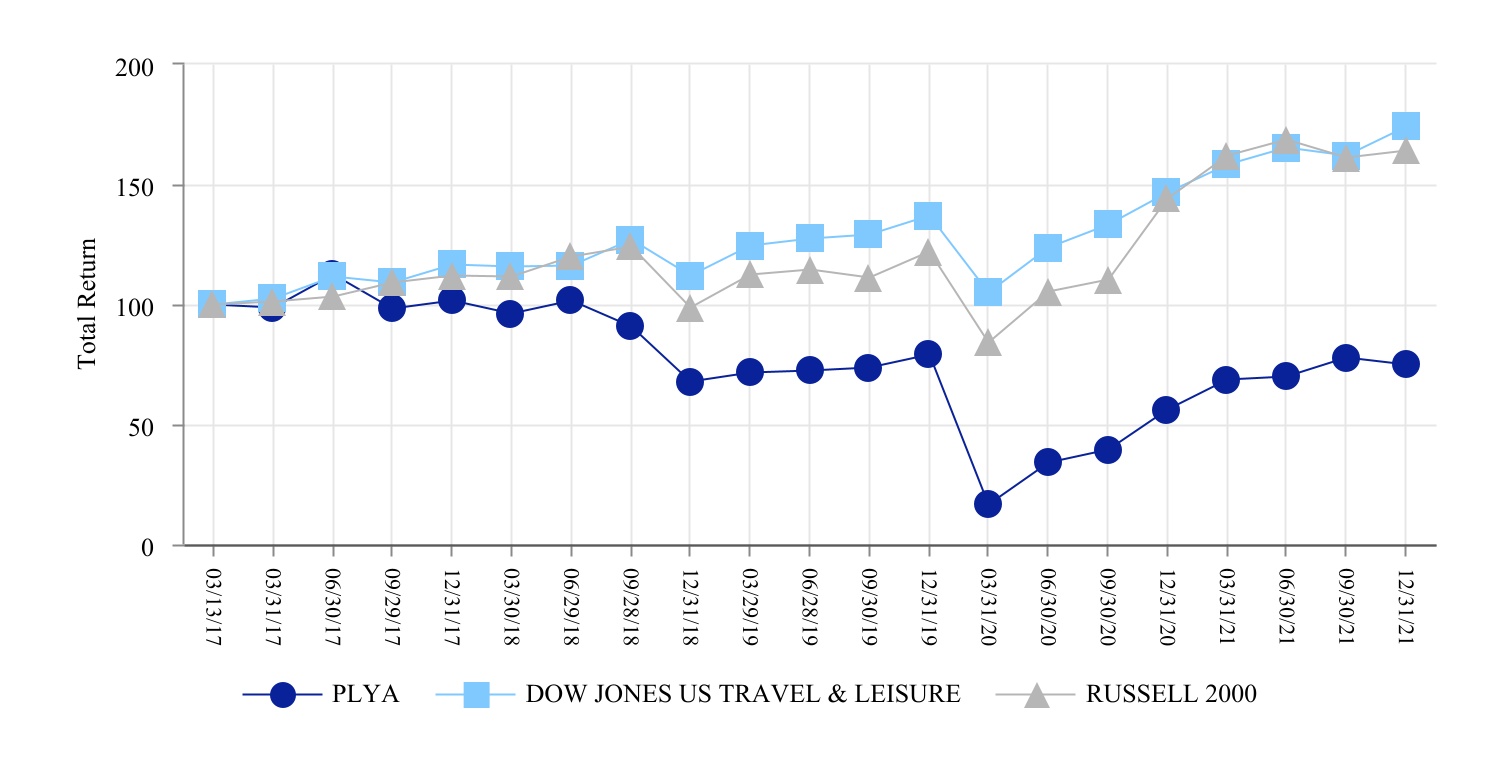
35
Unregistered Sales of Equity Securities and Use of Proceeds
None.
Issuer Purchases of Equity Securities
| Total number of shares purchased | Average price paid per share (1) | Total number of shares purchased as part of publicly announced program (2) | Maximum approximate dollar value of shares that may yet be purchased under the program ($ in thousands) (2) | |||||||||||
| October 1, 2019 to October 31, 2019 | 139,649 | $ | 7.74 | 139,649 | $ | 88,298 | ||||||||
| November 1, 2019 to November 30, 2019 | 184,119 | 7.47 | 184,119 | 86,923 | ||||||||||
| December 1, 2019 to December 31, 2019 | 118,535 | 7.85 | 118,535 | 85,992 | ||||||||||
| Total | 442,303 | $ | 7.66 | 442,303 | $ | 85,992 | ||||||||
Item 6. Selected Financial Data.Intentionally Omitted
| Year Ended December 31, | |||||||||||||||||||
| 2019 | 2018 (1) | 2017 | 2016 | 2015 | |||||||||||||||
| Total revenue | $ | 636,477 | $ | 617,013 | $ | 559,545 | $ | 521,491 | $ | 408,345 | |||||||||
| Operating income | $ | 25,710 | $ | 90,597 | $ | 88,669 | $ | 84,631 | $ | 58,692 | |||||||||
| Net (loss) income | $ | (4,357 | ) | $ | 18,977 | $ | (241 | ) | $ | 20,216 | $ | 9,711 | |||||||
| Net (loss) income available to ordinary shareholders | $ | (4,357 | ) | $ | 18,977 | $ | (9,042 | ) | $ | (23,460 | ) | $ | (29,946 | ) | |||||
(Losses) earnings per share - Basic (2) | $ | (0.03 | ) | $ | 0.16 | $ | (0.09 | ) | $ | (0.46 | ) | $ | (0.59 | ) | |||||
(Losses) earnings per share - Diluted (2) | $ | (0.03 | ) | $ | 0.16 | $ | (0.09 | ) | $ | (0.46 | ) | $ | (0.59 | ) | |||||
| Year Ended December 31, | |||||||||||||||||||
| 2019 | 2018 (1) | 2017 | 2016 | 2015 | |||||||||||||||
| Property and equipment, net | $ | 1,929,914 | $ | 1,808,412 | $ | 1,466,326 | $ | 1,400,317 | $ | 1,432,855 | |||||||||
| Cash and cash equivalents | $ | 20,931 | $ | 116,353 | $ | 117,229 | $ | 33,512 | $ | 35,460 | |||||||||
| Total assets | $ | 2,196,964 | $ | 2,135,158 | $ | 1,737,823 | $ | 1,590,890 | $ | 1,644,024 | |||||||||
| Total debt | $ | 1,040,658 | $ | 989,387 | $ | 898,215 | $ | 828,317 | $ | 828,438 | |||||||||
| Total liabilities | $ | 1,387,313 | $ | 1,295,317 | $ | 1,138,274 | $ | 1,074,336 | $ | 1,098,034 | |||||||||
| Cumulative redeemable preferred shares | $ | — | $ | — | $ | — | $ | 345,951 | $ | 352,275 | |||||||||
| Total equity (excluding preferred shares) | $ | 809,651 | $ | 839,841 | $ | 599,549 | $ | 170,603 | $ | 193,715 | |||||||||
| Year Ended December 31, | |||||||||||||||||||
| 2019 | 2018 (1) | 2017 | 2016 | 2015 | |||||||||||||||
| Net cash provided by (used in): | |||||||||||||||||||
| Operating activities | $ | 72,188 | $ | 114,430 | $ | 64,191 | $ | 76,181 | $ | 30,799 | |||||||||
| Investing activities | $ | (203,816 | ) | $ | (204,586 | ) | $ | (109,829 | ) | $ | (19,046 | ) | $ | (104,147 | ) | ||||
| Financing activities | $ | 36,206 | $ | 89,280 | $ | 119,704 | $ | (55,815 | ) | $ | 69,662 | ||||||||
| Capital expenditures | $ | (208,970 | ) | $ | (110,851 | ) | $ | (106,230 | ) | $ | (19,262 | ) | $ | (119,704 | ) | ||||
This section of this Annual Report on Form 10-K generally discusses 20192020 and 20182021 items and year-to-year comparisons between 20192020 and 2018.2021. Discussions of 20172019 items and year-to-year comparisons between 20182020 and 20172019 that are not included in this Annual Report on Form 10-K can be found in “Management’s Discussion and Analysis of Financial Condition and Results of Operations” in Part II, Item 7 of the Company’sour Annual Report on Form 10-K for the fiscal year ended December 31, 2018.2020.
Overview
Playa is a leading owner, operator and developer of all-inclusive resorts in prime beachfront locations in popular vacation destinations in Mexico and the Caribbean. As of December 31, 2019,2021, Playa owned and/or managed a total portfolio consisting of 2322 resorts (8,690(8,366 rooms) located in Mexico, Jamaica, and the Dominican Republic. Republic:
•In Mexico, Playa owns and manages Hyatt Zilara Cancún, Hyatt Ziva Cancún, Panama Jack ResortsWyndham Alltra Cancún, Panama Jack ResortsWyndham Alltra Playa del Carmen, Hilton Playa del Carmen All-Inclusive Resort, Hyatt Ziva Puerto Vallarta, and Hyatt Ziva Los Cabos. Cabos;
•In Jamaica, Playa owns and manages Hyatt Zilara Rose Hall, Hyatt Ziva Rose Hall, Hilton Rose Hall Resort & Spa, Jewel Dunn’s River Beach Resort & Spa, Jewel Grande Montego Bay Resort & Spa, Jewel Runaway Bay Beach Resort & Waterpark and Jewel Paradise Cove Beach Resort & Spa. Spa;
•In the Dominican Republic, Playa owns and manages the Hilton La Romana All-Inclusive Family Resort, the Hilton La Romana All-Inclusive Adult Resort, Hyatt Zilara Cap Cana and Hyatt Ziva Cap Cana. Cana; and
•Playa also owns fourtwo resorts in Mexico and the Dominican Republic that are managed by a third partythird-party and Playa manages five resorts on behalf of third-party owners.
Playa’s strategy is to leverage its globally recognized brand partnerships and proprietary in-house direct booking capabilities to capitalize on the Sanctuary Cap Canagrowing popularity of the all-inclusive resort model and reach first-time all-inclusive consumers in the Dominican Republic.a cost effective manner. We believe that this strategy should position us to generate attractive returns for our shareholders, build lasting relationships with our guests, and enhance the resorts we own and manage are among the finest all-inclusive resorts in the markets they serve. Alllives of our resorts offer guests luxury accommodations, noteworthy architecture, extensive on-site activitiesassociates and multiple food and beverage options. Our guests also have the opportunity to purchase upgrades from us such as premium rooms, dining experiences, wines and spirits and spa packages.communities in which we operate.
For the year ended December 31, 2019,2021, we generated a net loss of $4.4$89.7 million, total revenue of $636.5$534.6 million, Net Package RevPAR of $198.28$159.88 and Adjusted EBITDA of $150.7$99.2 million. For the year ended December 31, 2018,2020, during which time our operations were severely impacted by COVID-19, we generated a net incomeloss of $19.0$262.4 million, total revenue of $617.0$273.2 million, Net Package RevPAR of $205.83$76.61 and Adjusted EBITDA of $179.0($21.2) million. For discussions
Impact of Adjusted EBITDACOVID-19 Pandemic
The COVID-19 pandemic and reconciliationthe public health measures that have been undertaken in response have had a significant adverse impact on the global economy, the travel and hospitality industries and our business starting in the first quarter of 2020. The effects of the COVID-19 pandemic, including related government restrictions, border closings, quarantines, “shelter-in-place” orders and “social distancing,” as well as overall changes in consumer demand, have significantly disrupted global leisure travel, and have adversely impacted global commercial activity. We expect that the continuing fallout will create headwinds for global travel even after government restrictions are lifted.
Due to the most comparable U.S. GAAP financial measures, see “Key Indicatorsspread of Financialthe COVID-19 pandemic and Operating Performance”the associated restrictions placed on international travel, we temporarily suspended operations at all of our resorts in late March 2020. We subsequently began reopening our resorts on July 1, 2020, but occupancy levels at all of our resorts have remained below historical levels due to the continuing effects of the pandemic. All of our resorts were reopened by December 31, 2020, except for the Capri Resort which was sold in June 2021, and “Non-U.S. GAAP Financial Measures,” below.
36
The suspension of operations at our resorts during part of 2020, and the reduced occupancy at the resorts since they have reopened, adversely affected our liquidity. As of December 31, 2021, we had $270.1 million of available cash, excluding $23.5 million of restricted cash. We took the following measures during the fiscal years 2020 and 2021 to mitigate the impact of the effects of the COVID-19 pandemic on our liquidity position:
•raised $224.0 million of additional capital during the second quarter of 2020 from affiliates of Davidson Kempner Capital Management L.P. in the form of $204.0 million of additional debt financing and $20.0 million of equity financing at $4.10 per share;
•sold the Jewel Dunn's River Beach Resort & Spa and the Jewel Runaway Bay Beach Resort & Waterpark in May 2020 for a total cash consideration of $60.0 million;
•the temporary suspension of operations of all of our resorts during the second quarter of 2020 significantly reduced the variable cost components of our resort-level operating expenses, including resort franchise and franchise-related fees, management fees and expenses related to our resort employees;
•deferred substantially all of our non-critical capital expenditures planned for 2020 and 2021;
•adopted temporary voluntary senior executive salary reductions while the majority of our resorts were closed, and our Chief Executive Officer’s voluntary 100% salary reduction remained in place through December 31, 2020;
•imposed temporary compensation cuts broadly throughout our corporate workforce and canceled all non-essential corporate travel and spending;
•raised $138.0 million, net of underwriting discounts, of additional capital in January 2021 through an underwritten public equity offering at $5.00 per share;
•paid down the outstanding balance under our Revolving Credit Facility in February 2021 and also amended and extended our existing facility, further extending the covenant waiver period were we to draw the credit line over 35%;
•sold the Dreams Puerto Aventuras in February 2021 for a total cash consideration of $34.5 million; and
•sold the Capri Resort in June 2021 for a total cash consideration of $55.0 million.
The extent to which the COVID-19 pandemic will continue to impact us and consumer behavior will depend on future developments, which are highly uncertain and cannot be predicted with confidence, including the scope, severity and duration of the pandemic, continuing resurgences of the virus and its variants, including the Delta and Omicron variants, the government actions taken to contain the pandemic or mitigate its impact, the speed, continuing effectiveness and distribution of vaccines (including boosters) and treatment therapies, the rate of public adoption of COVID-19 vaccines, and the direct and indirect economic effects of the pandemic and containment measures, including the magnitude of its impact on unemployment rates, labor-force availability (including as a result of vaccine mandates), disruption in the supply chain for materials and consumer discretionary spending, among others. We cannot predict when the effects of the pandemic will subside, and thus we cannot predict whether our resorts will be permitted to remain open or when our business will return to normalized or even to break-even levels. There also can be no guarantee that when the effects of the pandemic subside that there will not be continuing resurgences of the virus or that the demand for lodging, and consumer confidence in travel generally, will recover as quickly as other industries. The longer and more severe the pandemic, and the actual occurrence or even the possibility of repeat or cyclical outbreaks of the virus beyond the one currently being experienced, the greater the material adverse effect the pandemic will have on our business, results of operations, cash flows, financial condition, access to credit markets and ability to service our indebtedness. See Part I, Item 1A. Risk Factors included elsewhere in this report for additional information.
37
Results of Operations
Years Ended December 31, 20192021 and 20182020
The following table summarizes our results of operations on a consolidated basis for the years ended December 31, 20192021 and 20182020 ($ in thousands):
| Year Ended December 31, | Increase / Decrease | |||||||||||||
| 2019 | 2018 | Change | % Change | |||||||||||
| Revenue | ||||||||||||||
| Package | $ | 538,088 | $ | 532,090 | $ | 5,998 | 1.1 | % | ||||||
| Non-package | 90,157 | 83,190 | 6,967 | 8.4 | % | |||||||||
| Management fees | 1,820 | 755 | 1,065 | 141.1 | % | |||||||||
| Cost reimbursements | 6,412 | 978 | 5,434 | 555.6 | % | |||||||||
| Total revenue | 636,477 | 617,013 | 19,464 | 3.2 | % | |||||||||
| Direct and selling, general and administrative expenses | ||||||||||||||
| Direct | 369,050 | 340,080 | 28,970 | 8.5 | % | |||||||||
| Selling, general and administrative | 125,788 | 115,975 | 9,813 | 8.5 | % | |||||||||
| Pre-opening | 1,452 | 321 | 1,131 | 352.3 | % | |||||||||
| Depreciation and amortization | 101,897 | 73,278 | 28,619 | 39.1 | % | |||||||||
| Reimbursed costs | 6,412 | 978 | 5,434 | 555.6 | % | |||||||||
| Impairment loss | 6,168 | — | 6,168 | 100.0 | % | |||||||||
| Gain on insurance proceeds | — | (4,216 | ) | 4,216 | (100.0 | )% | ||||||||
| Direct and selling, general and administrative expenses | 610,767 | 526,416 | 84,351 | 16.0 | % | |||||||||
| Operating income | 25,710 | 90,597 | (64,887 | ) | (71.6 | )% | ||||||||
| Interest expense | (44,087 | ) | (62,243 | ) | 18,156 | (29.2 | )% | |||||||
| Other (expense) income | (3,200 | ) | 2,822 | (6,022 | ) | (213.4 | )% | |||||||
| Net (loss) income before tax | (21,577 | ) | 31,176 | (52,753 | ) | (169.2 | )% | |||||||
| Income tax benefit (provision) | 17,220 | (12,199 | ) | 29,419 | (241.2 | )% | ||||||||
| Net (loss) income | $ | (4,357 | ) | $ | 18,977 | $ | (23,334 | ) | (123.0 | )% | ||||
| Year Ended December 31, | Increase / Decrease | ||||||||||||||||||||||
| 2021 | 2020 | Change | % Change | ||||||||||||||||||||
| Revenue | |||||||||||||||||||||||
| Package | $ | 437,950 | $ | 229,447 | $ | 208,503 | 90.9 | % | |||||||||||||||
| Non-package | 88,592 | 40,746 | 47,846 | 117.4 | % | ||||||||||||||||||
| Management fees | 2,291 | 807 | 1,484 | 183.9 | % | ||||||||||||||||||
| Cost reimbursements | 5,806 | 2,189 | 3,617 | 165.2 | % | ||||||||||||||||||
| Total revenue | 534,639 | 273,189 | 261,450 | 95.7 | % | ||||||||||||||||||
| Direct and selling, general and administrative expenses | |||||||||||||||||||||||
| Direct | 326,979 | 209,832 | 117,147 | 55.8 | % | ||||||||||||||||||
| Selling, general and administrative | 119,895 | 104,188 | 15,707 | 15.1 | % | ||||||||||||||||||
| Depreciation and amortization | 81,508 | 92,570 | (11,062) | (11.9) | % | ||||||||||||||||||
| Reimbursed costs | 5,806 | 2,189 | 3,617 | 165.2 | % | ||||||||||||||||||
| Impairment loss | 24,011 | 55,619 | (31,608) | (56.8) | % | ||||||||||||||||||
| Loss on sale of assets | 676 | 2,021 | (1,345) | (66.6) | % | ||||||||||||||||||
| Gain on insurance proceeds | — | (2,993) | 2,993 | 100.0 | % | ||||||||||||||||||
| Direct and selling, general and administrative expenses | 558,875 | 463,426 | 95,449 | 20.6 | % | ||||||||||||||||||
| Operating loss | (24,236) | (190,237) | 166,001 | 87.3 | % | ||||||||||||||||||
| Interest expense | (71,378) | (81,942) | 10,564 | 12.9 | % | ||||||||||||||||||
| Other expense | (1,471) | (1,164) | (307) | (26.4) | % | ||||||||||||||||||
| Net loss before tax | (97,085) | (273,343) | 176,258 | 64.5 | % | ||||||||||||||||||
| Income tax benefit | 7,403 | 10,973 | (3,570) | (32.5) | % | ||||||||||||||||||
| Net loss | $ | (89,682) | $ | (262,370) | $ | 172,688 | 65.8 | % | |||||||||||||||
The tables below set forth information for our total portfolio and our comparable portfolio with respect to our Occupancy, Net Package ADR, Net Package RevPAR, Net Package Revenue, Net Non-package Revenue, Management Fee Revenue, Total Net Revenue, Adjusted EBITDA and Adjusted EBITDA Margin. For a description of these operating metrics and non-U.S. GAAP measures, see “Key“Key Indicators of Financial and Operating Performance,”Performance” below. For discussion of Adjusted EBITDA and reconciliation to the most comparable U.S. GAAP financial measures, see “Key Indicators of Financial and Operating Performance” and “Non-U.S. GAAP Financial Measures” below.
Our comparable portfolio for the year ended December 31, 20192021 excludes the following resorts: Hilton La Romana All-Inclusive Resort and Hilton Playa del Carmen All-Inclusive Resort, which were under renovation in 2019, Hilton Rose Hall
•Jewel Dunn’s River Beach Resort & Spa and Jewel Runaway Bay Beach Resort & Waterpark, Jewel Dunn’s River Beach Resort & Spa, Jewel Paradise Cove Beach Resort & Spa and Jewel Grande Montego Bay Resort & Spa, which were acquired onsold in May 2020;
•Dreams Puerto Aventuras, which was sold in February 2021; and
•Capri Resort, which was sold in June 1, 2018, and Hyatt Ziva and Hyatt Zilara Cap Cana, a ground-up development opened during November 2019.2021.
38
Total Portfolio
| Year Ended December 31, | Increase / Decrease | ||||||||||||||||||||||
| 2021 | 2020 | Change | % Change | ||||||||||||||||||||
| Occupancy | 51.6 | % | 26.9 | % | 24.7 | pts | 91.8 | % | |||||||||||||||
| Net Package ADR | $ | 309.94 | $ | 284.84 | $ | 25.10 | 8.8 | % | |||||||||||||||
| Net Package RevPAR | $ | 159.88 | $ | 76.61 | $ | 83.27 | 108.7 | % | |||||||||||||||
| ($ in thousands) | |||||||||||||||||||||||
| Net Package Revenue | $ | 425,760 | $ | 221,659 | $ | 204,101 | 92.1 | % | |||||||||||||||
| Net Non-package Revenue | 87,746 | 40,473 | 47,273 | 116.8 | % | ||||||||||||||||||
| Management Fee Revenue | 2,291 | 807 | 1,484 | 183.9 | % | ||||||||||||||||||
| Total Net Revenue | 515,797 | 262,939 | 252,858 | 96.2 | % | ||||||||||||||||||
| Adjusted EBITDA | $ | 99,171 | $ | (21,173) | $ | 120,344 | 568.4 | % | |||||||||||||||
| Adjusted EBITDA Margin | 19.2 | % | (8.1) | % | 27.3 | pts | 337.0 | % | |||||||||||||||
| Year Ended December 31, | Increase / Decrease | |||||||||||||
| 2019 | 2018 | Change | % Change | |||||||||||
| Occupancy | 77.3 | % | 81.8 | % | (4.5 | )pts | (5.5 | )% | ||||||
| Net Package ADR | $ | 256.53 | $ | 251.76 | $ | 4.77 | 1.9 | % | ||||||
| Net Package RevPAR | $ | 198.28 | $ | 205.83 | $ | (7.55 | ) | (3.7 | )% | |||||
| ($ in thousands) | ||||||||||||||
| Net Package Revenue | $ | 517,592 | $ | 514,810 | $ | 2,782 | 0.5 | % | ||||||
| Net Non-package Revenue | 87,779 | 83,044 | 4,735 | 5.7 | % | |||||||||
| Management Fee Revenue | 1,820 | 755 | 1,065 | 141.1 | % | |||||||||
| Total Net Revenue | 607,191 | 598,609 | 8,582 | 1.4 | % | |||||||||
| Adjusted EBITDA | $ | 150,694 | $ | 179,031 | $ | (28,337 | ) | (15.8 | )% | |||||
| Adjusted EBITDA Margin | 24.8 | % | 29.9 | % | (5.1 | )pts | (17.1 | )% | ||||||
Comparable Portfolio
| Year Ended December 31, | Increase / Decrease | ||||||||||||||||||||||
| 2021 | 2020 | Change | % Change | ||||||||||||||||||||
| Occupancy | 52.7 | % | 26.3 | % | 26.4 | pts | 100.4 | % | |||||||||||||||
| Net Package ADR | $ | 310.49 | $ | 292.84 | $ | 17.65 | 6.0 | % | |||||||||||||||
| Net Package RevPAR | $ | 163.53 | $ | 76.96 | $ | 86.57 | 112.5 | % | |||||||||||||||
| ($ in thousands) | |||||||||||||||||||||||
| Net Package Revenue | $ | 425,218 | $ | 199,821 | $ | 225,397 | 112.8 | % | |||||||||||||||
| Net Non-package Revenue | 87,112 | 36,226 | 50,886 | 140.5 | % | ||||||||||||||||||
| Management Fee Revenue | 2,291 | 807 | 1,484 | 183.9 | % | ||||||||||||||||||
| Total Net Revenue | 514,621 | 236,854 | 277,767 | 117.3 | % | ||||||||||||||||||
| Adjusted EBITDA | $ | 100,058 | $ | (21,798) | $ | 121,856 | 559.0 | % | |||||||||||||||
| Adjusted EBITDA Margin | 19.4 | % | (9.2) | % | 28.6 | pts | 310.9 | % | |||||||||||||||
| Year Ended December 31, | Increase / Decrease | |||||||||||||
| 2019 | 2018 | Change | % Change | |||||||||||
| Occupancy | 79.3 | % | 82.0 | % | (2.7 | )pts | (3.3 | )% | ||||||
| Net Package ADR | $ | 264.63 | $ | 264.71 | $ | (0.08 | ) | — | % | |||||
| Net Package RevPAR | $ | 209.84 | $ | 217.12 | $ | (7.28 | ) | (3.4 | )% | |||||
| ($ in thousands) | ||||||||||||||
| Net Package Revenue | $ | 372,458 | $ | 385,224 | $ | (12,766 | ) | (3.3 | )% | |||||
| Net Non-package Revenue | 62,459 | 63,419 | (960 | ) | (1.5 | )% | ||||||||
| Management Fee Revenue | 1,820 | 755 | 1,065 | 141.1 | % | |||||||||
| Total Net Revenue | 436,737 | 449,398 | (12,661 | ) | (2.8 | )% | ||||||||
| Adjusted EBITDA | $ | 112,436 | $ | 128,790 | $ | (16,354 | ) | (12.7 | )% | |||||
| Adjusted EBITDA Margin | 25.7 | % | 28.7 | % | (3.0 | )pts | (10.5 | )% | ||||||
Total Revenue and Total Net Revenue
Our total revenue for the year ended December 31, 20192021 increased $19.5$261.5 million, or 3.2%95.7%, compared to the year ended December 31, 2018. 2020.
Our Total Net Revenue for the year ended December 31, 20192021 increased $8.6$252.9 million, or 1.4%96.2%, compared to the year ended December 31, 2018. This2020. The increase was driven primarily bya result of the resumption of resort operations for the entirety of 2021 as compared to the year ended December 31, 2020, when we closed all of our resorts for the second quarter of 2020 and experienced severely reduced occupancy during the third and fourth quarters of 2020 as a result of the COVID-19 pandemic. See “Impact of COVID-19 Pandemic” above for more information regarding the effects of the COVID-19 pandemic on our results of operations. We believe the increase in Total Net Revenue for the year ended December 31, 2021 was also due to an increase in Net Package ADR as a result of pent-up customer demand following COVID-19 related travel restrictions and vaccine availability, and our strategic decision to focus on pricing discipline to coincide with investments in guest satisfaction at our resorts.
Our Total Net Revenue for the year ended December 31, 2021 includes a $1.3 million favorable value-added tax (“VAT”) impact following OECD guidelines for Transfer Pricing for Multinational Enterprises as a result of $2.8 million, or 0.5%, and an increasethe economic impact of the COVID-19 pandemic. This VAT adjustment resulted in a $0.94 favorable impact in Net Non-package RevenuePackage ADR. Additionally, Net Package ADR of $4.7 million, or 5.7%. Our non-comparable portfolio, which accounted for a $21.2 million increase over comparable periods, was the primary driver$309.94 for the increaseyear ended December 31, 2021 benefited by an additional $4.95 as a result of a change in Totalbilling methodology of an online travel agency (“OTA”), which required Playa to present this revenue gross of commissions under U.S. GAAP. Excluding the aforementioned adjustments, Net Revenue.Package ADR would have been $304.05.
39
The following table shows a reconciliation of comparable Net Package Revenue, Net Non-package Revenue, Management Fee Revenue and Total Net Revenue to total revenue for the years ended December 31, 20192021 and 20182020 ($ in thousands):
| Year Ended December 31, | Increase/Decrease | Year Ended December 31, | Increase/Decrease | ||||||||||||||||||||||||||||||||||
| 2019 | 2018 | Change | % Change | 2021 | 2020 | Change | % Change | ||||||||||||||||||||||||||||||
| Net Package Revenue | Net Package Revenue | ||||||||||||||||||||||||||||||||||||
| Comparable Net Package Revenue | $ | 372,458 | $ | 385,224 | $ | (12,766 | ) | (3.3 | )% | Comparable Net Package Revenue | $ | 425,218 | $ | 199,821 | $ | 225,397 | 112.8 | % | |||||||||||||||||||
| Non-comparable Net Package Revenue | 145,134 | 129,586 | 15,548 | 12.0 | % | Non-comparable Net Package Revenue | 542 | 21,838 | (21,296) | (97.5) | % | ||||||||||||||||||||||||||
| Net Package Revenue | 517,592 | 514,810 | 2,782 | 0.5 | % | Net Package Revenue | 425,760 | 221,659 | 204,101 | 92.1 | % | ||||||||||||||||||||||||||
| Net Non-package Revenue | Net Non-package Revenue | ||||||||||||||||||||||||||||||||||||
| Comparable Net Non-package Revenue | 62,459 | 63,419 | (960 | ) | (1.5 | )% | Comparable Net Non-package Revenue | 87,112 | 36,226 | 50,886 | 140.5 | % | |||||||||||||||||||||||||
| Non-comparable Net Non-package Revenue | 25,320 | 19,625 | 5,695 | 29.0 | % | Non-comparable Net Non-package Revenue | 634 | 4,247 | (3,613) | (85.1) | % | ||||||||||||||||||||||||||
| Net Non-package Revenue | 87,779 | 83,044 | 4,735 | 5.7 | % | Net Non-package Revenue | 87,746 | 40,473 | 47,273 | 116.8 | % | ||||||||||||||||||||||||||
| Management Fee Revenue | Management Fee Revenue | ||||||||||||||||||||||||||||||||||||
| Comparable Management Fee Revenue | 1,820 | 755 | 1,065 | 141.1 | % | Comparable Management Fee Revenue | 2,291 | 807 | 1,484 | 183.9 | % | ||||||||||||||||||||||||||
| Non-comparable Management Fee Revenue | — | — | — | — | % | Non-comparable Management Fee Revenue | — | — | — | — | % | ||||||||||||||||||||||||||
| Management Fee Revenue | 1,820 | 755 | 1,065 | 141.1 | % | Management Fee Revenue | 2,291 | 807 | 1,484 | 183.9 | % | ||||||||||||||||||||||||||
| Total Net Revenue | Total Net Revenue | ||||||||||||||||||||||||||||||||||||
| Comparable Total Net Revenue | 436,737 | 449,398 | (12,661 | ) | (2.8 | )% | Comparable Total Net Revenue | 514,621 | 236,854 | 277,767 | 117.3 | % | |||||||||||||||||||||||||
| Non-comparable Total Net Revenue | 170,454 | 149,211 | 21,243 | 14.2 | % | Non-comparable Total Net Revenue | 1,176 | 26,085 | (24,909) | (95.5) | % | ||||||||||||||||||||||||||
| Total Net Revenue | 607,191 | 598,609 | 8,582 | 1.4 | % | Total Net Revenue | 515,797 | 262,939 | 252,858 | 96.2 | % | ||||||||||||||||||||||||||
| Compulsory tips | 22,874 | 17,426 | 5,448 | 31.3 | % | Compulsory tips | 13,036 | 8,061 | 4,975 | 61.7 | % | ||||||||||||||||||||||||||
| Cost Reimbursements | 6,412 | 978 | 5,434 | 555.6 | % | Cost Reimbursements | 5,806 | 2,189 | 3,617 | 165.2 | % | ||||||||||||||||||||||||||
| Total revenue | $ | 636,477 | $ | 617,013 | $ | 19,464 | 3.2 | % | Total revenue | $ | 534,639 | $ | 273,189 | $ | 261,450 | 95.7 | % | ||||||||||||||||||||
Direct Expenses
The following table shows a reconciliation of our direct expenses to Net Direct Expenses for the years ended December 31, 20192021 and 20182020 ($ in thousands):
| Year Ended December 31, | Increase/Decrease | Year Ended December 31, | Increase/Decrease | ||||||||||||||||||||||||||||||||||
| 2019 | 2018 | Change | % Change | 2021 | 2020 | Change | % Change | ||||||||||||||||||||||||||||||
| Direct expenses | $ | 369,050 | $ | 340,080 | $ | 28,970 | 8.5 | % | Direct expenses | $ | 326,979 | $ | 209,832 | $ | 117,147 | 55.8 | % | ||||||||||||||||||||
| Less: compulsory tips | 22,874 | 17,426 | 5,448 | 31.3 | % | Less: compulsory tips | 13,036 | 8,061 | 4,975 | 61.7 | % | ||||||||||||||||||||||||||
| Net Direct Expenses | $ | 346,176 | $ | 322,654 | $ | 23,522 | 7.3 | % | Net Direct Expenses | $ | 313,943 | $ | 201,771 | $ | 112,172 | 55.6 | % | ||||||||||||||||||||
Our direct expenses include resort expenses, such as food and beverage, salaries and wages, utilities and other ongoing operational expenses. Our Net Direct Expenses for the year ended December 31, 20192021 were $346.2$313.9 million, or 57.0%,60.9% of Total Net Revenue. Our Net Direct Expenses for the year ended December 31, 20182020 were $322.7$201.8 million, or 53.9%,76.7% of Total Net Revenue.
Net Direct Expenses for the year ended December 31, 20192021 increased $23.5$112.2 million, or 7.3%55.6%, compared to the year ended December 31, 2018.2020. As a percentage of Owned Net Revenue, Net Direct Expenses decreased to 61.3%, compared to 77.1% for the year ended December 31, 2020. Net Direct Expenses at our comparable properties increased primarily due$129.2 million, or 71.2%, compared to the acquisitionyear ended December 31, 2020. The increase in Net Direct Expenses was primarily a result of the SagicorAssets, which accountedresumption of resort operations for $31.7 million,the entirety of 2021 as compared to the year ended December 31, 2020, when we closed all of our resorts for the second quarter of 2020 and experienced severely reduced occupancy during the openingthird and fourth quarters of 2020 as a result of the Hyatt Ziva and Hyatt Zilara Cap Cana, which accounted for $4.9 million of the change. ThisCOVID-19 pandemic. The increase was partially offset byalso a decreaseresult of $12.1 million duea higher rate of inflation in 2021 as compared to our development projects under renovation at Hilton La Romana All-Inclusive Resort and Hilton Playa del Carmen All-Inclusive Resort.2020, particularly in the second half of 2021. See the “Inflation” section for additional discussion. Direct operating expenses fluctuate based on various factors, including changes in occupancy, labor costs, utilities, repair and maintenance costs and license and property taxes. Management fees and franchise fees, which are computed as a percentage of revenue, increase or decrease as a result of changes in revenues.
40
Net Direct Expenses consists of the following ($ in thousands):
Total Portfolio
| Year Ended December 31, | Increase/Decrease | Year Ended December 31, | Increase/Decrease | ||||||||||||||||||||||||||||||||||
| 2019 | 2018 | Change | % Change | 2021 | 2020 | Change | % Change | ||||||||||||||||||||||||||||||
| Food and beverages | $ | 84,564 | $ | 79,445 | $ | 5,119 | 6.4 | % | Food and beverages | $ | 68,885 | $ | 36,155 | $ | 32,730 | 90.5 | % | ||||||||||||||||||||
| Guest costs | Guest costs | 24,558 | 9,555 | 15,003 | 157.0 | % | |||||||||||||||||||||||||||||||
| Salary and wages | 130,882 | 117,209 | 13,673 | 11.7 | % | Salary and wages | 117,282 | 87,119 | 30,163 | 34.6 | % | ||||||||||||||||||||||||||
| Repairs and maintenance | 17,136 | 15,826 | 1,310 | 8.3 | % | Repairs and maintenance | 16,629 | 11,699 | 4,930 | 42.1 | % | ||||||||||||||||||||||||||
| Utilities and sewerage | 37,791 | 35,344 | 2,447 | 6.9 | % | Utilities and sewerage | 35,481 | 25,094 | 10,387 | 41.4 | % | ||||||||||||||||||||||||||
| Licenses and property taxes | 3,010 | 3,118 | (108 | ) | (3.5 | )% | Licenses and property taxes | 2,992 | 3,224 | (232) | (7.2) | % | |||||||||||||||||||||||||
| Incentive and management fees | 6,366 | 10,848 | (4,482 | ) | (41.3 | )% | Incentive and management fees | 1,492 | 1,162 | 330 | 28.4 | % | |||||||||||||||||||||||||
| Franchise/license fees | 21,881 | 18,839 | 3,042 | 16.1 | % | Franchise/license fees | 24,192 | 12,874 | 11,318 | 87.9 | % | ||||||||||||||||||||||||||
| Transportation and travel expenses | 4,825 | 4,464 | 361 | 8.1 | % | Transportation and travel expenses | 4,281 | 2,844 | 1,437 | 50.5 | % | ||||||||||||||||||||||||||
| Laundry and cleaning expenses | 4,753 | 4,322 | 431 | 10.0 | % | Laundry and cleaning expenses | 4,672 | 3,022 | 1,650 | 54.6 | % | ||||||||||||||||||||||||||
| Property and equipment rental expense | 3,305 | 5,169 | (1,864 | ) | (36.1 | )% | Property and equipment rental expense | 2,335 | 1,090 | 1,245 | 114.2 | % | |||||||||||||||||||||||||
| Entertainment expenses and decoration | 7,684 | 7,336 | 348 | 4.7 | % | Entertainment expenses and decoration | 6,917 | 3,948 | 2,969 | 75.2 | % | ||||||||||||||||||||||||||
| Office supplies | 1,511 | 2,346 | (835 | ) | (35.6 | )% | Office supplies | 996 | 623 | 373 | 59.9 | % | |||||||||||||||||||||||||
| Other operational expenses | 22,468 | 18,388 | 4,080 | 22.2 | % | Other operational expenses | 3,231 | 3,362 | (131) | (3.9) | % | ||||||||||||||||||||||||||
| Total Net Direct Expenses | $ | 346,176 | $ | 322,654 | $ | 23,522 | 7.3 | % | Total Net Direct Expenses | $ | 313,943 | $ | 201,771 | $ | 112,172 | 55.6 | % | ||||||||||||||||||||
Comparable Portfolio
| Year Ended December 31, | Increase/Decrease | Year Ended December 31, | Increase/Decrease | ||||||||||||||||||||||||||||||||||
| 2019 | 2018 | Change | % Change | 2021 | 2020 | Change | % Change | ||||||||||||||||||||||||||||||
| Food and beverages | $ | 54,921 | $ | 56,291 | $ | (1,370 | ) | (2.4 | )% | Food and beverages | $ | 68,739 | $ | 32,356 | $ | 36,383 | 112.4 | % | |||||||||||||||||||
| Resort salary and wages | 102,927 | 99,352 | 3,575 | 3.6 | % | ||||||||||||||||||||||||||||||||
| Guest costs | Guest costs | 24,253 | 8,525 | 15,728 | 184.5 | % | |||||||||||||||||||||||||||||||
| Salary and wages | Salary and wages | 115,245 | 78,317 | 36,928 | 47.2 | % | |||||||||||||||||||||||||||||||
| Repairs and maintenance | 11,105 | 11,027 | 78 | 0.7 | % | Repairs and maintenance | 16,508 | 9,742 | 6,766 | 69.5 | % | ||||||||||||||||||||||||||
| Utility expenses | 24,583 | 24,257 | 326 | 1.3 | % | ||||||||||||||||||||||||||||||||
| Utilities and sewerage | Utilities and sewerage | 35,295 | 22,974 | 12,321 | 53.6 | % | |||||||||||||||||||||||||||||||
| Licenses and property taxes | 1,822 | 1,729 | 93 | 5.4 | % | Licenses and property taxes | 2,854 | 2,936 | (82) | (2.8) | % | ||||||||||||||||||||||||||
| Incentive and management fees | 6,463 | 7,927 | (1,464 | ) | (18.5 | )% | Incentive and management fees | 1,450 | 580 | 870 | 150.0 | % | |||||||||||||||||||||||||
| Franchise/license fees | 17,421 | 16,298 | 1,123 | 6.9 | % | Franchise/license fees | 24,192 | 12,882 | 11,310 | 87.8 | % | ||||||||||||||||||||||||||
| Transportation and travel expenses | 3,471 | 3,190 | 281 | 8.8 | % | Transportation and travel expenses | 4,249 | 2,525 | 1,724 | 68.3 | % | ||||||||||||||||||||||||||
| Laundry and cleaning expenses | 2,481 | 2,620 | (139 | ) | (5.3 | )% | Laundry and cleaning expenses | 4,664 | 2,731 | 1,933 | 70.8 | % | |||||||||||||||||||||||||
| Property and equipment rental expense | 2,516 | 4,244 | (1,728 | ) | (40.7 | )% | Property and equipment rental expense | 2,324 | 995 | 1,329 | 133.6 | % | |||||||||||||||||||||||||
| Entertainment expenses | 6,231 | 5,981 | 250 | 4.2 | % | ||||||||||||||||||||||||||||||||
| Entertainment expenses and decoration | Entertainment expenses and decoration | 6,899 | 3,496 | 3,403 | 97.3 | % | |||||||||||||||||||||||||||||||
| Office supplies | 1,183 | 1,967 | (784 | ) | (39.9 | )% | Office supplies | 993 | 588 | 405 | 68.9 | % | |||||||||||||||||||||||||
| Other operational expenses | 12,398 | 13,567 | (1,169 | ) | (8.6 | )% | Other operational expenses | 2,988 | 2,760 | 228 | 8.3 | % | |||||||||||||||||||||||||
| Total Net Direct Expenses | $ | 247,522 | $ | 248,450 | $ | (928 | ) | (0.4 | )% | Total Net Direct Expenses | $ | 310,653 | $ | 181,407 | $ | 129,246 | 71.2 | % | |||||||||||||||||||