UNITED STATES
SECURITIES AND EXCHANGE COMMISSION
Washington, D.C. 20549
FORM 10-K
| | | | | |
| ☒ | ANNUAL REPORT PURSUANT TO SECTION 13 OR 15(d) OF THE SECURITIES EXCHANGE ACT OF 1934 |
For the fiscal year ended December 31, 20212023
orOR
| | | | | |
| ☐ | TRANSITION REPORT PURSUANT TO SECTION 13 OR 15(d) OF THE SECURITIES EXCHANGE ACT OF 1934 |
For the transition period from to
Commission file number 001-38124
GRANITE POINT MORTGAGE TRUST INC.
(Exact Name of Registrant as Specified in Its Charter)
| | | | | | | | |
| Maryland | | 61-1843143 |
State or Other Jurisdiction of
| | (I.R.S. Employer
|
| | | | | | | | | | | |
| 3 Bryant Park, Suite 2400A | | |
| New York, | New York | | 10036 |
| (Address of Principal Executive Offices) | | (Zip Code) |
(212) 364-5500
(Registrant’s telephone number, including area code)
Securities registered pursuant to Section 12(b) of the Act:
| | | | | | | | | | | | | | |
| Title of each class | | Trading Symbol(s) | | Name of each exchange on which registered |
| Common Stock, par value $0.01 per share | | GPMT | | NYSE |
| 7.00% Series A Fixed-to-Floating Rate Cumulative Redeemable Preferred Stock, par value $0.01 per share | | GPMTPrA | | NYSE |
Securities registered pursuant to Section 12(g) of the Act: None
Indicate by check mark if the registrant is a well-known seasoned issuer, as defined in Rule 405 of the Securities Act. Yes ☒☐ No ☐☒
Indicate by check mark if the registrant is not required to file reports pursuant to Section 13 or 15(d) of the Act. Yes ☐ No ☒
Indicate by check mark whether the registrant (1) has filed all reports required to be filed by Section 13 or 15(d) of the Securities Exchange Act of 1934 during the preceding 12 months (or for such shorter period that the registrant was required to file such reports), and (2) has been subject to such filing requirements for the past 90 days. Yes ☒ No ☐
Indicate by check mark whether the registrant has submitted electronically every Interactive Data File required to be submitted pursuant to Rule 405 of Regulation S-T (§232.405 of this chapter) during the preceding 12 months (or for such shorter period that the registrant was required to submit such files). Yes ☒ No ☐
Indicate by check mark whether the registrant is a large accelerated filer, an accelerated filer, a non-accelerated filer, a smaller reporting company, or an emerging growth company. See the definitions of “large accelerated filer,” “accelerated filer,” “smaller reporting company,” and “emerging growth company” in Rule 12b-2 of the Exchange Act.
| | | | | | | | | | | | | | |
| Large accelerated filer | ☒☐ | | Accelerated filer | ☐☒ |
| Non-accelerated filer | ☐ | | Smaller reporting company | ☐ |
| | | Emerging growth company | ☐ |
If an emerging growth company, indicate by check mark if the registrant has elected not to use the extended transition period for complying with any new or revised financial accounting standards provided pursuant to Section 13(a) of the Exchange Act. ☐
Indicate by check mark whether the registrant has filed a report on and attestation to its management’s assessment of the effectiveness of its internal control over financial reporting under Section 404(b) of the Sarbanes-Oxley Act (15 U.S.C. 7262(b)) by the registered public accounting firm that prepared or issued its audit report. ☒
If securities are registered pursuant to Section 12(b) of the Act, indicate by check mark whether the financial statements of the registrant included in the filing reflect the correction of an error to previously issued financial statements. ☐
Indicate by check mark whether any of those error corrections are restatements that required a recovery analysis of incentive-based compensation received by any of the registrant’s executive officers during the relevant recovery period pursuant to §240.10D-1(b). ☐
Indicate by check mark whether the registrant is a shell company (as defined in Rule 12b-2 of the Act). Yes ☐ No ☒
As of June 30, 2021,2023, the aggregate market value of the registrant’s common stock held by non-affiliates of the registrant was approximately $795.8$267.9 million based on the closing sale price as reported on the NYSE on that date.
As of February 18, 2022,26, 2024, there were 53,855,57750,793,057 shares of common stock, par value $.01$0.01 per share, issued and outstanding.
DOCUMENTS INCORPORATED BY REFERENCE
Portions of the registrant’s definitive Proxy Statement for the 20222024 Annual Meeting of Stockholders, which will be filed with the Securities and Exchange Commission under Regulation 14A within 120 days after the end of registrant’s fiscal year covered by this Annual Report, are incorporated by reference into Part III.
GRANITE POINT MORTGAGE TRUST INC.
20212023 ANNUAL REPORT ON FORM 10-K
TABLE OF CONTENTS
| | | | | | | | |
| | Page |
| PART I | | |
| | |
| | |
| | |
| | |
| | |
| | |
| | |
| PART II | | |
| | |
| | |
| | |
| | |
| | |
| | |
| | |
| | |
| | |
| PART III | | |
| | |
| | |
| | |
| | |
| | |
| PART IV | | |
| | |
| | |
| |
CAUTIONARY NOTE REGARDING FORWARD-LOOKING STATEMENTS
This Annual Report on Form 10-K contains, or incorporates by reference, not only historical information, but also forward-looking statements within the meaning of Section 27A of the Securities Act of 1933, as amended, or the Securities Act, and Section 21E of the Securities Exchange Act of 1934, as amended, or the Exchange Act, and that are subject to the safe harbors created by such sections. Forward-looking statements involve numerous risks and uncertainties. Our actual results may differ from our beliefs, expectations, estimates and projections and, consequently, you should not rely on these forward-looking statements as predictions of future events. Forward-looking statements are not historical in nature and can be identified by words such as “anticipate,” “estimate,” “will,” “should,” “expect,” “target,” “believe,” “outlook,” “potential,” “continue,” “intend,” “seek,” “plan,” “goals,” “future,” “likely,” “may” and similar expressions or their negative forms, or by references to strategy, plans or intentions. By their nature, forward-looking statements speak only as of the date they are made, are not statements of historical facts or guarantees of future performance and are subject to risks, uncertainties, assumptions or changes in circumstances that are difficult to predict or quantify, in particular those relating to the ongoing novel coronavirus, or COVID-19, pandemic, including the ultimate impact of the COVID-19 pandemic on our business, financial performance and operating results.quantify. Our expectations, beliefs and estimates are expressed in good faith and we believe there is a reasonable basis for them. However, there can be no assurance that management's expectations, beliefs and estimates will prove to be correct or be achieved and actual results may vary materially from what is expressed in or indicated by the forward-looking statements.
These forward-looking statements are subject to risks and uncertainties, including, among other things, those described in this Annual Report on Form 10-K under the caption “Risk Factors.” These risks may also be further heightened by the continued and evolving impact of the COVID-19 pandemic. Other risks, uncertainties and factors that could cause actual results to differ materially from those projected are described below and may be described from time to time in reports we file with the Securities and Exchange Commission, or the SEC, including our Quarterly Reports on Form 10-Q and Current Reports on Form 8-K. Forward-looking statements speak only as of the date they are made, and we undertake no obligation to update or revise any such forward-looking statements, whether as a result of new information, future events or otherwise.
Important factors that may affect our actual results include, among others:
•the severity and duration of the ongoing COVID-19 pandemic;
•potential risks and uncertainties relating to the spread of COVID-19, including new variants;
•actions taken by governmental authorities and businesses to contain the COVID-19 pandemic or to mitigate its impact;
•the negative impacts of COVID-19 on the global economy and on our financial condition, business operations and our loan portfolio, including the value of our assets, as well as the financial condition and operations of our borrowers;
•the general political, economic and competitive conditions in the markets in which we invest;invest and their impact on our investment portfolio, financial condition and business operations;
•inflationary trends which have led to higher interest rates and increased market volatility;
•the economic and geopolitical impacts of the Russia-Ukraine conflict and the conflict and rising tensions in the Middle East, including the adoption or expansion of economic sanctions or trade restrictions;
•reduced demand for office, multifamily or retail space, including as a result of increased hybrid work schedules which allow work from remote locations other than the employer's office premises;
•defaults by borrowers in paying debt service on outstanding indebtedness and borrowers' abilities to manage and stabilize properties;
•our ability to obtain or maintain financing arrangements on terms favorable to us or at all;
•the level and volatility of prevailing interest rates and credit spreads;
•reductions in the yield on our investments and increases in the cost of our financing;
•general volatility of the securities markets in which we participate and the potential need to post additional collateral on our financing arrangements;
•the return or impact of current or future investments;
•changes in our business, investment strategies or target investments;
•increased competition from entities investing in our target investments;
•effects of hedging instruments on our target investments;
•changes in governmental regulations, tax law and rates and similar matters;
•our ability to maintain our qualification as a real estate investment trust, or REIT, for U.S. federal income tax purposes and our exclusion from registration under the Investment Company Act of 1940, as amended, or the Investment Company Act;
•availability of desirable investment opportunities;
•threats to information security, including by way of cyber-attacks;
•availability of qualified personnel;
•operational failures by third-parties on whom we rely in the conduct of our business;
•estimates relating to our ability to make distributions to our stockholders in the future;
•acts of God,natural disasters, such as hurricanes, earthquakes, wildfires and other natural disasters,floods, including climate change-related risks,risks; acts of war and/or terrorism,terrorism; pandemics or outbreaks of infectious disease, such as the COVID-19 pandemic,disease; and other events that may cause unanticipated and uninsured performance declines and/or losses to us or the owners and operators of the real estate securing our investments;
•deterioration in the performance of the properties securing our investments that may cause deterioration in the performance of our investments, risks in collection of contractual interest payments and, potentially, principal losses to us, including the risk of credit loss charges and any impact on our ability to satisfy the covenants and conditions in our debt agreements; and
•difficulty or delays in redeploying the proceeds from repayments of our existing investments.
This Annual Report on Form 10-K may contain statistics and other data that, in some cases, have been obtained or compiled from information made available by loan servicers and other third-party service providers.
PART I
Item 1. Business
Our Company
Granite Point Mortgage Trust Inc. is an internally-managed real estate finance company that focuses primarily on directly originating, investing in and managing senior floating-rate commercial mortgage loans and other debt and debt-like commercial real estate investments. Our investment objective is to preserve our stockholders’ capital while generating attractive risk-adjusted returns over the long term, primarily through dividends derived from current income produced by our investment portfolio. We operate as a real estate investment trust, or REIT, as defined under the Internal Revenue Code of 1986, as amended, or the Code. We were incorporated in Maryland on April 7, 2017, and commenced operations as a publicly traded company on June 28, 2017.
The terms “Granite Point,” “we,” “our,” “us” and the “company”“Company” refer to Granite Point Mortgage Trust Inc. and its subsidiaries as a consolidated entity.
We have elected to be treated as a REIT for U.S. federal income tax purposes. To qualify as a REIT, we are required to meet certain investment and operating tests and annual distribution requirements. We generally will not be subject to U.S. federal income taxes on our taxable income to the extent that we annually distribute all of our net taxable income to stockholders, do not participate in prohibited transactions and maintain our intended qualification as a REIT. However, certain activities that we may perform may cause us to earn income which will not be qualifying income for REIT purposes. We have designated one of our subsidiaries as a taxable REIT subsidiary, or TRS, as defined in the Code, to engage in such activities, and we may form additional TRSs in the future. We also operate our business in a manner that will permit usintended to maintain our exclusion from registration under the Investment Company Act of 1940, as amended, or the Investment Company Act.
We are organized as a holding company and operate our business primarily through various subsidiaries in a single reporting segment that originates, acquires and finances our target investments.
Our Investment Strategy
Our investment strategy is to directly originate, invest in and manage a portfolio of primarily senior floating-rate commercial real estate loans and other debt and debt-like instruments secured by various types of institutional quality commercial properties located in attractive markets across the United States and managed by experienced owners. These loans may vary in term and may bear interest at a fixed or floating rate, although our primary focus is on floating-rate loans. We typically provide intermediate-term bridge or transitional financing for a variety of purposes, including acquisitions, recapitalizations, refinancings and a range of business plans, including lease-up, renovation, repositioning and repurposing of the commercial property.
From time to time, we may also directly originate and invest in mezzanine loans, subordinated mortgage interests (sometimes referred to as a B-note) and other real estate securities, and may also invest in preferred equity investments and other investments that are subordinated or otherwise junior in an issuer’s capital structure and that involve privately negotiated structures. The only securities we currently own are the retained interests from our securitization financing transactions. Our investment objective is to generate attractive, risk-adjusted returns for our stockholders over the long-term, primarily through dividends, and to preserve our stockholders’ capital through business cycles. We believe that the stability of our capital base is important to our ability to invest in assets that generate attractive returns on an ongoing basis. We intend to achieve these objectives by further growing our already well-diversified investment portfolio over the long-term and actively managing the various risks associated with our business strategy.
As a long-term, fundamental value-oriented investor, we may adjust our investment strategy as we react to evolving market dynamics. We believe there are enduring opportunities within our target investments that present attractive, risk-adjusted returns. However, as economic and business cycles develop, we may expand and/or adjust our investment strategy and target investments to capitalize on various investment opportunities. We believe that our well-diversified portfolio and flexible investment strategy will allow us to actively adapt to changing market conditions and generate attractive, long-term returns for our stockholders in a variety of environments.
Our Loan Portfolio
As of December 31, 2021,2023, our investmentloan portfolio consisted of 10573 commercial real estate loan investments with an aggregate principal balance of $3.8$2.7 billion and an additional $0.4$0.2 billion of future funding obligations. As of December 31, 2021, 98.8%2023, 98.3% of our loan portfolio by carrying valueprincipal balance earned a floating rate of interest. The table below details overall statistics of our portfolio as of December 31, 2021:2023:
| | (dollars in thousands) | (dollars in thousands) | |
| Type | Type | | Maximum Loan Commitment | | Principal Balance | | Carrying Value | | Cash Coupon (2) | | Yield (3) | | Original Term (Years) | | Initial LTV (4) | | Stabilized LTV (5) |
| Type | |
| Type | | | Maximum Loan Commitment | | Principal Balance | | Carrying Value | | Cash Coupon (2) | | Yield (3) | | Original Term (Years) | | Initial LTV (4) | | Stabilized LTV (5) |
Senior loans (1) | Senior loans (1) | | $ | 4,185,355 | | | $ | 3,781,771 | | | $ | 3,728,432 | | | L+3.48% | | L+4.07% | | 3.1 | | | 66.4 | % | | 63.6 | % | Senior loans (1) | | $ | 2,874,370 | | | $ | | $ | 2,713,672 | | | $ | | $ | 2,570,677 | | | S+3.75% | | S+3.75% | | S+4.03% | | 3.1 | | | 66.8 | | 66.8 | % | | 63.7 | % |
| Subordinated loans | Subordinated loans | | 15,054 | | | 15,054 | | | 12,876 | | | 8.35 | % | | 8.42 | % | | 10.0 | | | 43.3 | % | | 37.7 | % | Subordinated loans | | 13,507 | | | 13,507 | | 13,507 | | | 13,148 | | 13,148 | | | 8.00 | | 8.00 | % | | 8.11 | % | | 10.0 | | | 41.4 | | 41.4 | % | | 36.2 | % |
| | Total/Wtd. Avg. | Total/Wtd. Avg. | | $ | 4,200,409 | | | $ | 3,796,825 | | | $ | 3,741,308 | | | L+3.48% | | L+4.07% | | 3.1 | | | 66.3 | % | | 63.5 | % | Total/Wtd. Avg. | | $ | 2,887,877 | | | $ | | $ | 2,727,179 | | | $ | | $ | 2,583,825 | | | S+3.75% | | S+3.75% | | S+4.03% | | 3.2 | | | 66.7 | | 66.7 | % | | 63.6 | % |
____________________
(1)“Senior” means a loan primarily secured by a first priority lien on commercial real property and related personal property and also includes, when applicable, any companion subordinate loans.
(2)Cash coupon does not include origination or exit fees. Weighted average cash coupon excludes fixed rate loans.
(3)Yield includes net origination fees and exit fees, but does not include future fundings, and is expressed as a monthly equivalent. Weighted average yield excludes fixed rate loans.
(4)Initial loan-to-value ratio, or initial LTV, is calculated as the initial loan amount (plus any financing that is pari passu with or senior to such loan) divided by the as is appraised value (as determined in conformance with the Uniform Standards of Professional Appraisal Practice, or USPAP) as of the date the loan was originated set forth in the original appraisal.
(5)Stabilized loan-to-value ratio, or stabilized LTV, is calculated as the fully funded loan amount (plus any financing that is pari passu with or senior to such loan), including all contractually provided for future fundings, divided by the as stabilized value (as determined in conformance with USPAP) set forth in the original appraisal. As stabilized value may be based on certain assumptions, such as future construction completion, projected re-tenanting, payment of tenant improvement or leasing commissions allowances or free or abated rent periods, or increased tenant occupancies.
The map and charts below, weighted by carrying value, illustrate the geographic distribution and types of properties securing our loan portfolio as of December 31, 2021:2023:
Our Financing Strategy and Leverage
We currently finance our business through public and private offerings of our equity and debt securities, asset-backed financings (including repurchase, asset-specific financing, term financing and other credit facilities), secured term loan facilities and our outstanding commercial real estate collateralized loan obligations, or CRE CLOs. In addition to our current mix of funding sources, we may use other forms of financing, including additional securitizations and public and private, secured and unsecured, debt issuances by us or our subsidiaries.
As of December 31, 2021,2023, we had repurchase termand secured credit financing and asset-specific financingsfacilities in place to finance loans held for investment with Morgan Stanley Bank, N.A.; JPMorgan Chase Bank, National Association; Goldman Sachs Bank USA; Wells Fargo Bank, National Association; Canadian Imperial Bank of Commerce; and Citibank, N.A.; forour one real estate owned, or REO, asset with an aggregate maximum borrowing capacity of $2.1 billion, or $2.4 billion inclusive of our options to upsize the borrowing capacity of our repurchase facilities with Goldman Sachs Bank USA; Morgan Stanley Bank, N.A.; and Wells Fargo Bank, National Association.
In addition, as of December 31, 2021, we had senior secured term loan facilities in place with certain investment vehicles managed by Pacific Investment Management Company LLC with an outstanding balance of $150 million. Subsequent to December 31, 2021, on February 16, 2022, we prepaid an additional $50.0 million of borrowings under the senior secured term loan facilities, reducing the outstanding balance to $100 million.$1.9 billion.
We also finance pools of commercial real estate loans through CRE CLOs, which are consolidated on our financial statements. As of December 31, 2021,2023, the outstanding amount due on securitized debt obligations was $1.7$1.0 billion.
We are not required to maintain any particular debt-to-equity leverage ratio. The actual leverage we employ for particular investments will depend upon our assessment of the credit, liquidity, price volatility and other risks of those investments and the financing counterparties, and availability of particular types of financing at the time, as well as the financial covenants under
our financing facilities. Our decision to use leverage to finance our assets is at the discretion of our management team and is not subject to the approval of our stockholders. Given our focus on senior floating-rate mortgage loans, we currently expect that such leverage will be, on a total debt-to-equity ratio basis, within a range of 3.0:1.0 and 3.5:1.0; however, our leverage may vary and differ from our expectations depending on market conditions and any steps we may take to strengthen our balance sheet and enhance our liquidity position. We endeavor to match the terms and indices of our assets and liabilities, including, potentially, through the use of derivatives in certain instances. We also seek to manage the risks associated with recourse borrowing.
Subject to maintaining our qualification as a REIT for U.S. federal income tax purposes and our exemption from the Investment Company Act, we may, from time to time, engage in a variety of hedging transactions that seek to mitigate the effects of fluctuations in interest rates or currencies and their effects on our cash flows. These hedging transactions could take a variety of forms, including interest rate swaps or cap agreements, options, futures contracts, forward rate agreements or similar financial instruments. We expect these instruments would allow us to reduce, but not eliminate, the risk that we have to refinance our liabilities before the maturities of our investments and to reduce the impact of changing interest rates on our earnings. To date, we have not engaged in any hedging transactions.
Investment Guidelines
Our board of directors has approved the following investment guidelines:
•no investment shall be made that would cause us to fail to qualify as a REIT under the Code;
•no investment shall be made that would cause us to be regulated or required to register as an investment company under the Investment Company Act;
•we will primarily invest in our target investments, consisting of senior commercial mortgage loans, mezzanine loans, preferred equity, subordinated mortgage interests, real estate securities and other debt and debt-like commercial real estate investments;
•not more than 25% of our equity capital will be invested in any individual asset without the prior approval of a majority of our board of directors;
•any investment in excess of $300 million in an individual asset requires the prior approval of a majority of our board of directors; and
•until appropriate investments in our target investments are identified, we may invest our available cash in interest-bearing, short-term investments, including money market accounts or funds, and corporate bonds, subject to the requirements for our qualification as a REIT under the Code.
These investment guidelines may be changed from time-to-time by our board of directors without our stockholders’ consent, but we expect to disclose any material changes to our investment guidelines in the periodic quarterly and annual reports that we file with the SEC. We are not subject to any limits or proportions under our investment guidelines with respect to the mix of target investments that we originate or acquire other than as necessary to maintain our qualification as a REIT for U.S. federal income tax purposes and our exemption from registration under the Investment Company Act.
Competition
We are engaged in a competitive business. Our net income depends, in part, on our ability to originate or acquire investments at favorable credit spreads over our borrowing costs. In our lending and investment activities, we compete for opportunities with a variety of institutional lenders and investors, including other REITs, specialty finance companies, public and private funds, commercial and investment banks, commercial finance and insurance companies and other financial institutions. Several other companies that have raised significant amounts of capital may have investment objectives and strategies that overlap with ours, which may create additional competition for lending and investment opportunities.
Some of our competitors may have a lower cost of funds and access to funding sources that may not be available to us. Many of our competitors are not subject to the operating constraints associated with REIT rule compliance or maintenance of an exclusion from regulation under the Investment Company Act. In addition, some of our competitors may have higher risk tolerances or different risk assessments than we do, which could allow them to consider a wider variety of loans and investments, offer more attractive pricing or other terms and establish more relationships than us. Furthermore, competition for originations of and investments in our target investments may lead to decreasing yields, which may further limit our ability to generate desired returns.
We believe our industry experience and relationships provide us with a competitive advantage and helpshelp us assess risks and determine appropriate risk and return parameters for our target investments. Additionally, we believe that our experience enables us to compete more effectively and generate attractive investment opportunities for our portfolio. However, we may not be able to achieve our business goals or expectations due to the competitive risks that we face.
For additional information concerning these competitive risks, see “Risk Factors -— Risks Related to our Lending and Investment Activities -— We operate in a competitive market for investment opportunities and competition may limit our ability
to originate or acquire desirable investments in our target investments and could also affect the pricing of these securitiesinvestments” included in Item 1A of this Annual Report on Form 10-K.
Human Capital
Our team of talented employees is fundamental to our success. As of December 31, 2021,2023, we employed 3335 individuals, all of whom are full time and based out of our two primary office locations in New York, New York, and Saint Louis Park, Minnesota.
We are committed to creating and supporting a positive work environment and culture where our employees can grow professionally and contribute to the success of our company. This includes fostering a culture of diversity and inclusion where we recognize and value differences in experience, capabilities and perspectives.the Company. Our core values of excellence, responsibility, integrity and respect also guide us in building and maintaining the fruitful, long-term relationships with our various internal and external stakeholders, including our employees. Highlights of the specific ways we support our team members follow.
Diversity, Equity, Inclusion and Belonging
We are dedicated to promoting a work environment that:
•is free from discrimination, harassment or retaliation because of race, color, ethnicity, creed, religion, national origin, sex, sexual orientation (including transgender status, gender identity or expression), pregnancy (including childbirth, lactation or related conditions), marital status, disability, public assistance, age, familial status, genetic information, local commissions activity, veteran status, uniformed servicemember status, or any other status protected by federal, state or local laws;
•provides fair treatment and mutual respect to all employees;
•is inclusive and embraces individual differences;
•provides equal employment opportunities based on ability, performance and potential;
•informs all team members of their rights and responsibilities with regards to fairness, equity and respect for all aspects of diversity;
•considers flexible work practices, benefits and policies to support employees and their changing needs; and
•is committed to the attraction, retention and development of a diverse range of talented, energetic and committed people.
We promote this work environment and culture in part through policies that provide for equal employment opportunities, equal pay, disability accommodation, religious accommodation, parental and other family leave, and accommodations for nursing mothers, as well as detailed prohibitions against sexual harassment and other forms of workplace harassment.
In addition, all officers and employees annually receive mandatory third-party training on anti-harassment and diversity, equity, inclusion and belonging. Topics addressed in such training have included creating a culture of belonging and addressing unconscious bias.
Employee Engagement
In the fall of 2022, we developed and implemented an annual survey to measure employee engagement and satisfaction and to identify any areas where we may improve our communities.
We strivework environment or culture. More than 90% of our team members have completed this engagement survey each year. More than 90% of respondents to attract and retain the most talented employees2023 survey indicated that they Strongly Agree or Agree that they feel like they are part of a team, they have confidence in the industry by offering competitive compensationleadership of the Company, and benefits, along with a positive work environment and culture. We use a combination of fixed and variable pay, including base salary, cash bonuses, merit increases, a 401(k) plan with company contributions and equity-based compensation thatthere is competitive and consistent with employee positions, knowledge and experience levels. Our benefits are designed to be competitive in the marketplace while providing comprehensive coverage that supports the physical, financial, and emotional health and well-being of our employees. This includes employer-paid medical and dental insurance benefits, vision insurance, health savings, commuter and dependent care flexible spending accounts, generous paid time off, company holidays, life insurance, paid parental leave, short-term and long-term disability benefits, employee assistance program, a gym reimbursement program and wellness benefits.good interdepartmental cooperation.
Professional Development
We encourage the ongoing professional development of our employees through attendance at industry conferences and events, tuition reimbursement, continuing education classes or workshops, certification and licensure support and role specificrole-specific training and development opportunities. Additionally, we conductoffer our employees tuition reimbursement for qualifying undergraduate or graduate course work.
We also support our employees’ development in their roles through annual company-wide training for cybersecurity, anti-harassmentperformance reviews, and diversitywe encourage regular dialogue and inclusioninteractions between employees and actively review our anti-discrimination, anti-harassment, retaliationtheir supervisor and whistleblower policies.senior leadership.
In response to the novel coronavirus, or COVID-19, pandemicHealth, Safety and related government measures, we have implemented changes that we believe areSecurity in the best interest ofWorkplace
We monitor external threats, such as public health risks or civil unrest, and adopt safety measures or otherwise modify our personnelpolicies and practices as well asneeded to protect our employees.
We strive to provide our employees with a safe and healthy work environment free from hazards, violence and threatening behavior. We have policies against violent conduct, firearms, drugs and alcohol, and tobacco in the communities in which we operate. For example, ourworkplace. All personnel have largely worked remotely duringan obligation to report all workplace accidents, injuries and unsafe equipment, practices or conditions.
Compensation and Benefits
We provide a comprehensive suite of compensation and benefits that includes the pandemic; we have institutedfollowing elements, among others, to promote our employees’ well-being:
•competitive compensation packages that consist of salaries, cash bonuses, merit increases and stock-based compensation for eligible employees;
•company-paid medical and dental insurance benefits for our full-time employees and their families;
•savings and investment opportunities, including a flexible return401(k) plan with company contributions and health savings accounts with company contributions;
•mental health and wellness offerings, including a gym reimbursement program, gym discount program, fitness rewards program, free subscriptions to a mental health and mediation app, and an employee assistance program;
•generous paid time off, ten company holidays and leave policies, including gender neutral parenting leave; and
•flexible/hybrid work strategy; and we have implemented additional safety measures for personnel working on-site.model, where employees may work up to two days a week remotely.
Government Regulation
We are required to maintain qualifications, approvals and licenses in a number of states in order to conduct our lending activities and own certain of our target investments. Licensing requirements vary considerably by state and may impose various different obligations on our business, including restrictions on loan origination activity; limits on finance charges, including type, amount and manner of charging fees; disclosure requirements; surety bond and minimum specified net worth requirements; periodic reporting requirements; notice requirements for changes in principal officers, directors or principal owners; and record keeping requirements. Additionally, our licensed entities may be required, from time to time, to submit to routine examinations by state regulatory agencies to ensure our compliance with applicable requirements. We are also required to comply with certain provisions of the Equal Credit Opportunity Act that are applicable to commercial loans. We intend to conduct our business so that neither we nor any of our subsidiaries are required to register as an investment company under the Investment Company Act.
We currently believe that compliance with existing statutes and regulations has not had a material adverse effect on our business. In recent years, there has been greater regulation of financial services firms, particularly in areas such as risk management, leverage and disclosure. While we expect that new regulations in these areas will be adopted and existing ones may change in the future, it is not possible at this time to forecast the exact nature of any future legislation, regulations, judicial
decisions, orders or interpretations, nor their impact upon our future business, financial condition or results of operations or prospects.
Taxation
REIT Qualification
We have elected to be taxed as a REIT for U.S. federal income tax purposes commencing with our taxable year ended December 31, 2017.purposes. Our qualification as a REIT depends upon our ability to meet, on a continuing basis, through actual investment and operating results, various complex requirements under the Code, relating to, among other things, the sources of our gross income, the composition and values of our assets, our distribution levels and the diversity of ownership of our shares. We believe that we have been organized in conformity with the requirements for qualification and taxation as a REIT under the Code, and that our intended manner of operation will enable us to meet the requirements for qualification and taxation as a REIT.
So long as we qualify as a REIT, we generally will not be subject to U.S. federal income tax on our taxable income that we currently distribute to our stockholders. If we fail to qualify as a REIT in any taxable year and do not qualify for certain statutory relief provisions, we will be subject to U.S. federal income tax at regular corporate rates and may be precluded from qualifying as a REIT for the subsequent four taxable years following the year during which we lost our REIT qualification. Even if we qualify for taxation as a REIT, we may be subject to certain U.S. federal, state and local taxes on our income or property. See “Risk Factors -— Risks Related to ourOur REIT Status and Certain Other Tax Items” included in Item 1A of this Annual Report on Form 10-K.
Investment Company Act Exemption
We conduct our operations so that neither we nor any of our subsidiaries are an “investment company” as defined in Section 3(a)(1)(A) or Section 3(a)(1)(C) of the Investment Company Act. We believe we are not an investment company under Section 3(a)(1)(A) of the Investment Company Act because we do not engage primarily, or hold ourselves out as being engaged primarily, in the business of investing, reinvesting or trading in securities. Rather, through our wholly owned or majority-owned subsidiaries, we are primarily engaged in non-investment company business related to real estate. In addition, we conduct our operations so that we do not come within the definition of an investment company under Section 3(a)(1)(C) of the Investment Company Act because less than 40% of our total assets on an unconsolidated basis will consist of “investment securities,” or the 40% test. Excluded from the term “investment securities” (as that term is defined in the Investment Company Act) are securities issued by majority-owned subsidiaries that are themselves not investment companies and are not relying on the exclusion from the definition of investment company set forth in Section 3(c)(1) or Section 3(c)(7) of the Investment Company Act. The Investment Company Act defines a majority-owned subsidiary of a person as a company where 50% or more of the outstanding voting securities of which are owned by such person, or by another company which is a majority-owned subsidiary of such person. The Investment Company Act defines voting securities as any security presently entitling the owner, or holder
thereof, to vote for the election of directors of a company. We treat entities in which we own at least a majority of the outstanding voting securities as majority-owned subsidiaries for purposes of the 40% test. We monitor our holdings to ensure ongoing compliance with this test.
We hold our assets primarily through direct or indirect wholly owned or majority-owned subsidiaries, certain of which are excluded from the definition of investment company pursuant to Section 3(c)(5)(C) of the Investment Company Act. We classify our assets for purposes of certain of our subsidiaries’ Section 3(c)(5)(C) exclusion from the Investment Company Act based upon no-action positions taken by the SEC staff and interpretive guidance provided by the SEC and its staff. Based on such guidance, to qualify for the exclusion pursuant to Section 3(c)(5)(C), each such subsidiary generally is required to hold at least (i) 55% of its assets in “qualifying” real estate assets and (ii) 80% of its assets in “qualifying” real estate assets and real estate-related assets. “Qualifying” real estate assets for this purpose include mortgage loans, certain B-Notes and certain mezzanine loans that satisfy various conditions as set forth in SEC staff no-action letters and other guidance, and other assets that the SEC staff in various no-action letters and other guidance has determined are the functional equivalent of senior mortgage loans for the purposes of the Investment Company Act. We treat commercial mortgage-backed securities, or CMBS, B-NotesB-notes and mezzanine loans that do not satisfy the conditions set forth in the relevant SEC staff no-action letters and other guidance, and debt and equity securities of companies primarily engaged in real estate businesses, as real estate-related assets. To the extent that the SEC staff publishes new or different guidance with respect to these matters, we may be required to re-classify our assets for purposes of the Investment Company Act, including for purposes of our subsidiaries’ compliance with the exclusion provided in Section 3(c)(5)(C) of the Investment Company Act.
If we were required to register as an investment company under the Investment Company Act, we would become subject to substantial regulation with respect to our capital structure (including our ability to use borrowings), management, operations, transactions with affiliated persons (as defined in the Investment Company Act) and portfolio composition, including disclosure requirements and restrictions with respect to diversification and industry concentration and other matters. Compliance with the Investment Company Act would, accordingly, limit our ability to make certain investments and require us to significantly restructure our business plan, which could materially adversely affect our ability to pay distributions to our stockholders. See “Risk Factors - Risks Related to ourOur Company and Structure - Maintaining our exclusions from registration as an investment company under the Investment Company Act imposes limits on our operations” included. Investment returns may be reduced if we are required to register as an investment company under the Investment Company Act” in Item 1A of this Annual Report on Form 10-K.
Additional Information
Our website can be found at www.gpmtreit.com. We make available, free of charge on our website (on the Investor RelationsInvestors page under “SEC Filings”), our annual reports on Form 10-K, quarterly reports on Form 10-Q, current reports on Form 8-K and any amendments to those reports, as are filed or furnished pursuant to Section 13(a) or 15(d) of the Exchange Act, as well as our proxy statement with respect to our annual meeting of stockholders, as soon as reasonably practicable after we electronically file such material with, or furnish it to, the SEC. Our Exchange Act reports filed with, or furnished to, the SEC are also available on the SEC’s website at www.sec.gov. The content of any website referred to in this Annual Report on Form 10-K is not incorporated by reference into this Form 10-K unless expressly noted.
Item 1A. Risk Factors
SUMMARY OF RISK FACTORS
•Our lending and investment activities subject us to the general political, economic, capital markets, competitive and other conditions in the United States, including with respect to the effects of the COVID-19 pandemic and other events that markedly impact United States financial markets.
•Fluctuations in interest rates and credit spreads could reduce our ability to generate income on our loans and other investments, which could lead to a significant decrease in our results of operations, our cash flows and the market value of our investments, and ultimately limit our ability to pay distributions to our stockholders.
•Adverse changes in the real estate and real estate capital markets could negatively impact our performance by making it more difficult for our borrowers to satisfy their debt payment obligations, which could result in losses on our loan investments and/or make it more difficult for us to generate consistent or attractive risk-adjusted returns.
•Our results of operations, financial condition and business could be materially adversely affected if we experience difficulty accessing financing or raising capital (including due to a significant dislocation in or shut-down of the capital markets), a reduction in the yield on our investments, an increase in the cost of our financing, an inability to borrow incremental amounts or an obligation to repay amounts under our financing arrangements or borrower defaults.
•Events giving rise to increases in our current expected credit loss reserve, including the impact of the COVID-19 pandemic,current economic environment, have had an adverse effect on our business and results of operations and could in the future have a material adverse effect on our business, financial condition and results of operations.
•Our lending and investment activities subject us to the general political, economic, capital markets, societal, competitive and other conditions that markedly impact financial markets, such as reduced demand for office properties as a result of remote working arrangements that allow work from remote locations other than an employer’s office premises.
•Adverse legislative or regulatory developments, including with respect to tax laws, securities laws and the laws governing financial and lending institutions, could increase our cost of doing business and/or reduce our operating flexibility and the price of our common stock.
•Acts of God, such as hurricanes, earthquakes and other natural disasters, including climate change-related risks, acts of war and/or terrorism, pandemics or outbreaks of infectious disease, such as the COVID-19 pandemic, and other events that can markedly impact financial markets, may cause unanticipated and uninsured performance declines and/or losses to us or the owners and operators of the real estate securing our investments.
•The economic impact of escalating global trade tensions, including those related to the conflict between Russia and Ukraine, and the ensuing adoption or expansion of economic sanctions or trade restrictions, could adversely affect the real estate securing our investments.
•Deterioration in the performance of properties securing our investments may cause deterioration in the performance of our investments, instances of default or foreclosure on such properties and, potentially, principal losses to us.
•Adverse developments in the availability of desirable investment opportunities whether they are due to competition, regulation or otherwise, could adversely affect our results of operations.
•Difficulty or delays in redeploying the proceeds from repayments of our existing loans and investments may cause our financial performance and returns to stockholders to suffer.
•Increased competition from entities engaged in mortgage lending and/or investing in our target assets may limit our ability to originate or acquire desirable loans and investments, and could also affect the yields on these assets and have a material adverse effect on our business, financial condition and results of operations.
•If we do not maintain our qualification as a REIT, we will be subject to tax as a regular corporation and could face a substantial tax liability.
RISK FACTORS
Risks Related to the Ongoing COVID-19 Pandemic
The ongoing COVID-19 pandemic has caused severe disruptions in the United States and global economy and to our business and may continue to have an adverse impact on our performance and results of operations.
As the COVID-19 pandemic has evolved from its emergence in early 2020, so has its global impact. Many countries have re-instituted, or strongly encouraged, varying levels of quarantines and restrictions on travel and have at times ceased or limited operations of certain businesses and taken other restrictive measures designed to help slow the spread of COVID-19 and its variants. Governments and businesses have also instituted vaccine mandates and testing requirements for employees. While vaccine availability and uptake have increased, the longer-term macroeconomic effects on global supply chains, inflation, labor shortages and wage increases continue to impact many industries, including U.S. commercial real estate and the collateral underlying certain of our loans and the business operations of our borrowers/sponsors. Moreover, with the potential for new strains of COVID-19 to emerge, governments and businesses may re-impose aggressive measures to help slow its spread in the future. For this reason, among others, as the COVID-19 pandemic continues, the potential global impacts are uncertain and difficult to assess.
The COVID-19 pandemic has had and may continue to have a material adverse impact on our financial condition, liquidity, results of operations and the market price of our common stock, among other things. We expect that these impacts are likely to continue to some extent as the pandemic persists and potentially even longer. Although many or all facets of our business have been or could be impacted by COVID-19, we currently believe the following impacts to be among the most material to us:
•Long-term impacts on the broader economy and the commercial real estate market could negatively impact the value of the assets collateralizing our loans. Our portfolio includes loans collateralized by hotel, retail, and other asset classes that are particularly negatively impacted by the pandemic, due to government-mandated closures and travel restrictions, supply and labor issues, and the ability and willingness of people to convene in group settings. While we believe the principal amount of our loans are generally adequately protected by the value of the underlying collateral, there can be no assurance that we will realize the entire principal amount of certain investments. In addition, inflation, interest rates and credit spreads have been significantly impacted since the outbreak of COVID-19. This can increase the volatility of the fair value of our loans and our liabilities and the interest obligations on our floating-rate debt, which could increase our interest expense.
•We actively engaged in discussions with our borrowers, some of whom indicated that, due to the impact of the COVID-19 pandemic, they were unable to timely execute their business plans, had to temporarily close their businesses or experienced other negative business consequences. As a result, some borrowers requested, and in certain instances we agreed to, near-term loan modifications, including repurposing of funds in certain reserve accounts, temporary deferrals of interest or performance tests and certain covenant waivers on loans collateralized by properties impacted by the COVID-19 pandemic. Due to the continuing impact of the COVID-19 pandemic, there may be additional loan modification requests from our borrowers and potentially instances of default or foreclosure on assets underlying our loans, which would adversely affect the credit profile of our assets and our results of operations and financial condition.
•The ongoing COVID-19 pandemic has at times curtailed liquidity in the commercial real estate capital markets, which in turn has reduced some sources of liquidity for our business primarily in terms of reduced portfolio loan repayments and more limited access to financing on favorable terms. However, many of our obligations, including unfunded loan commitments, were not similarly reduced. Although our liquidity position substantially increased during the third quarter of 2020 and throughout 2021, there can be no assurance that we will avoid the need to sell assets at inopportune times, engage in dilutive capital raising on unfavorable terms in order to generate the liquidity required to meet our obligations, or change our dividend practice, including by reducing the amount of, or temporarily suspending, our future dividends or paying our future dividends in kind for some period of time. Furthermore, there can be no assurance that we will have access to financing and corporate capital on terms that are acceptable to us.
•COVID-19 initially caused us to materially increase our current expected credit loss, or CECL, reserve. Our initial CECL reserve of $18.5 million recorded on January 1, 2020, was reflected as a direct charge to retained earnings on our consolidated statements of changes in equity. During the year ended December 31, 2020, we recorded a $53.7 million net increase in the CECL reserve, bringing our total CECL reserve to $72.2 million as of December 31, 2020. During the year ended December 31, 2021, we recorded an aggregate $20.0 million decrease in the CECL reserve related to loans held for investment and unfunded loan commitments and a write-off of $9.7 million, bringing our total reserve to $42.4 million as of December 31, 2021. This CECL reserve reflects, among other things, the macroeconomic impact of the COVID-19 pandemic on commercial real estate markets generally, as well as certain loans with unique risk characteristics assessed individually for credit loss in our portfolio. Further, this reserve does not reflect what we expect our CECL reserve would be absent the current and potential future impacts of the COVID-19 pandemic. If the adverse macroeconomic effects of the COVID-19 pandemic persist or worsen, we may further materially increase our CECL reserve, which may have a material adverse effect on our business, financial condition, results of operations and ability to make distributions.
We have also experienced and may continue to experience other negative impacts to our business as a result of the pandemic that could exacerbate other risks discussed in this “Risk Factors” section.
The ongoing fluidity of this situation precludes any prediction as to the ultimate adverse impact of COVID-19 on economic and market conditions and, as a result, presents material uncertainty and risk with respect to us and the performance of our investments. The full extent of the impact and effects of COVID-19 will depend on future developments, including, among other factors, the duration and spread of the virus and its variants, availability, acceptance and effectiveness of vaccines along with related travel advisories, quarantines and restrictions, the recovery time of the disrupted supply chains and industries, the impact of labor market interruptions, the impact of government interventions, and uncertainty with respect to the duration of the global economic slowdown. COVID-19 and the current financial, economic and capital markets environment, and future developments in these and other areas present uncertainty and risk with respect to our performance, results of operations and ability to pay distributions.
Risks Related to Our Lending and Investment Activities
Our loans and investments expose us to risks associated with debt-oriented real estate investments generally.
We seek to invest primarily in debt investments in or relating to commercial real estate assets. Any deteriorationDeterioration of real estate fundamentals generally, and in the United States in particular, could negatively impact our performance, increasehas increased the default risk applicable to borrowers, and/or makemade it relatively more difficult for us to generate attractive risk-adjusted returns.returns and continues to negatively impact our performance. Changes in general economic conditions including as a result of the COVID-19 pandemic, will affecthave affected the creditworthiness of borrowers and/orand the value of underlying real estate collateral relating to our investmentsinvestments. Such changes have included, and may in the future include, economic and/or
market fluctuations, reduced demand for office properties as a result of increases in remote working arrangements, changes in environmental, zoning and other laws, casualty or condemnation losses, regulatory limitations on rents, or moratoriums against tenant evictions and/or foreclosures, decreases in property values, changes in the appeal of properties to tenants, (including due to the impact of COVID-19 on how tenants and workers can safely and efficiently use commercial space), changes in supply and demand of real estate products, fluctuations in real estate fundamentals, (including average occupancy and room rates for hotel properties),the financial resources of borrower entities, energy and supply shortages, various uninsured or uninsurable risks, natural disasters, terrorism, acts of war, outbreaks of pandemic or contagious diseases, changes in government regulations, (such as rent control), political and legislative uncertainty, changes in monetary policy, changes in real
property tax rates and operating expenses, changes in interest rates, changes in the availability of debt financing and/or mortgage funds which may render the sale or refinancing of properties difficult or impracticable, increased mortgage defaults, increases in borrowing rates, changes in consumer spending, negative developments in the economy that depress travel activity, escalating global trade tensions, the conflict between Russia and Ukraine, deteriorating conditions in the Middle East, adverse changes in demand and/or real estate values generally and other factors that are beyond our control. In addition, our investments may be exposed to new or increased risks and liabilities associated with global climate change, such as increased frequency or intensity of adverse weather and natural disasters, which could negatively impact our and our borrowers' businesses and the value of the properties securing our investments. We cannot predict the degree to which economic conditions generally, and the conditions for real estate debt investing in particular, will improve or decline. Any future declines in the performance of the U.S. and global economies or in the real estate debt markets could have a material adverse effect on our business, financial condition, and results of operations.
We operate in a competitive market for investment opportunities and competition may limit our ability to originate or acquire our target investments and could also affect the pricing of these investments.
A number of entities compete with us to make the types of loans and investments we seek to originate or acquire. Our profitability depends, in large part, on our ability to originate or acquire target investments on attractive terms. We compete with a variety of institutional lenders and investors, including other REITs, specialty finance companies, public and private funds, commercial and investment banks, commercial finance and insurance companies and other financial institutions. Some of our competitors have raised, and may in the future raise, significant amounts of capital and may have investment objectives that overlap with ours, which may create additional competition for lending and investment opportunities. Some competitors may have a lower cost of funds and access to funding sources that are not available to us. Many of our competitors are not subject to the operating constraints associated with REIT rule compliance or maintenance of an exclusion from registration under the Investment Company Act. In addition, some of our competitors may have higher risk tolerances or different risk assessments, which could allow them to consider a wider variety of loans and investments, offer more attractive pricing or other terms and establish more relationships than we. Furthermore, competition for originations of and investments in our target investments may lead to the yields of such assets decreasing, which may further limit our ability to generate satisfactory returns.
As a result of this competition, desirable loans and investments in our target investments may be limited in the future and we may not be able to take advantage of attractive lending and investment opportunities from time to time. We can provide no assurance that we will be able to identify and originate loans or make investments that are consistent with our investment objectives. We cannot assure you that the competitive pressures we face will not have a material adverse effect on our business, financial condition and results of operations. There can be no assurance that any current relationships with such parties will continue (whether on currently applicable terms or otherwise) or that we will be able to establish relationships with other such persons in the future if desired and on terms favorable to us.
Fluctuations in interest rates and credit spreads could reduce our ability to generate income on our loans and other investments, which could lead to a significant decrease in our results of operations, cash flows and the market value of our investments and may limit our ability to pay distributions to our stockholders.
Our primary interest rate exposures relate to the yield on our loans and other investments and the financing cost of our debt. Changes in interest rates and credit spreads may affect our net interest income from loans and other investments, which is the difference between the interest and related income we earn on our interest-earning investments and the interest and related expense we incur in financing these investments. Interest rate and credit spread fluctuations resulting in our interest and related expense exceeding interest and related income would result in operating losses for us. Changes in the level of interest rates and credit spreads also may affect our ability to make loans or investments, the value of our loans and investments and our ability to realize gains from the disposition of assets. Increases in interest rates and credit spreads may also negatively affect demand for loans and could result in higher borrower default rates.
Our operating results depend, in part, on differences between the income earned on our investments, net of credit losses, and our financing costs. The yields we earn on our floating-rate assets and our borrowing costs tend to move in the same direction in response to changes in short-term interest rates. However, one can rise or fall faster than the other, causing our net interest margin to expand or contract. In addition, we could experience reductions in the yield on our investments and an increase in the cost of our financing. Although we seek to match the terms of our liabilities to the expected tenor of loans that we acquire or originate, circumstances may arise in which our liabilities are shorter in duration than our assets, resulting in their adjusting faster in response to changes in interest rates. For any period during which our investments are not match-funded, the income earned on such investments may respond more slowly to interest rate fluctuations than the cost of our borrowings. Consequently, changes in interest rates, particularly short-term interest rates, may immediately and significantly decrease our
results of operations and cash flows and the market value of our investments, and any such change may limit our ability to pay distributions to our stockholders. In addition, unless we enter into hedging or similar transactions with respect to the portion of our assets that we fund using our balance sheet, returns we achieve on such assets will generally increase as interest rates for those assets rise and decrease as interest rates for those assets decline.
A prolonged economic slowdown, a lengthy or severe recession or declining real estate values could impair our investments and harm our operations.
We believe the risks associated with our business will be more severe during periods of economic slowdown or recession if these periods are accompanied by declining real estate values. Declining real estate values will likely reduce the level of new mortgage and other real estate-related loan originations since borrowers often use appreciation in the value of their existing properties to support the purchase of or investment in additional properties. Borrowers may not have control over certainalso be less able to pay principal and interest on our loan investments if the value of real estate weakens. Further, declining real estate values significantly increase the likelihood that we will incur losses on our loans and investments.
Ourloan investments in the event of default because the value of the collateral underlying a loan investment may be insufficient to cover our cost on the loan investment. Any sustained period of increased payment delinquencies, foreclosures or losses could adversely affect our ability to manageinvest in and finance our portfolioloan investments, which would materially and adversely affect our results of loansoperations, financial condition, liquidity and investments may be limited bybusiness and our ability to pay dividends to stockholders.
Market disruptions in a single country could cause a worsening of conditions on a regional and even global level, and economic problems in a single country are increasingly affecting other markets and economies. A continuation of this trend could result in problems in one country adversely affecting regional and even global economic conditions and markets. For example, Russia’s invasion of Ukraine has disrupted energy prices and the formmovement of goods in which they are made. In certain situations, we may:Europe resulting in rising energy costs and inflation more generally. The occurrence of similar crises in the future could cause increased volatility in the economies and financial markets of countries throughout a region, or even globally.
•acquire investments subjectAdditionally, global trade disruption, significant introductions of trade barriers and bilateral trade frictions, including due to rights of senior classes, special servicerswar or collateral managers under intercreditor, servicing agreements or securitization documents;
•pledgeother hostilities, together with any future downturns in the global economy resulting therefrom, could adversely affect our investments as collateral for financing arrangements;
•acquire only a minority and/or a non-controlling participation in an underlying investment; or
•rely on independent third-party management or servicing with respect to the management of an asset.
Therefore, we may not be able to exercise control over all aspects of our loans or investments. Such financial assets may involve risks not present in investments where senior creditors, junior creditors or servicers are not involved. Our rights to control the process following a borrower default may be subject to the rights of senior or junior creditors or servicers whose interests may not be aligned with ours.performance.
Most commercial real estate loans are nonrecourse loans and the assets securing these loans may not be sufficient to protect us from a partial or complete loss if a borrower defaults on a loan, which could materially and adversely affect us.
Except for customary nonrecourse carve-outs for certain “bad acts” and environmental liability, most commercial real estate loans are nonrecourse obligations of the borrower, meaning that there is no recourse against the assets of the borrower other than the underlying collateral. In the event of any default under a commercial real estate loan, we bear the risk of loss to the extent of any deficiency between the value of the collateral and the principal of and accrued interest on the loan, which could have a material adverse effect on our results of operations and financial condition. Even if a commercial real estate loan is recourse to the borrower (or if a nonrecourse carve-out to the borrower applies), in many cases, the borrower’s assets are limited primarily to its interest in the related mortgaged property. Further, although a commercial real estate loan may provide for limited recourse to a principal or affiliate of a borrower, there is no assurance that any recovery from such principal or affiliate will be made or that such principal’s or affiliate’s assets would be sufficient to pay any otherwise recoverable claim. In the event of the bankruptcy of a borrower, the loan to such borrower will be deemed to be secured only to the extent of the value of the underlying collateral at the time of bankruptcy (as determined by the bankruptcy court) and the lien securing the loan will be subject to the avoidance powers of the bankruptcy trustee or debtor-in-possession to the extent the lien is unenforceable under state law.
We may be subject to risks associated with commercial real estate loan participations.
Some of our commercial real estate loans may be held in the form of participation interests or co-lender arrangements in which we share the loan rights, obligations and benefits with other lenders. With respect to such participation interests, we may require the consent of these parties to exercise our rights under such loans, including rights with respect to amendment of loan documentation, enforcement proceedings upon a default and the institution of, and control over, foreclosure proceedings. In circumstances where we hold a minority interest, we may become bound to actions of the majority to which we otherwise would object. We may be adversely affected by this lack of control with respect to these interests.
Our portfolio of investments may be concentrated by geography, property type or sponsor, which could subject us to increased risk of loss.
The investment guidelines adopted by our board of directors do not require us to observe specific diversification criteria. OurThe properties securing our investments may at times be concentrated in certain property types or geographies that may be subject to higher risk of default or foreclosure, orloss. For example, our concentration of investments secured by office properties concentrated inare subject to a limited numberhigher risk of geographic locations.loss as a result of increased hybrid work schedules, which allow employees to work from remote locations other than their employer’s office premises.
Asset concentration may cause even modest changes in the value of the underlying real estate assets to significantly impact the value of our investments. As a result of any high levels of concentration, any adverse economic, political, social, climate-related or other condition, such as the increased frequency or intensity of adverse weather and natural disasters associated with global climate change, that disproportionately affects those geographic areas or asset classes could have a magnified adverse effect on our results of operations and financial condition, and the value of our stockholders’ investments could vary more widely than if we invested in a more diverse portfolio of loans.
Real estate valuation is inherently subjective and uncertain.uncertain, and is subject to change, especially during periods of volatility.
The valuation of real estate, and therefore the valuation of any collateral underlying our loans, is inherently subjective due to, among other factors, the individual nature of each property, its location, the expected future rental revenues from that particular property and the valuation methodology adopted. Appraisals we obtain from third-party appraisers may be overstated or market values may decline, which could result in inadequate collateral for loans we make. In addition, where we invest in loans that involve renovations, restorations or construction, initial valuations will assume completion of the business plan or project. As a result, the valuations of the real estate assets against which we will make or acquire loans are subject to a large
degree of uncertainty and are made on the basis of assumptions and methodologies that may not prove to be accurate, particularly in periods of volatility, macroeconomic and local economic uncertainty, disrupted supply chains effecting the timing of delivery and cost of materials, inflationary pressures, low transaction flow or restricted debt availability. Regardless of whether an appraisal is accurate at the time it is completed, all valuations are subject to change, especially during periods of market volatility or reduced demand for real estate, which may make it difficult to ensure loans are collateralized as expected across the life of the loan. See “ — Risks Related to Our Lending and Investment Activities — Loans on properties in transition may involve a greater risk of loss than conventional mortgage loans.”
The valuation of assets or loans we hold may not reflect the price at which the asset or loan is ultimately sold in the market, and the difference between that valuation and the ultimate sales price could be material. Valuation methodologies are subject to change from time to time.
The lack of liquidity of our investments may adversely affect our business, including our ability to value, finance and sell our investments.
The illiquidity of some or all of our investments, and investments we intend to make, may make it difficult for us to sell such investment if the need or desire arises. Investments such as senior commercial mortgages, B-notes, mezzanine and other loans (including participations) and preferred equity, in particular, are relatively illiquid due to their short life, limited potential for financing and greater difficulty of recovery in the event of a borrower’s default. We are also required to hold certain risk retention interests in certain of our securitization transactions. In addition, certain of our investments may become less liquid as a result of periods of delinquencies, defaults or turbulent market conditions, such as those we experiencedincluding due to current market conditions and continue to experience throughout the COVID-19 pandemic,exacerbated market volatility, which may make it more difficult for us to dispose of such assets at advantageous times or in a timely manner.
Consequently, even if we identify a buyer for certain of our investments, there is no assurance that we would be able to sell such investments in a timely manner if the need or desire arises. In addition, if we are required to liquidate all or a portion of our portfolio quickly, we may be forced to sell our investments at a price that is significantly less than the value at which we previously attributed to such investments.
Further, we may face other restrictions on our ability to liquidate an investment to the extent that we have or could be attributed as having material, non-public information regarding such business entity. As a result, our ability to vary our portfolio in response to changes in economic or other conditions may be relatively limited, which could adversely affect our results of operations and financial condition.
The due diligence process that we undertake with regard to investment opportunities may not reveal all facts that may affect an investment and if we incorrectly evaluate the risks of our investments, we may experience losses.
Before making investments, we conduct due diligence that we deem reasonable and appropriate based on the facts and circumstances relevant to each potential investment. When conducting due diligence, we may be required to evaluate important and complex issues, including, but not limited to, those related to business, financial, tax, accounting, environmental and legal and regulatory and macroeconomic trends, as well as environmental, social and governance, or ESG, matters. Outside consultants, legal advisors, accountants and investment banks may be involved in the due diligence process in varying degrees depending on the type of potential investment. SelectingThe due diligence investigation with respect to any investment opportunity may not reveal or highlight all relevant facts (including fraud) or risks that may be necessary or helpful in evaluating such investment opportunity, and we may not identify or foresee future developments that could have a material adverse effect on an investment. In addition, selecting and evaluating material due diligence matters, including ESG factors, is subjective by nature, and there is no guarantee that the criteria utilized or judgment exercised by us or a third-party specialist (if any) will reflect the beliefs, values, internal policies or preferred practices of any particular investor or align with the beliefs or values or preferred practices of other commercial real estate debt investors or with market trends. The materiality of sustainability risks and impacts on an individual potential investment or portfolio as a whole depends on many factors, including the relevant industry, location, asset class and investment strategy. Relying on the resources available to us, we evaluate our potential investments based on criteria we deem appropriate for the relevant investment. Our loss estimates may not prove accurate, as actual results may vary from estimates. If we underestimate the asset-level losses, we may experiencebe required to recognize an impairment and/or realize losses with respect to such investment.
Moreover, our investment analyses and decisions may frequently be required to be undertaken on an expedited basis to take advantage of investment opportunities. In such cases, the information available to us at the time of making an investment decision may be limited, and we may not have access to detailed information regarding such investment. Further, some matters covered by our diligence, such as ESG, are continuously evolving from an assessment, regulatory and compliance standpoint, and we may not accurately or fully anticipate such evolution. Therefore, we cannot assure you that we will have knowledge
The timing of all circumstances that may adversely affect such investment.
Investments that are subordinated or otherwise junior in an issuer’s capital structureloan investment repayments is difficult to predict and that involve privately negotiated structures expose us to greater risk of loss.
In addition to our senior floating-rate commercial mortgage loans, our portfolio contains mezzanine loans, and a B-note, and in the future, we may invest in CMBS, CRE CLOs, preferred equity investments and other investments that are subordinated or otherwise junior in an issuer’s capital structure and that involve privately negotiated structures. Any investments in subordinated debt and mezzanine tranches of a borrower’s capital structure and our remedies with respect thereto, including the ability to foreclose on any collateral securing such investments, are subject to the rights of any senior creditors and, to the extent applicable, contractual intercreditor and/or participation agreement provisions. Significant losses related to such loans or investments could adversely affect our results of operations and financial condition.
Investments in subordinated debt involve greater credit risk of default than the senior classes of the issue or series. As a result, with respect to any investments in CMBS, CRE CLOs, B-notes, mezzanine loans and other subordinated debt, we would potentially receive payments or interest distributions after, and must bear the effects of losses or defaults on the senior debt (including underlying senior mortgage loans, class A-Notes, senior mezzanine loans, preferred equity or senior CMBS or CRE CLO bonds, as applicable) before the holders of other more senior tranches of debt instruments with respect to such issuer. As the terms of such loans and investments are subject to contractual relationships among lenders, co-lending agents and others, they can vary significantly in their structural characteristics and other risks.
Mezzanine loans are, by their nature, structurally subordinated to more senior property-level financings. If a borrower defaults on a mezzanine loan or on debt senior to that loan, or if the borrower is in bankruptcy, the mezzanine loan will be satisfied only after the property-level debt and other senior debt is paid in full. In addition, mezzanine loans may have higher loan-to-loan value ratios than conventional mortgage loans, resulting in less equity in the property and increasing the risk of loss of principal. As a result, a partial loss in the value of the underlying collateral can result in a total loss of the value of the mezzanine loan. In addition, even if we are able to foreclose on the underlying collateral following a default on a mezzanine loan, we would be substituted for the defaulting borrower and, to the extent income generated on the underlying property is insufficient to meet outstanding debt obligations on the property, we may need to commit substantial additional capital and/or deliver a replacement guarantee by a creditworthy entity, which could include us, to stabilize the property and prevent additional defaults to lenders with existing liens on the property.
B-notes are mortgage loans that are typically secured by a first mortgage on a single commercial property or group of related properties, but subordinate to an A-note secured by the same first mortgage on the same collateral. As a result, if a borrower defaults, there may not be sufficient funds remaining for B-note holders after payment to the A-note holders. Because each transaction is privately negotiated, B-notes can vary in their structural characteristics and risks. For example, the rights of holders of B-notes to control the process following a borrower default may vary from transaction to transaction. Further, B-notes typically are secured by a single property and accordingly reflect the risks associated with significant concentration. Losses related to our B-notes could adversely affect our financial condition and results of operations.
Investments in preferred equity involve a greater risk of loss than conventional debt financing due to a variety of factors, including their non-collateralized nature and subordinated ranking to other loans and liabilities of the entity in which such preferred equity is held. Accordingly, if the issuer defaults on our preferred equity investment, we would only be able to proceed against such entity in accordance with the terms of the preferred equity, and not against any property owned by such entity. Furthermore, in the event of bankruptcy or foreclosure, we would only be able to recoup our investment after all lenders to, and other creditors of, such entity are paid in full. As a result, we may lose all or a significant part of any such investment, which could result in significant losses and adversely affect our results of operations and financial condition.
In addition, our investments in senior mortgage loans may be effectively subordinated to the extent we borrow under a repurchase facility or another facility involving a pledge the senior mortgage loan as collateral. Under these arrangements, the lender has a right to repayment of the borrowed amount before we can collect on the value of the senior mortgage loan, and therefore, if the value of the pledged senior mortgage loan decreases below the amount we have borrowed, we would experience a loss.
Prepayment rates may adversely affect our financial performance and the value of certain of our investments.
Generally, our borrowers may repay their loans prior to their stated maturities. In periods of declining interest rates and/or credit spreads, or as the business plans for the underlying collateralizing properties reach completion, prepayment rates on loans
generally increase. If general interest rates or credit spreads decline at the same time, the proceeds of such prepayments received during such periods may not be reinvested for some period of time or may be reinvested by us in assets with lower yields than the assets that were prepaid.
Because our commercial mortgage loans are generally not originated In periods of increasing rates and/or acquired at a premium to par value,credit spreads, prepayment rates do not materially affect the value of such investments. However, the value of certain otheron our loan investments may be affected by prepayment rates. For example, if we originatewill generally decrease, which could impact our liquidity or acquire mortgage-related securities or a pool of mortgage securities in the future, we would anticipate that the underlying mortgages would prepay at a projected rate generating an expected yield. If we wereincrease our exposure to purchase such investments at a premium to par value, if borrowers prepay their loans faster than expected, the corresponding prepayments on any such mortgage-related securities would likely reduce the expected yield. Conversely, if we
were to purchase such investments at a discount to par value, when borrowers prepay their loans slower than expected, the decrease in corresponding prepayments on the mortgage-related securities would likely reduce the expected yield.loan non-performance.
Prepayment rates on loans may be affected by a number of factors, including, but not limited to, the then-current level of interest rates and credit spreads, the availability of mortgage credit and investment capital, the status of the business plan for the underlying collateralizing property, the relative economic vitality of the area in which the related properties are located, the servicing of the loans, possible changes in tax laws, other opportunities for investment and other economic, social, geographic, demographic and legal factors beyond our control. Consequently, such prepayment rates cannot be predicted with certainty and no strategy can completely insulate us from prepayment or other such risks. If prepayment rates exceed our expectations, we may have greater difficulty in redeploying the proceeds into new investment opportunities, which may significantly increase our cash balance and exacerbate the risks related to our cash management strategy. For further discussion of the risks related to capital deployment, see “Risk Factors-Risks — Risks Related to Our Lending and Investment Activities-Activities — Difficulty or delays in redeploying the proceeds from repayments of our existing loans and investments may cause our financial performance and returns to stockholders to suffer.”
Our existing loan investments often contain call protection provisions that require a certain minimum amount of interest due to us regardless of when the loan is repaid. These include prepayment fees expressed as a percentage of the unpaid principal balance, or the amount of foregone net interest income due us from the date of repayment through a date that is frequently twelve or eighteen months after the origination date. Loan investments that are outstanding beyond the end of the call protection or yield maintenance period can be repaid with no prepayment fees or penalties. The absence of call protection provisions may expose us to the risk of early repayment of loans, and the inability to redeploy capital accretively. Difficulty in redeploying the proceeds from repayments of our existing loan investments and investments may cause our financial performance and returns to investors to suffer.
Difficulty or delays in redeploying the proceeds from repayments of our existing loans and investments may cause our financial performance and returns to stockholders to suffer.
As our loans and investments are repaid, we will have tomay redeploy the proceeds we receive into new loans and investments (which can include future fundings associated with our existing loan investments), repay borrowings under our credit facilities, pay dividends to our stockholders or repurchase outstanding shares of our common stock. It is possible that we will fail to identify reinvestment options that would provide returns or a risk profile that is comparable to the asset that was repaid. If we fail to redeploy, or experience any delays in redeploying, the proceeds we receive from repayment of a loan in equivalent or better alternatives, our financial performance and returns to stockholders could suffer.
In light of our investment strategy and the need to be able to invest capital quickly to capitalize on potential investment opportunities, we may from time to time maintain cash pending deployment into investments, which may at times be significant. Such cash may be held in an account of ours for the benefit of stockholders or may be invested in money market accounts or other similar temporary investments. While the duration of such holding period is expected to be relatively short, in the event we are unable to find suitable investments, such cash positions may be maintained for longer periods. It is not anticipated that the temporary investment of such cash into money market accounts or other similar temporary investments pending deployment into investments will generate significant interest, and such low interest payments on the temporarily invested cash may adversely affect our financial performance and returns to investors.
We may be subject to lender liability claims, and if we are held liable under such claims, we could be subject to losses.
In recent years, aA number of judicial decisions have upheld the right of borrowers to sue lending institutions on the basis of various evolving legal theories, collectively termed “lender liability.” Generally, lender liability is founded on the premise that a lender has either violated a duty, whether implied or contractual, of good faith and fair dealing owed to the borrower or has assumed a degree of control over the borrower resulting in the creation of a fiduciary duty owed to the borrower or its other creditors or stockholders. We cannot assure you that such claims will not arise or that we will not be subject to significant liability if a claim of this type did arise.
Liability relating to environmental matters may impact the value of properties that we may acquire upon foreclosure ofour investments and the properties underlying our investments.
To the extent we take title to any of the properties underlying our investments, we may be subject to environmental liabilities arising from such properties. Under various U.S. federal, state and local laws, an owner or operator of real property may become liable for the costs of removal of certain hazardous substances released on its property. These laws often impose liability without regard to whether the owner or operator knew of, or was responsible for, the release of such hazardous substances.
The presence of hazardous substances may adversely affect an owner’s ability to sell real estate or borrow using real estate as collateral. To the extent an owner of a property underlying one of our debt investments becomes liable for removal costs, the ability of the owner to make payments to us may be reduced, which, in turn, may adversely affect the value of the relevant asset held by us and our ability to make distributions to our stockholders.
To the extent we acquire any property underlying our investments, the presence of hazardous substances on such property may adversely affect our ability to sell the property and we may incur substantial remediation costs, thus harming our financial condition. The discovery of material environmental liabilities attached to such properties could have a material adverse effect on our results of operations and financial condition and our ability to make distributions to our stockholders.
The properties underlying our investments may be subject to other unknown liabilities that could adversely affect the value of these properties and, as a result, our investments.
Properties underlying our investments may be subject to other unknown or unquantifiable liabilities that may adversely affect the value of our investments. Such defects or deficiencies may include title defects, title disputes, liens or other encumbrances on the mortgaged properties. The discovery of such unknown defects, deficiencies and liabilities could affect the ability of our borrowers to make payments to us or could affect our ability to take title to and sell the underlying properties, which could adversely affect our results of operations and financial condition.
Commercial real estate debt investments may be subject to delinquency, foreclosure and loss, which may adversely impact our business, results of operations and financial condition.
Investments in the commercial real estate debt market are subject to risks of borrower delinquency, foreclosure and loss. The ability of a borrower to repay a loan secured by an income-producing property typically is dependent primarily upon the successful operation of the property, as opposed to the borrower’s independent income or assets. If the net operating income of the property is reduced, the borrower’s ability to repay the loan may be impaired. The net operating income of an income-producing property can be affected by numerous factors, including, but not limited to:
•tenant mix;
•success of tenant businesses and tenant bankruptcies;
•property management decisions, including decisions on capital improvements, particularly in older building structures;
•renovations or repositionings during which operations may be limited or halted completely;
•property location and condition;
•competition from similar properties;
•changes in national, regional or local economic conditions, real estate values or rental or occupancy rates;
•increases in remote working arrangements and the subsequent effect on demand for commercial real estate, particularly office properties;
•labor shortages and increasing wages;
•changes in interest rates and in the state of the credit and securitization markets and the debt and equity capital markets, including thediminished availability or lack of debt financing for commercial real estate;
•changes in governmental rules, regulations and fiscal policies, including income tax regulation, real estate taxes, environmental legislation and zoning laws;
•responses of businesses, governments and individuals to pandemics or outbreaks of contagious disease;
•environmental contamination;contamination and any liabilities relating to environmental matters at the property;
•fraudulent acts or theft on the part of the property owner, sponsor and/or property manager; and
•acts of God, natural disasters, such as hurricanes, earthquakes, wildfires and floods, including climate change-related risks, terrorism,risks; terrorism; social unrest,unrest; civil disturbances and other events which may result in property damage, decrease the availability of or increase the cost of insurance or otherwise result in uninsured losses.
In addition, we are exposed to the risk of judicial proceedings with our borrowers and entities in which we invest, including bankruptcy or other litigation, as a strategy to avoid foreclosure or enforcement of other rights by us as a lender or investor. In the event any of the properties or entities underlying or collateralizing our commercial real estate loans or investments experiences or continues to experience adverse effects from the COVID-19 pandemic or experiences any of the foregoing events or occurrences, the value of, and return on, such investments could be reduced, which, in turn, would adversely affect our results of operations and financial condition.
Loans on properties in transition may involve a greater risk of loss than conventional mortgage loans.
We have originated or acquired, and may continue to originate or acquire,The majority of our lending involves transitional loans to borrowers who are seeking relatively short-term capital to be used in an acquisition or rehabilitation of a property. The typical borrower under a transitional loan has usually identified an asset it believes is an undervalued asset that has been under-managed and/or is located in a recovering market. If the borrower’s assessment of the asset as undervalued is inaccurate, or if the market in which the asset is located fails to improve according to the borrower’s projections, or if the borrower fails to improve the quality of the asset’s management and/or the value of the asset or stabilize the property, the borrower may not be able to satisfy the transitional loan through a sale of the property or conventional financing, and we bear the risk of loss of principal and non-payment of interest and fees. During periods in which there are decreases in demand for certain properties as a result of macroeconomic factors, reductions in the financial resources of tenants and defaults by borrowers or tenants, borrowers face additional challenges in transitioning properties. Market downturns or other adverse macroeconomic factors may affect transitional loans in our portfolio more adversely than loans secured by more stabilized assets.
Furthermore, the renovation, refurbishment or expansion of a property in transition by a borrower involves various risks, of cost overruns and noncompletion. Estimates of the costs of improvements to bring an acquired property up to standards established for the market position intended for that property may prove inaccurate. Other risks may includeincluding rehabilitation costs exceeding original estimates (possibly making a project uneconomical)(including as the result of inflation in the cost of labor and materials),
environmental risks, delays in legal and other approvals and rehabilitation and subsequent leasing of the property not being completed on schedule.schedule or at all. If such renovation is not completed in a timely manner, or if costs are greater than expected, the borrower may experience a prolonged reduction of net operating income and may not be able to make payments on our investment on a timely basis or at all, which could result in significant losses.
Borrowers often use the proceeds of a conventional mortgage loan to repay a transitional loan. Transitional loans, therefore, are subject to risks of a borrower’s inability to obtain permanent financing on suitable terms to repay the transitional loan.loan and the broader availability of conventional mortgages at amenable rates. In the event of any default under transitional loans that may be held by us, we bear the risk of loss of principal and non-payment of interest and fees to the extent of any deficiency between the value of the mortgage collateral and the principal amount and unpaid interest of the transitional loan. To the extent we suffer such losses with respect to these transitional loans, it could adversely affect our results of operations and financial condition.
Our potential investments in CMBS, CRE CLOs and other similarly structured finance investments, as well as those we structure, sponsor or arrange, may pose additional risks, including the risks arising from the securitization process and the risk that the special servicer may take actions that could adversely affect our interests.
We may invest in CMBS, CRE CLOs and other similar securities in the future, which may be subordinated classes of securities in a structure of securities secured by a pool of loans. Accordingly, such securities may be the first, or among the first, to bear the loss upon a restructuring or liquidation of the underlying collateral and the last to receive payment of interest and principal, with only a nominal amount of equity or other debt securities junior to such positions. The estimated fair values of such subordinated interests tend to be much more sensitive to adverse economic downturns and underlying borrower developments than more senior securities. A projection of an economic downturn, for example, could cause a decline in the price of lower credit quality CMBS or CRE CLOs or collateralized debt obligations, or CDOs, because the ability of borrowers to make principal and interest payments on the loans underlying such securities may be impaired.
Subordinate interests such as CMBS, CRE CLOs CDOs and similarly structured finance investments generally are not actively traded or are subject to transfer restrictions and are relatively illiquid investments. Volatility in CMBS and CRE CLO and CDO trading markets may cause the value of these investments to decline. In addition, if the underlying mortgage portfolio has been overvalued by the originator, or if the values subsequently decline and, as a result, less collateral value is available to satisfy interest and principal payments and any other fees in connection with the trust or other conduit arrangement for such securities, we may incur significant losses.
With respect to the CMBS, CRE CLOs and other similar securities, overall control over the special servicing of the related underlying loans are held by a “directing certificate holder” or a “controlling class representative,” which is appointed by the holders of the most subordinated class of securities in such series. To the extent we acquire classes of existing series of such securities, we will not have the right to appoint the directing certificate holder. In connection with the servicing of the specially serviced loans, the related special servicer may, at the direction of the directing certificate holder, take actions with respect to the specially serviced mortgage loans that could adversely affect our interests. See “Risk Factors-Risks — Risks Related to Our Financing and Hedging-UseHedging — Use of nonrecourse securitizations to finance our loans and investments may expose us to risks that could result in losses” for a discussion of additional risks related to our securitization transactions.
Declines in the market values of any available-for-sale investments may adversely affect our results of operations and financial condition.
Most of our investments are valued at cost. However, to the extent we hold available-for-sale investments, we value them quarterly at fair value, as determined in accordance with ASC 820, Fair Value Measurements and Disclosures, or ASC 820, which may include unobservable inputs. Because such valuations are subjective, the fair value of certain of our investments may fluctuate over short periods of time and our determinations of fair value may differ materially from the values that would have been used if a ready market for these investments existed. The value of our common stock could be adversely affected if our determinations regarding the fair value of these investments are materially higher than the values that we ultimately realize upon their disposal.
Changes in the market values of available-for-sale investments are directly charged or credited to stockholders’ equity. As a result, a decline in values of available-for-sale investments may result in connection with factors that are out of our control and adversely affect our book value. Moreover, if the decline in value of an available-for-sale investment is other than temporary, such decline will reduce our earnings.
Any distressed loans or investments we make, or loans and investments that later become distressed, may subject us to losses and other risks.
While our loan investments focus primarily on “performing” real estate-related interests, our loan investments may also include making distressed investments from time to time (e.g., investments in defaulted, out-of-favor or distressed loans) or may involve investments that become “sub-performing” or “non-performing” following our origination or acquisition thereof. Certain of our investments may include loans on properties and to borrowers that are typically highly leveraged, with significant burdens on cash flow and, therefore, involve a high degree of risk of substantial or total losses on our investments in
certain circumstances and may become subject to certain additional potential liabilities that may exceed the value of our original investment therein. During an economic downturn or recession, loans of financially or operationally troubled borrowers are more likely to go into default than loans of other borrowers. Loans of financially or operationally troubled borrowers are less liquid and more volatile than loans of borrowers not experiencing such difficulties. Investment in the loans of financially or operationally troubled borrowers involves a high degree of credit and market risk.
The foreclosure processsuccess of our investment strategy depends, in part, on our ability to successfully effectuate loan modifications and/or restructurings.
In certain limited cases (e.g., in connection with a workout, restructuring and/or foreclosing proceedings involving one or more of our investments), the success of our investment strategy will depend, in part, on our ability to effectuate loan modifications and/or restructurings with our borrowers. The activity of identifying and implementing successful modifications and restructurings entails a high degree of uncertainty, including macroeconomic and borrower-specific factors beyond our control that impact our borrowers and their operations. There can be no assurance that any of the loan modifications and restructurings we have effected will be successful or that (i) we will be able to identify and implement successful modifications and/or restructurings with respect to any other distressed loans or investments we may have from time to time, or (ii) we have sufficient resources to implement such modifications and/or restructurings in times of widespread market challenges.
Further, such loan modifications and/or restructuring may entail, among other things, a substantial reduction in the interest rate and/or a substantial write-off of the principal of such loan, debt securities or other interests. Moreover, even if a restructuring were successfully accomplished, a risk exists that, upon maturity of such real estate loan, debt securities or other interests, replacement “takeout” financing will not be available. Additionally, such loan modifications may result in our becoming the owner of underlying the real estate. See “ — Risks Related to Our Lending and Investment Activities — We have in the past taken, and may in the future take, title to properties securing certain of our loan investments, which could result in losses that harm our results of operations and financial condition and — If we become the owner of real estate, we are subject to the risks inherent in the ownership and operation of real estate and the construction and development of real estate.”
Financial or operating difficulties of our borrowers may result in our being subject to bankruptcy proceedings.
Financial or operating difficulties our borrowers may face, such as those described in other risk factors, may never be overcome and may cause borrowers to become subject to bankruptcy or other similar administrative proceedings. There is a possibility that we may incur substantial or total losses on our investments, and in certain circumstances, become subject to certain additional potential liabilities that may exceed the value of our original investment therein. For example, under certain circumstances, a lender that has inappropriately exercised control over the management and policies of a debtor may have its claims subordinated or disallowed or may be difficult,found liable for damages suffered by parties as a result of such actions. In any reorganization or liquidation proceeding relating to our investments, we may lose our entire investment, may be required to accept cash or securities with a value less than our original investment and/or may be required to accept different terms, including payment over an extended period of time. In addition, under certain circumstances, payments to us may be reclaimed if any such payment or distribution is later determined to have been a fraudulent conveyance, preferential payment, or similar transaction under applicable bankruptcy and insolvency laws. Furthermore, bankruptcy laws and similar laws applicable to administrative proceedings may delay our ability to realize value from collateral for our loan positions, may adversely affect the economic terms and priority of such loans through doctrines such as equitable subordination or may result in a restructuring of the debt through principles such as the “cramdown” provisions of the bankruptcy laws.
We have in the past taken, and may in the future take, title to properties securing certain of our loan investments, which could result in losses that harm our results of operations and financial condition.
We have in the past found, and may in the future find, it necessary or desirable to take title to properties securing certain of the loans we originate or acquire via foreclosure or other means. The foreclosure process may be lengthy and costlyexpensive. If we take title to a property securing a loan investment, and if we do not or cannot sell the property, we would then come to own and operate it as REO. Owning and operating real property involves risks that are different (and in many ways more significant) than the risks faced in owning a loan secured by that property. The costs associated with operating and redeveloping a property, including any operating shortfalls and significant capital expenditures, could materially and adversely affect our results of operations, financial conditions and liquidity. In addition, we may end up owning a property that we would not otherwise have decided to acquire directly at the price of our original investment or at all, and the liquidation proceeds we receive upon sale of the underlying real estate may not be sufficient to coverrecover our cost basis in the loan.loan, resulting in a loss to us.
We may find it necessary or desirable to foreclose on certain of the loans we originate or acquire, and the foreclosure process may be lengthy and expensive. Whether or not we have participated in the negotiation of the terms of any such loans, we cannot assure you as to the adequacy of the protection of the terms of the applicable loan, including the validity or enforceability of the loan, and the maintenance of the anticipated priority and perfection of the applicable security interests. Furthermore, claims may be asserted by lenders or borrowers that might interfere with enforcement of our rights. Borrowers may resist foreclosure actions by asserting numerous claims, counterclaims and defenses against us, including, without limitation, lender liability claims and defenses, even if the assertions may have no basis in fact, in an effort to prolong the foreclosure action and seek to force the lender into a modification of the loan or a favorable buy-out of the borrower’s position in the loan. In some states, foreclosure actions can take several years or more to litigate. At any time prior to or during the foreclosure proceedings, the borrower may
file for bankruptcy, which would have the effect of staying the foreclosure actions and further delaying the foreclosure process and potentially results in a reduction or discharge of a borrower’s debt. Foreclosure may create a negative public perception of the related property, resulting in a diminution of its value.
Even if we are successful in foreclosing on a loan or otherwise taking title to the property securing a loan, the liquidation proceeds upon sale of the underlying real estate may not be sufficient to recover our cost basis in the loan, resulting in a loss. Furthermore, any costs or delays involved in the foreclosure of the loan, or a liquidation of the underlying property, will further reduce the net proceeds and, thus, increase any such loss to us.
Any credit ratings assignedIf we become the owner of real estate, we are subject to the risks inherent in the ownership and operation of real estate and the construction and development of real estate.
We may become the owner of real estate through a foreclosure, a deed-in-lieu of foreclosure transaction or otherwise and therefore become subject to the risks inherent in the ownership and operation of real estate and real estate-related businesses and assets. Such investments are subject to the potential for deterioration of real estate fundamentals and the risk of adverse changes in local market and economic conditions, which may include changes in supply of and demand for competing properties in an area, changes in interest rates and related increases in borrowing costs, fluctuations in the average occupancy and room rates for hotel properties, changes in demand for commercial office properties (including as a result of an increased prevalence of remote work), changes in the financial resources of tenants, defaults by borrowers or tenants and the lack of availability of mortgage funds, which may render the sale or refinancing of properties difficult or impracticable. In addition, investments in real estate and real estate-related businesses and assets may be subject to the risk of environmental liabilities, contingent liabilities upon disposition of assets, casualty or condemnations losses, energy supply shortages, natural disasters, climate-related risks (including transition risks and acute and chronic physical risks), acts of God, terrorist attacks, war and other events that are beyond our control, and various uninsured or uninsurable risks. Further, investments in real estate and real estate-related businesses and assets are subject to changes in law and regulation, including in respect of building, environmental and zoning laws, rent control and other regulations impacting residential real estate investments and changes to tax laws and regulations, including real property and income tax rates and the taxation of business entities and the deductibility of corporate interest expense. In addition, if we acquire direct or to usindirect interests in undeveloped land or underdeveloped real property, which may often be non-income producing, we will be subject to ongoing evaluationsthe risks normally associated with such assets and revisionsdevelopment activities, including risks relating to the availability and timely receipt of zoning and other regulatory or environmental approvals, the cost and timely completion of construction (including risks beyond our control, such as weather or labor conditions or material shortages) and the availability of both construction and permanent financing on favorable terms.
Further, ownership of real estate may increase our risk of direct and/or indirect liability under environmental laws that impose, regardless of fault, joint and several liability for the cost of remediating contamination and compensation for damages. In addition, changes in environmental laws or regulations or the environmental condition of real estate may create liabilities that did not exist at the time we cannot assure you that those ratings will not be downgraded.
Somebecame the owner of our investments, including the notes issuedsuch real estate. Even in our securitization transactions for whichcases where we are required to retain a portionindemnified against certain liabilities arising out of the credit risk, may be rated by rating agencies. Any credit ratings on our investments are subject to ongoing evaluation by credit rating agencies,violations of laws and we cannot assure you that any such ratings will not be changed or withdrawn by a rating agency in the future if, in its judgment, circumstances warrant. If rating agencies assign a lower-than-expected rating or reduce or withdraw, or indicate that they may reduce or withdraw, their ratings of our investments in the future, the value of our investments could significantly decline, which would adversely affect the value of our investment portfolioregulations, including environmental laws and could result in losses upon disposition or the failure of borrowers to satisfy their debt service obligations to us.
Further, to the extent we have corporate credit ratings by any of the principal credit agencies, any downgrade of any such ratings may make it more difficult and costly for us to access capital. Thereregulations, there can be no assurances thatassurance as to the financial viability of a third-party to satisfy such indemnities or our credit ratings will not be downgraded in the future, whether as a resultability to achieve enforcement of deteriorating general economic conditions, failure to successfully implement our operating strategy or the adverse impact on our results of operations or liquidity position of any of the above, or otherwise.such indemnities.
Investments in nonconforming and non-investment grade rated commercial real estate loans or securities involve increased risk of loss.
Certain commercial real estate debt investments may not conform to conventional loan standards applied by traditional lenders, and either will not be rated or will be rated as non-investment grade by the rating agencies. The non-investment grade ratings for these assets typically result from the overall leverage of the loans, the lack of a strong operating history for the properties underlying the loans, the borrowers’ credit history, the underlying properties’ cash flow or other factors. As a result, these investments should be expected to have a higher risk of default and loss than investment grade rated assets. Losses related to our non-investment grade loans or securities would adversely affect our financial condition and results of operations.
Insurance on commercial real estate loans may not cover all losses.
Our commercial real estate loans may be subject to certain types of losses, generally of a catastrophic nature, such as earthquakes, floods, hurricanes, terrorism or acts of war, which may be uninsurable or not economically insurable. Inflation, changes in building codes and ordinances, environmental considerations and other factors also might result in insurance proceeds insufficient to repair or replace a property if it is damaged or destroyed. Under these circumstances, the insurance proceeds received with respect to a property relating to one of our investments might not be adequate to restore our economic position with respect to our investment. Any uninsured loss could result in the corresponding nonperformance of, or loss on, our investment related to such property.
We depend on third-party service providers, including our loan servicers and our managed service provider, for a variety of services related to our business. We are, therefore, subject to the risks associated with third-party service providers.
We depend on a variety of services provided by third-party service providers related to our investments in commercial real estate debt investments, as well as for general operating purposes. For example, we rely on the servicers, principally Trimont Real Estate Advisors, LLC, whoa third-party servicer to service the
commercial real estate loans that we invest in and commercial real estate loans underlying CMBS, CRE CLOs and other commercial real estate debt investments to, among other things, collect principal and interest payments on such commercial real estate loans and perform certain asset management services in accordance with applicable laws and regulations. Loan servicersIn addition, as described in further detail in “Cybersecurity” in Item 1C of this Annual Report on Form 10-K, we rely on a third-party provider for our information technology systems. Such vendors and other service providers,others, such as trustees, appraisers and other due diligence vendors and document custodians, may fail to perform or otherwise not perform in a manner that promotes our interests. This may include systems failures, security breaches and errors that could significantly disrupt our business, including resulting in nonperformance of, or loss of, investments or defaults under our financing facilities.
The expected discontinuance of the London Interbank Offered Rate, or LIBOR,Increases in our CECL reserves have had and transitioncould continue to alternative reference rates may adversely impact our borrowings and assets.
On March 5, 2021, the Financial Conduct Authority of the U.K., or the FCA, which regulates LIBOR, announced that all LIBOR tenors relevant to us will cease to be published or will no longer be representative after June 30, 2023. The FCA announcement coincides with the March 5, 2021, announcement of LIBOR’s administrator, the ICE Benchmark Administration Limited, or the IBA, indicating that, as a result of not having access to input data necessary to calculate LIBOR tenors relevant to us on a representative basis after June 30, 2023, the IBA would have to cease publication of such LIBOR tenors immediately after the last publication on June 30, 2023. The United States Federal Reserve has also advised banks to cease entering into new contracts that use U.S. dollar LIBOR as a reference rate. The Federal Reserve, in conjunction with the Alternative Reference Rate Committee, or the ARRC, a committee convened by the Federal Reserve that includes major market participants, has identified the Secured Overnight Financing Rate, or SOFR, a new index calculated by short-term repurchase agreements, backed by Treasury securities, as its preferred alternative rate for LIBOR. There are significant differences between LIBOR and SOFR, such as LIBOR being an unsecured lending rate while SOFR is a secured lending rate, and SOFR is an overnight rate while LIBOR reflects term rates at different maturities. If our LIBOR-based borrowings are converted to SOFR, the differences between LIBOR and SOFR, and potential margin adjustments in connection with the transition, could result in higher interest costs for us, which could have a material adverse effect on our operating results. Although SOFR is the ARRC’s recommended replacement rate, it is also possible that lenders may instead choose alternative replacement rates that may differ from LIBOR in ways similar to SOFR or in other ways that would result in higher interest costs for us. We cannot predict the effect of the decision not to sustain LIBOR, or the potential transition to SOFR or another alternative reference rate as LIBOR’s replacement.
As of December 31, 2021, 98.8% of our loans by carrying value earned a floating rate of interest indexed to LIBOR, and 100.0% of our outstanding financing arrangements (excluding our convertible notes and senior secured financing facilities) bear interest indexed to LIBOR. All of these arrangements provide procedures for determining an alternative base rate in the event that LIBOR is discontinued. Regardless, there can be no assurances as to what alternative base rates may be and whether such base rate will be more or less favorable than LIBOR and any other unforeseen impacts of the potential discontinuation of LIBOR. Any changes, reforms or replacements relating to LIBOR could increase our interest expense and could have an adverse impact on the market for or value of any LIBOR-linked securities, loans, derivatives and other financial obligations or extensions of credit held by or due to us or on our overall financial condition or results of operations. In addition, there could be a mismatch between the timing of adjusting the floating base rate from LIBOR to an alternative base rate upon the discontinuation of LIBOR, between our financing arrangements and our loan investments, which may have an immediate and significant adverse impact on our results of operations and cash flows and the market value of our investments. We are monitoring the developments with respect to the potential phasing out of LIBOR and are working with our lenders and borrowers to minimize the impact of any LIBOR transition on ourbusiness, financial condition and results of operations, but can provide no assurances regardingoperations.
Our current expected credit loss, or CECL, reserves required under the impactASU 2016-13, Financial Instruments - Credit Losses (Topic 326): Measurement of Credit Losses on Financial Instruments, or ASU 2016-13, reflect our current estimate of potential credit losses related to our loans included in our consolidated balance sheets. Changes to our CECL reserves have been, and will continue to be, recognized through net income on our consolidated statements of operations. See Note 2 – Basis of Presentation and Significant Accounting Policies to our Consolidated Financial Statements included in this Annual Report on Form 10-K for further discussion of our CECL reserves.
While ASU 2016-13 does not require any particular method for determining CECL reserves, it does specify that reserves should be based on relevant information about past events, including historical loss experience, current portfolio and market conditions, and reasonable and supportable forecasts for the discontinuationduration of LIBOR.each respective loan. Because our methodology for determining the CECL reserves may differ from the methodologies employed by other companies, our CECL reserves may not be comparable with the CECL reserves reported by other companies. In addition, other than a few narrow exceptions, ASU 2016-13 requires that all financial instruments subject to the CECL model have some amount of loss reserve to reflect the GAAP principal underlying the CECL model that all loans, debt securities, and similar assets have some inherent risk of loss, regardless of credit quality, subordinate capital, or other mitigating factors. We may be required to make further increases to our CECL reserves in the future, depending on the performance of our portfolio and broader market conditions, and there may be volatility in the level of our CECL reserves. If we are required to materially increase our CECL reserves for any reason, such increase could adversely affect our business, financial condition and results of operations.
Provisions for loan lossesCECL reserves are difficult to estimate.estimate, and may not be correct, which could severely impact our results of operations.
Our provision for loan losses isCECL reserves are evaluated on a quarterly basis. The determination of our provision for loan lossesCECL reserves requires us to make certain estimates and judgments, which may be difficult to determine and are subject to uncertain and changing economic, market and other circumstances. Our estimates and judgments are based on a number of factors, including projected cash flow from the collateral securing our loans, debt structure (including the availability of reserves and recourse guarantees), likelihood of repayment in full at the maturity of a loan, potential for refinancing, the creditworthiness of borrowers and expected market discount rates for varying property types,the real estate and other assets serving as collateral for our loan investments, all of which remain uncertain and are subjective. In determining the adequacy of our CECL reserves, we rely on our experience and our evaluation of economic conditions and market factors. If our assumptions prove to be incorrect, our CECL reserves may not be sufficient to cover losses inherent in our loan portfolio and adjustment may be necessary to allow for different economic conditions or adverse developments in our loan portfolio. Consequently, a problem with one or more loans could require us to significantly increase the level of our CECL reserves. Our estimates and judgments may not be correct and, therefore, our results of operations and financial condition could be severely impacted.
We may be subject to risks associated with commercial real estate loan participations.
Some of our commercial real estate loans may be held in the form of participation interests or co-lender arrangements in which we share the loan rights, obligations and benefits with other lenders. With respect to such participation interests, we may require the consent of these parties to exercise our rights under such loans, including rights with respect to amendment of loan documentation, enforcement proceedings upon a default and the institution of, and control over, foreclosure proceedings. In circumstances where we hold a minority interest, we may become bound to actions of the majority to which we otherwise would object. We may be adversely affected by this lack of control with respect to these interests.
Investments that are subordinated or otherwise junior in an issuer’s capital structure and that involve privately negotiated structures expose us to greater risk of loss.
In addition to our senior floating-rate commercial mortgage loans, our portfolio contains, and in the future we may invest in, other investments that are subordinated or otherwise junior in an issuer’s capital structure and that involve privately negotiated structures. Any investments in subordinated debt and mezzanine tranches of a borrower’s capital structure and our ability to exert control or exercise remedies with respect thereto, including the ability to foreclose on January 1, 2020, we adopted Accounting Standards Update 2016-13, “Financial Instruments – Credit Losses - Measurement of Credit Losses on Financial Instruments (Topic 326),” which replaced the “incurred loss” model for recognizing credit losses with an “expected loss” model referred to as the CECL model. Under the CECL model, weany collateral securing such investments, are required to present certain financial assets carried at amortized cost, such as loans held for investment, at the net amount
expected to be collected. The measurement of expected credit losses is based on information about past events, including historical experience, current conditions, and reasonable and supportable forecasts that affect the collectability of the reported amount. This measurement takes place at the time the financial asset is first addedsubject to the balance sheetrights of any senior creditors and, is updated quarterly thereafter. This differs significantly fromto the “incurred loss” model previously required under GAAP, which delayed recognition until it was probable a loss has been incurred. Accordingly, the adoption of the CECL model has materially affected, and will continueextent applicable, contractual intercreditor and/or participation agreement provisions. Significant losses related to materially affect, how we determine our allowance for loan losses and has required us, and could continue to require us, to significantly increase our allowance and recognize provisions for credit losses earlier in the lending cycle. Moreover, the CECL model may create more volatility in the level of our allowance for credit losses. If we are required to materially increase our level of allowance for credit losses for any reason, such increaseloans or investments could adversely affect our business, financial condition and results of operations.operations and financial condition.
Investments in subordinated debt involve greater credit risk of default than the senior classes of the issue or series. As a result, with respect to any investments in subordinated debt, we would potentially receive payments or interest distributions after, and must bear the effects of losses or defaults on the senior debt before the holders of other more senior tranches of debt instruments with respect to such issuer. As the terms of such loans and investments are subject to contractual relationships among lenders, co-lending agents and others, they can vary significantly in their structural characteristics and other risks.
In addition, our investments in senior mortgage loans may be effectively subordinated to the extent we borrow under a repurchase facility or another facility involving a pledge of the senior mortgage loan as collateral. Under these arrangements, the lender has a right to repayment of the borrowed amount before we can collect on the value of the senior mortgage loan, and therefore, if the value of the pledged senior mortgage loan decreases below the amount we have borrowed, we would experience a loss.
Risks Related to Our Financing and Hedging
We have a substantial amount of debt and may incur additional debt, which subjects us to increased risk of loss which could adversely affect our results of operation and financial condition and may reduce cash available for distributions to our stockholders.
We have a substantial amount of debt and, subject to market conditions and availability, we may incur a significant amount of additional debt through bank credit facilities (including term loans and revolving facilities), repurchase agreements, warehouse facilities and structured financing arrangements, public and private debt issuances (including through securitizations) and derivative instruments, in addition to transaction or asset-specific funding arrangements. We may also issue additional debt or equity securities to fund our growth. The percentage of leverage we employ varies depending on our available capital, our ability to obtain and access financing arrangements with lenders, the type of asset we are funding, whether the financing is recourse or nonrecourse, debt restrictions contained in those financing arrangements and the lenders’ and rating agencies’ estimate of the stability of our investment portfolio’s cash flow. We may significantly increase the amount of leverage we utilize at any time without the approval of our board of directors. In addition, we may leverage individual assets at substantially higher levels. Our substantial amount of debt could subject us to many risks that, if realized, would materially and adversely affect us, including the risk that:
•our cash flow from operations may be insufficient to make required payments of principal of and interest on our debt, or we may fail to comply with covenants or breach a representation contained in our debt agreements, which in each case, if we are unable to obtain amendments or waivers of such convenants or representations from financing counterparties, may result in (a) acceleration of such debt (and any other debt containing a cross-default or cross-acceleration provision), which we then may be unable to repay from internal funds or to refinance on favorable terms, or at all, (b) our inability to borrow undrawn amounts under our financing arrangements, even if we are current in payments on borrowings under those arrangements, which would result in a decrease in our liquidity, and/or (c) the loss of some or all of our collateral assets to foreclosure or sale;
•our debt may increase our vulnerability to adverse economic and industry conditions with no assurance that investment yields will increase in an amount sufficient to offset the higher financing costs;
•we may be required to dedicate a substantial portion of our cash flow from operations to payments on our debt, thereby reducing funds available for operations, future business opportunities, stockholder distributionsdividends or other purposes; and
•we may not be able to refinance any debt that matures prior to the maturity (or realization) of an underlying investment it was used to finance on favorable terms or at all.
There can be no assurance that a leveraging strategy will be successful, and it may subject us to increased risk of loss and could adversely affect our results of operations and financial condition.
Our existing financing facilities impose, and additional financing facilities may impose, restrictive covenants, which may restrict our flexibility to determine our operating policies and investment strategy and to conduct our business.
We borrow funds under repurchase agreements and other financing arrangements with various counterparties. The documents that govern these financing arrangements and the related guarantees contain, and additional lending facilities may contain, customary affirmative and negative covenants, including financial covenants applicable to us that may restrict our flexibility to determine our operating policies and investment strategy. As a result, we may not be able to leverage our assets as fully as we would otherwise choose, which could reduce our return on assets. If we fail to meet or satisfy any of these covenants, we would be in default under these agreements, and our lenders could elect to declare outstanding amounts due and payable, terminate their commitments, require the posting of additional collateral and enforce their interests against existing collateral. We are, and in the future may also be, subject to cross-default and acceleration rights in our other debt arrangements. Further, this could also make it difficult for us to satisfy the distribution requirements necessary to maintain our qualification as a REIT for U.S. federal income tax purposes.
Our master repurchase agreements require, and bank credit facilities, repurchase agreements or other financing that we may use in the future to finance our assets may require, us to provide additional collateral or pay down debt.
Our master repurchase agreements with various counterparties, any bank credit facilities and additional repurchase agreements or other financing we may enter into in the future involve the risk that the market value of the assets pledged or sold
by us to the provider of the financing may decline in value, in which case the lender or counterparty may require us to provide additional collateral or lead to margin calls that may require us to repay all or a portion of the funds advanced. We may not have the funds available to repay our debt at that time, which would likely result in defaults unless we are able to raise the funds from alternative sources, including by selling assets at a time when we might not otherwise choose to do so, which we may not be able to achieve on favorable terms or at all. Posting additional collateral would reduce our cash available to make other, higher yielding investments, thereby decreasing our return on equity. If we cannot meet these requirements, the lender or counterparty could accelerate our indebtedness, increase the interest rate on advanced funds and terminate our ability to borrow funds from it, which could materially and adversely affect our financial condition and ability to implement our investment strategy. In the case of repurchase transactions, if the value of the underlying security has declined as of the end of that term, or if we default on our obligations under the repurchase agreement, we will likely incur a loss on our repurchase transactions.
Inability to access funding could have a material adverse effect on our results of operations, financial condition and business.
Our ability to fund our loans and investments may be impacted by our ability to secure bank credit facilities, warehouse facilities and structured financing arrangements, public and private debt issuances (including through securitizations) and derivative instruments, in addition to transaction or asset specific funding arrangements and additional repurchase agreements on acceptable terms. We may also rely on short-term financing that would be especially exposed to changes in availability. Our access to sources of financing will depend upon a number of factors, over which we have little or no control, including the market's view of the quality of our investments, the market’s perception of our growth potential, our current and potential future earnings and cash distributions and the market price of our securities.
We may need to periodically access the capital markets to, among other things, raise cash to fund new loans and investments. Unfavorable economic conditions, such as those resulting from the ongoing COVID-19 pandemic, or capital market conditions may increase our funding costs, limit our access to the capital markets or could result in a decision by our potential lenders not to extend credit. An inability to successfully access the capital markets could limit our ability to grow our business and fully execute our business strategy and could decrease our earnings and liquidity. In addition, any dislocation or weakness in the capital and credit markets could adversely affect our lenders and could cause one or more of our lenders to be unwilling or unable to provide us with financing or to increase the costs of that financing. In addition, as regulatory capital requirements imposed on our lenders are increased, they may be required to limit, or increase the cost of, financing they provide to us. In general, this could potentially increase our financing costs and reduce our liquidity or require us to sell assets at an inopportune time or price. Further, as the lender to our borrowers, we may be obligated to fund all or a significant portion of a loan we have agreed to at one or more future dates. If we are unable to access funding, we may not have the funds available at such future date(s) to meet our funding obligations under a loan. In that event, we would likely be in breach of our agreement under such loan. We cannot make assurances that we will be able to obtain any additional financing on favorable terms or at all.
The utilization of any of our repurchase facilities is subject to the pre-approval of the lender.
We utilize repurchase agreements to finance the purchase of certain investments. In order for us to borrow funds under a repurchase agreement, our lender must have the right to review the potential assets for which we are seeking financing and approve such assets in its sole discretion. Accordingly, we may be unable to obtain the consent of a lender to finance an investment and alternate sources of financing for such asset may not exist.
We are subject to counterparty risk associated with our debt obligations.
Our counterparties for critical financial relationships may include both domestic and international financial institutions. These institutions could be severely impacted by credit market turmoil, changes in legislation, allegations of civil or criminal wrongdoing and may as a result experience financial or other pressures. In addition, if a lender or counterparty files for bankruptcy or becomes insolvent, our borrowings under financing agreements with them may become subject to bankruptcy or insolvency proceedings, thus depriving us, at least temporarily, of the benefit of these assets. Such an event could restrict our access to financing and increase our cost of capital. If any of our counterparties were to limit or cease operation, it could lead to financial losses for us.
We may be subject to losses arising from current and future guarantees of debt and contingent obligations of our subsidiaries.
We currently guarantee certain obligations of our subsidiaries under the various financing facilities that provide for significant aggregate borrowings and we may in the future guarantee the performance of additional subsidiaries’ obligations, including, but not limited to, additional repurchase agreements, derivative agreements and unsecured indebtedness.
Our use of financing may create a mismatch with the duration and interest rate of the investments that we are financing.
We intend to structure our financing such that we minimize the difference between the term of our investments and the term of the financing for such investments. In the event that our financing is for a shorter term than the financed investment, we may not be able to extend or find appropriate replacement financing, and that would have an adverse impact on our liquidity and our returns. In the event that our financing is for a longer term than the financed investment, we may not be able to repay such financing or replace the financed investment with an optimal substitute or at all, which will negatively impact our desired leveraged returns.
We attempt to structure our financing such that we minimize the variability between the interest rate of our investments and the interest rate of our financing - financing floating rate investments with floating rate financing and fixed rate investments with fixed rate financing. If such a product is not available to us from our lenders on reasonable terms, we may use hedging instruments to effectively create such a match. For example, in the case of fixed rate investments, we may finance such investments with floating rate financing, but effectively convert all or a portion of the attendant financing to fixed rate using hedging strategies.
Our attempts to mitigate such risk are subject to factors outside of our control, such as the availability to us of favorable financing and hedging options, which is subject to a variety of factors, of which duration and term matching are only two. A duration mismatch may also occur when borrowers prepay their loans faster or slower than expected. The risks of a duration mismatch are also magnified by the potential for the extension of loans in order to maximize the likelihood and magnitude of their recovery value in the event the loans experience credit or performance challenges. Employment of this asset management practice would effectively extend the duration of our investments, while our liabilities or any hedges we may enter into may have set maturity dates.
Interest rate fluctuations could increase our financing costs, which could lead to a significant decrease in our results of operations, cash flows and the market value of our investments that may not be adequately protected, or protected at all, by our hedging strategies.
To the extent that our financing costs are determined by reference to floating rates, such as LIBOR (or any replacement rate such as SOFR)the Secured Overnight Financing Rate, or SOFR, or a Treasury index, the amount of such costs will depend on the level and movement of interest rates. Interest rates have remained at relatively low levels on a historical basis and the U.S. Federal Reserve maintained the federal funds target range at 0.0%In response to 0.25% for much of 2021. There can be no assurance, however, thatinflationary pressures, the Federal Reserve will not raiseraised benchmark overnight interest rates on multiple occasions in 2022 and 2023. These increases have increased borrowers' interest payments, adversely affected commercial real estate property values, and for certain of our borrowers have contributed, and may continue to contribute, to loan non-performance, modifications, defaults, foreclosures and/or property sales, which could result in us realizing losses on our investments. Although the Federal Reserve has indicated no further rate increases are expected in 2024, how long interest rates will remain at their current levels and the direction and extent of any such increase could adversely affect our results of operations and financial condition as described below. future rate changes remain uncertain.
In a period of rising interest rates, our interest expense on floating rate debt would increase, while any additional interest income we earn on our floating rate investments may be subject to caps and/or in-the-money floors that may limit the growth of our interest income until interest rates rise above such floors or loans with such floors are repaid or refinanced and may not compensate for such increase in interest expense. Any such increases would also increase our borrowers’ interest payments and,
for certain borrowers, may lead to defaults and losses to us. Such increases could also adversely affect commercial real estate property values. Similarly, in a period of declining interest rates, our interest income on floating rate investments would generally decrease, while any decrease in the interest we are charged on our floating rate debt may be subject to floors and may not compensate for such decrease in interest income; however, floors relating to our loan portfolio may offset some of the impact from declining rates. In addition, interest we are charged on our fixed rate debt would not change. Any such scenario could adversely affect our results of operations, interest coverage ratio and financial condition.
We may employ various hedging strategies to limit the effects of changes in interest rates (and in some cases credit spreads), including engaging in interest rate swaps, caps, floors and other interest rate derivative products. We believe that no strategy can completely insulate us from the risks associated with interest rate changes, and there is a risk that such strategies may provide no protection at all and potentially compound the impact of changes in interest rates. Hedging transactions involve certain additional risks such as counterparty risk, leverage risk, the legal enforceability of hedging contracts, the early repayment of hedged transactions and the risk that unanticipated and significant changes in interest rates may cause a significant loss of basis in the contract and a change in current period expense. We cannot make assurances that we will be able to enter into hedging transactions or that such hedging transactions will adequately protect us against the foregoing risks.
Accounting for derivatives under GAAP may be complicated. Any failure by us to meet the requirements for applying hedge accounting in accordance with GAAP could adversely affect our earnings. In particular, derivatives are required to be highly effective in offsetting changes in the value or cash flows of the hedged items (and appropriately designated and/or documented as such). If it is determined that a derivative is not highly effective at hedging the designated exposure, hedge accounting is discontinued and the changes in fair value of the instrument are included in our reported net income.
Our existing financing facilities impose, and additional financing facilities may impose, restrictive covenants, which may restrict our flexibility to determine our operating policies and investment strategy and to conduct our business.
We borrow funds under repurchase agreements and other financing arrangements with various counterparties. The documents that govern these financing arrangements and the related guarantees contain, and additional lending facilities may contain, customary affirmative and negative covenants, including financial covenants that may restrict our flexibility to determine our operating policies and investment strategy. In particular, these financing arrangements require us to maintain a certain amount of cash or set aside assets sufficient to maintain a specified liquidity position. As a result, we may not be able to leverage our assets as fully as we would otherwise choose, which could reduce our return on assets. If we fail to meet or satisfy any of these covenants, we would be in default under these agreements, and our lenders could elect to declare outstanding amounts due and payable, terminate their commitments, require the posting of additional collateral and enforce their interests against existing collateral. We are, and in the future may also be, subject to cross-default and acceleration rights in our other debt arrangements. Further, these covenants could also make it difficult for us to satisfy the distribution requirements necessary to maintain our qualification as a REIT for U.S. federal income tax purposes. These financing arrangements also grant certain consent rights to the lenders thereunder which give them the right to consent to certain modifications to the pledged collateral and could limit our ability to manage a pledged investment in a way that we think would provide the best outcome for our stockholders.
Our existing asset financing facilities require, and future asset financing facilities may require, us to provide additional collateral or pay down debt.
Our master repurchase agreements with various counterparties, any bank credit facilities and additional repurchase agreements or other financing we may enter into in the future involve the risk that the market value of the assets pledged or sold by us to the provider of the financing may decline in value, in which case the lender or counterparty may require us to provide additional collateral or lead to margin calls that may require us to repay all or a portion of the funds advanced. We may not have the funds available to repay our debt at that time, which would likely result in defaults unless we are able to raise the funds from alternative sources, including by selling assets at a time when we might not otherwise choose to do so, which we may not be able to achieve on favorable terms or at all. Posting additional margin and/or pledging additional collateral would reduce our cash and/or collateral available for other, higher yielding investments, thereby decreasing our return on equity. If we cannot meet these requirements, the lender or counterparty could accelerate our indebtedness, increase the interest rate on advanced funds and terminate our ability to borrow funds from it, which could materially and adversely affect our financial condition and ability to implement our investment strategy. In the case of repurchase transactions, if the value of the underlying security has declined as of the end of that term, or if we default on our obligations under the repurchase agreement, we will likely incur a loss on our repurchase transactions.
Inability to access funding could have a material adverse effect on our results of operations, financial condition and business.
Our ability to fund our loans and investments may be impacted by our ability to secure bank credit facilities, warehouse facilities and structured financing arrangements, public and private debt issuances (including through securitizations) and derivative instruments, in addition to transaction or asset-specific funding arrangements and additional repurchase agreements on acceptable terms or at all. We may also rely on short-term financing that would be especially exposed to changes in availability. Our access to sources of financing will depend upon a number of factors, over which we have little or no control,
including the market's view of the quality of our investments, the market’s perception of our growth potential, our current and potential future earnings and cash dividends, any credit ratings we or our corporate debt may receive from major rating agencies, the prevailing interest rates being paid by other companies that investors consider to be comparable to us and the market price of our securities.
We may need to periodically access the capital markets to, among other things, raise cash to fund new loans and investments. Unfavorable economic conditions or capital market conditions may increase our funding costs, limit our access to the capital markets or result in a decision by our potential lenders not to extend credit.
An inability to successfully access the capital markets could limit our ability to grow our business and fully execute our business strategy and could decrease our earnings and liquidity. In addition, any dislocation or weakness in the capital and credit markets could adversely affect our lenders and could cause one or more of our lenders to be unwilling or unable to provide us with financing or to increase the costs of that financing. In addition, as regulatory capital requirements imposed on our lenders are increased, they may be required to limit, or increase the cost of, financing they provide to us. In general, this could potentially increase our financing costs and reduce our liquidity or require us to sell assets at an inopportune time or price. Further, as the lender to our borrowers, we may be obligated to fund all or a significant portion of a loan we have agreed to at one or more future dates. During 2023, bank failures and other events affecting financial institutions contributed to volatility in global markets and diminished liquidity and credit availability in the market broadly.
Any downgrade of our or our corporate debt’s credit ratings by any of the principal credit agencies may make it more difficult and costly for us to access capital. Additionally, the notes issued in our securitization transactions for which we are required to retain a portion of the credit risk, have been, and in the future may be, rated by rating agencies. There can be no assurances that the credit ratings of our corporate debt or the notes issued in our securitization transactions will not be downgraded in the future, whether as a result of deteriorating general economic conditions, failure to successfully implement our operating strategy or the adverse impact on our results of operations or liquidity position of any of the above, or otherwise.
The condition of the financial markets and prevailing interest rates have fluctuated in the past and are likely to fluctuate in the future. Such fluctuations could have an adverse effect on the price of our corporate debt. In addition, credit rating agencies continually review their ratings for the companies that they follow. If, in the future, one or more rating agencies were to provide a rating for us or our corporate debt, or the notes issued in our securitization transactions, and then reduce or withdraw their rating, the market price of such debt or notes or of our common stock may be adversely affected.
Actual events involving limited liquidity, defaults, non-performance or other adverse developments that affect financial institutions, transactional counterparties or other companies in the financial services industry or the financial services industry generally, or concerns or rumors about any events of these kinds or other similar risks, have in the past and may in the future lead to market-wide liquidity problems. Recent or ongoing developments in banking, such as bank closures, may also have other implications for broader economic and monetary policy, including interest rate policy, and may impact the financial condition of banks and other financial institutions outside of the United States.
In addition, the capital and credit markets have recently experienced extreme volatility and economic disruption, inflation and rapid increases in interest rates have led to a decline in the trading value of previously issued government securities with interest rates below current market interest rates, which may result in additional liquidity concerns for us and/or in the broader financial services industry.
If we are unable to access funding, we may not have the funds available at such future date(s) to meet our funding obligations under a loan. In that event, we would likely be in breach of our agreement under such loan. We cannot make assurances that we will be able to obtain any additional financing on favorable terms or at all.
We are subject to counterparty risk associated with our debt obligations.
Our counterparties for critical financial relationships may include both domestic and international financial institutions. These institutions could be severely impacted by credit market turmoil, changes in legislation, allegations of civil or criminal wrongdoing and may as a result experience financial or other pressures. In addition, if a lender or counterparty files for bankruptcy or becomes insolvent, our borrowings under financing agreements with them may become subject to bankruptcy or insolvency proceedings, thus depriving us, at least temporarily, of the benefit of these assets. Such an event could restrict our access to financing and increase our cost of capital. If any of our counterparties were to limit or cease operation, it could lead to financial losses for us.
We may be subject to losses arising from current and future guarantees of debt and contingent obligations of our subsidiaries.
We currently guarantee certain obligations of our subsidiaries under the various financing facilities that provide for significant aggregate borrowings and we may in the future guarantee the performance of additional subsidiaries’ obligations, including, but not limited to, additional repurchase agreements, derivative agreements and unsecured indebtedness.
Our use of financing may create a mismatch with the duration and interest rate of the investments that we are financing, which could adversely impact our liquidity and returns.
We intend to structure our financing such that we minimize the difference between the term of our investments and the term of the financing for such investments. In the event that our financing is for a shorter term than the financed investment, we may not be able to extend or find appropriate replacement financing, and that would have an adverse impact on our liquidity and our returns.
We attempt to structure our financing such that we minimize the variability between the interest rate of our investments and the interest rate of our financing — financing floating rate investments with floating rate financing and fixed rate investments with fixed rate financing. If such a product is not available to us from our lenders on reasonable terms, we may use hedging instruments to effectively create such a match. For example, in the case of fixed rate investments, we may finance such investments with floating rate financing, but effectively convert all or a portion of the attendant financing to fixed rate using hedging strategies.
The success of our attempts to mitigate such risk may be impacted by factors outside of our control, such as the availability to us of favorable financing and hedging options, including with respect to duration and term matching. A duration mismatch may also occur when borrowers prepay their loans faster or slower than expected. The risks of a duration mismatch are also magnified by the potential for the extension of loans in order to maximize the likelihood and magnitude of their recovery value in the event the loans experience credit or performance challenges. Employment of this asset management practice would effectively extend the duration of our investments, while our liabilities or any hedges we may enter into may have set maturity dates.
Use of nonrecourse securitizations to finance our loans and investments may expose us to risks that could result in losses.
We have securitized and may in the future, to the extent consistent with the REIT requirements, seek to securitize certain of our portfolio investments. This involves creating a special-purpose vehicle, contributing a pool of our assets to the entity and selling interests in the entity or other securities issued by the entity on a nonrecourse basis to purchasers (whom we would expect to be willing to accept a lower interest rate to invest in investment-grade securities backed by loan pools). We have in the past retained, and would expect in the future to retain, all or a portion of the equity and potentially other tranches in the
securitized pool of loans or investments. In addition, we have in the past, and may in the future, retain a pari passu participations in securitized loans. Investments in CMBS, CRE CLOs and other similarly structured finance investments, as well as those we structure, sponsor or arrange, pose additional risks, including the risks of the securitization process and the risk that the special servicer may take actions that could adversely affect our interests. In addition, the securitization of our portfolio might magnify our exposure to losses because any equity interest we retain in the issuing entity would be subordinate to the notes issued to investors and we would, therefore, absorb all of the losses sustained with respect to a securitized pool of assets before the owners of the notes experience any losses.
The inability to securitize our portfolio may hurt our performance and our ability to grow our business. At the same time, the securitization of our loans or investments might expose us to losses, as the residual loans or investments in which we do not sell interests will tend to be riskier and more likely to experience losses. Moreover, the Dodd-Frank Wall Street Reform and Consumer Protection Act of 2010, or Dodd-Frank Act, contains a risk retention requirement for all asset-backed securities, which requires both public and private securitizers to retain not less than 5% of the credit risk of the assets collateralizing any asset-backed security issuance. Significant restrictions exist, and additional restrictions may be added in the future, regarding who may hold risk retention interests, the structure of the entities that hold risk retention interests and when and how such risk retention interests may be transferred. Therefore, such risk retention interests will generally be illiquid. As a result of the risk retention requirements, we have, and may in the future, be required to purchase and retain certain interests in a securitization into which we sell loans and/or, when we act as issuer, may be required to sell certain interests in a securitization at prices below levels that such interests have historically yielded and/or may be required to enter into certain arrangements related to risk retention that we have not historically been required to enter into. Accordingly, the risk retention rules may increase our potential liabilities and/or reduce our potential profits in connection with the securitization of loans. It is likely, therefore, that these risk retention rules will increase the administrative and operational costs of asset securitizations.
We may enter into hedging transactions that expose us to contingent liabilities in the future, which may adversely affect our financial results or cash available for distribution to stockholders.
In the future, we may engage in transactions intended to hedge against various risks to our portfolio, including the exposure to changes in interest rates. The extent of our hedging activity will vary in scope based on, among other things, the level and volatility of interest rates, the type of assets held and other changing market conditions. Although these transactions are intended to reduce our exposure to various risks, hedging may fail to adequately protect or could adversely affect us because, among other things:
•hedging can be expensive, particularly during periods of volatile or rapidly changing interest rates;
•available hedges may not correspond directly with the risks for which protection is sought;
•the duration of the hedge may not match the duration of the related liability;
•the amount of income that a REIT may earn from certain hedging transactions (other than through our TRS) is limited by U.S. federal income tax provisions governing REITs;
•the credit quality of a hedging counterparty may be downgraded to such an extent that it impairs our ability to sell or assign our side of the hedging transaction; and
•the hedging counterparty may default on its obligations.
Subject to maintaining our qualification as a REIT and satisfying the criteria for no-action relief from the CFTC’sregistration rules of the Commodity Futures Trading Commission, or the CFTC, regarding Commodity Pool Operator,Operators, or CPO, registration rules,CPOs, there are no current limitations on the hedging transactions that we may undertake. Our hedging transactions could require us to fund large cash payments in certain circumstances (e.g., the early termination of the hedging instrument caused by an event of default or other early termination event, or a demand by a counterparty that we make increased margin payments).
Our ability to fund these obligations will depend on the liquidity of our assets and our access to capital at the time. The need to fund these obligations could adversely affect our financial condition. Further, hedging transactions, which are intended to limit losses, may actually result in losses, which would adversely affect our earnings and could, in turn, reduce cash available for distribution to stockholders.
The Dodd-Frank Act regulates derivative transactions, including certain hedging instruments, we may use in our risk management activities. Rules implemented by the CFTC pursuant to the Dodd-Frank Act require, among other things, that certain derivatives be cleared through a registered clearing facility and traded on a designated exchange or swap execution facility. These regulations could increase the operational and transactional cost of derivatives contracts and affect the number and/or creditworthiness of available counterparties. Furthermore, the enforceability of agreements underlying hedging transactions may depend on compliance with applicable statutory and commodity and other regulatory requirements and, depending on the identity of the counterparty, applicable international requirements. The business failure of a hedging counterparty will most likely result in its default. Default by a hedging counterparty may result in the loss of unrealized profits and force us to cover our commitments, if any, at the then current market price. Although, generally, we will seek to reserve the right to terminate our hedging positions, it may not always be possible to dispose of or close out a hedging position without the consent of the hedging counterparty and we may not be able to enter into an offsetting contract in order to cover our risk. We
cannot assure you that a liquid secondary market will exist for hedging instruments purchased or sold, and we may be required to maintain a position until exercise or expiration, which could result in losses.
Risks Related to Our Company and Structure
Our ability to retain and attract key personnel is critical to our success.
Our success depends on our ability to retain our senior management and other key members of our team and to recruit additional qualified personnel as needed. Many members of our senior management team have a history of working together that predates the Company’s inception, and any loss of talent from that group could be disruptive to their effective functioning. Additionally, the size of our employee base (35 employees as of December 31, 2023, inclusive of the senior management group) means that we have limited overlap in roles such that any degree of attrition could challenge operations. Many of these roles are highly specialized and specific to our industry, making them difficult to source. We have also found that the marketplace for talent has become increasingly competitive and costly across seniority levels and job categories as unemployment rates remain low.
Our board of directors has approved very broad investment guidelines for us and will not review or approve each investment decision made by us.
Our board of directors may periodically review and update our investment guidelines and will also review our investment portfolio, but does not review or approve specific investments. Subject to maintaining our REIT qualification and our exclusion from registration under the Investment Company Act, we have great latitude within the broad parameters of the investment guidelines set by our board of directors in determining our investments and investment strategies, which could result in investment returns that are substantially below expectations or that result in material losses.
Operational risks, including the risk of cyberattacks, may disrupt our business, resulting in loss or limited growth.
Our operations are highly dependent on our information systems and technology, which are provided and maintained by an outsourced technology vendor, and we rely heavily on our financial, accounting, treasury, communications and other data processing systems. Such systems may fail to operate properly or become disabled as a result of tampering or a breach of the network security systems or otherwise. In addition, such systems are subject to cyberattacks, including ransomware attacks and social engineering, such as phishing, smishing and vishing, which are continually evolving and will likely continue to increase in sophistication and frequency in the future. Moreover, remote working, including pursuant to our hybrid work model, may be less secure and more susceptible to cyberattacks. Attacks on us and our service providers’ systems could involve, and in some instances have in the past involved, attempts that are intended to obtain unauthorized access to our proprietary information or personal identifying information of our stockholders, destroy data, disable, degrade or sabotage our systems, including through the introduction of computer viruses and other malicious code, or divert or steal funds, including by wire fraud and other nefarious means.
Cybersecurity incidents and cyberattacks, denial of service attacks, ransomware attacks, and social engineering attempts (including business email compromise attacks) have been occurring globally at a more frequent and severe level and will likely continue to increase in frequency in the future. There have been a number of recent highly publicized cases involving the dissemination, theft and destruction of corporate information or other assets, as a result of a failure to follow procedures by employees or contractors or as a result of actions by a variety of third parties, including nation state actors and terrorist or criminal organizations. We and our service providers and other market participants increasingly depend on complex information technology and communications systems to conduct business functions, and their operations rely on the secure access to, and processing, storage and transmission of confidential and other information in their systems and those of their respective third-party service providers. These information, technology and communications systems are subject to a number of different threats or risks that could adversely affect us. For example, our information and technology systems, as well as those of other related parties, such as service providers, may be vulnerable to damage or interruption from cybersecurity breaches, computer viruses or other malicious code, network failures, computer and telecommunication failures, infiltration by unauthorized persons and other security breaches, usage errors by their respective professionals or service providers, power, communications or other service outages and catastrophic events such as fires, tornadoes, floods, hurricanes and earthquakes. Cyberattacks and other security threats could originate from a wide variety of external sources, including cybercriminals, nation state hackers, hacktivists and other outside parties. Cyberattacks and other security threats could also originate from the malicious or accidental acts of insiders.
There has been an increase in the frequency and sophistication of the cyber and security threats we face, with attacks ranging from those common to businesses generally to those that are more advanced and persistent, which may target us because we hold a significant amount of confidential and sensitive information. As a result, we may face a heightened risk of a security breach or disruption with respect to this information. If successful, these types of attacks on our network or other systems could have a material adverse effect on our business and results of operations, due to, among other things, the loss of investor or proprietary data, interruptions or delays in the operation of our business and damage to our reputation. There can be no assurance that measures we take to ensure the integrity of our systems will provide protection, especially because cyberattack techniques used change frequently, may persist undetected over extended periods of time and may not be mitigated in a timely manner to prevent or minimize the impact of an attack.
If unauthorized parties gain access to such information and technology systems, they may be able to steal, publish, delete or modify private and sensitive information, including nonpublic personal information related to stockholders (and their beneficial owners) and material nonpublic information. Although we have implemented, and our service providers may implement, various measures to manage risks relating to these types of events, such systems could prove to be inadequate and, if compromised, could become inoperable for extended periods of time, cease to function properly or fail to adequately secure private information. There also have been several publicized cases of ransomware where hackers have requested ransom payments in exchange for not disclosing client or customer information or restoring access to information technology or communications systems. We do not control the cybersecurity plans and systems put in place by third-party service providers, and such third-party service providers may have limited indemnification obligations to us. Breaches such as those involving covertly introduced malware, impersonation of authorized users and industrial or other espionage may not be identified even with sophisticated prevention and detection systems, potentially resulting in further harm and preventing them from being addressed appropriately. The failure of these systems or of disaster recovery plans for any reason could cause significant interruptions in our operations and result in a failure to maintain the security, confidentiality or privacy of sensitive data, including personal information relating to stockholders, material nonpublic information and the intellectual property and trade secrets and other sensitive information in our possession. We could be required to make a significant investment to remedy the effects of any such failures, harm to our reputation, legal claims that we may be subjected to, regulatory action or enforcement arising out of applicable privacy and other laws, adverse publicity and other events that may affect our business and financial performance.
Even if we are not targeted directly, cyberattacks on governments, financial markets, financial institutions, or other businesses, including borrowers, vendors, software creators, cybersecurity service providers and other third-parties with whom we do business, may occur, and such events could disrupt our normal business operations and networks in the future.
In addition, our business is highly dependent on information systems and technology. The costs related to cyber or other security threats or disruptions may not be fully insured or indemnified by other means. In addition, we could also suffer losses in connection with updates to, or the failure to timely update, our information systems and technology. In addition, we are reliant on third-party service providers for certain aspects of our business, including for administrative services, as well as for certain information systems and technology, including cloud-based services. These third-party service providers could also face ongoing cybersecurity threats and compromises of their systems and as a result, unauthorized individuals could gain access to certain confidential data.
Many jurisdictions in which we operate have, or are considering adopting, laws and regulations relating to data privacy, cybersecurity and protection of personal information. Some jurisdictions have also enacted laws requiring companies to notify individuals and government agencies of data security breaches involving certain types of personal data. Breaches in security, whether malicious in nature or through inadvertent transmittal or other loss of data, could potentially jeopardize our
employees’, investors’ or counterparties’ confidential, proprietary and other information processed and stored in, and transmitted through, our computer systems and networks, or otherwise cause interruptions or malfunctions in our employees’, investors’, counterparties’ or third-parties’ operations, which could result in significant losses, increased costs, disruption of our business, liability to our investors and other counterparties, regulatory intervention or reputational damage. Furthermore, if we fail to comply with the relevant laws and regulations or fail to provide the appropriate regulatory or other notifications of a breach in a timely manner, it could result in regulatory investigations and penalties, which could lead to negative publicity and may cause our investors to lose confidence in the effectiveness of our security measures.
A disaster or a disruption in the infrastructure that supports our business, including a disruption involving electronic communications or other services used by us or third-parties with whom we conduct business, could have a material adverse impact on our ability to continue to operate our business without interruption. Our disaster recovery programs may not be sufficient to mitigate the harm that may result from such a disaster or disruption. In addition, insurance and other safeguards might only partially reimburse us for our losses, if at all.
Maintaining our exclusions from registration as an investment company under the Investment Company Act imposes limits on our operations. Your investment returnInvestment returns may be reduced if we are required to register as an investment company under the Investment Company Act.
We currently conduct, and intend to continue to conduct, our operations so that we are not required to register as an investment company under the Investment Company Act. We believe that we are not an investment company under Section 3(a)(1)(A) of the Investment Company Act because we do not engage primarily, or hold ourselves out as being engaged primarily, in the business of investing, reinvesting or trading in securities. Rather, through our wholly owned or majority-owned subsidiaries, we are primarily engaged in non-investment company businesses related to real estate. In addition, we intend to conduct our operations so that we do not come within the definition of an investment company under Section 3(a)(1)(C) of the Investment Company Act for purposes of the 40% test. Excluded from the term “investment securities” (as that term is defined in the Investment Company Act) are securities issued by majority-owned subsidiaries that are themselves not investment companies and are not relying on the exclusion from the definition of investment company set forth in Section 3(c)(1) or Section 3(c)(7) of the Investment Company Act.
To maintain our status as a non-investment company, the securities issued to us by any wholly owned or majority-owned subsidiaries that we may form in the future that are excluded from the definition of investment company under Section 3(c)(1) or Section 3(c)(7) of the Investment Company Act, together with any other investment securities we may own, may not have a value in excess of 40% of the value of our total assets on an unconsolidated basis. We monitor our holdings to ensure ongoing compliance with this test, but there can be no assurance that we will be able to maintain an exclusion or exemption from registration. The 40% test limits the types of businesses in which we may engage through our subsidiaries. In addition, the assets we and our subsidiaries may originate or acquire are limited by the provisions of the Investment Company Act and the rules and regulations promulgated under the Investment Company Act, which may adversely affect our business.
We hold our assets primarily through direct or indirect wholly owned or majority-owned subsidiaries, certain of which are excluded from the definition of investment company pursuant to Section 3(c)(5)(C) of the Investment Company Act. To qualify for the exclusion pursuant to Section 3(c)(5)(C), based on positions set forth by the SEC staff, each such subsidiary generally is required to hold at least (i) 55% of its assets in “qualifying” real estate assets and (ii) at least 80% of its assets in “qualifying” real estate assets and real estate-related assets. For our subsidiaries that maintain the exclusion under Section 3(c)(5)(C) or another exclusion or exceptionexemption under the Investment Company Act (other than Section 3(c)(1) or Section 3(c)(7) thereof), our interests in these subsidiaries do not and will not constitute “investment securities.”
As a consequence of our seeking to avoid the need to register under the Investment Company Act on an ongoing basis, we and/or our subsidiaries may be restricted from making certain investments or may structure investments in a manner that would be less advantageous to us than would be the case in the absence of such requirements. In particular, a change in the value of any of our assets could negatively affect our ability to maintain our exclusion from registration under the Investment Company Act and cause the need for a restructuring of our investment portfolio. For example, these restrictions may limit our and our subsidiaries’ ability to invest directly in mortgage-backed securities that represent less than the entire ownership in a pool of senior mortgage loans, debt and equity tranches of securitizations and certain asset-backed securities, non-controlling equity interests in real estate companies or in assets not related to real estate; however, we and our subsidiaries may invest in such securities to a certain extent. In addition, seeking to maintain our exclusion from the Investment Company Act may cause us and/or our subsidiaries to acquire or hold additional assets that we might not otherwise have acquired or held or dispose of investments that we and/or our subsidiaries might not have otherwise disposed of, which could result in higher costs or lower proceeds to us than we would have paid or received if we were not seeking to comply with such requirements. Thus, avoiding registration under the Investment Company Act may hinder our ability to operate solely on the basis of maximizing profits.
We determine whether an entity is a majority-owned subsidiary of our company.the Company. The Investment Company Act defines a majority-owned subsidiary of a person as a company 50% or more of the outstanding voting securities of which are owned by such person, or by another company which is a majority-owned subsidiary of such person. The Investment Company Act defines voting securities as any security presently entitling the owner or holder thereof to vote for the election of directors of a
company. We treat entities in which we own at least a majority of the outstanding voting securities as majority-owned
subsidiaries for purposes of the 40% test. We have not requested that the SEC or its staff approve our treatment of any entity as a majority-owned subsidiary, and neither has done so. If the SEC or its staff were to disagree with our treatment of one or more subsidiary entities as majority-owned subsidiaries, we may need to adjust our strategy and our assets in order to continue to pass the 40% test. Any adjustment in our strategy or assets could have a material adverse effect on us.
We classify our assets for purposes of certain of our subsidiaries’ Section 3(c)(5)(C) exclusion from the Investment Company Act based upon no-action positions taken by the SEC staff and interpretive guidance provided by the SEC and its staff. Based on such guidance, to qualify for the exclusion pursuant to Section 3(c)(5)(C), each such subsidiary generally is required to hold at least (i) 55% of its assets in “qualifying” real estate assets and (ii) 80% of its assets in “qualifying” real estate assets and real estate-related assets. “Qualifying” real estate assets for this purpose include mortgage loans, certain B-notes and certain mezzanine loans that satisfy various conditions as set forth in SEC staff no-action letters and other guidance, and other assets that the SEC staff in various no-action letters and other guidance has determined are the functional equivalent of senior mortgage loans for the purposes of the Investment Company Act. We treat CMBS, B-notes and mezzanine loans that do not satisfy the conditions set forth in the relevant SEC staff no-action letters and other guidance, and debt and equity securities of companies primarily engaged in real estate businesses as real estate-related assets. We note that the SEC staff’s prior no-action positions are based on specific factual situations that may be substantially different from the factual situations we and our subsidiaries may face, and a number of these no-action positions were issued more than twenty years ago. There may be no guidance from the SEC staff that applies directly to our factual situations and, as a result, we may have to apply SEC staff guidance that relates to other factual situations by analogy. No assurance can be given that the SEC or its staff will concur with our classification of our assets. In addition, the SEC or its staff may, in the future, issue further guidance that may require us to re-classify our assets for purposes of the Investment Company Act, including for purposes of our subsidiaries’ compliance with the exclusion provided in Section 3(c)(5)(C) of the Investment Company Act. There is no guarantee that we will be able to adjust our assets in the manner required to maintain our exclusion from the Investment Company Act and any adjustment in our strategy or assets could have a material adverse effect on us.
To the extent that the SEC or its staff provide more specific guidance regarding any of the matters bearing upon the definition of investment company and the exemptions and exclusions to that definition, we may be required to adjust our strategy accordingly. On August 31, 2011, the SEC issued a concept release and request for comments regarding the Section 3(c)(5)(C) exclusion (Release No. IC-29778) in which it contemplated the possibility of issuing new rules or providing new interpretations of the exclusion that might, among other things, define the phrase “liens on and other interests in real estate” or consider sources of income in determining a company’s “primary business.” Any additional guidance from the SEC or its staff could provide additional flexibility to us, or it could further inhibit our ability to pursue the strategies we have chosen.
There can be no assurance that we and our subsidiaries will be able to successfully avoid registration as an investment company. If it were established that we were an unregistered investment company, there would be a risk that we would be subject to monetary penalties and injunctive relief in an action brought by the SEC, that we would be unable to enforce contracts with third parties,third-parties, that third partiesthird-parties could seek to obtain rescission of transactions undertaken during the period it was established that we were an unregistered investment company and that we would be subject to limitations on corporate leverage that would have an adverse impact on our investment returns.
If we were required to register as an investment company under the Investment Company Act, we would become subject to substantial regulation with respect to our capital structure (including our ability to use borrowings), management, operations, transactions with affiliated persons (as defined in the Investment Company Act) and portfolio composition, including disclosure requirements and restrictions with respect to diversification and industry concentration and other matters. Compliance with the Investment Company Act would, accordingly, limit our ability to make certain investments and require us to significantly restructure our business plan, which could materially adversely affect our ability to pay distributionsdividends to our stockholders.
Rapid changes in the values of our assets may make it more difficult for us to maintain our qualification as a REIT or our exclusion from the Investment Company Act.
If the market value or income potential of our assets declines, we may need to increase our real estate assets and income or liquidate our non-qualifying assets in order to maintain our REIT qualification or our exclusion from the Investment Company Act. If the decline in real estate asset values or income occurs quickly, this may be especially difficult to accomplish. This difficulty may be exacerbated by the illiquid nature of any assets we may own. We may have to make decisions that we otherwise would not make absent the REIT qualification and Investment Company Act considerations.
State licensing requirements cause us to incur expenses and our failure to be properly licensed may have a material adverse effect on us and our operations.
Nonbank companies are generally required to hold licenses in a number of U.S. states to conduct lending and other related activities. State licensing statutes vary from state to state and may prescribe or impose various recordkeeping requirements; restrictions on loan origination, acquisition, enforcement and servicing practices, including limits on finance charges and the type, amount and manner of charging fees; disclosure requirements; requirements that licensees submit to periodic examination; surety bond and minimum specified net worth requirements; periodic financial reporting requirements; notification requirements for changes in principal officers, stock ownership or corporate control; and restrictions on advertising. Obtaining and maintaining licenses cause us to incur expenses and failure to be properly licensed under state law or otherwise may have a material adverse effect on us and our operations.
Changes in laws or regulations governing our operations, changes in the interpretation thereof or newly enacted laws or regulations (including laws and regulations having the effect of exempting REITs from the Investment Company Act) and any failure by us to comply with these laws or regulations, could require changes to certain of our business practices, negatively impact our operations, cash flow or financial condition, impose additional costs on us, subject us to increased competition or otherwise adversely affect our business.
We are subject to regulation by laws and regulations at the local, state and federal levels. These laws and regulations, as well as their interpretation, may change from time to time and new laws and regulations may be enacted. Accordingly, any change in these laws or regulations, changes in their interpretation or newly enacted laws or regulations and any failure by us to comply with these laws or regulations could require changes to certain of our business practices, negatively impact our operations, cash flow or financial condition, impose additional costs on us or otherwise adversely affect our business. Furthermore, if regulatory capital requirements imposed on our financing providers change, they may be required to limit, or increase the cost of, financing they provide to us. In general, this could potentially increase our financing costs and reduce our liquidity or require us to sell assets at an inopportune time or price.
ClimateRisks associated with climate change climate change-related regulation and the increased focus on environmental, social and governance issues may adversely affect our business and financial results and damage our reputation.
Recently, thereThere has been growingincreasing awareness of severe weather and other climate events outside of the historical norm as well as increasing concern from advocacy groups, government agencies and the general public overabout the effects of climate change on the environment. Transition risks, such as government restrictions, standards or regulations intended to reduce greenhouse gas emissions and potential climate change impacts, are emerging and may increase in the future in the form of restrictions or additional requirements on the development of commercial real estate. Such restrictions and requirements, along with rising insurance premiums resulting from climate change, could increase our costs or require additional technology and capital investment by our borrowers, which could adversely affect our results of operations. This is a particular concern in the western and northeastern U.S., where some of the most extensive and stringent environmental laws and building construction standards in the U.S. have been enacted, and where we have properties securing our investment portfolio.
Additionally, increasingFurther, significant physical effects of climate change, including changes in global weather patterns, rising sea levels, changes in temperature averages or extremes and extreme weather events such as hurricanes, droughts or floods, can also have an adverse impact on certain of our properties. As the effects of climate change increase, we expect the frequency and impact of weather and climate-related events and conditions to increase as well. For example, unseasonal or extreme weather events can have a material impact to hospitality businesses or properties.
Some physical risk is inherent in all properties, particularly properties in certain locations and in light of the unknown potential for extreme weather and other events that could occur related to climate change.
Our business is subject to evolving corporate governance and public disclosure regulations and expectations, including with respect to ESG matters, that could expose us to numerous risks.
Advocacy groups, government agencies, the general public, regulators, customers, investors, employees and other stakeholders are increasingly focusing on ESG matters and related disclosures. Such governmental, investor and societal attention to ESG matters, including expanding mandatory and voluntary reporting, diligence, and disclosure on topics such as climate change, human capital, labor and risk oversight, could expand the nature, scope, and complexity of matters that we are required to control,manage, assess and report.report, which could negatively impact the market price of our securities.
We are subject to changing rules and regulations promulgated by a number of governmental and self-regulatory organizations, including the SEC, the NYSE and the FASB. These rules and regulations continue to evolve in scope and complexity and many new requirements have been created in response to laws enacted by Congress, making compliance more difficult, costly and uncertain. Further, new and emerging regulatory initiatives related to climate change and ESG could adversely affect our business.
These changing rules, regulations and stakeholder expectations have resulted in, and are likely to continue to result in, increased general and administrative expenses and increased management time and attention spent complying with or meeting such regulations and expectations, including in areas such as diversity, equity and inclusion, human rights, climate change and environmental stewardship, support for local communities, corporate governance and transparency and considering ESG factors in our investment processes. Further, we may alterchoose to communicate certain initiatives and goals regarding environmental matters, diversity, responsible sourcing and social investments and other ESG-related matters, in our SEC filings or in other public disclosures. These initiatives and goals within the environmentscope of ESG could be difficult and expensive to implement and we could be criticized for the accuracy, adequacy or completeness of the disclosure. Statements about our ESG related initiatives and goals, and progress against those goals, may be based on standards for measuring progress that are still developing, internal controls and processes that continue to evolve and assumptions that are subject to change in whichthe future. In addition, we do business and may increasecould be criticized for the ongoing costsscope or nature of compliance and adversely impact our results of operations and cash flows.such initiatives or goals, or for any revisions to these goals. If we are unable to adequately address such ESG matters or if we fail to achieve progress with respect to our goals within the scope of ESG on a timely basis, or at all, or if we or our borrowers fail or are perceived to fail to comply with all laws, regulations, policies and related interpretations, it could negatively impact our reputation and our business results or result in litigation, investigations or threats thereof.
Further, significant physical effects of climate change, including extreme weather events such as hurricanes or floods, can also have an adverse impact on certain of our borrowers’ properties. As the effects of climate change increase, we expect the frequency and impact of weather and climate related events and conditions to increase as well. For example, unseasonal or violent weather events can have a material impact to businesses or properties that focus on hospitality.
Operational risks, including the risk of cyberattacks, may disrupt our business, resulting in loss or limited growth.
We rely heavily on our financial, accounting, treasury, communications and other data processing systems. Such systems may fail to operate properly or become disabled as a result of tampering or a breach of the network security systems or otherwise. In addition, such systems may be from time to time subject to cyberattacks, including phishing, social engineering and ransomware attacks, which may continue to increase in sophistication and frequency in the future. Moreover, remote working, which has increased as a result of the COVID-19 pandemic, may be less secure and more susceptible to cyberattacks. Attacks on us and our service providers’ systems could involve, and in some instances have in the past involved, attempts that are intended to obtain unauthorized access to our proprietary information or personal identifying information of our stockholders, destroy data, disable, degrade or sabotage our systems, including through the introduction of computer viruses and other malicious code, or steal money, including by wire fraud and other nefarious means.
Cybersecurity incidents and cyberattacks have been occurring globally at a more frequent and severe level and will likely continue to increase in frequency in the future. Our information and technology systems, as well as those of other related parties, such as service providers, may be vulnerable to damage or interruption from cybersecurity breaches, computer virusesresults.
or other malicious code, network failures, computer and telecommunication failures, infiltration by unauthorized persons and other security breaches, usage errors by their respective professionals or service providers, power, communications or other service outages and catastrophic events such as fires, tornadoes, floods, hurricanes and earthquakes. Cyberattacks and other security threats could originate from a wide variety of sources, including cybercriminals, nation state hackers, hacktivists and other outside parties. There has been an increase in the frequency and sophistication of the cyber and security threats we face, with attacks ranging from those common to businesses generally to those that are more advanced and persistent, which may target us because we hold a significant amount of confidential and sensitive information. As a result, we may face a heightened risk of a security breach or disruption with respect to this information. If successful, these types of attacks on our network or other systems could have a material adverse effect on our business and results of operations, due to, among other things, the loss of investor or proprietary data, interruptions or delays in the operation of our business and damage to our reputation. There can be no assurance that measures we take to ensure the integrity of our systems will provide protection, especially because cyberattack techniques used change frequently or are not recognized until successful.
If unauthorized parties gain access to such information and technology systems, they may be able to steal, publish, delete or modify private and sensitive information, including nonpublic personal information related to stockholders (and their beneficial owners) and material nonpublic information. Although we have implemented, and our service providers may implement, various measures to manage risks relating to these types of events, such systems could prove to be inadequate and, if compromised, could become inoperable for extended periods of time, cease to function properly or fail to adequately secure private information. We do not control the cybersecurity plans and systems put in place by third-party service providers, and such third party service providers may have limited indemnification obligations to us, each of which could be negatively impacted as a result. Breaches such as those involving covertly introduced malware, impersonation of authorized users and industrial or other espionage may not be identified even with sophisticated prevention and detection systems, potentially resulting in further harm and preventing them from being addressed appropriately. The failure of these systems or of disaster recovery plans for any reason could cause significant interruptions in our operations and result in a failure to maintain the security, confidentiality or privacy of sensitive data, including personal information relating to stockholders, material nonpublic information and the intellectual property and trade secrets and other sensitive information in our possession. We could be required to make a significant investment to remedy the effects of any such failures, harm to our reputation, legal claims that we may be subjected to, regulatory action or enforcement arising out of applicable privacy and other laws, adverse publicity and other events that may affect our business and financial performance.
In addition, our business is highly dependent on information systems and technology. The costs related to cyber or other security threats or disruptions may not be fully insured or indemnified by other means. Many jurisdictions in which we operate have laws and regulations relating to data privacy, cybersecurity and protection of personal information. Some jurisdictions have also enacted laws requiring companies to notify individuals of data security breaches involving certain types of personal data. Breaches in security could potentially jeopardize our employees’, investors’ or counterparties’ confidential and other information processed and stored in, and transmitted through, our computer systems and networks, or otherwise cause interruptions or malfunctions in our employees’, investors’, counterparties’ or third parties’ operations, which could result in significant losses, increased costs, disruption of our business, liability to our investors and other counterparties, regulatory intervention or reputational damage. Furthermore, if we fail to comply with the relevant laws and regulations, it could result in regulatory investigations and penalties, which could lead to negative publicity and may cause our investors to lose confidence in the effectiveness of our security measures.
A disaster or a disruption in the infrastructure that supports our business, including a disruption involving electronic communications or other services used by us or third parties with whom we conduct business could have a material adverse impact on our ability to continue to operate our business without interruption. Our disaster recovery programs may not be sufficient to mitigate the harm that may result from such a disaster or disruption. In addition, insurance and other safeguards might only partially reimburse us for our losses, if at all.
The market price of our common stock has recently fluctuated significantlybeen, and may continue to do so.be, volatile and may decline.
The capital and credit markets have, on occasion, experienced periods of extreme volatility and disruption. The market price and liquidity of the market for shares of our common stock has been and may in the future be significantly affected by numerous factors, including the risk factors described “Risk Factors” in this Item 1A, some of which are beyond our control and may not be directly related to our operating performance.
Some of the factors that could negatively affect the market price of our common stock include:
•our actual or projected operating results, financial condition, cash flows and liquidity or changes in business strategy or prospects, including as a result of the ongoing COVID-19 pandemic;
•equity issuances by us, share resales by our stockholders or the perception that such issuances or resales may occur;
•loss of a major funding source or inability to obtain new favorable funding sources in the future;
•our financing strategy and leverage;
•actual or anticipated accounting problems;
•publication of research reports about us or the real estate industry;
•changes in market valuations or operating performance of similar companies;
•adverse market reaction to any increased indebtedness we incur or securities we may issue in the future;
•additions to or departures of our key personnel;
•speculation in the press or investment community;
•increases in market interest rates, which may lead stockholders to demand a higher distribution yield for our common stock, and would result in increased interest expenses on our debt;
•failure to maintain our REIT qualification or exclusion from the Investment Company Act;
•price and volume fluctuations in the overall stock market from time to time;
•general market and economic conditions and trends, including inflationary concerns and the current state of the credit and capital markets, and the impact of natural disasters, war, global health crises, such as the outbreak of COVID-19, and other events on market and economic conditions;
•significant volatility in the market price and trading volume of securities of publicly traded REITs or other companies in our sector which are not necessarily related to the operating performance of these companies;
•changes in law, regulatory policies or tax guidelines, or interpretations thereof, particularly with respect to REITs;
•changes in the value of our portfolio;
•any shortfall in revenue or net income or any increase in losses from levels expected by stockholders or securities analysts;
•short-selling pressure with respect to shares of our common stock or REITs generally;
•the strength of the commercial real estate market and the U.S. economy generally; and
•the other factors described in this Item 1A - “Risk Factors.”
As noted above, market factors unrelated to our performance could also negatively impact the market price of our common stock. One of the factors that investors may consider in deciding whether to buy or sell our common stock is our distribution rate, if any, as a percentage of our stock price relative to market interest rates. If market interest rates increase, prospective investors may demand a higher distribution rate or seek alternative investments paying higher dividends or interest. As a result, interest rate fluctuations and conditions in the capital markets can affect the market value of our common stock. For instance, if interest rates rise, it is likely that the market price of our common stock will decrease as market rates on interest-bearing securities increase.
Future issuances of equity or debt securities, which may include securities that would rank senior to our common stock, may adversely affect the market price of the shares of our common stock.
The issuance of additional shares of our common stock, including in connection with the conversion of our outstanding 5.625% convertible senior notes due 2022, our outstanding 6.375% convertible senior notes due 2023 and/or our outstanding 7% Series A cumulative redeemable preferred stock, or our Series A Preferred Stock, or in connection with other future issuances of our common stock or shares of preferred stock or securities convertible or exchangeable into equity securities, may dilute the ownership interest of our existing holders of our common stock. If we decide to issue debt or equity securities which would rank senior to our common stock, it is likely that they will be governed by an indenture or other instrument containing covenants restricting our operating flexibility. Additionally, any convertible or exchangeable securities that we issue may have rights, preferences and privileges more favorable than those of our common stock and may result in dilution to owners of our common stock. We and, indirectly, our stockholders will bear the cost of issuing and servicing such securities. Because our decision to issue additional equity or debt securities in any future offering will depend on market conditions and other factors beyond our control, we cannot predict or estimate the amount, timing or nature of our future issuances. Also, we cannot predict the effect, if any, of future sales of our common stock, or the availability of shares for future sales, on the market price of our common stock. Sales of substantial amounts of common stock, or the perception that such sales could occur, may adversely affect the prevailing market price for the shares of our common stock. Therefore, holders of our common stock will bear the risk of our future issuances reducing the market price of our common stock and diluting the value of their stock holdings in us.
Provisions of our charter and amended and restated bylaws and Maryland law may deter takeover attempts, which may limit the opportunity of our stockholders to sell their shares at a favorable price.
Some of the provisions of Maryland law and our charter and amended and restated bylaws discussed below could make it more difficult for a third partythird-party to acquire us, even if doing so might be beneficial to our stockholders by providing them with the opportunity to sell their shares at a premium to the then current market price.
Issuance of stock without stockholder approval. Our charter authorizes our board of directors, without stockholder approval, to authorize the issuance of up to 450,000,000 shares of common stock and up to 50,000,000 shares of preferred stock. As of December 31, 2021, and February 18, 2022, 4,600,000 shares and2023, 11,500,000 shares of preferred stock are classified as 7.00% Series A Preferred Stock, respectively.Stock. Our charter also authorizes our board of directors, without stockholder approval, to classify or reclassify any unissued shares of common stock and preferred stock into other classes or series of stock and to
amend our charter to increase or decrease the aggregate number of shares of stock or the number of shares of stock of any class or series that are authorized by the charter to be issued. Preferred stock may be issued in one or more classes or series, the terms of which may be determined by our board of directors without further action by stockholders. Prior to the issuance of any such class or series, our board of directors will set the terms of any such class or series, including the preferences, conversion or other rights, voting powers, restrictions, limitations as to dividends or other distributions, qualifications and terms and conditions of redemption. The issuance of any preferred stock could materially adversely affect the rights of holders of common stock and, therefore, could reduce the value of the common stock. In addition, specific rights granted to future holders of our preferred stock could be used to restrict our ability to merge with, or sell assets to, a third party.third-party. The power of our board of directors to cause us to issue preferred stock could, in certain circumstances, make it more difficult, delay, discourage, prevent or make it costlier to acquire or effect a change in control thereby preservingunder circumstances that otherwise could provide the current stockholders’ control.holders of shares of our common stock with the opportunity to realize a premium over the then-current market price.
Advance notice bylaw. Our amended and restated bylaws contain advance notice procedures for the introduction by a stockholder of new business and the nomination of directors by a stockholder. These provisions could, in certain circumstances, discourage proxy contests and make it more difficult for stockholders to elect stockholder-nominated directors and to propose and, consequently, approve stockholder proposals opposed by management.
Maryland takeover statutes. Certain provisions of the Maryland General Corporation Law may have the effect of inhibiting a third partythird-party from making a proposal to acquire us or of impeding a change in our control under circumstances that otherwise could provide the holders of our common stock with the opportunity to realize a premium over the then prevailing market price of such shares. We are subject to the Maryland Business Combination Act, which, subject to limitations, prohibits certain business combinations between us and an “interested stockholder” (defined generally as any person who beneficially owns 10% or more of the voting power of our then outstanding voting shares or an affiliate or associate of ours who, at any time within the two-year period prior to the date in question, was the beneficial owner of 10% or more of the voting power of our then outstanding voting shares) or an affiliate thereof for five years after the most recent date on which the stockholder becomes an interested stockholder and, thereafter, imposes special stockholder voting requirements to approve these combinations unless the consideration being received by common stockholders satisfies certain conditions. The statute permits various exemptions
from its provisions, including business combinations that are exempted by the board of directors prior to the time that an interested stockholder becomes an interested stockholder.
We are also subject to the Maryland Control Share Acquisition Act. With certain exceptions, the Maryland General Corporation Law provides that a holder of “control shares” of a Maryland corporation acquired in a “control share acquisition” has no voting rights with respect to those shares except to the extent approved by a vote of two-thirds of the votes entitled to be cast on the matter, excluding shares owned by the acquiring person or by our officers or by our directors who are our employees.
We are also eligible to elect to be subject to the Maryland Unsolicited Takeovers Act, which permits our board of directors, without stockholder approval, to, among other things and notwithstanding any provision in our charter or amended and restated bylaws, to implement certain takeover defenses, such as a classified board, some of which we do not yet have.
In addition, our charter includes certain limitations on the ownership and transfer of our capital stock. See “—“ — Risks Related to Our REIT Status and Certain Other Tax Items—Our charter provides that any individual (including certain entities treated as individuals for this purpose) is prohibited from owning more than 9.8%Items — Ownership limitations may restrict change of our common stockcontrol or of our capital stock, and attempts to acquire our common stock or any of our capital stock in excess of this 9.8% limit would not be effective without a prior exemption from those prohibitions by our board of directorsbusiness combination opportunities..”
Our rights and the rights of our stockholders to take action against our directors and officers are limited, which could limit your recourse in the event of actions not in your best interests.
Our charter limits the liability of our present and former directors and officers to us and our stockholders for money damages to the maximum extent permitted by Maryland law. Under Maryland law, our present and former directors and officers will not have any liability to us and our stockholders for money damages other than liability resulting from:
•actual receipt of an improper benefit or profit in money, property or services; or
•active and deliberate dishonesty by the director or officer that was established by a final judgment as being material to the cause of action adjudicated.
Our charter provides that we have the power to indemnify our present and former directors and officers for actions taken by them in those capacities to the maximum extent permitted by Maryland law. Our amended and restated bylaws require us to indemnify each present and former director or officer, to the maximum extent permitted by Maryland law, in the defense of any proceeding to which he or she is made, or threatened to be made, a party by reason of his or her service to us. In addition, we may be obligated to pay or reimburse the defense costs incurred by our present and former directors and officers without requiring a preliminary determination of their ultimate entitlement to indemnification.
Our charter contains provisions that make removal of our directors difficult, which could make it difficult for our stockholders to effect changes to our management.
Our charter provides that, subject to the rights of any series of preferred stock, a director may be removed upon the affirmative vote of at least two-thirds of the votes entitled to be cast generally in the election of directors. Vacancies may be filled only by a majority of the remaining directors in office, even if less than a quorum. These requirements make it more difficult to change our managementboard of directors by removing and replacing directors and may prevent a change in control of our companythe Company that is in the best interests of our stockholders.
Our amended and restated bylaws designate certain Maryland courts as the sole and exclusive forum for certain types of actions and proceedings that may be initiated by our stockholders, which could limit our stockholders’ ability to obtain a favorable judicial forum for disputes with us or our directors, officers or employees.
Our amended and restated bylaws provide that, unless we consent in writing to the selection of an alternative forum, the Circuit Court for Baltimore City, Maryland, or, if that court does not have jurisdiction, the United States District Court for the District of Maryland, Baltimore Division, shall be the sole and exclusive forum for the following: any derivative action or proceeding brought on behalf of the company;Company; any action asserting a claim of breach of any duty owed by any of our present or former directors, officers or other employees or our stockholders to the companyCompany or to our stockholders or any standard of conduct applicable to our directors; any action asserting a claim against the companyCompany or any of our present or former directors, officers or other employees arising pursuant to any provision of the MGCL or our charter or amended and restated bylaws; or any action asserting a claim against the companyCompany or any of our present or former directors, officers or other employees that is governed by the internal affairs doctrine. This choice of forum provision may limit a stockholder’s ability to bring a claim in a judicial forum that the stockholder believes is favorable for disputes with us or our directors, officers or other employees, which may discourage lawsuits against us and our directors, officers and employees. Alternatively, if a court were to find these provisions of our amended bylaws inapplicable to, or unenforceable in respect of, one or more of the specified types of actions or proceedings, we may incur additional costs associated with resolving such matters in other jurisdictions, which could adversely affect our business, financial condition or results of operations.
We have not established a minimum distribution payment level and we cannot assure you of our ability to pay distributions in the future.
We are generally required to distribute to our stockholders at least 90% of our REIT taxable income, determined without regard to the deduction for dividends paid and excluding net capital gain, each year for us to qualify as a REIT under the Code,
which requirement we currently intend to satisfy through quarterly distributions of at least 90% of our net taxable income in such year, subject to certain adjustments. Although we intend to make regular quarterly distributions to holders of our common stock and we currently expect to distribute at least 90% of our net taxable income to our stockholders on an annual basis, we have not established a minimum distribution payment level and our ability to pay distributions may be adversely affected by a number of factors, including the risk factors described in this Annual Report on Form 10-K. Any distributions we make to our stockholders will be at the discretion of our board of directors and will depend on our earnings, financial condition, liquidity, debt covenants, maintenance of our REIT qualification, applicable law and such other factors as our board of directors may deem relevant from time to time. We believe that a change in any one of the following factors could adversely affect our results of operations and impair our ability to pay distributions to our stockholders:
•our ability to make profitable investments;
•margin calls or other expenses that reduce our cash flow;
•defaults in our investment portfolio or decreases in the value of our portfolio;
•the impact of changes in interest rates on our net interest income; and
•the fact that anticipated operating expense levels may not prove accurate, as actual results may vary from estimates.
As a result, no assurance can be given that the level of any distributions we make to our stockholders will achieve a market yield or increase or even be maintained over time, any of which could materially and adversely affect the market price of our common stock. We may use net operating losses, to the extent available and subject to certain limitations, carried forward to offset future net taxable income, and therefore reduce our dividend requirements. In addition, some of our distributions may include a return of capital, which would reduce the amount of capital available to operate our business.
In addition, distributions that we make to our stockholders will generally be taxable to our stockholders as ordinary income. REIT dividends (other than capital gain dividends) received by non-corporate stockholders may be eligible for a 20% reduction. However, a portion of our distributions may be designated by us as long-term capital gains to the extent that they are attributable to capital gain income recognized by us or may constitute a return of capital to the extent that they exceed our earnings and profits as determined for U.S. federal income tax purposes. A return of capital is not taxable, but has the effect of reducing the basis of a stockholder’s investment in our common stock.
Risks Related to Our REIT Status and Certain Other Tax Items
If we do not maintain our qualification as a REIT, we will be subject to tax as a regular corporation and could face a substantial tax liability.
We intend to continue to operate as a qualified REIT under the Code. However, qualification as a REIT involves the application of highly technical and complex Code provisions for which only a limited number of judicial or administrative interpretations exist. Our continued qualification as a REIT depends on our continuing ability to meet various requirements concerning, among other things, the sources of our gross income, the composition and value of our assets, our distribution levels and the diversity of ownership of our shares. Notwithstanding the availability of cure provisions in the Code, we could fail various compliance requirements which could jeopardize our REIT status. Furthermore, new tax legislation, administrative guidance or court decisions, in each instance potentially with retroactive effect, could make it more difficult or impossible for us to continue to qualify as a REIT. If we fail to qualify as a REIT in any tax year then, unless we were entitled to relief under applicable statutory provisions:
•we would be taxed as a regular domestic corporation, which, under current laws, among other things, means being unable to deduct distributions to stockholders in computing taxable income and being subject to U.S. federal income tax on our taxable income at regular corporate income tax rates;
•any resulting tax liability could be substantial and could have a material adverse effect on our book value;
•we would be required to pay taxes as described above, and thus our cash available for distribution to stockholders would be reduced for each of the years during which we did not qualify as a REIT and for which we had taxable income; and
•we generally would not be eligible to requalify as a REIT for the subsequent four full taxable years.
Even as a REIT, we, in certain circumstances, may incur tax liabilities that would reduce our cash available for distribution to you.stockholders.
Even if we qualify and maintain our status as a REIT, we may become subject to U.S. federal income taxes and related state and local taxes. For example, gain from the sale of properties that are “dealer” properties sold by a REIT (a “prohibited transaction” under the Code) will be subject to a 100% tax. Also, we may not make sufficient distributions to avoid excise taxes applicable to REITs. Similarly, if we were to fail an income or asset test (and did not lose our REIT status because such failure was due to reasonable cause and not willful neglect), we would be subject to tax on the income that does not meet the income test requirements or is generated by assets that do not meet the asset test requirements which could be material. We also may decide to retain net capital gain we earn from the sale or other disposition of our investments and pay income tax directly on such income. In that event, our stockholders would be treated as if they earned that income and paid the tax on it directly.
However, stockholders that are tax-exempt, such as charities or qualified pension plans, would have no benefit from their deemed payment of such tax liability unless they file U.S. federal income tax returns and seek a refund of such tax on such return. We also may be subject to state and local taxes on our income or property, including franchise, payroll, mortgage recording and transfer taxes, either directly or at the level of the other companies through which we indirectly own our assets. In addition, our TRS is subject to full U.S. federal, state, local and foreign corporate-level income taxes. Any taxes we pay directly or indirectly will reduce our cash available for distribution to you.stockholders.
Complying with REIT requirements may cause us to forgo otherwise attractive investment opportunities and limit our expansion opportunities.
In order to qualify as a REIT for U.S. federal income tax purposes, we must continually satisfy tests concerning, among other things, our sources of income, the nature of our investments in real estate and related assets, the amounts we distribute to our stockholders and the ownership of our stock. We may also be required to make distributions to stockholders at disadvantageous times, such as when we do not have funds readily available for distribution or when we would like to use funds for attractive investment and expansion opportunities. Thus, compliance with REIT requirements may hinder our ability to operate solely on the basis of maximizing profits.
Complying with REIT requirements may force us to liquidate or restructure otherwise attractive investments.
In order to qualify as a REIT, we must also ensure that at the end of each calendar quarter, at least 75% of the value of our assets consists of cash, cash items, government securities and qualified REIT real estate assets. The remainder of our investments in securities cannot include more than 10% of the outstanding voting securities of any one issuer or 10% of the total value of the outstanding securities of any one issuer unless we and such issuer jointly elect for such issuer to be treated as a TRS under the Code. The total value of all of our investments in TRSs cannot exceed 20% of the value of our total assets. In addition, no more than 5% of the value of our assets can consist of the securities of any one issuer other than a TRS or a disregarded entity, and no more than 25% of our assets can consist of debt of “publicly offered” REITs (i.e., REITs that are required to file annual and periodic reports with the SEC under the Exchange Act) that is not secured by real property or interests in real property. If we fail to comply with these requirements, we must dispose of a portion of our assets or otherwise come into compliance within 30 days after the end of the calendar quarter in order to avoid losing our REIT status and suffering adverse tax consequences. As a result, we may be required to liquidate or restructure otherwise attractive investments. These actions could have the effect of reducing our income and amounts available for distribution to you.stockholders.
Complying with REIT requirements may limit our ability to hedge effectively and may cause us to incur tax liabilities.
The REIT provisions of the Code substantially limit our ability to hedge our assets and liabilities. Any income from a hedging transaction will not constitute gross income for purposes of the 75% or 95% gross income test if we properly identify the transaction as specified in applicable Treasury regulations and we enter into such transaction (i) in the normal course of our business primarily to manage risk of interest rate or price changes or currency fluctuations with respect to borrowings made or to be made, or ordinary obligations incurred or to be incurred, to acquire or carry real estate assets or (ii) primarily to manage risk of currency fluctuations with respect to any item of income or gain that would be qualifying income under the 75% or 95% income tests. In addition, income from certain new hedging transactions that counteract prior qualifying hedging transactions described in (i) and (ii) above may not constitute gross income for purposes of the 75% and 95% gross income tests if we properly identify the new hedging transaction as specified in applicable Treasury regulations. To the extent that we enter into other types of hedging transactions, the income from those transactions is likely to be treated as non-qualifying income for purposes of both of these gross income tests. As a result of these rules, we intend to limit our use of advantageous hedging techniques or implement those hedges through a TRS. This could increase the cost of our hedging activities because our TRS would be subject to tax on gains or expose us to greater risks associated with changes in interest rates than we would otherwise want to bear. In addition, losses in our TRS, generally, will not provide any tax benefit, except for being carried forward against future taxable income in the TRS.
Complying with REIT requirements may force us to borrow to make distributions to you.stockholders.
From time to time, our taxable income may be greater than our cash flow available for distribution to stockholders. If we do not have other funds available in these situations, we may be unable to distribute substantially all of our taxable income as required by the REIT provisions of the Code. Thus, we could be required to borrow funds, sell a portion of our assets at disadvantageous prices or find another alternative. These options could increase our costs or reduce the value of our equity.
Ownership limitations may restrict change of control or business combination opportunities.
For us to qualify as a REIT under the Code, not more than 50% of the value of our outstanding capital stock may be owned, directly or indirectly, by five or fewer individuals (including certain entities treated as individuals for this purpose) during the last half of a taxable year. For the purpose of preserving our qualification as a REIT for federal income tax purposes, among other purposes, our charter provides that beneficial or constructive ownership by any individual (including certain entities treated as individuals for this purpose) of more than a certain percentage (currently 9.8%) in value or number of shares, whichever is more restrictive, of the outstanding shares of our common stock, or 9.8% in value of our outstanding capital stock is prohibited, which we refer to as the “ownership limits.” The constructive ownership rules under the Code and our charter are
complex and may cause shares of our outstanding common stock owned by a group of related individuals or entities to be deemed to be constructively owned by one individual. As a result, the acquisition of less than 9.8% of our outstanding common stock or our outstanding capital stock by an individual or entity could cause an individual to own constructively in excess of 9.8% of our outstanding common stock, or outstanding capital stock, respectively, and thus violate the ownership limit. Our board of directors, in its sole discretion, may exempt (prospectively or retroactively) a person from this limitation if it obtains such representations, covenants and undertakings as it deems appropriate to conclude that granting the exemption will not cause us to lose our status as a REIT. However, there can be no assurance that our board of directors, as permitted in our charter, will increase, or will not decrease, these ownership limits in the future. Our charter provides that any attempt to own or transfer shares of our common stock or capital stock in excess of the ownership limits without the consent of our board of directors either will result in the shares being transferred by operation of the charter to a charitable trust, and the person who attempted to acquire such excess shares to not have any rights in such excess shares, or in the transfer being void.
The ownership limits may have the effect of precluding a change in control of us by a third party,third-party, even if such change in control would be in the best interests of our stockholders or would result in receipt of a premium to the price of our common stock (and even if such change in control would not reasonably jeopardize our REIT status). Any exemptions to the ownership limits that are granted by our board of directors may limit our board of directors’ ability to increase the ownership limit or grant further exemptions at a later date.
We may choose to make distributions in our own stock, in which case youstockholders may be required to pay income taxes without receiving any cash dividends.
In connection with our qualification as a REIT, we are generally required to annually distribute to our stockholders at least 90% of our REIT taxable income, (which does not equal net income, as calculated in accordance with GAAP), determined without regard to the deduction for dividends paid and excluding net capital gain. In order to satisfy this requirement, we may make distributions that are payable in cash and/or shares of our common stock (which could account for up to 90% of the aggregate amount of such distributions) at the election of each stockholder. As a publicly offered REIT, as long as at least 20% of the total dividend is available in cash and certain other requirements as satisfied, the Internal Revenue Service, or IRS, will treat the stock distribution as a dividend (to the extent applicable rules treat such distribution as being made out of our earnings and profits). Pursuant to recently releasedThis threshold has been temporarily reduced in the past, and may be reduced in the future, by IRS guidance, this threshold is reduced from 20% to 10% for distributions declared by a publicly offered REIT on or after November 1, 2021, and on or before June 30, 2022.guidance. Taxable stockholders receiving such distributions will be required to include the full amount of such distributions as ordinary dividend income to the extent of our current or accumulated earnings and profits, as determined for U.S. federal income tax purposes. As a result, U.S. stockholders may be required to pay income taxes with respect to such distributions in excess of the cash portion of the distribution received. Accordingly, U.S. stockholders receiving a distribution of our shares may be required to sell shares received in such distribution or may be required to sell other stock or assets owned by them, at a time that may be disadvantageous, in order to satisfy any tax imposed on such distribution. If a U.S. stockholder sells the stock that it receives as part of the distribution in order to pay this tax, the sales proceeds may be less than the amount it must include in income with respect to the distribution, depending on the market price of our stock at the time of the sale. Furthermore, with respect to certain non-U.S. stockholders, we may be required to withhold U.S. tax with respect to such distribution, including in respect of all or a portion of such distribution that is payable in stock, by withholding or disposing of part of the shares included in such distribution and using the proceeds of such disposition to satisfy the withholding tax imposed. In addition, if a significant number of our stockholders determine to sell shares of our common stock in order to pay taxes owed on dividend income, such sale may put downward pressure on the market price of our common stock.
Dividends payable by REITs do not qualify for the reduced tax rates on dividend income from regular corporations, which could adversely affect the value of our shares.
Currently, the maximum tax rate applicable to qualified dividend income payable to certain non-corporate U.S. stockholders is 20%. Dividends payable by REITs, however, generally are not eligible for the reduced rate. Although this does not adversely affect the taxation of REITs or dividends payable by REITs, the more favorable rates applicable to regular corporate qualified dividends could cause certain non-corporate investors to perceive investments in REITs to be relatively less attractive than investments in the stocks of non-REIT corporations that pay dividends, which could adversely affect the value of the shares of REITs, including shares of our common stock.
Under current law, for taxable years before January 1, 2026, REIT dividends (other than capital gain dividends and qualified dividends) received by non-corporate taxpayers may be eligible for a 20% deduction which, if allowed in full, equates to a maximum effective U.S. federal income tax rate on ordinary REIT dividends of 29.6%. Prospective investors should consult their own tax advisors regarding the effect of this rule on their effective tax rate with respect to REIT dividends.
We are largely dependent on external sources of capital to finance our growth.
As with other REITs, but unlike corporations generally, our growth must largely be funded by external sources of capital because we generally have to distribute 90% of our taxable income to our stockholders in order to qualify as a REIT. Our access to external capital depends upon a number of factors, including general market conditions, the market’s perception of our growth potential, our current and potential future earnings, cash distributions and the market price of our common stock. We will be subject to regular corporate income taxes on any undistributed REIT taxable income each year, including net capital gains. Additionally, we will be subject to a 4% nondeductible excise tax on any amount by which distributions paid by us in any
calendar year are less than the sum of 85% of our ordinary income, 95% of our capital gain net income and 100% of our undistributed income from previous years.
We may be subject to adverse legislative or regulatory tax changes that could increase our tax liability, reduce our operating flexibility or reduce the market price of our securities.
The present U.S. federal income tax treatment of REITs may be modified, possibly with retroactive effect, by legislative, judicial, or administrative action at any time, which could affect the U.S. federal income tax treatment of an investment in us. The U.S. federal income tax rules dealing with REITs are constantly under review by persons involved in the legislative process, the IRS, and the U.S. Treasury, which results in statutory changes as well as frequent revisions to regulations and interpretations. Several recent proposals have been made that would make substantial changes to the U.S. federal income tax laws generally. We cannot predict whether any of these proposed changes will become law. Future revisions in the U.S. federal tax laws and interpretations thereof may affect or cause us to change our investments and commitments, and affect the tax considerations of an investment in us.
Any such revisions could have an adverse effect on an investment in our securities or on the market value or the resale potential of our assets. YouStockholders are urged to consult with yourtheir tax advisor with respect to the impact of such revisions on yourtheir investment in our shares and the status of legislative, regulatory or administrative developments and proposals and their potential effect on an investment in our shares. Although REITs generally receive certain tax advantages compared to entities taxed as regular corporations, it is possible that future legislation would result in a REIT having fewer tax advantages, and it could become more advantageous for a company that invests in real estate to elect to be treated for U.S. federal income tax purposes as a corporation. Our charter provides our board of directors with the power, under certain circumstances, to revoke or otherwise terminate our REIT election and cause us to be taxed as a regular corporation, without the vote of our stockholders. Our board of directors has duties to us and could only cause such changes in our tax treatment if it determines in good faith that such changes are in our best interest.
WeOur investments in certain investments may cause us to recognize “phantom income” in respectfor U.S. federal income tax purposes even though no cash payments have been received on the debt instruments, and certain modifications of such investments could cause such modified investments to not qualify as a good REIT asset, thereby jeopardizing our investments.REIT qualification.
Our taxable income may substantially exceed our net income as determined based on GAAP, or differences in timing between the recognition of taxable income and the actual receipt of cash, or between the recognition of a taxable deduction and the actual payment of cash, may occur. For example, we may acquire assets, including debt securities requiring us to accrue original issue discount, or OID, or recognize market discount income, that generate taxable income in excess of economic income or in advance of the corresponding cash flow from the assets, which is referred to as “phantom income.” In addition, if a borrower with respect to a particular debt instrument encounters financial difficulty rendering it unable to pay stated interest as due, we may nonetheless be required to continue to recognize the unpaid interest as taxable income, with the effect that we will recognize income but will not have a corresponding amount of cash available for distribution to our stockholders. Finally, we may be required, under the terms of indebtedness, that we incur to use cash received from interest payments to make principal payments on that indebtedness, with the effect of recognizing income but not having a corresponding amount of cash available for distribution to our stockholders.
As a result of the foregoing, we may generate less cash flow than taxable income in a particular year and find it difficult or impossible to meet the REIT distribution requirements in certain circumstances. In such circumstances, we may be required to (a) sell assets in adverse market conditions, (b) borrow on unfavorable terms, (c) distribute amounts that would otherwise be used for future acquisitions or used to repay debt, or (d) make a taxable distribution of our shares of common stock as part of a distribution in which stockholders may elect to receive shares of our common stock or (subject to a limit measured as a percentage of the total distribution) cash, in order to comply with the REIT distribution requirements.
Moreover, we may acquire distressed loans or other debt investments that require subsequent modification by agreement with the borrower. If the amendments to the outstanding debt are “significant modifications” under applicable Treasury regulations, the modified debt may be considered to have been reissued to us in a debt-for-debt taxable exchange with the borrower. In certain circumstances, this deemed reissuance may prevent the modified debt from qualifying as a good REIT asset if the underlying security has declined in value and could cause us to recognize income to the extent the principal amount of the modified debt exceeds our adjusted tax basis in the unmodified debt.
The “taxable mortgage pool” rules may increase the taxes that we or our stockholders may incur, and, therefore, may limit the manner in which we will affecteffect future securitizations.
Securitizations could result in the creation of taxable mortgage pools for federal income tax purposes. As a REIT, so long as we own 100% of the equity interests in a taxable mortgage pool, we generally would not be adversely affected by the characterization of the securitization as a taxable mortgage pool. However, we would be precluded from selling equity interests in these securitizations to outside investors, or selling any debt securities issued in connection with these securitizations that might be considered to be equity interests for tax purposes. Certain categories of stockholders such as foreign stockholders eligible for treaty or other benefits, stockholders with net operating losses, and certain tax-exempt stockholders that are subject to unrelated business income tax, could be subject to increased taxes on a portion of their dividend income from us that is
attributable to “excess inclusion income.” In addition, to the extent that our stock is owned by tax-exempt “disqualified organizations,” such as certain government-related entities and charitable remainder trusts that are not subject to tax on unrelated business income, we may incur a corporate level tax on a portion of our income from the taxable mortgage pool. In that case, we may reduce the amount of our distributions to pay the tax on any “excess inclusion income” ourselves. These limitations may prevent us from using certain techniques to maximize our returns from securitization transactions.
In order to control better, and to attempt to avoid, any distribution of “excess inclusion income” to our stockholders, a subsidiary REIT of ours currently owns 100% of the equity interests in each taxable mortgage pool created by our securitizations. While we believe that we have structured our securitizations such that the above taxes would not apply to our stockholders with respect to taxable mortgage pools held by our subsidiary REIT, our subsidiary REIT is in part owned by a TRS of ours, which will pay corporate level tax on any income that it may be allocated from the subsidiary REIT. In addition, our subsidiary REIT is required to satisfy, on a stand-alone basis, the REIT asset, income, organizational, distribution, stockholder ownership and other requirements described above, and if it were to fail to qualify as a REIT, then (i) our subsidiary REIT would face adverse tax consequences similar to those described above with respect to our qualification as a REIT and (ii) such failure could have an adverse effect on our ability to comply with the REIT income and asset tests and thus could impair our ability to qualify as a REIT unless we could avail ourselves of certain relief provisions.
The failure of a mezzanine loan to qualify as a real estate asset could adversely affect our ability to qualify as a REIT.
We may originate or acquire mezzanine loans, for which the IRS has provided a safe harbor but not rules of substantive law. Pursuant to the safe harbor, if a mezzanine loan meets certain requirements, it will be treated by the IRS as a real estate asset for purposes of the REIT asset tests, and interest derived from the mezzanine loan will be treated as qualifying mortgage interest for purposes of the REIT 75% income test. Our mezzanine loans may not meet all of the requirements of this safe harbor. In the event we own a mezzanine loan that does not meet the safe harbor, the IRS could challenge such loan’s treatment as a real estate asset for purposes of the REIT asset and income tests and, if such a challenge were sustained, we could fail to qualify as a REIT, unless we are able to qualify for a statutory REIT “savings” provision, which may require us to pay a significant penalty tax to maintain our REIT qualification.
We may fail to qualify as a REIT if the IRS successfully challenges the treatment of our mezzanine loans as debt or our preferred equity investments as equity for U.S. federal income tax purposes.
There is limited case law and administrative guidance addressing whether instruments such as mezzanine loans and preferred equity investments will be treated as equity or debt for U.S. federal income tax purposes. We expect that our mezzanine loans generally will be treated as debt for U.S. federal income tax purposes, and our preferred equity investments generally will be treated as equity for U.S. federal income tax purposes, but we typically do not anticipate obtaining private letter rulings from the IRS or opinions of counsel on the characterization of those investments for U.S. federal income tax purposes. If a mezzanine loan is treated as equity for U.S. federal income tax purposes, we would be treated as owning the assets held by the partnership or limited liability company that issued the mezzanine loan and we would be treated as receiving our proportionate share of the income of that entity. If that partnership or limited liability company owned non-qualifying assets or earned non-qualifying income, we may not be able to satisfy all of the REIT income or asset tests. Alternatively, if the IRS successfully asserts a preferred equity investment is debt for U.S. federal income tax purposes, then that investment may be treated as a non-qualifying asset for purposes of the 75% asset test and as producing non-qualifying income for the 75% gross income test. In addition, such an investment may be subject to the 10% value test and the 5% asset test, and it is possible that a preferred equity investment that is treated as debt for U.S. federal income tax purposes could cause us to fail one or more of the foregoing tests. Accordingly, we could fail to qualify as a REIT if the IRS does not respect our classification of our mezzanine loans or preferred equity for U.S. federal income tax purposes unless we are able to qualify for a statutory REIT “savings” provision, which may require us to pay a significant penalty tax to maintain our REIT qualification.
The tax on prohibited transactions limits our ability to engage in transactions, including certain methods of securitizing or syndicating commercial mortgage loans that would be treated as sales for U.S. federal income tax purposes.
A REIT’s net income from prohibited transactions is subject to a 100% tax with no offset for losses. In general, prohibited transactions are sales or other dispositions of property, other than foreclosure property, but including commercial mortgage loans, held primarily for sale to customers in the ordinary course of business. We might be subject to this tax if we dispose of, securitize or syndicate loans in a manner that was treated as a sale of the loans, or if we frequently buy and sell securities in a manner that is treated as dealer activity with respect to such securities for U.S. federal income tax purposes. Therefore, in order to avoid the prohibited transactions tax, we may choose to engage in certain sales of loans through a TRS and not at the REIT level (which would give rise to corporate-level tax), and may limit the structures we utilize for our securitization transactions, even though direct sales by us or those structures might otherwise be beneficial to us.
The failure of assets subject to repurchase agreements to qualify as real estate assets could adversely affect our ability to qualify as a REIT.
We have entered into financing arrangements that are structured as sale and repurchase agreements pursuant to which we nominally sell certain of our assets to a counterparty and simultaneously enter into an agreement to repurchase these assets at a later date in exchange for a purchase price. Economically, these agreements are borrowings which are secured by the assets sold pursuant thereto. We believe that we will be treated for REIT asset and income test purposes as the owner of the assets that are the subject of any such sale and repurchase agreement, notwithstanding that such agreements may transfer record ownership of the assets to the counterparty during the term of the agreement. It is possible, however, that the IRS could assert that we did not own the assets during the term of the related sale and repurchase agreement, in which case we could fail to qualify as a REIT.
Liquidation of assets may jeopardize our REIT qualification.
To qualify as a REIT, we must comply with requirements regarding our assets and our sources of income. If we are compelled to liquidate our investments to repay obligations to our lenders, we may be unable to comply with these requirements, ultimately jeopardizing our qualification as a REIT, or we may be subject to a 100% tax on any resultant gain if we sell assets that are treated as dealer property or inventory.
Our ownership of, and relationship with, our TRSs will be restricted and a failure to comply with the restrictions would jeopardize our REIT status and may result in the application of a 100% excise tax.
A REIT may own up to 100% of the stock of one or more TRSs. A TRS may earn income that would not be qualifying REIT income if earned directly by the parent REIT. Both the TRS and the REIT must jointly elect to treat the subsidiary as a TRS. A corporation of which a TRS directly or indirectly owns more than 35% of the voting power or value of the stock will automatically be treated as a TRS. Overall, no more than 20% of the gross value of a REIT’s assets may consist of stock or securities of one or more TRSs. The value of our interests in, and thus the amount of assets held in, a TRS may also be restricted by our need to qualify for an exclusion from regulation as an investment company under the Investment Company Act.
Any domestic TRS we own, or may form in the future, will pay U.S. federal, state and local income tax at regular corporate rates on any income that it earns. In addition, the Code limits the deductibility of interest paid or accrued by a TRS. The rules also impose a 100% excise tax on certain transactions between a TRS and its parent REIT that are not conducted on an arm’s-length basis.
We expect that the aggregate value of all TRS stock and securities owned by us should be less than 20% of the value of our total assets. Although we monitor our investments in and transactions with TRSs, there can be no assurance that we will be able to comply with the limitation on the value of our TRSs discussed above or to avoid application of the 100% excise tax discussed above.
Our qualification as a REIT may be dependent on the accuracy of legal opinions or advice rendered or given or statements by the issuers of assets that we acquire, and the inaccuracy of any such opinions, advice or statements may adversely affect our REIT qualification and result in significant corporate-level tax.
When purchasing securities, we may rely on opinions or advice of counsel for the issuer of such securities, or statements made in related offering documents, for purposes of determining whether such securities represent debt or equity securities for U.S. federal income tax purposes, the value of such securities and also to what extent those securities constitute qualified real estate assets for purposes of the REIT asset tests and produce income that qualifies under the 75% gross income test. The inaccuracy of any such opinions, advice or statements may adversely affect our ability to qualify as a REIT and result in significant corporate-level tax.
Item 1B. Unresolved Staff Comments
None.
Item 1C. Cybersecurity
Risk Management and Strategy
We regularly assess risks from cybersecurity threats, monitor our information systems for potential vulnerabilities and test those systems pursuant to our cybersecurity policies, processes and practices, which are integrated into our overall risk management program. In partnership with our designed outsourced technology provider, we have implemented extensive processes and controls to assess, manage and protect against material risks from cybersecurity threats, including the following:
•a managed detection and response platform that is monitored at all times by members of our third-party technology provider’s Security Operations Center team;
•periodic penetration testing and vulnerability scans;
•quarterly cybersecurity training and phishing email exercises for all employees and officers;
•vendor cybersecurity diligence;
•cybersecurity insurance; and
•a cybersecurity Incident Response Plan that includes procedures for responding to cybersecurity incidents.
To date, cybersecurity threats, including as a result of any previous cybersecurity incidents, have not materially affected and we believe are not reasonably likely to materially affect the Company, including our business strategy, results of operations or financial condition. Refer to “Risk Factors – Risks Related to our Company and Structure – Operational risks, including the risk of cyberattacks, may disrupt our business, resulting in loss or limited growth” in Item 1A of this Annual Report on Form 10-K for an additional description of our cybersecurity risk and the potential related impacts.
Governance
Pursuant to its charter, the Audit Committee of our board of directors oversees our risk management program, which focuses on the most significant risks we face, including cybersecurity risks. Audit Committee meetings include discussions of specific risk areas, and our Chief Compliance Officer, or our CCO, regularly reports to the Audit Committee on cybersecurity risks we face, as well as the status of measures undertaken by the Company to manage those risks. Pursuant to our Incident Response Plan, the chair of the Audit Committee will be notified in the event of a cybersecurity incident meeting a specified severity level. In addition, all members of our board of directors, including members of the Audit Committee, participate in quarterly training on cybersecurity threats, including those facing the Company.
Our CCO and our Chief Financial Officer, or our CFO, work collaboratively with senior members of our outsourced technology firm to comprise our Cybersecurity Team. Our Cybersecurity Team has primary responsibility for overseeing, implementing and managing our processes and controls to assess, identify and manage material risks from cybersecurity threats, including those described above in Risk Management and Strategy.
Our Incident Response Team, in coordination with external advisors, is responsible for responding to and managing cybersecurity incidents pursuant to our Incident Response Plan. Our Incident Response Team includes our Cybersecurity Team and our Chief Executive Officer, along with other Company personnel as appropriate based on the nature of the incident.
The members of our Cybersecurity Team have various levels of experience in information technology and cybersecurity matters. Our third-party technology firm is a global information technology and cybersecurity provider with a seasoned executive team possessing decades of experience and various cybersecurity certifications, such as Certified Information Systems Security Professional certification. Our CCO and CFO each has extensive experience managing risks at the Company, including risks arising from cybersecurity threats. Our CCO also holds a CERT Certificate in Cybersecurity Oversight issued from the CERT Division of the Software Engineering Institute at Carnegie Mellon University and the National Association of Corporate Directors.
Item 2. Properties
Our corporate headquarters is located in sub-leased office space at 3 Bryant Park, Suite 2400A, New York, New York 10036. We also lease office facilities in St. Louis Park, Minnesota. We do not own any real property. We consider these facilities to be suitable and adequate for the management and operations of our business.
Item 3. Legal Proceedings
From time to time, we may be involved in various legal claims and/or administrative proceedings that arise in the ordinary course of our business. As of the date of this filing, we are not party to any litigation or other legal proceedings or, to the best of our knowledge, any threatened litigation or legal proceedings, which, in our opinion, individually or in the aggregate would have a material adverse effect on our results of operations or financial condition.
Item 4. Mine Safety Disclosures
Not applicable.
PART II
Item 5. Market for Registrant’s Common Equity, Related Stockholder Matters, and Issuer Purchases of Equity Securities
Market Information
Our common stock is listed on the NYSE under the symbol “GPMT.” On February 18, 2022,26, 2024, the closing price of our common stock, as reported on the NYSE, was $11.58$4.63 per share.
Holders
As of February 18, 2022,26, 2024, there were 205178 registered holders of our common stock. This does not include the number of stockholders that hold shares in “street name” through banks or broker-dealers.
Dividends
We generally intend to distribute substantially all of our taxable income each year (which does not necessarily equal net income as calculated in accordance with Generally Accepted Accounting Principles, or GAAP) to our stockholders to comply with the REIT provisions of the Code. In addition, our dividend policy remains subject to revision at the discretion of our board of directors. AllAny distributions will be made at the discretion of our board of directors and will depend upon, among other things, our actual results of operations and liquidity. These results, and our ability to pay distributions, will be affected by various factors, including our taxable income, our financial condition, our maintenance of REIT status, restrictions related to our financing facilities, applicable law and other factors as our board of directors deems relevant.
The following table presents cash dividends declared on our common stock since 2022:
| | | | | | | | | | | | | | | | | | | | |
| Declaration Date | | Record Date | | Payment Date | | Cash Dividend Per Share |
| 2023 | | | | | | |
| December 19, 2023 | | December 29, 2023 | | January 16, 2024 | | $ | 0.20 | |
| September 20, 2023 | | October 2, 2023 | | October 16, 2023 | | $ | 0.20 | |
| June 22, 2023 | | July 3, 2023 | | July 17, 2023 | | $ | 0.20 | |
| March 16, 2023 | | April 3, 2023 | | April 17, 2023 | | $ | 0.20 | |
| | | | | | $ | 0.80 | |
| | | | | | |
| 2022 | | | | | | |
| December 20, 2022 | | December 30, 2022 | | January 17, 2023 | | $ | 0.20 | |
| September 20, 2022 | | October 3, 2022 | | October 17, 2022 | | $ | 0.25 | |
| June 16, 2022 | | July 1, 2022 | | July 15, 2022 | | $ | 0.25 | |
| March 17, 2022 | | April 1, 2022 | | April 15, 2022 | | $ | 0.25 | |
| | | | | | $ | 0.95 | |
| | | | | | |
| | | | | | |
| | | | | | |
| | | | | | |
| | | | | | |
| | | | | | |
| | | | | | |
| | | | | | |
| | | | | | |
| | | | | | |
| | | | | | |
| | | | | | |
| | | | | | |
| | | | | | |
| | | | | | |
| | | | | | |
| | | | | | |
| | | | | | |
Performance Graph
The following graph compares the stockholder’s cumulative total return on our common stock, assuming $100 invested at June 28, 2017, with all quarterly reinvestment of dividends before consideration of income taxes and without the payment of any commissions, as if such amounts had been invested in: (i) our common stock; (ii) the stocks included in the Standard and Poor’s 500 Stock Index, or S&P 500; and (iii) the stocks included in the Bloomberg REIT Mortgage Index. There can be no assurance that the performance of our shares will continue in line with the same or similar trends depicted in the graph below.
COMPARISON OF CUMULATIVE TOTAL RETURN
Among Granite Point Mortgage Trust Inc.,
S&P 500 and Bloomberg REIT Mortgage Index
| | Index | Index | | 6/28/17 | | 6/30/17 | | 12/31/17 | | 6/30/18 | | 12/31/18 | | 6/30/19 | | 12/31/19 | | 6/30/20 | | 12/31/20 | | 6/30/21 | | 12/31/21 | Index | | 6/28/17 | | 6/30/17 | | 12/31/17 | | 6/30/18 | | 12/31/18 | | 6/30/19 | | 12/31/19 | | 6/30/20 | | 12/31/20 | | 6/30/21 | | 12/31/21 | | 6/30/22 | | 12/31/22 | | 6/30/23 | | 12/31/23 |
| Granite Point Mortgage Trust Inc. | Granite Point Mortgage Trust Inc. | | $ | 100.00 | | | $ | 99.84 | | | $ | 97.25 | | | $ | 105.12 | | | $ | 108.05 | | | $ | 117.60 | | | $ | 120.47 | | | $ | 47.06 | | | $ | 70.39 | | | $ | 107.90 | | | $ | 89.15 | |
| S&P 500 | S&P 500 | | $ | 100.00 | | | $ | 99.30 | | | $ | 110.64 | | | $ | 113.56 | | | $ | 105.78 | | | $ | 125.39 | | | $ | 139.07 | | | $ | 134.78 | | | $ | 139.07 | | | $ | 189.74 | | | $ | 211.86 | |
| Bloomberg REIT Mortgage Index | Bloomberg REIT Mortgage Index | | $ | 100.00 | | | $ | 99.21 | | | $ | 102.58 | | | $ | 103.07 | | | $ | 99.59 | | | $ | 108.57 | | | $ | 123.12 | | | $ | 73.73 | | | $ | 95.79 | | | $ | 116.79 | | | $ | 112.65 | |
Purchases of Equity Securities by the Issuer and Affiliated Purchasers
On December 16, 2021, the CompanyMay 9, 2023, we announced that itsour board of directors increased the Company’shad amended our share repurchase program to allow forauthorize the repurchase of up to an aggregate of 4,000,000additional 5,000,000 shares of the Company’sour common stock. The Company’sstock, for a total share repurchase authorization of 9,000,000 shares of our common stock, inclusive of amounts previously authorized. Our share repurchase program has no expiration date. The shares are expected to be repurchased from time to time through privately negotiated transactions or open market transactions, including pursuant to a trading plan in accordance with Rules 10b5-1 and 10b-18 under the Securities Exchange Act of 1934, as amended, or the Exchange Act or by any combination of such methods. The manner, price, number and timing of share repurchases will be subject to a variety of factors, including market conditions and applicable SEC rules.
During the year ended December 31, 2021, the Company2023, and 2022, under our share repurchase program, we repurchased 1,301,6122,001,338 shares of itsour common stock at a weighted average purchase price of $5.12 per share for an aggregate purchase price of $10.2 million and 1,539,134 shares of our common stock at a weighted average purchase price of $10.18 per share for an aggregate purchase price of $15.7 million, respectively. During the three months ended December 31, 2023, under our share repurchase program, we repurchased 1,000,000 shares of our common stock at a weighted average price of $13.65$5.15 per share for an aggregate costpurchase price of $17.8$5.2 million. As of December 31, 2021,2023, there remained 2,698,3884,157,916 shares authorized for repurchase. No shares were repurchased during the three months ended December 31, 2021, or the year ended December 31, 2020.repurchase under our share repurchase program.
The Company hasOur board of directors also authorized the repurchase of shares of restricted common stock granted to employees and directors for tax withholding purposes. During the year ended December 31, 2021, the Company2023, and 2022, pursuant to such authorization, we repurchased from employees and directors 115,05336,916 shares of itsour common stock at a weighted average purchase price of $6.40 for an aggregate costpurchase price of $1.2 million.$0.2 million and 69,039 shares of our common stock at a weighted average purchase price of $11.94 for an aggregate purchase price of $0.8 million, respectively. No shares were repurchased for tax withholding purposes during the three months ended December 31, 2021, or2023.
Issuer Purchases of Equity Securities
The following table summarizes the yearrepurchase of common stock for the three months ended December 31, 2020.2023:
| | | | | | | | | | | | | | | | | | | | | | | |
| Period | Total Number of Shares Purchased | | Average Price Paid Per Share | | Total Number of Shares Purchased as Part of Publicly Announced Plans or Programs | | Maximum Number (or Approximate Dollar Value) of Shares that May Yet Be Purchased Under the Plan or Programs(1) |
| | | | | | | |
| | | | | | | |
| | | | | | | |
| October 1-31, 2023 | — | | | $ | — | | | — | | | 5,157,916 | |
| November 1-30, 2023 | 798,737 | | | $ | 5.06 | | | 798,737 | | | 4,359,179 | |
| December 1-31, 2023 | 201,263 | | | $ | 5.50 | | | 201,263 | | | 4,157,916 | |
| Total | 1,000,000 | | | $ | 5.15 | | | 1,000,000 | | | 4,157,916 | |
____________________
Item 6. [Reserved]
Not applicable.
Item 6. [Reserved]
Item 7. Management’s Discussion and Analysis of Financial Condition and Results of Operations
The following discussion and analysis should be read in conjunction with the consolidated financial statements and accompanying notes included elsewhere in this Annual Report on Form 10-K. In addition to historical data, this discussion contains forward-looking statements about our business, operations and financial performance based on current expectations that involve risks, uncertainties and assumptions. Our actual results may differ materially from those in this discussion as a result of various factors, including, but not limited to, those discussed in Part I - Item 1A Risk Factors, in this Annual Report on Form 10-K.
This section of this Annual Report on Form 10-K generally discusses 20212023 and 20202022 items and year-to-year comparisons between 20212023 and 2020.2022. Discussions of 20192021 items and year-to-year comparisons between 20202022 and 20192021 that are not included in this Annual Report on Form 10-K can be found in “Management’s“Management’s Discussion and Analysis of Financial Condition and Results of Operations”Operations” in Part II, Item 7 of our Annual Report on Form 10-K for the fiscal year ended December 31, 2020.2022.
Our Company
Granite Point Mortgage Trust Inc. is an internally managedinternally-managed real estate finance company that focuses primarily on directly originating, investing in and managing senior floating-rate commercial mortgage loans and other debt and debt-like commercial real estate investments. Our investment objective is to preserve our stockholders’ capital while generating attractive risk-adjusted returns over the long term, primarily through dividends derived from current income produced by our investment portfolio. We operate as a real estate investment trust, or REIT, as defined under the Internal Revenue Code of 1986, as amended, or the Code. We also operate our business in a manner that will permit usintended to maintain our exclusion from registration under the Investment Company Act of 1940, as amended, or the Investment Company Act. We operate our business as one segment.
Recent Developments
COVID-19 PandemicMacroeconomic Environment
AsThe year ended December 31, 2023, was characterized by continued volatility in global securities markets, driven by investor concerns over inflation, high interest rates, escalating trade tensions, slowing economic growth, political and regulatory uncertainty and geopolitical conditions, including the novel coronavirus, or COVID-19, pandemicimpacts of the Russia-Ukraine conflict and, more recently, the conflict and rising tensions in the Middle East. Events affecting financial institutions during the year also contributed to volatility in global markets and diminished liquidity and credit availability.
Although the Federal Reserve has evolved from its emergenceindicated that no further interest rate increases are expected in early 2020, so2024, how long interest rates will remain at their current elevated levels and the direction and extent of any future interest rate changes remain uncertain. Although our business model is such that higher interest rates will, all else being equal, generally correlate to higher net income, interest rates remaining elevated for an extended period of time has its global impact. Many countries have reinstituted, or strongly encouraged, varying levels of quarantinesadversely affected, and restrictions on travel and in some cases have at times limited operations of certain businesses and taken other restrictive measures designed to help slow the spread of COVID-19 and its variants. Governments and businesses have also instituted vaccine mandates and testing requirements for employees. While vaccine availability and uptake have increased, the longer-term macroeconomic effects on global supply chains, inflation, labor shortages and wage increases, as well as any potential fiscal and monetary policy responses, may continue to adversely affect, our existing borrowers and the cost of financing their properties and lead to nonperformance. Additionally, higher interest rates and increasing costs may dampen consumer spending and slow corporate profit growth, which may negatively impact many industries, including those related to the collateral underlying certain of our loans. Moreover,Higher interest rates have adversely impacted, and may continue to adversely impact, commercial real estate property values. It remains difficult to predict the full impact on macroeconomic conditions and our business of recent events and any future changes in interest rates or inflation.
Office Property Market
The office property market has been experiencing higher office vacancies, slower leasing activity and various tenants re-evaluating their need for physical office space due in large part to remote work trends. These factors coupled with inflation, elevated interest rates, and limited market liquidity have created a high level of uncertainty with respect to property values. These challenging dynamics have stressed certain borrowers’ ability and willingness to support their office properties and perform in accordance with the potential for new strainsterms of COVID-19 to emerge, governments and businesses may re-impose aggressive measures to help slow its spread in the future. Fortheir loans. Given this reason, among others, as the COVID-19 pandemic continues, the potential global impacts are uncertain anduncertainty, it remains difficult to assess.predict the effect these challenging conditions may have on the office property market, our borrowers, their performance under the terms of our loans secured by office properties and our financial results.
LIBORReference Rate Transition
On March 5, 2021,The London Interbank Offered Rate, or LIBOR, which had been the Financial Conduct Authorityprimary reference rate for our floating rate financing arrangements, was previously the subject of the U.K.,regulatory guidance and proposals for reform or the FCA, which regulates LIBOR, announced that all LIBOR tenors relevant to us will cease to be published or will no longer be representative after June 30, 2023. The FCA announcement coincides with the March 5, 2021, announcement of LIBOR’s administrator, the ICE Benchmark Administration Limited, or the IBA, indicating that, as a result of not having access to input data necessary to calculate LIBOR tenors relevant to us on a representative basis after June 30, 2023, the IBA would have to cease publication of such LIBOR tenors immediately after the last publication on June 30, 2023. The United States Federal Reserve has also advised banks to cease entering into new contracts that use U.S. dollar LIBOR as a reference rate.replacement. The Federal Reserve, in conjunction with the Alternative Reference RateRates Committee, or the ARRC, a steering committee convened by the Federal Reserve that includes major market participants, hascomposed of large U.S. financial institutions, identified the Secured Overnight Financing Rate, or SOFR, a newan index calculated byusing short-term repurchase agreements backed by U.S. Treasury securities, as its preferred alternative rate for LIBOR. There are significant differences between LIBOR and SOFR, such as LIBOR being an unsecured lending rate while SOFR is a secured lending rate, and SOFR is an overnight rate while LIBOR reflects term rates at different maturities. If our LIBOR-based borrowings are converted to SOFR, the differences between LIBOR and SOFR, and potential margin adjustments in connection with the transition, could result in higher interest costs for us, which could have a material adverse effect on our operating results. Although SOFR is the ARRC’s recommended replacement rate, it is also possible that lenders may instead choose alternative replacement rates that may differ from LIBOR in ways similar to SOFR or in other ways that would result in higher interest costs for us. We cannot predict the effect of the decision not to sustain LIBOR, or the potential transition to SOFR or another alternative reference rate as LIBOR’s replacement.
As of December 31, 2021, 98.8%2023, all of our loans by carry value earned a floating rate of interest indexed to LIBOR,SOFR and 100.0%all of our outstanding floating rate financing arrangements (excluding our convertible notes and senior secured financing facilities) bearbore interest indexed to SOFR.
interest indexed to LIBOR. All of these arrangements provide procedures for determining an alternative base rate in the event that LIBOR is discontinued. Regardless, there can be no assurances as to what alternative base rates may be and whether such base rate will be more or less favorable than LIBOR and any other unforeseen impacts of the potential discontinuation of LIBOR. We are monitoring the developments with respect to the potential phasing out of LIBOR and are working with our lenders and borrowers to minimize the impact of any LIBOR transition on our financial condition and results of operations, but can provide no assurances regarding the impact of the discontinuation of LIBOR.
20212023 Activity
Operating Results:
•Recognized GAAP net income(loss) attributable to common stockholders of $67.6$(77.6) million, or $1.24$(1.50) per basic share.
•Generated Distributable Earnings before realized losses of $37.3 million, or $0.72 per basic share, reflecting a releaseand Distributable (Loss) to common stockholders of CECL reserves of $20.0 million, a loss on early extinguishment of debt of $(8.9) million, and other factors.
•Distributable Earnings of $54.3$(17.0) million, or $0.99$(0.33) per basic share, which includes a total of $(54.3) million of write-offs related to certain loan resolutions, and excludes the $20.0$(104.8) million release of the CECL reserve, $7.6in non-cash provision for credit losses, $(7.0) million expense related to the amortization of non-cash equity compensation the $(8.9)expense and $(3.4) million of lossnon-cash depreciation and amortization on early extinguishmentREO.
•Recorded an increase to the allowance for credit losses of debt and includes the $(9.7)$50.5 million, realized loss onfor a total allowance of credit losses of $137.1 million, or approximately 4.7% of total loan held-for-investment, as further described below.commitments of $2.9 billion at December 31, 2023.
•Book value per share of common stock of $16.70at December 31, 2023, was $12.91, inclusive of $(0.79)$(2.71) per share of total Current Expected Credit Loss, or CECL, reserve.
•Declared aggregate common stock dividends of $55.3$42.7 million, or $1.00$0.80 per share of common stock, and preferred dividends of $0.7$14.5 million, or $0.15069$1.75 per share of Series A Preferred Stock.
Investment Portfolio Activity:
•Originated 22 loansone loan with a total commitmentscommitment of $764.1$61.8 million and totalan initial principal balance of $673.6$48.8 million related to the resolution of a nonaccrual loan.
•Funded $71.3 million of prior loan commitments, loan upsizes and protective advances.
•Realized $698.3 million of total unpaid principal balance, or UPB, in loan repayments, principal paydowns and principal amortization, including a write-off of $(33.3) million.
•Funded $142.7Acquired through a negotiated deed-in-lieu of foreclosure an office property with an estimated fair value at closing of $24.0 million, incurring a write-off of $(4.2) million. The property had previously served as collateral for a senior mortgage loan held-for-investment with an unpaid principal balance on prior loan commitments and $8.0 million of principal balance on upsizing of loans.$28.2 million.
•ReceivedTransferred a senior loan repaymentswith an unpaid principal balance of $31.8 million to loans held-for-sale, incurring a write-off of $(16.8) million at the time of transfer, and principal amortization of $960.3 million.finalized the loan sale with no additional losses incurred.
•Maintained a portfolio of 10573 loan investments with an aggregate unpaid principal balance of $2.7 billion and total commitments of $2.9 billion, a weighted-averageweighted average stabilized loan to value ratio, or LTV at origination of 63.5%63.6%, and a weighted-averageweighted average all-in yield at origination of L+4.07%S+4.03%.
•Collected 100% of contractual interest payments during 2021, inclusive of loan modifications and two loans on nonaccrual status. Deferred, and added to the principal, $10.2 million of interest income related to certain loans that have been modified.
Portfolio Financing Activity:
•Issued two collateralized loan obligations totaling $1.4 billion, financing 45 existing senior loan investments, further diversifying our funding mix and significantly increasingRedeemed the proportionGPMT 2019-FL2 CRE CLO, which, at its redemption, had $98.1 million of matched-term, non-recourse and non-mark-to-marketoutstanding borrowings.
•Closed a $349.3 million matched-term, non-recourseExtended the maturity of the JPMorgan Chase financing facility to July 28, 2025, and non-mark-to-market financing facility.upsized the facility’s maximum borrowing capacity up to $525 million.
•Extended maturitiesthe maturity of three of our bankthe Morgan Stanley and Goldman Sachs financing facilities totaling approximately $850.0to June 28, 2024, and July 13, 2024, respectively.
•Entered into amendments of the guaranties provided by the Company in connection with certain of its secured financing arrangements, including its repurchase facilities with Morgan Stanley Bank, Goldman Sachs Bank USA, JPMorgan Chase and Citibank, to modify certain financial covenants.
•Fully repaid and terminated the asset-specific financing facility, which had $45.8 million of borrowing capacity.outstanding borrowings at payoff.
Corporate Financing Activity:
•Issued approximately 4.6Redeemed for cash $131.6 million of Series A Preferred Stock, generating gross proceeds of $114.9 million and further expanding our permanent equity capital base to over $1.0 billion.
•Repaid $75.0 million of borrowings underin convertible senior notes at maturity on October 1, 2023. Following the senior secured term loan facilities.repayment, no corporate debt maturities remain.
•Repurchased through open market transactions 1,301,6122,001,338 shares of common stock at a weighted average purchase price of $13.65 per share$5.12 for an aggregate costpurchase price of $17.8 million, resulting in accretion of book value per share.
•Settled in cash all of the outstanding warrants to purchase approximately 4.55 million shares of our common stock for a net cash amount of approximately $32.1$10.2 million. No warrants remain outstanding.
Available LiquidityLiquidity:
•At December 31, 2021, we had2023, carried unrestricted cash available for investments of $191.9$188.4 million, a portion of which is subject to certain liquidity covenants.
Key Financial Measures and Indicators
As a commercial real estate finance company, we believe the key financial measures and indicators for our business are earnings per share presented on a U.S. generally accepted accounting principles, or GAAP basis, dividends declared on common stock, Distributable Earnings and book value per share of common stock. For the year ended December 31, 2021,2023, we recorded earningsa GAAP net (Loss) per basic share of $1.24,$(1.50), declared totala cash dividendsdividend of $1.00$0.80 per share of common stock and reported Distributable (Loss) of $(0.33) per basic share. Our
Distributable Earnings of $0.99 per basic share. Our book value as of December 31, 2021,2023, was $16.70$12.91 per share of common stock, inclusive of $(0.79)$(2.71) per share of total Current Expected Credit Loss, or CECL reserve.reserves.
As further described below, Distributable Earnings is a measure that is not prepared in accordance with GAAP. We use Distributable Earnings to evaluate our performance, excluding the effects of certain transactions and GAAP adjustments that we believe are not necessarily indicative of our current loan portfolio and operations. In addition, Distributable Earnings is a performance metric we consider, along with other measures, when declaring our common stock dividends.
(Loss) Earnings Per Share and Dividends Declared Per Common Share
The following table sets forth the calculation of basic and diluted earnings (loss) per share and dividends declared per share:share for the years ended December 31, 2023, and 2022:
| | | | | | | | | | | | | | | |
| | | Year Ended |
| | | December 31, |
| (in thousands) | | | | | 2021 | | 2020 |
| Net income (loss) attributable to common stockholders | | | | | $ | 67,560 | | | $ | (40,539) | |
| Weighted average number of common shares outstanding | | | | | 54,593,499 | | | 55,156,482 | |
| Weighted average number of diluted shares outstanding | | | | | 54,929,070 | | | 55,156,482 | |
| Basic earnings per basic common share | | | | | $ | 1.24 | | | $ | (0.73) | |
| Diluted earnings per basic common share | | | | | $ | 1.23 | | | $ | (0.73) | |
| Dividend declared per common share | | | | | $ | 1.00 | | | $ | 0.65 | |
| | | | | | | | | | | | | | | |
| | | Year Ended |
| | | December 31, |
| (in thousands, except share data) | | | | | 2023 | | 2022 |
| Net (loss) attributable to common stockholders | | | | | $ | (77,649) | | | $ | (55,327) | |
| Weighted average number of common shares outstanding | | | | | 51,641,619 | | | 53,011,806 | |
| Weighted average number of diluted shares outstanding | | | | | 51,641,619 | | | 53,011,806 | |
| Basic (loss) per basic common share | | | | | $ | (1.50) | | | $ | (1.04) | |
| Diluted (loss) per basic common share | | | | | $ | (1.50) | | | $ | (1.04) | |
| Dividend declared per common share | | | | | $ | 0.80 | | | $ | 0.95 | |
Distributable Earnings
In order to maintain our status as a REIT, we are required to distribute at least 90% of our taxable income as dividends. Distributable Earnings is intended to over time serve as a general, though imperfect, proxy for our taxable income. As such, Distributable Earnings is considered a key indicator of our ability to generate sufficient income to pay dividends on our common dividends,stock, which is the primary focus of income-oriented investors who comprise a meaningful segment of our stockholder base. We believe providing Distributable Earnings on a supplemental basis to our net income (loss) and cash flow from operating activities, as determined in accordance with GAAP, is helpful to stockholders in assessing the overall run-rate operating performance of our business.
We use Distributable Earnings to evaluate our performance, excluding the effects of certain transactions and GAAP adjustments we believe are not necessarily indicative of our current loan portfolio and operations. For reporting purposes, we define Distributable Earnings as net income (loss) attributable to our stockholders, computed in accordance with GAAP, excluding: (i) non-cash equity compensation expenses; (ii) depreciation and amortization; (iii) any unrealized gains (losses) or other similar non-cash items that are included in net income (loss) for the applicable reporting period (regardless of whether such items are included in other comprehensive income (loss) or in net income (loss) for such period); and (iv) certain non-cash items and one-time expenses. Distributable Earnings may also be adjusted from time to time for reporting purposes to exclude one-time events pursuant to changes in GAAP and certain other material non-cash income or expense items approved by a majority of our independent directors. The exclusion of depreciation and amortization from the calculation of Distributable Earnings only applies to debt investments related to real estate to the extent we foreclose upon the property or properties underlying such debt investments.
While Distributable Earnings excludes the impact of the unrealized non-cash current provision for credit losses, we expect to only recognize such potential credit losses in Distributable Earnings if and when such amounts are deemed non-recoverable. This is generally at the time a loan is repaid, or in the case of foreclosure, when the underlying asset is sold, but non-recoverability may also be concluded if, in our determination, it is nearly certain that all amounts due will not be collected. The realized loss amount reflected in Distributable Earnings will equal the difference between the cash received, or expected to be received, and the carrying value of the asset, and is reflective of our economic experience as it relates to the ultimate realization of the loan. During the year ended December 31, 2021,2023, we recorded a $20.0 million benefit from provision for credit losses of $(104.8) million, which has been excluded from Distributable Earnings, consistent with other unrealized gains (losses) and other non-cash items pursuant to our existing policy for reporting Distributable Earnings referenced above. PursuantDuring the year ended December 31, 2023, we recorded $(3.4) million in depreciation and amortization on REO and related intangibles, which has been excluded from Distributable Earnings consistent with other unrealized gains (losses) and other non-cash items pursuant to our existing policy for reporting Distributable Earnings referenced above, during the year ended December 31, 2021, we recorded a $(9.7) million realized loss on a loan held-for investment, which we included in Distributable Earnings because we did not collect all amounts due at the time the loan was repaid.above. During the year ended December 31, 2021,2023, we recorded a $(8.9)$0.2 million lossgain on early extinguishment of debt, which has been excluded from Distributable Earnings consistent with certain one-time expensesevents pursuant to our existing policy for reporting Distributable Earnings as a helpful indicator in assessing the overall run-rate operating performance of our business.
During the year ended December 31, 2023, we recorded $(54.3) million of realized losses on loan investments consisting of: (i) a $(33.3) million realized loss representing a write-off of an allowance for credit losses related to the resolution of a loan secured by an office property located in San Diego, CA, (ii) a $(16.8) million realized loss representing a write-off of an allowance for credit losses related to the transfer to loans held-for-sale of a loan secured by an office property located in Dallas,
TX, and (iii) a $(4.2) million realized loss representing a write-off of an allowance for credit losses related to the transfer to REO of a loan secured by an office property located in Phoenix, AZ. These realized losses have been included in Distributable Earnings pursuant to our existing policy for reporting Distributable Earnings referenced above.
Distributable Earnings does not represent net income (loss) or cash flow from operating activities and should not be considered as an alternative to GAAP net income (loss), or an indication of our GAAP cash flows from operations, a measure of our liquidity, or an indication of funds available for our cash needs. In addition, our methodology for calculating
Distributable Earnings may differ from the methodologies employed by other companies to calculate the same or similar supplemental performance measures, and, accordingly, our reported Distributable Earnings may not be comparable to the Distributable Earnings reported by other companies.
We believe it is useful to our stockholders to present Distributable Earnings before realized losses to reflect our run-rate operating results as (i) our operating results are mainly comprised of net interest income earned on our loan investments net of our operating expenses, which comprise our ongoing operations, (ii) it helps our stockholders in assessing the overall run-rate operating performance of our business, and (iii) it has been a useful reference related to our common dividend as it is one of the factors we and our Board of Directors consider when declaring the dividend. We believe that our stockholders use Distributable Earnings and Distributable Earnings before realized losses, or a comparable supplemental performance measure, to evaluate and compare the performance of our company and our peers.
The following table provides a reconciliation of GAAP net income (loss) attributable to common stockholders to Distributable Earnings (in thousands, except sharebefore realized losses and per share data):Distributable (Loss) Earnings for the years ended December 31, 2023, and 2022:
| | | | | | | | | | | | | | | |
| | | Year Ended |
| | | December 31, |
| (in thousands, except share data) | | | | | 2023 | | 2022 |
| Reconciliation of GAAP net (loss) to Distributable Earnings: | | | |
| GAAP net (loss) attributable to common stockholders | | | | | $ | (77,649) | | | $ | (55,327) | |
| Adjustments: | | | | | | | |
| Provision for (benefit from) credit losses | | | | | 104,807 | | | 69,265 | |
| Realized losses on sales | | | | | — | | | 1,702 | |
| Depreciation and amortization on real estate owned | | | | | 3,375 | | | — | |
| (Gain) loss on extinguishment of debt | | | | | (238) | | | 18,823 | |
| | | | | | | |
| Non-cash equity compensation | | | | | 6,979 | | | 7,025 | |
| Distributable Earnings before realized losses | | | | | $ | 37,274 | | | $ | 41,488 | |
| Realized losses on write-offs, loan sales and REO conversions | | | | | (54,274) | | | (26,796) | |
| Distributable (Loss) Earnings | | | | | $ | (17,000) | | | $ | 14,692 | |
| Distributable Earnings per basic share of common stock | | | | | $ | (0.33) | | | $ | 0.28 | |
| Distributable Earnings per diluted share of common stock | | | | | $ | (0.33) | | | $ | 0.28 | |
| Distributable Earnings before realized losses per basic share of common stock | | | | | $ | 0.72 | | | $ | 0.78 | |
| Distributable Earnings before realized losses per diluted share of common stock | | | | | $ | 0.72 | | | $ | 0.78 | |
| Basic weighted average common shares | | | | | 51,641,619 | | | 53,011,806 | |
| Diluted weighted average common shares | | | | | 51,641,619 | | | 53,011,806 | |
| | | | | | | | | | | | | | |
| | Year Ended |
| | December 31, |
| (in thousands) | | | | 2021 | | 2020 |
| Reconciliation of GAAP net income to Distributable Earnings: | | (unaudited) |
| GAAP net income (loss) attributable to common stockholders | | | | $ | 67,560 | | | $ | (40,539) | |
| Adjustments for non-distributable earnings: | | | | | | |
| (Benefit from) provision for credit losses | | | | (20,027) | | | 53,710 | |
| Write-off of loan held-for-investment | | | | (9,740) | | | — | |
| Loss on extinguishment of debt | | | | 8,919 | | | — | |
| Restructuring charges | | | | — | | | 46,252 | |
| Non-cash equity compensation | | | | 7,591 | | | 5,276 | |
| Distributable Earnings | | | | $ | 54,303 | | | $ | 64,699 | |
| Distributable Earnings per basic share of common stock | | | | $ | 0.99 | | | $ | 1.17 | |
| Basic weighted average common shares - Distributable Earnings | | | | 54,593,499 | | | 55,156,482 | |
Book Value Per Common Share
The following table provides the calculation of our book value per share of common stock:stock as of December 31, 2023, and 2022:
| | | | Year Ended |
| | | December 31, |
| (in thousands) | | 2021 | | 2020 |
| (in thousands, except share data) | |
| | (in thousands, except share data) | |
| | (in thousands, except share data) | | | | | December 31,
2023 | | December 31,
2022 |
| Stockholders’ equity | Stockholders’ equity | | $ | 1,013,058 | | | $ | 933,846 | |
| 7.00% Series A cumulative redeemable preferred stock liquidation preference | 7.00% Series A cumulative redeemable preferred stock liquidation preference | | (114,913) | | | — | |
| | Common stockholders’ equity | Common stockholders’ equity | | $ | 898,145 | | | $ | 933,846 | |
| Common stockholders’ equity | |
| Common stockholders’ equity | |
| Shares: | Shares: | | |
| Common stock | |
| Common stock | |
| Common stock | Common stock | | 53,524,803 | | | 54,635,547 | |
| Restricted stock | Restricted stock | | 264,662 | | | 569,535 | |
| Total outstanding | Total outstanding | | 53,789,465 | | | 55,205,082 | |
| Book value per share of common stock | Book value per share of common stock | | $ | 16.70 | | | $ | 16.92 | |
Book value per share as of December 31, 2021,2023, includes the impact of an estimated allowance for credit losses of $(42.4)$(137.1) million, or $(0.79)$(2.71) per common share. See Note 23 – BasisLoans Held-for-Investment, Net of Presentation and Significant Accounting PoliciesAllowance for Credit Losses to our Consolidated Financial Statements included in this Annual Report on Form 10-K for a detailed discussion of allowance for credit losses.
Loan Portfolio Overview
Our business model is mainly focused on directly originating, investing in and managing senior floating-rate commercial mortgage loans and other debt and debt-like commercial real estate investments. As a result of this strategy, our operating performance is subject to overall market demand for commercial real estate loan products and other debt and debt-like commercial real estate investments. We place emphasis on diversifying our investment portfolio across geographical regions and local markets, property types, borrowers and loan structures. We do not limit our loan originations by geographical area or property type so that we may develop a well-diversified investment portfolio.
Interest-earning assets include our 100% loan investment portfolio. At December 31, 2021,2023, our loan portfolio was comprised of 105 loans,73 investments, of which 10372 were senior first mortgage loans totaling $4.2$2.9 billion of commitments with an unpaid principal balance of $3.8$2.7 billion, and two wereone subordinated loansloan totaling $15.1$13.5 million in commitments and unpaid principal balance. During the year ended December 31, 2021, we collected 100% of the contractual interest payments that were due under our loan agreements, after taking into consideration certain loans that have been modified mainly due to the impact of the COVID-19 pandemic and two loans on nonaccrual status. At December 31, 2021,2023, the weighted average risk rating of our loan portfolio was 2.6,2.8 as compared to 2.5 at December 31, 2022, weighted by total unpaid principal balance,balance.
We may hold REO as compareda result of taking title to 2.7 ata loan’s collateral. As of December 31, 2020.2023, we owned one office property with a carrying value of $20.5 million.
ForDuring the year ended December 31, 2021,2023, we originated 22 loans with a total loan commitment amount of $764.1funded $69.3 million of which $673.6 million was funded at origination. Other loan fundings included $142.7 million of additional fundings made under existing loan commitments, $48.8 million on one origination and $8.0$2.0 million of upsizing of loans with total commitments of $14.5 million. Proceedson loan upsizings and protective advances. We realized $758.4 million in aggregate reductions in portfolio unpaid principal balance from loan repayments, totaled $960.3 million. Wepaydowns, amortization and loan resolutions. During the year ended December 31, 2023, we generated interest income of $198.3$263.7 million and incurred interest expense of $105.6$(181.7) million, which resulted in net interest income of $92.7$82.0 million. See Note 3 - Loans Held-for-Investment, Net of Allowance for Credit Losses to our Consolidated Financial Statements included in this Annual Report on Form 10-K for details.further detail.
The following table details our loan activity by unpaid principal balance for the yearyears ended December 31, 2021,2023, and 2020: | | | | | | | | | | | | | |
| | | Year Ended | | Year Ended |
| | | December 31, | | December 31, |
| (in thousands) | | | 2021 | | 2020 |
| Loan originations | | | $ | 673,638 | | | $ | 125,169 | |
Other loan fundings (1) | | | $ | 150,644 | | | $ | 238,989 | |
| Deferred interest capitalized | | | $ | 10,179 | | | $ | 8,700 | |
| Loan sales | | | $ | — | | | $ | (211,148) | |
| Loan repayments | | | $ | (960,330) | | | $ | (517,295) | |
| Loan write-offs | | | $ | (9,740) | | | $ | — | |
| | | | | |
| Total loan activity, net | | | $ | (135,609) | | | $ | (355,585) | |
| | | | | | | | | | | | | |
| | | Year Ended December 31, |
| (in thousands) | | | 2023 | | 2022 |
| Loan originations | | | $ | 48,800 | | | $ | 420,955 | |
Other loan fundings(1) | | | 71,266 | | | 143,386 | |
| Deferred interest capitalized | | | 3,466 | | | 2,458 | |
| Transfers to real estate owned | | | (24,000) | | | — | |
| | | | | |
Loan repayments(2) | | | (664,985) | | | (910,134) | |
| Loan write-offs and realized loan losses | | | (54,274) | | | (27,308) | |
| Loan sales | | | (15,100) | | | (64,176) | |
| Total loan activity, net | | | $ | (634,827) | | | $ | (434,819) | |
_______________________________________(1)Additional fundings made under existing loan commitments and upsizing of loans.
(2)Includes repayment of deferred interest capitalized.
The following table details overall statistics for our investmentloan portfolio as of December 31, 2021:
| | | | | |
| (dollars in thousands) | |
| Loan Portfolio Summary |
| Number of loans | 10573 | |
| Total loan commitments | $ | 4,200,4092,887,877 | |
| Unpaid principal balance | $ | 3,796,8252,727,179 | |
| Unfunded loan commitments | $ | 403,584160,698 | |
| Carrying value | $ | 3,741,3082,583,825 | |
Weighted-average cash coupon(1) | L+3.48%S+3.75% |
Weighted-average all-in yield(2) | L+4.07%S+4.03% |
| |
Stabilized LTV at origination(3) | 63.563.6 | % |
The following table provides detail of our loan portfolio as of December 31, 2021:2023:
| | (dollars in millions) | (dollars in millions) | |
| (dollars in millions) | |
| (dollars in millions) | |
Type (1) | Type (1) | | Origination/ Acquisition Date | | Maximum Loan Commitment | | Principal Balance | | Carrying Value | | Cash Coupon (2) | | All-in Yield at Origination (3) | | Original Term (Years) (4) | | State | | Property Type | | Initial LTV (5) | | Stabilized LTV (6) |
Type(1) | |
Type(1) | | | Origination/ Acquisition Date | | Maximum Loan Commitment | | Principal Balance | | Carrying Value | | | | Cash Coupon(2) | | All-in Yield at Origination(3) | | Original Term (Years)(4) | | State | | Property Type | | Initial LTV(5) | | Stabilized LTV(6) |
| Loans Held-For-Investment | |
| Senior | |
| Senior | |
| Senior | | | 12/19 | | $111.1 | | $109.2 | | $108.9 | | | | S+2.80% | | S+3.23% | | 3.0 | | IL | | Multifamily | | 76.5% | | 73.0% |
| Senior | | Senior | | 12/18 | | 96.5 | | 92.2 | | 92.0 | | | | S+3.75% | | S+5.21% | | 3.0 | | NY | | Mixed-Use | | 26.2% | | 47.6% |
Senior(7) | | Senior(7) | | 08/19 | | 93.1 | | 93.2 | | | | S+2.85% | | S+3.26% | | 3.0 | | MN | | Office | | 73.1% | | 71.2% |
Senior(7) | | Senior(7) | | 07/19 | | 89.8 | | 80.0 | | 79.9 | | | | S+3.74% | | S+4.32% | | 3.0 | | IL | | Office | | 70.0% | | 64.4% |
| Senior | | Senior | | 10/19 | | 87.4 | | 87.2 | | 86.8 | | | | S+2.60% | | S+3.05% | | 3.0 | | TN | | Office | | 70.2% | | 74.2% |
Senior(7) | | Senior(7) | | 12/15 | | 86.0 | | 85.6 | | 85.4 | | | | S+4.15% | | S+4.43% | | 4.0 | | LA | | Mixed-Use | | 65.5% | | 60.0% |
| Senior | | Senior | | 06/19 | | 81.2 | | 81.0 | | 80.5 | | | | S+3.29% | | S+3.05% | | 3.0 | | TX | | Mixed-Use | | 71.7% | | 72.2% |
| Senior | | Senior | | 12/18 | | 78.1 | | 60.1 | | 60.0 | | | | S+3.40% | | S+3.44% | | 3.0 | | TX | | Office | | 68.5% | | 66.7% |
| Senior | | Senior | | 10/19 | | 77.3 | | 77.0 | | | | S+3.41% | | S+3.73% | | 3.0 | | FL | | Mixed-Use | | 67.7% | | 62.9% |
| Senior | | Senior | | 10/22 | | 77.3 | | | | S+4.50% | | S+4.61% | | 2.0 | | CA | | Retail | | 47.7% | | 36.6% |
| Senior | | Senior | | 12/19 | | 69.2 | | 62.9 | | 62.8 | | | | S+3.50% | | S+3.28% | | 3.0 | | NY | | Office | | 68.8% | | 59.3% |
Senior(7) | | Senior(7) | | 12/16 | | 66.0 | | | | S+5.15% | | S+4.87% | | 4.0 | | FL | | Office | | 73.3% | | 63.2% |
| Senior | | Senior | | 12/23 | | 61.8 | | 48.8 | | | | S+5.50% | | S+5.65% | | 2.0 | | CA | | Office | | 80.0% | | 79.2% |
| Senior | | Senior | | 05/22 | | 55.5 | | 46.7 | | 46.5 | | | | S+3.29% | | S+3.70% | | 3.0 | | TX | | Multifamily | | 59.3% | | 62.9% |
| Senior | | Senior | | 06/19 | | 54.1 | | 53.9 | | | | S+3.35% | | S+3.70% | | 3.0 | | VA | | Office | | 49.3% | | 49.9% |
| Senior | | Senior | | 11/21 | | 52.8 | | 50.1 | | 49.9 | | | | S+3.40% | | S+3.82% | | 3.0 | | PA | | Mixed-Use | | 62.0% | | 63.5% |
| Senior | | Senior | | 06/21 | | 52.7 | | 47.5 | | 47.4 | | | | S+4.38% | | S+4.75% | | 3.0 | | GA | | Office | | 68.0% | | 69.4% |
| Senior | | Senior | | 09/21 | | 51.7 | | 51.0 | | 50.9 | | | | S+5.05% | | S+5.12% | | 3.0 | | MN | | Hotel | | 68.4% | | 57.8% |
Senior(7) | | Senior(7) | | 08/17 | | 48.5 | | 48.3 | | | | S+4.35% | | S+4.40% | | 3.0 | | KY | | Multifamily | | 79.8% | | 73.1% |
| Senior | Senior | | 12/15 | | $120.0 | | $120.0 | | $119.3 | | L+4.15% | | L+4.43% | | 4.0 | | LA | | Mixed-Use | | 65.5% | | 60.0% | Senior | | 07/22 | | 47.6 | | 45.0 | | 44.5 | | | | S+3.62% | | S+4.25% | | 3.0 | | GA | | Multifamily | | 74.5% | | 68.2% |
| Senior | Senior | | 10/19 | | 120.0 | | 93.0 | | 92.3 | | L+3.24% | | L+3.86% | | 3.0 | | CA | | Office | | 63.9% | | 61.1% | Senior | | 03/22 | | 46.9 | | 46.6 | | | | S+3.25% | | S+3.64% | | 3.0 | | MA | | Industrial | | 67.3% | | 60.8% |
| Senior | Senior | | 07/18 | | 114.1 | | 114.1 | | 99.5 | | L+3.34% | | L+4.27% | | 2.0 | | CA | | Retail | | 50.7% | | 55.9% | Senior | | 07/21 | | 46.4 | | 45.4 | | 45.2 | | | | S+3.72% | | S+4.19% | | 3.0 | | CT | | Office | | 68.3% | | 63.5% |
| Senior | Senior | | 12/19 | | 111.1 | | 95.4 | | 94.6 | | L+2.75% | | L+3.23% | | 3.0 | | IL | | Multifamily | | 76.5% | | 73.0% | Senior | | 04/22 | | 46.2 | | 44.2 | | 44.0 | | | | S+3.41% | | S+3.78% | | 3.0 | | TX | | Multifamily | | 74.4% | | 64.0% |
| Senior | Senior | | 08/19 | | 100.3 | | 92.8 | | 92.1 | | L+2.80% | | L+3.26% | | 3.0 | | MN | | Office | | 73.1% | | 71.2% | Senior | | 08/21 | | 45.8 | | 45.4 | | 45.3 | | | | S+3.21% | | S+3.53% | | 3.0 | | TX | | Multifamily | | 77.8% | | 75.2% |
| Senior | Senior | | 12/18 | | 96.5 | | 77.6 | | 77.0 | | L+3.75% | | L+5.21% | | 3.0 | | NY | | Mixed-Use | | 26.2% | | 47.6% | Senior | | 09/21 | | 44.3 | | 41.1 | | 40.8 | | | | S+3.36% | | S+3.72% | | 3.0 | | CA | | Office | | 62.4% | | 66.1% |
| Senior | Senior | | 07/19 | | 94.0 | | 80.8 | | 80.3 | | L+3.69% | | L+4.32% | | 3.0 | | IL | | Office | | 70.0% | | 64.4% | Senior | | 02/22 | | 42.4 | | 42.2 | | | | S+3.05% | | S+3.40% | | 3.0 | | NJ | | Industrial | | 75.0% | | 59.5% |
| Senior | Senior | | 10/19 | | 87.8 | | 85.0 | | 84.2 | | L+2.55% | | L+3.05% | | 3.0 | | TN | | Office | | 70.2% | | 74.2% | Senior | | 04/22 | | 40.2 | | 37.5 | | 37.3 | | | | S+4.65% | | S+4.87% | | 3.0 | | NY | | Other | | 66.7% | | 61.8% |
| Senior | Senior | | 01/20 | | 81.9 | | 63.4 | | 63.0 | | L+3.25% | | L+3.93% | | 3.0 | | CO | | Industrial | | 47.2% | | 47.5% | Senior | | 12/17 | | 39.4 | | 38.8 | | 38.7 | | | | S+5.25% | | S+5.26% | | 3.0 | | MA | | Mixed-Use | | 72.9% | | 62.0% |
| Senior | Senior | | 06/19 | | 81.7 | | 81.4 | | 80.9 | | L+2.69% | | L+3.05% | | 3.0 | | TX | | Mixed-Use | | 71.7% | | 72.2% | Senior | | 05/21 | | 38.9 | | 37.6 | | 37.4 | | | | S+3.33% | | S+3.83% | | 3.0 | | AL | | Multifamily | | 72.2% | | 64.8% |
| Senior | Senior | | 10/19 | | 76.8 | | 76.8 | | 76.2 | | L+3.36% | | L+3.73% | | 3.0 | | FL | | Mixed-Use | | 67.7% | | 62.9% | Senior | | 05/18 | | 38.8 | | 35.4 | | 35.5 | | | | S+3.18% | | S+3.95% | | 3.0 | | MA | | Office | | 47.0% | | 41.1% |
| Senior | Senior | | 12/16 | | 71.8 | | 68.2 | | 68.0 | | L+4.25% | | L+4.87% | | 4.0 | | FL | | Office | | 73.3% | | 63.2% | Senior | | 07/16 | | 38.5 | | 38.3 | | | | S+5.55% | | S+4.99% | | 4.0 | | VA | | Office | | 62.8% | | 61.5% |
Senior(7) | | Senior(7) | | 11/18 | | 37.1 | | | | S+3.60% | | S+5.50% | | 3.0 | | CA | | Mixed-Use | | 69.9% | | 67.9% |
| Senior | Senior | | 11/17 | | 71.5 | | 71.5 | | 70.7 | | L+4.45% | | L+5.20% | | 3.0 | | TX | | Hotel | | 68.2% | | 61.6% | Senior | | 03/20 | | 34.9 | | 24.1 | | | | S+5.04% | | S+4.66% | | 3.0 | | GA | | Office | | 63.2% | | 64.6% |
| Senior | Senior | | 12/19 | | 65.2 | | 50.2 | | 49.7 | | L+2.80% | | L+3.28% | | 3.0 | | NY | | Office | | 68.8% | | 59.3% | Senior | | 12/18 | | 34.2 | | 33.7 | | 33.5 | | | | S+4.11% | | S+3.27% | | 4.0 | | IL | | Multifamily | | 70.8% | | 62.1% |
| Senior | Senior | | 07/21 | | 63.3 | | 60.5 | | 59.7 | | L+3.00% | | L+3.39% | | 3.0 | | LA | | Multifamily | | 68.8% | | 68.6% | Senior | | 08/19 | | 33.5 | | 31.1 | | | | S+2.96% | | S+3.38% | | 3.0 | | TX | | Multifamily | | 79.3% | | 72.5% |
| Senior | Senior | | 09/19 | | 60.2 | | 60.2 | | 60.1 | | L+3.00% | | L+3.63% | | 2.0 | | TX | | Office | | 64.7% | | 59.0% | Senior | | 11/21 | | 33.4 | | 32.0 | | 31.9 | | | | S+3.13% | | S+3.52% | | 3.0 | | AL | | Multifamily | | 77.9% | | 68.1% |
| Senior | | 12/18 | | 60.1 | | 56.3 | | 56.1 | | L+2.90% | | L+3.44% | | 3.0 | | TX | | Office | | 68.5% | | 66.7% |
| Senior | | 10/21 | | 55.5 | | 51.0 | | 50.4 | | L+3.15% | | L+3.42% | | 3.0 | | CO | | Multifamily | | 78.2% | | 74.7% |
| Senior | | 06/19 | | 54.1 | | 51.4 | | 51.3 | | L+3.30% | | L+3.70% | | 3.0 | | VA | | Office | | 49.3% | | 49.9% |
| Senior | | 10/17 | | 54.0 | | 54.0 | | 45.9 | | L+4.07% | | L+4.47% | | 4.0 | | DC | | Office | | 67.0% | | 66.0% |
| Senior | | 11/21 | | 52.8 | | 46.5 | | 45.8 | | L+3.40% | | L+3.82% | | 3.0 | | PA | | Mixed-Use | | 62.0% | | 63.5% |
| Senior | | 06/21 | | 52.7 | | 46.6 | | 46.1 | | L+4.32% | | L+4.75% | | 3.0 | | GA | | Office | | 68.0% | | 69.4% |
| Senior | | 09/21 | | 51.7 | | 46.1 | | 45.1 | | L+5.00% | | L+5.12% | | 3.0 | | MN | | Hotel | | 68.4% | | 57.8% |
| Senior | | 02/20 | | 50.5 | | 45.1 | | 43.5 | | L+3.30% | | L+3.75% | | 3.0 | | TN | | Hotel | | 69.1% | | 54.2% |
| Senior | | 09/18 | | 50.1 | | 35.9 | | 35.8 | | L+3.25% | | L+4.13% | | 3.0 | | IL | | Office | | 47.9% | | 56.1% |
| Senior | | 12/15 | | 49.0 | | 49.0 | | 48.9 | | L+3.73% | | L+4.87% | | 4.0 | | PA | | Office | | 74.5% | | 67.5% |
| Senior | | 08/19 | | 48.2 | | 44.1 | | 43.5 | | L+3.70% | | L+3.39% | | 3.0 | | GA | | Office | | 69.5% | | 68.3% |
| Senior | | 07/21 | | 46.4 | | 45.4 | | 44.7 | | L+3.69% | | L+4.19% | | 3.0 | | CT | | Office | | 68.3% | | 63.5% |
| Senior | | 06/18 | | 46.0 | | 46.0 | | 45.9 | | L+3.60% | | L+4.06% | | 3.0 | | WY | | Hotel | | 67.4% | | 62.3% |
| Senior | | 08/21 | | 45.8 | | 45.4 | | 44.6 | | L+3.16% | | L+3.53% | | 3.0 | | TX | | Multifamily | | 77.8% | | 75.2% |
| Senior | | 08/18 | | 45.7 | | 45.4 | | 45.2 | | L+3.13% | | L+3.32% | | 3.0 | | TX | | Multifamily | | 68.9% | | 63.6% |
| Senior | | 09/21 | | 44.3 | | 37.8 | | 37.2 | | L+3.30% | | L+3.72% | | 3.0 | | CA | | Office | | 62.4% | | 66.1% |
| Senior | | 05/19 | | 44.1 | | 41.9 | | 41.6 | | L+3.20% | | L+3.60% | | 3.0 | | NY | | Mixed-Use | | 59.7% | | 55.1% |
| Senior | | 08/17 | | 42.4 | | 42.4 | | 41.4 | | L+4.24% | | L+4.40% | | 3.0 | | KY | | Multifamily | | 79.8% | | 73.1% |
| Senior | | 12/17 | | 40.9 | | 37.9 | | 37.8 | | L+4.38% | | L+5.26% | | 3.0 | | MA | | Mixed-Use | | 72.9% | | 62.0% |
| Senior | | 07/16 | | 40.5 | | 32.0 | | 31.9 | | L+2.93% | | L+4.99% | | 4.0 | | VA | | Office | | 62.8% | | 61.5% |
| Senior | | 05/21 | | 38.9 | | 24.2 | | 23.9 | | L+3.28% | | L+3.83% | | 3.0 | | AL | | Multifamily | | 72.2% | | 64.8% |
| Senior | | 05/18 | | 38.8 | | 34.8 | | 34.7 | | L+3.18% | | L+3.95% | | 3.0 | | MA | | Office | | 47.0% | | 41.1% |
| Senior | | 07/19 | | 38.2 | | 36.2 | | 36.0 | | L+3.70% | | L+4.43% | | 3.0 | | NJ | | Hotel | | 47.8% | | 54.6% |
| Senior | | 11/18 | | 37.1 | | 35.8 | | 35.6 | | L+3.60% | | L+5.50% | | 3.0 | | CA | | Mixed-Use | | 69.9% | | 67.9% |
| Senior | | 10/18 | | 36.8 | | 30.3 | | 30.2 | | L+2.85% | | L+3.45% | | 3.0 | | NY | | Industrial | | 71.2% | | 70.8% |
| Senior | | 11/19 | | 36.5 | | 33.5 | | 33.3 | | L+3.28% | | L+3.14% | | 3.0 | | NC | | Multifamily | | 80.0% | | 72.8% |
| Senior | | 03/20 | | 34.9 | | 16.0 | | 15.7 | | L+3.42% | | L+4.66% | | 3.0 | | GA | | Office | | 63.2% | | 64.6% |
| Senior | | 05/17 | | 34.8 | | 31.3 | | 31.3 | | L+5.35% | | L+5.97% | | 3.0 | | TX | | Office | | 68.7% | | 65.1% |
| Senior | | 10/19 | | 34.4 | | 25.0 | | 25.0 | | L+2.75% | | L+3.28% | | 3.0 | | CA | | Office | | 70.6% | | 67.8% |
| Senior | | 12/18 | | 34.2 | | 32.1 | | 31.1 | | L+2.92% | | L+3.27% | | 4.0 | | IL | | Multifamily | | 70.8% | | 62.1% |
| Senior | | 05/17 | | 33.8 | | 29.8 | | 29.7 | | L+4.40% | | L+5.36% | | 3.0 | | AZ | | Office | | 69.5% | | 59.0% |
| Senior | | 10/19 | | 33.7 | | 26.1 | | 26.0 | | L+3.15% | | L+3.75% | | 3.0 | | CA | | Office | | 70.6% | | 64.2% |
| Senior | | 03/20 | | 33.5 | | 27.6 | | 27.3 | | L+2.80% | | L+3.27% | | 3.0 | | CA | | Office | | 63.6% | | 66.7% |
| Senior | | 08/19 | | 33.5 | | 28.8 | | 28.7 | | L+2.90% | | L+3.38% | | 3.0 | | TX | | Multifamily | | 79.3% | | 72.5% |
| Senior | | 03/16 | | 33.5 | | 33.5 | | 33.3 | | 5.11% | | 5.26% | | 10.0 | | NJ | | Office | | 74.9% | | 74.9% |
| Senior | | 06/18 | | 33.4 | | 28.7 | | 28.5 | | L+4.07% | | L+4.75% | | 3.0 | | OH | | Hotel | | 70.6% | | 57.4% |
| Senior | | 11/21 | | 33.4 | | 28.4 | | 28.0 | | L+3.18% | | L+3.52% | | 3.0 | | AL | | Multifamily | | 77.9% | | 68.1% |
| Senior | | 10/21 | | 32.2 | | 32.2 | | 31.8 | | L+3.15% | | L+3.43% | | 3.0 | | AR | | Multifamily | | 63.1% | | 63.1% |
| Senior | | 03/19 | | 32.1 | | 28.0 | | 27.9 | | L+2.97% | | L+3.42% | | 3.0 | | NY | | Office | | 53.8% | | 48.5% |
| Senior | | 08/19 | | 32.0 | | 24.1 | | 24.0 | | L+3.32% | | L+5.27% | | 3.0 | | MA | | Office | | 76.5% | | 54.1% |
| Senior | | 08/19 | | 31.7 | | 31.2 | | 31.1 | | L+2.80% | | L+3.53% | | 3.0 | | LA | | Multifamily | | 74.1% | | 72.4% |
| Senior | | 11/19 | | 31.1 | | 31.1 | | 31.0 | | L+2.75% | | L+3.27% | | 2.0 | | IL | | Multifamily | | 72.7% | | 72.7% |
| | Senior | Senior | | 05/18 | | 31.0 | | 31.0 | | 30.3 | | L+4.07% | | L+4.63% | | 3.0 | | NY | | Mixed-Use | | 57.0% | | 51.1% |
| Senior | Senior | | 05/17 | | 30.7 | | 29.2 | | 29.0 | | L+4.00% | | L+5.19% | | 4.0 | | FL | | Office | | 69.3% | | 68.5% |
| Senior | Senior | | 06/21 | | 30.5 | | 29.7 | | 29.4 | | L+3.22% | | L+3.58% | | 3.0 | | GA | | Multifamily | | 73.0% | | 65.8% | | 11/19 | | 32.9 | | 32.7 | | 32.5 | | | | S+3.73% | | S+3.14% | | 3.0 | | NC | | Multifamily | | 80.0% | | 72.8% |
| Senior | Senior | | 11/19 | | 27.7 | | 19.1 | | 18.9 | | L+3.18% | | L+3.64% | | 3.0 | | CA | | Office | | 61.7% | | 62.8% | Senior | | 03/16 | | 32.5 | | | | 5.11% | | 5.26% | | 10.0 | | NJ | | Office | | 74.9% |
| Senior | Senior | | 01/19 | | 27.5 | | 26.9 | | 26.9 | | L+2.97% | | L+3.38% | | 3.0 | | TX | | Multifamily | | 64.9% | | 64.9% | Senior | | 04/22 | | 31.8 | | 30.2 | | 30.0 | | | | S+3.35% | | S+3.73% | | 3.0 | | GA | | Multifamily | | 75.1% | | 67.1% |
| Senior | Senior | | 12/18 | | 27.5 | | 27.5 | | 27.3 | | L+3.90% | | L+4.42% | | 3.0 | | MN | | Hotel | | 64.7% | | 57.7% | Senior | | 03/19 | | 30.6 | | 29.0 | | 28.9 | | | | S+3.75% | | S+3.42% | | 3.0 | | NY | | Office | | 53.8% | | 48.5% |
| Senior | Senior | | 07/17 | | 27.3 | | 27.3 | | 27.1 | | L+4.10% | | L+4.58% | | 3.0 | | NY | | Multifamily | | 76.5% | | 76.5% | Senior | | 04/22 | | 28.6 | | 26.4 | | 26.2 | | | | S+3.22% | | S+3.55% | | 3.0 | | TX | | Multifamily | | 73.3% | | 63.9% |
| Senior | | 06/17 | | 27.0 | | 24.0 | | 24.0 | | L+3.83% | | L+5.24% | | 3.0 | | CA | | Hotel | | 54.7% | | 48.6% |
| Senior | | 01/19 | | 27.0 | | 24.4 | | 24.4 | | L+2.90% | | L+3.44% | | 3.0 | | MA | | Office | | 71.2% | | 70.1% |
| Senior | | 08/19 | | 26.8 | | 26.3 | | 26.0 | | L+3.15% | | L+3.67% | | 3.0 | | SC | | Multifamily | | 67.0% | | 58.7% |
| Senior | | 12/18 | | 26.1 | | 22.5 | | 22.4 | | L+2.95% | | L+3.43% | | 3.0 | | FL | | Office | | 61.9% | | 65.5% |
| Senior | | 01/18 | | 26.0 | | 26.0 | | 25.8 | | L+5.13% | | L+5.58% | | 3.0 | | AZ | | Hotel | | 65.8% | | 61.3% |
| Senior | | 12/18 | | 25.9 | | 24.4 | | 24.3 | | L+4.00% | | L+5.56% | | 3.0 | | PA | | Multifamily | | 70.1% | | 67.0% |
| Senior | | 10/21 | | 25.7 | | 25.7 | | 25.3 | | L+3.15% | | L+3.43% | | 4.0 | | GA | | Industrial | | 67.5% | | 64.5% |
| Senior | | 09/18 | | 25.1 | | 22.0 | | 21.7 | | L+3.87% | | L+4.42% | | 3.0 | | NY | | Mixed-Use | | 60.2% | | 59.3% |
| Senior | | 08/19 | | 25.0 | | 23.9 | | 23.8 | | L+2.66% | | L+3.07% | | 2.0 | | OK | | Multifamily | | 79.9% | | 74.2% |
| Senior | | 12/21 | | 24.7 | | 16.7 | | 16.4 | | L+3.30% | | L+3.59% | | 3.0 | | CA | | Office | | 72.9% | | 68.3% |
| Senior | | 10/15 | | 24.7 | | 24.7 | | 23.5 | | L+4.07% | | L+5.76% | | 3.0 | | MO | | Hotel | | 73.2% | | 57.8% |
Senior(7) | | Senior(7) | | 12/18 | | 28.0 | | | | S+3.90% | | S+4.42% | | 3.0 | | MN | | Hotel | | 64.7% | | 57.7% |
| Senior | Senior | | 09/17 | | 24.7 | | 21.6 | | 21.5 | | L+4.90% | | L+5.52% | | 3.0 | | MA | | Hotel | | 67.3% | | 63.9% | Senior | | 01/19 | | 27.6 | | 26.9 | | | | S+3.00% | | S+3.38% | | 3.0 | | TX | | Multifamily | | 64.9% |
| Senior | Senior | | 09/21 | | 24.4 | | 22.5 | | 22.2 | | L+3.18% | | L+3.61% | | 3.0 | | CA | | Multifamily | | 71.9% | | 57.8% | Senior | | 03/22 | | 27.2 | | 24.3 | | 24.0 | | | | S+4.14% | | S+4.89% | | 3.0 | | NC | | Office | | 47.4% | | 53.5% |
| Senior | Senior | | 12/21 | | 24.4 | | 20.4 | | 20.2 | | L+3.86% | | L+4.16% | | 3.0 | | Various | | Other | | 55.1% | | 64.3% | Senior | | 01/19 | | 27.0 | | 26.1 | | 26.0 | | | | S+3.40% | | S+3.44% | | 3.0 | | MA | | Office | | 71.2% | | 70.1% |
| Senior | Senior | | 07/19 | | 24.0 | | 19.2 | | 19.2 | | L+3.00% | | L+3.60% | | 3.0 | | OH | | Office | | 63.1% | | 66.1% | Senior | | 08/19 | | 26.8 | | 26.6 | | 26.5 | | | | S+3.20% | | S+3.67% | | 3.0 | | SC | | Multifamily | | 67.0% | | 58.7% |
| Senior | Senior | | 05/21 | | 23.3 | | 15.4 | | 15.2 | | L+3.50% | | L+4.09% | | 3.0 | | LA | | Multifamily | | 68.0% | | 69.6% | Senior | | 10/21 | | 25.7 | | 25.5 | | | | S+3.20% | | S+3.43% | | 4.0 | | GA | | Industrial | | 67.5% | | 64.5% |
| Senior | Senior | | 07/19 | | 23.3 | | 20.0 | | 19.9 | | L+2.95% | | L+3.51% | | 3.0 | | CA | | Office | | 62.3% | | 62.6% | Senior | | 01/18 | | 25.2 | | 25.1 | | | | S+5.18% | | S+5.58% | | 3.0 | | AZ | | Hotel | | 65.8% | | 61.3% |
| Senior | Senior | | 03/18 | | 23.0 | | 23.0 | | 23.0 | | L+4.05% | | L+4.65% | | 2.0 | | FL | | Office | | 60.8% | | 60.8% | Senior | | 03/20 | | 25.1 | | 22.2 | | 22.1 | | | | S+4.25% | | S+3.27% | | 3.0 | | CA | | Office | | 63.6% | | 66.7% |
| Senior | Senior | | 06/18 | | 22.8 | | 17.9 | | 17.6 | | L+4.21% | | L+4.73% | | 3.0 | | FL | | Retail | | 74.0% | | 69.4% | Senior | | 08/19 | | 25.0 | | 23.9 | | 23.8 | | | | S+2.71% | | S+3.07% | | 2.0 | | OK | | Multifamily | | 79.9% | | 74.2% |
| Senior | Senior | | 10/18 | | 22.5 | | 22.3 | | 22.1 | | L+4.21% | | L+5.16% | | 3.0 | | CT | | Hotel | | 75.4% | | 66.9% | Senior | | 12/21 | | 24.7 | | 16.7 | | 16.6 | | | | S+3.36% | | S+3.59% | | 3.0 | | CA | | Office | | 72.9% | | 68.3% |
| Senior | Senior | | 04/18 | | 22.2 | | 22.2 | | 22.2 | | L+4.05% | | L+4.46% | | 3.0 | | KS | | Multifamily | | 72.1% | | 67.4% | Senior | | 09/21 | | 24.4 | | 23.6 | | 23.5 | | | | S+3.23% | | S+3.61% | | 3.0 | | CA | | Multifamily | | 71.9% | | 57.8% |
| Senior | Senior | | 06/19 | | 21.5 | | 21.5 | | 21.4 | | L+4.50% | | L+5.05% | | 3.0 | | NY | | Other | | 39.6% | | 39.6% | Senior | | 07/17 | | 23.8 | | 23.7 | | | | S+4.50% | | S+4.58% | | 3.0 | | NY | | Multifamily | | 76.5% |
| Senior | Senior | | 10/18 | | 21.5 | | 19.3 | | 19.1 | | L+3.24% | | L+3.69% | | 3.0 | | TX | | Office | | 73.0% | | 69.9% | Senior | | 05/21 | | 23.3 | | 18.6 | | 18.5 | | | | S+3.55% | | S+4.09% | | 3.0 | | LA | | Multifamily | | 68.0% | | 69.6% |
| Senior | Senior | | 07/21 | | 21.4 | | 20.2 | | 19.9 | | L+3.25% | | L+3.63% | | 3.0 | | GA | | Multifamily | | 77.0% | | 68.7% | Senior | | 02/22 | | 22.9 | | 20.1 | | 20.0 | | | | S+3.90% | | S+4.29% | | 3.0 | | CO | | Office | | 64.4% | | 60.2% |
| Senior | Senior | | 03/19 | | 21.1 | | 20.8 | | 20.7 | | L+2.93% | | L+3.40% | | 3.0 | | KY | | Multifamily | | 69.8% | | 69.9% | Senior | | 02/20 | | 21.9 | | 21.8 | | | | S+4.00% | | S+3.75% | | 3.0 | | TN | | Hotel | | 69.1% | | 54.2% |
| Senior | Senior | | 06/19 | | 21.0 | | 19.9 | | 19.8 | | L+2.90% | | L+4.24% | | 3.0 | | GA | | Mixed-Use | | 60.6% | | 67.4% | Senior | | 06/18 | | 21.8 | | 19.9 | | 19.8 | | | | S+5.31% | | S+4.73% | | 3.0 | | FL | | Retail | | 74.0% | | 69.4% |
| Senior | Senior | | 04/21 | | 21.0 | | 20.0 | | 19.8 | | L+3.24% | | L+3.56% | | 3.0 | | NJ | | Multifamily | | 77.5% | | 74.2% | Senior | | 06/19 | | 21.5 | | | | S+4.55% | | S+5.05% | | 3.0 | | NY | | Other | | 39.6% |
| Senior | Senior | | 05/21 | | 20.6 | | 16.4 | | 16.3 | | L+3.99% | | L+4.41% | | 3.0 | | FL | | Multifamily | | 69.8% | | 62.8% | Senior | | 05/21 | | 20.6 | | 20.4 | | | | S+4.05% | | S+4.41% | | 3.0 | | FL | | Multifamily | | 69.8% | | 62.8% |
| Senior | Senior | | 01/18 | | 19.3 | | 17.6 | | 17.6 | | L+4.77% | | L+5.50% | | 3.0 | | PA | | Mixed-Use | | 66.8% | | 67.3% | Senior | | 12/21 | | 20.4 | | 20.3 | | | | S+3.91% | | S+4.16% | | 3.0 | | Various | | Other | | 55.1% | | 64.3% |
| Senior | Senior | | 11/18 | | 18.9 | | 16.6 | | 16.6 | | L+3.20% | | L+3.83% | | 3.0 | | CA | | Office | | 73.1% | | 64.5% | Senior | | 06/19 | | 20.4 | | 20.3 | | | | S+3.25% | | S+4.24% | | 3.0 | | GA | | Mixed-Use | | 60.6% | | 67.4% |
| Senior | Senior | | 04/18 | | 18.7 | | 18.7 | | 18.7 | | L+4.29% | | L+4.65% | | 3.0 | | NV | | Multifamily | | 78.7% | | 66.1% | Senior | | 11/18 | | 18.5 | | 16.9 | | | | S+5.00% | | S+3.83% | | 3.0 | | CA | | Office | | 73.1% | | 64.5% |
| Senior | Senior | | 01/19 | | 18.2 | | 18.2 | | 18.2 | | L+3.40% | | L+4.14% | | 3.0 | | TX | | Multifamily | | 72.2% | | 68.2% | Senior | | 10/18 | | 16.9 | | | | S+4.71% | | S+5.16% | | 3.0 | | CT | | Hotel | | 75.4% | | 66.9% |
| Senior | Senior | | 08/17 | | 17.5 | | 14.5 | | 14.4 | | L+4.77% | | L+5.49% | | 3.0 | | PA | | Office | | 66.7% | | 67.3% | Senior | | 06/21 | | 16.7 | | 14.3 | | 14.1 | | | | S+3.41% | | S+3.82% | | 4.0 | | IN | | Multifamily | | 67.0% | | 66.4% |
| Senior | Senior | | 06/21 | | 16.7 | | 13.5 | | 13.3 | | L+3.35% | | L+3.82% | | 4.0 | | IN | | Multifamily | | 67.0% | | 66.4% | Senior | | 07/19 | | 16.6 | | 14.5 | | | | S+3.07% | | S+3.60% | | 3.0 | | OH | | Office | | 63.1% | | 66.1% |
| Senior | Senior | | 07/18 | | 16.0 | | 11.5 | | 11.5 | | L+3.75% | | L+4.35% | | 3.0 | | CA | | Office | | 77.1% | | 63.5% | Senior | | 08/17 | | 15.4 | | 12.4 | | 12.3 | | | | S+5.25% | | S+5.49% | | 3.0 | | PA | | Office | | 66.7% | | 67.3% |
| Senior | Senior | | 06/19 | | 15.2 | | 11.6 | | 11.6 | | L+3.96% | | L+4.69% | | 3.0 | | NY | | Office | | 40.7% | | 60.0% | Senior | | 08/21 | | 14.5 | | 13.9 | | | | S+3.70% | | S+3.88% | | 3.0 | | CO | | Office | | 72.0% | | 63.7% |
| Senior | Senior | | 08/21 | | 14.5 | | 14.0 | | 13.8 | | L+3.65% | | L+3.88% | | 3.0 | | CO | | Office | | 72.0% | | 63.7% | Senior | | 07/18 | | 14.3 | | 10.0 | | | | S+4.86% | | S+4.35% | | 3.0 | | CA | | Office | | 77.1% | | 63.5% |
| Mezzanine | Mezzanine | | 01/17 | | 14.0 | | 14.1 | | 12.9 | | 8.00% | | 8.11% | | 10.0 | | HI | | Hotel | | 41.4% | | 36.2% | Mezzanine | | 01/17 | | 13.5 | | | | 8.00% | | 8.11% | | 10.0 | | HI | | Hotel | | 41.4% | | 36.2% |
| Senior | Senior | | 09/19 | | 12.0 | | 11.8 | | 11.7 | | L+2.99% | | L+3.50% | | 3.0 | | WI | | Multifamily | | 51.4% | | 75.0% | Senior | | 10/19 | | 11.8 | | 4.3 | | | | S+2.81% | | S+3.28% | | 3.0 | | CA | | Office | | 70.6% | | 67.8% |
| Mezzanine | | 11/15 | | 1.0 | | 1.0 | | — | | 13.00% | | 12.50% | | 10.0 | | NY | | Hotel | | 68.3% | | 58.0% |
| Total/Weighted Average | | $4,200.4 | | $3,796.8 | | $3,741.3 | | L+3.48% | | L+4.07% | | 3.1 | | 66.3% | | 63.5% |
Senior(7) | | Senior(7) | | 09/19 | | 11.7 | | | | S+3.05% | | S+3.50% | | 3.0 | | WI | | Multifamily | | 51.4% | | 75.0% |
| Senior | | Senior | | 06/19 | | 11.4 | | 10.4 | | | | S+4.01% | | S+4.69% | | 3.0 | | NY | | Office | | 40.7% | | 60.0% |
| Senior | | Senior | | 01/18 | | 8.3 | | 6.6 | | | | S+5.25% | | S+5.50% | | 3.0 | | PA | | Office | | 66.8% | | 67.3% |
| Allowance for credit losses | |
| | Total/Weighted Average Loans | |
| | Total/Weighted Average Loans | |
| | Total/Weighted Average Loans | | | $2,887.9 | | $2,727.2 | | $2,583.8 | | | | S+3.75% | | S+4.03% | | 3.2 | | | | | | 66.7% | | 63.6% |
|
____________________
(1)“Senior” means a loan primarily secured by a first priority lien on commercial real property and related personal property and also includes, when applicable, any companion subordinate loans.
(2)Cash coupon does not include origination or exit fees. Weighted average cash coupon excludes fixed rate loans.
(3)Yield includes net origination fees and exit fees, but does not include future fundings, and is expressed as a monthly equivalent. Weighted average yield excludes fixed rate loans.
(4)Original term (years) is the initial maturity date at origination and does not include any extension options and has not been updated to reflect any subsequent extensions or modifications, if applicable.
(5)Initial loan-to-value ratio, or initial LTV, is calculated as the initial loan amount (plus any financing that is pari passu with or senior to such loan) divided by the as is appraised value (as determined in conformance with the Uniform Standards of Professional Appraisal Practice, or USPAP) as of the date of the loan was originated set forth in the original appraisal.
(6)Stabilized loan-to-value ratio, or stabilized LTV is calculated as the fully funded loan amount (plus any financing that is pari passu with or senior to such loan), including all contractually provided for future fundings, divided by the as stabilized value (as determined in conformance with USPAP) set forth in the original appraisal. As stabilized value may be based on certain assumptions, such as future construction completion, projected re-tenanting, payment of tenant improvement or leasing commissions allowances or free or abated rent periods, or increased tenant occupancies.
Most of our loans are structured with an initial maturity term, typically three years, and one or more (typically two) one-year extension options, which can be exercised by the borrower subject to meeting various extension conditions in accordance with the terms of the loan agreement. As part of our overall asset management strategy, we have in the past entered into, and may in the future enter into, loan modifications with some of our borrowers. These amendments may include, among other things, modifying or waiving certain performance or extension conditions as part of the overall agreement.
The map and charts below illustrate the geographic distribution and types of properties securing our portfolio as of December 31, 2021:
Portfolio Management and Credit Quality
We actively manage each loan investment from closing and initial funding through final repayment and assess the risk of credit deterioration by quarterly evaluating the performance of the underlying collateral properties. We also evaluate the macroeconomic environment, prevailing real estate fundamentals and local property market dynamics. Typically, our loan documents allow us, among other things, to receive regular property, borrower and guarantor financial statements; approve
annual budgets and major tenant leases; and enforce loan covenants and remedies. In addition, we work with Trimont Real Estate Advisors LLC, one of thea leading commercial real estate loan servicers, whoservicer, which provides us with a fully-dedicated and experienced team to increase efficiency and leverage our internal resources in servicing and asset managing our loan investments. Our internal team retains authority on all asset management decisions.
We maintain strong relationships and an active asset management dialogue with our borrowers. We have leveraged those strong relationships along with our team’s experience to minimizemaximize the negative impactsperformance of the COVID-19 pandemic on our portfolio, particularly in respectincluding during periods of the properties securing loans in our portfolio experiencing COVID-19-related business interruptionseconomic uncertainty and pressure on operating cash flows.market volatility. While we generally believe that the principal amount of our loans is typically sufficiently protected by the underlying collateral value, there is a risk that we will not realize the entire principal amount of certain of our loan investments.
In addition to ongoing asset management, we review our entire portfolio quarterly, assess the performance of each loan and assign it a risk rating on a scale between “1” and “5,” from least risk to greatest risk, respectively. The risk ratings are based on many factors, which include, but are not limited to, property type, geographic and local market dynamics, physical condition, leasing and tenant profile, projected cash flow, collateral performance, loan structure and exit plan, origination LTV, project sponsorship and other factors deemed appropriate. We evaluate these factors with respect to each loan investment on a case-by-case basis taking into consideration such loan’s facts and circumstances at the time. The risk factors may be given different weightings depending on the specifics of each loan. See Note 3 - Loans Held-for-Investment, Net of Allowance for Credit Losses to our consolidated financial statementsConsolidated Financial Statements included in this Annual Report on Form 10-K for a discussion regarding ourthe risk rating methodology we use for our portfolio.
The following table allocates the unpaid principal balance and the carrying value balances based on our internal risk ratings:ratings as of December 31, 2023, and 2022:
| | | | | | | | | | | | | | | | | | | | | | | | | | | | | | | | | | | | | | |
| (dollars in thousands) | | December 31, 2023 | | December 31, 2022 |
| Risk Rating | | Number of Loans | | Unpaid Principal Balance | | Carrying Value | | Number of Loans | | Unpaid Principal Balance | | Carrying Value |
| 1 | | 4 | | | $ | 71,597 | | | $ | 71,211 | | | 8 | | | $ | 291,236 | | | $ | 287,527 | |
| 2 | | 36 | | | 1,277,491 | | | 1,262,126 | | | 52 | | | 1,857,744 | | | 1,824,564 | |
| 3 | | 24 | | | 862,102 | | | 842,175 | | | 21 | | | 697,532 | | | 689,196 | |
| 4 | | 4 | | | 192,104 | | | 174,313 | | | 5 | | | 268,236 | | | 258,570 | |
| 5 | | 5 | | | 323,885 | | | 234,000 | | | 4 | | | 247,258 | | | 207,958 | |
| Total | | 73 | | | $ | 2,727,179 | | | $ | 2,583,825 | | | 90 | | | $ | 3,362,006 | | | $ | 3,267,815 | |
As of December 31, 2023, the weighted average risk rating of the Company’s loan portfolio was 2.8, versus 2.5 as of December 31, 2022, weighted by unpaid principal balance. The year-over-year change in the weighted average portfolio risk rating is mainly a result of changes in portfolio mix due to loan payoffs, paydowns and select loan rating downgrades, including four loans downgraded to a risk rating of “5”, partially offset by the transfer of a previously risk-rated “5” loan to loans held-for-sale, the transfer of a previously risk-rated “5” loan to REO and the resolution of a previously risk-rated “5” loan involving a coordinated sale of the collateral property through a deed-in-lieu of foreclosure transaction.
Risk-Rated “5” Loan Summaries
As of December 31, 2023, we had five loans that had a risk rating of “5” with an aggregate principal balance of $323.9 million, for which we recorded an allowance for credit losses of $89.6 million. These five loans were on nonaccrual status as of December 31, 2023. The performance of these assets has been adversely affected to varying degrees by many different factors, such as slower leasing velocity, including leasing challenges of office properties in certain markets related to work from home trends and other submarket dynamics combined with a significant rise in interest rates resulting in a meaningful reduction in real estate transaction activity, capital markets volatility and limited market liquidity affecting these borrowers’ ability to either sell or refinance their loans, and other property specific factors.
During the year ended December 31, 2023, a first mortgage loan with an outstanding principal balance of $85.6 million collateralized by a mixed-use retail and office property located in Baton Rouge, LA, was downgraded from a risk rating of “4” to a risk rating of “5” and placed on nonaccrual status. The borrower has begun a process to sell the collateral property, which remains ongoing. However, given the volatile and uncertain market conditions, there may be no assurances that the sale process will be completed, and the timing and ultimate outcome remain uncertain.
During the year ended December 31, 2023, a first mortgage loan with an outstanding principal balance of $80.0 million collateralized by an office property located in Chicago, IL, was downgraded from a risk rating of “4” to a risk rating of “5” and placed on nonaccrual status. We are in an ongoing dialogue with the borrower regarding next steps and potential resolution options with respect to this loan, the timing and ultimate outcome of which remain uncertain.
During the year ended December 31, 2023, a first mortgage loan with a principal balance of $37.1 million collateralized by a mixed-use office and retail property located in Los Angeles, CA, was downgraded from a risk rating of “4” to a risk rating of
| | | | | | | | | | | | | | | | | | | | | | | | | | | | | | | | | | | | | | |
| (dollars in thousands) | | December 31,
2021 | | December 31,
2020 |
| Risk Rating | | Number of Loans | | Unpaid Principal Balance | | Carrying Value | | Number of Loans | | Unpaid Principal Balance | | Carrying Value |
| 1 | | 9 | | | $ | 245,939 | | | $ | 245,042 | | | 6 | | | $ | 183,369 | | | $ | 182,730 | |
| 2 | | 58 | | | 2,002,008 | | | 1,983,615 | | | 50 | | | 1,863,590 | | | 1,847,332 | |
| 3 | | 25 | | | 747,631 | | | 739,343 | | | 29 | | | 1,055,782 | | | 1,026,662 | |
| 4 | | 11 | | | 633,153 | | | 627,938 | | | 17 | | | 762,636 | | | 732,310 | |
| 5 | | 2 | | | 168,094 | | | 145,370 | | | 1 | | | 67,057 | | | 58,769 | |
| Total | | 105 | | | $ | 3,796,825 | | | $ | 3,741,308 | | | 103 | | | $ | 3,932,434 | | | $ | 3,847,803 | |
At December 31, 2023, we held a first mortgage loan with an outstanding principal balance of $93.1 million collateralized by an office property located in Minneapolis, MN that had a risk rating of “5” and was on nonaccrual status. We are in an ongoing dialogue with the borrower regarding next steps and potential resolutions with respect to this loan, the timing and ultimate outcome of which remain uncertain.
During the year ended December 31, 2023, a first mortgage with a principal balance of $28.0 million collateralized by a hotel property located in Minneapolis, MN, was downgraded from a risk rating of “4” to a risk rating of “5” and placed on nonaccrual status, as the collateral property’s operating performance has been adversely affected by the ongoing softness in local market business travel environment and other local submarket dynamics. The borrower has begun a process to sell the collateral property, which remains ongoing. However, given the volatile and uncertain market conditions, there may be no assurances that the borrower’s process to sell the collateral property will be completed, and the timing and ultimate outcome remain uncertain.
During the year ended December 31, 2023, we converted a senior loan that had an outstanding principal balance of $28.2 million and collateralized by an office property in Phoenix, AZ, to real estate owned. The loan had been previously placed on nonaccrual status and had a risk rating of “5”. We recorded a write-off of $(4.2) million related to the transfer.
During the year ended December 31, 2023, a senior loan with an outstanding principal balance of $31.8 million and collateralized by an office property located in Dallas, TX was transferred to loans held-for-sale. The loan had previously been placed on nonaccrual status and had a risk rating of “5”. We recorded a write-off of $(16.8) million related to the transfer. On October 16, 2023, the loan sale was finalized with no additional losses incurred.
During the year ended December 31, 2023, a senior loan with an outstanding principal balance of $92.6 million and collateralized by an office property located in San Diego, CA was resolved, which involved a coordinated sale of the collateral property through a deed-in-lieu of foreclosure transaction and our company providing the new ownership group with a senior floating rate loan with a total commitment of $61.8 million and an initial principal balance of $48.8 million. The loan had previously been placed on nonaccrual status and had a risk rating of “5”. We recorded a write-off of $(33.3) million in the allowance for credit losses on loans held-for-investment related to the resolution.
Other Portfolio Developments
During the year ended December 31, 2021, we recorded a decrease of $20.0 million in the allowance for credit losses, which resulted in the overall CECL reserve of $42.4 million at December 31, 2021. The decrease in the allowance for credit losses reflects repayments of legacy loans with relatively higher credit reserves, improved performance and credit profile of our portfolio, a write-off of a prior credit reserve related to a resolution of a collateral-dependent loan, a release of a credit reserve on unfunded commitments on a collateral-dependent asset, and moderately improved expectations of macroeconomic conditions.
During the year ended December 31, 2021, we entered into a loan modification related to a retail asset located in Pasadena, CA, which is classified as troubled debt restructuring under GAAP. This modification included, among other changes, a partial deferral of the loan’s contractual interest payments due to the collateral property’s cash flows and operating performance being adversely affected by the ongoing effects of the COVID-19 pandemic. This loan had also been previously modified. At December 31, 2021, this first mortgage loan had an outstanding principal balance of $114.1 million, and during the year ended December 31, 2021, was assigned a risk rating of “5”. We determined that the recovery of the loan’s principal is collateral-dependent. Accordingly, this loan was assessed individually and we elected to apply a practical expedient in accordance with “Financial Instruments – Credit Losses - Measurement of Credit Losses on Financial Instruments (Topic 326),” or ASU 2016-13. At December 31, 2021, we recorded an allowance for credit loss of $14.1 million on this loan based on our estimate of fair value of the loan’s underlying collateral using the discounted cash flow method of valuation less the estimated cost to foreclose and sell the property. The estimation of the fair value of the collateral property also involved using various Level 3 inputs, which were in part developed based on discussions with various market participants and management’s best estimates as of the valuation date and required significant judgment. Additionally, during the year ended December 31, 2021, we placed this loan on nonaccrual status and reversed $0.3 million of interest income. This loan’s maturity date has passed without the loan being paid off. We are evaluating, and at any given time may be pursuing, a variety of potential options with respect to the resolution of this loan, which, among others, may include a foreclosure, negotiated deed-in-lieu of foreclosure, a sale of the underlying collateral property or a sale of the loan.
During the year ended December 31, 2021,2023, a first mortgage loan with a principal balance of $54.0$66.0 million collateralized by an office property located in Washington, D.C., was downgradedMiami Beach, FL, had its maturity on July 9, 2023 pass without extension. We deemed probable that the repayment of the loan is expected to a risk rating of “5” as a resultbe substantially satisfied through the borrower’s sale of the collateral property’s operating performance being adversely affected by the ongoing office leasing market challenges related to the COVID-19 pandemic.property. During the yearthree months ended December 31, 2021, we entered into2023, the contract to purchase the property was terminated. As a loan modification related to this asset, which included, among other changes, a reallocation of certain reserves. This loan had also been modified previously. We determined thatresult, the
recovery of the loan’s principal is collateral-dependent. Accordingly, this loan was assessed individually and we elected to apply a practical expedient in accordance with ASU 2016-13. At December 31, 2021, we recorded an allowance for credit loss of $8.0 million on this loan based on our estimate of fair value of the loan’s underlying collateral using the discounted cash flow method of valuation less the estimated cost to foreclose and sell the property. The estimation of the fair value of the collateral property also involved using various Level 3 inputs, which were in part developed based on discussions with various market participants and management’s best estimates as of the valuation date, and required significant judgment. Additionally, during the year ended December 31, 2021, we placed this loan on nonaccrual status and reversed $0.8 millionas of interest income. This loan’s maturity date of October 9, 2021, has passed without the loan being paid off. We are evaluating, and at any given time may be pursuing, a variety of potential options with respectDecember 31, 2023, due to the resolution of this loan, which, among others, may include a foreclosure, a negotiated deed-in-lieu of foreclosure, a saleuncertainty of the underlying collateral property or a salecollection of the loan.future interest.
During the year ended December 31, 2021, we resolved the nonaccrual status of2023, a seniorfirst mortgage loan secured by a mixed-use office and retail property in New York City with an outstanding unpaid principal balance of $22.0 million.$11.8 million collateralized by a multifamily property located in Milwaukee, WI, had its maturity on December 9, 2023, pass without extension and was placed on nonaccrual status. We received all interestdeemed probable that was previously due in the amount of approximately $1.6 million and had the borrower establish and fund additional reserves for debt service and operating expenses. Given these facts and our expectations for the loan performing in accordance with the termsrepayment of the loan agreement,is expected to be substantially satisfied through the borrower’s sale of the collateral property. The borrower has begun a process to sell the collateral property, which remains ongoing. However, given the volatile and uncertain market conditions, there may be no assurances that the borrower’s process to sell the collateral property will be completed, and the timing and ultimate outcome remain uncertain.
Loan Modification Activity
Loan modifications and amendments are commonplace in the transitional lending business. We may amend or modify a loan depending on the loan’s specific facts and circumstances. These loan modifications may include additional time for the borrower to refinance or sell the collateral property, adjustment or waiver of performance tests that are prerequisite to the extension of a loan maturity, and/or deferral of scheduled payments. In exchange for a modification, we often receive a partial repayment of principal, an accrual of deferral interest for a portion of interest due, a cash infusion to replenish interest or capital improvement reserves, termination of all or a portion of the remaining unfunded loan commitment, additional call protection, and/or an increase in the loan was reinstated to accrual status.coupon or additional loan fees.
During the year ended December 31, 2021,2023, we resolvedcompleted the modification of a seniorfirst mortgage loan that had an outstanding unpaidwith a principal balance of $68.1$48.5 million and had been nonaccrual status.secured by a multifamily student housing property in Louisville, KY. The resolution involved a coordinated saleterms of the collateral property,modification included, among other things, a Minneapolis, MN hotel,12-month extension of the fully-extended maturity date to November 9, 2024, the full deferral of debt service payments with interest capitalized and compounding, the deferral of the extension fee and our providingagreement to pay for approved expenses, in our sole discretion. Due to the new ownership groupuncertainty with a new $45.3 million senior floating raterespect to the collection of future interest accruals, the loan supported by capital invested in the property by the new sponsor. As a resultwas placed on nonaccrual status.
Portfolio Financing
As of December 31, 2021,2023, our portfolio financing consisted of repurchase and secured credit facilities collateralized by loans held-for-investment and our one REO asset, and securitized debt obligations collateralized by pools of loans held-for-investment issued in CRE CLOs, an asset-specific financing facility collateralized by loans held-for-investment and a term financing facility collateralized by loans held-for-investment.CLOs. Our non-mark-to-market financing sources accounted for approximately 73.2%55.5% of portfolio loan-level financing as of December 31, 2021.2023.
The following table details our portfolio loan-level financing as of December 31, 2021,2023, and December 31, 2020:2022:
| | | | | | | | | | | |
| (in thousands) | December 31,
2021 | | December 31,
2020 |
| CRE CLOs | $ | 1,677,619 | | | $ | 927,128 | |
| Term financing facility | 127,145 | | | — | |
| Asset-specific financing facility | 43,622 | | | 123,091 | |
| Total non-mark-to-market financing | 1,848,386 | | | 1,050,219 | |
| Secured repurchase agreements | 677,285 | | | 1,708,875 | |
| Total portfolio financing | $ | 2,525,671 | | | $ | 2,759,094 | |
| | | | | | | | | | | |
| (in thousands) | December 31,
2023 | | December 31,
2022 |
| CRE CLOs | $ | 991,698 | | | $ | 1,138,749 | |
| | | |
| Asset-specific financing facility | — | | | 44,913 | |
| Secured credit facility | 84,000 | | | 100,000 | |
| Secured repurchase agreement (non-mark-to-market) | 6,213 | | | 46,280 | |
| Total non-mark-to-market financing | 1,081,911 | | | 1,329,942 | |
| Secured repurchase agreements (mark-to-market) | 869,229 | | | 969,286 | |
| Total portfolio financing | $ | 1,951,140 | | | $ | 2,299,228 | |
The following table summarizes assets at carrying values that served as collateral for the future payment obligations of the repurchase facilities, the asset-specific financing facility, the term financing facility, the secured credit facility and the CRE CLOs as of December 31, 2021,2023, and 2022:
| | | | | | | | | | | |
| (in thousands) | December 31,
2023 | | December 31,
2022 |
| Loans held-for-investment | $ | 2,522,187 | | | $ | 3,236,745 | |
| Loans held-for-sale | — | | | — | |
Real Estate Owned, net(1) | 20,508 | | | — | |
| | | |
| | | |
| | | |
| Restricted cash | — | | | 5,674 | |
| | | |
| Total | $ | 2,542,695 | | | $ | 3,242,419 | |
____________________
(1)As of December 31, 2020:
| | | | | | | | | | | |
| (in thousands) | December 31,
2021 | | December 31,
2020 |
| Loans held-for-investment | $ | 3,681,089 | | | $ | 3,814,460 | |
| | | |
| | | |
| | | |
| | | |
| | | |
| Total | $ | 3,681,089 | | | $ | 3,814,460 | |
Secured Repurchase Agreements
As of December 31, 2021,2023, we had repurchase facilities in place with five counterparties (lenders) with aggregate outstanding borrowings of $0.7$0.9 billion, which financed a portion of our loans held-for-investment.held-for-investment and real estate owned. As of December 31, 2021,2023, the weighted average borrowing rate on our repurchase facilities was 2.2%8.8%, the weighted average advance rate was 62.8%69.3%, and the term to maturity ranged from 179180 days to approximately 1.51.6 years, with a weighted average remaining maturity of 0.81.2 years.
The table below details our secured repurchase facilities as of December 31, 2021:2023:
| | December 31, 2021 | |
| December 31, 2023 | |
| December 31, 2023 | |
| December 31, 2023 | |
| (in thousands) | |
| (in thousands) | |
| (in thousands) | (in thousands) | Maturity Date (1) | | Committed | | Amount Outstanding | | Unused Capacity | | Total Capacity | |
| Repurchase facilities: | Repurchase facilities: | | | | | | | | | | |
Morgan Stanley Bank (2) | June 28, 2022 | | No | | $ | 230,982 | | | $ | 269,018 | | | $ | 500,000 | | |
| Repurchase facilities: | |
| Repurchase facilities: | |
| Morgan Stanley Bank | |
| Morgan Stanley Bank | |
| Morgan Stanley Bank | |
Goldman Sachs Bank USA(3) | |
Goldman Sachs Bank USA(3) | |
Goldman Sachs Bank USA (3) | Goldman Sachs Bank USA (3) | July 13, 2023 | | No | | $ | 81,227 | | | $ | 168,773 | | | $ | 250,000 | | |
| JPMorgan Chase Bank | JPMorgan Chase Bank | June 28, 2022 | | No | | $ | 104,215 | | | $ | 345,785 | | | $ | 450,000 | | |
| JPMorgan Chase Bank | |
| JPMorgan Chase Bank | |
| Citibank | Citibank | January 9, 2023 | | No | | $ | 202,944 | | | $ | 297,056 | | | $ | 500,000 | | |
Wells Fargo Bank (4) | June 28, 2022 | | No | | $ | 57,917 | | | $ | 42,083 | | | $ | 100,000 | | |
| Citibank | |
| Citibank | |
| Centennial Bank(4) | |
| Centennial Bank(4) | |
| Centennial Bank(4) | |
|
(1)The facilities are set to mature on the stated maturity date, unless extended pursuant to their terms.
(2)AsUnused capacity is not committed as of December 31, 2021, we retained an option to increase the maximum facility capacity amount up to $600 million, subject to customary terms and conditions.2023.
(3)As of December 31, 2021,2023, we retained an optionoptions to increase the maximum facility capacity amount up to $350 million, subject to customary terms and conditions.
(4)As of December 31, 2021,2023, we retained an optionoptions to increase the maximum facility capacity amount up to $200 million, subject to customary terms and conditions. As of December 31, 2023, the outstanding balance was collateralized by real estate owned.
Under our repurchase facilities, other than with respect to our Centennial Bank repurchase facility, which provides financing on a non-mark-to-market basis, our counterparties may make margin calls becauseas a result of a perceived decline in the value of our assets collateralizing the given secured financing arrangement due to a credit event or, under a limited number of our
repurchase facilities, due to market events. To cover a margin call, we may transfer cash or other loan collateral to such a counterparty. At maturity, any cash on deposit as collateral is generally applied against the repurchase facility balance, thereby reducing the amount borrowed. Should the value of our assets suddenly decrease, significant margin calls on our mark-to-market repurchase facilities could result, causing an adverse change in our liquidity position.
Commercial Real Estate Collateralized Loan Obligations
We have financed certain pools of our loans through the issuance of CRE CLOs. At December 31, 2021,2023, we had fourtwo CRE CLOs outstanding,outstanding: GPMT 2021-FL4 and GPMT 2021-FL3, GPMT 2019-FL2 and GPMT 2018-FL1, totaling $1.7$1.0 billion of outstanding borrowings, financing 7239 of our existing first mortgage loan investments with an aggregate principal balance, inclusive of $2.3restricted cash, of $1.3 billion. TheAs of December 31, 2023, our CRE CLOs provide us with an attractive cost of funds and finance 59.7%financed 45.9% of our total loan portfolio principal balance on a term-matched, non-recourse and non-mark-to-market basis.
basis with attractive cost of funds. On March 16, 2023, we redeemed the GPMT 2019-FL2 CRE CLO, which at its redemption had $98.1 million of outstanding borrowings. As a result of the redemption, we realized a gain on early extinguishment of debt of approximately $0.3 million.The following table details our CRE CLO securitized debt obligations:obligations as of December 31, 2023:
| | (in thousands) | December 31,
2021 |
| (dollars in thousands) | | (dollars in thousands) | December 31, 2023 |
| Securitized Debt Obligations | Securitized Debt Obligations | | Principal Balance | | Carrying Value | | Wtd. Avg. Yield/Cost (1) | Securitized Debt Obligations | | Principal Balance | | Carrying Value | | Wtd. Avg. Yield/Cost (1) |
| GPMT 2021-FL4 CRE CLO | GPMT 2021-FL4 CRE CLO | | | | | | |
Collateral assets(2) | |
Collateral assets(2) | |
Collateral assets(2) | | | $ | 621,409 | | | $ | 607,338 | | | S+ 3.8% |
| Financing provided | | Financing provided | | 502,564 | | | 500,403 | | | S+ 1.8% |
| GPMT 2021-FL3 CRE CLO | |
Collateral assets(3) | |
Collateral assets(3) | |
Collateral assets(3) | | | 629,273 | | | 618,003 | | | S+3.8% |
| Financing provided | | Financing provided | | 491,295 | | | 491,295 | | | S+1.9% |
| | Total | |
| | Total | |
| | Total | |
| Collateral assets | |
| Collateral assets | |
| Collateral assets | Collateral assets | | $ | 621,409 | | | $ | 613,504 | | | L+ 3.7% | | $ | 1,250,682 | | | $ | | $ | 1,225,341 | | | S+3.8% | | S+3.8% |
| Financing provided | Financing provided | | 502,564 | | | 498,117 | | | L+ 1.7% | Financing provided | | $ | 993,859 | | | $ | | $ | 991,698 | | | S+1.8% | | S+1.8% |
| GPMT 2021-FL3 CRE CLO | |
Collateral assets (2) | | 768,850 | | | 763,607 | | | L+3.9% |
| Financing provided | | 630,818 | | | 629,049 | | | L+1.7% |
| GPMT 2019-FL2 CRE CLO | |
| Collateral assets | | 617,119 | | | 605,831 | | | L+4.1% |
| Financing provided | | 446,849 | | | 445,920 | | | L+1.8% |
| GPMT 2018-FL1 CRE CLO | |
| Collateral assets | | 270,722 | | | 268,322 | | | L+5.0% |
| Financing provided | | 104,532 | | | 104,532 | | | L+2.8% |
| Total | |
| Collateral assets | | $ | 2,278,100 | | | $ | 2,251,264 | | | L+4.0% |
| Financing provided | | $ | 1,684,763 | | | $ | 1,677,618 | | | L+1.8% |
____________________
(1)Calculations of all in yield on collateral assets at origination are based on a number of assumptions (some or all of which may not occur) and are expressed as monthly equivalent yields that include net origination fees and exit fees and exclude future fundings and any potential or completed loan amendments or modifications. Calculations of all in weighted average yield at origination exclude fixed rate loans. Calculations of cost of funds is the weighted average coupon of the CRE CLO, exclusive of any CRE CLO issuance costs. During the year ended December 31, 2023, the financing provided transitioned from LIBOR to SOFR.
(2)Includes $10.4 millionNo restricted cash is included as of December 31, 2023. Yield on collateral assets is exclusive of restricted cash.
Term Financing Facility
In February 2021, we entered into a term financing facility with Goldman Sachs Bank USA providing us with term-matched and non-mark-to-market financing to fund certain loans that were previously financed under the repurchase facility with Goldman Sachs Bank USA. The term financing facility(3)No restricted cash is non-amortizing and may be voluntarily repaid, in whole, on any payment date, subject to a prepayment premium with certain exceptions if repaid prior to February 10, 2022. The term financing facility’s term is matched to that of the underlying commercial mortgage loans, not to exceed February 9, 2025. As of December 31, 2021, we had $129.1 million outstanding on the term financing facility with a weighted average borrowing rate of 3.70%.
The following table details the outstanding borrowings under our term financing facilityincluded as of December 31, 2021:
| | | | | | | | | | | | | | | | | | | | |
| (in thousands) | December 31,
2021 |
| Term Financing Facility | | Principal Balance | | Carrying Value | | Wtd. Avg. Yield/Cost (1) |
| GS Term Financing Facility | | | | | | |
| Collateral assets | | 331,553 | | | $ | 329,256 | | | L+4.1% |
| Borrowings outstanding | | 129,099 | | | 127,145 | | | L+3.6% |
___________________(1) Calculations of all in yield2023. Yield on collateral assets at origination are based on a number of assumptions (some or all of which may not occur) and are expressed as monthly equivalent yields that include net origination fees and exit fees and exclude future fundings and any potential or completed loan amendments or modifications. Calculations of all in weighted average yield at origination exclude fixed rate loans. Calculations of cost of funds is the initial weighted average coupon of the term financing facility, exclusive of any term financing facility issuance costs.
Asset-Specific Financing
In April 2019, we entered into a $150$150.0 million loanasset-specific financing facility with CIBC Bank USA to provide us with loan-based financing on a non-mark-to-market basis with a term matched to the underlying loan collateral and partial recourse to us. During the year ending December 31, 2023, the borrowings facility was terminated.
Secured Credit Facility
In December 2022, we entered into a secured credit facility with a maximum borrowing capacity of $100.0 million. The facility had aggregate outstanding borrowings of $84.0 million as of December 31, 2023, which financed a portion of our loans held for investment on a non-mark-to-market basis. The facility matures on December 21, 2025.
The following table details the outstanding borrowings under our asset-specific financingsecured credit facility as of December 31, 2021:2023:
| | | | | | | | | | | | | | | | | | | | |
| (in thousands) | December 31,
2021 |
| Asset-Specific Financing Facility | | Principal Balance | | Carrying Value | | Wtd. Avg. Yield/Cost (1) |
| CIBC Asset-Specific Financing Facility | | | | | | |
| Collateral assets | | $ | 56,288 | | | $ | 56,129 | | | L+3.4% |
| Borrowings outstanding | | 43,622 | | | 43,622 | | | L+1.7% |
| | | | | | | | | | | | | | | | | | | | |
| (dollars in thousands) | December 31, 2023 |
| Secured Credit Facility | | Principal Balance | | Carrying Value | | Wtd. Avg. Yield/Cost (1) |
| | | | | | |
| Collateral assets | | $ | 141,899 | | | $ | 105,865 | | | S+4.1% |
| Borrowings outstanding | | 84,000 | | | 84,000 | | | S+6.5% |
____________________
(1)Calculations of all in yield on collateral assets at origination are based on a number of assumptions (some or all of which may not occur) and are expressed as monthly equivalent yields that include net origination fees and exit fees and exclude future fundings and any potential or completed loan amendments or modifications. Calculations of all in weighted average yield at origination exclude fixed rate loans. Calculations of cost of funds is the initial weighted average coupon of the asset-specific financingsecured credit facility, exclusive of any asset-specific financingsecured credit facility issuance costs.
Corporate Financing
The following table details our outstanding corporate financing as of December 31, 2021:
| | | | | | | | |
(in thousands) | | December 31,
2021 |
Corporate Financing | | Principal Balance |
Senior secured term loan facilities | | $ | 150,000 | |
Convertible senior notes | | 275,350 | |
Total Corporate Financing | | 425,350 | |
Senior Secured Term Loan Facilities
As of December 31, 2021, the total outstanding amount due on the senior secured term loan facilities was $150.0 million, with a carrying value of $139.9 million, net of deferred issuance costs. The balance reflects a $75 million principal repayment made on December 9, 2021, which resulted in the $(8.9) million loss on early extinguishment of debt. Interest on the outstanding loans under the senior secured term loan facilities is payable quarterly in arrears and accrues at the rate of (i) 8.00% per annum for any period for which accrued interest is paid in cash or (ii) 9.00% per annum for any period for which the borrowers elect to pay up to 50% of accrued interest in kind by adding such interest to the principal amount of the loans. The senior secured term loan facilities will mature on September 25, 2025. The balance does not reflect the $50 million principal repayment made on February 16, 2022, which resulted in a $(5.8) million loss on early extinguishment of debt.
| | | | | | | | | | | | | | | | | | | | | | | | | | |
| (in thousands) | | December 31,
2021 |
| Senior Secured Term Loan Facilities | | Principal Balance | | Carrying Value | | All-in Cost (1) | | Maturity Date |
| PIMCO Senior Secured Term Loan Facilities | | $ | 150,000 | | | $ | 139,880 | | | 11.0 | % | | September 2025 |
____________________
(1)In addition to cash coupon, average yield includes the amortization of deferred financing costs and initial estimated fair value assigned to warrants.
Convertible Senior Notes
As of December 31, 2021, the total outstanding amount due onWe redeemed for cash $131.6 million in convertible senior notes was $275.4 million. The notes are unsecured and pay interest semiannually at a rate of 5.625% per annummaturity on the notes maturing in December 2022 and a rate of 6.375% per annum on the notes maturing in October 1, 2023. As of December 31, 2021, these notes had a conversion rate of 51.9943 and 50.0894shares of common stock per $1,000 principal amount2023, none of the notes respectively.
As of December 31, 2021, the following convertible senior notes were outstanding:
| | | | | | | | | | | | | | | | | | | | | | | | | | | | | | | | |
| (in thousands) | | December 31,
2021 |
| Convertible Senior Notes | | Principal Balance | | Carrying Value | | Interest Rate | | All-in Cost (1) | | Maturity Date |
| Convertible Senior Notes Maturing 2022 | | 143,750 | | | 142,875 | | | 5.6 | % | | 6.4 | % | | December 1, 2022 |
| Convertible Senior Notes Maturing 2023 | | 131,600 | | | 130,067 | | | 6.4 | % | | 7.2 | % | | October 1, 2023 |
____________________
(1)In addition to cash coupon, average yield includes the amortization of deferred financing costs.
The following table provides the quarterly average balances, the quarter-end balancesremained outstanding and the maximum balances at any month-end within that quarterly period, of borrowings under our repurchase facilities, asset-specific financing facility, term financing facility, CRE CLOs, senior secured term loan facilities and convertible senior notes for the three months ended December 31, 2021, and the four immediately preceding quarters:
| | | | | | | | | | | | | | | | | | | |
| (in thousands) | Quarterly Average | | End of Period Balance | | Maximum Balance of Any Month-End | | |
| For the Three Months Ended December 31, 2021 | $ | 2,985,109 | | | $ | 2,938,493 | | | $ | 3,031,364 | | | |
| For the Three Months Ended September 30, 2021 | $ | 2,974,497 | | | $ | 2,927,103 | | | $ | 3,014,681 | | | |
| For the Three Months Ended June 30, 2021 | $ | 2,989,774 | | | $ | 2,868,936 | | | $ | 3,129,181 | | | |
| For the Three Months Ended March 31, 2021 | $ | 3,127,878 | | | $ | 3,112,629 | | | $ | 3,319,943 | | | |
| For the Three Months Ended December 31, 2020 | $ | 3,272,932 | | | $ | 3,236,792 | | | $ | 3,317,165 | | | |
Financial Covenants
Our financial covenants and guarantees for outstanding borrowings related to our repurchasesecured financing agreements term financing facility, asset specific financing and senior secured term loan facilities generally require the Companyus to maintain compliance with the following most restrictive covenants across the agreements:
| | | | | | | | |
| Financial Covenant | Description | Value as of December 31, 20212023 |
| Cash Liquidity | Unrestricted cash liquidity of no less than the greater of $30.0 million and 5.0% of recourse indebtedness, which was $15.6 million. | Unrestricted cash of $191.9 million, while 5.0% of recourse indebtedness was $31.6$188.4 million |
| Tangible Net Worth | Tangible net worth greater than the sum of (i) 75.0% of tangible net worth as of June 28, 2017,$816.9 million and (ii) 75.0% of net cash proceeds of equity issuances after June 28, 2017, which calculates to $865.7August 3, 2023. As the Company has not had any equity issuances after August 3, 2023, tangible net worth must be greater than $816.9 million. | Tangible net worth of $1.1$1.0 billion |
| Leverage Ratios | Target asset leverage ratio cannot exceed 77.5% and total leverage ratio cannot exceed 80.0%. | Target asset leverage ratio of 66.5%71.8%; Total leverage ratio of 73.8%66.6% |
| Interest Coverage | Interest coverage ratio of no less than 1.5:1.3:1.0 through June 30, 2024, thereafter no less than 1.4:1.0. | Interest coverage of 1.8:1.5:1.0 |
We were in compliance with all financial covenants as of December 31, 2021.2023.
Leverage Ratios
As of December 31, 2021,2023, the total debt-to-equity ratio with respect to our loans held-for-investment was 2.7:2.1:1.0, and our recourse leverage ratio was 0.9:1.0.
The following table represents the Company’sour recourse leverage ratio and total leverage ratio as of December 31, 2021,2023, and December 31, 2020:2022:
| | | | | | | | |
| December 31, 2021 | December 31, 2020 |
Recourse leverage ratio (1) | 0.9 | 2.2 |
Total leverage ratio (2) | 2.7 | 3.2 |
| | | | | | | | |
| December 31, 2023 | December 31, 2022 |
Recourse leverage ratio(1) | 0.9 | 1.2 |
Total leverage ratio(2) | 2.1 | 2.3 |
____________________
(1)The debt-to-equity ratio with respect to our loans held-for-investment, defined as recourse debt, net of cash, divided by total equity.
(2)The total debt-to-equity ratio with respect to our loans held-for-investment, defined as total debt, net of cash, divided by total equity.
Floating Rate Portfolio
Our business strategy seeks to minimize our exposure to changes in interest rates by matching benchmark indices on our assets with those on our asset level borrowings. Accordingly, our business model is such that, in general, rising interest rates will increase our net interest income, while declining interest rates will decrease our net interest income, subject to the impact of interest rate floors on our floating rate assets and certain liabilities. As of December 31, 2021, 98.8%2023, 98.3% of our loan investments by carrying valueprincipal balance earned a floating rate of interest and were financed with liabilities that pay interest on a floating rate basis, which resulted in an amount of net equity that is positively correlated to rising interest rates,floating rate exposure, subject to the impact of interest rate floors on certain of our floating rate loan investments.investments, of $0.7 billion. As of December 31, 2021, the remaining 1.2%2023, 1.7% of our loan investments thatby principal balance earned a fixed rate of interest and were financed with liabilities that pay interest on a floating rate basis, which resulted in a negative correlation to rising interest rates on that amount of our financing.
The following table details our loan portfolio’s net floating rate exposure as of December 31, 2021:2023:
| | | | | |
| (in thousands) | Net Exposure |
Floating rate assets(1)(2) | $ | 3,748,3112,681,202 | |
Floating rate liabilities(1)(2)(3) | 2,534,7691,953,301 | |
| Net floating rate exposure | $ | 1,213,542727,901 | |
____________________
(1) FloatingAs of December 31, 2023, all of our floating rate assets and liabilities arewere indexed to the London Interbank Offered Rate, or LIBOR.SOFR.
(2)Includes loans on nonaccrual status as of December 31, 2023.
(3)Floating rate liabilities include our outstanding repurchase facilities, term financing facility, asset-specific financingsecured credit facility and CRE CLOs.
Interest-Earning Assets and Interest-Bearing Liabilities
The following tables present the components of interest income and average annualized net asset yield earned by asset type, the components of interest expense and average annualized cost of funds on borrowings incurred by collateral type and net interest income and average annualized net interest rate spread for the yearyears ended December 31, 2021,2023, and 2020: | | | | | | | | | | | | | | | | | | | | | | | |
| | | Year Ended December 31, 2021 |
| (dollars in thousands) | | | | | | | Average Balance | | Interest Income/Expense (1) | | Net Yield/Cost of Funds |
Interest-earning assets (2) | | | | | | | | | | | |
| Loans held-for-investment | | | | | | | | | | | |
Senior loans (3) | | | | | | | $ | 3,732,225 | | | $ | 196,429 | | | 5.3 | % |
| Subordinated loans | | | | | | | 15,783 | | | 1,513 | | | 9.6 | % |
| | | | | | | | | | | |
| | | | | | | | | | | |
| Other | | | | | | | — | | | 346 | | | — | % |
| Total interest income/net asset yield | | | | | | | $ | 3,748,008 | | | $ | 198,288 | | | 5.3 | % |
| Interest-bearing liabilities | | | | | | | | | | | |
| Borrowings collateralized by: | | | | | | | | | | | |
| Loans held-for-investment | | | | | | | | | | | |
Senior loans (3) | | | | | | | $ | 2,518,884 | | | $ | 65,457 | | | 2.6 | % |
| Subordinated loans | | | | | | | 8,473 | | | 268 | | | 3.2 | % |
| | | | | | | | | | | |
| | | | | | | | | | | |
| Other: | | | | | | | | | | | |
| Convertible senior notes | | | | | | | 272,157 | | | 18,167 | | | 6.7 | % |
| Senior secured term loan facilities | | | | | | | 202,174 | | | 21,688 | | | 10.7 | % |
| Total interest expense/cost of funds | | | | | | | $ | 3,001,688 | | | 105,580 | | | 3.5 | % |
| Net interest income/spread | | | | | | | | | $ | 92,708 | | | 1.8 | % |
| | | | | | | | | | | | | | | | | | | | | | | | | |
| | | Year Ended December 31, 2023 |
| (dollars in thousands) | | | | | | | Average Balance | | Interest Income/Expense(1) | | Net Yield/Cost of Funds |
Interest-earning assets(2) | | | | | | | | | | | |
| Loans held-for-investment | | | | | | | | | | | |
Senior loans(3) | | | | | | | $ | 3,107,233 | | | $ | 253,629 | | | 8.2 | % |
| Subordinated loans | | | | | | | 13,626 | | | 1,104 | | | 8.1 | % |
| | | | | | | | | | | |
| | | | | | | | | | | |
| | | | | | | | | | | |
| Total loan interest income/net asset yield | | | | | | | $ | 3,120,859 | | | $ | 254,733 | | | 8.2 | % |
| Other - Interest on cash and cash equivalents | | | | | | | | | 9,002 | | | |
| Total interest income | | | | | | | | | $ | 263,735 | | | |
| Interest-bearing liabilities | | | | | | | | | | | |
| Borrowings collateralized by: | | | | | | | | | | | |
| Loans held-for-investment | | | | | | | | | | | |
Senior loans(3)(4) | | | | | | | $ | 2,196,553 | | | $ | 174,083 | | | 7.9 | % |
| Subordinated loans | | | | | | | 8,182 | | | 677 | | | 8.3 | % |
| | | | | | | | | | | |
| | | | | | | | | | | |
| Other: | | | | | | | | | | | |
| Convertible senior notes | | | | | | | 98,467 | | | 6,975 | | | 7.1 | % |
| | | | | | | | | | | |
| Total interest expense/cost of funds | | | | | | | $ | 2,303,202 | | | $ | 181,735 | | | 7.9 | % |
| Net interest income/spread | | | | | | | | | $ | 82,000 | | | 0.3 | % |
| | | Year Ended December 31, 2020 |
| | | Year Ended December 31, 2022 | |
| | | Year Ended December 31, 2022 | |
| | | Year Ended December 31, 2022 | |
| (dollars in thousands) | (dollars in thousands) | | Average Balance | | Interest Income/Expense (1) | | Net Yield/Cost of Funds | (dollars in thousands) | | | | | | | Average Balance | | Interest Income/Expense(1) | | Net Yield/Cost of Funds |
Interest-earning assets (2) | Interest-earning assets (2) | | | | | | |
| Loans held-for-investment | Loans held-for-investment | | |
| Loans held-for-investment | |
| Loans held-for-investment | |
Senior loans(3) | |
Senior loans(3) | |
Senior loans (3) | Senior loans (3) | | $ | 4,156,473 | | | $ | 233,212 | | | 5.6 | % | | | | | | | $ | 3,696,469 | | | $ | | $ | 207,145 | | | 5.6 | | 5.6 | % |
| Subordinated loans | Subordinated loans | | 26,932 | | | 2,637 | | | 9.8 | % | Subordinated loans | | | | | | | 14,250 | | | 1,355 | | 1,355 | | | 9.5 | | 9.5 | % |
| Available-for-sale securities | | 8,034 | | | 646 | | | 8.0 | % |
| Held-to-maturity securities | | 7,853 | | | 659 | | | 8.4 | % |
| Other | | — | | | 559 | | | — | % |
| Total interest income/net asset yield | | $ | 4,199,292 | | | $ | 237,713 | | | 5.7 | % |
| | Total loan interest income/net asset yield | |
| | Total loan interest income/net asset yield | |
| | Total loan interest income/net asset yield | | | | | | | | $ | 3,710,719 | | | $ | 208,500 | | | 5.7 | % |
| Other - Interest on cash and cash equivalents | |
| Total interest income | |
| Total interest income | |
| Total interest income | |
| Interest-bearing liabilities | |
| Interest-bearing liabilities | |
| Interest-bearing liabilities | Interest-bearing liabilities | | |
| Borrowings collateralized by: | Borrowings collateralized by: | | |
| Borrowings collateralized by: | |
| Borrowings collateralized by: | |
| Loans held-for-investment | |
| Loans held-for-investment | |
| Loans held-for-investment | Loans held-for-investment | | |
Senior loans (3) | Senior loans (3) | | $ | 3,010,143 | | | $ | 88,667 | | | 2.9 | % |
Senior loans(3) | |
Senior loans(3) | | | | | | | | $ | 2,503,708 | | | $ | 104,448 | | | 4.2 | % |
| Subordinated loans | Subordinated loans | | 8,793 | | | 322 | | | 3.7 | % | Subordinated loans | | | | | | | 8,332 | | | 400 | | 400 | | | 4.8 | | 4.8 | % |
| Available-for-sale securities | | 5,083 | | | 198 | | | 3.9 | % |
| Held-to-maturity securities | | 4,773 | | | 210 | | | 4.4 | % |
| | Other: | |
| | Other: | |
| | Other: | Other: | | |
| Convertible senior notes | Convertible senior notes | | 270,506 | | | 18,092 | | | 6.7 | % |
| Convertible senior notes | |
| Convertible senior notes | | | | | | | | 261,790 | | | 17,527 | | | 6.7 | % |
| Senior secured term loan facilities | Senior secured term loan facilities | | 53,222 | | | 5,446 | | | 10.2 | % | Senior secured term loan facilities | | | | | | | 36,003 | | | 3,754 | | 3,754 | | | 10.4 | | 10.4 | % |
| | Total interest expense/cost of funds | |
| Total interest expense/cost of funds | |
| Total interest expense/cost of funds | Total interest expense/cost of funds | | $ | 3,352,520 | | | 112,935 | | | 3.4 | % | | | | | | | $ | 2,809,833 | | | $ | | $ | 126,129 | | | 4.5 | | 4.5 | % |
| Net interest income/spread | Net interest income/spread | | | $ | 124,778 | | | 2.3 | % | Net interest income/spread | | | | | | | | | $ | 84,725 | | | 1.2 | | 1.2 | % |
____________________
(1)Includes amortization of deferred debt issuance costs.
(2)Average balance represents average amortized cost on loans held-for-investment, available-for-sale, or AFS, securities and held-to-maturity securities.held-for-investment.
(3)Loans primarily secured by a first priority lien on commercial real property and related personal property and also includes, when applicable, any companion subordinate loans.
(4)Included in collateralized borrowings is the Centennial repurchase facility with an outstanding balance of $6.2 million as shown in Note 6 - Secured Financing Agreements, which became collateralized by real estate owned on May 16, 2023. During the year ended December 31, 2023, the facility had an average balance collateralized by real estate owned of $4.3 million. During the year ended December 31, 2023, the facility accrued interest expense of $0.4 million while collateralized by real estate owned.
Factors Affecting Our Operating Results
The results of our operations are affected by a number of factors and primarily depend on, among other things, the level of our net interest income, the availability and cost of financing for us, the market value of our assets, the credit performance of our assets and the supply of, and demand for, commercial real estate loans, other commercial real estate debt instruments and other financial assets available for investment in the market and available as a source of refinancing of our assets. Our net interest income, which reflects the amortization of origination fees and direct costs, is recognized based on the contractual rate and the outstanding principal balance of the loans we originate. The objective of the interest method is to arrive at periodic interest income that yields a level rate of return over the loan term. Interest rates vary according to the type of loan or security, conditions in the financial markets, credit worthinesscredit-worthiness of our borrowers, competition and other factors, none of which can be predicted with any certainty. Our operating results may also be impacted by credit losses in excess of initial anticipations or unanticipated credit events experienced by our borrowers. We continue to monitor the effects on each of these factors in light of the COVID-19 pandemicsignificant volatility in global markets, driven by investor concerns over inflation, rising interest rates, slowing economic growth and geopolitical uncertainty, and how they will affect the results of our operations.operating results.
Loan Originations
Our business model is mainly focused on directly originating, investing in and managing senior floating-rate commercial mortgage loans and other debt and debt-like commercial real estate investments. As a result of this strategy, our operating performance is subject to overall market demand for commercial real estate loan products and other debt and debt-like commercial real estate investments. We manage originations and acquisitions of our target investments by diversifying our investment portfolio across geographical regions, local markets, property types, borrower types and loan structures. We do not limit our investments to any number of geographical areas or property types for our originations so that we develop a well-diversified investment portfolio. Additionally, our team has extensive experience originating and acquiring commercial real estate loans and other debt and debt-like commercial real estate investments, through a network of long-standing relationships with borrowers, sponsors and industry brokers. The COVID-19 pandemic hasInvestor concerns over inflation, rising interest rates, slowing economic growth, and geopolitical uncertainty have resulted in significant disruptions and volatility in financial markets, uncertainty about the overall macroeconomic outlook and a dislocation in the commercial real estate sector, including reduced borrower demand, wider credit spreads, higher lending rates, increased capitalization rates on properties and significantly lower transaction volume. TheThis dislocation in capital markets and decline in real estate sale transaction and refinancing activities caused by the pandemic have negatively impacted, and will likely continue to negatively impact, the volume of loan repayments and prepayments on select property types which(which are a significant source of our overall liquidityliquidity) and could make it more difficult for us to originatethe volume of our originations of new loan investments.
Financing Availability
We are subject to the availability and cost of financing to successfully execute on our business strategy and generate attractive risk-adjusted returns to our stockholders. Much of our financing is in the form of repurchase agreements or other types of credit facilities provided to us by our lender counterparties. We mitigate this counterparty risk by seeking to diversify our lending partners, focusing on establishing borrowing relationships with strong counterparties and continuously monitoring them through a thoughtful approach to counterparty risk oversight. Additionally, as part of our broader risk management strategy, and to the extent available in the market, we finance our business through other means, which may include, but not be limited to, securitizations, note sales and issuance of unsecured debt and equity instruments. We continue to actively explore additional types of funding facilities in order to further diversify our financing sources. The COVID-19 pandemic hasInvestor concerns over inflation, rising interest rates, slowing economic growth, and geopolitical uncertainty have resulted in significant disruptions and volatility in financial markets and uncertainty about the overall macroeconomic outlook. Declines in economic conditions couldhave negatively impacted, and may continue to negatively impact, real estate and real estate capital markets, which could make it more difficult for us to obtain or maintain financing.
We finance pools of our commercial real estate loans through collateralized loan obligations, or CRE CLOs, retaining the subordinate securities in our investment portfolio. Our CRE CLOs are accounted for as financings with the non-retained securitized debt obligations recognized on our consolidated balance sheets.
Credit Risk
We are subject to varying degrees of credit risk in connection with our target investments. The performance and value of our investments depend upon sponsors’ ability to operate the properties that serve as our collateral so that they produce cash flows adequate to pay interest and principal due to us. In addition, we are exposed to the risks generally associated with the commercial real estate market, including variances in occupancy rates, capitalization rates, absorption rates and other macroeconomic factors beyond our control.control such as the level of market interest rates. We try to mitigate this riskthese risks by seeking to originate or acquire assets of higher quality at appropriate rates of return given anticipated and unanticipated losses, by employing a comprehensive review and selection process and by proactively monitoring originated or acquiredour investments. Nevertheless, unanticipated credit losses, including as a result of the COVID-19 pandemic,inflation, rising interest rates, capital markets volatility, slowing economic growth and geopolitical uncertainty, could occur that could adversely impact our operating results. Volatility in market interest rates may result in fluctuations in cash flows and values of properties securing our loans. As a result, there may exist the risk of non-performance on our floating-rate loans, and in the case of a significant increase in interest rates, the cash flows of the
collateral properties may not sufficiently cover debt service due under our loans, which may contribute to loan non-performance or, in certain cases, loan default.
The environmental, social and governance, or ESG, risksfactors associated with our potential collateral and borrowers could also pose credit risks to us. We try to mitigate these risks by incorporating diligence practices into our investment process to identify materialsignificant ESG mattersconcerns related to a given investment. The nature and scope of our ESG diligence will vary based on the investment but may include a review of, among other things, energy management, pollution and contamination, accounting standards, and bribery and corruption.
We employ a long-term, fundamental value-oriented investment strategy and we aim to, on a loan-by-loan basis, construct an investment portfolio that is well-diversified across property types, geographies and sponsors.
The COVID-19 pandemic significantly impacted the commercial real estate markets, causing reduced occupancy, requests from tenants for rent deferral or abatement, and delays in construction and development projects currently planned or underway. While the economy has improved significantly, macroeconomic trends associated with the COVID-19 pandemic have persisted and could continue to persist and impair our borrowers’ ability to pay principal and interest due to us under our loan agreements.
Operating Expenses
Through December 31, 2020, we were externally managed by Pine River Capital Management L.P., or the Former Manager, through December 31, 2020, at which time we internalized our management function, or the Internalization. Prior to the Internalization, we paid the Former Manager a quarterly base management fee and, if earned, an incentive fee and reimbursed the Former Manager for all costs and expenses it incurred on our behalf in order to operate our business, including compensation costs for certain personnel that provided services to us under the Management Agreement. Subsequent to the Internalization, we no longer pay the Former Manager and we are responsible for paying all costs and expenses incurred to operate our business, including compensation costs for all of our employees. Our operating expenses, such as compensation costs and expenses related to managing our investment portfolio, may vary over time and are subject to a variety of factors, including overall economic and market environment, competitive market forces driving employee-related costs and other related factors.
Allowance for Credit Losses
Our operating results are also impacted by the allowance for credit losslosses we record for loans held-for-investment using the Current Expected Credit Loss, or CECL model pursuant to ASU 2016-13. Refer to “Management’s Discussion and Analysis of Financial Condition and Results of Operations – Critical Accounting Policies and Use of Estimates – Loans Held-For-Investment and Provision for Credit Losses” included in Item 7 of this Annual Report on Form 10-K for additional information regarding our allowance for credit losses.
Changes in the Fair Value of Our Investments
We intend to hold our target investments for the long-term and, as such, they are carried at an amortized cost on our consolidated balance sheets.
Although we intend to hold our target investments for the long-term, we may occasionally classify some of ourinvest in debt securities and classify them as available-for-sale, or AFS. Investments classified as AFS are carried at their fair value, with changes in fair value recorded through accumulated other comprehensive (loss) income, a component of stockholders’ equity, rather than through earnings. We do not intend to hold any of our investments for trading purposes.
Changes in Market Interest Rates
Our primary interest rate exposures relate to the yield on our loans and other investments and the financing cost of our borrowings. Changes in interest rates have affected, and may continue to affect, our net interest income from loans and other investments. Interest rate fluctuations resulting in our interest and related expense exceeding interest and related income would result in operating losses for us. ToFor further discussion of the extent that our financing costs are determined by reference to floating rates, such as LIBOR (or any replacement rate such as SOFR) or a Treasury index, the amountpotential impacts of such costs will depend on the level and movement of interest rates. Interest rates have remained at relatively low levels on a historical basis. There can be no assurance, however, that the Federal Reserve will not raise rateschanges in 2022, and any such increase could adversely affect our results of operations and financial condition. In a period of rising interest rates, our interest expensesee “Quantitative and Qualitative Disclosures about Market Risk — Interest Rate Risk” in Item 7A of this Annual Report on floating rate borrowings would increase, while any additional interest income we earn on our floating rate investments may be subject to caps and/or in-the-money floors that may limit the growth of our interest income until interest rates rise above such floors, or loans with such floors are repaid or refinanced, and may not compensate for such increase in interest expense. Any such scenario could adversely affect our results of operations, interest coverage ratio and financial condition.
Although our strategy is to primarily originate, invest in and manage senior floating-rate commercial mortgage loans, from time-to-time we may acquire fixed-rate investments, which exposes our operating results to the risks posed by fluctuations in interest rates. To the extent that this applies to us, we may choose to actively manage this risk through the use of hedging strategies.
Summary of Results of Operations and Financial Condition
Our GAAP net income (loss) attributable to common stockholders was $67.6$(77.6) million (or $1.24$(1.50) per basic weighted average share) for the year ended December 31, 2021,2023, as compared to GAAP net income (loss) attributable to common stockholders of $(40.5)$(55.3) million (or $(0.73)$(1.04) per basic weighted average share) for the year ended December 31, 2020.2022. The decrease in GAAP results was primarily due to provision for credit losses of $(104.8) million, a gain on extinguishment of debt of $0.2 million, a net loss on REO of $(3.4) million and net interest income forof $82.0 million during the year ended December 31, 2021, benefited from2023, compared to a partial reversal of the provision for credit losses which was related to loan prepayments, somewhat improved macroeconomic forecast and overall market conditions and a decrease in other operating expenses. The GAAPof $(69.3) million, $(18.8) million losses on extinguishment of debt, no net loss foron REO and net interest income of $84.7 million during the year ended December 31, 2020, was primarily a result2022.
Comparison of the COVID-19 pandemic, one-time restructuring charges related to the Internalization and realized losses on the sale of select loans.
For a comparison and discussion of our results of operations and other operating and financial data for the fiscal years endedYear Ended December 31, 2020,2023, and December 31, 2019, see “Part II, Item 7. Management’s Discussion and Analysis of Financial Condition and Results of Operations” of our annual report on Form 10-K for the fiscal year ended December 31, 2020, filed with the SEC on March 5, 2021.
The following table presents the primary components of our consolidated balance sheets as of December 31, 2021, and 2020:
| | | | | | | | | | | | | | |
| (in thousands) | | December 31,
2021 | | December 31,
2020 |
| Balance Sheet Data: | | |
| | | | |
| Loans held-for-investment, net | | $ | 3,741,308 | | | $ | 3,847,803 | |
| Total assets | | $ | 3,988,518 | | | $ | 4,219,648 | |
| Repurchase facilities | | $ | 677,285 | | | $ | 1,708,875 | |
| Securitized debt obligations | | $ | 1,677,619 | | | $ | 927,128 | |
| Asset-specific financings | | $ | 43,622 | | | $ | 123,091 | |
| Term financing facility | | $ | 127,145 | | | $ | — | |
| Convertible senior notes | | $ | 272,942 | | | $ | 271,250 | |
| Senior secured term loan facilities | | $ | 139,880 | | | $ | 206,448 | |
| Total stockholders’ equity | | $ | 1,013,058 | | | $ | 933,846 | |
2022
Net Interest Income
The following tables presenttable presents the components of interest income and interest expense for the year ended December 31, 2021,2023, and 2020:December 31, 2022:
| | | | | | | | | | | | | | | | | | | | | | | | | | | | | | |
| (in thousands, except share data) | | | | | | Year Ended December 31, | | | | |
| Income Statement Data: | | | | | | | | | | 2021 | | 2020 | | 2021 vs 2020 | | | | |
| Interest income: | | | | | | | | |
| Loans held-for-investment | | | | | | | | | | $ | 197,942 | | | $ | 234,954 | | | $ | (37,012) | | | | | |
| Loans held-for-sale | | | | | | | | | | — | | | 895 | | | (895) | | | | | |
| Available-for-sale securities | | | | | | | | | | — | | | 646 | | | (646) | | | | | |
| Held-to-maturity securities | | | | | | | | | | — | | | 659 | | | (659) | | | | | |
| Cash and cash equivalents | | | | | | | | | | 346 | | | 559 | | | (213) | | | | | |
| Total interest income | | | | | | | | | | 198,288 | | | 237,713 | | | (39,425) | | | | | |
| Interest expense: | | | | | | | | | | | | | | — | | | | | |
| Repurchase facilities | | | | | | | | | | 25,973 | | | 58,444 | | | (32,471) | | | | | |
| Securitized debt obligations | | | | | | | | | | 29,926 | | | 26,312 | | | 3,614 | | | | | |
| Convertible senior notes | | | | | | | | | | 18,167 | | | 18,092 | | | 75 | | | | | |
| Term financing facility | | | | | | | | | | 7,585 | | | — | | | 7,585 | | | | | |
| Asset-specific financings | | | | | | | | | | 2,241 | | | 3,862 | | | (1,621) | | | | | |
| Revolving credit facilities | | | | | | | | | | — | | | 779 | | | (779) | | | | | |
| Senior secured term loan facilities | | | | | | | | | | 21,688 | | | 5,446 | | | 16,242 | | | | | |
| | | | | | | | | | | | | | | | | | |
| Total interest expense | | | | | | | | | | 105,580 | | | 112,935 | | | (7,355) | | | | | |
| Net interest income | | | | | | | | | | 92,708 | | | 124,778 | | | (32,070) | | | | | |
| | | | | | | | | | | | | | | | | | | | | | | | | | | | | | | | |
| (in thousands) | | | | | | | | Year Ended | | | | |
| Income Statement Data: | | | | | | | | | | | | 2023 | | 2022 | | 2023 vs 2022 | | | | |
| Interest income: | | | | | | | | | | | | | | | | |
| Loans held-for-investment | | | | | | | | | | | | $ | 254,733 | | | $ | 208,500 | | | $ | 46,233 | | | | | |
| | | | | | | | | | | | | | | | | | | | |
| | | | | | | | | | | | | | | | | | | | |
| | | | | | | | | | | | | | | | | | | | |
| Cash and cash equivalents | | | | | | | | | | | | 9,002 | | | 2,354 | | | 6,648 | | | | | |
| Total interest income | | | | | | | | | | | | $ | 263,735 | | | $ | 210,854 | | | $ | 52,881 | | | | | |
| Interest expense: | | | | | | | | | | | | | | | | — | | | | | |
| Repurchase facilities | | | | | | | | | | | | $ | 86,593 | | | $ | 49,452 | | | $ | 37,141 | | | | | |
| Securitized debt obligations | | | | | | | | | | | | 72,975 | | | 51,631 | | | 21,344 | | | | | |
| Convertible senior notes | | | | | | | | | | | | 6,975 | | | 17,527 | | | (10,552) | | | | | |
| Term financing facility | | | | | | | | | | | | — | | | 1,713 | | | (1,713) | | | | | |
| Asset-specific financings | | | | | | | | | | | | 2,902 | | | 1,669 | | | 1,233 | | | | | |
| | | | | | | | | | | | | | | | | | | | |
| Secured credit facility | | | | | | | | | | | | 12,290 | | | 383 | | | 11,907 | | | | | |
| Senior secured term loan facilities | | | | | | | | | | | | — | | | 3,754 | | | (3,754) | | | | | |
| | | | | | | | | | | | | | | | | | | | |
| Total interest expense | | | | | | | | | | | | $ | 181,735 | | | $ | 126,129 | | | $ | 55,606 | | | | | |
| Net interest income | | | | | | | | | | | | $ | 82,000 | | | $ | 84,725 | | | $ | (2,725) | | | | | |
The majority of our interest-earning assets and liabilities have floating rates based on an index (e.g., one-month LIBOR)SOFR) plus a credit spread. As a result, our asset yields and cost of funds are impacted by changes in benchmark market interest rates and credit spreads on investments and borrowings, as well as changes in the mix of our investment portfolio credit spreads due to new originations, loan amendments, of existing investments, additional fundings, upsizings and repayments.
Interest Income
Interest income decreasedfor the year ended December 31, 2023, increased to $263.7 million from $237.7 million to $198.3$210.9 million for the year ended December 31, 2020, and December 31, 2021, respectively. The decrease is2022, mainly due to an increase in short-term interest rates, partially offset by a lower average portfolio balance of our interest-earning assets due to prepayments and a decrease inhigher average LIBOR.balance of nonaccrual loans.
Interest Expense
Interest expense decreasedfor the year ended December 31, 2023, increased to $181.7 million from $112.9 million to $105.6$126.1 million for the year ended December 31, 2020, and December 31, 2021, respectively. The decrease is2022, mainly due to an increase in short-term interest rates and the higher-cost secured credit facility, partially offset by a lower average borrowings balance on portfolio level financing and a decrease in average LIBOR, offset by the addition of the senior secured term loan facilities and the term financing facility.corporate borrowings.
Provision for Credit Losses
Consistent with the methodology used during the adoption of ASU 2016-13 on January 1, 2020, we continue to use a probability-weighted analytical model to estimate and recognize an allowance for credit losses on loans held-for-investment and their related unfunded commitments. Additionally, in determining the allowance for credit losses estimate through December 31, 2021, we employed third party licensed macroeconomic forecasts, over the reasonable projection period. Significant inputs to our estimate of the allowance for credit losses include loan specific factors such as DSCR, LTV, remaining loan term, property type and others. In certain instances, for loans with unique risk characteristics, we may instead elect to employ different methods to estimate loan losses that also conform to ASU 2016-13 and related guidance.
Allowance for credit losses related to off-balance sheet future funding commitments is recorded as a component of other liabilities. Changes in the provision for credit losses for both the assets and their related unfunded commitments are recognized through net income on the consolidated statements of comprehensive income (loss). The following table presents the components of (provision for) benefit from (provision for) credit losses for the year ended December 31, 2021,2023, and 2020:December 31, 2022:
| | Year Ended December 31, |
| Year Ended December 31, | |
| Year Ended December 31, | |
| Year Ended December 31, | |
| (in thousands) | (in thousands) | 2021 | | | 2020 | |
| Benefit from (provision for) credit losses on: | | | | | |
| (in thousands) | |
| (in thousands) | |
| (Provision for) benefit from credit losses on: | |
| (Provision for) benefit from credit losses on: | |
| (Provision for) benefit from credit losses on: | |
| Loans held-for-investment | |
| Loans held-for-investment | |
| Loans held-for-investment | Loans held-for-investment | $ | 16,029 | | | | $ | (49,975) | | |
| | Other liabilities | Other liabilities | 3,998 | | | | (3,735) | | |
| Total benefit from (provision for) credit losses | $ | 20,027 | | | | $ | (53,710) | | |
| | Other liabilities | |
| | Other liabilities | |
| Recoveries of amounts previously written off | |
| Recoveries of amounts previously written off | |
| Recoveries of amounts previously written off | |
| Total (provision for) benefit from credit losses | |
| Total (provision for) benefit from credit losses | |
| Total (provision for) benefit from credit losses | |
During the year ended December 31, 2021,2023, we recorded a benefit from the provision for credit losses of $20.0$(104.8) million including a $(9.7)as compared to $(69.3) million realized loss on a write-off of a loan held-for-investment.during the year ended December 31, 2022. The decreaseincrease in our estimate of allowancethe provision for credit losses was primarily driven by the loan write-off, improved macroeconomic forecasts employed in our loss estimation model and overall market conditions, and the changes in the composition of our investment portfolio as a result of loan repayments, partially offset byrecording an increase in the provision related toallowance for certain collateral-dependent loans during the reserve onyear ended December 31, 2023, that were individually assessed in accordance with ASU 2016-13. The collateral properties securing these loans have been significantly impacted by an increasingly uncertain macroeconomic outlook including weakening in credit fundamentals; global market volatility; reduced liquidity in the capital markets, especially for certain property types, such as office assets located in underperforming markets; and meaningfully higher interest rates. These macroeconomic factors, along with uncertainty derived from the geopolitical environment, have resulted in slowing of business plan execution and reduced market liquidity, thereby impacting the borrowers’ ability to either sell or refinance their properties to repay the Company’s loans.
Gain (Loss) on Extinguishment of Debt
OnGains on extinguishment of debt for the year ended December 9, 2021, we prepaid $75.031, 2023, were $0.2 million mainly due to the redemption of borrowings under the GPMT 2019-FL2 CRE CLO, partially offset by the termination of the Wells Fargo repurchase facility, compared to losses on extinguishment of debt for the year ended December 31, 2022 of $(18.8) million related to repayments of the term financing facility and senior secured term loan facilities, resulting in a total payment of approximately $79.9 million, inclusive offacilities.
Revenue from REO Operations
During the principal amount, prepayment penalty and accrued interest. As a result of this repayment, the Company realized a charge on early extinguishment of debt of approximately $(8.9) million, or $(0.17) per share, comprised of the prepayment penalty and a pro-rata charge-off of unamortized discount including transaction costs.
Subsequent toyear ended December 31, 2021, on February 16, 2022,2023, we prepaid an additional $50.0 millionrecorded revenue from REO operations of borrowings under$2.6 million. No revenue from REO operations was generated during the senior secured term loan facilities, resulting in a total payment of approximately $53.0 million, inclusive of the principal amount, prepayment penalty and accrued interest. As a result of this repayment, we realized a charge on early extinguishment of debt of approximately $(5.8) million, or $(0.11) per share, comprised of the prepayment penalty and a pro-rata charge-off of unamortized discount including transaction costs.
year ended December 31, 2022.Expenses
The following table presents the components of expenses for the year ended December 31, 2021,2023, and 2020:December 31, 2022: | | | | | | | | | | | | | | | |
| | | Year Ended |
| | | December 31, |
| (in thousands, except share data) | | | | | 2021 | | 2020 |
| Base management fees | | | | | $ | — | | | $ | 15,786 | |
| Compensation and benefits | | | | | $ | 21,464 | | | $ | 13,268 | |
| Servicing expenses | | | | | $ | 5,173 | | | $ | 4,056 | |
| Restructuring charges | | | | | $ | — | | | $ | 46,252 | |
| | | | | | | |
| | | | | | | |
| | | | | | | |
| | | | | | | |
| | | | | | | |
| | | | | | | |
| Other operating expenses | | | | | $ | 8,634 | | | $ | 15,756 | |
| Annualized operating expense ratio (excl. restructuring charges) | | | | | 3.7 | % | | 5.1 | % |
| | | | | | | | | | | | | | | |
| | | Year Ended December 31, | | Year Ended December 31, |
| (dollars in thousands) | | | | | 2023 | | 2022 |
| | | | | | | |
| Compensation and benefits | | | | | $ | 21,711 | | | $ | 20,225 | |
| Servicing expenses | | | | | 5,313 | | | 5,718 | |
| | | | | | | |
| | | | | | | |
| | | | | | | |
| | | | | | | |
| | | | | | | |
| | | | | | | |
| | | | | | | |
| Expenses from real estate owned operations | | | | | 5,977 | | | — | |
| Other operating expenses | | | | | 10,289 | | | 10,754 | |
| Total operating expenses | | | | | $ | 43,290 | | | $ | 36,697 | |
| Annualized total operating expense ratio, excluding expenses from real estate owned operations | | | | | 4.0 | % | | 3.5 | % |
| Annualized core operating expense ratio (excluding non-cash equity compensation and expenses from real estate owned operations) | | | | | 3.3 | % | | 2.8 | % |
Prior to the Internalization, we paid the Former Manager a base management feeOur operating expenses include compensation and when applicable, an incentive fee. The base management fee was calculated based on our equity with certain adjustments outlined in the Management Agreement. The incentive fee was calculated based on historical “core earnings,” as defined in the Management Agreement, as well as our equity with certain adjustments outlined in the Management Agreement. Following the Internalization, we no longer incur management or incentive fees, but we incur expenses associated with being an internally managed REIT, including compensation expenses previously borne by the Former Manager.
We also incur servicingbenefits costs, expenses related to the servicing of commercial real estate loansour loan portfolio, expenses from REO operations and other operating expenses. The increaseOur total operating expenses increased from $36.7 million to $43.3 million, driven mainly by the acquisition of REO in servicing expenses2023. Our operating expense ratio, excluding REO, increased during the year ended December 31, 2021,2023, as compared to the same period in 2020, was primarily due to increased loan originations and increased CRE CLO trust fees incurred in 2021. The decrease in our operating expense ratio, adjusted for restructuring charges, during the year ended December 31, 2021, as compared2022, mainly due to the same period in 2020, resulted primarily from the lack of management fees as a result of the Internalizationhigher compensation and benefits expenses and lower other operating expenses partially offset by an increase in expenses related to the compensation and infrastructure to support the operation and growth of our business and servicing fees.
For the year ended December 31, 2020, included in other operating expenses are direct and allocated costs incurred by the Former Manager on our behalf and reimbursed by us, including compensation paid to certain employees of the Former Manager. Also included in other operating expenses is compensation paid directly to certain of our executive officers pursuant to the terms of the employment agreements entered into with such executive officers in connection with the Internalization.average equity.
Financial Condition
As of December 31, 2021,2023, our borrowings consisted of repurchase agreement facilities collateralized by a portion of our loans held-for-investment and REO, securitized debt obligations issued by CRE CLOs collateralized by pools of our loans held-for-investment and a term financingsecured credit facility collateralized by loans held-for-investment, an asset-specific financing facility collateralized by loans held-for-investment, long-term senior secured term loan facilities and long-term unsecured convertible senior notes.held-for-investment.
As of December 31, 2021,2023, we had outstanding $677.3 million$0.9 billion of repurchase agreement facility borrowings, and the term to maturity ranged from 179180 days to approximately 1.51.6 years. Our repurchase agreement facilities had a weighted average borrowing rate of 2.15%8.8% and weighted average remaining maturities of 0.781.2 years as of December 31, 2021.2023.
As of December 31, 2021,2023, we had outstanding $1.7$1.0 billion of securitized debt obligations with a weighted average borrowing rate of 1.8%7.2% and weighted average estimated remaining maturities of 1.20.7 years based on the maturities of the underlying loan collateral.
As of December 31, 2021,2023, we had outstanding $43.6$84.0 million of asset-specific financingsecured credit facility borrowings with a weighted average borrowing rate of 1.8%11.9% and weighted average estimated remaining maturitiesa term to maturity of 0.94 years based on the maturities of the underlying collateral.
As of December 31, 2021, we had outstanding $127.1 million of term loan financing facility borrowings with a weighted average borrowing rate of 3.7% and weighted average estimated remaining maturities of 3.12.0 years.
As of December 31, 2021, the total outstanding amount due on the senior secured term loan facilities was $150.0 million, with a carrying value of $139.9 million net of deferred issuance costs. Interest on the outstanding loans under the term loan facilities is payable quarterly in arrears and accrues at the rate of (i) 8.00% per annum for any period for which accrued interest is paid in cash or (ii) 9.00% per annum for any period for which the borrowers elect to pay up to 50% of accrued interest in kind by adding such interest to the principal amount of the loans. The term loan facilities will mature on September 25, 2025.
As of December 31, 2021, the total outstanding amount due on convertible senior notes was $272.9 million, net of deferred issuance costs. The notes are unsecured and pay interest semiannually at a rate of 5.625% per annum on the notes maturing in December 2022 and a rate of 6.375% per annum on the notes maturing in October 2023. As of December 31, 2021, these notes had a conversion rate of 51.9943 and 50.0894shares of common stock per $1,000 principal amount of the notes, respectively.
As of December 31, 2021,2023, the debt-to-equity ratio, with respect to our loans held-for-investment, defined as total debt, net of cash, divided by equity, was 2.7:2.1:1.0.
GAAP to Estimated Taxable Income
The following tables provide reconciliations of our GAAP net income (loss) to our estimated taxable income (loss) split between our REIT and taxable REIT subsidiaries for the yearyears ended December 31, 2021,2023, and December 31, 2020:2022:
| | Year Ended December 31, 2021 |
| (dollars in millions) | TRS | | REIT | | Consolidated |
| GAAP net income, pre-tax | $ | — | | | $ | 68.5 | | | $ | 68.5 | |
| Year Ended December 31, 2023 | | | Year Ended December 31, 2023 |
| (in millions) | | (in millions) | TRS | | REIT | | Consolidated |
| GAAP net (loss), pre-tax | |
| | Permanent differences | Permanent differences | |
| | Permanent differences | |
| | Permanent differences | |
| | Other permanent differences | |
| | Other permanent differences | |
| | Other permanent differences | Other permanent differences | — | | | (1.9) | | | (1.9) | |
| Temporary differences | Temporary differences | |
| Net accretion of OID and market discount | Net accretion of OID and market discount | — | | | (3.8) | | | (3.8) | |
| Income from significant modifications | — | | | 0.3 | | | 0.3 | |
| Net accretion of OID and market discount | |
| Net accretion of OID and market discount | |
| | | Credit loss impairment | |
| | Credit loss impairment | |
| | Credit loss impairment | |
| Other temporary differences | Other temporary differences | 0.3 | | | (16.5) | | | (16.2) | |
| | Estimated taxable income | Estimated taxable income | 0.3 | | | 46.6 | | | 46.9 | |
| | Estimated taxable income | |
| | Estimated taxable income | |
| | Dividend declaration deduction | |
| Dividend declaration deduction | |
| Dividend declaration deduction | Dividend declaration deduction | — | | | (46.6) | | | (46.6) | |
| Estimated taxable income post-dividend deduction | Estimated taxable income post-dividend deduction | $ | 0.3 | | | $ | — | | | $ | 0.3 | |
| | Year Ended December 31, 2020 |
| (dollars in millions) | TRS | | REIT | | Consolidated |
| GAAP net income, pre-tax | $ | — | | | $ | 70.2 | | | $ | 70.2 | |
| Year Ended December 31, 2022 | | | Year Ended December 31, 2022 |
| (in millions) | | (in millions) | TRS | | REIT | | Consolidated |
| GAAP net (loss), pre-tax | |
| | Permanent differences | Permanent differences | |
| | Permanent differences | |
| | Permanent differences | |
| | Other permanent differences | |
| | Other permanent differences | |
| | Other permanent differences | Other permanent differences | — | | | (0.7) | | | (0.7) | |
| Temporary differences | Temporary differences | |
| Net accretion of OID and market discount | Net accretion of OID and market discount | — | | | 1.6 | | | 1.6 | |
| Net accretion of OID and market discount | |
| Net accretion of OID and market discount | |
| Income from significant modifications | Income from significant modifications | — | | | 1.7 | | | 1.7 | |
| | Net realized losses on sale of loans | |
| Credit loss impairment | |
| Other temporary differences | Other temporary differences | — | | | 4.6 | | | 4.6 | |
| | Estimated taxable income | Estimated taxable income | — | | | 77.4 | | | 77.4 | |
| | Estimated taxable income | |
| | Estimated taxable income | |
| | Dividend declaration deduction | |
| Dividend declaration deduction | |
| Dividend declaration deduction | Dividend declaration deduction | — | | | (77.4) | | | (77.4) | |
| Estimated taxable income post-dividend deduction | Estimated taxable income post-dividend deduction | $ | — | | | $ | — | | | $ | — | |
The permanent tax differences recorded in 20212023 and 20202022 were principally related to recurring differences in compensation expense related to restricted stock dividends. Temporary differences were principally timing differences between GAAP and tax accounting related to restructuring charges, provision for credit losses and amendments to loans treated as “significant modifications” for tax under applicable Treasury regulations.
Dividends
For the year ended December 31, 2021,2023, we declared dividends on our common stock totaling $1.00$0.80 per share. As a REIT, we are required to distribute at least 90% of our taxable income to stockholders, subject to certain distribution requirements. We plan to satisfy the REIT distribution requirements for the year ended December 31, 2021, in part with dividends paid in 2022. Furthermore, if we distribute less than the sum of: (a) 85% of our ordinary income for the calendar year; (b) 95% of our capital gain net income for the calendar year; and (c) any undistributed shortfall from our prior calendar year, or the Required Distribution, to our stockholders during any calendar year (including any distributions declared by the last day of the calendar year but paid in January of the subsequent year), then we are required to pay non-deductible excise tax equal to 4% of any shortfall between the Required Distribution and the amount that was actually distributed. AnyCash dividends cannot be paid on our common stock unless we have paid full cumulative dividends on all classes of these taxes would decrease cash available for distribution to our stockholders. Forpreferred stock. We have paid full cumulative dividends on all classes of our preferred stock from the year endedrespective dates of issuance through December 31, 2021, we accrued an excise tax2023.
The following table presents cash dividends declared on our common stock since 2019:2022:
| | | | | | | | | | | | | | | | | | | | |
| Declaration Date | | Record Date | | Payment Date | | Cash Dividend Per Share |
| | | | | | |
20212023 | | | | | | |
December 16, 202119, 2023 | | December 31, 202129, 2023 | | January 18, 16, 2024 | | $ | 0.20 | |
| September 20, 2023 | | October 2, 2023 | | October 16, 2023 | | $ | 0.20 | |
| June 22, 2023 | | July 3, 2023 | | July 17, 2023 | | $ | 0.20 | |
| March 16, 2023 | | April 3, 2023 | | April 17, 2023 | | $ | 0.20 | |
| | | | | | $ | 0.80 | |
| 2022 | | | | | | |
| December 20, 2022 | | December 30, 2022 | | January 17, 2023 | | $ | 0.20 | |
| September 20, 2022 | | October 3, 2022 | | October 17, 2022 | | $ | 0.25 | |
SeptemberJune 16, 2022 | | July 1, 2022 | | July 15, 20212022 | | October 1, 2021 | | October 19, 2021 | | $ | 0.25 | |
JuneMarch 17, 2022 | | April 1, 2022 | | April 15, 20212022 | | July 1, 2021 | | July 19, 2021 | | $ | 0.25 | |
| March 18, 2021 | | April 1, 2021 | | April 19, 2021 | $ | 0.250.95 | |
| | | | | | | $1.00 | |
| 2020 | | | | | |
| December 18, 2020 | | December 31, 2020 | | January 22, 2021 | | $0.25 | |
| December 18, 2020 | | December 31, 2020 | | January 22, 2021 | | $0.20 | |
| September 28, 2020 | | October 8, 2020 | | October 19, 2020 | | $0.20 | |
| | | | | | |
| | | | | | |
| | | | | | | $0.65 | |
| 2019 | | | | | |
| December 18, 2019 | | December 31, 2019 | | January 17, 2020 | | $0.42 | |
| September 18, 2019 | | October 3, 2019 | | October 18, 2019 | | $0.42 | |
| June 20, 2019 | | July 5, 2019 | | July 19, 2019 | | $0.42 | |
| March 20, 2019 | | April 1, 2019 | | April 18, 2019 | | $0.42 | |
| | | | | | | $1.68 | |
| | | | | | |
| | | | | | |
| | | | | | |
| | | | | | |
| | | | | | |
| | | | | | |
| | | | | | |
| | | | | | |
| | | | | | |
| | | | | | |
The following table summarizes dividends declared since 20192022 and their related tax characterization (per share amounts):
| | | | | | | | | | | | | | | | | | | | | | | | | | | | | | | | | | |
| | | | | | Tax Characterization of Dividends |
| Year Ended December 31, | | Dividends Declared | | Adjustments (1) | | Ordinary Dividends (Non-Qualified) (2) | | Qualified Ordinary Dividends | | Capital Gain Distribution | | |
| 2021 | | $ | 1.00 | | | $ | — | | | $ | 0.99 | | | $ | 0.01 | | | $ | — | | | |
| 2020 | | $ | 0.65 | | | $ | 0.09 | | | $ | 0.74 | | | $ | — | | | $ | — | | | |
| 2019 | | $ | 1.68 | | | $ | (0.09) | | | $ | 1.59 | | | $ | — | | | $ | — | | | |
| | | | | | | | | | | | |
| | | | | | | | | | | | |
| | | | | | | | | | | | | | | | | | | | | | | | | | | | | | | | | | | | | | |
| | | | | | Tax Characterization of Dividends |
| Year Ended December 31, | | Dividends Declared | | Adjustments (1) | | Ordinary Dividends (Non-Qualified) (2) | | Qualified Ordinary Dividends | | Capital Gain Distribution | | Nondividend Distributions (3) |
| 2023 | | $ | 0.80 | | | $ | — | | | $ | — | | | $ | — | | | $ | — | | | $ | 0.80 | |
| 2022 | | $ | 0.95 | | | $ | (0.20) | | | $ | 0.08 | | | $ | 0.01 | | | $ | — | | | $ | 0.66 | |
| | | | | | | | | | | | |
| | | | | | | | | | | | |
| | | | | | | | | | | | |
| | | | | | | | | | | | |
____________________
(1)A portion of theThe dividend declared in the fourth quarter of 20192022 and paid in the first quarter of 20202023 was treated as a 20202023 distribution for federal income tax purposes. The dividend declared in the fourth quarter of 2023 and paid in the first quarter of 2024 was treated as a 2024 dividend for federal tax purposes.
(2)Beginning with the year ended December 31, 2018, and subsequent years, ordinary dividends (non-qualified) are also the portion of dividends that may be eligible for the 20% qualified business income deduction under Internal Revenue Code Section 199A.
Liquidity and Capital Resources
Capitalization
To date we have capitalized our business primarily through the issuance and sale of shares of our common and preferred stock, borrowings under our senior secured term loan facilities, secured financing facilities, issuance of CRE CLOs borrowings under our senior secured term loan facilities and the issuance and sale of convertible notes. As of December 31, 2021,2023, our capitalization included $0.4 billion of corporate debt and $2.5$2.0 billion of loan-level financing. No portionOur loan-level financing as of our corporate debt matures before December 2022 and our loan-level financing31, 2023, is generally term-matched or matures in 20222024 or later. Our $2.5later, and includes $0.9 billion of loan-level financing includes $677.3 million of secured repurchase agreements, $1.7$1.0 billion of CRE CLO securitizations, which are term-matched to the underlying assets, non-recourse and non-mark-to-market, $127.1and a $84.0 million of term financing facility and $43.6 million of asset-specific financingsecured credit facility.
See Note 4 -5 – Variable Interest Entities and Securitized Debt Obligations, Note 5 -6 – Secured Financing Agreements,and Note 6 -7 – Convertible Senior Notes and Note 7 - Senior Secured Term Loan Facilitiesto our Consolidated Financial Statements included in this Annual Report on Form 10-K for additional details regarding our securitized debt obligations;obligations, our secured repurchasefinancing facilities, asset-specific financing facility, and term financing facility; our secured convertible senior notes; and our senior secured term loan facilities,notes, respectively.
Leverage
From December 31, 2020,2022, to December 31, 2021,2023, our debt-to-equity ratio, defined as total debt, net of cash, divided by total equity, decreased from 3.2:2.3:1.0 to 2.7:1.0.2.1:1.0, mainly driven by a reduction in outstanding debt, partially offset by a reduction in total equity. As part of our investment strategy, we plan to finance our target assets with a moderate amount of leverage, the level of which may vary based upon the particular characteristics of our portfolio and market conditions. To that end, subject to maintaining our qualification as a REIT and our exclusion from registration under the Investment Company Act, we intend to use borrowings to fund the origination or acquisition of our target investments. Given our focus on senior floating-rate mortgage loans, we currently expect that such leverage will be, on a total debt-to-equity ratio basis, within a range of 3.0:1.0 and 3.5:1.0; however, our leverage may vary and differ from our expectations depending on market conditions and any steps we may take to strengthen our balance sheet and enhance our liquidity position. The amount of leverage we deploy for our target investments depends upon our assessment of a variety of factors, which may include the anticipated liquidity and price volatilityany changes
in value of the investments in our portfolio, the potential for losses in our portfolio, the gap between the durationmaturities of our assets and liabilities, the availability and cost of financing theour investments, our opinion of the creditworthiness of our financing counterparties, the health of the U.S. economy and commercial real estate financing markets, our outlook for the level and volatility of interest rates, the slope of the yield curve, the credit quality of our investments, the collateral underlying our investments and our outlook for investment credit spreads relative to LIBOR.SOFR.
Sources of Liquidity
Our primary sources of liquidity include cash and cash equivalents on our consolidated balance sheets, any approved but unused borrowing capacity under our financing facilities, the net proceeds of future public and private equity and debt offerings, payments of principal, including loan repayments and prepayments, loan sales, interest we receive on our portfolio of assets and cash generated from our operating results.
The following table sets forth our immediately available sources of liquidity as of December 31, 2021:2023:
| | | | | | | | |
| | | Year Ended
| (in thousands) | | December 31, 20212023 |
| Cash and cash equivalents | | $ | 191,931188,370 | |
| Approved but unused borrowing capacity on financing facilities | | — | |
| | |
| Total | | $ | 191,931188,370 | |
We have access to liquidity through public offerings of debt and equity securities.securities, subject to market conditions. To facilitate such offerings, in August 2021, we filed a shelf registration statement with the SEC that is effective for a term of three years and expires in August 2024. The amount of securities to be issued pursuant to this shelf registration statement was not specified when it was filed and there is no specific dollar limit on the amount of securities we may issue. The securities covered by this registration statement include: (i) common stock, (ii) preferred stock, (iii) depositary shares representing preferred stock and (iv) debt securities. The specifics of any future offerings, along with the use of proceeds of any securities offered, will be described in detail in a prospectus supplement, or other offering materials, at the time of any offering.
We may also access liquidity through our at-the-market stock offering program, pursuant to which we may sell, from time to time, up to 4,757,6364,157,916 additional shares of our common stock as of December 31, 2021.2023. See Note 12 – Stockholders’ Equity, to our Consolidated Financial Statements included in this Annual Report on Form 10-K for additional details.further detail.
Although we generally intend to hold our target investments as long-term investments, we have opportunistically sold, and may again in the future sell, certain of our assets in order to manage our liquidity needs, to meet other operating objectives and to adapt to market conditions. We cannot predict the timing and impact of future sales of our assets, if any. Since many of our
assets are financed with secured financing facilities and/or CRE CLOs, a significant portion of the proceeds from sales of our assets, prepayments and scheduled amortization would be used to repay balances under these financing arrangements.
We remain focused on actively managing our balance sheet and enhancing our liquidity position to best position us for the market environment, satisfy our loan future funding and financing obligations and to make new investments, which we expect will cause us to take, and in some instances has already caused us to take, some or all of the following actions: raise capital from offerings of equity and/or debt securities, on a public or private basis; borrow additional capital; post additional collateral; sell assets; and/or change our dividend policy, which we will continue to evaluate in respect of future quarters based upon customary considerations, including market conditions and distribution requirements to maintain our REIT status. At any given time and from time to time we may be evaluating or pursuing one or more transactions, including, but not limited to, loan sales, capital markets activities and other sources of funding, to improve our liquidity or to refinance our debt or may otherwise seek transactions to reduce our interest expense or leverage and extend our debt maturities, which transactions, depending on market conditions and other factors, could result in actual losses and/or otherwise negatively impact our results of operations in one or more periods.
Liquidity Needs
In addition to our loan origination activities and general operating expenses, our primary liquidity needs include interest and principal payments under our $3.0$2.0 billion of outstanding borrowings under our repurchase facilities, collateralized loan obligations, term financing facility, asset-specific financing facility, seniorCRE CLOs, and secured term loan facilities, and convertible senior notes, $403.6credit facility; $160.7 million of unfunded loan commitments,commitments; and dividend distributions to our preferred and common stockholders.
Financing Availability
We are subject to the availability and cost of financing to successfully execute on our business strategy and generate attractive risk-adjusted returns to our stockholders. Much of our financing is in the form of repurchase facilities or other types of credit facilities provided to us by our lender counterparties. We mitigate this counterparty risk by seeking to diversify our lending partners, focusing on establishing borrowing relationships with strong counterparties and continuously monitoring them through a thoughtful approach to counterparty risk oversight. Additionally, as part of our broader risk management strategy, and to the extent available in the market, we finance our business through other means which may include, but not be limited to, CRE CLOs, note sales and the issuance of unsecured debt and equity instruments. We continue to actively explore additional types of funding facilities in order to further diversify our financing sources. The COVID-19 pandemic hasInvestor concerns over inflation, rising interest
rates, slowing economic growth and geopolitical uncertainty have resulted in significant disruptions in financial markets and uncertainty about the overall macroeconomic outlook. Declines in economic conditions couldhave negatively impacted, and may continue to negatively impact, real estate fundamentals and real estate capital markets, which could make it more difficult for us to obtain or maintain financing.
The following table provides the maturities of our repurchase facilities, asset-specific financing facility, term financingsecured credit facility, securitized debt obligations, long-term senior secured term loan facilities and convertible senior notes, net of deferred debt issuance costs, as of December 31, 2021,2023, and December 31, 2020:2022:
| | | | | | | | | | | |
| (in thousands) | December 31,
2021 | | December 31,
2020 |
| Within one year | $ | 1,530,671 | | | $ | 1,763,359 | |
| One to three years | 1,096,112 | | | 1,266,985 | |
| Three to five years | 311,710 | | | 205,647 | |
| Five years and over | — | | | — | |
| Total | $ | 2,938,493 | | | $ | 3,235,991 | |
| | | | | | | | | | | |
| (in thousands) | December 31,
2023 | | December 31,
2022 |
| Within one year | $ | 988,716 | | | $ | 1,338,194 | |
| One to three years | 962,424 | | | 1,091,952 | |
| Three to five years | — | | | — | |
| Five years and over | — | | | — | |
| Total | $ | 1,951,140 | | | $ | 2,430,146 | |
Cash Flows
FromFor the year ended December 31, 2020, to December 31, 2021,2023, our restricted and unrestricted cash and cash equivalents balance decreasedincreased approximately $124.9$59.1 million, to $204.3$199.2 million. The cash movements can be summarized by the following:
•Cash flows from operating activities. For the year ended December 31, 2021,2023, operating activities increased our cash balances by approximately $60.3$52.1 million, primarily driven by our financial results.net income after removing non-cash provision, and equity compensation.
•Cash flows from investing activities. For the year ended December 31, 2021,2023, investing activities increased our cash balances by approximately $139.8$561.4 million, primarily driven by repayments of loans held-for-investment, partially offset by originations of loans held-for-investment.
•Cash flows from financing activities. For the year ended December 31, 2021,2023, financing activities decreased our cash balances by approximately $325.0$554.5 million, primarily driven by repaymentsthe refinance of repurchase facilities, securitized debt obligations, asset-specific financings and term financing facilities,the collateral loans held in the GPMT 2019-FL2 CRE CLO, partially offset by proceeds fromprincipal payments on repurchase agreements, the issuance of securitized debt obligations, proceeds from the term financing facility and issuance of preferred stock.
Corporate Activities
Senior Secured Term Loan Facilities Paydown
On September 25, 2020, we, as a guarantor, and certain of our subsidiaries, as borrowers, entered into a five-year senior secured term loan credit agreement with certain investment vehicles managed by Pacific Investment Management Company LLC, or PIMCO, providing for up to $300.0 million of senior secured term loan facilities. On September 28, 2020, we borrowed $225.0 million under the initial term loan facility. We chose not to borrow the remaining $75.0 million of commitments under the senior secured term loan facilities, which were available to us on a delayed draw basis until September 25, 2021. Interest on the outstanding loans under the senior secured term loan facilities is payable quarterly in arrears and accrues at the rate of (i) 8.00% per annum for any period for which accrued interest is paid in cash or (ii) 9.00% per annum for any period for which the borrowers elect to pay up to 50% of accrued interest in kind by adding such interest to the principal amountredemption of the loans. The senior secured term loan facilities will mature on September 25, 2025.
The loans outstanding underGPMT 2019-FL2 CRE CLO, and the senior secured term loan facilities are non-amortizing and may be voluntarily repaid, in whole or in part, at any time, subject to certain prepayment premiums if they are repaid prior to September 25, 2023.
On December 9, 2021, we prepaid $75.0 million of borrowings under the senior secured term loan facilities, resulting in a total payment of approximately $79.9 million, inclusiveredemption of the principal amount, prepayment penalty and accrued interest. As a result of this repayment, we realized a charge on early extinguishment of debt of approximately $(8.9) million, or $(0.17) per share, comprised of the prepayment penalty and a pro-rata charge-off of unamortized discount including transaction costs.
Subsequent to December 31, 2021, on February 16, 2022, we prepaid an additional $50.0 million of borrowings under the senior secured term loan facilities, resulting in a total payment of approximately $53.0 million, inclusive of the principal amount, prepayment penalty and accrued interest. As a result of this repayment, we realized a charge on early extinguishment of debt of approximately $(5.8) million, or $(0.11) per basic share, comprised of the prepayment penalty and a pro-rata charge-off of unamortized discount including transaction costs.
Cash Settlement of Warrants to Purchase Shares of Common Stock
In connection with the senior secured term loan facilities, on September 25, 2020, we issued warrants to purchase up to 6.066 million shares of our common stock, $0.01 par value per share to certain investment vehicles managed by PIMCO.
On September 25, 2021, the warrantholders forfeited unvested warrants exercisable for 1,516,455 shares of common stock because we chose not to borrow the $75.0 million of delayed draw commitments available under the senior secured term loan facilities.
On September 30, 2021, we settled warrants to purchase approximately 1.06 million shares of common stock at an exercise price of $6.47 per share of common stock for a net cash amount of approximately $7.5 million. On October 4, 2021, we settled the remaining warrants to purchase approximately 3.49 million shares of common stock at an exercise price of $6.47 per share of common stock for a net cash amount of approximately $24.7 million. We currently have no warrants outstanding.
See Note 7 - Senior Secured Term Loan Facilities and Warrants to Purchase Shares of Common Stock to our Consolidated Financial Statements included in this Annual Report on Form 10-K for additional details regarding the senior secured term loan facilities and warrants.
Issuance of 7.00% Series A Fixed-to-Floating Rate Cumulative Redeemable Preferred Stock
On November 30, 2021, and December 10, 2021, we received total net proceeds of $110.5 million from the sale of 4,596,500 shares of Series A Preferred Stock, after deducting the underwriting discount of $3.6 million and issuance costs of $0.8 million.
On January 18, 2022, and February 8, 2022, we received total net proceeds of $87.4 million from the sale of 3,633,000 additional shares of our Series A Preferred Stock after deducting the underwriting discount of $2.9 million and issuance costs of $0.5 million. See Note 11 – Preferred Stock to our Consolidated Financial Statements included in this Annual Report on Form 10-K for additional details regarding our Series A Preferred Stock.10% cumulative preferred stock.
Critical Accounting Policies and Use of Estimates
The preparation of financial statements in accordance with GAAP requires us to make certain judgments and assumptions, based on information available at the time, of our preparation of the financial statements, in determining accounting estimates used in preparation of the statements. Our significant accounting policies are described in Note 2 – Basis of Presentation and Significant Accounting Policies to our Consolidated Financial Statements included in this Annual Report on Form 10-K. Our most critical accounting policies involve decisions and assessments that could affect our reported assets and liabilities, as well as itsour reported revenues and expenses. We believe that all of the decisions and assessments used to prepare our financial statements are based upon reasonable assumptions given the information available at that time. The accounting policies and estimates that we believe are most critical to a stockholder’s understanding of our financial results and condition are discussed below.
Loans Held-for-Investment and Provision for Credit Losses
Loans held-for-investment are reported at cost, net of any provision for credit losses, unamortized acquisition premiums or discounts, loan fees and origination costs, as applicable.
We adopted ASU 2016-13 on January 1, 2020, which replaced the incurred loss model under existing guidance with a CECL model for instruments measured at amortized cost, and requires entities to record allowances for AFS debt securities rather than reduce the carrying amount, as they did under the other-than-temporary impairment model. It also simplified the accounting model for purchased credit-impaired debt securities and loans. In addition, the new model applies to off-balance sheet credit exposures, such as unfunded loan commitments.
In connection with our adoption of ASU 2016-13, we implemented new processes, including the utilization of loan loss forecasting models, updates to our reserve policy documentation, changes to our internal reporting process and related internal controls. We have implemented loan loss forecasting models for estimating expected life-time credit losses, at the individual loan level, for our commercial mortgage loan portfolio. The CECL forecasting methods we use include (i) a probability of default and loss given default method using a third partythird-party CMBS/CRE loan database with historical loan loss data beginning in 1998 and (ii) probability weighted expected cash flow method, depending on the type of loan and the availability of relevant historical market loan loss data. We might use other acceptable alternative approaches in the future depending on, among other factors, the type of loan, underlying collateral and availability of relevant historical market loan loss data.
We estimate our CECL allowance for our loan portfolio at the individual loan level. Significant inputs to our forecasting methods include (i) key loan-specific inputs such as vintage year, loan-term, underlying property type, geographic location, and expected timing and amount of future loan fundings, (ii) performance against the underwritten business plan and our internal loan risk rating, and (iii) a macroeconomic forecast. In certain instances, we consider relevant loan-specific qualitative factors to certain loans to estimate our CECL allowance.
We consider loan investments that are both (i) expected to be substantially repaid through the operation or sale of the underlying collateral, and (ii) for which the borrower is experiencing financial difficulty, to be “collateral-dependent” loans. For such loans that we determine foreclosure of the collateral is probable, we measure the expected losses based on the difference between the fair value of the collateral and the amortized cost basis of the loan as of the measurement date. For collateral-dependent loans that we determine foreclosure is not probable, we apply a practical expedient to estimate expected losses using the difference between the collateral’s fair value (less costs to sell the asset if repayment is expected through the sale of the collateral) and the amortized cost basis of the loan. Our estimate of the fair value of the collateral property is sensitive to both the valuation methodology selected and inputs used in the analysis. As a result, the fair value of the collateral property used in determining the expected credit losses is subject to uncertainty and any actual losses, if incurred, could differ materially from the estimated provision for credit losses.
Our loans typically include commitments to fund incremental proceeds to our borrowers over the life of the loan. Those future funding commitments are also subject to a CECL reserve. The CECL reserve related to future loan fundings is recorded as a component of other liabilities on our consolidated balance sheets, and not as an offset to the related loan balance. This CECL reserve is estimated using the same process outlined above for our outstanding loan balances, and changes in this component of the CECL reserve will similarly flow through our consolidated statements of operations.
Credit performance of our portfolio is monitored regularly, with more intense analysis and oversight done on a quarterly basis, and each loan is evaluated by assessing the risk factors of each loan and assigning a risk rating based on a variety of factors. Risk ratings are defined as follows:
1 –Lower Risk
2 –Average Risk
See Note 3 –Acceptable Risk
4 –Loans Held-for-Investment, Net of Allowance for Credit Losses Higher Risk: A loan that has exhibited material deteriorationto our Consolidated Financial Statements included in cash flows and/or other credit factors which, if negative trends continue, could be indicative of probability of principal loss.
5 –Loss Likely: A loan that has a significantly increased probability of principal loss.this Annual Report on Form 10-K for additional details regarding our risk ratings.
Recently Issued Accounting Standards
Refer to Note 2 – Basis of Presentation and Significant Accounting Policies to our Consolidated Financial Statements included in this Annual Report on Form 10-K.
Inflation
VirtuallyNearly all of our assets and liabilities are interest rate sensitive in nature. As a result, interest rates and other factors typically influence our performance far more than inflation does. ChangesHowever, changes in interest rates do not necessarilymay correlate with inflation rates or changes in inflation rates. In response to the inflationary pressures, over the last couple of years the Federal Reserve has approved multiple increases to its federal funds rate target range. Our consolidated financial statements are prepared in accordance with GAAP and our distributions will be determined by our board of directors consistent with our obligation to distribute to our stockholders at least 90% of our REIT taxable income on an annual basis in order to maintain our REIT qualification; in each case, our activities and balance sheet are measured with reference to historical cost and/or fair market value without considering inflation.
Other Matters
We intend to conduct our business to maintain our exempt status under, and not to become regulated as, an investment company under the Investment Company Act. If we fail to maintain our exempt status under the Investment Company Act and become regulated as an investment company, our ability to, among other things, use leverage would be substantially reduced and, as a result, we would be unable to conduct our business as described in Item 1, “Business - Government Regulation” in Item 1of this Annual Report on Form 10-K. Accordingly, we monitor our compliance with both the 55% Test and the 80% Tests of the Investment Company Act in order to maintain our exempt status. As of December 31, 2021,2023, we determined that we maintained compliance with both the 55% Test and the 80% Test requirements.
We calculate that at least 75% of our assets were qualified REIT assets, as defined in the Code, for the year ended December 31, 2021.2023. We also calculate that our revenue qualifies for the 75% source of income test and for the 95% source of income test rules for the year ended December 31, 2021.2023. Consequently, we met the REIT income and asset tests. We also met all REIT requirements regarding the ownership of our common stock and the distribution of our net income. Therefore, for the year ended December 31, 2021,2023, we believe that we qualified as a REIT under the Code.
Changes to the tax laws are likely to occur, and we intend to continue to monitor such changes.
Item 7A. Quantitative and Qualitative Disclosures about Market Risk
We seek to manage our risks related to the credit quality of our investments, interest rates, liquidity and market value while, at the same time, seeking to generate attractive risk-adjusted returns to our stockholders. While we are exposed to certain types of market risk in our business, we seek to actively manage them using our risk management infrastructure and philosophy centered around quantifying and measuring various market risks on a continuous basis. We seek to be fairly compensated through the returns we earn on our investments for taking those risks and focus on maintaining liquidity and capital levels consistent with the risks to which we are exposed. However, many of those risks have been magnified by the continuing economic disruption and capital markets volatility resulting from the COVID-19 pandemic.inflation, rising interest rates, slowing economic growth and geopolitical uncertainty.
Recent Market Conditions
Due to the current COVID-19 pandemic in the United Statesmacroeconomic challenges driven by inflation, rising interest rates, slowing economic growth and globally,geopolitical uncertainty, most of our borrowers, sponsors, their tenants, the properties serving as collateral for our loan investments and the economy as a whole have been, and will likely continue to be, adversely affected. See “COVID-19 Pandemic”Macroeconomic Environment” in Part II, Item 7 of this Annual Report on Form 10-K for further discussion of the impact of the COVID-19 pandemic oncurrent market conditions.
Credit Risk
We are subject to varying degrees of credit risk in connection with holding a portfolio of our target investments. The performance and value of our investments depend upon the sponsors’ ability to operate the properties that serve as our collateral so that they produce cash flows adequate to pay interest and principal due to us. We seek to manage credit risk by performing deep fundamental credit analysis of our potential investments, as well as seeking to originate or acquire assets of higher quality at appropriate rates of return given anticipated and unanticipated losses, by employing a comprehensive review and selection process and by proactively monitoring our investments. Credit risk is also addressed through our ongoing review, and our investment portfolio is monitored for variance from underwritten and expected results on a monthly basis, with more intense analysis and oversight done on a quarterly basis. Nevertheless, unanticipated credit losses, including as a result of the COVID-19 pandemic,inflation, rising interest rates, slowing economic growth and geopolitical uncertainty, could occur thatand could adversely impact our operating results.
We employ a long-term, fundamental value-oriented investment strategy and we aim to, on a loan-by-loan basis, construct an investment portfolio that is well-diversified across property types, geographies and sponsors. However, any potential negative impacts on our business as a result of the COVID-19 pandemic may be heightened by the fact that we are not required to observe specific diversification criteria, which means that our investments may be relatively concentrated in certain property types, geographical areas or loan categories that may be more adversely affected by the pandemic than others. For example, certain of our loans are secured by office, industrial, multifamily, hotel and retail properties. Changes in how certain types of commercial properties are operated to facilitate social distancing and other measures intended to control the impact of the pandemic have impacted, and are likely to continue to impact, our investments secured by these properties.
The COVID-19 pandemic has significantly impacted the commercial real estate markets, causing reduced occupancy, requests from tenants for rent deferrals or abatement and delays in capital improvements on projects currently planned or underway. These negative conditions may persist into the future and impair our borrowers’ ability to pay principal and interest due to us under our loan agreements. We maintain an active dialogue and strong relationships with our borrowers as part of our overall asset management strategy. Through our asset management process, we focus on addressing potential impacts ofstrategy to maximize the COVID-19 pandemic on our loans secured by properties experiencing cash flow strains. Certainperformance of our borrowers have indicated that due to the impactportfolio, including during periods of COVID-19 pandemic they will be unable to timely execute their business plans, have had to temporarily close their businesses or have experienced other business challenges. As a result, they have requested, and in certain instances we have granted, temporary deferrals of interest payments or forbearance, or other modifications of their loans. Discussions we have had with our borrowers have addressed potential near-term loan modifications including repurposing of funds in certain reserve accounts, temporary deferrals of interest or performance tests and certain covenant waivers on loans collateralized by properties impacted by the COVID-19 pandemic.volatility. While we generally believe that the principal amount of our loans is typically sufficiently protected by the underlying collateral value, there is a risk that we will not realize the entire principal amount of certain of our loan investments.
Interest Rate Risk
Our primary strategy is to primarily originate, invest in and manage a portfolio of senior floating-rate commercial mortgage loans. As a result, the composition of our investments in general is such that rising interest rates increase our net income, while declining interest rates will decrease our net income, subject to the impact of contractual interest rate floors. From time to time, we may originate or acquire fixed-rate investments, which may expose our operating results to the risks posed by fluctuations in interest rates, which we may choose to hedge, if we deem it prudent.
In response to inflationary pressures, the Federal Reserve raised benchmark overnight interest rates on multiple occasions in 2022 and 2023. These increases in interest rates have increased, and may continue to increase, our interest expense, which may not be fully offset by any increases in interest income. In addition, these increases have increased borrowers’ interest payments, adversely affected commercial real estate property values and, for certain of our borrowers have contributed, and may continue to contribute, to loan non-performance, modifications, defaults, foreclosures and/or property sales, which could result in us realizing losses on our investments. Although the Federal Reserve has indicated that no further interest rate increases are expected in 2024, how long interest rates will remain at their current levels and the direction and extent of any future rate changes remain uncertain.
As of December 31, 2021,2023, approximately 98.8%98.3% of our portfolio by carrying valueprincipal balance earned a floating rate of interest. The remaining approximately 1.2%1.7% of our portfolio earned a fixed rate of interest. If interest rates were to decline, the value of these fixed-rate investments may increase, and if interest rates were to increase, the value of these fixed-rate investments may fall; however, the interest income generated by these investments would not be affected by fluctuations in market interest rates. The interest rates we pay under our current repurchasesecured financing facilities asset-specific financing facility, term financing facility and CRE CLOs are primarily floating rate, which generally, and with limited exceptions, are not subject to contractual interest rate floors. Accordingly, our interest expense generally increases as interest rates increase and decreases as interest rates decrease.
Our analysis of risks is based on our experience, estimates models and assumptions. These analyses rely on models which utilize estimates of fair value and interest rate sensitivity. Actual economic conditions or our implementation of decisions may produce results that differ significantly from the estimates and assumptions used in our models.analyses.
The information presented in the following interest rate sensitivity table projects the potential impact of sudden parallel changes in interest rates on our financial results and financial condition over the next 12 months, based on our interest sensitive financial instruments at December 31, 2021.2023. All changes in value are measured as the change from our December 31, 20212023, financial position. All projected changes in annualized net interest income are measured as the change from our projected annualized net interest income based off current performance returns. Actual results of changes in annualized net interest income may differ from the information presented in the sensitivity table below due to differences between the dates of actual interest rate resets in our loan investments and our floating rate interest-bearing liabilities, and the dates as of which the analysis was performed.
| | | | | | | | | | | | | | | | | | | | | | | |
| Changes in Interest Rates (1) |
| (in thousands) | -100 bps | | -50 bps | | +50 bps | | +100 bps |
| Change in value of financial position: | | | | | | | |
| Loans held-for-investment | $ | 4 | | | $ | 4 | | | $ | (184) | | | $ | (436) | |
| | | | | | | |
| | | | | | | |
| Repurchase facilities | (24) | | | (24) | | | 141 | | | 282 | |
| Securitized debt obligations | (73) | | | (73) | | | 351 | | | 702 | |
| Asset-specific financings | (2) | | | (2) | | | 9 | | | 18 | |
| Term financing facility | (5) | | | (5) | | | 27 | | | 54 | |
| Convertible senior notes | (3,167) | | | (1,576) | | | 1,560 | | | 3,104 | |
| Total net assets | $ | (3,267) | | | $ | (1,676) | | | $ | 1,904 | | | $ | 3,724 | |
| | | | | | | |
| -100 bps | | -50 bps | | +50 bps | | +100 bps |
| Change in annualized net interest income: | $ | 2,286 | | | $ | 2,286 | | | $ | (8,316) | | | $ | (15,313) | |
____________________
(1)Changes in interest rates were limited to a decrease in rate to zero percent.
| | | | | | | | | | | | | | | | | | | | | | | |
| Changes in Interest Rates |
| (in thousands) | -100 bps | | -50 bps | | +50 bps | | +100 bps |
| Change in value of financial position: | | | | | | | |
| Loans held-for-investment | $ | 1,028 | | | $ | 514 | | | $ | (530) | | | $ | (1,059) | |
| | | | | | | |
| | | | | | | |
| Repurchase facilities | (365) | | | (182) | | | 182 | | | 365 | |
| Securitized debt obligations | (414) | | | (207) | | | 207 | | | 414 | |
| | | | | | | |
| | | | | | | |
| Secured financing facility | (35) | | | (18) | | | 18 | | | 35 | |
| Total net assets | $ | 214 | | | $ | 107 | | | $ | (123) | | | $ | (245) | |
| | | | | | | |
| -100 bps | | -50 bps | | +50 bps | | +100 bps |
| Change in annualized net interest income: | $ | (2,662) | | | $ | (1,331) | | | $ | 1,331 | | | $ | 2,662 | |
The interest rate sensitivity table quantifies the potential changes in annualized net interest income and portfolio value, should interest rates immediately change. The interest rate sensitivity table presents the estimated impact of interest rates instantaneously rising 50 and 100 basis points, and falling 50 and 100 basis points. The cash flows associated with the portfolio for each rate change are calculated based on assumptions including yield on future originations and acquisitions, slope of the yield curvewith respect to interest rates and size of the portfolio. Assumptions made on the interest rate sensitive liabilities include anticipated interest rates, collateral requirements as a percentage of borrowings and amount and term of borrowing.
Certain assumptions have been made in connection with the calculation of the information set forth in the foregoing interest rate sensitivity table and, as such, there can be no assurance that assumed events will occur or that other events will not occur that would affect the outcomes. The base interest rate scenario assumes interest rates at December 31, 2021.2023. The analysis utilizes assumptions and estimates based on management’s judgment and experience. Furthermore, while we generally expect to retain such assets and the associated interest rate risk to maturity, future originations, acquisitions and sales of assets could materially change our interest rate risk profile.
The information set forth in the interest rate sensitivity table above and all related disclosures constitutes forward-looking statements within the meaning of Section 27A of the Securities Act and Section 21E of the Exchange Act. Actual results could differ significantly from those estimated in the foregoing interest rate sensitivity table.
Market Value Risk
We intend to hold our target investments for the long-term and, as such, they are carried at an amortized cost on our consolidated balance sheets. However, we may occasionally classify some of our investments as AFS. Investments classified as AFS are carried at their fair value, with changes in fair value recorded through accumulated other comprehensive income, (loss), a component of stockholders’ equity, rather than through earnings. The estimated fair value of such investments may fluctuate primarily due to changes in interest rates, overall market environment and liquidity and other factors. As market volatility increases or liquidity decreases, the market value of the investments may be adversely impacted. We do not intend to hold any of our investments for trading purposes.
Borrower Performance
In addition to the risks related to fluctuations in cash flows and investment values associated with movements in interest rates, there is also the risk of borrower non-performance on our floating-rate investments. If interest rates were to significantly rise, it is possible that the increased debt service costs may negatively impact operating cash flows on properties securing our commercial real estate loan investments, resulting in potential non-performance of our borrowers or, in severe cases, default. This risk is partially mitigated by various factors we consider during our rigorous underwriting and loan structuring process, which in certain cases include a requirement for our borrower to purchase an interest rate cap contract.
Capital Markets Risk
As a REIT, we are required to distribute a significant portion of our taxable income annually, which constrains our ability to accumulate significant operating cash flow and therefore requires us to utilize capital markets, both debt and equity, to finance our business. As a result, we are exposed to risks related to the equity capital markets and our related ability to raise capital
through the issuance of our common stock or other equity instruments. We are also exposed to risks related to the debt capital markets, and our related ability to finance our business through borrowings under credit facilities or other debt instruments, such as securitizations or unsecured debt. We seek to mitigate these risks by monitoring the debt and equity capital markets to inform our decisions on the amount, timing and terms of capital we raise.
Various factors, such as rising interest rates, high inflation, supply chain disruptions, growing geopolitical tensions and increased volatility in public equity and fixed income markets have led to increased cost and decreased availability of capital, which may adversely impact the ability of commercial property owners to service their debt obligations and refinance their loans as they mature and/or our ability to access capital markets.
Real Estate Risk
Our business strategy focuses on commercial real estate related debt investments. As a result, we will be exposed to the risks generally associated with the commercial real estate market, including occupancy rates, capitalization rates, absorption rates and other macroeconomic factors beyond our control, including, but not limited to, the impacts of the COVID-19 pandemic discussed above.control.
Additionally, commercial real estate debt investments may be affected by a number of factors, including international, national, regional and local economic and real estate conditions, changes in business trends of specific industry segments, property construction characteristics, demographic factors and changes to laws and regulations, including additional restrictions or requirements on the development of commercial real estate intended to reduce greenhouse gas emissions and potential climate change. Any combination of these factors may affect the value of real estate collateral for investments within our investment portfolio and the potential proceeds available to a borrower to repay the underlying loans, which could cause us to suffer losses. We seek to manage these risks through our rigorous and fundamentally driven underwriting and investment management processes.
Liquidity Risk
Our liquidity risk is principally associated with our financing of longer-maturity investments with shorter-term borrowings, such as repurchase facilities, an asset-specific financing facility and a term loan facility.facilities. Should the value of our investments serving as collateral for our repurchase facilities significantly decrease, including, but not limited to, as a result of the impacts of the COVID-19 pandemic discussed above, our lenders may exercise their margin call rights, causing an adverse change in our liquidity position. If we fail to resolve such margin calls when due, the lenders may exercise their rights under such
repurchase facilities, including requiring payment by us of our aggregate outstanding financing obligations and/or taking ownership of the loans securing such obligations, potentially on an unfinanced basis, thereby reducing our available liquidity. Additionally, if one or more of our repurchase facilities or asset-specific financing facility counterparties should choose not to provide ongoing funding, including with respect to future funding obligations on existing loans financed with such counterparties, which such risks are increased as a result of the COVID-19 pandemic and its effects on the global and U.S. economies and commercial real estate markets, our ability to finance our investments and related future funding obligations would possibly decline or exist at possibly less advantageous terms.
Extension Risk
We manage our assets based on a variety of assumptions and estimates, including among others, assumptions regarding the rate at which the borrowers will prepay our loans or extend. If prepayment rates decrease in a rising interest rate environment or extension options are exercised, the life of our loan investments could extend beyond the term of the secured financing agreements. The current macroeconomic, commercial real estate and capital markets disruptions caused by the COVID-19 pandemic have resulted in, and will likely continue to result in, a decrease in prepayment rates and an increase in the number of our borrowers who exercise loan extension options. In addition, higher interest rates imposed by the Federal Reserve to address inflationary pressures have led to, and may continue to lead to, a decrease in prepayment speeds and an increase in the number of our borrowers who exercise loan extension options. This could have a negative impact on our results of operations. In some situations, we may be forced to sell assets to maintain adequate liquidity, which could cause us to incur losses.
As part of our overall asset management strategy, we have in the past entered into, and may in the future enter into, loan modifications with some of our borrowers. These amendments may include, among other things, modifying or waiving certain performance or extension conditions as part of the overall agreement, which are often coupled with additional equity or other forms of credit support from the sponsor. We work closely with our lending counterparties when negotiating and entering into loan modifications with our borrowers to ensure we maintain financing on modified assets. There can be no assurance that going forward we will be able to maintain financing on modified loans.
Risk Management
To the extent consistent with maintaining our REIT qualification, we seek to manage risk exposure by closely monitoring our portfolio and actively managing the financing, interest rate, credit and other risks associated with holding a portfolio of our target investments. Generally, we:
•manage our portfolio with focus on diligent, investment-specific market review, enforcement of loan and security rights and timely execution of disposition strategies;
•actively employ portfolio-wide and investment-specific risk measurement and management processes in our daily operations, including utilizing risk management tools; and
•seek to manage credit risk through our rigorous underwriting due diligence process prior to origination or acquisition of our target investments, and through the use of nonrecourse financing when and where available and appropriate.
Item 8. Financial Statements and Supplementary Data
GRANITE POINT MORTGAGE TRUST INC.
INDEX TO CONSOLIDATED FINANCIAL STATEMENTS AND SCHEDULES
Report of Independent Registered Public Accounting Firm
To the Stockholders and the Board of Directors
of Granite Point Mortgage Trust Inc.
Opinion on the Financial Statements
We have audited the accompanying consolidated balance sheets of Granite Point Mortgage Trust Inc. (the Company) as of December 31, 20212023 and 2020,2022, the related consolidated statements of comprehensive (loss) income, (loss), stockholders’ equity and cash flows for each of the three years in the period ended December 31, 2021,2023, and the related notes and financial statement schedule listed in the Index at Item 15(a) (collectively referred to as the “consolidated financial statements”). In our opinion, the consolidated financial statements present fairly, in all material respects, the financial position of the Company at December 31, 20212023 and 2020,2022, and the results of its operations and its cash flows for each of the three years in the period ended December 31, 2021,2023, in conformity with U.S. generally accepted accounting principles.
We also have audited, in accordance with the standards of the Public Company Accounting Oversight Board (United States) (PCAOB), the Company’s internal control over financial reporting as of December 31, 2021,2023, based on criteria established in Internal Control-Integrated Framework issued by the Committee of Sponsoring Organizations of the Treadway Commission (2013 framework) and our report dated February 25, 2022March 1, 2024 expressed an unqualified opinion thereon.
Adoption of New Accounting Standard
As discussed in Note 2 to the consolidated financial statements, the Company changed its method for accounting for credit losses in 2020. As explained below, auditing the Company’s allowance for credit losses was a critical audit matter.
Basis for Opinion
These financial statements are the responsibility of the Company's management. Our responsibility is to express an opinion on the Company’s financial statements based on our audits. We are a public accounting firm registered with the PCAOB and are required to be independent with respect to the Company in accordance with the U.S. federal securities laws and the applicable rules and regulations of the Securities and Exchange Commission and the PCAOB.
We conducted our audits in accordance with the standards of the PCAOB. Those standards require that we plan and perform the audit to obtain reasonable assurance about whether the financial statements are free of material misstatement, whether due to error or fraud. Our audits included performing procedures to assess the risks of material misstatement of the financial statements, whether due to error or fraud, and performing procedures that respond to those risks. Such procedures included examining, on a test basis, evidence regarding the amounts and disclosures in the financial statements. Our audits also included evaluating the accounting principles used and significant estimates made by management, as well as evaluating the overall presentation of the financial statements. We believe that our audits provide a reasonable basis for our opinion.
Critical Audit Matter
The critical audit matter communicated below is a matter arising from the current period audit of the financial statements that was communicated or required to be communicated to the audit committee and that: (1) relates to accounts or disclosures that are material to the financial statements and (2) involved our especially challenging, subjective or complex judgments. The communication of the critical audit matter does not alter in any way our opinion on the consolidated financial statements, taken as a whole, and we are not, by communicating the critical audit matter below, providing a separate opinion on the critical audit matter or on the account or disclosures to which it relates.
| | | | | |
| Allowance for Credit Losses - Loans held-for-investment
|
| Description of the Matter | As of December 31, 2021,2023, the Company’s loans held-for-investment totaled $3.8$2.7 billion, and the associated allowance for credit losses (ACL) totaled $40.9$134.7 million. As disclosed in Notes 2 and 3 to the consolidated financial statements, the ACL is established forestimated on a quarterly basis and represents management’s estimate of current expected credit losses on(CECL) in the Company’s loans held-for-investment over the contractual life of the loans,portfolio, including unfunded loan commitments, using a probability weightedprobability-weighted analytical model (CECL model) that considers the likelihood of default and loss-given-default for each individual loan. Additionally, for certain loans deemed to be collateral-dependent,” the Company measuresdetermines the ACL by comparing its estimation of the fair value of the underlying collateral, less costs to sell, to the carrying value of the loan. To estimate the fair value of the underlying collateral, the Company generally used a discounted cash flow method of valuation. Management applies significant judgment in establishing inputs used to determine the ACL and a variety of subjective assumptions. Significant inputs and assumptions used in the CECL model include the relevant historical loan loss data sets, the expected timing and amount of future loan fundings and repayments, forecast for macroeconomic conditions, the reasonable and supportable forecast period and loan specific factors such as debt service coverage ratio (DSCR), loan-to-value (LTV), ratio, remaining contractual loan term, property type, and others.other loan-specific qualitative factors. Significant inputs and assumptions in determining the fair value of collateral include estimates of property cash flow performance,net operating income, capitalization rates, and discount rates, and exit costs.rates. Auditing management’s estimate of the ACL involved a high degree of subjectivity in evaluating the significant inputs and assumptions used to determine the ACL. Changes in these factors and assumptions can have a material effect on the measurement of the ACL.
|
| | | | | |
| How We Addressed the Matter in Our Audit | Our audit procedures related to the ACL included the following, among others. We obtained an understanding of the process, evaluated the design, and tested the operating effectiveness of the Company’s processcontrols over establishing the ACL, including management’s controls over the ACL methodology; the completeness and accuracy of significant inputs and assumptions used in the CECL model; and the estimated fair value of collateral for collateral-dependent loans. With respect to the CECL model, with the support of specialists, we performed a model methodology and outcome reviews andreview, assessed the Company’s model documentation and governance.governance, assessed the conceptual soundness and the model output. We also involved our specialists in assessing the macroeconomic forecasts, reasonable and supportable forecast periods, DSCR, LTV, and LTV.loan-specific qualitative factors. Our procedures included, amongst others, the assessment by comparing information to external sources, peer information, and reviewing the results of managements’ specialists. For all collateral-dependent loans, with the support of specialists, we independently developed a fair value estimate of the underlying collateral, less costs to sell and compared those to management’s estimate of fair value. We also tested the appropriateness and accuracy of significant inputs used in the CECL model by reperforming the stratification of historical loan loss data, agreeing a sample of inputs to source documents, including among others, loan agreements and third-party loan servicer reports. We evaluated the overall ACL amount, and whether the recorded ACL appropriately reflected the expected credit losses on the loans held-for-investment and unfunded loan commitments. We also reviewed subsequent events and peer company information, and we considered whether they corroborate or contradict the Company’s conclusion with respect to its measurement of the ACL.
|
/s/ Ernst & Young LLP
We have served as the Company’s auditor since 2017.
Minneapolis, Minnesota
February 25, 2022March 1, 2024
GRANITE POINT MORTGAGE TRUST INC.
CONSOLIDATED BALANCE SHEETS
(in thousands, except share data)
| | December 31,
2021 | | December 31,
2020 |
| December 31,
2023 | | | December 31,
2023 | | December 31,
2022 |
| ASSETS | ASSETS | | | |
| Loans held-for-investment | |
| Loans held-for-investment | |
| Loans held-for-investment | Loans held-for-investment | $ | 3,782,205 | | | $ | 3,914,469 | |
| Allowance for credit losses | Allowance for credit losses | (40,897) | | | (66,666) | |
| Loans held-for-investment, net | Loans held-for-investment, net | 3,741,308 | | | 3,847,803 | |
| | | Cash and cash equivalents | |
| | Cash and cash equivalents | |
| | Cash and cash equivalents | Cash and cash equivalents | 191,931 | | | 261,419 | |
| Restricted cash | Restricted cash | 12,362 | | | 67,774 | |
| Real estate owned, net | |
| Accrued interest receivable | Accrued interest receivable | 10,716 | | | 12,388 | |
| | | Other assets | |
| | Other assets | |
| | Other assets | Other assets | 32,201 | | | 30,264 | |
Total Assets (1) | Total Assets (1) | $ | 3,988,518 | | | $ | 4,219,648 | |
| LIABILITIES AND STOCKHOLDERS’ EQUITY | LIABILITIES AND STOCKHOLDERS’ EQUITY | | | |
| Liabilities | Liabilities | |
| Liabilities | |
| Liabilities | |
| Repurchase facilities | |
| Repurchase facilities | |
| Repurchase facilities | Repurchase facilities | $ | 677,285 | | | $ | 1,708,875 | |
| Securitized debt obligations | Securitized debt obligations | 1,677,619 | | | 927,128 | |
| Asset-specific financings | Asset-specific financings | 43,622 | | | 123,091 | |
| Term financing facility | 127,145 | | | — | |
| Secured credit facility | |
| | Convertible senior notes | |
| Convertible senior notes | |
| Convertible senior notes | Convertible senior notes | 272,942 | | | 271,250 | |
| | Senior secured term loan facilities | 139,880 | | | 206,448 | |
| | Dividends payable | |
| | Dividends payable | |
| | Dividends payable | Dividends payable | 14,406 | | | 25,049 | |
| Other liabilities | Other liabilities | 21,436 | | | 22,961 | |
Total Liabilities (1) | Total Liabilities (1) | 2,974,335 | | | 3,284,802 | |
| Commitments and Contingencies (see Note 10) | Commitments and Contingencies (see Note 10) | 0 | | 0 | Commitments and Contingencies (see Note 10) | | | |
| 10% cumulative redeemable preferred stock, par value $0.01 per share; 50,000,000 shares authorized and 1,000 shares issued and outstanding ($1,000,000 liquidation preference) | 1,000 | | | 1,000 | |
| 10.00% cumulative redeemable preferred stock, par value $0.01 per share; 50,000,000 shares authorized | |
| Stockholders’ Equity | Stockholders’ Equity | |
| 7.00% Series A cumulative redeemable preferred stock, par value $0.01 per share; 4,600,000 shares authorized and 4,596,500 and 0 shares issued and outstanding, respectively; liquidation preference $25.00 per share | 46 | | | — | |
| Common stock, par value $0.01 per share; 450,000,000 shares authorized and 53,789,465 and 55,205,082 shares issued and outstanding, respectively | 538 | | | 552 | |
| 7.00% Series A cumulative redeemable preferred stock, par value $0.01 per share; 11,500,000 shares authorized, and 8,229,500 and 8,229,500 shares issued and outstanding, respectively; liquidation preference $25.00 per share | |
| 7.00% Series A cumulative redeemable preferred stock, par value $0.01 per share; 11,500,000 shares authorized, and 8,229,500 and 8,229,500 shares issued and outstanding, respectively; liquidation preference $25.00 per share | |
| 7.00% Series A cumulative redeemable preferred stock, par value $0.01 per share; 11,500,000 shares authorized, and 8,229,500 and 8,229,500 shares issued and outstanding, respectively; liquidation preference $25.00 per share | |
| Common stock, par value $0.01 per share; 450,000,000 shares authorized, and 50,577,841 shares and 52,350,989 issued and outstanding, respectively | |
| Additional paid-in capital | Additional paid-in capital | 1,125,241 | | | 1,058,298 | |
| Cumulative earnings | Cumulative earnings | 171,518 | | | 103,165 | |
| Cumulative distributions to stockholders | Cumulative distributions to stockholders | (284,285) | | | (228,169) | |
| Total Granite Point Mortgage Trust, Inc. Stockholders’ Equity | 1,013,058 | | | 933,846 | |
| Total Granite Point Mortgage Trust Inc. Stockholders’ Equity | |
| Non-controlling interests | Non-controlling interests | 125 | | | — | |
| Total Equity | Total Equity | $ | 1,013,183 | | | $ | 933,846 | |
| Total Liabilities and Stockholders’ Equity | Total Liabilities and Stockholders’ Equity | $ | 3,988,518 | | | $ | 4,219,648 | |
____________________
(1)The consolidated balance sheets include assets of consolidated variable interest entities, or VIEs, that can only be used to settle obligations of these VIEs, and liabilities of the consolidated VIEs for which creditors do not have recourse to Granite Point Mortgage Trust Inc. At December 31, 2021,2023, and December 31, 2020,2022, assets of the VIEs totaled $2,266,044$1,233,821 and $1,255,932,$1,551,936, respectively, and liabilities of the VIEs totaled $1,679,435$994,081 and $928,220,$1,141,028, respectively. See Note 45 - Variable Interest Entities and Securitized Debt Obligations, for additional information.further detail.
The accompanying notes are an integral part of these consolidated financial statements.
GRANITE POINT MORTGAGE TRUST INC.
CONSOLIDATED STATEMENTS OF COMPREHENSIVE (LOSS) INCOME (LOSS)
(in thousands, except share data)
| | | | | | | | | | | | | | | | | | | | | | |
| | | | Year Ended |
| | | | December 31, |
| | | | | | 2021 | | 2020 | | 2019 |
| Interest income: | | | |
| Loans held-for-investment | | | | | $ | 197,942 | | | $ | 234,954 | | | $ | 240,022 | |
| Loans held-for-sale | | | | | — | | | 895 | | | — | |
| Available-for-sale securities | | | | | — | | | 646 | | | 1,221 | |
| Held-to-maturity securities | | | | | — | | | 659 | | | 2,239 | |
| Cash and cash equivalents | | | | | 346 | | | 559 | | | 2,775 | |
| Total interest income | | | | | 198,288 | | | 237,713 | | | 246,257 | |
| Interest expense: | | | | | | | | | |
| Repurchase facilities | | | | | 25,973 | | | 58,444 | | | 67,632 | |
| Securitized debt obligations | | | | | 29,926 | | | 26,312 | | | 46,815 | |
| Convertible senior notes | | | | | 18,167 | | | 18,092 | | | 17,971 | |
| Term financing facility | | | | | 7,585 | | | — | | | — | |
| Asset-specific financings | | | | | 2,241 | | | 3,862 | | | 2,891 | |
| Revolving credit facilities | | | | | — | | | 779 | | | 1,673 | |
| Senior secured term loan facilities | | | | | 21,688 | | | 5,446 | | | — | |
| Total interest expense | | | | | 105,580 | | | 112,935 | | | 136,982 | |
| Net interest income | | | | | 92,708 | | | 124,778 | | | 109,275 | |
| | | | | | | | | | |
| | | | | | | | | | |
| | | | | | | | | | |
| | | | | | | | | | |
| Other income (loss): | | | | | | | | | |
| Benefit from (provision for) credit losses | | | | | 20,027 | | | (53,710) | | | — | |
| Loss on extinguishment of debt | | | | | (8,919) | | | — | | | — | |
| Realized losses on sales | | | | | — | | | (16,913) | | | — | |
| Fee income | | | | | — | | | 1,117 | | | 1,210 | |
| | | | | | | | | | |
| Total other income (loss) | | | | | 11,108 | | | (69,506) | | | 1,210 | |
| Expenses: | | | | | | | | | |
| Management fees | | | | | — | | | 15,786 | | | 14,854 | |
| Incentive fees | | | | | — | | | — | | | 244 | |
| Compensation and benefits | | | | | 21,464 | | | 13,269 | | | 14,301 | |
| Servicing expenses | | | | | 5,173 | | | 4,056 | | | 3,670 | |
| Other operating expenses | | | | | 8,634 | | | 15,755 | | | 7,206 | |
| Restructuring charges | | | | | — | | | 46,252 | | | — | |
| Total expenses | | | | | 35,271 | | | 95,118 | | | 40,275 | |
| Income (loss) before income taxes | | | | | 68,545 | | | (39,846) | | | 70,210 | |
| Provision for (benefit from) income taxes | | | | | 192 | | | 593 | | | (4) | |
| Net (loss) income | | | | | 68,353 | | | (40,439) | | | 70,214 | |
| Dividends on preferred stock | | | | | 793 | | | 100 | | | 100 | |
| Net income (loss) attributable to common stockholders | | | | | $ | 67,560 | | | $ | (40,539) | | | $ | 70,114 | |
| Basic (loss) earnings per weighted average common share | | | | | $ | 1.24 | | | $ | (0.73) | | | $ | 1.32 | |
| Diluted (loss) earnings per weighted average common share | | | | | $ | 1.23 | | | $ | (0.73) | | | $ | 1.32 | |
| | | | | | | | | | |
| Weighted average number of shares of common stock outstanding: | | | | | | | | | |
| Basic | | | | | 54,593,499 | | | 55,156,482 | | | 53,087,395 | |
| Diluted | | | | | 54,929,070 | | | 55,156,482 | | | 53,087,395 | |
| Comprehensive income (loss): | | | | | | | | | |
| Net income (loss) attributable to common stockholders | | | | | $ | 67,560 | | | $ | (40,539) | | | $ | 70,114 | |
| Other comprehensive (loss) income, net of tax: | | | | | | | | | |
| Unrealized (loss) gain on available-for-sale securities | | | | | — | | | (32) | | | 224 | |
| Other comprehensive (loss) income | | | | | — | | | (32) | | | 224 | |
| Comprehensive income (loss) | | | | | $ | 67,560 | | | $ | (40,571) | | | $ | 70,338 | |
| | | | | | | | | | | | | | | | | | | | | | | | |
| | | | Year Ended |
| | | | December 31, |
| | | | | | 2023 | | 2022 | | 2021 |
| Interest income: | | | |
| Loans held-for-investment | | | | | $ | 254,733 | | | $ | 208,500 | | | $ | 197,942 | |
| | | | | | | | | | |
| | | | | | | | | | |
| | | | | | | | | | |
| Cash and cash equivalents | | | | | 9,002 | | | 2,354 | | | 346 | |
| Total interest income | | | | | 263,735 | | | 210,854 | | | 198,288 | |
| Interest expense: | | | | | | | | | |
| Repurchase facilities | | | | | 86,593 | | | 49,452 | | | 25,973 | |
| Secured credit facility | | | | | 12,290 | | | 383 | | | — | |
| Securitized debt obligations | | | | | 72,975 | | | 51,631 | | | 29,926 | |
| Convertible senior notes | | | | | 6,975 | | | 17,527 | | | 18,167 | |
| Term financing facility | | | | | — | | | 1,713 | | | 7,585 | |
| Asset-specific financings | | | | | 2,902 | | | 1,669 | | | 2,241 | |
| | | | | | | | | | |
| Senior secured term loan facilities | | | | | — | | | 3,754 | | | 21,688 | |
| Total interest expense | | | | | 181,735 | | | 126,129 | | | 105,580 | |
| Net interest income | | | | | 82,000 | | | 84,725 | | | 92,708 | |
| | | | | | | | | | |
| | | | | | | | | | |
| | | | | | | | | | |
| | | | | | | | | | |
| Other (loss) income: | | | | | | | | | |
| Revenue from real estate owned operations | | | | | 2,622 | | | — | | | — | |
| | | | | | | | | | |
| (Provision for) benefit from credit losses | | | | | (104,807) | | | (69,265) | | | 20,027 | |
| Gain (loss) on extinguishment of debt | | | | | 238 | | | (18,823) | | | (8,919) | |
| Realized losses on sales | | | | | — | | | (1,702) | | | — | |
| Fee income | | | | | 134 | | | 954 | | | — | |
| | | | | | | | | | |
| Total other (loss) income | | | | | (101,813) | | | (88,836) | | | 11,108 | |
| Expenses: | | | | | | | | | |
| | | | | | | | | | |
| | | | | | | | | | |
| Compensation and benefits | | | | | 21,711 | | | 20,225 | | | 21,464 | |
| Servicing expenses | | | | | 5,313 | | | 5,718 | | | 5,173 | |
| Expenses from real estate owned operations | | | | | 5,977 | | | — | | | — | |
| Other operating expenses | | | | | 10,289 | | | 10,754 | | | 8,634 | |
| | | | | | | | | | |
| Total expenses | | | | | 43,290 | | | 36,697 | | | 35,271 | |
| (Loss) income before income taxes | | | | | (63,103) | | | (40,808) | | | 68,545 | |
| Provision for (benefit from) income taxes | | | | | 95 | | | 17 | | | 192 | |
| Net (loss) income | | | | | (63,198) | | | (40,825) | | | 68,353 | |
| Dividends on preferred stock | | | | | 14,451 | | | 14,502 | | | 793 | |
| | | | | | | | | | |
| Net (loss) income attributable to common stockholders | | | | | $ | (77,649) | | | $ | (55,327) | | | $ | 67,560 | |
| Basic (loss) earnings per weighted average common share | | | | | $ | (1.50) | | | $ | (1.04) | | | $ | 1.24 | |
| Diluted (loss) earnings per weighted average common share | | | | | $ | (1.50) | | | $ | (1.04) | | | $ | 1.23 | |
| | | | | | | | | | |
| Weighted average number of shares of common stock outstanding: | | | | | | | | | |
| Basic | | | | | 51,641,619 | | | 53,011,806 | | | 54,593,499 | |
| Diluted | | | | | 51,641,619 | | | 53,011,806 | | | 54,929,070 | |
| | | | | | | | | | |
| Net (loss) income attributable to common stockholders | | | | | $ | (77,649) | | | $ | (55,327) | | | $ | 67,560 | |
| | | | | | | | | | |
| | | | | | | | | | |
| | | | | | | | | | |
| Comprehensive (loss) income | | | | | $ | (77,649) | | | $ | (55,327) | | | $ | 67,560 | |
The accompanying notes are an integral part of these consolidated financial statements.
GRANITE POINT MORTGAGE TRUST INC
CONSOLIDATED STATEMENTS OF STOCKHOLDERS’ EQUITY
(in thousands, except share data)
| | | | | | | | | | | | | | | | | | | | | | | | | | | | | | | | | | | | | | | | | | | | | | | | | | | | | | | | | | | | | | | | | |
| Common Stock | | Preferred Stock | | | | | | | | | | | | | | |
| Shares | | Amount | | Shares | | Amount | | Additional Paid-in Capital | | Accumulated Other Comprehensive Income (Loss) | | Cumulative Earnings | | Cumulative Distributions to Stockholders | | Total Stockholders’ Equity | | Non-controlling Interests | | Total Equity |
| | | | | | | | | | | | | | | | | | | | | |
| | | | | | | | | | | | | | | | | | | | | |
| | | | | | | | | | | | | | | | | | | | | |
| | | | | | | | | | | | | | | | | | | | | |
| | | | | | | | | | | | | | | | | | | | | |
| | | | | | | | | | | | | | | | | | | | | |
| | | | | | | | | | | | | | | | | | | | | |
| | | | | | | | | | | | | | | | | | | | | |
| | | | | | | | | | | | | | | | | | | | | |
| | | | | | | | | | | | | | | | | | | | | |
| | | | | | | | | | | | | | | | | | | | | |
| | | | | | | | | | | | | | | | | | | | | |
| | | | | | | | | | | | | | | | | | | | | |
| | | | | | | | | | | | | | | | | | | | | |
| | | | | | | | | | | | | | | | | | | | | |
| | | | | | | | | | | | | | | | | | | | | |
| | | | | | | | | | | | | | | | | | | | | |
| | | | | | | | | | | | | | | | | | | | | |
| Balance, December 31, 2018 | 43,621,174 | | | $ | 436 | | | $ | — | | | $ | — | | | $ | 836,288 | | | $ | (192) | | | $ | 91,875 | | | $ | (100,876) | | | $ | 827,531 | | | $ | — | | | $ | 827,531 | |
| Cumulative effect of adoption of new accounting principle | — | | | — | | | — | | | — | | | 13 | | | — | | | (13) | | | — | | | — | | | — | | | — | |
| Adjusted balance, January 1, 2019 | 43,621,174 | | | 436 | | | — | | | — | | | 836,301 | | | (192) | | | 91,862 | | | (100,876) | | | 827,531 | | | — | | | 827,531 | |
| | | | | | | | | | | | | | | | | | | | | |
| | | | | | | | | | | | | | | | | | | | | |
| Net income | — | | | — | | | — | | | — | | | — | | | — | | | 70,214 | | | — | | | 70,214 | | | — | | | 70,214 | |
| Other comprehensive income before reclassifications | — | | | — | | | — | | | — | | | — | | | 224 | | | — | | | — | | | 224 | | | — | | | 224 | |
| | | | | | | | | | | | | | | | | | | | | |
| Net other comprehensive income | — | | | — | | | — | | | — | | | — | | | 224 | | | — | | | — | | | 224 | | | — | | | 224 | |
| Issuance of common stock, net of offering costs | 10,954,924 | | | 110 | | | — | | | — | | | 207,404 | | | — | | | — | | | — | | | 207,514 | | | — | | | 207,514 | |
| | | | | | | | | | | | | | | | | | | | | |
| Common dividends declared, $1.68 per share | — | | | — | | | — | | | — | | | — | | | — | | | — | | | (91,029) | | | (91,029) | | | — | | | (91,029) | |
| Preferred dividends declared, $100.00 per share | — | | | — | | | — | | | — | | | — | | | — | | | — | | | (100) | | | (100) | | | — | | | (100) | |
| | | | | | | | | | | | | | | | | | | | | |
| Non-cash equity award compensation | 277,107 | | | 3 | | | — | | | — | | | 4,779 | | | — | | | — | | | — | | | 4,782 | | | — | | | 4,782 | |
| Balance, December 31, 2019 | 54,853,205 | | | 549 | | | — | | | — | | | 1,048,484 | | | 32 | | | 162,076 | | | (192,005) | | | 1,019,136 | | | — | | | 1,019,136 | |
| | | | | | | | | | | | | | | | | | | | | |
| | | | | | | | | | | | | | | | | | | | | |
| Cumulative effect of adoption of new accounting principle | — | | | — | | | — | | | — | | | — | | | — | | | (18,472) | | | — | | | (18,472) | | | — | | | (18,472) | |
| Adjusted balance, January 1, 2020 | 54,853,205 | | | 549 | | | — | | | — | | | 1,048,484 | | | 32 | | | 143,604 | | | (192,005) | | | 1,000,664 | | | — | | | 1,000,664 | |
| | | | | | | | | | | | | | | | | | | | | |
| | | | | | | | | | | | | | | | | | | | | |
| | | | | | | | | | | | | | | | | | | | | |
| | | | | | | | | | | | | | | | | | | | | |
| | | | | | | | | | | | | | | | | | | | | |
| | | | | | | | | | | | | | | | | | | | | |
| | | | | | | | | | | | | | | | | | | | | |
| | | | | | | | | | | | | | | | | | | | | |
| | | | | | | | | | | | | | | | | | | | | |
| | | | | | | | | | | | | | | | | | | | | |
| | | | | | | | | | | | | | | | | | | | | |
| | | | | | | | | | | | | | | | | | | | | |
| | | | | | | | | | | | | | | | | | | | | |
| | | | | | | | | | | | | | | | | | | | | |
| | | | | | | | | | | | | | | | | | | | | |
| | | | | | | | | | | | | | | | | | | | | |
| | | | | | | | | | | | | | | | | | | | | |
| | | | | | | | | | | | | | | | | | | | | |
| | | | | | | | | | | | | | | | | | | | | |
| | | | | | | | | | | | | | | | | | | | | |
| | | | | | | | | | | | | | | | | | | | | |
| | | | | | | | | | | | | | | | | | | | | |
| | | | | | | | | | | | | | | | | | | | | |
| | | | | | | | | | | | | | | | | | | | | |
| | | | | | | | | | | | | | | | | | | | | |
| | | | | | | | | | | | | | | | | | | | | |
| | | | | | | | | | | | | | | | | | | | | |
| | | | | | | | | | | | | | | | | | | | | |
| | | | | | | | | | | | | | | | | | | | | |
| | | | | | | | | | | | | | | | | | | | | |
| Net loss | — | | | — | | | — | | | — | | | — | | | — | | | (40,439) | | | — | | | (40,439) | | | — | | | (40,439) | |
| Other comprehensive loss before reclassifications | — | | | — | | | — | | | — | | | — | | | (288) | | | — | | | — | | | (288) | | | — | | | (288) | |
| Amounts reclassifications | — | | | — | | | — | | | — | | | — | | | 256 | | | — | | | — | | | 256 | | | — | | | 256 | |
| Net other comprehensive loss | — | | | — | | | — | | | — | | | — | | | (32) | | | — | | | — | | | (32) | | | — | | | (32) | |
| Issuance of warrants to purchase common stock | — | | | — | | | — | | | — | | | 4,541 | | | — | | | — | | | — | | | 4,541 | | | — | | | 4,541 | |
| Common dividends declared, $0.65 per share | — | | | — | | | — | | | — | | | — | | | — | | | — | | | (36,064) | | | (36,064) | | | — | | | (36,064) | |
| Preferred dividends declared, $100.00 per share | — | | | — | | | — | | | — | | | — | | | — | | | — | | | (100) | | | (100) | | | — | | | (100) | |
| Non-cash equity award compensation | 351,877 | | | 3 | | | — | | | — | | | 5,273 | | | — | | | — | | | — | | | 5,276 | | | — | | | 5,276 | |
| Balance, December 31, 2020 | 55,205,082 | | | 552 | | | — | | | — | | | 1,058,298 | | | — | | | 103,165 | | | (228,169) | | | 933,846 | | | — | | | 933,846 | |
GRANITE POINT MORTGAGE TRUST INC
CONSOLIDATED STATEMENTS OF STOCKHOLDERS’ EQUITY
(in thousands, except share data) (Continued)
| | Common Stock | | Preferred Stock | |
| Shares | | Amount | | Shares | | Amount | | Additional Paid-in Capital | | Accumulated Other Comprehensive Income (Loss) | | Cumulative Earnings | | Cumulative Distributions to Stockholders | | Total Stockholders’ Equity | | Non-controlling Interests | | Total Equity |
| Net income | — | | | — | | | — | | | — | | | — | | | — | | | 68,353 | | | — | | | 68,353 | | | — | | | 68,353 | |
| | Issuance of preferred stock, net of offering costs | — | | | 4,596,500 | | | 46 | | | 110,473 | | | — | | | — | | | — | | | 110,519 | | 0 | — | | | 110,519 | |
| Restricted stock forfeiture | (115,053) | | | (1) | | | — | | | — | | | (1,193) | | | — | | | — | | | — | | | (1,194) | | | — | | | (1,194) | |
| Repurchase of common stock | (1,301,612) | | | (13) | | | — | | | — | | | (17,790) | | | — | | | — | | | — | | | (17,803) | | | — | | | (17,803) | |
| Preferred dividends declared, $100.00 per share | — | | | — | | | — | | | — | | | — | | | — | | | — | | | (100) | | | (100) | | | — | | | (100) | |
| Preferred dividends declared, $0.15069 per share | — | | | — | | | — | | | — | | | — | | | — | | | — | | | (693) | | | (693) | | | — | | | (693) | |
| Common dividends declared, $1.00 per share | — | | | — | | | — | | | — | | | — | | | — | | | — | | | (55,323) | | | (55,323) | | | — | | | (55,323) | |
| Settlement of warrants to purchase common stock | — | | | — | | | — | | | — | | | (32,138) | | | — | | | — | | | — | | | (32,138) | | | — | | | (32,138) | |
| Contributions from non-controlling interests | — | | | — | | | — | | | — | | | — | | | — | | | — | | | — | | | — | | | 125 | | | 125 | |
| Non-cash equity award compensation | 1,048 | | | — | | | — | | | — | | | 7,591 | | | — | | | — | | | — | | | 7,591 | | | — | | | 7,591 | |
| Balance, December 31, 2021 | 53,789,465 | | | 538 | | | 4,596,500 | | | 46 | | | 1,125,241 | | | — | | | 171,518 | | | (284,285) | | | 1,013,058 | | | 125 | | | 1,013,183 | |
| Common Stock | |
| Common Stock | |
| Common Stock | |
| Shares | |
| Shares | |
| Shares | | | Amount | | Shares | | Amount | | Additional Paid-in Capital | | | | | | Cumulative Earnings | | Cumulative Distributions to Stockholders | | Total Stockholders’ Equity | | Non-controlling Interests | | Total Equity |
| | Balance, December 31, 2020 | |
| | Balance, December 31, 2020 | |
| | | Balance, December 31, 2020 | |
| Net income | |
| Issuance of preferred stock, net of offering costs | |
| Restricted stock forfeiture | |
| Repurchase of common stock | |
| Preferred dividends declared, $100 per share | |
| Preferred dividends declared, $1.75 per share | |
| Common dividends declared, $0.95 per share | |
| Settlement of warrants to purchase common stock | |
| Contributions from non-controlling interests | |
| Non-cash equity award compensation | |
| Balance, December 31, 2021 | |
| Net (loss) income | |
| Issuance of preferred stock, net of offering costs | |
| Repurchase of common stock | |
| Restricted stock forfeiture | |
| Restricted Stock Unit (RSU) forfeiture | |
| Preferred dividends declared, $100 per share | |
| Preferred dividends declared, $1.75 per share | |
| Common dividends declared, $0.80 per share | |
| Non-cash equity award compensation | |
| Balance, December 31, 2022 | |
| Net (loss) income | |
| Repurchase of common stock | |
| Restricted Stock forfeiture | |
| Restricted Stock Unit (RSU) forfeiture | |
| Preferred dividends declared, $49.44 per share | |
| Preferred dividends declared, $1.75 per share | |
| Common dividends declared, $0.80 per share | |
| Non-cash equity award compensation | |
| Balance, December 31, 2023 | |
The accompanying notes are an integral part of these consolidated financial statements.
GRANITE POINT MORTGAGE TRUST INC.
CONSOLIDATED STATEMENTS OF CASH FLOWS (in thousands) | | | | | | | | | | | | | | | | | | |
| | Year Ended |
| | December 31, |
| | 2021 | | 2020 | | 2019 |
| Cash Flows From Operating Activities: | | | |
| Net income (loss) | $ | 68,353 | | | $ | (40,439) | | | $ | 70,214 | |
| Adjustments to reconcile net income (loss) to net cash provided by operating activities: | | | | | |
| Accretion of discounts and net deferred fees on loans held-for-investment and deferred interest capitalized to loans held-for-investment | (23,291) | | | (15,915) | | | (15,417) | |
| Amortization of deferred debt issuance costs | 16,559 | | | 6,426 | | | 7,588 | |
| (Benefit from) provision for credit losses | (20,027) | | | 53,710 | | | — | |
| | | | | | |
| | | | | | |
| Realized losses on sales of loans held-for-sale | — | | | 16,913 | | | — | |
| | | | | | |
| | | | | | |
| | | | | | |
| Loss on extinguishment of debt | 5,169 | | | — | | | — | |
| Amortization of equity-based compensation | 7,591 | | | 5,276 | | | 4,782 | |
| Proceeds received from deferred interest capitalized to loans held-for-investment | 1,931 | | | — | | | — | |
| Net change in assets and liabilities: | | | | | |
| Decrease (increase) in accrued interest receivable | 1,672 | | | (1,066) | | | (1,055) | |
| | | | | | |
| | | | | | |
| | | | | | |
| (Increase) decrease in other assets | (171) | | | 2,436 | | | (11,682) | |
| | | | | | |
| | | | | | |
| | | | | | |
| | | | | | |
| Increase (decrease) in other liabilities | 2,515 | | | (7,086) | | | 7,431 | |
| | | | | | |
| Net cash provided by operating activities | 60,301 | | | 20,255 | | | 61,861 | |
| Cash Flows From Investing Activities: | | | | | |
| Originations, acquisitions and additional fundings of loans held-for-investment, net of deferred fees | (814,515) | | | (369,216) | | | (1,812,698) | |
| | | | | | |
| Proceeds from repayment of loans held-for-investment | 958,399 | | | 486,422 | | | 769,816 | |
| | | | | | |
| | | | | | |
| | | | | | |
| | | | | | |
| Increase in other assets, due from servicer/trustee on repayments of loans held-for-investment | (4,114) | | | — | | | — | |
| Principal payments on available-for-sale securities | — | | | 12,798 | | | — | |
| | | | | | |
| | | | | | |
| Principal payments on held-to-maturity securities | — | | | 18,076 | | | 8,620 | |
| | | | | | |
| Proceeds from sales of loans held-for-sale | — | | | 193,538 | | | — | |
| | | | | | |
| | | | | | |
| Net cash provided by (used in) investing activities | 139,770 | | | 341,618 | | | $ | (1,034,262) | |
| | | | | | |
| Cash Flows From Financing Activities: | | | | | |
| Proceeds from repurchase facilities | 599,579 | | | 397,004 | | | 1,390,059 | |
| Principal payments on repurchase facilities | (1,631,169) | | | (612,150) | | | (966,581) | |
| Proceeds from issuance of securitized debt obligations | 1,188,330 | | | — | | | 646,868 | |
| Principal payments on securitized debt obligations | (433,520) | | | (117,925) | | | (266,179) | |
| Proceeds from senior secured term loan facilities | — | | | 205,647 | | | — | |
| Repayment of senior secured term loan facilities | (75,000) | | | — | | | — | |
| Proceeds from asset-specific financings | 3,063 | | | 6,626 | | | 116,465 | |
| Repayment of asset-specific financings | (82,532) | | | — | | | — | |
| Proceeds from revolving credit facilities | — | | | 38,361 | | | 361,273 | |
| Repayment of revolving credit facilities | — | | | (80,369) | | | (394,265) | |
| Proceeds from term financing facility | 349,291 | | | — | | | — | |
| Repayment of term financing facility | (220,192) | | | — | | | — | |
| | | | | | |
| | | | | | |
| Payment of debt issuance costs | (15,572) | | | — | | | — | |
| Settlement of warrants to purchase common stock | (32,138) | | | — | | | — | |
| Contributions from non-controlling interests | 125 | | | — | | | — | |
| Proceeds from issuance of warrants to purchase common stock | — | | | 4,541 | | | — | |
| Proceeds from issuance of preferred stock, net of offering costs | 110,519 | | | — | | | — | |
| Proceeds from issuance of common stock, net of offering costs | — | | | — | | | 207,514 | |
| | | | | | |
| | | | | | |
| Tax withholding on restricted stock | (1,194) | | | — | | | — | |
| Repurchase of common stock | (17,803) | | | — | | | — | |
| Dividends paid on preferred stock | (100) | | | (100) | | | (100) | |
| Dividends paid on common stock | (66,658) | | | (34,079) | | | (86,312) | |
| Net cash (used in) provided by financing activities | (324,971) | | | (192,444) | | | 1,008,742 | |
| Net (decrease) increase in cash, cash equivalents and restricted cash | (124,900) | | | 169,429 | | | 36,341 | |
| Cash, cash equivalents, and restricted cash at beginning of period | 329,193 | | | 159,764 | | | 123,423 | |
| Cash, cash equivalents, and restricted cash at end of period | $ | 204,293 | | | $ | 329,193 | | | $ | 159,764 | |
| Supplemental Disclosure of Cash Flow Information: | | | | | |
| Cash paid for interest | $ | 105,960 | | | $ | 115,013 | | | $ | 136,091 | |
| Cash paid for taxes | $ | 599 | | | $ | — | | | $ | — | |
| Noncash Activities: | | | | | |
| Transfers of loans held-for-investment to loans held-for-sale | $ | — | | | $ | 210,452 | | | $ | — | |
| Dividends declared but not paid at end of period | $ | 14,406 | | | $ | 25,049 | | | $ | 23,063 | |
| | | | | | | | | | | | | | | | | | |
| | |
| | Year Ended December 31, |
| | 2023 | | 2022 | | 2021 |
| Cash Flows From Operating Activities: | | | |
| Net loss | $ | (63,198) | | | $ | (40,825) | | | $ | 68,353 | |
| Adjustments to reconcile net (loss) income to net cash provided by operating activities: | | | | | |
| Accretion of discounts and net deferred fees on loans held-for-investment and deferred interest capitalized to loans held-for-investment | (8,398) | | | (11,964) | | | (23,291) | |
| Amortization of deferred debt issuance costs | 8,269 | | | 12,412 | | | 16,559 | |
| Provision for credit losses | 104,807 | | | 69,265 | | | (20,027) | |
| (Gain) loss on extinguishment of debt | (274) | | | 11,307 | | | — | |
| Realized losses on available-for-sale securities | — | | | — | | | 5,169 | |
| Realized losses on loan sales | — | | | 1,702 | | | — | |
| | | | | | |
| | | | | | |
| | | | | | |
| | | | | | |
| Amortization of equity-based compensation | 6,979 | | | 7,025 | | | 7,591 | |
| Proceeds received from deferred interest capitalized on loans held-for-investment | 359 | | | 7,903 | | | 1,931 | |
| Depreciation and amortization on real estate owned | 3,492 | | | — | | | — | |
| Net change in assets and liabilities: | | | | | |
| Decrease (increase) in accrued interest receivable | 1,033 | | | (2,697) | | | 1,672 | |
| | | | | | |
| | | | | | |
| | | | | | |
| Decrease (increase) in other assets | (771) | | | 5,727 | | | (171) | |
| | | | | | |
| | | | | | |
| | | | | | |
| | | | | | |
| Increase (decrease) in other liabilities | (202) | | | (957) | | | 2,515 | |
| | | | | | |
| Net cash provided by operating activities | 52,096 | | | 58,898 | | | 60,301 | |
| Cash Flows From Investing Activities: | | | | | |
| Originations, acquisitions and additional fundings of loans held-for-investment, net of deferred fees | (118,177) | | | (557,468) | | | (814,515) | |
| Proceeds from loan sales | 14,980 | | | 64,045 | | | — | |
| | | | | | |
| Proceeds from repayment of loans held-for-investment | 664,626 | | | 902,743 | | | 958,399 | |
| | | | | | |
| | | | | | |
| | | | | | |
| | | | | | |
| Increase in other assets, due from servicer on repayments of loans held-for-investment | — | | | (689) | | | (4,114) | |
| | | | | | |
| | | | | | |
| | | | | | |
| | | | | | |
| | | | | | |
| | | | | | |
| | | | | | |
| | | | | | |
| Net cash provided by investing activities | 561,429 | | | 408,631 | | | 139,770 | |
| | | | | | |
| Cash Flows From Financing Activities: | | | | | |
| Proceeds from repurchase facilities | 558,954 | | | 828,893 | | | 599,579 | |
| Principal payments on repurchase facilities | (699,501) | | | (490,612) | | | (1,631,169) | |
| Proceeds from issuance of securitized debt obligations | — | | | — | | | 1,188,330 | |
| Principal payments on securitized debt obligations | (147,881) | | | (543,023) | | | (433,520) | |
| | | | | | |
| Repayment of senior secured term loan facilities | — | | | (150,000) | | | (75,000) | |
| Proceeds from asset-specific financings | 910 | | | 1,291 | | | 3,063 | |
| Repayment of asset-specific financings | (45,823) | | | — | | | (82,532) | |
| Proceeds from secured credit facility | — | | | 100,000 | | | — | |
| Repayment of secured credit facility | (16,000) | | | — | | | — | |
| Repayment of convertible senior notes | (131,600) | | | (143,750) | | | — | |
| | | | | | |
| | | | | | |
| Proceeds from term financing facility | — | | | — | | | 349,291 | |
| Repayment of term financing facility | — | | | (129,099) | | | (220,192) | |
| | | | | | |
| | | | | | |
| Payment of debt issuance costs | (3,923) | | | (9,557) | | | (15,572) | |
| Settlement of warrants to purchase common stock | — | | | — | | | (32,138) | |
| Contributions from non-controlling interests | — | | | — | | | 125 | |
| | | | | | |
| Proceeds from issuance of preferred stock, net of offering costs | — | | | 87,521 | | | 110,519 | |
| | | | | | |
| | | | | | |
| | | | | | |
| Tax withholding on restricted stock and RSUs | (966) | | | (1,736) | | | (1,194) | |
| Repurchase of common stock | (10,298) | | | (15,714) | | | (17,803) | |
| Redemption of cumulative redeemable preferred stock | (1,000) | | | — | | | — | |
| Dividends paid on preferred stock | (14,451) | | | (11,594) | | | (100) | |
| Dividends paid on common stock | (42,895) | | | (54,277) | | | (66,658) | |
| Net cash used in financing activities | (554,474) | | | (531,657) | | | (324,971) | |
| Net increase (decrease) in cash, cash equivalents and restricted cash | 59,051 | | | (64,128) | | | (124,900) | |
| Cash, cash equivalents, and restricted cash at beginning of period | 140,165 | | | 204,293 | | | 329,193 | |
| Cash, cash equivalents, and restricted cash at end of period | $ | 199,216 | | | $ | 140,165 | | | $ | 204,293 | |
| Supplemental Disclosure of Cash Flow Information: | | | | | |
| Cash paid for interest | $ | 182,569 | | | $ | 123,371 | | | $ | 105,960 | |
| | | | | | |
| Cash paid for taxes | $ | 964 | | | $ | 463 | | | $ | 599 | |
| Noncash Activities: | | | | | |
| Transfers of loans held-for-investment to loans held-for-sale | $ | 14,980 | | | $ | 22,033 | | | $ | — | |
| Dividends declared but not paid at end of period | $ | 14,136 | | | $ | 14,318 | | | $ | 14,406 | |
| Transfers from loans held-for-investment to real estate owned, other assets and other liabilities | $ | 24,000 | | | $ | — | | | $ | — | |
| Deferred financing costs, not yet paid | $ | 1,313 | | | $ | 1,757 | | | $ | — | |
The accompanying notes are an integral part of these consolidated financial statements.
GRANITE POINT MORTGAGE TRUST INC.
Notes to the Consolidated Financial Statements
Note 1. Organization and Operations
Granite Point Mortgage Trust Inc., or the Company, is an internally managed commercial real estate finance company that focuses primarily on directly originating, investing in and managing senior floating-rate commercial mortgage loans and other debt and debt-like commercial real estate investments. These investments are capitalized by accessing a variety of funding options,sources, including borrowing under the Company’s bank credit facilities or other asset-specificasset financings, issuing commercial real estate collateralized loan obligations, or CRE CLOs, entering into term financing agreements, and issuing other forms of secured and unsecured debt and equity securities, depending on market conditions and the Company’s view of the most appropriate funding option available for the Company’s investments. The Company is not in the business of buying or trading securities, and the only securities it owns are the retained interests from its CRE CLOs. The Company’s investment objective is to preserve the Company’s stockholders’ capital while generating attractive risk-adjusted returns over the long term, primarily through dividends derived from current income produced by the Company’s investment portfolio. The Company’s common stock is listed on the New York Stock Exchange, or NYSE under the symbol “GPMT”. The Company operates its business in a manner that is intended to permit it to maintain its exclusion from registration under the Investment Company Act of 1940, as amended, or the Investment Company Act. The Company operates its business as 1one segment. The Company was incorporated in Maryland on April 7, 2017, and commenced operations as a publicly traded company on June 28, 2017.
The Company has elected to be treated as a real estate investment trust, or REIT, as defined under the Internal Revenue Code of 1986, as amended, or the Code, for U.S. federal income tax purposes. As long as the Company continues to comply with a number of requirements under federal tax law and maintains its qualification as a REIT, the Company generally will not be subject to U.S. federal income taxes to the extent that the Company distributes its taxable income to its stockholders on an annual basis and does not engage in prohibited transactions. However, certain activities that the Company may perform may cause it to earn income which will not be qualifying income for REIT purposes. The Company has designated one of its subsidiaries as a taxable REIT subsidiary, or TRS, as defined in the Code, to engage in such activities.
Note 2. Basis of Presentation and Significant Accounting Policies
Consolidation and Basis of Presentation
The accompanying consolidated financial statements include the accounts of all subsidiaries; inter-company accounts and transactions have been eliminated. Certain prior period amounts have been reclassified to conform to the current period presentation. The accounting and reporting policies of the Company conform to U.S. generally accepted accounting principles, or GAAP.
All entities in which the Company holds investments that are considered variable interest entities, or VIEs, for financial reporting purposes were reviewed for consolidation under the applicable consolidation guidance. Whenever the Company has both the power to direct the activities of an entity that most significantly impact the entity’s performance, and the obligation to absorb losses or the right to receive benefits of the entity that could be significant, the Company consolidates the entity. See Note 45 - Variable Interest Entities and Securitized Debt Obligations to the Company’s Consolidated Financial Statements included in this Annual Report on Form 10-K for additional details regarding consolidation of VIEs.
Use of Estimates
The preparation of financial statements in conformity with GAAP requires management to make a number of significant estimates. These include estimates of amount and timing of allowances for credit losses, fair value of certain assets and liabilities, and other estimates that affect the reported amounts of certain assets and liabilities as of the date of the consolidated financial statements and the reported amounts of certain revenues and expenses during the reported period. It is likely that changes in these estimates (e.g., valuation changes to the underlying collateral of loans due to changes in market interest and capitalization rates, leasing, credit worthiness of major tenants, occupancy rates, availability of financing, exit plan, loan sponsorship, actions of other lenders, overall economic and capital markets conditions, the broader commercial real estate market, local geographic sub-markets or other factors) will occur in the near term. As the novel coronavirus, or COVID-19, pandemic has evolved from its emergence in early 2020, so has its global impact. During the year ended December 31, 2021, many countries have re-instituted or strongly encouraged varying levels of quarantines and restrictions on travel, and in some cases have at times limited operations of certain businesses and taken other restrictive measures designed to help slow the spread of COVID-19 and its variants. Governments and businesses have also instituted vaccine mandates and testing requirements for employees. While vaccine availability and uptake have increased, the longer-term macroeconomic effects on global supply chains, inflation, labor shortages and wage increases continue to impact many industries, including those related to the collateral underlying certain of our loans. Moreover, with the potential for new strains of COVID-19 to emerge, governments and businesses may re-impose aggressive measures to help slow its spread in the future. For this reason, among others, as the COVID-19 pandemic continues, the potential global impacts are uncertain and difficult to assess. We believe
The Company believes the estimates and assumptions underlying our
GRANITE POINT MORTGAGE TRUST INC.
Notes to the Consolidated Financial Statements
its consolidated financial statements are reasonable and supportable based on the information available as of December 31, 2021.2023. However, uncertainty over the ultimate impact COVID-19 will have on the global economy generally, and the Company’s business in particular, makes any estimates and assumptions as of December 31, 2021, inherently less certain than they would be absent the current and potential impacts of COVID-19. The Company’s actual results could ultimately differ from its estimates and such differences may be material.
Significant Accounting Policies
Loans Held-for-Investment, Net
The Company originates and acquires commercial real estate debt and related instruments generally to be held as long-term investments. These assets are classified as loans held-for-investment on the consolidated balance sheets. Additionally, the Company finances pools of its commercial real estate loans through collateralized loan obligations, or CRE CLOs, which are considered VIEs for financial
GRANITE POINT MORTGAGE TRUST INC.
Notes to the Consolidated Financial Statements
reporting purposes and, thus, are reviewed for consolidation under the applicable consolidation guidance. The Company has both the controlpower to direct the activities of the CRE CLOs that most significantly impact the entities’ performance and the obligation to absorb losses or the right to receive benefits of the entities that could be significant, therefore, the Company consolidates the CRE CLOs and classifies the underlying loans as loans held-for-investment. The Company utilizes a third-party servicer who services the commercial real estate loans that the Company invests in and commercial real estate loans underlying CRE CLOs and other commercial real estate debt investments to collect principal and interest payments on such commercial real estate loans and performs certain asset management services.
Interest income on loans held-for-investment is recordedrecognized at the loan coupon rate. Any premiums or discounts, loan fees, contractual exit fees and origination costs are amortized or accreted into interest income over the lives of the loans using the effective interest method. Generally, loans held-for-investment are placed on nonaccrual status when delinquent for more than 90 days or when determined not to be probable of full collection. Interest income recognition is suspended when loans are placed on nonaccrual status. Interest accrued, but not collected, at the consolidated statementsdate loans are placed on nonaccrual is written off if determined not probable of comprehensive income (loss).collection, and subsequently recognized only to the extent it is received in cash or until it qualifies for return to accrual status. However, when there is doubt regarding the ultimate collectability of loan principal, all cash received is applied to reduce the carrying value of such loans. Loans held-for-investment are restored to accrual status only when contractually current or the collection of future payments is reasonably assured. The Company may make exceptions to placing a loan on nonaccrual status if the loan has sufficient collateral value and is in the process of collection or has been modified.
Loans held-for-investment are reported at cost, net of allowance for credit losses, any unamortized acquisition premiums or discounts, loan fees and origination costs, as applicable. The Company accountsallowance for credit losses is recorded in accordance with ASU 2016-13. Changes to the allowance for credit losses are recognized through net income (loss) on the Company’s consolidated statements of comprehensive (loss) income. The allowance is based on ASU 2016-13, Financial Instruments - Credit Losses (Topic 326): Measurementrelevant information about past events, including historical loss experience, current portfolio, market conditions and reasonable and supportable forecasts for the duration of Credit Losses on Financial Instruments,each respective loan. All loans held-for-investment within the Company’s portfolio have some amount of expected loss to reflect the GAAP principal underlying the CECL model that all loans have some inherent risk of loss, regardless of credit quality, subordinate capital or ASU 2016-13. Subsequent to the adoption of ASU 2016-13 on January 1, 2020, to estimate and recognizeother mitigating factors. Estimating an allowance for credit losses is inherently subjective, as it requires management to exercise significant judgment in establishing appropriate factors used to determine the allowance and a variety of subjective assumptions, including (i) determination of relevant historical loan loss data sets, (ii) the expected timing and amount of future loan fundings and repayments, (iii) the current credit quality of loans and operating performance of loan collateral and the Company’s expectations of performance, (iv) selecting the forecast for macroeconomic conditions and (v) determining the reasonable and supportable forecast period.
The Company’s loans typically include commitments to fund incremental proceeds to its borrowers over the life of the loan. Those future funding commitments are also subject to an allowance for credit losses. The allowance for credit losses related to future loan fundings is recorded as a component of other liabilities on the Company’s consolidated balance sheets, and not as an offset to the related loan balance. This allowance for credit losses is estimated using the same process outlined below for the Company’s outstanding loan balances, and changes in this component of the allowance for credit losses similarly flow through the Company’s consolidated statements of comprehensive (loss) income.
The allowance for credit losses is estimated on a quarterly basis and represents management’s estimates of current expected credit losses in the Company’s investment portfolio. Pools of loans held-for-investment and their related unfunded commitments, the Company continues to use probability-weighted analytical model.with similar risk characteristics are collectively evaluated while loans that no longer share risk characteristics with loan pools are evaluated individually. The Company employsemployed quarterly updated macroeconomic forecasts, which reflect expectations for overall economic output, interest rates, values of real estate properties and other factors, geopolitical instability and the ongoingFederal Reserve monetary policy impact of the COVID-19 pandemic on the overall U.S. economy and commercial real estate markets generally. DrivenThese estimates may change in future periods based on available future macroeconomic data and might result in a material change in the Company’s future estimates of expected credit losses for its loan portfolio.
The Company generally estimates its allowance for credit losses by using a probability-weighted analytical model that considers the general progress around the developmentlikelihood of default and distributionloss-given-default for each individual loan. The analytical model incorporated a third-party licensed database with historical loan losses from 1998 to 2022 for over 100,000 commercial real estate loans. The Company licenses certain macroeconomic financial forecasts from a third-party to inform its view of the COVID-19 vaccines overpotential future impact that broader macroeconomic conditions may have on the last few quarters, thoseperformance of the loans held-for-investment. These macroeconomic forecasts have been improving, including expectations forfactors include unemployment rates, overall economic output, level of interest rates, price indices for commercial property and valuesother factors. The Company may use one or more of real estate properties.these forecasts in the process of estimating its allowance for credit losses. Selection of these economic forecasts requires significant judgment about future events that, while based on the information available to the Company as of the balance sheet date, are ultimately unknowable with certainty, and the actual economic conditions impacting the Company’s
GRANITE POINT MORTGAGE TRUST INC.
Notes to the Consolidated Financial Statements
portfolio could vary significantly from the estimates the Company made for the periods presented. Significant inputs to the Company’s estimate of the allowance for credit losses include the reasonable and supportable forecast period and loan specific factors such as debt service coverage ratio, or DSCR, loan to valueloan-to-value ratio, or LTV, remaining contractual loan term, property type and others. In addition, the Company also considers relevant loan-specific qualitative factors to estimate its allowance for credit losses. In certain instances, for loans with unique risk and credit characteristics, the Company may instead elect to employ different methods to estimate an allowance for creditloan losses that also conform to ASU 2016-13 and related guidance.
The Company considers loan investments that are both (i) expected to be substantially repaid through the operation or sale of the underlying collateral, and (ii) for which the borrower is experiencing financial difficulty, to be “collateral-dependent” loans. For loans that the Company determines foreclosure of the collateral is probable, the Company measures the expected losses based on the difference between the fair value of the collateral and the amortized cost basis of the loan as of the measurement date. For collateral-dependent loans that the Company determines foreclosure is not probable, the Company applies a practical expedient to estimate expected losses using the difference between the collateral’s fair value (less costs to sell the asset if repayment is expected through the sale of the collateral) and the amortized cost basis of the loan.
For loans assigned a risk rating of “5,” the Company has determined that the recovery of the loan’s principal is collateral-dependent. Accordingly, these loans are assessed individually and the Company elected to apply a practical expedient in accordance with ASU 2016-13. While utilizing the practical expedient for collateral-dependent loans, the Company generally estimates the fair value of the loan’s underlying collateral using the discounted cash flow method of valuation, less the estimated cost to foreclose and sell the property when applicable. The estimation of the fair value of the collateral property also involves using various Level 3 unobservable inputs,assumptions, which are inherently uncertain and subjective, and are in part developed based on discussions with various market participants and management’s best estimates, which may vary depending on the information available and market conditions as of the valuation date. These assumptions include property net operating income, capitalization rates, and discount rates. Selecting the appropriate inputs and assumptions requires significant judgment and consideration of various factors that are specific to the underlying collateral property being assessed. The Company’s estimate of the fair value of the collateral property is sensitive to both the valuation methodology selected and inputs used in the analysis. As a result, the fair value of the collateral property used in determining the expected credit losses is subject to uncertainty and any actual losses, if incurred, could differ materially from the estimated provision for credit losses.
GRANITE POINT MORTGAGE TRUST INC.
Notes to the Consolidated Financial Statements
Interest income on loans held-for-investment is recognized at the loan coupon rate. Any premiums or discounts, loan fees, contractual exit fees and origination costs are amortized or accreted into interest income over the life of the loans using the effective interest method. Generally, loans held-for-investment are placed on nonaccrual status when delinquent for more than 90 days or when determined not to be probable of full collection. Interest income recognition is suspended when loans are placed on nonaccrual status. Interest accrued, but not collected, at the date loans are placed on nonaccrual is reversed and subsequently recognized only to the extent it is received in cash or until it qualifies for return to accrual status. However, when there is doubt regarding the ultimate collectability of loan principal, all cash received is applied to reduce the carrying value of such loans. Loans held-for-investment are restored to accrual status only when contractually current or the collection of future payments is reasonably assured. The Company may make exceptions to placing a loan on nonaccrual status if the loan has sufficient collateral value and is in the process of collection or has been modified.
The allowance for credit losses is recorded in accordance with ASU 2016-13, and is a valuation account that is deducted from the amortized cost basis of loans held-for-investment on the Company’s consolidated balance sheets. Changes to the allowance for credit losses are recognized through net income (loss) on the Company’s consolidated statements of comprehensive income (loss). The allowance is based on relevant information about past events, including historical loss experience, current portfolio, market conditions and reasonable and supportable forecasts for the duration of each respective loan. All loans held-for-investment within the Company’s portfolio have some amount of expected loss to reflect the GAAP principal underlying the Current Expected Credit Loss, or CECL, model that all loans have some inherent risk of loss, regardless of credit quality, subordinate capital or other mitigating factors.
ASU 2016-13 replaced the incurred loss model under existing guidance with a CECL model for instruments measured at amortized cost, and requires entities to record allowances for AFS debt securities rather than reduce the carrying amount, as they did under the other-than-temporary impairment model. It also simplified the accounting model for purchased credit-impaired debt securities and loans. In addition, the new model applies to off-balance sheet credit exposures, such as unfunded loan commitments.
In connection with the Company’s adoption of ASU 2016-13, the Company implemented new processes, including the utilization of loan loss forecasting models, updates to its reserve policy documentation, changes to its internal reporting process and related internal controls. The Company has implemented loan loss forecasting models for estimating expected life-time credit losses, at the individual loan level, for its commercial mortgage loan portfolio. The CECL forecasting methods the Company uses include (i) a probability of default and loss given default method using a third party CMBS/CRE loan database with historical loan loss data beginning in 1998, and (ii) probability weighted expected cash flow method, depending on the type of loan and the availability of relevant historical market loan loss data. The Company might use other acceptable alternative approaches in the future depending on, among other factors, the type of loan, underlying collateral and availability of relevant historical market loan loss data.
The Company estimates its CECL allowance for its loan portfolio at the individual loan level. Significant inputs to the Company’s forecasting methods include (i) key loan-specific inputs such as vintage year, loan term, underlying property type, geographic location, and expected timing and amount of future loan fundings, (ii) performance against the underwritten business plan and our internal loan risk rating, and (iii) a macroeconomic forecast. In certain instances, the Company considers relevant loan-specific qualitative factors to certain loans to estimate its CECL allowance.
The Company’s loans typically include commitments to fund incremental proceeds to its borrowers over the life of the loan. Those future funding commitments are also subject to a CECL reserve. The CECL reserve related to future loan fundings is recorded as a component of other liabilities on the Company’s consolidated balance sheets, and not as an offset to the related loan balance. This CECL reserve is estimated using the same process outlined above for the Company’s outstanding loan balances, and changes in this component of the CECL reserve will similarly flow through the Company’s consolidated statements of operations.
These estimates of the Company’s CECL reserve may change in future periods based on available future macroeconomic, capital markets, loan specific and other data, and might result in a material change in the Company’s future estimates of expected credit losses for its loan portfolio.
Available-for-Sale Securities at Fair Value
From time to time, the Company may selectively invest in commercial mortgage-backed securities, or CMBS, representing interests in pools of commercial mortgage loans issued by trusts. In the past, the Company had designated investments in certain CMBS as available-for-sale, or AFS, because the Company had the ability to dispose of them prior to maturity. All assets classified as AFS would be reported at estimated fair value with unrealized gains and losses included in accumulated other comprehensive income (loss).
GRANITE POINT MORTGAGE TRUST INC.
Notes to the Consolidated Financial Statements
Interest income on AFS securities is accrued based on the outstanding principal balance and contractual terms. Premiums and discounts associated with CMBS are amortized into interest income over the life of such securities using the effective yield method.
As part of the adoption of ASU 2016-13, the Company evaluates AFS securities to determine whether a decline in the fair value below the amortized cost basis (impairment) is due to credit-related factors or noncredit-related factors. Any impairment that is not credit-related is recognized in other comprehensive income (loss), net of applicable taxes. Credit-related impairment is recognized as an allowance for credit losses on the consolidated statements of comprehensive income (loss), limited to the amount by which the amortized cost basis exceeds the fair value, with a corresponding adjustment to earnings. Both the allowance for credit losses and the adjustment to net income (loss) may be reversed if conditions change. Changes in the allowance for credit losses are recorded as provision for credit loss expense. The Company did not hold any AFS securities as of December 31, 2021.
Prior to the adoption of ASU 2016-13, on a quarterly basis, the Company evaluated its AFS securities to assess whether a decline in the fair value of an AFS security below the Company’s amortized cost basis was an other-than-temporary impairment, or OTTI. The presence of OTTI was based upon a fair value decline below a security’s amortized cost basis and a corresponding adverse change in expected cash flows due to credit related factors, as well as non-credit factors, such as changes in interest rates and market spreads. Impairment was considered other-than-temporary if an entity (i) intended to sell the security, (ii) would more likely than not be required to sell the security before it recovered in value, or (iii) did not expect to recover the security’s amortized cost basis, even if the entity did not intend to sell the security. Under these scenarios, the impairment was other-than-temporary and the full amount of impairment recognized in earnings and the cost basis of the investment security was adjusted. However, if an entity did not intend to sell the impaired debt security and it was more likely than not that it would not be required to sell before recovery, the OTTI is separated into (i) the estimated amount relating to credit loss, or credit component, and (ii) the amount relating to all other factors, or non-credit component. Only the estimated credit loss amount was recognized in earnings, with the remainder of the loss amount recognized in other comprehensive income (loss). The difference between the new amortized cost basis and the cash flows expected to be collected was accreted as interest income in accordance with the effective interest method.
Held-to-Maturity Securities
In the past, the Company designated investments in certain CMBS as held-to-maturity, or HTM, because the Company had both the ability and intent to hold them until maturity. All assets classified as HTM were reported at stated cost plus any premiums or discounts, which were amortized or accreted through the consolidated statements of comprehensive income (loss) using the effective interest method.
As part of the adoption of ASU 2016-13, the Company no longer records impairments for credit losses as adjustments to the amortized cost for HTM debt securities, but rather records an allowance for credit losses. The carrying values of debt securities are presented net of any allowance for credit losses. The Company did not hold any HTM securities as of December 31, 2021. Prior to the adoption of ASU 2016-13, the Company evaluated its HTM securities, on a quarterly basis, to assess whether a decline in the fair value of an HTM security below the Company’s amortized cost basis is an OTTI. The presence of OTTI is based upon a fair value decline below a security’s amortized cost basis and a corresponding adverse change in expected cash flows due to credit related factors. Impairment was considered other-than-temporary if an entity did not expect to recover the security’s amortized cost basis. Impairment was recognized in earnings and the cost basis of the HTM security was adjusted.
Loans Held-for-Sale
The Company classifies certain loans as held-for-sale based on management’s intent to sell or otherwise dispose of them. Loans held-for-sale are reported at the lower of amortized cost or fair value. Fair value is determined under the guidance of ASC 820. Interest income on loans held-for-sale is recognized at the loan coupon rate and recorded on the consolidated statements of comprehensive income (loss). income.
Cash and Cash Equivalents
Cash and cash equivalents representinclude cash held in banks and liquid investments with original maturities of three months or less. The Company may have bank balances in excess of federally insured amounts; however, the Company deposits its cashaccounts and cash equivalents with high credit-quality institutions to minimize credit risk exposure. The Company has not experienced, and does not expect, any lossesheld in money market funds on its cash or cash equivalents.
GRANITE POINT MORTGAGE TRUST INC.
Notes to the Consolidated Financial Statements
an overnight basis.Restricted Cash
Restricted cash includes certain cash balances the Company is required to maintain in restricted accounts as collateral for the Company’s repurchase agreements and with counterparties to support activities related to securities. Cash held by counterparties as collateral, which resides in non-interest-bearingnon-interest bearing accounts, is not available to the Company for general corporate purposes, but may be applied against amounts due to securities and repurchase agreement counterparties or returned to the Company when the collateral requirements are exceeded or at the maturity of the repurchase agreement.
Accrued Interest Receivable
Accrued interest receivable represents interest that is due and payable to the Company. Cash interest is generally received within 30 days of recording the receivable. The Company generally writes off the accrued interest receivable balance when interest is 90 days or more past due unless the loan is both well secured and in the process of collection. Write-offs of accrued interest receivable are recognized within the provision for credit lossesinterest income in the consolidated statements of comprehensive income (loss). income. Accrued interest receivable includes deferred interest that may be collected at the loan maturity or past 90 days, and the Company deems probable to collect, and an allowance for credit losses has been included as part of the loan’s amortized cost. Accrued interest receivable is included within other assets on the Company’s consolidated balance sheets.
Due from Counterparties
Due from counterparties includes cash held by counterparties as collateral against the Company’s repurchase agreements but represents excess capacity and deemed unrestricted and a receivable from the counterparty as of the balance sheet date. Due from counterparties is included within other assets on the Company’s consolidated balance sheets.
Real Estate Owned
As part of its portfolio management strategy to maximize an economic outcome from a defaulted loan, the Company may assume legal title or physical possession of the underlying collateral property through foreclosure or the execution of a deed-in-
GRANITE POINT MORTGAGE TRUST INC.
Notes to the Consolidated Financial Statements
lieu of foreclosure. Real estate acquired through a foreclosure or by deed-in-lieu of foreclosure is classified as REO. The Company’s basis in REO and related acquired assets is equal to the estimated fair value of the collateral on the acquisition date and allocated within Real estate owned, Other assets and Other liabilities on the Company’s consolidated balance sheets. The estimated fair value of REO is determined using generally accepted valuation techniques, including a discounted cash flow model and inputs that include the highest and best use for each asset, estimated future values based on discussions with local brokers, investors and other market participants, the estimated holding period for the asset, and discount rates and capitalization rates that reflect estimated investor return requirements for the risks associated with the expected use of each asset. If the estimated fair value of REO is lower than the carrying value of the related loan upon acquisition, the difference is recorded through the provision for credit losses in the Company’s consolidated statements of comprehensive income. Upon acquisition, the Company allocates the fair value of REO to land and land improvements, building and building improvements, tenant improvements, intangible assets and intangible liabilities, as applicable.
As of December 31, 2023, REO and related acquired assets, except for land, are depreciated using the straight-line method over estimated useful lives as follows:
| | | | | | | | |
| Description | | Depreciable Life |
| Building | | 39 years |
| Tenant improvements | | Over lease terms |
| Lease intangibles | | Over lease terms |
Renovations and/or replacements that improve or extend the life of the REO are capitalized and depreciated over their estimated useful lives. The cost of ordinary repairs and maintenance are expensed as incurred in the Company’s consolidated statements of comprehensive income.
Building and tenant improvements depreciation and in-place lease intangibles amortization expense are recognized in expenses from real estate owned operations in the Company’s consolidated statements of comprehensive income. Above-market lease intangibles amortization and below-market lease intangibles accretion are recognized in revenue from real estate owned operations in the Company’s consolidated statements of comprehensive income.
REO is initially measured at fair value and is thereafter subject to an impairment assessment on a quarterly basis. Subsequent to an REO acquisition, events or circumstances may occur that may result in a material and sustained decrease in the cash flows generated from the property. REO is evaluated for recoverability when impairment indicators are identified. Upon the identification of an impairment indicator, an REO asset is further considered for impairment when the sum of estimated future undiscounted cash flows to be generated by the REO asset over the estimated remaining holding period is less than the carrying value of such REO asset. An impairment charge is recorded when the carrying value of the REO exceeds the fair value. When determining the fair value of an REO asset, the Company makes certain assumptions including, but not limited to, projected operating cash flows, comparable selling prices and projected cash flows from the eventual disposition of the REO asset. Any impairment losses and gains or losses on sale are included in the Company’s consolidated statements of comprehensive income. Revenue and expenses from REO operations are included in the consolidated statements of comprehensive income within Revenue from real estate owned operations and Expenses from real estate owned operations, as applicable. The Company did not record any impairments of real estate for the years ended December 31, 2023, and 2022.
Repurchase Agreements
The Company finances the acquisitioncertain of its loans held-for-investment through the use of repurchase agreements. Borrowings under repurchase agreements generally bear interest rates of a specified margin over one-month London Interbank Offered Rate, or LIBOR,SOFR, and are generally uncommitted. The repurchase agreements are treated as collateralized financing transactions and are carried at their contractual amounts, as specified in the respective agreements.
Asset-Specific Financings
The Company finances certain of its loans held-for-investment through the use of an asset-specific financing facility. Borrowings under the asset-specific financing facility generally bear interest rates of a specified margin over one-month LIBOR.SOFR. The asset-specific financings are treated as collateralized financing transactions and are carried at their contractual amounts, as specified in the respective agreements.
RevolvingSecured Credit Facilities
In the past, theThe Company has financed the acquisition offinances certain of its loans held-for-investment through the use of revolvinga secured credit facilities.facility. Borrowings under revolvingthe secured credit facilities havefacility generally bornebear interest rates of a specified margin over one-month LIBOR and have generally been uncommitted. RevolvingSOFR. The secured credit facilitiesfacility financings are treated as collateralized financing transactions and are carried at their contractual amounts, as specified in the respective agreements.
GRANITE POINT MORTGAGE TRUST INC.
Notes to the Consolidated Financial Statements
Deferred Debt Issuance Costs
Because the outstanding balance of the Company’s repurchase agreement facilities, asset-specific financingsfinancing facilities, revolving credit facilities and revolvingsecured credit facilities may fluctuate as the Company borrows and repays amounts, the Company presents unamortized deferred debt issuance costs related to these credit facilities as an asset on its consolidated balance sheets within other assets. Amortization of deferred debt issuance costs over the term of the related facilities is reported within interest expense on the consolidated statements of comprehensive income (loss). income.
Securitized Debt Obligations
The Company finances pools of its loans held-for-investment through CRE CLOs retaining the subordinate securities in its investment portfolio. The CRE CLOs are accounted for as financing arrangements and consolidated on the Company’s consolidated financial statements. The securitized debt obligations not retained by the Company, which are nonrecourse to the Company beyond the assets held in the CRE CLOs, are recorded at outstanding principal balance, net of any unamortized deferred debt issuance costs, on the Company’s consolidated balance sheets. See Note 4 - Variable Interest Entities and Securitized Debt Obligations to the Company’s Consolidated Financial Statements included in this Annual Report on Form 10-K for additional details regarding consolidation of VIEs.
Convertible Senior Notes
Convertible senior notes include unsecured convertible debt that are carried at their unpaid principal balance, net of any unamortized deferred issuance costs, on the Company’s consolidated balance sheets. Interest on the notes is payable semiannually until such time the notes mature or are converted into shares of the Company’s common stock. Amortization of
GRANITE POINT MORTGAGE TRUST INC.
Notes to the Consolidated Financial Statements
deferred debt issuance costs over the term of the notes is reported within interest expense on convertible senior notes on the consolidated statements of comprehensive income (loss). income.
Senior Secured Term Loan Facilities
The Company records senior secured term loan facilities as liabilities at their unpaid principal balance, net of any unamortized deferred issuance costs, on the Company’s consolidated balance sheets. Where applicable, any issue discount or transaction expenses are deferred and amortized over the term of the loan using the effective interest method, and is included within interest expense in the Company’s consolidated statements of comprehensive (loss) income, (loss), while the unamortized balance is included as a reduction to the carrying amount on the Company’s consolidated balance sheets. See Note 7 - Senior Secured Term Loan Facilities and Warrants to Purchase Shares of Common Stock to the Company’s Consolidated Financial Statements included in this Annual Report on Form 10-K for additional details regarding the senior secured term loan facilities and warrants.
Accrued Interest Payable
Accrued interest payable represents interest that is due and payable to third parties.third-parties. Interest is generally paid within 30 days to three months of recording the payable, based upon the Company’s remittance requirements. Accrued interest payable is included within other liabilities on the Company’s consolidated balance sheets.
Income Taxes
The Company has elected to be taxed as a REIT under the Code and the corresponding provisions of state law. To qualify as a REIT, the Company must distribute at least 90% of its annual REIT taxable income to stockholders (not including taxable income retained in its taxable subsidiaries) within the time frame set forth in the Code and the Company must also meet certain other requirements. In addition, because certain activities, if performed by the Company, may cause the Company to earn income which isdoes not qualifyingqualify for the REIT gross income tests, the Company has formed a TRS, as defined in the Code, to engage in such activities. The TRS’s activities are subject to income taxes, as well as any REIT taxable income not distributed to stockholders.
The Company assesses its tax positions for all open tax years and determines whether the Company has any material unrecognized liabilities in accordance with ASC 740, Income Taxes, or ASC 740. The Company records these liabilities to the extent the Company deems them more likely than not to be incurred. The Company classifies interest and penalties on material uncertain tax positions as interest expense and operating expense, respectively, in its consolidated statements of comprehensive income (loss). income.
Related Party Management Fee and Operating Expenses
The Company was externally managed by Pine River Capital Management L.P., or the Former Manager, through December 31, 2020, at which time the Company internalized its management function, or the Internalization. Prior to the Internalization, the Company paid the Former Manager a base management fee equal to 1.5% of the Company’s equity on an annualized basis, as well as an incentive fee, which was payable, if earned, beginning in the fourth quarter of 2018, in accordance with the terms of the management agreement with the Former Manager, or the Management Agreement.
Temporary Equity
The Company accounts for its temporary equity in accordance with ASC 480, Distinguishing Liabilities from Equity. Holders of the Company’s temporary equity have certain preference rights with respect to the common stock. Based on the Company’s analysis, the 10% cumulative redeemable preferred stock has been classified as redeemable interests outside of permanent equity in the mezzanine section of the Company’s consolidated balance sheets as a result of certain redemption requirements or other terms. The Company redeemed the 10% cumulative redeemable preferred stock during the year ended December 31, 2023.
Permanent Equity
The Company has common stock and preferred stock outstanding that are classified as permanent equity. The Company’s common stock is perpetual in nature with voting rights and dividend rights. The Company’s 7.00% Series A Fixed-to-Floating Rate Cumulative Redeemable Preferred Stock, or the Series A Preferred Stock is classified as permanent equity. The outstanding shares of Series A Preferred Stock have a 7.00% dividend rate and may be redeemed by the Company on and after November 30, 2026. See Note 11 – Preferred Stockto the Company’s Consolidated Financial Statements included in this
GRANITE POINT MORTGAGE TRUST INC.
Notes to the Consolidated Financial Statements
Financial Statements included in this Annual Report on Form 10-K for additional details regarding the Series A Preferred Stock.
Earnings (Loss) Per Share
Basic and diluted earnings per share are computed by dividing net income by the weighted average number of common shares and potential common shares outstanding. For both basic and diluted per share calculations, potential common shares representrepresents issued and unvested shares of restricted stock, which have full rights to the common stock dividend declarations of the Company. If the assumed conversion of convertible notes into common shares is dilutive, diluted earnings per share is adjusted by adding back the periodic interest expense (net of any tax effects) associated with dilutive convertible notes to net income attributable to common stockholders and adding the shares issued in an assumed conversion to the diluted weighted average share count.
Other Comprehensive Income (Loss)
Current period net unrealized gains and losses on AFS securities are reported as components of accumulated other comprehensive income (loss) on the consolidated statements of stockholders’ equity and in the consolidated statements of comprehensive income (loss).
Equity Incentive PlanPlans
The Company has adopted the 2017 Equity Incentive Plan, or the 2017 Plan, to provide incentive compensation to attract and retain qualified directors, officers, advisors, consultants and other personnel. The Plan is administered by the compensation committee of the Company’s board of directors. The Plan permitspermitted the granting of restricted shares of common stock, phantom shares, dividend equivalent rights and other equity-based awards.
On June 2, 2022, the Company’s stockholders approved the adoption of the Granite Point 2022 Omnibus Incentive Plan, or the 2022 Plan. The 2022 Plan permits the granting of stock options, stock appreciation rights, restricted stock, restricted stock units (both non-performance-based, or RSUs, and performance-based, or PSUs), dividend equivalent rights, other stock-based awards and other cash-based awards to employees, certain consultants of the Company and members of the board of directors. Since the adoption of the 2022 Plan, no new equity awards may be granted under the 2017 Plan, but previously-granted RSUs and PSUs remained outstanding under the 2017 Plan as of December 31, 2023.
See Note 13 - Equity Incentive PlanPlans for further details regarding the Plan.Equity Incentive Plans.
The cost of equity-based compensation is measured on and fixedat its fair value at the grant date, based on the price of the Company’s commondate. Restricted stock as of period end, and RSU-related compensation is amortized over the vesting term. PSU-related compensation is amortized over the vesting term to the extent that management estimates that it is probable that the performance conditions will be achieved. Changes in the estimate of the probability of achievement of the PSU performance conditions are recorded as a cumulative catch-up adjustment to retroactively apply the new estimate. The Company accounts for forfeitures as they occur. Amortization expense is included within other operating expensescompensation expense on the consolidated statements of comprehensive income (loss). income.
Restructuring Charges
The termination of the Management Agreement was a material change in the management structure of the business, and is accounted for under ASC 420, Exit or disposal cost obligations. The one-time payment made to the Former Manager under the internalization agreement, and other associated costs incurred as part of the Internalization, were recorded within restructuring charges on the consolidated statements of comprehensive income (loss) with a corresponding liability recorded within other liabilities on the consolidated balance sheets. See Note 14 - Restructuring Charges for further details.
Recently Issued and/or Adopted Accounting Standards
Financial Instruments-Credit Losses (Topic 326): Troubled Debt Restructurings and Vintage Disclosures
In March 2022, the FASB issued Accounting Standards Update, or ASU, 2022-02, Financial Instruments – Credit Losses (Topic 326): Troubled Debt Restructurings and Vintage Disclosures, or ASU 2022-02. The new guidance is based on whether a modification or restructuring with a borrower experiencing financial difficulty results in principal forgiveness, an interest rate reduction, a significant payment delay or term extension as opposed to simply a concession. The new guidance requires disclosure by class of financing receivables, of the types of modifications, the financial effects of those modifications and the performance of those modified receivables in the last twelve months. As it relates to Accounting Standards Codification, or ASC, 326-20, the Company is now allowed to use any acceptable method to determine credit losses as a result of modification or restructuring with a borrower experiencing financial difficulty. ASU 2022-02 also requires disclosure of gross write-offs recorded in the current period, on a year-to-date basis, and by year of origination in the vintage disclosures. On January 1, 2023, the Company adopted ASU 2022-02 on a prospective basis and the adoption did not have a material impact on the Company’s consolidated financial statements.
Facilitation of the Effects of Reference Rate Reform on Financial Reporting (Topic 848)
LIBOR, which had been the primary reference rate for the Company’s floating rate financing arrangements, was previously the subject of regulatory guidance and proposals for reform or replacement. The Federal Reserve, in conjunction with the Alternative Reference Rates Committee, a steering committee composed of large U.S. financial institutions, identified SOFR, an index calculated using short-term repurchase agreements backed by U.S. Treasury securities, as its preferred alternative rate for LIBOR. As of December 31, 2023, all of the Company’s floating rate loans and outstanding related financings earned a rate of interest indexed to SOFR.
Segment Reporting (Topic 280): Improvements to Reportable Segment Disclosures
In March 2020,November 2023, the Financial Accounting Standards Board, or FASB issued ASU No. 2020-04,2023-07, Reference Rate ReformSegment Reporting (Topic 848)280): Facilitation of the Effects of Reference Rate Reform on Financial Reporting, Improvements to Reportable Segment Disclosures, or ASU No. 2020-04, which provides optional expedients and exceptions for applying GAAP2023-07. The new guidance requires a public entity with a single reportable segment to debt instruments, derivatives,provide new disclosures surrounding segment expenses and other contracts that reference LIBOR or other reference rates expected to be discontinued as a result of reference rate reform. This guidance is optionalsegment items on an annual and may be elected through December 31, 2022, using a prospective application on all eligible contract modifications. The Company has loan agreements, and debt agreements that incorporate LIBOR as a referenced interest rate. It is difficult to predict what effect, if any,interim basis, with the phase-out of LIBOR and the use of alternative benchmarks may have on the Company’s business or on the overall financial markets. The Company has not adopted any of the optional expedients or exceptions through December 31, 2021, but will continue to evaluate the possible adoption of any such expedients or exceptions.
Accounting for Convertible Instruments and Contracts in an Entity’s Own Equity
In August 2020, FASB issued ASU No. 2020-06, Debt – Debt with Conversion and Other Options (Subtopic 470-20) and Derivatives and Hedging – Contracts in an Entity’s Own Equity (Subtopic 815-40): Accounting for Convertible Instruments and Contracts in an Entity’s Own Equity, or ASU No. 2020-06. The intention of improving reportable segment disclosure requirements as well as enhancing interim disclosure requirements. ASU No. 2020-062023-07 is to address the complexities in accounting for certain financial instruments with a debt and equity component. Under ASU No. 2020-06, the number of accounting models for convertible notes will be reduced and entities that issue convertible debt will be required to use the if-converted method for the computation of diluted "Earnings per share" under ASC 260. ASC 2020-06 is effective for fiscal years beginning after December 15, 2021, and may be adopted through either a modified retrospective method of transition or a fully retrospective method of transition. There will be no impact to the Company’s consolidated financial statements upon adoption of ASU 2020-06.
GRANITE POINT MORTGAGE TRUST INC.
Notes to the Consolidated Financial Statements
effective for fiscal years beginning after December 15, 2023, and for interim periods with fiscal years beginning after December 15, 2024, with the guidance to be adopted retrospectively to all prior periods presented. The Company is currently evaluating the impact ASU 2023-07 will have on our consolidated financial statements.
Income Taxes (Topic 740): Improvements to Income Tax Disclosures
In December 2023, the FASB issued ASU 2023-09, Income Taxes (Topic 740): Improvements to Income Tax Disclosures, or ASU 2023-09. The new guidance requires entities to disclose the amount of income taxes paid, net of refunds received, disaggregated by federal, state and foreign jurisdiction, with the intention of improving the transparency of income tax disclosures. ASU 2023-09 is effective for fiscal years beginning after December 15, 2024, and is to be adopted on a prospective basis with the option to apply retrospectively. The Company is currently evaluating the impact of this guidance but does not anticipate it will have a material impact on the Company’s consolidated financial statements.
Note 3. Loans Held-for-Investment, Net of Allowance for Credit Losses
The Company originates and acquires commercial real estate debt and related instruments generally to be held as long-term investments. These assets are classified as “loans held-for-investment” on the consolidated balance sheets. Loans held-for-investment are reported at cost, net of any unamortized acquisition premiums or discounts, loan fees, origination costs and allowance for credit losses, as applicable.
The following tables summarize the Company’s loans held-for-investment by asset type, property type and geographic location as of December 31, 2021,2023, and December 31, 2020:2022:
| | December 31,
2021 |
| December 31, 2023 | |
| December 31, 2023 | |
| December 31, 2023 | |
| (dollars in thousands) | (dollars in thousands) | Senior Loans (1) | | Mezzanine Loans | | B-Notes | | Total | (dollars in thousands) | Senior Loans(1) | | | | B-Notes | | Total |
| Unpaid principal balance | Unpaid principal balance | $ | 3,781,771 | | | $ | 1,048 | | | $ | 14,006 | | | $ | 3,796,825 | |
| Unamortized (discount) premium | Unamortized (discount) premium | (70) | | | — | | | — | | | (70) | |
| Unamortized net deferred origination fees | Unamortized net deferred origination fees | (14,550) | | | — | | | — | | | (14,550) | |
| Allowance for credit losses | Allowance for credit losses | (38,719) | | | (1,048) | | | (1,130) | | | (40,897) | |
| Carrying value | Carrying value | $ | 3,728,432 | | | $ | — | | | $ | 12,876 | | | $ | 3,741,308 | |
| Unfunded commitments | Unfunded commitments | $ | 403,584 | | | $ | — | | | $ | — | | | $ | 403,584 | |
| Number of loans | Number of loans | 103 | | | 1 | | | 1 | | | 105 | |
| Weighted average coupon | 4.5 | % | | 13.0 | % | | 8.0 | % | | 4.5 | % |
Weighted average years to maturity (2) | 1.1 | | 3.9 | | 5.1 | | 1.1 |
Weighted average coupon(2) | | Weighted average coupon(2) | 8.2 | % | | | | 8.0 | % | | 8.2 | % |
Weighted average years to maturity(3) | | Weighted average years to maturity(3) | 0.7 | | | | 3.1 | | 0.7 |
| | December 31,
2020 |
| December 31, 2022 | |
| December 31, 2022 | |
| December 31, 2022 | |
| (dollars in thousands) | (dollars in thousands) | Senior Loans (1) | | Mezzanine Loans | | B-Notes | | Total | (dollars in thousands) | Senior Loans(1) | | | | B-Notes | | Total |
| Unpaid principal balance | Unpaid principal balance | $ | 3,915,833 | | | $ | 2,366 | | | $ | 14,235 | | | $ | 3,932,434 | |
| Unamortized (discount) premium | Unamortized (discount) premium | (75) | | | — | | | — | | | (75) | |
| Unamortized net deferred origination fees | Unamortized net deferred origination fees | (17,890) | | | — | | | — | | | (17,890) | |
| Allowance for credit losses | Allowance for credit losses | (60,130) | | | (2,366) | | | (4,170) | | | (66,666) | |
| Carrying value | Carrying value | $ | 3,837,738 | | | $ | — | | | $ | 10,065 | | | $ | 3,847,803 | |
| Unfunded commitments | Unfunded commitments | $ | 503,726 | | | $ | — | | | $ | — | | | $ | 503,726 | |
| Number of loans | Number of loans | 101 | | | 1 | | | 1 | | | 103 | |
| Weighted average coupon | 5.1 | % | | 13.0 | % | | 8.0 | % | | 5.1 | % |
Weighted average years to maturity (2) | 1.1 | | 4.9 | | 6.1 | | 1.1 |
Weighted average coupon(2) | | Weighted average coupon(2) | 6.3 | % | | | | 8.0 | % | | 6.3 | % |
Weighted average years to maturity(3) | | Weighted average years to maturity(3) | 1.0 | | | | 4.1 | | 1.0 |
____________________
(1)Loans primarily secured by a first priority lien on commercial real property and related personal property and also includes, when applicable, any companion subordinate loans.
(2)Weighted average coupon inclusive of the impact of nonaccrual loans.
(3)Based on contractual maturity date. Certain loans are subject to contractual extension options with such conditions stipulated in the applicable loan documents. Actual maturities may differ from contractual maturities stated herein as certain borrowers may have the right to prepay with or without paying a prepayment fee. The Company may also extend contractual maturities in connection with certain loan modifications.
GRANITE POINT MORTGAGE TRUST INC.
Notes to the Consolidated Financial Statements
| | (dollars in thousands) | (dollars in thousands) | | December 31,
2021 | | December 31,
2020 | (dollars in thousands) | | December 31, 2023 | | December 31, 2022 |
| Property Type | Property Type | | Carrying Value | | % of Loan Portfolio | | Carrying Value | | % of Loan Portfolio | Property Type | | Carrying Value | | % of Loan Portfolio | | Carrying Value | | % of Loan Portfolio |
| Office | Office | | $ | 1,703,951 | | | 45.5 | % | | $ | 1,720,705 | | | 44.7 | % | Office | | $ | 1,116,551 | | | 43.2 | | 43.2 | % | | $ | 1,348,205 | | | 41.3 | | 41.3 | % |
| Multifamily | Multifamily | | 1,061,434 | | | 28.4 | % | | 910,557 | | | 23.7 | % | Multifamily | | 826,125 | | | 32.0 | | 32.0 | % | | 1,008,177 | | | 30.9 | | 30.9 | % |
| Hotel | Hotel | | 464,816 | | | 12.4 | % | | 646,869 | | | 16.8 | % | Hotel | | 180,891 | | | 7.0 | | 7.0 | % | | 337,264 | | | 10.3 | | 10.3 | % |
| Retail | Retail | | 341,834 | | | 9.1 | % | | 332,218 | | | 8.6 | % | Retail | | 257,945 | | | 10.0 | | 10.0 | % | | 303,266 | | | 9.3 | | 9.3 | % |
| Industrial | Industrial | | 118,564 | | | 3.2 | % | | 196,677 | | | 5.1 | % | Industrial | | 113,972 | | | 4.4 | | 4.4 | % | | 185,337 | | | 5.6 | | 5.6 | % |
| Other | Other | | 50,709 | | | 1.4 | % | | 40,777 | | | 1.1 | % | Other | | 88,341 | | | 3.4 | | 3.4 | % | | 85,566 | | | 2.6 | | 2.6 | % |
| Total | Total | | $ | 3,741,308 | | | 100.0 | % | | $ | 3,847,803 | | | 100.0 | % | Total | | $ | 2,583,825 | | | 100.0 | | 100.0 | % | | $ | 3,267,815 | | | 100.0 | | 100.0 | % |
| | (dollars in thousands) | (dollars in thousands) | | December 31,
2021 | | December 31,
2020 | (dollars in thousands) | | December 31, 2023 | | December 31, 2022 |
| Geographic Location | Geographic Location | | Carrying Value | | % of Loan Portfolio | | Carrying Value | | % of Loan Portfolio | Geographic Location | | Carrying Value | | % of Loan Portfolio | | Carrying Value | | % of Loan Portfolio |
| Northeast | Northeast | | $ | 917,029 | | | 24.5 | % | | $ | 1,028,584 | | | 26.8 | % | Northeast | | $ | 709,838 | | | 27.5 | | 27.5 | % | | $ | 834,985 | | | 25.5 | | 25.5 | % |
| Southwest | Southwest | | 836,955 | | | 22.4 | % | | 802,233 | | | 20.8 | % | Southwest | | 495,133 | | | 19.2 | | 19.2 | % | | 675,288 | | | 20.7 | | 20.7 | % |
| West | West | | 658,429 | | | 17.6 | % | | 682,236 | | | 17.7 | % | West | | 328,547 | | | 12.7 | | 12.7 | % | | 519,244 | | | 15.9 | | 15.9 | % |
| Midwest | Midwest | | 637,784 | | | 17.0 | % | | 712,675 | | | 18.5 | % | Midwest | | 421,881 | | | 16.3 | | 16.3 | % | | 546,030 | | | 16.7 | | 16.7 | % |
| Southeast | Southeast | | 691,111 | | | 18.5 | % | | 622,075 | | | 16.2 | % | Southeast | | 628,426 | | | 24.3 | | 24.3 | % | | 692,268 | | | 21.2 | | 21.2 | % |
| | Total | Total | | $ | 3,741,308 | | | 100.0 | % | | $ | 3,847,803 | | | 100.0 | % |
| Total | |
| Total | | | $ | 2,583,825 | | | 100.0 | % | | $ | 3,267,815 | | | 100.0 | % |
At December 31, 2021,2023, and December 31, 2020, the Company pledged2022, loans held-for-investment with a carrying value, net of allowance for credit losses, of $3.7$2.5 billion and $3.8$3.2 billion, respectively, as collateral under repurchase facilities, an asset-specificcollateralized the Company’s secured financing facility, a term financing facilityagreements and securitized debt obligations.CRE CLOs. See Note 45 - Variable Interest Entities and Securitized Debt Obligations, and Note 56 - Secured Financing Agreements.Agreements, for further detail.
Loan Portfolio Activity
The following table summarizes activity related to loans held-for-investment, net of allowance for credit losses, for the year ended December 31, 2021,2023, and 2020:2022:
| | | Year Ended December 31, |
| | | | Year Ended December 31, | |
| | | | Year Ended December 31, | |
| | | | Year Ended December 31, | |
| (in thousands) | (in thousands) | | 2021 | | 2020 | | (in thousands) | | | | | | 2023 | | 2022 |
| Balance at beginning of period | Balance at beginning of period | | $ | 3,847,803 | | | $ | 4,226,212 | | |
| Originations, additional fundings, upsizing of loans and capitalized deferred interest | Originations, additional fundings, upsizing of loans and capitalized deferred interest | | 834,461 | | | 372,859 | | |
| | Repayments | Repayments | | (960,330) | | | (486,422) | | |
| Transfers to loans held-for-sale | | — | | | (210,452) | | |
| Repayments | |
| Repayments | |
| Loan sales | |
| | Transfers to real estate owned | |
| Transfers to real estate owned | |
| Transfers to real estate owned | |
| Net discount accretion (premium amortization) | Net discount accretion (premium amortization) | | 5 | | | 13 | | |
| Increase in net deferred origination fees | Increase in net deferred origination fees | | (9,766) | | | (3,642) | | |
| Amortization of net deferred origination fees | Amortization of net deferred origination fees | | 13,106 | | | 15,901 | | |
| | Benefit from (provision for) credit losses | | 16,029 | | | (66,666) | | |
| | Provision for credit losses | |
| | Provision for credit losses | |
| | Provision for credit losses | |
| Balance at end of period | Balance at end of period | | $ | 3,741,308 | | | $ | 3,847,803 | | |
Allowance for Credit Losses
Subsequent toDuring the adoption of ASU 2016-13 on January 1, 2020, to estimate and recognize an allowance for credit losses on loans held-for-investment and the related unfunded commitments,year ended December 31, 2023, the Company continuesfunded $71.3 million of prior commitments and upsizings and originated one new loan with an initial funding of $48.8 million related to use a third party licensed probability-weighted analytical model.resolution of a nonaccrual loan with an unpaid principal balance of $92.6 million, which resulted in a write-off of $(33.3) million. Additionally, the Company received $609.1 million of full loan repayments, and partial paydowns and amortization of $55.9 million, for total loan repayments, paydowns and amortization of $665.0 million, inclusive of the resolution of the nonaccrual loan. The Company employs quarterly updated macroeconomic forecasts, which reflecttransferred to held-for-sale and subsequently sold a senior loan with an unpaid principal balance of $31.8 million, incurring a write-off of $(16.8) million at the ongoing impacttime of transfer. Finally, the COVID-19 pandemic onCompany converted to REO a senior loan with an unpaid principal balance of $28.2 million, incurring a write-off of $(4.2) million at the overall U.S. economy and commercial real estate markets generally. Those macroeconomic forecasts have been improving, including expectations for overall economic output and valuestime of real estate properties. Significant inputs to the Company’s estimate of the allowance for credit losses include loan specific factors such as debt service coverage ratio, or DSCR, loan to value ratio, or LTV, remaining contractual loan term, property type and others. Inconversion.
GRANITE POINT MORTGAGE TRUST INC.
Notes to the Consolidated Financial Statements
certain instances,Allowance for loans with unique risk and credit characteristics,Credit Losses
The following table presents the Company may instead elect to employ different methods to estimate an allowance for credit losses that also conform to ASU 2016-13 and related guidance.
As of December 31, 2021, the Company recognized an allowance for credit losses related to its loans held-for-investment of $40.9 million, which reflected a write-off of $(9.7) million on a loan held-for-investment and a benefit from provision for credit losses of $16.0 millionchanges for the year ended December 31, 2021. The benefit from provision for credit losses reflects the continued general improvement2023, and 2022 in the overall performance of the investment portfolio, loan repayments, and current expectations for further moderate improvement in macroeconomic conditions.
The allowance for credit losses related to the Company’s loans held-for-investment is deducted from the amortized cost basis of related loans, while the allowance for credit losses on loans held-for-investment:
| | | | | | | | | | | | | | | | | | |
| | | | Year Ended December 31, |
| (in thousands) | | | | | | 2023 | | 2022 |
| Balance at beginning of period | | | | | | $ | 82,335 | | | $ | 40,897 | |
| Provision for (benefit from) credit losses | | | | | | 106,600 | | | 67,556 | |
| Write-off | | | | | | (54,274) | | | (25,606) | |
| Recoveries of amounts previously written off | | | | | | — | | | (512) | |
| Balance at end of period | | | | | | $ | 134,661 | | | $ | 82,335 | |
During the year ended December 31, 2023, the Company recorded an increase of $52.3 million to its allowance for credit losses on loans held-for-investment. The increase was primarily due to: (i) $56.3 million related to off-balance sheet unfunded commitments on existingfive loans is recorded(one hotel loan, one multifamily loan, one office loan and two mixed-use office and retail loans that were assessed as collateral-dependent loans for the first time during the year ended December 31, 2023); (ii) $20.0 million related to further deterioration of local market fundamentals for one office loan that had been previously assessed as a componentcollateral-dependent loan; (iii) $0.2 million from more adverse macroeconomic forecasts and other loan specific assumptions employed in estimating the general CECL reserve, partially offset by a decrease of: (i) $5.9 million resulting from a $(16.8) million write-off on a transfer of other liabilitiesone office loan to held-for-sale; (ii) $4.7 million resulting from a $(4.2) million write-off attributable to an office loan converted to REO; and (iii) $13.6 million resulting from a $(33.3) million write-off on the Company’s consolidated balance sheets. a coordinated sale through a deed-in-lieu of foreclosure transaction of one office loan.
As of December 31, 2021,2023, the Company recognized $1.5$2.5 million in other liabilities related to the allowance for credit losses on unfunded commitments, resulting in a total allowance for credit losses of $137.1 million, and recorded a benefit from provision for credit losses of $4.0$1.8 million for the year ended December 31, 2021, mainly related2023, due to the release of a $3.2 million allowance for credit losses related todecrease in unfunded commitments, on the office loan that had previously been deemed to be collateral-dependent and for which the unfunded commitments were deemed to be unlikely to be funded, given the loan’s delinquent status as of December 31, 2021. Changesresulting in thea total provision for credit losses for both loans held-for-investment and their related unfunded commitments are recognized through net income (loss) on the Company’s consolidated statements of comprehensive income (loss).
The following table presents the changes$(104.8) million for the year ended December 31, 2021,2023.
As of December 31, 2023, the Company had six collateral-dependent loans with an aggregate principal balance of $335.7 million, for which the Company recorded an allowance for credit losses of $91.4 million. These loans were individually assessed in accordance with the CECL framework and 2020 in the allowance for credit losses was determined based on the estimates of the collateral properties’ fair value. Two of the collateral-dependent loans held-for-investment:
| | | | | | | | | | | | | | | | | |
| | | | | Year Ended December 31, |
| (in thousands) | | | | | 2021 | | 2020 | | |
| Balance at beginning of period | | | | | $ | 66,666 | | | $ | 16,692 | | | |
| (Benefit from) provision for credit losses | | | | | (16,029) | | | 49,974 | | | |
| Write-off | | | | | (9,740) | | | — | | | |
| | | | | | | | | |
| Balance at end of period | | | | | $ | 40,897 | | | $ | 66,666 | | | |
Generally,were first mortgage loans held-for-investment are placed on nonaccrual status when delinquent for more than 90 days or earlier when determined not to be probable of full collection. Interest income recognition is suspended when loans are placed on nonaccrual status.
During the year ended December 31, 2021, the Company resolved the nonaccrual status of a senior loan secured by office properties, one first mortgage loan was secured by a hotel property, one first mortgage loan was secured by a multifamily property, and two first mortgage loans were secured by mixed-use office and retail properties. The performance of the collateral properties securing these loans has been impacted by an increasingly uncertain macroeconomic and commercial real estate market outlook, which includes weakening in credit fundamentals, capital markets volatility and significantly reduced real estate transaction activity, especially for certain property types, such as office assets located in New York City with an unpaid principal balanceunderperforming markets, and a meaningfully higher cost of $22.0 millioncapital driven by significant increases in interest rates. These macroeconomic and carrying value of $17.8 million. The Company received all interest that was previously duemarket factors have resulted in the amountslowing of approximately $1.6 million, which was recorded in interest incomebusiness plan execution and reduced market liquidity, thereby impacting the borrowers’ ability to either sell or refinance their properties to repay the Company’s loans. See Note 9 - Fair Value, for further detail on the Company’s consolidated statementsfair value measurement of comprehensive income (loss). Given these facts and the Company’s expectations for the loan to be performing in accordance with the terms of the loan agreement, the loan was reinstated to accrual status.loans.
During the year ended December 31, 2021, the Company resolved a senior loan that had an outstanding unpaid principal balance of $68.1 million. The loan had been placed on nonaccrual status during the year ended December 31, 2021. The Company recognized a write-off of $(9.7) million on the discounted payoff of the loan.
As of December 31, 2021, the Company had two senior loans with a total unpaid principal balance of $168.1 million and carrying value of $145.4 million that were held on nonaccrual status. No other loans were considered past dueAdditionally, as of December 31, 2021.2023, the Company had one collateral-dependent loan with a principal balance of $66.0 million secured by an office property, for which the Company recorded no allowance for credit losses as the collateral’s estimated fair value exceeded the loan balance. See Note 9 - Fair Value, for further detail on the fair value measurement of this loan.
GRANITE POINT MORTGAGE TRUST INC.
Notes to the Consolidated Financial Statements
Nonaccrual Loans
The following table presents the carrying value of loans held-for-investment on nonaccrual status for the year ended December 31, 2021,2023, and 2020:2022:
| | Year Ended December 31, | |
| | | | Year Ended December 31, | |
| | | | Year Ended December 31, | |
| | | | Year Ended December 31, | |
| (in thousands) | (in thousands) | 2021 | 2020 | | (in thousands) | | | | | | 2023 | | 2022 |
| Nonaccrual loan carrying value at beginning of period | Nonaccrual loan carrying value at beginning of period | $ | 17,835 | | $ | — | | |
| Addition of nonaccrual loan carrying value | Addition of nonaccrual loan carrying value | $ | 203,668 | | $ | 17,835 | | |
| Removal of nonaccrual loan carrying value | $ | (76,133) | | $ | — | | |
| Reduction of nonaccrual loan carrying value | |
| Nonaccrual loan carrying value at end of period | Nonaccrual loan carrying value at end of period | $ | 145,370 | | $ | 17,835 | | |
As of December 31, 2023, the Company had eight senior loans with a total unpaid principal balance of $450.1 million and carrying value of $343.7 million that were held on nonaccrual status, compared to four senior loans with a total unpaid principal balance of $247.3 million and carrying value of $208.0 million that were held on nonaccrual status as of December 31, 2022. All other loans were considered current with respect to interest payments due as of the years ended December 31, 2023, and December 31, 2022.
Loan Modifications
The Company may amend or modify a loan depending on the loan’s specific facts and circumstances. These loan modifications typically include additional time for the borrower to refinance or sell the collateral property, adjustment or waiver of performance tests that are prerequisite to the extension of a loan’s maturity, and/or deferral of scheduled principal payments. In exchange for a modification, the Company may receive a partial repayment of principal, a short-term accrual of capitalized interest for a portion of interest due, a cash infusion to replenish interest or capital improvement reserves, termination of all or a portion of the remaining unfunded loan commitment, additional call protection, and/or an increase in the loan coupon or fees.
During the year ended December 31, 2023, the Company completed the modification of a first mortgage loan with a principal balance of $48.5 million and an amortized cost of $48.3 million secured by a multifamily student housing property in Louisville, KY. The terms of the modification included, among other things, a 12-month extension of the fully-extended maturity date to November 9, 2024, the full deferral of debt service payments with interest capitalized and compounding, the deferral of the extension fee and the Company’s agreement to pay for approved expenses, in its sole discretion. Due to the uncertainty with respect to the collection of future interest accruals, the loan was placed on nonaccrual status.
Loan Risk Ratings
The Company’s primary credit quality indicators are its risk ratings. The Company evaluates the credit quality of each loan at least quarterly by assessing the risk factors of each loan and assigning a risk rating based on a variety of factors. Risk factors considered in the assessment include, but are not limited to, property type, geographic and local market dynamics, physical condition, leasing and tenant profile, projected cash flow, collateral performance, loan structure and exit plan, origination LTV, project sponsorship and other factors deemed necessary. RiskThe Company evaluates these factors with respect to each loan investment on a case-by-case basis taking into consideration such loan’s facts and circumstances at the time. The risk factors may be given different weightings and consideration depending on each loan’s situation. Loans are rated “1” (less risk) through “5” (greater risk), which ratings are defined as follows:
1 –Lower Risk
2 –Average Risk
3 –Acceptable Risk
4 –Higher Risk: A loan that has exhibited material deterioration in cash flows and/or other credit factors, which, if negative trends continue, could be indicative of probability of principal loss.
5 –Loss Likely: A loan that has a significantly increased probability of principal loss.
GRANITE POINT MORTGAGE TRUST INC.
Notes to the Consolidated Financial Statements
The following table presents the number of loans, unpaid principal balance and carrying value by risk rating for loans held-for-investment as of December 31, 2021,2023, and December 31, 2020:2022:
| | (dollars in thousands) | (dollars in thousands) | | December 31,
2021 | | December 31,
2020 | (dollars in thousands) | | December 31, 2023 | | December 31, 2022 |
| Risk Rating | Risk Rating | | Number of Loans | | Unpaid Principal Balance | | Carrying Value | | Number of Loans | | Unpaid Principal Balance | | Carrying Value | Risk Rating | | Number of Loans | | Unpaid Principal Balance | | Carrying Value | | Number of Loans | | Unpaid Principal Balance | | Carrying Value |
| 1 | 1 | | 9 | | | $ | 245,939 | | | $ | 245,042 | | | 6 | | | $ | 183,369 | | | $ | 182,730 | |
| 2 | 2 | | 58 | | | 2,002,008 | | | 1,983,615 | | | 50 | | | 1,863,590 | | | 1,847,332 | |
| 3 | 3 | | 25 | | | 747,631 | | | 739,343 | | | 29 | | | 1,055,782 | | | 1,026,662 | |
| 4 | 4 | | 11 | | | 633,153 | | | 627,938 | | | 17 | | | 762,636 | | | 732,310 | |
| 5 | 5 | | 2 | | | 168,094 | | | 145,370 | | | 1 | | | 67,057 | | | 58,769 | |
| Total | Total | | 105 | | | $ | 3,796,825 | | | $ | 3,741,308 | | | 103 | | | $ | 3,932,434 | | | $ | 3,847,803 | |
As of December 31, 2021,2023, the weighted average risk rating of the Company’s loan portfolio was 2.6,2.8, versus 2.5 as of December 31, 2022, weighted by unpaid principal balance, versus 2.7balance. The change in portfolio risk rating as of December 31, 2020. The moderate improvement2023, versus December 31, 2022, is mainly a result of changes in portfolio mix from loan payoffs and paydowns and select loan rating downgrades, including four loans downgraded to a “5”, partially offset by the portfolio’s average risk rating year-over-year reflects originationstransfer of newa previously “5” rated loan to loans held-for-sale, the ongoing economic and market recovery from the COVID-19 pandemic, the advancementtransfer of business plans for the collateral properties,a previously “5” rated loan to REO and the resulting improvement in the performanceresolution of the properties securing the Company’sa previously “5” rated loan portfolio, which resulted in risk rating upgrades in the portfolio duringinvolving a coordinated sale through a deed-in-lieu of foreclosure transaction as described above.
During the year ended December 31, 2021.2023, as part of its quarterly risk rating process, the Company downgraded four loans from a risk rating of “4” to a risk rating of “5”. These four loans included two mixed-use retail and office loans, one office loan and one hotel loan with an aggregate outstanding principal balance of $230.7 million and were downgraded due to the challenging leasing environment including office market fundamentals, uncertain and volatile capital market conditions resulting in limited liquidity for real estate transactions, and other factors related to property specific operating performance.
During the year ended December 31, 2023, the Company transferred to REO a risk-rated “5” office loan with an outstanding principal balance of $28.2 million. See Note 4 - Real Estate Owned, Net, for further detail.
During the year ended December 31, 2023, the Company transferred to loan held-for-sale and subsequently sold a risk-rated “5” office loan with an outstanding principal balance of $31.8 million.
During the year ended December 31, 2023, the Company resolved a risk-rated “5” office loan with an outstanding principal balance of $92.6 million through a deed-in-lieu of foreclosure and a coordinated sale of the collateral property.
GRANITE POINT MORTGAGE TRUST INC.
Notes to the Consolidated Financial Statements
The following table presents the carrying value of loans held-for-investment as of December 31, 2021,2023, and 2020December 31, 2022, by risk rating and year of origination:
| | | | | | | | | | | | | | | | | | | | | | | | | | | | | | | | | | | | | | | | | | | | | | | | | | |
| | December 31, 2021 |
| (dollars in thousands) | | Origination Year | | |
| Risk Rating | | 2021 | | 2020 | | 2019 | | 2018 | | 2017 | | 2016 | | Prior | | Total |
| 1 | | $ | — | | | $ | — | | | $ | 136,138 | | | $ | 75,592 | | | $ | — | | | $ | 33,312 | | | $ | — | | | $ | 245,042 | |
| 2 | | $ | 623,992 | | | $ | 90,381 | | | $ | 828,432 | | | $ | 347,173 | | | $ | 12,877 | | | $ | 31,872 | | | $ | 48,888 | | | $ | 1,983,615 | |
| 3 | | $ | 45,062 | | | $ | 59,186 | | | $ | 147,214 | | | $ | 242,662 | | | $ | 153,732 | | | $ | 68,012 | | | $ | 23,475 | | | $ | 739,343 | |
| 4 | | $ | — | | | $ | — | | | $ | 260,672 | | | $ | 74,808 | | | $ | 173,081 | | | $ | — | | | $ | 119,377 | | | $ | 627,938 | |
| 5 | | $ | — | | | $ | — | | | $ | — | | | $ | 99,515 | | | $ | 45,855 | | | $ | — | | | $ | — | | | $ | 145,370 | |
| Total | | $ | 669,054 | | | $ | 149,567 | | | $ | 1,372,456 | | | $ | 839,750 | | | $ | 385,545 | | | $ | 133,196 | | | $ | 191,740 | | | $ | 3,741,308 | |
| | | | | | | | | | | | | | | | | | | | | | | | | | | | | | | | | | | | | | | | | | | | | |
| | December 31, 2020 | |
| (dollars in thousands) | | Origination Year | | | |
| Risk Rating | | 2020 | | 2019 | | 2018 | | 2017 | | 2016 | | Prior | | Total | |
| 1 | | $ | — | | | $ | 18,291 | | | $ | 75,190 | | | $ | 55,706 | | | $ | 33,543 | | | $ | — | | | $ | 182,730 | | |
| 2 | | $ | 75,707 | | | $ | 1,014,194 | | | $ | 472,491 | | | $ | 194,625 | | | $ | 35,999 | | | $ | 54,316 | | | $ | 1,847,332 | | |
| 3 | | $ | 12,377 | | | $ | 395,160 | | | $ | 304,104 | | | $ | 247,120 | | | $ | 67,901 | | | $ | — | | | $ | 1,026,662 | | |
| 4 | | $ | 42,163 | | | $ | 110,202 | | | $ | 242,200 | | | $ | 194,317 | | | $ | — | | | $ | 143,428 | | | $ | 732,310 | | |
| 5 | | $ | — | | | $ | 58,769 | | | $ | — | | | $ | — | | | $ | — | | | $ | — | | | $ | 58,769 | | |
| Total | | $ | 130,247 | | | $ | 1,596,616 | | | $ | 1,093,985 | | | $ | 691,768 | | | $ | 137,443 | | | $ | 197,744 | | | $ | 3,847,803 | | |
| | | | | | | | | | | | | | | | | | | | | | | | | | | | | | | | | | | | | | | | | | | | | | |
| | December 31, 2023 |
| (dollars in thousands) | | Origination Year | | |
| Risk Rating | | 2023 | | 2022 | | 2021 | | 2020 | | 2019 | | | | Prior | | Total |
| 1 | | $ | — | | | $ | — | | | $ | — | | | $ | 21,744 | | | $ | 49,467 | | | | | $ | — | | | $ | 71,211 | |
| 2 | | — | | | 328,576 | | | 349,210 | | | 21,966 | | | 474,669 | | | | | 87,705 | | | 1,262,126 | |
| 3 | | 47,760 | | | 105,934 | | | 146,538 | | | 22,599 | | | 189,259 | | | | | 330,085 | | | 842,175 | |
| 4 | | — | | | — | | | — | | | — | | | 25,807 | | | | | 148,506 | | | 174,313 | |
| 5 | | — | | | — | | | — | | | — | | | 121,940 | | | | | 112,060 | | | 234,000 | |
| Total | | $ | 47,760 | | | $ | 434,510 | | | $ | 495,748 | | | $ | 66,309 | | | $ | 861,142 | | | | | $ | 678,356 | | | $ | 2,583,825 | |
| | | | | | | | | | | | | | | | |
| Gross write-offs | | $ | — | | | $ | — | | | $ | — | | | $ | — | | | $ | (33,324) | | | | | $ | (20,950) | | | $ | (54,274) | |
| | | | | | | | | | | | | | | | | | | | | | | | | | | | | | | | | | | | | | | | | | | | | | |
| | December 31, 2022 |
| (dollars in thousands) | | Origination Year | | |
| Risk Rating | | 2022 | | 2021 | | 2020 | | 2019 | | 2018 | | | | Prior | | Total |
| 1 | | $ | — | | | $ | — | | | $ | 44,141 | | | $ | 186,506 | | | $ | 56,880 | | | | | $ | — | | | $ | 287,527 | |
| 2 | | 419,617 | | | 512,526 | | | 95,560 | | | 516,723 | | | 193,900 | | | | | 86,238 | | | 1,824,564 | |
| 3 | | — | | | 95,061 | | | 20,154 | | | 234,019 | | | 99,311 | | | | | 240,651 | | | 689,196 | |
| 4 | | — | | | — | | | — | | | — | | | 135,782 | | | | | 122,788 | | | 258,570 | |
| 5 | | — | | | — | | | — | | | 157,111 | | | — | | | | | 50,847 | | | 207,958 | |
| Total | | $ | 419,617 | | | $ | 607,587 | | | $ | 159,855 | | | $ | 1,094,359 | | | $ | 485,873 | | | | | $ | 500,524 | | | $ | 3,267,815 | |
| | | | | | | | | | | | | | | | |
| | | | | | | | | | | | | | | | |
Note 4. Real Estate Owned, Net
On May 16, 2023, the Company acquired legal title to an office property located in Phoenix, AZ pursuant to a negotiated deed-in-lieu of foreclosure. The property previously served as collateral for a first mortgage loan held for investment, which had been originated in May 2017. As of March 31, 2023, the loan had a risk rating of “5”, was on nonaccrual status and was accounted for under cost-recovery. At the time of acquisition, the loan had an amortized cost and carrying value of $28.2 million and $24.0 million, respectively. During the year ended December 31, 2021,2023, the Company entered intorecognized the property as real estate owned with a loan modification related to a retail asset located in Pasadena, CA, which is classified as troubled debt restructuring under GAAP. This modification included, among other changes, a partial deferralcarrying value of the loan’s contractual interest payments due to the collateral property’s cash flows and operating performance being adversely affected by the ongoing effects of the COVID-19 pandemic. This loan had also been previously modified. At December 31, 2021, this first mortgage loan had an outstanding principal balance of $114.1$24.0 million and was assigned a risk rating of “5”. The Company determined that the recovery of the loan’s principal is collateral-dependent. Accordingly, this loan was assessed individually, and the Company elected to apply a practical expedient in accordance with ASU 2016-13. At December 31, 2021, the Company recorded an allowance for credit loss of $14.1 million on this loan based on the Company’s estimate ofestimated fair value of the loan’s underlying collateral using the discounted cash flow method of valuation less the estimated cost to foreclose and sell the property. The estimation of the fair value of the collateral property also involved using various Level 3 inputs, which were in part developed based on discussions with various market participants and management’s best estimatesThis acquisition was accounted for as of the valuation date and required significant judgment. Additionally, during the year ended December 31, 2021, the Company placed this loan on nonaccrual status and reversed $0.3 million of interest income. This loan’s maturity date has passed without the loan being paid off. The Company is evaluating, and at any given time may be pursuing, a variety of potential options with respect to the resolution of this loan which, among others, may include a foreclosure, negotiated deed-in-lieu of foreclosure, a sale of the underlying collateral property or a sale of the loan.
During the year ended December 31, 2021, a first mortgage loan with a principal balance of $54.0 million collateralized by an office property located in Washington, D.C., was downgraded to a risk rating of “5,” as a result of the collateral property’s operating performance being adversely affected by the ongoing office leasing market challenges related to the COVID-19 pandemic. During the year ended December 31, 2021, the Company entered into a loan modification related to this asset which included, among other changes, a reallocation of certain loan reserve accounts. This loan had also been modified previously. The Company determined that the recovery of the loan’s principal is collateral-dependent. Accordingly, this loan was assessed individually, and the Company elected to apply a practical expedient in accordance with ASU 2016-13. At December 31, 2021, the Company recorded an allowance for credit loss of $8.0 million on this loan based on the Company’s estimate of fair value of the loan’s underlying collateral using the discounted cash flow method of valuation less the estimated cost to foreclose and sell the property. The estimation of the fair value of the collateral property also involved using various Level 3 inputs, whichacquisition under ASC 805.
GRANITE POINT MORTGAGE TRUST INC.
Notes to the Consolidated Financial Statements
were in part developed based on discussions with various market participants and management’s best estimates asThe Company allocated the fair value of the valuationassumed assets and liabilities on the acquisition date and required significant judgment. Additionally,as follows:
| | | | | |
| (in thousands) | Fair Value Allocation |
| Land | $ | 9,123 | |
| Building | 5,638 | |
| Tenant improvements | 3,596 | |
In-place lease intangibles(1) | 5,280 | |
Above-market lease intangibles(1) | 401 | |
Below-market lease intangibles(2) | (38) | |
| Total | $ | 24,000 | |
____________________(1)Included in “Other assets” on the consolidated balance sheets.
(2)Included in “Other liabilities” on the consolidated balance sheets.
The weighted average initial depreciation period for the acquired tenant improvements during the year ended December 31, 2021,2023, was 1.5 years. The weighted average initial amortization period for the acquired in-place lease intangibles, above-market lease intangibles and below-market lease intangibles acquired during the year ended December 31, 2023, were 1.6 years, 1.9 years, and 3.6 years, respectively.
The Company assumed certain legacy lease arrangements upon the acquisition of the REO. These arrangements entitle the Company placed this loan on nonaccrual statusto receive contractual rent payments during the lease periods and reversed $0.8tenant reimbursements for certain property operating expenses, including common area costs, insurance, utilities and real estate taxes.
The following table presents the identified intangible assets and liabilities related to REO as of December 31, 2023, and 2022:
| | | | | | | | | | | | | | |
| (in thousands) | December 31,
2023 | | | December 31,
2022 | | |
| Intangible Assets | | | | | | |
| Gross amount | $ | 5,681 | | | | $ | — | | | |
| Accumulated amortization | (2,082) | | | | — | | | |
| Total, net | $ | 3,599 | | | | $ | — | | | |
| Intangible Liabilities | | | | | | |
| Gross amount | $ | (38) | | | | $ | — | | | |
| Accumulated amortization | 8 | | | | — | | | |
| Total, net | $ | (30) | | | | $ | — | | | |
The following table presents the REO operations and related income (loss) included in the Company’s consolidated statements of comprehensive income for the years ended December 31, 2023, and 2022:
| | | | | | | | | | | | | | |
| (in thousands) | Year Ended December 31, | | |
| Real Estate Owned, Net | 2023 | | | 2022 | | |
| Rental income | $ | 2,510 | | | | $ | — | | | |
| Other operating income | 112 | | | | — | | | |
| Revenue from real estate owned operations | 2,622 | | | | — | | | |
Expenses from real estate owned operations (1) | (5,977) | | | | — | | | |
| | | | | | |
| | | | | | |
| | | | | | |
| | | | | | |
| Total | $ | (3,355) | | | | $ | — | | | |
____________________(1)Includes $(3.4) million of interest income. The loan’s maturity datedepreciation and amortization for the year ended December 31, 2023.
GRANITE POINT MORTGAGE TRUST INC.
Notes to the resolutionConsolidated Financial Statements
The following table presents the amortization of this loan which, among others, may include a foreclosure, a negotiated deed-in-lieulease intangibles included in the Company’s consolidated statements of foreclosure, a saleincome for the years ended December 31, 2023, and 2022:
| | | | | | | | | | | | | | | | | | | | | | | | | | | | | |
| (in thousands) | | | Year Ended December 31, | | | | | | | | | | |
| Income Statement Location | | 2023 | | | | 2022 | | | | | | | | | | |
| Asset | | | | | | | | | | | | | | | | | |
| In-place lease intangibles | Expenses from real estate owned operations | | $ | 1,957 | | | | | $ | — | | | | | | | | | | | |
| Above-market lease intangibles | Revenue from real estate owned operations | | (126) | | | | | — | | | | | | | | | | | |
| Liability | | | | | | | | | | | | | | | | | |
| Below-market lease intangibles | Revenue from real estate owned operations | | 9 | | | | | — | | | | | | | | | | | |
| | | | | | | | | | | | | | | | | |
The following table presents the amortization of lease intangibles for each of the underlying collateral property or a salesucceeding fiscal years:
| | | | | | | | | | | | | | | | | | | | | | |
| (in thousands) | | In-place Lease Intangible Assets | | Above-market Lease intangible Assets | | Below-market Lease Intangible Liabilities | | |
| 2024 | | $ | 1,979 | | | $ | 123 | | | $ | (6) | | | |
| 2025 | | 589 | | | 24 | | | (6) | | | |
| 2026 | | 498 | | | 20 | | | (6) | | | |
| 2027 | | 58 | | | 17 | | | (6) | | | |
| 2028 | | 53 | | | 17 | | | (5) | | | |
| Thereafter | | 146 | | | 75 | | | — | | | |
Future Minimum Lease Payments
The following table presents the future minimum lease payments to be collected under non-cancelable operating leases, excluding tenant reimbursements of expenses as of December 31, 2023:
| | | | | | | | | | |
| (in thousands) | | Contractual Lease Payments | | |
| 2024 | | $ | 3,145 | | | |
| 2025 | | 1,755 | | | |
| 2026 | | 1,630 | | | |
| 2027 | | 637 | | | |
| 2028 | | 630 | | | |
| Thereafter | | 792 | | | |
The weighted average minimum remaining term of the loan.non-cancelable leases was approximately 2.0 years as of December 31, 2023.
Note 4.5. Variable Interest Entities and Securitized Debt Obligations
The Company finances pools of its commercial real estate loans through CRE CLOs, which are considered VIEs for financial reporting purposes, and, thus, are reviewed for consolidation under the applicable consolidation guidance. The Company has both the power to direct the activities of the CRE CLOs that most significantly impact the entities’ performance and the obligation to absorb losses or the right to receive benefits of the entities that could be significant; therefore, the Company consolidates the CRE CLOs.
GRANITE POINT MORTGAGE TRUST INC.
Notes to the Consolidated Financial Statements
The following table presents a summary of the assets and liabilities of all VIEs consolidated on the Company’s consolidated balance sheets as of December 31, 2021,2023, and December 31, 2020:2022:
| | | | | | | | | | | |
| (in thousands) | December 31,
2021 | | December 31,
2020 |
| Loans held-for-investment | $ | 2,257,768 | | | $ | 1,200,479 | |
| Allowance for credit losses | (16,904) | | | (15,914) | |
| Loans held-for-investment, net | 2,240,864 | | | 1,184,565 | |
| | | |
| Restricted cash | 10,377 | | | 62,804 | |
| | | |
| Other assets | 14,803 | | | 8,563 | |
| Total Assets | $ | 2,266,044 | | | $ | 1,255,932 | |
| Securitized debt obligations | $ | 1,677,619 | | | $ | 927,128 | |
| | | |
| Other liabilities | 1,816 | | | 1,092 | |
| Total Liabilities | $ | 1,679,435 | | | $ | 928,220 | |
GRANITE POINT MORTGAGE TRUST INC.
Notes to the Consolidated Financial Statements
| | | | | | | | | | | |
| (in thousands) | December 31,
2023 | | December 31,
2022 |
| Loans held-for-investment | $ | 1,246,448 | | | $ | 1,557,731 | |
| Allowance for credit losses | (21,107) | | | (21,865) | |
| Loans held-for-investment, net | 1,225,341 | | | 1,535,866 | |
| | | |
| Restricted cash | — | | | 5,674 | |
| | | |
| Other assets | 8,480 | | | 10,396 | |
| Total Assets | $ | 1,233,821 | | | $ | 1,551,936 | |
| Securitized debt obligations | $ | 991,698 | | | $ | 1,138,749 | |
| | | |
| Other liabilities | 2,383 | | | 2,279 | |
| Total Liabilities | $ | 994,081 | | | $ | 1,141,028 | |
The securitized debt obligations issued by the CRE CLOs are recorded at outstanding principal, net of any unamortized deferred debt issuance costs, on the Company’s consolidated balance sheets.
On March 16, 2023, the Company redeemed the GPMT 2019-FL2 CRE CLO, which at the time of redemption had $98.1 million of investment-grade bonds outstanding. The 11 loans or participation interests therein, with an aggregate principal balance of $269.3 million held by the trust, were refinanced in part by one of the Company’s existing secured financing facilities, whose borrowing capacity was upsized in connection therewith. As a result of the redemption, the Company realized a gain on early extinguishment of debt of approximately $0.3 million.
The following table details ourthe Company’s CRE CLO securitized debt obligations:
| | (in thousands) | December 31,
2021 | | December 31,
2020 |
| (dollars in thousands) | | (dollars in thousands) | December 31, 2023 | | December 31, 2022 |
| Securitized Debt Obligations | Securitized Debt Obligations | Principal Balance | | Carrying Value | | Wtd. Avg. Yield/Cost (1) | | Principal Balance | | Carrying Value | | Wtd. Avg. Yield/Cost (1) | Securitized Debt Obligations | Principal Balance | | Carrying Value | | Wtd. Avg. Yield/Cost (1) | | Principal Balance | | Carrying Value | | Wtd. Avg. Yield/Cost (1) |
| GPMT 2021-FL4 CRE CLO | GPMT 2021-FL4 CRE CLO | | | | | | | | | | | |
| Collateral assets | $ | 621,409 | | | $ | 613,504 | | | L+3.7% | | $ | — | | | $ | — | | | N/A |
Collateral assets(2) | |
Collateral assets(2) | |
Collateral assets(2) | | $ | 621,409 | | | $ | 607,338 | | | S+3.8% | | $ | 621,409 | | | $ | 607,354 | | | L+/S+3.7% |
| Financing provided | Financing provided | 502,564 | | | 498,117 | | | L+1.7% | | — | | | — | | | N/A | Financing provided | 502,564 | | | 500,403 | | 500,403 | | | S+1.8% | | S+1.8% | | 502,564 | | | 499,249 | | 499,249 | | | L+1.7% | | L+1.7% |
| GPMT 2021-FL3 CRE CLO | GPMT 2021-FL3 CRE CLO | |
Collateral assets (2) | 768,850 | | | 763,607 | | | L+3.9% | | — | | | — | | | N/A |
Collateral assets(3) | |
Collateral assets(3) | |
Collateral assets(3) | | 629,273 | | | 618,003 | | | S+3.8% | | 677,715 | | | 669,279 | | | L+/S+3.9% |
| Financing provided | Financing provided | 630,818 | | | 629,049 | | | L+1.7% | | — | | | — | | | N/A | Financing provided | 491,295 | | | 491,295 | | 491,295 | | | S+1.9% | | S+1.9% | | 539,876 | | | 539,892 | | 539,892 | | | L+1.7% | | L+1.7% |
| GPMT 2019-FL2 CRE CLO | GPMT 2019-FL2 CRE CLO | |
Collateral assets(4) | |
Collateral assets(4) | |
Collateral assets(4) | | — | | | — | | | — | | | 270,498 | | | 264,907 | | | L+ 4.2% |
| Financing provided | | Financing provided | — | | | — | | | — | | | 99,300 | | | 99,608 | | | L+ 2.7% |
| | Total | |
| | Total | |
| | Total | |
| Collateral assets | Collateral assets | 617,119 | | | 605,831 | | | L+4.1% | | 762,228 | | | 750,185 | | | L+ 3.4% |
| Financing provided | 446,849 | | | 445,920 | | | L+1.8% | | 653,835 | | | 650,908 | | | L+ 1.6% |
| GPMT 2018-FL1 CRE CLO | |
| Collateral assets | Collateral assets | 270,722 | | | 268,322 | | | L+5.0% | | 442,517 | | | 434,380 | | | L+ 4.2% |
| Financing provided | 104,532 | | | 104,532 | | | L+2.8% | | 276,118 | | | 276,220 | | | L+ 1.8% |
| Total | |
| Collateral assets | Collateral assets | $ | 2,278,100 | | | $ | 2,251,264 | | | L+4.0% | | $ | 1,204,745 | | | $ | 1,184,565 | | | L+ 3.7% | $ | 1,250,682 | | | $ | | $ | 1,225,341 | | | S+3.8% | | S+3.8% | | $ | 1,569,622 | | | $ | | $ | 1,541,540 | | | L+/S+ 3.9% | | L+/S+ 3.9% |
| Financing provided | Financing provided | $ | 1,684,763 | | | $ | 1,677,618 | | | L+1.8% | | $ | 929,953 | | | $ | 927,128 | | | L+ 1.7% | Financing provided | $ | 993,859 | | | $ | | $ | 991,698 | | | S+1.8% | | S+1.8% | | $ | 1,141,740 | | | $ | | $ | 1,138,749 | | | L+ 1.8% | | L+ 1.8% |
|
____________________
(1)Calculations of all inall-in yield on collateral assets at origination are based on a number of assumptions (some or all of which may not occur) and are expressed as monthly equivalent yields that include net origination fees and exit fees and exclude future fundings and any potential or completed loan amendments or modifications. CalculationsCalculation of cost of funds is the weighted average coupon of the CRE CLO, exclusive of any CRE CLO issuance costs. During the year ended December 31, 2023, the financing provided transitioned from LIBOR to SOFR.
(2)Includes $10.4No restricted cash is included as of December 31, 2023, or December 31, 2022. Yield on collateral assets is exclusive of restricted cash.
(3)No restricted cash is included as of December 31, 2023. $5.6 million of restricted cash is included as of December 31, 2021.2022. Yield on collateral assets is exclusive of restricted cash.
GRANITE POINT MORTGAGE TRUST INC.
Notes to the Consolidated Financial Statements
Note 5.6. Secured Financing Agreements
To finance its loans held-for-investment, the Company has entered into a variety of secured financing arrangements with several counterparties, including repurchase facilities an asset-specific financing facility and a term financingsecured credit facility. The Company’s repurchase facilities are typically collateralized by loans held-for-investment, loans held-for-sale, REO assets, and certain cash balances. Although the transactions under repurchase facilities represent committed borrowings until maturity, other than with respect to the Company’s Centennial Bank repurchase facility, which provides financing on a non-mark-to-market basis, the other respective lender retainslenders retain the right to mark the underlying collateral to fair value. A reduction in the value of pledged assets due to collateral-specific credit events, or, with respect to a limited number of the Company’s repurchase facilities, capital market events, would require the Company to fund margin calls. The Company does not typically retain similar rights for the Company to make margin calls on its underlying borrowers as a result of a determination by the Company and/or its financing counterparty that there has been a decrease in the market value of the underlying pledged collateral.
The Company’s asset-specific financing facility and term financing facilitysecured credit facilities are also typically collateralized by loans held-for-investment. Neither facility contains mark-to-market provisionsheld-for-investment and both are generally term-matched to the underlying assets, not to exceed February 9, 2025 in the case of the term financing facility.
GRANITE POINT MORTGAGE TRUST INC.
Notes to the Consolidated Financial Statements
mark-to-market.The following tables summarize details of the Company’s borrowings outstanding on its secured financing agreements as of December 31, 2021,2023, and December 31, 2020:2022:
| | | | | | | | | | | | | | | | | | | | | | | | | | | | | | | | | | | |
| December 31, 2021 |
| (in thousands) | Maturity Date (1) | | Amount Outstanding | | Unused Capacity | | Total Capacity | | Carrying Value of Collateral | | Weighted Average Borrowing Rate |
| Repurchase facilities: | | | | | | | | | | | |
Morgan Stanley Bank (2) | June 28, 2022 | | $ | 230,982 | | | $ | 269,018 | | | $ | 500,000 | | | $ | 382,017 | | | 2.2 | % |
Goldman Sachs Bank USA (3) | July 13, 2023 | | 81,227 | | | 168,773 | | | 250,000 | | | 111,811 | | | 2.6 | % |
| JPMorgan Chase Bank | June 28, 2022 | | 104,215 | | | 345,785 | | | 450,000 | | | 188,838 | | | 2.3 | % |
| Citibank | January 9, 2023 | | 202,944 | | | 297,056 | | | 500,000 | | | 285,767 | | | 1.8 | % |
Wells Fargo Bank (4) | June 28, 2022 | | 57,917 | | | 42,083 | | | 100,000 | | | 86,409 | | | 2.3 | % |
| | | | | | | | | | | |
| Total/Weighted Average | | | $ | 677,285 | | | $ | 1,122,715 | | | $ | 1,800,000 | | | $ | 1,054,842 | | | |
| Asset-specific financings: | | | | | | | | | | | |
| CIBC Bank USA | Term Matched | | $ | 43,622 | | | $ | 106,378 | | | $ | 150,000 | | | $ | 56,129 | | | 1.8 | % |
| Term financing facility: | | | | | | | | | | | |
Goldman Sachs Bank USA (5) | February 14, 2025 | | $ | 127,145 | | | $ | — | | | $ | 127,145 | | | $ | 329,256 | | | 3.7 | % |
| | | | | | | | | | | | | | | | | | | | | | | | | | | | | | | | | | | |
| December 31, 2023 |
| (dollars in thousands) | Maturity Date(1) | | Amount Outstanding | | Unused Capacity(2) | | Total Capacity | | Carrying Value of Collateral | | Weighted Average Borrowing Rate |
| Repurchase facilities: | | | | | | | | | | | |
| Morgan Stanley Bank | June 28, 2024 | | $ | 193,165 | | | $ | 281,835 | | | $ | 475,000 | | | $ | 304,598 | | | 8.0 | % |
Goldman Sachs Bank USA(3) | July 13, 2024 | | 53,745 | | | 196,255 | | | 250,000 | | | 131,112 | | | 8.7 | % |
| JPMorgan Chase Bank | July 28, 2025 | | 445,713 | | | 79,238 | | | 524,951 | | | 500,985 | | | 9.8 | % |
| Citibank | May 25, 2025 | | 176,606 | | | 323,394 | | | 500,000 | | | 254,286 | | | 7.2 | % |
| | | | | | | | | | | |
| | | | | | | | | | | |
Centennial Bank(4) | August 29, 2024 | | 6,213 | | | 143,787 | | | 150,000 | | | 20,508 | | | 10.4 | % |
| Total/Weighted Average | | | $ | 875,442 | | | $ | 1,024,509 | | | $ | 1,899,951 | | | $ | 1,211,489 | | | |
| | | | | | | | | | | |
| | | | | | | | | | | |
| | | | | | | | | | | |
| Secured credit facility | December 21, 2025 | | $ | 84,000 | | | $ | 16,000 | | | $ | 100,000 | | | $ | 105,865 | | | 11.9 | % |
| | | | | | | | | | | |
| | | | | | | | | | | |
| | December 31, 2020 |
| (in thousands) | Maturity Date (1) | | Amount Outstanding | | Unused Capacity | | Total Capacity | | Carrying Value of Collateral | | Weighted Average Borrowing Rate |
| December 31, 2022 | | | December 31, 2022 |
| (dollars in thousands) | | (dollars in thousands) | Maturity Date(1) | | Amount Outstanding | | Unused Capacity(2) | | Total Capacity | | Carrying Value of Collateral | | Weighted Average Borrowing Rate |
| Repurchase facilities: | Repurchase facilities: | | | | | | | | | |
| Morgan Stanley Bank | Morgan Stanley Bank | June 28, 2021 | | $ | 435,719 | | | $ | 164,281 | | | $ | 600,000 | | | $ | 657,066 | | | 2.3 | % |
| Goldman Sachs Bank USA | May 2, 2021 | | 395,990 | | | 104,010 | | | 500,000 | | | 593,625 | | | 2.5 | % |
| Morgan Stanley Bank | |
| Morgan Stanley Bank | | June 28, 2023 | | $ | 494,250 | | | $ | 105,750 | | | $ | 600,000 | | | $ | 701,469 | | | 7.0 | % |
Goldman Sachs Bank USA(3) | | Goldman Sachs Bank USA(3) | July 13, 2023 | | 66,914 | | | 183,086 | | | 250,000 | | | 93,651 | | | 6.5 | % |
| JPMorgan Chase Bank | JPMorgan Chase Bank | June 28, 2022 | | 361,797 | | | 88,203 | | | 450,000 | | | 536,758 | | | 2.5 | % | JPMorgan Chase Bank | June 28, 2024 | | 132,438 | | | 217,562 | | 217,562 | | | 350,000 | | 350,000 | | | 211,841 | | 211,841 | | | 6.7 | | 6.7 | % |
| Citibank | Citibank | January 9, 2023 | | 386,049 | | | 113,951 | | | 500,000 | | | 504,236 | | | 1.8 | % | Citibank | May 25, 2025 | | 204,593 | | | 295,407 | | 295,407 | | | 500,000 | | 500,000 | | | 266,179 | | 266,179 | | | 6.1 | | 6.1 | % |
| Wells Fargo Bank | June 28, 2021 | | 129,320 | | | 145,680 | | | 275,000 | | | 185,282 | | | 2.1 | % |
Wells Fargo Bank(5) | | Wells Fargo Bank(5) | June 28, 2023 | | 71,091 | | | — | | | 71,091 | | | 111,154 | | | 6.3 | % |
Centennial Bank(4) | | Centennial Bank(4) | August 29, 2024 | | 46,280 | | | 103,720 | | | 150,000 | | | 101,844 | | | 9.3 | % |
| Total/Weighted Average | |
| | Total/Weighted Average | | $ | 1,708,875 | | | $ | 616,125 | | | $ | 2,325,000 | | | $ | 2,476,967 | | |
| Asset-specific financings: | | | | | | | | | |
| CIBC Bank USA | Term Matched | | $ | 123,091 | | | $ | 26,909 | | | $ | 150,000 | | | $ | 152,929 | | | 2.5 | % |
Asset-specific financings(5) | |
| Asset-specific financings(5) | |
| Asset-specific financings(5) | | Term Matched | | $ | 44,913 | | | $ | 105,087 | | | $ | 150,000 | | | $ | 57,629 | | | 6.0 | % |
| Secured credit facility | | Secured credit facility | December 21, 2025 | | $ | 100,000 | | | $ | — | | | $ | 100,000 | | | $ | 157,112 | | | 10.8 | % |
|
____________________
(1)The facilities are set to mature on the stated maturity date, unless extended pursuant to their terms.
(2)AsUnused capacity is not committed as of December 31, 2021, the Company retained an option to increase the maximum facility capacity amount up to $600 million, subject to customary terms2023, and conditions.December 31, 2022.
(3)As of December 31, 2021,2023, and December 31, 2022, the Company retained options to increase the maximum facility capacity amount up to $350 million, subject to customary terms and conditions.
(4)As of December 31, 2021,2023, and December 31, 2022, the Company retained options to increase the maximum facility capacity amount up to $200 million, subject to customary terms and conditions. As of December 31, 2023, the outstanding balance was collateralized by real estate owned, inclusive of $3.6 million in other assets and liabilities related to acquired leases. See Note 4 - Real Estate Owned, Net, for further detail.
(5)Amount outstanding includes unamortized debt issuance costs.
GRANITE POINT MORTGAGE TRUST INC.
Notes to the Consolidated Financial Statements
At December 31, 2021,2023, and December 31, 2020,2022, the Company’s borrowings outstanding on its secured financing facilities had contractual maturities as follows:
| | December 31, 2023 | |
| December 31, 2023 | |
| December 31, 2023 | |
| (in thousands) | | (in thousands) | Repurchase Facilities | | | | | | Secured Credit Facility | | | | | | Total Amount Outstanding |
| | December 31, 2021 |
| (dollars in thousands) | Repurchase Facilities | | Asset-Specific Financings | | Term Financing Facility (1) | | | Total Amount Outstanding |
| 2022 | $ | 393,114 | | | $ | 43,622 | | | $ | — | | | | $ | 436,736 | |
| 2023 | 284,171 | | | — | | | — | | | | 284,171 | |
| 2024 | |
| 2024 | |
| 2024 | 2024 | — | | | — | | | — | | | | — | |
| 2025 | 2025 | — | | | — | | | 127,145 | | | | 127,145 | |
| 2026 | 2026 | — | | | — | | | — | | | | — | |
| 2027 | |
| 2028 | |
| Thereafter | Thereafter | — | | | — | | | — | | | | — | |
| Total | Total | $ | 677,285 | | | $ | 43,622 | | | $ | 127,145 | | | | $ | 848,052 | |
| | | | | | | | | | | | | | | | | | | | | | | | | |
| December 31, 2022 |
| (in thousands) | Repurchase Facilities | | Asset-Specific Financings(1) | | | | Secured Credit Facility | | Total Amount Outstanding |
| 2023 | $ | 632,255 | | | $ | 44,913 | | | | | $ | — | | | $ | 677,168 | |
| 2024 | 178,718 | | | — | | | | | — | | | 178,718 | |
| 2025 | 204,593 | | | — | | | | | 100,000 | | | 304,593 | |
| 2026 | — | | | — | | | | | — | | | — | |
| 2027 | — | | | — | | | | | — | | | — | |
| Thereafter | — | | | — | | | | | — | | | — | |
| Total | $ | 1,015,566 | | | $ | 44,913 | | | | | $ | 100,000 | | | $ | 1,160,479 | |
| | | | | | | | | | | | | | | | | | | | | | | | | |
| December 31, 2020 |
| (dollars in thousands) | Repurchase Facilities | | Asset-Specific Financings | | Term Financing Facility (1) | | | | Total Amount Outstanding |
| 2021 | $ | 961,030 | | | 82,768 | | | $ | — | | | | | $ | 1,043,798 | |
| 2022 | 361,797 | | | 40,323 | | | — | | | | | 402,120 | |
| 2023 | 386,048 | | | — | | | — | | | | | 386,048 | |
| 2024 | — | | | — | | | — | | | | | — | |
| 2025 | — | | | — | | | — | | | | | — | |
| Thereafter | — | | | — | | | — | | | | | — | |
| Total | $ | 1,708,875 | | | $ | 123,091 | | | $ | — | | | | | $ | 1,831,966 | |
______________________________________(1)Amount outstanding includes unamortized debt issuance costs.
The following table summarizes certain characteristics of the Company’s repurchase facilities and counterparty concentration at December 31, 2021,2023, and December 31, 2020:2022:
| | December 31, 2021 | | December 31, 2020 |
| December 31, 2023 | | | December 31, 2023 | | December 31, 2022 |
| (dollars in thousands) | (dollars in thousands) | Amount Outstanding | | Net Counterparty Exposure (1) | | Percent of Equity | | Weighted Average Years to Maturity | | Amount Outstanding | | Net Counterparty Exposure (1) | | Percent of Equity | | Weighted Average Years to Maturity | (dollars in thousands) | Amount Outstanding | | Net Counterparty Exposure(1) | | Percent of Equity | | Weighted Average Years to Maturity | | Amount Outstanding | | Net Counterparty Exposure(1) | | Percent of Equity | | Weighted Average Years to Maturity |
| Morgan Stanley Bank | Morgan Stanley Bank | $ | 230,982 | | | $ | 155,446 | | | 15 | % | | 0.49 | | $ | 435,719 | | | $ | 230,815 | | | 25 | % | | 0.49 | Morgan Stanley Bank | $ | 193,165 | | | $ | | $ | 118,253 | | | 14 | | 14 | % | | 0.49 | | $ | 494,250 | | | $ | | $ | 213,855 | | | 22 | | 22 | % | | 0.49 |
| JPMorgan Chase Bank | JPMorgan Chase Bank | 104,215 | | | 87,103 | | | 9 | % | | 0.49 | | 361,797 | | | 187,282 | | | 20 | % | | 1.50 | JPMorgan Chase Bank | 445,713 | | | 62,216 | | 62,216 | | | 7 | | 7 | % | | 1.58 | | 132,438 | | | 81,850 | | 81,850 | | | 8 | | 8 | % | | 1.49 |
| Goldman Sachs Bank USA | Goldman Sachs Bank USA | 81,227 | | | 31,852 | | | 3 | % | | 1.53 | | 395,990 | | | 203,297 | | | 22 | % | | 0.33 | Goldman Sachs Bank USA | 53,745 | | | 78,949 | | 78,949 | | | 9 | | 9 | % | | 0.53 | | 66,914 | | | 27,594 | | 27,594 | | | 3 | | 3 | % | | 0.53 |
| Citibank | Citibank | 202,944 | | | 85,631 | | | 8 | % | | 1.02 | | 386,049 | | | 124,913 | | | 13 | % | | 2.02 | Citibank | 176,606 | | | 80,441 | | 80,441 | | | 9 | | 9 | % | | 1.40 | | 204,593 | | | 63,924 | | 63,924 | | | 6 | | 6 | % | | 2.40 |
| Wells Fargo Bank | Wells Fargo Bank | 57,917 | | | 29,320 | | | 3 | % | | 0.49 | | 129,320 | | | 57,483 | | | 6 | % | | 0.49 | Wells Fargo Bank | — | | | — | | — | | | — | | — | % | | — | | | 71,091 | | 71,091 | | | 42,447 | | 42,447 | | | 4 | | 4 | % | | 0.49 |
| Centennial Bank | | Centennial Bank | 6,213 | | | 17,757 | | | 2 | % | | 0.66 | | 46,280 | | | 55,712 | | | 6 | % | | 1.66 |
| Total | Total | $ | 677,285 | | | $ | 389,352 | | | $ | 1,708,875 | | | $ | 803,790 | | |
____________________
(1)Represents the excess of the carrying amount or market value of the loans held-for-investment pledged as collateral for repurchase facilities, including accrued interest plus any cash on deposit to secure the repurchase obligation, less the amount of the repurchase liability, including accrued interest.
The Company does not anticipate any defaults by its financing counterparties, although there can be no assurance that one or more defaults will not occur.
GRANITE POINT MORTGAGE TRUST INC.
Notes to the Consolidated Financial Statements
Financial Covenants
The Company is subject to a variety of financial covenants under its secured financing agreements. The following represent the most restrictive financial covenants across the agreements as of December 31, 2021:its secured financing agreements:
•Unrestricted cash cannot be less than the greater of $30.0 million and 5.0% of recourse indebtedness. As of December 31, 2021,2023, the Company’s unrestricted cash was $191.9$188.4 million, while 5.0% of the Company’s recourse indebtedness was $31.6$15.6 million.
•Tangible net worth must be greater than the sum of (i) 75.0% of the Company’s tangible net worth as of June 28, 2017,$816.9 million and (ii) 75.0% of net cash proceeds of the Company’s equity issuances after June 28, 2017, which calculates to $865.7August 3, 2023. As the Company has not had any equity issuances after August 3, 2023, tangible net worth must be greater than $816.9 million. As of December 31, 2021,2023, the Company’s tangible net worth was $1.1 billion$1.0 billion.
•Target asset leverage ratio cannot exceed 77.5% and total leverage ratio cannot exceed 80.0%. As of December 31, 2021,2023, the Company’s target asset leverage ratio was 66.5%71.8% and the Company’s total leverage ratio was 73.8%66.6%.
•Minimum interest coverage must be greaterof no less than 1.5:1.0.1.3:1.0 through June 30, 2024. As of December 31, 2021,2023, the Company’s minimum interest coverage was 1.8:1.01.5:1.0. Subsequent to June 30, 2024, the Company will be required to maintain minimum interest coverage of no less than 1.4:1.0.
The Company may also be subject to additional financial covenants in connection with various other agreements it enters into in the normal course of ourits business. The Company was in compliance with all of its financial covenants as of December 31, 2023, and December 31, 2022, and intends to continue to operate in a manner which complies with all of its financial covenants.
Note 6.7. Convertible Senior Notes
In December 2017, the Company closed a private placement of $125.0 million aggregate principal amount of convertible senior notes due 2022. In January 2018, an additional $18.8 million in notes were issued by the Company in connection with the exercise of the initial purchaser’s option. The net proceeds from the offering were approximately $139.5 million after deducting underwriting discounts and expenses. The notes are unsecured, pay interest semiannually at a rate of 5.625% per annum and are convertible at the option of the holder into shares of the Company’s common stock. The notes will mature in December 2022, unless earlier converted or repurchased in accordance with their terms. The Company does not have the right to redeem the notes prior to maturity, but may be required to repurchase the notes from holders under certain circumstances. As of December 31, 2021, the notes had a conversion rate of 51.9943 shares of common stock per $1,000 principal amount of the notes.
In October 2018, the Company closed an underwritten public offering of $131.6 million aggregate principal amount of convertible senior notes due 2023.October 1, 2023, or the convertible notes. The net proceeds from the offeringconvertible notes were approximately $127.7 million after deducting underwriting discounts and expenses. The notes are unsecured, paypaid interest semiannually at a rate of 6.375% per annum and arewere convertible at the option of the holder into shares of the Company’s common stock. The notes will mature in October 2023, unless earlier converted or repurchased in accordance with their terms. The Company does not have the right to redeem the notes prior to maturity, but may be required to repurchase the notes from holders under certain circumstances. As of December 31, 2021, the notes had a conversion rate of 50.0894 shares of common stock per $1,000 principal amount of the notes.
The consolidated amount outstanding due on the convertible senior notes as of December 31, 2021, and December 31, 2020,2022, was $272.9$130.9 million, and $271.3 million, respectively, net of deferred issuance costs. As of December 31, 2023, the Company had redeemed for cash the convertible senior notes at maturity, and none of the notes remained outstanding.
The following table details the interest expense related to the Convertible Senior Notes:convertible notes for the years ended December 31, 2023, and 2022:
| | | | | | | | | | | | | | | | | |
| | | Year Ended December 31, |
| (in thousands) | | | | | | | 2021 | | 2020 |
| Cash coupon | | | | | | | $ | 16,475 | | | $ | 16,475 | |
| Amortization of issuance costs | | | | | | | 1,692 | | | 1,617 | |
| Total interest expense | | | | | | | $ | 18,167 | | | $ | 18,092 | |
GRANITE POINT MORTGAGE TRUST INC.
Notes to the Consolidated Financial Statements
| | | | | | | | | | | | | | | | | | |
| | | | Year Ended December 31, |
| (in thousands) | | | | | | 2023 | | 2022 |
| Cash coupon | | | | | | $ | 6,293 | | | $ | 15,802 | |
| Amortization of issuance costs | | | | | | 682 | | | 1,725 | |
| Total interest expense | | | | | | $ | 6,975 | | | $ | 17,527 | |
The following table details the carrying value of the Convertible Senior Notes:
December 2022 Convertible Senior Notes
| | | | | | | | | | | | | | | | | |
| Year Ended December 31, |
| (in thousands) | 2021 | | | | 2020 | | | | |
| Principal outstanding | $ | 143,750 | | | | | $ | 143,750 | | | | | |
| Less: Unamortized issuance costs | (875) | | | | | (1,774) | | | | | |
| Net carrying value | $ | 142,875 | | | | | $ | 141,976 | | | | | |
October 2023 Convertible Senior Notes
| | | | | | | | | | | | | | | | | |
| Year Ended December 31, |
| (in thousands) | 2021 | | | | 2020 | | | | |
| Principal outstanding | $ | 131,600 | | | | | $ | 131,600 | | | | | |
| Less: Unamortized issuance costs | (1,533) | | | | | (2,326) | | | | | |
| Net carrying value | $ | 130,067 | | | | | $ | 129,274 | | | | | |
Note 7. Senior Secured Term Loan Facilities and Warrants to Purchase Shares of Common Stock
Senior Secured Term Loan Facilities
On September 25, 2020, the Company, as a guarantor, and certain of its subsidiaries, as borrowers, entered into a five-year senior secured term loan credit agreement with certain investment vehicles managed by Pacific Investment Management Company LLC, or PIMCO, providing for up to $300.0 million of senior secured term loan facilities. On September 28, 2020, the Company borrowed $225.0 million under the initial term loan facility. The Company chose not to borrow the remaining $75.0 million of commitments under the senior secured term loan facilities, which were available to it on a delayed draw basis until September 25, 2021. Interest on the outstanding loans under the senior secured term loan facilities is payable quarterly in arrears and accrues at the rate of (i) 8.00% per annum for any period for which accrued interest is paid in cash or (ii) 9.00% per annum for any period for which the borrowers elect to pay up to 50% of accrued interest in kind by adding such interest to the principal amount of the loans. The senior secured term loan facilities will mature on September 25, 2025.
The loans outstanding under the term loan facilities are non-amortizing and may be voluntarily repaid, in whole or in part, at any time, subject to certain prepayment premiums if they are repaid prior to September 25, 2023.
On December 9, 2021, the Company prepaid $75.0 million of borrowings under the senior secured term loan facilities, resulting in a total payment of approximately $79.9 million, inclusive of the principal amount, prepayment penalty and accrued interest. As a result of this repayment, the Company realized a charge on early extinguishment of debt of approximately $(8.9) million, or $(0.17) per share, comprised of the prepayment penalty and a pro-rata charge-off of unamortized discount including transaction costs.
Subsequent to December 31, 2021, on February 16, 2022, the Company prepaid an additional $50.0 million of borrowings under the senior secured term loan facilities, resulting in a total payment of approximately $53.0 million, inclusive of the principal amount, prepayment penalty and accrued interest. As a result of this repayment, the Company realized a charge on early extinguishment of debt of approximately $(5.8) million, or $(0.11) per basic share, comprised of the prepayment penalty and a pro-rata charge-off of unamortized discount including transaction costs.
Warrants to Purchase Shares of Common Stock
In connection with the senior secured term loan facilities, on September 25, 2020, the Company issued warrants to purchase up to 6.066 million shares of the Company’s common stock, $0.01 par value per share to certain investment vehicles managed by PIMCO.
On September 25, 2021, the warrantholders forfeited unvested warrants exercisable for 1,516,455 shares of common stock because the Company chose not to borrow the $75.0 million of delayed draw commitments available under the senior secured term loan facilities. On September 30, 2021, the Company settled warrants to purchase approximately 1.06 million shares of common stock at an exercise price of $6.47 per share of common stock for a net cash amount of approximately $7.5 million. On October 4, 2021, the Company settled the remaining warrants to purchase approximately 3.49 million shares of common stock at an exercise price of $6.47 per share of common stock for a net cash amount of approximately $24.7 million. The Company currently has no warrants outstanding.
GRANITE POINT MORTGAGE TRUST INC.
Notes to the Consolidated Financial Statements
The Company retained third party valuation experts to assist with estimating the fair value of the warrants on the issuance date. Based on the warrants’ fair value relative to the fair value of the senior secured term loan facilities, approximately $4.5 million of the $225.0 million of gross proceeds was allocated to the warrants, creating a corresponding senior secured term loan facilities discount in the same amount. The Company elected the accreted redemption value method whereby this discount will be accreted over five years using the effective interest method, resulting in an increase in the carrying value of the senior secured term loan facilities.
The table below summarizes the net carrying amount of the senior secured term loan facilities:
| | | | | | | | | | | | | | | | | |
| Year Ended December 31, |
| (in thousands) | 2021 | | | | 2020 | | | | |
| Principal outstanding | $ | 150,000 | | | | | $ | 225,000 | | | | | |
| Less: Unamortized debt discount and issuance costs | (10,120) | | | | | (18,552) | | | | | |
| Net carrying value | $ | 139,880 | | | | | $ | 206,448 | | | | | |
The senior secured term loan credit agreement contains various affirmative and negative covenants, which are applicable to the Company, the borrowers and their respective subsidiaries, including limitations (subject to exceptions) on their ability to: (i) incur indebtedness; (ii) incur liens on their assets; (iii) consummate certain fundamental changes; (iv) dispose of all or any part of their assets; (v) pay dividends or other distributions with respect to their equity interests; (vi) make investments; (vii) enter into transactions with their affiliates; (viii) modify the terms of the Company’s existing convertible notes any refinancings thereof or any subordinated or junior lien indebtedness, or prepay any such indebtedness; and (ix) enter into certain burdensome agreements.
The senior secured term loan credit agreement also contains financial covenants that are substantially similar to the financial covenants under the Company’s repurchase facilities, asset-specific financing facility and term financing facility. If the Company fails to meet or satisfy any of the covenants in accordance with the senior secured term loan credit agreement and is unable to obtain a waiver or other suitable relief from the lenders, the Company would be in default and the Company’s lenders could elect to declare outstanding amounts due and payable. The Company was in compliance with all of its financial covenants as of December 31, 2021.2023, and 2022:
| | | | | | | | | | | | | | | | | |
| (in thousands) | December 31,
2023 | | | | December 31,
2022 | | | | |
| Principal outstanding | $ | — | | | | | $ | 131,600 | | | | | |
| Less: Unamortized issuance costs | — | | | | | (682) | | | | | |
| Net carrying value | $ | — | | | | | $ | 130,918 | | | | | |
Note 8. Cash, Cash Equivalents and Restricted Cash
Cash and cash equivalents include cash held in bank accounts and cash held in money market funds on an overnight basis.
The Company is required to maintain certain cash balances in restricted accounts as collateral for the Company’s repurchase facilities and with counterparties to support investment activities. As of December 31, 2021,2023, the Company held $2.0$10.8 million in restricted cash in connection with its non-CRE CLO financing activities, compared to $5.0$1.4 million and $2.0 million as of December 31, 2020.2022, and 2021, respectively. In addition, as of December 31, 2021,2023, the Company held $10.4 million inno restricted cash representing proceeds from principal repayments and paydowns of loans held in the CRE CLOs, compared to $62.8$5.6 million and $10.4 million as of December 31, 2020.2022, and 2021, respectively.
GRANITE POINT MORTGAGE TRUST INC.
Notes to the Consolidated Financial Statements
The following table provides a reconciliation of cash, cash equivalents and restricted cash reported on the Company’s consolidated balance sheets as of December 31, 2021,2023, 2022, and December 31, 2020,2021, that sum to the total of the same such amounts shown in the consolidated statements of cash flows:
| | (in thousands) | (in thousands) | December 31,
2021 | | December 31,
2020 | (in thousands) | December 31,
2023 | | December 31,
2022 | | December 31,
2021 |
| Cash and cash equivalents | Cash and cash equivalents | $ | 191,931 | | | $ | 261,419 | |
| Restricted cash | Restricted cash | 12,362 | | | 67,774 | |
| Total cash, cash equivalents and restricted cash | Total cash, cash equivalents and restricted cash | $ | 204,293 | | | $ | 329,193 | |
GRANITE POINT MORTGAGE TRUST INC.
Notes to the Consolidated Financial Statements
Note 9. Fair Value
Fair Value Measurements
ASC 820, Fair Value Measurements, or ASC 820, defines fair value as the price that would be received to sell an asset or paid to transfer a liability in an orderly transaction between market participants at the measurement date. ASC 820 clarifies that fair value should be based on the assumptions market participants would use when pricing an asset or liability and establishes a fair value hierarchy that prioritizes the information used to develop those assumptions. The fair value hierarchy gives the highest priority to quoted prices available in active markets (i.e., market-based or observable inputs) and the lowest priority to data lacking transparency (i.e., unobservable inputs) resulting in the use of management assumptions. Additionally, ASC 820 requires an entity to consider all aspects of nonperformance risk, including the entity’s own credit standing, when measuring fair value of a liability.
ASC 820 establishes a three-level hierarchy to be used when measuring and disclosing fair value. An instrument’s categorization within the fair value hierarchy is based on the lowest level of significant input to its valuation. Following is a description of the three levels:
Level 1Inputs are quoted prices in active markets for identical assets or liabilities as of the measurement date under current market conditions. Additionally, the entity must have the ability to access the active market and the quoted prices cannot be adjusted by the entity.
Level 2Inputs include quoted prices in active markets for similar assets or liabilities; quoted prices in inactive markets for identical or similar assets or liabilities; or inputs that are observable or can be corroborated by observable market data by correlation or other means for substantially the full-term of the assets or liabilities.
Level 3Unobservable inputs are supported by little or no market activity. The unobservable inputs represent the assumptions that market participants would use to price the assets and liabilities, including risk. Generally, Level 3 assets and liabilities are valued using pricing models, discounted cash flow methodologies or similar techniques that require significant judgment or estimation.
Following are descriptions of the valuation methodologies used to measure material assets and liabilities at fair value and details of the valuation models, key inputs to those models and significant assumptions utilized.
GRANITE POINT MORTGAGE TRUST INC.
Notes to the Consolidated Financial Statements
Recurring Fair Value
As of December 31, 2021,2023, and December 31, 2020,2022, the Company held no assets or liabilities measured at fair value on a recurring basis.
Nonrecurring Fair Value
The Company may be required to measure certain assets or liabilities at fair value from time to time. These periodic fair value measures typically result from the application ofestablishing allowances for collateral-dependent assets under GAAP. These items would constitute nonrecurring fair value measures under ASC 820. For collateral-dependent loans that are identified as impaired, the Company measures allowance for credit losses by comparing its estimation of the fair value of the underlying collateral, less costs to sell, to the carrying value of the respective loan. To estimate the fair value of the underlying collateral, the Company may (i) use certain valuation techniques which, among others, may include a discounted cash flow method of valuation, or (ii) by obtaining a third-party independent assessment of value such as an appraisal or other opinion of value. These valuations require significant judgments, which include assumptions regarding capitalization rates, discount rates, leasing, creditworthiness of major tenants, occupancy rates, availability and cost of financing, exit plan, loan sponsorship, actions of other lenders, and other factors deemed relevant.
During the year endedAs of December 31, 2021,2023, the Company assigned a risk rating of “5” to twodeemed seven of its loans held-for-investment during the quarterly risk rating process. As of December 31, 2021, these two loans havewith an aggregate outstanding principal balance of $168.1$401.6 million and an aggregate carrying valueto be collateral-dependent in accordance with its policy. Therefore, the allowance for credit
GRANITE POINT MORTGAGE TRUST INC.
Notes to the Consolidated Financial Statements
losses associated with these two assetsloans was based on its estimationthe estimates of the fair value of each loan’sthe loans’ underlying property collateral, less costs to sell, as of December 31, 2021. Theseand the loans held-for-investment are therefore measured at fair value on a nonrecurring basis using significant unobservable inputs and are classified as Level 3 assets in the fair value hierarchy. The loans’ collateral properties were valued using the discounted cash flow method. The significant unobservable inputs used to estimate the fair value ofon these loans held-for-investment include the exit capitalization rate and discount rate, assumptions used to forecast the future sale price of the underlying real estate collateral, which ranged from 5.50%6.00% to 7.00%13.00%, and from 7.00%7.25% to 9.50%13.50%, respectively. Refer to Note 2 - Basis of Presentation and Significant Accounting Policies and Note 3 - Loans Held-for-Investment, Net of Allowance for Credit Losses for further detail.
During the year ended December 31, 2023, the Company acquired legal title of an office property in Phoenix, AZ. The Company’s fair market value estimate at the time of conversion from loan held-for-investment to REO was $24.0 million and was determined primarily using the discounted cash flow method. The significant unobservable inputs used to estimate the fair value include the exit capitalization rate, discount rate and return on cost assumptions used to forecast the fair value of the underlying real estate collateral, which ranged from 6.75% to 7.25%, from 9.25% to 9.75%, and from 5.50% to 6.00%, respectively. Refer to Note 4 - Real Estate Owned, Net for further detail.
Fair Value of Financial Instruments
In accordance with ASC 820, the Company is required to disclose the fair value of financial instruments, both assets and liabilities recognized and not recognized in the consolidated balance sheets, for which fair value can be estimated.
The following describes the Company’s methods for estimating the fair value for financial instruments:
•Loans held-for-investment are carried at cost, net of any unamortized acquisition premiums or discounts, loan fees, origination costs and allowance for credit losses, as applicable. The Company estimates the fair value of its loans held-for-investment by assessing any changes in market interest rates, credit spreads for loans of comparable risk as corroborated by inquiry of other market participants, shifts in credit profiles and actual operating results, for mezzanine loans and senior loans, taking into consideration such factors as underlying property type, property competitive position within its market, market and submarket fundamentals, tenant mix, nature of business plan, sponsorship, extent of leverage and other loan terms. The Company categorizes the fair value measurement of these assets as Level 3.
•Loans held-for-sale are carried at the fair value of the loans’ underlying collateral less costs to sell. The Company categorizes the fair value measurement of these assets as Level 3.
•Cash and cash equivalents and restricted cash have a carrying value which approximates fair value because of the short maturities of these instruments. The Company categorizes the fair value measurement of these assets as Level 1.
•The carrying value of the underlying loans in the repurchase facilities, the asset-specific financing facility and the term financing facilitysecured credit facilities that mature in less than one year generally approximates fair value due to the short maturities. The Company’s long-term repurchase and secured credit facilities have, and the Company’s asset-specific financing facility and term financing facility havehad, floating rates based on an index plus a credit spread and the credit spread is typically consistent with those demanded in the market. Accordingly, the interest rates on these borrowings are at market and, thus, carrying value approximates fair value. The Company categorizes the fair value measurement of these liabilities as Level 2.
•Securitized debt obligations are recorded at outstanding principal, net of any unamortized deferred debt issuance costs. In determining the fair value of its securitized debt obligations, management’s judgment may be used to arrive at fair value that considers prices obtained from third-party pricing providers, broker quotes received and other applicable market data. If observable market prices are not available or insufficient to determine fair value due principally to illiquidity in the marketplace, then fair value is based upon internally developed models that are primarily based on observable market-based inputs but also include unobservable market data inputs (including prepayment speeds, delinquency levels and credit losses). The Company categorizes the fair value measurement of these liabilities as Level 2.
GRANITE POINT MORTGAGE TRUST INC.
Notes to the Consolidated Financial Statements
•Convertible senior notes are carried at their unpaid principal balance, net of any unamortized deferred issuance costs. The Company estimates the fair value of its convertible senior notes using the market transaction price nearest to December 31, 2021.2023. The Company categorizes the fair value measurement of these assets as Level 2.
GRANITE POINT MORTGAGE TRUST INC.
Notes to the fair value of its senior secured term loan facilities at the carrying value thereof as of December 31, 2021. The Company categorizes the fair value measurement of these assets as Level 2.Consolidated Financial Statements
The following table presents the carrying values and estimated fair values of assets and liabilities that are required to be recorded or disclosed at fair value at December 31, 2021,2023, and December 31, 2020:2022:
| | December 31, 2021 | | December 31, 2020 |
| December 31, 2023 | | | December 31, 2023 | | December 31, 2022 |
| (in thousands) | (in thousands) | Carrying Value | | Fair Value | | Carrying Value | | Fair Value | (in thousands) | Carrying Value | | Fair Value | | Carrying Value | | Fair Value |
| Assets | Assets | | | | | | | |
| Loans held-for-investment, net of allowance for credit losses | Loans held-for-investment, net of allowance for credit losses | $ | 3,741,308 | | | $ | 3,771,216 | | | $ | 3,847,803 | | | $ | 3,867,286 | |
| Loans held-for-investment, net of allowance for credit losses | |
| Loans held-for-investment, net of allowance for credit losses | |
| | Cash and cash equivalents | |
| | Cash and cash equivalents | |
| | Cash and cash equivalents | Cash and cash equivalents | $ | 191,931 | | | $ | 191,931 | | | $ | 261,419 | | | $ | 261,419 | |
| Restricted cash | Restricted cash | $ | 12,362 | | | $ | 12,362 | | | $ | 67,774 | | | $ | 67,774 | |
| Liabilities | Liabilities | |
| Repurchase facilities | Repurchase facilities | $ | 677,285 | | | $ | 677,285 | | | $ | 1,708,875 | | | $ | 1,708,875 | |
| Repurchase facilities | |
| Repurchase facilities | |
| Securitized debt obligations | Securitized debt obligations | $ | 1,677,619 | | | $ | 1,681,514 | | | $ | 927,128 | | | $ | 916,701 | |
| Asset-specific financings | Asset-specific financings | $ | 43,622 | | | $ | 43,622 | | | $ | 123,091 | | | $ | 123,091 | |
| Term financing facility | $ | 127,145 | | | $ | 127,145 | | | $ | — | | | $ | — | |
| Secured credit facility | |
| | Convertible senior notes | Convertible senior notes | $ | 272,942 | | | $ | 278,554 | | | $ | 271,250 | | | $ | 257,411 | |
| Senior secured term loan facilities | $ | 139,880 | | | $ | 139,880 | | | $ | 206,448 | | | $ | 206,448 | |
| Convertible senior notes | |
| Convertible senior notes | |
|
Note 10. Commitments and Contingencies
The following represent the material commitments and contingencies of the Company as of December 31, 2021:2023:
Legal and Regulatory
From time to time, the Company may be subject to liability under laws and government regulations and various claims and legal actions arising in the ordinary course of business. Liabilities are established for legal claims when payments associated with the claims become probable and the costs can be reasonably estimated. The actual costs of resolving legal claims may be substantially higher or lower than the amounts established for those claims. Based on information currently available, management is not aware of any legal or regulatory claims that would have a material effect on the Company’s consolidated financial statements and, therefore, no accrual is required as of December 31, 2021.
GRANITE POINT MORTGAGE TRUST INC.
Notes to the Consolidated Financial Statements
2023.Unfunded Commitments on Loans Held-for-Investment
Certain of the Company’s commercial real estate loan agreements contain provisions and obligations to extend credit to its borrowers through its unfunded loan commitments over the contractual period of its loans. As of December 31, 2021,2023, and December 31, 2020,2022, the Company had unfunded loan commitments of $403.6$160.7 million and $503.7$229.6 million, respectively, on loans held-for-investment, which it expects to fund, subject to the satisfaction of any conditions precedent to such commitments, over the tenure of these loans, which have a weighted average future funding period of approximately one to two years.loans. These commitments generally provide funding for lease-related or capital improvement expenditures, as well as interest and carry costs, all of which will vary depending on the progress of capital improvement projects, leasing and cash flows at the properties that serve as collateral for the Company’s loans. Therefore, the exact timing and amounts of such loan balance future fundings are generally uncertain and will depend on the current and future performance of the collateral properties. Due to the COVID-19 pandemic and its impact on the global and U.S. economies, generally, and the U.S. commercial real estate market, specifically, the pace of lease-related or capital improvement expenditures may be slower than otherwise expected, and the pace of associated future fundings relating to these capital needs accordingly may be similarly slower; however, the exact timing and amounts are uncertain. The Company typically finances the funding of its loan commitments on terms generally consistent with its overall financing facilities; however, most of its financing agreement counterparties are not obligated to fund their ratable portion of these loan commitments over time and have varying degrees of discretion over future loan funding obligations, including the advance rates on their fundings. The Company may be obligated to fund loan commitments with respect to a pledgedfinanced asset even if the applicable financing counterparty will not fund their ratable portion of the loan commitment and/or has made margin calls with respect to such pledgedfinanced asset. As a result of the COVID-19 pandemic and the increased degree of uncertainty it has created, the Company’s financing agreement counterparties may be less likely to finance its future loan funding commitments than they were prior to the COVID-19 pandemic.
As of December 31, 2021,2023, the Company recognized $1.5$2.5 million in other liabilities related to the allowance for credit losses on unfunded loan commitments. See Note 3 - Loans Held-for-Investment, Net of Allowance for Credit Losses, for further detail.
Note 11. Preferred Stock
Temporary Equity
The Company’sCompany issued 10% cumulative redeemable preferred stock ranks senior to the rights of holderson June 28, 2017. The holder of the Company’s common stock, but junior to all other classes or series of10% cumulative redeemable preferred stock that has been issued and may be issued in the future. The holders of the preferred stock arewas entitled to receive, when, as and if authorized and declared by the Company’s board of directors, cumulative cash dividends at the rate of 10% per annum of the $1,000 liquidation preference per share of the 10% cumulative redeemable preferred stock. Such dividends accrue on a daily basis and are cumulative from and including the initial issue date of the preferred stock.
The Company hasredeemed the option at any time after five years from the initial issue date of10% cumulative redeemable preferred stock on June 28, 2017, to redeem the preferred stock30, 2023, at a redemption price of $1,000 per share, plus any accrued and unpaid dividends. At any time after six years fromshare.
GRANITE POINT MORTGAGE TRUST INC.
Notes to the initial issue date, the Company will, at the request of any preferred stockholder, repurchase the holder’s preferred stock at a price of $1,000 per share, plus any accrued and unpaid dividends.Consolidated Financial Statements
During each of the years ended December 31, 2021,2023, and 2020,2022, the Company declared dividends to the 10% cumulative redeemable preferred stockholder of $100,000.$49,444 and $100,000, respectively.
Issuance of Sub-REIT Preferred Stock
In January 2021, a subsidiary of the Company issued 625 shares of Series A preferred stock of which 500 shares were retained by the Company and 125 shares were sold to third partythird-party investors for proceeds of $0.1 million. The 500 preferred shares of Series A preferred stock retained by the Company are eliminated in the Company’s consolidated statements of changes in equity and the 125 shares sold to third-party investors are shown in the Company’s consolidated statements of changes in equity as non-controlling interests.
Issuance of 7.00% Series A Fixed-to-Floating Rate Cumulative Redeemable Preferred Stock
On November 30, 2021, and December 10, 2021, the Company received total net proceeds of $110.5 million from the issuance of the 4,596,500 shares of Series A Preferred Stock or the Initial Series A Preferred Stock Shares, after deducting the underwriting discount of $3.6 million and issuance costs of $0.8 million. The
On January 18, 2022, and February 8, 2022, the Company used thereceived total net proceeds of $87.5 million from the offering to partially prepayissuance of 3,633,000 additional shares of Series A Preferred Stock after deducting the senior secured term loan facilitiesunderwriting discount of $2.9 million and for general corporate purposes.issuance costs of $0.4 million. The Series A Preferred Stock is currently listed on the NYSE under the symbol “GPMT PrA.”
Subsequent to December 31, 2021, on January 18, 2022, and February 8, 2022, the Company received total net proceeds of $87.4 million from the issuance of the 3,633,000 additional shares of Series A Preferred Stock, or the Additional Series A Preferred Stock Shares, after deducting the underwriting discount of $2.9 million and issuance costs of $0.5 million. The Company plans to use the net proceeds from this offering for general corporate purposes.
GRANITE POINT MORTGAGE TRUST INC.
Notes to the Consolidated Financial Statements
Holders of the Series A Preferred Stock are entitled to receive, when and as declared, a dividend at a fixed rate of 7.00% per annum of the $25.00 liquidation preference. The first dividend on the Initial Series A Preferred Stock Shares was payable on January 18, 2022, and covered the period from, and including, November 30, 2021, to, but not including, January 15, 2022, and was in the amount of $0.15069 per share. The first dividend on the Additional Series A Preferred Stock Shares is payable on April 15, 2022, and will cover the period from, and including, January 15, 2022, to, but not including, April 15, 2022, and will be in the amount of $0.4375 per share.
The Series A Preferred Stock has a liquidation preference of $25.00 per share. When, as, and if authorized by the Company’s board of directors and declared by the Company, dividends on Series A Preferred Stock are payable on the 15th of April, July, October and January of each year at a rate per annum equal to 7.00% per annum of the $25.00 per share liquidation preference. Dividends on the Series A Preferred Stock are cumulative.PrA”.
On and after November 30, 2026, the Company, at its option, upon not fewer than 30 days’ nor more than 60 days’ written notice, may redeem the Series A Preferred Stock, in whole, at any time, or in part, from time to time, for cash, at a redemption price of $25.00 per share, plus any accrued and unpaid dividends thereon to, but excluding, the date fixed for redemption.
Upon the occurrence of a Change of Control event (as defined in the company,Articles Supplementary designating the Series A Preferred Stock, or the Articles Supplementary), the Company may, at ourits option, upon not less than 30 nor more than 60 days’ written notice, redeem the Series A Preferred Stock, in whole or in part, within 120 days on or after the first date on which such Change of Control occurred, for cash at a redemption price of $25.00 per share, plus any accumulated and unpaid dividends thereon to, but excluding, the redemption date, without interest. If, prior to the Change of Control Conversion Date, we have provided notice of our election to redeem some or all of the shares of Series A Preferred.
Holders of Series A Preferred Stock willdo not have any voting rights except in limited circumstances as set forth in the Articles Supplementary.
During the years ended December 31, 2023, 2022, and 2021, the Company declared dividends on the Series A Preferred Stock of $14.4 million, $14.4 million, and $0.7 million, respectively.
GRANITE POINT MORTGAGE TRUST INC.
Notes to the Consolidated Financial Statements
Note 12. Stockholders’ Equity
Common Stock
Distributions to Stockholders
The following table presents cash dividends declared by the Company’s board of directors on its common stock fromduring the years ended December 31, 2018, through December 31,2023, 2022, and 2021:
| | | | | | | | | | | | | | | | | | | | |
| Declaration Date | | Record Date | | Payment Date | | Cash Dividend Per Share |
| 2023 | | | | | | |
| December 19, 2023 | | December 29, 2023 | | January 16, 2024 | | $ | 0.20 | |
| September 20, 2023 | | October 2, 2023 | | October 16, 2023 | | $ | 0.20 | |
| June 22, 2023 | | July 3, 2023 | | July 17, 2023 | | $ | 0.20 | |
| March 16, 2023 | | April 3, 2023 | | April 17, 2023 | | $ | 0.20 | |
| | | | | | $ | 0.80 | |
| | | | | | |
| 2022 | | | | | | |
| December 20, 2022 | | December 30, 2022 | | January 17, 2023 | | $ | 0.20 | |
| September 20, 2022 | | October 3, 2022 | | October 17, 2022 | | $ | 0.25 | |
| June 16, 2022 | | July 1, 2022 | | July 15, 2022 | | $ | 0.25 | |
| March 17, 2022 | | April 1, 2022 | | April 15, 2022 | | $ | 0.25 | |
| | | | | | $ | 0.95 | |
| 2021 | | | | | | |
| December 16, 2021 | | December 31, 2021 | | January 18, 2022 | | $ | 0.25 | |
| September 15, 2021 | | October 1, 2021 | | October 19,16, 2021 | | $ | 0.25 | |
| June 15, 2021 | | July 1, 2021 | | July 19, 2021 | | $ | 0.25 | |
| March 18, 2021 | | April 1, 2021 | | April 19, 2021 | | $ | 0.25 | |
| | | | | | $ | 1.00 | |
| 2020 | | | | | |
| December 18, 2020 | | December 31, 2020 | | January 22, 2021 | | $0.25 | |
| December 18, 2020 | | December 31, 2020 | | January 22, 2021 | | $0.20 | |
| September 28, 2020 | | October 8, 2020 | | October 19, 2020 | | $0.20 | |
| | | | | | | $0.65 | |
| 2019 | | | | | |
| December 18, 2019 | | December 31, 2019 | | January 17, 2020 | | $0.42 | |
| September 18, 2019 | | October 3, 2019 | | October 18, 2019 | | $0.42 | |
| June 20, 2019 | | July 5, 2019 | | July 19, 2019 | | $0.42 | |
| March 20, 2019 | | April 1, 2019 | | April 18, 2019 | | $0.42 | |
| | | | | | | $
| 1.68 | | | | | |
GRANITE POINT MORTGAGE TRUST INC.
Notes to the Consolidated Financial Statements
Share Repurchases
On December 16, 2021,May 9, 2023, the Company announced that its board of directors increased the Company’shad amended its share repurchase program to allow forauthorize the repurchase of up to an aggregate of 4,000,000additional 5,000,000 shares of the Company’s common stock.stock, for a total share repurchase authorization of 9,000,000 shares of common stock, inclusive of amounts previously authorized. The Company’s share repurchase program has no expiration date. The shares are expected to be repurchased from time to time through privately negotiated transactions or open market transactions, including pursuant to a trading plan in accordance with Rules 10b5-1 and 10b-18 under the Securities Exchange Act of 1934, as amended, or the Exchange Act, or by any combination of such methods. The manner, price, number and timing of share repurchases will be subject to a variety of factors, including market conditions and applicable SEC rules. During the yearyears ended December 31, 2023, 2022, and 2021, the Company repurchased 2,001,338, 1,539,134 and 1,301,612 shares, respectively, of its common stock at a weighted average price of $13.65 perunder its share repurchase program for an aggregate cost, inclusive of commissions paid, of $10.3 million, $15.7 million, and $17.8 million.million respectively. As of December 31, 2021,2023, there remained 2,698,3884,157,916 shares authorized for repurchase. No shares were repurchased during the year ended December 31, 2020.repurchase under its share repurchase program.
The CompanyCompany’s board of directors has also authorized the repurchase of shares of restricted common stock granted to employees and directors for tax withholding purposes. During the yearyears ended December 31, 2023, 2022, and 2021, the Company repurchased from employees 36,916, 69,039 and directors 115,053 shares, respectively, of its common stock for an aggregate cost of $0.2 million, $0.8 million, and $1.2 million. No shares were repurchased for tax withholding purposes during the year ended December 31, 2020.million, respectively.
At-the-Market Offering
The Company is party to an equity distribution agreement under which the Company may sell up to an aggregate of 8,000,000 shares of its common stock from time to time in any method permitted by law deemed to be an “at-the-market” offering as defined in Rule 415 under the Securities Act of 1933, as amended, or Securities Act. As of December 31, 2021,2023, 3,242,364 shares of common stock had been sold under the equity distribution agreement for total accumulated net proceeds of approximately $61.2 million. No shares were sold during the years ended December 31, 2021, and 2020.2023, 2022, or 2021.
GRANITE POINT MORTGAGE TRUST INC.
Notes to Purchase Common Stock
See Note 7 - SeniorSecured Term Loan Facilities and Warrants to Purchase Shares of Common Stock for details on warrants to purchase shares of the Company’s common stock.Consolidated Financial Statements
Preferred Stock
Distributions to Stockholders
The following table presents cash dividends declared by the Company’s board of directors on its Series A preferred stock fromPreferred Stock during the years ended December 31, 2018, through December 31,2023, 2022 and 2021:
| | | | | | | | | | | | | | | | | | | | |
| Declaration Date | | Record Date | | Payment Date | | Cash Dividend Per Share |
| 2023 | | | | | | |
| | | | | | |
| December 19, 2023 | | December 29, 2023 | | January 16, 2024 | | $ | 0.43750 | |
| September 20, 2023 | | October 2, 2023 | | October 16, 2023 | | $ | 0.43750 | |
| June 22, 2023 | | July 3, 2023 | | July 17, 2023 | | $ | 0.43750 | |
| March 16, 2023 | | April 3, 2023 | | April 17, 2023 | | $ | 0.43750 | |
| | | | | | $ | 1.75000 | |
| 2022 | | | | | | |
| | | | | | |
| | | | | | |
| | | | | | |
| December 20, 2022 | | December 20, 2022 | | January 1, 2023 | | $ | 0.43750 | |
| September 20, 2022 | | October 3, 2022 | | October 17, 2022 | | $ | 0.43750 | |
| June 16, 2022 | | July 1, 2022 | | July 15, 2022 | | $ | 0.43750 | |
| March 17, 2022 | | April 1, 2022 | | April 15, 2022 | | $ | 0.43750 | |
| | | | | | $ | 1.75000 | |
| 2021 | | | | | | |
| December 16, 2021 | | December 31, 2021 | | January 18, 2022 | | $ | 0.15069 | |
| | | | | | $ | 0.15069 | |
Note 13. Equity Incentive PlanPlans
TheOn June 2, 2022, the Company’s stockholders approved the adoption of the Granite Point Mortgage Trust Inc. 2022 Omnibus Incentive Plan, or the 2022 Plan. With the adoption of the 2022 Plan, no new equity awards may be granted under the Granite Point Mortgage Trust Inc. 2017 Equity Incentive Plan, or the 2017 Plan, but previously granted restricted stock units, or RSUs, and performance share units, or PSUs, remain outstanding under the 2017 Plan. The 2022 Plan permits the granting of restricted common stock phantom shares, oroptions, stock appreciation rights, restricted stock, units, both non-performance based, or RSUs, and performance-based, or PSUs, dividend equivalent rights, other stock-based awards and other equity-basedcash-based awards to employees, directors, officers, advisors,certain consultants of the Company and other personnel.members of the board of directors. As of December 31, 2021,2023, the Company had 2,225,9917,182,964 shares of common stock available for future issuance under the 2022 Plan.
The Company accounts for equity-based awards under ASC 718 - Compensation - Stock Compensation, which requires the Company to expense the cost of services received in exchange for equity-based awards based on the grant-date fair value of the awards. This expense is recognized ratably over the requisite service period following the date of grant. The fair value of awards of the Company’s restricted common stock and RSUs is typically equivalent to the closing stock price on the grant date. The unrecognized compensation cost relating to such awards is recognized as an expense over the awards’ remaining vesting periods.
As of December 31, 2021, there was $0.7 million of total unrecognized compensation cost for awards of restricted common stock that will be recognized over the grants’ remaining weighted average vesting period of 1.1 years. For the year ended December 31, 2021, the Company recognized $7.6 million of compensation expense associated with these awards, compared to $5.3 million and $4.8 million for the year ended December 31, 2020, and 2019, respectively, within compensation and benefits expense on the consolidated statements of income (loss).
GRANITE POINT MORTGAGE TRUST INC.
Notes to the Consolidated Financial Statements
The following table summarizes the grants, vesting and forfeitures of restricted stock, RSUs and PSUs for the year ended December 31, 2023:
| | | | | | | | | | | | | | | | | | | | | | | |
| Restricted Stock | | RSUs | | PSUs(1) | | Weighted Average Grant Date Fair Market Value |
| | | | | | | |
| | | | | | | |
| | | | | | | |
| | | | | | | |
| | | | | | | |
| | | | | | | |
| | | | | | | |
| | | | | | | |
| Outstanding at December 31, 2020 | 569,535 | | | 403,903 | | | — | | | $ | 14.93 | |
| Granted | — | | | 564,415 | | | 347,896 | | | 11.43 | |
| Vested | (189,820) | | | (31,078) | | | — | | | 12.74 | |
| Forfeited | (115,053) | | | (3,957) | | | — | | | 16.16 | |
| Outstanding at December 31, 2021 | 264,662 | | | 933,283 | | | 347,896 | | | $ | 12.48 | |
| Granted | — | | | 523,190 | | | 312,538 | | | 11.78 | |
| Vested | (103,038) | | | (218,034) | | | — | | | 13.38 | |
| Forfeited | (69,039) | | | — | | | — | | | 18.87 | |
| Outstanding at December 31, 2022 | 92,585 | | | 1,238,439 | | | 660,434 | | | $ | 11.83 | |
| | | | | | | |
| | | | | | | |
| | | | | | | |
| | | | | | | |
| | | | | | | |
| | | | | | | |
| | | | | | | |
| | | | | | | |
| | | | | | | |
| | | | | | | |
| | | | | | | |
| | | | | | | |
| Granted | — | | | 1,255,082 | | | 734,223 | | | 5.02 | |
| Vested | (55,669) | | | (265,106) | | | — | | | 11.98 | |
| Forfeited | (36,916) | | | (129,540) | | | — | | | 12.55 | |
| Outstanding at December 31, 2023 | — | | | 2,098,875 | | | 1,394,657 | | | $ | 7.90 | |
____________________(1)As of December 31, 2023, the Company has deemed that the performance criteria for the 347,896 PSUs granted in 2021 are not probable of being met, which would result in no shares of common stock related to these PSUs. These units will remain outstanding at target levels until the Company’s performance over the awards’ three-year performance period ended on December 31, 2023, relative to their performance criteria, is determined in the first quarter of 2024. For additional details on the performance metrics, see below.
Below is a summary of RSU and PSU vesting dates as of December 31, 2023:
| | | | | | | | | | | | | | | | | | | | | |
| Vesting Year | | | RSUs | | PSUs(1) | | Total Awards |
| 2024 | | | 849,974 | | | 347,896 | | | 1,197,870 | |
| 2025 | | | 886,100 | | | 312,538 | | | 1,198,638 | |
| 2026 | | | 362,801 | | | 734,223 | | | 1,097,024 | |
| Total | | | 2,098,875 | | | 1,394,657 | | | 3,493,532 | |
____________________(1)As of December 31, 2023, there was $5.5were 347,896 PSUs outstanding that the Company has deemed not probable of vesting. These PSUs will remain outstanding until the performance matrix criteria is available for measurement in the first quarter of 2024. The shares had an aggregate grant date fair value of $4.9 million.
For the year ended December 31, 2023, the Company recognized the remaining $47.5 thousand of compensation expense associated with awards of restricted stock, compared to $0.7 million and $2.3 million for the years ended December 31, 2022, and 2021, respectively, within compensation and benefits expense on the consolidated statements of income. As of December 31, 2023, all awards of restricted stock had vested.
The RSUs are time based with one-third vesting each year over a three-year period. For the year ended December 31, 2023, the Company recognized $6.7 million of compensation expense associated with these awards, compared to $5.9 million and $4.3 million for the years ended December 31, 2022, and 2021, respectively, within compensation and benefits expense on the consolidated statements of income. As of December 31, 2023, $5.3 million of total unrecognized compensation cost for awards of RSUs that will be recognized over the grants’ remaining weighted average vesting period of 1.90.8 years. For the year ended December 31, 2021, the Company recognized $4.3 million of compensation expense associated with these awards within compensation and benefits expense on the consolidated statements of income (loss). The Company did not recognize any compensation expense associated with grants of RSUs in any period prior to January 1, 2021.
Awards of PSUs have a three-yearthree-year cliff vesting, with the number of performance-based stock units vesting at the end of the three-yearthree-year period based upon the Company’s absolute and relative “core” return on average equity, or Core ROAE, performance aswith respect to metrics set in the applicable award agreements. More specifically, betweenBetween 0% and 200% of the target number of units granted in early 2021 and 2022 may vest at the end of their respective performance periods based (i) 50% against the predetermined internal Company performance goal for “core” return on average equity, or “core” ROAE and (ii) 50% against the Company’s performance ranking for “core” ROAE among a peer group of commercial mortgage REIT companies. Between 0% and 200% of the target number of units granted in March 2023 may vest at the end of the performance period based (i) 50%25% against the predetermined internal Company performance goal “run-rate” ROAE, (ii) 25% against the Company’s performance ranking for “run-rate” ROAE among a peer group of commercial mortgage REIT companies, (iii) 25% against the predetermined internal Company performance goal for Core ROAEchange in book value per share, and (ii) 50%(iv) 25% against the Company’s performance ranking for Core ROAEchange in book value per share among a peer group of commercial mortgage REIT peer companies. The commercial mortgage REIT peer group used to measure relative “core” ROAE, “run-rate” ROAE and change in book value per share includes publicly traded commercial mortgage REITs, which the
GRANITE POINT MORTGAGE TRUST INC.
Notes to the Consolidated Financial Statements
Company believes derive the majority of their revenues from commercial real estate balance sheet lending activities and meet certain market capitalization criteria.
For the year ended December 31, 2023, the Company recognized $0.2 million of compensation expense associated with these awards, compared to $0.5 million and $1.0 million for the years ended December 31, 2022, and 2021, respectively, within compensation and benefits expenses on the consolidated statements of income. As of December 31, 2021, there was $3.92023, $2.9 million of total unrecognized compensation cost for awards of PSUs that will be recognized over the grants’ remaining weighted average vesting period of 1.5 years. For the year ended December 31, 2021, the Company recognized $1.0 million of compensation expense associated with these awards within compensation and benefits expenses on the consolidated statements of income (loss). The Company did not recognize any compensation expense associated with grants of PSUs in any period prior to January 1, 2021.
The following table summarizes the grants, vesting and forfeitures of restricted common stock, RSUs and PSUs for the year ended December 31, 2021:
| | | | | | | | | | | | | | | | | | | | | | | |
| Restricted Stock | | RSUs | | PSUs | | Weighted Average Grant Date Fair Market Value |
| Outstanding at December 31, 2018 | 321,134 | | | — | | | — | | | $ | 18.04 | |
| Granted | 277,107 | | | — | | | — | | | 19.31 | |
| Vested | (136,870) | | | — | | | — | | | (18.20) | |
| Forfeited | — | | | — | | | — | | | — | |
| Outstanding at December 31, 2019 | 461,371 | | | — | | | — | | | $ | 18.75 | |
| Granted | 367,489 | | | 403,903 | | | — | | | 12.81 | |
| Vested | (243,713) | | | — | | | — | | | (18.74) | |
| Forfeited | (15,612) | | | — | | | — | | | (18.68) | |
| Outstanding at December 31, 2020 | 569,535 | | | 403,903 | | | — | | | $ | 14.93 | |
| Granted | — | | | 564,415 | | | 347,896 | | | 11.43 | |
| Vested | (189,820) | | | (31,078) | | | — | | | (12.74) | |
| Forfeited | (115,053) | | | (3,957) | | | — | | | (16.16) | |
| Outstanding at December 31, 2021 | 264,662 | | | 933,283 | | | 347,896 | | | 12.48 | |
Below is a summary of restricted stock, RSU and PSU vesting dates as of December 31, 2021:
| | | | | | | | | | | | | | | | | | | | | | | |
| Vesting Year | Restricted Stock | | RSUs | | PSUs | | Total Awards |
| 2022 | 172,077 | | | 218,034 | | | — | | | 390,111 | |
| 2023 | 92,585 | | | 173,187 | | | 347,896 | | | 613,668 | |
| 2024 | — | | | 173,194 | | | — | | | 173,194 | |
| 2025 | — | | | 368,868 | | | — | | | 368,868 | |
| | | | | | | |
| Total | 264,662 | | | 933,283 | | | 347,896 | | | 1,545,841 | |
Note 14. Income Taxes
The Company has elected to be taxed as a REIT under the Code for U.S. federal income tax purposes. As long as the Company qualifies as a REIT, the Company generally will not be subject to U.S. federal income taxes on that portion of its income that it distributes to its stockholders if it annually distributes at least 90% of its REIT taxable income, without regard to the deduction for dividends paid and excluding net capital gains and does not engage in prohibited transactions. For the year
GRANITE POINT MORTGAGE TRUST INC.
Notes to the Consolidated Financial Statements
ended December 31, 2021, and 2020, the Company did not distribute the required minimum amount of taxable income pursuant to federal excise tax requirements and, consequently, the Company accrued an excise tax of $0.3 million and $0.6 million, respectively. As of December 31, 2021, the Company distributed 100% of its REIT taxable income for the taxable year ended December 31, 2020, in part with dividends paid in 2021, and has complied with all requirements to continue to qualify as a REIT. The Company intends to distribute 100% of its REIT taxable income for the taxable year ending December 31, 2021, in part with dividends paid in 2022, and comply with all requirements to continue to qualify as a REIT. The majority of states also recognize the Company’s REIT status. The Company’s TRS files a separate federal tax return and is fully taxed as a standalone U.S. C-corporation. It is assumed that the Company will retain its REIT status and will incur no REIT level taxation as it intends to comply with the REIT regulations and annual distribution requirements.
The Company’s taxable income before dividend distributions differs from its pre-tax net income for GAAP purposes primarily due to differences in timing between GAAP and tax accounting related to restructuring charges, and provision for credit losses.losses and amendments to loans treated as “significant modifications” for tax under applicable Treasury regulations. These book to tax differences in the REIT are not reflected in the consolidated financial statements as the Company assumes it will retain its REIT status.
The following is a reconciliation of the statutory federal and state rates to the effective rates, for the yearyears ended December 31, 2021, 2020,2023, 2022, and 2019:2021:
| | | | | | | | | | | | | | | | | | | | | | | | | | | | | | | | | | | |
| Year Ended |
| December 31, |
| 2021 | | 2020 | | 2019 |
| (dollars in thousands) | Amount | | Percent | | Amount | | Percent | | Amount | | Percent |
| Computed income tax expense at federal rate | $ | 14,394 | | | 21 | % | | $ | (8,368) | | | 21 | % | | $ | 14,744 | | | 21 | % |
| State taxes, net of federal benefit, if applicable | — | | | — | % | | — | | | — | % | | — | | | — | % |
| Permanent differences in taxable income from GAAP net income | (404) | | | (1 | %) | | (57) | | | — | % | | (150) | | | — | % |
| Dividends paid deduction | (13,798) | | | (20 | %) | | 9,018 | | | (23 | %) | | (14,598) | | | (21 | %) |
| Provision for (benefit from) income taxes/ Effective Tax Rate | $ | 192 | | | — | % | | $ | 593 | | | (2 | %) | | $ | (4) | | | — | % |
| | | | | | | | | | | | | | | | | | | | | | | | | | | | | | | | | | | |
| Year Ended |
| December 31, |
| 2023 | | 2022 | | 2021 |
| (dollars in thousands) | Amount | | Percent | | Amount | | Percent | | Amount | | Percent |
| Computed income tax expense at federal rate | $ | (13,252) | | | 21 | % | | $ | (8,570) | | | 21 | % | | $ | 14,394 | | | 21 | % |
| State taxes, net of federal benefit, if applicable | 70 | | | — | % | | 14 | | | — | % | | — | | | — | % |
| Permanent differences in taxable income from GAAP net income | (261) | | | — | % | | (228) | | | 1 | % | | (404) | | | (1) | % |
| REIT income not subject to corporate income tax | 13,538 | | | (21) | % | | 8,801 | | | (22) | % | | (13,798) | | | (20) | % |
| Provision for (benefit from) income taxes/ Effective Tax Rate | $ | 95 | | | — | % | | $ | 17 | | | — | % | | $ | 192 | | | — | % |
The Company’s permanent differences in taxable income from GAAP net (loss) income (loss) attributable to common stockholders in the yearyears ended December 31, 2021, 20202023, 2022 and 20192021 were primarily due to a recurring difference in compensation expense related to restricted stock dividends.
Based on the Company’s evaluation, it has been concluded that there are no significant uncertain tax positions requiring recognition in the Company’s consolidated financial statements of a contingent tax liability for uncertain tax positions. Additionally, there were no amounts accrued for penalties or interest as of, or during, the periods presented in these
consolidated financial statements.
GRANITE POINT MORTGAGE TRUST INC.
Notes to the Consolidated Financial Statements
Note 15. Earnings (Loss) Per Share
The following table presents a reconciliation of the earnings and shares used in calculating basic and diluted earnings per share for the years ended December 31, 2021, 20202023, and 2019:2022:
| | | | | | | | | | | | | | | | | | | |
| Year Ended |
| December 31, |
| (in thousands, except share data) | 2021 | | 2020 | | 2019 | | |
| Numerator: | | | | | | | |
| Net income (loss) attributable to common stockholders - basic | $ | 67,560 | | | $ | (40,539) | | | $ | 70,114 | | | |
| Interest expense attributable to convertible notes | — | | | — | | | — | | | |
| Net income (loss) attributable to common stockholders - diluted | $ | 67,560 | | | $ | (40,539) | | | $ | 70,114 | | | |
| Denominator: | | | | | | | |
| Weighted average common shares outstanding | 54,282,018 | | | 54,580,046 | | | 52,615,977 | | | |
| Weighted average restricted stock shares | 311,481 | | | 576,436 | | | 471,418 | | | |
| Basic weighted average shares outstanding | 54,593,499 | | | 55,156,482 | | | 53,087,395 | | | |
| | | | | | | |
| Effect of dilutive shares issued in an assumed conversion of RSUs as additional shares | 335,571 | | | — | | | — | | | |
| Effect of dilutive shares issued in an assumed conversion of PSUs as additional shares | — | | | — | | | — | | | |
| | | | | | | |
| Diluted weighted average shares outstanding | 54,929,070 | | | 55,156,482 | | | 53,087,395 | | | |
| Earnings (loss) per share | | | | | | | |
| Basic | $ | 1.24 | | | $ | (0.73) | | | $ | 1.32 | | | |
| Diluted | $ | 1.23 | | | $ | (0.73) | | | $ | 1.32 | | | |
| | | | | | | | | | | | | | | | | | | | | | | | | | | |
| | | | | Year Ended |
| | | | | December 31, |
| (in thousands, except share data) | | | | | | | | | 2023 | | 2022 | | 2021 |
| Numerator: | | | | | | | | | | | | | |
| Net income (loss) attributable to common stockholders | | | | | | | | | $ | (77,649) | | | $ | (55,327) | | | $ | 67,560 | |
| Dividends allocated to participating restricted stock units | | | | | | | | | (1,661) | | | — | | | — | |
| Net income (loss) attributable to common stockholders - basic | | | | | | | | | $ | (79,310) | | | $ | (55,327) | | | $ | 67,560 | |
| | | | | | | | | | | | | |
| | | | | | | | | | | | | |
| | | | | | | | | | | | | |
| Net income (loss) attributable to common stockholders - diluted | | | | | | | | | $ | (79,310) | | | $ | (55,327) | | | $ | 67,560 | |
| Denominator: | | | | | | | | | | | | | |
| Weighted average common shares outstanding | | | | | | | | | 51,641,619 | | | 52,904,606 | | | 54,282,018 | |
| Weighted average restricted stock shares | | | | | | | | | — | | | 107,200 | | | 311,481 | |
| Basic weighted average shares outstanding | | | | | | | | | 51,641,619 | | | 53,011,806 | | | 54,593,499 | |
| | | | | | | | | | | | | |
| Effect of dilutive shares issued in an assumed conversion of RSUs as additional shares | | | | | | | | | — | | | — | | | 335,571 | |
| | | | | | | | | | | | | |
| | | | | | | | | | | | | |
| Diluted weighted average shares outstanding | | | | | | | | | 51,641,619 | | | 53,011,806 | | | 54,929,070 | |
| Earnings (loss) per share | | | | | | | | | | | | | |
| Basic | | | | | | | | | $ | (1.50) | | | $ | (1.04) | | | $ | 1.24 | |
| Diluted | | | | | | | | | $ | (1.50) | | | $ | (1.04) | | | $ | 1.23 | |
For the yearsyear ended December 31, 2021, 20202022, and 2019,2021, excluded from the calculation of diluted earnings per share is the effect of adding back $18.2 million, $18.1$17.5 million and $18.0$18.2 million, respectively, of interest expense related to the Company’s convertible senior notes. For the years ended December 31, 2022, and 2021, 13,431,000 and 14,065,946, 13,717,782 and 13,670,796, respectively, of weighted average common share equivalents related to the assumed conversion of the Company’s convertible senior notes were also excluded from the calculation of diluted earnings per share, as their inclusion would be antidilutive. As of December 31, 2023, the convertible notes have been redeemed and no notes remain outstanding.
The computation of diluted earnings per share is also based on the incremental shares that would be outstanding assuming the conversionsettlement of RSUs. The number of incremental shares is calculated by applying the treasury stock method. For the yearyears ended December 31, 2021, an additional 335,5712023, and 2022, 496,317 and 393,610 of weighted-average unvested RSUs, respectively, were included in the dilutive earnings per share denominator. For the year ended December 31, 2020, no additional weighted-average unvested RSUs were includedexcluded in the dilutive earnings per share denominator, as their inclusion would be antidilutive. The Company did not have anyFor the year ended 2021, 335,571 of weighted-average unvested RSUs outstanding as of December 31, 2019.were included in the dilutive earnings per share denominator.
The computation of diluted earnings per share is also based on the incremental shares that would be outstanding assuming the conversionsettlement of PSUs. The number of incremental shares is calculated by applying the treasury stock method. For the yearyears ended December 31, 2023, 2022, and 2021, no additional weighted-average unvested PSUs were included in the dilutive earnings per share denominator, as their inclusion would be antidilutive. The Company did not have any PSUs outstanding as of December 31, 2020, and 2019.
Note 16. Related Party Transactions
Prior to the Internalization, the Company paid the Former Manager a base management fee equal to 1.5% of the Company’s equity on an annualized basis. The Company incurred $15.8 million and 14.9 million, respectively, in management fees for the years ended December 31, 2020, and 2019, respectively. The Company did not incur a management fee for the year ended December 31, 2021, because the Company was not managed by the Former Manager during the period as a result of the Internalization.
In addition, incentive fees, if earned, were payable to the Former Manager. No incentive fees were incurred for the years ended December 31, 2021, and 2020. The Company incurred $0.2 million as an incentive fee to the Former Manager for the year ended December 31, 2019.
GRANITE POINT MORTGAGE TRUST INC.
Notes to the Consolidated Financial Statements
Prior to the Internalization, the Company reimbursed the Former Manager for certain direct and allocated costs incurred by the Former Manager on behalf of the Company. During the years ended December 31, 2020, and 2019, these direct and allocated costs totaled approximately $12.3 million and $11.7 million, respectively. No direct and allocated costs were incurred by the Former Manager on behalf of the Company during the year ended December 31, 2021, because the Company was not managed by the Former Manager during the period as a result of the Internalization.
The Company recognized $7.6 million, $5.3 million and $4.8 million of compensation during the years ended December 31, 2021, 2020 and 2019, related to equity incentive awards issued to the Company’s personnel and the Company’s independent directors pursuant to the Plan. See Note 17 - Equity Incentive Plan for additional information.
The terms of these transactions may have been different had they been transacted with an unrelated third-party.
Note 17.16. Subsequent Events
Events subsequent to December 31, 20212023, were evaluated through the date these consolidated financial statements were issued and no other additional events were identified requiring further disclosure in these consolidated financial statements other than as discussed below.statements.
On January 18, 2022, and February 8, 2022, the Company issued a total of 3,633,000 additional shares of its Series A Preferred Stock. See Note 11 – Preferred Stock for additional details.
On February 16, 2022, the Company prepaid an additional $50.0 million of borrowings under the senior secured term loan facilities. See Note 7 – Senior Secured Term Loan Facilities and Warrants to Purchase Shares of Common Stock for additional details.
GRANITE POINT MORTGAGE TRUST INC.
SCHEDULE IV – MORTGAGE LOANS ON REAL ESTATE
As of December 31, 20212023
(dollars in thousands)
| | Asset Type/ Location | Asset Type/ Location | | Interest Rate | | Maturity Date (2) | | Periodic Payment Terms (3) | | Prior Liens (4) | | Face Amount | | Carrying Amount (5) | | Principal Amount Subject to Delinquent Principal or Interest | Asset Type/ Location | | Interest Rate | | Maturity Date (2) | | Periodic Payment Terms (3) | | Prior Liens (4) | | Face Amount | | Carrying Amount (5) | | Principal Amount Subject to Delinquent Principal or Interest |
Senior Loans (1) | Senior Loans (1) | | | | | | | | |
| Mixed-Use/Southwest | | L + | 4.15 | % | | 4/2022 | | IO | | $ | — | | | $ | 120,000 | | | $ | 119,378 | | | $ | — | |
| Office/West | | L + | 3.24 | % | | 11/2022 | | IO | | — | | | 92,997 | | | 92,350 | | | — | |
| Retail/West | | L + | 3.34 | % | | 7/2021 | | IO | | — | | | 114,128 | | | 99,516 | | | 114,128 | |
| Multifamily/Midwest | |
| Multifamily/Midwest | |
| Multifamily/Midwest | Multifamily/Midwest | | L + | 2.75 | % | | 1/2024 | | IO | | — | | | 95,408 | | | 94,612 | | | — | |
| Office/Midwest | Office/Midwest | | L + | 2.80 | % | | 8/2022 | | IO | | — | | | 92,731 | | | 92,086 | | | — | |
| Mixed-Use/Northeast | Mixed-Use/Northeast | | L + | 3.75 | % | | 1/2024 | | IO | | — | | | 77,599 | | | 76,902 | | | — | |
| Office/Southeast | |
| Mixed-Use/Southwest | |
| Mixed-Use/Southwest | |
| Office/Midwest | Office/Midwest | | L + | 3.69 | % | | 8/2022 | | IO | | — | | | 80,782 | | | 80,211 | | | — | |
| Office/Southeast | | L + | 2.55 | % | | 11/2022 | | IO | | — | | | 84,971 | | | 84,182 | | | — | |
| Industrial/West | | L + | 3.25 | % | | 2/2023 | | IO | | — | | | 63,443 | | | 63,032 | | | — | |
| Mixed-Use/Southwest | | L + | 2.69 | % | | 7/2022 | | IO | | — | | | 81,415 | | | 80,893 | | | — | |
| Mixed-Use/Southeast | Mixed-Use/Southeast | | L + | 3.36 | % | | 10/2022 | | IO | | — | | | 76,846 | | | 76,235 | | | — | |
| Office/Southeast | | L + | 4.25 | % | | 6/2022 | | IO | | — | | | 68,158 | | | 68,012 | | | — | |
| Hotel/Southwest | | L + | 4.45 | % | | 12/2022 | | IO | | — | | | 71,495 | | | 70,696 | | | — | |
| Office/Northeast | | L + | 2.80 | % | | 12/2022 | | IO | | — | | | 50,201 | | | 49,747 | | | — | |
| Multifamily/Southwest | | L + | 3.00 | % | | 7/2024 | | IO | | — | | | 60,531 | | | 59,688 | | | — | |
| Office/Southwest | | L + | 3.00 | % | | 10/2022 | | IO | | — | | | 60,200 | | | 60,063 | | | — | |
| Office/Southwest | | L + | 2.90 | % | | 12/2022 | | IO | | — | | | 56,288 | | | 56,129 | | | — | |
| Multifamily/West | | L + | 3.15 | % | | 10/2024 | | IO | | — | | | 51,000 | | | 50,430 | | | — | |
| Office/Northeast | | L + | 3.30 | % | | 7/2022 | | IO | | — | | | 51,393 | | | 51,261 | | | — | |
| Office/Northeast | | L + | 4.07 | % | | 10/2021 | | IO | | — | | | 53,966 | | | 45,855 | | | 53,966 | |
| Mixed-Use/Northeast | | L + | 3.40 | % | | 11/2024 | | IO | | — | | | 46,580 | | | 45,863 | | | — | |
| Office/Southeast | | L + | 4.32 | % | | 7/2024 | | IO | | — | | | 46,624 | | | 46,104 | | | — | |
| Hotel/Midwest | | L + | 5.00 | % | | 10/2024 | | IO | | — | | | 46,059 | | | 45,062 | | | — | |
| Hotel/Southeast | | L + | 3.30 | % | | 3/2023 | | IO | | — | | | 45,087 | | | 43,473 | | | — | |
| Office/Midwest | | L + | 3.25 | % | | 4/2022 | | IO | | — | | | 35,885 | | | 35,762 | | | — | |
| Office/Northeast | | L + | 3.73 | % | | 5/2022 | | P&I | | — | | | 48,980 | | | 48,888 | | | — | |
| Retail/West | |
| Office/Southeast | Office/Southeast | | L + | 3.70 | % | | 11/2024 | | IO | | — | | | 44,115 | | | 43,512 | | | — | |
| Office/Northeast | Office/Northeast | | L + | 3.69 | % | | 7/2024 | | IO | | — | | | 45,361 | | | 44,747 | | | — | |
| Hotel/West | | L + | 3.60 | % | | 7/2022 | | IO | | — | | | 46,000 | | | 45,885 | | | — | |
| Office/Southwest | |
| Office/Northeast | |
| Hotel/Midwest | |
| Mixed-Use/Northeast | |
| Office/West | |
| Multifamily/Midwest | |
| Office/Southeast | |
| Industrial/Northeast | |
| Multifamily/Southwest | Multifamily/Southwest | | L + | 3.16 | % | | 9/2024 | | IO | | — | | | 45,448 | | | 44,562 | | | — | |
| Multifamily/Southwest | Multifamily/Southwest | | L + | 3.13 | % | | 9/2022 | | IO | | — | | | 45,410 | | | 45,215 | | | — | |
| Office/Northeast | |
| Multifamily/Southeast | |
| Multifamily/Southwest | |
| Industrial/Northeast | |
| Office/West | Office/West | | L + | 3.30 | % | | 10/2024 | | IO | | — | | | 37,778 | | | 37,204 | | | — | |
| Mixed-Use/Northeast | | L + | 3.20 | % | | 5/2022 | | IO | | — | | | 41,856 | | | 41,632 | | | — | |
| Multifamily/Midwest | | L + | 4.24 | % | | 11/2022 | | IO | | — | | | 42,433 | | | 41,380 | | | — | |
| Mixed-Use/Northeast | Mixed-Use/Northeast | | L + | 4.38 | % | | 1/2023 | | IO | | — | | | 37,945 | | | 37,784 | | | — | |
| Office/Northeast | Office/Northeast | | L + | 2.93 | % | | 10/2022 | | IO | | — | | | 31,988 | | | 31,872 | | | — | |
| Multifamily/Southeast | Multifamily/Southeast | | L + | 3.28 | % | | 7/2024 | | IO | | — | | | 24,198 | | | 23,860 | | | — | |
| Other/Northeast | |
| Mixed-Use/West | |
| Office/Northeast | Office/Northeast | | L + | 3.18 | % | | 6/2022 | | IO | | — | | | 34,804 | | | 34,747 | | | — | |
| Hotel/Northeast | | L + | 3.70 | % | | 7/2022 | | IO | | — | | | 36,198 | | | 36,014 | | | — | |
| Multifamily/Midwest | |
| Multifamily/Southeast | |
| Office/Northeast | |
| Multifamily/Southeast | |
| Multifamily/Southwest | |
| Multifamily/Southeast | |
| Office/Northeast | |
| Hotel/Midwest | |
| | Asset Type/ Location | | Interest Rate | | Maturity Date (2) | | Periodic Payment Terms (3) | | Prior Liens (4) | | Face Amount | | Carrying Amount (5) | | Principal Amount Subject to Delinquent Principal or Interest |
| Mixed-Use/West | | L + | 3.60 | % | | 12/2022 | | IO | | — | | | 35,793 | | | 35,595 | | | — | |
| Industrial/Northeast | | L + | 2.85 | % | | 5/2022 | | IO | | — | | | 30,299 | | | 30,236 | | | — | |
| Multifamily/Southeast | | L + | 3.28 | % | | 10/2023 | | IO | | — | | | 33,510 | | | 33,254 | | | — | |
| Office/Southeast | | L + | 3.42 | % | | 3/2023 | | IO | | — | | | 15,970 | | | 15,713 | | | — | |
| Office/Southwest | | L + | 5.35 | % | | 5/2022 | | IO | | — | | | 31,295 | | | 31,278 | | | — | |
| Office/West | | L + | 2.75 | % | | 10/2022 | | IO | | — | | | 25,038 | | | 24,987 | | | — | |
| Multifamily/Midwest | | L + | 2.92 | % | | 1/2023 | | IO | | — | | | 32,065 | | | 31,068 | | | — | |
| Office/Southwest | | L + | 4.40 | % | | 5/2022 | | IO | | — | | | 29,837 | | | 29,726 | | | — | |
| Office/West | | L + | 3.15 | % | | 10/2022 | | IO | | — | | | 26,118 | | | 25,984 | | | — | |
| Office/West | | L + | 2.80 | % | | 3/2023 | | IO | | — | | | 27,581 | | | 27,350 | | | — | |
| Multifamily/Southwest | Multifamily/Southwest | | L + | 2.90 | % | | 7/2024 | | IO | | — | | | 28,845 | | | 28,698 | | | — | |
| Office/Northeast | | - | 5.11 | % | | 3/2026 | | P&I | | — | | | 33,460 | | | 33,312 | | | — | |
| Hotel/Midwest | | L + | 4.07 | % | | 7/2022 | | IO | | — | | | 28,745 | | | 28,520 | | | — | |
| Multifamily/Southeast | Multifamily/Southeast | | L + | 3.18 | % | | 11/2024 | | IO | | — | | | 28,400 | | | 28,016 | | | — | |
| Multifamily/Southwest | Multifamily/Southwest | | L + | 3.15 | % | | 11/2024 | | IO | | — | | | 32,200 | | | 31,819 | | | — | |
| Office/Northeast | Office/Northeast | | L + | 2.97 | % | | 4/2022 | | IO | | — | | | 27,984 | | | 27,929 | | | — | |
| Industrial/Southeast | |
| Hotel/Southwest | |
| Office/Southeast | |
| Office/Southeast | |
| Multifamily/Southwest | |
| Multifamily/Northeast | |
| Multifamily/West | |
| Office/West | |
| Hotel/Southeast | |
| Other/Northeast | |
| Multifamily/Southeast | |
| Other/Midwest | |
| Mixed-Use/Southeast | |
| Office/West | |
| Retail/Southeast | |
| Multifamily/Southwest | |
| Hotel/Northeast | |
| Office/West | |
| Office/West | |
| Office/Midwest | |
| Multifamily/Midwest | |
| Office/West | |
| Office/Northeast | Office/Northeast | | L + | 3.32 | % | | 8/2022 | | IO | | — | | | 24,052 | | | 24,010 | | | — | |
| Multifamily/Southwest | | L + | 2.80 | % | | 8/2022 | | IO | | — | | | 31,199 | | | 31,095 | | | — | |
| Multifamily/Midwest | Multifamily/Midwest | | L + | 2.75 | % | | 12/2022 | | IO | | — | | | 31,120 | | | 30,989 | | | — | |
| Mixed-Use/Northeast | | L + | 4.07 | % | | 5/2022 | | IO | | — | | | 30,995 | | | 30,341 | | | — | |
| Office/Southeast | | L + | 4.00 | % | | 5/2022 | | P&I | | — | | | 29,215 | | | 28,953 | | | — | |
| Multifamily/Southeast | | L + | 3.22 | % | | 7/2024 | | IO | | — | | | 29,701 | | | 29,408 | | | — | |
| Office/Northeast | |
| Office/West | Office/West | | L + | 3.18 | % | | 11/2022 | | IO | | — | | | 19,079 | | | 18,935 | | | — | |
| Multifamily/Southwest | | L + | 2.97 | % | | 2/2022 | | IO | | — | | | 26,901 | | | 26,873 | | | — | |
| Hotel/Midwest | | L + | 3.90 | % | | 12/2022 | | IO | | — | | | 27,500 | | | 27,321 | | | — | |
| Multifamily/Northeast | | L + | 4.10 | % | | 7/2022 | | IO | | — | | | 27,250 | | | 27,146 | | | — | |
| Office/Northeast | |
| Office/West | |
| Mezzanine Loans | |
| Hotel/West | Hotel/West | | L + | 3.83 | % | | 8/2022 | | IO | | — | | | 24,000 | | | 23,977 | | | — | |
| Office/Northeast | | L + | 2.90 | % | | 2/2022 | | IO | | — | | | 24,446 | | | 24,399 | | | — | |
| Multifamily/Southeast | | L + | 3.15 | % | | 8/2022 | | IO | | — | | | 26,319 | | | 26,033 | | | — | |
| Office/Southeast | | L + | 2.95 | % | | 7/2022 | | IO | | — | | | 22,451 | | | 22,421 | | | — | |
| Hotel/Southwest | | L + | 5.13 | % | | 1/2022 | | IO | | — | | | 26,000 | | | 25,826 | | | — | |
| Multifamily/Northeast | | L + | 4.00 | % | | 5/2023 | | IO | | — | | | 24,367 | | | 24,293 | | | — | |
| Industrial/Southeast | | L + | 3.15 | % | | 11/2025 | | IO | | — | | | 25,650 | | | 25,297 | | | — | |
| Mixed-Use/Northeast | | L + | 3.87 | % | | 10/2022 | | IO | | — | | | 22,019 | | | 21,660 | | | — | |
| Multifamily/Southwest | | L + | 2.66 | % | | 8/2022 | | IO | | — | | | 23,900 | | | 23,753 | | | — | |
| Office/West | | L + | 3.30 | % | | 1/2025 | | IO | | — | | | 16,700 | | | 16,441 | | | — | |
| Hotel/Midwest | | L + | 4.07 | % | | 4/2022 | | P&I | | — | | | 24,714 | | | 23,475 | | | — | |
| Hotel/Northeast | | L + | 4.90 | % | | 9/2022 | | P&I | | — | | | 21,635 | | | 21,479 | | | — | |
| Multifamily/West | | L + | 3.18 | % | | 10/2024 | | IO | | — | | | 22,477 | | | 22,155 | | | — | |
| Other/Midwest | | L + | 3.86 | % | | 12/2024 | | IO | | — | | | 20,400 | | | 20,154 | | | — | |
| Office/Midwest | | L + | 3.00 | % | | 8/2022 | | IO | | — | | | 19,248 | | | 19,202 | | | — | |
| Multifamily/Southwest | | L + | 3.50 | % | | 6/2024 | | IO | | — | | | 15,404 | | | 15,180 | | | — | |
| Office/West | | L + | 2.95 | % | | 8/2022 | | IO | | — | | | 20,000 | | | 19,914 | | | — | |
| Office/Southeast | | L + | 4.05 | % | | 3/2022 | | IO | | — | | | 23,000 | | | 22,984 | | | — | |
| Retail/Southeast | | L + | 4.21 | % | | 7/2022 | | IO | | — | | | 17,856 | | | 17,635 | | | — | |
| Hotel/West | |
| Hotel/West | |
| Allowance for credit losses | |
| Total loans held-for-investment | |
| Total loans held-for-investment | |
| Total loans held-for-investment | |
| | | | | | | | | | | | | | | | | | | | | | | | | | | | | | | | | | | | | | | | | | | | | | | |
| Asset Type/ Location | | Interest Rate | | Maturity Date (2) | | Periodic Payment Terms (3) | | Prior Liens (4) | | Face Amount | | Carrying Amount (5) | | Principal Amount Subject to Delinquent Principal or Interest |
| Hotel/Northeast | | L + | 4.21 | % | | 10/2022 | | IO | | — | | | 22,315 | | | 22,095 | | | — | |
| Multifamily/Midwest | | L + | 4.05 | % | | 5/2022 | | IO | | — | | | 22,235 | | | 22,190 | | | — | |
| Other/Northeast | | L + | 4.50 | % | | 6/2022 | | IO | | — | | | 21,500 | | | 21,382 | | | — | |
| Office/Southwest | | L + | 3.24 | % | | 4/2022 | | IO | | — | | | 19,251 | | | 19,154 | | | — | |
| Multifamily/Southeast | | L + | 3.25 | % | | 8/2024 | | IO | | — | | | 20,176 | | | 19,911 | | | — | |
| Multifamily/Midwest | | L + | 2.93 | % | | 4/2022 | | IO | | — | | | 20,797 | | | 20,715 | | | — | |
| Mixed-Use/Southeast | | L + | 2.90 | % | | 6/2022 | | IO | | — | | | 19,920 | | | 19,847 | | | — | |
| Multifamily/Northeast | | L + | 3.24 | % | | 5/2024 | | IO | | — | | | 19,963 | | | 19,831 | | | — | |
| Multifamily/Southeast | | L + | 3.99 | % | | 6/2024 | | IO | | — | | | 16,428 | | | 16,260 | | | — | |
| Mixed-Use/Northeast | | L + | 4.77 | % | | 2/2022 | | IO | | — | | | 17,610 | | | 17,560 | | | — | |
| Office/West | | L + | 3.20 | % | | 12/2022 | | IO | | — | | | 16,604 | | | 16,557 | | | — | |
| Multifamily/Southwest | | L + | 4.29 | % | | 4/2022 | | IO | | — | | | 18,700 | | | 18,655 | | | — | |
| Multifamily/Southwest | | L + | 3.40 | % | | 2/2022 | | IO | | — | | | 18,285 | | | 18,277 | | | — | |
| Office/Northeast | | L + | 4.77 | % | | 8/2022 | | IO | | — | | | 14,490 | | | 14,393 | | | — | |
| Multifamily/Midwest | | L + | 3.35 | % | | 6/2025 | | IO | | — | | | 13,500 | | | 13,303 | | | — | |
| Office/West | | L + | 3.75 | % | | 2/2022 | | IO | | — | | | 11,528 | | | 11,484 | | | — | |
| Office/Northeast | | L + | 3.96 | % | | 7/2022 | | IO | | — | | | 11,679 | | | 11,651 | | | — | |
| Office/West | | L + | 3.65 | % | | 9/2024 | | IO | | — | | | 13,970 | | | 13,758 | | | — | |
| Multifamily/Midwest | | L + | 2.99 | % | | 9/2022 | | IO | | — | | | 11,781 | | | 11,731 | | | — | |
| Mezzanine Loans | | | | | | | | |
| Hotel/West | | | 8.00 | % | | 2/2027 | | P&I | | 40,000 | | | 14,006 | | | 12,876 | | | — | |
| Hotel/Northeast | | | 13.00 | % | | 11/2025 | | P&I | | 59,000 | | | 1,048 | | | — | | | — | |
| Total loans held-for-investment | | $ | 99,000 | | | $ | 3,796,825 | | | $ | 3,741,308 | | | $ | 168,094 | |
__________________________________________________________________________________________________________________________(1)“Senior” means a loan primarily secured by a first priority lien on commercial real property and related personal property and also includes, when applicable, any companion subordinate loans.
(2)Based on contractual maturity date as of December 31, 2021.2023. Certain commercial mortgage loans are subject to contractual extension options which may be subject to conditions as stipulated in the loan agreement. Actual maturities may differ from contractual maturities stated herein as certain borrowers may have the right to prepay with or without paying a prepayment penalty. The Company may also extend contractual maturities in connection with loan modifications.
(3)Principal and interest, or P&I; Interest-only, or IO. Certain commercial mortgage loans labeled as P&I are non-amortizing until a specific date when they begin amortizing P&I, as stated in the loan agreements.
(4)Represents third-party priority liens. Third partyThird-party portions of pari-passu participations are not considered prior liens.
(5)As of December 31, 2021,2023, the aggregate tax basis of the Company’s loans held-for-investment was $3.8$2.7 billion.
For the activity within ourthe Company’s loan portfolio during the year ended December 31, 2021,2023, see Note 3 - Loans Held-for-Investment, Net of Allowance for Credit Losses to ourthe Company’s Consolidated Financial Statements included in this Annual Report on Form 10-K.
Item 9. Changes in and Disagreements With Accountants on Accounting and Financial Disclosures
None.
Item 9A. Controls and Procedures
A review and evaluation was performed by our management, including our Chief Executive Officer, or CEO, and Chief Financial Officer, or CFO, of the effectiveness of our disclosure controls and procedures (as such term is defined in Rule 13a-15(e) and 15d-15(e) under the Exchange Act) as of the end of the period covered by this Annual Report on Form 10-K. Based on that review and evaluation, the CEO and CFO have concluded that our current disclosure controls and procedures, as designed and implemented, were effective as of the end of the period covered by this Annual Report on Form 10-K. Although our CEO and CFO have determined our disclosure controls and procedures were effective at the end of the period covered by this Annual Report on Form 10-K, a control system, no matter how well designed and operated, can provide only reasonable, not absolute, assurance that it will detect or uncover failures within the Company to disclose material information otherwise required to be set forth in the reports we submit under the Exchange Act.
There was no change in our internal control over financial reporting that occurred during the quarter ended December 31, 2021,2023, that has materially affected, or is reasonably likely to materially affect, our internal control over financial reporting.
Management’s Report On Internal Control Over Financial Reporting
Management of the Company is responsible for establishing and maintaining adequate internal control over financial reporting for the Company. Internal control over financial reporting is defined in Rules 13a-15(f) and 15d-15(f) promulgated under the Exchange Act as a process designed by, or under the supervision of, the Company’s principal executive and principal financial officers and effected by the Company’s board of directors, management and other personnel to provide reasonable assurance regarding the reliability of financial reporting and the preparation of financial statements for external purposes in accordance with GAAP and includes those policies and procedures that:
•pertain to the maintenance of records that in reasonable detail accurately and fairly reflect the transactions and dispositions of the assets of the Company;
•provide reasonable assurance that transactions are recorded as necessary to permit preparation of financial statements in accordance with GAAP, and that receipts and expenditures of the Company are being made only in accordance with authorizations of management and directors of the Company; and
•provide reasonable assurance regarding prevention or timely detection of unauthorized acquisition, use or disposition of the Company’s assets that could have a material effect on the financial statements.
Because of its inherent limitations, internal control over financial reporting may not prevent or detect misstatements. Projections of any evaluation of effectiveness to future periods are subject to the risks that controls may become inadequate because of changes in conditions or that the degree of compliance with the policies or procedures may deteriorate.
The Company’s management assessed the effectiveness of the Company’s internal control over financial reporting as of December 31, 2021.2023. In making this assessment, the Company’s management used criteria set forth by the Committee of Sponsoring Organizations of the Treadway Commission in Internal Control-Integrated Framework (2013 framework).
Based on its assessment, the Company’s management believes that, as of December 31, 2021,2023, the Company’s internal control over financial reporting was effective based on those criteria.
The Company’s independent auditors, Ernst & Young LLP, have issued an attestation report on the effectiveness of the Company’s internal control over financial reporting. This report appears on page 71102 of this Annual Report on Form 10-K.
Report of Independent Registered Public Accounting Firm
To the Stockholders and the Board of Directors
of Granite Point Mortgage Trust Inc.
Opinion on Internal Control overOver Financial Reporting
We have audited Granite Point Mortgage Trust Inc.’s internal control over financial reporting as of December 31, 2021,2023, based on criteria established in Internal Control—Integrated Framework issued by the Committee of Sponsoring Organizations of the Treadway Commission (2013 framework) (the COSO criteria). In our opinion, Granite Point Mortgage Trust Inc. (the Company) maintained, in all material respects, effective internal control over financial reporting as of December 31, 2021,2023, based on the COSO criteria.
We also have audited, in accordance with the standards of the Public Company Accounting Oversight Board (United States) (PCAOB), the consolidated balance sheets of the Company as of December 31, 20212023 and 2020,2022, the related consolidated statements of comprehensive (loss) income, (loss), stockholders' equity and cash flows for each of the three years in the period ended December 31, 2021,2023, and the related notes and financial statement schedule listed in the Index at Item 15(a) and our report dated February 25, 2022March 1, 2024 expressed an unqualified opinion thereon.
Basis for Opinion
The Company’s management is responsible for maintaining effective internal control over financial reporting and for its assessment of the effectiveness of internal control over financial reporting included in the accompanying Management’s Report On Internal Control Over Financial Reporting. Our responsibility is to express an opinion on the Company’s internal control over financial reporting based on our audit. We are a public accounting firm registered with the PCAOB and are required to be independent with respect to the Company in accordance with the U.S. federal securities laws and the applicable rules and regulations of the Securities and Exchange Commission and the PCAOB.
We conducted our audit in accordance with the standards of the PCAOB. Those standards require that we plan and perform the audit to obtain reasonable assurance about whether effective internal control over financial reporting was maintained in all material respects.
Our audit included obtaining an understanding of internal control over financial reporting, assessing the risk that a material weakness exists, testing and evaluating the design and operating effectiveness of internal control based on the assessed risk, and performing such other procedures as we considered necessary in the circumstances. We believe that our audit provides a reasonable basis for our opinion.
Definition and Limitations of Internal Control Over Financial Reporting
A company’s internal control over financial reporting is a process designed to provide reasonable assurance regarding the reliability of financial reporting and the preparation of financial statements for external purposes in accordance with generally accepted accounting principles. A company’s internal control over financial reporting includes those policies and procedures that (1) pertain to the maintenance of records that, in reasonable detail, accurately and fairly reflect the transactions and dispositions of the assets of the company; (2) provide reasonable assurance that transactions are recorded as necessary to permit preparation of financial statements in accordance with generally accepted accounting principles, and that receipts and expenditures of the company are being made only in accordance with authorizations of management and directors of the company; and (3) provide reasonable assurance regarding prevention or timely detection of unauthorized acquisition, use, or disposition of the company’s assets that could have a material effect on the financial statements.
Because of its inherent limitations, internal control over financial reporting may not prevent or detect misstatements. Also, projections of any evaluation of effectiveness to future periods are subject to the risk that controls may become inadequate because of changes in conditions, or that the degree of compliance with the policies or procedures may deteriorate.
/s/ Ernst & Young LLP
Minneapolis, Minnesota
February 25, 2022March 1, 2024
Item 9B. Other Information
None.During the three months ended December 31, 2023, two of the Company’s independent directors adopted a “Rule 10b5-1 trading arrangement,” as such term is defined in Item 408(a) of Regulation S-K. Tanuja M. Dehne adopted a Rule 10b5-1 trading arrangement on November 17, 2023, that provides for the sale of 25% of the shares to be issued when her currently outstanding RSUs vest on June 1, 2024. Stephen G. Kasnet adopted a 10b5-1 trading arrangement on November 14, 2023, that provides for the sale of 40% of the shares to be issued when his currently outstanding RSUs vest on June 1, 2024.
Item 9C. Disclosure Regarding Foreign Jurisdictions that Prevent Inspections
Not applicable.
PART III
Items 10. Directors, Executive Officers and Corporate Governance
The information required by this item is incorporated by reference to information to be set forth under the captions “PROPOSAL 1: ELECTION OF DIRECTORS,” “INFORMATION ABOUT OUR EXECUTIVE OFFICERS,” “CORPORATE GOVERNANCE AND BOARD MATTERS,” and “SECURITY OWNERSHIP AND REPORTS--Delinquent Section 16(a) Reports” (if applicable) in the Company’s definitive proxy statement to be filed with the SEC, pursuant to Regulation 14A, not later than April 30, 2022.29, 2024.
Item 11. Executive Compensation
The information required by this item is incorporated by reference to information to be set forth under the captions “COMPENSATION DISCUSSION AND ANALYSIS,” “EXECUTIVE COMPENSATION” (excluding information under the subheading “Pay Versus Performance”) and “COMPENSATION COMMITTEE REPORT” in the Company’s definitive proxy statement to be filed with the SEC, pursuant to Regulation 14A, not later than April 30, 2022.29, 2024.
Item 12. Security Ownership of Certain Beneficial Owners and Management and Related Stockholder Matters
Securities Authorized for Issuance under Equity Compensation Plans
The Company adopted the 2017 Equity Incentive Plan, or the 2017 Plan, to provide incentive compensation to attract and retain qualified directors, officers, advisors, consultants and other personnel. The 2017 Plan permitted the granting of restricted shares of common stock, phantom shares, dividend equivalent rights and other equity-based awards.
On June 2, 2022, the Company’s stockholders approved the adoption of the Granite Point 2022 Omnibus Incentive Plan, or the 2022 Plan. The 2022 Plan permits the granting of stock options, stock appreciation rights, restricted stock, RSUs, PSUs, dividend equivalent rights, other stock-based awards and other cash-based awards to employees, certain consultants of the Company and members of the board of directors. Since the adoption of the 2022 Plan, no new equity awards may be granted under the 2017 Plan, but previously-granted RSUs and PSUs remained outstanding under the 2017 Plan as of December 31, 2023.
The following table presents certain information about the 2017 Plan and 2022 Plan as of December 31, 2023:
| | | | | | | | | | | | | | | | | | | | |
| | December 31, 2023 |
| Plan Category | | Number of securities to be issued upon exercise of outstanding options, warrants and rights (1) | | Weighted-average exercise price of outstanding options, warrants and rights | | Number of securities remaining available for future issuance under equity compensation plans (excluding securities reflected in the first column of this table) (2) |
| Equity compensation plans approved by stockholders | | 1,554,218 | | | $ | — | | | 5,200,797 | |
| Equity compensation plans not approved by stockholders | | — | | | — | | | — | |
| Total | | 1,554,218 | | | $ | — | | | 5,200,797 | |
____________________
(1)The amount set forth in this column consists of shares issuable upon settlement of RSUs and PSUs granted under the 2022 Plan or the 2017 Plan. PSUs are subject to satisfaction of the applicable performance criteria over a three-year performance period; outstanding PSUs reported in this column reflect target level of performance.
(2)The amount set forth in this column reflects shares available for future issuance under the 2022 Plan. As of December 31, 2023, no further awards may be granted under the 2017 Plan, but RSU and PSU awards granted under the 2017 Plan that were outstanding as of December 31, 2023, are reflected in the first column of the table.
The information required by this item, other than the information required by Item 201(d) of Regulation S-K, is incorporated by reference to information to be set forth under the captions “PROPOSAL 3: GRANITE POINT MORTGAGE TRUST INC. 2022 EQUITY INCENTIVE PLAN” andcaption “SECURITY OWNERSHIP AND REPORTING” in the Company’s definitive proxy statementProxy Statement to be filed with the SEC, pursuant to Regulation 14A, not later than April 30, 2022.29, 2024.
Item 13. Certain Relationships and Related Transactions, and Director Independence
The information required by this item is incorporated by reference to information to be set forth under the captions “CERTAIN RELATIONSHIPS AND TRANSACTIONS” and “CORPORATE GOVERNANCE AND BOARD MATTERS—Director Independence” in the Company’s definitive proxy statement to be filed with the SEC, pursuant to Regulation 14A, not later than April 30, 2022.
Item 14. Principal AccountingAccountant Fees and Services
The information required by this item is incorporated by reference to information to be set forth under the captions “PROPOSAL 4: RATIFICATION OF APPOINTMENT OF INDEPENDENT REGISTERED PUBLIC ACCOUNTING FIRM--Audit and Non-Audit Fees” and “--Audit Services Pre-Approval Policy” in the Company’s definitive proxy statement to be filed with the SEC, pursuant to Regulation 14A, not later than April 30, 2022.29, 2024.
PART IV
Item 15. Exhibits, Financial Statement Schedules
(a) The following documents are filed as part of this Annual Report on Form 10-K:
(1)Consolidated Financial Statements:
The consolidated financial statements of the Company, together with the independent registered public accounting firm’s report thereon, are set forth in Part II, Item 8 on pages 7064 through 7770 of this Annual Report on Form 10-K and are incorporated herein by reference. (2)Schedules to Consolidated Financial Statements:
Schedule IV - Mortgage Loans on Real Estate is set forth in Part II, Item 8 on pages 10798 through 109100 of this Annual Report on Form 10-K. All other consolidated financial statement schedules not included have been omitted because they are either inapplicable or the information required is provided in the Company’s Consolidated Financial Statements and Notes thereto, included in Part II, Item 8, of this Annual Report on Form 10-K.
(3)Exhibits:
The exhibits listed on the accompanying Exhibits Index are filed or incorporated by reference as part of this Annual Report on Form 10-K.
| | | | | | | | |
| Exhibit Number | | Exhibit Index |
| 1.1 | |
| 2.1 | | |
| 3.1 | | |
| 3.2 | | |
| 3.3 | | |
| 3.4 | | |
| 3.5 | | |
| 4.1 | | |
| 4.2 | | |
| 4.3 | | |
4.4 | | |
4.5 | | |
4.64.4 | | |
4.74.5 | | Investor Rights Agreement,Indenture, dated September 25, 2020,as of February 28, 2019, by and among Granite Point MortgageGPMT 2019-FL2, Ltd., GPMT 2019-FL2 LLC, GPMT Seller LLC, Wilmington Trust, Inc., certain investment vehicles managed by Pacific Investment Management Company LLCNational Association, and the other investors party thereto from time to timeWells Fargo Bank, National Association (incorporated by reference to Exhibit 4.2 10.1 to the registrant’s Current Report on Form 8-K filed with the SEC on September 28, 2020)March 5, 2019). |
4.84.6+ | | Indenture, dated as of May 14, 2021, by and among GPMT 2021-FL3, Ltd., GPMT 2021-FL3 LLC, GPMT Seller LLC, Wilmington Trust, National Association and Wells Fargo Bank, National Association (incorporated by reference to Exhibit 10.1 to the registrant’s Current Report on Form 8-K filed with the SEC on May 18, 2021). |
| 4.7 | | Supplemental Indenture No. 1, dated as of June 27, 2023, by and among GPMT 2021-FL3, Ltd., GPMT 2021-FL3 LLC, GPMT Seller LLC, Wilmington Trust, National Association and Wells Fargo Bank, National Association (incorporated by reference to Exhibit 10.2 to the registrant’s Quarterly Report on Form 10-Q filed with the SEC on August 8, 2023). |
| 4.8+ | | Indenture, dated as of November 16, 2021, by and among GPMT 2021-FL4, Ltd., GPMT 2021-FL4 LLC, GPMT Seller LLC, Wilmington Trust, National Association and Wells Fargo Bank, National Association (incorporated by reference to Exhibit 10.1 to the registrant’s Current Report on Form 8-K filed with the SEC on November 19, 2021). |
| 4.9 | | Supplemental Indenture No. 1, dated as of June 27, 2023, by and among GPMT 2021-FL4, Ltd., GPMT 2021-FL4 LLC, GPMT Seller LLC, Wilmington Trust, National Association and Wells Fargo Bank, National Association (incorporated by reference to Exhibit 10.3 to the registrant’s Quarterly Report on Form 10-Q filed with the SEC on August 8, 2023). |
| 4.10 | | |
| 10.1* | | |
| | | | | | | | |
| Exhibit Number | | Exhibit Index |
| 10.2* | | |
| 10.3* | | |
10.3* | | |
| 10.4* | | |
| 10.5* | | |
| 10.6* | | |
| | | | | | | | |
Exhibit Number10.7* | | Exhibit Index |
10.6 | | |
10.7 | | |
| 10.8* | | |
| 10.9* | | |
| 10.10* | | |
| 10.11* | | |
| 10.12* | | |
10.910.13* | | |
10.1010.14*+ | | |
| 10.15*+ | | |
| 10.16*+ | | |
| 10.17*+ | | |
| 10.18*+ | | |
| 10.19 | | Master Repurchase and Securities Contract Agreement, dated as of February 18, 2016, First Amendment to Master Repurchase and Securities Contract Agreement, dated as of June 30, 2016, and Second Amendment to Master Repurchase and Securities Contract Agreement, dated as of February 21, 2017, each between Morgan Stanley Bank, N.A., and TH Commercial MS II, LLC (now known as GP Commercial MS LLC) (incorporated by reference to Exhibit 10.8 ofto Amendment No. 1 to the registrant’s Registration Statement on Form S-11 (File No. 333-218197) filed with the SEC on June 15, 2017). |
10.1110.20 | | |
10.1210.21 | | |
| | | | | | | | |
10.13Exhibit Number | | Exhibit Index |
| 10.22 | | |
10.1410.23 | | |
10.1510.24 | | Seventh Amendment to Master Repurchase and Securities Contract Agreement and Second Amendment to Guaranty, dated as of September 25, 2020, among Morgan Stanley Bank, N.A., as buyer, Granite Point Mortgage Trust Inc., as guarantor, GP Commercial MS LLC, as seller (incorporated by reference to Exhibit 10.2 to the registrant’s Current Report on Form 8-K filed with the SEC on September 28, 2020). |
10.1610.25 | | |
10.1710.26+ | | |
10.1810.27 | | |
| 10.28 | | |
| 10.29+ | | |
| 10.30 | | |
10.1910.31 | | |
10.2010.32 | | |
10.2110.33 | | |
| | | | | | | | |
Exhibit Number10.34 | | Exhibit Index |
10.22 | | |
10.2310.35 | | |
10.2410.36 | | Amendment No. 6 to Master Repurchase Agreement and Amendment No. 3 to Amended and Restated Guarantee Agreement, dated as of September 25, 2020, among JPMorgan Chase Bank, National Association, as buyer, and GP Commercial JPM LLC, as seller,, and acknowledged and agreed to by Granite Point MortgageMortgage Trust Inc., as guarantor (incorporated by reference to Exhibit 10.3 to the registrant’s Current Report on Form 8-K filed with the SEC on September 28, 2020). |
10.2510.37+ | | Amendment No. 7 to Master Repurchase Agreement, dated as of September 29, 2021, among JPMorgan Chase Bank, National Association, as buyer, Granite Point Mortgage Trust Inc., as guarantor, and GP Commercial JPM LLC, as seller (incorporated by reference to Exhibit 10.1 to the registrant’s Current Report on Form 8-K filed with the SEC on October 5, 2021). |
| | | | | | | | |
10.26Exhibit Number | | Exhibit Index |
| 10.38+ | | |
| 10.39+ | | |
| 10.40+ | | |
| 10.41+ | | |
| 10.42 | | |
10.2710.43 | | |
10.2810.44 | | |
10.2910.45 | | |
10.3010.46 | | |
10.3110.47 | | |
10.3210.48 | | |
10.3310.49+ | | |
10.3410.50+ | | |
10.35 | | |
10.36 | | |
| | | | | | | | |
Exhibit Number | | Exhibit Index |
10.37 | | |
10.38 | | Fourth Amendment to Master Repurchase Agreement and Second Amendment to Guaranty, dated as of September 25, 2020, among Citibank, N.A., as purchaser, Granite Point Mortgage Trust Inc., as guarantor, and GP Commercial CB LLC, as seller (incorporated by reference to Exhibit 10.510.2 to the registrant’s Current Report on Form 8-K filed with the SEC on September 28, 2020)March 20, 2023). |
10.3910.51+ | | |
| 10.52+ | | |
| | | | | | | | |
| Exhibit Number | | Exhibit Index |
| 10.53 | | |
10.4010.54 | | |
10.4110.55 | | Amendment Number Two to Amended and Restated Master Repurchase Agreement and Securities Contract, and Second Amendment to Guarantee Agreement, dated as of September 25, 2020, among Wells Fargo Bank, National Association, as buyer, Granite Point Mortgage Trust Inc., as guarantor, and GP Commercial WF LLC, as seller (incorporated by reference to Exhibit 10.6 to the registrant’s Current Report on Form 8-K filed with the SEC on September 28, 2020). |
10.4210.56 | | |
10.4310.57+ | | Amendment No.No. 4 to Amended and Restated Master Repurchase Agreement and Securities Contract, and Second Amendment to Guarantee Agreement, dated as of January 28, 2022, by and between Wells Fargo Bank, National Association, as buyer, and GP Commercial WF LLC, as seller, and acknowledged by Granite Point Mortgage Trust Inc., as guarantor (incorporated by reference to Exhibit 10.1 to the registrant’s Current Report on Form 8-K filed with the SEC on January 31, 2022). |
10.4410.58 | | |
10.4510.59 | | |
10.4610.60 | | |
| 10.61 | | |
| 10.62 | | |
10.4710.63 | | |
10.4810.64 | | |
| 10.65 | | |
| 10.66 | | |
10.4910.67 | | |
10.5010.68 | | |
| 10.69 | | |
| 10.70 | | |
| | | | | | | | |
| Exhibit Number | | Exhibit Index |
| 10.71 | | |
10.5110.72 | | |
10.5210.73 | | |
10.5310.74 | | |
| | | | | | | | |
Exhibit Number10.75 | | Exhibit Index |
10.54 | | Term Loan CreditThird Amendment to Guarantee Agreement, dated as of September 25, 2020, amongMarch 23, 2022, by and between Granite Point Mortgage Trust Inc., as a guarantor, Granite Point Operating Company LLC, as a borrower, GP Commercial Investment Corp., as a borrower, GPMT CLO REIT LLC, as a borrower, the financial institutions party thereto, as lenders, and Wilmington Trust,Wells Fargo Bank, National Association as administrative agent (incorporated by reference to Exhibit 10.110.5 to the registrant’s Current Report on Form 8-K filed with the SEC on September 28, 2020)March 24, 2022). |
10.5510.76 | | Indenture, dated as of May 9, 2018, by and among GPMT 2018-FL1, Ltd., GPMT 2018-FL1 LLC, GPMT Seller LLC, Wilmington Trust, National Association, and Wells Fargo Bank, National Association (incorporated by reference to Exhibit 10.1 of the registrant’s Current Report on Form 8-K filed with the SEC on May 16, 2018). |
10.56 | | |
10.57 | | |
10.58 | | Servicing Agreement, dated as of May 9, 2018, by and among, GPMT 2018-FL1, Ltd., Wilmington Trust, National Association, Wells Fargo Bank, National Association, GPMT Seller LLC, Trimont Real Estate Advisors, LLC and Park Bridge Lender Services LLC (incorporated by reference to Exhibit 10.4 of the registrant’s Current Report on Form 8-K filed with the SEC on May 15, 2018). |
10.59 | | Indenture, dated as of February 28, 2019, by and among GPMT 2019-FL2, Ltd., GPMT 2019-FL2 LLC, GPMT Seller LLC, Wilmington Trust, National Association, and Wells Fargo Bank, National Association (incorporated by reference to Exhibit 10.1 of the registrant’s Current Report on Form 8-K filed with the SEC on March 5, 2019). |
10.60 | | |
10.6110.77 | | |
10.6210.78 | | |
10.6310.79 | | Servicing Agreement, dated as of February 28, 2019, by and among, GPMT 2019-FL2, Ltd., Wilmington Trust, National Association, Wells Fargo Bank, National Association, GPMT Seller LLC and Trimont Real Estate Advisors, LLC (incorporated by reference to Exhibit 10.5 ofto the registrant’s Current Report on Form 8-K filed with the SEC on March 5, 2019). |
10.64*10.80+ | | |
10.65* | | |
10.66* | | |
10.67* | | |
10.68* | | |
10.69 | | Indenture and Credit Agreement, dated as of February 4, 2021, among GP Commercial GS Issuer LLC, as Issuer, Goldman Sachs Bank USA, as Class A Lender, and Wells Fargo Bank, National Association, as note administrator, paying agent, calculation agent, transfer agent, note registrar, trustee, custodian, collateral agent and loan agent (incorporated by reference to Exhibit 10.1 to the registrant’s Current Report on Form 8-K filed with the SEC on February 8, 2021). |
10.70 | | |
| | | | | | | | |
Exhibit Number | | Exhibit Index |
10.71 | | Indenture, dated as of May 14, 2021, by and among GPMT 2021-FL3, Ltd., GPMT 2021-FL3 LLC, GPMT Seller LLC, Wilmington Trust, National Association and Wells Fargo Bank, National Association (incorporated by reference to Exhibit 10.1 of the registrant’s Current Report on Form 8-K filed with the SEC on May 18, 2021). |
10.72 | | |
10.7310.81+ | | |
10.7410.82+ | | Servicing Agreement, dated as of May 14, 2021, by and among GPMT 2021-FL3, Ltd., Wilmington Trust, National Association, Wells Fargo Bank, National Association, GPMT Seller LLC, Trimont Real Estate Advisors, LLC and Park Bridge Lender Services LLC (incorporated by reference to Exhibit 10.4 ofto the registrant’s Current Report on Form 8-K filed with the SEC on May 18, 2021). |
10.7510.83+ | | Indenture, dated as of November 16, 2021, by and among GPMT 2021-FL4, Ltd., GPMT 2021-FL4 LLC, GPMT Seller LLC, Wilmington Trust, National Association and Wells Fargo Bank, National Association (incorporated by reference to Exhibit 10.1 of the registrant’s Current Report on Form 8-K filed with the SEC on November 19, 2021). |
10.76 | | |
10.7710.84+ | | |
10.7810.85+ | | |
10.7910.86+ | | Servicing Agreement, dated as of November 16, 2021, by and among GPMT 2021-FL4, Ltd., GPMT Collateral Manager LLC, Wilmington Trust, National Association, Wells Fargo Bank, National Association, GPMT Seller LLC and Trimont Real Estate Advisors, LLC (incorporated by reference to Exhibit 10.5 ofto the registrant’s Current Report on Form 8-K filed with the SEC on November 19, 2021). |
| 21.1 | | |
| 23.1 | | |
| 24.1 | | |
| 31.1 | | |
| | | | | | | | |
| Exhibit Number | | Exhibit Index |
| 31.2 | | |
| 32.1 | | |
| 32.2 | | |
| 97 | | |
| 101 | | Financial statements from the Annual Report on Form 10-K of Granite Point Mortgage Trust Inc. for the year ended December 31, 2021,2023, formatted in Inline XBRL: (i) the Consolidated Balance Sheets, (ii) the Consolidated Statements of Comprehensive (Loss) Income, (iii) the Consolidated Statements of Stockholders’ Equity, (iv) the Consolidated Statements of Cash Flows, and (v) the Notes to the Consolidated Financial Statements. (filed herewith) |
| 104 | | Cover Page Interactive Data File, formatted in Inline XBRL and contained in Exhibit 101. (filed herewith) |
| | |
| | |
____________________
* Management contract or compensatory plan, contract or arrangement
Item 16. Form 10-K Summary
None.
SIGNATURES
Pursuant to the requirements of Section 13 or 15(d) of the Securities Exchange Act of 1934, the registrant has duly caused this report to be signed on its behalf by the undersigned, thereunto duly authorized.
| | | | | | | | | | | |
| | | GRANITE POINT MORTGAGE TRUST INC. |
| Dated: | February 25, 2022March 1, 2024 | By: | /s/ John A. Taylor |
| | | John A. Taylor
President, Chief Executive Officer and Director
(Principal Executive Officer) |
POWER OF ATTORNEY
Each of the undersigned hereby appoints John A. Taylor and Marcin Urbaszek, and each of them (with full power to act alone), as attorneys and agents for the undersigned, with full power of substitution, for and in the name, place and stead of the undersigned, to sign and file with the Securities and Exchange Commission under the Securities Act of 1934, any and all amendments and exhibits to this Annual Report on Form 10-K and any and all applications, instruments and other documents to be filed with the Securities and Exchange Commission pertaining to this Annual Report on Form 10-K or any amendments thereto, with full power and authority to do and perform any and all acts and things whatsoever requisite and necessary or desirable.
Pursuant to the requirements of the Securities Exchange Act of 1934, this report has been signed below by the following persons on behalf of the registrant and is the capacities and on the dates indicated.
| | | | | | | | | | | | | | |
| Signature | | Title | | Date |
| /s/ John A. Taylor | | President, Chief Executive Officer and Director
(principal executive officer) | | February 25, 2022March 1, 2024 |
| John A. Taylor | | | |
| | | | |
| /s/ Marcin Urbaszek | | Chief Financial Officer
(principal accounting and financial officer) | | February 25, 2022March 1, 2024 |
| Marcin Urbaszek | | | |
| | | | |
| | | | |
| | | |
| | | | |
| /s/ Stephen G. Kasnet | | Chairman of the Board of Directors | | February 25, 2022March 1, 2024 |
| Stephen G. Kasnet | | | |
| | | | |
/s/ Devin Chen | | Director | | February 25, 2022 |
Devin Chen | | | | |
| | | | |
| /s/ Tanuja M. Dehne | | Director | | February 25, 2022March 1, 2024 |
| Tanuja M. Dehne | | | |
| | | | |
| /s/ Sheila K. McGrath | | Director | | March 1, 2024 |
| Sheila K. McGrath | | | | |
| | | | |
| /s/ W. Reid Sanders | | Director | | February 25, 2022March 1, 2024 |
| W. Reid Sanders | | | |
| | | | |
| /s/ Hope B. Woodhouse | | Director | | February 25, 2022March 1, 2024 |
| Hope B. Woodhouse | | | | |
| | | | |
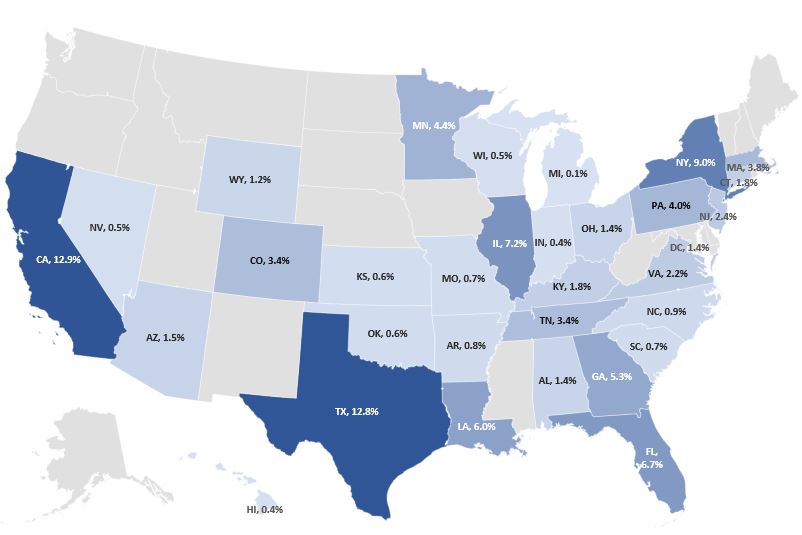

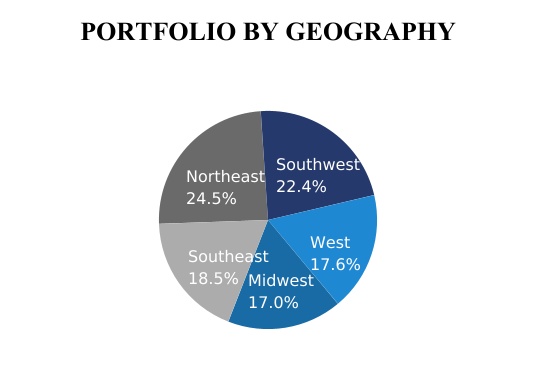
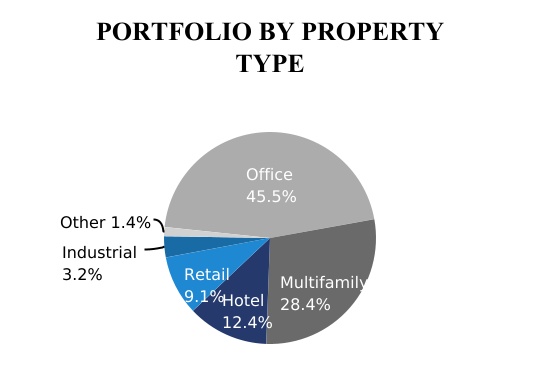


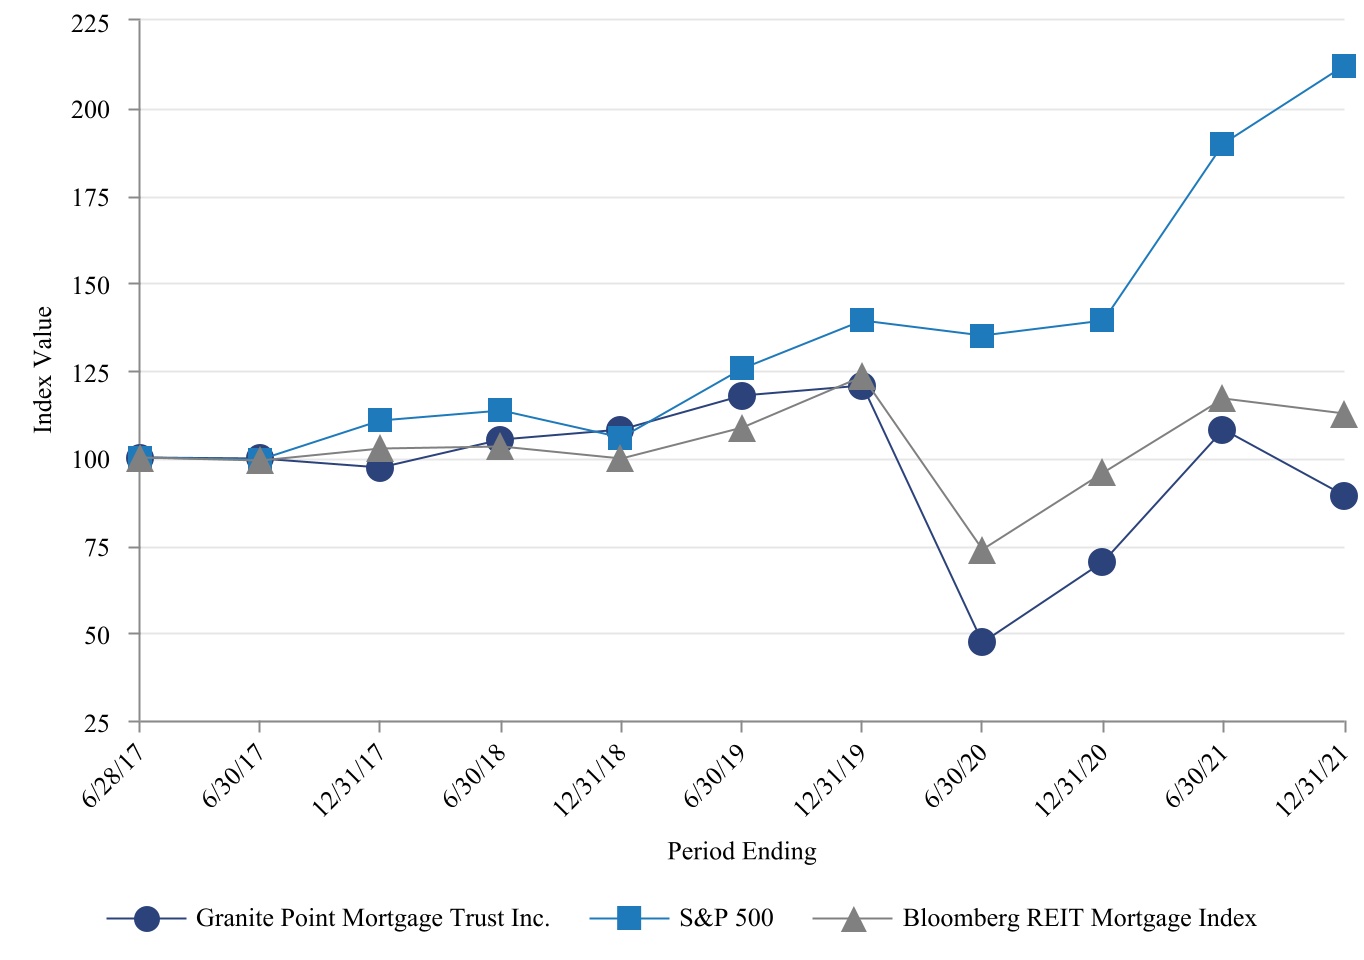
