Indicate by check mark if the registrant is a well-known seasoned issuer, as defined in Rule 405 of the Securities Act. Yes: ý ☒No: ¨☐
Indicate by check mark if the registrant is not required to file reports pursuant to Section 13 or Section 15(d) of the Exchange Act. Yes: ¨ ☐No: ý☒
Indicate by check mark whether the registrant (1) has filed all reports required to be filed by Section 13 or 15 (d) of the Securities Exchange Act of 1934 during the preceding 12 months (or for such shorter period that the registrant was required to file such reports) and (2) has been subject to such filing requirements for the past 90 days. Yes: ý ☒No: ¨☐
Indicate by check mark whether the registrant has submitted electronically, every Interactive Data File required to be submitted pursuant to Rule 405 of Regulation S-T (Section 232.405 of this chapter) during the preceding 12 months (or for such shorter period that the registrant was required to submit such files). Yes: ý ☒No: ¨☐
If an emerging growth company, indicate by check mark if the registrant has elected not to use the extended transition period for complying with any new or revised financial accounting standards provided pursuant to Section 13(a) of the Exchange Act. ¨☐
Indicate by check mark whether the registrant has filed a report on and attestation to its management’s assessment of the effectiveness of its internal control over financial reporting under Section 404(b) of the Sarbanes-Oxley Act (15 U.S.C. 7262(b)) by the registered public accounting firm that prepared or issued its audit report. ☒
Indicate by check mark whether the registrant is a shell company (as defined in Rule 12b-2 of the Exchange Act). Yes: ¨☐ No: ý☒
Prior to the separation of the registrant from Autoliv, Inc., on June 29, 2018, the registrant was a wholly-owned subsidiary of Autoliv, Inc. Consequently, there was no
The aggregate market value of the registrant'sregistrant’s voting and non-voting common stockequity held by non-affiliates of the registrant as ofon June 29, 2018, the30, 2021 (the last business day of the most recently completed second fiscal quarter.quarter) was approximately $2.58 billion.
As of February 15, 2019,March 30, 2022, there were 87,178,772112,140,210 shares of common stock of Veoneer, Inc., par value $1.00 per share, outstanding.
Documents Incorporated
DOCUMENTS INCORPORATED BY REFERENCE
None.
EXPLANATORY NOTE
Veoneer, Inc., referred to in this report as “Veoneer,” “the Company,” “we,” “us,” and “our,” is filing this Amendment No. 1 on Form 10-K/A (this “Amendment”) to its Annual Report on Form 10-K for the year ended December 31, 2021, originally filed with the Securities and Exchange Commission (the “SEC”) on February 17, 2022 (the “Original Report”), for the sole purpose of including the information required by ReferencePart III, Items 10 through 14, of Form 10-K. This information was previously omitted from the Original Report in reliance on General Instruction G(3) to Form 10-K, which permits the information in Part III to be incorporated in the Form 10-K by reference from our definitive proxy statement if such statement is filed no later than 120 days after our fiscal year end. We are filing this Amendment to provide information required in Part III of Form 10-K for the fiscal year ended December 31, 2021, because the Company does not intend to file a definitive proxy statement containing such information within 120 days of December 31, 2021.
|
| |
Document | Where Incorporated |
Proxy Statement* | Part III (Items 10, 11, 12, 13 and 14) |
*As statedIn accordance with Rule 12b-15 under variousthe Securities Exchange Act of 1934, as amended (the “Exchange Act”), Part III, Items 10 through 14 of the Original Report are hereby amended and restated in their entirety, and Part IV, Item 15 of the Original Report is hereby amended and restated only with respect to the addition of the new certifications by our principal executive officer and principal financial officer filed herewith. Except as described above or as otherwise expressly provided by the terms of this Report, only certain specified portionsAmendment, no other changes have been made to the Original Report. This Amendment does not reflect events occurring after the filing of the registrant’sOriginal Report, does not modify or update in any way the disclosures contained in the Original Report, and does not modify or update those disclosures that may be affected by subsequent events. Accordingly, this Amendment should be read in conjunction with the Original Report and with our filings with the SEC subsequent to the Original Report.
On October 4, 2021, Veoneer entered into a definitive Proxy Statementagreement with SSW HoldCo LP (“SSW”), a Delaware limited partnership, SSW Merger Sub Corp, a Delaware corporation and a direct, wholly owned subsidiary of SSW (“Merger Sub”), and QUALCOMM Incorporated (“Qualcomm”) providing for the annual stockholders’ meetingmerger of Merger Sub with and into the Company, with the Company continuing as a wholly owned subsidiary of SSW (the “Merger”).
Shortly after the closing of the Merger, it is contemplated that SSW will sell Veoneer's dedicated software unit, referred to as the Arriver business, to Qualcomm and retain Veoneer’s Tier-1 supplier businesses.
Pursuant to the Merger Agreement, at the effective time of the Merger (the “Effective Time”):
| • | each share of common stock, par value $1.00 per share, of the Company (the “Common Stock”) issued and outstanding immediately prior to the Effective Time (other than any shares cancelled pursuant to the Merger Agreement) will be converted into the right to receive $37.00 per share of Common Stock in cash, without interest and subject to any tax withholding required by applicable law (the “Merger Consideration”); |
| • | each Company stock option (whether or not vested) that is outstanding immediately prior to the Effective Time will automatically vest (if unvested) and be cancelled and converted into the right to receive an amount in cash, without interest and subject to any tax withholding required by applicable law, equal to the product of (i) the excess, if any, of (A) the Merger Consideration over (B) the per-share exercise price for such Company stock option and (ii) the total number of shares of Common Stock underlying such Company stock option, provided, that if the exercise price per share of Common Stock of such Company stock option is equal to or greater than the Merger Consideration, such Company stock option shall be cancelled without any cash payment or other consideration being made in respect thereof; |
| • | each Company time-based restricted stock unit that is outstanding immediately prior to the Effective Time will automatically vest (if unvested) and be cancelled and converted into the right to receive an amount in cash, without interest and subject to any tax withholding required by applicable law, equal to the product of (i) the total number of shares of Common Stock underlying such Company time-based restricted stock unit (including any shares of Common Stock in respect of dividend equivalent units credited thereon) and (ii) the Merger Consideration; and |
| • | each Company performance-based restricted stock unit that is outstanding immediately prior to the Effective Time will automatically vest (if unvested) and be cancelled and converted into the right to receive an amount in cash, without interest and subject to any tax withholding required by applicable law, equal to the product of (i) the number of shares of Company Common Stock underlying such Company PSU (including any shares of Common Stock in respect of dividend equivalent units credited thereon) determined based on the attainment of the applicable performance metrics at (x) the actual level of performance for any performance periods that have concluded prior to the date of the Merger Agreement, and (y) the greater of the target level of performance or actual level of performance measured through the date on which the Closing of the Merger occurs (as determined by the Board), for any performance periods that would otherwise conclude following the date of the Merger Agreement, in each case, and (ii) the Merger Consideration. |
In connection with the Merger, the Company’s securities will be held on May 8, 2019, to be dated on or around March 28, 2019 (the “2019 Proxy Statement”) are incorporated by reference in this Report.de-listed from the New York Stock Exchange and de-registered under the Exchange Act as soon as practicable following the Effective Time.
TABLE OF CONTENTS
VEONEER, INC.
FORM 10-K/A
For the Year Ended December 31, 2021
PART III
|
| | |
| | |
| PART I | |
Item 1. | | |
Item 1A. | | |
Item 1B. | | |
Item 2. | | |
Item 3. | | |
Item 4. | | |
| PART II | |
Item 5. | | |
Item 6. | | |
Item 7. | | |
Item 7A. | | |
Item 8. | | |
Item 9. | | |
Item 9A. | | |
Item 9B. | | |
| PART III | |
| Item 10. | | 4 |
| Item 11. | | 11 |
| Item 12. | | 34 |
| Item 13. | | 35 |
| Item 14. | | 36 |
| | | |
| PART IV | | |
| Item 15. | | 37 |
| Signatures | |
Part III
Item 16.10. | | Directors, Executive Officers and Corporate Governance |
FORWARD-LOOKING STATEMENTS
This Annual Report on Form 10-K contains forward-looking statements withinThe Company’s bylaws (the “Bylaws”) provide that the meaningsize of the Private Securities Litigation Reform Act of 1995. All statements contained in this Annual Report on Form 10-K other than statements of historical fact, including without limitation, statements regarding management’s examination of historical operating trends and data, estimates of future sales (including estimates related to order intake), operating margin, cash flow, taxes or other future operating performance or financial results, are forward-looking statements. In some cases, you can identify these statements by forward-looking words such as “estimates,” “expects,” “anticipates,” “projects,” “plans,” “intends,” “believes,” “may,” “likely,” “might,” “would,” “should,” “could,” or the negative of these terms and other comparable terminology, although not all forward-looking statements contain such words. We have based these forward-looking statements on our current expectations and assumptions and/or data available from third parties about future events and trends that we believe may affect our financial condition, results of operations, business strategy, short-term and long-term business operations and objectives and financial needs.
New risks and uncertainties ariseBoard shall be fixed from time to time exclusively by the Board. The Board has currently fixed the size of the Board at seven. The Board currently consists of seven members divided into three classes.
The directors designated in the first class have terms expiring in 2022 (Class I); the directors designated in the second class have terms expiring in 2023 (Class II); and itthe directors designated in the third class have terms expiring in 2024 (Class III). Each director will be elected at such meetings to serve a term of three years, with each director’s term to expire at the annual meeting held three years after the director’s election.
Below are biographical summaries current as of the date of this Form 10-K/A for each of our directors.
Class I Directors
Mark Durcan
Director Since: June 29, 2018
Current Other Public Directorships: Advanced Micro Devices, Inc., AmerisourceBergen Corporation, and ASML Holding NV
Age: 60 | | Mr. Durcan served as Chief Executive Officer of Micron Technology, Inc., a memory and storage solutions company, from February 2012 until May 2017. Mr. Durcan joined Micron Technology in 1984 and held a variety of senior leadership positions at the company, including President and Chief Operating Officer from June 2007 to February 2012, Chief Operating Officer from February 2006 to 2007 and Chief Technical Officer from 1998 to February 2006. Mr. Durcan has been a member of the board of directors of Advanced Micro Devices, Inc. since October 2017, a director of St. Luke’s Health System of Idaho since February 2017, a director of AmerisourceBergen Corporation since September 2015, and a member of the Supervisory Board of ASML Holding NV, a manufacturer of chip-making equipment, since April 2020. Mr. Durcan also served on the board of the Semiconductor Industry Association from 2011 to 2017. Mr. Durcan holds a Bachelor of Science and Master of Chemical Engineering degree from Rice University and is currently a member of its Board of Trustees.
Qualifications: Mr. Durcan is a seasoned business executive who brings demonstrated skill in the areas of strategic planning, semiconductor technology, finance and corporate governance to the Board.
|
Jonas Synnergren
Director Since: June 29, 2018
Current Other Public Directorships: Nordea
Age: 44 | | Mr. Synnergren has been a partner at Cevian Capital AB, investment advisor to the international investment firm, Cevian Capital since 2009 and was promoted to Senior Partner in 2020. Mr. Synnergren joined Cevian in 2007 and has been head of Cevian’s Swedish office since 2012. In 2006 Mr. Synnergren was Interim CEO and Head of Investor Relations and Business Development of Svalan Konsortier AB, a Swedish Real Estate fund based in Stockholm. From 2000 to 2006, Mr. Synnergren worked for the Boston Consulting Group, ultimately as a Project Leader, where he led projects related to strategy, organization and operational efficiency, including IT-related assignments. During his time with the Boston Consulting Group, Mr. Synnergren’s main focus was financial services. Mr. Synnergren served on the board of directors of Tieto Corporation, a Finnish IT software and services company, from 2012 through early 2019. Mr. Synnergren has served on the board of directors of Nordea, a Nordic bank headquartered in Finland, since May 28, 2020. Mr. Synnergren has also served on the Nomination Committee of Ericsson, a Swedish telecom equipment company, since 2019. Mr. Synnergren served on the Nomination Board of Metso, a Finnish industry machinery company, from 2014 to 2016. Mr. Synnergren has a Master of Science in Economics and Business from the Stockholm School of Economics, including studying at HEC Paris.
Qualifications: The Board benefits from Mr. Synnergren’s deep knowledge of capital markets, mergers and acquisitions and investment expertise. |
Mr. Synnergren was initially appointed as a director of the Company pursuant to the terms of a Cooperation Agreement between the Company and Cevian Capital II GP Limited (“Cevian”), and its affiliates (the “Cooperation Agreement”), as described below under “Relationships and Related Party Transactions – Stockholder Agreements- Cooperation Agreement with Cevian Capital II GP Limited”. As of the date of this Report, Cevian owns at least 8% of the outstanding common stock of the Company. Pursuant to the terms of the Cooperation Agreement, Mr. Synnergren has agreed to offer his resignation from the Board if Cevian no longer owns at least 8% of the then-outstanding shares of common stock of Veoneer.
Class II Directors
Kazuhiko Sakamoto
Director Since: June 29, 2018
Age: 76 | | Mr. Sakamoto has served as an outside auditor of Zenitaka Corporation, a mid-sized construction company listed on the Tokyo Stock Exchange, since 2016. Mr. Sakamoto previously served in a number of senior executive roles at Marubeni Corporation, one of Japan’s leading general trading houses, and Marubeni Construction Material Lease Co. Ltd., a company affiliated with Marubeni Corporation, over the course of 40 years. Mr. Sakamoto served as a director of Autoliv, Inc. from 2007 until the Spin-off (as defined below). He has a degree from Keio University, and attended the Harvard University Research Institute for International Affairs. Qualifications: Mr. Sakamoto brings to the Board a unique set of skills and insights gained through his extensive business experience in both Asia and North America.
|
Wolfgang Ziebart
Director Since: June 29, 2018
Current Other Public Directorships: Nordex SE
Age: 72 | | Dr. Ziebart had a distinguished career with BMW beginning in 1977, which took him to the Board of Management, where he was responsible for R&D and Purchasing. From 2000 to 2004, he was Member of the Board of Management of automotive supplier Continental, where he was in charge of the electronics and the brake business. Between 2004 and 2008, he was President and CEO of Infineon Technologies AG, a global semiconductor and system solutions provider listed on the Frankfurt Stock Exchange. Dr. Ziebart was also previously employed by Jaguar Land Rover, where he served in a consulting role related to product development. Dr. Ziebart serves on the Supervisory Board of Webasto SE, an automotive supplier, mainly for body systems, and is the Chairman of the Supervisory Board of Nordex SE, a wind turbine manufacturer. Dr. Ziebart served as a director of Autoliv, Inc. from 2008 to 2013, and from December 2015 until the Spin-off. Dr. Ziebart holds a doctorate degree in mechanical engineering from the Technical University of Munich in Germany. Qualifications: Dr. Ziebart brings to the Board his extensive knowledge of the automotive industry, gained through his years of experience, including, in particular, with engineering and development.
|
Class III Directors
Robert W. Alspaugh
Director Since: June 29, 2018
Current Other Public Directorships: Triton International Ltd.
Age: 75 | | Mr. Alspaugh had a 36-year career with KPMG, serving in a number of roles, including as the senior partner for a diverse array of companies across a broad range of industries. He has worked with global companies in Europe and Japan in addition to those headquartered in the U.S. Mr. Alspaugh also serves on the board of directors of Triton International Ltd., which is a public company, and DSGI Technologies, Inc., a private company. Mr. Alspaugh served on the board of Autoliv, Inc. from 2006 until the Spin-off. Mr. Alspaugh has a BBA degree, summa cum laude, in Accounting from Baylor University. Qualifications: Mr. Alspaugh brings his technical skills and knowledge gained through his extensive global business experience to the Board. |
Jan Carlson
Director Since: April 1, 2018
Current Other Public Directorships: Autoliv, Inc. and Telefonaktiebolaget LM Ericsson
Age: 61 | | Mr. Carlson has been the Chairman of the Board of Veoneer since the Spin-off, and President and Chief Executive Officer of Veoneer since April 1, 2018. Before the Spin-off, Mr. Carlson served as the President and Chief Executive Officer of Autoliv since April 1, 2007. Mr. Carlson joined Autoliv in 1999 as President of Autoliv Electronics, and later served as Vice President, Engineering and a member of Autoliv’s Executive Committee. Mr. Carlson was appointed Chairman of the board of directors of Autoliv in May 2014 and continues to serve in that role. Mr. Carlson has served on the board of directors of Telefonaktiebolaget LM Ericsson since February 2017. Mr. Carlson has been nominated for election to the board of directors of AB Volvo, a commercial transport solutions company, at its Annual General Meeting scheduled to be held on April 6, 2022. Mr. Carlson has a Master of Science degree in Physics and Electrical Engineering from the University of Linköping in Sweden and was appointed Technology Honorary Doctorate by the University in May 2018. Qualifications: Mr. Carlson brings his extensive knowledge of Veoneer’s operations, business and industry to the Board and Mr. Carlson’s role as Chief Executive Officer of Veoneer provides the Board with insight into the day-to-day operations of the Company. |
James M. Ringler
Director Since: April 1, 2018
Current Other Public Directorships: Autoliv, Inc., TechnipFMC plc, JBT Corporation, and Teradata Corporation
Age: 76 | | Mr. Ringler served as Vice Chairman of Illinois Tool Works Inc. between 1999 and 2004. Prior to joining Illinois Tool Works, Mr. Ringler served in a number of executive positions at Premark International, Inc., including as Chairman, President, and Chief Executive Officer until the company merged with Illinois Tool Works in 1999. Mr. Ringler served as a director of Autoliv, Inc. from 2002 until 2021, and also serves on the board of directors of TechnipFMC plc and JBT Corporation. Mr. Ringler also previously served on the board of directors of Teradata Corporation until 2021. Mr. Ringler holds a Bachelor of Science degree in Business Administration and an MBA degree in Finance from the State University of New York. Qualifications: Mr. Ringler brings to the Board his business and management experience in multiple executive positions at Premark International, Inc. and Illinois Tool Works and his deep knowledge of manufacturing, technology and corporate governance gained through his extensive service on the boards of directors of public companies in a wide variety of industries. |
Executive Officers of the Company
Set forth below is information regarding our current executive officers of the Company as defined in Rule 3b-7 under the Securities Exchange Act of 1934, as amended, who are not also directors:
Ray Pekar
Executive Officer Since: March 1, 2021
Title: CFO and Executive Vice President, Finance Age: 59
| | Mr. Pekar has served as the Chief Financial Officer and Executive Vice President, Finance of the Company since March 2021. Mr. Pekar joined the Company in April 2018 as Vice President, Investor Relations, in connection with the spin-off of the Company by Autoliv, Inc. Prior to that, Mr. Pekar served in various roles of increasing responsibility at Autoliv, Inc. beginning in 1996, including Vice President, IR and M&A from January 2005 until April 2018 and VP Finance and Tech Center General Manager for North America from June 1998 until January 2005. Mr. Pekar holds a Bachelor of Commerce Degree from the University of Windsor with a concentration in finance and accounting. He is also a CPA, CMA receiving his accreditation in Ontario, Canada.
|
Matthias Bieler
Executive Officer Since: February 1, 2020
Title: Executive Vice President, Business Unit
Europe
Age: 55
| | Mr. Bieler has served as Executive Vice President, Business Area Vision & DMS since April 1, 2021. Prior to that he served as Executive Vice President, Business Unit Europe of the Company (beginning in February 2020) and as Vice President and Managing Director for VW, PAS and JLR (beginning in November 2019). Prior to joining the Company, Mr. Bieler was self-employed for several years after holding multiple senior management positions within program management, business development and sales in Europe and China for TRW Automotive, and then, following its acquisition of TRW Automotive, as a Senior Vice President for ZF Friedrichshafen from 2015-2017. Mr. Bieler holds an engineering degree in electrical engineering from University of Paderborn and an Executive MBA from Henley Management College. |
Robert Bisciotti
Executive Officer Since: August 1, 2020
Title: Executive Vice President, Business Unit North America
Age: 59 | | Mr. Bisciotti has served as Executive Vice President, Business Unit North America since August 1, 2020. Mr. Bisciotti previously served as the Company’s Vice President and Managing Director-Ford Business Unit since July 2018. Prior to joining the Company, Mr. Bisciotti was the VP-Autoliv Electronics Europe and America, VP-ANBS Operations & Sales, VP-Autoliv NA Sales at Autoliv, Inc. Mr. Bisciotti holds a Bachelor’s degree in Electrical Engineering and an MBA from Villanova University.
|
Steven Jenkins
Executive Officer Since: May 1, 2021
Title: Chief Technology Officer
Age: 43 | | Mr. Jenkins has served as Chief Technology Officer since April 2021. Prior to that, he served as Director of Technical Competence since December 2018 and as Department Manager of Software Engineering from June 2016 until December 2018. Prior to joining the Company, Mr. Jenkins served as Department Manager – Software Engineering for Autoliv, Inc. from October 2017 until April 2018 and as a Manager – Systems Design for Autoliv, Inc. from June 2016 until September 2017. Prior to his career at Autoliv, Mr. Jenkins served as a Software Engineering Manager at Arris, Inc. from May 2013 until May 2016. Mr. Jenkins holds a Bachelor’s degree in Computer Science from University of Bradford. |
Thomas Jönsson
Executive Officer Since: April 1, 2018
Title: Executive Vice President, Communications and Investor Relations
Age: 56 | | Mr. Jönsson has served as Executive Vice President, Communications and Investor Relations of the Company since April 1, 2018. Prior to joining the Company, Mr. Jönsson served as Vice President, Corporate Communications of Autoliv since May 2013. Prior to joining Autoliv in January 2013, Mr. Jönsson served from June 2010 to December 2012 as Vice President of Brand and External Communications for TeliaSonera, a leading Nordic and Baltic telecommunications company. Before joining TeliaSonera, Mr. Jönsson had an international career working for Nokia and Intel Corporation. Mr. Jönsson studied Business Administration at the University of Stockholm.
|
| | |
Mikael Landberg
Executive Officer Since: March 1, 2020
Title: Executive Vice President, Human Resources
Age: 53 | | Mr. Landberg has served as Executive Vice President, Human Resources of the Company since March 1, 2020. Immediately prior to joining the Company, he served as the Chief Human Resources Officer of Sweco AB since January 2018. Prior to that, Mr. Landberg worked for DeLaval for almost ten years, where he served in progressively senior positions and was appointed Senior Vice President of Human Resources in 2012. Mr. Landberg holds a Bachelor´s degree in Human Resources, Industrial Relations and Labour Relations from Uppsala University, and an Executive MBA from the Stockholm School of Economics. |
| | |
Christer Lundström
Executive Officer Since: May 6, 2020
Title: Executive Vice President, Quality
Age: 57 | | Mr. Lundström has served as Executive Vice President, Operations & Quality of the Company since May 1, 2021. From May 6, 2021 until May 1, 2021. Mr. Lundström served as Executive Vice President, Quality (beginning May 6, 2021), and Senior Vice President, Quality (beginning March 19, 2020) of the Company. Prior to coming to work for the Company, Mr. Lundström was employed by Volvo Car Corporation, based in Gothenburg, Sweden, from May 1989 until March 18, 2020. From 2011 until 2016, Mr. Lundström had the position Vice President, Manufacturing Quality and from 2016 until the end of his employment on March 18, 2020, Vice President, Marketing, Sales, and Service Quality. Mr. Lundström has a Master of Science degree in Computer Science and Computer Engineering. |
| | |
Christoph Schmickler
Executive Officer Since: May 10, 2021 Title: Executive Vice President, ADAS ECU & Integration Product Area
Age: 54
| | Mr. Schmickler has served as the Company’s Executive Vice President, ADAS ECU & Integration beginning in May 10, 2021, and as Senior Vice President and Managing Director, Business Unit, Europe of the Company beginning in 2020. Prior to joining the Company, Mr. Schmickler served as Vice President, Sales and Business Development at Zenuity GmbH (2017-2020), and Director, Business Development, Europe Active Safety (2012-2016) for Autoliv Electronics. |
| | |
Lars Sjöbring
Executive Officer Since: April 1, 2018
Title: Executive Vice President, Legal Affairs, General Counsel and Secretary
Age: 54 | | Mr. Sjöbring has served as Executive Vice President, Legal Affairs, General Counsel and Secretary of the Company since April 1, 2018. Prior to that, Mr. Sjöbring served as Group Vice President, Legal Affairs, General Counsel and Secretary of Autoliv since November 2015. Mr. Sjöbring served as Senior Vice President and General Counsel of Transocean Ltd., a leading international provider of offshore contract drilling services, from March 2014 through November 2015. Prior to his time with Transocean, Mr. Sjöbring served as Autoliv’s Vice President, Legal Affairs, General Counsel and Secretary from September 2007 until February 2014. Over the course of his career, Mr. Sjöbring has also held various positions at Telia AB, Skadden Arps, Slate, Meagher and Flom LLP and Nokia Corporation. Mr. Sjöbring holds Master of Law degrees from the University of Lund in Sweden and Amsterdam School of International Relations (ASIR) in the Netherlands and a Master of Corporate Law degree from Fordham University School of Law in New York.
|
| | |
Chris Van Dan Elzen
Executive Officer Since: May 1, 2021
Title: Executive Vice President, Radar
Age: 50 | | Mr. Van Dan Elzen has served as Executive Vice President, Radar at Veoneer since May 2021. Mr. Van Dan Elzen previously held the positions of Vice President and Managing Director from July 2019 until May 2021, and Vice President, Product Planning from April 2018 until July 2019 at the Company. Prior to joining Veoneer, Mr. Van Dan Elzen held the positions of Vice President Product Planning from December 2016 until April 2018 and Senior Director Business Development from October 2016 until December 2016 at Autoliv, Inc. Mr. Van Dan Elzen has a Master of Science in Engineering from Oakland University, Rochester, Michigan, and three Bachelor of Science degrees in engineering from Oakland University, Rochester, Michigan, as well as Master of Business Administration from University of Michigan, Ann Arbor, Michigan. |
Corporate Governance Guidelines and Code of Conduct and Ethics
The Board has adopted Corporate Governance Guidelines to guide the Board in the exercise of its responsibilities and a Code of Conduct and Ethics for Directors to assist the individual directors in fulfilling their duties as members of the Board. The Company also has Standards of Business Conduct and Ethics that apply to all employees of the Company and a Code of Conduct and Ethics for Senior Officers (the Code of Conduct and Ethics for Directors, Code of Conduct and Ethics for Senior Officers, and Standards of Business Conduct and Ethics are collectively referred to herein as the “Codes”).
The Company has also adopted a written policy regarding related person transactions (the “Related Person Transactions Policy”). The Company’s Corporate Governance Guidelines, the Codes and the Related Person Transactions Policy, and any amendments or waivers related thereto, are posted on the Company’s website at www.Veoneer.com – Who we are – Governance, and can also be obtained from the Company in print by request using the contact information below.
Board Committees
Committees of the Board
There are three standing committees of the Board: the Audit Committee, the Compensation Committee and the Nominating and Corporate Governance Committee. The Board has determined that all members of the Audit, the Compensation, and the Nominating and Corporate Governance Committees qualify as independent directors under the applicable rules of the NYSE, the Sarbanes-Oxley Act of 2002, as amended, and the rules and regulations promulgated by the SEC. While no formal policy exists regarding the attendance of the CEO and the Chairman at committee meetings, the practice of the Board is to invite the CEO and the Chairman to attend each committee meeting and excuse them when matters relating to them are discussed. The Lead Independent Director is also invited to attend all committee meetings. The following table shows the composition of the committees of the Board:
| Audit Committee | Compensation Committee | Nominating and Corporate Governance Committee |
| Robert W. Alspaugh (Chair) | James M. Ringler (Chair) | Wolfgang Ziebart (Chair) |
| Jonas Synnergren | Mark Durcan | James M. Ringler |
| Wolfgang Ziebart | Kazuhiko Sakamoto | Jonas Synnergren |
The Audit Committee
The Audit Committee appoints, subject to stockholder ratification, the Company’s independent auditors and is responsible for the compensation, retention and oversight of the work of the independent auditors and for any special assignments given to such auditors. The Audit Committee reviews the independence of the independent auditors and considers whether there should be a regular rotation of the independent auditors. In addition, the Audit Committee evaluates the lead audit partner’s qualifications and performance. The Audit Committee also evaluates the selection of the lead audit partner, including his or her qualifications and performance. The Audit Committee also (i) reviews the annual audit and its scope, including the results of the independent auditors’ audit and management’s responses thereto; (ii) reviews the performance of the independent auditors, including the lead partner; (iii) approves any non-audit services provided to the Company by its independent auditors; (iv) reviews possible violations of the Company’s business ethics and conflicts of interest policies; (v) reviews any major accounting changes made or contemplated; (vi) reviews the effectiveness and efficiency of the Company’s internal audit staff; and (vii) monitors legal, regulatory and financial risk, including those related to ethics practices and information technology (including cybersecurity), as well as discusses risk oversight and management as part of its obligations under the NYSE’s listing standards. In addition, the Audit Committee confirms that no restrictions have been imposed by Company personnel on the scope of the independent auditors’ examinations. The Audit Committee is also responsible for our managementthe review and approval of related person transactions. Members of this committee are Mr. Alspaugh (Chairman), Mr. Synnergren and Dr. Ziebart. The Audit Committee met eight times in 2021.
The Compensation Committee
The Compensation Committee advises the Board with respect to predict all risks, nor can we assess the impact of all factors on our business or the extent to which any factor, or combination of factors, may cause actual results to differ materially from those contained in any forward-looking statements we may make. Factors that could cause actual results to differ materially from these forward-looking statements include, without limitation, the following: the cyclical nature of automotive sales and production; changes in general industry and market conditions or regional growth or decline; our ability to achieve the intended benefits from our separation from our former parent; our abilitycompensation to be awarded new business or loss of business from increased competition; higher than anticipated costs and use of resources related to developing new technologies; higher raw material, energy and commodity costs; component shortages; changes in customer and consumer preferences for end products; market acceptance of our new products; dependence on and relationships with customers and suppliers; unfavorable fluctuations in currencies or interest rates among the various jurisdictions in which we operate; costs or difficulties relatedpaid to the integrationdirectors and executive officers of any new or acquired businessesthe Company and technologies; successful integrationis responsible for approving the terms of acquisitionscontracts to be entered into with the senior executives of the Company. The committee also administers the Company’s cash and operations of joint ventures; successful implementation of strategic partnershipsstock incentive plans and collaborations; product liability, warrantyreviews and recall claims and investigations and other litigation and customer reactions thereto; higher expenses for our pension and other post-retirement benefits, including higher funding needs for our pension plans; work stoppages or other labor issues; possible adverse results of future litigation, regulatory actions or investigations or infringement claims; our ability to protect our intellectual property rights; tax assessments by governmental authorities and changes in our tax rate; dependence on key personnel; legislative or regulatory changes impacting or limiting our business; political conditions; and other risks and uncertainties identified in Item 1A -“Risk Factors” and Item 7 - “Management’sdiscusses with management the Company’s Compensation Discussion and Analysis of Financial Condition and Results of Operations”(“CD&A”) included in this Form 10-K.Proxy Statement. The committee also oversees the Company’s human capital management, including executive succession planning, leadership development, diversity and inclusion, and pay equality. Members of this committee are Mr. Ringler (Chairman), Mr. Durcan and Mr. Sakamoto. The Compensation Committee met seven times in 2021.
For any forward-looking statements contained in this Annual Report on Form 10-K or any other document, we claim the protection
The Nominating and Corporate Governance Committee
The Nominating and Corporate Governance Committee identifies and recommends individuals qualified to serve as members of the safe harborBoard and assists the Board by reviewing the composition of the Board and its committees, monitoring a process to assess Board effectiveness, and developing and implementing the Company’s Corporate Governance Guidelines. The committee also oversees the Company’s sustainability, corporate social responsibility and corporate citizenship policies and practices and reviews the Company’s disclosure containing significant information relating to matters within the committee’s mandate. The Nominating and Corporate Governance Committee will consider stockholder nominees for forward-looking statements contained inelection to the Private Securities Litigation Reform ActBoard if timely advance written notice of 1995, and we assume no obligation to revise or publicly releasesuch nominees is received by the resultsSecretary of any revision to these forward-looking statements, except as required by law. Given these risks and uncertainties, readers are cautioned not to place undue reliance on such forward-looking statements.
Part I
Item 1. Business
General
Veoneer, Inc. (“Veoneer”, the “Company” or “we”) is a Delaware corporation withCompany at its principal executive officersoffices in Stockholm, Sweden. accordance with the Bylaws, a copy of which may be obtained by written request to the Company’s Secretary or on the Company’s website at www.Veoneer.com – Who we are – Governance. Members of this committee are Dr. Ziebart (Chairman) and Messrs. Ringler and Synnergren. The Nominating and Corporate Governance Committee met five times in 2021.
Corporate Governance
The Spin-off
On June 29, 2018 we(the “Spin-off Effective Date”), Veoneer, Inc. became an independent, publicly traded company as a result of the separation of the Electronics segment from Autoliv, Inc. (“Autoliv”). Veoneer was incorporated under the laws of Delaware in 2017 for the purpose of holding this business. The separation was completed in the form of a pro rata distribution on the Spin-off Effective Date (the “Spin-off”) of 100% of the outstanding shares of Common Stock of Veoneer to the stockholders of Autoliv (the “Spin-Off”). The Company functions as a holding corporation and owns two principal subsidiaries, Veoneer AB and Veoneer US, Inc.
Shares of Veoneer common stock are traded on the New York Stock Exchange under the symbol “VNE”. Swedish Depository Receipts representing shares of Veoneer common stock (“SDRs”) trade on NASDAQ Stockholm under the symbol “VNE SDB”. Our fiscal year ends on December 31.
Business
Veoneer is a global leader in the design, development, manufacture and sale of automotive safety electronics. Our ambition is to be a leading system supplier for advanced driver assistance systems ("ADAS"), Collaborative Driving, highly automated driving ("HAD") solutions, and autonomous drive ("AD") as well as a market leader in automotive safety electronics products.
Based on our purpose of "Creating Trust in Mobility", our safety systems are designed to make driving safer and easier, more comfortable and convenient, and to intervene before a collision. Our systems currently include restraint control electronics and crash sensors for deployment of airbags and seatbelt pretensioners, active safety sensors, controllers and software for both ADAS and AD solutions and brake control systems.
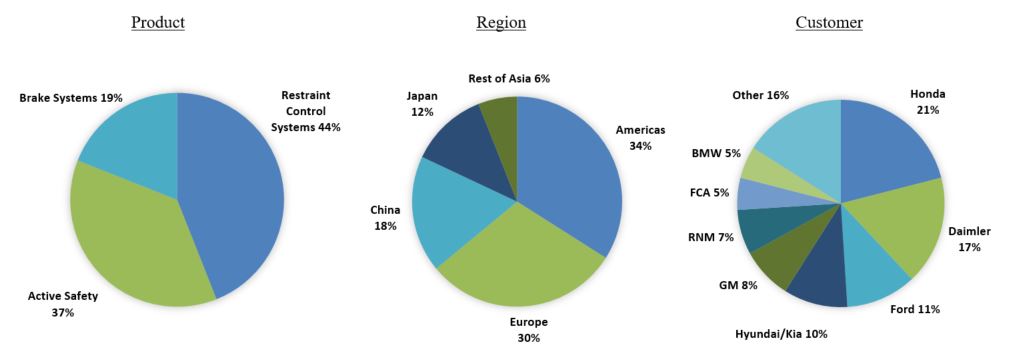
Including joint venture operations, Veoneer has 10 manufacturing sites and operates in 13 countries and its customers include the world’s largest car manufacturers. Veoneer’s sales in 2018 were $2.2 billion, approximately 37% of which consisted of active safety products, approximately 44% of which consisted of restraint control systems and approximately 19% of which consisted of brake systems products. Our business is conducted primarily in Europe, the Americas and Asia.
Veoneer’s head office is located in Stockholm, Sweden. As of December 31, 2018, Veoneer had approximately 7,300 employees worldwide and a total headcount of approximately 8,600, including temporary personnel.
Additional information required by this Item 1 regarding developments in the Company’s business during 2018 is contained under Item 7 in this Annual Report.
Financial Information on Segments
Veoneer reports its financial results in two segments: Electronics and Brake Systems. Our Electronics reporting segment consists of our active safety and restraint control systems product areas. Our Brake Systems reporting segment consists of our brake systems product area, which are those products developed by Veoneer-Nissin Brake Systems (VNBS), our joint venture with Nissin Kogyo the 49% owner in VNBS (a 51% owned subsidiary).
Business Strategy
We believe the Company is well-positioned for growth from increasing long-term global vehicle production volumes, increased demand for safety and collaborative and autonomous driving products, and new business wins with existing and new customers. We are focused on accelerating the commercialization of active safety and collaborative and autonomous driving by providing the software, sensors and computers required to do so.
Products and Technology
Electronics Segment
We provide advanced active safety sensors, used for ADAS, HAD and AD solutions, such as vision and radar systems, ADAS Electronic Control Units (“ECUs”), night vision and positioning systems. Through Zenuity, our 50% owned joint venture with Volvo Car Corporation ("Volvo Cars"), we develop an advanced software stack for sensor fusion and decision control for ADAS, HAD and AD solutions. In addition, we offer driver monitoring systems, LiDAR sensors and other technologies critical for AD solutions by leveraging our partnership network and internally developed intellectual property.
We also provide restraint control systems such as ECUs and crash sensors for deployment of airbags and seatbelt pretensioners in the event of a collision.
Active Safety Products
Active safety systems are designed to intervene before a collision to make accidents avoidable or reduce the severity of the crash in addition to making driving easier as well as more comfortable and convenient.
We develop radar and vision technologies (including Veoneer’s internally developed vision algorithms for both mono-and-stereo vision) that monitor the environment around the vehicle with features that adjust engine output and steering or braking to avoid accidents. The goal of active safety technologies is to provide early warnings to alert drivers to take timely and appropriate action or trigger intelligent systems that affect the vehicle’s motion using braking and steering to avoid accidents, as well as to increase the comfort and convenience of driving. Active safety systems can also improve the effectiveness of the restraint control systems which combine hazard information with traditional crash-sensing methods.
Active safety functions include: Autonomous Emergency Braking, which brakes a vehicle autonomously; Adaptive Cruise Control, which keeps and adjusts the vehicle’s pre-set speed to keep a pre-set distance from vehicles ahead; Traffic Jam Assist and Highway Assist, which takes control of braking and acceleration in slow-moving traffic and highway speed, respectively; Forward Collision Warning; Blind Spot Detection; Rear Cross-Traffic Assist; Lane Departure Warning; Lane Centering Assist, Traffic Sign Detection; Light Source Recognition; Driver Monitoring for attention and drowsiness; Vehicle-to-Vehicle and Vehicle-to-Infrastructure communication; and Night Driving Assist.
Key systems used in the active safety functions and the Company’s capabilities, currently provided to the market or under active development, include:
Vision Systems: Vision systems are critical to driver assistance and safety functions. They support the driver in collision avoidance and mitigating severity in the event of an accident. Using our software algorithms, the camera looks at the road ahead for other vehicles, road signs, lane markings and other key elements and provides information and warnings if the car is approaching a potentially hazardous traffic situation. Vision systems are used in applications such as road-sign recognition, lane detection along with forward and pedestrian collision warnings. We offer forward looking mono- and stereo-vision systems:
•The mono-vision system is a forward-looking camera that is mounted behind the windshield in front of the rear-view mirror. Images are interpreted by algorithms that help identify objects and assist the driver with warnings or actuations such as lane keeping and automatic braking of the vehicle. Mono-vision systems provide a significant level of accident reductions targeting 5-star safety levels as well as driver comfort and convenience features like Adaptive Cruise Control.
•Stereo-vision system technology goes a step further and measures the entire driving environment in 3D. The system is capable of acting on any object without classification. Stereo-vision also provides free-space recognition, road surface measurement down to millimeter level accuracy, which is important to original equipment manufacturers ("OEMs") to improve safety and comfort and provides depth perception for distance calculations due to the 3D capability.
Next generation vision systems and algorithms such as our fourth-generation mono- and stereo-cameras, which are currently under development and planned for production in 2019 will support AD and European New Car Assessment Program (“NCAP”) 2020. Fifth generation vision systems, which are in the early planning stages, and planned for production in 2022 will offer more than five times higher image resolution than the current generations as well as offer multiple camera solutions. Selected customers for our vision systems include Geely, Mercedes-Benz, Volvo Cars and one additional Asian OEM.
Radar Systems: Radar systems capture and analyze driving conditions and alert the driver to potentially dangerous events, and can take control of the vehicle if the driver does not take timely appropriate action. Radar systems are used in functions such as adaptive cruise control and automatic emergency braking. Radar is important because it provides superior performance in poor weather conditions such as rain and fog and other situations with poor visibility. Fused with vision systems, higher levels of functional safety are possible allowing a wider range of operating conditions. Our radar sensor portfolio includes: 25GHz ultra-wide band radar, 24 GHz narrow band radar, and 77GHz front and rear corner, and front center radars. Selected customers for our radar systems include Fiat Chrysler Automobiles (FCA), Geely, General Motor (GM), Honda, Mercedes-Benz, Renault Nissan Mitsubishi, and Volvo Cars.
ADAS ECUs: ADAS electronic control units ("ECU") are emerging products within the active safety market and are precursors to the autonomous vehicles of the future. Today, a limited number of OEMs are using separate ADAS ECUs, as most of the ADAS functionalities can be done in an integrated sensor-ECU. With future ADAS and AD systems increasing in complexity, the need for multi-sensor solutions and subsequently higher processing capabilities is expected to lead to more OEMs installing separate ADAS ECUs in their vehicles.
In the ADAS ECU, large quantities of data from the vehicle’s different sensors is validated and analyzed. Advanced algorithms can then act in real time to warn the driver and control the vehicle throttle, braking and steering torque to follow a desired trajectory for fully automated driving. We believe one of the biggest challenges self-driving cars will have to overcome is being able to react to the randomness of traffic flow, other drivers, and the fact that no two driving situations are ever the same.
By using deep learning (artificial intelligence) and sensor fusion, algorithms in the ADAS ECU can likely be improved in such a way that the vehicle will be able to make better decisions than a human driver could. This processing must be done with multiple levels of redundancy to ensure the highest level of safety. The computing demands of driverless
vehicles are 50 to 100 times more intensive than the most advanced vehicle today. Meeting these demands will be the major challenge in developing the next generation of ADAS ECUs including data processing.
In 2016, we launched the world’s first ADAS ECU for mass production in Mercedes-Benz’s new E-class. We provide a similar solution to the updated Mercedes-Benz S-class.
Night Vision Systems: Using passive infrared technology, our night vision system identifies if pedestrians, animals or certain other hazards are present in the danger zone of a vehicle, and alerts the driver, driver, particularly in nighttime, or other “dark” conditions. Our night vision system is the key component in “dynamic light spot” pedestrian illumination system which allows more time for drivers to identify potential hazards at distances beyond normal head-lights. Our fourth-generation night vision system, expected in 2020, will have improved field of view and detection distances, reduction in size, weight and cost featuring enhanced algorithms for pedestrian, animal and vehicle detection as well as supporting night time automatic emergency braking solutions. Selected customers of the night vision system include Audi, BMW, GM, Mercedes-Benz, PSA, Porsche and Volkswagen.
Safety Domain ECUs: As active and passive safety features become more advanced, having dedicated ECUs for the various features increases the complexity and cost of the vehicle architecture. The Safety Domain ECU replaces multiple dedicated ECUs across the vehicle by combining all active and passive safety ECUs into one powerful domain controller. This requires a highly powerful processor which is able to execute simultaneous computing. Techniques such as virtualization enable the safe and secure separation of computing tasks, as the other controllers are not affected if one virtual controller fails.
LiDAR: In 2017, we agreed to collaborate with Velodyne to expand and commercialize our LiDAR development. LiDAR is expected to be an important sensor technology for the future development of AD systems. Under the current agreement with Velodyne, Veoneer will act as the Tier-1 supplier to the OEMs for the Velodyne LiDAR sensors. We will provide project management services, product validation and verification capabilities and system/interface packaging in supplying automotive-grade LiDAR systems to the OEMs. Our LiDAR product roadmap includes first providing it to test fleets of the OEMs and the robo-taxis market followed by developing a solid-state design for the consumer vehicle market. Building on this relationship, on January 7, 2019 the Company announced entry into a license and supply agreement with Velodyne whereby Velodyne will provide Veoneer US, Inc. with materials and rights to certain Velodyne intellectual property which would enable Veoneer US, Inc to sell, distribute, promote, manufacture and modify, including related research and development ("R&D") certain LiDAR products based on a Velodyne-authorized reference design.
Driver Monitoring: We have been developing solutions to address driver distraction and fatigue as they relate to traditional driving situations and driver attention for hands-free driving. In 2017 we entered into an agreement with Seeing Machines to accelerate this effort. This technology is expected to be necessary to achieve a 5-star NCAP rating in Europe in 2022 as well as Level 3 autonomy solutions worldwide. Our non-exclusive agreement with Seeing Machines to utilize their reference design and market under a license, allows the Company the ability to build hardware and feature level solutions on top of Seeing Machines’s world leading head pose, gaze and recognition data outputs.
RoadScape: Our RoadScapeTM product line offers highly accurate satellite positioning along with world leading dead reckoning capabilities for increased precision in urban areas. Building on this, RoadScapeTM provides a digital representation of the road ahead that can be further enhanced through probe data in the field and cloud connectivity. Finally, adding RoadScapeTM communication technology allows for vehicle-to-vehicle, infrastructure and cloud connectivity for premonition and situational awareness in ADAS and AD.
Human Machine Interaction (“HMI”): Genuine two-way communication between vehicle and driver is critical to building driver trust and enhancing the driver experience. Veoneer’s Learning Intelligent Vehicle (“LIV”) is an artificial intelligence-equipped research vehicle that can understand and respond to context. LIV uses external and internal sensing combined with complex algorithmic artificial intelligence to create a unified contextual picture of what is going on with the occupants, vehicle, driving situation and then acts and serves as a “co-pilot” to communicate with drivers and passengers. Veoneer uses LIV to learn more about task delegation, shared control, driver-vehicle collaboration; innovate ways to increase driver understanding of an autonomous system; and to continually improve the system’s understanding of its human co-travelers.
Restraint Control Systems
The restraint control system is the brain triggering a vehicle’s passive safety system in a crash situation. Restraint control systems consist of a restraint ECU and related remote crash sensors, including acceleration and pressure sensors. The ECU’s algorithms decide when a seatbelt pretensioner should be triggered and an airbag system should be deployed.
The ECU is mounted centrally in the vehicle, well protected in the event of a crash, and is supported by crash sensors mounted in the door beam, the pillar between the doors, the rocker panel and/or in various locations at the front and rear of the vehicle. These “satellite” crash sensors provide acceleration data to enable early and appropriate deployment of the airbags and seatbelt pretensioners within milliseconds of a vehicle crash.
The ECU also contains certain sensors that are common with the brake system. We were the first to offer this type of solution, providing savings through the reduction in multiple sensors for measuring yaw rate, and consolidating this information on the vehicle data bus. Additionally, the restraint control system is capable of recording details of what happened before and during a crash event using an Event Data Recorder (“EDR”) with the restraint control ECU.
Selected customers include FCA, Ford, Geely, GM, Great Wall, Hyundai/Kia, Jaguar Land Rover, Mazda, PSA, Renault Nissan Mitsubishi, Suzuki and Volvo Cars.
Overview of Zenuity
In addition to our two segments, we are a 50% owner of Zenuity, our joint venture with Volvo Cars to develop decision making software for ADAS and AD.
All ADAS and AD features are based on a recommended reference architecture for customers that require a system level solution. In March 2018 Zenuity was selected by Geely as supplier for Geely’s Level 3 project, which includes ADAS electronic control units and software, radar systems, as well as mono-vision and stereo-vision camera systems.
As of December 31, 2018, Zenuity had a team of over 600 employees and consultants, of which 88% are software engineers who we believe have the necessary skills to develop these technologies. We expect to supply customers with Zenuity software during 2020.
Through the Company's own product capabilities and extensive partnership network, Veoneer has one of the broadest ADAS and AD product portfolio offerings, which include all major sensing technologies, decision making software, positioning and mapping technologies and cloud solutions.
Our product portfolio has been significantly expanded over the recent years (as illustrated below) from individual hardware sensing components to a full range of key functions and capabilities as outlined below. This enables us to address our customer needs today, and likely in the future, by offering the entire spectrum of ADAS and AD solutions.
Brake Systems Segment
Our Brake Systems reporting segment consists of our brake systems product area, which are those products developed by VNBS which provides brake control and actuation systems. VNBS provides products for both traditional and new braking systems which we see as building blocks in the actuator area towards HAD.
VNBS supplies brake systems, including the brake booster, hydraulic proportioning valves and electronic control module with sensors. The control module can modulate the brake pressure applied on each wheel individually to maintain optimum braking and offers features like Electronic Stability Control (“ESC”), Anti-locking Brakes (“ABS”) and Traction Control System.
For traditional brakes, a vacuum produced by Internal Combustion Engines is necessary to amplify the force applied by the driver’s foot to convert it into hydraulic pressure to decelerate the vehicle. New drivetrains, such as Electric (“EV”) and Hybrid (“HEV”), do not provide the same source of energy for boosting the brake input from the driver. Therefore, VNBS has developed new servo-assisted and integrated brake control systems that can work independent of the type of drivetrain used.
To improve the overall efficiency of vehicles, VNBS’ new braking systems also provide the opportunity to recover brake energy using electric motors as generators to charge batteries. This contrasts with conventional braking systems where the excess kinetic energy is converted to unwanted and wasted heat by friction in the brakes.
VNBS currently produces brake systems capable of coping with regenerative braking and has developed an upgraded Electronic Brake Boost system for market introduction expected towards the end of 2019. This system integrates the hydraulic brake modulator with the electronic brake control unit and the brake fluid reservoir into a single unit (so called “one box” design). Scalability and cost competitiveness of this technology qualifies VNBS to participate in the growth of brake-by-wire systems needed for regenerative braking while delivering superior braking performance to support the growing need for external brake requests such as Automated Emergency Braking and other functionalities.
In January 2017 the Company announced that VNBS is expanding its customer base beyond its primary customer Honda, winning lifetime contract order value of more than $1 billion for our new braking system with a Detroit based OEM on a major vehicle platform. Production for this awarded business is currently scheduled to begin in 2020. There is no minimum purchase value associated with this awarded business. The agreement will be governed by the OEM’s general terms and conditions and Veoneer and such OEM will enter into a commercial and program agreement that will set forth the specific commercial terms and functional requirements with respect to this order. The program life cycle is estimated to be six years. We received a second major order from the same OEM at the end of 2017. The main opportunities we see in brake systems stem from its capabilities in regenerative braking technology which works well with combustion engine vehicles but is even more suitable for HEV and EV. We see significant opportunities to expand outside the current customer base, especially in combination with our strong customer relationships and global footprint.
Acquisition, Partnership and Collaboration History
Our success and comprehensive product portfolio have partly been driven by acquisitions and partnerships, both critical elements to succeed within the multifaceted auto safety electronics industry and to remain competitive against existing and new entrants looking to enter the market. These partnerships and collaborations have a strategic importance in the near and long term to develop additional autonomous driving building blocks and bring potential products to market in future years.
Acquisitions and Joint Ventures
February 2018: Zenuity announced the acquisition of Beyonav intellectual property and trademarks, a technology services company delivering innovative location-based solutions that go beyond traditional applications of navigation technology.
November 2017: We acquired Fotonic, a Swedish company with expertise in LiDAR and Time of Flight cameras, building on our collaboration with Velodyne that was established in June 2017. This acquisition adds to our portfolio the collaboration capabilities within LiDAR sensors, leveraging on our expertise in manufacturing and validation.
April 2017: We launched Zenuity, a strategic 50/50 joint venture with Volvo Cars. This joint venture is an industry first, where an OEM and Tier-1 supplier, both recognized as pioneers in automotive safety, formed a company to develop ADAS software towards AD. See details above.
April 2016: We formed VNBS, a 51/49 joint venture with Nissin Kogyo, a Japanese supplier of both traditional and new brake systems. The joint venture is fully consolidated by Veoneer. See details above.
Partnerships, Collaborations and Supplier Agreements
January 2019: The Company announced entry into a license and supply agreement with Velodyne whereby Velodyne will provide Veoneer US, Inc. with materials and rights to certain Velodyne intellectual property which would enable Veoneer US, Inc. to sell, distribute, promote, manufacture and modify (including related R&D) certain LiDAR products based on a Velodyne-authorized reference design.
January 2018: Zenuity announced a non-exclusive collaboration with TomTom, to provide reference map architecture for the “Zenuity Connected Roadview” system for autonomous vehicles. TomTom’s High Definition (“HD”) Maps will power the localization, perception and path planning in the Zenuity AD software stack in combination with on-vehicle sensors such as cameras, radar and LiDAR to create continuously updated maps.
October 2017: We announced a non-exclusive collaboration with Massachusetts Institute of Technology AgeLab to develop deep learning algorithms that enable effective communication and transfer of control between driver and vehicle. This includes sensing driver gaze, emotion, cognitive load, drowsiness, hand position, posture and fusing this information with the perception of the driving environment to create safe and reliable vehicles that drivers can learn to trust.
September 2017: Zenuity announced a non-exclusive collaboration with Ericsson. The aim is to develop the Zenuity connected cloud, where Ericsson will contribute its “Internet of Things” accelerator platform aiming to integrate in-vehicle software and systems with connected safety data from other vehicles and infrastructure to potentially provide Over-the-Air real time updates across the vehicle fleet.
August 2017: We announced a non-exclusive collaboration with Seeing Machines, a pioneer in computer vision based human sensing technologies to develop next generation Driver Monitoring Systems for autonomous vehicles.
July 2017: We announced a non-exclusive collaboration with Velodyne to sell various LiDAR sensors as the Tier-1 supplier to the OEMs. See details above.
June 2017: We announced a non-exclusive early stage collaboration with NVIDIA, in combination with Zenuity, providing Veoneer and Zenuity with pre-commercial access to NVIDIA’s AI computing platform for autonomous driving. Actual production vehicles utilizing said platform are not planned for sale before 2021.
Market Overview and Competitive Landscape
Automotive Supplier Market Overview
The automotive production value chain is split among OEMs such as General Motors, Toyota and Volkswagen and automotive suppliers, such as ourselves, Aptiv, Bosch, Continental, Denso, Magna, Valeo and ZF. Veoneer acts mainly as a Tier-1 supplier to OEMs, meaning that we sell products directly to OEMs.
Our underlying market is primarily driven by two critical factors: Global Light Vehicle Production (“LVP”) and Content Per Vehicle (“CPV”), whereby CPV is the clear market driver for the growth of our total addressable market.
Light Vehicle Production: Over the last two decades, LVP has increased at an average annual growth rate of around 3% despite the cyclical nature of the automotive industry. LVP is expected to grow to around 92 million in 2019, and 106 million in 2025, from approximately 91 million in 2018, according to IHS, The market is undergoing a shift from traditional internal combustion engine vehicles, to HEVs and EVs, as emission regulation becomes more stringent, and battery technology continues to evolve.
Content Per Vehicle: Unlike LVP, we can directly influence the CPV by introducing new technologies to the market. Looking ahead, we expect that safety CPV growth will primarily be driven by active safety content (including software), with total active safety market growing from approximately $75 per vehicle in 2018 to approximately $250 per vehicle in 2025, representing a compound annual growth rate ("CAGR") of roughly 19% from 2018 to 2025, as the demand for advanced active safety features grows.
See Item 7 Management’s Discussion and Analysis ("MD&A") of Financial Condition and Results of Operations-Trends, Uncertainties and Opportunities” for additional information related to recent trends in LVP and CPV.
Active Safety Competitive Landscape
The active safety market is highly fragmented and highly competitive. Competition is based primarily on technology, innovation, quality, delivery and price. Our future success will depend on our ability to develop advanced hardware and software technologies and to maintain or improve on our already strong competitive position over our existing and any new competitors. Main competitors in active safety include Aptiv, Bosch, Continental, Denso, Magna, Valeo, ZF, and Intel/Mobileye.
On a broader scale, we have seen significant shifts in our competitive landscape over the last several years. Technology companies have increased their presence and influence in ADAS and AD either through acquisitions or forming “ecosystems” around certain technologies with OEMs and other suppliers. This has led to new industry entrants like Apple, Google, Intel, NVIDIA, Qualcomm and Uber, which also provide partnership or customer opportunities for Veoneer hardware and software solutions.
Through acquisitions, technology partnerships with customers and licensing agreements we have continuously added key building blocks and we estimate to have obtained a market share of 12% in active safety in 2018. Zenuity has since inception formed several partnerships to establish a full-suite ecosystem and competes with peer ecosystems such as the BMW/Intel/Mobileye collaboration.
Restraint Control Systems Competitive Landscape
The market for restraint control systems remains relatively fragmented with both traditional electronics suppliers and some passive safety suppliers. Over the past few years, we have seen our market share increase mainly due to cost efficient integration solutions and strong customer relationships built on quality and technology advancements. Currently we are the leading supplier of restraint control systems with a market share of around 26% in 2018. Our largest competitors include Bosch, Continental, Denso and ZF.
The total restraint control systems market amounted to approximately $4 billion in 2018 and is expected to remain at the same level until 2025. We believe that restraint control systems will play an integral role in a larger integration trend towards centralized Safety Domain Controllers in the future. In addition, our strong market position in restraint control systems will provide opportunities to become a leading supplier in the ADAS ECU and eventually the Safety Domain Controller market.
Brake Systems Competitive Landscape
Brake systems consists of brake control ECUs, including ABS and ESC as well as brake apply units. We estimate the total brake systems market to be approximately $12 billion in 2018, with a projected CAGR of 3% through 2025. The main growth driver is higher installation rates of ESC systems in China and other emerging countries in Asia. Another major growth driver is more advanced and complex servo assisted systems and regenerative braking systems for HEVs and EVs. The ability to regenerate kinetic energy through braking is of growing importance as vehicle powertrains are becoming increasingly electrified. We estimate that VNBS had a market share of just above 4% in 2018. Main competitors of VNBS include ADVICS, Bosch, Continental, Mando and ZF.
Research & Development and Intellectual Property
Our ability to maintain our position at the forefront of technological innovations and to serve customers on a local basis will be differentiating factors to our success. Therefore, we maintain one of the broadest global networks of technical engineering centers across all major automotive regions to develop and provide advanced products, processes and manufacturing support for our manufacturing sites and to provide our customers with local engineering capabilities and design development on a global basis.
We currently own or co-own approximately 738 active patents and have approximately 710 pending patent applications in the US and other jurisdictions. The active patents will expire between 2019 and 2038. We have registered the name Veoneer as a trademark in Sweden and are pursuing registration in other markets of interest. Depending on the jurisdiction, trademarks are generally valid as long as they are in use or their registrations are properly maintained, and they have not been found to have become generic.
We are actively pursuing opportunities to commercialize and license our technology to the automotive industries, and we selectively utilize other companies’ licenses through sublicenses in order to support our business interests. These activities foster optimization of intellectual property rights.
We believe that our patents, trademarks and licenses, provide meaningful protection for our products and technical innovations and as a whole, to be material to our business. However, we do not consider our business or any of our business segments to be materially dependent upon any individual patent, trademark or license.
We seek to effectively manage fixed costs and efficiently rationalize capital spending by evaluating the market and profit potential of existing and new customer programs, including investments in innovation and technology. We maintain our engineering activities around our focused product portfolio and allocate our capital and resources to those products and distinctive technologies.
Our total research and development expenses, including engineering, net of customer reimbursements, were $466 million, $375 million and $300 million for the years ended December 31, 2018, 2017 and 2016, respectively. Zenuity’s total expenses were $125 million for the year ended December 31, 2018. These expenses were mainly related to research and development.
We believe that our engineering and technical expertise, together with our emphasis on continuing research and development, allows us to use the latest technologies, materials and processes to solve problems for our customers and to bring new innovative products to market. We believe that continued engineering activities are critical to maintaining our pipeline of technologically advanced products.
Dependence on Customers
Veoneer serves most of the world’s major automotive OEMs and is not dependent on one single customer. Our customer base has consistently increased and diversified over the last five years, mainly driven by our active safety product offerings and VNBS.
In 2018 we served a total of 16 customers and our largest customers were Honda (21% of sales), Daimler (17% of sales), Ford (11% of sales), Hyundai/Kia (10% of sales), General Motors (8% of sales), Renault Nissan Mitsubishi (7% of sales) FCA (5% of sales) and BMW (5% of sales). Some of the concentration is driven by the concentration in the automotive industry, with the five largest OEMs in 2018 accounting for 49% of global LVP and the ten largest for 74%, according to IHS.
We typically supply products to our OEM customers through written contracts or purchase orders which are generally governed by general terms and conditions established by each OEM. These arrangements include terms regarding price, quality, technology and delivery. Although it may vary from customer to customer, our customer contracts generally require us to supply a customer’s annual requirements for a particular vehicle model and assembly facilities, rather than for manufacturing a specific quantity of products. Such contracts range from one year to the life of the model, which is generally four to seven years. Because we produce products for a broad cross section of vehicle models, we are not overly reliant on any one vehicle model or one particular product.
These contracts are often subject to renegotiation, sometimes as frequent as on an annual basis which may affect product pricing. In general, these arrangements with our customers provide that the customer can terminate them if we do not meet specified quality, delivery and cost requirements. Although these arrangements may be terminated at any time by our customers (but not typically by us), such terminations have historically been minimal and have not had a material impact on our results of operations. However, if terminations do occur in the future or if production under a contract winds down earlier than expected, then such event could have a material impact on our results of operations. The arrangements typically provide that we are subject to a warranty on the products supplied; in most cases, the duration of such warranty is coterminous with the warranty offered by the OEM to the end-user of the vehicle. We may also be obligated to share in all or a part of recall costs if the OEM recalls its vehicles for defects attributable to our products.
Veoneer Personnel
As of December 31, 2018, we had a total of approximately 8,600 employees and consultants, with 4,676 in engineering, 2,083 in production and 1,346 in production overhead, and the remainder employed in management, general and administrative functions. Within engineering, more than two thirds of the employees worked as software engineers.
In addition, Zenuity had approximately 600 employees and consultants at the end of 2018, of which approximately 88% worked as software developers. In 2018, approximately 1,100 engineers were hired by Veoneer and more than 100 were hired by Zenuity.
We consider our relationship with our personnel to be strong. We have not had any disputes which are significant or had a lasting impact on our relationship with our employees, customer perception of our employee practices or our business results.
Major unions to which some of our employees belong in Europe include: IG Metall in Germany; Unite in the United Kingdom; Confédération Générale des Travailleurs, Confédération Française Démocratique du Travail, and Force Ouvrière in France; and If Metall, Unionen, Sveriges Ingenjörer and Akademikerföreningen in Sweden.
In addition, our employees in other regions are represented by the following unions: Unifor and the International Association of Machinists and Aerospace Workers (“IAM”) in Canada and VNBS Roudou Kumiai in Japan.
In many European countries and in Canada, wages, salaries and general working conditions are negotiated with local unions and/or are subject to centrally negotiated collective bargaining agreements. The terms of our various agreements with unions typically range between one and three years. Some of our subsidiaries in Europe and Canada must negotiate with the applicable local unions with respect to important changes in operations, working and employment conditions. Twice a year, members of the Company’s management conduct a meeting with the European Works Council (“EWC”) to provide employee representatives with important information about the Company and a forum for the exchange of ideas and opinions.
In many Asia Pacific countries, the central or regional governments provide guidance each year for salary adjustments or statutory minimum wage for workers. Our employees may join associations in accordance with local legislation and rules, although the level of unionization varies significantly throughout our operations.
Inventory and Working Capital
We, as with other component manufactures in the automotive industry, ship our products to customer vehicle assembly facilities throughout the world on a “just-in-time” basis for our customers to maintain low inventory levels. Our suppliers (external suppliers as well as our own production sites) use a similar method in providing raw materials to us.
Sources and Availability of Raw Materials
We procure our raw materials and components from a variety of suppliers around the world. Generally, we seek to obtain materials in the region in which our products are manufactured to minimize transportation, currency risks and other costs. The most significant raw materials we use to manufacture our products are various electrical components and ferrous metals for brake systems. As of December 31, 2018, we have not experienced any significant shortages of raw materials and normally do not carry inventories of such raw materials more than those reasonably required to meet our production and shipping schedules.
Commodity cost volatility is a challenge for us and our industry. We are continually seeking to manage these costs using a combination of strategies, including working with our suppliers to mitigate costs, seeking alternative product designs and material specifications, combining our purchase requirements with our customers and/or suppliers, changing suppliers, hedging certain commodities and other means. Our overall success in passing commodity cost increases on to our customers has been limited. We will continue our efforts to pass market-driven commodity cost increases to our customers in an effort to mitigate all or some of the adverse earnings impacts, including by seeking to renegotiate terms as contracts with our customers expire.
Seasonality
Our business is moderately seasonal. Our European customers generally reduce production during the months of July and August and for one week in December. Our North American customers historically reduce production during the month of July and halt operations for approximately one week in December. Our Chinese customers generally reduce production during the Chinese New Year period in February. Shut-down periods in the rest of the world generally vary by country. In addition, automotive production is traditionally reduced in the months of July, August and September due to the launch of parts production for new vehicle models. Accordingly, our results reflect this seasonality. In addition, engineering income tends to be skewed towards the fourth quarter.
Environmental Compliance
We are subject to various environmental regulations governing, among other things: (i) the generation, storage, handling, use, transportation, presence of, or exposure to hazardous materials; (ii) the emission and discharge of hazardous materials into the ground, air or water; (iii) the incorporation of certain chemical substances into our products, including electronic equipment; and (iv) the health and safety of our employees.
Most of the Company’s manufacturing processes consist of the assembly of components. As a result, the environmental impact from the Company’s plants is generally modest. While our businesses from time to time are subject to environmental investigations, there are no material environmental-related cases pending against the Company. Therefore, we do not incur (or expect to incur) any material costs or capital expenditures associated with maintaining facilities compliant with U.S. or non-U.S. environmental requirements. To reduce environmental risk, the Company has implemented an environmental management system in all plants globally and has adopted an environmental policy.
We are subject to various U.S. federal, state and local, and non-U.S., laws and regulations, including those related to environmental, health and safety, financial and other matters. We cannot predict the substance or impact of pending or future legislation or regulations, or the application thereof. The introduction of new laws or regulations or changes in existing laws or regulations that impact our business, or the interpretations thereof, could increase the costs of doing business for us or our customers or suppliers or restrict our actions and adversely affect our financial condition, operating results and cash flows.
We are also required to obtain permits from governmental authorities for certain of our operations.
Dependency on Government Contracts
We are not dependent on government contracts. Some R&D projects are partly financed by certain government agencies.
Joint Venture Agreements
Zenuity Joint Venture Agreement
Zenuity operates pursuant to the Joint Venture Agreement, dated April 18, 2017 (the “Zenuity JV Agreement”), between Volvo Cars and a subsidiary of Veoneer. The Zenuity JV Agreement describes the scope of the business activities of Zenuity, which is to develop automotive driver assistance and highly autonomous driving software solutions that can be supplied to Volvo Cars and other potential customers. In addition, Zenuity conducts research within the areas of human factors, vehicle environments and computer techniques to develop algorithms for driving assistance or automated driving. Zenuity owns and licenses certain intellectual property rights pursuant to commercialization agreements between the parties. Veoneer is the exclusive supplier and distribution channel for all Zenuity’s products sold to third parties; however, there is no exclusivity toward any customer or the owners. Volvo Cars can source such products directly from Zenuity. The parties also entered into a number of related agreements in connection with forming the joint venture, including an investment agreement, commercialization agreements and intellectual property license and assignment agreements pursuant to which Volvo Cars and Veoneer transferred certain intellectual property rights to Zenuity. A copy of the Zenuity JV Agreement has been filed with the U.S. Securities and Exchange Commission (the “SEC”).
VNBS Joint Venture Agreement
Brake Systems was formed by and operates pursuant to a number of agreements entered into between certain affiliates of each of Veoneer and Nissin Kogyo Ltd., Co. (“Nissin”), including a Share Purchase Agreement, dated September 9, 2015, and a Joint Venture Agreement, dated March 7, 2016 (the “VNBS JV Agreement”). The VNBS JV Agreement sets forth the agreements between Veoneer and Nissin with respect to the ownership, capitalization, governance and operations of Brake Systems. It provides that Veoneer owns 51% of each of the entities that comprise Brake Systems and Nissin owns the remaining 49% of each entity. A copy of the VNBS JV Agreement has been filed with the SEC.
Since the Company acquired a 51% interest in VNBS, Veoneer has unilaterally provided the funds necessary to meet VNBS’s operational needs as Nissin Kogyo has, notwithstanding repeated requests, refused to provide funding in proportion to its ownership. In 2019, the Company initiated a formal negotiation process under the VNBS JV Agreement to find a resolution to the current funding situation.
Spin-Off Related Agreements
As part of the Spin-Off, Autoliv underwent an internal reorganization, pursuant to which, among other things and subject to limited exceptions, all of the assets and liabilities (including whether accrued, contingent or otherwise, and subject to certain exceptions) associated with the electronics business of Autoliv were retained by or transferred to Veoneer or our subsidiaries and all other assets and liabilities (including whether accrued, contingent or otherwise, and subject to certain exceptions) of Autoliv were retained by or transferred to Autoliv or its subsidiaries (other than Veoneer).
Following the Spin-Off, the Company and Autoliv began operating independently and neither has any ownership interest in the other. To govern certain ongoing relationships between Veoneer and Autoliv after the Spin-Off and to provide mechanisms for an orderly transition, the Company and Autoliv entered into agreements pursuant to which certain services and rights are provided for following the Spin-Off, and the Company and Autoliv will indemnify each other against certain liabilities arising from our respective businesses.
Distribution Agreement
In connection with the internal reorganization, we entered into a Master Transfer Agreement with Autoliv which was amended and restated effective as of the Spin-Off (the “Distribution Agreement”). The Distribution Agreement governs certain transfers of assets and assumptions of liabilities by each of Veoneer and Autoliv and the settlement or extinguishment of certain liabilities and other obligations among the companies and their subsidiaries. In particular, substantially all of the assets and liabilities associated with the separated Electronics business were retained by or transferred to Veoneer or its subsidiaries and all other assets and liabilities were retained by or transferred to Autoliv or its subsidiaries. The Distribution Agreement also provided the principal corporate transactions required to affect the Spin-Off, certain conditions to the Spin-Off and provisions governing the relationship between Veoneer and Autoliv with respect to and resulting from the completion of the Spin-Off. The Distribution Agreement also provides for indemnification obligations designed to make the Company financially responsible for substantially all liabilities that may exist relating to its business activities, whether incurred prior to or after the completion of the internal reorganization, as well as those obligations of Autoliv assumed by us pursuant to the Master Transfer Agreement; provided, however, certain warranty, recall and product liabilities for Electronics products manufactured prior to the completion of the internal reorganization were retained by Autoliv and Autoliv will indemnify us for any losses associated with such warranty, recall or product liabilities.
Employee Matters Agreement
The Employee Matters Agreement governs Autoliv’s and Veoneer’s compensation and employee benefit obligations with respect to the current and former employees and non-employee directors of each company. Under the agreement, Autoliv is responsible for liabilities associated with Autoliv allocated employees and liabilities associated with former employees and Veoneer is responsible for liabilities associated with Veoneer allocated employees, but Autoliv retains and continues to be responsible for certain post-retirement liabilities relating to plans sponsored by Autoliv. The Employee Matters Agreement provided for the conversion of the outstanding awards granted under the Autoliv equity compensation programs into adjusted awards relating to both shares of Autoliv and Veoneer common stock.
Tax Matters Agreement
The Tax Matters Agreement governs the respective rights, responsibilities and obligations of Autoliv and Veoneer with respect to tax liabilities and benefits, tax attributes, tax contests and other tax sharing regarding U.S. federal, state, local and foreign income taxes, other tax matters and related tax returns. The agreement also specifies the portion, if any, of this tax liability for which Veoneer will bear responsibility and provides for certain indemnification provisions with respect to amounts for which they are not responsible. In addition, under the agreement, each party is expected to be responsible for any taxes imposed on Autoliv that arise from the failure of the Spin-Off and certain related transactions to qualify as a tax-free transaction for U.S. federal income tax purposes.
Amended and Restated Transition Services Agreement
Under the Amended and Restated Transition Services Agreement (“TSA”), Autoliv and Veoneer agreed to provide to each other certain services for a limited time to help ensure an orderly transition following the Spin-Off. The services that Autoliv provides include certain finance, information technology, human resources and compensation, facilities, legal and compliance and other services. We pay Autoliv for any such services utilized at agreed amounts as set forth in the TSA. In addition, for a term set forth in the TSA, we and Autoliv may mutually agree on additional services to be provided by Autoliv to us that were provided to us by Autoliv prior to the distribution but were omitted from the TSA at pricing based on market rates that are reasonably agreed by the parties.
Available Information
We file or furnish with the SEC periodic reports and amendments thereto, which include annual reports on Form 10-K, quarterly reports on Form 10-Q, current reports on Form 8-K, proxy statements and other information. Such reports, amendments, proxy statements and other information are made available free of charge on our corporate website at www.veoneer.com and are available as soon as reasonably practicable after they are electronically filed with the SEC. The SEC maintains an internet site that contains reports, proxy and information statements, and other information regarding issuers that file electronically with the SEC at http://www.sec.gov. Paper copies ocf the above-mentioned documents can be obtained free of charge from the Company by contacting us at: Veoneer, Inc., Box 13089, SE-103 02, Stockholm, Sweden or Veoneer, Inc., 26545 American Drive, Southfield, MI 48034.
Item 1A. Risk Factors
Owning our common stock involves a high degree of risk. You should consider carefully the following risk factors and all other information contained in this Annual Report on Form 10-K. If any of the following risks, as well as additional risks and uncertainties not currently known to us or that we currently deem immaterial but are in fact material, occur, our business, liquidity, results of operations and financial condition could be materially and adversely affected. If this were to happen, the market price of our common stock could decline significantly, and you could lose all or a part of the value of your ownership in our common stock. Some statements in this information statement, including statements in the following risk factors, constitute forward-looking statements. Please refer to the section in this Annual Report entitled “Forward-Looking Statements.”
Risks Related to Our Industry
The cyclical nature of automotive sales and production can adversely affect our business.
Our business is related to LVP in the global market and by our customers, and automotive sales and LVP are critical drivers for our sales. Automotive sales and production are highly cyclical and can be affected by general or regional economic or industry conditions or uncertainty, the level of consumer demand, recalls and other safety issues, labor relations issues, technological changes, fuel prices and availability, vehicle safety regulations and other regulatory requirements, governmental initiatives, trade agreements, political volatility, especially in energy producing countries and growth markets, changes in interest rate levels and credit availability and other factors. At various times some regions around the world may be more particularly impacted by these factors than other regions. Economic declines that result in a significant reduction in automotive sales and production by our customers have in the past had, and may in the future have, a material adverse effect on our business, results of operations and financial condition.
Our sales are also affected by inventory levels of our customers. We cannot predict when our customers will decide to either increase or reduce inventory levels or whether new inventory levels will approximate historical inventory levels. This may exacerbate variability in our order intake and, as a result, our revenues and financial condition. Uncertainty regarding inventory levels may be exacerbated by consumer financing programs initiated or terminated by our customers or governments as such changes may affect the timing of their sales.
Most of our products are technologically complex and innovative and there can be a significant amount of time between design and production. Development delays resulting from the challenges of integrating new functionality into vehicles and the evolution of our customers’ performance requirements during the development cycle subject us to the risk that our customers cancel or postpone a contract in the time period that it takes us to begin production of a particular product.
Changes in automotive sales and LVP and/or customers’ inventory levels will have an impact on our long-term targets, earnings guidance and estimates. In addition, we base our growth projections in part on business awards, or order intake, made by our customers. However, actual production orders from our customers may not approximate the awarded business or our estimated order intake. Any significant reduction in automotive sales and/or LVP by our customers, whether due to general economic
conditions or any other factors relevant to sales or LVP, will likely have a material adverse effect on our business, results of operations and financial condition.
Growth rates in safety content per vehicle, which may be impacted by changes in consumer trends and political decisions, could affect our results in the future.
Vehicles produced in different markets may have various safety content values. For now, our products are typically found in vehicles with higher safety content. Because growth in global LVP is highly concentrated in markets such as China and India, our operating results may suffer if the safety content per vehicle remains low in our growth markets. As safety content per vehicle is also an indicator of our sales development, should this trends continue, the average safety systems per vehicle could decline.
We operate in highly competitive markets.
The markets in which we operate are highly competitive. We compete with a number of companies that design, produce and sell similar products. Among other factors, our products compete on the basis of price, quality, manufacturing and distribution capability, design and performance, technological innovation, delivery and service. Some of our competitors are subsidiaries (or divisions, units or similar) of companies that are larger than we are and have greater financial and other resources than us. Some of our competitors as well as some of our customers have strategic relationships with outside partners, enabling them to pool resources. Additionally, some of our competitors may also have “preferred status” as a result of special relationships or ownership interests with certain customers. Our ability to compete successfully depends, in large part, on our ability to innovate and manufacture products that have commercial success with consumers, differentiating our products from those of our competitors, delivering quality products in the time frames required by our customers, and achieving best-cost production.
Our ability to maintain and improve existing products, while successfully developing and introducing distinctive new and enhanced products that anticipate changing customer and consumer preferences and capitalize upon emerging technologies will be a significant factor in our ability to be competitive. If we are unsuccessful or are less successful than our competitors in predicting the course of market development, developing innovative products, processes, and/or use of materials or adapting to new technologies or evolving regulatory, industry or customer requirements, we will suffer from a competitive disadvantage. There is a risk that our investments in research and development initiatives will not lead to successful new products and a corresponding increase in revenue. We may also encounter increased competition in the future from existing or new competitors. The inability to compete successfully could have a material adverse effect on our business, results of operations and financial condition.
We operate in a developing market that may be subject to greater uncertainty and fluctuations in levels of competition than a more mature market.
The field of active safety is a developing segment in the automotive industry and is expected to act as a basis for and enable the development and introduction of commercially viable autonomous vehicles. The number of competitors may increase as suppliers from outside the traditional automotive industry, such as Google, Argo, Uber, Lyft, Cruise, Samsung, Panasonic, Here, Tesla, Intel, NVIDIA and other technology companies, consider the significant business opportunities presented by autonomous driving. Some of our customers are also partnering together to develop autonomous driving solutions. The evolving nature of the competitive landscape creates greater uncertainty than the traditional automotive market.
Products and services provided by companies outside the automotive industry may also reduce demand for our products, which require substantial investment in research and development. For example, there has been an increase in consumer preferences for mobility on demand services, such as car- and ride-sharing, as opposed to automobile ownership, which may result in a long-term reduction in the number of vehicles per capita. Today, in most markets, active safety products are considered to be premium equipment rather than standard automotive safety items, which can create significant volatility in demand for certain of our products.
The high development costs of active safety and autonomous driving products increases the risk that we will be unable to effectively compete in the market.
Our products may require significant resources to develop both hardware and software solutions, which are of increasing importance in our market. There is an increasing trend towards partnerships between companies with complementary hardware and software solutions that are able to pool resources to support development. The high development cost in active safety limits the number of technical solutions that can be pursued by most “Tier 1” automotive suppliers (meaning companies that supply directly to the automobile manufacturers), leading to risk of exposure to a disruptive technology different than those being developed by us.
In addition, a significant part of our business is focused on developing autonomous driving technology, which requires significant amounts of resources devoted to researching and developing innovative products and processes. For example, we have invested significant resources in developing Zenuity, our joint venture with Volvo Cars, which is aimed at developing software solutions
for autonomous driving. There is a risk that Zenuity or our other autonomous driving projects will not be able to deliver a competitive product.
If we are unable to develop and deliver innovative and competitive products, or unable to do so before our competitors, our business, results of operations and financial condition could be materially adversely affected.
Autonomous driving involves complex technology and requires a number of different hardware and software competencies and technologies and there is a risk that these competencies or technologies will not develop at a sufficient pace to address marketplace needs.
Autonomous driving requires various types of sensor technology, including cameras, radar and LiDAR technology as well as software technology to control such sensors. These technologies are under various stages of development and marketplace acceptance. There is a risk that these technological solutions will not develop at a sufficient pace to gain acceptance with our customers. If we are unable to develop our autonomous driving solutions fast enough to keep pace with the market, our future business prospects, results of operations and financial condition could be materially adversely affected.
There are also challenges to develop autonomous driving solutions that are outside of our control, including regulatory requirements from state and federal agencies, cybersecurity and privacy concerns, product liability concerns and perceptions of drivers regarding autonomous driving capabilities and solutions. We may need to adjust our strategy and projected timelines based on how these challenges, and others, evolve over time. There is a risk that these challenges will not be overcome, which could have a material adverse effect on our business, results of operations and financial condition.
The inability to effectively manage the timing, quality and costs of new program launches could adversely affect our financial performance.
To compete effectively in the automotive supply industry, we must be able to launch new products to meet our customers’ timing, performance and quality standards. Our inability to do so may result in the loss of awarded business as well as significant liabilities and/penalties. Certain state of the art products we launch may need to be developed on an especially accelerated time frame for speed-to-market. There is a risk that we will not be able to install and certify the equipment needed to produce products for new programs in time for the start of production, or that the transitioning of our manufacturing facilities and resources to full production for such new programs will not impact production rates or other operational efficiency measures at our facilities. In addition, there is a risk that our customers will not execute on schedule the launch of their new product programs, for which we might supply products. Additionally, as a Tier 1 automotive supplier, we must effectively coordinate the activities of numerous suppliers in order to launch programs successfully. Given the complexity of new program launches, especially involving new and innovative technologies, we may experience difficulties managing product quality, timeliness and associated costs. These risks with new technologies are increased when the customer relationship is new and the customer is subject to the same pressures on product quality and timeliness. In addition, new program launches require a significant ramp up of costs; however, the sales related to these new programs generally are dependent upon the timing and success of the introduction of new vehicles by our customers. Our inability to effectively manage the timing, quality and costs of these new program launches could have a material adverse effect on our business, results of operations and financial condition.
Risks Related to Our Business
A prolonged recession and/or a downturn in our industry could adversely affect our business and require us to seek additional sources of financing to continue our operations, which may not be available to us or be available only on materially different terms than what has historically been available.
Our ability to generate cash from our operations is highly dependent on regional and global economic conditions, automotive sales and LVP. A prolonged downturn in or uncertainty relating to global or regional economic conditions, a downturn in the automotive industry or LVP are conditions that could adversely impact our business. Such adverse impacts could require us to shut down plants or result in impairment charges, restructuring actions or changes in our valuation allowances against deferred tax assets, which could be material to our financial condition and results of operations. If global economic conditions deteriorate or economic uncertainty increases, our customers and potential customers may experience deterioration of their businesses, which may result in the delay or cancellation of plans to purchase our products.
A prolonged downturn in global economic conditions or LVP would likely result in us experiencing a significantly negative cash flow. Similarly, if cash losses from customer defaults rise sharply, we would experience a negative cash flow. Such negative cash flow could result in our having insufficient funds to continue our operations unless we can procure external financing, which may not be possible. These risks could be exacerbated by instability in the global credit markets and global economic pressure. If external financing is unavailable to us when necessary, we may have insufficient funds to continue our operations.
We may not have sufficient resources to fund all future research and development and capital expenditures or possible acquisitions or joint ventures.
In order to remain competitive, we must make substantial investments in research and development of new or enhanced products. Our products may require significant resources to develop both hardware and software solutions. Challenges of integrating new functionality into vehicles and the evolution of our customers’ performance requirements during development may also increase research and development costs. Customer demands for changes to our products to meet such performance requirements are difficult to predict both in terms of timing and cost. Since our revenue is largely based on sales over time, new customer demands can delay payment for our products which can make it difficult for us to fund these critical up-front investments. We may be unable to fund all of our research and development and capital investment needs or possible acquisitions or joint ventures, and we may have to pass on valuable long-term opportunities that arise. Our ability to raise additional capital will depend on a variety of factors, some of which will not be within our control, including the existence of a public offering market, investor perceptions of us, our businesses and the industries in which we operate, and general economic conditions. Failure to successfully raise needed capital on a timely or cost-effective basis could have a material adverse effect on our business, results of operations and financial condition.
We may not be able to protect our proprietary technology and intellectual property rights, which could result in the loss of our rights or increased costs.
We have developed a considerable amount of proprietary technology related to our products and rely on a number of patents to protect our intellectual property rights in such technology. Our intellectual property plays an important role in maintaining our competitive position in a number of the markets we serve. In addition to our in-house research and development efforts, we have acquired and may continue to seek to acquire rights to new intellectual property through corporate acquisitions, asset acquisitions, licensing and joint venture arrangements. Developments or assertions by or against us relating to our intellectual property rights could negatively impact our business. If claims alleging patent, copyright or trademark infringement are brought against us and are successfully prosecuted against us, they could result in substantial costs.
If we are not able to protect our patents, trademarks, or other intellectual property rights, either owned or licensed by us, against infringement and unauthorized use, we could lose those rights and/or incur substantial costs policing and defending those rights. We also generate license revenue from our intellectual property, which we may lose if we do not adequately protect our intellectual property and proprietary rights. Our means of protecting our intellectual property may not be adequate, and our competitors may independently develop technologies that are similar or superior to our proprietary technologies, or design around the patents we own or license. In addition, the laws of some foreign countries do not protect our proprietary rights to as great an extent as the laws of the U.S. If we cannot protect our proprietary technology, we could experience a material adverse effect on our business, results of operations and financial condition.
In addition, certain of our products utilize components that are developed by third parties and licensed to us or our joint ventures. If claims alleging patent, copyright or trademark infringement are brought against such licensors and successfully prosecuted, they could result in substantial costs, and we may not be able to replace the functions provided by these licensors. Alternate sources for the technology currently licensed to us or our joint ventures may not be available in a timely manner, may not provide the same functions as currently provided or may be more expensive than products currently used. Additionally, there is a risk that any patents owned or licensed by us may be challenged, invalidated or circumvented, limiting competitive advantage of affected products or technologies.
Because we develop proprietary information through our in-house research and development efforts, consulting arrangements and research collaborations with other entities or organizations, there is also a risk that our attempts to protect this proprietary information by entering into confidentiality agreements, or consulting, services or employment agreements that contain non-disclosure and non-use provisions, with our employees, consultants, contractors, scientific advisors and third parties are unsuccessful. Even if agreements are entered into, these agreements may be breached or may otherwise fail to prevent disclosure, third-party infringement or misappropriation of our proprietary information, may be limited as to their term and may not provide an adequate remedy in the event of unauthorized disclosure or use of proprietary information. If we develop an increasing amount of our intellectual property through collaborations and development agreements, more of the technology we depend on could be subject to risks related to protecting these rights. Any of the risks related to the protection of our proprietary technology described above could have a material adverse effect on our business, results of operations and financial condition.
Some of our products and technologies may use “open source” software, which may restrict how we use or distribute our products or require that we release the source code of certain products subject to those licenses.
Some of our products and technologies may incorporate software licensed under so-called “open source” licenses. In addition to risks related to license requirements, usage of open source software can lead to greater risks than use of third-party commercial
software, as open source licensors generally do not provide warranties or controls on origin of the software. Additionally, open source licenses typically require that source code subject to the license be made available to the public and that any modifications or derivative works to open source software continue to be licensed under open source licenses. These open source licenses typically mandate that proprietary software, when combined in specific ways with open source software, become subject to the open source license. If we combine our proprietary software in such a way with open source software, we could be required to release the source code of our proprietary software. Few courts have interpreted open source licenses, and the manner in which these licenses may be interpreted and enforced is therefore subject to some uncertainty.
If these risks materialize, they could have a material adverse effect on our business, results of operations and financial condition.
The discontinuation, lack of commercial success, or loss of business with respect to a customer or particular vehicle model for which we are a significant supplier could reduce our sales and harm our profitability.
A number of our customer contracts require us to supply a customer’s annual requirements for a particular vehicle model and assembly facilities, rather than for manufacturing a specific quantity of products. Such contracts range from one year to the life of the model, which is generally four to seven years. These contracts are often subject to renegotiation, sometimes as frequent as on an annual basis, which may affect product pricing, and generally may be terminated by our customers at any time. The unpredictable nature of such customer contracts has made, and may continue to make, our sales variable. Furthermore, the discontinuation of, the loss of business with respect to, or a lack of commercial success of a customer or particular vehicle model or brand for which we are a significant supplier could reduce our sales and harm our profitability.
Scaling our business has become increasingly critical to our success as OEMs have adopted global vehicle platforms and sought to increase standardization, reduce per unit cost and increase capital efficiency. We are investing in technologies that are intended to become the architecture for other products. If we are not able to scale according to our current expected timelines and needs of our current and prospective customers, we will lose the trust of our customers and our customer relationships may suffer.
We may incur material losses and costs as a result of product liability, warranty and recall claims that may be brought against us or our customers.
We face risks related to product liability claims, warranty claims and recalls in the event that any of our products actually or allegedly are defective, fail to perform as expected or the use of our products results, or is alleged to result, in bodily injury and/or property damage. We may not be able to anticipate all of the possible performance or reliability problems that could arise with our products after they are released to the market. Additionally, increasing regulation and reporting requirements regarding potentially defective products, particularly in the U.S., may increase the possibility that we become involved in additional product liability or recall investigations or claims. There is a risk that our product liability and product recall insurance will not provide adequate coverage against potential claims, such insurance will not be available in the appropriate markets or that we will not be able to obtain such insurance on acceptable terms in the future. There is also a risk that Autoliv or one of our customers may be unable or unwilling to indemnify us for product liability, warranty or recall claims although they are contractually obligated to do so or we may be required to indemnify Autoliv or such customer for such claims, which may significantly increase our exposure and potential loss with respect to any such claims. There is a risk that our current and future investments in our engineering, design, and quality infrastructure will be insufficient and that our products could suffer from defects or other deficiencies or that we will experience material warranty claims or additional product recalls. In the future, we could experience additional material warranty or product liability losses and incur significant costs to process and defend these claims.
Escalating pricing pressures from our customers may adversely affect our business.
The automotive industry continues to experience increasingly aggressive pricing pressure from customers. This trend is partly attributable to the major automobile manufacturers’ strong purchasing power. As an automotive component manufacturer, we may be expected to quote fixed prices or be forced to accept prices with annual price reduction commitments for long-term sales arrangements or discounted reimbursements for engineering work. Price reductions may impact our sales and profit margins. Our future profitability will depend upon, among other things, our ability to continuously reduce our cost per unit and maintain our cost structure. Our profitability is also influenced by our success in designing and marketing technological improvements in automotive safety systems. If we are unable to offset continued price reductions, these price reductions could have a material adverse effect on our business, results of operations and financial condition.
We could experience disruption in our supply or delivery chain, which could cause one or more of our customers to halt or delay production.
We, as with other component manufactures in the automotive industry, ship our products to customer vehicle assembly facilities throughout the world on a “just-in-time” basis in order for our customers to maintain low inventory levels. Our suppliers (external
suppliers as well as our own production sites) use a similar method in providing raw materials to us. This “just-in-time” method makes the logistics supply chain in our industry very complex and vulnerable to disruptions. Disruptions in our supply chain, such as large recalls or field actions impacting our suppliers, facility closures, strikes, electrical outages, natural disasters or other logistical or mechanical failures, could inhibit our ability to timely deliver on orders. We may experience disruptions if there are delays in customs processing, including if we are unable to obtain government authorization to export or import certain materials. When we fail to timely deliver, we may have to absorb our own costs for identifying and resolving the ultimate problem as well as expeditiously producing and shipping replacement components or products. Generally, we must also carry the costs associated with “catching up,” such as overtime and premium freight.
Additionally, if we are the cause of a customer being forced to halt production, the customer may seek to recoup all of its losses and expenses from us. These losses and expenses could be very significant and may include consequential losses such as lost profits. Where a customer halts production because of another supplier failing to deliver on time, we may not be fully compensated, if at all. Thus, any such supply chain disruptions could severely impact our operations and/or those of our customers and force us to halt production for prolonged periods of time which could expose us to material claims for compensation and have a material adverse effect on our business, results of operations and financial condition.
We are subject to risks associated with the development and implementation of new manufacturing process technology.
We may not be successful or efficient in developing or implementing new production processes. We are continually engaged in the transition from our existing process to the next-generation process technology. This consistent innovation involves significant expense and carries inherent risks, including difficulties in designing and developing next-generation process technologies, development and production timing delays, lower than anticipated manufacturing yields, and product defects and errors. Production issues can lead to increased costs and may affect our ability to meet product demand, which could have a material adverse effect on our business, results of operations and financial condition.
Work stoppages or other labor issues at our customers’ facilities or at our facilities could adversely affect our operations.
Because the automotive industry relies heavily on “just-in-time” delivery of components during the assembly and manufacture of vehicles, a work stoppage at one or more of our facilities could have material adverse effects on our business. Similarly, if any of our customers were to experience a work stoppage, that customer may halt or limit the purchase of our products, or a work stoppage at another supplier could interrupt production at one of our customers’ facilities which would have the same effect. A work stoppage at one or more of our facilities or our customers’ facilities could cause us to shut down production facilities supplying these products, which could have a material adverse effect on our business, results of operations and financial condition.
Changes in the source, cost, availability of and regulations pertaining to raw materials and components may adversely affect our profit margins.
Our business uses a broad range of raw materials and components in the manufacture of our products, many of which are generally available from a number of qualified suppliers. Our industry may be affected from time to time by limited supplies or price fluctuations of certain key components and materials. Price fluctuations may intensify or occur with greater frequency as demand for our principal raw materials and components is significantly impacted by demand in emerging markets. Commercial negotiations with our customers and suppliers may not offset the adverse impact of higher raw material, energy and commodity costs. Even where we are able to pass price increases along to our customer, there may be a lapse of time before we are able to do so such that we must absorb the cost increase. Some of our suppliers may not be able to handle the volatility in commodity costs, which could cause them to experience supply disruptions resulting in delivery or production delays by our suppliers. Risks associated with the cost and availability of raw materials and components could have a material adverse effect on our business, results of operations and financial condition.
The SEC requires companies that manufacture products containing certain minerals and their derivatives that are, known as “conflict minerals,” originating from the Democratic Republic of Congo or adjoining countries to diligence and report the source of such materials. There are significant consequences associated with complying with these requirements, including diligence efforts to determine the sources of conflict minerals used in our products, changes to our processes or supplies as a result of such diligence and our ability to source “conflict free” materials. Accordingly, these rules could have a material adverse effect on our business, results of operations and financial condition.
Our business could be materially and adversely affected if we lost our largest customers or if they were unable to pay their invoices.
We are dependent on a few large customers with strong purchasing power. Business with any given customer is typically split into several contracts (either on the basis of one contract per vehicle model or on a broader platform basis). The loss of business from
any of our largest customers (whether by lower overall demand for vehicles, cancellation of existing contracts or the failure to award us new business) could have a material adverse effect on our business, results of operations and financial condition.
Customers may put us on a “new business hold,” which limits our ability to quote or be awarded all or part of their future vehicle contracts if quality or other issues arise in the vehicles for which we were a supplier. Such new business holds range in length and scope and are generally accompanied by a certain set of remedial conditions that must be met before we are eligible to bid for new business. Meeting any such conditions within the prescribed timeframe may require additional Company resources. A failure to satisfy any such conditions may have a materially adverse impact on our financial results in the long term. Additionally, we have no fixed volume commitments from our customers. Thus, even if we have won a bid for business from a customer there are no guaranteed purchase volumes.
There is a risk that one or more of our largest customers could be unable to pay our invoices as they become due or that a customer will simply refuse to make such payments, for reasons such as financial difficulties. If one of our largest customers would enter into bankruptcy proceedings or similar proceedings whereby contractual commitments are subject to stay of execution and the possibility of legal or other modification, or if one of our largest customers otherwise successfully procures protection against us legally enforcing its obligations, it is likely that we will be forced to record a substantial loss.
Changes in our product mix may impact our financial performance.
We sell products that have varying profit margins. Our financial performance can be impacted depending on the mix of products we sell during a given period. Our earnings guidance and estimates assume a certain geographic sales mix as well as a product sales mix. There is a risk that the mix of offerings by our customers and demand for such offerings could change. If actual results vary from this projected geographic and product mix of sales, it could have an unfavorable impact on our revenue and our results of operations and financial condition could be materially adversely affected.
We may be involved from time to time in legal proceedings and our business may suffer as a result of adverse outcomes of future legal proceedings.
We may be from time to time involved in litigation, regulatory proceedings and commercial or contractual disputes that may be significant. These matters may include, without limitation, disputes with our suppliers and customers, intellectual property claims, stockholder litigation, government investigations, class action lawsuits, personal injury claims, environmental issues, customs and value added tax (VAT) disputes and employment and tax issues. In such matters, government agencies or private parties may seek to recover from us very large, indeterminate amounts in penalties or monetary damages (including, in some cases, treble or punitive damages) or seek to limit our operations in some way. There is a risk that claims may be asserted against us and their magnitude may remain unknown for long periods of time. These types of lawsuits could require significant management time and attention, and a substantial legal liability or adverse regulatory outcome and the substantial expenses to defend the litigation or regulatory proceedings may have a material adverse effect on our customer relationships, business prospects, reputation, operating results, cash flows and financial condition. There is a risk that such proceedings and claims will have a material adverse impact on our profitability and consolidated financial position or that our established reserves or our available insurance will not be adequate to mitigate such impact.
We may have exposure to greater than anticipated tax liabilities.
The determination of our worldwide provision for income taxes and other tax liabilities requires estimation and significant judgment, and there are many transactions and calculations where the ultimate tax determination is uncertain. As a multinational corporation, we are subject to tax in multiple U.S. and foreign tax jurisdictions. Our determination of our tax liability is always subject to audit and review by applicable domestic and foreign tax authorities. Although we are currently under audit in a jurisdiction, we are indemnified by Autoliv, Inc. for any tax settlements for tax periods prior to April 1, 2018. Any adverse outcome of any such audit or review for tax periods after April 1, 2018 could have a negative effect on our business and the ultimate tax outcome may differ from the amounts recorded in our financial statements and may materially affect our financial results in the period or periods for which such determination is made. There is a risk that our established reserves, which are based on assumptions and estimates that we believe are reasonable to cover such eventualities, may prove to be insufficient. In addition, our future income taxes could be adversely affected by earnings being lower than anticipated (or by the incurrence of losses) in jurisdictions that have lower statutory tax rates and higher than anticipated in jurisdictions that have higher statutory tax rates, by changes in the valuation of our deferred tax assets and liabilities, or changes in tax laws, regulations, or accounting principles, as well as certain discrete items.
Our ability to operate our company effectively could be impaired if we fail to attract and retain executive officers and other key personnel.
We compete in a market that involves rapidly changing technological and other developments, which requires us to attract and employ a workforce with broad expertise and intellectual capital. Our ability to operate our business and implement our strategies effectively depends, in part, on the efforts of our executive officers and other key employees. In addition, our future success will depend on, among other factors, our ability to attract, develop and retain other qualified personnel, particularly engineers and other employees with software and technical expertise. The loss of the services of any of our senior executives or other key employees or the failure to attract or retain other qualified personnel could have a material adverse effect on our business.
Impairment charges relating to our assets, goodwill and other intangible assets could adversely affect our financial performance.
If one or more of our customers’ facilities cease production or decrease their production volumes, the assets we carry related to our facilities serving such customers may decrease in value because we may no longer be able to utilize or realize them as intended. Where such decreases are significant, such impairments may have a materially adverse impact on our financial results. Impairment of goodwill and other identifiable intangible assets may result from, among other things, deterioration in our performance and especially the cash flow performance of these goodwill assets, adverse market conditions and adverse changes in applicable laws or regulations. If there are changes in these circumstances or the other variables associated with the estimates, judgments and assumptions relating to the valuation of goodwill, when assessing the valuation of our goodwill items, we may determine that it is appropriate to write down a portion of our goodwill or intangible assets and record related non-cash impairment charges. In the event that we determine that we are required to write down a portion of our goodwill items and other intangible assets and thereby record related non-cash impairment charges, our business, results of operations and financial condition could be materially adversely affected.
For example, in the fourth quarter of 2017, the Company recognized an impairment charge of $234 million, pre-tax, which represented the full goodwill amount related to VNBS. The impairment loss was due to a lower than originally anticipated sales development in VNBS. For additional information, see “Management’s Discussion and Analysis of Financial Condition and Results of Operations.”
We face risks related to our defined benefit pension plans and employee benefit plans, including the need for additional funding as well as higher costs and liabilities.
Our defined benefit pension plans or employee benefit plans may require additional funding or give rise to higher related costs and liabilities which, in some circumstances, could reach material amounts and negatively affect our results of operations. We are required to make certain year-end assumptions regarding our pension plans. Our pension obligations are dependent on several factors, including factors outside our control such as changes in interest rates, the market performance of the diversified investments underlying the pension plans, actuarial data and adjustments and an increase in the minimum funding requirements or other regulatory changes governing the plans. Adverse equity market conditions and volatility in the credit market may have an unfavorable impact on the value of our pension assets and our future estimated pension liabilities. Internal factors such as an adjustment to the level of benefits provided under the plans may also lead to an increase in our pension liability. There are also uncertainties as the Company settles certain benefit plan relationships with Autoliv. If these or other internal and external risks were to occur, alone or in combination, our required contributions to the plans and the costs and net liabilities associated with the plans could increase substantially and have a material effect on our business.
Cybersecurity incidents could disrupt business operations, result in the loss of critical and confidential information, and adversely impact our reputation and results of operations.
We rely extensively on information technology (“IT”) networks and systems, our global data centers and services provided over the internet to process, transmit and store electronic information, and to manage or support a variety of business processes or activities across our facilities worldwide. The secure operation of our IT networks and systems and the proper processing and maintenance of this information are critical to our business operations. We have been, and likely will continue to be, subject to cyber-attacks. To date we have seen no material impact on our business from these attacks or events. Although we seek to deploy comprehensive security measures to prevent, detect, address and mitigate these threats, there has been an increased level of activity, and an associated level of sophistication, in cyber-attacks against large multinational companies. The ever-evolving threats mean we and our third-party service providers and vendors must continually evaluate and adapt our respective systems and processes and overall security environment, as well as those of any companies we acquire. There is no guarantee that these measures will be adequate to safeguard against all data security breaches, system compromises or misuses of data.
Our security measures may be breached due to human error, system malfunctions or attacks from uncoordinated individuals or sophisticated and targeted measures known as advanced persistent threats, directed at the Company, its products, its customers and/or its third-party service providers.
Disruptions and attacks on our IT systems or the systems of third parties storing our data could result in the misappropriation, loss or corruption of our critical data and confidential or proprietary information, personal information of our employees, and the leakage of our or our customers’ confidential information, improper use of our systems and networks, production downtimes and both internal and external supply shortages, which could have a material adverse effect on our business, results of operations and financial condition. The potential consequences of a material cybersecurity incident include reputational damage, litigation with third parties, diminution in the value of our investment in research, development and engineering, diversion of the attention of management away from the operation of our business and increased cybersecurity protection and remediation costs, which in turn could adversely affect our competitiveness and results of operations.
We rely on third parties to provide or maintain some of our IT systems, data centers and related services and do not exercise direct control over these systems. There is a risk that security measures implemented at our own and at third party locations may not be sufficient and that our IT systems, data centers and cloud services are vulnerable to disruptions, including those resulting from natural disasters, cyberattacks or failures in third party-provided services. While we obtain assurances that any third parties we provide data to will protect this information and, where we believe appropriate, monitor the protections employed by these third parties, there is a risk the confidentiality of data held by us or by third parties may be compromised and expose us to liability for such breach.
Cyberattacks have become increasingly frequent, sophisticated and globally widespread and could target software embedded in our products. Embedded software code could be compromised during software development or manufacturing processes or within the car itself. Cyberattacks on our products within the car can lead to malfunction or complete damage of the products, which could result into loss of control of the car and its safety features. To the extent that any disruption or security breach results in a misappropriation, loss or damage to our data, or an inappropriate disclosure of our confidential information or our customer’s information, it could cause significant damage to our reputation, affect our relationships with our customers, lead to claims against us and ultimately harm our business. In addition, we may be required to incur significant costs to protect against damage caused by these disruptions or security breaches in the future. In addition, as the regulatory environment related to information security, data collection and use, and privacy becomes increasingly rigorous, with new and constantly changing requirements applicable to our business, compliance with those requirements could result in additional costs. Any future significant compromise or breach of our data security, whether external or internal, or misuse of customer, associate, supplier or Company data, could result in significant costs, lost sales, fines, lawsuits, and damage to our reputation.
Our business is exposed to risks inherent in international operations.
We currently conduct operations in various countries and jurisdictions, including locating certain of our manufacturing and distribution facilities internationally, which subjects us to the legal, political, regulatory and social requirements and economic conditions in these jurisdictions. International sales and operations subject us to certain risks inherent in doing business abroad, including exposure to local economic and political conditions, foreign tax consequences, issues with enforcing legal agreements, currency controls, imposition of tariffs, and preferences of foreign nations for domestically manufactured products. These risks could have a material adverse effect on our business, results of operation and financial condition.
The 2017 Tax Cuts and Jobs Act (the “Tax Act”) significantly changed the taxation of U.S. based multinational corporations, including, inter alia, reducing the U.S. federal corporate income tax rate from 35% to 21%, creating new taxes on certain foreign sourced earnings and a new minimum tax calculated on certain U.S. outbound payments. We have completed our accounting for the impact of the Tax Act as of December 22, 2018 based on published guidance. We expect that the U.S. Treasury Department, the Internal Revenue Service (“IRS”), and state tax authorities will be issuing additional guidance on how the provisions of the Tax Act will be applied or otherwise administered, and such guidance may be different from our current interpretation. The legislation could be subject to potential amendments and technical corrections, any of which could materially lessen or increase certain adverse impacts of the legislation. As regulations and guidance evolve with respect to the Tax Act, and as we gather information and perform more analysis, our results may differ from previous estimates and may materially affect our financial position. Changes in tax laws or policies by foreign jurisdictions could result in a higher effective tax rate on our worldwide earnings and such change could have a material adverse effect on our business, results of operations and financial condition.
In addition, the current U.S. administration has created uncertainty about the future relationship between the U.S. and certain of its trading partners, including with respect to the trade policies, treaties, government regulations and tariffs that could apply to trade between the U.S. and other nations, including changes to the North American Free Trade Agreement, including the United States-Mexico-Canada Agreement (the “USMCA”) or otherwise and other international trade agreements. During 2018, the U.S. administration announced tariffs on certain products imported into the U.S., which has resulted in reciprocal tariffs from other
countries, including countries where we operate. The tariffs implemented on our products (or on materials, parts or components we use to manufacture our products) by the U.S. will increase the cost of our products manufactured and imported into the U.S. Tariffs and other trade restrictions announced by other countries on products manufactured in the U.S. could likewise increase the costs of those products when imported into other countries. If additional tariffs are implemented on our products (or on materials, parts or components we use to manufacture our products) by the U.S. or other countries, the cost of our products could increase further. Additional tariffs, changes in international trade relations or continued uncertainty could depress economic activity and restrict our access to suppliers or customers and could have a material adverse effect on our business, results of operations and financial condition.
Our business in China is subject to aggressive competition and is sensitive to economic and market conditions as well as restrictions placed on foreign automakers.
We operate in the highly competitive automotive supply market in China and face competition from both international and smaller domestic manufacturers. Maintaining a strong position in the Chinese market is a key component of our global growth strategy. Our business is sensitive to economic and market conditions that impact automotive sales volumes and growth in China and may be affected if the pace of growth slows as the Chinese market matures or if there are reductions in vehicle demand in China. We anticipate that additional competitors, both international and domestic, may seek to enter the Chinese market resulting in increased competition. Increased competition may result in price reductions, reduced margins and our inability to gain or hold market share. There have been periods of increased market volatility and moderation in the levels of economic growth in China, which resulted in periods of lower automotive production growth rates in China than those previously experienced. Furthermore, the Chinese government has inflated demand for domestic production of electric cars by offering purchase incentives for electric cars and has restricted foreign automakers from digital mapping within its borders impacting many of our customers’ ability to manufacture self-driving vehicles within China. Many of our customers are not domestic Chinese companies. If our non-Chinese customers are prevented or deterred from doing business in China, it could impair our position in the Chinese market. If we are unable to maintain our position in the Chinese market, the pace of growth slows or vehicle sales in China decrease, our business, results of operations and financial condition could be materially adversely affected.
We are exposed to exchange rate risks.
We have currency exposures related to buying, selling and financing in currencies other than the local currencies of the countries in which we operate. We are particularly vulnerable to a strong U.S. dollar as certain raw materials and components are sourced in U.S. dollars while sales are also currently in other currencies, like the Euro. Our risks include:
transaction exposure, which arises because the cost of a product originates in one currency and the product is sold in another currency;
revaluation effects, which arise from valuation of assets denominated in other currencies than the reporting currency of each unit;
translation exposure in the income statement, which arises when the income statements of non-U.S. subsidiaries are translated into U.S. dollars;
translation exposure in the balance sheet, which arises when the balance sheets of non-U.S. subsidiaries are translated into U.S. dollars; and
changes in the reported U.S. dollar amounts of cash flows.
For example, in 2018 the Company’s gross transaction exposure was approximately $0.7 billion, with a net exposure of $0.6 billion due to counter-flows. The five largest net transaction exposures were the sale of Euro against Swedish Krona, the purchase of U.S. Dollars against Swedish Krona, the purchase of U.S. Dollar against Korean Won, the sale of U.S. Dollars against Chinese Renminbi and the purchase of U.S. Dollar against Euro. Together these currency pairs accounted for approximately 76% of the Company’s net currency transaction exposure. These exchange rate risks could have a material adverse effect on our business, results of operations and financial condition.
We face risks in connection with identifying, completing and integrating acquisitions.
Our business’s growth has been enhanced through strategic opportunities, including acquisitions of businesses, products and technologies, and joint development agreements. We may continue to identify and engage in strategic opportunities in the future. However, we may not be able to successfully identify suitable acquisition candidates or complete transactions on acceptable terms, integrate acquired operations into our existing operations or expand into new markets. Our failure to identify suitable strategic opportunities may restrict our ability to grow our business. These strategic opportunities also involve numerous additional risks to us and our investors, including risks related to retaining acquired management and employees, difficulties in integrating the acquired technology, products, operations and personnel with our existing business, assumption of contingent liabilities, and potentially adverse financial impact of acquisitions. Consequently, there is a risk that the acquisitions and other transactions may
not result in revenue growth, operational synergies or service or technology enhancements, which could have a material adverse effect on our business, results of operations and financial condition.
Risks associated with joint venture partnerships and other collaborations may adversely affect our business and financial results.
Certain of our operations are currently conducted through joint ventures and joint development agreements, and we may enter into additional joint ventures and collaborations in the future. Our joint ventures and collaborations are generally focused on opening or expanding opportunities for our technologies and supporting the design and introduction of new products and services (or enhancing existing products or services). Such activities entail a high degree of risk and often require significant capital investments. We may underestimate the costs and/or overestimate the benefits, including technology, product, revenue, cost and other synergies and growth opportunities, that we expect to realize, and we may not achieve those benefits, or may do so later than expected. The market and customer demand for products and technologies provided by our joint ventures may also shift. For example, we have begun to see a shift in our customer’s focus to products and systems supporting “Level 2 plus driver assistance” technologies over systems supporting fully autonomous driving as it appears that fully autonomous vehicles will come to market in significant numbers later than previously expected. This means that some of the expected sales from technologies provided by our Zenuity joint venture may come later than previously expected. As a result, we may have to evaluate our strategic and business plans for, as well as the ongoing funding needs of, Zenuity to account for such delays.
Furthermore, our joint venture partners may be unable or unwilling to meet their economic or other contractual obligations, and we may in some cases and/or for some time choose to fulfill those obligations alone to ensure the ongoing success of a joint venture, or we may choose to dissolve and liquidate it. For example, since we acquired a 51% interest in VNBS, we have unilaterally provided the funds necessary to meet VNBS’s operational needs as Nissin Kogyo has, notwithstanding repeated requests, refused to provide funding in proportion to its ownership. In 2019, the Company initiated a formal negotiation process under the VNBS JV Agreement to find a resolution to this situation.
In addition, our joint venture and collaboration partners may at any time have economic, business or legal interests or goals that are inconsistent with our goals or with the goals of the joint venture. Our products and technologies may from time to time overlap with certain aspects of the technologies developed with one of our joint venture or collaboration partners which may cause the parties to consider the impact on the contractual relationship. Depending on our level of control over the governance and/or operations of a joint venture or collaboration, we may be unable to implement actions with respect to the joint venture’s activities that we believe are favorable if the joint venture partner does not agree. Disagreements with our business partners may impede our ability to maximize the benefits of our partnerships. We may have difficulty resolving disputes with or claims against our joint venture partners, which could lead to us bearing liability for claims that we are not responsible for and may have a material adverse impact on the joint venture.
The above risks, if realized, could have a material adverse effect on our business, results of operations and financial condition.
We may not be able to respond quickly enough to changes in technology and technological risks and to develop our intellectual property into commercially viable products.
Changes in legislative, regulatory or industry requirements or in competitive technologies may render certain of our products obsolete or less attractive to our customers. We currently license certain proprietary technology to third parties and, if such technology becomes obsolete or less attractive, those licensees could terminate our license agreements, which could adversely affect our results of operations. Our ability to anticipate changes in technology and regulatory standards and to successfully develop and introduce new and enhanced products on a timely basis will be a significant factor in our ability to be competitive. There is a risk that we will not be able to achieve the technological advances that may be necessary for us to be competitive or that certain of our products will become obsolete. We are also subject to the risks generally associated with new product introductions and applications, including lack of market acceptance, delays in product development and failure of products to operate properly. As part of our business strategy, we may from time to time seek to acquire businesses or assets that provide us with additional intellectual property. We may experience problems integrating acquired technologies into our existing technologies and products, and such acquired intellectual property may be subject to known or contingent liabilities such as infringement claims. These risks could have a material adverse effect on our business, results of operations and financial condition.
Our business may be adversely affected by laws or regulations, including international, environmental, occupational health and safety or other governmental regulations.
We are subject to various federal, state, local and foreign laws and regulations, including those related to the requirements of environmental, occupational health and safety, financial and other matters. We cannot predict the substance or impact of pending or future legislation or regulations, or the application thereof. The introduction of new laws or regulations or changes in existing
laws or regulations, or the interpretations thereof, could increase the costs of doing business for us or our customers or suppliers or restrict our actions and adversely affect our operating results, cash flows and financial condition. Our operations are subject to environmental and safety laws and regulations governing, among other things, emissions to air, discharges to waters and the generation, handling, storage, transportation, treatment and disposal of waste and other materials. The operation of automotive parts manufacturing facilities entails risks in these areas, and there is a risk that we will incur material costs or liabilities as a result. Additionally, environmental laws, regulations, and permits and the enforcement thereof change frequently and have tended to become increasingly stringent over time, which may necessitate substantial capital expenditures or operating costs or may require changes of production processes.
Due to our global operations, we are also subject to many laws governing our activities in other countries (including, but not limited to, the Foreign Corrupt Practices Act, and other anti-bribery regulations in foreign jurisdictions where we do business, and the U.S. Export Administration Act), which prohibit improper payments to government officials and restrict where and how we can do business, what information or products we can supply to certain countries and what information we can provide to authorities in governmental authorities.
There is a risk that our policies and procedures will not protect us from the reckless acts of our employees or representatives, particularly in the case of recently acquired operations that may not have significant training in applicable compliance policies and procedures. Any costs, liabilities, and obligations that we incur relating to such regulations could have a material adverse effect on our business, results of operations and financial condition.
The United Kingdom’s (“U.K.”) referendum to exit from the European Union (“E.U.”) will continue to have uncertain effects and could have an adverse effect on our business and financial results.
On June 23, 2016, the UK held a referendum in which voters approved an exit from the EU (commonly referred to as “Brexit”). Current uncertainty over whether the UK will ultimately leave the EU, as well as the final outcome of the negotiations between the UK and the EU, could have an adverse effect on our business and financial results. The long-term effects of Brexit may include, among other things, greater restrictions on imports and exports between the UK and EU countries, a fluctuation in currency exchange rates and additional regulatory complexity. Such changes could be costly and potentially disruptive to our operations and business relationships in these markets. If we are unable to manage any of these risks effectively, our business could be adversely affected. Our operations in the UK represented an immaterial part of our business as of December 31, 2018.
Our business may be adversely affected by changes in automotive safety regulations or concerns that drive further regulation of the automobile safety and autonomous driving markets.
Government vehicle safety regulations are a key driver in our business. Historically, these regulations have imposed ever more stringent safety regulations for vehicles. Safety regulations have a positive impact on driver awareness and acceptance of active safety products and technology. These more stringent safety regulations often require vehicles to have more safety content per vehicle and more advanced safety products, including active safety technology, which has thus been a driver of growth in our business.
These regulations are subject to change based on a number of factors that are not within our control, including new scientific or medical data, adverse publicity regarding autonomous vehicles or technology, domestic and foreign political developments or considerations, and litigation relating to our products and our competitors’ products. Changes in government regulations in response to these and other considerations could have a severe impact on our business. If government priorities shift and we are unable to adapt to changing regulations, our business may suffer material adverse effects.
The regulatory obligation of complying with safety regulations could increase as federal and local regulators impose more stringent compliance and reporting requirements in response to product recalls, safety issues and product innovations in our industry. In the U.S., we are subject to the existing Transportation Recall Enhancement, Accountability and Documentation (TREAD) Act, which requires manufacturers to comply with “Early Warning” requirements by reporting to the National Highway Traffic Safety Administration (“NHTSA”) information related to defects or reports of injury related to their products. TREAD imposes criminal liability for violating such requirements if a defect subsequently causes death or bodily injury. In addition, the National Traffic and Motor Vehicle Safety Act authorizes NHTSA to require a manufacturer to recall and repair vehicles that contain safety defects or fail to comply with federal motor vehicle safety standards. The U.S. Department of Transportation issued regulations in 2016 that require manufacturers of certain autonomous vehicles to provide documentation covering specific topics to regulators, such as how automated systems detect objects on the road, how information is displayed to drivers, what cybersecurity measures are in place and the methods used to test the design and validation of autonomous driving systems.
As our technologies advance and develop beyond traditional automotive products, we may be subject to regulatory regimes beyond traditional vehicle safety rules and requirements. As a result, we may not identify all regulatory licenses or permits required for
our products, or our products may operate beyond the scope of the licenses and permits we have obtained. Failing to obtain the required licenses, permits or other regulatory authorizations could result in investigations, fines or other penalties or proceedings. If any of the regulatory risks described above materialize, it could have a material adverse effect on our business, results of operations and financial condition.
Risks Related to the Spin-Off and Our Operation as a Stand-Alone Company
We have a limited history of operating as an independent, stand-alone company, and our historical financial information does not predict our future results.
Our historical financial information in this Annual Report on Form 10-K up to Spin-Off refers to our business as operated by and integrated with Autoliv. Our historical financial information included in this Annual Report on Form 10-Kprior to the completion of the Spin-Off is derived from the consolidated financial statements and accounting records of Autoliv. Accordingly, the historical financial information included in this Annual Report on Form 10-K prior to the completion of the Spin-Off does not necessarily reflect the financial condition, results of operations or cash flows that we would have achieved as a separate, publicly traded company during the periods presented or those that we will achieve in the future primarily as a result of the factors described below.
Prior to the Spin-Off, our business was operated by Autoliv as part of its broader corporate organization, rather than as an independent company. Autoliv or one of its affiliates performed various corporate functions for us, such as legal, accounting, treasury, internal auditing, and human resources and also provided our IT and other corporate infrastructure. Our historical financial results reflect allocations of corporate expenses from Autoliv for such functions and are likely to be less than the expenses we would have incurred had we operated as a separate publicly traded company. As a result of the Spin-Off, we are responsible for the costs related to such functions previously performed by Autoliv, and such costs have increased. Autoliv is providing some of these functions to us pursuant to a transition services agreement. See “Spin-Off Related Agreements-Amended and Restated Transition Services Agreement.” We will need to make investments to replicate or outsource from other providers certain facilities, systems, infrastructure, and personnel to which we no longer have access as a result of the Spin-Off. These initiatives to develop our independent ability to operate without access to Autoliv’s existing operational and administrative infrastructure will have a cost to implement. We may not be able to operate our business efficiently or at comparable costs, and our profitability may decline. Additionally, prior to the Spin-Off, we shared economies of scale in costs, employees, vendor relationships and customer relationships with Autoliv. Although we have entered into a transition services agreement with Autoliv for certain services, these arrangements may not fully capture the benefits that we have enjoyed as a result of being integrated with Autoliv and may result in us paying higher amounts than in the past for certain products and services. This could have an adverse effect on our results of operations and financial condition as separate, publicly traded company.
Other significant changes may occur in our cost structure, management, financing and business operations, as compared to the past financial performance of our business, as a result of operating as a company separate from Autoliv. These risks could, individually or in the aggregate, have a material adverse effect on our business, results of operations and financial condition.
Our ability to meet our capital needs have materially changed by the loss of financial support from Autoliv and it may be more difficult for us to obtain capital to fund our business.
The loss of financial support from Autoliv has changed our previous source of capital Autoliv previously provided certain capital that was needed in excess of the amounts generated by our operating activities. We currently expect to obtain any funds needed in excess of the amounts contributed by Autoliv in the Spin-Off and generated by our operating activities through the capital markets, bank financing, strategic relationships or other arrangements, and not from Autoliv. However, given the smaller relative size of our company, as compared to Autoliv after the Spin-Off, we may incur higher debt servicing and other costs relating to new indebtedness than we would have otherwise incurred as a part of Autoliv. As a stand-alone company, the cost of our financing also will depend on other factors such as our performance and financial market conditions generally. Further, we cannot guarantee you that we will be able to obtain capital market financing or credit on favorable terms, or at all, in the future. We cannot assure you that our ability to meet our capital needs will not be harmed by the loss of financial support from Autoliv.
We may be unable to achieve some or all of the benefits that we expect to achieve from the Spin-Off.
We and Autoliv believe that the tax-free Spin-Off will enhance our long-term value. However, by separating from Autoliv, we may be more susceptible to market fluctuations and other adverse events than we would have been were we still a part of Autoliv. In addition, we may not be able to achieve some or all of the benefits that we expect to achieve as an independent company in the time we expect, if at all.
We may be responsible for U.S. federal income tax liabilities that relate to the distribution.
Autoliv received an opinion from its outside tax counsel to the effect that the distribution of our common stock, together with certain related transactions, should qualify as a transaction that is tax-free under Sections 368(a)(1)(D) and 355 of the Code. The opinion was based on and relied on, among other things, certain facts and assumptions, as well as certain representations, statements and undertakings of Autoliv and the Company, including those relating to the past and future conduct of Autoliv and the Company. If any of these representations, statements or undertakings are, or become, inaccurate or incomplete, or if Autoliv or the Company breach any of their respective covenants in the Spin-Off documents, the opinion of counsel may be invalid and the conclusions reached therein could be jeopardized. Notwithstanding the opinion of counsel, the IRS could determine that the distribution, together with certain related transactions, should be treated as a taxable transaction if the IRS determines that any of these representations, assumptions, or undertakings upon which such opinion was based are incorrect or have been violated or if the IRS disagrees with the conclusions in the opinion of counsel. An opinion of counsel is not binding on the IRS or any court and there is a risk that the IRS not challenge the conclusions reached in the opinion. The IRS did not provide any opinion in advance of the Spin-Off that the Spin-Off will be tax-free.
If the distribution, together with certain related transactions, failed to qualify as a transaction that is generally tax-free under Sections 368(a)(1)(D) and 355 of the Code, Autoliv would recognize taxable gain as if it had sold our common stock in a taxable sale for its fair market value, Autoliv stockholders who received our common stock in the distribution would be subject to tax as if they had received a taxable distribution equal to the fair market value of such shares, and we could incur significant liabilities. In addition, if the Spin-Off is not tax-free, Veoneer would be responsible for tax liabilities as allocated by the Tax Matters Agreement.
Even if the Spin-Off otherwise qualifies as a tax-free transaction for U.S. federal income tax purposes, the distribution will be taxable to Autoliv if there are (or have been) one or more acquisitions (including issuances) of our stock or the stock of Autoliv, representing 50% or more, measured by vote or value, of the stock of any such corporation and the acquisition or acquisitions are deemed to be part of a plan or series of related transactions that include the distribution. Any acquisition of our common stock within two years before or after the distribution (with exceptions, including public trading by less-than-5% stockholders and certain compensatory stock issuances) generally will be presumed to be part of such a plan unless that presumption is rebutted. The resulting tax liability would be substantial, and under U.S. Treasury regulations, each member of the Autoliv group at the time of the Spin-Off (including us and our subsidiaries) would be severally liable for the resulting U.S. federal income tax liability.
Pursuant to the Tax Matters Agreement, we agreed not to enter into certain transactions that could cause any portion of the Spin-Off to be taxable to Autoliv, including under Section 355(e) of the Code. We also agreed to indemnify Autoliv for any tax liabilities resulting from such transactions or other actions we take, and Autoliv agreed to indemnify us for any tax liabilities resulting from transactions entered into by Autoliv. These obligations may discourage, delay or prevent a change of control of our company, which could have a materially adverse effect on our business. For additional details, see “Spin-Off Related Agreements, Tax Matters Agreement.”
Our internal controls around accounting and financial reporting may not be adequate to ensure complete and accurate reporting of our financial position, results of operations and cash flows.
The Exchange Act requires that we file annual, quarterly and current reports with respect to its business and financial condition. Under the Sarbanes Oxley Act, we are required to maintain effective disclosure controls and procedures and internal controls over financial reporting. Any failure to achieve and maintain effective internal controls could have a material adverse effect on our business, results of operations and financial condition.
We could incur substantial additional costs and experience temporary business interruptions as we install and implement our information technology infrastructure and transition our data to our own systems.
We have begun to install and implement information technology infrastructure to support certain of our business functions, including accounting and reporting, manufacturing process control and distribution. We may incur temporary interruptions in business operations if we cannot fully transition effectively from Autoliv’s existing transactional and operational systems, data centers and the transition services that support these functions. We may not be successful in implementing our new systems and transitioning our data, and we may incur substantially higher costs for implementation than currently anticipated. Our failure to avoid operational interruptions as we implement the new systems and replaces Autoliv’s information technology services, or our failure to implement the new systems and replace Autoliv’s services successfully, and any substantially higher costs could disrupt our business and have a material adverse effect on our business, results of operations and financial condition and. In addition, if we are unable to replicate or transition certain systems, our ability to comply with regulatory requirements could be impaired.
Autoliv may fail to perform under various agreements that were executed in connection with the Spin-Off and we may have greater costs or potential liability pursuant to such agreements.
In connection with the internal reorganization and Spin-Off, we and Autoliv entered into a Master Transfer Agreement, Distribution Agreement and various other agreements, including the Transition Services Agreement, Tax Matters Agreement and an Employee Matters Agreement. Certain of these agreements provide for the performance of services by each company for the benefit of the other following the Spin-Off. We are relying on Autoliv to satisfy its performance and payment obligations under these agreements. If Autoliv is unable to satisfy its obligations under these agreements, including its indemnification obligations, we could incur operational difficulties or losses.
Furthermore, these agreements may not reflect terms that would have resulted from arm’s-length negotiations among unaffiliated third parties. To the extent that certain terms of those agreements provide for rights and obligations that could have been procured from third parties, we may have received better terms from third parties. There is a risk that we may incur greater costs or be subject to greater potential liability pursuant to our agreements with Autoliv for certain rights and obligations that could have been procured from unaffiliated third parties. See “Spin-Off Related Agreements.”
Currently, we rely on Autoliv to provide certain corporate and administrative services such as certain information technology, financial and human resource services. We are in the process of creating our own, or engaging third parties to provide, systems and services to replace many of the systems and services Autoliv currently provides to us pursuant to the Transition Services Agreement. If Autoliv is unable or unwilling to provide such services pursuant to the Transition Services Agreement, or if the agreement is terminated prior to the end of its term, we may be unable to provide such services ourselves or we may have to incur additional expenditures to obtain such services from another provider.
Potential indemnification liabilities to Autoliv or a refusal of Autoliv to indemnify us pursuant to the Distribution Agreement could materially adversely affect us.
The transaction documents we entered into with Autoliv in connection with the internal reorganization and the Spin-Off provide for cross-indemnities that require Autoliv and Veoneer to bear financial responsibility for each company’s business prior to the internal reorganization or Spin-Off, as applicable, and to indemnify the other party in connection with a breach of such party of the transaction agreements; provided, however, certain warranty, recall and product liabilities for electronics products manufactured prior to the completion of the internal reorganization have been retained by Autoliv and Autoliv will indemnify us for any losses associated with such warranty, recall or product liabilities pursuant to the distribution agreement entered into as part of the Spin-Off. If we are required to indemnify Autoliv under the circumstances set forth in the transaction documents, we may be subject to substantial liabilities. In addition, there can be no assurance that the indemnities from Autoliv will be sufficient to protect us against the full amount of any potential liabilities. Even if we do succeed in recovering from Autoliv any amounts for which we are held liable, we may be temporarily required to bear these losses ourselves. In addition, each of these risks could have a material adverse effect on our business, results of operations and financial condition.
We may be unable to take certain actions because such actions could jeopardize the tax-free status of the Spin-Off, and such restrictions could be significant.
To preserve the tax-free treatment of the Spin-Off, for the initial two-year period following the Spin-Off, we are prohibited, except in limited circumstances, from taking or failing to take certain actions that would prevent the Spin-Off and related transactions from being tax-free, including: (1) entering into any transaction pursuant to which our stock would be acquired, whether by merger or otherwise; (2) issuing any equity securities or securities that could possibly be converted into our equity securities; (3) selling or otherwise disposing of substantially all of our assets; or (4) repurchasing our equity securities. These restrictions may limit our ability to issue equity and to pursue strategic transactions or engage in new business or other transactions that may maximize the value of our business. In addition, if we take, or fail to take, actions that prevent the Spin-Off and related transactions from being tax-free, we could be liable for the adverse tax consequences resulting from such actions. See “Spin-Off Related Agreements, Tax Matters Agreement.”
The Spin-Off and related transactions may expose us to potential liabilities arising out of state and federal fraudulent conveyance laws and legal distribution requirements.
The Spin-Off could be challenged under various state and federal fraudulent conveyance laws. An unpaid creditor or an entity vested with the power of such creditor (such as a trustee or debtor-in-possession in a bankruptcy) could claim that Autoliv did not receive fair consideration or reasonably equivalent value in the Spin-Off, and that the Spin-Off left Autoliv insolvent or with unreasonably small capital or that Autoliv intended or believed it would incur debts beyond its ability to pay such debts as they mature. If a court were to agree with such a plaintiff, then such court could void the Spin-Off as a fraudulent transfer and could impose a number of different remedies, including without limitation, returning our assets or your shares in our company to Autoliv
or providing Autoliv with a claim for money damages against us in an amount equal to the difference between the consideration received by Autoliv and the fair market value of our company at the time of the Spin-Off. No assurance can be given as to what standard a court would apply to determine insolvency or that a court would determine that Autoliv was solvent at the time of or after giving effect to the Spin-Off, including the distribution of our common stock.
Certain of our officers and directors may have actual or potential conflicts of interest because of their service as executive officers or directors of Autoliv.
Certain of our directors and officers own Autoliv common stock and equity awards. Even though our board of directors consists of a majority of directors who are independent, several of our directors continue to have a financial interest in Autoliv common stock and equity awards. Continuing ownership of Autoliv common stock and equity awards, or service as a director at both companies could create, or appear to create, potential conflicts of interest for our directors and officers with prior or continuing positions with Autoliv if we have disagreements with Autoliv about the agreements between us that continue or face decisions that could have different implications for us and Autoliv.
Risks Related to Investing in Our Securities
Our board of directors may change significant corporate policies without stockholder approval.
Our financing, borrowing and dividend policies and our policies with respect to all other activities, including growth, debt, capitalization and operations, are determined by our board of directors. These policies may be amended or revised at any time and from time to time at the discretion of our board of directors without a vote of our stockholders. In addition, our board of directors may change our policies with respect to conflicts of interest provided that such changes are consistent with applicable legal requirements. A change in these policies could have a material adverse effect on our business, results of operations, financial condition, the per share trading price of our common stock and our ability to satisfy our debt service obligations and to pay dividends to our stockholders.
Anti-takeover provisions in our organizational documents and Delaware law might discourage or delay acquisition attempts for us that you might consider favorable.
Our certificate of incorporation and bylaws contain provisions that may make the merger or acquisition of the Company more difficult without the approval of our board of directors. Among other things:
although we do not have a stockholder rights plan, our certificate of incorporation allows us to authorize the issuance of undesignated preferred stock in connection with a stockholder rights plan or otherwise, the terms of which may be established and the shares of which may be issued without stockholder approval, and which may include super voting, special approval, dividend, or other rights or preferences superior to the rights of the holders of common stock;
we have a classified board of directors, and any director may be removed only for cause and only by the affirmative vote of at least 75% of the voting power of all the then-outstanding shares of voting stock;
our board of directors is expressly authorized to make, alter or repeal our bylaws and our stockholders may only amend our bylaws by the affirmative vote of at least 80% of the voting power of all the then-outstanding shares of voting stock;
our certificate of incorporation and bylaws permits only our board of directors to call special meetings of stockholders;
our certificate of incorporation and bylaws do not permit stockholder action by written consent; and
our bylaws establish advance notice requirements for nominations for elections to our board of directors or for proposing matters that can be acted upon by stockholders at stockholder meetings.
Further, as a Delaware corporation, we are subject to provisions of Delaware law, which may impair a takeover attempt that our stockholders may find beneficial. These anti-takeover provisions and other provisions under Delaware law could discourage, delay or prevent a transaction involving a change in control of the Company, including actions that our stockholders may deem advantageous, or negatively affect the trading price of our common stock. These provisions could also discourage proxy contests and make it more difficult for you and other stockholders to elect directors of your choosing and to cause us to take other corporate actions you desire.
Our certificate of incorporation designates the Court of Chancery of the State of Delaware as the sole and exclusive forum for certain litigation that may be initiated by our stockholders, which could limit our stockholders’ ability to obtain a favorable judicial forum for disputes with us or our current or former directors, officers or stockholders.
Our certificate of incorporation provides that, unless we consent to the selection of an alternative forum, the Court of Chancery of the State of Delaware will be the sole and exclusive forum for (i) any derivative action or proceeding brought on our behalf, (ii) any action asserting a claim of breach of a fiduciary duty owed by any of our stockholders, directors, officers or other employees
to us or to our stockholders, (iii) any action asserting a claim arising out of or pursuant to the Delaware General Corporation Law, (iv) the certificate of incorporation or amended and bylaws, or (v) any action asserting a claim government by the internal affairs doctrine. At our 2019 annual meeting of stockholders, we intend to ask our stockholders to vote on whether to keep this provision in our certificate of incorporation. This choice of forum provision may only be amended by the affirmative vote of at least 80% of the voting power of all the outstanding shares of common stock entitled to vote, which may have the effect of making this provision difficult to repeal by our stockholders. Any person or entity purchasing or otherwise holding any interest in shares of our capital stock will be deemed to have notice of, and consented to, the provision in our restated certificate of incorporation related to choice of forum. This provision may have the effect of discouraging lawsuits against our directors, officers or employees by limiting our stockholders’ ability to bring a claim in a judicial forum that they find favorable for disputes.
The market price and trading volume of our common stock may fluctuate widely.
The market price of our common stock may fluctuate significantly, depending upon many factors, some of which may be beyond our control, including, but not limited to:
a shift in our investor base;
our quarterly or annual earnings, or those of comparable companies;
actual or anticipated fluctuations in our operating results;
our ability to obtain financing as needed;
changes in laws and regulations affecting our business;
changes in accounting standards, policies, guidance, interpretations or principles;
announcements by us or our competitors of significant investments, acquisitions or dispositions;
the failure of securities analysts to cover our common stock;
changes in earnings estimates by securities analysts or our ability to meet those estimates;
the operating performance and stock price of comparable companies;
overall market fluctuations;
a decline in the automotive market; and
general economic conditions and other external factors.
Future issuances of common stock by us may cause the market price of our common stock to decline.
Sales of a substantial number of shares of our common stock in the public market, or the perception that these sales could occur, could substantially decrease the market price of our common stock.
In connection with the Spin-Off, we adopted an equity incentive plan in which our employees, non-employee directors and other service providers may participate, under which an aggregate of 3,000,000 shares of our common stock are available for future issuance, plus a number of shares to satisfy equity-based awards that were issued to holders of certain equity awards outstanding under Autoliv’s Amended and Restated Stock Incentive Plan at the time of the Spin-Off . We filed a registration statement on Form S-8 under the Securities Act to register shares of our common stock or securities convertible into or exchangeable for shares of our common stock issued pursuant to our equity incentive plan. Accordingly, shares registered under such registration statement are available for sale in the open market.
Your ownership in our stock may be diluted by additional equity issuances.
Your percentage ownership in our common stock could be diluted in the future as a result of equity issuances for acquisitions, capital market transactions or otherwise, including any equity awards that we grant to our directors, officers and employees. Such awards could have a dilutive effect on our earnings per share, which could adversely affect the market price of our common stock. In addition, our certificate of incorporation authorizes us to issue, without the approval of our stockholders, one or more classes or series of preferred shares having such designation, powers, preferences and relative, participating, optional and other special rights as our board of directors generally may determine. The terms of one or more classes or series of preferred shares could dilute the voting power or reduce the value of our common stock.
We have no current plans to pay cash dividends on our common stock, and certain factors could limit our ability to pay dividends in the future.
The declaration, amount and payment of any future dividends on shares of common stock will be at the absolute and sole discretion of our board of directors. Our board of directors may take into account general and economic conditions, our financial condition and results of operations, our available cash and current and anticipated cash needs, capital requirements, contractual, legal, tax and regulatory restrictions and implications on the payment of dividends by us to our stockholders or by our subsidiaries to us
and such other factors as our board of directors may deem relevant. In addition, our ability to pay dividends may be limited by covenants of indebtedness we or our subsidiaries incur in the future. We have no current plans to pay any cash dividends.
Risks Related to an Investment in our SDRs
Veoneer SDR holders do not have the same rights as our stockholders.
A Veoneer SDR holder does not have equivalent rights as our holders of common stock, whose rights are governed by U.S. federal law and the Delaware General Corporation Law. The rights of Veoneer SDR holders are set forth and described in to the General Terms and Conditions for Swedish Depository Receipts in Veoneer (the “General Terms and Conditions”). Although the General Terms and Conditions generally allow Veoneer SDR holders to vote in general meetings of stockholders or to be entitled to dividends as if they held our shares of common stock directly, the rights of Veoneer SDR holders differ in some instances from the rights of Veoneer stockholders. In particular, Veoneer SDR holders do not have the ability to nominate directors for election or bring proposals before our annual meeting to the extent provided for in our governing documents or by applicable U.S state or federal law. Additionally, Veoneer SDR holders may not be able to enforce their rights under the General Terms and Conditions in relation to their SDRs in the same manner as one of our stockholders could with respect to our shares of common stock under applicable U.S. law.
The trading market for Veoneer SDRs may be limited in the future.
There is a risk that a trading market for Veoneer SDRs will not develop or be sustained in the future. Veoneer SDRs traded in Stockholm are not equivalent to a Swedish security being traded on Nasdaq Stockholm. Specifically, Veoneer SDRs represent shares of a U.S. company and are not themselves shares of stock. The lack of an active trading market may make it more difficult for you to sell your Veoneer SDRs and could lead to the price of Veoneer SDRs being depressed or more volatile.
Item 1B. Unresolved Staff Comments
Not applicable.
Item 2. Properties
Veoneer’s principal executive offices are located at Klarabergsviadukten 70, Section C6, SE-111 64, Stockholm, Sweden. Veoneer’s various businesses operate in a number of production facilities and offices. Veoneer believes that its properties are adequately maintained and suitable for their intended use and that the Company’s production facilities have adequate capacity for the Company’s current and foreseeable needs. All of Veoneer’s production facilities and offices are owned or leased by operating (either subsidiary or joint venture) companies.
As of December 31, 2018, including joint venture operations, we owned or leased 10 manufacturing facilities and 22 technical centers and several sales and administrative offices. We have a presence in 13 countries. Our global scale enables us to engineer globally and manufacture locally to serve our global and local customers.
The following tables shows the regional distribution of our manufacturing facilities and technical sites:
VEONEER MANUFACTURING FACILITIES
|
| | | | | | | | |
Country/ Company | | Location of
Facility
| | Reporting
Segment(s)
| | Items Produced at
Facility
| | Owned/
Leased
|
Canada | | | | | | | | |
Veoneer Canada Inc. | | Markham | | Electronics | | Airbag electronics, radar sensors | | Leased |
China | | | | | | | | |
Veoneer (China) Co., Ltd. | | Shanghai | | Electronics | | Airbag electronics, radar sensors | | Owned |
Veoneer Nissin Brake Systems (Zhongshan) Co., Ltd | | Zhongshan | | Brake Systems | | Brake control systems | | Owned |
France | | | | | | | | |
Veoneer France SAS | | Saint-Etienne du Rouvray | | Electronics | | Airbag electronics, ADAS ECUs | | Owned |
Japan | | | | | | | | |
Veoneer Nissin Brake Systems Japan Co., Ltd. | | Ueda | | Brake Systems | | Brake control systems | | Leased |
| | Shimo-Muroga | | Brake Systems | | Brake control systems | | Leased |
| | Saku City | | Brake Systems | | Brake control systems | | Leased |
Sweden | | | | | | | | |
Veoneer Sweden AB | | Vårgårda | | Electronics | | Airbag electronics, vision cameras and radar | | Owned |
USA | | | | | | | | |
Veoneer US, Inc. | | Goleta, CA | | Electronics | | Night vision | | Leased |
Veoneer Nissin Brake Systems America, LLC | | Findlay, OH | | Brake Systems | | Brake control systems | | Leased |
TECHNICAL CENTERS
|
| | | | | | |
Country / Company | | Location | | Reporting
Segment(s)
| | Product(s) Supported |
Australia | | | | | | |
Veoneer Australia Pty. Ltd. | | Brooklyn | | Brake Systems | | Brake control systems |
China | | | | | | |
Veoneer China Co., Ltd. | | Shanghai | | Electronics | | Customer applications and platform development with full-scale test laboratory |
France | | | | | | |
Veoneer France SAS | | Cergy-Pontoise | | Electronics | | Customer applications and platform development with full-scale test laboratory |
Germany | | | | | | |
Veoneer Germany GmbH | | Dachau | | Electronics | | Customer applications and platform development with full-scale test laboratory |
| | Niederwern | | Electronics | | Customer applications and platform development |
| | Holzgerlingen | | Electronics | | Customer applications and platform development |
| | Bergkirchen | | Electronics | | Customer applications and platform development |
| | Kitzingen | | Electronics | | Customer application test facility |
India | | | | | | |
Veoneer India Private Limited | | Bangalore | | Electronics | | Customer applications and platform development |
Japan | | | | | | |
Veoneer Japan Ltd. | | Hiroshima | | Electronics | | Customer applications and platform development |
| | Yokohama (Facility 1) | | Electronics | | Customer applications and platform development |
| | Yokohama (Facility 2) | | Electronics | | Customer applications and platform development |
Veoneer Nissin Brake Systems Japan Co., Ltd. | | Tochigi | | Brake Systems | | Brake control systems |
Romania | | | | | | |
Veoneer Romania S.R.L. | | Timisoara | | Electronics | | Customer applications and platform development |
| | Iasi | | Electronics | | Customer applications and platform development |
South Korea | | | | | | |
Veoneer Korea Ltd. | | Hwaseong-shi | | Electronics | | Customer applications |
Sweden | | | | | | |
Veoneer Sweden AB | | Vårgårda | | Electronics | | Research center |
| | Linköping | | Electronics | | Electronics platform development |
| | Gothenburg | | Electronics | | Customer applications and platform development |
| | Stockholm | | Electronics | | Customer applications and platform development |
| | Skellefteå | | Electronics | | Customer applications and platform development |
USA | | | | | | |
Veoneer US, Inc. | | Southfield, MI | | Electronics | | Brake control systems, electronics customer application and platform development |
| | Lowell, MA | | Electronics | | Electronics platform development |
| | Goleta, CA | | Electronics | | Night vision development |
Veoneer Nissin Brake Systems America, LLC | | Southfield, MI | | Electronics | | Brake control systems customer application and platform development |
| | East Liberty, OH | | Brake Systems | | Brake control systems customer application and platform development. |
Our joint venture, Zenuity, leases technical centers in Munich, Germany, Göteborg, Sweden and Farmington Hills, Michigan, USA.
Item 3. Legal Proceedings
Various claims, litigation and proceedings are pending or threatened against the Company or its subsidiaries, covering a range of matters that arise in the ordinary course of its business activities with respect to commercial, product liability and other matters.
Certain legal proceedings in which the Company is involved are discussed in Note 16 - "Commitments and Contingencies" of Part II, Item 8 "Financial Statements and Supplementary Data" and should be considered an integral part of Part I, Item 3 "Legal Proceedings."
Item 4. Mine Safety Disclosures
Not applicable.
Part II
Item 5. Market for Registrant’s Common Equity, Related Stockholder Matters and Issuer Purchases of Equity Securities
Our common stock is traded on the New York Stock Exchange under the trading symbol "VNE" and our Swedish Depository Receipt ("SDRs") representing shares of our common stock are traded on Nasdaq Stockholm under the trading symbol "VNE SDB". As of February 15, 2019, the Company had 87,178,772 shares of its common stock, $1.00 par value per share, outstanding, which were owned by approximately 54,000 beneficial shareholders of record.
Performance Graph
The following graph compares the cumulative total stockholder return from July 2, 2018, through December 31, 2018, for Veoneer's existing common stock, the S&P 500 Index and the Dow Jones U.S. Auto Parts Index. The graph below assumes that $100 was invested on July 2, 2018, in each of the Company's common stock, the stocks comprising the S&P 500 Index and the stocks comprising the Dow Jones U.S. Auto Parts Index, and that all that dividends have been reinvested.
|
| | | |
| | 2 July 2018 | 28 September 2018 | 31 December 2018 |
| Veoneer, Inc. | $100.00 | $129.12 | $55.26 |
| S&P 500 | $100.00 | $106.87 | $91.94 |
| Dow Jones U.S. Auto & Parts Index | $100.00 | $92.24 | $71.67 |
The above comparisons are required by the Securities and Exchange Commission and are not intended to forecast or be indicative of possible future performance of the Company's common stock or the referenced indices.
Item 6. Selected Financial Data
(DOLLARS IN MILLIONS)
The following statement of operations, statement of cash flows and balance sheet data were derived from the Company's consolidated financial statements for the years ended December 31, 2018, 2017, 2016, 2015 and 2014. This information should be read in conjunction with Item 7, “Management's Discussion and Analysis of Financial Condition and Results of Operations” and Item 8, “Financial Statements and Supplementary Data” in this Report.
|
| | | | | | | | | | | | | | | | | | | | |
| | | As of and for the Year Ended December 31, |
| | | 2018 | | 2017 | | 2016 | | 2015 | | 2014 |
| | | | | | | | | | | |
| Operating Results: | | | | | | | | | | |
| Net Sales | | $ | 2,228 |
| | $ | 2,322 |
| | $ | 2,218 |
| | $ | 1,589 |
| | $ | 1,489 |
|
Operating Income / (loss)1 | | $ | (197 | ) | | $ | (283 | ) | | $ | (25 | ) | | $ | (8 | ) | | $ | 30 |
|
| Net Income / (loss) | | $ | (294 | ) | | $ | (344 | ) | | $ | (60 | ) | | $ | (30 | ) | | $ | 21 |
|
| Net Income / (loss) attributable to controlling interest | | $ | (276 | ) | | $ | (217 | ) | | $ | (53 | ) | | $ | (30 | ) | | $ | 21 |
|
| Capital Expenditures | | $ | (188 | ) | | $ | (110 | ) | | $ | (103 | ) | | $ | (53 | ) | | $ | (64 | ) |
| Depreciation and Amortization | | $ | (111 | ) | | $ | (119 | ) | | $ | (106 | ) | | $ | (53 | ) | | $ | (45 | ) |
| Financial Position: | | | | | | | | | | |
| Total Assets | | $ | 2,632 |
| | $ | 1,663 |
| | $ | 1,739 |
| | $ | 1,059 |
| | $ | 758 |
|
Total Debt 2 | | $ | (14 | ) | | $ | (62 | ) | | $ | (15 | ) | | $ | — |
| | $ | — |
|
1 Includes costs for goodwill impairment of $234 million in 2017.
2 Includes related party short-term debt and related party long-term debt as of December 31, 2018, related party long-term debt as of December 31, 2017.
Item 7. Management's Discussion and Analysis of Financial Condition and Results of Operations
Introduction
The following MD&A is intended to help you understand the business operations and financial condition of the Company. This MD&A is presented in the following sections:
Executive Overview
Trends, Uncertainties and Opportunities
Market Overview
Non-U.S. GAAP Financial Measures
Results of Operations
Liquidity and Capital Resources
Off-Balance Sheet Arrangements
Contractual Obligations and Commitments
Significant Accounting Policies and Critical Accounting Estimates
Veoneer is a Delaware corporation with its principal executive offices in Stockholm, Sweden. The Company functions as a holding corporation and owns two principal operating subsidiaries, Veoneer AB and Veoneer US, Inc. On June 29, 2018 the Spin-Off of Veoneer from Autoliv, Inc. ("Autoliv") was completed through the distribution by Autoliv of all the outstanding shares of common stock of Veoneer held by Autoliv to Autoliv’sAutoliv common stockholders as of the close of businessrecord on June 12, 2018, the common stock record date for the distribution, in a tax-free, pro rata distribution (the "Spin-Off").2018. On July 2, 2018, the shares of Veoneer, Inc. common stock commencedbegan “regular way” trading on the New York Stock Exchange under the ticker symbol “VNE” and the Veoneer Swedish Depository Receipts representing shares of Veoneer common stock commencedits SDRs began trading on Nasdaq Stockholm under the symbol “VNE SDB.”
Veoneer
Board Independence
The Board has determined that all current directors except Mr. Carlson are independent directors under the applicable rules of the NYSE, the Sarbanes-Oxley Act of 2002, as amended, and the rules and regulations promulgated by the SEC. In making its independence determinations, the Board reviewed (i) information regarding relevant relationships, arrangements or transactions between the Company and each director or parties affiliated with such director, (ii) Company records and (iii) publicly available information.
Stockholder Engagement Efforts
The Company engages with the Company’s stockholders throughout the year to ensure that management and the Board understand and focus on the issues that matter most to them, to solicit their views and feedback on various matters and to provide perspective on the Company’s policies and practices. During 2021, members of the Company’s management met with a number of the Company’s stockholders to listen to their questions and concerns and discuss a variety of topics, including the proposed merger with Qualcomm and SSW, our business, strategy, the changing markets and industry as well as our governance practices, compensation framework and sustainability efforts.
Exclusive Forum
At the Company’s 2019 annual general meeting of stockholders, the Company asked its stockholders whether it should retain its exclusive forum provision in its Restated Certificate of Incorporation. In response to its proposal, a majority of stockholders voting at the 2019 annual meeting voted for the Company to retain its exclusive forum provision. Notwithstanding the outcome of the vote, the Board considered whether it was appropriate to continue to maintain the exclusive forum provision. After additional consideration, the Board determined to follow the recommendation of its stockholders and retain the exclusive forum provision in its Restated Certificate of Incorporation. The Board believes that the exclusive forum provision is a global leaderan important element of the Company’s governance structure to provide increased consistency in the design, development, manufacture,application of Delaware law for specified intra-corporate disputes and salecontinues to be in the best interests of automotive safety electronicsthe Company and its stockholders.
Classified Board and Supermajority Voting Provisions
At the Company’s 2019 annual meeting, the Company asked its stockholders to vote, on a non-binding basis, whether it should retain the classified board structure. In response to its proposal, a majority of stockholders voting at the 2019 annual meeting voted for the Company to retain the classified board structure.
After consulting with our stockholders following the 2019 annual meeting and considering ongoing trends in corporate governance, our Board reconsidered its position on retaining its classified structure and recommended that the stockholders approve amendments to the Company’s Restated Certificate of Incorporation at the Company’s 2020 annual general meeting of stockholders to (i) eliminate the classification of the Board and to provide for the annual election of all directors and (ii) to eliminate the supermajority voting provisions. Despite increased stockholder engagement efforts by management to encourage stockholders to vote at the 2020 annual meeting, neither of these proposals received the required level of approval at the 2020 annual meeting. The approval of both of these proposals required the affirmative vote of not less than 80% of the then outstanding shares of the Company entitled to vote at the 2020 annual meeting.
The Company continued to engage with stockholders regarding these governance practices during the remainder of 2020 and, based on feedback from the stockholders, does not believe that these items are current priorities of our stockholders. The Company will continue to engage with its stockholders regarding these governance practices and will consider recommending such amendments in the future.
Director Tenure and Retirement Age Policy
It is the general policy of the Company that a director who has attained the age of 75 years during his or her term will not stand for re-election at the next annual meeting of stockholders at which such director stands for re-election.
In connection with director nomination recommendations, the Corporate Governance Guidelines provide that the Nominating and Corporate Governance Committee will consider the average and individual tenures of directors, with the goal of maintaining an appropriate balance of new perspectives and longer-term expertise. An individual director’s re-nomination is dependent upon such director’s performance evaluation, as well as a suitability review, each to be conducted by the Nominating and Corporate Governance Committee in connection with each director nomination recommendation.
Board Leadership Structure and Risk Oversight
Board Leadership
The Board is responsible for selecting the Company’s Chairman of the Board (the “Chairman”) and Chief Executive Officer (the “CEO”). The Bylaws and the Company’s Corporate Governance Guidelines do not require the separation of the positions of the Chairman and the CEO. The Corporate Governance Guidelines permit the Board to determine the most appropriate leadership structure for the Company at any given time and give the Board the ability to choose a Chairman that it deems best for the Company.
Jan Carlson currently serves as the Chairman, in addition to his role as President and CEO. The Board believes the combined role of CEO and Chairman under Mr. Carlson is the appropriate leadership structure for the Company at this time. Combining the CEO and Chairman roles under Mr. Carlson provides efficient and effective decision-making and unified leadership for the Company, with a focussingle person setting the tone for management of the Company. Mr. Carlson is well-suited to serve in the Chairman role because his familiarity with the Company’s business enables him to effectively lead the Board in its discussion, consideration and execution of the Company’s strategy. The Board believes that combining the CEO and Chairman roles under Mr. Carlson facilitates the flow of information between the Board and the Company’s management and better enables the Board to fulfill its oversight role.
In considering its leadership structure, the Board believes that the combined roles of Chairman and CEO are appropriately balanced by the designation of a Lead Independent Director. James M. Ringler has served as our Lead Independent Director since the Spin-off and was re-appointed again by the Board in February 2021 to serve as the principal liaison between the Chairman and the other independent directors and to provide independent leadership of the Board’s affairs on innovation, qualitybehalf of the Company’s stockholders. Mr. Ringler presides over the executive sessions of the independent directors. The Lead Independent Director has the following duties and manufacturing excellence. Priorresponsibilities:
| • | Presides at all meetings of the Board at which the Chairman is not present, including chairing any executive sessions of the independent and non-management directors; |
| • | Serves as liaison between the independent and non-management directors and the Chairman; |
| • | Has the authority to call meetings of the independent and non-management directors; |
| • | Approves meeting agendas of the full Board after they are prepared by the Chairman, assures that there is sufficient time for discussion of all agenda items, and facilitates approval of the number and frequency of Board meetings; |
| • | Is regularly apprised of inquiries from stockholders and involved in correspondence responding to these inquiries when appropriate, and if requested by stockholders, ensures that he or she is available, when appropriate, for consultation and direct communication; |
| • | Assists the Nominating and Corporate Governance Committee in its annual evaluation of the CEO’s effectiveness as Chairman and CEO, including an annual evaluation of his or her interactions with the directors and ability to provide leadership and direction to the full Board; and |
| • | Approves information sent to the Board, including the quality and timeliness of such information. |
Risk Oversight
The Board is responsible for the oversight of risk management of the Company with various aspects of risk oversight delegated to its committees. The Audit Committee is responsible for monitoring legal, regulatory and financial risk, including those related to ethics practices and information technology and security, as well as discussing risk oversight and management as part of its obligations under the Spin-Off, Veoneer operatedNYSE’s listing standards. The Compensation Committee oversees the Company’s succession planning programs and policies related to recruiting and retaining management. In its meetings, the Board receives reports from various Board committees and management, including the CEO and the Company’s Chief Financial Officer (“CFO”) regarding the main strategic, operational and financial risks the Company is facing and the steps that management is taking to address and mitigate such risks. Additionally, the Board will receive periodic risk-related updates from other members of management as necessary.
The Compensation Committee has reviewed with management the design and operation of our incentive compensation arrangements for almost four years as an operating segment within Autoliv. Veoneer's Safety Systemssenior management, including executive officers, for the purpose of determining whether such programs might encourage inappropriate risk-taking that could have a material adverse effect on the Company. The Compensation Committee considered, among other things, the features of the Company’s compensation program that are designed to mitigate compensation-related risk, such as the performance objectives and target levels for incentive awards (which are based on overall Company performance), and the Company’s compensation recoupment policy. The Compensation Committee concluded that any risks arising from the Company’s compensation plans, policies and practices are not reasonably likely to have a material adverse effect on the Company.
The Nominating and Corporate Governance Committee oversees and monitors the Company’s sustainability, corporate social responsibility and corporate citizenship policies, programs and initiatives and any risks related thereto and receives periodic reports from management of any such risks.
Board Meetings
The Board met 28 times during the year ended December 31, 2021, and took action by written consent two times. All directors serving during 2021 participated in at least 95% of the total number of meetings of the Board and committees on which they served. The independent directors met in executive session, without management participating, a total of 13 times in 2021.
| Item 11. | Executive Compensation |
Board Compensation
Directors who are employees of the Company or any of its subsidiaries do not receive separate compensation for service on the Board or its committees. Non-employee directors receive an annual board base retainer, which is higher for a Non-employee Chairman of the Board (which we do not currently have). The Committee chairs and the Lead Independent Director each receive an annual supplemental retainer as compensation in addition to the annual base retainer for their commitments. Board compensation was reviewed in 2021 and based on input from the Compensation Committee’s independent advisor, Frederic W. Cook & Co., Inc., the Compensation Committee determined not to make driving saferany adjustments to the compensation program.
Our Non-employee Director Compensation Policy provides for quarterly cash payments in advance for a service year that runs from annual meeting to annual meeting and easier, more comfortableprovides that one-half of the annual base retainer will be paid in the form of restricted stock units (“RSUs”), which will be granted on the date of the annual meeting and convenientwill vest on the earlier of (a) the date of the next annual meeting or (b) the one-year anniversary of the grant date. Our Non-employee Director Stock Ownership Policy requires each Non-employee director to acquire and hold shares of the Company’s common stock in an amount equivalent to five times the cash component of the annual Board retainer, with five years to reach the new ownership requirements.
Non-employee directors’ compensation levels are as described below (which have remained the same since 2018):
| Annual Base Retainer | | | |
| All Non-employee Directors other than Chairman | | $ | 240,000 | |
| Non-employee Chairman | | $ | 390,000 | |
| Lead Independent Director Annual Supplemental Retainer | | $ | 40,000 | |
| Committee Chair Annual Supplemental Retainers | | | | |
| Audit Committee | | $ | 30,000 | |
| Compensation Committee | | $ | 20,000 | |
| Nominating and Corporate Governance Committee | | $ | 20,000 | |
2021 Director Compensation
The following table sets forth the compensation that our Non-employee directors earned or were paid during the year ended December 31, 2021, for services rendered as members of our Board during 2021:
| Name | | Fees Earned or Paid in Cash ($) (1) | | | Stock Awards ($) (2) (3) | | | Total ($) | |
| Robert W. Alspaugh | | | 150,000 | | | | 120,000 | | | | 270,000 | |
| Mary Louise Cummings | | | 90,000 | | | | 120,000 | (4) | | | 210,000 | |
| Mark Durcan | | | 120,000 | | | | 120,000 | | | | 240,000 | |
| James M. Ringler | | | 180,000 | | | | 120,000 | | | | 300,000 | |
| Kazuhiko Sakamoto | | | 120,000 | | | | 120,000 | | | | 240,000 | |
| Jonas Synnergren | | | 120,000 | | | | 120,000 | | | | 240,000 | |
| Wolfgang Ziebart | | | 140,000 | | | | 120,000 | | | | 260,000 | |
| (1) | The cash portion of director compensation is set in USD and converted to the director’s local currency, as applicable, at the then-current exchange rate on the date of payment. |
| (2) | Reflects the grant date fair value calculated in accordance with FASB Topic 718 of 5,263 RSUs granted on May 10, 2021, which RSUs will vest in one installment on May 10, 2022, provided that the Non-employee director remains in service on the vesting date, subject to certain exceptions. |
| (3) | As of December 31, 2021, each of our Non-employee directors, except Mary Louise Cummings, held 5,263 outstanding unvested RSUs. |
| (4) | Mary Louise Cummings resigned as a director effective November 1, 2021. In connection with her resignation, she forfeited all of her outstanding RSUs as of such date. |
Compensation Discussion and Analysis
This Compensation Discussion and Analysis (“CD&A”) describes the material elements of compensation awarded to, earned by, or paid to each of the Company’s “named executive officers” during the last completed fiscal year, and discusses the principles and decisions underlying our executive compensation policies and decisions.
Our Named Executive Officers in 2021
In accordance with the relevant rules and regulations promulgated by the SEC, our “named executive officers” are the CEO, the CFO, three other executive officers who had the highest total compensation for 2021, and three former executive officers. The named executive officers for 2021 are as follows:
| • | Jan Carlson (President and CEO) |
| • | Ray Pekar (CFO and Executive Vice President, Finance) |
| • | Lars Sjöbring (Executive Vice President, Legal Affairs, General Counsel and Secretary) |
| • | Matthias Bieler (Executive Vice President, Product Area Vision & DMS) |
| • | Robert Bisciotti (Executive Vice President, Product Area RCS) |
| • | Mats Backman(1) (Former CFO and Executive Vice President, Finance) |
| • | Art Blanchford(2) (Former Executive Vice President, Sales & Business Development) |
| • | Steve Rodé (3) (Former Executive Vice President, Operations) |
| (1) | Mr. Backman resigned effective March 1, 2021. |
| (2) | Mr. Blanchford entered into a mutual separation agreement and resigned effective October 15, 2021. |
| (3) | Mr. Rodéstepped down as Executive Vice President, Operations as of May 1, 2021 but continues to provide service to the Company. |
Executive Summary of 2021 Compensation Program and Program Development
Our 2021 executive compensation program reflected the following:
| • | Pay for Performance Alignment. The compensation of our named executive officers is substantially tied to company performance. |
| – | A significant portion of our named executive officers’ total direct compensation is provided in the form of long-term equity incentive (LTI) awards, the value of which will rise or decline with our stock price over their vesting terms. |
| – | In 2021, our named executive officers received 50% (100% for our CEO) of their LTI awards in the form of performance shares (“PSs”), which may be earned over three years based on our achievement of annual gross margin goals established by the Compensation Committee at the beginning of each year in the performance period, with the final number of earned PSs subject to downward adjustment based on our share price measured at the end of the three-year performance period. For our named executive officers other than our CEO, the remaining 50% of the LTI awards was provided in the form of restricted stock units (“RSUs”) that cliff vest on the third anniversary of the grant date. |
| • | For the 2019-2021 PSs, the Company did not achieve the threshold annual gross margin goals for 2019; therefore, no PSs were earned for the 2019 portion of the applicable three-year performance period. |
| • | For the 2019-2021 PSs and 2020-2022 PSs, the Company achieved the threshold annual gross margin goals for 2020; based on such achievement, 0.3x target PSs were earned for the 2020 portions of the applicable three-year performance periods, which remain subject to downward adjustment as described below. |
| • | For the 2019-2021 PSs, 2020-2022 PSs, and 2021-2023 PSs, the Company achieved the target annual gross margin goals for 2021; based on such achievement, 1.08x target PSs were earned for the 2021 portions of the applicable three-year performance periods, which remain subject to downward adjustment as described below. |
| – | In 2021, each of our named executive officers was eligible to earn an annual cash incentive award based on pre-established targets for our Free Cash Flow. The Free Cash Flow metric comprised 100% of the annual cash incentive award for our CEO for the entire year. For other named executive officers, the Free Cash Flow metric comprised 100% of the annual cash incentive award for the period January 1 – June 30, and 75% for the period July 1 – December 31. Based on our Free Cash Flow of approximately $(312) million, our named executive officers earned annual cash incentive awards with respect to the Free Cash Flow metric equal to 1.5x target for the full calendar year. |
| – | In 2021, for the period July 1 – December 31, each of our named executive officers except our CEO was eligible to earn 25% of their annual cash incentive award based on pre-established individual targets. Our named executive officers, other than our CEO, earned annual cash incentive awards with respect to their individual performance targets ranging between 1.417 – 1.583x target. |
| • | Strong Pay Governance Practices. Our program reflects several strong pay governance practices including: stock ownership guidelines, a compensation recoupment policy, a policy against the hedging or pledging of Company securities, and an annual compensation risk assessment. |
| • | Impact of COVID-19. During 2021, the COVID-19 pandemic had an impact on our business. However, we continued to work toward launches in 2022 and beyond and maintained tight schedules and expended significant efforts to meet customer demands. With the priority of keeping focused on our commitments, during 2021, we determined it was not appropriate or in the best interest of the Company and its stockholders to make changes to our executive compensation program based on the impact of COVID-19, including any related adjustments to our financial performance goals. |
| • | Merger. On October 4, 2021, we announced that we had entered into a definitive merger agreement with Qualcomm and SSW. For additional details regarding the amounts payable to our named executive officers if the merger transaction is completed, please see our Current Report on Form 8-K, dated October 4, 2021, and our Definitive Proxy Statement on Schedule 14A relating to the merger filed with the SEC. |
Compensation Objectives
The primary objectives of our compensation program are to:
| • | Offer competitive total compensation and benefits sufficient to attract, motivate and retain the management talent necessary to support the Company’s continued success; |
| • | Align the interests of the executives and the stockholders; |
| • | Pay for performance over the short- and long-term using straightforward programs to communicate our goals; and |
| • | Encourage company-wide cooperation among members of the executive, regional and business unit management teams and throughout the Company. |
Elements of Compensation
The Company seeks to establish a balanced mix of fixed and variable, cash and equity compensation. The elements of compensation for our named executive officers are base salary, annual cash incentives, LTI, retirement and other benefits, in each case aligned with our pay objectives, as summarized in the table below.
| | Pay Objective |
| Pay Element | Function/Purpose | Competitive Pay | Stockholder Alignment | Pay for Performance | Company- wide Cooperation |
| Base Salary | Provides a set level of pay warranted by position and sustained individual performance. A competitive base salary is important to attract and retain an appropriate caliber of talent for the position. | ✔ | | | |
Annual Cash Incentive | Recognizes short-term performance against established annual financial performance goals and creates focus and engagement in delivering results. | ✔ | ✔ | ✔ | ✔ |
| LTI | Provides our executive officers with incentives to build long-term value for our stockholders while promoting retention of critical executives. | ✔ | ✔ | ✔ | ✔ |
Retirement and Other Benefits | Provides additional value for our executives with competitive and market-aligned benefits. | ✔ | | | |
Market and Market Position
We consider the competitive environment where our significant operations and markets are located to provide a compensation package that optimizes value to the participant and cost to the Company. Related to this, pay mix is intended to be appropriate for the end consumercountry in which the named executive officer is located. Because we employ many non-U.S. executives, our pay mix is more heavily weighted to base salary and to intervene beforeretirement benefits than a collision. Veoneer endeavors to prevent vehicle accidents or reduce the severity of impact in the event a crash is unavoidable. Through our customer focus, being an expert partner with our customers, we intend to develop human centric systems that benefit vehicle occupants.
Veoneer’s current product offeringtypical U.S.-company pay mix, and, correspondingly, includes automotive radars, mono-and stereo-vision cameras, night driving assist systems, positioning systems, ADAS (advanced driver assist systems) electronic control units, passive safety electronics (airbag control units and crash sensors), brake control systems and a complete ADAS software offering towards highly automated driving (HAD) and eventually autonomous driving (AD). In addition, we offer driver monitoring systems, LiDAR sensors, RoadScape positioning and other technologies critical for HAD and AD solutions by leveraging our partnership network and internally developed intellectual property.
Executive Overview
The environment around us is rapidly changing and we currently see a shift across the automotive and autotech industries. New technologies, creating newlower levels of interactionequity than many of our U.S. Peers.
The Compensation Committee’s objective is to generally approximate the market median for base salaries as well as total direct compensation of the relevant market data primarily linked to the country in which the named executive officer is located. Notwithstanding, the Compensation Committee and driver supportmanagement believe that it is their responsibility to use discretion and make informed judgments as to individual compensation packages or pay levels that may occasionally deviate above or below our target pay strategy based on factors such as:
| 1. | Individual performance and potential relative to market. |
| 2. | Long-term succession planning and talent management. |
| 3. | Business conditions in our industry or the market overall, as well as business or regulatory conditions in the executive’s area of responsibility. |
| 4. | Cases where individuals are asked to step into new roles and responsibilities for specific projects or strategic initiatives. |
Base Salaries
Initial base salaries are startingprimarily a function of the Compensation Committee’s assessment of (i) market compensation levels, (ii) the references made to revolutionize driving, but we also seebase salary in our compensation philosophy for executive management, (iii) the driver being actively involvedcompensation required to attract and retain the executive, and (iv) the Company’s need to fill the position either internally or externally. The Compensation Committee typically intends for yearsbase salary to come. We call this Collaborative Driving; the industry also calls it “Level 2+” driver support. At the samecomprise, on average, over time, there is also a growing realization that the introduction40% of truly self-driving cars will likely take longer and be more expensive than previously anticipated. This fundamental insight opens up new opportunities for companies, including Veoneer, but it also requires a reprioritization of resources.
In the near term there is also an increased uncertainty regarding the development of global light vehicle production (LVP). During the fourth quarter of 2018 we saw a sharp decline in the LVP in China and Western Europe and we anticipate that these markets will continue to show weakness in the first half of this year. We expect the situation to improve in the second half, but we currently expect a slight decline in the global LVPtotal direct compensation for the full year 2019.
In response toCEO and 50% for other named executive officers. As noted above, this is in large part informed by the larger role inappropriate pay mix given the market for Collaborative Driving, the expected delay of self-driving, and the weaker LVP trend, we are actively reviewing our investment priorities and the focuslocation of our product portfolio. Our purpose is to identify the most effective way to allocate talent and capital to meet these new market realities. In December we refined our organization to create a more agile and focused company, and during 2019 we expect our renewed organization, combined with other initiatives to gradually start delivering efficiency gains and stronger customer engagement.executives.
We expect the combined effects
As part of the year. Assuming successful execution2021 compensation review, the Compensation Committee increased base salaries for our named executive officers, other than Mr. Carlson, by approximately 3-4.5%. Mr. Carlson’s base salary was increased by 10% in 2021, which was the first base salary adjustment since the spin-off from Autoliv in 2018.
Annual Cash Incentives
Members of these initiatives, we expect our executive management team, including our named executive officers, are eligible to earn an annual cash incentive award based on achievement against pre-established performance criteria. Payout opportunities at threshold, target and maximum are reflected as a percentage of each executive’s base salary, as set forth in the following table.
Annual Non-Equity Incentive Opportunity for Our Named Executive Officers in 2021 |
| Named Executive Officer | | Incentive as a % of Base Salary |
| | | Threshold | Target | Maximum |
| Jan Carlson | | 0% | 75% | 150% |
| Ray Pekar | | 0% | 45% | 90% |
| Lars Sjöbring | | 0% | 35% | 70% |
| Matthias Bieler | | 0% | 45% | 90% |
| Robert Bisciotti | | 0% | 45% | 90% |
Mats Backman(1) | | 0% | 45% | 90% |
Art Blanchford(1) | | 0% | 45% | 90% |
| | 0% | 45% | 90% |
Messrs. Backman and Blanchford were not employed on December 31, 2021, and were not eligible for an annual cash incentive payout for 2021. |
In 2021, each of our named executive officers was eligible to earn an annual non-equity incentive award based on pre-established Free Cash Flow targets. For the period July 1 to December 31, 2021, each of our named executive officers, except our CEO, was eligible to earn an annual non-equity incentive award based on pre-established Free Cash Flow targets weighted 75% and individual targets weighted 25%.
Free Cash Flow for the purpose of the annual non-equity incentive award is defined as net cash to cover our funding requirements until the Company reaches positive cash flow. However, additional funding may be required if order intake increases beyond our expectations, if the underlying near-term business conditions deteriorate further, or if we make acquisitions.
We build our 2019 plan on a strong base. In 2018, our order intake grew strongly to a record lifetime order value of close to $6 billion. Active Safety orders almost doubled, and we expanded our Active Safety customer base from 9 to 12 car manufacturers. From a product perspective, I am particularly pleased with the strong market and customer reception of our vision products based on Veoneer’s internally developed software algorithms and the fact that we won our first major commercial LiDAR order with a global OEM.
We move forwardused in 2019 with a strong focus on capturing the opportunities in a new industry situation. By balancing growth, cost, and effectiveoperating activities less capital allocation we are building a focused, industry leading product portfolio, all with the objective to make Veoneer the leading company in our chosen business segments.
2019 Outlook
Looking ahead into 2019 we are planning for a complex business environment. We are responding to light vehicle production fluctuations and uncertainties even as we prepare for a heavy new program launch schedule beginning in late 2019 and extending into 2020.
Our current customer call-offs and deliveries reflect a weak demand situation in China and Western Europe, which leads us to anticipate a decline in LVP during the first six months of 2019. At this time, we expect this demand to stabilize and return to growth during the second half of the year, resulting in the estimated full year LVP being slightly down in 2019 as compared to 2018.
Our sales during the first half of 2019 are expected to remain relatively flat sequentially from the second half of 2018, albeit a decline year over year, and then improve sequentially in the second half of 2019. Consequently, we estimate our organic sales will be flat to decline slightly for the full year 2019 while we estimate the currency translation impact to be approximately (2)% as compared to 2018.
As a result of our sales and RD&E development, in combination with the implementation of our market adjustment initiatives during 2019, we expect a weak operating margin and cash flow during the first half of the year. The first quarter in 2019 is expected to be weaker than the fourth quarter in 2018, with an anticipated improvement during the second half of 2019.
Based on the market opportunities ahead of us, we expect our 2019 order intake to be at least as strong as our performance in 2018.
Financial Results
Significant aspects of the Company's financial resultsexpenditures (($351) million USD for the year ended December 31, 2018, include2021)(1), as further adjusted to exclude Zenuity and Autotech cash effects and merger-related costs. The Compensation Committee selected Free Cash Flow as the following.
Sales - Net salessingle financial performance metric for the full year of 2018 decreased by $95 million to $2,228 million as compared to 2017.
Gross Profit - The gross profit of $430 millionannual cash incentive awards because the focus on cash flow was crucial for the full year of 2018 was $36 million lower as compared to 2017. The volumeCompany’s success and product mix effect causing the lower organic sales was partially offset by a net favorable currency benefit of around $10 million.aligned with stockholder interests.
Operating Loss - The operating loss of $197 million for the full year of 2018 decreased by $86 million as compared to 2017, including a net favorable currency benefit of $4 million. In 2017 the operating loss included a goodwill impairment charge related to VNBS of $234 million.
Net Loss - The net loss for the full year of 2018 of $294 million decreased by $50 million as compared to 2017. In addition to the operating loss impact, the Veoneer net loss from Zenuity increased by $32 million. The Zenuity net loss increase is mainly due to the higher net cost run-rate related to the hiring of software engineers and an additional quarter of cost in 2018, since the JV was formed in April 2017.
Interest income net increased by $6 million as compared to 2017. Income tax expense for 2018 was $42 million as compared to $30 million in 2017. The change in tax expense was primarily impacted by the change in mix of pre-tax earnings in our profitable subsidiaries and a non-cash, one-time discrete tax item of $23 million in 2018.
The non-controlling interest loss in the VNBS JV was $19 million for 2018 as compared to $127 million loss in 2017 which included the goodwill impairment charge of $113 million.
The pie charts below highlight the sales breakdown for Veoneer for the year ended December 31, 2018.
Trends, Uncertainties and Opportunities
Europe continues to take a pro-active role in promoting or requiring active safety technologies. The European New Car Assessment Program (“NCAP”) continuously updates its test rating program to include more active safety technologies to help the European Union reach its target of cutting road fatalities by 50% by 2030, as compared to 2020. On May 17, 2018, the European Commission proposed a new mandate, as party of the EU general Safety Regulation road-map till 2028 to make certain active safety features compulsory in light vehicles by 2022. Such a mandate should significantly expand demand for our active safety products. If passed as proposed, certain safety features could be mandated in 2022 as new vehicle models are introduced to the European market. In any case, General Safety Regulation (GSR) would have a positive influence on other market regulators as they evaluate their respective vehicle test rating programs and safety legislations.
In China, the Ministry of Industry and Information Technology issued the Key Working Points of Intelligent Connected Vehicle Standardization for 2018 to promote and facilitate the development of the intelligent connected vehicles industry, and advance the development of fundamental standards and those that are in urgent demand. The guideline has pointed out that more than 30 key standards will be defined by 2020 to fund the systems for ADAS and low-level autonomous driving, and a system of over 100 standards will be set up by 2025 for higher level autonomous driving.
During the third quarter of 2018 the Chinese government commenced testing of new vehicles according to the new China New Car Assessment Program (CNAP) where active safety features like Autonomous Emergency Braking (AEB) are required to achieve the maximum safety rating.
In 2017 a consortium of Original Equipment Manufacturers (OEM's) in the United States voluntarily agreed to make AEB standard equipment on all new vehicles produced no later than 2023.
On October 4, 2018 the U.S. Department of Transportation (DoT) issued new voluntary guidelines on automated driving systems (ADS) under its “Preparing for the Future of Transportation: Automated Vehicles 3.0” initiative, building on its “Vision for Safety 2.0” from September 2017 which prioritized aligning federal guidance around twelve safety design elements of interest to the auto industry. This initiative should have a positive impact on the adoption of Advanced Driver Assistance Systems (ADAS) and Highly Automated Driving (HAD) on the road towards Autonomous Vehicles.
The UN ECE created the new Working Party to deal with regulations for Automated Vehicles (GRVA). In addition to the EU and Japan who started to work closely for ADAS regulations in the last 3 years, the U.S. and China indicated a willingness to be active in several working groups towards harmonization of future regulations for ADAS and AV. This would create a common umbrella for countries which follow type-approval rules (EU, Japan, Australia) and countries which are outside of type-approval system e.g., under self-certification regimes (U.S., Korea) or specific national rules (China).
Key future working fields for regulations are expected for (i) safety critical ADAS-features (e.g. AEB); (ii) Highway AV-features (Physical Tests + Real World Test Drive + Audit); (iii) Cybersecurity & SW-Updates; and (iv) Connected Vehicles. On one hand, the agreement on minimal common base requirements will take longer time and therefore may postpone introduction of regulations. On the other hand, the harmonization would help the industry while a more active position from China may help to pull forward some safety critical ADAS technologies which are not yet considered as relevant for regulation in EU and Japan (e.g. Blind Spot or Night Vision).
Market Overview
|
| | | | | | | | | | | | | |
Millions (except where specified, as of January 17, 2019) | Light Vehicle Production by Region - 2018 |
| China | | Japan | | Rest of Asia | | Americas | | Europe | | Other | | Total |
| Full Year 2018 | 25.7 | | 9.1 | | 13.1 | | 19.1 | | 21.9 | | 2.5 | | 91.3 |
| Change vs. 2017 | (3.5)% | | 0.3% | | 3.4% | | —% | | (1.3)% | | (2.2)% | | (0.9)% |
During 2018 the global light vehicle production decreased by around 1% as compared to 2017 mainly due to the production declines in Western Europe (4%), partially attributable to the introduction of the Worldwide Harmonized Light Vehicle Procedure ("WLTP"), China (4%), likely attributable to weaker consumer demand and record volumes in 2017 when tax incentive on 1.6 liter vehiclestargets were in place, along with South Korea (2%) likely attributable to fewer NAFTA exports due to production localization. Light vehicle demand in Japan and the Americas remained relatively flat, where South America increased 3% and North America declined slightly (1)% while India, included in Rest of Asia, increased 7% during the year as compared with 2017.
|
| | | | | | | | | | | | | |
Millions (except where specified, as of January 17, 2019) | Light Vehicle Production by Region - 2017 |
| China | | Japan | | Rest of Asia | | Americas | | Europe | | Other | | Total |
| Full Year 2017 | 26.6 | | 9.0 | | 12.6 | | 19.1 | | 22.2 | | 2.6 | | 92.2 |
| Change vs. 2016 | 2.3% | | 5.6% | | 1.1% | | (1.4)% | | 3.3% | | 13.7% | | 2.2% |
During 2017 the global light vehicle production increased by around 2% as compared to 2016 mainly due to the production declines in Western Europe (1%), North America (5%) and South Korea (3%) which was more than offset by increases in China of 2%, partially attributable to the tax incentive on 1.6 liter vehicles which were still in place in 2017, along with South America, Japan, Eastern Europe and India all with increases of 20%, 6%, 9% and 7%, respectively.
Non-U.S. GAAP Financial Measures
Non-U.S. GAAP financial measures are reconciled throughout this report.
In this report we refer to organic sales or changes in organic sales growth, a non-U.S. GAAP financial measure that we, investors and analysts use to analyze the Company's sales trends and performance. We believe that this measure assists investors and management in analyzing trends in the Company's business because the Company generates approximately 65% of sales, a significant amount of sales, in currencies other than in U.S. dollars (its reporting currency) and currency rates have been and can be rather volatile. Additionally, the Company has historically made several acquisitions and divestitures. Organic sales and organic sales growth presents the increase or decrease in the overall U.S. dollar net sales on a comparable basis, allowing separate discussions of the impact of acquisitions/divestitures and exchange ratesestablished based on the Company’s performance. The tables in this report present reconciliation of changes inbusiness plan and were as follows:
| Threshold: | (477) million USD. |
| Target: | (367) million USD. |
| Maximum: | (257) million USD. |
If Free Cash Flow is less than the total U.S. GAAP net sales changes in organic sales growth.threshold level, there is no annual cash incentive payout. Linear interpolation is used to determine payouts for performance between threshold and target, and target and maximum.
For any forward-looking statements contained in this report or any other document, we claim the protection of the safe harbor for forward-looking statements contained in the Private Securities Litigation Reform Act of 1995, and we assume no obligation to revise or publicly release the results of any revision to these forward-looking statements, except as required by law. Given these risks and uncertainties, readers are cautioned not to place undue reliance on such forward-looking statements.
The Company also uses in this report EBITDA,believes that using the single performance metric of Free Cash Flow provides a non-U.S. GAAP financial measure, which representsclear direction to our executives with respect to the Company’s net income excluding interest expense, income taxes, depreciation and amortization. The Company also uses Segment EBITDA, a non-U.S. GAAP financial measure, which represents the Company’s EBITDA which has been further adjusted on a segment basis to exclude certain corporate and other items. We believe that EBITDA and Segment EBITDA are useful measures for management, analysts and investors to evaluate operating performance on a consolidated and reportable segment basis, because it assists in comparing our performance on a consistent basis. The tables below provide reconciliations of net income (loss) to EBITDA and Segment EBITDA.
The Company also uses in this report net working capital, a non-U.S. GAAP financial measure, which is defined as current assets (excluding cash and cash equivalents) less current liabilities. Management uses this measure to improve its ability to assess liquidity at a point in time. The table below provides a reconciliation of current assets and liabilities to net working capital.
Investors should not consider these non-U.S. GAAP measures as substitutes, but rather as additions, to financial reporting measures prepared in accordance with U.S. GAAP. It should be noted that these measures, as defined, may not be comparable to similarly titled measures used by other companies.
The forward looking non-U.S. GAAP financial measure used in this report is provided on a non-U.S. GAAP basis. Veoneer has not provided a U.S. GAAP reconciliation of this measure because items that impact this measure, such as foreign currency exchange rates, cannot be reasonably predicted or determined. As a result, such reconciliation is not available without unreasonable efforts and Veoneer is unable to determine the probable significance of the unavailable information.
Results of Operations
Fiscal Year 2018 compared to 2017
The following tables show Veoneer’s performance by segmentfocus for the given year ended December 31, 2018 and 2017 along with components of change compared to the prior year.
|
| | | | | | | | | | | | | | | | | | | | | | | | | | | | | | | | | |
| Electronics Segment | Year Ended December 31 | | Components of Change vs. Prior Year |
Dollars in millions, (except where specified) | 2018 | | 2017 | | U.S. GAAP Reported | | Currency | | Organic1 |
| $ | | % | | $ | | % | | Chg. $ | | Chg. % | | $ | | % | | $ | | % |
| Net Sales | $ | 1,799 |
| |
|
| | $ | 1,850 |
| |
|
| | $ | (51 | ) | | (3 | )% | | $ | 17 |
| | 1 | % | | (68 | ) | | (4 | )% |
| Operating Loss / Margin | $ | (116 | ) | | (6.4 | )% | | $ | (14 | ) | | (0.7 | )% | | $ | (102 | ) | | | | | | | | | | |
EBITDA1 / % | $ | (43 | ) | | (2.4 | )% | | $ | 67 |
| | 3.6 | % | | $ | (110 | ) | | | | | | | | | | |
| Associates | 7,105 |
| |
|
| | 5,898 |
| |
| | 1,207 |
| | | | | | | | | | |
1 Non-U.S. GAAP measure reconciliation for Organic Sales and EBITDA
Sales - Net sales in the Electronics segment for the full year of 2018 decreased by $51 million to $1,799 million as compared to 2017. The difference was attributable to organic sales decline in Restraint Control Systems of approximately $120 million which was partially offset by Active Safety organic sales growth of around $52 million.
The quantities delivered for the full year 2018 were 18.7 million and 10 million units for Restraint Controls Systems and Active Safety, respectively.
Operating Loss - The operating loss in the Electronics segment increased by $102 million to $116 million for the full year of 2018 as compared to 2017. The increase is mainly due to the volume and product mix effect causing the lower organic sales and a planned increase in RD&E costs to support future sales growth.
EBITDA - For the full year of 2018 the Electronics segment EBITDA of negative $43 million declined by $110 million as compared to 2017, which was partially offset by lower amortization of intangibles, mainly related to the effects of the MACOM acquisition.
Associates - The number of associates in the Electronics segment increased by approximately 1,207 since December 31, 2017 to 7,105 mainly due to increases in RD&E to support future organic sales growth and current development programs.
|
| | | | | | | | | | | | | | | | | | | | | | | | | | | | | | | | | | |
| Brake Systems Segment | Year Ended December 31, 2018 | | Components of Change vs. Prior Year |
Dollars in millions, (except where specified) | 2018 | | 2017 | | U.S. GAAP Reported | | Currency | | Organic1 |
| $ | | % | | $ | | % | | Chg. $ | | Chg. % | | $ | | % | | $ | | % |
| Net Sales | $ | 428 |
| | | | $ | 476 |
| | | | $ | (48 | ) | | (10 | )% | | $ | 7 |
| | 1 | % | | $ | (55 | ) | | (11 | )% |
| Operating Loss / Margin | $ | (30 | ) | | (7.1 | )% | | $ | (247 | ) | | (51.9 | )% | | $ | 217 |
| | | | | | | | | | |
EBITDA1/ % | $ | 7 |
| | 1.7 | % | | $ | (210 | ) | | (44.2 | )% | | $ | 217 |
| | | | | | | | | | |
| Associates | 1,452 |
| | | | 1,586 |
| | | | (134 | ) | | | | | | | | | | |
1 Non-U.S. GAAP measure reconciliation for Organic Sales and EBITDA
Sales - The net sales of $428 million in the Brake Systems segment for the full year of 2018 decreased by $48 million as compared to 2017. The decline was mainly attributable to lower volumes on certain Honda models, primarily in North America and lower LVP in China which was partially offset by higher volumes in Japan.
The quantity delivered for the full year 2018 was 1.9 million units for the Brake Systems segment.
Operating Loss - The operating loss in the Brake Systems segment decreased by $217 million to $30 million for the full year of 2018 as compared to 2017 which included the goodwill impairment charge of $234 million. In addition, the volume and product mix effect causing the lower organic sales was partially offset by reduced overhead costs.
EBITDA - For the full year of 2018, the Brake Systems segment EBITDA of $7 million increased by $217 million as compared to 2017. This was mainly due to the goodwill impairment charge in 2017 of $234 million, which was partially offset by an increase in underlying operating loss.
Associates - The number of associates in the Brake Systems segment declined by 134 since December 31, 2017 to 1,452 mainly due to the reductions in direct manufacturing as well as production overhead and SG&A due to the decline in organic sales.
|
| | | | | | | | | | | | | | | | | | | | |
| Corporate and Other | Year Ended December 31 |
Dollars in millions, (except where specified) | 2018 | | 2017 | | U.S. GAAP Reported |
| $ | | % | $ | | % | | Chg. $ | | Chg.% |
| Net Sales | $ | — |
| | | | $ | — |
| | | | $ | — |
| | — | % |
| Operating Loss / Margin | $ | (51 | ) | | — | % | | $ | (22 | ) | | — | % | | $ | (29 | ) | | |
Segment EBITDA1 / Margin | $ | (51 | ) | | — | % | | $ | (21 | ) | | — | % | | $ | (29 | ) | | |
| Associates | $ | 43 |
| | | | $ | — |
| | | | $ | 43 |
| | |
1 Non-U.S. GAAP measure reconciliation for EBITDA
Operating Loss and EBITDA - The operating loss and EBITDA for Corporate and other for the full year of 2018 increased to $51 million from $22 million and $21 million, respectively, as compared to 2017 mainly due to the additional costs associated with being a standalone listed company.
Associates - The number of associates in Corporate and other increased to 43 as compared to December 31, 2017 mainly related to the hiring of additional personnel for being a standalone listed company.
The associate and financial figures are not comparable since the 2017 financial reports are based on carve-out basis accounting rules.
Net Sales by Product
The following tables show Veoneer’s consolidated net sales by product for the year ended December 31, 2018 and 2017 along with components of change compared to the prior year.
|
| | | | | | | | | | | | | | | | | | | | | | | | | | | | |
| Consolidated Net Sales | Year Ended December 31 | | Components of Change vs. Prior Year |
Dollars in millions, (except where specified) | 2018 | | 2017 | | U.S. GAAP Reported | | Currency | | Organic1 |
| $ | | $ | | Chg. $ | | Chg. % | | $ | | % | | $ | | % |
| Restraint Control Systems | $ | 974 |
| | $ | 1,073 |
| | $ | (99 | ) | | (9 | )% | | $ | 21 |
| | 2 | % | | $ | (120 | ) | | (11 | )% |
| Active Safety | $ | 825 |
| | $ | 777 |
| | $ | 48 |
| | 6 | % | | $ | (4 | ) | | (1 | )% | | $ | 52 |
| | 7 | % |
| Brake Systems | $ | 428 |
| | $ | 473 |
| | $ | (45 | ) | | (9 | )% | | $ | 7 |
| | 1 | % | | $ | (51 | ) | | (11 | )% |
| Total | $ | 2,228 |
| | $ | 2,322 |
| | $ | (95 | ) | | (4 | )% | | $ | 24 |
| | 1 | % | | $ | (119 | ) | | (5 | )% |
1 Non-U.S. GAAP measure reconciliation for Organic Sales
Sales - Net sales for the full year of 2018 decreased by $95 million to $2,228 million as compared to 2017.
The organic sales decline of 5% was partially offset by positive currency translation effects of 1%. The sales decline in Restraint Control Systems and Brake Systems, was mitigated by the Active Safety organic sales growth. We expect the sales trend in all three product areas to rebound starting in the latter part of 2019 and increasing in 2020.
Restraint Control Systems - Net sales of $974 million for the full year of 2018 declined by 9% as compared to 2017. The 11% organic sales decline was mainly driven by the phase-out of certain models in North America and lower LVP in China and Western Europe in the second half of 2018.
Active Safety - Net sales of $825 million for the full year of 2018 increased by 6% as compared to 2017 due to an increase in organic sales of 7%.
Strong demand for vision systems and ADAS ECUs on multiple models accounted for most of the organic sales growth together with night vision systems to PSA and Audi. This strong growth was partially offset by the continued ramp-down of current GPS business with Ford and an underlying weaker LVP environment, particularly in Western Europe.
Brake Systems - Net sales of $428 million for the full year of 2018 decreased by 9% as compared to 2017, mainly due to an organic sales decline of 11%, mostly due to lower volumes on certain Honda vehicle models, primarily in North America, and lower LVP in China.
Veoneer Performance
The following table shows Veoneer’s performance for the year ended December 31, 2018 and 2017 along with components of change compared to the prior year.
|
| | | | | | | | | | | | | | | | | |
| Income Statement | Year Ended December 31 |
Dollars in millions, (except per share data) | 2018 3 | | 2017 3 | | |
| $ | | % | | $ | | % | | Change |
| Net sales | $ | 2,228 |
| | | | $ | 2,322 |
| | | | $ | (95 | ) |
| Cost of sales | (1,798 | ) | | (80.7 | )% | | (1,857 | ) | | (79.9 | )% | | 59 |
|
| Gross profit | $ | 430 |
| | 19.3 | % | | $ | 466 |
| | 20.1 | % | | $ | (36 | ) |
| Selling, general & administrative expenses | (156 | ) | | (7.0 | )% | | (110 | ) | | (4.7 | )% | | (46 | ) |
| Research, development & engineering expenses, net | (466 | ) | | (20.9 | )% | | (375 | ) | | (16.2 | )% | | (91 | ) |
| Goodwill impairment charges | — |
| | — |
| | (234 | ) | | (10.1 | )% | | 234 |
|
| Amortization of intangibles | (23 | ) | | (1.0 | )% | | (37 | ) | | (1.6 | )% | | 14 |
|
| Other income | 18 |
| | 0.8 | % | | 8 |
| | 0.3 | % | | 10 |
|
| Operating loss | $ | (197 | ) | | (8.8 | )% | | $ | (283 | ) | | (12.2 | )% | | $ | 86 |
|
| Loss from equity method investments | (63 | ) | | (2.8 | )% | | (31 | ) | | (1.3 | )% | | (32 | ) |
| Interest income | 7 |
| | 0.3 | % | | 1 |
| | — | % | | 6 |
|
| Interest (expense) | (1 | ) | | — | % | | — |
| | — | % | | (1 | ) |
| Other non-operating items, net | — |
| | — | % | | (1 | ) | | — | % | | 1 |
|
| Loss before income taxes | $ | (253 | ) | | (11.4 | )% | | $ | (314 | ) | | (13.5 | )% | | $ | 61 |
|
| Income tax expense | (42 | ) | | (1.9 | )% | | (30 | ) | | (1.3 | )% | | (12 | ) |
Net loss1 | $ | (294 | ) | | (13.2 | )% | | $ | (344 | ) | | (14.8 | )% | | $ | 50 |
|
| Less: Net loss attributable to non-controlling interest | (19 | ) | | (0.9 | )% | | (127 | ) | | (5.5 | )% | | 108 |
|
| Net loss attributable to controlling interest | $ | (276 | ) | | (12.4 | )% | | $ | (217 | ) | | (9.3 | )% | | $ | (59 | ) |
Net loss per share – basic2 | $ | (3.17 | ) | | | | $ | (2.49 | ) | | | | $ | (0.68 | ) |
Weighted average number of shares outstanding in millions2 | 87.16 |
| | | | 87.13 |
| | | | 0.03 |
1 Including Corporate and other sales.
| |
2
| Basic number of shares used to compute net loss per share. Participating share awards with right to receive dividend equivalents are (under the two class method) excluded from EPS calculation.
|
| |
3
| 2017 and first half of 2018 are according to Carve-out reporting from Autoliv Spin-Off of Veoneer. |
Gross Profit - The gross profit of $430 million for the full year of 2018 was $36 million lower as compared to 2017. The volume and product mix effect causing the lower organic sales was partially offset by a net favorable currency benefit of around $10 million.
Operating Loss - The operating loss of $197 million for the full year of 2018 decreased by $86 million as compared to 2017, including a net favorable currency benefit of $4 million. In 2017 the operating loss included a goodwill impairment charge related to VNBS of $234 million.
The planned increase in RD&E investments of $91 million, mainly related to the increase in engineers for future sales growth and current development programs, as well as $46 million higher SG&A, mainly resulting from the additional costs associated with being a standalone listed company, accounted for most of the change as compared to 2017.
These effects were partially offset by a decrease of $14 million in the amortization of intangibles related to historical acquisitions, and a $10 million increase in other income, both as compared to 2017.
Net Loss - The net loss for the full year of 2018 of $294 million decreased by $50 million as compared to 2017. In addition to the operating loss impact, the Veoneer net loss from Zenuity increased by $32 million. The Zenuity net loss increase is mainly due to the higher net cost run-rate related to the hiring of software engineers and an additional quarter of cost in 2018, since the JV was formed in April 2017. Interest income net increased by $6 million as compared to 2017. Income tax expense for 2018 was $42 million as compared to $30 million in 2017. The change in tax expense was primarily impacted by the change in mix of pre-tax earnings in our profitable subsidiaries and a non-cash, one-time discrete tax item of $23 million in 2018. The non-controlling interest loss in the VNBS JV was $19 million for 2018 as compared to $127 million loss in 2017 which included the goodwill impairment charge of $113 million.
Loss per Share - The loss per share for the full year of 2018 increased to $3.17 as compared to a loss of $2.49 per share in 2017 due to the increased net loss. The share count was virtually unchanged.
Reconciliations of U.S. GAAP to non U.S. GAAP
|
| | | | | | | |
| Dollars in millions | Year Ended December 31 |
| Net Loss to EBITDA | 2018 | | 2017 |
| Net Loss | $ | (294 | ) | | $ | (344 | ) |
| Depreciation and amortization | 111 |
| | 119 |
|
| Loss from equity method investment | 63 |
| | 31 |
|
| Interest and other non-operating items, net | (7 | ) | | 1 |
|
| Income tax | 42 |
| | 30 |
|
| EBITDA | $ | (87 | ) | | $ | (164 | ) |
|
| | | | | | | |
| Dollars in millions | Year Ended December 31 |
| Segment EBITDA to EBITDA | 2018 | | 2017 |
| Electronics | $ | (43 | ) | | $ | 67 |
|
| Brake Systems | 7 |
| | (210 | ) |
| Segment EBITDA | (36 | ) | | (143 | ) |
| Corporate and other | (51 | ) | | (21 | ) |
| EBITDA | $ | (87 | ) | | $ | (164 | ) |
|
| | | | | | | |
| Dollars in millions | Year Ended December 31 |
| Working Capital to Net Working Capital | 2018 | | 2017 |
| Total current assets | $ | 1,543 |
| | $ | 649 |
|
| Total current liabilities | 636 |
| | 590 |
|
| Working capital | $ | 907 |
| | $ | 59 |
|
| Cash and cash equivalents | (864 | ) | | — |
|
| Net working capital | $ | 42 |
| | $ | 59 |
|
Results of Operations
Full Year 2017 compared with 2016
The following tables show Veoneer’s performance by segment for the year ended 2017 and 2016 along with components of change.
|
| | | | | | | | | | | | | | | | | | | | | | | | | | | | | | | | | | | | | | | | |
| Electronics Segment | Year Ended December 31 | | Components of Change vs. Prior Year |
Dollars in millions, (except where specified) | 2017 | | 2016 | | U.S. GAAP Reported | | Currency | | Acquisitions / Divestitures | | Organic1 |
| $ | | % | | $ | | % | | Chg. $ | | Chg.% | | $ | | % | | $ | % | | $ | | % |
| Net Sales | $ | 1,850 |
| | |
| | $ | 1,837 |
| | |
| | $ | 14 |
| | 1 | % | | $ | 4 |
| | — | % | | $ | — |
| — | % | | $ | 11 |
| | 1 | % |
| Operating Loss / Margin | $ | (14 | ) | | (0.7 | )% | | $ | 11 |
| | 0.6 | % | | $ | (25 | ) | | |
| | |
| | |
| | |
| | | |
| | |
|
EBITDA1/% | $ | 67 |
| | 3.6 | % | | $ | 81 |
| | 4.4 | % | | $ | (14 | ) | | |
| | |
| | |
| | |
| | | |
| | |
|
| Associates | 5,898 |
| | |
| | 5,045 | | |
| | 853 |
| | |
| | |
| | |
| | |
| | | |
| | |
|
1 Non-U.S. GAAP measure reconciliation for Organic Sales and EBITDA
Net Sales - The net sales in the Electronics segment for the full year 2017 increased by $14 million to $1,850 million as compared to 2016. The difference was attributable to organic sales1 increase in Active Safety of approximately $38 million and favorable currency translation effects of around $4 million was partially offset by a decline in Restraint Controls Systems organic sales growth of around $27 million.
The quantities delivered for the full year 2017 were approximately 20 million and 10 million for Restraint Controls Systems and Active Safety, respectively.
Operating Loss - The operating loss in the Electronics segment increased by $25 million to $14 million for 2017 as compared to 2016. The increase is mainly due to the planned increase in RD&E costs to support future sales growth.
EBITDA1 - The Electronics segment EBITDA of $67 million in 2017 declined by $14 million as compared to 2016. In addition to the increased operating loss, amortization of intangibles declined mainly related to the effects of the MACOM acquisition.
Associates - The number of associates in the Electronics segment increased by approximately 853 since December 31, 2016 to 5,898 mainly due to increases in RD&E to support future organic sales growth and current development programs.
|
| | | | | | | | | | | | | | | | | | | | | | | | | | | | | | | | | | | | | | | | | |
| Brake Systems Segment | Year Ended December 31 | | Components of Change vs. Prior Year |
Dollars in millions, (except where specified) | 2017 | | 2016 | | U.S. GAAP Reported | | Currency | | Acquisitions / Divestitures | | Organic1 |
| $ | | % | | $ | | % | | Chg. $ | | Chg.% | | $ | | % | | $ | | % | | $ | | % |
| Net Sales | $ | 476 |
| | |
| | $ | 391 |
| | |
| | $ | 85 |
| | 22 | % | | $ | (7 | ) | | (2 | )% | | $ | 121 |
| | 31 | % | | $ | (29 | ) | | (7 | )% |
| Operating Loss / Margin | $ | (247 | ) | | (51.9 | )% | | $ | (12 | ) | | (3.1 | )% | | $ | (235 | ) | | |
| | |
| | |
| | |
| | | | |
| | |
|
EBITDA1/% | $ | (210 | ) | | (44.2 | )% | | $ | 24 |
| | 6.0 | % | | $ | (234 | ) | | |
| | |
| | |
| | |
| | | | |
| | |
|
| Associates | 1,586 |
| | |
| | 1,733 | | |
| | (147 | ) | | |
| | |
| | |
| | |
| | | | |
| | |
|
1 Non-U.S. GAAP measure reconciliation for Organic Sales and EBITDA
Net Sales - The net sales of $476 million in the Brake Systems segment for the full year 2017 increased by $85 million as compared to 2016. The increase was mainly attributable to the additional quarter of sales in 2017 since the joint venture was formed in April 2016 which was partially offset by lower volumes on certain Honda models, primarily in North America which was partially offset by higher volumes in Japan.
The quantities delivered for the full year 2017 were 2 million for Brake Systems.
Operating Loss - The operating loss in the Brake Systems segment decreased by $235 million to $247 million in 2017 as compared to 2016. This is mainly due to the volume and product mix impact due to lower organic sales and slight increase in RD&E costs to support sales growth which was more than offset by reduced overhead costs and the goodwill impairment charge of $234 million in 2017.
EBITDA1 - For 2017, the Brake Systems segment EBITDA of $(210) million decreased by $234 million compared to 2016.
Associates - The number of associates in the Brake Systems segment declined by 147 since December 31, 2016 to 1,586 mainly due to the reductions in direct manufacturing as well as production overhead and SG&A due to the sales decline.
|
| | | | | | | | | | | | | | | | | | | | |
| Corporate and Other | Year Ended December 31 |
Dollars in millions,
(except where specified) | 2017 | | 2016 | | U.S. GAAP Reported |
| $ | | % | $ | | % | | Chg. $ | | Chg.% |
| Net Sales | $ | — |
| | | | $ | — |
| | | | $ | — |
| | — | % |
| Operating Loss / Margin | $ | (22 | ) | | — | % | | $ | (24 | ) | | — | % | | $ | 2 |
| | |
Segment EBITDA 1/ Margin | $ | (21 | ) | | — | % | | $ | (24 | ) | | — | % | | $ | 2 |
| | |
| Associates | — |
| | | | — |
| | | | — |
| | |
1 Non-U.S. GAAP measure reconciliation for EBITDA
Operating Loss - The operating loss and EBITDA1 for Corporate and other for 2017 decreased to negative $22 million and $21 million, respectively, from negative $24 million as compared to 2016 mainly resulting from lower SG&A which is tied to the carve-out basis rules of reporting Veoneer related to the Spin-Off from Autoliv.
Associates - There were no associates in Corporate and other during 2017 and 2016. The associate and financial figures are not comparable since the financial results are based on carve-out basis accounting rules.
Net Sales by Product
The following tables show Veoneer’s consolidated net sales by product for the year ended December 31, 2017 and 2016 along with components of change compared to the prior year.
|
| | | | | | | | | | | | | | | | | | | | | | | | | | | | | | | | | | | |
| Consolidated Net Sales | Year Ended December 31 | | Components of Change vs. Prior Year |
Dollars in millions, (except where specified) | 2017 | | 2016 | | U.S. GAAP Reported | | Currency | | Acquisitions/Divestitures | | Organic1 |
| $ | | $ | | Chg. $ | | Chg. % | | $ | | % | | $ | | % | | $ | | % |
| Restraint Control Systems | $ | 1,073 |
| | $ | 1,097 |
| | $ | (24 | ) | | (2 | )% | | $ | 3 |
| | — | % | | $ | — |
| | — | % | | $ | (27 | ) | | (3 | )% |
| Active Safety | $ | 777 |
| | $ | 739 |
| | $ | 38 |
| | 5 | % | | $ | — |
| | — | % | | $ | — |
| | — | % | | $ | 38 |
| | 5 | % |
| Brake Systems | $ | 473 |
| | $ | 383 |
| | $ | 90 |
| | 23 | % | | $ | (7 | ) | | (2 | )% | | $ | 121 |
| | 31 | % | | $ | (24 | ) | | (6 | )% |
| Total | $ | 2,322 |
| | $ | 2,218 |
| | $ | 104 |
| | 5 | % | | $ | (3 | ) | | — | % | | $ | 121 |
| | 5 | % | | $ | (13 | ) | | (1 | )% |
1 Non-U.S. GAAP measure reconciliation for Organic Sales
Sales - Net sales for 2017 increased by 5% to $2,322 million as compared to 2016. The organic sales1 decline of 1% was more than offset by acquisition effects of the VNBS joint venture of 5% or $121 million as the currency translation effects were negligible.
Restraint Control Systems - Restraint Control Systems sales declined by 2% in 2017 as compared to 2016. The decrease in organic sales of 3% or $27 million was mainly driven by declines in North America, Japan and South Korea which were partially mitigated by increase in China and India.
Active Safety - Active Safety sales increased by 5% or $38 million as compared to 2016, driven essentially by an increase in organic sales. The Active Safety growth was positively impacted by double digit organic sales in core active safety products (including radars, cameras including night driving assist and ADAS ECU's). However, this growth was negatively impacted by sales declines for positioning systems in North America as well as the ramp-down in our internally developed brake systems in China.
Brake Systems - Brake Systems sales increased by 23% in 2017 as compared to 2016. This positive change was mainly driven by the full year operations impact of $121 million in the VNBS joint venture which was formed on April 1, 2016. The organic sales decline of 6% or $24 million was mainly attributable to product changes on certain vehicle models where Honda did not retain VNBS as the incumbent.
Veoneer Performance
The following table shows Veoneer’s performance for the year ended December 31, 2017 and 2016 along with components of change compared to the prior year.
|
| | | | | | | | | | | | | | | | | |
| Income Statement | Year Ended December 31 |
Dollars in thousands, (except per share data) | 2017 3 | | 2016 3 | | |
| $ | | % | | $ | | % | | Change |
| Net sales | $ | 2,322 |
| | | | $ | 2,218 |
| | | | $ | 104 |
|
| Cost of sales | (1,857 | ) | | (80.0 | )% | | (1,795 | ) | | (80.9 | )% | | (62 | ) |
| Gross profit | $ | 466 |
| | 20.0 | % | | $ | 423 |
| | 19.1 | % | | $ | 43 |
|
| Selling, general & administrative expenses | (110 | ) | | (4.7 | )% | | (110 | ) | | (5.0 | )% | | — |
|
| Research, development & engineering expenses, net | (375 | ) | | (16.1 | )% | | (300 | ) | | (13.5 | )% | | (75 | ) |
| Goodwill impairment charges | (234 | ) | | (10.1 | )% | | — |
| | — | % | | (234 | ) |
| Amortization of intangibles | (37 | ) | | (1.6 | )% | | (35 | ) | | (1.6 | )% | | (2 | ) |
| Other income | 8 |
| | 0.3 | % | | (4 | ) | | (0.2 | )% | | 12 |
|
| Operating loss | $ | (283 | ) | | (12.2 | )% | | $ | (25 | ) | | (1.1 | )% | | $ | (258 | ) |
| Loss from equity method investments | (31 | ) | | (1.3 | )% | | — |
| | — | % | | (31 | ) |
| Interest income | 1 |
| | — | % | | — |
| | — | % | | 1 |
|
| Interest (expense) | — |
| | — | % | | — |
| | — | % | | — |
|
| Other non-operating items, net | (1 | ) | | — | % | | 3 |
| | — | % | | (4 | ) |
| Loss before income taxes | $ | (314 | ) | | (13.5 | )% | | $ | (22 | ) | | (1.0 | )% | | $ | (292 | ) |
| Income tax expense | (30 | ) | | (1.4 | )% | | (38 | ) | | (1.7 | )% | | 8 |
|
Net loss1 | $ | (344 | ) | | (14.8 | )% | | $ | (60 | ) | | (2.7 | )% | | $ | (284 | ) |
| Less: Net loss attributable to non-controlling interest | (127 | ) | | (5.5 | )% | | (7 | ) | | (0.3 | )% | | (120 | ) |
| Net loss attributable to controlling interest | $ | (217 | ) | | (9.0 | )% | | $ | (53 | ) | | (2.4 | )% | | $ | (164 | ) |
Net loss per share – basic2 | $ | (2.49 | ) | | | | $ | (0.61 | ) | | | | $ | (1.88 | ) |
Weighted average number of shares outstanding in millions2 | 87.13 | | | | 87.13 | | | | 0.00 |
| |
1
| Including Corporate and other sales.
|
| |
2
| Basic number of shares used to compute net loss per share. Participating share awards with right to receive dividend equivalents are (under the two-class method) excluded from EPS calculation.
|
| |
3
| 2016 and 2017 are according to Carve-out reporting from Autoliv Spin-Off of Veoneer. |
Gross Profit - The gross profit for the full year 2017 increased by $43 million to $466 million as compared to 2016. This increase was primarily driven by the sales increase in Active Safety and the VNBS joint venture. In addition, lower material costs were partly offset by higher costs related to investments for capacity and growth.
Operating Loss - The operating loss of $283 million for 2017 increased by $258 million as compared to 2016, mainly due to the goodwill impairment charge of $234 million in 2017 due to lower than originally anticipated sales development in the VNBS joint venture.
In addition, planned higher RD&E investments of $75 million, in engineering resources to support future growth as illustrated by our strong order intake, more than offset the improvement in gross profit while SG&A remained relatively unchanged as compared to 2016.
The $12 million decrease in other income (expense), net was primarily impacted by a reduction of the contingent liability consideration related to the MACOM acquisition.
Net Loss - In addition to the operating loss effect, the Zenuity joint venture cost increased $31 million in 2017 as compared to 2016 since the joint venture was created in April 2017.
The income tax expense decrease of $8 million in 2017 as compared to 2016 was primarily due to a reduction in the earnings of our profitable non-US subsidiaries and an increase in tax credits. The increase in the non-controlling interest loss in the VNBS JV of $120 million was mainly due the goodwill impairment charge in 2017.
Loss per Share - The loss per share for 2017 increased to $2.49 as compared to a loss of $0.61 per share in 2016 due to the increased net loss, mainly related to the goodwill impairment charge in the VNBS joint venture, as the share count was virtually unchanged.
Reconciliations of U.S. GAAP to non U.S. GAAP
|
| | | | | | | |
| Dollars in millions | Year Ended December 31 |
| Net Loss to EBITDA | 2017 | | 2016 |
| Net Loss | $ | (344 | ) | | $ | (60 | ) |
| Depreciation and amortization | 119 |
| | 105 |
|
| Loss from equity method investment | 31 |
| | — |
|
| Interest and other non-operating items, net | 1 |
| | (3 | ) |
| Income tax | 30 |
| | 38 |
|
| EBITDA | $ | (164 | ) | | $ | 80 |
|
|
| | | | | | | |
| Dollars in millions | Year Ended December 31 |
| Segment EBITDA | 2017 | | 2016 |
| Electronics | $ | 67 |
| | $ | 81 |
|
| Brake Systems | (210 | ) | | 24 |
|
| Segment EBITDA | $ | (143 | ) | | $ | 104 |
|
| Corporate and other | (21 | ) | | (24 | ) |
| EBITDA | $ | (164 | ) | | $ | 80 |
|
|
| | | | | | | |
| Dollars in millions | Year Ended December 31 |
| Working Capital to Net Working Capital | 2017 | | 2016 |
| Total current assets | $ | 649 |
| | $ | 649 |
|
| Total current liabilities | 590 |
| | 576 |
|
| Working capital | $ | 59 |
| | $ | 73 |
|
| Cash and cash equivalents | — |
| | — |
|
| Net working capital | $ | 59 |
| | $ | 73 |
|
Liquidity and Capital Resources
Liquidity
As of December 31, 2018, the Company had cash and cash equivalents of $864 million and short-term investments of $5 million which will be primarily use for ongoing working capital requirements, capital expenditures and investments in joint ventures particularly Zenuity.
We expect the combined effects of a stronger LVP and new program launches in the second half of the year combinedconsistent with our own efficiency and prioritization initiatives to start to lead to improved cash-flow in the latter partobjective of the year. Assuming successful execution of these initiatives, we expect our net cash to cover our funding requirements until the Company reaches positive cash flow. However, additional funding may be required if order intake increases beyond our expectations, if the underlying near-term business conditions deteriorate further, or if we make acquisitions.
During the year ended December 31, 2017, the Company entered an unconditional purchase obligation whereof the outstanding balance as of December 31, 2018 is $10 million which will be paid in 2019. The amount will be reimbursed by Zenuity.encouraging Company-wide cooperation. In addition, the Company hasbelieves that a holdbacksingle performance metric enhances the transparency of $2 million relatedour annual incentive program and provides easy to understand information to our investors. We believe this simple, transparent approach supports good corporate governance.
| (1) | See page 44 of the Annual Report on Form 10-K for the fiscal year ended December 31, 2021, for a reconciliation of Free Cash Flow. |
Individual Performance Targets comprised 25% of the Fotonic acquisitionannual cash incentive award for the period July 1 to be paid in 2019. See Note 4, Business Combinations, to the consolidated financial statements included herein. The Company has no other material obligations other than short-term obligations related to operations, inventory, services, tooling and property, plant and equipment purchased in the ordinary course of business.
On June 30, 2017, Veoneer committed to make a $15 million investment in Autotech Fund I, L.P. pursuant to a limited partnership agreement, and as a limited partner, will periodically make capital contributions toward this total commitment amount. As of December 31, 2018, Veoneer contributed a total of approximately $8 million2021, for each named executive officer (other than the CEO). The Compensation Committee introduced individual performance targets to the fund. The initial term of the fund is set to expire on December 31, 2025. This fund focuses broadly on the automotive industry and complementsalign with the Company’s innovation strategy, particularlyinternal reorganization in the areas of active safety and autonomous driving. Under the limited partnership agreement, the general partner has the sole and exclusive right to manage, control and conduct the affairs of the fund.May 2021.
|
| | | | | | | | | | | |
| | Year Ended December 31 |
| Dollars in millions | 2018 | | 2017 | | 2016 |
| Selected cash flow items | $ | | $ | | $ |
Net working capital1 | $ | 42 |
| | $ | 59 |
| | $ | 73 |
|
| Net cash provided by operating activities | $ | (179 | ) | | $ | (1 | ) | | $ | (7 | ) |
| Capital expenditures | $ | (188 | ) | | $ | (110 | ) | | $ | (103 | ) |
| Equity method investment | $ | (71 | ) | | $ | — |
| | $ | — |
|
| Net Cash Used in investing activities | $ | (185 | ) | | $ | (230 | ) | | $ | (335 | ) |
| Net Cash Provided by financing activities | $ | 1,226 |
| | $ | 232 |
| | $ | 343 |
|
1 Non-U.S. GAAP measure see reconciliation for Net Working Capital
Net Working Capital1 - The net working capital of $42 million as of December 31, 2018 was a decrease of $17 million and $31 million as compared with 2017 and 2016, respectively. These decreases were mainly due to favorable timing effects in working capital.
Net Cash Used in Operating Activities - Net cash used in operating activities of $179 million for the year ended December 31, 2018 increased by $178 million and $172 million as compared with 2017 and 2016, respectively, due to change in net loss and timing effects in working capital.
Net Cash Used in Investing Activities - Net cash used in investing activities of $185 million for the year ended December 31, 2018 was $45 million lower and $150 million lower as compared with 2017 and 2016, respectively, mainly due to higher capital expenditures, which was more than offset by lower affiliate investments and acquisitions.
Net Cash Provided by Financing Activities - Net cash provided by financing activities for the year ended December 31, 2018 includes the net capital contribution from Autoliv at the Distribution Date.
Capital Expenditures - Capital expenditures during the year ended December 31, 2018 of $188 million, around 8% of sales, was $78 million and $85 million higher as compared with 2017 and 2016, respectively. This level as a percentage of sales in 2018 was in line with the full year expectation.
|
| | | | | | | | | | | |
| | | | | Year Ended December 31 |
| Associates | | 2018 | | 2017 | | 2016 |
| Total Associates | | 8,600 |
| | 7,484 |
| | 6,778 |
|
| Whereof: | | Direct Manufacturing | | 2,083 |
| | 2,232 |
| | 2,279 |
|
| | | R,D&E | | 4,676 |
| | 3,576 |
| | 2,775 |
|
| | | Temporary | | 1,329 |
| | 1,151 |
| | 1,046 |
|
Associates - The number of associates increased to 8,600 in 2018 by 1,116 compared to 2017, mainly due to the hiring of approximately 1,100 engineers to support our future sales growth and current development programs.
Off-Balance Sheet Arrangements
The Company does not have any off-balance sheet arrangements.
Contractual Obligations and Commitments
The table below reflects our contractual obligations as of December 31, 2018. The Company’s future contractual obligations have not changed materially.
|
| | | | | | | | | | | | | | | | | | | | |
Aggregate Contractual Obligations 1 | | Payments due by Period |
| (DOLLARS IN MILLIONS) | | Total | | Less than 1 year | | 1-3 years | | 3-5 years | | More than 5 years |
| Related party long-term debt | | 13 |
| | 1 |
| | 12 |
| | — |
| | — |
|
| Operating lease obligations | | 88 |
| | 17 |
| | 24 |
| | 12 |
| | 34 |
|
| Build-to-suit lease obligations | | 51 |
| | 3 |
| | 6 |
| | 6 |
| | 35 |
|
| Pension contribution requirements | | 36 |
| | 3 |
| | 5 |
| | 6 |
| | 22 |
|
| Capital lease obligations | | 15 |
| | 1 |
| | 12 |
| | 1 |
| | 1 |
|
| Other non-current liabilities reflected on the balance sheet | | 9 |
| | 2 |
| | 2 |
| | — |
| | 4 |
|
| Unconditional purchase obligations | | 10 |
| | 10 |
| | — |
| | — |
| | — |
|
| Total | | $ | 222 |
| | $ | 37 |
| | $ | 61 |
| | $ | 25 |
| | $ | 96 |
|
1 Excludes contingent liabilities arising from litigation, arbitration, regulatory actions or income taxesContractual obligations include related party long-term debt, lease and purchase obligations that are enforceable and legally binding on the Company. Non-controlling interest is not included in this table.
Related party long-term debt: The related party debt obligation relates to capital lease obligations. The capital lease obligations mainly relate to property and plants in Japan and is between Veoneer Nissin Brake Systems (a 51% owned subsidiary) and Nissin Kogyo. See Note 19, Relationship with Former Parent and Related Entities, to the consolidated financial statements included herein.
Operating lease obligations: The Company leases certain offices, manufacturing and research buildings, machinery, automobiles and data processing and other equipment. Such operating leases, some of which are non-cancelable and include renewals, expire on various dates. See Note 16, Commitments and Contingencies, to the consolidated financial statements included herein.
Build-to-suit lease obligations: The Company has entered into build-to-suit lease arrangements for certain buildings during 2017. See Note 16, Commitments and Contingencies, to the consolidated financial statements included herein.
Pension contribution requirements: The Company sponsors defined benefit plans that cover eligible employees in Japan, Canada, and France. In 2019, the expected contribution to all plans, including direct payments to retirees, is $3 million, of which the major contribution is $1 million for our Canada pension plans. Due to volatility associated with future changes in interest rates and plan asset returns, the Company cannot predict with reasonable reliability the timing and amounts of future funding requirements, and therefore the above table shows expected contributions (to funded plans, or direct payments to retirees in the case of unfunded plans) for 2019, but only shows benefit payments (from funded plans, or direct to retirees in the case of unfunded plans) for 2020 and subsequent years. We may elect to make contributions in excess of the minimum funding requirements for the Japan, Canada, and France plans in response to investment performance and changes in interest rates, or when we believe that it is financially advantageous to do so and based on other capital requirements. This contribution amount does not include plans considered to be multiemployer with Autoliv. See Note 2, Summary of Significant Accounting Policies, and Note 14, Retirement Plans, to the consolidated financial statements included herein.
Other non-current liabilities reflected on the balance sheet: The Company has $2 million of deferred purchase consideration, payable at the 18-month anniversary of the closing date.related to the Fotonic acquisition to be paid in 2019. See Note 4, Business Combinations, to the consolidated financial statements included herein.
Unconditional purchase obligations: During the year ended December 31, 2017, the Company entered into an unconditional purchase obligation of $30 million of which $10 million was paid in each of the years ended December 31, 2017 and December 31, 2018. The remaining $10 million will be paid in 2019. This amount will be reimbursed by Zenuity. There are no obligations other than short-term obligations related to inventory, services, tooling, and property, plant and equipment purchased in the ordinary course of business.
Autotech Venture Fund: On June 30, 2017, Veoneer committed to make a $15 million investment in Autotech Fund I, L.P. pursuant to a limited partnership agreement, and, as a limited partner, will periodically make capital contributions toward this total commitment amount. As of December 31, 2018, Veoneer has in total contributed $8 million to the fund. The initial term of the fund is set to expire on December 31, 2025. This fund focuses broadly on the automotive industry and complements the Company’s innovation strategy, particularly in the areas of active safety and autonomous driving. Under the limited partnership agreement, the general partner has the sole and exclusive right to manage, control, and conduct the affairs of the fund.
Significant Accounting Policies and Critical Accounting Estimates
New Accounting Pronouncements
The Company has considered all applicable recently issued accounting guidance. The Company has summarized in Note 2, Summary of Significant Accounting Policies to the consolidated financial statements included herein each of the recently issued accounting pronouncements and stated the impact or whether management is continuing to assess the impact.
Critical Accounting Estimates
The application of accounting policies necessarily requires judgments and the use of estimates by a Company’s management. Actual results could differ from these estimates. By their nature, these judgments are subject to an inherent degree of uncertainty. These judgments are based on our historical experience, terms of existing contracts, and management’s evaluation of trends in the industry, information provided by our customers and information available from other outside sources, as appropriate. Certain policies relate to estimates that involve matters that are highly uncertain at the time the accounting estimate is made and different estimates or changes to an estimate could have a material impact on the reported financial position, changes in financial condition or results of operations. Such critical estimates are discussed below. For these, materially different amounts could be reported under varied conditions and assumption. Other items in the Company's consolidated financial statements require estimation, however, in our judgment, they are not as critical as those discussed below.
Revenue Recognition
In accordance with ASC 606, Revenue from Contracts with Customers, revenue is measured based on consideration specified in a contract with a customer, adjusted for any variable consideration (i.e. price concessions or annual price adjustments) and estimated at contract inception. The Company recognizes revenue when it satisfies a performance obligation by transferring control over a product to a customer.
In addition, from time to time, Veoneer may make payments to customers in connection with ongoing and future business. These payments to customers are generally recognized as a reduction to revenue at the time of the commitment to make these payments, unless certain criteria are met, warranting capitalization. If the payments are capitalized, the amounts are amortized as the related goods are transferred. As of December 31, 2018, and 2017, the Company capitalized $54 million and $23 million, respectively, in Other non-current assets related payments to customers. The Company assesses these amounts for impairment. There was no impairment.
Taxes assessed by a governmental authority that are both imposed on and concurrent with a specific revenue-producing transaction, that are collected by the Company from a customer, are excluded from revenue.
Shipping and handling costs associated with outbound freight after control of a product has transferred to a customer are accounted for as a fulfillment cost and are included in cost of sales.
Nature of goods and services
The following is a description of principal activities from which the Company generates its revenue. The Company has two operating segments, Electronics and Brake Systems. Electronics includes all of electronics resources and expertise, restraint control systems and active safety products. Brake Systems provides brake control and actuation systems. The principal activities are essentially the sametargets for each of the segments. Both of the segments generate revenue from the sale of production partsindividual are designed to original equipment manufacturers (“OEMs”).
The Company accounts forstrengthen our desired culture. Each named executive officer’s individual products separately if they are distinct (i.e., if a product is separately identifiable from other items and if a customer can benefit from it on its own or with other resources that are readily available to the customer). The consideration,performance targets reflect our core values, including any price concession or annual price adjustments, is based on their stand-alone selling prices for each of the products. The stand-alone selling prices are determined based on the cost-plus margin approach.
The Company recognizes revenue for production parts primarily at a point in time.
For production parts with revenue recognized at a point in time, the Company recognizes revenue upon shipment to the customers and transfer of title and risk of loss under standard commercial terms (typically F.O.B. shipping point). There are certain contracts where the criteria to recognize revenue over time have been met (e.g., there is no alternative use to the Company and the Company has an enforceable right to payment). In such cases, at period end, the Company recognizes revenue and a related asset and associated cost of goods sold and inventory. However, the financial impact of these contracts is immaterial considering the very short production cycles and limited inventory days on hand, which is typical for the automotive industry.
The amount of revenue recognized is based on the purchase order price and adjusted for variable consideration (i.e. price concessions or annual price adjustments). Customers typically pay for the production parts based on customary business practices with payment terms averaging 30 days.
Contract balances
The contract assets related to the Company’s rights to consideration for work completed but not billed (generally in conjunction with contracts for which revenue is recognized over time) at the reporting date on production parts. The contract assets are reclassified into the receivables balance when the rights to receive payments become unconditional. There have been no impairment losses recognized related to contract assets arising from the Company’s contracts with customers.
Business Combinations
In accordance with accounting guidance for the provisions in FASB ASC 805, Business Combinations, the Company allocates the purchase price of an acquired business to its identifiable assets and liabilities based on estimated fair values. The excess of the purchase price over the amount allocated to the assets and liabilities, if any, is recorded as goodwill. In addition, an acquisition may include a contingent consideration component. The fair value of the contingent consideration is estimated as of the date of the acquisition and is recorded as part of the purchase price. Each quarter this contingent consideration is re-measured using the discounted cash flow method.
The Company uses actual revenue levels as well as changes in the estimated probability of different revenue scenarios to estimate fair values. The Company has engaged outside appraisal firms to assist in the fair value determination of identifiable intangible assets and any other significant assets or liabilities. The Company adjusts the preliminary purchase price allocation, as necessary, up to one year after the acquisition closing date as the Company obtains more information regarding asset valuations and liabilities assumed.
The Company’s purchase price allocation methodology contains uncertainties because it requires management to make assumptions and to apply judgment to estimate the fair value of acquired assets and liabilities. Management estimates the fair value of assets and liabilities based upon quoted market prices, the carrying value of the acquired assets and widely accepted valuation techniques, including discounted cash flows and market multiple analyses. Unanticipated events or circumstances may occur which could affect the accuracy of our fair value estimates, including assumptions regarding industry economic factors and business strategies.
Other estimates used in determining fair value include, but are not limited to future cash flows or income related to intangibles, market rate assumptions, actuarial assumptionsteam member development and integration, customer focus, and performance and team motivation, the achievement of which is assessed by our CEO and approved by the Compensation Committee.
Actual Cash Incentive Award Levels
For 2021, Operating Cash Flow was approximately $(312) million and the payout was made at one point five (1.5) times the target level, weighted 100% for benefit plansthe period January 1 – June 30 and appropriate discount rates. The Company estimates75% for the fair value based upon assumptions believed to be reasonable, but these are inherently uncertain, and therefore, may not be realized. Accordingly, there can be no assurance that the estimates, assumptions, and values reflected in the valuations will be realized, and actual results could vary materially.period July 1 – December 31, as described above.
Equity Method Investments
The Company initially accountsCompensation Committee approved the payout for an equity method investment at its fair value onour named executive officer’s achievement of individual performance target between 1.417 – 1.583 times the date of acquisition. See Note 2, Summary of Significant Accounting Policies and Note 9, Investments related totarget level, weighted 25% for the Company’s investment in Zenuity, to the consolidated financial statements included.period July 1 – December 31, as described above.
Inventory Reserves
Inventories are evaluated based on individual or, in some cases, groups of inventory items. Reserves are established to reduce the value of inventories to the lower of cost and net realizable value. Net realizable value is the estimated selling prices in the ordinary course of business, less reasonably predictable costs of completion, disposal and transportation. Excess inventories are quantities of items that exceed anticipated sales or usage for a reasonable period. The Company has guidelines for calculating provisions for excess inventories based on the number of months of inventories on hand compared to anticipated sales or usage. Management uses its judgment to forecast sales or usage and to determine what constitutes a reasonable period.
There can be no assurance that the amount ultimately realized for inventories will not be materially different than that assumed in the calculation of the reserves.
Goodwill and Intangibles
The Company performs an annual impairment review of goodwill in the fourth quarter of each year following the Company’s annual forecasting process. Management uses its judgment to determine the Company’s reporting unitsactual cash incentive awards earned by our named executive officers for goodwill impairment testing. The estimated fair market value of goodwill is determined by the discounted cash flow method. The Company discounts projected operating cash flows using its weighted average cost of capital. Estimating the fair value requires the Company to make judgments about appropriate discount rates, growth rates, relevant comparable company earnings multiples and the amount and timing of expected future cash flows. If the fair value of the reporting unit is less than its carrying amount, an impairment loss is recognized for the excess of carrying amount over the fair value of the respective reporting unit.
In the fourth quarter of 2017, in connection with the annual impairment test, the Company recorded a goodwill impairment charge of $234 million in its Electronics Segment, relating to the VNBS acquisition. For more information, see Note 2, Summary of Significant Accounting Policies, to the consolidated financial statements included herein) due to lower than originally anticipated sales development. There is no remaining goodwill related to VNBS after the impairment. There were no goodwill impairments recognized during 2018 and 2016.
The Company reviews indefinite-lived intangible assets for impairment annually or more frequently if events or changes in circumstances indicate the assets might be impaired. Similar to the goodwill impairment test described above, the Company performs a quantitative impairment test by comparing the estimated fair value of the asset, based upon its forecasted cash flows, to its carrying value. Other intangible assets with definite lives are amortized over their useful lives. The Company evaluates the carrying value and useful lives of long-lived assets other than goodwill when indications of impairment are evident, or it is likely that the useful lives have decreased, in which case the Company depreciates the assets over the remaining useful lives. Impairment testing is primarily done by using the cash flow method based on undiscounted future cash flows. Estimated undiscounted cash flows for a long-lived asset being evaluated for recoverability are compared with the respective carrying amount of that asset. If the estimated undiscounted cash flows exceed the carrying amount of the assets, the carrying amounts of the long-lived asset are considered recoverable and an impairment cannot be recorded. However, if the carrying amount of a group of assets exceeds the undiscounted cash flows, an entity must then measure the long-lived assets’ fair value to determine whether an impairment loss should be recognized, generally using a discounted cash flow model.
Recall Provisions and Warranty Obligations
The Company records liabilities for product recalls when probable claims are identified and when it is possible to reasonably estimate costs. Recall costs are costs incurred when the customer decides to formally recall a product due to a known or suspected safety concern. Product recall costs typically include the cost of the product being replaced as well as the customer’s cost of the recall, including labor to remove and replace the defective part. In some cases, portions of the product recall costs are reimbursed by an insurance company. Actual costs incurred could differ from the amounts estimated, requiring adjustments to these reserves in future periods. It is possible that changes in our assumptions or future product recall issues could materially affect our financial position, results of operations or cash flows.
Estimating warranty obligations requires the Company to forecast the resolution of existing claims and expected future claims on products sold. The Company bases the estimate on historical trends of units sold and payment amounts, combined with our current understanding of the status of existing claims and discussions with our customers. These estimates are re-evaluated on an ongoing basis. Actual warranty obligations could differ from the amounts estimated requiring adjustments to existing reserves in future periods. Due to the uncertainty and potential volatility of the factors contributing to developing these estimates, changes in our assumptions could materially affect our results of operations.
Defined Benefit Pension Plans
Veoneer’s employees participate in defined benefit plans sponsored by Autoliv and certain defined benefit plans sponsored by Veoneer in Japan (the Japan plans), France (the France plans), and Canada (the Canada plans).
For the Japan, French, and Canada plans, the amount recognized as a defined benefit liability is the net total of projected benefit obligation (PBO) minus the fair value of plan assets (if any). The plan assets are measured at fair value. Net periodic benefit cost was reported within Costs of sales, Selling, general and administrative expenses and RD&E expenses in the Consolidated Statement of Operations.
Veoneer has considered the remaining plans to be part of a multiemployer plan with Autoliv. Pension expense was allocated for these plans and reported within Costs of sales, Selling, general and administrative expenses and RD&E expenses in the Consolidated Statement of Operations.
Of the plans sponsored by Veoneer, the most significant plans are the Japan plans. These plans represent approximately 44% of the Company’s total pension benefit obligation. See Note 14, Retirement Plans, to the consolidated financial statements included herein.
The Company, in consultation with its actuarial advisors, determines certain key assumptions to be used in calculating the projected benefit obligation and annual pension expense. For the Japan plans, the assumptions used for calculating the 2018 pension expense were a discount rate of 0.5%, expected rate of increase in compensation levels of 5.0%, and an expected long-term rate of return on plan assets of 0.75%.
The discount rate for the Japanese plans has been set based on the rates of return of high-quality fixed-income investments currently available at the measurement date and are expected to be available during the period the benefits will be paid. The expected rate of increase in compensation levels and long-term return on plan assets are determined based on a number of factors and must take into account long-term expectations and reflect the financial environment in the respective local markets. As of December 31, 2018 and 2017, 100% and 97% of the Japanese plan assets were invested in insurance contracts.
Income Taxes
Significant judgment is required in determining the worldwide provision for income taxes. In the ordinary course of a global business, there are many transactions for which the ultimate tax outcome is uncertain. Many of these uncertainties arise as a consequence of intercompany transactions. See Note 1, Basis of Presentation, Note 6, Income Taxes and Note 19, Relationship with Parent and Related Entities, to the Consolidated Financial Statements included herein.
Although the Company believes that its tax return positions are supportable, no assurance can be given that the final outcome of these matters will not be materially different than that which2021 is reflected in the historical income tax provisions and accruals. Such differences could have a material effect on the income tax provisions or benefits in the periods in which such determinations are made. See also the discussion of the determinations of valuation allowances on our deferred tax assets in Note 6, Income Taxes, to the consolidated financial statements included herein.table below.
Contingent Liabilities
Various claims, lawsuits and proceedings are pending or threatened against the Company or its subsidiaries, covering a range of matters that arise in the ordinary course of its business activities with respect to commercial, product liability or other matters. For a discussion of legal matters we are involved in, see Note 16, Contingent Liabilities, to the condensed consolidated financial statements included herein.
The Company diligently defends itself in such matters and, in addition, carries insurance coverage to the extent reasonably available against insurable risks.
The Company records liabilities for claims, lawsuits and proceedings when they are probable, and it is possible to reasonably estimate the cost of such liabilities. Legal costs expected to be incurred in connection with a loss contingency are expensed as such costs are incurred.
A loss contingency is accrued by a charge to income if it is probable that an asset has been impaired, or a liability has been incurred and the amount of the loss can be reasonably estimated. In determining whether a loss should be accrued management evaluates, among other factors, the degree of probability of an unfavorable outcome and the ability to make a reasonable estimate of the amount of loss. Changes in these factors could materially impact our consolidated financial statements.
Item 7A. Quantitative and Qualitative Disclosures about Market Risk
Currency Risks
Transaction Exposure and Revaluation Effects
Transaction exposure arises because the cost of a product originates in one currency and the product is sold in another currency. Revaluation effects come from valuation of assets denominated in other currencies than the reporting currency of each unit.
The Company’s gross transaction exposure for 2018 was approximately $0.7 billion. A part of the currency flows had counter-flows in the same currency pair, which reduced the net exposure to approximately $0.6 billion. The five largest net transaction exposures were the sale of Euro against Swedish Krona, the purchase of U.S. Dollars against Swedish Krona, the purchase of U.S. Dollar against Korean Won, the sale of U.S. Dollars against Chinese Renminbi and the purchase of U.S. Dollar against Euro. Together these currencies accounted for approximately 76% of the Company’s net currency transaction exposure.
Since the Company can only effectively hedge these currency flows in the short term, periodic hedging would only reduce the impact of fluctuations temporarily. Over time, periodic hedging would postpone but not reduce the impact of fluctuations. In addition, the net exposure is limited to approximately one quarter of net sales and is made up of close to 20 different currency pairs with exposures of more than $1 million each. Veoneer generally does not hedge these flows. However, for some purchased components from external suppliers, the Company may enter into hedging from time to time. There were no foreign exchange forward contracts outstanding as of December 31, 2018.
Translation Exposure in the Statement of Operations and Balance Sheet
The Company estimates that a 1% increase in the value of the U.S. dollar versus European currencies would decrease reported U.S. dollar annual net sales in 2018 by $7 million or by 0.3% while it would have a positive impact on the operating loss for 2018 by approximately 0.6% or by about $1 million, assuming reported corporate average margin.
Interest Rate Risk
As of December 31, 2018 we also had approximately $864 million of cash and cash equivalents and $5 million of short-term investments. As of December 31, 2018, the company estimates that a 1% change of the interest rates would not significantly impact our interest expense or income.
Component Costs
Veoneer procures raw material and components from a variety of suppliers around the world. Generally, we seek to obtain mechanical components and material in the region in which our products are manufactured to limit transportation, currency risks and other costs. The most significant raw materials we use to manufacture our products are various electrical components, non-ferrous metals and ferrous metals for brake systems. We have not experienced any significant shortages of raw materials and normally do not carry inventories of such raw materials more than those reasonably required to meet our production and shipping schedules. Despite this, material price changes in Veoneer’s supply chain could have a significant impact on its profitability.
Changes in most raw material prices affect the Company with a time lag. For non-ferrous metals like aluminum and zinc, we have quarterly and sometimes monthly price adjustments.
The Company’s strategies to offset price increases on cost of materials include working with suppliers to mitigate costs, seeking alternative product designs and material specifications, combining purchase requirements with our customers and/or suppliers, changing suppliers, and other means. However, should these actions not be sufficient to offset component price increases, our earnings could be materially impacted.
Item 8. Financial Statements and Supplementary Data
Veoneer, Inc.
Index to Consolidated Financial Statements
| Year |
| |
| | |
Audited Consolidated Financial Statements of Veoneer, Inc. | |
| |
Flow Metric | Individual Performance Mr. Pekar | Payout Individual Performance Mr. Sjöbring | Payout Individual Performance Mr. Bieler | Payout Individual Performance Mr. Bisciotti | Payout Individual Performance Mr. Rodé |
| 2021 | |
| 1.5 x Target | |
| 1.5 x Target | |
| 1.583 x Target | |
| 1.417 x Target | |
| 1.583 x Target | |
| |
| |
| |
| |
| |
| |
| |
Audited Consolidated Financial Statements of Zenuity AB | |
| |
| |
| |
| |
| |
| 1.417 x Target |
Report of Independent Registered Public Accounting Firm
To the Shareholders and the Board of Directors of Veoneer, Inc.
Opinion on the Financial Statements
We have audited the accompanying consolidated balance sheets of Veoneer, Inc. (the Company) as of December 31, 2018 and 2017, the related consolidated statements of operations, comprehensive loss, cash flows and changes in equity for each of the three years in the period ended December 31, 2018 and the related notes (collectively referred to as the “consolidated financial statements”). In our opinion, the consolidated financial statements present fairly, in all material respects, the financial position of the Company at December 31, 2018 and 2017, and the results of its operations and its cash flows for each of the three years in the period ended December 31, 2018, in conformity with U.S. generally accepted accounting principles.
Basis for Opinion
These financial statements are the responsibility of the Company's management. Our responsibility is to express an opinion on the Company’s financial statements based on our audits. We are a public accounting firm registered with the Public Company Accounting Oversight Board (United States) (PCAOB) and are required to be independent with respect to the Company in accordance with the U.S. federal securities laws and the applicable rules and regulations of the Securities and Exchange Commission and the PCAOB.
We conducted our audits in accordance with the standards of the PCAOB. Those standards require that we plan and perform the audit to obtain reasonable assurance about whether the financial statements are free of material misstatement, whether due to error or fraud. The Company is not required to have, nor were we engaged to perform, an audit of its internal control over financial reporting. As part of our audits we are required to obtain an understanding of internal control over financial reporting but not for the purpose of expressing an opinion on the effectiveness of the Company's internal control over financial reporting. Accordingly, we express no such opinion.
Our audits included performing procedures to assess the risks of material misstatement of the financial statements, whether due to error or fraud, and performing procedures that respond to those risks. Such procedures included examining, on a test basis, evidence regarding the amounts and disclosures in the financial statements. Our audits also included evaluating the accounting principles used and significant estimates made by management, as well as evaluating the overall presentation of the financial statements.Restricted Stock Units. We believe that our auditsRSUs provide a reasonable basis for our opinion.powerful tool to retain valuable executives because:
/s/ Ernst & Young AB
We have served as the Company’s auditor since 2017.
Stockholm, Sweden
February 22, 2019
Veoneer, Inc.
Consolidated Statements of Operations
(U.S. DOLLARS IN MILLIONS)
|
| | | | | | | | | | | | | | |
| | | | | Year Ended December 31 |
| | | | | 2018 | | 2017 | | 2016 |
| Net sales | | Note 3 | | $ | 2,228 |
| | $ | 2,322 |
| | $ | 2,218 |
|
| Cost of sales | | | | (1,798 | ) | | (1,857 | ) | | (1,795 | ) |
| Gross profit | | | | 430 |
| | 466 |
| | 423 |
|
| Selling, general and administrative expenses | | | | (156 | ) | | (110 | ) | | (110 | ) |
| Research, development and engineering expenses, net | | | | (466 | ) | | (375 | ) | | (300 | ) |
| Goodwill, impairment charge | | Note 11 | | — |
| | (234 | ) | | — |
|
| Amortization of intangibles | | Note 11 | | (23 | ) | | (37 | ) | | (35 | ) |
| Other income (expense), net | | | | 18 |
| | 8 |
| | (4 | ) |
| Operating loss | | | | (197 | ) | | (283 | ) | | (25 | ) |
| Loss from equity method investment | | Note 9 | | (63 | ) | | (31 | ) | | — |
|
| Interest income | | | | 7 |
| | — |
| | — |
|
| Interest expense | | | | (1 | ) | | — |
| | — |
|
| Other non-operating items, net | | | | — |
| | (1 | ) | | 3 |
|
| Loss before income taxes | | | | (253 | ) | | (314 | ) | | (22 | ) |
| Income tax expense | | Note 6 | | (42 | ) | | (30 | ) | | (38 | ) |
| Net loss | | | | (294 | ) | | (344 | ) | | (60 | ) |
| Less: Net loss attributable to non-controlling interest | | | | (19 | ) | | (127 | ) | | (7 | ) |
| Net loss attributable to controlling interest | | | | $ | (276 | ) | | $ | (217 | ) | | $ | (53 | ) |
| | | | | | | | | |
| Net loss per share - basic | | Note 17 | | $ | (3.17 | ) | | $ | (2.49 | ) | | $ | (0.61 | ) |
| Net loss per share - diluted | | | | $ | (3.17 | ) | | $ | (2.49 | ) | | $ | (0.61 | ) |
| | | | | | | | | |
Weighted average number of shares outstanding, (in millions) | | Note 17 | | 87.16 |
| | 87.13 |
| | 87.13 |
|
Weighted average number of shares outstanding, assuming dilution (in millions) | | | | 87.16 |
| | 87.13 |
| | 87.13 |
|
See Notes to Consolidated Financial Statements.
Veoneer, Inc.
Consolidated Statements of Comprehensive Loss
(U.S. DOLLARS IN MILLIONS)
|
| | | | | | | | | | | | |
| | | Year Ended December31 |
| | | 2018 | | 2017 | | 2016 |
| Net loss | | $ | (294 | ) | | $ | (344 | ) | | $ | (60 | ) |
| Other comprehensive (loss) income, before tax: | | | | | | |
| Change in cumulative translation adjustment | | (9 | ) | | 30 |
| | (17 | ) |
| Net change in cash flow hedges | | 1 |
| | (9 | ) | | 8 |
|
| Pension liability | | (4 | ) | | — |
| | (4 | ) |
| Other comprehensive (loss) income, before tax | | (12 | ) | | 21 |
| | (13 | ) |
| Income /(expense) for taxes | | 1 |
| | — |
| | (1 | ) |
| Other comprehensive (loss) income, net of tax | | (10 | ) | | 21 |
| | (14 | ) |
| Comprehensive loss | | (304 | ) | | (323 | ) | | (74 | ) |
| Less: Comprehensive loss attributable to non-controlling interest | | (19 | ) | | (127 | ) | | (7 | ) |
| Comprehensive loss attributable to controlling interest | | $ | (285 | ) | | $ | (196 | ) | | $ | (67 | ) |
See Notes to Consolidated Financial Statements.
Veoneer, Inc.
Consolidated Balance Sheets
(U.S. DOLLARS IN MILLIONS)
|
| | | | | | | | | | |
| | | | | As of December 31 |
| | | | | 2018 | | 2017 |
| Assets | | | | | | |
| Cash and cash equivalents | | | | $ | 864 |
| | $ | — |
|
| Short-term investments | | | | 5 |
| | — |
|
| Receivables, net | | Note 7 | | 376 |
| | 448 |
|
| Inventories, net | | Note 8 | | 172 |
| | 154 |
|
| Related party receivable | | Note 19 | | 64 |
| | 13 |
|
| Prepaid expenses and other contract assets | | | | 39 |
| | 34 |
|
| Other current assets | | | | 22 |
| | — |
|
| Total current assets | | | | 1,543 |
| | 649 |
|
| Property, plant and equipment, net | | Note 10 | | 499 |
| | 362 |
|
| Equity method investment | | Note 9 | | 101 |
| | 98 |
|
| Goodwill | | Note 11 | | 291 |
| | 292 |
|
| Intangible assets, net | | Note 11 | | 102 |
| | 122 |
|
| Deferred tax assets | | Note 6 | | 11 |
| | 30 |
|
| Related party notes receivable | | Note 19 | | 1 |
| | 76 |
|
| Investments | | | | 8 |
| | — |
|
| Other non-current assets | | | | 77 |
| | 34 |
|
| Total assets | | | | $ | 2,632 |
| | $ | 1,663 |
|
| Liabilities and equity | | | | | | |
| Accounts payable | | | | $ | 369 |
| | $ | 320 |
|
| Related party payables | | Note 19 | | 16 |
| | 8 |
|
| Accrued expenses | | Note 12 | | 193 |
| | 195 |
|
| Income tax payable | | Note 6 | | 9 |
| | 41 |
|
| Other current liabilities | | | | 47 |
| | 26 |
|
| Related party short-term debt | | Note 19 | | 1 |
| | 0 |
|
| Total current liabilities | | | | 636 |
| | 590 |
|
| Related party long-term debt | | Note 19 | | 13 |
| | 62 |
|
| Pension liability | | Note 14 | | 20 |
| | 14 |
|
| Deferred tax liabilities | | Note 6 | | 13 |
| | 17 |
|
| Other non-current liabilities | | | | 25 |
| | 22 |
|
| Total non-current liabilities | | | | 70 |
| | 115 |
|
| Commitments and contingencies | | Note 16 | |
| |
|
| Equity | | | | | | |
| Common stock (par value $1.00, 325 million shares authorized, 87 million shares issued and outstanding at December 31, 2018 and December 31, 2017) | | | | 87 |
| | — |
|
| Additional paid-in capital | | | | 1,938 |
| | — |
|
| Accumulated deficit | | | | (181 | ) | | — |
|
| Net Former Parent investment | | | | — |
| | 844 |
|
| Accumulated other comprehensive loss | | | | (19 | ) | | (8 | ) |
| Total Equity | | | | 1,826 |
| | 836 |
|
| Non-controlling interest | | | | 101 |
| | 122 |
|
| Total Equity and non-controlling interests | | | | 1,927 |
| | 957 |
|
| Total liabilities, Equity and non-controlling interests | | | | $ | 2,632 |
| | $ | 1,663 |
|
See Notes to Consolidated Financial Statements.
Veoneer, Inc.
Consolidated Statements of Cash Flow
(U.S. DOLLARS IN MILLIONS)
|
| | | | | | | | | | | | |
| | | Years Ended December 31 |
| | | 2018 | | 2017 | | 2016 |
| Operating activities | | | | | | |
| Net loss | | $ | (294 | ) | | $ | (344 | ) | | $ | (60 | ) |
| Adjustments to reconcile net loss to net cash (used in) / provided by operating activities: | | | | | | |
| Depreciation and amortization | | 111 |
| | 119 |
| | 106 |
|
| Undistributed loss from equity method investments | | 63 |
| | 31 |
| | — |
|
| Stock-based compensation | | 5 |
| | 2 |
| | 3 |
|
| Contingent consideration write-down | | (14 | ) | | (13 | ) | | — |
|
| Deferred income taxes | | 15 |
| | (11 | ) | | (11 | ) |
| Goodwill, impairment charge | | — |
| | 234 |
| | — |
|
| Other, net | | (29 | ) | | (29 | ) | | (12 | ) |
| Change in operating assets and liabilities | | | | | | |
| Receivables, gross | | 58 |
| | 12 |
| | (153 | ) |
| Accounts payable | | 10 |
| | (11 | ) | | 68 |
|
| Related party receivable and payables, net | | (46 | ) | | — |
| | 5 |
|
| Income taxes | | (40 | ) | | 10 |
| | 20 |
|
| Inventories, gross | | (22 | ) | | 19 |
| | (8 | ) |
| Accrued expenses | | 4 |
| | (9 | ) | | 64 |
|
| Prepaid expenses and contract assets | | (6 | ) | | (1 | ) | | (19 | ) |
| Other current assets and liabilities, net | | 6 |
| | (9 | ) | | (11 | ) |
| Net cash used in operating activities | | (179 | ) | | (1 | ) | | (7 | ) |
| Investing activities | | | | | | |
| Net decrease / (increase) in related party notes receivable | | 76 |
| | (2 | ) | | (8 | ) |
| Proceeds from sale of property, plant and equipment | | 4 |
| | 7 |
| | 2 |
|
| Capital expenditures | | (188 | ) | | (110 | ) | | (103 | ) |
| Equity method investment | | (71 | ) | | — |
| | — |
|
| Short-term investments | | (5 | ) | | — |
| | — |
|
| Acquisition of intangible assets | | (1 | ) | | — |
| | — |
|
| Acquisition of businesses and interest in affiliates, net of cash acquired | | — |
| | (125 | ) | | (226 | ) |
| Net cash used in investing activities | | (185 | ) | | (230 | ) | | (335 | ) |
| Financing activities | | | | | | |
| Cash provided at separation by Former Parent | | 980 |
| | — |
| | — |
|
| Net transfers from Former Parent | | 294 |
| | 184 |
| | 327 |
|
| Net increase / (decrease) in related party short-term debt | | 1 |
| | (4 | ) | | 4 |
|
| (Decrease)/ increase in related party long-term debt | | (49 | ) | | 51 |
| | 12 |
|
| Net cash provided by financing activities | | 1,226 |
| | 232 |
| | 343 |
|
| Effect of exchange rate changes on cash and cash equivalents | | 2 |
| | — |
| | — |
|
| Increase in cash and cash equivalents | | 864 |
| | — |
| | — |
|
| Cash and cash equivalents at beginning of year | | — |
| | — |
| | — |
|
| Cash and cash equivalents at end of year | | $ | 864 |
| | $ | — |
| | $ | — |
|
| Supplemental Disclosures: | | | | | | |
| Cash paid for income taxes | | $ | 39 |
| | $ | 30 |
| | $ | 19 |
|
See Notes to Consolidated Financial Statements.
Veoneer, Inc.
Consolidated Statements of Changes in Equity
(U.S. DOLLARS IN MILLIONS)
|
| | | | | | | | | | | | | | | | | | | | | | | | | | | |
| | Common Stock | | Additional Paid In Capital
| | Net Former Parent Investment | | Accumulated Deficit | | Accumulated Other Comprehensive Loss | | Non-controlling Interests | | Total |
| 2016 |
| Balance at January 1, 2016 | $ | — |
| | $ | — |
| | $ | 606 |
| | $ | — |
| | $ | (15 | ) | | $ | — |
| | $ | 591 |
|
| Comprehensive Loss: |
| Net loss | — |
| | — |
| | (53 | ) | | — |
| | — |
| | (7 | ) | | (60 | ) |
| Net change in cash flow hedges | — |
| | — |
| | — |
| | — |
| | 8 |
| | — |
| | 8 |
|
| Foreign currency translation | — |
| | — |
| | — |
| | — |
| | (17 | ) | | (7 | ) | | (25 | ) |
| Pension liability | — |
| | — |
| | — |
| | — |
| | (5 | ) | | — |
| | (5 | ) |
| Total Comprehensive Loss | — |
| | — |
| | (53 | ) | | — |
| | (14 | ) | | (14 | ) | | (81 | ) |
| Investment in subsidiary by non-controlling interest | — |
| | — |
| | — |
| | — |
| | — |
| | 252 |
| | 252 |
|
| Net transfers from Former Parent | | | | | 324 |
| | | |
|
| | 4 |
| | 327 |
|
| Balance at December 31, 2016 | $ | — |
| | $ | — |
| | $ | 877 |
| | $ | — |
| | $ | (29 | ) | | $ | 242 |
| | $ | 1,089 |
|
| 2017 |
| Comprehensive Income (Loss): |
| Net loss | — |
| | — |
| | (217 | ) | | — |
| | — |
| | (127 | ) | | (344 | ) |
| Net change in cash flow hedges | — |
| | — |
| | — |
| | — |
| | (9 | ) | | — |
| | (9 | ) |
| Foreign currency translation | — |
| | — |
| | — |
| | — |
| | 30 |
| | 7 |
| | 37 |
|
| Total Comprehensive income (Loss) | — |
| | — |
| | (217 | ) | | — |
| | 21 |
| | (120 | ) | | (316 | ) |
| Net transfers from Former Parent | — |
| | — |
| | 184 |
| | — |
| | — |
| | — |
| | 184 |
|
| Balance at December 31, 2017 | $ | — |
| | $ | — |
| | $ | 844 |
| | $ | — |
| | $ | (8 | ) | | $ | 122 |
| | $ | 957 |
|
| 2018 |
| Adoption of ASC 606 | $ | — |
| | $ | — |
| | $ | 1 |
| | $ | — |
| | $ | — |
| | $ | — |
| | $ | 1 |
|
| Comprehensive Income (Loss): |
| Net loss | — |
| | — |
| | (95 | ) | | (181 | ) | | — |
| | (19 | ) | | (294 | ) |
| Net change in cash flow hedges | — |
| | — |
| | — |
| | — |
| | 1 |
| | — |
| | 1 |
|
| Foreign currency translation | — |
| | — |
| | — |
| | — |
| | (9 | ) | | (1 | ) | | (10 | ) |
| Pension liability | — |
| | — |
| | — |
| | — |
| | (3 | ) | | 1 |
| | (2 | ) |
| Reclassification of Former Parent's net investment and issuance of ordinary shares in connection with separation | 87 |
| | 1,935 |
| | (2,003 | ) | | — |
| | — |
| | — |
| | 19 |
|
| Stock based compensation expense | — |
| | 3 |
| | — |
| | — |
| | — |
| | — |
| | 3 |
|
| Total Comprehensive Income (Loss) | 87 |
| | 1,938 |
| | (2,098 | ) | | (181 | ) | | (10 | ) | | (19 | ) | | (283 | ) |
| Net transfers from Former Parent | — |
| | — |
| | 1,253 |
| | — |
| | — |
| | (1 | ) | | 1,252 |
|
| Balance at December 31, 2018 | $ | 87 |
| | $ | 1,938 |
| | $ | — |
| | $ | (181 | ) | | $ | (19 | ) | | $ | 101 |
| | $ | 1,927 |
|
See Notes to Consolidated Financial Statements.
Veoneer, Inc.
Notes to Consolidated Financial Statements
(U.S. DOLLARS IN MILLIONS)
NOTE 1. Basis of Presentation
On June 29, 2018 (the “Distribution Date”), Veoneer, Inc. (“Veoneer” or “the Company”) became an independent, publicly-traded company as a result of the distribution by Autoliv, Inc. (“Autoliv” or “Former Parent”) of 100 percent of the outstanding common stock of Veoneer to the stockholders of Autoliv (the “Spin-Off”). Each Autoliv stockholder and holder of Autoliv’s Swedish Depository Receipts (SDRs) of record as of certain specified dates received one share of Veoneer common stock or one Veoneer SDR, respectively, for every one share of Autoliv common stock or Autoliv SDR held as of a certain date. The Spin-Off was completed on June 29, 2018 in a tax free transaction pursuant to Section 355 of the U.S. Internal Revenue Code.
On July 2, 2018, Veoneer common stock began regular trading on the New York Stock Exchange (“NYSE”) under the ticker symbol “VNE” and Veoneer SDRs began trading on National Association of Securities Dealers (“NASDAQ”) Stockholm under the symbol “VNE-SDB”. Agreements entered into between Veoneer and Autoliv in connection with the Spin-Off govern the relationship between the parties following the Spin-Off and provide for the allocation of various assets, liabilities, rights and obligations. These agreements also include arrangements for transition services to be provided on a temporary basis between the parties.
In advance of the Spin-Off, Autoliv completed a series of internal transactions, in which Autoliv transferred its Electronics business to Veoneer. These transactions are referred to herein as the “internal reorganization”. The internal reorganization was completed on April 1, 2018.
The Company has two operating segments, Electronics and Brake Systems. Electronics includes all electronics resources and expertise, Restraint Control Systems and Active Safety products, and Brake Systems provides brake control and actuation systems.
The accompanying consolidated financial statements as of and for the years ended December 31, 2017 and 2016 and from January 1, 2018 through the Distribution Date were prepared from Autoliv’s historical accounting records and are presented on a stand-alone basis as if the operations had been conducted independently from Autoliv. For the period from the Distribution Date through December 31, 2018, the consolidated financial statements reflect Veoneer’s stand-alone operations. Prior to the Spin-Off, Autoliv’s net investment in these operations (Former Parent equity) is shown in lieu of a controlling interest’s equity in the Consolidated Financial Statements. Subsequent to the Spin-Off, Veoneer common stock, Additional paid-in capital and future income (losses) are reflected in Accumulated deficit. Accordingly, for periods prior to June 29, 2018, the Company’s financial statements are presented on a combined basis and for the periods subsequent to June 29, 2018, they are presented on a consolidated basis (all periods hereinafter are referred to as "Consolidated Financial Statements").
Prior to the Spin-Off, the Consolidated Statements of Operations include all sales and costs directly attributable to Veoneer, including costs for facilities, functions and services used by Veoneer. Certain shared costs have been directly charged to Veoneer based on usage or other allocation methods. The results of operations also include allocations of (i) costs for administrative functions and services performed on behalf of Veoneer by centralized staff groups within Autoliv, (ii) Autoliv’s general corporate expenses and (iii) certain pension and other retirement benefit costs (See Note 14, Retirement Plans for a description of the allocation methodologies employed). As more fully described in Note 6, Income Taxes, current and deferred income taxes and related tax expense have been determined based on the stand-alone results of Veoneer by applying Financial Accounting Standards Board (FASB) Accounting Standards Codification (ASC) No. 740, Income Taxes, to the Veoneer operations in each country as if it were a separate taxpayer (i.e., following the separate return methodology). Subsequent to the Spin-Off, sales, costs and taxes are reflected for Veoneer’s operations on a stand-alone company basis.
Prior to the Spin-Off, Veoneer participated in Autoliv's centralized cash management and financing programs. Accordingly, no cash and cash equivalents of Autoliv was allocated to Veoneer in the consolidated financial statements. Transactions between Autoliv and Veoneer are accounted for through Net Former Parent Investment. Autoliv’s short-term and long-term debt, including any related interest expense as well as its derivative activity, was pushed down to Veoneer’s consolidated financial statements where it is specifically identifiable to Veoneer. See Note 19, Relationship with Former Parent and Related Entities, for a further description of related party transactions between Autoliv and Veoneer. Subsequent to the Spin-Off, Veoneer has its own treasury functions.
For periods prior to the Spin-Off, all charges and allocations of cost for facilities, functions and services performed by Autoliv organizations have been deemed paid by Veoneer to Autoliv, in cash, in the period in which the cost was recorded in the Consolidated Statements of Operations.
Veoneer, Inc.
Notes to Consolidated Financial Statements
(U.S. DOLLARS IN MILLIONS)
The consolidated financial statements include the historical operations, assets, and liabilities that are considered to comprise the Veoneer business. All of the allocations and estimates in the consolidated financial statements are based on assumptions that Veoneer management believe are reasonable. However, the historical statements of operations, comprehensive loss, balance sheets, and cash flows of Veoneer included herein may not be indicative of what they would have been had Veoneer actually been a stand-alone entity during such periods, nor are they necessarily indicative of Veoneer's future results.
Certain amounts in the prior year’s consolidated financial statements and related footnotes thereto have been reclassified to conform to the current year presentation.
Certain amounts in the consolidated financial statements and associated notes may not reconcile due to rounding. All percentages have been calculated using unrounded amounts.
NOTE 2. Summary of Significant Accounting Policies
Principles of Consolidation
The consolidated financial statements have been prepared in accordance with United States (U.S.) Generally Accepted Accounting Principles (GAAP) and include the consolidated assets, liabilities, sales, and expenses of the Veoneer business as of December 31, 2018 and 2017 and for the years ended December 31, 2018, 2017, and 2016. All intercompany accounts and transactions within the Company have been eliminated from the consolidated financial statements. See Note 19, Relationship with Parent and Related Entities, for a further description of related party transactions between Autoliv and Veoneer.
Consolidation is also required when the Company has both the power to direct the activities of a variable interest entity (VIE) and the obligation to absorb losses or the right to receive benefits from the VIE that could be significant to the VIE.
Investments in affiliated companies in which the Company exercises significant influence over the operations and financial policies, but does not control, are reported using the equity method of accounting.
Business Combinations
Transactions in which the Company obtains control of a business are accounted for according to the acquisition method as described in Financial Accounting Standards Board (FASB) Accounting Standards Codification (ASC) 805, Business Combinations. The assets acquired and liabilities assumed are recognized and measured at their fair values as of the date control is obtained. Acquisition related costs in connection with a business combination are expensed as incurred. Contingent consideration is recognized and measured at fair value at the acquisition date and until paid is re-measured on a recurring basis. It is classified as a liability based on appropriate GAAP.
Equity Method Investments
Investments accounted for under the equity method, means that a proportional share of the equity method investment’s net income increases the investment, and a proportional share of losses and payment of dividends decreases it. In the Consolidated Statements of Operations, the proportional share of the net loss is reported as Loss from equity method investments.
Use of Estimates
The preparation of consolidated financial statements in conformity with GAAP requires management to make estimates and assumptions that affect the reported amounts of assets and liabilities, disclosures of contingent assets and liabilities at the date of the consolidated financial statements, and the reported amounts of net sales and expenses during the reporting period. The accounting estimates that require management’s most significant judgments include the estimation of retroactive price adjustments, estimations associated with purchase price allocations regarding business combinations, valuation of stock based payments, assessment of recoverability of goodwill and intangible assets, assessment of the useful lives of intangible assets, estimation of pension benefit expense based on actuarial assumptions, estimation of accruals for warranty and product liabilities, uncertain tax positions, valuation allowances and contingent liabilities. However, actual results could differ from those estimates.
Veoneer, Inc.
Notes to Consolidated Financial Statements
(U.S. DOLLARS IN MILLIONS)
Revenue Recognition
In accordance with ASC 606, Revenue from Contracts with Customers, revenue is measured based on consideration specified in a contract with a customer, adjusted for any variable consideration (i.e. price concessions or annual price adjustments) and estimated at contract inception. The Company recognizes revenue when it satisfies a performance obligation by transferring control over a product to a customer.
In addition, from time to time, Veoneer may make payments to customers in connection with ongoing and future business. These payments to customers are generally recognized as a reduction to revenue at the time of the commitment to make these payments, unless certain criteria are met, warranting capitalization. If the payments are capitalized, the amounts are amortized as the related goods are transferred. As of December 31, 2018, and 2017, the Company capitalized $54 million and $23 million, respectively, in Other non-current assets related to payments to customers. The Company assesses these amounts for impairment. There was no impairment in 2018 or 2017.
Taxes assessed by a governmental authority that are both imposed on and concurrent with a specific revenue-producing transaction, that are collected by the Company from a customer, are excluded from revenue.
Shipping and handling costs associated with outbound freight after control of a product has transferred to a customer are accounted for as a fulfillment cost and are included in cost of sales.
Nature of goods and services
The following is a description of principal activities from which the Company generates its revenue. The Company has two operating segments, Electronics and Brake Systems. Electronics includes all of electronics resources and expertise, restraint control systems and active safety products. Brake Systems provides brake control and actuation systems. The principal activities are essentially the same for each of the segments. Both of the segments generate revenue from the sale of production parts to original equipment manufacturers (“OEMs”).
The Company accounts for individual products separately if they are distinct (i.e., if a product is separately identifiable from other items and if a customer can benefit from it on its own or with other resources that are readily available to the customer). The consideration, including any price concession or annual price adjustments, is based on their stand-alone selling prices for each of the products. The stand-alone selling prices are determined based on the cost-plus margin approach.
The Company recognizes revenue for production parts primarily at a point in time.
For production parts with revenue recognized at a point in time, the Company recognizes revenue upon shipment to the customers and transfer of title and risk of loss under standard commercial terms (typically F.O.B. shipping point). There are certain contracts where the criteria to recognize revenue over time have been met (e.g., there is no alternative use to the Company and the Company has an enforceable right to payment). In such cases, at period end, the Company recognizes revenue and a related asset and associated cost of goods sold and inventory. However, the financial impact of these contracts is immaterial considering the very short production cycles and limited inventory days on hand, which is typical for the automotive industry.
The amount of revenue recognized is based on the purchase order price and adjusted for variable consideration (i.e. price concessions or annual price adjustments). Customers typically pay for the production parts based on customary business practices with payment terms averaging 30 days.
Contract balances
The contract assets related to the Company’s rights to consideration for work completed but not billed (generally in conjunction with contracts for which revenue is recognized over time) at the reporting date on production parts. The contract assets are reclassified into the receivables balance when the rights to receive payments become unconditional. There have been no impairment losses recognized related to contract assets arising from the Company’s contracts with customers.
Research, Development and Engineering (R,D&E)
The Company performs research activities to identify new products, product development activities for further product evolution, and engineering activities to customize existing products for specific customers. Research and development and most engineering
Veoneer, Inc.
Notes to Consolidated Financial Statements
(U.S. DOLLARS IN MILLIONS)
expenses are expensed as incurred. These expenses are reported net of expense reimbursements from contracts to further customize existing products for specific customers.
Certain engineering expenses related to long-term supply arrangements are capitalized when defined criteria, such as the existence of a contractual guarantee for reimbursement, are met.
Tooling is generally agreed upon as a separate contract or a separate component of an engineering contract, as a pre-production project. Capitalization of tooling costs is made only when the specific criteria for capitalization of customer funded tooling are met or the criteria for capitalization as Property, Plant & Equipment for tools owned by the Company are fulfilled. Depreciation on the Company’s own tooling is recognized in the Consolidated Statements of Operations as Cost of Sales.
Stock Based Compensation
The compensation costs for all of the Company’s stock-based compensation awards are determined based on the fair value method as defined in ASC 718, Compensation-Stock Compensation. The Company records the compensation expense for its direct and allocated portion of awards under the Veoneer Stock Incentive Plan, including restricted stock units (RSUs), performance shares (PSs) and stock options (SOs), over the respective vesting period. For further details, see Note 15, Stock Incentive Plans.
Income Taxes
Prior to the spin-off, Veoneer’s operations were included in the tax returns filed by Autoliv of which the Veoneer business was a part. Income tax expense and other income tax related information contained in these consolidated financial statements were presented on a separate return basis as if the Company filed its own tax returns. Income taxes as presented in the consolidated financial statements for periods prior to the spin-off attribute current and deferred income taxes in a manner that is systematic, rational and consistent with the asset and liability method prescribed by the accounting guidance for income taxes. The separate return method applies the accounting guidance for income taxes to the standalone financial statements as if the Company was a separate taxpayer and a standalone company for the periods presented prior to the spin-off. Any income tax liabilities or related net deferred tax assets or liabilities resulting from operations prior to the spin-off have been settled with the Former Parent as of the Distribution Date and are reflected in the Net Former Parent investment.
Subsequent to the Spin-Off, current tax liabilities and assets are recognized for the estimated taxes payable or refundable on the tax returns for the current year. In certain circumstances, payments or refunds may extend beyond twelve months, in such cases amounts would be classified as non-current taxes payable or refundable. Deferred tax liabilities or assets are recognized for the estimated future tax effects attributable to temporary differences and carryforwards that result from events that have been recognized in either the financial statements or the tax returns, but not both. The measurement of current and deferred tax liabilities and assets is based on provisions of enacted tax laws in effect for the year the differences are expected to reverse. Deferred tax assets are reduced by the amount of any tax benefits that are not expected to be realized. A valuation allowance is recognized if, based on the weight of all available evidence, it is more likely than not that some portion, or all, of the deferred tax asset will not be realized. Evaluation of the realizability of deferred tax assets is subject to significant judgment requiring careful consideration of all facts and circumstances.
Tax benefits associated with tax positions taken in the Company’s income tax returns are initially recognized and measured in the financial statements when it is more likely than not that those tax positions will be sustained upon examination by the relevant taxing authorities. The Company’s evaluation of its tax benefits is based on the probability of the tax position being upheld if challenged by the taxing authorities (including through negotiation, appeals, settlement and litigation). Whenever a tax position does not meet the initial recognition criteria, the tax benefit is subsequently recognized and measured if there is a substantive change in the facts and circumstances that cause a change in judgment concerning the sustainability of the tax position upon examination by the relevant taxing authorities. In cases where tax benefits meet the initial recognition criterion, the Company continues, in subsequent periods, to assess its ability to sustain those positions. A previously recognized tax benefit is derecognized when it is no longer more likely than not that the tax position would be sustained upon examination. Liabilities for unrecognized tax benefits are classified as non-current unless the payment of the liability is expected to be made within the next 12 months.
Cash and Cash Equivalents
The Company considers all highly liquid investments purchased with an original maturity of three months or less to be cash equivalents. Veoneer held approximately $864 million of cash and cash equivalents and $5 million of short-term investments as of December 31, 2018.
Veoneer, Inc.
Notes to Consolidated Financial Statements
(U.S. DOLLARS IN MILLIONS)
The carrying amounts reflected in the Consolidated Balance Sheets for cash and cash equivalents and short-term investments approximate their fair values based on Level 1 of the fair value hierarchy.
Receivables
Accounts receivables are recorded at the invoiced amount and do not bear interest.
The Company has guidelines for calculating the allowance for bad debts. In determining the amount of a bad debt allowance, management uses its judgment to consider factors such as the age of the receivables, the Company’s prior experience with the customer, the experience of other enterprises in the same industry, the customer’s ability to pay, and/or an appraisal of current economic conditions. Collateral is typically not required. There can be no assurance that the amount ultimately realized for receivables will not be materially different than that assumed in the calculation of the allowance.
A substantial majority of the Company’s trade receivables are derived from sales to OEMs. The Company’s four largest customers accounted for 58% of sales for 2018, 62% for 2017 and 59% for 2016. Additionally, as of December 31, 2018 and 2017, these four largest customers accounted for 52% and 55%, respectively, of the Company’s accounts receivable. The Company believes that the receivable balances from these largest customers do not represent a significant credit risk based on past collection experience. The Company has adopted credit policies and standards intended to accommodate industry growth and inherent risk. The Company believes that credit risks are moderated by the financial stability of the Company’s major customers.
Derivative Instruments and Hedging Activities
The Company uses derivative financial instruments, primarily forwards, options and swaps to reduce the effects of fluctuations in foreign exchange rates and the resulting variability of the Company’s operating results. On the date that a derivative contract is entered into, the Company designates the derivative as either (1) a hedge of the exposure to changes in the fair value of a recognized asset or liability or of an unrecognized firm commitment (a fair value hedge) or (2) a hedge of the exposure of a forecasted transaction or of the variability in the cash flows of a recognized asset or liability (a cash flow hedge).
When a hedge is classified as a fair value hedge, the change in the fair value of the hedge is recognized in the Consolidated Statements of Operations along with the offsetting change in the fair value of the hedged item. When a hedge is classified as a cash flow hedge, any change in the fair value of the hedge is initially recorded in equity as a component of Other Comprehensive Income (OCI) and reclassified into the Consolidated Statements of Operations when the hedge transaction affects net earnings. The Company uses the forward rate with respect to the measurement of changes in fair value of cash flow hedges when revaluing foreign exchange forward contracts. All derivatives are recognized in the consolidated financial statements at fair value. For further details. see Note 5, Fair Value Measurements.
Inventories
The cost of inventories is computed according to the first-in, first-out method (FIFO). Cost includes the cost of materials, direct labor and the applicable share of manufacturing overhead. Inventories are evaluated based on individual or, in some cases, groups of inventory items. Reserves are established to reduce the value of inventories to the lower of cost and net realizable value. Net realizable value is the estimated selling prices in the ordinary course of business, less reasonably predictable costs of completion, disposal and transportation. Excess inventories are quantities of items that exceed anticipated sales or usage for a reasonable period. The Company has guidelines for calculating provisions for excess inventories based on the number of months of inventories on hand compared to anticipated sales or usage. Management uses its judgment to forecast sales or usage and to determine what constitutes a reasonable period. There can be no assurance that the amount ultimately realized for inventories will not be materially different than that assumed in the calculation of the reserves.
Property, Plant and Equipment
Property, Plant and Equipment are recorded at historical cost. Construction in progress generally involves short-term projects for which capitalized interest is not significant. The Company provides for depreciation of property, plant and equipment computed under the straight-line method over the assets’ estimated useful lives, or in the case of leasehold improvements over the shorter of the useful life or the lease term. Amortization on capital leases is recognized with depreciation expense in the Consolidated Statements of Operations over the shorter of the assets’ expected life or the lease contract term. Repairs and maintenance are expensed as incurred.
Veoneer, Inc.
Notes to Consolidated Financial Statements
(U.S. DOLLARS IN MILLIONS)
The Company also entered into certain “build-to-suit” lease arrangements in 2017 with continuing impact into 2018 for certain manufacturing and research buildings. During 2018, one of the “build-to-suit” lease arrangement was completed and accounted as a lease as of December 31, 2018. For the build-to-suit still under construction, the Company will be deemed the owner of the buildings for accounting purposes during the construction period due to the terms of the arrangements. As such, those amounts will be capitalized as an asset and a liability in Consolidated Balance Sheet during the construction period. As of December 31, 2018, capitalized amounts are approximately $48 million, and as of December 31, 2017, capitalized amounts were immaterial.
Long-Lived Assets Impairment
The Company evaluates the carrying value and useful lives of long-lived assets when indications of impairment are evident or it is likely that the useful lives have decreased, in which case the Company depreciates the assets over the remaining useful lives. Impairment testing is primarily performed by using the cash flow method based on undiscounted future cash flows. Estimated undiscounted cash flows for a long-lived asset being evaluated for recoverability are compared with the respective carrying amount of that asset. If the estimated undiscounted cash flows exceed the carrying amount of the assets, the carrying amounts of the long-lived asset are considered recoverable and an impairment is not be recorded. However, if the carrying amount of a group of assets exceeds the undiscounted cash flows, an entity must then measure the long-lived assets’ fair value to determine whether an impairment loss should be recognized, generally using a discounted cash flow model.
Intangible Assets and Goodwill
Intangible assets, principally related to acquired technology and contractual relationships, are amortized over their useful lives which range from 5 to 10 years.
Goodwill represents the excess of the fair value of consideration transferred over the fair value of net assets of businesses acquired. Goodwill is not amortized but is subject to at least an annual review for impairment.
The Company reviews goodwill for impairment annually in the fourth quarter or more frequently if events or changes in circumstances indicate the assets might be impaired.
In conducting its impairment testing, the Company compares the estimated fair value of each of its reporting units to the related carrying value of the reporting unit. If the estimated fair value of a reporting unit exceeds its carrying value, goodwill is considered not to be impaired. If the carrying value of a reporting unit exceeds its estimated fair value, an impairment loss is recognized for the excess of carrying amount over the fair value of the respective reporting unit.
The estimated fair value of the reporting unit is determined by the discounted cash flow method taking into account expected long-term operating cash-flow performance. The Company discounts projected operating cash flows using the reporting unit’s weighted average cost of capital, including a risk premium to adjust for market risk. The estimated fair value is based on automotive industry volume projections which are based on third-party and internally developed forecasts and discount rate assumptions. Significant assumptions include terminal growth rates, terminal operating margin rates, future capital expenditures and working capital requirements. To supplement this analysis, the Company compares the market value of its equity, calculated by reference to the quoted market prices of its shares, to the book value of its equity.
In the fourth quarter of 2017, in connection with the annual impairment test, the Company recorded a goodwill impairment charge of $234 million relating to its Brake Systems Segment (see Note 4, Business Combinations). There is no remaining goodwill related to the Brake Systems Segment after the impairment. There were no impairments of goodwill for 2018 and 2016.
Warranties and Recalls
The Company records liabilities for product recalls when probable claims are identified and when it is possible to reasonably estimate costs. Recall costs are costs incurred when the customer decides to formally recall a product due to a known or suspected safety concern. Product recall costs typically include the cost of the product being replaced as well as the customer’s cost of the recall, including labor to remove and replace the defective part. Insurance receivables, related to recall issues covered by the insurance, are included within other current assets in the Consolidated Balance Sheets.
Provisions for warranty claims are estimated based on prior experience, likely changes in performance of newer products and the mix and volume of products sold. The provisions are recorded on an accrual basis.
Veoneer, Inc.
Notes to Consolidated Financial Statements
(U.S. DOLLARS IN MILLIONS)
Pension and Other Post-Employment Benefits
Veoneer’s employees participate in both defined contribution plans and defined benefit plans sponsored by Veoneer in Japan (the Japan plans), Canada (the Canada plans), and France (the France plans) and certain defined benefit plans sponsored by Autoliv in Sweden (the Sweden plans) and US (the US plans). A defined contribution plan generally specifies the periodic amount that the employer must contribute to the plan and how that amount will be allocated to the eligible employees who perform services during the same period. A defined benefit pension plan is one that contains pension benefit formulas, which generally determine the amount of pension benefits that each employee will receive for services performed during a specified period of employment.
For the Japan, Canada, and France plans, the amount recognized as a defined benefit liability is the net total of projected benefit obligation (PBO) minus the fair value of plan assets (if any). The plan assets are measured at fair value. The inputs to the fair value measurement of the plan assets are mainly level 2 inputs (see Note 5, Fair Value Measurements). Veoneer has considered the remaining plans to be part of a multiemployer plan with Autoliv and does not record a corresponding asset or liability. Pension expense was allocated and reported within Costs of sales, Selling, general and administrative expenses and Research, development and engineering expenses in the Consolidated Statements of Operations. The expense related to Veoneer employees and allocated expenses are included in these Consolidated Financial Statements.
Contingent Liabilities
Various claims, lawsuits and proceedings are pending or threatened against the Company or its subsidiaries, covering a range of matters that arise in the ordinary course of its business activities with respect to commercial, product liability or other matters.
The Company diligently defends itself in such matters and, in addition, carries insurance coverage to the extent reasonably available against insurable risks.
The Company records liabilities for claims, lawsuits and proceedings when they are probable, and it is possible to reasonably estimate the cost of such liabilities. Legal costs expected to be incurred in connection with a loss contingency are expensed as such costs are incurred.
The Company believes, based on currently available information, that the resolution of outstanding matters, described in Note 16, Commitments and Contingencies, after taking into account recorded liabilities and available insurance coverage, should not have a material effect on the Company’s financial position or results of operations.
However, due to the inherent uncertainty associated with such matters, there can be no assurance that the final outcomes of these matters will not be materially different than currently estimated.
Translation of Non-US Subsidiaries
The balance sheets of subsidiaries with functional currency other than U.S. dollars are translated into U.S. dollars using year-end exchange rates.
The statement of operations of these subsidiaries is translated into U.S. dollars using the average exchange rates for the year. Translation differences are reflected in equity as a component of OCI.
Receivable and Liabilities in Non-Functional Currencies
Receivables and liabilities not denominated in functional currencies are converted at year-end exchange rates. Net transaction gains/(losses) that are reflected in the Consolidated Statements of Operations amounted to $(2) million in 2018, $3 million in 2017 and $1 million in 2016. These are recorded in operating income if they relate to operational receivables and liabilities or are recorded in other non-operating items, net if they relate to financial receivables and liabilities.
Recently Issued Accounting Pronouncements
Adoption of New Accounting Standards
In February 2018, the Financial Accounting Standards Board (“FASB”) issued Accounting Standard Update (“ASU”) 2018-02, Income Statement – Reporting Comprehensive Income (Topic 220) – Reclassification of Certain Tax Effects from Accumulated Other Comprehensive Income (AOCI), which allows a reclassification from AOCI to retained earnings for stranded tax effects resulting from the Tax Cuts and Jobs Act of 2017 (the “Act”). Consequently, the amendments in ASU 2018-02 eliminate
Veoneer, Inc.
Notes to Consolidated Financial Statements
(U.S. DOLLARS IN MILLIONS)
the stranded tax effects resulting from the Act. The amendments in ASU 2018-02 are effective for all entities for annual periods beginning after December 15, 2018, including interim periods within those annual periods. Early adoption is permitted as of the beginning of an annual period for which financial statements (interim or annual) have not been issued or made available for issuance. The amendments in ASU 2018-02 should be applied either in the period of adoption or retrospectively to each period (or periods) in which the effect of the change in the U.S. federal corporate income tax rate in the Act is recognized. The Company adopted early ASU 2018-02 as of January 1, 2018 and the adoption did not have a material impact on the consolidated financial statements for any periods presented.
In January 2018, the FASB released guidance on the accounting for tax on the global intangible low-taxed income (“GILTI”) provisions of the Act. The GILTI provisions impose a tax on foreign income in excess of a deemed return on tangible assets of foreign corporations. In the first quarter of 2018, the Company elected to treat any potential GILTI inclusions as a period cost.
In January 2017, the FASB issued ASU 2017-04, Intangibles—Goodwill and Other (Topic 350)—Simplifying the Test for Goodwill Impairment, which simplifies how an entity is required to test goodwill for impairment by eliminating step two from the goodwill impairment test, which measures a goodwill impairment loss by comparing the implied fair value of a reporting unit’s goodwill with the carrying amount. Instead, entities should perform annual or interim goodwill impairment tests by comparing the fair value of a reporting unit with its carrying amount and recognize an impairment charge for the excess of carrying amount over the fair value of the respective reporting unit. The amendments in ASU 2017-04 are effective for public business entities for annual or interim goodwill impairment tests in annual periods beginning after December 15, 2019. Early adoption is permitted for interim or annual goodwill impairment tests performed on testing dates after January 1, 2017. The Company early adopted ASU 2017-04 effective January 1, 2017. As this standard is prospective in nature, the impact to the Company’s financial statements by not performing step two to measure the amount of any potential goodwill impairment will depend on various factors. However, the elimination of step two reduces the complexity and cost of the subsequent measurement of goodwill. This new standard was applied in conjunction with assessing Goodwill impairment as discussed in Note 2, Summary of Significant Accounting Policies.
In January 2017, the FASB issued ASU 2017-01, Business Combinations (Topic 805)—Clarifying the Definition of a Business, which provides a screen to determine when an integrated set of assets and activities is not a business. The screen requires that when substantially all of the fair value of the gross assets acquired (or disposed of) is concentrated in a single identifiable asset or a group of similar identifiable assets, the set is not a business. The amendments in ASU 2017-01 are effective for public business entities for annual periods beginning after December 15, 2017, and interim periods within those periods. ASU 2017-01 should be applied prospectively. Early adoption is permitted. The Company early adopted ASU 2017-01 effective January 1, 2017 for new transactions that have not been reported in financial statements that have been issued or made available for issuance. As this standard is prospective in nature, the impact to the Company’s financial statements will depend on the nature of the Company’s future acquisitions. This new standard was applied in conjunction with the Zenuity joint venture and the Fotonic i Norden dp AB acquisition as discussed in Note 9, Equity Method Investment and Note 4, Business Combinations, respectively, to the consolidated financial statements for any periods presented.
In March 2017, the FASB issued ASU 2017-07, Compensation-Retirement Benefits (Topic 715) - Improving the Presentation of Net Periodic Pension Cost and Net Periodic Post-Retirement Benefit Cost, which requires the service cost component to be reported in the same line item or items as other compensation costs arising from services rendered by the pertinent employees during the period. The other components of net benefit cost are required to be presented in the Consolidated Statements of Operations separately from the service cost component and outside operating income. The amendments in ASU 2017-07 are effective for public business entities for annual periods beginning after December 15, 2017, including interim periods within those annual periods. The amendments in ASU 2017-07 should be applied retrospectively for the presentation of the service cost component and the other components of net periodic pension cost and net periodic post-retirement benefit cost in the Consolidated Statements of Operations. The Company adopted ASU 2017-07 in the first quarter of 2018 and the adoption did not have a material impact on the consolidated financial statements for any periods presented (see Note 14, Retirement Plans).
In May 2017, the Financial Accounting Standards Board (FASB) issued Accounting Standards Update (ASU) 2017-09, Compensation-Stock Compensation (Topic 718) – Scope of Modification Accounting, which provides guidance about which changes to the terms or conditions of a share-based payment award require an entity to apply modification accounting in Topic 718. An entity should account for the effects of a modification unless (a) the fair value of the modified award is the same as the fair value of the original award, (b) the vesting conditions of the modified award are the same as the vesting conditions of the original award and (c) the classification of the modified award as an equity instrument or a liability instrument is the same as the classification of the original award immediately before the original award is modified. The amendments in ASU 2017-09 are effective for public business entities for annual periods beginning after December 15, 2017, including interim periods within those annual periods. Early adoption is permitted, including adoption in any interim period, for public business entities for reporting periods for which
Veoneer, Inc.
Notes to Consolidated Financial Statements
(U.S. DOLLARS IN MILLIONS)
financial statements have not been issued. The amendments in ASU 2017-09 should be applied prospectively to an award modified on or after the adoption date. The Company early adopted ASU 2017-09 in the second quarter beginning April 1, 2017. As this standard is prospective in nature, the impact to the Company’s financial statements will depend on the nature of the Company’s future award modifications. There have been no modifications to awards to date in 2017.
In March 2016, the FASB issued ASU 2016-09, Compensation— Stock Compensation (Topic 718), which simplifies the accounting for share-based payment transactions, including the income tax consequences, classification of awards as either equity or liabilities, and classification on the statement of cash flows. For public business entities, the amendments in ASU 2016-09 are effective for annual periods beginning after December 15, 2016, and interim periods within those annual periods. Amendments related to the timing of when excess tax benefits are recognized, minimum statutory withholding requirements, forfeitures, and intrinsic value should be applied using a modified retrospective transition method by means of a cumulative-effect adjustment to equity as of the beginning of the period in which the guidance is adopted. Amendments related to the presentation of employee taxes paid on the statement of cash flows when an employer withholds shares to meet the minimum statutory withholding requirement should be applied retrospectively. Amendments requiring recognition of excess tax benefits and tax deficiencies in the income statement and the practical expedient for estimating expected term should be applied prospectively. An entity may elect to apply the amendments related to the presentation of excess tax benefits on the statement of cash flows using either a prospective transition method or a retrospective transition method. The Company adopted ASU 2016-09 effective January 1, 2017 and has elected to recognize forfeitures as they occur. The adoption of ASU 2016-09 did not have a material impact on the consolidated financial statements for any periods presented.
In August 2016, the FASB issued ASU 2016-15, Statement of Cash Flows (Topic 230)—Classification of Certain Cash Receipts and Cash Payments, which provides guidance on reducing the diversity in practice on eight cash flow classification issues and how certain cash receipts and cash payments are presented and classified in the statement of cash flows. The amendments in ASU 2016-15 are effective for public business entities for annual periods beginning after December 15, 2017, and interim periods within those annual periods. Early adoption is permitted, including adoption in an interim period. If an entity early adopts the amendments in an interim period, any adjustments should be reflected as of the beginning of the annual period that includes that interim period. The amendments in ASU 2016-15 should be applied using a retrospective transition method to each period presented. The Company early adopted ASU 2016-15 effective January 1, 2017. The adoption of ASU 2016-15 did not have a material impact on the consolidated financial statements for any periods presented.
In October 2016, the FASB issued ASU 2016-16, Income Taxes (Topic 740) – Intra-Entity Transfers of Assets Other Than Inventory, which requires an entity to recognize the income tax consequences of an intra-entity transfer of an asset other than inventory when the transfer occurs. Historical GAAP prohibits the recognition of current and deferred income taxes for an intra-entity asset transfer until the asset has been sold to an outside party. Consequently, the amendments in this ASU 2016-16 eliminate the exception for an intra-entity transfer of an asset other than inventory. Two common examples of assets included in the scope of ASU 2016-16 are intellectual property and property, plant, and equipment. The amendments in ASU 2016-16 are effective for public business entities for annual periods beginning after December 15, 2017, including interim periods within those annual periods. The amendments in ASU 2016-16 should be applied on a modified retrospective basis through a cumulative-effect adjustment directly to equity as of the beginning of the period of adoption. The Company's adoption of ASU 2016-16 effective January 1, 2018 did not have a material impact on consolidated financial statements for any periods presented.
In May 2014, the FASB issued ASU 2014-09, Revenue from Contracts with Customers (Topic 606), which outlines a single, comprehensive model for entities to use in accounting for revenue arising from contracts with customers and supersedes most current revenue recognition guidance issued by the FASB, including industry specific guidance. In 2016, the FASB issued accounting standard updates to address implementation issues and to clarify guidance in certain areas. The core principle of the guidance is that an entity should recognize revenue when it transfers promised goods or services to customers in an amount that reflects the consideration which the Company expects to receive in exchange for those goods or services. In addition, ASU 2014-09 requires certain additional disclosure around the nature, amount, timing, and uncertainty of revenue and cash flows arising from contracts with customers. The Company adopted ASU 2014-09 effective January 1, 2018 and utilized the modified retrospective (cumulative effect) transition method. The Company applied the modified retrospective transition method through a cumulative adjustment to equity. The adoption of the new revenue standard did not have a material impact on the consolidated financial statements for any periods presented. The table below shows the adjustments made due to ASU 2014-09.
Veoneer, Inc.
Notes to Consolidated Financial Statements
(U.S. DOLLARS IN MILLIONS)
|
| | | | | | | | | | | |
Balance Sheet (Dollars in millions) | Balance at December 31, 2017 | | Adjustments due to ASU 2014-09 | | Balance at January 1, 2018 |
| Assets | | | | | |
| Inventories, net | $ | 154 |
| | $ | (5 | ) | | $ | 149 |
|
| Prepaid expenses and contract assets | 34 |
| | 7 |
| | 41 |
|
| | | | | | |
| Equity | | | | | |
| Net Former Parent investment | $ | 844 |
| | $ | 1 |
| | $ | 845 |
|
|
| | | | | | | | | | | |
| | Year Ended December 31, 2018 |
Income Statement (Dollars in millions) | As Reported | | Balances without adoption of ASC 606 | | Effect of Changes |
| Net sales | $ | 2,228 |
| | $ | 2,227 |
| | $ | 1 |
|
| Cost of sales | (1,798 | ) | | (1,797 | ) | | (1 | ) |
| Operating loss | (197 | ) | | (197 | ) | | — |
|
|
| | | | | | | | | | | |
| | As of December 31, 2018 |
Balance Sheet (Dollars in millions) | As Reported | | Balances without adoption of ASC 606 | | Effect of Changes |
| Assets | | | | | |
| Inventories, net | $ | 172 |
| | $ | 178 |
| | $ | (6 | ) |
| Prepaid expenses and contract assets | 39 |
| | 31 |
| | 8 |
|
| | | | | | |
| Equity | | | | | |
| Additional paid-in capital | $ | 1,938 |
| | $ | 1,937 |
| | $ | 1 |
|
Accounting Standards Issued But Not Yet Adopted
In November 2018, the FASB issued ASU 2018-19, Codification Improvements to Topic 326, Financial Instruments-Credit Losses, which provides improvements to ASU 2016-13, Financial Instruments-Credit Losses (Topic 326): Measurement of Credit Losses on Financial Instruments. Specifically, ASU 2018-19 clarifies that receivables arising from operating leases are not within the scope of Subtopic 326-20, Measured at Amortized Cost, and states that impairment of receivables arising from operating leases should be accounted for in accordance with ASC Topic 842, Leases. The Company is required to adopt ASU 2018-19 concurrently with ASU 2016-13 in the first quarter of 2020 and is currently evaluating the impact of the ASU 2018-19 of its consolidated financial statements.
In November 2018, the FASB issued ASU 2018-18 Collaborative Arrangements (Topic 808), Clarifying the Interaction between Topic 808 and Topic 606, which (1) clarifies that certain transactions between collaborative arrangement participants should be accounted for under ASC Topic 606, Revenue from Contracts with Customers (Topic 606), when the collaborative arrangement participant is a customer in the context of a unit of account, (2) adds unit-of-account guidance in Topic 808 to align with Topic 606 when an entity is assessing whether the collaborative arrangement, or a part of the arrangement, is within the scope of Topic 606, (3) precludes presenting transactions together with revenue when those transactions involve collaborative arrangement participants that are not directly related to third parties and are not customers. The Company is required to adopt ASU 2018-18 in the first quarter of 2020 and is currently evaluating the impact of ASU 2018-18 on its consolidated financial statements.
In October 2018, the FASB issued ASU 2018-17 Consolidation (Topic 810), Targeted Improvements to Related Party Guidance for Variable Interest Entities, which allows a private company (reporting entity) to elect not to apply variable interest entity (VIE) guidance to legal entities under common control (including common control leasing arrangements) if both the parent and the legal entity being evaluated for consolidation are not public business entities. The accounting alternative provides an accounting policy election that a private company will apply to all current and future legal entities under common control that meet the criteria for applying this alternative. If the alternative is elected, a private company should continue to apply other consolidation guidance,
Veoneer, Inc.
Notes to Consolidated Financial Statements
(U.S. DOLLARS IN MILLIONS)
particularly the VIE guidance, unless another scope exception applies. The Company is required to adopt ASU 2018-17 in the first quarter of 2020 and is currently evaluating the impact of ASU 2018-17 on its consolidated financial statements.
In October 2018, the FASB issued ASU 2018-16 Derivatives and Hedging (Topic 815), Inclusion of the Secured Overnight Financing Rate (SOFR) Overnight Index Swap (OIS) Rate as a Benchmark Interest Rate for Hedge Accounting Purposes, which provides amendments to ASU 2017-12, Derivatives and Hedging (Topic 815), Targeted Improvements to Accounting for Hedging Activities. The amendments in ASU 2018-16 permit use of the Overnight Index Swap (OIS) Rate based on the Secured Overnight Financing Rate (SOFR) as a U.S. benchmark interest rate for hedge accounting purposes under Topic 815 in addition to the U.S. Government (UST) Rate, the London Interbank Offered Rate (LIBOR) Swap Rate, the OIS Rate based on the Fed Funds Effective rate, and the Securities Industry and Financial Markets Association (SIFMA) Municipal Swap Rate. The Company is required to adopt ASU 2018-16 concurrently with ASU 2017-12 in the first quarter of 2019. The Company does not expect ASU 2017-12 to have material impact to the consolidated financial statements.
In August 2018, the FASB issued ASU 2018-14, Compensation - Retirement Benefits - Defined Benefit Plans - General (Topic 715-20): Disclosure Framework - Changes to the Disclosure Requirements for Defined Benefit Plans. ASU 2018-14 modifies the disclosure requirements for employers that sponsor defined benefit pension or other post-retirement plans. ASU 2018-14 removes the requirements to disclose: amounts in accumulated other comprehensive income (loss) expected to be recognized as components of net periodic benefit cost over the next fiscal year; the amount and timing of plan assets expected to be returned to the employer; and the effects of a one-percentage point change in assumed health care cost trend rates. ASU 2018-14 requires disclosure of an explanation of the reasons for significant gains and losses related to changes in the benefit obligation for the period. This guidance is effective for fiscal years, and interim periods within those fiscal years, beginning after December 15, 2020. Early adoption is permitted for all entities and the amendments in this update are required to be applied on a retrospective basis to all periods presented. The Company is currently evaluating this guidance to determine the impact on its disclosures.
In August 2018, the FASB issued ASU 2018-13, Fair Value Measurement (Topic 820): Disclosure Framework-Changes to the Disclosure Requirements for Fair Value Measurement. ASU 2018-13 removes the requirement to disclose: the amount of and reasons for transfers between Level 1 and Level 2 of the fair value hierarchy; the policy for timing of transfers between levels; and the valuation processes for Level 3 fair value measurements. ASU 2018-13 requires disclosure of changes in unrealized gains and losses for the period included in other comprehensive income (loss) for recurring Level 3 fair value measurements held at the end of the reporting period and the range and weighted average of significant unobservable inputs used to develop Level 3 fair value measurements. The amendments on changes in unrealized gains and losses, the range and weighted average of significant unobservable inputs used to develop Level 3 fair value measurements, and the narrative description of measurement uncertainty should be applied prospectively for only the most recent interim or annual period presented in the initial fiscal year of adoption. All other amendments should be applied retrospectively to all periods presented upon their effective date. This guidance is effective for fiscal years, and interim periods within those fiscal years, beginning after December 15, 2019. Early adoption is permitted. The Company is currently evaluating this guidance to determine the impact on its disclosures.
In June 2016, the FASB issued ASU 2016-13, Financial Instruments—Credit Losses (Topic 326), Measurement of Credit Losses on Financial Instruments, which requires measurement and recognition of expected credit losses for financial assets held and requires enhanced disclosures regarding significant estimates and judgments used in estimating credit losses. ASU 2016-13 is effective for public business entities for annual periods beginning after December 15, 2019, and earlier adoption is permitted for annual periods beginning after December 15, 2018. The Company is currently evaluating the impact of the Company’s pending adoption of ASU 2016-13 on the consolidated financial statements for any periods presented.
In February 2016, the FASB issued ASU 2016-02, Leases (Topic 842), to increase transparency and comparability among organizations by recognizing lease liabilities on the balance sheet and disclosing key information about leasing arrangements. ASU 2016-02 affects any entity that enters into a lease, with some specified scope exceptions. For public business entities, the amendments in ASU 2016-02 are effective for annual periods beginning after December 15, 2018, and interim periods within those annual periods. Early adoption is permitted. The Company intends to adopt ASU 2016-02 in the annual period beginning January 1, 2019. The Company intends to apply the modified retrospective transition method and elect the transition option to use the effective date January 1, 2019, as the date of initial application. The Company will not adjust its comparative period financial statements for effects of the ASU 2016-02, or make the new required lease disclosures for periods before the effective date. The Company will recognize its cumulative effect transition adjustment as of the effective date. In addition, we intend to elect the package of practical expedients permitted under the transition guidance within the new standard, which among other things, will allow us to carry forward the historical lease classification. The Company has made an accounting policy election to not recognize lease assets or liabilities for leases with a term of 12 months or less. In addition, the Company has also made an accounting policy election to combine all lease and the related non-lease components as a single component.
Veoneer, Inc.
Notes to Consolidated Financial Statements
(U.S. DOLLARS IN MILLIONS)
During the fourth quarter, the Company continued its process to identify leasing arrangements and to compare its accounting policies and practices to the requirements of the new standard. Specifically, the Company is continuing to assess whether there are any “embedded leases” in arrangements with its suppliers and customers. In addition, the Company has identified and is implementing necessary changes to processes and controls to support recognition and disclosure under the new standard. In the first quarter of 2019, the Company will continue its testing of the updated process controls including controls specific to the new third-party software. The Company has substantially completed aggregating and evaluating lease contracts and is in the final stages of implementing a new lease accounting system to support the accounting and disclosure requirements of this standards update.
Upon adoption, the Company anticipates recording a right-of-use asset and lease liability on its Consolidated Balance Sheet similar in magnitude to the total present value of outstanding future minimum payments for operating leases and Build-To-Suit lease obligation s as shown in Note 16, Commitments and Contingencies; therefore, the Company expects this standards update will have a material impact on our Consolidated Balance Sheets and related disclosures. The adoption of this standards update is not expected to have a material impact on our Consolidated Statements of Operations or Statements of Cash Flows.
NOTE 3. Revenue
Disaggregation of revenue
The Company has attributed net sales to the geographic area based on the location of the entity selling the final product. Of the net sales, exports from the U.S. to other regions amounted to approximately $356 million, $159 million and $222 million in 2018, 2017 and 2016, respectively.
In the following tables, revenue is disaggregated by primary region and products of revenue recognition.
Net Sales by Region
|
| | | | | | | | | | | | | | | | | | | | | | | | | | | | | | | | | | | |
| | Year Ended December 31 |
| | 2018 | | 2017 | | 2016 |
| | Electronics | | Brake Systems | | Total | | Electronics | | Brake Systems | | Total | | Electronics | | Brake Systems | | Total |
| Asia | $ | 424 |
| | $ | 370 |
| | $ | 794 |
| | $ | 489 |
| | $ | 362 |
| | $ | 851 |
| | $ | 521 |
| | $ | 276 |
| | $ | 797 |
|
| Americas | 696 |
| | 58 |
| | 754 |
| | 698 |
| | 114 |
| | 812 |
| | 717 |
| | 115 |
| | 832 |
|
| Europe | 680 |
| | — |
| | 680 |
| | 663 |
| | — |
| | 663 |
| | 598 |
| | — |
| | 598 |
|
| Total region sales | 1,799 |
| | 428 |
| | 2,228 |
| | 1,850 |
| | 476 |
| | 2,326 |
| | 1,837 |
| | 391 |
| | 2,228 |
|
| Less: intercompany sales | — |
| | — |
| | — |
| | (1 | ) | | (3 | ) | | (4 | ) | | (1 | ) | | (8 | ) | | (9 | ) |
| Total | $ | 1,800 |
| | $ | 428 |
| | $ | 2,228 |
| | $ | 1,849 |
| | $ | 473 |
| | $ | 2,322 |
| | $ | 1,835 |
| | $ | 383 |
| | $ | 2,218 |
|
Veoneer, Inc.
Notes to Consolidated Financial Statements
(U.S. DOLLARS IN MILLIONS)
Net Sales by Products
|
| | | | | | | | | | | | | | | | | | | | | | | | | | | | | | | | | | | |
| | Year Ended December 31 |
| | 2018 | | 2017 | | 2016 |
| | Electronics | | Brake Systems | | Total | | Electronics | | Brake Systems | | Total | | Electronics | | Brake Systems | | Total |
| Restraint Control Systems | $ | 974 |
| | $ | — |
| | $ | 974 |
| | $ | 1,073 |
| | $ | — |
| | $ | 1,073 |
| | $ | 1,097 |
| | $ | — |
| | $ | 1,097 |
|
| Active Safety products | 825 |
| | — |
| | 825 |
| | 778 |
| | — |
| | 778 |
| | 740 |
| | — |
| | 740 |
|
| Brake Systems | — |
| | 428 |
| | 428 |
| | — |
| | 476 |
| | 476 |
| | — |
| | 391 |
| | 391 |
|
| Total product sales | 1,799 |
| | 428 |
| | 2,228 |
| | 1,850 |
| | 476 |
| | 2,326 |
| | 1,837 |
| | 391 |
| | 2,228 |
|
| Less: intercompany sales | — |
| | — |
| | — |
| | (1 | ) | | (3 | ) | | (4 | ) | | (1 | ) | | (8 | ) | | (9 | ) |
| Total net sales | $ | 1,800 |
| | $ | 428 |
| | $ | 2,228 |
| | $ | 1,849 |
| | $ | 473 |
| | $ | 2,322 |
| | $ | 1,835 |
| | $ | 383 |
| | $ | 2,218 |
|
The following tables provide information about receivables and contract assets from contracts with customers.
Contract Balances with Customers
|
| | | | | | | |
| | As of December 31 |
| | 2018 | | 2017 |
| Receivables, net | $ | 376 |
| | $ | 448 |
|
Contract assets1 | 8 |
| | — |
|
1 Included in prepaid expenses and other contract assets in the Consolidated Balance Sheets
Changes in the contract asset balances during the period are as follows:
Change in Contract Balances with Customers1
|
| | | | |
| | | December 31, 2018 |
| | | Contract assets |
| Beginning balance | | $ | — |
|
| Increases due to cumulative catch up adjustment | | 8 |
|
| Increases due to revenue recognized | | 31 |
|
| Decreases due to transfer to receivables | | (31 | ) |
| Ending balance | | $ | 8 |
|
1 The contract asset is determined at each period end, this table reflects the rollforward of the period end balance.
Contract Costs
As of December 31, 2018, the Company has capitalized $12 million of direct and incremental contract costs incurred in connection with obtaining a contract with a customer. These costs will be amortized as the related goods are transferred.
NOTE 4. Business Combinations
Business combinations generally take place to either gain key technology or strengthen Veoneer’s position in a certain geographical area or with a certain customer. The results of operations and cash flows from the Company’s acquisitions have been included in the Company’s consolidated financial statements prospectively from their date of acquisition.
Fotonic i Norden dp AB
On November 1, 2017, Veoneer completed the acquisition of all the shares in Fotonic i Norden dp AB (Fotonic), headquartered in Stockholm and Skellefteå in Sweden. The acquisition date fair value of the total consideration transferred was $17 million, consisting of a $15 million cash payment and $2 million of deferred purchase consideration, payable at the 18-month anniversary of the closing date. The deferred purchase consideration reflects the holdback amount as stipulated in the share purchase agreement. The transaction has been accounted for as a business combination, with the purchase price allocation reflecting the final valuation results.
Veoneer, Inc.
Notes to Consolidated Financial Statements
(U.S. DOLLARS IN MILLIONS)
Fotonic provides Lidar and Time of Flight camera expertise and the acquisition included 35 Lidar and Time of Flight engineering experts, in addition to defined tangible and intangible assets. The strength of the acquired competence is on the Lidar and Time of Flight camera hardware side which form a complement to Veoneer’s skillset in the Lidar software and algorithms area. Lidar technology is an enabling technology for Highly Automated Driving and considered the primary sensor by all system developers. Fotonic is being reported in the Electronics segment.
The net assets acquired as of the acquisition date amounted to $17 million. The fair values of identifiable assets acquired consisted of Intangible assets of $4 million and Goodwill of $13 million, and the fair value of liabilities assumed consisted of Other current liabilities was less than a $1 million. Acquired Intangibles consisted of the fair value of background IP (patent & technical know-how). The useful life of the IP is five years and will be amortized on a straight-line basis. The recognized goodwill which is tax deductible primary reflects the valuation of the acquired workforce of specialist engineers.
Veoneer-Nissin Brake Systems
On March 31, 2016, the Company acquired a 51% interest in the entities that formed Veoneer-Nissin Brake Systems (Brake Systems) for approximately $263 million in cash. This entity comprises the Company’s Brake Systems Segment. Brake Systems designs, manufactures and sells products in the brake control and actuation systems business. Nissin Kogyo retained a 49% interest in the entities that formed Brake Systems. The Company has management and operational control of Brake Systems and has consolidated the results of operations and balance sheet from Brake Systems from the date of the acquisition forward. The transaction was accounted for as a business combination.
The acquisition combined Nissin Kogyo’s expertise and technology in brake control and actuation systems with the Company’s global reach and customer base to create a global competitive offering in the growing global Brake Systems market. Brake Systems is expected to further strengthen the Company’s role as a system supplier of products and systems for autonomous driving vehicles. From the date of the acquisition through December 31, 2016, the Brake Systems business reported net sales of $391 million and a net loss attributable to controlling interest of $5 million. The net loss attributable to the non-controlling interest was $7 million. The operating loss from the date of the acquisition through December 31, 2016 included $1 million of purchase accounting inventory fair value step-up adjustments in cost of sales upon the sale of acquired inventory.
Total Brake Systems acquisition related costs were approximately $2 million for consolidated the year ended December 31, 2016. These costs were reflected in Selling, general and administrative expenses in the Consolidated Statements of Operations.
The acquisition date fair value of the consideration transferred for the Company’s 51% interest in the entities that formed Brake Systems was $263 million in a cash transaction.
Veoneer, Inc.
Notes to Consolidated Financial Statements
(U.S. DOLLARS IN MILLIONS)
The following table summarizes the finalized fair values of identifiable assets acquired and liabilities assumed:
|
| | | |
| Assets: | As of March 31, 2016 |
| Cash and cash equivalents | $ | 38 |
|
| Receivables | 2 |
|
| Inventories | 33 |
|
| Other current assets | 8 |
|
| Property, plant and equipment | 139 |
|
| Other non-current assets | — |
|
| Intangibles | 112 |
|
| Goodwill | 235 |
|
| Total assets | $ | 566 |
|
| Liabilities: | |
| Accounts payable | $ | 6 |
|
| Other current liabilities | 23 |
|
| Pension liabilities | 9 |
|
| Other non-current liabilities | 13 |
|
| Total liabilities | $ | 51 |
|
| Net assets acquired | $ | 515 |
|
| Less: Non-controlling interest | $ | (252 | ) |
| Controlling interest | $ | 263 |
|
Acquired Intangibles primarily consisted of the fair value of customer contracts of $51 million and certain technology of $61 million. The customer contracts will be amortized straight-line over 7 years and the technology will be amortized straight-line over 10 years.
The recognized goodwill of $235 million reflects expected synergies from combining the Company's global reach and customer base with Nissin Kogyo’s expertise (including workforce) and technology in brake control and actuation systems. A portion of the goodwill is deductible for tax purposes.
Veoneer recognized related party short term debt of $4 million as of December 31, 2016, due to financing at Veoneer Nissin Brake Systems China Zhongshan (a 51% owned subsidiary). This $4 million debt facility was wholly repaid as of December 31, 2017.
NOTE 5. Fair Value Measurements
The Company uses a three-level fair value hierarchy that categorizes assets and liabilities measured at fair value based on the observability of the inputs utilized in the valuation. The fair value hierarchy gives the highest priority to the quoted prices in active markets for identical assets and liabilities and lowest priority to unobservable inputs.
Level 1 - Financial assets and liabilities whose values are based on unadjusted quoted market prices for identical assets and liabilities in an active market that the Company has the ability to access.
Level 2 - Financial assets and liabilities whose values are based on quoted prices in markets that are not active or model inputs that are observable for substantially the full term of the asset or liability.
Level 3 - Financial assets and liabilities whose values are based on prices or valuation techniques that require inputs that are both unobservable and significant to the overall fair value measurement.
Assets which are valued at net asset value per share ("NAV"), or its equivalent, as a practical expedient are reported outside the fair value hierarchy, but are included in the total assets for reporting and reconciliation purposes.
Veoneer, Inc.
Notes to Consolidated Financial Statements
(U.S. DOLLARS IN MILLIONS)
Items Measured at Fair Value on a Recurring Basis
Derivative instruments - The Company uses derivative financial instruments, “derivatives”, to mitigate the market risk that occurs from its exposure to changes in interest and foreign exchange rates. The Company does not enter into derivatives for trading or other speculative purposes. The Company’s use of derivatives is in accordance with the strategies contained in the Company’s overall financial risk policy. The derivatives outstanding as of December 31, 2018 and 2017 were foreign exchange swaps and forward contracts. All swaps principally match the terms and maturity of the underlying debt and no swaps have a maturity beyond six months. All derivatives are recognized in the consolidated financial statements at fair value. Certain derivatives are from time to time designated either as fair value hedges or cash flow hedges in line with the hedge accounting criteria. For certain other derivatives hedge accounting is not applied either because non-hedge accounting treatment creates the same accounting result or the hedge does not meet the hedge accounting requirements, although entered into applying the same rationale concerning mitigating market risk that occurs from changes in interest and foreign exchange rates. The Company’s derivatives are classified as Level 2 of the fair value hierarchy and there were no transfers between the levels during this or comparable periods.
During the first quarter of 2018, foreign exchange forward contracts designated as cash flow hedges of certain external purchasing were terminated. The loss associated with such termination was not material.
Financial Statement Presentation
The Company enters into master netting agreements, International Swaps and Derivatives Association (ISDA) agreements with all derivative counterparties. The netting agreements allow for netting of exposures in the event of default or breach of the counterparty agreement. The fair values in the Consolidated Balance Sheets have been presented on a gross basis. Derivative financial instruments designated and non-designated as hedging instruments are included in the Consolidated Balance Sheets . The nominal value of the derivatives not designated as hedging instruments was $103 million and $67 million as of December 31, 2018 and 2017, respectively. As of December 31, 2018 and 2017 the liability of the derivatives not designated as hedging instruments was less than $1 million and $1 million, respectively.
Gains and losses on derivative financial instruments for the periods presented are as follows:
|
| | | | | | | | | | | |
| | Year ended December 31 |
| | 2018 | | 2017 | | 2016 |
| | Foreign exchange forward contracts | | Foreign exchange forward contracts | | Foreign exchange forward contracts |
| Foreign currency risk -Cost of sales: | | | | | |
| Recorded into gain (loss) | $ | — |
| | $ | — |
| | $ | — |
|
| Recorded gains (loss) into AOCI net of tax | — |
| | (4 | ) | | 9 |
|
| Less: reclassified from AOCI into gain (loss) | (1 | ) | | 5 |
| | 1 |
|
| | $ | 1 |
| | $ | (9 | ) | | $ | 8 |
|
Contingent consideration -The fair value of the contingent consideration relating to the MACOM acquisition on August 17, 2015 is re-measured on a recurring basis. The fair value measurements are generally determined using unobservable inputs and are classified within Level 3 of the fair value hierarchy. The Company adjusted the fair value of the earn-out liability to $14 million during 2017 based on actual revenue levels to date as well as changes in the estimated probability of different revenue scenarios for the remaining contractual earn-out period. Income of approximately $13 million was recognized within other income in the Consolidated Statements of Operations during the year ended December 31, 2017 due to the decrease in the contingent consideration liability. The remaining fair value of the earn-out liability of $14 million as of December 31, 2017 was fully released to and recognized within Other income during the year ended December 31, 2018, driven by changes in the estimated probability of different revenue scenarios for the remaining contractual earn-out period such that management no longer believes that there are any scenarios under which the earn-out criteria could be met. Management has updated its analysis as of December 31, 2018 and continues to believe that the fair value of the contingent consideration is $0 million.
Veoneer, Inc.
Notes to Consolidated Financial Statements
(U.S. DOLLARS IN MILLIONS)
Items Measured at Fair Value on a Non-Recurring Basis
Certain assets and liabilities are measured at fair value on a nonrecurring basis. The fair value measurements are generally determined using unobservable inputs and are classified within Level 3 of the fair value hierarchy. These assets include long-lived assets, intangible assets and investments in affiliates, which may be written down to fair value as a result of impairment. The Company has determined that the fair value measurements included in each of these assets and liabilities rely primarily on Company-specific inputs and the Company’s assumptions about the use of the assets and settlements of liabilities, as observable inputs are not available. The Company has determined that each of these fair value measurements reside within Level 3 of the fair value hierarchy. To determine the fair value of long-lived assets, the Company utilizes the projected cash flows expected to be generated by the long-lived assets, then discounts the future cash flows over the expected life of the long-lived assets.
In the fourth quarter of 2017, the Company recognized an impairment charge of the full goodwill related to VNBS, resulting in an impairment loss of $234 million, which was included in earnings for the period. The primary driver of the goodwill impairment was due to the lower expected long-term operating cash flow performance of the business unit as of the measurement date. The remaining goodwill balance as of December 31, 2018 and 2017 was not measured at fair value as impairment indicators did not exist.
In the first quarter of 2017, the Company recognized an impairment charge to amortization of intangibles of $12 million related to a contract with an OEM customer of MACOM products, which was included in earnings for the period. As of December 31, 2017, the intangible value related to this customer contract was fully amortized. The remaining intangibles balance as of December 31, 2018 and 2017 was not measured at fair value as impairment indicators did not exist.
Investments
The Company may, as a practical expedient, estimate the fair value of certain investments using NAV of the investment as of the reporting date. This practical expedient generally deals with investments that permit an investor to redeem its investment directly with, or receive distributions from, the investee at times specified in the investee’s governing documents. Examples of these investments (often referred to as alternative investments) may include ownership interests in real assets, certain credit strategies, and hedging and diversifying strategies. They are commonly in the form of limited partnership interests. The Company uses NAV as a practical expedient when valuing investments in alternative asset classes and funds which are a limited partnership or similar investment vehicle.
On June 30, 2017, Veoneer committed to make a $15 million investment in Autotech Fund I, L.P. pursuant to a limited partnership agreement, and as a limited partner, will periodically make capital contributions toward this total commitment amount. As of December 31, 2018, Veoneer contributed a total of $8 million to the fund.
The carrying amounts reflected in the Consolidated Balance Sheet in Investments for the AutoTech Fund I, L.P approximates its fair values.
Veoneer, Inc.
Notes to Consolidated Financial Statements
(U.S. DOLLARS IN MILLIONS)
NOTE 6. Income Taxes
| • | RSUs are easy to understand and communicate; |
|
| | | | | | | | | | | | |
| | | Year Ended December 31 |
| Loss before taxes | | 2018 | | 2017 | | 2016 |
| U.S. | | $ | (54 | ) | | $ | (200 | ) | | $ | (78 | ) |
| Non-U.S. | | (199 | ) | | (114 | ) | | 56 |
|
| Total | | $ | (253 | ) | | $ | (314 | ) | | $ | (22 | ) |
| • | Due to the three-year cliff vesting schedule, RSUs encourage the executive to stay with the Company or forfeit significant accumulated value; and |
| • | RSUs also mitigate excessive risk-taking by focusing management on long-term value creation and ownership accumulation that provides alignment with stockholders. |
|
| | | | | | | | | | | | |
| | | Year Ended December 31 |
| Provision for income taxes | | 2018 | | 2017 | | 2016 |
| Current | | | | | | |
| Non-U.S. | | $ | 22 |
| | $ | 40 |
| | $ | 41 |
|
| Deferred | | | | | | |
| U.S. federal | | (4 | ) | | (1 | ) | | 2 |
|
| Non-U.S. | | 24 |
| | (9 | ) | | (4 | ) |
| Total income tax expense | | $ | 42 |
| | $ | 30 |
| | $ | 38 |
|
|
| | | | | | | | | | | | |
| | | Year Ended December 31 |
| Effective income tax rate | | 2018 | | 2017 | | 2016 |
| U.S. federal income tax rate | | $ | (53 | ) | | $ | (110 | ) | | $ | (8 | ) |
| Foreign tax rate variances | | 1 |
| | 9 |
| | (2 | ) |
| State taxes, net of federal benefit | | — |
| | (2 | ) | | (1 | ) |
| Tax credits | | (9 | ) | | (10 | ) | | (9 | ) |
| Change in Valuation Allowances | | 79 |
| | 62 |
| | 51 |
|
| Non-Controlling Interest | | 3 |
| | 21 |
| | 1 |
|
| Earnings of equity investments | | 13 |
| | 7 |
| | — |
|
| Withholding taxes | | 5 |
| | 4 |
| | 4 |
|
| Goodwill impairment | | — |
| | 13 |
| | — |
|
| Change in U.S. tax rate | | — |
| | 35 |
| | — |
|
| Other, net | | 3 |
| | 2 |
| | 1 |
|
| Provision for income taxes | | $ | 42 |
| | $ | 30 |
| | $ | 38 |
|
The Tax Cuts and Jobs Act (the “Tax Act”) was enacted on December 22, 2017. The Act makes broad and complex changes to the U.S. tax code, including reducing the U.S. federal corporate income tax rate from 35% to 21%, requiring companies to pay a one-time transition tax on earnings of certain foreign subsidiaries that were previously deferred and creates new taxes on certain foreign sourced earnings. The SEC issued Staff Accounting Bulletin No. 118 (“SAB 118”) on December 22, 2017. SAB 118 allows for a measurement period in which companies can either use provisional estimates for changes resulting from the Tax Act or apply the tax laws that were in effect immediately prior to the Tax Act being enacted if estimates cannot be determined at the time of the preparation of the financial statements until the actual impacts can be determined. The Company has completed the Company’s accounting for the effects on the Company’s existing deferred tax balances. Due to the full valuation allowance related to the Company’s U.S. operations, the impact to deferred taxes had a net zero impact to the Company except as it relates to a deferred tax liability related to tax deductible goodwill which resulted in a benefit of $4 million recorded for the year ended December 31, 2018 which is reflected as a change in valuation allowances. Pursuant to the Tax Matters Agreement entered into with Autoliv in connection with the Spin-Off, Autoliv is the primarily obligor on all taxes which relate to any period prior to April 1, 2018. Consequently the Company is not liable for any transition taxes under the Tax Act.
Veoneer, Inc.
Notes to Consolidated Financial Statements
(U.S. DOLLARS IN MILLIONS)
The Tax Act created a new requirement that certain Global Intangible Low Taxed Income (“GILTI”) earned by foreign subsidiaries must be included currently in the gross income of the U.S. shareholder. Under U.S. GAAP, the Company is permitted to make an accounting policy election to either treat taxes due on future inclusions in U.S. taxable income related to GILTI as a current-period expense when incurred or to factor such amounts into the Company’s measurement of deferred taxes. The Company has determined that it will treat the impact of GILTI as a period cost. The Tax Act also included other provisions effective in 2018, designated as (1) foreign derived intangible income (“FDII”), (2) interest disallowance and (3) base erosion anti-abuse tax (“BEAT”), that were considered in the income tax provision for the year ended December 31, 2018.
The tax effect of temporary differences and carryforwards that comprise significant portions of deferred tax assets and liabilities were as follows:
|
| | | | | | | | |
| | | As of December 31 |
| Deferred taxes | | 2018 | | 2017 |
| Assets | | | | |
| Provisions | | $ | 39 |
| | $ | 44 |
|
| Costs capitalized for tax | | 1 |
| | 2 |
|
| Acquired intangibles | | 20 |
| | 12 |
|
| Tax receivables, principally net operating loss carryforward | | 74 |
| | 112 |
|
| Credits | | 2 |
| | 9 |
|
| Other | | 3 |
| | — |
|
| Deferred tax assets before allowances | | $ | 139 |
| | $ | 179 |
|
| Valuation allowances | | (125 | ) | | (150 | ) |
| Total | | $ | 14 |
| | $ | 29 |
|
| Liabilities | | | | |
| Property, plant and equipment | | (9 | ) | | (6 | ) |
| Distribution taxes | | (7 | ) | | (8 | ) |
| Other | | — |
| | (2 | ) |
| Total | | $ | (16 | ) | | $ | (16 | ) |
| Net deferred tax asset (liability) | | $ | (2 | ) | | $ | 13 |
|
Deferred income taxes reflect the net tax effects of temporary differences between the carrying amounts of assets and liabilities for financial reporting purposes and the amounts used for income tax purposes. On December 31, 2018, the Company had net operating loss carryforwards (NOL’s) of approximately $289 million, of which approximately $153 million have no expiration date. The remaining losses expire on various dates through 2027. The Company also has $2 million of U.S. Research and Development Credit carry forwards, which expire in 2038.
The Company assesses all available evidence, both positive and negative, to determine the amount of any required valuation allowance. In the fourth quarter of 2018, one of the Company’s Asian subsidiaries entered into a long-term development contract which will result in projected losses in that jurisdiction. While this entity has historically been profitable, the Company has determined that, given the projected losses along with indications that there may be a slowdown in this jurisdiction, it is no longer more likely than not that its deferred tax assets in the jurisdiction will be realizable and therefore has recorded a full valuation allowance against this entity’s deferred tax assets. Valuation allowances have been established for the Company’s US, Sweden, China and Japan operations and the Company’s joint venture in Japan. Such allowances are provided against each entity’s net deferred tax assets, primarily NOL’s, due to a history of cumulative losses or changes to projected future earnings which would support the recognition of the net deferred tax assets.
The Company has recorded a deferred tax asset of $11 million and $30 million as of December 31, 2018 and 2017, respectively, and $13 million and $17 million of deferred tax liabilities as of December 31, 2018 and 2017, respectively, in the Consolidated Balance Sheets.
Veoneer, Inc.
Notes to Consolidated Financial Statements
(U.S. DOLLARS IN MILLIONS)
The following table summarizes the activity related to the Company’s valuation allowances:
|
| | | | | | | | |
| | | As of December 31 |
| Valuation Allowances Against Deferred Tax Assets | | 2018 | | 2017 |
| Allowances at beginning of year | | $ | 150 |
| | $ | 90 |
|
| Benefits reserved current year | | 83 |
| | 98 |
|
| Benefits recognized current year | | — |
| | (4 | ) |
| Settlement of tax matters with Former Parent1 | | (101 | ) | | — |
|
| Change in Tax rate /impact of U.S. tax reform | | (4 | ) | | (35 | ) |
| Translation difference | | (3 | ) | | 1 |
|
| Allowances at end of year | | $ | 125 |
| | $ | 150 |
|
1Impact is reflected in equity in conjunction with the Spin-OffThe Company has reserves for income taxes that represent the Company’s best estimate of the potential liability for tax exposures. Inherent uncertainties exist in estimates of tax exposures due to changes in tax law, both legislated and concluded through the various jurisdictions’ court systems. Any income tax liabilities resulting from operations prior to the legal date of separation, were settled with Former Parent on the last day Veoneer was part of the Autoliv group and were relieved through the Former Parent company investment. The Company files income tax returns in the United States federal jurisdiction, and various states and non-U.S. jurisdictions.
Since the Company’s operations were generally part of an existing Autoliv legal entity through April 1, 2018 or June 30, 2018 (depending on the jurisdiction), the existing Autoliv legal entity was the primary obligor and is responsible for handling any income tax audit and settling any audits with the taxing authority. To the extent that the Company has accrued a liability for an uncertain tax position related to a period prior to the separation, such liabilities were settled with Former Parent on the last day the Company was part of the Former Parent’s group and were relieved through the Parent company investment.
The Company recognizes interest and penalties, if any, related to unrecognized tax benefits in tax expense. As of December 31, 2018, the Company had recorded $2 million for unrecognized tax benefits. Of the total unrecognized tax benefits as of December 31, 2018, $1 million is classified as a current income tax payable and $1 million is classified as non-current tax payable included in Other Non-Current Liabilities in the Consolidated Balance Sheets. Approximately $2 million of these reserves would impact income tax expense if released into income. The Company expects a change to its unrecognized tax benefits of approximately $1 million in the next twelve months.
The following table summarizes the activity related to the Company’s unrecognized tax benefits:
|
| | | | | | | | |
| | | As of December 31 |
| Unrecognized Tax Benefits | | 2018 | | 2017 |
| Unrecognized tax benefits at beginning of year | | $ | 2 |
| | $ | 1 |
|
| Increases as a result of tax positions taken during the current period | | 2 |
| | 1 |
|
| Settlement with net former parent | | (2 | ) | | — |
|
| Total unrecognized tax benefits at end of year | | $ | 2 |
| | $ | 2 |
|
The Company deferred tax liability for unremitted foreign earnings was $7 million as of December 31, 2018. The $7 million deferred tax liability represented our estimate of the foreign tax cost associated with our preliminary estimate of $146 million of foreign earnings that are not considered to be permanently reinvested. The Company have not provided for foreign withholding or income taxes on the remaining foreign subsidiaries’ undistributed earnings because such earnings have been retained and reinvested by the subsidiaries as of December 31, 2018. Accordingly, no provision has been made for foreign withholding or income taxes, which may become payable if the remaining undistributed earnings of foreign subsidiaries were paid to us as dividends.
Veoneer, Inc.
Notes to Consolidated Financial Statements
(U.S. DOLLARS IN MILLIONS)
NOTE 7. Receivables
|
| | | | | | | | |
| | | As of December 31 |
| | | 2018 | | 2017 |
| Receivables | | $ | 378 |
| | $ | 450 |
|
| Allowance at beginning of year | | $ | (2 | ) | | $ | (4 | ) |
| Reversal of allowance | | — |
| | 2 |
|
| Allowance at end of year | | $ | (2 | ) | | $ | (2 | ) |
| Total receivables, net of allowance | | $ | 376 |
| | $ | 448 |
|
The Company receives bank acceptance notes which are registered and endorsed to the Company, and generally matures within six months from certain of its customers in China to settle trade accounts receivable. These guaranteed notes are available for discounting with banking institutions in China or transferring to suppliers to settle liabilities. The Company may hold such bank acceptance notes until maturity, exchange them with suppliers to settle liabilities, or sell them to third party financial institutions in exchange for cash.
As of December 31, 2018, the Company has $19 million of of bank acceptance notes in China, and $10 million of trade receivables in France which remain outstanding and will mature within the first half of 2019. The collections of such bank acceptance notes and trade receivables are included in operating cash flows based on the substance of the underlying transactions, which are operating in nature. The fair value of the guaranteed notes receivables in China is determined based on Level 2 inputs including credit ratings and other criteria observable in the market. The fair value of these notes equal their carrying amounts of $9 million as of December 31, 2018.
During the year ended December 31, 2018, the Company entered into arrangements with financial institutions and factored trade receivables of $10 million in France and bank notes of $9 million in China. They were accounted for as secured borrowings with pledged collateral and recorded in the Consolidated Balance Sheets within “Receivable, net” and “Other current liabilities.”
NOTE 8. Inventories
|
| | | | | | | | |
| | | As of December 31 |
| | | 2018 | | 2017 |
| Raw material | | $ | 108 |
| | $ | 90 |
|
| Work in progress | | 15 |
| | 21 |
|
| Finished products | | 71 |
| | 70 |
|
| Inventories | | $ | 194 |
| | $ | 181 |
|
| Inventory reserve at beginning of year | | $ | (27 | ) | | $ | (25 | ) |
| Reversal of reserve | | 1 |
| | 5 |
|
| Addition to reserve | | (3 | ) | | (6 | ) |
| Write-off against reserve | | 5 |
| | 1 |
|
| Translation difference | | 1 |
| | (2 | ) |
| Inventory reserve at end of year | | $ | (23 | ) | | $ | (27 | ) |
| Total inventories, net of reserve | | $ | 172 |
| | $ | 154 |
|
NOTE 9. Equity Method Investment
As of December 31, 2018, the Company has one equity method investment.
On April 18, 2017, Autoliv and Volvo Cars completed the formation of their joint venture, Zenuity AB. Autoliv’s interest in Zenuity was transferred to Veoneer in connection with the Spin-Off. Autoliv made an initial cash contribution of SEK 1 billion (approximately $111 million as of April 18, 2017) and also contributed intellectual property, lab equipment and an assembled workforce. Veoneer and Volvo Cars each have a 50% ownership of Zenuity and neither entity has the ability to exert control over the joint venture, in form or in substance. Veoneer accounts for its investment in Zenuity under the equity method and the investment is shown in Equity method investment in the Consolidated Balance Sheets. The contributed intellectual property, lab equipment,
Veoneer, Inc.
Notes to Consolidated Financial Statements
(U.S. DOLLARS IN MILLIONS)
and an assembled workforce have been assessed to constitute a business as defined by ASU 2017-1, Business Combinations (Topic 805) – Clarifying the Definition of a Business. FASB ASC Topic 810, Consolidation states that when a group of assets that constitute a business is derecognized, the carrying amounts of the assets and liabilities are removed from the Consolidated Balance Sheets. The investor would recognize a gain or loss based on the difference between the sum of the fair value of any consideration received less the carrying amount of the group of assets and liabilities contributed at the date of the transaction. The equity value of Zenuity on the date of the closing of the transaction of approximately $250 million was calculated using the discounted cash flow method of the income approach. Veoneer’s 50% share of the equity value, approximately $125 million, represented its investment in Zenuity, including its cash contribution at inception.
As of December 31, 2018, Veoneer had contributed SEK 600 million (approximately $71 million) in cash (representing 50% of the total contribution, with the remainder made by Volvo Cars) into Zenuity to support its future operating cash flow needs.
The profit and loss attributed to the investment is shown in Loss from equity method investment in the Consolidated Statements of Operations. Veoneer’s share of Zenuity’s loss for the years ended December 31, 2018 and 2017 was $63 million and $31 million, respectively. As of December 31, 2018 and 2017, the Company’s equity investment in Zenuity amounted to $101 million and $98 million, respectively, after consideration of foreign exchange movements.
Certain audited Summarized Income Statement information of Zenuity is shown below:
|
| | | | | | | | | | | |
| | Year Ended December 31 |
| | 2018 | | 2017 | | 2016 |
| Net sales | $ | 5 |
| | $ | 5 |
| | $ | — |
|
| Gross profit | — |
| | — |
| | — |
|
| Operating loss | (125 | ) | | (61 | ) | | — |
|
| Loss before income taxes | (125 | ) | | (61 | ) | | — |
|
| Net loss | $ | (125 | ) | | $ | (61 | ) | | $ | — |
|
NOTE 10. Property, Plant and Equipment
|
| | | | | | | | | | | | |
| | | As of December 31 | | |
| DECEMBER 31 | | 2018 | | 2017 | | Estimated life |
| Land and land improvements | | $ | 21 |
| | $ | 20 |
| | n/a to 15 |
|
| Machinery and equipment | | 662 |
| | 610 |
| | 3-8 |
|
| Buildings | | 111 |
| | 76 |
| | 20 |
|
| Construction in progress | | 177 |
| | 72 |
| | n/a |
|
| Property, plant and equipment | | $ | 971 |
| | $ | 778 |
| | |
| Less accumulated depreciation | | (472 | ) | | (416 | ) | | |
| Net of accumulated depreciation | | $ | 499 |
| | $ | 362 |
| | |
| | | | | | | |
| | | Year Ended December 31 |
| DEPRECIATION INCLUDED IN | | 2018 | | 2017 | | 2016 |
| Cost of sales | | $ | 62 |
| | $ | 58 |
| | $ | 51 |
|
| Selling, general and administrative expenses | | 3 |
| | 2 |
| | 1 |
|
| Research, development and engineering expenses, net | | 22 |
| | 22 |
| | 19 |
|
| Total | | $ | 88 |
| | $ | 82 |
| | $ | 71 |
|
In 2018 the Company recognized an impairment charge of approximately $1 million of fixed assets related to Brake Systems. No significant fixed asset impairments were recognized during the year ended December 31, 2017 or 2016.
The net book value of machinery, equipment, buildings and land under capital lease contracts was $13 million and $11 million as of December 31, 2018 and 2017, respectively.
Veoneer, Inc.
Notes to Consolidated Financial Statements
(U.S. DOLLARS IN MILLIONS)
NOTE 11. Goodwill and Intangible Assets
Intangible assets as of December 31, 2018 and 2017, were as follows:
|
| | | | | | | | | | | |
| | Total | | Electronics Segment | | Brake Systems Segment |
| Goodwill | | | | | |
| Carrying amount at January 1, 2017 | $ | 490 |
| | $ | 278 |
| | $ | 212 |
|
| Acquisition | 30 |
| | 13 |
| | 17 |
|
| Goodwill impairment charge | (234 | ) | | — |
| | (234 | ) |
| Translation differences | 6 |
| | — |
| | 5 |
|
| Carrying amount at December 31, 2017 | 292 |
| | 292 |
| | — |
|
| Translation differences | (1 | ) | | (1 | ) | | — |
|
| Carrying amount at December 31, 2018 | $ | 291 |
| | $ | 291 |
| | $ | — |
|
Of the $30 million of goodwill recognized as of December 31, 2017, $13 million is related to the Fotonic acquisition in the fourth quarter of 2017 and $17 million is related to the finalization of the purchase price allocation for Brake Systems acquisition in the first quarter of 2017 (see Note 4, Business Combinations). During the year ended December 31, 2017, the Company recognized an impairment charge of the full goodwill amount of $234 million, after consideration of foreign exchange movements, related to Brake Systems. The Company estimated the fair value of Brake Systems using the discounted cash flow method, taking into account expected long-term operating cash-flow performance. The primary driver of the goodwill impairment was due to the lower expected long-term operating cash flow performance of the business unit as of the measurement date. For more information regarding the Company’s impairment testing, see section “Goodwill and Intangible Assets” in Note 2, Summary of Significant Accounting Policies.
|
| | | | | | | | |
| | | As of December 31 |
| Amortizable Intangible | | 2018 | | 2017 |
| Gross carrying amount | | $ | 260 |
| | $ | 249 |
|
| Acquisition | | 3 |
| | 4 |
|
| Translation differences | | 1 |
| | 7 |
|
| Accumulated amortization | | (161 | ) | | (138 | ) |
| Carrying value | | $ | 102 |
| | $ | 122 |
|
During the year ended December 31, 2017 the Company received information related to a contract with an OEM customer of MACOM products and as a result the Company recognized an impairment charge to amortization of intangibles in the Consolidated Statements of Operations for a customer contract of $12 million.
Of the carrying value of $102 million as of December 31, 2018, $71 million was related to the technology asset category and $31 million was related to the contractual relationships' asset category. Of the carrying value of $122 million at December 31, 2017, $80 million was related to the technology asset category and $38 million was related to the contractual relationships' asset category.
The Company recorded approximately $23 million, $37 million and $35 million of amortization expense related to definite-lived intangible assets for the years ended December 31, 2018, 2017 and 2016, respectively. The Company currently estimated future amortization expense be $22 million for 2019, $21 million for 2020, $19 million for 2021, $17 million for 2022 and $8 million for 2023. Indefinite-lived intangible assets are not amortized but are tested for impairment at least annually, or earlier when events and circumstances indicate that it is more likely than not that such assets have been impaired.
Veoneer, Inc.
Notes to Consolidated Financial Statements
(U.S. DOLLARS IN MILLIONS)
NOTE 12. Accrued Expenses
|
| | | | | | | | |
| | | As of December 31 |
| | | 2018 | | 2017 |
| Operating related accruals | | $ | 55 |
| | $ | 55 |
|
| Employee related accruals | | 66 |
| | 57 |
|
| Customer pricing accruals | | 39 |
| | 36 |
|
Product related liabilities1 | | 16 |
| | 22 |
|
| Other accruals | | 18 |
| | 25 |
|
| Total Accrued Expenses | | $ | 193 |
| | $ | 195 |
|
| |
1
| As of December 31, 2018, $14 million of product related liabilities were indemnifiable losses subject to indemnification by Autoliv and an indemnification asset is included in Other current assets, and there were no indemnification assets as of December 31, 2017. |
NOTE 13. Other Comprehensive Loss
|
| | | | | | | | | | | | |
| | | Year Ended December 31 |
| | | 2018 | | 2017 | | 2016 |
Other Comprehensive Loss1 | | | | | | |
| Cumulative translation adjustments | | $ | (10 | ) | | $ | (2 | ) | | $ | (31 | ) |
| Net gain (loss) of cash flow hedge derivatives | | — |
| | (1 | ) | | 8 |
|
| Pension liability | | (9 | ) | | (6 | ) | | (6 | ) |
| Total (ending balance) | | $ | (19 | ) | | $ | (8 | ) | | $ | (29 | ) |
| Deferred taxes on the pension liability | | 1 |
| | — |
| | — |
|
| |
1
| The components of Other Comprehensive Loss are net of any related income tax effects. |
NOTE 14. Retirement Plans
Defined Benefit Pension Plans
The defined benefit pension plans impacting the Veoneer financial results include the following:
Existing Veoneer Plans which are comprised of plans in Japan, Canada, and France, Transferred Veoneer Plans whicharecomprisedofplansinGermany,India,Japan,andSouthKorea,and Autoliv Sponsored Plans whichare comprisedofplansinSwedenandtheU.S.
The combination of the Existing Veoneer Plans and Transferred Veoneer Plans has resulted in a total pension expense of $4 million, $5 million and $4 million for the years ended December 31, 2018, 2017 and 2016, respectively.
Existing Veoneer Plans
The defined benefit pension plans for eligible participants in Japan, Canada, and France prior to the Spin-Off continue to provide pension retirement benefits to the Company’s employees subsequent to the Spin-Off.
Veoneer, Inc.
Notes to Consolidated Financial Statements
(U.S. DOLLARS IN MILLIONS)
Transferred Veoneer Plans
Prior to the plan transfers to Veoneer legal entities on April 1, 2018, eligible Veoneer employees participated in the following Autoliv-sponsored plans:
|
| |
Country | Name of Defined Benefit Plans |
Germany | Direct Pension Promises Plan |
India | Gratuity Plan |
Japan | Retirement Allowances Plan |
Defined Benefit Corporate Plan |
South Korea | Severance Pay Plan (statutory plan) |
On April 1, 2018, the assets, liabilities, and associated accumulated other comprehensive income (loss) of the pension plans in Germany, India, Japan, and South Korea related to active Veoneer employees were transferred to pension plans sponsored by various Veoneer legal entities. Benefit plan obligations of $6 million were recorded by Veoneer related to these plans in connection with the April 1, 2018 transfer. Plan assets in the transferred plans are immaterial. The amounts recorded for the transfer of the Veoneer plans were based on the assumptions incorporated into the plan measurements as of December 31, 2017; however, management determined that there were no material changes in assumptions from December 31, 2017 to April 1, 2018. The plans were re-measured in connection with the December 31, 2018 actuarial valuation.
Changes in Benefit Obligations and Plan Assets
|
| | | | | | | | |
| | | As of December 31 |
| | | 2018 | | 2017 |
| Benefit obligation at beginning of year | | $ | 74 |
| | $ | 66 |
|
| Service cost | | 5 |
| | 5 |
|
| Interest cost | | 2 |
| | 1 |
|
| Actuarial (gain) loss | | (2 | ) | | 1 |
|
| Benefits paid | | (2 | ) | | (1 | ) |
| Curtailments | | — |
| | (3 | ) |
| Settlement | | (3 | ) | | — |
|
| Acquisition | | — |
| | 1 |
|
| Other | | 4 |
| | — |
|
| Translation difference | | (2 | ) | | 4 |
|
| Benefit obligation at end of year | | $ | 76 |
| | $ | 74 |
|
| Fair value of plan assets at beginning of year | | $ | 60 |
| | $ | 51 |
|
| Actual return on plan assets | | (2 | ) | | 3 |
|
| Company contributions | | 4 |
| | 6 |
|
| Benefits paid | | (2 | ) | | (1 | ) |
| Settlements | | (3 | ) | | (3 | ) |
| Acquisition | | — |
| | 1 |
|
| Other | | (1 | ) | | — |
|
| Translation difference | | (2 | ) | | 3 |
|
| Fair value of plan assets at year end | | $ | 54 |
| | $ | 60 |
|
| Funded status recognized in the balance sheet | | $ | (22 | ) | | $ | (14 | ) |
Veoneer, Inc.
Notes to Consolidated Financial Statements
(U.S. DOLLARS IN MILLIONS)
Components of Net Periodic Benefit Cost Associated with the Defined Benefit Retirement Plan
|
| | | | | | | | | | | | |
| | | Year Ended December 31 |
| | | 2018 | | 2017 | | 2016 |
| Service cost | | $ | 5 |
| | $ | 5 |
| | $ | 4 |
|
| Interest cost | | 2 |
| | 1 |
| | 1 |
|
| Expected return on plan assets | | (2 | ) | | (2 | ) | | (2 | ) |
| Net periodic benefit cost | | $ | 4 |
| | $ | 5 |
| | $ | 4 |
|
The service cost and amortization of prior service cost components are reported among employee compensation costs in the Consolidated Statements of Operations. The remaining components (interest cost, expected return on plan assets and amortization of actuarial loss) are reported in Other non-operating items, net in the Consolidated Statements of Operations.
The estimated prior service cost and net actuarial loss that will be amortized from other comprehensive income into net benefit cost over the next fiscal year is immaterial. The estimated net periodic benefit cost for 2019 is $6 million.
Components of Accumulated other Comprehensive Income Before Tax
|
| | | | | | | | |
| | | As of December 31 |
| | | 2018 | | 2017 |
| Net actuarial loss (gain) | | $ | 9 |
| | $ | 6 |
|
| Prior service cost (credit) | | — |
| | 1 |
|
| Total accumulated other comprehensive income recognized in the balance sheet | | $ | 10 |
| | $ | 7 |
|
Changes in Accumulated Other Comprehensive Income Before Tax
|
| | | | | | | | |
| | | As of December 31 |
| | | 2018 | | 2017 |
| Total retirement benefit recognized in accumulated other comprehensive income at beginning of year | | $ | 7 |
| | $ | 7 |
|
| Net actuarial loss (gain) | | 3 |
| | (1 | ) |
| Translation difference | | (1 | ) | | 1 |
|
| Other | | 1 |
| | — |
|
| Total retirement benefit recognized in accumulated other comprehensive income at end of year | | $ | 10 |
| | $ | 7 |
|
The accumulated benefit obligation for the Veoneer defined benefit pension plans as of December 31, 2018 and 2017 was $67 million and $33 million, respectively.
Pension Plans for Which Accumulated Benefit Obligation (ABO) Exceeds the Fair Value of Plan Assets
|
| | | | | | | | |
| | | As of December 31 |
| | | 2018 | | 2017 |
| Projected Benefit Obligation (PBO) | | $ | 76 |
| | $ | 39 |
|
| Accumulated Benefit Obligation | | $ | 67 |
| | $ | 33 |
|
| Fair value of plan assets | | $ | 54 |
| | $ | 26 |
|
Veoneer, in consultation with its actuarial advisors, determines certain key assumptions to be used in calculating the projected benefit obligation and annual net periodic benefit cost.
Veoneer, Inc.
Notes to Consolidated Financial Statements
(U.S. DOLLARS IN MILLIONS)
Assumptions Used to Determine the Benefit Obligation
|
| | | | | |
| | | As of December 31 |
| | | 2018 | | 2017 |
| | | Weighted average | | Range |
| Discount rate | | 2.14 | % | | 0.50-3.60 |
| Rate of increases in compensation level | | 4.39 | % | | 2.00-3.00 |
Assumptions Used to Determine the Net Periodic Benefit Cost for Years Ended December 31
|
| | | | | | | |
| | | Year Ended December 31 |
| | | 2018 | | 2017 | | 2016 |
| | | Weighted average | | Range | | Range |
| Discount rate | | 2.06 | % | | 0.50-3.90 | | 0.50-4.10 |
| Rate of increases in compensation level | | 4.30 | % | | 2.00-5.00 | | 2.25-5.00 |
| Expected long-term rate of return on assets | | 3.81 | % | | 0.75-6.00 | | 0.75-6.15 |
The discount rates for the Veoneer plans have been set based on the rates of return on high-quality fixed-income investments currently available at the measurement date and expected to be available during the period the benefits will be paid. The expected timing of cash flows from the plan have also been considered in selecting the discount rate. In particular, the yields on corporate bonds rated AA or better on the measurement date have been used to set the discount rate. The expected rate of increase in compensation levels and long-term rate of return on plan assets are determined based on a number of factors and must take into account long-term expectations and reflect the financial environment in the respective local market. The expected return on assets for the Veoneer plans are based on the fair value of the assets as of December 31.
The investment objectives for the Veoneer plans is to provide an attractive risk-adjusted return that will ensure the payment of benefits while protecting against the risk of substantial investment losses. Correlations among the asset classes are used to identify an asset mix that Veoneer believes will provide the most attractive returns. Long-term return forecasts for each asset class using historical data and other qualitative considerations to adjust for projected economic forecasts are used to set the expected rate of return for the entire portfolio. Veoneer has assumed a long-term rate of return on the plan assets of 0.75% for the Japan plans and 6.00% for the Canada plans for calculating the 2018 and 2019 expense.
The Company made contributions of approximately $4 million for the year ended December 31, 2018 and of approximately $6 million for the year ended December 31, 2017. In addition, the Company expects to contribute $3 million to its pension plans in 2019.
Fair Value of Total Plan Assets
|
| | | | | | |
| | | As of December 31 |
| ASSETS CATEGORY IN % WEIGHTED AVERAGE | | 2018 | | 2017 |
| Equity securities | | 36.0 | % | | 40.0 | % |
| Debt instruments | | 12.0 | % | | 13.0 | % |
| Other assets | | 52.0 | % | | 47.0 | % |
| Total | | 100.0 | % | | 100.0 | % |
Veoneer, Inc.
Notes to Consolidated Financial Statements
(U.S. DOLLARS IN MILLIONS)
The following table summarizes the fair value of the defined benefit pension plan assets:
|
| | | | | | | | |
| | | As of December 31 |
| | | 2018 | | 2017 |
| Assets | | | | |
| Equity | | | | |
| U.S. Large Cap | | $ | 7 |
| | $ | 16 |
|
| Non-U.S. Equity | | 13 |
| | 8 |
|
| Non-U.S. Bonds | | | | |
| Corporate | | 3 |
| | — |
|
| Aggregate | | 4 |
| | 7 |
|
| Insurance Contracts | | 24 |
| | 25 |
|
| Other Investments | | 4 |
| | 4 |
|
| Total | | $ | 54 |
| | $ | 60 |
|
The fair value measurement level within the fair value hierarchy (see Note 5, Fair Value Measurements) is based on the lowest level of any input that is significant to the fair value measurement. Plan assets are classified as Level 1 with exception of the Insurance Contracts which are classified as Level 2 in the table above.
The estimated future benefit payments for the pension benefits reflect expected future service, as appropriate. The amount of benefit payments in a given year may vary from the projected amount, especially as certain plans include lump sum benefit payments, and the lump sum amounts may vary with market interest rates.
|
| | | |
| | |
| Pension Benefits Expected Payments | Amount |
| 2019 | $ | 2 |
|
| 2020 | $ | 2 |
|
| 2021 | $ | 3 |
|
| 2022 | $ | 3 |
|
| 2023 | $ | 3 |
|
| Years 2024-2028 | $ | 22 |
|
Autoliv Sponsored Plans
Prior to certain legal decisions or plan amendments, Veoneer employees in Sweden and in the U.S. participated in the following Autoliv-sponsored multiemployer plans:
|
| |
Country | Name of Defined Benefit Plans |
Sweden | ITP plan |
U.S. | Autoliv ASP, Inc. Pension Plan |
Autoliv ASP, Inc. Excess Pension Plan |
Autoliv ASP, Inc. Supplemental Pension Plan |
On April 1, 2018, it was determined that the assets, liabilities, and associated accumulated other comprehensive income (loss) of the Sweden plan for all Veoneer employees included in the Sweden plan will remain with Autoliv and benefits will be paid out of that plan in the future upon retirement. The allocation to capture the Company’s specific defined benefit plans expense and contributions prior to the plans amendment for the year ended March 31, 2018 were less than $1 million and $1 million for the year ended December 31, 2017 and 2016, respectively. The remaining components (interest cost, expected return on plan assets and amortization of actuarial loss) are reported as other non-operating items, net in the Consolidated Statements of Operations. These costs were funded through intercompany transactions with Autoliv, which are reflected within the Net Former Parent Investment balance.
On June 29, 2018, it was also determined that the assets, liabilities, and associated accumulated other comprehensive income (loss) of the U.S. plan for all Veoneer employees included in the U.S. plan will remain with Autoliv and benefits will be paid out of that
Veoneer, Inc.
Notes to Consolidated Financial Statements
(U.S. DOLLARS IN MILLIONS)
plan in the future upon retirement. The Veoneer employees were considered to be participating in the Autoliv sponsored plan through June 29, 2018 at which date the plan was amended to freeze the accrual of benefits for any Veoneer employees. The U.S. plan resulted in less than $1 million of defined benefit plan expense and contributions made allocated to Veoneer for the year ended December 31, 2018 and less than $1 million of defined benefit plan expense and contributions made allocated to Veoneer for the year ended December 31, 2017.
Prior to the respective dates above for the Sweden and the U.S. plans, the Veoneer employees were considered to be participating in the Autoliv sponsored plans. Effective April 1, 2018 for the Sweden plan and June 29, 2018 for the U.S. plan the respective parties determined that Veoneer would not have additional expense or liability related to each of the existing plans.
Post-Retirement Benefits Other Than Pension
Veoneer currently provides postretirement health care and life insurance benefits to eligible Canadian employees. The plan is an unfunded plan with a benefit obligation of $4 million as of December 31, 2018 and $3 million as of December 31, 2017 and 2016. The net periodic benefit cost and impact on accumulated other comprehensive income related to the plan are immaterial.
In addition to the existing benefit obligation from the Canadian medical plan, the Company also assumed less than $1 million in benefit obligations transferred from Autoliv’s U.S. medical plan as of June 29, 2018 in connection with the Spin-Off.
Defined contribution plans
Veoneer recorded charges for contributions to the defined contribution plans of $2 million for the year ended December 31, 2018 and $1 million for each of the years ended December 31, 2017 and 2016.
NOTE 15. Stock Incentive Plan
The Veoneer, Inc. 2018 Stock Incentive Plan was adopted and effective as of the Distribution Date to govern the Company’s stock-based awards that will be granted in the future as well as awards granted in connection with the conversion of outstanding awards granted under the Autoliv equity compensation program. The Veoneer, Inc. 2018 Stock Incentive Plan authorizes the grant of 3 million shares of Veoneer common stock for future equity awards to Veoneer employees, non-employee directors and other service-providers. In addition, the board authorized 957,388 shares for the conversion of the outstanding Autoliv stock awards in connection with the Spin-Off.
Prior to the Spin-Off, certain eligible employees and non-employee directors of Veoneer participated in the Autoliv, Inc. 1997 Stock Incentive Plan and received Autoliv stock-based awards, which included stock options, restricted stock units and performance shares. In connection with the Spin-Off, each outstanding Autoliv stock-based award as of the Distribution Date was converted to a stock award having underlying shares of both Autoliv and Veoneer common stock.
The conversion that occurred on the Distribution Date was based on the following:
Stock Options (SOs) - A number of SOs comprising 50% of the value of the outstanding SOs calculated immediately prior to the Spin-Off continued to be applicable to Autoliv common stock. A number of SOs comprising the remaining 50% of the pre-spin value were replaced with options to acquire shares of Veoneer common stock.
Restricted Stock Units (RSUs) - A number of RSUs comprising 50% of the value of the outstanding RSU calculated immediately prior to the Spin-Off continued to be applicable to Autoliv common stock. A number of RSUs comprising the remaining 50% of the pre-spin value were replaced with RSUs with underlying Veoneer common stock.
Performance Shares (PSs) - Outstanding PSs were converted to time-based RSUs and were treated in the same manner as other outstanding RSUs (as described above) on the Distribution Date. The number of outstanding PSs were converted based on:
| |
1) | The level of actual achievement of performance goals for each outstanding PS for the period between the first day of the performance period and December 31, 2017 (the “Performance Measurement Date”), referred to as “Level of Performance-to-Date”, and |
| |
2) | The greater of the Level of Performance-to-Date and estimated target performance level (i.e., 100%) for the period between the Performance Measurement Date and the last day of the performance period. |
Veoneer, Inc.
Notes to Consolidated Financial Statements
(U.S. DOLLARS IN MILLIONS)
In each case above, the conversion was intended to generally preserve the intrinsic value of the original award determined as of the Distribution Date. The number of converted RSUs and SOs for Autoliv and Veoneer was based on the average of Autoliv closing stock prices for the last 5 trading days prior to the Spin-Off and the average of closing stock prices of Autoliv and Veoneer, respectively, for the first 5 trading days after the Spin-Off.
As a result of the Spin-Off and the related conversion, it was determined that the stock-based awards were modified in accordance with ASC 718, Compensation – Stock Compensation. As a result, the fair value of the RSUs and SOs immediately before and after the modification was assessed in order to determine if the modification resulted in any incremental compensation cost related to the awards, including consideration of the impact of conversion using the 5 trading day average. Based on the valuation performed, it was determined that the conversion did not result in any incremental compensation cost for any of the outstanding awards.
With certain limited exceptions, including the freezing of the Performance Measurement Date to December 31, 2017 as noted above, the adjusted SOs and RSUs outstanding after the Spin-Off are subject to the same terms and conditions (including with respect to vesting and expiration) that were applicable to such Autoliv stock-based awards immediately prior to the conversion. There was no stock-based compensation expense related to SOs for the years ended December 31, 2018 and 2017.
The RSUs granted by the Former Parent on February 15, 2016 and May 9, 2016 vest in three approximately equal annual installments beginning on the first anniversary of the grant date. The RSUs and PSs granted by the Former Parent on February 19, 2017 and February 15, 2018 will each vest in one installmentcliff-vest on the third anniversary of the grant date. The RSUs and PSs granted in 2017 and the RSUs granted in 2018 entitle the grantee to receive dividend equivalents in the form of additional RSUs and PSsdate, subject to the samegrantee’s continued employment with the Company on such vesting conditionsdate, and subject to limited exceptions.
Performance Shares. We believe that PSs focus and direct the efforts of our executives toward the attainment of critical multi-year corporate objectives, as well as further encourage employment retention because:
| • | The performance metrics selected for the PSs are drivers of our long-term value creation; and |
| • | Due to the three-year performance period vesting period, PSs will parallel the RSUs in encouraging the executive to stay with the Company or forfeit potential, significant accumulated value. |
Our named executive officers are eligible to earn 0%-200% of the underlying RSUstarget number of PSs based on the Company’s achievement of annual gross margin goals established by the Compensation Committee at the beginning of each year during a three-year performance period. For purposes of the PSs, “gross margin” means the Company’s gross profits for the applicable year, where gross profits means net sales (revenues as reported on the Company’s income statement for the applicable year) minus direct and production overhead cost (cost of goods sold as reported on the Company’s income statement for the applicable year), in each case excluding Veoneer Brake Systems.
For the 2019-2021, 2020-2022 and 2021-2023 PS awards the gross margin target for the 2021 annual period were as follows:
| Threshold: | 13% |
| Target: | 15.5%-16.5% |
| Maximum: | 19% |
If gross margin for the applicable fiscal year is less than the threshold level, no PSs respectively.are to be earned for that year. Linear interpolation is used to determine the number of PSs eligible to be earned for performance between threshold and target, and target and maximum.
The fair valuefinal number of PSs earned is subject to downward adjustment based on our share price measured at the end of the RSUs and PSs is calculated asthree-year performance period. If the grant date fair value“volume weighted average price” of the shares expectedCompany stock measured during December at the end of the PSs three-year performance period is equal to be issued. Foror below 75% of the grants made during 2017 and 2018, the fair value of a PS and a RSU is calculated by using the closing stock price on the grant date. For the grants made during 2016, the fair valuedate of a RSU and a PS was estimated using the Black Scholes valuation model. The grant date fair value for the RSUs at February 13, 2018 was $6 million and the grant date fair value of the RSUs at February 19, 2017 was $3 million. The grant date fair value of the PSs, then the PSs eligible to vest is capped at February 19, 2017 was $3 million. The cost will be amortized straight line over the vesting period. For PSs, the grant date fair value100% of the numbertarget award. If the “volume weighted average price” is equal to or above 100% of awards expectedthe closing price on the date of grant, then the PSs eligible to vest will vest at the actual performance level. If the “volume weighted average price” is between 75% and 100%, then the PSs eligible to vest is based on a linear interpolation. The Compensation Committee believes that annual gross margin performance targets are appropriate at this time due to the Former Parent’s best estimate of ultimate performance againstcomplexity in setting three-year cumulative targets. The Committee intends to implement three-year cumulative targets for PSs for future LTI programs, if and when practical.
Actual PS Award Levels
The Company’s annual gross margin for 2021 was 16.7%. Accordingly, for the respective targets2019-2021, 2020-2022 and is recognized as compensation cost on a straight-line basis over would2021-2023 PSs, the PSs were earned at 1.08x the target award and became eligible to be the requisite vesting periodearned for 2021 performance. The number of the awards. The Former Parent assessedPSs earned by our named executive officers for each of the expected achievement levelslast two years is reflected in the table below, which remain subject to downward adjustment at the end of each quarter. the applicable three-year performance period, as described above:
| Actual Earnout Performance Share Program |
| PS Cycle | Performance Year/Tranche | | Earnout |
| 2019-2021, 2020-2022, 2021-2023 | 2021 | | 1.08 x Target |
| 2019-2021, 2020-2022 | 2020 | | 0.3 x Target |
| 2019-2021 | 2019 | | 0 x Target |
Final Earn Out of the 2019-2021 PSs
As described above, the final number of PSs earned are subject to downward adjustment based on our share price measured at the end of the three-year performance period. The “volume weighted average price” of the Company stock measured during December 31, 2017,2021 was $35.28 compared to $29.47 on the Former Parent believed itday of grant for the 2019-2021 PSs. As the “volume weighted average price” was probable thatabove 100% of the closing price on the day of grant of the 2019-2021 PSs, there was no downward adjustment to the 2019-2021 PSs and the PSs vested at the performance conditions for the two grants will be met, although at a different level,levels described above.
Pension / Retirement and has recorded the compensation expense accordingly. The cumulative effect of the changeOther Post-Employment Benefits
Veoneer provides certain supplemental retirement/pension and other post-employment benefits, in estimate is recognized in the period of change as an adjustment to compensation expense.
All SOs were granted for 10-year terms, had an exercise price equaladdition to the fair market valuemandatory programs required by local and national statutes and maintains defined contribution plans for our named executive officers that are competitive with customary local practice. The programs’ key terms are described below.
Defined Contribution Programs (individual retirement investment from Company contributions). All senior executives participate in defined contribution plans rather than defined benefit plans.
The Company contributes a percentage of each executive’s annual base salary to the share on the date of grant, and became exercisable after one year of continued employment following the grant date. The average grant date fair values of SOs were calculated using the Black-Scholes valuation model. The Former Parent used historical exercise data for determining the expected life assumption. Expected volatility was based on historical and implied volatility. There were no SOs granted in 2018, 2017 or 2016. The table below includes the assumptions for all awards issued:plan, as follows:
|
| | | | | | | | | |
| | | Year Ended December 31 |
| | | 2018 | | 2017 | | 2016 |
| PSs and RSUs | | | | | | |
Dividend yield 1 | | — |
| | — |
| | 2.2 | % |
Retirement - Defined Contribution Level as % of Annual Base Salary |
| Name | | Level of Contribution |
| Jan Carlson | | 48% |
Ray Pekar1(1) | Dividend equivalent rights applied to grants starting in 2017. | 0% |
Lars Sjöbring(2) | | 35% |
| Matthias Bieler | | 35% |
| Robert Bisciotti | | See below and “Nonqualified Deferred Compensation” table |
Mats Backman(3) | | 35% |
| Art Blanchford | | See below and “Nonqualified Deferred Compensation” table |
Steve Rodé(1) | | 0% |
Veoneer recognized total stock (RSUs, PSs and SOs) compensation cost of $5 million, $2 million and $3 million, in the Consolidated Statements of Operations, for the years ended December 31, 2018, 2017 and 2016, respectively. These costs include amounts for individuals specifically identifiable to the Veoneer business as well as an allocation of costs attributable to individuals in corporate functions for the periods prior to the Spin-Off and Veoneer employees subsequent to the Spin-Off. Veoneer has unrecognized compensation cost for Veoneer employees of $6 million related to non-vested awards for RSUs and the weighted average period over which this cost is expected to be recognized is approximately 1.8 years. There is no compensation cost not yet recognized for stock options.
Veoneer, Inc.
Notes to Consolidated Financial Statements
(U.S. DOLLARS IN MILLIONS)
A summary of RSUs activity is presented below:
|
| (1) | |
| Number of RSUs |
RSUs1
| |
Outstanding as of June 30, 2018 (Converted from former ParentMessrs. Pekar and Rodé do not participate in connection with the Spin-Off) | 601,740 |
|
Granted | 9,380 |
|
Shares issued | (7,490 | ) |
Cancelled/Forfeited/Expired | (9,636 | ) |
Outstanding as of December 31, 2018 | 593,994 |
401(k) plan available to U.S. based employees. |
1 RSUs presented in this table represent Veoneer awards, including those held by Autoliv employees.
The weighted average fair value per share at the grant date for RSUs during the years ended December 31, 2018, 2017 and 2016 was $42.88, $31.98 and $29.81, respectively. The grant date fair value for RSUs vested in 2018 was $2 million.
There were no PSs granted subsequent to the Spin-Off. The weighted average fair value per share at the grant date for PSs during the years ended December 31, 2017 and 2016 was $31.98 and $29.81, respectively. All outstanding PSs were cancelled and converted to RSUs in connection with the Spin-Off. There are no PSs outstanding as of December 31, 2018.
The grant date fair value for RSUs and PSs awarded by the Former Parent were converted with a factor of 3.31.
| (2) | Comprised of contributions to both 401(k) and non-qualified contribution plans. |
| | |
| | Number(3)
| Mr. Backman resigned as CFO effective March 1, 2021. Pursuant to the terms of Options
|
SOs1
| |
Outstanding at June 30, 2018 (Converted from former Parent in connection with his employment agreement, the Spin-Off) | 355,646 |
|
Exercised | (30,062 | ) |
Cancelled/Forfeited/Expired | — |
|
Outstanding as of December 31, 2018 | 325,584 |
Company continued to make contributions to the plan through May 3, 2021. |
1 SOs presented in this table represent Veoneer awards, including those held by Autoliv employees.
The following summarizes information about stock options outstanding
Messrs. Sjöbring, Bisciotti and exercisable as of December 31, 2018:
|
| | | | | |
| | | Number Outstanding1 | | Remaining Contract life (in years) |
| EXERCISE PRICES | | | | |
| $4.93 | | 16,796 |
| | 0.14 |
| $13.51 | | 21,342 |
| | 1.13 |
| $20.25 | | 21,266 |
| | 3.15 |
| $20.91 | | 43,934 |
| | 4.14 |
| $22.04 | | 15,055 |
| | 2.15 |
| $28.67 | | 80,627 |
| | 5.14 |
| $34.25 | | 126,564 |
| | 6.13 |
| | | 325,584 |
| | 4.6 |
1 SOs presented in this table represent Veoneer awards, including those held by Autoliv employees.
The total aggregate intrinsic value, which is the difference between the exercise price and $23.57 (closing price per share as of December 31, 2018), for all “in the money” stock options, both outstanding and exercisable as of December 31, 2018, was $1 million.
Veoneer, Inc.
Notes to Consolidated Financial Statements
(U.S. DOLLARS IN MILLIONS)
NOTE 16. Commitments and Contingencies
Legal Proceedings
Veoneer is subject to various claims, lawsuits and proceedings are pending or threatened against the Company, covering a range of matters that arise in the ordinary course of its business activities with respect to commercial, product liability and other matters. Litigation is subject to many uncertainties, and the outcome of any litigation cannot be assured. After discussions with counsel, with the exception of any potential losses resulting from the issue described below, it is the opinion of management that the various legal proceedings and investigations to which the Company currently is a party will not have a material adverse impact on the Consolidated financial position of Veoneer, but the Company cannot provide assurance that Veoneer will not experience material litigation, product liability or other losses in the future.
Product Warranty, Recalls and Intellectual Property
Veoneer is exposed to various claims for damages and compensation if its products fail to perform as expected. Such claims can be made, and result in costs and other losses to the Company, even where the product is eventually found to have functioned properly. Where a product (actually or allegedly) fails to perform as expected or is defective, the Company may face warranty and recall claims. Where such (actual or alleged) failure or defect results, or is alleged to result, in bodily injury and/or property damage, the Company may also face product liability and other claims. There can be no assurance that the Company will not experience material warranty, recall or product (or other) liability claims or losses in the future, or that the Company will not incur significant costs to defend against such claims. The Company may be requiredBlanchford were eligible to participate in a recall involving its products.401(k) plan available to U.S. based employees in 2021. Under this plan, the Company makes an employer matching contribution equal to 100% of the first 3%, and then equal to 50% of the next 2% of employee contributions (expressed as percentage of base pay), up to certain limits. Messrs. Sjöbring and Blanchford also participated in a non-qualified defined contribution plan.
Defined Benefits Program. Mr. Carlson participated in a Company defined benefit plan prior to becoming CEO of Autoliv. This plan is frozen and remains with Autoliv. None of our other named executive officers are parties to a defined benefit arrangement with the Company.
Termination/Severance Agreements. Each vehicle manufacturerof our named executive officers has its own practicesan employment agreement with the Company, pursuant to which he is entitled to certain severance benefits in the event of his termination of employment. A detailed summary of the terms of these agreements is provided on page 28 of this Report. In addition, each of Messrs. Carlson and Sjöbring has a change-in-control (“CiC”) severance agreement with the Company, pursuant to which the executive is entitled to certain severance benefits in the event of his termination of employment in connection with a CiC (which benefits would be in lieu of any benefits under the employment agreement). These arrangements were provided to certain of our most senior executive officers as a competitive pay package component to encourage executives to remain focused on the Company’s business in the event of rumored or actual fundamental corporate changes.
Pension / Retirement and Other Post-Employment Benefits
In addition to the CiC severance agreements, the stock plans provide certain protections in the event of a CiC. Pursuant to the Autoliv 1997 Stock Incentive Plan and the Veoneer 2018 Stock Incentive Plan, outstanding equity awards granted prior to 2019 will become fully vested upon the occurrence of a CiC. Awards granted in 2019 and forward provide for “double-trigger” CiC acceleration. Specifically, (i) in the event of a CiC in which the LTI awards are assumed by the surviving entity, if the employee’s employment is terminated without cause (or, in certain cases, if he or she resigns for good reason) within two years following the CiC, then the RSUs and PSs will immediately vest (at actual performance achievement for completed performance periods and at the target level for incomplete performance periods, in the case of PSs); and (ii) in the event of a CiC in which the awards are not assumed by the surviving entity, then the RSUs and PSs will become immediately vested (at actual performance achievement for completed performance periods and at the target level for incomplete performance periods, in the case of the PSs).
The “change-in-control” definition contained in Autoliv’s 1997 Stock Incentive Plan and Veoneer’s 2018 Stock Incentive Plan and CiC severance arrangements requires the actual consummation of a corporate transaction, such as a merger, rather than upon stockholder approval of the transaction. This avoids an inadvertent “early trigger” of any CiC provisions should the transaction fail to close.
We do not provide tax gross-up protection for CiC excise taxes (i.e., U.S. taxes under Section 4999 of the United States Internal Revenue Code of 1986, as amended (the “U.S. Internal Revenue Code”), applied to CiC payments that exceed certain amounts under Section 280G) to our named executive officers.
Executive Compensation Responsibilities
Role of the Compensation Committee
The Compensation Committee reviews our named executive officers’ pay levels and target incentive opportunities versus the competitive market and considers information provided by the consultants regarding product recallstrends, input from the Executive Vice President, Human Resources, the CEO’s recommendations as to compensation for our named executive officers (other than himself) and other product liability actions relating to its suppliers. As suppliers become more integrally involvedrelevant factors as discussed above in the vehicle design process and assume more“Compensation Objectives” section.
Role of the vehicle assembly functions, vehicle manufacturers are increasingly lookingIndependent Compensation Committee Consultant
The Compensation Committee regularly engages an independent advisor, who reports directly to their suppliers for contribution when faced with recallsthe Compensation Committee. The independent advisor routinely attends meetings of the Compensation Committee and product liability claims. Government safety regulators may also play a roleprovides independent perspective and advice to the Compensation Committee on various aspects of the Company’s total compensation program and the market environment in warranty and recall practices. A warranty, recall or product-liability claim brought againstwhich the Company operates. Additional information regarding the role of the Compensation Committee’s advisor, Meridian Compensation Partners, may be found later in excessthis CD&A in the “2021 Executive Compensation Decisions” section.
Role of the Chief Executive Officer
Our CEO regularly participates in the meetings of the Compensation Committee. The CEO and Executive Vice President, Human Resources work together to develop a recommendation to present to the Compensation Committee with respect to compensation packages for each of our named executive officers, other than the CEO. As a result, our CEO generally has a significant impact on the compensation paid to the other named executive officers. In addition, the Compensation Committee has delegated to the CEO the authority for the determination of certain grants to employees other than executive officers under our long-term incentive plan, subject to established grant limits. The Compensation Committee regularly holds executive sessions, excusing the CEO from the meeting, to discuss matters related to the CEO’s compensation.
Role of the Management Consultant
Management periodically solicits the advice of external compensation consultants to ensure that the Company’s compensation program is competitive with compensation programs offered by the companies in its insurance maypeer group and companies in the markets in which the named executive officers are located. In 2021, Mercer assisted management with reviewing the Company’s compensation program for executives, as described in more detail below.
Policies and Practices that Govern Executive Compensation at Veoneer
Stock Ownership Guidelines. Pursuant to these guidelines, each executive officer is expected to accumulate and hold shares of Company common stock having a value at least equal to (i) 2x annual base salary, in the case of the CEO, and (ii) 1x annual base salary, in the case of each executive other than the CEO. Executives are expected to make continuous progress toward their respective ownership requirements. Until the executive has satisfied the stock ownership guidelines, he or she will be required to retain 75% of the net shares received upon settlement of RSUs. For purposes of these stock ownership guidelines, “net shares” are those shares held by the executive after deducting any shares withheld by the Company or sold by the executive for the sole purpose of satisfying the executive’s tax liabilities and related fees, if any, related to the settlement event.
Policy Against Hedging, Short-Selling and Pledging. All Veoneer directors, officers (including executive officers) and employees holding Veoneer securities are prohibited from engaging in hedging, short-selling or pledging with respect to such securities.
Compensation Recoupment Policy. We have a compensation recoupment policy that allows the Board to recoup from current and former executives’ annual incentive compensation that is subsequently determined not to have been earned in the event of a material restatement of the Company’s financial results due to fraud, intentional misconduct, negligence, or dereliction of duties by the executive officer. The Board is also authorized to recoup equity compensation upon misconduct that is harmful to the interests of the Company such as a violation of Company policy.
Compensation Risk Assessment
The Compensation Committee annually considers potential risks when reviewing and approving our compensation program. We have designed our compensation program, including our incentive compensation plans, with specific features to address potential risks while rewarding employees for achieving long-term financial and strategic objectives through prudent business judgment and appropriate risk taking. The following elements have been incorporated in our compensation program for executive officers:
A Balanced Mix of Compensation Components – The target compensation mix for our executive officers is composed of base salary, annual cash incentives, LTI and retirement benefits, representing a mix that is not overly weighted toward short-term cash incentives.
Performance Factors – Annual cash incentives for executive officers other than the CEO are determined at 75% on Company-wide financial goals and 25% on individual goals that consider relevant Environmental, Social, and Governance (ESG) metrics. The CEO is subject to an annual individual performance assessment by the Board that considers these and other relevant factors.
Long-term Incentives – Our LTIs are equity-based and generally have a three-year vesting schedule to complement our annual cash-based incentives. The allocation is 100% performance shares for the CEO and 50% PSs and 50% RSUs for all executive officers.
Capped Incentive Awards – Annual cash incentive awards and PSs are capped at 200% of target.
Stock Ownership Guidelines – Our guidelines call for meaningful share ownership, which aligns the interests of our executive officers with the long-term interests of our stockholders.
Compensation Recoupment Policy – Our Board is authorized to recoup earned incentive compensation in the event of a material restatement of the Company’s financial results due to fraud, intentional misconduct, negligence, or dereliction of duties by the executive officer.
Additionally, the Compensation Committee considered an assessment of compensation-related risks including an inventory of incentive and commission arrangements below the executive level. Based on this assessment, the Compensation Committee concluded that our compensation program does not create risks that are reasonably likely to have a material adverse effect on Veoneer. In making this determination, the Compensation Committee reviewed the key design elements of our compensation programs in relation to industry “best practices” as presented by Meridian Compensation Partners, the Compensation Committee’s independent compensation consultant, as well as the means by which any potential risks may be mitigated, such as through our internal controls and oversight by management and the Board of Directors.
As of 2019, when the Company introduced its first long-term incentive program as a stand-alone company, to mitigate potential compensation-related risk, the Company began requiring double-trigger acceleration of unvested equity awards in the event of a covered termination following a CiC, instead of the previous single trigger acceleration in the outstanding adjusted awards which were granted prior to the Spin-Off.
2021 Executive Compensation Decisions
The Process
The compensation for our named executive officers is reviewed every year. The Compensation Committee considers changes in total compensation levels for the named executive officers after it reviews the relevant peer group or local market data (per position). The Compensation Committee uses this information as one input in its decision-making process. In addition to market data, the Compensation Committee also reviews the Company’s business. Vehicle manufacturers are also increasingly requiring their outside suppliersfinancial performance, the named executive officers’ individual performance, input from the Executive Vice President, Human Resources, and the recommendations of the CEO with respect to guarantee or warrant their productsthe compensation packages for the named executive officers other than himself. The Compensation Committee reviews, provides feedback and bearapproves the costsfinal recommendations for the compensation of repairour named executive officers.
The Compensation Committee reviewed the 2021 compensation for our executives and replacementthe recommendations made by the CEO other than for himself, during its meetings held in December 2020 and February 2021 and decided on the 2021 compensation levels. The review was supported by a comprehensive analysis and market review prepared by Mercer.
The Advisors
Throughout the decision-making process for 2021 compensation, which included the Compensation Committee’s December 2020 meeting, and during the other Compensation Committee meetings which included January, February, May, July, August, November and December 2021 meetings, the Compensation Committee engaged Meridian Compensation Partners who reported directly to the Compensation Committee. During 2021, Meridian Compensation Partners attended the majority of such products under new vehicle warranties. A vehicle manufacturer may attemptthe Compensation Committee’s meetings and provided input for each meeting, including:
| • | independent perspective and advice to the Compensation Committee on various aspects of the Company’s total compensation program; |
| • | information about the market environments in which the Company operates, including guidance regarding compensation trends, compensation levels and compensation mix within the applicable markets; |
| • | information about regulatory developments in the executive and director compensation space; |
| • | recommendations regarding program design and structure; and |
| • | recommendations regarding compensation levels and mix for our executive officers and members of the Board. |
Meridian Compensation Partners did not provide any additional services to hold the Company responsibleother than those described herein.
In 2020, management engaged Mercer to assist in setting the compensation for some, or all,2021. Mercer was assigned specific tasks related to the compensation of our senior executive officers, including: (i) review of peer group and pay changes in the 2021 employment market, (ii) compilation of peer groups for our named executive officers, and (iii) compensation analysis for the Compensation Committee. In addition, Mercer provided the Company with actuarial services related to the Company’s employee benefit plans. The total fees paid to Mercer for actuarial services in 2021 was USD $130,218 and the total fees paid to Mercer for compensation analysis in 2021 was $26,856.
The Peer Groups
For 2021 compensation decisions, the Compensation Committee reviewed the most current compensation data available in selected markets. This included market data from Sweden, Germany and the U.S. prepared by Mercer using its proprietary compensation database to assess local market compensation levels for executive roles operating within the general, high-tech, automotive and manufacturing industries. Such market assessments were based on our named executive officers’ roles, characteristics and responsibilities including job function, reporting level and other organizational financial and organizational scope measures, including revenue responsibility, employees, and geographical responsibility. The market data contained information regarding the assessed level of base salary, total cash compensation, total direct compensation and total compensation. Mr. Pekar commenced his executive role on March 1, 2021 and, accordingly, was not included in the peer study described below.
Swedish Peer Group
In considering compensation for 2021 for our named executive officers based in Sweden, the Compensation Committee reviewed, among other factors, market data from a peer group consisting of companies similar in both business type and size, including large-cap Swedish companies that have global operations of substantial size in markets of North America, Europe and Asia, are headquartered in Sweden and have executives based in Sweden with Swedish employment conditions (the “Swedish peer group”). The Compensation Committee did not make any adjustments to the Swedish peer group prior to the 2021 compensation review. The Swedish peer group for 2021 consisted of the repair or replacement costsfollowing companies:
| Husqvarna AB | Saab AB | Tele2 AB |
| Getinge AB | Dometic Group AB | Mölnlycke Health Care AB |
| Lifco AB | Axis AB | Lindab International AB |
| Höganäs AB | Elekta Instrument AB | |
U.S. Peer Group
In considering compensation for 2021 for our named executive officers outside of Sweden, the product suppliedCompensation Committee reviewed, among other factors, market data from a peer group consisting of companies similar in both business type and size, including U.S. companies with R&D and manufacturing that were selected based on market capitalization and total revenue (the “U.S. peer group”). The Compensation Committee adjusted the U.S. peer group to exclude peer companies that had been acquired and were no longer stand alone companies. The U.S. peer group for 2021 consisted of the following companies:
| AeroVironment Inc. | Curtiss-Wright Corporation | Stoneridge Inc. |
| Astronics Corporation | Gentherm Incorporated | Trimble Inc. |
| Cerence Inc. | Cooper-Standard Holdings Inc. | Sensata Technologies Holdings PLC |
| Visteon Corporation | Gentex Corporation | |
| Coherent Inc. | Moog Inc. | |
The U.S. peer group for 2021 reflects the removal of Cubic Corporation, FLIR Systems and Wabco Holdings Inc. due to the acquisition of each respective company.
Findings and Decisions for 2021 Compensation
The following section of this CD&A focuses on the decisions linked to compensation paid to our named executive officers for 2021. The Compensation Committee did not performinclude Mr. Backman in the 2021 compensation-setting process due to his resignation on March 1, 2021; accordingly, Mr. Backman is not included in the discussion below.
The Compensation Committee reviews the compensation for the executives taking internal, external and personal factors into consideration and one of the factors considered is the current market position of respective named executive officers. Although the analysis provided an additional input to decision making, Veoneer is aware of the fact that the limited number of peer group companies in Sweden, where the majority of our named executive officers are located, may result in inconsistencies in year-over-year analysis.
The percentage changes in each element of compensation set forth below reflect the Compensation Committee’s decisions in December 2020 and February 2021 for each of our named executive officers other than Mr. Pekar (who was not included in the peer review due to the timing of his commencement of employment, as represented bydiscussed above).
Jan Carlson. Based on the Company or expected bymarket data and the customer. Accordingly,other factors the future costsCompensation Committee considered, the Compensation Committee approved the following changes to Mr. Carlson’s compensation for 2021:
Base Salary Adjustment for 2021 | | Target STI Adjustment for 2021 | | Approved Target Grant Value of Stock Incentive Plan for 2021 | | Retirement/ Pension Solution for 2021 |
| Increased by 10% | | No change (remained at 75% of base salary) | | Increased by 10% compared to 2020 grant | | No change (contribution level remained at 48% of base salary) |
Lars Sjöbring. Based on the market data and the other factors the Compensation Committee considered, the Compensation Committee approved the following changes to Mr. Sjöbring’s compensation for 2021:
Base Salary Adjustment for 2021 | | Target STI Adjustment for 2021 | | Approved Target Grant Value of Stock Incentive Plan for 2021 | | Retirement/ Pension Solution for 2021 |
| Increased by 3% | | No change (remained at 35% of base salary) | | Increased by 3% compared to 2020 grant | | No change (contribution level remained at 35% of base salary) |
Matthias Bieler. Based on the customers may be material. However,market data and the Company believes its established reserves are adequate. Veoneer’s warranty reserves are based uponother factors the Compensation Committee considered, the Compensation Committee approved the following changes to Mr. Bieler’s compensation for 2021:
Base Salary Adjustment for 2021 | | Target STI Adjustment for 2021 | | Approved Target Grant Value of Stock Incentive Plan for 2021 | | Retirement/ Pension Solution for 2021 |
| Increased by 4% | | No change (remained at 45% of base salary) | | Increased by 4% compared to 2020 grant | | No change (contribution level remained at 35% of base salary) |
Robert Bisciotti. Based on the market data and the other factors the Compensation Committee considered, the Compensation Committee approved the following changes to Mr. Bisciotti’s compensation for 2021:
Base Salary Adjustment for 2021 | | Target STI Adjustment for 2021 | | Approved Target Grant Value of Stock Incentive Plan for 2021 | | Retirement/ Pension Solution for 2021 |
| Increased by 4.5% | | No change (remained at 45% of base salary) | | Increased by 233% compared to 2020 grant | | No change (contribution level remained at 35% of base salary) |
Art Blanchford. Based on the market data and the other factors the Compensation Committee considered, the Compensation Committee approved the following changes to Mr. Blanchford’s compensation for 2021:
Base Salary Adjustment for 2021 | | Target STI Adjustment for 2021 | | Approved Target Grant Value of Stock Incentive Plan for 2021 | | Retirement/ Pension Solution for 2021 |
| Increased by 4% | | No change (remained at 45% of base salary) | | Increased by 4% compared to 2020 grant | | No change |
Steve Rodé. Based on the market data and the other factors the Compensation Committee considered, the Compensation Committee approved the following changes to Mr. Rodé’s compensation for 2021:
Base Salary Adjustment for 2021 | | Target STI Adjustment for 2021 | | Approved Target Grant Value of Stock Incentive Plan for 2021 | | Retirement/ Pension Solution for 2021 |
| Increased by 3% | | No change (remained at 45% of base salary) | | Increased by 3% compared to 2020 grant | | No change |
2021 Additional Benefits
The Company’s best estimatesexecutive compensation program also included certain retirement/pension benefits (see page 16 of amounts necessary to settle futurethis Report) and existing claims. The Company regularly evaluates the adequacycertain other items of these reserves, and adjusts them when appropriate. However, the final amounts actually due related to these matters could differ materially from the Company’s recorded estimates.
In addition, as vehicle manufacturers increasingly use global platforms and procedures, quality performance evaluations are also conducted on a global basis. Any one or more quality, warranty or other recall issue(s) (including those affecting few units and/or having a small financial impact) may cause a vehicle manufacturer to implement measurescompensation, such as a temporary or prolonged suspensioncompany car. The Compensation Committee believes these benefits are reasonable and appropriate for each of our named executive officers.
Additional Employment Arrangements
Mr. Carlson’s Retention Bonus Arrangements (pursuant to employment agreement entered into in 2018, as amended to date)
As disclosed in prior years, in lieu of Mr. Carlson’s right to severance upon terminating his employment with Autoliv at the time of the Spin-off, and in recognition of the critical importance of his continued service and leadership during the formation of Veoneer, Mr. Carlson’s employment agreement provides that he is eligible to receive a $6,000,000 retention bonus. Mr. Carlson would have been entitled to a severance payment of approximately $9.8 million had he elected to leave Autoliv in connection with the Spin-off, as he was entitled to do. When asked to serve as the Company’s Chief Executive Officer, Mr. Carlson waived his right to the severance payment in lieu of his new orders,employment agreement, which may haveincluded the retention bonus. Pursuant to his employment agreement, the retention bonus is to be paid in three equal installments in each of July 2019, 2020, and 2021, provided that he remains employed by Veoneer on each such date. Fifty percent (50%) of the retention bonus is to be paid annually at the time of vesting in a material impactfixed cash amount ($1,000,000 annually), of which Mr. Carlson earned one-third in each of 2019, 2020, and 2021 respectively (such amounts are reflected in the Bonus column of the Summary Compensation table for 2019, 2020 and 2021). The remaining fifty percent (50%) of the retention bonus was denominated in Veoneer restricted stock units (“Cash-Settled Retention RSUs”) on the effective date of the Spin-off and is to be paid annually in one-third installments in cash having a value equal to the relevant number of underlying shares of the Company’s results of operations.
The Company carries insurance for potential recall and product liability claims at coverage levelscommon stock on the applicable vesting date (determined based on the closing price of the Company’s prior claims experience. Veoneer cannot assurecommon stock on each applicable vesting date), which aligns the value of the retention payment with the performance of the Company and the interests of our stockholders. In 2019, we amended Mr. Carlson’s retention RSUs to provide that the level of coverage will24,969 Cash-Settled Retention RSUs that vested on July 1, 2019 would be sufficient to cover every possible claim that can arisesettled in the Company’s businesses, now or in the future, or thatform of 24,969 shares of Company common stock, instead of a cash payment having a value equal to such coverage always will be available should the Company, now or in the future, wish to extend, increase or otherwise adjust the Company’s insurance.
In its products, the Company utilizes technologies which may be subject to intellectual property rights of third parties. While the Company does seek to procure the necessary rights to utilize intellectual property rights associated with its products, it may fail to do so. Where the Company so fails, the Company may be exposed to material claims from the owners of such rights. Where the Company has sold products which infringe upon such rights, its customers may be entitled to be indemnified by the Company for the claims they suffer as a result thereof. Such claims could be material.
Product Related Liabilities
The Company is exposed to product liability and warranty claims in the event that the Company’s products fail to perform as represented and such failure results, or is alleged to result, in bodily injury, and/or property damage or other loss. The Company has reserves for product risks. Such reserves are related to product performance issues including recall, product liability and warranty issues.
Veoneer, Inc.
Notes to Consolidated Financial Statements
(U.S. DOLLARS IN MILLIONS)
The Company records liabilities for product related risks when probable claims are identified and when it is possible to reasonably estimate costs. Provisions for warranty claims are estimated based on prior experience, likely changes in performance of newer products, and volumeshares. Mr. Carlson earned one-third of the products sold. The provisions are recorded on an accrual basis.
The table below summarizes the changeCash-Settled Retention RSUs in product related liabilities in the Consolidated Balance Sheets.
|
| | | | | | | | |
| | | As of December 31 |
| | | 2018 | | 2017 |
| Reserve at beginning of the year | | $ | 22 |
| | $ | 30 |
|
| Change in reserve | | 10 |
| | 8 |
|
| Cash settlements | | (15 | ) | | (16 | ) |
| Transfers | | (1 | ) | | — |
|
| Translation difference | | — |
| | 1 |
|
| Reserve at end of the year | | $ | 16 |
| | $ | 22 |
|
each of 2019, 2020 and 2021, respectively. As of December 31, 20182021, Mr. Carlson’s retention bonus was earned in full.
Mr. Carlson’s retention bonus was an important component of the Spin-off. The Spin-off amounted to a $2.5 billion dividend to Autoliv’s stockholders. Prior to the Spin-off and 2017, provisionswhile the stockholders of Autoliv were also the (indirect) stockholders of the Company with their interests thus fully aligned, Autoliv took several steps to ensure the success of the Spin-off. Notably, it capitalized the Company with $1 billion and cash paid primarily relatenegotiated employment and related agreements with key members of the Company’s management. It was against this background that the Autoliv board, at a time when the interests of the Autoliv and the Company’s stockholders were fully aligned, negotiated an agreement with Mr. Carlson under which Mr. Carlson agreed to recallserve as the Chief Executive Officer of the Company and warranty related issues. The decreaseagreed to forfeit his Autoliv severance in lieu of the retention arrangement. These arrangements were later ratified by our Board. It is the Company’s view that the actions of Autoliv, ratified by the Board, were in the reserve balancebest interests of their respective stockholders. For Autoliv, this arrangement converted a $9.8 million severance payment into a $6 million continued service incentive (the final number will depend on the performance of our stock) for which it compensated the Company. For the Company, it secured Mr. Carlson’s services as Chief Executive Officer and facilitated its capitalization by Autoliv to cover the expected costs associated with the retention.
Mr. Pekar’s Employment Arrangement
As described above, Mr. Pekar was appointed as the CFO & Executive Vice President as of December 31, 2018 comparedMarch 1, 2021. In determining the compensation for Mr. Pekar, the Compensation Committee considered the market pay levels in the U.S. and Sweden for the U.S. and Swedish Peer Groups described above, as well as the pay level of his predecessor. Mr. Pekar’s employment agreement provides that he is entitled to an annual base salary of USD 400,000. Mr. Pekar has the opportunity to participate in Veoneer’s bonus plan for executive officers, with an initial cash bonus of forty-five percent (45%) of his base salary, and he is eligible to receive equity grants under Veoneer’s stock incentive plan. In addition, Veoneer provide Mr. Pekar with certain expatriate benefits. For additional information about these benefits, see footnote 4 to the prior year was mainly dueSummary Compensation Table. Mr. Pekar’s employment agreement also provides for a taxable, annual payment equal to recall related issues offset by5.6% of his annual base salary as applicable from time to time (the “Salary Allowance”), which is intended to supplement his retirement benefits. Mr. Pekar is eligible for tax equalization of his income between the cash payments for warrantiesU.S., Canada and product liabilities.Sweden. For information regarding Mr. Pekar’s severance benefits under his employment agreement see the “Potential Payments Upon Termination or Change in Control” section later in this Report.
Agreements entered into between Autoliv and Veoneer in
Mr. Bisciotti’s Employment Arrangement
In connection with the Spin-Off provide for Autolivre-organization of the Company in May 2021, Mr. Bisciotti received a new assignment with the Company and his title was changed from Executive Vice President Business Unit North America to indemnify Veoneer for certain liabilities relatedExecutive Vice President Product Area RCS. Under the new agreement Mr. Bisciotti’s annual base salary was adjusted by 13.4% to electronics products manufactured before April 1, 2018. AsUSD 460,000 to reflect the increased scope of December 31, 2018,his role. In determining the indemnification asset includedadjustment of Mr. Bisciotti’s annual base salary the Compensation Committee considered the market pay levels in the Other current assetsU.S. for the U.S. Peer Groups as described above.
Messrs. Backman’s and Blanchford’s Separation Arrangements
Mr. Backman separated from the Company effective May 3, 2021 and Mr. Blanchford separated from the Company effective October 15, 2021. A summary of the separation agreements with Messrs. Backman and Blanchford may be found in the Consolidated Balance Sheets amounting to $14 million represents substantially all of the product related liabilities included“Potential Payments Upon Termination or Change in the Other current assetsControl” section later in the Consolidated Balance Sheets. A substantial portion of these costs are subject to indemnification by Autoliv.this Report.
A majority of the Company’s recall related issues are covered by insurance. Insurance receivables are included within prepaid expenses and other contract assets in the Consolidated Balance Sheets.
Guarantees
Currencies for Executive Compensation
The Company provide lease guaranteesgenerally sets cash-based compensation (including for all of our named executive officers) in the local currency of the country of service with limited exceptions. Accordingly, the Company set compensation in Swedish kronor (“SEK”) for Messrs. Carlson and Backman, in U.S. dollars (“USD”) for Messrs. Sjöbring, Pekar, Bisciotti, Blanchford and Rodé, and in Euro (“EUR”) for Mr. Bieler, except for the annual target grant value of the LTI awards for which the compensation is set in USD for all of our named executive officers. All amounts have been converted to ZenuityUSD using the following exchange rates: 1 USD = 9.0437 SEK; 1 USD = 0.8843 EUR. For historic numbers, we have converted the compensation paid in prior years by the same exchange rate in order to facilitate comparison. Thus, while the historic amounts paid do not change, due to fluctuations in exchange rates, amounts reflecting historic figures in this Report may differ significantly from disclosure in previous years. We also note that the exchange rate prevailing at the time of $8 million asthe Compensation Committee’s review of compensation may vary significantly from the exchange rates prevailing at the time this Report is prepared. As a result, the year-to-year percentage changes in compensation reviewed and approved by the Compensation Committee may differ significantly from the percentage changes in compensation presented in this Report due to fluctuations in exchange rates.
Executive Compensation
The following table shows information concerning the annual compensation for services provided by our named executive officers in the fiscal years ended December 31 2018 and 2017. These represent the maximum potential amount of future (undiscounted) payments that Veoneer could be required to make under the guarantees in the event of default by the guaranteed parties. These guarantees will generally cease upon expiration of current lease agreements betweenperiods 2019, 2020 and 2022.2021.
Commitments
Operating Leases
On October 4, 2021, we announced that we had entered into a definitive merger agreement with Qualcomm and SSW. For additional details regarding the amounts payable to our named executive officers if the merger transaction is completed, please see our Current Report on Form 8-K, dated October 4, 2021, and our Definitive Proxy Statement on Schedule 14A relating to the merger filed with the SEC.
Summary Compensation Table (1) |
Name and Principal Position | Year | Base Salary $ | Bonus $ | Stock Awards (2) $ | Non- Equity Incentive Plan Compen- sation $ | Change in Pension Value and Nonqualified Deferred Compensation Earnings (1) $ | All Other Compen- sation (3) $ | TOTAL $ |
Jan Carlson, President and CEO |
| | 2021 | 1,718,707(4) | 1,000,000 (5) | 1,185,169 | 1,724,070 | - | 759,437 | 6,387,383 |
| | 2020 | 1,625,154 | 1,000,000 | 642,479 | 2,089,782 | - | 687,344 | 6,044,759 |
| | 2019 | 1,518,575 | 1,000,000 | 515,342 | 595,588 | - | 683,880 | 4,313,385 |
Ray Pekar, CFO and EVP Finance (6) |
| | 2021 | 381,544 (7) | - | 378,993 | 246,695 | - | 100,631 | 1,107,863 |
Mats Backman, Former CFO and EVP Finance |
| | 2021 | 111,698 (8) | - | 408,670 (9) | - | - | 603,618 | 1,123,986 |
| | 2020 | 670,190 | - | 344,816 | 603,171 | - | 406,880 | 2,025,058 |
| | 2019 | 534,442 | - | 938,408 | 164,501 | - | 195,456 | 1,832,807 |
Lars Sjöbring, EVP Legal Affairs, General Counsel |
| | 2021 | 770,418 | - | 583,374 | 407,278 | - | 315,143 | 2,076,213 |
| | 2020 | 747,979 | - | 247,165 | 523,585 | - | 312,165 | 1,830,894 |
| | 2019 | 726,193 | - | 191,201 | 144,876 | - | 301,760 | 1,364,030 |
Matthias Bieler, EVP Product Area Vision & DMS (10) |
| | 2021 | 588,036 | 163,084 (11) | 730,658 | 394,168 | - | 265,519 | 2,132,465 |
| | 2020 | 548,456 | 197,897 | 299,989 | 484,564 | - | 238,143 | 1,769,049 |
Robert Bisciotti, EVP Product Area Radar (12) |
| | 2021 | 446,433 | - | 322,263 | 303,499 | - | 107,556 | 1,179,751 |
Art Blanchford, Former EVP Sales and Business Development (13) |
| | 2021 | 463,944 | - | 1,836,631 (14) | - | - | 195,544 | 2,496,119 |
| | 2020 | 539,470 | - | 529,169 | 485,523 | - | 95,641 | 1,649,803 |
| | 2019 | 516,239 | - | 104,501 | 132,415 | - | 82,912 | 836,067 |
Steve Rodé, Former EVP Operations (15) |
| | 2021 | 436,518 | - | 538,264 (14) | 292,603 | - | 119,126 | 1,386,511 |
| (1) | The amounts contained in the table were paid in Swedish Kronor, Euro and USD. All amounts have been converted to U.S. dollars using the following exchange rates: 1 USD = 9.0437 SEK; 1 USD = 0.8843 EUR. Amounts are rounded to the nearest whole number and, as a result of such rounding, the amounts reflected in the “Total” column may differ slightly from the sum of amounts set forth in each individual column. |
| (2) | The numbers reflect the aggregate grant-date fair value of the RSUs and PSs granted under Veoneer’s Stock Incentive Plan in 2021, 2020 and 2019 calculated in accordance with FASB Topic 718. For the dollar value of our named executive officers’ outstanding RSUs and PSs as of December 31, 2021, see the Outstanding Equity Awards table on page 26. |
The Company leases certain offices, manufacturingPSs granted in 2019 (referred to herein as the 2019 PSA (Tranche 1), the 2019 PSA (Tranche 2) and research buildings, machinery, automobiles, data processingthe 2019 PSA (Tranche 3)), 2020 (referred to herein as the 2020 PSA (Tranche 1), the 2020 PSA (Tranche 2) and other equipment under operating lease contracts. the 2020 PSA (Tranche 3)) and 2021 (referred to herein as the 2021 PSA (Tranche 1), the 2021 PSA (Tranche 2) and the 2021 PSA (Tranche 3)) are comprised of three one-year performance periods with goals related to annual gross margin, with the number of shares ultimately earned subject to downward adjustment based on our share price measured at the end of the three-year performance period (December 31, 2021, with respect to the 2019 PSA, December 31, 2022, with respect to the 2020 PSA and December 31, 2023, with respect to the 2021 PSA).
| • | The annual gross margin goals for 2019 PSA (Tranche 2) and 2019 PSA (Tranche 3) were not established at the date of grant of the 2019 PSA (Tranche 1) and, as a result, for accounting purposes, 2019 PSA (Tranche 2) and 2019 PSA (Tranche 3) are not considered granted until the respective performance goals are established. Accordingly, the grant date fair value of the 2019 PSA (Tranche 1) is reported in the Stock Awards column for 2019, the grant date fair value of the 2019 PSA (Tranche 2) is reported in the Stock Awards column for 2020, and the grant date fair value of the 2019 PSA (Tranche 3) is reported in the Stock Awards column for 2021. |
| • | The annual gross margin goals for 2020 PSA (Tranche 2) and 2020 PSA (Tranche 3) were not established at the date of grant of the 2020 PSA (Tranche 1) and, as a result, for accounting purposes, 2020 PSA (Tranche 2) and 2020 PSA (Tranche 3) are not considered granted until the respective performance goals are established. Accordingly, the grant date fair value of the 2020 PSA (Tranche 1) is reported in the Stock Awards column for 2020 and the grant date fair value of the 2020 PSA (Tranche 2) is reported in the Stock Awards column for 2021, but the grant date fair value of the 2020 PSA (Tranche 3) will not be reported in the Stock Awards column until 2022. |
| • | The annual gross margin goals for 2021 PSA (Tranche 2) and 2021 PSA (Tranche 3) were not established at the date of grant of the 2021 PSA (Tranche 1) and, as a result, for accounting purposes, 2021 PSA (Tranche 2) and 2021 PSA (Tranche 3) are not considered granted until the respective performance goals are established. Accordingly, the grant date fair value of the 2021 PSA (Tranche 1) is reported in the Stock Awards column for 2021, but the grant date fair value of the 2021 PSA (Tranche 2) and the 2021 PSA (Tranche 3) will not be reported in the Stock Awards column until 2022 and 2023, respectively. |
| Grant Date Fair Value – Target (a) | Grant Date Fair Value – Maximum (b) |
| 2019 Performance Share Award (Tranche 1) | Mr. Carlson $257,656 | Mr. Carlson $515,312 |
| Mr. Backman $92,829 | Mr. Backman $185,658 |
| Mr. Sjöbring $95,601 | Mr. Sjöbring $191,201 |
| Mr. Blanchford $52,250 | Mr. Blanchford $104,501 |
| 2019 Performance Share Award (Tranche 2) | Mr. Carlson $127,123 | Mr. Carlson $254,246 |
| Mr. Backman $44,827 | Mr. Backman $89,654 |
| Mr. Sjöbring $47,168 | Mr. Sjöbring $94,336 |
| Mr. Blanchford $25,779 | Mr. Blanchford $51,559 |
| 2020 Performance Share Award (Tranche 1) | Mr. Carlson $257,678 | Mr. Carlson $515,356 |
| Mr. Backman $149,995 | Mr. Backman $299,989 |
| Mr. Sjöbring $99,992 | Mr. Sjöbring $199,983 |
| Mr. Bieler $149,995 | Mr. Bieler $299,989 |
| Mr. Blanchford $149,995 | Mr. Blanchford 299,989 |
| 2019 Performance Share Award (Tranche 3) | Mr. Carlson $266,723 | Mr. Carlson $533,445 |
| Mr. Pekar $13,695 | Mr. Pekar $27,389 |
| Mr. Backman $94,032 | Mr. Backman $188,063 |
| Mr. Sjöbring $98,973 | Mr. Sjöbring $197,945 |
| Mr. Bisciotti $13,695 | Mr. Bisciotti $27,389 |
| Mr. Blanchford $54,077 | Mr. Blanchford 108,153 |
| Mr. Rodé $53,863 | Mr. Rodé 107,726 |
| 2020 Performance Share Award (Tranche 2) | Mr. Carlson $540,521 | Mr. Carlson $1,081,042 |
| Mr. Pekar $31,964 | Mr. Pekar $63,928 |
| Mr. Backman $314,638 | Mr. Backman $629,276 |
| Mr. Sjöbring $209,749 | Mr. Sjöbring $419,497 |
| Mr. Bieler $314,638 | Mr. Bieler $629,276 |
| Mr. Bisciotti $41,938 | Mr. Bisciotti $83,875 |
| Mr. Blanchford $314,638 | Mr. Blanchford $629,276 |
| Mr. Rodé $209,749 | Mr. Rodé 419,497 |
| 2021 Performance Share Award (Tranche 1) | Mr. Carlson $377,926 | Mr. Carlson $755,851 |
| Mr. Pekar $83,326 | Mr. Pekar $166,652 |
| Mr. Sjöbring $68,656 | Mr. Sjöbring $137,311 |
| Mr. Bieler $104,005 | Mr. Bieler $208,010 |
| Mr. Bisciotti $66,643 | Mr. Bisciotti $133,285 |
| Mr. Blanchford $104,005 | Mr. Blanchford $208,010 |
| Mr. Rodé $68,656 | Mr. Rodé 137,311 |
| a. | Reflects the grant date fair value of the PSs as reflected in the Stock Awards column, which was computed by multiplying (i) the target number of PSs awarded to each named executive officer, which was the assumed probable outcome as of the grant date, by (ii) the grant date fair value per share used for financial reporting purposes, based on the actual share price on the date of grant. See also Note 18 of the Notes to the Company’s Form 10-K for the fiscal year ended December 31, 2021, filed with the SEC on February 19, 2021. |
| b. | Reflects the grant date fair value of the PSs assuming the highest level of performance conditions was satisfied. |
| (3) | The following table reflects the items that are included in the All Other Compensation column for 2021. |
| | Perquisites | Company Contributions to Defined Contribution Plans | Tax Payment | Vacation Supplement | Compensation During Notice Period | TOTAL |
| Name | $ (a) | $ (b) | $ (c) | $ (d) | $ (e) | $ |
| Jan Carlson | 15,939 | 735,603 | - | 7,895 | - | 759,437 |
| Ray Pekar | 81,878 | - | 18,753 | - | - | 100,631 |
| Mats Backman | 568 | 39,094 | - | - | 563,956 | 603,618 |
| Lars Sjöbring | 45,497 | 269,646 | - | - | - | 315,143 |
| Matthias Bieler | 50,706 | 205,813 | - | - | - | 256,519 |
| Robert Bisciotti (f) | 100,355 | 7,200 | - | - | - | 107,556 |
| Art Blanchford | 41,342 | 42,009 | - | - | 112,193 | 195,544 |
| Steve Rodé | 119,126 | - | - | - | - | 119,126 |
| a. | For Mr. Carlson, reflects the value of a company car (which per the terms of the lease agreement was provided at no cost to the Company in 2021), company-paid healthcare benefits, and a home alarm system. For Mr. Pekar, reflects the value of a company car, company-paid health care benefits, the Salary Allowance, and accommodation cost in Sweden ($44,124). For Mr. Backman, reflects the value of a company car and company-paid health care benefits. For Mr. Sjöbring, reflects the value of a company car ($27,816) and company-paid healthcare benefits. For Mr. Bieler, reflects the value of a company car and accommodation cost in Germany ($40,710). For Mr. Bisciotti, reflects the value of a company car ($26,823) company-paid health care benefits, and a special retirement allowance ($55,750) for the loss of continuing participation in Autoliv’s defined benefit plan until its freeze at the time of spin-off from Autoliv. For Mr. Blanchford, reflects the value of a company car ($25,142), and company-paid health care benefits. For Mr. Rodé, reflects the value of a company car ($31,694), company-paid health care benefits, and a special retirement allowance ($81,250) for the loss of continuing participation in Autoliv’s defined benefit plan until its freeze at the time of spin-off from Autoliv. For all perquisites, the value reported reflects the aggregate incremental cost to the Company of providing the benefit. The Company determined the cost of the company car based on the value of the lease payment or car allowance paid, as applicable. |
| b. | Reflects for Messrs. Carlson, Backman, and Bieler contributions to the named executive officer’s defined contribution plans. Reflects for Mr. Sjöbring, $11,695 in matching contributions to the U.S. 401(k) plan, $41,143 in matching contributions to the Veoneer US Non-Qualified Retirement Plan and $214,808 as contribution to the Supplemental Plan. Reflects for Mr. Bisciotti, $7,200 in matching contributions to the U.S. 401(k) plan. Reflects for Mr. Blanchford, $14,759 in matching contributions to the U.S. 401(k) plan and $27,250 in matching contributions to the Veoneer US Non-Qualified Retirement Plan. |
| c. | Reflects for Mr. Pekar a tax gross-up payment on the benefits related to his assignment in Sweden for 2021 Per the terms of Mr. Pekar’s employment agreement, he is entitled to tax equalization benefits. As of the date of this Report, the tax equalization benefit related to compensation earned in 2021 is not yet known and has not yet been paid. Consequently, the Company will include such amount for Mr. Pekar in a future year provided that he is a named executive officer. |
| d. | Reflects for Mr. Carlson the vacation supplement required by Swedish labor law. |
| e. | Reflects for Mr. Backman the non-compete payment ($402,114) in 2021 pursuant Mr. Backman’s employment agreement and unused vacation days ($161,841) paid out after termination of his employment. Reflects for Mr. Blanchford the non-compete payment ($86,315) in 2021 pursuant to Mr. Blanchford’s employment agreement, unused vacation days ($22,657) paid out after the termination of his employment, and company-paid COBRA. |
| f. | Amounts are rounded to the nearest whole number and, as a result of such rounding, the amount reflected in the “Total” column differs slightly from the sum of amounts set forth in each individual column. |
| (4) | Includes payment of $186,200 to Mr. Carlson for unused vacation days. |
| (5) | Reflects the retention bonus earned and paid to Mr. Carlson in 2021. |
| (6) | Mr. Pekar commenced his employment in March 2021 and was not a named executive officer in 2020 and 2019. |
| (7) | Reflects what Mr. Pekar actually received in 2021 as salary. |
| (8) | Reflects the base salary earned by Mr. Backman in his position as CFO from January 1, 2021 – February 28, 2021. Base salary and comp |
| (9) | Mr. Backman resigned as CFO on March 1, 2021 and was not eligible to participate in the Long-Term Incentive Program introduced in 2021. The value reflects the grant date fair value of the 2019 PSA (Tranche 1) and 2020 PSA (Tranche 2) that, from accounting purposes, were considered granted in 2021 when the respective performance goals were established. |
| (10) | Mr. Bieler commenced his employment in February 2020 and was not a named executive officer in 2019. |
| (11) | Reflects the retention bonus paid to Mr. Bieler in November 2021 ($113,084) pursuant to his employment agreement and an award for extraordinary achievement paid in July 2021 ($50,000). |
| (12) | Mr. Bisciotti was not a named executive officer in 2020 and 2019. |
| (13) | Mr. Blanchford entered into a mutual separation agreement and resigned effective October 15, 2021. |
| (14) | Includes the incremental fair value ($1,051,897) of Mr. Blanchford’s RSUs and PSAs resulting from the modification of such award to accelerate the vesting to the time of termination of Mr. Blanchford’s employment in lieu of compensation and benefits provided during the 6-month notice period and lump sum severance payment Mr. Blanchford would otherwise be entitled to under his employment agreement. For additional information regarding Mr. Blanchford’s termination arrangement, see the summary of the separation agreement with Mr. Blanchford that may be found in the “Potential Payments Upon Termination or Change in Control” section later in this Report. |
| (15) | Mr. Rodé was not a named executive officer in 2020 and 2019. |
2021 Grants of Plan-Based Awards Table
The operating leases, somefollowing table summarizes grants of which are non-cancellable and include renewals, expire at various dates through 2034. The Company pays most maintenance, insurance and tax expenses relatingplan-based awards to leased assets. Rental expense for operating leases fornamed executive officers made in the year ended December 31, 2018, 2017 and 2016 was $13 million, $7 million and $6 million, respectively.2021.
As
| Name, Grant Date | Estimated Possible Payouts Under Non-Equity Incentive Plan Awards | Estimated Possible Payouts Under Equity Incentive Plan Awards (1) | All Other Stock Awards: Number of Shares of Stock or Units (#) | Grant Date Fair Value of Stock and Option Awards ($) (3) |
Threshold ($) | Target ($) | Maximum ($) | Threshold (#) | Target (#$) | Maximum (#) |
| Jan Carlson | | | | | | | |
| 2/16/2021 | - | - | - | - | - | - | - | - |
| 2/16/2021 | - | - | - | 0 | 12,391 | 24,782 | - | 377,926 |
| 2/16/2021 | - | - | - | 0 | 17,722 | 35,444 | - | 540,521 |
| 2/16/2021 | - | - | - | 0 | 8,745 | 17,490 | - | 266,723 |
| | 0 | 1,149,380 | 2,089,782 | - | - | - | — | - |
| Ray Pekar | | | | | | | |
| 2/16/2021 | - | - | - | - | - | - | 8,197 | 250,009 |
| 2/16/2021 | - | - | - | 0 | 2,732 | 5,464 | - | 83,326 |
| 2/16/2021 | - | - | - | 0 | 1,048 | 2,096 | - | 31,964 |
| 2/16/2021 | - | - | - | 0 | 449 | 898 | - | 13,695 |
| | 0 | 164,436 | 328,927 | - | - | - | - | - |
| Mats Backman | | | | | | | |
| 2/16/2021 | - | - | - | 0 | 10,316 | 20,632 | - | 314,638 |
| 2/16/2021 | - | - | - | 0 | 3,083 | 6,166 | - | 94,032 |
| Lars Sjöbring | | | | | | | |
| 2/16/2021 | - | - | - | - | - | - | 6,754 | 205,997 |
| 2/16/2021 | - | - | - | 0 | 2,251 | 4,502 | - | 68,656 |
| 2/16/2021 | - | - | - | 0 | 6,877 | 13,754 | - | 209,749 |
| 2/16/2021 | - | - | - | 0 | 3,245 | 6,490 | - | 98,973 |
| | 0 | 269,646 | 539,293 | - | - | - | - | - |
| Matthias Bieler | | | | | | | |
| 2/16/2021 | - | - | - | - | - | - | 10,230 | 312,015 |
| 2/16/2021 | - | - | - | 0 | 3,410 | 6,820 | - | 104,005 |
| 2/16/2021 | - | - | - | 0 | 10,316 | 20,632 | - | 314,638 |
| | 0 | 264,616 | 529,232 | - | - | - | - | - |
| Robert Bisciotti | | | | | | | |
| 2/16/2021 | - | - | - | - | - | - | 6,557 | 199,989 |
| 2/16/2021 | - | - | - | 0 | 2,185 | 4,370 | - | 66,643 |
| 2/16/2021 | - | - | - | 0 | 1,375 | 2,750 | - | 41,938 |
| 2/16/2021 | - | - | - | 0 | 449 | 898 | - | 13,695 |
| 2/16/2021 | 0 | 200,895 | 401,790 | - | - | - | - | - |
| Art Blanchford (2) | | | | | | | |
| 15/10/2021 | - | - | - | - | - | - | - | 1,051,897 |
| 2/16/2021 | - | - | - | - | - | - | 10,230 | 312,015 |
| 2/16/2021 | - | - | - | 0 | 3,410 | 6,820 | - | 104,005 |
| 2/16/2021 | - | - | - | 0 | 10,316 | 20,632 | - | 314,638 |
| 2/16/2021 | - | - | - | 0 | 1,773 | 3,546 | - | 54,077 |
| 2/16/2021 | 0 | 208,775 | 417,550 | - | - | - | - | - |
| Steve Rodé | | | | | | | |
| 2/16/2021 | - | - | - | - | - | - | 6,754 | 205,997 |
| 2/16/2021 | - | - | - | 0 | 2,251 | 4,502 | - | 68,656 |
| 2/16/2021 | - | - | - | 0 | 6,877 | 13,754 | - | 20,749 |
| 2/16/2021 | - | - | - | 0 | 1,766 | 3,532 | - | 53,863 |
| 2/16/2021 | 0 | 196,433 | 392,866 | - | - | - | - | - |
| (1) | Reflects for Messrs. Carlson, Pekar, Sjöbring, Bisciotti, Blanchford and Rodé, the 2021 PSA (Tranche 1), the 2020 PSA (Tranche 2) and the 2019 PSA (Tranche 3). Reflects for Mr. Backman, the 2020 PSA (Tranche 2) and the 2019 PSA (Tranche 3). Reflects for Mr. Bieler, the 2021 PSA (Tranche 1) and the 2020 PSA (Tranche 2). See footnote to the Summary Compensation table for a description of the performance share program. |
| (2) | Reflects the incremental fair value of Mr. Blanchford’s RSUs and PSAs resulting from the modification of such award to accelerate the vesting to the time of termination of Mr. Blanchford’s employment. |
| (3) | Reflects the aggregate grant date fair value of the RSUs, the 2021 PSA (Tranche 1), the 2020 PSA (Tranche 2) and the 2019 PSA (Tranche 3) calculated in accordance with FASB Topic 718 and based on the actual share price on the date of grant. See also Note 19 of the Notes to the Company’s Form 10-K for the fiscal year ended December 31, 2021, filed with the SEC on February 22, 2022. Each of the executive officers received their RSUs, 2021 PSA (Tranche 1), 2020 PSA (Tranche 2) and 2019 PSA (Tranche 3) in February 2021. The RSUs will vest on the third anniversary of the grant subject to executive’s continued employment on such date. See footnote 2 in the Summary Compensation table for a description of the performance share program. |
Outstanding Equity Awards at 2021 Fiscal Year-End
The following table summarizes the total number of securities underlying outstanding plan awards for the named executive officers on December 31, 2018, future minimum lease payments2021.
On October 4, 2021, we announced that we had entered into a definitive merger agreement with Qualcomm and SSW. For additional details regarding the treatment of outstanding equity awards for non-cancellable operating leases totaled $88 millionour named executive officers if the merger transaction is completed, please see our Current Report on Form 8-K, dated October 4, 2021, and our Definitive Proxy Statement on Schedule 14A relating to the merger filed with the SEC.
| | Option Awards (1) | Stock Awards (1) |
Name (Grant Year, Award Type) | Number of Securities Underlying Unexercised Options (#) Exercisable | Number of Securities Underlying Unexercised Options(#) Unexercisable | Option Exercise Price ($) | Option Expiration Date ($) | Number of Shares or Units of Stock That Have Not Vested (#) | Market Value of Shares or Units of Stock That Have Not Vested (7) ($) | Equity Incentive Plan Awards: Number of unearned Shares, Units or Other Rights That Have Not Vested (#) (7) (8) | Equity Incentive Plan Awards: Market or Payout Value of Unearned Shares, Units or Other Rights That Have Not Vested (8) ($) |
| Jan Carlson | | | | | | | | |
| 2021 Veoneer | — | — | — | — | - | - | 13,382 | 474,793 |
| — | — | — | — | 17,722 | 628,777 | 24,456 | 867,699 |
| 2019 Veoneer | — | — | — | — | 8,744 | 310,237 | 12,067 | 428,137 |
| 2015 Veoneer | 21,071 | | 34.25 | 2/16/2025 | — | — | — | — |
| 2014 Veoneer | 22,888 | | 28.67 | 2/19/2024 | — | — | — | — |
| Ray Pekar | | | | | | | |
| 2021 Veoneer | — | — | — | — | 8,197 | 290,830 | 2,950 | 104,666 |
| 2020 Veoneer | — | — | — | — | 3,146 | 111,620 | 1,466 | 51,304 |
| 2019 Veoneer | — | — | — | — | 1,345 | 47,721 | 619 | 21,962 |
| 2015 Veoneer | 3,195 | | 34.25 | 2/16/2025 | - | - | - | - |
| 2015 Autoliv | 117 | | 80.40 | 2/16/2025 | - | - | - | - |
| 2014 Veoneer | 1,883 | | 28.67 | 2/19/2024 | - | - | - | - |
| 2013 Veoneer | 2,651 | | 20.91 | 2/19/2023 | - | - | - | - |
| 2012 Veoneer | 1,853 | | 20.25 | 2/22/2022 | - | - | - | - |
| Lars Sjöbring | | | | | | | | |
| 2021 Veoneer | — | — | — | — | 6,754 | 239,632 | 2,431 | 86,252 |
| 2020 Veoneer | — | — | — | — | 6,878 | 244,031 | 9,490 | 336,705 |
| 2019 Veoneer | — | — | — | — | 3,244 | 115,097 | 4,477 | 158,844 |
| Matthias Bieler | | | | | | | |
| 2021 Veoneer | — | — | — | — | 10,230 | 362,960 | 3,682 | 130,637 |
| 2020 Veoneer | — | — | — | — | 10,316 | 366,012 | 14,236 | 505,093 |
| Robert Bisciotti | | | | | | | |
| 2021 Veoneer | - | - | - | - | 6,557 | 232,642 | 2,359 | 83,697 |
| 2020 Veoneer | - | - | - | - | 4,127 | 146,426 | 1,897 | 67,306 |
| 2019 Veoneer | - | - | - | - | 1,345 | 47,721 | 619 | 21,962 |
| Steve Rodé | | | | | | | |
| 2021 Veoneer | - | - | - | - | 6,754 | 239,632 | 2,431 | 86,252 |
| 2020 Veoneer | - | - | - | - | 6,878 | 244,031 | 9,490 | 336,705 |
| 2019 Veoneer | - | - | - | - | 1,765 | 62,622 | 2,436 | 86,429 |
| 2015 Veoneer | 4,279 | - | 34.25 | 2/16/2025 | - | - | - | - |
| (1) | All outstanding stock awards granted under Autoliv’s equity compensation programs until 2018 were converted to adjusted awards relating to both shares of Autoliv and Veoneer common stock. The outstanding awards in the table above reflect the adjusted number of awards following the conversion for these awards. Except as otherwise noted, the above plan awards were originally granted on February 19, 2014, February 16, 2015, February 13, 2018, February 19, 2019 and February 18, 2020. All options granted are for 10-year terms with an exercise price equal to the fair market value (as defined in the Autoliv 1997 Incentive Plan) per share on the date of grant, as adjusted in the Spin-off, and become exercisable after one year of continued employment following the grant date. Except as otherwise noted, all RSUs generally cliff vest after three years. Amounts reflected in this table include RSUs acquired through dividend equivalent rights. |
| (7) | Based on the closing prices on the NYSE for Autoliv and Veoneer per share of common stock on December 31, 2021, the last trading day of the year, which were ALV $103.41 and VNE $35.48. |
| (8) | On February 16, 2022, the Compensation Committee determined that 1.08 times the target awards of the 2021 PSA (Tranche 1), 2020 PSA (Tranche 2) and 2019 PSA (Tranche 3) awards were earned based on the actual level of achievement of the 2021 PSA (Tranche 1), 2020 PSA (Tranche 2) and PSA 2019 (Tranche 3) annual gross margin goal. This column includes the outstanding PSs for the 2021 PSA (Tranche 1), 2020 PSA (Tranche 2) and PSA 2019 (Tranche 3), which remain subject to downward adjustment based on our share price at the conclusion of the respective three-year performance period. |
Option Exercises and Stock Vested During 2021
The following table summarizes for each of our named executive officers the option awards that were exercised and RSUs that vested during the year ended December 31, 2021.
| | | Option Awards | | Stock Awards |
| Name | | Number of Shares Acquired on Exercise (#) | Value Realized on Exercise ($) | | Number of Shares Acquired on Vesting (#) | Value Realized on Vesting ($) (1) |
| Jan Carlson | Veoneer | - | - | | 37,082 (2) | 933,914 (2) |
| Jan Carlson | Autoliv | 18,726 | 563,570 | | 5,465 | 515,186 |
| Ray Pekar | Veoneer | 1,757 | 11,743 | | 930 | 27,649 |
| Ray Pekar | Autoliv | - | - | | 419 | 39,499 |
| Mats Backman | Veoneer | - | - | | 25,000 | 705,750 |
| Lars Sjöbring | Veoneer | - | - | | 4,363 | 129,712 |
| Lars Sjöbring | Autoliv | - | - | | 1,968 | 185,523 |
| Matthias Bieler | Veoneer | - | - | | - | - |
| Robert Bisciotti | Veoneer | - | - | | 6,930 | 165,529 |
| Robert Bisciotti | Autoliv | - | - | | 419 | 39,499 |
| Art Blanchford | Veoneer | - | - | | 89,510 (3) | 2,776,722 (3) |
| Art Blanchford | Autoliv | - | - | | 419 | 39,499 |
| Steve Rodé | Veoneer | - | - | | 31,513 | 734,381 |
| Steve Rodé | Autoliv | 579 | 13,257 | | 682 | 64,292 |
| (1) | The value realized on vesting of RSUs shown in the table above was calculated as the product of the closing price of a share of Veoneer’s or Autoliv’s common stock on the vesting date multiplied by the number of RSUs vested. |
| (2) | Includes $573,765 reflecting the 24,968 Cash-Settled Retention RSUs that were settled in a cash payment having a value equal to such shares. |
| (3) | Includes $1,274,937 and $784,736 reflecting the 36,261 PSAs and 22,319 RSUs, respectively, that accelerated and vested at the time of Mr. Blanchford’s termination in lieu of continuing salary and benefits during the 6-month notice period and lump sum severance payment that he would otherwise have received under the terms of his employment agreement. |
Pension Benefits
None of our executive officers participates in a defined benefit plan sponsored by the Company. Mr. Carlson participates in a defined benefit plan sponsored by Autoliv, which such defined benefit plan remained with Autoliv following the Spin-off. Accordingly, no information is included with respect to such plan for 2020 and 2021 as it is no longer an obligation of the Company or related to Mr. Carlson’s services to the Company.
Nonqualified Deferred Compensation
The following table sets forth certain information with respect to the Veoneer US Non-Qualified Retirement Plan (the “Non-Qualified Retirement Plan”). Messrs. Sjöbring and Blanchford are payablethe only named executive officers that participate in the Non-Qualified Retirement Plan.
| Name | | Executive Contributions in Last Fiscal Year ($) (1) | | Registrant Contributions in Last Fiscal Year ($) (2) | | Aggregate Earnings in Last Fiscal Year ($) (3) | | Aggregate Withdrawals/ Distributions ($) | | Aggregate Balance at Last Fiscal Year-End ($) (4) |
| Lars Sjöbring | | 53,929 | | 257,952 | | 309,089 | | - | | 2,390,318 |
| Art Blanchford | | 34,062 | | 27,250 | | 33,815 | | - | | 302,045 |
| (1) | Messrs. Sjöbring’s and Blanchford’s contributions to the Non-Qualified Retirement Plan are included in the amount reported as “Salary” in the Summary Compensation table for fiscal year 2021. |
| (2) | The Company’s matching contributions to the Non-Qualified Retirement Plan are included in the “All Other Compensation” in the Summary Compensation table for Messrs. Sjöbring and Blanchford for fiscal year 2021. |
| (3) | Aggregate earnings are not includable in the Summary Compensation Table because such earnings are not above-market or preferential interest rates. |
| (4) | Includes amounts previously reported in the Summary Compensation Table in the previous years when earned if that executive officer’s compensation was required to be disclosed in a previous year. Amounts previously reported in such years include previously earned, but deferred, salary and Company matching contributions. |
Pursuant to the Non-Qualified Retirement Plan, participants may elect to defer a stated percentage of their base salary for each plan year, as follows: 2019: $17 million; 2020: $14 million; 2021: $10 million; 2022: $7 million; 2023: $5 million; 2024determined by the administrative committee of the plan; provided, however, the amount deferred may not exceed 25% of a participant’s base salary. Earnings (and losses) are credited to participants’ accounts based on participant choices between various investment options and thereafter: $34 million.the rate of return determined by the administrative committee of the plan.
Build-To-Suit Lease
Participants are eligible to receive matching contributions equal to 80% of their deferred amounts, deferred amounts in excess of 7% of the participant’s compensation are not eligible for matching contributions. Contributions for Mr. Sjöbring will be increased so that the total value of retirement-related contributions made by the Company (including contributions to the 401(k) plan) will be equivalent to 35% of his base salary. Participants are always 100% vested in their deferred amounts and earnings thereon; provided, however, matching contributions and earnings thereon in a participant’s account are subject to forfeiture if the participant is determined by the Board to have stolen Company assets, violated the Company’s Standards of Business Conduct and Ethics or disclosed confidential business or technical information of the Company to unauthorized third parties.
Participants may elect to receive distributions from their accounts on the first day of the seventh month following the occurrence of any one of the following distribution events as designated by the participant: (i) separation from service, (ii) death, (iii) attainment of normal retirement age (65), or (iv) attainment of early retirement age (age 55 and at least five years of service with the Company). Amounts will be distributed in one of the following forms, as selected by the participant: (i) a single lump sum, (ii) 60 approximately equal monthly installments or (iii) 120 approximately equal monthly installments.
Potential Payments Upon Termination or Change in Control
The Company has entered into “build-to-suit” lease arrangements,agreements and maintains plans that may require the Company to make payments and/or provide benefits to our named executive officers in additionthe event of termination of employment or a change in control. The paragraphs below summarize the material terms of such agreements with our named executive officers other than Mr. Backman, our former CFO and EVP Finance and Art Blanchford, our former EVP Sales & Business Development, who separated from the Company effective May 3, 2021 and October 15, 2021, respectively. The separation agreements with each of Messrs. Backman and Blanchford are disclosed below.
On October 4, 2021, we announced that we had entered into a definitive merger agreement with Qualcomm and SSW. For additional details regarding the amounts payable to our named executive officers if the merger transaction is completed, please see our Current Report on Form 8-K, dated October 4, 2021, and our Definitive Proxy Statement on Schedule 14A relating to the operating leases above,merger filed with the SEC.
Employment Agreements. The Company has an employment agreement with each of its named executive officers. The employment agreements obligate the Company to provide 6 months’ notice of termination of employment for all other of the named executive officers other than Mr. Carlson who is entitled to 18 months’ notice of termination (unless either Messrs. Carlson, Pekar, Sjöbring, Bieler, Bisciotti, or Rodé, is terminated for “Cause,” in which case termination would be effective immediately), as well as certain manufacturingseverance payments. Each of the named executive officers must provide the Company with 6 months’ notice of resignation, with the exception of Mr. Carlson, who must provide the Company with 12 months’ notice of resignation. The employment agreements automatically terminate upon retirement. Mr. Carlson has the right to retire on the last day of the month preceding his 60th birthday, and research buildings.if not otherwise agreed upon, the obligation to retire on the last day of the month preceding his 65th birthday. Messrs. Pekar, Sjöbring, Bieler, Bisciotti, and Rodé are all obligated to retire on the last day of the month before their 65th birthdays.
Except as provided below, following the executive’s termination of employment, each of the named executive officers is prohibited from competing with the Company for a period of 12 months. Such noncompetition covenant does not apply in the event that (i) the Company terminates Mr. Carlson’s employment for any reason other than for Cause or by reason of the executive’s breach of the agreement or the Company terminates Messrs. Pekar’s, Sjöbring’s, Bieler’s, Bisciotti’s, or Rodé’s employment for any reason other than for Cause, or (ii) Mr. Carlson terminates employment due to the Company’s breach of the agreement or Messrs. Pekar, Sjöbring, Bieler, Bisciotti, or Rodé resigns for “Good Reason.” In consideration for such noncompetition covenant, the Company is obligated to make up to 12 monthly payments equal to the difference between the executive’s monthly gross salary as of the date of his employment termination and any lower salary earned by the executive in any new employment, if any. The aggregate monthly payments are limited to a maximum of 60% of the gross salary earned as of the date of his employment termination, and the Company will cease making payments once such aggregate amount has been reached. The Company is deemednot obligated to make such payments if the ownerexecutive’s employment terminates due to his retirement.
In addition to receiving full base salary and benefits during the requisite notice period, if Mr. Carlson is terminated involuntarily by the Company other than for Cause or breach of the buildingsagreement or if the Company terminates Messrs. Pekar’s, Sjöbring’s, Bieler’s, Bisciotti’s, or Rodé’s employment involuntarily other than for accounting purposes duringCause or if Messrs. Pekar, Sjöbring, Bieler, Bisciotti, or Rodé, resigns for Good Reason, then the construction periodexecutive would be entitled to a lump sum severance payment equal to, in the case of Messrs. Pekar, Sjöbring, Bieler, Bisciotti, or Rodé one and one-half times his then-current base salary, or, in the case of Mr. Carlson, the sum of (i) the executive’s then-current annual salary, (ii) the average of the annual bonuses received by the executive for the two most recent fiscal years, or, if higher, the annual bonus for the fiscal year immediately prior to the year of termination, (iii) the annual taxable value of the benefit of a company car, and (iv) the value of any defined contribution plan benefits to which the executive would have been entitled to if he remained in service for one year following termination. If Mr. Carlson is given notice of termination by Veoneer for reasons other than “cause” or “disability,” or Mr. Carlson gives notice of termination for reasons that constitute “good reason” (as such terms are defined in the employment agreement) all retention payments made to date will be deducted from any payments to Mr. Carlson due under the employment agreement following the date of notice.
Severance Agreements. Each of Messrs. Carlson and Sjöbring has a change-in-control severance agreement (“CiC Severance Agreement”) with the Company. Pursuant to the terms of each of the arrangements.CiC Severance Agreements, in the event that during the two-year period following a change of control, (i) the executive terminates his employment for Good Reason, (ii) the Company terminates the executive’s employment for any reason other than death or for Cause, or (iii) the executive’s employment is terminated due to disability, the executive would be entitled to receive an immediate lump sum payment (the “CiC Severance Payment”) in an amount equal to, in the case of Mr. Carlson 2.5 times the sum of (a) such executive’s then-current annual salary (or if higher, the salary in effect immediately prior to the first event or circumstances which constitutes Good Reason), (b) the average of the annual bonuses received by the executive for the two most recent fiscal years, or the annual bonus for the fiscal year immediately prior to the fiscal year during which occurs the first event or circumstance constituting Good Reason, whichever is highest, (c) the taxable value of the benefit of a company car, and (d) the value of any defined contribution plan benefits to which the executive would have been entitled to if he remained in service for one year following termination and in the case of Mr. Sjöbring; 1.5 times the sum of (a) his then-current annual salary (or if higher, the salary in effect immediately prior to the first event or circumstances which constitutes Good Reason); (b) (i) the average of the annual cash bonuses earned in the two fiscal years prior to the date of termination, (ii) if two fiscal years have not elapsed prior to the date of termination, the annual cash bonus earned in the fiscal year prior to termination, (iii) if a full fiscal year has not elapsed prior to the date of termination, his target annual cash bonus, or (iv) provided that it results in a higher bonus than the amount payable under (i) through (iii), the bonus payable for the fiscal year immediately prior to the first occurrence of an event or circumstance constituting Good Reason; (c) the taxable value of the benefit of a company car; and (d) the value of any defined contribution plan benefits to which he would have been entitled to if he remained in service for one year following the termination. The CiC Severance Payment is in lieu of the salary and benefits payable during the requisite notice period and the severance benefits that would otherwise be payable under the executive’s employment agreement.
As
For purposes of the discussion above, the following terms have the following meanings:
“Cause” generally means (i) the willful and continued failure by the executive to substantially perform his duties, or (ii) the willful engaging by the executive in conduct which is demonstrably and materially injurious to the Company or its subsidiaries, monetarily or otherwise.
“Change in Control” generally means (i) the acquisition of 20% or more of the Company’s voting securities; or (ii) the members of the Board cease to constitute a majority of the Board; or (iii) consummation of merger or consolidation unless (1) the current stockholders continue to own at least 60% of the surviving entity’s voting securities, or (2) such transaction was effected to implement a recapitalization of the Company in which no person acquires 20% or more of the Company’s voting securities; or (iv) stockholder approval of a liquidation or dissolution or consummation of an agreement for the sale or disposition of all or substantially all of the Company’s assets (unless the current stockholders continue to own at least 60% of the Company’s voting securities after such transaction).
“Good Reason” generally means the occurrence of any one of the following events without the executive’s express written consent: (i) the assignment to the executive of any duties inconsistent with his status as an executive officer or a substantial adverse alteration in the nature or status of his responsibilities; (ii) any reduction in the executive’s annual base salary; (iii) relocation of the executive’s principal place of employment to a location more than 30 miles, or 45 kilometers, as applicable, from his then-current principal place of employment; (iv) the Company’s failure to pay any portion of the executive’s compensation; (v) the discontinuance of any compensation plan in which the executive participated which is material to his total compensation; (vi) in the case of Mr. Carlson, any direct or indirect reduction of any material fringe benefit in place at the time of the change in control, or the Company’s failure to provide the number of paid vacation days to which executive is entitled; (vii) any purported termination of the executive’s employment which is not effected pursuant to the notice requirements under the Severance Agreement; or (viii) the failure by any successor to the Company to expressly assume the employment agreement.
Equity Awards. Pursuant to Autoliv’s 1997 Stock Incentive Plan, Veoneer’s 2018 Stock Incentive Plan and the agreements evidencing the conversion of the outstanding Stock Awards upon the Spin-off, upon the occurrence of a change in control of Veoneer, any outstanding options and RSUs held by the executive would fully vest. Pursuant to the agreements evidencing awards originally granted under the Autoliv 1997 Stock Incentive Plan, upon the executive’s death or retirement, any outstanding RSUs held by the executive would become fully vested. For awards granted in 2019 and onwards, a change in control acceleration occurs if the surviving entity does not assume or otherwise equitably convert or substitute the unvested equity in connection with the change in control. If the surviving company does assume or otherwise equitably convert or substitute the unvested equity, then the awards will accelerate and vest only if the executive’s employment is terminated without cause or if he resigns for good reason within two years following the change in control. Upon an executive’s involuntary termination of employment, absent a change in control, any outstanding options, RSUs that would vest during the applicable notice period, if any, would become fully vested.
Estimated Payments to Named Executive Officers upon Termination of Employment under Various Circumstances or a Change in Control. The following tables set forth the estimated value of the payments and benefits described above to each of Messrs. Carlson, Pekar, Sjöbring, Bieler, Bisciotti and Rodé upon termination of employment under various circumstances or a change in control. The amounts shown assume that the triggering events occurred on December 31, 2018, future minimum lease2021. For the purpose of the calculations, the 2020 defined contribution payments for non-cancellable build-to-suit lease obligations totaled $51 million and are payable as follows: 2019: $3 million; 2020: $3 million; 2021: $3 million; 2022: $3 million; 2023: $3 million; 2024 and thereafter: $36 million.each named executive officer have been used. The amounts contained in the table would be paid in Swedish Kronor, Euro or USD. All amounts have been converted to USD using the following exchange rates: 1 USD = 9,0437 SEK; 1 USD = 0.8843 EUR.
Jan Carlson
Capital Leases
| Estimated Potential Payment or Benefit | | Resignation without Good Reason ($) | | Termination without Cause ($) | | Termination for Cause ($) | | Change in Control ($) | | Change in Control and Qualifying Termination ($) (9) | | Death or Retirement ($) |
| Lump sum cash severance payment | | — | | 4,386,340 (7) | | — | | — | | 10,965,849(7) | | - |
| Continuing salary/annual incentive payments during requisite notice period | | 1,532,507 | | 3,448,141 | | — | | — | | — | | — |
| Salary differential payments in consideration for noncompetition with the Company (1) | | 919,504 | | — | | 919,504 | | — | | — | | — |
| Continuing health, welfare and retirement benefits (2) | | 738,640 | | 1,107,960 | | — | | — | | — | | — |
| Accelerated vesting of equity (3) | | 738,374 (4) | | 2,863,626(5) | | — | | (6) | | 4,217,685 | | 4,217,685(8) |
| Company car (10) | | 9,716 | | 14,574 | | — | | — | | — | | - |
| Total | | 3,938,741 | | 11,820,641 | | 919,504 | | — | | 15,183,534 | | 4,217,685 |
Ray Pekar
| Estimated Potential Payment or Benefit | | Resignation without Good Reason ($) | | Termination without Cause or Resignation for Good Reason ($) | | Termination for Cause ($) | | Change in Control ($) | | Change in Control and Qualifying Termination ($) (9)
| | Death or Retirement ($) |
| Lump sum cash severance payment | | — | | 600,000 | | — | | — | | 600,000 | | — |
| Continuing salary/annual incentive payments during requisite notice period | | 200,000 | | 200,000 | | — | | — | | 200,000 | | — |
| Salary differential payments in consideration for noncompetition with the Company (1) | | 240,000 | | — | | 240,000 | | — | | — | | — |
| Continuing health, welfare and retirement benefits (2) | | 25,858 | | 25,858 | | — | | — | | — | | — |
| Accelerated vesting of equity (3) | | 69,683 | | 69,683 (5) | | — | | (6) | | 859,255 | | 859,255(8) |
| Company car (10) | | 9,793 | | 9,793 | | — | | — | | — | | — |
| Total | | 545,334 | | 905,334 | | 240,000 | | — | | 1,659,255 | | 859,255 |
Lars Sjöbring
| Estimated Potential Payment or Benefit | | Resignation without Good Reason ($) | | Termination without Cause or Resignation for Good Reason ($) | | Termination for Cause ($) | | Change in Control ($) | | Change in Control and Qualifying Termination ($) (9) | | Death or Retirement ($) |
| Lump sum cash severance payment | | — | | 1,155,627 | | — | | — | | 2,383,274 (7) | | — |
| Continuing salary/annual incentive payments during requisite notice period | | 385,209 | | 385,209 | | — | | — | | — | | — |
| Salary differential payments in consideration for noncompetition with the Company (1) | | 462,251 | | — | | 462,251 | | — | | — | | — |
| Continuing health, welfare and retirement benefits (2) | | 143,664 | | 143,664 | | — | | — | | — | | — |
| Accelerated vesting of equity (3) | | 273,941(4) | | 273,941(5) | | — | | - (6) | | 1,584,395 | | 1,584,395(8) |
| Company car (10) | | 13,908 | | 13,908 | | — | | — | | — | | — |
| Total | | 1,278,973 | | 1,972,349 | | 462,251 | | - | | 3,967,669 | | 1,584,395 |
Matthias Bieler
Estimated Potential Payment or Benefit | | Resignation without Good Reason ($) (11) | | Termination without Cause or Resignation for Good Reason ($) | | Termination for Cause ($) | | Change in Control ($) | | Change in Control and Qualifying Termination ($) (9) | | Death or Retirement ($) |
| Lump sum cash severance payment | | — | | 882,054 | | — | | — | | 882,054 | | — |
| Continuing salary/annual incentive payments during requisite notice period | | 294,018 | | 294,018 | | — | | — | | 294,018 | | — |
| Salary differential payments in consideration for noncompetition with the Company (1) | | 352,821 | | — | | 352,821 | | — | | — | | — |
| Continuing health, welfare and retirement benefits (2) | | 123,261 | | 123,261 | | — | | — | | 123,261 | | — |
| Accelerated vesting of equity (3) | | — | | — | | — | | — | | 1,972,723 | | 1,972,723 (8) |
| Company car (10) | | 4,998 | | 4,998 | | — | | — | | 4,998 | | — |
| Total | | 775,099 | | 1,304,331 | | 352,821 | | — | | 3,277,054 | | 1,972,723 |
Robert Bisciotti
Estimated Potential Payment or Benefit | | Resignation without Good Reason ($) (11) | | Termination without Cause or Resignation for Good Reason ($) | | Termination for Cause ($) | | Change in Control ($) | | Change in Control and Qualifying Termination ($) (9) | | Death or Retirement ($) |
| Lump sum cash severance payment | | — | | 690,000 | | — | | — | | 690,000 | | — |
| Continuing salary/annual incentive payments during requisite notice period | | 230,000 | | 230,000 | | — | | — | | 230,000 | | — |
| Salary differential payments in consideration for noncompetition with the Company (1) | | 276,000 | | — | | 276,000 | | — | | — | | — |
| Continuing health, welfare and retirement benefits (2) | | 12,491 | | 12,491 | | — | | — | | 12,491 | | — |
| Accelerated vesting of equity (3) | | 69,683 | | 69,683 | | — | | (6) | | 803,728 | | 803,728 (8) |
| Company car (10) | | 13,411 | | 13,411 | | — | | — | | 13,411 | | — |
| Total | | 601,586 | | 1,015,586 | | 276,000 | | — | | 1,749,631 | | 803,728 |
Steve Rodé
Estimated Potential Payment or Benefit | | Resignation without Good Reason ($) | | Termination without Cause or Resignation for Good Reason ($) | | Termination for Cause ($) | | Change in Control ($) | | Change in Control and Qualifying Termination ($) (9) | | Death or Retirement ($) |
| Lump sum cash severance payment | | — | | 654,777 | | — | | — | | 654,777 | | — |
| Continuing salary/annual incentive payments during requisite notice period | | 218,259 | | 218,259 | | — | | — | | 218,259 | | — |
| Salary differential payments in consideration for noncompetition with the Company (1) | | 261,911 | | — | | 261,911 | | — | | — | | — |
| Continuing health, welfare and retirement benefits (2) | | 2,591 | | 2,591 | | — | | — | | 2,591 | | — |
| Accelerated vesting of equity (3) | | 149,051 | | 149,051 | | — | | -(6) | | 1,459,505 | | 1,459,505 (8) |
| Company car (10) | | 15,847 | | 15,847 | | — | | — | | 15,847 | | — |
| Total | | 647,659 | | 1,040,525 | | 261,911 | | - | | 2,350,979 | | 1,459,505 |
The following footnotes apply to the tables above:
| (1) | Reflects a monthly payment of 60% of the monthly gross salary earned as of the date of the executive’s employment termination, multiplied by 12, which is the maximum amount available to the executive pursuant to the terms of his employment agreement. |
| (2) | Reflects the value of the benefits disclosed in footnote (4) to the Summary Compensation Table (with the exception of amounts paid as vacation supplements or settlements) that the executive would be entitled to during the requisite notice period. The estimated values are determined based on the Company’s cost of providing such benefits during 2021. |
| (3) | Reflects the value of RSUs that vest upon the designated event, based on the closing price for a share of Autoliv and Veoneer common stock on December 31, 2021 (ALV $103.41 and VNE $35.48), the last trading day of the year. None of the named executive officers held unvested options as of December 31, 2021. |
| (4) | As discussed above, upon termination, the executive would be entitled to receive his compensation and benefits during the 12-month or 6-month notice period, as applicable, including any equity awards that would vest during such period. |
| (5) | As discussed above, upon an involuntary termination, the executive would be entitled to receive his compensation and benefits during the 18-month or 6-month notice period, as applicable, including any equity awards that would vest during such period. The value of the equity awards upon an involuntary termination reflects the value of the RSUs that would vest during the notice period following December 31, 2021. |
| (6) | For all LTI awards granted in 2019 and after, (i) in the event of a change in control in which the LTI awards are not assumed by the surviving entity, if the employee’s employment is terminated without cause (or, in certain cases, if he resigns for good reason) within two years following the change in control, then the RSUs and PSs will immediately vest (at actual performance achievement for fulfilled performance periods and at the target level for unfulfilled performance periods, in the case of PSs); and (ii) in the event of a change in control in which the awards are not assumed by the surviving entity, then the RSUs and PSs will become immediately vested (at actual performance achievement for fulfilled performance periods and at the target level for unfulfilled performance periods, in the case of the PSs). The value of the equity awards upon a change in control assumes that LTI awards granted in 2019 and after were assumed by the surviving entity. |
| (7) | For purposes of calculating the lump sum payment, for Messrs. Carlson and Sjöbring the annual bonus received by the executive for the year immediately prior to the year of termination (2020) is used, which is higher than the average of the annual bonuses received by the executive the two most recent fiscal years (2019 and 2020). |
| (8) | As discussed above, the executive’s unvested RSUs will become fully vested upon his termination of employment by reason of death or retirement. |
| (9) | Qualifying termination after a change in control includes resignation for good reason, termination without cause or termination due to disability. |
| (10) | Reflects the value of the company car, fuel and parking during the requisite notice period. The estimated values are determined based on the Company’s cost (or estimated cost as of December 31, 2021) of providing such benefits during 2021. |
| (11) | Amounts are rounded to the nearest whole number and, as a result of such rounding, the amounts reflected in the “Total” row may differ slightly from the sum of amounts set forth in each individual row. |
Mr. Backman’s Resignation
Mr. Backman resigned from his position as CFO and Executive Vice President, Finance on March 1, 2021. Pursuant to his employment agreement for a resignation without good reason, he received salary and benefits through May 3, 2021 (the requisite 6-month notice period following the agreement effective date), with a value of $453,497 and payment of unused vacation days, with a value of $161,841. Mr. Backman also received the salary differential payments in consideration for noncompetition agreement with the Company leases certain property, plantequal to $402,114, subject to his compliance with such covenant. Mr. Backman’s retention RSUs originally granted in 2019 vested on their scheduled vesting date, March 1, 2021. All other RSUs and equipmentPSs originally granted in 2019 and 2020 were forfeited according to their terms upon final termination of Mr. Backman’s employment.
Separation with Mr. Blanchford
On October 11, 2021, the Company and Mr. Blanchford mutually agreed that the employment would cease effective October 15, 2021. The Company entered into a separation agreement with Mr. Blanchford, pursuant to which he will receive the following severance benefits under capital lease contracts.the terms of his agreement with the Company; in lieu of continuing salary and benefits during the requisite 6-month notice period and lump sum severance payment, all outstanding RSUs and PSAs would accelerate (at actual performance level for the PSA Tranches when the performance period was fulfilled and the performance level had been determined and at target level for those PSA Tranches when performance period was not yet fulfilled and performance had not yet been determined in the case of PSAs) and vest on October 15, 2021, with such RSUs and PSAs having a value on such date of $784,736 and $1,274,937, respectively. Pursuant to the separation agreement, the Company and Mr. Blanchford agreed that the non-competition covenant in his employment agreement would become operative during the 12 months immediately following his last day of employment, and the payment for such covenant would have a maximum value of $336,629. Mr. Blanchford also received a lump sum payment for his accrued vacation days with a value of $22,658 and reimbursement of COBRA premiums for continuing medical and dental coverage with a value of $3,220.
Mr. Rode’s Agreement on Conditions due to Retirement
On April 14, 2021, Mr. Rodé provided notice of his intention to retire from his position as Executive Vice President Operations and the Company. The capital leases expire at various dates through 2027.
As of December 31, 2018, future minimum lease payments for non-cancellable capital leases totaled $15 million and are payable as follows: 2019: $1 million; 2020: $1 million; 2021: $12 million; 2022: $0 million; 2023: $0 million; 2024 and thereafter: $1 million.
Unconditional Purchase Obligation and Other Non-current liabilities
During the year ended December 31, 2017, the Company entered into an unconditional purchase obligation whereofagreement on Conditions due to Retirement under which Mr. Rodé would step down as the outstanding balanceCompany’s Executive Vice President Operations with immediate effect but continue to provide services to the Company as a non-executive employee until his retirement date of January 2, 2022. In December 2021, the Company and Mr. Rodé agreed that he would not retire on January 2, 2022, as previously disclosed, and that he would continue to provide services to the Company due to the additional work related to the merger with SSW/Qualcomm. Mr. Rodé continues to receive salary and benefits according to his current employment agreement.
CEO Pay Ratio
Methodology
Our CEO pay ratio for 2021, our last completed fiscal year, is a reasonable estimate calculated in compliance with the requirements of Section 953(b) of the Dodd-Frank Wall Street Reform and Consumer Protection Act, and Item 402(u) of Regulation S-K. Given the different methodologies that various public companies will use to determine an estimate of their pay ratio, the estimated ratio reported below should not be used as a basis for comparison between companies.
For the compensation year 2021, as disclosed in this Report we refer to the same “median employee” as we identified in 2019, as there were no significant changes that would impact the Company’s employee population, demographics or compensation arrangements. To identify the “median employee,” we took the following steps:
Step 1: We identified our active employee population as of DecemberOctober 31, 20182019. Our active workforce on October 31, 2019, including our consolidated subsidiaries, had 7,674 employees in 12 countries throughout the world. Of that population, 974 were U.S. employees and 6,700 were non-U.S. employees.
We based our analysis on the entire population (other than the CEO) as opposed to statistical sampling. As a result, our identification of the median employee reflects our inclusion of all 7,674 of our 7,674 global full-time, part-time, temporary, and seasonal employees (other than the CEO) whose compensation is $10 millionset by Veoneer and who were paid through Veoneer’s payroll employed and active as of October 31, 2019.
Step 2: We identified a consistently applied compensation measure which will bewould provide a reasonable picture of the annual compensation of our employees. For our consistently applied compensation measure, we used “Actual Gross Taxable Compensation Reported Through Payroll”– a combination of salary/overtime (paid on an hourly, weekly, biweekly or monthly basis),a variety of other cash-based incentive pay (including bonuses and other types of production based pay typical for their respective positions), equity-based incentive and taxable benefits in kind received by the employees in our identified population.
Given our multiple payroll systems and diverse global workforce, we measured compensation for our employee population using the 10-month period starting on January 1, 2019 and ending on October 31, 2019 (which we refer to as our measurement period). Our workforce is paid in 2019. Thisten currencies throughout the world on at least 16 different payroll systems. For the purpose of this disclosure, we applied the local currency to U.S. dollar exchange rate as of October 31, 2021 to the compensation paid. We did not make any cost-of-living adjustments.
Step 3: We identified the “median employee” from our employee population by ranking our employees, excluding the CEO, high to low based on their actual gross taxable compensation earned over the measurement period.
Calculating the CEO Pay Ratio
Using the above methodology, we determined that our median employee was a full-time, salaried employee residing in Sweden. At the end of the year, we identified and calculated the elements of the median paid employee’s total compensation for the fiscal year 2021 in accordance with the requirements of the Summary Compensation Table, as disclosed below. For the purpose of this disclosure the amount will be reimbursed by Zenuity. There are no obligations other than short-term obligations relatedhas been converted from SEK to inventory, services, tooling, and property, plant and equipment purchasedUSD using the exchange rate 1 USD = 9.0437 SEK.
| | Year | Salary $ | Bonus $ | Stock Awards $ | Non-Equity Incentive plan Compensation $ | Change in Pension Value and Nonqualified Deferred Compensation Earnings $ | All Other Compensation $ | Total $ |
| CEO | 2021 | 1,718,707 | 1,000,000 | 1,185,169 | 1,724,070 | - | 759,437 | 6,387,383 |
| Median employee | 2021 | 46,672 | - | - | - | - | 3,449 | 50,121 |
Accordingly, our median employee’s 2021 total compensation was $50,121. Our CEO’s 2021 total compensation was $6,387,383, as reflected in the ordinary course“Total” column in the Summary Compensation table. Therefore, our CEO’s total compensation compared to our median employees total compensation (the CEO Pay Ratio) is 127 to 1.
| Item 12. | Security Ownership of Certain Beneficial Owners and Management and Related Stockholder Matters |
NOTE 17. Loss Per Share
Basic loss per share is computed by dividing net loss for the period by the weighted average number of common stock outstanding during the period. Diluted loss per share is computed by dividing net loss for the period by the weighted average number of shares of common stock and potentially dilutive common stock outstanding during the period. The dilutive effect of outstanding options and equity incentive awards is reflected in diluted loss per share by application of the treasury stock method. The calculation of diluted loss per share excludes all anti-dilutive common stock. The following table sets forth certain information regarding the computationbeneficial ownership of basicour common stock as of December 31, 2021 for each person known by us to beneficially own more than 5% of our common stock, except where otherwise noted, and diluted loss per share.as of March 30, 2022 for (i) each of our directors; (ii) each of our named executive officers (as defined on page 12); and (iii) all of our directors, named executive officers and executive officers as a group. A person is deemed to be a beneficial owner of any securities of which that person has a right to acquire beneficial ownership within 60 days.
|
| | | | | | | | | | | |
| (U.S. dollars in millions, except per share amounts) | Year Ended December 31 |
| | 2018 | | 2017 | | 2016 |
| Numerator: | | | | | |
| Basic and diluted: | | | | | |
| Net loss attributable to common shareholders | $ | (276 | ) | | $ | (217 | ) | | $ | (53 | ) |
| | | | | | |
| Denominator: | | | | | |
| Basic: Weighted average number of shares outstanding (in millions) | 87.16 |
| | 87.13 |
| | 87.13 |
|
Diluted: Weighted-average number of shares outstanding, assuming dilution (in millions)1 | 87.16 |
| | 87.13 |
| | 87.13 |
|
| | | | | | |
| Basic loss per share | $ | (3.17 | ) | | $ | (2.49 | ) | | $ | (0.61 | ) |
Diluted loss per share1 | $ | (3.17 | ) | | $ | (2.49 | ) | | $ | (0.61 | ) |
| | Common Stock Beneficially Owned (1) (2) |
| Name of Beneficial Owner | | Number of Shares | | Percent of Total |
| 5% Stockholders | | | | |
Cevian Capital II GP Limited (3) 11-15 Seaton Place, St. Helier, Jersey JE4 0QH, Channel Islands | | 10,676,924 | | |
AMF Tjänstepension AB (4) Klara Södra Kyrkogata 18, SE-113 88, Stockholm, Sweden | | 11,252,960 | | |
Fjarde AP Fonden (6) Regeringsgatan 28, SE-111 53, Stockholm, Sweden | | 10,190,913 | | |
Alecta pensionsförsäkring, ömsesidigt (5) Regeringsgatan 107, SE-103 73, Stockholm, Sweden | | 10,061,200 | | |
| Directors and Named Executive Officers |
| Robert W. Alspaugh (7) | | 29,974 | | * |
| Mats Backman (8) | | 0 | | * |
| Art Blanchford (9) | | 0 | | * |
| Steven Jenkins | | 0 | | * |
| Matthias Bieler | | 0 | | * |
| Jan Carlson | | 274,759 | | |
| Mark Durcan (7) | | 25,911 | | * |
| Ray Pekar | | | | * |
| Steve Rodé (10) | | 36,669 | | * |
| James M. Ringler (7) | | 33,402 | | * |
| Kazuhiko Sakamoto (7) | | 29,718 | | * |
| Lars Sjöbring | | 31,021 | | * |
| Jonas Synnergren (7) | | 25,547 | | * |
| Wolfgang Ziebart (7) | | 27,691 | | * |
All directors, named executive officers and executive officers as a group (20 individuals including those named above) | | | |
* Less than 1%
| (1) | |
1
| SharesBased on 112,140,210 shares of the Company’s common stock outstanding as of March 30, 2022 except as noted below. The figures in the diluted loss per share calculationtable and notes thereto represent basic shares duebeneficial ownership and sole voting and investment power except where indicated. |
| (2) | Includes restricted stock units that vested on February 16, 2022, restricted stock units that will vest in one installment on May 10, 2022, subject to the net loss. Non-employee director’s continued service on the vesting date, subject to certain exceptions, and shares individuals have the right to acquire upon exercise of options exercisable within 60 days, including: Jan Carlson – 43,959 shares, Thomas Jönsson - 5,656 shares, Ray Pekar – 7,729, and Steven Rodé – 4,279 shares. |
| (3) | The number of shares excluded fromowned was provided by Cevian Capital II GP Limited (“Cevian”) pursuant to Amendment No. 1 to its Schedule 13G filed with the calculation were 446,821 for the year endedSEC on February 14, 2020, indicating beneficial ownership as of December 31, 2018, because they are anti-dilutive2019. The total number of shares include 2,653,275 Swedish Depositary Receipts representing 2,653,275 shares of the Company’s common stock. Cevian reported sole power to vote and fordispose of all such shares. |
| (4) | The number of shares owned was provided by AMF Tjänstepension AB, pursuant to Amendment No. 3 to its Schedule 13G filed with the years endedSEC on February 2, 2022, indicating beneficial ownership as of December 31, 20172021. AMF Tjänstepension AB reported sole power to vote and 2016,dispose of 8,285,000 shares and shared power to vote and dispose of 2,967,960 shares. |
| (5) | The number of shares owned was provided by Alecta pensionsförsäkring, ömsesidigt pursuant to Amendment No. 7 to its Schedule 13G filed with the SEC on February 7, 2022, indicating beneficial ownership as of December 31, 2021. Alecta pensionsförsäkring, ömsesidigt reported sole power to vote and dispose of all such shares. |
| (6) | The number of common shares excluded were zero.owned was determined utilizing information provided by Fjärda AP-Fonden in its Schedule 13G filed with the SEC on June 7, 2019, indicating beneficial ownership as of December 31, 2019, its Form 13F filed with the SEC on August 12, 2021, indicating beneficial ownership as of June 30, 2021, and data obtained from Euroclear with respect to beneficial ownership of SDRs as of December 31, 2020. |
| (7) | Includes 5263 restricted stock units that will vest in one installment on May 10, 2022, subject to the Non-employee director’s continued service on the vesting date, subject to certain exceptions. |
| (8) | Mr. Backman resigned as the CFO of the Company effective March 1, 2021. |
| (9) | Mr. Blanchford resigned as the Executive Vice President, Sales & Business Development of the Company effective May 1, 2021. |
| (10) | Mr. Rodé resigned as the Executive Vice President, Operations of the Company effective May 1, 2021. |
| Item 13. | Certain Relationships and Related Transactions, and Director Independence |
NOTE 18. Segment Information
Financial results forBoard Independence
The Board has determined that all current directors except Mr. Carlson are independent directors under the Company's reportable segments have been prepared using a management approach, which is consistent withapplicable rules of the basisNYSE, the Sarbanes-Oxley Act of 2002, as amended, and manner in which financial information is evaluatedthe rules and regulations promulgated by the Company's Chief Operating Decision Maker (CODM) in allocating resourcesSEC. In making its independence determinations, the Board reviewed (i) information regarding relevant relationships, arrangements or transactions between the Company and in assessing performance.each director or parties affiliated with such director, (ii) Company records and (iii) publicly available information.
Related Party Transactions
As a general matter, the Company prefers to avoid related person transactions (as defined below). We recognize that such transactions present a heightened risk of conflicts of interest and have adopted a written Related Person Transaction Reporting and Approval Policy to which all related-party transactions are subject. The Company has two operating segments, Electronics and Brake Systems. Electronics includes all of electronics resources and expertise in passive safety electronics and active safety. The operating results of the operating segments are regularly reviewed by the Company’s CODM, the Chief Executive Officer, to assess the performance of the individual operating segments and make decisions about resources to be allocated to the operating segments.
The accounting policies for the reportable segments are the same as those described in the Note 2, Summary of Significant Accounting Policies to the consolidated financial statements.
Veoneer, Inc.
Notes to Consolidated Financial Statements
(U.S. DOLLARS IN MILLIONS)
Key financial measures reviewed by the Company’s CODM are as follows.
|
| | | | | | | | | | | | |
| | | Year Ended December 31 |
| (Loss)/Income Before Income Taxes | | 2018 | | 2017 | | 2016 |
| Electronics | | $ | (116 | ) | | $ | (14 | ) | | $ | 11 |
|
| Brake Systems | | (30 | ) | | (247 | ) | | (12 | ) |
| Segment operating loss | | (146 | ) | | (261 | ) | | (1 | ) |
| Corporate and other | | (51 | ) | | (22 | ) | | (24 | ) |
| Interest and other non-operating items, net | | 7 |
| | (1 | ) | | 3 |
|
| Loss from equity method investment | | (63 | ) | | (31 | ) | | — |
|
| Loss before income taxes | | $ | (253 | ) | | $ | (314 | ) | | $ | (22 | ) |
|
| | | | | | | | | | | | |
| | | Year Ended December 31 |
| Capital Expenditures | | 2018 | | 2017 | | 2016 |
| Electronics | | $ | 132 |
| | $ | 79 |
| | $ | 80 |
|
| Brake Systems | | 56 |
| | 31 |
| | 23 |
|
| Total capital expenditures | | $ | 188 |
| | $ | 110 |
| | $ | 103 |
|
|
| | | | | | | | | | | | |
| | | Year Ended December 31 |
| Depreciation and Amortization | | 2018 | | 2017 | | 2016 |
| Electronics | | $ | 72 |
| | $ | 80 |
| | $ | 70 |
|
| Brake Systems | | 38 |
| | 39 |
| | 36 |
|
| Total depreciation and amortization | | $ | 111 |
| | $ | 119 |
| | $ | 106 |
|
| | | | | | | |
|
| | | | | | | | | | |
| | | | | As of December 31 |
| Segment Assets | | | | 2018 | | 2017 |
| Electronics | | | | $ | 2,329 |
| | $ | 1,286 |
|
| Brake Systems | | | | 507 |
| | 377 |
|
| Intersegment assets | | | | (204 | ) | | — |
|
| Total assets | | | | $ | 2,632 |
| | $ | 1,663 |
|
The Company’s customers consist of all major European, U.S. and Asian automobile manufacturers. Sales to individual customers representing 10% or more of net sales were:
In 2018: Customer A 21%, Customer B 17% and Customer C 11%.
In 2017: Customer A 21%, Customer B 17%, Customer C 12% and Customer D 12%.
In 2016: Customer A 17%, Customer B 16%, Customer C 13%, Customer D 13% and Customer E 11%.
|
| | | | | | | | |
| | | As of December 31 |
| Long-lived Assets | | 2018 | | 2017 |
| Asia | | $ | 307 |
| | $ | 302 |
|
| Americas | | 368 |
| | 393 |
|
| Europe | | 438 |
| | 242 |
|
| Total | | $ | 1,113 |
| | $ | 938 |
|
Veoneer, Inc.
Notes to Consolidated Financial Statements
(U.S. DOLLARS IN MILLIONS)
Long-lived assets in the U.S. amounted to $315 million and $349 million for 2018 and 2017, respectively. For 2018 and 2017 $117 million and $285 million, respectively, of the long-lived assets in the U.S. refers to intangible assets, principally from acquisition goodwill.
NOTE 19. Relationship with Former Parent and Related Entities
Before the Spin-Off, Veoneer had been managed and operated in the normal course of business with other affiliates of Autoliv. Accordingly,recognizes, however, that certain shared costs had been allocated to Veoneer and reflected as expenses in the stand-alone consolidated financial statements. Veoneer Management consider the allocation methodologies used to be reasonable and appropriate reflections of historical expenses of Autoliv attributable to Veoneer for purposes of the stand-alone financial statements; however, the expenses reflected in the consolidated financial statementsrelated person transactions may not be indicativeinconsistent with the best interests of the actual expensesCompany and its stockholders. The Company’s policy is that would have been incurred duringall related person transactions must be reviewed and approved by the periods presented if Veoneer historically operated as a separate, stand-alone entity. In addition, the expenses reflectedAudit Committee or, in certain circumstances, its Chairman.
As provided in the consolidated financial statements may not be indicativeRelated Person Transactions Policy, a “Related Person Transaction” is a transaction, arrangement or relationship (or any series of expenses thatsimilar transactions, arrangements or relationships) or change or amendment to an existing relationship, in which the Company (including any of its subsidiaries) was, is or will be incurreda participant and in which any “Related Person” (as defined in the future by Veoneer.
PriorRelated Person Transactions Policy) had, has or will have a direct or indirect interest. In determining whether to approve a related person transaction, the Audit Committee considers all of the known relevant facts and circumstances, including the benefit of the transaction to the Spin-Off, transactions between Autoliv and Veoneer,Company, the terms of the agreement with the exceptionRelated Person, the possible impact on a director’s independence, the availability of salesother sources for goods or services comparable to those provided by the Related Person, and purchase transactions and reimbursements for payments made to third-party service providers by Autoliv on Veoneer’s behalf, are reflectedany other information regarding the transaction or the Related Person that may be material.
Except as described below, the Company has not engaged in equity inany material Related Person Transactions.
Cooperation Agreement with Cevian Capital II GP Limited
On May 24, 2018, the Consolidated Balance Sheets as Net Former Parent investment and in the Consolidated Statements of Cash Flows as a financing activity in Net transfers from Former Parent.
Transactions with Related Parties
VeoneerCompany and Autoliv entered into a Transition ServicesCooperation Agreement (TSA) under(the “Cooperation Agreement”) with Cevian Capital II GP Limited (“Cevian”), pursuant to which Autoliv agreed to take action for Veoneer to appoint Mr. Synnergren, a partner of Cevian, to Veoneer’s Board following the Spin-off and Cevian agreed to certain services are providedstandstill provisions. Veoneer agreed to nominate Mr. Synnergren or a replacement designee of Cevian at future annual meetings of Veoneer to elect directors, subject to the terms and conditions of the Cooperation Agreement.
The appointment of Mr. Synnergren (or a replacement designee of Cevian) to the Board and his inclusion on future slates of directors during the Standstill Period (defined below) was conditioned upon Cevian owning at least 8% of the outstanding shares of Autoliv common stock at the time of the Spin-off and, thereafter, at least 8% of the outstanding common stock of Veoneer. Mr. Synnergren agreed to offer his resignation from the Board if Cevian no longer owns at least 8% of the then-outstanding shares of common stock of Veoneer.
Under the terms of the Cooperation Agreement, Cevian agreed to certain standstill restrictions including restrictions on Cevian (i) acquiring more than 19.9% of the Company, (ii) soliciting or granting proxies to vote shares of the Company’s common stock, (iii) initiating stockholder proposals for consideration by the Company’s stockholders, (iv) nominating directors for election to the Company’s Board, (v) making public announcements or communications regarding a plan or proposal to the Company’s Board, including its management plans, and (vi) submitting proposals for or offers of certain extraordinary transactions involving the Company, in each case, subject to certain qualifications or exceptions.
The foregoing standstill restrictions will terminate automatically upon the earliest of (i) 30 days following the time Mr. Synnergren (or his replacement, as applicable) no longer serves on the Company’s Board, (ii) the fifth business day after Cevian delivers written notice to Autoliv to Veoneer and certain services are providedthe Company of a material breach of the Cooperation Agreement by the Company if such breach is not cured within the notice period, (iii) the announcement by Veoneer of a definitive agreement with respect to Autoliv. Forcertain transactions that would result in the acquisition by any person or group of more than 50% of the outstanding shares of the Company’s common stock, or (iv) the commencement of certain tender or exchange offers which if consummated would result in the acquisition by any person or group of more than 50% of the outstanding shares of the Company’s common stock (the “Standstill Period”). The Cooperation Agreement will terminate upon the expiration of the Standstill Period or any other date established by mutual written agreement of the parties.
| Item 14. | Principal Accountant Fees and Services |
Fees of Independent Auditors
Types of Fees (Dollars in millions, USD) | | 2021 | | | 2020 | |
| Audit Fees | | $ | 4.8 | | | $ | 5.6 | |
| Audit-Related Fees | | $ | 0.1 | | | $ | 0.1 | |
| Tax Fees | | $ | 0.1 | | | $ | 0.2 | |
| All Other Fees | | | - | | | | - | |
| Total | | $ | 5.0 | | | $ | 5.9 | |
| Percent of total that were Audit or Audit-Related | | | 98 | % | | | 97 | % |
Audit Fees, Audit-Related Fees, and Tax Fees are calculated in accordance with Veoneer’s average exchange rates for 2020, as applicable.
Audit fees for the fiscal year ended December 31, 2018, Veoneer recognized $7 million of expenses under the TSA, and there were no TSA costs2021 relate to professional services provided by Ernst & Young AB, Stockholm, Sweden (PCAOB ID 1433) for the years ended December 31, 2017 and 2016.
Throughoutaudit of the periods covered by the consolidatedCompany’s annual financial statements, Veoneer sold finished goods to Autoliv and Nissin Kogyo,including the 49% owner in VNBS (a 51% owned subsidiary). Related party sales during the years ended December 31, 2018, 2017 and 2016 amounted to $121 million, $148 million and $120 million, respectively. Related party purchases during the years ended December 31, 2018, 2017 and 2016 amounted to $22 million, $25 million and $29 million, respectively. Furthermore, engineering services relating to passive safety electronics, have been rendered to Autoliv amounting to $1 million for the year ended December 31, 2018, and engineering services relating to Passive safety electronics, received from Autoliv amounting to $1 million for eachreview of the years ended December 31, 2017 and 2016.
Related Party Balances
Amounts due to and due from related party components as summarizedfinancial statements included in the below table:
|
| | | | | | | | |
| | | As of December 31 |
| RELATED PARTY | | 2018 | | 2017 |
| Related party receivable | | $ | 64 |
| | $ | 13 |
|
| Related party notes receivable | | $ | 1 |
| | $ | 76 |
|
| Related party payables | | $ | 16 |
| | $ | 8 |
|
| Related party short term debt | | $ | 1 |
| | $ | — |
|
| Related party long-term debt | | $ | 13 |
| | $ | 62 |
|
Related party receivables are mainly driven by reseller agreements put in place in connection with the Spin-Off. The reseller agreements are between Autoliv and Veoneer and facilitate the temporary arrangement of the sale of Veoneer products manufactured for certain customers for a limited period after the Spin-Off. Autoliv will collect the customer payments and will remit the payments to Veoneer.
As of December 31, 2017, related party notes receivables relate to a long-term loan between Veoneer and Autoliv entities, which was subsequently settled prior to the Spin-Off.
As of December 31, 2018, the related party payables mainly relate to an agreement between VNBS and various Autoliv entities.
Veoneer, Inc.
Notes to Consolidated Financial Statements
(U.S. DOLLARS IN MILLIONS)
A portion of the related party long-term debt is subject to a long-term loan agreement that was settled on June 29, 2018. As of December 31, 2018, all related party debt agreements were settled or terminated, with the exception of a capital lease arrangement at VNBS of $13 million and $11 million as of December 31, 2018 and 2017, respectively. The capital lease is with Nissin Kogyo.
In the third quarter of 2018, the Company recorded certain true-up adjustments related to amounts due to and from Autoliv with an offsetting increase to equity of $3 million. In addition, the Company recorded a true-up adjustment during 2018 to its deferred tax amount of $8 million associated with the tax impacts of the legal organization prior to the Spin-Off, with an offsetting increase to equity.
Corporate Costs/Allocations
For the periods prior to April 1, 2018, the consolidated financial statements include corporate costs incurred by Autoliv for services that are provided to or on behalf of Veoneer. These costs consist of allocated cost pools and direct costs. Corporate costs have been directly charged to, or allocated to Veoneer using methods management believes are consistent and reasonable. The method for allocating corporate function costs to Veoneer is based on various formulas involving allocation factors. The methods for allocating corporate administration costs to Veoneer are based on revenue, headcount, or other relevant metrics. However, the expenses reflected in the consolidated financial statements may not be indicative of the actual expenses that would have been incurred during the periods presented if Veoneer historically operated as a separate, stand-alone entity. All corporate charges and allocations have been deemed paid by Veoneer to Autoliv in the period in which the cost was recorded in the Consolidated Statements of Operations. Effective April 1, 2018, Veoneer began performing certain functions using internal resources or third parties, and certain other services continued to be provided by Autoliv and directly charged to Veoneer. In addition, Veoneer personnel perform certain services for Autoliv, which are directly charged to Autoliv.
Allocated corporate costs included in Costs of sales, Selling, general and administrative expenses and Research, development and engineering expenses were for shared services and infrastructure provided, which includes costs such as information technology, accounting, legal, real estate and facilities, corporate advertising, risk and insurance services, treasury, shareholder services and other corporate and infrastructure services.
Cash Management and Financing
Prior to the Spin-Off, Veoneer participated in Autoliv’s centralized cash management and financing programs. Disbursements were made through centralized accounts payable systems operated by Autoliv. Cash receipts were transferred to centralized accounts, also maintained by Autoliv. As cash was disbursed and received by Autoliv, it was accounted for by Veoneer through the Net Former Parent investment. All short-term and long-term debt was financed by Autoliv or by Nissin Kogyo and financing decisions for wholly and majority owned subsidiaries were determined by Autoliv’s corporate treasury operations. On the Distribution Date, Veoneer held approximately $1 billion of cash and cash equivalents. Upon the Spin-Off, Veoneer created its own corporate treasury operations.
Veoneer, Inc.
Notes to Consolidated Financial Statements
(U.S. DOLLARS IN MILLIONS)
NOTE 20. Summary Quarterly Financial Data (Unaudited)
The following table presents summary quarterly financial data:
|
| | | | | | | | | | | | | | | | | | | | | | | | | | | | | | | |
| | 2018 | | 2017 |
| | First Quarter | | Second Quarter | | Third Quarter | | Fourth Quarter | | First Quarter | | Second Quarter | | Third Quarter | | Fourth Quarter |
| (Dollars in Millions, Except Per Share Amounts) |
| Sales | $ | 594 |
| | $ | 572 |
| | $ | 526 |
| | $ | 535 |
| | $ | 583 |
| | $ | 579 |
| | $ | 567 |
| | $ | 593 |
|
| Gross profit | 112 |
| | 112 |
| | 99 |
| | 109 |
| | 113 |
| | 120 |
| | 109 |
| | 124 |
|
| Operating loss | (16 | ) | | (48 | ) | | (58 | ) | | (75 | ) | | (10 | ) | | (12 | ) | | (16 | ) | | (244 | ) |
| Loss before income taxes | (30 | ) | | (63 | ) | | (70 | ) | | (90 | ) | | (11 | ) | | (19 | ) | | (26 | ) | | (258 | ) |
| Net loss | (37 | ) | | (66 | ) | | (72 | ) | | (119 | ) | | (22 | ) | | (30 | ) | | (36 | ) | | (256 | ) |
| Net loss attributable to controlling interest | $ | (32 | ) | | $ | (63 | ) | | $ | (68 | ) | | $ | (114 | ) | | $ | (20 | ) | | $ | (28 | ) | | $ | (33 | ) | | $ | (136 | ) |
| Per Share Data: | | | | | | | | | | | | | | | |
| Basic loss per share | $ | (0.36 | ) | | $ | (0.72 | ) | | $ | (0.78 | ) | | $ | (1.31 | ) | | $ | (0.23 | ) | | $ | (0.32 | ) | | $ | (0.38 | ) | | $ | (1.56 | ) |
| Diluted loss per share | $ | (0.36 | ) | | $ | (0.72 | ) | | $ | (0.78 | ) | | $ | (1.31 | ) | | $ | (0.23 | ) | | $ | (0.32 | ) | | $ | (0.38 | ) | | $ | (1.56 | ) |
During the first quarter of 2017, the Company recognized an impairment charge to amortization of intangibles of $12 million related to a contract with an OEM customer of MACOM products, which was included in earnings for the period.
The Company adjusted the fair value of the earn-out liability to $14 million during 2017 based on actual revenue levels to date as well as changes in the estimated probability of different revenue scenarios for the remaining contractual earn-out period. Income of approximately $13 million was recognized within other income in the Consolidated Statements of Operations during the year ended December 31, 2017 due to the decrease in the contingent consideration liability.
During the fourth quarter of 2017, the Company recognized an impairment charge of the full goodwill amount of $234 million, after consideration of foreign exchange movements, related to VNBS.
Item 9. Changes in and Disagreements With Accountants on Accounting and Financial Disclosure
None
Item 9A. Controls and Procedures
Evaluation of Disclosure Controls and Procedures
Our management, with the participation of our Chief Executive Officer and Chief Financial Officer, has evaluated the effectiveness of our disclosure controls and procedures (as defined in Rules 13a-15(e) and 15d-15(e) under the Securities Exchange Act of 1934, as amended), as of the end of the period covered by this Annual Report on Form 10-K. Based on such evaluation, our Chief Executive Officer and Chief Financial Officer have concluded that as of December 31, 2018 our disclosure controls and procedures were effective to provide reasonable assurance that the information required to be disclosed by us in thisCompany’s Annual Report on Form 10-K was (a) reported within the time periods specified by SEC rules and regulations, and (b) communicated to our management, including our Chief Executive Officer and Chief Financial Officer, to allow timely decisions regarding any required disclosure.
Management’s Annual Report on Internal Control Over Financial Reporting
This annual report does not include a report of management’s assessment regarding internal control over financial reporting or an attestation report of the Company's registered public accounting firm due to a transition period established by rules of the SEC for newly public companies.2021.
Changes in Internal Control over Financial Reporting
There were no changes in our internal control over financial reporting identified in management’s evaluation pursuant to Rules 13a-15(d) or 15d-15(d) of the Exchange Act during the quarter ended December 31, 2018 that materially affected, or are reasonably likely to materially affect, our internal control over financial reporting.
Item 9B. Other Information
None
Part III
Item 10. Directors, Executive Officers and Corporate Governance
We have adopted a written Code of Conduct and Ethics for Senior Officers that applies to our Executive Management Team, together with our Senior Treasury Officer and Senior Accounting Officer, including our CEO, CFO and Controller. Our Code of Conduct and Ethics for Senior Officers serves as our written code of ethics for those officers. The Code of Conduct and Ethics for Senior Officers is also available at the Corporate Governance section of the Investors page on our website at https://www.veoneer.com/en/governance. If we make any substantive amendments to the Code of Conduct for Senior Officers or grant any waiver, including an implicit waiver, from the Code of Conduct to our CEO, CFO or Controller, we will within four business days of the event disclose the nature of the amendment or waiver on our website or in a report on Form 8-K.
The information relating to our directors, our nominees for directors, and our executive officers pursuant to Items 401; and Item 407(c)(3), (d)(4) and (d)(5) of Regulation S-K required by Item 10 will be contained under the caption "Proposal 1 - Election of Directors" in the 2019 Proxy Statement to be filed by us with the SEC pursuant to Regulation 14A of the Exchange Act and is hereby specifically incorporated herein by reference thereto.
The information required pursuant to Item 405 of Regulation S-K to be included in this Item 10 will be contained under the caption "Section 16(a) Beneficial Ownership Reporting Compliance" in the 2019 Proxy Statement, to be filed by us with the SEC pursuant to Regulation 14A of the Exchange Act and is hereby specifically incorporated herein by reference thereto.
Item 11. Executive Compensation
The information required under this Item 11 will appear under the captions "Board Compensation," "Compensation Discussion and Analysis", "Executive Compensation" and related discussion and disclosure thereto, in the 2019 Proxy Statement, to be filed by us with the SEC pursuant to Regulation 14A of the Exchange Act, and is hereby specifically incorporated herein by reference thereto.
Item 12. Security Ownership of Certain Beneficial Owners and Management and Related Stockholder Matters
The information pursuant to Item 403 of Regulation S-K to be included in this Item 12 will appear under the captions "Security Ownerships of Certain Beneficial Owners and Management" in the 2019 Proxy Statement, to be filed by us with the SEC pursuant to Regulation 14A of the Exchange Act, and is hereby specifically incorporated herein by reference thereto.´
Shares Previously Authorized for Issuance Under the 2018 Stock Incentive Plan
The following table provides information as of December 31, 2018, about the common stock that may be issued under the Veoneer, Inc. Stock Incentive Plan. The Company does not have any equity compensation plans that have not been approved by its stockholders.
|
| | | | | | | | | |
| Plan Category | (a) Number of Securities to be issued upon exercise of outstanding options, warrants and rights | | (b) Weighted- average exercise price of outstanding options, warrants and rights2 | | (c) Number of securities remaining available for future issuance under equity compensation plans (excluding securities reflected in column (a)3 |
Equity compensation plans approved by security holders1 | 919,578 |
| | $ | 17.68 |
| | 3,000,257 |
|
Equity compensation plans not approved by security holders | — |
| | $ | — |
| | — |
|
| Total | 919,578 |
| | $ | 17.68 |
| | 3,000,257 |
|
1 Veoneer, Inc. 2018 Stock Incentive Plan (Stock Options and Restricted Stock Units (RSUs)).
2 Excludes RSUs which convert to shares of common stock for no consideration.
3 All such shares are available for issuance pursuant to grants of full-value stock awards.
Item 13. Certain Relationships and Related Transactions, and Director Independence
The information required under this item will appear under the captions "Proposal 1 - Election of Directors", "Relationships and Related Party Transactions" and related discussion and disclosure thereto, in the 2019 Proxy Statement, to be filed by us with the SEC pursuant to Regulation 14A of the Exchange Act, and is hereby specifically incorporated herein by reference thereto.
Item 14. Principal Accountant Fees and Services
The information required under this item will appear under the captions "Fees of Independent Auditors," and "AuditAudit Committee Pre-Approval Policies and Procedures"Procedures
The Audit Committee has adopted guidelines for the provision of audit and related discussionnon-audit services by EY, including requiring Audit Committee pre-approval of any such audit and disclosure thereto,non-audit services. In developing these guidelines, the Audit Committee took into consideration the need to ensure the independence of EY while recognizing that EY may possess the expertise on certain matters that best positions it to provide the most effective and efficient services on certain matters unrelated to accounting and auditing. On balance, the Audit Committee will only pre-approve the services that it believes enhance the Company’s ability to manage or control risk. The Audit Committee was also mindful of the relationship between fees for audit and non-audit services in deciding whether to pre-approve any such services and may determine, for each fiscal year, the 2019 Proxy Statement,appropriate ratio between the total amount of fees for audit, audit-related and tax services, and the total amount of fees for permissible non-audit services (excluding tax services). The guidelines provide for the pre-approval by the Audit Committee of described services to be filedperformed, such as audit, audit-related, tax and other permissible non-audit services. Approval of audit and permitted non-audit services may also be made by usthe chairperson of the Committee, and the person granting such approval must report such approval to the Committee at the next scheduled meeting.
The Audit Committee has considered the audit, audit-related, tax and all other services discussed above, and additional information provided to the Company by EY and determined that the provision of these services is compatible with the SEC pursuant to Regulation 14Aindependence of the Exchange Act, and is hereby specifically incorporated herein by reference thereto.EY. The Audit Committee pre-approved all such services in 2021.
36
104
Part IV
| Item 15. | Exhibits, Financial Statement Schedules |
Item 15. Exhibits and Financial Statement Schedules
(a) The following documents are filed as part of this report:
1. Financial Statements
See “Index to Consolidated Financial Statements” in Part II, Item 8 hereof.| (a) | The following Exhibits are filed as part of this report. |
2. Financial Statement Schedules
All other financial statement schedules are omitted because they are not required or applicable under instructions contained in Regulation S-X or because the information called for is shown in the financial statements and notes thereto.
(b) Exhibits.
These exhibits are available without charge upon written request directed to the Company’s Secretary at Veoneer, Inc. Attn: Corporate Secretary, Box 13089, SE-10302, Stockholm, Sweden.
|
| |
| Exhibit No. | Description |
| |
| |
| |
| |
| |
| |
| Employee Matters Agreement,Indenture, dated JuneMay 28, 2018,2019, between Veoneer, Inc. and Autoliv, Inc.U.S. Bank National Association, as trustee, incorporated herein by reference to Exhibit 4.1 to the Company’s Current Report on Form 8-K filed May 29, 2019. |
| |
| |
| |
| |
| |
| Joint Venture Agreement, dated March 7, 2016, by and among Autoliv ASP, Inc., Autoliv AB, Autoliv Holding, Inc. and Nissin Kogyo Co., Ltd., Nissin Kogyo Holdings USA, Inc. and Zhongshan Nissin Industry Co., Ltd., incorporated herein by reference to Exhibit 10.6 to the Company’s Registration Statement on Form 10 filed May 21, 2018. |
| |
| |
| |
| |
| |
| Transaction Framework Agreement between Veoneer Sweden AB, Veoneer AB, Veoneer US, Inc., Volvo Car Corporation AB ZTWO Company AB Transaction Framework Agreement between Veoneer Sweden AB, Veoneer AB, Veoneer US, Inc., Volvo Car Corporation AB ZTWO Company AB and Zenuity AB, dated July 1, 2020, incorporated herein by reference to Exhibit 10.1 to the Company's Quarterly Report on Form 10-Q filed October 23, 2020. Zenuity AB, dated July 1, 2020, incorporated herein by reference to Exhibit 10.1 to the Company's Quarterly Report on Form 10-Q filed October 23, 2020. |
| |
| |
| |
| |
| |
| |
| |
| |
| |
|
| |
| |
| Change-in-Control SeveranceAmendment, dated June 10, 2019, to Addendum to Employment Agreement, effective as of June 29,dated August 20, 2018, by and between Veoneer, Inc. and Johan Löfvenholm,Jan Carlson, incorporated herein by reference to Exhibit 10.1110.2 to the Company’s Registration StatementCompany's Quarterly Report on Form 1010-Q filed May 21, 2018.July 26, 2019. |
| |
| |
| |
| |
| |
| |
| Amendment, dated March 29, 2021, to Employment Agreement, effective as of May 21, 2018.1, 2020, by and between Veoneer, Inc. and Matthias Bieler, incorporated herein by reference to Exhibit 10.3 to the Company's Quarterly Report on Form 10-Q filed July 3, 2021. |
| |
| |
| |
| |
| Employment Agreement, effective as of June 29, 2018,May 1, 2021, by and between Veoneer, Inc. and Peter Rogbrant, Steven Jenkins,incorporated herein by reference to Exhibit 10.1710.4 to the Company’s Registration StatementCompany's Quarterly Report on Form 1010-Q filed May 21, 2018.July 3, 2021. |
| |
| |
| |
| |
| |
| |
| |
| |
| |
| |
| |
| |
| |
| |
| |
| |
| 104 | |
| inline XBRL document). |
|
| |
101* | The following financial information from the Annual Report on Form 10-K for the fiscal year ended December 31, 2018, formatted in XBRL (Extensible Business Reporting Language) and furnished electronically herewith: (i) the Consolidated Statements of Operations; (ii) the Consolidated Statements of Comprehensive Loss: (iii) the Consolidated Balance Sheets; (iv) the Consolidated Statements of Cash Flow; (v) the Consolidated Statements of Changes in Equity; and (vi) the Notes to the Consolidated Financial Statements. |
* Filed herewith.
+ Management contract or compensatory plan
**Portions of this exhibit have been redacted pursuant to a confidential treatment request filed with the Securities and Exchange Commission pursuant to Rule 24b-2 under the Exchange Act. The redacted portions of this exhibit have been filed with the Securities and Exchange Commission.
*** Portions of this exhibit have been omitted pursuant to Item 601(b)(10) of Regulation S-K. The Company agrees to furnish to the Securities and Exchange Commission a copy of any omitted portions of the exhibit upon request. The omitted information is (i) not material and (ii) would likely cause competitive hard to the Company if publicly disclosed.
**** The schedules and exhibits have been omitted pursuant to Item 601(b)(2) of Regulation S-K. The Company agrees to furnish supplementally a copy of such schedules and exhibits, or any section thereof, to the Securities and Exchange Commission upon request.
Item 16. Form 10-K Summary
Not applicable.
Signatures
Pursuant to the requirements of Section 13 or 15(d) of the Securities Exchange Act of 1934, as amended, the Registrant has duly caused this reportAmendment No. 1 to the Annual Report on Form 10-K to be signed on its behalf by the undersigned, thereunto duly authorized.
Date: February 22, 2019March 31, 2022
VEONEER, INC.
(Registrant)
By: /s/ Mathias HermanssonRay Pekar
Mathias Hermansson
Ray Pekar
Chief Financial Officer
(Duly Authorized Officer and Principal Financial Officer)
Pursuant to the requirements of the Securities Exchange Act of 1934, this report has been signed below by the following persons on behalf of the registrant and in the capacities indicated, as of February 22, 2019.
41
|
| |
Title | Name |
Chairman of the Board of Director,
Chief Executive Officer and President (Principal Executive Officer)
| /s/ Jan Carlson
Jan Carlson
|
| |
Executive Vice President and Chief Financial Officer
(Principal Financial and Principal Accounting Officer)
| /s/ Mathias Hermansson
Mathias Hermansson
|
| |
Director | /s/ Robert W. Alspaugh
Robert W. Alspaugh
|
| |
Director | /s/ Mary Louise Cummings
Mary Louise Cummings
|
| |
Director | /s/ Mark Durcan
Mark Durcan
|
| |
Director | /s/ James M. Ringler
James M. Ringler
|
| |
Director | /s/ Kazuhiko Sakamoto
Kazuhiko Sakamoto
|
| |
Director | /s/ Jonas Synnergren
Jonas Synnergren
|
| |
Director | /s/ Wolfgang Ziebart
Wolfgang Ziebart
|
Report of Independent Auditors
To the Board of Directors
Zenuity AB
We have audited the accompanying consolidated financial statements of Zenuity AB, which comprise the consolidated balance sheets as of December 31, 2018 and 2017, and the related consolidated income statements, statements of changes in equity and cash flow statements for the year ended 2018 and for the period from April 18, 2017 through December 31, 2017, and the related notes to the consolidated financial statements.
Management’s Responsibility for the Financial Statements
Management is responsible for the preparation and fair presentation of these financial statements in conformity with the Annual Accounts Act and the Swedish Accounting Standards Board’s generally accepted accounting principles BFNAR 2012:1 Annual Report and consolidated accounts (K3); this includes the design, implementation and maintenance of internal control relevant to the preparation and fair presentation of financial statements that are free of material misstatement, whether due to fraud or error.
Auditor’s Responsibility
Our responsibility is to express an opinion on these financial statements based on our audits. We con-ducted our audits in accordance with auditing standards generally accepted in the United States. Those standards require that we plan and perform the audit to obtain reasonable assurance about whether the financial statements are free of material misstatement.
An audit involves performing procedures to obtain audit evidence about the amounts and disclosures in the financial statements. The procedures selected depend on the auditor’s judgment, including the assessment of the risks of material misstatement of the financial statements, whether due to fraud or error. In making those risk assessments, the auditor considers internal control relevant to the entity’s preparation and fair presentation of the financial statements in order to design audit procedures that are appropriate in the circumstances, but not for the purpose of expressing an opinion on the effectiveness of the entity’s internal control. Accordingly, we express no such opinion. An audit also includes evaluating the appropriateness of accounting policies used and the reasonableness of significant accounting estimates made by management, as well as evaluating the overall presentation of the financial statements.
We believe that the audit evidence we have obtained is sufficient and appropriate to provide a basis for our audit opinion.
Opinion
In our opinion, the financial statements referred to above present fairly, in all material respects, the consolidated financial position of Zenuity AB at December 31, 2018 and 2017, and the consolidated results of its operations and its cash flows for the year ended December 31, 2018 and for the period from April 18, 2017 through December 31, 2017 in conformity with the Annual Accounts Act and the Swedish Accounting Standards Board’s generally accepted accounting principles BFNAR 2012:1 Annual Report and consolidated accounts (K3).
Accounting principles generally accepted in Sweden (K3) vary in certain respects from accounting principles generally accepted in the United States of America (US GAAP). In Note 24 to the consolidated financial statements is a reconciliation from K3 to US GAAP
/s/ Ernst & Young AB
Gothenburg, Sweden
February 22, 2019
Zenuity AB
Corporate identity number 559073-6871
Consolidated financial statements
For the financial year January 1 2018 - December 31 2018
Zenuity AB
Corporate identity number 559073-6871 |
| | | | | | | | |
| | | | | 1 January 2018- | | 18 April 2017- |
| Amounts in TSEK | | Note | | 31 December 2018 | | 31 December 2017 |
| Net sales | | | | 39,193 |
| | 40,001 |
|
| Cost of services sold | | | | (36,629 | ) | | (37,384 | ) |
| Gross profit | | | | 2,564 |
| | 2,617 |
|
| Selling and administrative expenses | | | | (57,714 | ) | | (80,313 | ) |
| Research and development expenses | | | | (1,043,988 | ) | | (452,605 | ) |
| Other operating income | | 3 | | 24,426 |
| | 8,290 |
|
| Other operating expenses | | 6 | | (7,790 | ) | | (2,652 | ) |
| Operating loss | | 4,5,7 | | (1,082,502 | ) | | (524,663 | ) |
| Profit/loss from financial items | | | | | | |
| Interest income and similar profit/loss items | | 8 | | 4,326 |
| | 1,970 |
|
| Interest expense and similar profit/loss items | | 9 | | (3,432 | ) | | (2,597 | ) |
| Loss after financial items | | | | (1,081,608 | ) | | (525,290 | ) |
| Loss before tax | | | | (1,081,608 | ) | | (525,290 | ) |
| Tax expense for the year | | 10 | | (4,417 | ) | | (3,294 | ) |
| Net loss for the year | | | | (1,086,025 | ) | | (528,584 | ) |
Zenuity AB
Corporate identity number 559073-6871
|
| | | | | | | | |
| Amounts in TSEK | | Note | | 31 December 2018 | | 31 December 2017 |
| ASSETS | | | | | | |
| Non-current assets | | | | | | |
| Intangible assets | | | | | | |
| Capitalized expenditures for software and similar | | 11 | | 18,490 |
| | 23,722 |
|
| Concessions, patents, licenses, trademarks and similar rights | | 12 | | 245,976 |
| | 256,171 |
|
| | | | | 264,466 |
| | 279,893 |
|
| Property, plant and equipment | | | | | | |
| Leasehold improvements | | 13 | | 3,290 |
| | 1,950 |
|
| Equipment, plant and machinery | | 14 | | 141,550 |
| | 105,370 |
|
| | | | | 144,840 |
| | 107,320 |
|
| Financial assets | | | | | | |
| Deferred tax asset | | 16 | | 49,611 |
| | 62,429 |
|
| Other long-term receivables | | 17 | | 15,379 |
| | 8,520 |
|
| | | | | 64,990 |
| | 70,949 |
|
| Total non-current assets | | | | 474,296 |
| | 458,162 |
|
| Current assets | | | | | | |
| Current receivables | | | | | | |
| Receivables from owners | | | | 22,520 |
| | 20,060 |
|
| Other receivables | | | | 35,044 |
| | 19,801 |
|
| Prepaid expenses and accrued income | | 18 | | 104,256 |
| | 93,937 |
|
| | | | | 161,820 |
| | 133,798 |
|
| Cash and bank balances | | | | | | |
| Cash and bank | | 21 | | 498,020 |
| | 384,136 |
|
| | | | | 498,020 |
| | 384,136 |
|
| Total current assets | | | | 659,840 |
| | 517,934 |
|
| TOTAL ASSETS | | | | 1,134,136 |
| | 976,096 |
|
Zenuity AB
Corporate identity number 559073-6871
|
| | | | | | | | |
| Amounts in TSEK | | Note | | 31 December 2018 | | 31 December 2017 |
| EQUITY AND LIABILITIES | | | | | | |
| Equity | | | | | | |
| Share capital | | 19 | | 500 |
| | 500 |
|
| Other capital contributed | | | | 2,520,297 |
| | 1,320,297 |
|
| Translation reserve | | | | 3,935 |
| | (3,587 | ) |
| Retained earnings incl. loss for the year | | | | (1,614,609 | ) | | (528,584 | ) |
| | | | | 909,623 |
| | 788,126 |
|
| | | | | 910,123 |
| | 788 626 |
|
| Provisions | | | | | | |
| Deferred tax liability | | 16 | | 51,134 |
| | 62,429 |
|
| | | | | 51,134 |
| | 62,429 |
|
| Current liabilities | | | | | | |
| Accounts payable - trade | | | | 35,935 |
| | 23,469 |
|
| Liabilities to owners | | | | 19,717 |
| | 15,718 |
|
| Current tax liability | | | | 6,071 |
| | 3,286 |
|
| Other liabilities | | | | 21,502 |
| | 12,627 |
|
| Accrued expenses and deferred income | | 20 | | 89,654 |
| | 69,941 |
|
| | | | | 172,879 |
| | 125,041 |
|
| TOTAL EQUITY AND LIABILITIES | | | | 1,134,136 |
| | 976,096 |
|
Zenuity AB
Corporate identity number 559073-6871
|
| | | | |
Statement of changes in equity |
|
| | | | | | | | | | | | | | | |
| December 31, 2017 | | | | | | | | | | |
Amounts in TSEK
| | Share capital | | Other capital contributed* | | Translation reserve | | Retained earnings incl. loss for the year* | | Total equity |
| Opening balance | | — |
| | — |
| | — |
| | — |
| | — |
|
| Net loss for the year | | | | | | | | (528,584 | ) | | (528,584 | ) |
| Foreign currency translation differences | | — |
| | — |
| | (3,587 | ) | | — |
| | (3,587 | ) |
| Total | | — |
| | — |
| | (3,587 | ) | | — |
| | (3,587 | ) |
| Transactions with owners | | | | | | | | | | |
| Issue of ordinary shares | | 500 |
| | — |
| | — |
| | — |
| | 500 |
|
| Shareholders’ contribution received | | | | 1,320,297 |
| | — |
| | — |
| | 1,320,297 |
|
| Total | | 500 |
| | 1,320,297 |
| | — |
| | — |
| | 1,320,797 |
|
| At year end | | 500 |
| | 1,320,297 |
| | (3,587 | ) | | (528,584 | ) | | 788,626 |
|
|
| | | | | | | | | | | | | | | |
| December 31, 2018 | | | | | | | | | | |
| Amounts in TSEK | | Share capital | | Other capital contributed* | | Translation reserve | | Retained earnings incl. loss for the year* | | Total equity |
| Opening balance | | 500 |
| | 1,320,297 |
| | (3,587 | ) | | (528,584 | ) | | 788,626 |
|
| Net loss for the year | | | | | | | | (1,086,025 | ) | | (1,086,025 | ) |
| Foreign currency translation differences | | — |
| | — |
| | 7,522 |
| | — |
| | 7,522 |
|
| Total | | — |
| | — |
| | 7,522 |
| | — |
| | 7,522 |
|
| Transactions with owners | | | | | | | | | | |
| Shareholders’ contribution received | | — |
| | 1,200,000 |
| | — |
| | — |
| | 1,200,000 |
|
| Total | | — |
| | 1,200,000 |
| | — |
| | — |
| | 1,200,000 |
|
| At year end | | 500 |
| | 2,520,297 |
| | 3,935 |
| | (1,614,609 | ) | | 910,123 |
|
*Definitions of equity has been adjusted in FS 2018 to be in accordance with Swedish GAAP for group accounting.
Zenuity AB
Corporate identity number 559073-6871
|
| | | | | | | | |
| | | | | 1 January 2018- | | 18 April 2017- |
| Amounts in TSEK | | | | 31 December 2018 | | 31 December 2017 |
| Operating activities | | | | | | |
| Loss after financial items | | | | (1,081,608 | ) | | (525,290 | ) |
| Adjustments for non-cash items, etc. | | 22 | | 93,061 |
| | 45,064 |
|
| Income tax paid | | | | (346 | ) | | — |
|
| Cash flow from operating activities before working capital changes | | | | (988,893 | ) | | (480,226 | ) |
| Increase(-)/Decrease(+) of current receivables | | | | (27,713 | ) | | (133,798 | ) |
| Increase(+)/Decrease(-) of current liabilities | | | | 49,613 |
| | 111,659 |
|
| Cash flow from operating activities | | | | (966,993 | ) | | (502,365 | ) |
| Investing activities | | | | | | |
| Acquisition of property, plant and equipment | | | | (76,965 | ) | | (87,191 | ) |
| Disposal of property, plant and equipment | | | | 286 |
| | — |
|
| Acquisition of intangible assets | | | | (36,376 | ) | | (18,535 | ) |
| Contribution in kind, net liquid effect | | 22 | | — |
| | 239 |
|
| Acquisition of financial assets | | | | (6,859 | ) | | (8,520 | ) |
| Cash flow from investing activities | | | | (119,914 | ) | | (114,007 | ) |
| Financing activities | | | | | | |
| Issue of ordinary shares | | | | - |
| | 500 |
|
| Received shareholders’ contribution | | | | 1,200,000 |
| | 1,000,555 |
|
| Cash flow from financing activities | | | | 1,200,000 |
| | 1,001,055 |
|
| Cash flow for the year | | | | 113,093 |
| | 384,683 |
|
| Cash and cash equivalents at the beginning of the year | | | | 384,136 |
| | — |
|
| Exchange rate differences in cash and cash equivalents | | | | 791 |
| | (547 | ) |
| Cash and cash equivalents at the end of the year | | 21 | | 498,020 |
| | 384,136 |
|
Zenuity AB
Corporate identity number 559073-6871
Amounts in TSEK unless otherwise stated
|
| |
Note 1 | Accounting principles |
These consolidated financial statements have been prepared in accordance with the Annual Accounts Act and the Swedish Accounting Standards Board’s generally accepted accounting principles BFNAR 2012:1 Annual Report and consolidated accounts (K3).
Assets, provisions and liabilities have been valued at cost unless otherwise stated below.
Intangible assets
Research and development
Expenditures for research activities, i.e. the planned and systematic search for new scientific or technical knowledge and insight, are expensed as incurred.
Internal development costs are expensed when incurred in accordance with the expense model in BFNAR 2012:1.
Other intangible assets - intellectual property rights, licenses and similar rights
Other intangible assets acquired are valued at cost less accumulated amortisation and impairment.
Amortisations
Amortisation is made on a straight-line basis over the asset’s estimated useful life. The amortisation is recognized as an expense in the income statement.
|
| |
Acquired intangible assets | Useful life |
Software licenses | 3 years |
Software | 7 years |
Intellectual Property | 7 years |
Property, plant and equipment
Property, plant and equipment is valued at cost less accumulated depreciation and impairment.
Depreciation
Depreciation is performed on a straight-line basis over the asset’s estimated useful life, since it reflects the expected usage of the asset’s future economic benefits. The depreciation is recognized as an expense in the income statement.
|
| |
Property, plant and equipment | Useful life |
Leasehold improvements | 10 years |
Equipment, tools, fixtures and fittings | 3-5 years |
Impairment - Property, plant, equipment and intangible assets
At every closing date, an assessment is made concerning whether or not there is an indication that an asset’s value is lower than its carrying value. If an indication exists, the recoverable amount of the asset is calculated in order to identify a potential impairment charge.
The recoverable value is the highest of the fair value less cost to sell and the value in use. When calculating the value in use, future expected cash flows that the asset is expected to generate in the ongoing operations and when disposed of are discounted to a net present value. The discount rate before tax is used as it reflects current market assessment of the time value of money and the risks attributable to the asset. An impairment loss is reversed only to the extent that the asset´s carrying amount does not exceed the carrying amount that would have been determined, net of depreciation or amortization, if no impairment loss had been recognized.
Zenuity AB
Corporate identity number 559073-6871
Leases
Lessee
All lease contracts are defined as operating lease contracts.
Lease payments, including up-front payments but excluding expenditures for services, such as insurance and maintenance, are expensed on a straight-line basis over the lease term.
Basis of consolidation
Group companies are consolidated as from the date the Group obtains control over a subsidiary. The consolidation is prepared according to the acquisition method.
Any Intra-Group transactions have been eliminated.
Foreign currencies
Items in foreign currencies
Monetary items denominated in foreign currencies are translated at the exchange rate at the reporting date. Non-monetary items that are measured at their fair value in a foreign currency are translated at the exchange rate at the time of the fair value measurement. Non-monetary items that are measured based on historical cost in a foreign currency are translated at the exchange rate at the date of the transaction.
Foreign currency differences are recognized in the income statement.
Foreign operations
The assets and liabilities of foreign operations are translated from the foreign operation’s functional currency to the Group’s reporting currency, SEK, using the exchange rates prevailing on the balance sheet date.
Revenues and expenses of foreign operations are translated into SEK using the average exchange rates that approximates the exchange rates prevailing at each transaction date. Translation differences are recognized in a separate equity component.
Financial assets and liabilities
Financial assets and liabilities are accounted for in accordance with BFNAR 2012:1, chapter 11 - Financial instruments measured at cost.
Accounting in and derecognition from the balance sheet
A financial asset or financial liability is recognized in the balance sheet when the Group becomes a part of the financial instrument’s contractual agreement. A financial asset is derecognised when the contractual right to the cash flow from the asset has expired or been settled. The same is applicable when the risks and benefits that are associated with the holdings in all material aspects are transferred to another party and the Group does not possess any control over the financial asset. A financial liability is derecognised when the contractual obligation has been fulfilled or expired.
Measurement of financial assets
Financial assets are initially measured at cost, including any transaction costs that are directly attributable to the acquisition.
Subsequent to initial recognition, financial current assets are measured at the lower of cost and net realizable value.
Accounts receivable and other receivables are measured individually at the amount expected to be received.
Subsequent to initial recognition, financial non-current assets are measured at cost adjusted for potential impairment losses.
Zenuity AB
Corporate identity number 559073-6871
Employee benefits
Post-employment benefits
Classification
Plans for post-employment benefits are classified according to simplified rules.
For defined contribution plans, determined fees are paid to another Company, normally an insurance Company, and the Group does not have any other obligation to the employee when the fee is paid. The size of the employee’s post-employment benefits is dependent on the fees that have been paid and the return on the accumulated fees.
For defined benefit plans, the Group has an obligation to provide the benefits agreed upon to current and earlier employees. The Group carries, in all material aspects, the risk for the benefits to be higher than expected (actuarial risk) and the risk for the return on the assets to deviate from the expectations (investment risk). Investment risk also exists if the assets are transferred to another Company.
Defined contribution plans
Obligations for contributions (fees) to defined contribution plans are expensed as the related service is provided. Prepaid contributions are recognized as an asset to the extent that a cash refund or a reduction in the future payments are available.
Defined benefit plans
The Group has chosen to apply the simplifying rules presented in BFNAR 2012:1.
In Sweden the Group has post-employment defined benefit obligations for personnel which are insured by Alecta. Alecta is the largest Swedish life insurance Company and safeguards the majority of the private sector’s defined benefit pension plans, i.e., the ITP-plan. Alecta is not able to provide specific information for each customer’s obligations and fair value of related assets which is necessary information in order to account for the obligations in accordance with the rules for defined benefit plans. Therefore, all obligations relating to the Swedish ITP-plan are accounted for as defined contribution plans in accordance with the rules for multi-employer plans.
Plans for which pension premiums are paid are accounted for as defined contribution plans, which implies that the fees are expensed in the income statement.
Other long-term employee benefits
Liabilities regarding other long-term employee benefits are recognized at the present value of the obligations at the balance sheet date.
Termination benefits
Termination benefits, to the extent the employee does not provide the Group with any future services, are only recognised as a liability and expense when the Group has a legal or informal obligation to either
a) terminate an employee’s or group of employees’ employments before the normal time for the employment’s termination, or
b) give termination benefits through offerings that encourage voluntary termination.
Termination benefits are accounted for as a provision at the earlier of the date
a) when the Group can no longer withdraw the offer of those benefits; and
b) when the entity recognizes costs for a restructuring that involves the payment of termination benefits.
Zenuity AB
Corporate identity number 559073-6871
Tax
Tax expense for the year in the income statement consists of current tax and deferred tax. Current tax is the income tax for the current financial year, which refers to the year’s taxable profit and the part of earlier financial years’ income tax that have not been recognized. Deferred tax is recognized based on temporary differences between the carrying amounts of assets and liabilities and their value for tax purposes.
Deferred tax assets for unused tax losses are recognized to the extent it is probable that future taxable profits will be available to use the tax losses for.
Revenue
The inflow of economic benefits that the Group receives or will receive on its own behalf are recognized as revenue. Revenue is measured at the fair value of the consideration received or receivable.
Service agreements and construction contract – continuous
Revenue from engagements on continuous contracts are recognized as revenue in line with work performed and services delivered or consumed.
All revenue refers to services provided to the owners regarding engineering hours on the owners projects.
Shareholders’ contribution
Shareholders’ contribution that has been made without issued shares or other received equity instruments in exchange is recognized in the balance sheet as an increase of the investments’ carrying amount.
Shareholders’ contribution that has been received without issued shares or any other equity instruments in exchange are recognized directly in equity.
|
| |
Note 2 | Estimates and judgements |
At each reporting date the Group assesses whether there is an indication that intangible assets may be impaired. Management has performed an impairment test without identifying any fixed assets that may be impaired. As the Group was established during 2017 the risk of impaired intangible assets recognized during the establishment is low.
|
| |
Note 3 | Other operating income |
|
| | | | | |
| | 1 January 2018- | | 18 April 2017- |
| | 31 December 2018 | | 31 December 2017 |
| Exchange rate gains on operating receivables/liabilities | 2,571 |
| | 2,303 |
|
| Rental income | 6,920 |
| | — |
|
| Other | 14,935 |
| | 5,987 |
|
| | 24,426 |
| | 8,290 |
|
|
| |
Note 4 | Employees, personnel costs and remunerations to Board of Directors |
Average number of employees
|
| | | | | | | |
| | | 1 January 2018- | | whereof | | 18 April 2017- |
| | | 31 December 2018 | | men | | 31 December 2017 |
| Sweden | | 349 | | 81 | % | | 206 |
| Germany | | 80 | | 84 | % | | 49 |
| US | | 65 | | 84 | % | | 41 |
| Total | | 494 | | 82 | % | | 296 |
Disclosure of gender distribution in the management of the Group
|
| | | | | |
| | 31 December 2018
Proportion of women | | 31 December 2017
Proportion of women |
| | | | |
| Board of Directors | — | % | | — | % |
| Other senior management | 25 | % | | 27 | % |
Zenuity AB
Corporate identity number 559073-6871
Salaries, other remunerations and social security expenses, including pension expenses
|
| | | | | |
| | 1 January 2018- | | 18 April 2017- |
| | 31 December 2018 | | 31 December 2017 |
| Salaries and remunerations | 358,952 |
| | 146,865 |
|
| Social security expenses | 122,578 |
| | 56,794 |
|
(of that pension expenses)1 | (32,371 | ) | | (13,329 | ) |
1Of the Company’s pension expenses 589 TSEK (356 TSEK) relate to the Managing Director.
|
| |
Note 5 | Depreciation, amortisation and impairment of property, plant and equipment and intangible assets |
|
| | | | | |
| | 1 January 2018- | | 18 April 2017- |
| | 31 December 2018 | | 31 December 2017 |
| Depreciation and amortisation divided by asset | | | |
| Capitalized expenditures for software and similar | (3,947 | ) | | (3,790 | ) |
| Concessions, patents, licenses, trademarks | (48,117 | ) | | (26,889 | ) |
| Leasehold improvements | (380 | ) | | (160 | ) |
| Equipment, plant and machinery | (39,802 | ) | | (16,092 | ) |
| | (92,246 | ) | | (46,931 | ) |
|
| |
Note 6 | Other operating expenses |
|
| | | | | |
| | 1 January 2018- | | 18 April 2017- |
| | 31 December 2018 | | 31 December 2017 |
| Exchange rate losses on operating receivables/liabilities | (7,627 | ) | | (2,607 | ) |
| Capital losses | (163 | ) | | (45 | ) |
| | (7,790 | ) | | (2,652 | ) |
Lease contracts where the Group is the lessee
|
| | | | | |
| | 31 December 2018 | | 31 December 2017 |
| Future minimum lease payments regarding non-cancellable operating lease contracts | | | |
| Within one year | 34,616 |
| | 49,700 |
|
| Between one and five years | 121,895 |
| | 156,600 |
|
| Later than five years | 135,353 |
| | 147,972 |
|
| | 291,864 |
| | 354,272 |
|
| | | | |
| | 1 January 2018- | | 18 April 2017- |
| | 31 December 2018 | | 31 December 2017 |
| The financial year’s recognized lease expenses | 33,916 |
| | 17,118 |
|
The main part of the lease expense refer to expenses regarding office rent.
|
| |
Note 8 | Interest income and similar profit/loss items |
|
| | | | | |
| | 1 January 2018- | | 18 April 2017- |
| | 31 December 2018 | | 31 December 2017 |
| Interest income, other | 4,326 |
| | 1,970 |
|
| | 4,326 |
| | 1,970 |
|
|
| |
Note 9 | Interest expense and similar profit/loss items |
|
| | | | | |
| | 1 January 2018- | | 18 April 2017- |
| | 31 December 2018 | | 31 December 2017 |
| Interest expense, other | (3,432 | ) | | (2,597 | ) |
| | (3,432 | ) | | (2,597 | ) |
Zenuity AB
Corporate identity number 559073-6871
|
| |
Note 10 | Tax expense for the year |
|
| | | | | |
| | 1 January 2018- | | 18 April 2017- |
| | 31 December 2018 | | 31 December 2017 |
| Current tax expense | (4,417 | ) | | (3,294 | ) |
| | (4,417 | ) | | (3,294 | ) |
Reconciliation of effective tax rate |
| | | | | | | | | |
| | 1 January 2018- | | 18 April 2017- |
| | 31 December 2018 | | 31 December 2017 |
| | Percent | Amount | | Percent | Amount |
| Loss before tax | | (1,081,608 | ) | | | (525,290 | ) |
| Tax according to current tax rate for the parent Company | 22 | % | 237,954 |
| | 22 | % | 115,564 |
|
| Non-deductible depreciation | (0.9 | )% | (10,244 | ) | | (1.3 | )% | (6,865 | ) |
| Other non-deductible depreciation | — | % | (171 | ) | | — | % | — |
|
| Increase of loss carry-forward without corresponding recognized deferred tax | (21.4 | )% | (231,484 | ) | | (21.1 | )% | (110,810 | ) |
| Effect due to other tax rates and tax regulations | — | % | (472 | ) | | (0.2 | )% | (1,183 | ) |
| Reported effective tax | (0.4 | )% | (4,417 | ) | | (0.6 | )% | (3,294 | ) |
|
| |
Note 11 | Capitalized expenditures for software and similar |
|
| | | | | |
| | 31 December 2018 | | 31 December 2017 |
| Accumulated acquisition costs | | | |
| At the beginning of the year | 27,479 |
| | — |
|
| Contribution in kind | — |
| | 16,068 |
|
| Additions | 850 |
| | 11,833 |
|
| Reclassifications | (4,402 | ) | | — |
|
| Translation differences during the year | 306 |
| | (422 | ) |
| At the end of the year | 24,233 |
| | 27,479 |
|
| | | | |
| Accumulated amortization | | | |
| At the beginning of the year | (3,757 | ) | | — |
|
| Reclassifications | 1,946 |
| | — |
|
| Amortization during the year | (3,947 | ) | | (3,790 | ) |
| Translation differences during the year | 15 |
| | 33 |
|
| At the end of the year | (5,743 | ) | | (3,757 | ) |
| Carrying amount at the end of the year | 18,490 |
| | 23,722 |
|
|
| |
Note 12 | Concessions, patents, licenses, trademarks and similar rights |
|
| | | | | |
| | 31 December 2018 | | 31 December 2017 |
| Accumulated acquisition costs | | | |
| At the beginning of the year | 283,059 |
| | — |
|
| Contribution in kind | — |
| | 276,356 |
|
| Additions | 35,603 |
| | 6,702 |
|
| Reclassifications | 4,519 |
| | — |
|
| Translation differences during the year | 2 |
| | 1 |
|
| At the end of the year | 323,183 |
| | 283,059 |
|
| | | | |
| Accumulated amortization | | | |
| At the beginning of the year | (26,888 | ) | | — |
|
| Reclassifications | (2,151 | ) | | — |
|
| Amortization during the year | (48,117 | ) | | (26,888 | ) |
| Translation differences during the year | (51 | ) | | — |
|
| At the end of the year | (77,207 | ) | | (26,888 | ) |
| Carrying amount at the end of the year | 245,976 |
| | 256,171 |
|
Zenuity AB
Corporate identity number 559073-6871
|
| |
Note 13 | Leasehold improvements |
|
| | | | | |
| | 31 December 2018 | | 31 December 2017 |
| Accumulated acquisition costs | | | |
| At the beginning of the year | 2,108 |
| | — |
|
| Contribution in kind | — |
| | 710 |
|
| Additions | 1,674 |
| | 1,459 |
|
| Translation differences during the year | 60 |
| | (61 | ) |
| At the end of the year | 3,842 |
| | 2,108 |
|
| Accumulated depreciation | | | |
| At the beginning of the year | (158 | ) | | — |
|
| Depreciation during the year | (380 | ) | | (160 | ) |
| Translation differences during the year | (15 | ) | | 2 |
|
| At the end of the year | (553 | ) | | (158 | ) |
| | | | |
| Carrying amount at the end of the year | 3,290 |
| | 1,950 |
|
|
| |
Note 14 | Equipment, plant and machinery |
|
| | | | | |
| | 31 December 2018 | | 31 December 2017 |
| Accumulated acquisition costs | | | |
| At the beginning of the year | 121,388 |
| | — |
|
| Contribution in kind | — |
| | 36,456 |
|
| Additions | 75,428 |
| | 85,930 |
|
| Disposals | (619 | ) | | (211 | ) |
| Reclassifications | (117 | ) | | — |
|
| Translation differences during the year | 1,746 |
| | (787 | ) |
| At the end of the year | 197,826 |
| | 121,388 |
|
| | | | |
| Accumulated depreciation | | | |
| At the beginning of the year | (16,018 | ) | | — |
|
| Reversed depreciation on disposals | 164 |
| | 13 |
|
| Reclassifications | 20 |
| | — |
|
| Depreciation during the year | (39,802 | ) | | (16,092 | ) |
| Translation differences during the year | (640 | ) | | 61 |
|
| At the end of the year | (56,276 | ) | | (16,018 | ) |
| | | | |
| Carrying amount at the end of the year | 141,550 |
| | 105,370 |
|
|
| |
Note 15 | Participation in group companies |
|
| | | | | |
| | 31 December 2018 | | 31 December 2017 |
| Accumulated acquisition costs | | | |
| At the beginning of the year | 103,888 |
| | — |
|
| Acquisitions | 1,400 |
| | 103,888 |
|
| At the end of the year | 105,288 |
| | 103,888 |
|
Specification of the Parent Company’s participation in group companies
|
| | | | | | | | | | | | | | | |
| | | 31 December 2018 |
| Subsidiary / Corp. Id. No. / Registered office | | Number of shares | | Share in % i) | | Carrying amount | | Equity | | Profit/loss for the year |
| Zenuity GmbH, HRB 228080, Unterschleissheim | | 25,000 |
| | 100.0 |
| | 48,068 |
| | 61,649 |
| | 6,305 |
|
| Zenuity Inc, 81-4350409, Delaware | | 100 |
| | 100.0 |
| | 55,820 |
| | 65,449 |
| | 6,886 |
|
| Zenuity Software Technology Co. Ltd, Shanghai | | — |
| | 100.0 |
| | 1,400 |
| | 1,414 |
| | 29 |
|
Acquisitions during 2017 and 2018
Zenuity GmbH and Zenuity Inc. were founded during 2017 and were contributed to Zenuity AB via contribution in kind from the joint owners. Zenuity AB made during 2017 a capital contribution to Zenuity GmbH of 47,829 TSEK and a capital contribution to Zenuity Inc. of 55,820 TSEK. Zenuity Software Technology Co. Ltd was founded in 2018 and Zenuity AB made during 2018 a capital contribution to Zenuity Software Technology Co. Ltd of 1,400 TSEK.
Zenuity AB
Corporate identity number 559073-6871
|
| | | | | | | | |
| | | | 2018-12-31 | | |
| | Deferred | | Deferred | | Change |
| | tax asset | | tax liability | | Net |
| Significant temporary differences | | | | | |
| Capitalized expenditures for developments | — |
| | 1,743 |
| | -1,743 |
|
| Concessions, patents, licenses | — |
| | 44,007 |
| | -44,007 |
|
| Equipment | — |
| | 5,384 |
| | -5,384 |
|
| Tax-rebate related to acquisition of assets | 49,611 |
| | — |
| | 49,611 |
|
| Deferred tax asset/liability | 49,611 |
| | 51,134 |
| | (1,523 | ) |
| | | | 2018-12-31 | | |
| | Carrying | | | | Temporary |
| | amount | | Tax base | | difference |
| Significant temporary differences attributable to deferred tax asset | | | | | |
| Tax-rebate related to acquisition of assets | 49,611 |
| | — |
| | -49,611 |
|
| | 49,611 |
| | — |
| | -49,611 |
|
| Significant temporary differences attributable to deferred tax liability | | | | | |
| Capitalized expenditures for developments | 8,328 |
| | — |
| | 8,328 |
|
| Concessions, patents, licenses | 210,557 |
| | — |
| | 210,557 |
|
| Equipment | 25,568 |
| | — |
| | 25,568 |
|
| | 244,453 |
| | — |
| | 244,453 |
|
|
| | | | | | | | |
| | | | 2017-12-31 | | |
| | Deferred | | Deferred | | |
| | tax asset | | tax liability | | Net |
| Significant temporary differences | | | | | |
| Capitalized expenditures for developments | — |
| | 2,182 |
| | -2,182 |
|
| Concessions, patents, licenses | — |
| | 55,009 |
| | -55,009 |
|
| Equipment | — |
| | 5,238 |
| | -5,238 |
|
| Tax-rebate related to acquisition of assets | 62,429 |
| | — |
| | 62,429 |
|
| Deferred tax asset/liability | 62,429 |
| | 62,429 |
| | — |
|
| | | | |
| | | | 2017-12-31 | | |
| | Carrying | | | | Temporary |
| | amount | | Tax base | | difference |
| Significant temporary differences attributable to deferred tax asset | | | | | |
| Tax-rebate related to acquisition of assets | 62,429 |
| | — |
| | -62,429 |
|
| | 62,429 |
| | — |
| | -62,429 |
|
| Significant temporary differences attributable to deferred tax liability | | | | | |
| Capitalized expenditures for developments | 9,919 |
| | — |
| | 9,919 |
|
| Concessions, patents, licenses | 250,037 |
| | — |
| | 250,037 |
|
| Equipment | 23,811 |
| | — |
| | 23,811 |
|
| | 283,767 |
| | — |
| | 283,767 |
|
Taxable loss carry-forward amounts to 1,555,605 TSEK (503,683 TSEK).
|
| |
Note 17 | Other long-term receivables |
|
| | | | | |
| | 31 December 2018 | | 31 December 2017 |
| Accumulated acquisition costs | | | |
| At the beginning of the year | 8,520 |
| | — |
|
| Paid rental deposit | 7,409 |
| | 8,520 |
|
| Repaid rental deposit | (671 | ) | | — |
|
| Translation differences during the year | 121 |
| | — |
|
| At the end of the year | 15,379 |
| | 8,520 |
|
| Carrying amount at the end of the year | 15,379 |
| | 8,520 |
|
|
| |
Note 18 | Prepaid expenses and accrued income |
|
| | | | | |
| | 31 December 2018 | | 31 December 2017 |
| Prepaid services according to supplier agreements | 92,226 |
| | 73,243 |
|
| Prepaid rent | 5,782 |
| | 5,253 |
|
| Accrued income | 5,156 |
| | 4,105 |
|
| Other items | 1,092 |
| | 11,336 |
|
| | 104,256 |
| | 93,937 |
|
|
| |
Note 19 | Number of shares and quotient value |
|
| | | | | |
| | 31 December 2018 | | 31 December 2017 |
| Ordinary shares: | | | |
| Number of shares | 500,000 |
| | 500,000 |
|
| Quotient value | 1 |
| | 1 |
|
|
| |
Note 20 | Accrued expenses and deferred income |
|
| | | | | |
| | 31 December 2018 | | 31 December 2017 |
| Accrued personnel expenses | 62,410 |
| | 32,631 |
|
| Accrued consultant expenses | 14,249 |
| | 14,447 |
|
| Prepaid revenue | 5,801 |
| | 4,498 |
|
| Other items | 7,194 |
| | 18,365 |
|
| | 89,654 |
| | 69,941 |
|
|
| | | | | |
| | 31 December 2018 | | 31 December 2017 |
| The following sub-components are included in cash equivalents: | | | |
| Bank balance | 498,020 |
| | 384,136 |
|
| | 498,020 |
| | 384,136 |
|
Zenuity AB
Corporate identity number 559073-6871
|
| |
Note 22 | Other disclosures to the cash flow statement |
Adjustments for items not included in the cash flow etc.
|
| | | | | |
| | 1 January 2018- | | 18 April 2017- |
| | 31 December 2018 | | 31 December 2017 |
| Depreciation and amortization | 92,246 |
| | 46,931 |
|
| Unrealized exchange rate differences | 678 |
| | (1,867 | ) |
| Capital gain/loss on sale of non-current assets | 137 |
| | - |
|
| | 93,061 |
| | 45 064 |
|
Contribution in kind of subsidiary/assets, net liquid affect |
| | | | | |
| 31 December 2018 | | 31 December 2017 |
Intangible assets | — |
| | 292,425 |
|
Property, plant and equipment | — |
| | 37,166 |
|
Financial assets | — |
| | 239 |
|
Tax-rebate related to acquisition of assets | — |
| | 69,293 |
|
Total assets | — |
| | 399,123 |
|
Deferred tax liability | — |
| | 69,293 |
|
Operational liabilities | — |
| | 10,088 |
|
Total provisions and liabilities | — |
| | 79,381 |
|
Consideration | — |
| | 319,742 |
|
Deductible: Non-cash issue | — |
| | (319,503 | ) |
Effect on cash and cash balances | — |
| | 239 |
|
Zenuity AB was formed via contribution in kind at a fair value of 319,742 TSEK and a capital contribution of 1,000,555 TSEK in cash from the joint owners.
See further Note 23 for details regarding the contributions from the owners.
|
| |
Note 23 | Information about the business, company, group and formation |
Zenuity develops software for active automotive safety and self-driving vehicles. Zenuity started during 2017 but the Group originates from the safety leaders of the automotive industry and builds on robust industrial automotive solutions. Zenuity’s engineers have extensive experience and are now developing modular platforms for complete ADAS and AD systems and the combination of scalability and completeness allows for fast application cross vehicle variants and vehicle lines.
Parent Company information
Zenuity AB, Corp ID no 559073-6871, was created and registered on August 24, 2016. The Company changed name to Zenuity AB on December 7, 2016. The Company’s board of directors is based in Göteborg, Sweden.
Owners
Zenuity AB is a joint venture owned by Veoneer Sweden AB (50 %), Corp ID no 559131-0841, and Volvo Personvagnar AB (50 %), Corp ID no 556074-3089, Göteborg. Due to that no owner holds more than 50 % of the votes, Zenuity AB is not part of any parent group.
Purchases and sales from and to owners
Of the Group’s total purchases and sales in SEK, 12 % (18 %) of the purchases and 100% (100 %) of the sales refer to owner companies.
All transactions with the owners are made at arm’s length.
For information regarding the contributions from the owners, see separate section below.
Information regarding the formation of the Group
Zenuity AB was created and registered in 2016 but started its business on April 18, 2017 when the joint owners contributed cash of 1,000,555 TSEK and contributed in kind at a fair value of 319,742 TSEK. The contribution included intellectual property rights, software, fixed assets, personnel, personnel related debt and shares in Zenuity GmbH and Zenuity Inc. The Company has treated the contribution as an asset acquisition. Most of the contributed assets have a tax value of zero resulting in temporary differences between book values and tax values. See further Note 16 for specification of the current temporary differences. ☐
During 2018 the joint owners have each contributed cash of 600,000 TSEK.
Zenuity AB
Corporate identity number 559073-6871
|
| |
Note 24 | Reconciliation between Swedish GAAP and US GAAP |
Zenuity AB prepared its consolidated financial statements in accordance with the Swedish Annual Accounts Act and the Swedish Accounting Standards Board´s generally accepted accounting principles BFNAR 2012:1 (“K3”). The accounting policies are further described in the Note 1 Accounting principles.
Swedish GAAP as applied by Zenuity is based on IFRS for SMEs but with minor differences.
As described in Note 1 Research and development, Zenuity applies a policy where all internal development costs are expensed when incurred. Therefore, there is no US GAAP adjustment as the costs would also be expensed under US GAAP.
Below we present a reconciliation describing the main differences between Swedish GAAP and US GAAP for Zenuity AB consolidated financial statements.
|
| | | | | |
| | 1 January 2018- | | 18 April 2017- |
| SEK million | 31 December 2018 | | 31 December 2017 |
| NET LOSS BASED ON SWEDISH GAAP | (1,086.0 | ) | | (528.6 | ) |
| Reversal of amortization of Tax Rebate Asset | 12.8 |
| | 6.9 |
|
| | | | |
| NET LOSS BASED ON US GAAP | (1,073.2 | ) | | (521.7 | ) |
| | | | |
| SEK million | 31 December 2018 | | 31 December 2018 |
| SHAREHOLDERS’ EQUITY BASED ON SWEDISH GAAP | 910.1 |
| | 788.6 |
|
| Reversal of amortization of Tax Rebate Asset at the beginning of the year | 6.9 |
| | - |
|
| Reversal of amortization of Tax Rebate Asset during the year | 12.8 |
| | 6.9 |
|
| Goodwill | 924.6 |
| | 924.6 |
|
| SHAREHOLDERS’ EQUITY BASED ON US GAAP | 1,854.4 |
| | 1,713.2 |
|
Zenuity AB
Corporate identity number 559073-6871
Goodwill and reversal of Tax Rebate Asset
Under Swedish GAAP the accounting treatment for formation of a joint venture is not explicitly regulated, and there is
room for judgment. Zenuity management assessed that the contributions from the owners were contributions of assets that did not comprise a business under the Swedish GAAP definition of a business.
Certain assets (IP, tools and equipment and software) contributed by Volvo Cars and Autoliv had a tax value of zero. Since there were differences between carrying amounts and tax values, temporary differences were identified and as a result there was a deferred tax liability and a tax rebate asset recorded. This asset is being amortized over 5-7 years, corresponding to the dissolvement of deferred tax liability.
Under US GAAP, management concluded that the assets and employees contributed to the JV constituted a business as defined in ASC 805. Management assessed two general approaches a joint venture might consider when recognizing those assets: (1) a fair value approach or (2) a carryover basis approach. Management determined that the fair value approach is the most appropriate as the contributing companies are not related parties and that the fair value is determinable as a valuation was performed in connection with the contributions.
There may be different approaches to determine the fair value. Management determined that a “Stand alone entity view” approach was appropriate when determine fair value. Under this approach the value of the consideration transferred equals the aggregate fair value of the joint venture immediately after formation. Management used a discounted cash flow analysis to calculate the fair value of Zenuity.
The differences between Swedish GAAP and US GAAP are: the Tax Rebate Asset is derecognized under US GAAP as an adjustment to Goodwill and Goodwill is established as the transaction meets the definition of a business under US GAAP. The amortization of the Tax Asset Rebate of SEK 12.8 (6.9) million recorded under Swedish GAAP during 2018 is reversed. As per December 31 2018 accumulated amortization of Tax Rebate Asset amounts to SEK 19.7 (6.9) million. Further, an additional goodwill of SEK 924.6 million was recognized under US GAAP (not recognized under Swedish GAAP) as the difference between the fair value of the individual assets and liabilities contributed by the owners and the aggregate fair value of the joint venture at formation which was estimated to be USD 250 million.
Zenuity AB
Corporate identity number 559073-6871
The company has evaluated subsequent events through 22 February 2019, the date on when financial statements were issued. No subsequent events have occurred.