| Delaware | 82-3720890 | |||||||
| (State or other jurisdiction of | (I.R.S. Employer | |||||||
| incorporation or organization) | Identification No.) | |||||||
| Klarabergsviadukten 70, Section C6 | ||||||||
| Box 13089, | SE- 103 02 | |||||||
| Stockholm, | ||||||||
| Sweden | ||||||||
| +46 | 8 527 762 00 | |||||||||||||||||||||||||
| (Registrant’s telephone number, including area code) | ||||||||||||||||||||||||||
| Securities registered pursuant to Section 12(b) of the Act: | ||||||||||||||||||||||||||
Title of each class: | Trading Symbol: | Name of each exchange on which registered: | ||||||
| Common Stock, par value $1.00 per share | VNE | New York Stock Exchange | ||||||
Indicate by check mark if the registrant is a well-known seasoned issuer, as defined in Rule 405 of the Securities Act. Yes: ý ☒ No: ¨☐
Indicate by check mark if the registrant is not required to file reports pursuant to Section 13 or Section 15(d) of the Exchange Act. Yes: ¨ ☐ No: ý☒
Indicate by check mark whether the registrant (1) has filed all reports required to be filed by Section 13 or 15 (d) of the Securities Exchange Act of 1934 during the preceding 12 months (or for such shorter period that the registrant was required to file such reports) and (2) has been subject to such filing requirements for the past 90 days. Yes: ý ☒ No: ¨☐
Indicate by check mark whether the registrant has submitted electronically, every Interactive Data File required to be submitted pursuant to Rule 405 of Regulation S-T (Section 232.405 of this chapter) during the preceding 12 months (or for such shorter period that the registrant was required to submit such files). Yes: ý ☒ No: ¨☐
Indicate by check mark whether the registrant is a large accelerated filer, an accelerated filer, a non-accelerated filer, a smaller reporting company or an emerging growth company. See definitions of “large accelerated filer,” “accelerated filer,” “smaller reporting company,” and “emerging growth company” in Rule 12b-2 of the Exchange Act
| Large accelerated filer | Accelerated filer | |||||||||||||||||||
| Non-accelerated filer | Smaller reporting company | |||||||||||||||||||
| Emerging Growth Company | ||||||||||||||||||||
If an emerging growth company, indicate by check mark if the registrant has elected not to use the extended transition period for complying with any new or revised financial accounting standards provided pursuant to Section 13(a) of the Exchange Act. ¨☐
Indicate by check mark whether the registrant is a shell company (as defined in Rule 12b-2 of the Exchange Act). Yes: ¨☐ No: ý☒
As of February 15,13, 2019, there were 87,178,772111,408,845 shares of common stock of Veoneer, Inc., par value $1.00 per share, outstanding.
Documents Incorporated by Reference
| Document | Where Incorporated | ||||
| Proxy Statement* | Part III (Items 10, 11, 12, 13 and 14) | ||||
*As stated under various Items of this Report, only certain specified portions of the registrant’s definitive Proxy Statement for the annual stockholders’ meeting to be held on May 8, 2019,6, 2020, to be dated on or around March 28, 201925, 2020 (the “2019“2020 Proxy Statement”) are incorporated by reference in this Report.
TABLE OF CONTENTS
| PART I | ||||||||
| Item 1. | ||||||||
| Item 1A. | ||||||||
| Item 1B. | ||||||||
| Item 2. | ||||||||
| Item 3. | ||||||||
| Item 4. | ||||||||
| PART II | ||||||||
| Item 5. | ||||||||
| Item 6. | ||||||||
| Item 7. | ||||||||
| Item 7A. | ||||||||
| Item 8. | ||||||||
| Item 9. | ||||||||
| Item 9A. | ||||||||
| Item 9B. | ||||||||
| PART III | ||||||||
| Item 10. | ||||||||
| Item 11. | ||||||||
| Item 12. | ||||||||
| Item 13. | ||||||||
| Item 14. | ||||||||
| PART IV | ||||||||
| Item 15. | ||||||||
| Item 16. | ||||||||
FORWARD-LOOKING STATEMENTS
This Annual Report on Form 10-K contains forward-looking statements within the meaning of the Private Securities Litigation Reform Act of 1995. All statements contained in this Annual Report on Form 10-K other than statements of historical fact, including without limitation, statements regarding management’s examination of historical operating trends and data, estimates of future sales (including estimates related to order intake), operating margin, cash flow, taxes or other future operating performance or financial results, are forward-looking statements. In some cases, you can identify these statements by forward-looking words such as “estimates,” “expects,” “anticipates,” “projects,” “plans,” “intends,” “believes,” “may,” “likely,” “might,” “would,” “should,” “could,” or the negative of these terms and other comparable terminology, although not all forward-looking statements contain such words. We have based these forward-looking statements on our current expectations and assumptions and/or data available from third parties about future events and trends that we believe may affect our financial condition, results of operations, business strategy, short-term and long-term business operations and objectives and financial needs.
New risks and uncertainties arise from time to time, and it is not possible for our management to predict all risks, nor can we assess the impact of all factors on our business or the extent to which any factor, or combination of factors, may cause actual results to differ materially from those contained in any forward-looking statements we may make. Factors that could cause actual results to differ materially from these forward-looking statements include, without limitation, the following: the cyclical nature of automotive sales and production; changes in general industry and market conditions or regional growth or decline; our ability to achieve the intended benefits from our separation from our former parent; our ability to be awarded new business or loss of business from increased competition; higher than anticipated costs and use of resources related to developing new technologies; higher raw material, energy and commodity costs; component shortages; changes in customer and consumer preferences for end products; market acceptance of our new products; dependence on and relationships with customers and suppliers; unfavorable fluctuations in currencies or interest rates among the various jurisdictions in which we operate; costs or difficulties related to the integration of any new or acquired businesses and technologies; successful integration of acquisitions and operations of joint ventures; successful implementation of strategic partnerships and collaborations; product liability, warranty and recall claims and investigations and other litigation and customer reactions thereto; higher expenses for our pension and other post-retirement benefits, including higher funding needs for our pension plans; work stoppages or other labor issues; possible adverse results of future litigation, regulatory actions or investigations or infringement claims; our ability to protect our intellectual property rights; tax assessments by governmental authorities and changes in our tax rate; dependence on key personnel; legislative or regulatory changes impacting or limiting our business; political conditions; and other risks and uncertainties identified in Item 1A -“Risk Factors” and Item 7 - “Management’s Discussion and Analysis of Financial Condition and Results of Operations” in this Form 10-K.
For any forward-looking statements contained in this Annual Report on Form 10-K or any other document, we claim the protection of the safe harbor for forward-looking statements contained in the Private Securities Litigation Reform Act of 1995, and we assume no obligation to revise or publicly release the results of any revision to these forward-looking statements, except as required by law. Given these risks and uncertainties, readers are cautioned not to place undue reliance on such forward-looking statements.
3
Part I
Item 1. Business
General
Veoneer, Inc. (“Veoneer”, the “Company” or “we”) is a Delaware corporation with its principal executive officersoffice in Stockholm, Sweden. On June 29, 2018, weVeoneer became an independent company as a result of the separation of the Electronics segment from Autoliv, Inc. (“Autoliv”). Veoneer was incorporated under the laws of Delaware in 2017 for the purpose of holding this business. The separation was completed in the form of a pro rata distribution of 100% of the outstanding shares of Common Stock of Veoneer to the stockholders of Autoliv (the “Spin-Off”). The Company functions as a holding corporation and owns two principal subsidiaries, Veoneer AB and Veoneer US, Inc.
Shares of Veoneer common stock are traded on the New York Stock Exchange under the symbol “VNE”. Swedish Depository Receipts representing shares of Veoneer common stock (“SDRs”) trade on NASDAQ Stockholm under the symbol “VNE SDB”. Our fiscal year ends on December 31.
On June 14, 2019, the Company signed agreements with Nissin Kogyo Co. Ltd., its joint venture partner in Veoneer Nissin Brake Systems ("VNBS"), providing for certain structural changes to the joint venture and the funding of VNBS.
Pursuant to the agreements, Veoneer acquired Nissin Kogyo’s interests in the US operations of VNBS, referred to as Veoneer Brake Systems ("VBS"), and VNBS transferred or licensed the VNBS technologies necessary to operate the VBS business to VBS. VBS, including the transferred or licensed technologies, is a wholly-owned Veoneer business effective on the closing date, June 28, 2019.VNBS will also provide certain transition services to VBS.
On October 30, 2019, Veoneer signed agreements (the "Definitive Agreements") to sell its 51% ownership in Veoneer Nissin Brake Japan ("VNBJ") and Veoneer Nissin Brake China ("VNBZ") entities that comprise VNBS to its joint venture partner, Nissin-Kogyo Co., Ltd., and Honda Motor Co., Ltd. The transaction was completed on February 3,
2020 under the Definitive Agreements, and the VNBS joint venture was terminated. See Note 6 "Assets held for sale" for additional information.
Business
Veoneer is a global leader in the design, development, manufacture and sale of automotive safety electronics. Our ambition is to be a leading system supplier for advanced driver assistance systems ("ADAS"), Collaborative Driving, highly automated driving ("HAD") solutions, and autonomous drive ("AD") as well as a market leader in automotive safety electronics products.
Based on our purpose of "Creating Trust in Mobility", our safety systems are designed to make driving safer and easier, more comfortable and convenient, and to intervene before a collision. Our systems currently include restraint control electronics and crash sensors for deployment of airbags and seatbelt pretensioners, active safety sensors, controllers and software for both ADAS and AD solutions and brake control systems.
Veoneer’s head office is located in Stockholm, Sweden. As of December 31, 2018,2019, Veoneer had approximately 7,300 employees7,500 associates worldwide and a total headcountassociates of approximately 8,600,8,900, including temporary personnel.
Additional information required by this Item 1 regarding developments in the Company’s business during 20182019 is contained under Item 7 in this Annual Report.
Financial Information on Segments
Veoneer reports its financial results in two segments: Electronics and Brake Systems.Systems. Our Electronics reporting segment consists of our active safetyActive Safety and restraint control systemsRestraint Control Systems product areas. Our Brake Systems reporting segment consists of our brake systemsBrake Systems product area, which are those products developed by Veoneer-Nissin Brake Systems (VNBS),VNBS, our joint venture with Nissin Kogyo the 49% owner in VNBS (a 51% owned subsidiary). and VBS.
On October 30, 2019 Veoneer announced the execution of definitive agreements to divest its 51% ownership in the remaining VNBS joint venture operations in Japan and China to Nissin Kogyo Co. Ltd. and Honda Motor Co. Ltd. On February 3, 2020,
4
Veoneer completed the divestiture of its VNBS joint venture interest. Veoneer is classifying this transaction, which was pending as of December 31, 2019, as "assets held for sale" in this Annual Report on Form 10-K, which resulted in no impairment charge.
Business Strategy
Products and Technology
Electronics Segment
We also provide restraint control systemsRestraint Control Systems such as ECUs and crash sensors for deployment of airbags and seatbelt pretensioners in the event of a collision.
Active Safety Products
Active safetySafety systems are designed to intervene before a collision to make accidents avoidable or reduce the severity of the crash, in addition to making driving easier as well as more comfortable and convenient.
We develop radar and vision technologies (including Veoneer’s internally developed vision algorithms for both mono-and-stereomono, stereo and thermal vision) that monitor the environment around the vehicle with features thatwhich can adjust engine output and steering or braking to avoid accidents. The goal of active safetyActive Safety technologies is to provide early warnings to alert drivers to take timely and appropriate action or trigger intelligent systems that affect the vehicle’s motion using braking and steering to avoid accidents, as well as to increase the comfort and convenience of driving. Active safetySafety systems can also improve the effectiveness of the restraint control systems which combine hazard information with traditional crash-sensing methods.
Active safetySafety functions include: Autonomous Emergency Braking (AEB), which brakes a vehicle autonomously; Adaptive Cruise Control (ACC), which keeps and adjusts the vehicle’s pre-set speed to keep a pre-set distance from vehicles ahead; Traffic Jam Assist and Highway Assist, which takes control of braking and acceleration in slow-moving traffic and highway speed, respectively; Forward Collision Warning; Blind Spot Detection; Rear Cross-Traffic Assist; Lane Departure Warning; Lane Centering Assist, Traffic Sign Detection; Light Source Recognition; Driver Monitoring for attention and drowsiness; Vehicle-to-Vehicle and Vehicle-to-Infrastructure communication; and Night Driving Assist.
Key systems usedincluded in the active safety functions and the Company’s capabilities,Company's Active Safety portfolio, either currently provided to the market or under activeproduct development, include:
Vision Systems: Vision systems are critical to driver assistance and safety functions. They support the driver in collision avoidance and mitigating the crash severity in the event of an accident. Using our internally developed software algorithms, the camera looks at the road ahead for other vehicles, road signs, lane markings and other key elementsroad attributes and provides information and warnings if the cara vehicle is approaching a potentially hazardous traffic situation. Vision systems are used in applications such as road-sign recognition, lane detection along with forward and pedestrian collision warnings. We offer forward looking mono- and stereo-vision systems:
•The mono-vision system is a forward-looking camera that is mounted behind the windshield in front of the rear-view mirror. Images are interpreted by algorithms that help identify objects and assist the driver with warnings or actuations such as lane keeping and automatic braking of the vehicle. Mono-vision systems provide a significant level of accident reductions targeting 5-star safety levels as well as driver comfort and convenience features like Adaptive Cruise Control.
5
•Stereo-vision system technology goes a step further and measures the entire driving environment in 3D.a 3D view. The system is capable of acting on any object without classification. Stereo-vision also provides free-space recognition, and road surface measurement down to millimeter level accuracy, which is important to original equipment manufacturers ("OEMs") to improve safety and comfort and provides depth perception for distance calculations due to the 3D capability.
Next generation vision systems and algorithms such as our fourth-generation mono-mono and stereo-cameras, which are currently under development and planned forwent into initial production in 2019, will support AD and European New Car Assessment Program (“NCAP”) 2020. Fifth generation vision systems, which are in the early planningdevelopment stages, and planned for production in 2022 will offer more than five times higher image resolution than the current generations of camera solutions, as well as offer multiple camera solutions. Selected customers where Veoneer has been awarded and sourced business for our vision systems include Geely, Mercedes-Benz, Volvo Cars, two major global OEMs, an Asian based OEM and one additional Asiana local Chinese OEM.
Radar Systems: Radar systems capture and analyze driving conditions and alert the driver to potentially dangerous events,situations, and can take control of the vehicle if the driver does not take timely, appropriate action. Radar systems are used in functions such as adaptive cruise controlACC and automatic emergency braking.AEB. Radar is important because it provides superior performance in poor weather conditions such as rain and fog and other situations with limited or poor visibility.visibility from the camera system. Fused with vision systems, higher levels of functional safety are possible, allowing a wider range of operating conditions. Our radar sensor portfolio includes: 25GHz ultra-wide band radar, 24 GHz narrow band radar, and 77GHz front and rear corner, and front center radars. Selected customers for our radar systems include Fiat Chrysler Automobiles (FCA), GAC, Geely, General MotorMotors (GM), Honda, Mercedes-Benz, Renault Nissan Mitsubishi, and Volvo Cars. Veoneer has been awarded and sourced business with 12 OEM customers.
ADAS Central Compute: ADAS ECUs: ADAS electronic control units ("ECU") are emerging products within the active safetyActive Safety market and are precursors to the autonomous vehicles of the future. Today, a limited number of OEMs are using separate ADAS ECUs, as most of the ADAS functionalities can be done in an integrated sensor-ECU.ECU. With future ADAS and AD systems increasing in complexity, the need for multi-sensor solutions and subsequently higher processing capabilities is expected to lead to more OEMs installing separate ADAS ECUs in their vehicles.
In the ADAS ECU, large quantities of data from the vehicle’s different sensors is validatedare analyzed and analyzed.validated. Advanced algorithms can then act in real time to warn the driver and control the vehicle throttle, braking and steering torque to follow a desired trajectory for fully automated driving.Automated Driving. We believe one of the biggest challenges self-driving cars will have to overcome is being able to react to the randomness of traffic flow, other drivers, and the fact that no two driving situations are ever the same.
vehicles are 50 to 100 times more intensiveextensive than the most advanced vehicle today. Meeting these demands will be thea major challenge in developing the next generation of ADAS ECUs, including data processing.
In 2016, we launched the world’s first ADAS ECU for mass production in Mercedes-Benz’s new E-class. We provide a similar solution to the updated Mercedes-Benz S-class.S-class, and have received new business awards with three additional customers launching over the next 18 months.
Night Vision Systems: Using passive infrared technology (thermal sensing), our night vision system identifies if pedestrians, animals or other certain other hazards are present in the danger zone of a vehicle, and alerts the driver, driver, particularly in nighttime, or other “dark”“challenging” conditions. Our night vision system is the key component in “dynamic light spot” pedestrian illumination system which allows more time for drivers to identify potential hazards at distances beyond normal head-lights. Our fourth-generation night vision system, expected inlaunching during 2020, will have improved field of view and detection distances, reduction in size, weight and cost, featuring enhanced algorithms for pedestrian, animal and vehicle detection as well as supporting night time automatic emergency brakingAEB solutions. Selected customers of the night vision system include Audi, BMW, GM, Mercedes-Benz, PSA, Porsche and Volkswagen.
Safety Domain ECUs: As activeActive and passive safetyPassive Safety features become more advanced, having dedicated ECUs for the various features increases the complexity, weight and cost of the vehicle architecture. The Safety Domain ECU replaces multiple dedicated ECUs across the vehicle by combining all activeActive and passive safetyPassive Safety ECUs into one powerful domain controller. This requires a highly powerful processor which is able to execute simultaneous computing. Techniques such as virtualization enable the safe and secure separation of computing tasks, as the other controllers are not affected if one virtual controller fails.
6
LiDAR: In 2017, we agreed to collaborate with Velodyne to expand and commercialize our LiDAR development. LiDAR is expected to be an important sensor technology for the future development of AD systems. Under the current non-exclusive agreement with Velodyne, Veoneer will act as the Tier-1 supplier to the OEMs for the Velodyne LiDAR sensors. WeVeoneer will provide project management services, product validation and verification, capabilities and system/interface packaging in supplyingand manufacturing to produce automotive-grade LiDAR systems to the OEMs. Our LiDAR product roadmap includes first providing it to test fleets of the OEMs and the robo-taxis market followed by developing a solid-state design for the consumer vehicle market. Building on this relationship, on January 7, 2019 the Company announced entry into a license and supply agreement with Velodyne whereby Velodyne will provide Veoneer US, Inc. with materials and rights to certain Velodyne intellectual property which would enable Veoneer US, IncInc. to sell, distribute, promote, manufacture and modify, including related research and development ("R&D") certain LiDAR products based on a Velodyne-authorized reference design.
Driver Monitoring: We have been developing solutions to address driver distraction and fatigue as they relate to traditional driving situations and driver attention for hands-free driving. In 2017, we entered into an agreement with Seeing Machines to accelerate this effort. This technology is expected to be necessary to achieve a 5-star NCAP rating in Europe in 2022 as well as Level 3 autonomy solutions worldwide.worldwide and is an option to meet the EU mandate for driver monitoring systems starting in 2022. Our non-exclusive agreement with Seeing Machines to utilize their reference design and market under a license, allowsprovides Veoneer the Company the abilitycapability to build hardware and feature level solutions on top of Seeing Machines’sMachines’ world leading head pose, gaze and recognition data outputs.
RoadScape: Our RoadScapeTM product line offers highly accurate satellite positioning along with world leading dead reckoning capabilities for increased precision in highway, urban and rural areas. Building on this, our RoadScapeTM platform provides a digital representation of the road ahead that can be further enhanced through probe data in the field and cloud connectivity. Finally, addingAdding RoadScapeTM communication technology allows for vehicle-to-vehicle, infrastructure and cloud connectivity for premonition and situational awareness in ADAS and AD.
Human Machine Interaction (“HMI”): Genuine Effective two-way communication between the vehicle and driver is critical to building driver trust and enhancing the driver experience. Veoneer’s Learning Intelligent Vehicle (“LIV”) is an artificial intelligence-equipped research vehicle that can understand and respond to context. LIV uses external and internal sensing combined with complex algorithmic artificial intelligence algorithms to create a unified contextual picture of what is going on with the occupants, vehicle, driving situation and then acts and serves as a “co-pilot” to communicate with drivers and passengers. Veoneer uses LIV to learn more aboutabout: task delegation, shared control, driver-vehicle collaboration; innovatecollaboration, innovative ways to increase driver understanding of an autonomous system;system, and to continually improve the system’s understanding of its human co-travelers.
Restraint Control Systems
The restraint control systemRestraint Control System is the brain triggering a vehicle’s passive safetyPassive Safety system in a crash situation. Restraint control systemsControl Systems consist of a restraint ECU and related remote crash sensors, including acceleration and pressure sensors. The ECU’sECUs algorithms decide when a seatbelt pretensioner should be triggered and an airbag system should be deployed.
The ECU is mounted centrally in the vehicle, well protected from the environment in the event of a crash, and is supported by crash sensors mounted in the door beam, the pillarpillars between the doors, the rocker panelpanels and/or in various locations at the front and rear of the vehicle. These “satellite” crash sensors provide acceleration data to enable early and appropriate deployment of the airbags and seatbelt pretensioners within milliseconds of a vehicle crash.
The ECU also contains certain sensors that are common with the brake system. We were the first to offer this type of solution, providing savings through the reduction in multiple sensors for measuring yaw rate, and consolidating this information on the vehicle data bus. Additionally, the restraint control systemRestraint Control System is capable of recording details of what happened before and during a crash event using an Event Data Recorder (“EDR”) with the restraint control ECU.
Selected customers include FCA, Ford, Geely, GM, Great Wall, Hyundai/Kia, Jaguar Land Rover, Mazda, PSA, Renault Nissan Mitsubishi, Suzuki and Volvo Cars.
Overview of Zenuity
In addition to our two segments, we are a 50% owner of Zenuity, our joint venture with Volvo Cars to develop decision making and vehicle control software for ADAS and AD.
7
All ADAS and AD features are based on a recommended reference architecture for customers that require a system level solution. In March 2018 Zenuity was selected by Geely as supplier for Geely’s first Level 3 project, which includes an ADAS electronic control unitsECU and software, radar systems, as well as mono-vision and stereo-vision camera systems.
As of December 31, 2018,2019, Zenuity had a team of over 600approximately 720 employees and consultants, ofclose to which 88%90% are software engineers who we believe have the necessary skills to develop these technologies. We expectthe decision making and vehicle control software for ADAS and AD. Zenuity is expected to supplydeliver software to its customers with Zenuity software during 2020.
Through the Company's owninternal product capabilities and extensive partnership network, Veoneer has one of the broadest ADAS and AD product portfolio offerings in the market, which includeincludes all major sensing technologies, decision making and vehicle control software, positioning and mapping technologies and cloud solutions.
Our product portfolio has been significantly expanded over the recent years (as illustrated below) from individual hardware sensing components to a full range of key functionsfeatures and capabilitiesfunctions, as outlined below.earlier. This enables usVeoneer to address our customer needs today, and likely in the future, bywith a complete system offering the entire spectrum of ADAS and AD solutions.solutions for consumer based vehicles and specific sub-system solutions for robo-taxi applications.
Brake Systems Segment
Our Brake Systems reporting segment consists of our brake systems product area, which are those products developed by our VNBS joint venture and VBS which provides brake control and actuation systems. VNBS providesand VBS provide products for both traditional and new next generation braking systems which we see as building blocks in the actuatoractuation area towards HAD.
VNBS suppliesand VBS supply brake systems, including the brake booster,boosters, hydraulic proportioning valves and electronic control modulemodules with sensors. The control module can modulate the brake pressure applied on each wheel individually to maintain optimum braking and offers features like Electronic Stability Control (“ESC”), Anti-locking Brakes (“ABS”) and Traction Control System.System ("TCS").
For traditional brakes, a vacuum produced by Internal Combustion Engines is necessary to amplify the force applied by the driver’s foot to convert it into hydraulic pressure to decelerate the vehicle. New drivetrains, such as Electric (“EV”) and Hybrid (“HEV”), do not provide the same source of energy for boosting the brake input from the driver. Therefore, VNBS hasVBS have developed new servo-assisted and integrated brake control systems that can work independent of the type of drivetrain used.
To improve the overall efficiency of vehicles, VNBS’these new braking systems also provide the opportunity to recover brake energy using electric motors as generators to charge batteries. This contrasts with conventional braking systems where the excess kinetic energy is converted to unwanted and wasted heat by friction in the brakes.
In January 2017, the Company announced that VNBSVBS is expanding its customer base beyond its primary customer Honda, winning lifetime contract order value of more than $1 billion for our new braking system with a Detroit based OEM on a major vehicle platform. Production for this awardednew business award is currently scheduled to begin in 2020. There is no minimum purchase value associated with this awarded business. The agreement will be governed by the OEM’s general terms and conditions and Veoneer and such OEM will enter into a commercial and program agreement that will set forth the specific commercial terms and functional requirements with respect to this order. The program life cycle is estimated to be six years. We received a secondsubsequent major orderorders from the same OEM atduring 2017 and 2018 to roll-out the end of 2017.same product on additional vehicle platforms and several models. The main opportunities we see in brake systems stem from its capabilities in regenerative braking technology which works well with combustion engine vehicles but is even more suitable for HEV and EV. We see significant opportunities to expand outside the current customer base, especially in combination with our strong customer relationships and our global footprint.
8
Acquisition, Partnership and Collaboration History
Our success and comprehensive product portfolio have partly been driven by acquisitions and partnerships, both being critical elements to succeed within the multifaceted autoautomotive safety electronics industry and to remain competitive against existing and new entrants looking to entermoving into various parts of the market. These partnerships and collaborations have a strategic importance in the near and long termlong-term to develop additional autonomous driving building blocks and bring potential productsnew technologies to market in future years.
Acquisitions, and Joint Ventures and Divestitures
October 2019: Veoneer signed definitive agreements to divest its remaining 51% ownership in the VNBS joint venture. The transaction closed February 3, 2020.
June 2019: Veoneer acquired Nissin Kogyo's 49% of their ownership stake in the US operations of the VNBS joint venture (VNBA).
February 2018: Zenuity announced the acquisition of Beyonav intellectual property and trademarks, a technology services company delivering innovative location-based solutions that go beyond traditional applications of navigation technology.
November 2017: WeVeoneer acquired Fotonic, a Swedish company with expertise in LiDAR and Time of Flight cameras, building on our collaboration with Velodyne that was established in June 2017. This acquisition addsadded to our portfolio the collaboration capabilities within LiDAR sensors, leveraging on our expertise in manufacturing and validation.
April 2017: WeVeoneer launched Zenuity, a strategic 50/50 joint venture with Volvo Cars. This joint venture is an industry first, where an OEM and Tier-1 supplier, both recognized as pioneers in automotive safety, formed a company to develop ADAS software towards AD. See details above.
April 2016: WeVeoneer formed VNBS, a 51/49 joint venture with Nissin Kogyo, a Japanese supplier of both traditional and new brake systems. The joint venture is fully consolidated by Veoneer. See details above.
Partnerships, Collaborations and Supplier Agreements
January 2019: The Company Veoneer announced entrythat it had entered into a license and supply agreement with Velodyne whereby Velodyne will provide Veoneer US, Inc. with materials and rights to certain Velodyne intellectual property which would enable Veoneer US, Inc. to sell, distribute, promote, manufacture and modify (including related R&D) certain LiDAR products based on a Velodyne-authorized reference design.
January 2018: Zenuity announced a non-exclusive collaboration with TomTom, to provide reference map architecture for the “Zenuity Connected Roadview” system for autonomous vehicles. TomTom’s High Definition (“HD”) Maps will power the localization, perception and path planning in the Zenuity AD software stack in combination with on-vehicle sensors such as cameras, radar and LiDAR to create continuously updated maps.
October 2017: WeVeoneer announced a non-exclusive collaboration with Massachusetts Institute of Technology AgeLab to develop deep learning algorithms that enable effective communication and transfer of control between driver and vehicle. This includes sensing driver gaze, emotion, cognitive load, drowsiness, hand position, posture and fusing this information with the perception of the driving environment to create safe and reliable vehicles that drivers can learn to trust.
September 2017: Zenuity announced a non-exclusive collaboration with Ericsson. The aim is to develop the Zenuity connected cloud, where Ericsson will contribute its “Internet of Things” accelerator platform aiming to integrate in-vehicle software and systems with connected safety data from other vehicles and infrastructure to potentially provide Over-the-Air real time updates across the vehicle fleet.
August 2017: WeVeoneer announced a non-exclusive collaboration with Seeing Machines, a pioneer in computer vision based human sensing technologies to develop next generation Driver Monitoring Systems for autonomous vehicles.
July 2017: WeVeoneer announced a non-exclusive collaboration with Velodyne to sell various LiDAR sensors as the Tier-1 supplier to the OEMs. See details above.
June 2017: WeVeoneer announced a non-exclusive early stage collaboration with NVIDIA, in combination with Zenuity, providing Veoneer and Zenuity with pre-commercial access to NVIDIA’s AI computing platform for autonomous driving. Actual production vehicles utilizing said platform are not planned for sale before 2021.
9
Market Overview and Competitive Landscape
Automotive Supplier Market Overview
The automotive production value chain is split among OEMs such as General Motors, Toyota and Volkswagen and automotive suppliers, such as ourselves, Aptiv, Bosch, Continental, Denso, Magna, Valeo and ZF. Veoneer acts mainly as a Tier-1 supplier to OEMs, meaning that we sell products directly to OEMs.
Our underlying market is primarily driven by two critical factors: Global Light Vehicle Production (“LVP”) and Content Per Vehicle (“CPV”), whereby CPV is the clear market driver for the growth of our total addressable market.Total Addressable Market ("TAM").
Light Vehicle Production: Over the last two decades, LVP has increased at an average annual growth rate of around 3% despite the cyclical nature of the automotive industry. The LVP is expected to growincrease from 85 million vehicles in 2020, to around 92 million in 2019, and 10697 million in 2025, fromwhere approximately 9186 million where produced in 2018,2019, according to IHS, The market is undergoing a shift from traditional internal combustion engine ("ICE") vehicles, to HEVs and EVs, as emission regulation becomesregulations become more stringent, and battery technology continues to evolve.evolve in cost and performance.
Content Per Vehicle: Unlike LVP, we can directly influence the CPV by introducing new technologies to the market. Looking ahead, we expect thatthe safety CPV growth will primarily be driven by active safetyActive Safety content (including software), with total active safetyActive Safety market growing from approximately $75$100 per vehicle in 20182019 to approximately $250$300 per vehicle in 2025, representing a compound annual growth rate ("CAGR") of roughly 19% from 2018 to 2025, as the demand for advanced active safety features grows.2025.
See Item 7 Management’s Discussion and Analysis ("MD&A") of Financial Condition and Results of Operations-Trends, Uncertainties and Opportunities” for additional information related to recent trends in LVP and CPV.
Active Safety Competitive Landscape
The active safetyActive Safety market isremains a highly fragmented and highly competitive. Competition is based primarily on technology, innovation, quality, delivery and price. Our future success will depend on our ability to develop advanced hardware and software technologiestechnology solutions and to maintain or improve on our already strong competitive position over our existing and any new competitors. Main competitors in active safetyActive Safety include Aptiv, Bosch, Continental, Denso, Magna, Mobis, Valeo, ZF, and Intel/Mobileye.Mobileye as a Tier 2 vision software provider.
On a broader scale, we have seen significant shifts in our competitive landscape over the last several years. Technology companies have increased their presence and influence in ADAS and AD either through acquisitions or forming “ecosystems” around certain technologies with OEMs and other suppliers. This has led to new industry entrants like Apple, Google,Waymo, Intel, Lyft, NVIDIA, Qualcomm and Uber, which also provide partnership or customer opportunities for Veoneer hardware and software solutions.
Through acquisitions, technology partnerships with customers and licensing agreements, along with our customers we have continuously added key building blocks and we estimate to have obtained a market share of 12%approximately 9% in active safetyActive Safety in 2018.2019. Zenuity has since inception formed several partnerships to establish a full-suitesoftware-suite ecosystem and competes with peer ecosystems such as the BMW/Intel/Mobileye collaboration.collaboration and GM Super Cruise program.
Restraint Control Systems Competitive Landscape
The market for restraint control systemsRestraint Control Systems, in comparison to the Active Safety market, remains relatively fragmentedconsolidated with both traditional electronics suppliers and some passive safetyPassive Safety suppliers. Over the past few years, we have seen our market share increase mainly due to cost efficient integration solutions and strong customer relationships built on quality and technology advancements. Currently we are thea leading supplier of restraint control systemsRestraint Control Systems with aan estimated market share of around 26%approximately 22% in 2018.2019. Our largest competitors include Bosch, Continental, Denso and ZF.
The total restraint control systems market amounted to approximately $4 billion in 2018 and is expected to remain at the same level until 2025. We believe that restraint control systems will play an integral role in a larger integration trend towards centralized Safety Domain Controllers in the future. In addition, our strong market position in restraint control systems will provide opportunities to become a leading supplier in the ADAS ECU and eventually the Safety Domain Controller market.
Brake Systems Competitive Landscape
Brake systems consists of brake control ECUs, including ABS and ESC as well as brake apply units. We estimate the total brake systems market to be approximately $12 billion in 2018,2019, with a projected CAGR of 3%5% through 2025. The main growth driver is higher installation rates of ESC systems in China and other emerging countries in Asia. Another major growth driver is more advanced and complex servo assisted systems and regenerative braking systems for HEVs and EVs. The ability to regenerate kinetic energy through braking is of growing importance as vehicle powertrainspower trains are becoming increasingly electrified. We estimate that VNBS and VBS combined had a market share of just aboveapproximately 4% in 2018.2019. Main competitors of VNBS include ADVICS, Bosch, Continental, Mando and ZF.
Research & Development and Intellectual Property
Our ability to maintain our position at the forefront of technologicaltechnology innovations and to serve customers on a local basis will be differentiating factors to our success. Therefore, we maintain one of the broadest global networks of technical engineering centers across all major automotive regions to develop and provide advanced products, processes and manufacturing support for our manufacturing sites and to provide our customers with local engineering capabilities and design development on a global basis.
We currently own or co-own approximately 738850 active patents and have approximately 710800 pending patent applications in the US and other jurisdictions. The active patents will expire between 20192020 and 2038.2039. We have registered the name Veoneer as a trademark in Sweden and are pursuing registration in other markets of interest. Depending on the jurisdiction, trademarks are generally valid as long as they are in use or their registrations are properly maintained, and they have not been found to have become generic.
We are actively pursuing opportunities to commercialize and license our technology to the automotive industries, and we selectively utilize other companies’ licenses through sublicensessub-licenses in order to support our business interests. These activities foster optimization of intellectual property rights.
We believe that our patents, trademarks and licenses, provide meaningful protection for our products and technical innovations and as a whole, to be material to our business. However, we do not consider our business or any of our business segments to be materially dependent upon any individual patent, trademark or license.
We seek to effectively manage fixed costs and efficiently rationalize capital spending by evaluating the market and profit potential of existing and new customer programs, including investments in innovation and technology. We maintain our engineering activities around our focused product portfolio and allocate our capital and resources to those products and distinctive technologies.
Our total research and development expenses, including engineering, net of customer reimbursements, were $562 million, $466 million $375 million and $300$375 million for the years ended December 31, 2019, 2018 and 2017, respectively. Veoneer's 50% share of Zenuity’s net expenses, as reported in loss from equity method investment, was $70 million, $63 million and 2016, respectively. Zenuity’s total expenses were $125$31 million for the yearyears ended December 31, 2018.2019, 2018 and 2017, respectively. These expensescosts were mainly related to research and development.
We believe that our engineering and technical expertise, together with our emphasis on continuing research and development, allows us to use the latest technologies, materials and processes to solve problems for our customers and to bring new innovative productsinnovations to market. We believe that a continued focus on engineering activities are criticalcrucial to maintaining our pipeline of technologically advanced products.technologies to become automotive grade products to meet our customer, regulatory and consumer demands.
Dependence on Customers
Veoneer serves most of the world’s major automotive OEMs and is not dependent on one single customer. Our customer base has consistently increased and become more diversified over the last five years, mainly driven by our active safetyActive Safety product offerings and VNBS.Brake Systems.
11
We typically supply products to our OEM customers through written contracts or purchase orders which are generally governed by general terms and conditions established by each OEM. These arrangements include terms regarding price, quality, technology and delivery. Although it may vary from customer to customer, our customer contracts generally require us to supply a customer’s annual requirements for a particular vehicle model and assembly facilities, rather than for manufacturing a specific quantity of products. Such contracts range from one year to the life of the model, which is generally four to seven years. Because we produce products for a broad cross section of vehicle models, we are not overly reliant on any one vehicle model or one particular product.
These contracts are often subject to renegotiation, sometimes as frequent as on an annual basis which may affect product pricing. In general, these arrangements with our customers provide that the customer can terminate them if we do not meet specified quality, delivery and cost requirements. Although these arrangements may be terminated at any time by our customers (but not typically by us), such terminations have historically been minimal and have not had a material impact on our results of operations. However, if terminations do occur in the future or if production under a contract winds down earlier than expected, then such event could have a material impact on our results of operations. The arrangements typically provide that we are subject to a warranty on the products supplied; in most cases, the duration of such warranty is coterminous with the warranty offered by the OEM to the end-user of the vehicle. We may also be obligated to share in all or a part of recall costs if the OEM recalls its vehicles for defects attributable to our products.
Veoneer Personnel
As of December 31, 2018,2019, we had a total of approximately 8,600 employees and consultants,8,900 total associates, with 4,6764,900 in engineering, 2,0832,000 in direct manufacturing and the remaining 2,000 in production and 1,346SG&A overhead functions. Included in production overhead,these figures are approximately 1,400 temporary associates, and the remainder employed in management, general and administrative functions. Withinwithin engineering, more than two thirds of the employeesassociates worked as software engineers.
In addition, Zenuity had approximately 600720 employees and consultants at the endas of 2018,December 31, 2019, of which approximately 88%close to 90% worked as software developers. In 2018,During 2019, approximately 1,100230 engineers were hired by Veoneer and more than 100approximately 70 were hired by Zenuity.
We consider our relationship with our personnel to be strong. We have not had any disputes which are significant or had a lasting impact on our relationship with our employees, customer perception of our employee practices or our business results.
Major unions to which some of our employees belong in Europe include: IG Metall in Germany; Unite in the United Kingdom; Confédération Générale des Travailleurs, Confédération Française Démocratique du Travail, and Force Ouvrière in France; and If Metall, Unionen, Sveriges Ingenjörer and Akademikerföreningen in Sweden.
In addition, our employees in other regions are represented by the following unions: Unifor and the International Association of Machinists and Aerospace Workers (“IAM”) in Canada and VNBS Roudou Kumiai in Japan.
In many European countries and in Canada, wages, salaries and general working conditions are negotiated with local unions and/or are subject to centrally negotiated collective bargaining agreements. The terms of our various agreements with unions typically range between one and three years. Some of our subsidiaries in Europe and Canada must negotiate with the applicable local unions with respect to important changes in operations, working and employment conditions. Twice a year, members of the Company’s management conduct a meeting with the European Works Council (“EWC”) to provide employee representatives with important information about the Company and a forum for the exchange of ideas and opinions.
In many Asia Pacific countries, the central or regional governments provide guidance each year for salary adjustments or statutory minimum wage for workers. Our employees may join associations in accordance with local legislation and rules, although the level of unionization varies significantly throughout our operations.
Inventory and Working Capital
We, as with other component manufactures in the automotive industry, ship our products to customer vehicle assembly facilities throughout the world on a “just-in-time” basis for our customers to maintain low inventory levels. Our suppliers (external suppliers as well as our own production sites) use a similar method in providing raw materials or sub-assemblies to us. In certain situations Veoneer utilizes consignment inventories with our supply base.
12
Sources and Availability of Raw Materials
We procure our raw materials and components from a variety of suppliers around the world. Generally, we seek to obtain materials in the region in which our products are manufactured to minimize transportation, currency risks and other costs. The most significant raw materials we use to manufacture our products are various electricalelectronic semi-conductor components and ferrous metals for brake systems. As of December 31, 2018,2019, we have not experienced any significant shortages of raw materials and normally do not carry inventories of such raw materials more than those reasonably required to meet our production and shipping schedules.
Commodity cost volatility is a challenge for us and our industry. We are continually seeking to manage these costs using a combination of strategies, including working with our suppliers to mitigate costs, seeking alternative product designs and material specifications, continuous improvement VEVAs (Value Engineering, Value Analysis), combining our purchase requirements with our customers and/or suppliers, changing suppliers, hedging certain commodities and other means. Our overall success in passing commodity cost increases on to our customers has been limited. We will continue our efforts to pass market-driven commodity cost increases to our customers in an effort to mitigate all or some of the adverse earnings impacts, including by seeking to renegotiate terms as contracts with our customers expire.
Seasonality
Our business is moderately seasonal. Our European customers generally reduce production during the months of July and August and for one week in December. Our North American customers historically reduce production during the month of July and halt operations for approximately one week in December. Our Chinese customers generally reduce production during the Chinese New Year period in February. Shut-down periods in the rest of the world generally vary by country. In addition, automotive production is traditionally reduced in the months of July, August and September due to the launch of parts production for new vehicle models. Accordingly, our results reflect this seasonality. In addition, engineering incomereimbursement tends to be skewed towards the fourth quarter.
Environmental Compliance
We are subject to various environmental regulations governing, among other things: (i) the generation, storage, handling, use, transportation, presence of, or exposure to hazardous materials; (ii) the emission and discharge of hazardous materials into the ground, air or water; (iii) the incorporation of certain chemical substances into our products, including electronic equipment; and (iv) the health and safety of our employees.
Most of the Company’s manufacturing processes consist of the assembly of components. As a result, the environmental impact from the Company’s plants is generally modest. While our businesses from time to time are subject to environmental investigations, there are no material environmental-related cases pending against the Company. Therefore, we do not incur (or expect to incur) any material costs or capital expenditures associated with maintaining facilities compliant with U.S. or non-U.S. environmental requirements. To reduce environmental risk, the Company has implemented an environmental management system in all plants globally and has adopted an environmental policy.
We are subject to various U.S. federal, state and local, and non-U.S., laws and regulations, including those related to environmental, health and safety, financial and other matters. We cannot predict the substance or impact of pending or future legislation or regulations, or the application thereof. The introduction of new laws or regulations or changes in existing laws or regulations that impact our business, or the interpretations thereof, could increase the costs of doing business for us or our customers or suppliers or restrict our actions and adversely affect our financial condition, operating results and cash flows.
We are also required to obtain permits from governmental authorities for certain of our operations.
Dependency on Government Contracts
We are not dependent on government contracts. Some R&D projects are partly financed by certain government agencies.
13
Joint Venture AgreementsVentures
Zenuity Joint Venture Agreement
Zenuity operates pursuant to the Joint Venture Agreement, dated April 18, 2017 (the “Zenuity JV Agreement”), between Volvo Cars and a subsidiary of Veoneer. The Zenuity JV Agreement describes the scope of the business activities of Zenuity, which is to develop automotive driver assistance and highly autonomous driving software solutions that can be supplied to Volvo Cars and other potential customers. In addition, Zenuity conducts research within the areas of human factors, vehicle environments and computer techniques to develop algorithms for driving assistance or automated driving. Zenuity owns and licenses certain intellectual property rights pursuant to commercialization agreements between the parties. Veoneer is the exclusive supplier and distribution channel for all Zenuity’s products sold to third parties; however, there is no exclusivity toward any customer or the owners. Volvo Cars can source such products directly from Zenuity. The parties also entered into a number of related agreements in connection with forming the joint venture, including an investment agreement, commercialization agreements and intellectual property license and assignment agreements pursuant to which Volvo Cars and Veoneer transferred certain intellectual property rights to Zenuity. A copy of the Zenuity JV Agreement has been filed with the U.S. Securities and Exchange Commission (the “SEC”).
Former VNBS Joint Venture Agreement
Brake Systems was formed by and operates pursuant to a number of agreements entered into between certain affiliates of each of Veoneer and Nissin Kogyo Ltd., Co. (“Nissin”), including a Share Purchase Agreement, dated September 9, 2015, and a Joint Venture Agreement, dated March 7, 2016 (the “VNBS JV Agreement”). The VNBS JV Agreement setsset forth the agreementsagreement between Veoneer and Nissin with respect to the ownership, capitalization, governance and operations of Brake Systems. It providesprovided that Veoneer ownswould own 51% of each of the entities that comprisecomprised Brake Systems and Nissin ownswould own the remaining 49% of each entity. A copy of the VNBS JV Agreement has beenwas filed with the SEC.
Pursuant to the agreements, Veoneer acquired Nissin’s interests in the US operations of VNBS, referred to as VBS, and VNBS transferred or licensed the VNBS technologies necessary to operate the VBS business to VBS. VBS, including the transferred or licensed technologies, became a formal negotiation processwholly-owned Veoneer business effective on the closing date, June 28, 2019.
Under the agreement, Nissin provided guarantees for certain VNBS commercial loans corresponding to 49% of the funding Veoneer had previously unilaterally provided to VNBS. During the nine months ended September 30, 2019, Veoneer received approximately $20 million as debt repayment from VNBS.
On October 30, 2019, Veoneer signed agreements (the "Definitive Agreements") to sell its 51% ownership in Veoneer Nissin Brake Japan ("VNBJ") and Veoneer Nissin Brake China ("VNBZ") entities that comprise VNBS to Nissin and Honda Motor Co., Ltd. The transaction was completed on February 3, 2020 under the Definitive Agreements, and the VNBS JV Agreement to find a resolution to the current funding situation.joint venture was terminated. See Note 6 "Assets held for sale" for additional information.
Spin-Off Related Agreements
As part of the Spin-Off, Autoliv underwent an internal reorganization, pursuant to which, among other things and subject to limited exceptions, all of the assets and liabilities (including whether accrued, contingent or otherwise, and subject to certain exceptions) associated with the electronics business of Autoliv were retained by or transferred to Veoneer or our subsidiaries and all other assets and liabilities (including whether accrued, contingent or otherwise, and subject to certain exceptions) of Autoliv were retained by or transferred to Autoliv or its subsidiaries (other than Veoneer).
Following the Spin-Off, the Company and Autoliv began operating independently and neither has any ownership interest in the other. To govern certain ongoing relationships between Veoneer and Autoliv after the Spin-Off and to provide mechanisms for an orderly transition, the Company and Autoliv entered into agreements pursuant to which certain services and rights are provided for following the Spin-Off, and the Company and Autoliv will indemnify each other against certain liabilities arising from our respective businesses.
Distribution Agreement
In connection with the internal reorganization, we entered into a Master Transfer Agreement with Autoliv which was amended and restated effective as of the Spin-Off (the “Distribution Agreement”). The Distribution Agreement governs
14
certain transfers of assets and assumptions of liabilities by each of Veoneer and Autoliv and the settlement or extinguishment of certain liabilities and other obligations among the companies and their subsidiaries. In particular, substantially all of the assets and liabilities associated with the separated Electronics business were retained by or transferred to Veoneer or its subsidiaries and all other assets and liabilities were retained by or transferred to Autoliv or its subsidiaries. The Distribution Agreement also provided the principal corporate transactions required to affect the Spin-Off, certain conditions to the Spin-Off and provisions governing the relationship between Veoneer and Autoliv with respect to and resulting from the completion of the Spin-Off. The Distribution Agreement also provides for indemnification obligations designed to make the Company financially responsible for substantially all liabilities that may exist relating to its business activities, whether incurred prior to or after the completion of the internal reorganization, as well as those obligations of Autoliv assumed by us pursuant to the Master Transfer Agreement; provided, however, certain warranty, recall and product liabilities for Electronics products manufactured prior to the completion of the internal reorganization were retained by Autoliv and Autoliv will indemnify us for any losses associated with such warranty, recall or product liabilities.
Employee Matters Agreement
The Employee Matters Agreement governs Autoliv’s and Veoneer’s compensation and employee benefit obligations with respect to the current and former employees and non-employee directors of each company. Under the agreement, Autoliv is responsible for liabilities associated with Autoliv allocated employees and liabilities associated with former employees and Veoneer is responsible for liabilities associated with Veoneer allocated employees, but Autoliv retains and continues to be responsible for certain post-retirement liabilities relating to plans sponsored by Autoliv. The Employee Matters Agreement provided for the conversion of the outstanding awards granted under the Autoliv equity compensation programs into adjusted awards relating to both shares of Autoliv and Veoneer common stock.
Tax Matters Agreement
The Tax Matters Agreement governs the respective rights, responsibilities and obligations of Autoliv and Veoneer with respect to tax liabilities and benefits, tax attributes, tax contests and other tax sharing regarding U.S. federal, state, local and foreign income taxes, other tax matters and related tax returns. The agreement also specifies the portion, if any, of this tax liability for which Veoneer will bear responsibility and provides for certain indemnification provisions with respect to amounts for which they are not responsible. In addition, under the agreement, each party is expected to be responsible for any taxes imposed on Autoliv that arise from the failure of the Spin-Off and certain related transactions to qualify as a tax-free transaction for U.S. federal income tax purposes.
Amended and Restated Transition Services Agreement
Under the Amended and Restated Transition Services Agreement (“TSA”), Autoliv and Veoneer agreed to provide to each other certain services for a limited time to help ensure an orderly transition following the Spin-Off. The services that Autoliv provides include certain finance, information technology, human resources and compensation, facilities, legal and compliance and other services. We pay Autoliv for any such services utilized at agreed amounts as set forth in the TSA. In addition, for a term set forth in the TSA, we and Autoliv may mutually agree on additional services to be provided by Autoliv to us that were provided to us by Autoliv prior to the distribution but were omitted from the TSA at pricing based on market rates that are reasonably agreed by the parties. The TSA terminates on April 1, 2020.
Available Information
We file or furnish with the SEC periodic reports and amendments thereto, which include annual reports on Form 10-K, quarterly reports on Form 10-Q, current reports on Form 8-K, proxy statements and other information. Such reports, amendments, proxy statements and other information are made available free of charge on our corporate website at www.veoneer.com and are available as soon as reasonably practicable after they are electronically filed with the SEC. The SEC maintains an internet site that contains reports, proxy and information statements, and other information regarding issuers that file electronically with the SEC at http://www.sec.gov. Paper copies ocfof the above-mentioned documents can be obtained free of charge from the Company by contacting usour Investor Relations and Corporate Communications at: Veoneer, Inc., Box 13089, SE-103 02, Stockholm, Sweden or Veoneer, Inc., 2654526360 American Drive, Southfield, MI 48034.48034 or http://www.veoneer.com.
15
Item 1A. Risk Factors
Owning our common stock involves a high degree of risk. You should consider carefully the following risk factors and all other information contained in this Annual Report on Form 10-K. If any of the following risks, as well as additional risks and uncertainties not currently known to us or that we currently deem immaterial but are in fact material, occur, our business, liquidity, results of operations and financial condition could be materially and adversely affected. If this were to happen, the market price of our common stock could decline significantly, and you could lose all or a part of the value of your ownership in our common stock. Some statements in this information statement,Annual Report, including statements in the following risk factors, constitute forward-looking statements. Please refer to the section in this Annual Report entitled “Forward-Looking Statements.”
Risks Related to Our Industry
The cyclical nature of automotive sales and production can adversely affect our business. The market is currently experiencing a significant decline in light vehicle production (LVP) and LVP may decline for the next several years. A prolonged recession and/or a downturn in our industry or deteriorating performance of our business, could adversely affect our business and require impairments or restructuring actions.
Our business is related to LVP in the global market and by our customers, and automotive sales and LVP are critical drivers for our sales. Automotive sales and production are highly cyclical and can be affected by generalA prolonged downturn in or uncertainty relating to global or regional economic or industry conditions, or uncertainty, the level of consumer demand, recalls and other safety issues, labor relations issues, technological changes, fuel prices and availability, vehicle safety regulations and other regulatory requirements, governmental initiatives, trade agreements, political volatility, especially in energy producing countries and growth markets, changes in interest rate levels and credit availability and other factors. At various times some regions around the world may be more particularly impacted by these factors than other regions. Economic declines that result in aany significant reduction in automotive sales and productionand/or LVP by our customers, have in the past had, and may in the futurewhether due to general economic conditions or any other factors relevant to sales or LVP, will likely have a material adverse effect on our business, results of operations and financial condition. If global economic conditions deteriorate or economic uncertainty increases, our customers and potential customers may experience deterioration of their businesses, which may result in the delay or cancellation of plans to purchase our products.
Furthermore, our ability to generate cash from our operations is highly dependent on regional and global economic conditions, automotive sales and LVP. Additionally, we have a substantial number of important product and program launches in the next 18 months. These launches are important from both a sales and cash flow perspective. A continued lower LVP or lower sales volumes on these new vehicles being launched as well as lower sales on other vehicles may delay the return on our investment in R&D and a return on the resources expended to ensure timely and quality launches. Given the high level of R&D that is required in our products, including new product and program launches, a significantly negative cash flow could have a materially negative impact on our business. A prolonged downturn in global economic conditions or LVP would likely result in us experiencing a significantly negative cash flow.
Order intake and the dollar amount of the order intake are not necessarily indicative of future net sales revenues and are subject to a number of uncertainties. If order intake fails to translate into future net sales revenue it may adversely affect our business.
We monitor order intake to make certain predictions related to our capital needs and expenditures and in providing long-term targets, earnings guidance and estimates. Our order intake is the estimated future average annual sales attributable to documented new business awarded based on estimated average annual product volumes, average annual sales price for such products over their anticipated life, and exchange rates. Order intake is not recorded as revenue until the order is completed. The aggregate value of order intake is considered our “order book” and is part of it until the products are also affected by inventory levelsmanufactured and delivered to customers and we realize net sales revenue from such orders. Since the general lead time from an “order” to the start of production is three to four years and it may take several months for production of a certain vehicle model to fully ramp up, the assumptions we use to determine order intake may no longer be accurate at the time production begins or the order is completed. For example, active safety and restraint control systems order intake from 2013 to 2015 is reflected in sales from 2017 to 2019.
To determine our customers.estimated order intake, we make several assumptions related to vehicle production in a particular year of a particular model, annual product values, sales prices for such products and exchange rates. If any of the inputs to these assumptions fail to materialize as we expect, the net sales revenue actually realized may be adversely impacted. We cannot predict when our customers will decide to either increase or reduce inventory levels or whether new inventory levels will approximate historical inventory levels. This may exacerbate variability inOur customers generally do not guarantee order volumes. Additionally, the commercial success of the vehicle models which include our products will also impact whether our order intake and, as a result, our revenues and financial condition. Uncertainty regarding inventory levels may be exacerbated by consumer financing programs initiated or terminated by our customers or governments as such changes may affect the timing of their sales.
conditions or any other factors relevant to sales or LVP, will likely have a material adverse effect on whether net sales revenue is ultimately realized from our business, results of operations and financial condition.estimated order book.
16
Growth rates in safety content per vehicle, which may be impacted by changes in consumer trends and political decisions, could affect our results in the future.
Vehicles produced in different markets may have various safety content values. For now, our products are typically found in vehicles with higher safety content. Because growth in global LVP is highly concentrated in markets such as China and India, our operating results may suffer if the safety content per vehicle remains low in our growth markets. As safety content per vehicle is also an indicator of our sales development, should this trendstrend continue, the average safety systems per vehicle could decline.
Our estimate of total addressable market is subject to numerous uncertainties. If we have overestimated the size of our total addressable market, our future growth rate may be limited.
The Company’s estimates of total addressable market, or TAM, are based on a variety of inputs, including production estimates per product group (which are based in significant part on LVP data and estimates from IHS), and in particular in relation to content per vehicle, or CPV, estimates, the Company’s own market insights, estimates as to the pace and extent of standard-setting and regulatory change, internal market intelligence on prices and penetration/adoption rates of each expected product group and the Company’s history operating in the market (including, among other things, its order and bid experience).
We have not independently verified any third-party information, including LVP estimates by IHS, and cannot assure you of its accuracy or completeness. While we believe our market size estimates are reasonable, such information is inherently imprecise. For example, IHS’s January 2020 estimates of LVP over the time period from 2020 to 2023 are reduced by approximately 50 million vehicles compared to forecasts in June 2018 (around the time of the completion of our spin-off from Autoliv). Compared to forecasts in June 2018, the current global LVP forecast is 11% lower for 2019, 13% lower for 2020 and 12% lower for 2022. In Western Europe, the current forecast is 10% lower for 2019, 11% lower for 2020 and 5% lower for 2022. In North America, the current forecast is 7% lower for 2019, 6% lower for 2020 and 7% lower for 2022. In China, the current forecast is 18% lower for 2019, 22% lower for 2020 and 19% lower for 2022. If IHS or other third-party or internally generated data that is used in our estimates proves to be inaccurate or we make errors in our assumptions based on that data, our actual market may be more limited than our estimates. In addition, these inaccuracies or errors may cause us to misallocate capital and other critical business resources, which could harm our business. Even if our total addressable market meets our size estimates and experiences growth, we may not continue to grow our share of the market. Our growth is subject to many factors, including our success in implementing our business strategy, which is subject to many risks and uncertainties. Accordingly, the estimates of our total addressable market included in this Annual Report should not be taken as indicative of our ability to grow our business.
We operate in highly competitive markets.
The markets in which we operate are highly competitive. We compete with a number of companies that design, produce and sell similar products. Among other factors, our products compete on the basis of price, quality, manufacturing and distribution capability, design and performance, technological innovation, delivery and service. Some of our competitors are subsidiaries (or divisions, units or similar) of companies that are larger than we are and have greater financial and other resources than us. Some of our competitors as well as some of our customers have strategic relationships with outside partners, enabling them to pool resources. Additionally, some of our competitors may also have “preferred status” as a result of special relationships or ownership interests with certain customers. Our ability to compete successfully depends, in large part, on our ability to innovate and manufacture products that have commercial success with consumers, differentiatingdifferentiate our products from those of our competitors, deliveringdeliver quality products in the time frames required by our customers, create confidence in our financial stability, and achievingachieve best-cost production.
Furthermore, given that some of our competitors are larger than we are and have greater financial resources, our ability to create confidence in our customers and potential customers that we have the financial strength and resources to support their ambitious programs and can timely deliver quality products over the life of a vehicle program will also be a significant factor in our ability to be competitive. Because the supply chain in our industry is very complex and many of our competitors have greater financial resources, our customers and potential customers may consider us as a supply risk and become concerned that we will be unable to continue to provide products to them at a quality level that meets their needs. If we are unable to create confidence in our financial position, customers may choose other suppliers, which would have a material adverse effect on our business, results of operations and financial condition.
Our ability to maintain and improve existing products, while successfully developing and introducing distinctive new and enhanced products that anticipate changing customer and consumer preferences and capitalize upon emerging technologies will
17
be a significant factor in our ability to be competitive. If we are unsuccessful or are less successful than our competitors in predicting the course of market development, developing innovative products, processes, and/or use of materials or adapting to new technologies or evolving regulatory, industry or customer requirements, we will suffer from a competitive disadvantage. Further, the global automotive industry is experiencing a period of significant technological change, including a focus on environmentally sustainable products. As a result, the success of portions of our business requires us to develop, acquire and/or incorporate new technologies. There is a risk that our investments in research and development initiatives will not lead to successful new products and a corresponding increase in revenue. We may also encounter increased competition in the future from existing or new competitors. The inability to compete successfully could have a material adverse effect on our business, results of operations and financial condition.
We operate in a developing market that may be subject to greater uncertainty and fluctuations in levels of competition than a more mature market.
The field of active safety is a developing segment in the automotive industry and is expected to act as a basis for and enable the development and introduction of commercially viable autonomous vehicles. The number of competitors may increase as suppliers from outside the traditional automotive industry, such as Google, Argo, Uber, Lyft, Cruise, Samsung, Panasonic, Here, Tesla, Intel, NVIDIA and other technology companies, consider the significant business opportunities presented by autonomous driving. Some of our customers are also partnering together to develop autonomous driving solutions. The evolving nature of the competitive landscape creates greater uncertainty than the traditional automotive market.
Products and services provided by companies outside the automotive industry may also reduce demand for our products, which require substantial investment in research and development. For example, there has been an increase in consumer preferences for mobility on demand services, such as car- and ride-sharing, as opposed to automobile ownership, which may result in a long-term reduction in the number of vehicles per capita. Today, in most markets, active safety products are considered to be premium equipment rather than standard automotive safety items, which can create significant volatility in demand for certain of our products.
The high development costs of active safety and autonomous driving products increases the risk that we will be unable to effectively compete in the market.market and our inability to effectively manage the timing, quality and costs of new program launches could adversely affect our financial performance.
If we are unable to develop and deliver innovative and competitive products, or unable to do so beforewithin the same timeframe as our competitors, our business, results of operations and financial condition could be materially adversely affected.
To compete effectively in the automotive supply industry, we must be able to launch new products to meet our customers’ timing, performance and quality standards. Our inability to do so may result in the loss of awarded business, or being put on a “ new business hold” (prohibiting us from competing for new business with the customer), as well as significant liabilities and/penalties. Certain state of the art products we launch may need to be developed on an especially accelerated time frame for speed-to-market. There is a risk that we will not be able to install and certify the equipment needed to produce products for new programs in time for the start of production, or that the transitioning of our manufacturing facilities and resources to full production for such new programs will not impact production rates or other operational efficiency measures at our facilities. In addition, there is a risk that our customers will not execute on schedule the launch of their new product programs. A declining LVP increases the risk that new programs will be delayed or have a slow launch process.
Additionally, as a Tier 1 automotive supplier, we must effectively coordinate the activities of numerous suppliers in order to launch programs successfully. Given the complexity of new program launches, especially involving new and innovative technologies, we may experience difficulties managing product quality, timeliness and associated costs. These risks with new technologies are increased when the customer relationship is new and the customer is subject to the same pressures on product quality and timeliness. In addition, new program launches require a significant ramp up of costs; however, the sales related to these new programs generally are dependent upon the timing and success of the introduction of new vehicles by our customers. Furthermore, if it becomes necessary to request that our customers cover or share in these costs due to the complexities and changes requested by the customers, this could impact our relationships with our customers and the development of these programs. These negotiations can take considerable time and effort and risk deterioration of our relationships with our customers, and there can be no assurances that any specific negotiations will result in amendments that are beneficial to us on a timely basis. We have a significant number of new program and product launches in the next 18 months. As the start of production grows closer for these programs and products, the potential risk related to timeliness and potential costs for failure to
18
deliver timely may increase depending on the program or product as there is less time to implement any necessary changes to these programs even if they are requested by our customers. We may also have contractual liabilities for any such delays. Additionally, any such delays may impact our relationship with our customers and could impact potential future business opportunities. These issues may also be exacerbated due to deteriorating business conditions or declines in LVP. Our inability to effectively manage the timing, quality and costs of these new program launches could have a material adverse effect on our business, results of operations and financial condition.
Autonomous driving involves complex technology and requires a number of different hardware and software competencies and technologies and there is a risk that these competencies or technologies will not develop at a sufficient pace to address marketplace needs.
Autonomous driving requires various types of sensor technology, including cameras, radar and LiDAR technology as well as software technology to control such sensors. These technologies are under various stages of development and marketplace acceptance. There is a risk that these technological solutions will not develop at a sufficient pace to gain acceptance with our customers. If we are unable to develop our autonomous driving solutions fast enough to keep pace with the market, our future business prospects, results of operations and financial condition could be materially adversely affected.
There are also challenges to develop autonomous driving solutions that are outside of our control, including regulatory requirements from state and federal agencies, cybersecurity and privacy concerns, product liability concerns and perceptions of drivers regarding autonomous driving capabilities and solutions. We may need to adjust our strategy and projected timelines based on how these challenges, and others, evolve over time. There is a risk that these challenges will not be overcome, which could have a material adverse effect on our business, results of operations and financial condition.
The inability to effectively manage the timing, quality and costs of new program launches could adversely affect our financial performance.
To compete effectively in the automotive supply industry, we must be able to launch new products to meet our customers’ timing, performance and quality standards. Our inability to do so may result in the loss of awarded business as well as significant liabilities and/penalties. Certain state of the art products we launch may need to be developed on an especially accelerated time frame for speed-to-market. There is a risk that we will not be able to install and certify the equipment needed to produce products for new programs in time for the start of production, or that the transitioning of our manufacturing facilities and resources to full production for such new programs will not impact production rates or other operational efficiency measures at our facilities. In addition, there is a risk that our customers will not execute on schedule the launch of their new product programs, for which we might supply products. Additionally, as a Tier 1 automotive supplier, we must effectively coordinate the activities of numerous suppliers in order to launch programs successfully. Given the complexity of new program launches, especially involving new and innovative technologies, we may experience difficulties managing product quality, timeliness and associated costs. These risks with new technologies are increased when the customer relationship is new and the customer is subject to the same pressures on product quality and timeliness. In addition, new program launches require a significant ramp up of costs; however, the sales related to these new programs generally are dependent upon the timing and success of the introduction of new vehicles by our customers. Furthermore, if it becomes necessary to request that our customers cover or share in these costs due to the complexities and changes requested by the customers, this could impact our relationships with our customers and the development of these programs. These negotiations can take considerable time and effort and risk deterioration of our relationships with our customers, and there can be no assurances that any specific negotiations will result in amendments that are beneficial to us on a timely basis. Our inability to effectively manage the timing, quality and costs of these new program launches could have a material adverse effect on our business, results of operations and financial condition.
Risks Related to Our Business
A prolonged recession and/or a downturn in our industry or deteriorating performance of our business, or further decreases in our market capitalization, could adversely affect our business and require impairments or restructuring actions or require us to seek additional sources of financing to continue our operations, which may not be available to us or be available only on materially different terms than what has historically been available.
Our ability to generate cash from our operations is highly dependent on regional and global economic conditions, automotive sales and LVP. A prolonged downturn in or uncertainty relating to global or regional economic conditions, a downturn in the automotive industry or LVP are conditions that could adversely impact our business. Such adverse impacts could require us to shut down plants or result in impairment charges, restructuring actions or changes in our valuation allowances against deferred tax assets, which could be material to our financial condition and results of operations. If global economic conditions deteriorate or economic uncertainty increases, our customers and potential customers may experience deterioration of their
19
businesses, which may result in the delay or cancellation of plans to purchase our products. Deteriorating global economic conditions and/or deteriorating performance of our business may also result in a negative impact on our market capitalization, which could also result in impairment charges. For example, given our market capitalization, further decreases in our market capitalization may necessitate additional impairment testing. If it is determined that an impairment has occurred this could have a material adverse effect on our financial results.
A prolonged downturn in global economic conditions or LVP would likely result in us experiencing a significantly negative cash flow. Similarly, if cash losses from customer defaults rise sharply, we would experience a negative cash flow. Such negative cash flow could result in our having insufficient funds to continue our operations unless we can procure external financing, which may not be possible. These risks could be exacerbated by instability in the global credit markets and global economic pressure. If external financing is unavailable to us when necessary, we may have insufficient funds to continue our operations.
We may not have sufficient resources to fund all future research and development and capital expenditures or possible acquisitions or joint ventures.
In order to remain competitive, we must make substantial investments in research and development of new or enhanced products. Our products may require significant resources to develop both hardware and software solutions. Challenges of integrating new functionality into vehicles and the evolution of our customers’ performance requirements during development may also increase research and development costs. Customer demands for changes to our products to meet such performance requirements are difficult to predict both in terms of timing and cost. Since our revenue is largely based on sales over time, new customer demands can delay payment for our products which can make it difficult for us to fund these critical up-front investments. We may be unable to fund all of our research and development and capital investment needs or possible acquisitions or joint ventures, and we may have to pass on valuable long-term opportunities that arise. Our ability to raise additional capital, if needed, will depend on a variety of factors, some of which will not be within our control, including the existence of a public offering market, investor perceptions of us, our businesses and the industries in which we operate, and general economic conditions. Failure to successfully raise needed capital on a timely or cost-effective basis could have a material adverse effect on our business, results of operations and financial condition.
Our ability to raise capital in the future may be limited, which could limit our business plan or adversely affect the rights of our stockholders.
Although we expect our current cash balance, combined with our future cash flows, will address our capital needs for at least the next 12 months, we cannot be assured that this will be the case. Our operating environment is increasingly challenging, and our business and strategic plans may consume resources faster than we presently anticipate. Specifically, short term deteriorating business conditions and lower than expected light vehicle production, along with the demand for increased RD&E investment to support our continued strong order intake, the successful execution of challenging customer projects, and the continued development of our product portfolio could potentially result in a future need to raise additional capital. We may finance future cash needs through public or private equity offerings and may also use debt financings or strategic collaborations and licensing arrangements. Our ability to access the capital markets, if needed, on a timely basis or at all will depend on a number of factors, such as the state of the financial markets and securities law requirements and standards. In the event of rising interest rates, disruptions in financial markets, negative perceptions of our business or our financial strength, or other factors that would increase our cost of borrowing, we cannot be sure of our ability to raise additional capital, if needed, on terms acceptable to us, and we may be forced to consider alternative transactions (including the sale of non-core / non-active safety assets on terms our existing security holders perceive as unattractive) in order to fund our operations, repay debt or make new investments, or we may be unable to do so.
Even if we are successful in raising any required funds through additional financings, this may adversely impact our existing security holders. For example, if we raise funds by issuing additional securities, the securities that we issue may have rights, preferences or privileges senior to those of the holders of our common stock or may be issued at a discount to the market price of our common stock which would result in dilution to our existing stockholders. If we raise additional funds by issuing debt, we may be subject to debt covenants, which could place limitations on our operations. Further, we may incur substantial costs in pursuing future capital and/or financing, including investment banking fees, legal fees, accounting fees, printing and distribution expenses and other costs. We may also be required to recognize non-cash expenses in connection with certain securities we may issue, such as convertible notes and warrants, which will adversely impact our financial condition and results of operations.
If we are unable to raise required capital on a timely basis, we may be forced to adjust our strategic and business plans to prioritize more essential funding needs. This could result in delaying certain research or development initiatives, which could impact our ability to develop innovative products and technologies. If capital is not available, or is not available on acceptable
20
terms if and when needed, our ability to fund our operations, take advantage of market opportunities, develop or enhance our products, or otherwise respond to market changes or competitive pressures could be limited.
Our indebtedness may harm our financial condition and results of operations.
As of December 30, 2019, we have outstanding debt of $171 million. We may incur additional debt for a variety of reasons. Although our significant debt agreements do not have any financial covenants, our level of indebtedness will have several important effects on our future operations, including, without limitation (i) a portion of our cash flows from operations will be dedicated to the payment of any interest or could be used for amortization required with respect to outstanding indebtedness; (ii) increases in our outstanding indebtedness and leverage will increase our vulnerability to adverse changes in general economic and industry conditions, as well as to competitive pressure; (iii) depending on the levels of our outstanding debt, our ability to obtain additional financing for working capital, acquisitions, capital expenditures, general corporate and other purposes may be limited; and (iv) potential future tightening of the availability of capital both from financial institutions and the debt markets may have an adverse effect on our ability to access additional capital.
We may not be able to protect our proprietary technology and intellectual property rights, which could result in the loss of our rights or increased costs.
We have developed a considerable amount of proprietary technology related to our products and rely on a number of patents to protect our intellectual property rights in such technology. Our intellectual property plays an important role in maintaining our competitive position in a number of the markets we serve. In addition to our in-house research and development efforts, we have acquired and may continue to seek to acquire rights to new intellectual property through corporate acquisitions, asset acquisitions, licensing and joint venture arrangements. Developments or assertions by or against us relating to our intellectual property rights could negatively impact our business. If claims alleging patent, copyright or trademark infringement are brought against us and are successfully prosecuted against us, they could result in substantial costs.
If we are not able to protect our patents, trademarks, or other intellectual property rights, either owned or licensed by us, against infringement and unauthorized use, we could lose those rights and/or incur substantial costs policing and defending those rights. We also generate license revenue from our intellectual property, which we may lose if we do not adequately protect our intellectual property and proprietary rights. Our means of protecting our intellectual property may not be adequate, and our competitors may independently develop technologies that are similar or superior to our proprietary technologies, or design around the patents we own or license. In addition, the laws of some foreign countries do not protect our proprietary rights to as great an extent as the laws of the U.S. If we cannot protect our proprietary technology, we could experience a material adverse effect on our business, results of operations and financial condition.
In addition, certain of our products utilize components that are developed by third parties and licensed to us or our joint ventures. If claims alleging patent, copyright or trademark infringement are brought against such licensors and successfully prosecuted, they could result in substantial costs, and we may not be able to replace the functions provided by these licensors. Alternate sources for the technology currently licensed to us or our joint ventures may not be available in a timely manner, may not provide the same functions as currently provided or may be more expensive than products currently used. Additionally, there is a risk that any patents owned or licensed by us may be challenged, invalidated or circumvented, limiting competitive advantage of affected products or technologies.
Because we develop proprietary information through our in-house research and development efforts, consulting arrangements and research collaborations with other entities or organizations, there is also a risk that our attempts to protect this proprietary information by entering into confidentiality agreements, or consulting, services or employment agreements that contain non-disclosure and non-use provisions, with our employees, consultants, contractors, scientific advisors and third parties are unsuccessful. Even if agreements are entered into, these agreements may be breached or may otherwise fail to prevent disclosure, third-party infringement or misappropriation of our proprietary information, may be limited as to their term and may not provide an adequate remedy in the event of unauthorized disclosure or use of proprietary information. If we develop an increasing amount of our intellectual property through collaborations and development agreements, more of the technology we depend on could be subject to risks related to protecting these rights. Any of the risks related to the protection of our proprietary technology described above could have a material adverse effect on our business, results of operations and financial condition.
Some of our products and technologies may use “open source” software, which may restrict how we use or distribute our products or require that we release the source code of certain products subject to those licenses.
Some of our products and technologies may incorporate software licensed under so-called “open source” licenses. In addition to risks related to license requirements, usage of open source software can lead to greater risks than use of third-party commercial
software, as open source licensors generally do not provide warranties or controls on origin of the software. Additionally, open
21
source licenses typically require that source code subject to the license be made available to the public and that any modifications or derivative works to open source software continue to be licensed under open source licenses. These open source licenses typically mandate that proprietary software, when combined in specific ways with open source software, become subject to the open source license. If we combine our proprietary software in such a way with open source software, we could be required to release the source code of our proprietary software. Few courts have interpreted open source licenses, and the manner in which these licenses may be interpreted and enforced is therefore subject to some uncertainty.
If these risks materialize, they could have a material adverse effect on our business, results of operations and financial condition.
The discontinuation, lack of commercial success, or loss of business with respect to a customer or particular vehicle model for which we are a significant supplier could reduce our sales and harm our profitability.
A number of our customer contracts require us to supply a customer’s annual requirements for a particular vehicle model and assembly facilities, rather than for manufacturing a specific quantity of products. Such contracts range from one year to the life of the model, which is generally four to seven years. These contracts are often subject to renegotiation, sometimes as frequent as on an annual basis, which may affect product pricing, and generally may be terminated by our customers at any time. The unpredictable nature of such customer contracts has made, and may continue to make, our sales variable. Furthermore, the discontinuation of, the loss of business with respect to, or a lack of commercial success of a customer or particular vehicle model or brand for which we are a significant supplier could reduce our sales and harm our profitability.
Scaling our business has become increasingly critical to our success as OEMs have adopted global vehicle platforms and sought to increase standardization, reduce per unit cost and increase capital efficiency. We are investing in technologies that are intended to become the architecture for other products. If we are not able to scale according to our current expected timelines and needs of our current and prospective customers, we will lose the trust of our customers and our customer relationships may suffer.
We may incur material losses and costs as a result of product liability, warranty and recall claims that may be brought against us or our customers.
We face risks related to product liability claims, warranty claims and recalls in the event that any of our products actually or allegedly are defective, fail to perform as expected or the use of our products results, or is alleged to result, in bodily injury and/or property damage. We may not be able to anticipate all of the possible performance or reliability problems that could arise with our products after they are released to the market. Additionally, increasing regulation, andincluding reporting requirements, regarding potentially defective products, particularly in the U.S., may increase the possibility that we become involved in additional product liability or recall investigations or claims. There is a risk that our product liability and product recall insurance will not provide adequate coverage against potential claims, such insurance will not be available in the appropriate markets or that we will not be able to obtain such insurance on acceptable terms in the future. There is also a risk that Autoliv or one of our customers may be unable or unwilling to indemnify us for product liability, warranty or recall claims although they are contractually obligated to do so or we may be required to indemnify Autoliv or such customer for such claims, which may significantly increase our exposure and potential loss with respect to any such claims.
There is a risk that our current and future investments in our engineering, design, and quality infrastructure will be insufficient and that our products could suffer from defects or other deficiencies or that we will experience material warranty claims or additional product recalls. This is especially relevant in the dynamic active safety market, which is characterized by accelerated development cycles, fluctuating performance requirements and identification of potential failure modes, and the need to integrate products into advanced vehicle environments In the future, we could experience additional material warranty or product liability losses and incur significant costs to process and defend these claims.
Escalating pricing pressures from our customers may adversely affect our business.
The automotive supplier industry continues to experience increasingly aggressive pricing pressure from OEM customers. This trend is partly attributable to the major automobile manufacturers’ strong purchasing power. As an automotive component manufacturer, we may be expected to quote fixed prices or be forced to accept prices with annual price reduction commitments for long-term sales arrangements or discounted reimbursements for engineering work. Price reductions may impact our sales and profit margins. Our future profitability will depend upon, among other things, our ability to continuously reduce our cost per unit and maintain our cost structure. Our profitability is also influenced by our success in designing and marketing technological improvements in automotive safety systems. If we are unable to offset continued price reductions, these price reductions could have a material adverse effect on our business, results of operations and financial condition.
22
Disruptions in our supply or delivery chain, whichor those of our OEM customers, could cause one or more of our customers to halt or delay production.
We, as with other component manufactures in the automotive industry, ship our products to customer vehicle assembly facilities throughout the world on a “just-in-time” basis in order forto allow our customers to maintain low inventory levels. Our suppliers (external
suppliers as well as our own production sites) use a similar method in providing raw materials and components to us. This “just-in-time” method makes the logistics supply chain in our industry very complex and vulnerable to disruptions.
Disruptions in our supply chain such as large recalls or field actions impacting our suppliers, facility closures, strikes, electrical outages, critical health and safety and other working conditions issues, pandemic diseases, such as the coronavirus (COVID-19), natural disasters or other logistical or mechanical failures, could inhibit our ability to timely deliver on orders. We may also experience disruptions if there are delays in customs processing, including if we are unable to obtain government authorization to export or import certain materials.
In addition, financial pressure and/or instability resulting from a prolonged downturn in or uncertainty relating to global or regional economic conditions, or any significant reduction in automotive sales and/or LVP, may affect our suppliers’ agility and willingness and/or ability to accommodate our commercial demands, including with respect to cost and timing.
When we fail to timely deliver or cause a disruption in our customers’ production, we risk damaging our customer relationship, and may lose the business or have to absorb our own costs for identifying and resolving the ultimate problem as well as expeditiously producing and shipping replacement components or products. Generally, we must also carry the costs associated with “catching up,” such as overtime and premium freight.freight, and may be financially responsible for damages to the customer caused by such delays.
We currently do not have long-term supply contracts with many of our third-party suppliers and make substantially all of our purchases on a purchase order basis. Our standard terms and conditions of purchase require a commitment from our suppliers to produce raw materials or components at the causelast piece part price accepted by the parties for at least five years following the end of a customer being forcedproduction contract, and service parts for fifteen (15) years after fulfillment of a purchase order. However, not all suppliers accept these terms and, even if accepted, we cannot be assured they will honor their contractual commitments. Autonomous driving solutions are rapidly developing and increasingly complex and require the use of advanced components that may be single-sourced or not easily replaced if the technology or the vendor does not perform as expected or agree to halt production, the customersupply on a continuing basis. We expect that it would take approximately 12 to 18 months to transition from a current supplier to new providers for our more advanced components. Such a transition would also likely require a qualification process by our customers.
We may seekchoose to recoup all of its losses and expenses from us. These losses and expenses could be very significant and maypursue arrangements with suppliers that include consequential losses such as lost profits. Where a customer halts production because of another supplier failingcommitments to deliver on time,purchase specified quantities over extended periods or nonrefundable deposits or loans in exchange for capacity commitments. If we do so, we may not be fully compensated, if at all. Thus,able to make any such supply chain disruptions could severely impactarrangement in a timely fashion or at all, and any arrangements may be costly, reduce our operations and/or those offinancial flexibility, and not be on terms favorable to us. To date, we have not entered into such arrangements with our customers and force us to halt production for prolonged periods of time which could expose us to material claims for compensation and have a material adverse effect on our business, results of operations and financial condition.suppliers.
We are subject to risks associated with the development and implementation of new manufacturing process technology.
We may not be successful or efficient in developing or implementing new production processes. We are continually engaged in the transition from our existing process to the next-generation process technology. This consistent innovation involves significant expense and carries inherent risks, including difficulties in designing and developing next-generation process technologies, development and production timing delays, lower than anticipated manufacturing yields, and product defects and errors. Production issues can lead to increased costs and may affect our ability to meet product demand, which could have a material adverse effect on our business, results of operations and financial condition.
Additionally, scaling our business has become increasingly critical to our success as OEMs have adopted global vehicle platforms and sought to increase standardization, reduce per unit cost and increase capital efficiency and profitability. We are investing in technologies that are intended to become the architecture for other products. If we are not able to scale according to our current expected timelines and needs of our current and prospective customers, we will lose the trust of our customers and our customer relationships may suffer.
23
Work stoppages or other labor issues at our customers’ facilities or at our facilities could adversely affect our operations.
Because the automotive industry relies heavily on “just-in-time” delivery of components during the assembly and manufacture of vehicles, a work stoppage at one or more of our facilities could have material adverse effects on our business. Similarly, if any of our customers were to experience a work stoppage, that customer may halt or limit the purchase of our products, or a work stoppage at another supplier could interrupt production at one of our customers’ facilities which would have the same effect. A work stoppage at one or more of our facilities or our customers’ facilities could cause us to shut down production facilities supplying these products, which could have a material adverse effect on our business, results of operations and financial condition.
Changes in the source, cost, availability of and regulations pertaining to raw materials and components may adversely affect our profit margins.
Our business uses a broad range of raw materials and components in the manufacture of our products, many of which are generally available from a number of qualified suppliers. Our industry may be affected from time to time by limited supplies or price fluctuations of certain key components and materials. Price fluctuations may intensify or occur with greater frequency as demand for our principal raw materials and components is significantly impacted by demand in emerging markets. Commercial negotiations with our customers and suppliers may not offset the adverse impact of higher raw material, energy and commodity costs. Even where we are able to pass price increases along to our customer, there may be a lapse of time before we are able to do so such that we must absorb the cost increase. Some of our suppliers may not be able to handle the volatility in commodity costs, which could cause them to experience supply disruptions resulting in delivery or production delays by our suppliers. Risks associated with the cost and availability of raw materials and components could have a material adverse effect on our business, results of operations and financial condition.
The SEC requires companies that manufacture products containing certain minerals and their derivatives that are, known as “conflict minerals,” originating from the Democratic Republic of Congo or adjoining countries to diligence and report the source of such materials. There are significant consequences associated with complying with these requirements, including diligence efforts to determine the sources of conflict minerals used in our products, changes to our processes or supplies as a result of such diligence and our ability to source “conflict free” materials. Accordingly, these rules could have a material adverse effect on our business, results of operations and financial condition.
Our business could be materially and adversely affected if we lost our largest customers or if they were unable to pay their invoices.
We are dependent on a few large customers with strong purchasing power. Business with any given customer is typically split into several contracts (either on the basis of one contract per vehicle model or on a broader platform basis). The loss of business from
any of our largest customers (whether by lower overall demand for vehicles, cancellation of existing contracts or the failure to award us new business) could have a material adverse effect on our business, results of operations and financial condition.
Customers may put us on a “new business hold,” which limits our ability to quote or be awarded all or part of their future vehicle contracts if quality or other issues arise in the vehicles for which we were a supplier. Such new business holds range in length and scope and are generally accompanied by a certain set of remedial conditions that must be met before we are eligible to bid for new business. Meeting any such conditions within the prescribed timeframe may require additional Company resources. A failure to satisfy any such conditions may have a materially adverse impact on our financial results in the long term. Additionally, we have no fixed volume commitments from our customers. Thus, even if we have won a bid for business from a customer there are no guaranteed purchase volumes.
There is a risk that one or more of our largest customers could be unable to pay our invoices as they become due or that a customer will simply refuse to make such payments, for reasons such as financial difficulties. If one of our largest customers would enter into bankruptcy proceedings or similar proceedings whereby contractual commitments are subject to stay of execution and the possibility of legal or other modification, or if one of our largest customers otherwise successfully procures protection against us legally enforcing its obligations, it is likely that we will be forced to record a substantial loss.
Changes in our product mix may impact our financial performance.
We sell products that have varying profit margins. Our financial performance can be impacted depending on the mix of products we sell during a given period. Our earnings guidance and estimates assume a certain geographic sales mix as well as a
24
product sales mix. There is a risk that the mix of offerings by our customers and demand for such offerings could change. If actual results vary from this projected geographic and product mix of sales, it could have an unfavorable impact on our revenue and our results of operations and financial condition could be materially adversely affected.
We may be involved from time to time in legal proceedings and our business may suffer as a result of adverse outcomes of future legal proceedings.
We may be from time to time involved in litigation, regulatory proceedings and commercial or contractual disputes that may be significant. These matters may include, without limitation, disputes with our suppliers and customers, intellectual property claims, stockholder litigation, government investigations, class action lawsuits, personal injury claims, environmental issues, customs and value added tax (VAT) disputes and employment and tax issues. In such matters, government agencies or private parties may seek to recover from us very large, indeterminate amounts in penalties or monetary damages (including, in some cases, treble or punitive damages) or seek to limit our operations in some way. There is a risk that claims may be asserted against us and their magnitude may remain unknown for long periods of time. These types of lawsuits could require significant management time and attention, and a substantial legal liability or adverse regulatory outcome and the substantial expenses to defend the litigation or regulatory proceedings may have a material adverse effect on our customer relationships, business prospects, reputation, operating results, cash flows and financial condition. There is a risk that such proceedings and claims will have a material adverse impact on our profitability and consolidated financial position or that our established reserves or our available insurance will not be adequate to mitigate such impact.
Our ability to operate our company effectively could be impaired if we fail to attract and retain executive officers and other key personnel.
We compete in a market that involves rapidly changing technological and other developments, which requires us to attract and employ a workforce with broad expertise and intellectual capital. Our ability to operate our business and implement our strategies effectively depends, in part, on the efforts of our executive officers and other key employees. In addition, our future success will depend on, among other factors, our ability to attract, develop and retain other qualified personnel, particularly engineers and other employees with software and technical expertise. The loss of the services of any of our senior executives or other key employees or the failure to attract or retain other qualified personnel could have a material adverse effect on our business.
Impairment charges relating to our assets, goodwill and other intangible assets could adversely affect our financial performance.
If one or more of our customers’ facilities cease production or decrease their production volumes, the assets we carry related to our facilities serving such customers may decrease in value because we may no longer be able to utilize or realize them as intended. Where such decreases are significant, such impairments may have a materially adverse impact on our financial results. Impairment of goodwill and other identifiable intangible assets may result from, among other things, deterioration in our performance and especially the cash flow performance of these goodwill assets, adverse market conditions (including a resulting decline in our market capitalization from such adverse market conditions or deteriorating performance) and adverse changes in applicable laws or regulations. If there are changes in these circumstances or the other variables associated with the estimates, judgments and assumptions relating to the valuation of goodwill, when assessing the valuation of our goodwill items, we may determine that it is appropriate to write down a portion of our goodwill or intangible assets and record related non-cash impairment charges. In the event that we determine that we are required to write down a portion of our goodwill items and other intangible assets and thereby record related non-cash impairment charges, our business, results of operations and financial condition could be materially adversely affected.
We face risks related to our defined benefit pension plans and employee benefit plans, including the need for additional funding as well as higher costs and liabilities.
Our defined benefit pension plans or employee benefit plans may require additional funding or give rise to higher related costs and liabilities which, in some circumstances, could reach material amounts and negatively affect our results of operations. We are required to make certain year-end assumptions regarding our pension plans. Our pension obligations are dependent on several factors, including factors outside our control such as changes in interest rates, the market performance of the diversified investments underlying the pension plans, actuarial data and adjustments and an increase in the minimum funding requirements or other regulatory changes governing the plans. Adverse equity market conditions and volatility in the credit market may have an unfavorable impact on the value of our pension assets and our future estimated pension liabilities. Internal factors such as an adjustment to the level of benefits provided under the plans may also lead to an increase in our pension liability. There are also uncertainties as the Company settles certain benefit plan relationships with Autoliv. If these or other internal and external risks
25
were to occur, alone or in combination, our required contributions to the plans and the costs and net liabilities associated with the plans could increase substantially and have a material effect on our business.
Cybersecurity incidents could disrupt business operations, result in the loss of critical and confidential information, and adversely impact our reputation and results of operations.
We rely extensively on information technology (“IT”) networks and systems, our global data centers and services provided over the internet to process, transmit and store electronic information, and to manage or support a variety of business processes or activities across our facilities worldwide. The secure operation of our IT networks and systems and the proper processing and maintenance of this information are critical to our business operations. We have been, and likely will continue to be, subject to cyber-attacks. To date we have seen no material impact on our business from these attacks or events. Although we seek to deploy comprehensive security measures to prevent, detect, address and mitigate these threats, there has been an increased level of activity, and an associated level of sophistication, in cyber-attacks against large multinational companies. The ever-evolving threats mean we and our third-party service providers and vendors must continually evaluate and adapt our respective systems and processes and overall security environment, as well as those of any companies we acquire. There is no guarantee that these measures will be adequate to safeguard against all data security breaches, system compromises or misuses of data.
Our security measures may be breached due to human error, system malfunctions or attacks from uncoordinated individuals or sophisticated and targeted measures known as advanced persistent threats, directed at the Company, its products, its customers and/or its third-party service providers.
Disruptions and attacks on our IT systems or the systems of third parties storing our data could result in the misappropriation, loss or corruption of our critical data and confidential or proprietary information, personal information of our employees, and the leakage of our or our customers’ confidential information, improper use of our systems and networks, production downtimes and both internal and external supply shortages, which could have a material adverse effect on our business, results of operations and financial condition. The potential consequences of a material cybersecurity incident include reputational damage, litigation with third parties, diminution in the value of our investment in research, development and engineering, diversion of the attention of management away from the operation of our business and increased cybersecurity protection and remediation costs, which in turn could adversely affect our competitiveness and results of operations.
We rely on third parties to provide or maintain some of our IT systems, data centers and related services and do not exercise direct control over these systems. There is a risk that security measures implemented at our own and at third party locations may not be sufficient and that our IT systems, data centers and cloud services are vulnerable to disruptions, including those resulting from natural disasters, cyberattacks or failures in third party-provided services. While we obtain assurances that any third parties we provide data to will protect this information and, where we believe appropriate, monitor the protections employed by these third parties, there is a risk the confidentiality of data held by us or by third parties may be compromised and expose us to liability for such breach.
Cyberattacks have become increasingly frequent, sophisticated and globally widespread and could target software embedded in our products. Embedded software code could be compromised during software development or manufacturing processes or within the car itself. Cyberattacks on our products within the car can lead to malfunction or complete damage of the products, which could result into loss of control of the car and its safety features. To the extent that any disruption or security breach results in a misappropriation, loss or damage to our data, or an inappropriate disclosure of our confidential information or our customer’s information, it could cause significant damage to our reputation, affect our relationships with our customers, lead to claims against us and ultimately harm our business. In addition, we may be required to incur significant costs to protect against damage caused by these disruptions or security breaches in the future. In addition, as the regulatory environment related to information security, data collection and use, and privacy becomes increasingly rigorous, with new and constantly changing requirements applicable to our business, compliance with those requirements could result in additional costs. Any future significant compromise or breach of our data security, whether external or internal, or misuse of customer, associate, supplier or Company data, could result in significant costs, lost sales, fines, lawsuits, and damage to our reputation.
Our business is exposed to risks inherent in international operations.
We currently conduct operations in various countries and jurisdictions, including locating certain of our manufacturing and distribution facilities internationally, which subjects us to the legal, political, regulatory and social requirements and economic conditions in these jurisdictions. International sales and operations subject us to certain risks inherent in doing business abroad, including exposure to local economic and political conditions, health foreign tax consequences, issues with enforcing legal agreements, currency controls, imposition of tariffs, and preferences of foreign nations for domestically manufactured products.products, and concerns about human rights, working conditions and other labor rights and conditions and the environmental impact in foreign
26
countries where our products are produced and raw materials and/or components are sourced. These risks could have a material adverse effect on our business, results of operation and financial condition.
The 2017 Tax Cuts and Jobs Act (the “Tax Act”) significantly changed the taxation of U.S. based multinational corporations, including, inter alia,, reducing the U.S. federal corporate income tax rate from 35% to 21%, creating new taxes on certain foreign sourced earnings and a new minimum tax calculated on certain U.S. outbound payments. We have completed our accounting for the impact of the Tax Act as of December 22, 2018 based on published guidance. We expect that the U.S. Treasury Department, the Internal Revenue Service (“IRS”), and state tax authorities will be issuing additional guidance on how the provisions of the Tax Act will be applied or otherwise administered, and such guidance may be different from our current interpretation. The legislation could be subject to potential amendments and technical corrections, any of which could materially lessen or increase certain adverse impacts of the legislation. As regulations and guidance evolve with respect to the Tax Act, and as we gather information and perform more analysis, our results may differ from previous estimates and may materially affect our financial position. Changes in tax laws or policies by foreign jurisdictions could result in a higher effective tax rate on our worldwide earnings and such change could have a material adverse effect on our business, results of operations and financial condition.
Our business in China is subject to aggressive competition and is sensitive to economic and market conditions as well as restrictions placed on foreign automakers.
We operate in the highly competitive automotive supply market in China and face competition from both international and smaller domestic manufacturers. Maintaining a strong position in the Chinese market is a key component of our global growth strategy. Our business is sensitive to economic and market conditions that impact automotive sales volumes and growth in China and may be affected if the pace of growth slows as the Chinese market matures or if there are reductions in vehicle demand in China. We anticipate that additional competitors, both international and domestic, may seek to enter the Chinese market resulting in increased competition. Increased competition may result in price reductions, reduced margins and our inability to gain or hold market share. There have been periods of increased market volatility and moderation in the levels of economic growth in China, which resulted in periods of lower automotive production growth rates in China than those previously experienced. Furthermore, the Chinese government has inflatedincreased demand for domestic production of electric cars by offering purchase incentives for electric cars and has restricted foreign automakers from digital mapping within its borders impacting many of our customers’ ability to manufacture self-driving vehicles within China. Many of our customers are not domestic Chinese companies. If our non-Chinese customers are prevented or deterred from doing business in China, it could impair our position in the Chinese market. If we are unable to maintain our position in the Chinese market, the pace of growth slows or vehicle sales in China decrease, our business, results of operations and financial condition could be materially adversely affected.
We are exposed to exchange rate risks.
We have currency exposures related to buying, selling and financing in currencies other than the local currencies of the countries in which we operate. We are particularly vulnerable to a strong U.S. dollar as certain raw materials and components are sourced in U.S. dollars while sales are also currently in other currencies, like the Euro. Our risks include:
•transaction exposure, which arises because the cost of a product originates in one currency and the product is sold in another currency;
•revaluation effects, which arise from valuation of assets denominated in other currencies than the reporting currency of each unit;
•translation exposure in the income statement, which arises when the income statements of non-U.S. subsidiaries are translated into U.S. dollars;
•translation exposure in the balance sheet, which arises when the balance sheets of non-U.S. subsidiaries are translated into U.S. dollars; and
27
•changes in the reported U.S. dollar amounts of cash flows.
For example, in 20182019 the Company’s gross transaction exposure was approximately $0.7$1.0 billion, with a net exposure of $0.6$0.9 billion due to counter-flows. The five largest net transaction exposures were the sale of Euro against Swedish Krona, the purchase of U.S. Dollars against Swedish Krona,Dollar, and the purchase of U.S. Dollar against Korean Won,Won. In 2019, the sale of U.S. Dollars against Chinese Renminbi and the purchase of U.S. Dollar against Euro. Together thesefive largest currency pairs accounted for approximately 76%82% of the Company’s net currency transaction exposure. These exchange rate risks could have a material adverse effect on our business, results of operations and financial condition.
We face risks in connection with identifying, completing and integrating acquisitions.
Our business’s growth has been enhanced through strategic opportunities, including acquisitions of businesses, products and technologies, and joint development agreements. We may continue to identify and engage in strategic opportunities in the future. However, we may not be able to successfully identify suitable acquisition candidates or complete transactions on acceptable terms, integrate acquired operations into our existing operations or expand into new markets. Our failure to identify suitable strategic opportunities may restrict our ability to grow our business. These strategic opportunities also involve numerous additional risks to us and our investors, including risks related to retaining acquired management and employees, difficulties in integrating the acquired technology, products, operations and personnel with our existing business, assumption of contingent liabilities, and potentially adverse financial impact of acquisitions. Consequently, there is a risk that the acquisitions and other transactions may
not result in revenue growth, operational synergies or service or technology enhancements, which could have a material adverse effect on our business, results of operations and financial condition.
Risks associated with joint venture partnerships and other collaborations may adversely affect our business and financial results.
Certain of our operations are currently conducted through joint ventures and joint development agreements,collaborations, and we may enter into additional joint ventures and collaborations in the future. Our joint ventures and collaborations are generally focused on opening or expanding opportunities for our technologies and supporting the design and introduction of new products and services (or enhancing existing products or services). Such activities entail a high degree of risk and often require significant capital investments. We may underestimate the costs and/or overestimate the benefits, including technology, product, revenue, cost and other synergies and growth opportunities, that we expect to realize, and we may not achieve those benefits, or may do so later than expected. The market and customer demand for products and technologies provided by our joint ventures may also shift. For example, we have begun to see a shift in our customer’s focus to products and systems supporting “Level 2 plus driver assistance” technologies over systems supporting fully autonomous driving as it appears that fully autonomous vehicles will come to market in significant numbers later than previously expected. This means that some of the expectedanticipated benefits of our Zenuity joint venture, including sales from technologies provideddeveloped by our Zenuitythe joint venture, may not materialize or may come later than previously expected. As a result, we may have to evaluateWe are currently in discussions with our Zenuity joint venture partner regarding the development priorities of Zenuity in light of the market shift toward autonomous vehicle solutions and are presently evaluating our strategic and business plans for Zenuity, as well as theits ongoing funding needsneeds. The outcome of these discussions may influence the level of funding and participation of Veoneer in Zenuity, as well as future sharing of intellectual property and IP licenses and may result in a different strategy, focus, structure and/or purpose of Zenuity to account for such delays.or implementation of other strategic options being reviewed.
Furthermore, our joint venture partners may be unable or unwilling to meet their economic or other contractual obligations, and we may in some cases and/or for some time choose to fulfill those obligations alone to ensure the ongoing success of a joint venture, or we may choose to dissolve and liquidate it. For example, since we acquired a 51% interestin connection with ongoing disagreements with Nissin Kogyo, our joint venture partner in VNBS, we have unilaterally providedentered into agreements to separate and terminate the funds necessary to meet VNBS’s operational needs asjoint venture. In June 2019, we acquired Nissin Kogyo’s interests in the US operations of VNBS, or VBS, and released Nissin Kogyo has, notwithstanding repeated requests, refusedfrom any obligations to provide fundingfund VBS in proportionthe future and from any claims Veoneer may have had against Nissin Kogyo relating to its ownership. In 2019,VBS. Further, in February 2020 we completed the Company initiated a formal negotiation process undersale of our 51% ownership in the Japanese and Chinese entities that comprise the remainder of the VNBS JV Agreementjoint venture to find a resolution to this situation.Nissin Kogyo and Honda Motor Co., Ltd. thereby terminating the VNBS joint venture.
In addition, our joint venture and collaboration partners may at any time have economic, business or legal interests or goals that are inconsistent with our goals or with the goals of the joint venture. Our products and technologies may from time to time overlap with certain aspects of the technologies developed with one of our joint venture or collaboration partners which may cause the parties to consider the impact on the contractual relationship. Depending on our level of control over the governance and/or operations of a joint venture or collaboration, we may be unable to implement actions with respect to the joint venture’s activities that we believe are favorable if the joint venture partner does not agree. Disagreements with our business partners may impede our ability to maximize the benefits of our partnerships. We may have difficulty resolving disputes with or claims against our joint venture partners, which could lead to us bearing liability for claims that we are not responsible for and may have a material adverse impact on the joint venture. We may not have access to these technologies or suitable replacements
28
without these joint ventures or collaborations. If one or more of our joint venture partners or collaboration partners experiences operating difficulties or economic uncertainties, our access to these development technologies may be jeopardized and our product development may be negatively impacted. The above risks, if realized, could have a material adverse effect on our business, results of operations and financial condition.
We may not be able to respond quickly enough to changes in technology and technological risks and to develop our intellectual property into commercially viable products.
Changes in legislative, regulatory or industry requirements or in competitive technologies may render certain of our products obsolete or less attractive to our customers. We currently license certain proprietary technology to third parties and, if such technology becomes obsolete or less attractive, those licensees could terminate our license agreements, which could adversely affect our results of operations. Our ability to anticipate changes in technology and regulatory standards and to successfully develop and introduce new and enhanced products on a timely basis will be a significant factor in our ability to be competitive. There is a risk that we will not be able to achieve the technological advances that may be necessary for us to be competitive or that certain of our products will become obsolete. We are also subject to the risks generally associated with new product introductions and applications, including lack of market acceptance, delays in product development and failure of products to operate properly. As part of our business strategy, we may from time to time seek to acquire businesses or assets that provide us with additional intellectual property. We may experience problems integrating acquired technologies into our existing technologies and products, and such acquired intellectual property may be subject to known or contingent liabilities such as infringement claims. These risks could have a material adverse effect on our business, results of operations and financial condition.
Risks Related to Government Regulations & Taxes
Our business may be adversely affected by if our policies and procedures do not adequately protect our employees or others or otherwise meet the requirements of applicable laws or regulations, including international, environmental, occupational health and safety or other governmental regulations.
We are subject to various federal, state, local and foreign laws and regulations, including those related to the requirements of environmental, occupational health and safety, financial and other matters. We cannot predict the substance or impact of pending or future legislation or regulations, or the application thereof. The introduction of new laws or regulations or changes in existing
laws or regulations, or the interpretations thereof, could increase the costs of doing business for us or our customers or suppliers or restrict our actions and adversely affect our operating results, cash flows and financial condition.
Our operations are subject to environmental and safety laws and regulations governing, among other things, emissions to air, discharges to waters and the generation, handling, storage, transportation, treatment and disposal of waste and other materials. The operation of automotive parts manufacturing facilities entails risks in these areas, and there is a risk that we will incur material costs or liabilities as a result. Additionally, environmentalEnvironmental laws, regulations, and permits and the enforcement thereof change frequently and have tended to become increasingly stringent over time,time. The operation of automotive parts manufacturing facilities entails health and safety and environmental risks, and our development processes includes vehicle testing and data collection that could expose employees to risks inherent in driving on public roads and test tracks. Although we employ safety procedures in the design and operation of our facilities and development programs, there is a risk that an accident or injury could occur. Any accident or injury could result in litigation, manufacturing and/or development delays, property loss and/or and harm to our reputation, which may necessitate substantial capital expenditures orcould negatively affect our business, operating results and financial condition. In addition, here is a risk that we will incur material costs or may require changes of production processes.liabilities including fines and/or penalties if regulators determine that proper controls were not in place.
We are also subject to local regulations and declarations related to public health issues, including travel bans, quarantines and mandated facility closures implemented in response to local, national or international epidemics or pandemics. Any unanticipated limitations on our ability to operate or our employees or contractors’ ability to travel or work could inhibit our ability to maintain customer supply, either directly or through impact on our suppliers.
Due to our global operations, we are also subject to many laws governing our activities in other countries (including, but not limited to, the Foreign Corrupt Practices Act, and other anti-bribery regulations in foreign jurisdictions where we do business, and the U.S. Export Administration Act), which prohibit improper payments to government officials and restrict where and how we can do business, what information or products we can supply to certain countries and what information we can provide to authorities in governmental authorities.
There is a risk that our policies and procedures will not protect us from the intentional or reckless acts of our employees or representatives, particularly in the case of recently acquired operations that may not have significant training in applicable compliance policies and procedures. Any costs, liabilities, and obligations that we incur relating to such regulations could have a material adverse effect on our business, results of operations and financial condition.
29
Our business may be adversely affected by changes in automotive safety regulations or concerns that drive further regulation of the automobile safety and autonomous driving markets.
Government vehicle safety regulations are a key driver in our business. Historically, these regulations have imposed ever more stringent safety regulations for vehicles. Safety regulations have a positive impact on driver awareness and acceptance of active safety products and technology. These more stringent safety regulations often require vehicles to have more safety content per vehicle and more advanced safety products, including active safety technology, which has thus been a driver of growth in our business.
These regulations are subject to change based on a number of factors that are not within our control, including new scientific or medical data, adverse publicity regarding autonomous vehicles or technology, domestic and foreign political developments or considerations, and litigation relating to our products and our competitors’ products. Changes in government regulations in response to these and other considerations could have a severe impact on our business. If government priorities shift and we are unable to adapt to changing regulations, our business may suffer material adverse effects.
The regulatory obligation of complying with safety regulations could increase as federal and local regulators impose more stringent compliance and reporting requirements in response to product recalls, safety issues and product innovations in our industry. In the U.S., we are subject to the existing Transportation Recall Enhancement, Accountability and Documentation (TREAD) Act, which requires manufacturers to comply with “Early Warning” requirements by reporting to the National Highway Traffic Safety Administration (“NHTSA”) information related to defects or reports of injurydeath related to their products. TREAD imposes criminal liability for violating such requirements if a defect subsequently causes death or bodily injury. In addition, the National Traffic and Motor Vehicle Safety Act authorizes NHTSA to require a manufacturer to recall and repair vehicles that contain safety defects or fail to comply with federal motor vehicle safety standards. TheIn September 2016, U.S. Department of Transportation issued a Federal Automated Vehicles Policy as agency guidance for comment rather than in a rulemaking in order to enable the delivery of an initial regulatory framework and best practices to guide manufacturers and other entities in the safe design, development, testing, and deployment of highly automated vehicles. Since September 2016, the U.S. Department of Transportation has issued voluntary “guidance” for autonomous vehicle (AV) standards, including the most recent “Ensuring American Leadership in Automated Vehicle Technologies – Automated Vehicles 4.0” dated January 2020, to promote autonomous vehicle development. It is unknown when specific U.S. regulations for AVs may be released and what, if any, impact such regulations may have on us or our customers in 2016 that require manufacturersterms of certain autonomous vehicles to provide documentation covering specific topics to regulators, such as how automated systems detect objects on the road, how information is displayed to drivers, what cybersecurity measures are in placeproducts, features and the methods used to test the design and validation of autonomous driving systems.performance requirements.
As our technologies advance and develop beyond traditional automotive products, we may be subject to regulatory regimes beyond traditional vehicle safety rules and requirements. As a result, we may not identify all regulatory licenses or permits required for
our products, or our products may operate beyond the scope of the licenses and permits we have obtained. Failing to obtain the required licenses, permits or other regulatory authorizations could result in investigations, fines or other penalties or proceedings. If any of the regulatory risks described above materialize, it could have a material adverse effect on our business, results of operations and financial condition. We may have exposure to greater than anticipated tax liabilities.
We may have exposure to greater than anticipated tax liabilities.
The determination of our worldwide provision for income taxes and other tax liabilities requires estimation and significant judgment, and there are many transactions and calculations where the ultimate tax determination is uncertain. As a multinational corporation, we are subject to tax in multiple U.S. and foreign tax jurisdictions. Our determination of our tax liability is always subject to audit and review by applicable domestic and foreign tax authorities. Although we are currently under audit in a jurisdiction, we are indemnified by Autoliv for any tax settlements for tax periods prior to April 1, 2018. Any adverse outcome of any such audit or review for tax periods after April 1, 2018 could have a negative effect on our business and the ultimate tax outcome may differ from the amounts recorded in our financial statements and may materially affect our financial results in the period or periods for which such determination is made. There is a risk that our established reserves, which are based on assumptions and estimates that we believe are reasonable to cover such eventualities, may prove to be insufficient. In addition, our future income taxes could be adversely affected by earnings being lower than anticipated (or by the incurrence of losses) in jurisdictions that have lower statutory tax rates and higher than anticipated in jurisdictions that have higher statutory tax rates, by changes in the valuation of our deferred tax assets and liabilities, or changes in tax laws, regulations, or accounting principles, as well as certain discrete items.
The United Kingdom’s (“U.K.”) referendum to exit from the European Union (“E.U.”) will continue to have uncertain effects and could have an adverse effect on our business and financial results.
On June 23, 2016, the U.K. held a referendum in which voters approved an exit from the E.U. (commonly referred to as “Brexit”), and the U.K. ceased to be a member state of the E.U. on January 31, 2020. As a result of Brexit, the U.K. will lose
30
access to the E.U. single market and to E.U. trade deals negotiated with other jurisdictions at that time, so the long-term effects of Brexit will depend on the agreements or arrangements with the E.U. for the U.K. to retain access to E.U. markets either during a transitional period or more permanently. The long-term effects of Brexit may include, among other things, greater restrictions on imports and exports between the U.K. and E.U. countries, a fluctuation in currency exchange rates and additional regulatory complexity. Such changes could be costly and potentially disruptive to our operations and business relationships in these markets. If we are unable to manage any of these risks effectively, our business and financial results could be adversely affected. Our operations in the U.K. represented an immaterial part of our business as of December 31, 2019.
Risks Related to the 2018 Spin-Off and Our Operation as a Stand-Alone Companyfrom Autoliv
We have a limited history of operating as an independent, stand-alone company, and our historical financial information does not predict our future results.results.
Our historical financial information in this Annual Report on Form 10-K for the period ended December 31, 2019 in relation to periods or times up to the Spin-Off refers to our business as operated by and integrated with Autoliv. Our historical financial information included in this Annual Report on Form 10-Kpriorin relation to periods or times prior to the completion of the Spin-Off is derived from the consolidated financial statements and accounting records of Autoliv. Accordingly, the historical financial information included herein in this Annual Report on Form 10-Krelation to periods or times prior to the completion of the Spin-Off does not necessarily reflect the financial condition, results of operations or cash flows that we would have achieved as a separate, publicly traded company during the periods presented or those that we will achieve in the future primarily as a result of the factors described below.
Prior to the Spin-Off, our business was operated by Autoliv as part of its broader corporate organization, rather than as an independent company. Autoliv or one of its affiliates performed various corporate functions for us, such as legal, accounting, treasury, internal auditing, and human resources and also provided our IT and other corporate infrastructure. Our historical financial results reflect allocations of corporate expenses from Autoliv for such functions and are likely to be less than the expenses we would have incurred had we operated as a separate publicly traded company. As a result of the Spin-Off, we are responsible for the costs related to such functions previously performed by Autoliv, and such costs have increased. Autoliv is providing some of these functions to us pursuant to a transition services agreement. See “Spin-Off Related Agreements-Amended and Restated Transition Services Agreement.” We will need to make investments to replicate or outsource from other providers certain facilities, systems, infrastructure, and personnel to which we no longer have access as a result of the Spin-Off. These initiatives to develop our independent ability to operate without access to Autoliv’s existing operational and administrative infrastructure will have a cost to implement. We may not be able to operate our business efficiently or at comparable costs, and our profitability may decline. Additionally, prior to the Spin-Off, we shared economies of scale in costs, employees, vendor relationships and customer relationships with Autoliv. Although we have entered into a transition services agreement with Autoliv for certain services, these arrangements may not fully capture the benefits that we have enjoyed as a result of being integrated with Autoliv and may result in us paying higher amounts than in the past for certain products and services. This could have an adverse effect on our results of operations and financial condition as separate, publicly traded company.
Other significant changes may occur in our cost structure, management, financing and business operations, as compared to the past financial performance of our business, as a result of operating as a company separate from Autoliv. These risks could, individually or in the aggregate, have a material adverse effect on our business, results of operations and financial condition.
Our ability to meet our capital needs havehas materially changed by the loss of financial support from Autoliv since the Spin-Off, and it may be more difficult for us to obtain capital to fund our business.
The loss of financial support from Autoliv since the completion of the Spin-Off has changed our previous source of capitalcapital. Autoliv previously provided certain capital that was needed in excess of the amounts generated by our operating activities. We currently expect to obtain any funds needed in excess of the amounts contributed by Autoliv in the Spin-Off and generated by our operating activities through the capital markets, bank financing, strategic relationships or other arrangements, and not from Autoliv. However, given the smaller relative size of our company, as compared to Autoliv after the Spin-Off, we may incur higher debt servicing and other costs relating to new indebtedness than we would have otherwise incurred as a part of Autoliv. As a stand-alone company, the cost of our financing also will depend on other factors such as our performance and financial market conditions generally. Further, we cannot guarantee you that we will be able to obtain capital market financing or credit on favorable terms, or at all, in the future. We cannot assure you that our ability to meet our capital needs will not be harmed by the loss of financial support from Autoliv.
We may be unable to achieve some or all of the benefits that we expect to achieve from the Spin-Off.
We and Autoliv believe that the tax-free Spin-Off will enhance our long-term value. However, by separating from Autoliv, we may be more susceptible to market fluctuations and other adverse events than we would have been were we still a part of
31
Autoliv. In addition, we may not be able to achieve some or all of the benefits that we expect to achieve as an independent company in the time we expect, if at all.
We may be responsible for U.S. federal income tax liabilities that relate to the distribution.
Autoliv received an opinion from its outside tax counsel to the effect that the distribution of our common stock, together with certain related transactions, should qualify as a transaction that is tax-free under Sections 368(a)(1)(D) and 355 of the Code. The opinion was based on and relied on, among other things, certain facts and assumptions, as well as certain representations, statements and undertakings of Autoliv and the Company, including those relating to the past and future conduct of Autoliv and the Company. If any of these representations, statements or undertakings are, or become, inaccurate or incomplete, or if Autoliv or the Company breach any of their respective covenants in the Spin-Off documents, the opinion of counsel may be invalid and the conclusions reached therein could be jeopardized. Notwithstanding the opinion of counsel, the IRS could determine that the distribution, together with certain related transactions, should be treated as a taxable transaction if the IRS determines that any of these representations, assumptions, or undertakings upon which such opinion was based are incorrect or have been violated or if the IRS disagrees with the conclusions in the opinion of counsel. An opinion of counsel is not binding on the IRS or any court and there is a risk that the IRS notwill challenge the conclusions reached in the opinion. The IRS did not provide any opinion in advance of the Spin-Off that the Spin-Off will be tax-free.
If the distribution, together with certain related transactions, failed to qualify as a transaction that is generally tax-free under Sections 368(a)(1)(D) and 355 of the Code, Autoliv would recognize taxable gain as if it had sold our common stock in a taxable sale for its fair market value, Autoliv stockholders who received our common stock in the distribution would be subject to tax as if they had received a taxable distribution equal to the fair market value of such shares, and we could incur significant liabilities. In addition, if the Spin-Off is not tax-free, Veoneer would be responsible for tax liabilities as allocated by the Tax Matters Agreement.
Even if the Spin-Off otherwise qualifies as a tax-free transaction for U.S. federal income tax purposes, the distribution will be taxable to Autoliv if there are (or have been) one or more acquisitions (including issuances) of our stock or the stock of Autoliv, representing 50% or more, measured by vote or value, of the stock of any such corporation and the acquisition or acquisitions are deemed to be part of a plan or series of related transactions that include the distribution. Any acquisition of our common stock within two years before or after the distribution (with exceptions, including public trading by less-than-5% stockholders and certain compensatory stock issuances) generally will be presumed to be part of such a plan unless that presumption is rebutted. The resulting tax liability would be substantial, and under U.S. Treasury regulations, each member of the Autoliv group at the time of the Spin-Off (including us and our subsidiaries) would be severally liable for the resulting U.S. federal income tax liability.
Pursuant to the Tax Matters Agreement, we agreed not to enter into certain transactions that could cause any portion of the Spin-Off to be taxable to Autoliv, including under Section 355(e) of the Code. We also agreed to indemnify Autoliv for any tax liabilities resulting from such transactions or other actions we take, and Autoliv agreed to indemnify us for any tax liabilities resulting from transactions entered into by Autoliv. These obligations may discourage, delay or prevent a change of control of our company, which could have a materially adverse effect on our business. For additional details, see “Spin-Off Related Agreements, Tax Matters Agreement.”
Our internal controls around accounting and financial reporting may not be adequate to ensure complete and accurate reporting of our financial position, results of operations and cash flows.
The Exchange Act requires that we file annual, quarterly and current reports with respect to itsour business and financial condition. Under the Sarbanes Oxley Act, we are required to maintain effective disclosure controls and procedures and internal controls over financial reporting. Any failure to achieve and maintain effective internal controls could have a material adverse effect on our business, results of operations and financial condition.
We could incur substantial additional costs and experience temporary business interruptions as we install and implement our information technology infrastructure and transition our data to our own systems.
We have begun to install and implementare finalizing the implementation of information technology infrastructure to support certain of our business functions, including accounting and reporting, manufacturing process control and distribution. We may incur temporary interruptions in business operations if we cannot fully transition effectively from Autoliv’s existing transactional and operational systems, data centers and the transition services that support these functions. We may not be successful in implementing our new systems and transitioning our data, and we may incur substantially higher costs for implementation than currently anticipated. Our failure to avoid operational interruptions as we implement the new systems and replaces Autoliv’s information technology services, or our failure to implement the new systems and replace Autoliv’s services successfully, and any substantially higher costs could
32
disrupt our business and have a material adverse effect on our business, results of operations and financial condition and.condition. In addition, if we are unable to replicate or transition certain systems, our ability to comply with regulatory requirements could be impaired.
Autoliv may fail to perform under various agreements that were executed in connection with the Spin-Off and we may have greater costs or potential liability pursuant to such agreements.
In connection with the internal reorganization and Spin-Off, we and Autoliv entered into a Master Transfer Agreement, Distribution Agreement and various other agreements, including the Transition Services Agreement, Tax Matters Agreement and an Employee Matters Agreement. Certain of these agreements provide for the performance of services by each company for the benefit of the other following the Spin-Off. We are relying on Autoliv to satisfy its performance and payment obligations under these agreements. If Autoliv is unable to satisfy its obligations under these agreements, including its indemnification obligations, we could incur operational difficulties or losses.
Furthermore, these agreements may not reflect terms that would have resulted from arm’s-length negotiations among unaffiliated third parties. To the extent that certain terms of those agreements provide for rights and obligations that could have been procured from third parties, we may have received better terms from third parties. There is a risk that we may incur greater costs or be subject to greater potential liability pursuant to our agreements with Autoliv for certain rights and obligations that could have been procured from unaffiliated third parties. See “Spin-Off Related Agreements.”
Currently, we rely on Autoliv to provide certain corporate and administrative services such as certain information technology, financial and human resource services. We are in the process of creating our own, or engaging third parties to provide, systems and services to replace many of the systems and services Autoliv currently provides to us pursuant to the Transition Services Agreement. If Autoliv is unable or unwilling to provide such services pursuant to the Transition Services Agreement, or if we do not have in place our own systems and services, or if we do not have agreements with other providers of these services, once the agreement is terminated prior to the end of its term,terminates, or if these services are only available for substantially less favorable terms, we may not be unableable to provide such services ourselves or weoperate our business effectively and our financial condition and result of operations may have to incur additional expenditures to obtain such services from another provider.be adversely affected. The Transition Services Agreement terminates on April 1, 2020.
Potential indemnification liabilities to Autoliv or a refusal of Autoliv to indemnify us pursuant to the Distribution Agreement could materially adversely affect us.
The transaction documents we entered into with Autoliv in connection with the internal reorganization and the Spin-Off provide for cross-indemnities that require Autoliv and Veoneer to bear financial responsibility for each company’s business prior to the internal reorganization or Spin-Off, as applicable, and to indemnify the other party in connection with a breach of such party of the transaction agreements; provided, however, certain warranty, recall and product liabilities for electronics products manufactured prior to the completion of the internal reorganization have been retained by Autoliv and Autoliv will indemnify us for any losses associated with such warranty, recall or product liabilities pursuant to the distribution agreement entered into as part of the Spin-Off.Distribution Agreement. If we are required to indemnify Autoliv under the circumstances set forth in the transaction documents, we may be subject to substantial liabilities. In addition, there can be no assurance that the indemnities from Autoliv will be sufficient to protect us against the full amount of any potential liabilities. Even if we do succeed in recovering from Autoliv any amounts for which we are held liable, we may be temporarily required to bear these losses ourselves. In addition, each of these risks could have a material adverse effect on our business, results of operations and financial condition.
We may be unable to take certain actions because such actions could jeopardize the tax-free status of the Spin-Off, and such restrictions could be significant.
To preserve the tax-free treatment of the Spin-Off, for the initial two-year period following the Spin-Off, we are prohibited, except in limited circumstances, from taking or failing to take certain actions that would prevent the Spin-Off and related transactions from being tax-free, including: (1) entering into any transaction pursuant to which our stock would be acquired, whether by merger or otherwise; (2) issuing any equity securities or securities that could possibly be converted into our equity securities; (3) selling or otherwise disposing of substantially all of our assets; or (4) repurchasing our equity securities. These restrictions may limit our ability to issue equity and to pursue strategic transactions or engage in new business or other transactions that may maximize the value of our business. In addition, if we take, or fail to take, actions that prevent the Spin-Off and related transactions from being tax-free, we could be liable for the adverse tax consequences resulting from such actions. See “Spin-Off Related Agreements, Tax Matters Agreement.”
33
The Spin-Off and related transactions may expose us to potential liabilities arising out of state and federal fraudulent conveyance laws and legal distribution requirements.
The Spin-Off could be challenged under various state and federal fraudulent conveyance laws. An unpaid creditor or an entity vested with the power of such creditor (such as a trustee or debtor-in-possession in a bankruptcy) could claim that Autoliv did not receive fair consideration or reasonably equivalent value in the Spin-Off, and that the Spin-Off left Autoliv insolvent or with unreasonably small capital or that Autoliv intended or believed it would incur debts beyond its ability to pay such debts as they mature. If a court were to agree with such a plaintiff, then such court could void the Spin-Off as a fraudulent transfer and could impose a number of different remedies, including without limitation, returning our assets or your shares in our company to Autoliv
or providing Autoliv with a claim for money damages against us in an amount equal to the difference between the consideration received by Autoliv and the fair market value of our company at the time of the Spin-Off. No assurance can be given as to what standard a court would apply to determine insolvency or that a court would determine that Autoliv was solvent at the time of or after giving effect to the Spin-Off, including the distribution of our common stock.
Certain of our officers and directors may have actual or potential conflicts of interest because of their service as executive officers or directors of Autoliv.
Certain of our directors and officers own Autoliv common stock and equity awards. Even though our board of directors consists of a majority of directors who are independent, several of our directors continue to have a financial interest in Autoliv common stock and equity awards. Continuing ownership of Autoliv common stock and equity awards, or service as a director at both companies could create, or appear to create, potential conflicts of interest for our directors and officers with prior or continuing positions with Autoliv if we have disagreements with Autoliv about the agreements between us that continue or face decisions that could have different implications for us and Autoliv.
Risks Related to Investing in Our Securities
Our board of directors may change significant corporate policies without stockholder approval.
Our financing, borrowing and dividend policies and our policies with respect to all other activities, including growth, debt, capitalization and operations, are determined by our board of directors. These policies may be amended or revised at any time and from time to time at the discretion of our board of directors without a vote of our stockholders. In addition, our board of directors may change our policies with respect to conflicts of interest provided that such changes are consistent with applicable legal requirements. A change in these policies could have a material adverse effect on our business, results of operations, financial condition, the per share trading price of our common stock and our ability to satisfy our debt service obligations and to pay dividends to our stockholders.
Anti-takeover provisions in our organizational documents and Delaware law might discourage or delay acquisition attempts for us that you might consider favorable.
Our certificate of incorporation and bylaws contain provisions that may make the merger or acquisition of the Company more difficult without the approval of our board of directors. Among other things:
•although we do not have a stockholder rights plan, our certificate of incorporation allows us to authorize the issuance of undesignated preferred stock in connection with a stockholder rights plan or
•otherwise, the terms of which may be established and the shares of which may be issued without stockholder approval, and which may include super voting, special approval, dividend, or other rights or preferences superior to the rights of the holders of common stock;
•we have a classified board of directors, and any director may be removed only for cause and only by the affirmative vote of at least 75% of the voting power of all the then-outstanding shares of voting stock;
•our board of directors is expressly authorized to make, alter or repeal our bylaws and our stockholders may only amend our bylaws by the affirmative vote of at least 80% of the voting power of all the then-outstanding shares of voting stock;
•our certificate of incorporation and bylaws permits only our board of directors to call special meetings of stockholders;
•our certificate of incorporation and bylaws do not permit stockholder action by written consent; and
•our bylaws establish advance notice requirements for nominations for elections to our board of directors or for proposing matters that can be acted upon by stockholders at stockholder meetings.
Further, as a Delaware corporation, we are subject to provisions of Delaware law, which may impair a takeover attempt that our stockholders may find beneficial. These anti-takeover provisions and other provisions under Delaware law could discourage, delay or prevent a transaction involving a change in control of the Company, including actions that our stockholders may deem
34
advantageous, or negatively affect the trading price of our common stock. These provisions could also discourage proxy contests and make it more difficult for you and other stockholders to elect directors of your choosing and to cause us to take other corporate actions you desire.
Our certificate of incorporation designates the Court of Chancery of the State of Delaware as the sole and exclusive forum for certain litigation that may be initiated by our stockholders, which could limit our stockholders’ ability to obtain a favorable judicial forum for disputes with us or our current or former directors, officers or stockholders.
Our certificate of incorporation provides that, unless we consent to the selection of an alternative forum, the Court of Chancery of the State of Delaware will be the sole and exclusive forum for (i) any derivative action or proceeding brought on our behalf, (ii) any action asserting a claim of breach of a fiduciary duty owed by any of our stockholders, directors, officers or other employees
to us or to our stockholders, (iii) any action asserting a claim arising out of or pursuant to the Delaware General Corporation Law, (iv) the certificate of incorporation or amended and bylaws, or (v) any action asserting a claim government by the internal affairs doctrine. At our 2019 annual meeting of stockholders, we intend to ask our stockholders to vote on whether to keep this provision in our certificate of incorporation. This choice of forum provision may only be amended by the affirmative vote of at least 80% of the voting power of all the outstanding shares of common stock entitled to vote, which may have the effect of making this provision difficult to repeal by our stockholders. Any person or entity purchasing or otherwise holding any interest in shares of our capital stock will be deemed to have notice of, and consented to, the provision in our restated certificate of incorporation related to choice of forum. This provision may have the effect of discouraging lawsuits against our directors, officers or employees by limiting our stockholders’ ability to bring a claim in a judicial forum that they find favorable for disputes.
The market price and trading volume of our common stock may fluctuate widely.
The market price of our common stock may fluctuate significantly, depending upon many factors, some of which may be beyond our control, including, but not limited to:
•a shift in our investor base;
•our quarterly or annual earnings, or those of comparable companies;
•actual or anticipated fluctuations in our operating results;
•our ability to obtain financing as needed;
•changes in laws and regulations affecting our business;
•changes in accounting standards, policies, guidance, interpretations or principles;
•announcements by us or our competitors of significant investments, acquisitions or dispositions;
•the failure of securities analysts to cover our common stock;
•changes in earnings estimates by securities analysts or our ability to meet those estimates;
•the operating performance and stock price of comparable companies;
•overall market fluctuations;
•a decline in the automotive market; and
•general economic conditions and other external factors.
Future issuances of common stock by us may cause the market price of our common stock to decline.
Sales of a substantial number of shares of our common stock in the public market, or the perception that these sales could occur, could substantially decrease the market price of our common stock.
In connection with the Spin-Off, we adopted an equity incentive plan in which our employees, non-employee directors and other service providers may participate, under which an aggregate of 3,000,000 shares of our common stock are available for future issuance, plus a number of shares to satisfy equity-based awards that were issued to holders of certain equity awards outstanding under Autoliv’s Amended and Restated Stock Incentive Plan at the time of the Spin-Off .Spin-Off. We filed a registration statement on Form S-8 under the Securities Act to register shares of our common stock or securities convertible into or exchangeable for shares of our common stock issued pursuant to our equity incentive plan. Accordingly, shares registered under such registration statement are available for sale in the open market.
Your ownership in our stock may be diluted by additional equity issuances.
Your percentage ownership in our common stock could be diluted in the future as a result of equity issuances for acquisitions, capital market transactions or otherwise, including any equity awards that we grant to our directors, officers and employees. Such awards could have a dilutive effect on our earnings per share, which could adversely affect the market price of our common stock. In addition, our certificate of incorporation authorizes us to issue, without the approval of our stockholders, one or more classes or series of preferred shares having such designation, powers, preferences and relative, participating, optional and other special rights as our board of directors generally may determine. The terms of one or more classes or series of preferred shares could dilute the voting power or reduce the value of our common stock.
35
We have no current plans to pay cash dividends on our common stock, and certain factors could limit our ability to pay dividends in the future.
The declaration, amount and payment of any future dividends on shares of our common stock will be at the absolute and sole discretion of our board of directors. Our board of directors may take into account general and economic conditions, our financial condition and results of operations, our available cash and current and anticipated cash needs, capital requirements, contractual, legal, tax and regulatory restrictions and implications on the payment of dividends by us to our stockholders or by our subsidiaries to us
and such other factors as our board of directors may deem relevant. In addition, our ability to pay dividends may be limited by covenants of indebtedness we or our subsidiaries incur in the future. We have no current plans to pay any cash dividends.
Risks Related to an Investment in our SDRs
Veoneer SDR holders do not have the same rights as our stockholders.
A Veoneer SDR holder does not have equivalent rights as our holders of common stock, whose rights are governed by U.S. federal law and the Delaware General Corporation Law. The rights of Veoneer SDR holders are set forth and described in to the General Terms and Conditions for Swedish Depository Receipts in Veoneer (the “General Terms and Conditions”). Although the General Terms and Conditions generally allow Veoneer SDR holders to vote in general meetings of stockholders or to be entitled to dividends as if they held our shares of common stock directly, the rights of Veoneer SDR holders differ in some instances from the rights of Veoneer stockholders. In particular, Veoneer SDR holders do not have the ability to nominate directors for election or bring proposals before our annual meeting to the extent provided for in our governing documents or by applicable U.SU.S. state or federal law. Additionally, Veoneer SDR holders may not be able to enforce their rights under the General Terms and Conditions in relation to their SDRs in the same manner as one of our stockholders could with respect to our shares of common stock under applicable U.S. law.
The trading market for Veoneer SDRs may be limited in the future.
There is a risk that a trading market for Veoneer SDRs will not develop or be sustained in the future. Veoneer SDRs traded in Stockholm are not equivalent to a Swedish security being traded on Nasdaq Stockholm. Specifically, Veoneer SDRs represent shares of a U.S. company and are not themselves shares of stock. The lack of an active trading market may make it more difficult for you to sell your Veoneer SDRs and could lead to the price of Veoneer SDRs being depressed or more volatile.
Item 1B. Unresolved Staff Comments
Not applicable.
Item 2. Properties
Veoneer’s principal executive offices are located at Klarabergsviadukten 70, Section C6, SE-111 64, Stockholm, Sweden. Veoneer’s various businesses operate in a number of production facilities and offices. Veoneer believes that its properties are adequately maintained and suitable for their intended use and that the Company’s production facilities have adequate capacity for the Company’s current and foreseeable needs. All of Veoneer’s production facilities and offices are owned or leased by operating (either subsidiary or joint venture) companies.
As of December 31, 2018,2019, including our VNBS joint venture operations, we owned or leased 10 manufacturing facilities and 2227 technical centers and several sales and administrative offices. We have a presence in 13 countries. Our global scale enables us to engineer globally and manufacture locally to serve our global and local customers.
The following tables shows the regional distribution of what we consider our material manufacturing facilities and technical sites:
VEONEER MANUFACTURING FACILITIES
| Country/ Company | Location of Facility | Reporting Segment(s) | Items Produced at Facility | Owned/ Leased | ||||||||||||||||||||||
| Canada | ||||||||||||||||||||||||||
| Veoneer Canada Inc. | Markham | Electronics | Airbag electronics, radar sensors | Leased | ||||||||||||||||||||||
| China | ||||||||||||||||||||||||||
| Veoneer (China) Co., Ltd. | Shanghai | Electronics | Airbag electronics, radar sensors | Owned | ||||||||||||||||||||||
| Veoneer Nissin Brake Systems (Zhongshan) Co., Ltd | Zhongshan | Brake Systems | Brake control systems | Owned | ||||||||||||||||||||||
| France | ||||||||||||||||||||||||||
| Veoneer France SAS | Saint-Etienne du Rouvray | Electronics | Airbag electronics, ADAS ECUs | Owned | ||||||||||||||||||||||
| Japan | ||||||||||||||||||||||||||
| Veoneer Nissin Brake Systems Japan Co., Ltd. | Ueda | Brake Systems | Brake control systems | Leased | ||||||||||||||||||||||
| Sweden | ||||||||||||||||||||||||||
| Veoneer Sweden AB | Vårgårda | Electronics | Airbag electronics, vision cameras and radar | Owned | ||||||||||||||||||||||
| USA | ||||||||||||||||||||||||||
| Veoneer US, Inc. | Goleta, CA | Electronics | Night vision | Leased | ||||||||||||||||||||||
| Veoneer Nissin Brake Systems America, LLC | Findlay, OH | Brake Systems | Brake control systems | Leased | ||||||||||||||||||||||
37
TECHNICAL CENTERS
| Country / Company | Location | Reporting Segment(s) | Product(s) Supported | |||||||||||||||||
| Veoneer China Co., Ltd. | Shanghai | Electronics | Customer applications and platform development with full-scale test laboratory | |||||||||||||||||
| France | ||||||||||||||||||||
| Veoneer France SAS | Cergy-Pontoise | Electronics | Customer applications and platform development with full-scale test laboratory | |||||||||||||||||
| Germany | ||||||||||||||||||||
| Veoneer Germany GmbH | Electronics | Customer applications and platform development with full-scale test laboratory | ||||||||||||||||||
| Electronics | Customer application test facility | |||||||||||||||||||
| India | ||||||||||||||||||||
| Veoneer India Private Limited | Bangalore | Electronics | Customer applications and platform development | |||||||||||||||||
| Japan | ||||||||||||||||||||
| Veoneer Japan Ltd. | Hiroshima | Electronics | Customer applications and platform development | |||||||||||||||||
| Electronics | Customer applications and platform development | |||||||||||||||||||
| Romania | ||||||||||||||||||||
| Timisoara | Electronics | |||||||||||||||||||
| Customer applications and platform development | ||||||||||||||||||||
| Veoneer Korea Ltd. | Hwaseong-shi | Electronics | Customer applications | |||||||||||||||||
| Veoneer US, Inc. | Southfield, MI | Electronics | Brake control systems, electronics customer application and platform development | |||||||||||||||||
| Lowell, MA | Electronics | Electronics platform development | ||||||||||||||||||
Our joint venture, Zenuity, leases a material technical centerscenter in Munich, Germany, Göteborg, Sweden and Farmington Hills, Michigan, USA.Sweden.
Item 3. Legal Proceedings
Various claims, litigation and proceedings are pending or threatened against the Company or its subsidiaries, covering a range of matters that arise in the ordinary course of its business activities with respect to commercial, product liability and other matters.
Certain legal proceedings in which the Company is involved are discussed in Note 16 - "Commitments and Contingencies" of Part II, Item 8 "Financial Statements and Supplementary Data" and should be considered an integral part of Part I, Item 3 "Legal Proceedings."
Item 4. Mine Safety Disclosures
Not applicable.
Part II
Item 5. Market for Registrant’s Common Equity, Related Stockholder Matters and Issuer Purchases of Equity Securities
Our common stock is traded on the New York Stock Exchange under the trading symbol "VNE" and our Swedish Depository Receipt ("SDRs") representing shares of our common stock are traded on Nasdaq Stockholm under the trading symbol "VNE SDB". As of February 15, 2019,13, 2020, the Company had 87,178,772111,408,845 shares of its common stock, $1.00 par value per share, outstanding, which were owned by approximately 54,00041,000 beneficial shareholders of record.record as of December 31, 2019.
Performance Graph
The following graph compares the cumulative total stockholder return from July 2, 2018, through December 31, 2018, for2019, of Veoneer's existing common stock, the S&P 500 Index and the Dow Jones U.S. Auto Parts Index. The graph belowcomparison assumes that $100 was invested on July 2, 2018, in each of the Company's common stock the stocks comprising the S&P 500 Index and the stocks comprising the Dow Jones U.S. Auto Parts Index,each index, and that all that dividends have been reinvested.
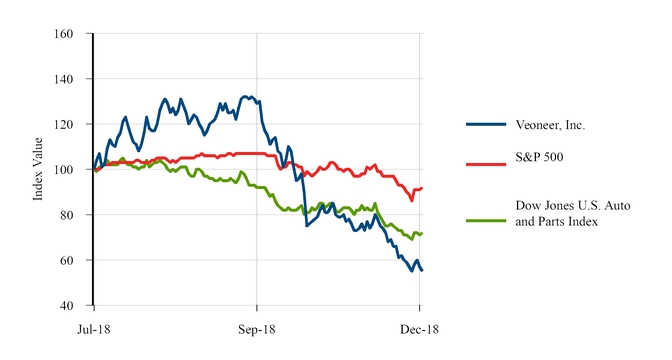

| 2 July 2018 | 31 December 2018 | 30 June 2019 | 31 December 2019 | ||||||||||||||
| Veoneer, Inc. | $100.00 | $55.26 | $40.59 | $36.62 | |||||||||||||
| S&P 500 | $100.00 | $91.94 | $107.89 | $118.49 | |||||||||||||
| Dow Jones U.S. Auto & Parts Index | $100.00 | $92.24 | $83.69 | $89.78 | |||||||||||||
| 2 July 2018 | 28 September 2018 | 31 December 2018 | |
| Veoneer, Inc. | $100.00 | $129.12 | $55.26 |
| S&P 500 | $100.00 | $106.87 | $91.94 |
| Dow Jones U.S. Auto & Parts Index | $100.00 | $92.24 | $71.67 |
The above comparisons are required by the Securities and Exchange Commission and are not intended to forecast or be indicative of possible future performance of the Company's common stock or the referenced indices.
Item 6. Selected Financial Data
The following statement of operations, statement of cash flows and balance sheet data were derived from the Company's consolidated financial statements for the years ended December 31, 2019, 2018, 2017, 2016 2015 and 2014.2015. This information should be read in conjunction with Item 7, “Management's Discussion and Analysis of Financial Condition and Results of Operations” and Item 8, “Financial Statements and Supplementary Data” in this Report.
| Year Ended December 31 | ||||||||||||||||||||||||||||||||||||||||||||||||||||||||
Dollars in millions, (except where specified) | 2019 | 2018 3 | 2017 3 | 2016 3 | 2015 3 | |||||||||||||||||||||||||||||||||||||||||||||||||||
| Operating Results: | ||||||||||||||||||||||||||||||||||||||||||||||||||||||||
| Net Sales | $ | 1,902 | $ | 2,228 | $ | 2,322 | $ | 2,218 | $ | 1,589 | ||||||||||||||||||||||||||||||||||||||||||||||
Operating Income / (loss)1 | $ | (460) | $ | (197) | $ | (283) | $ | (25) | $ | (8) | ||||||||||||||||||||||||||||||||||||||||||||||
| Net Income / (loss) | $ | (522) | $ | (294) | $ | (344) | $ | (60) | $ | (30) | ||||||||||||||||||||||||||||||||||||||||||||||
| Net Income / (loss) attributable to controlling interest | $ | (500) | $ | (276) | $ | (217) | $ | (53) | $ | (30) | ||||||||||||||||||||||||||||||||||||||||||||||
| Capital Expenditures | $ | (213) | $ | (188) | $ | (110) | $ | (103) | $ | (53) | ||||||||||||||||||||||||||||||||||||||||||||||
| Depreciation and Amortization | $ | (115) | $ | (111) | $ | (119) | $ | (106) | $ | (53) | ||||||||||||||||||||||||||||||||||||||||||||||
| Financial Position: | ||||||||||||||||||||||||||||||||||||||||||||||||||||||||
| Total Assets | $ | 2,743 | $ | 2,632 | $ | 1,663 | $ | 1,739 | $ | 1,059 | ||||||||||||||||||||||||||||||||||||||||||||||
Total Debt 2 | $ | (171) | $ | (14) | $ | (62) | $ | (15) | $ | — | ||||||||||||||||||||||||||||||||||||||||||||||
| As of and for the Year Ended December 31, | ||||||||||||||||||||
| 2018 | 2017 | 2016 | 2015 | 2014 | ||||||||||||||||
| Operating Results: | ||||||||||||||||||||
| Net Sales | $ | 2,228 | $ | 2,322 | $ | 2,218 | $ | 1,589 | $ | 1,489 | ||||||||||
Operating Income / (loss)1 | $ | (197 | ) | $ | (283 | ) | $ | (25 | ) | $ | (8 | ) | $ | 30 | ||||||
| Net Income / (loss) | $ | (294 | ) | $ | (344 | ) | $ | (60 | ) | $ | (30 | ) | $ | 21 | ||||||
| Net Income / (loss) attributable to controlling interest | $ | (276 | ) | $ | (217 | ) | $ | (53 | ) | $ | (30 | ) | $ | 21 | ||||||
| Capital Expenditures | $ | (188 | ) | $ | (110 | ) | $ | (103 | ) | $ | (53 | ) | $ | (64 | ) | |||||
| Depreciation and Amortization | $ | (111 | ) | $ | (119 | ) | $ | (106 | ) | $ | (53 | ) | $ | (45 | ) | |||||
| Financial Position: | ||||||||||||||||||||
| Total Assets | $ | 2,632 | $ | 1,663 | $ | 1,739 | $ | 1,059 | $ | 758 | ||||||||||
Total Debt 2 | $ | (14 | ) | $ | (62 | ) | $ | (15 | ) | $ | — | $ | — | |||||||
1 Includes costs for goodwill impairment of $234 million in 2017.
2Includes related party short-term debt and related party long-term debt as of December 31, 2018, related party long-term debt as of December 31, 2017.
3 The Veoneer financial results for the first half of 2018 and all of 2017, 2016 and 2015 have been prepared from the financial records of Autoliv, Inc. under specific carve-out basis accounting rules.
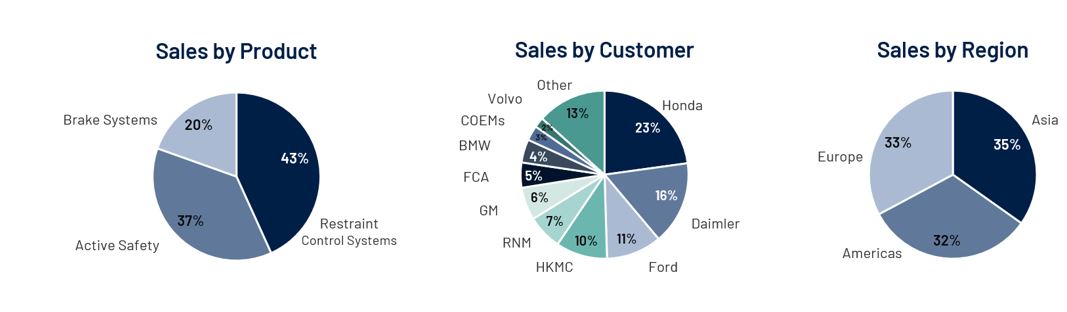
Item 7. Management's Discussion and Analysis of Financial Condition and Results of Operations
Introduction
The following MD&A is intended to help you understand the business operations and financial condition of the Company. This MD&A is presented in the following sections:
•Executive Overview
•Trends, Uncertainties and Opportunities
•Market Overview
•Non-U.S. GAAP Financial Measures
•Results of Operations
•Liquidity and Capital Resources
•Off-Balance Sheet Arrangements
•Contractual Obligations and Commitments
•Significant Accounting Policies and Critical Accounting Estimates
Veoneer is a Delaware corporation with its principal executive offices in Stockholm, Sweden. The Company functions as a holding corporation and owns two principal operating subsidiaries, Veoneer AB and Veoneer US, Inc. On June 29, 2018, the Spin-Off of Veoneer from Autoliv, Inc. ("Autoliv") was completed through the distribution by Autoliv of all the outstanding shares of common stock of Veoneer to Autoliv’s stockholders as of the close of business on June 12, 2018, the common stock record date for the distribution, in a tax-free, pro rata distribution (the "Spin-Off"). On July 2, 2018, the shares of Veoneer common stock commenced trading on the New York Stock Exchange under the symbol “VNE” and the Veoneer Swedish Depository Receipts representing shares of Veoneer common stock commenced trading on Nasdaq Stockholm under the symbol “VNE SDB.”
Veoneer is a global leader in the design, development, manufacture, and sale of automotive safety electronics with a focus on innovation, quality and manufacturing excellence. Prior to the Spin-Off, Veoneer operated for almost four years as an operating segment within Autoliv. Veoneer's Safety Systemssafety systems are designed to make driving safer and easier, more comfortable and convenient for the end consumer and to intervene before a potential collision. Veoneer endeavors to prevent vehicle accidents or reduce the severity of impact in the event a crash is unavoidable. Through our customer focus, being an expert partner with our customers, we intend to develop human centric systems that benefit automotive light vehicle occupants.
Veoneer’s current product offering includes automotive radars, mono-and stereo-vision cameras, night driving assist (thermal sensing) systems, positioning systems, ADAS (advanced driver assist systems) electronic control units, passive safety electronics (airbag control units and crash sensors), brake control systems and a complete ADAS software offering towards highly automated driving (HAD) and eventually autonomous driving (AD). In addition, we offer driver monitoring systems, LiDAR sensors, RoadScape positioning and other technologies critical for HAD and AD solutions by leveraging our partnership network and internally developed intellectual property.
Executive Overview
Organic sales in the quarter were in-line with our expectations at the beginning of the quarter, despite some weakness in the LVP. Our operating loss was lower than expected at the beginning of the quarter, primarily due to continuing cost control activities across the company, particularly with respect to customer reimbursements and control of our RD&E costs. In general, our market adjustment initiatives are continuing to positively impact our cost structure.
During 2020 we intend to take further actions under our market adjustment initiative program. These actions include: further partnering, further focusing our product portfolio, reviewing certain customer contracts, and a continued focus on other cost improvement initiatives.
We are also continuing to define the scope and priorities of Zenuity, where the Polestar 2 and the Volvo XC 40 Recharge, both launching in the upcoming months, will be the first two vehicles with the full Zenuity software suite for collaborative driving. This is a major milestone and achievement for Zenuity.
2020 is a major customer launch year for Veoneer and we are gearing up for the launch of our fourth-generation vision systems during the first half of the year. The bulk of the launches, and importantly the higher delivery volumes, are concentrated toward the second half of the year which is when we expect Veoneer to return to organic sales growth.
We are basing our 2020 outlook on our core Active Safety and Restraint Control Systems businesses and our VBS US operations Brake Systems business, as we completed the divestiture of the Asian operations of our VNBS joint venture on February 3, 2020 as part of an on-going strategic review of our brake business.
In the early part of January, we participated to the Consumer Electronics Show where we showcased our latest solutions in Collaborative Driving, which further confirmed our decision to focus our sales, operations and development on Active Safety solutions where the driver remains involved. Customer feedback to our approach is very positive and we expect to win significant, profitable orders with our focused, refined Active Safety portfolio throughout 2020.
We are currently monitoring and taking appropriate actions on a daily basis related to the effects from the Coronavirus outbreak in China. As always, the health and safety of our employees is our primary focus. To date we are not aware of any cases of the virus with our employees, however it is too early to assess the effects on our China business as this is an on-going situation.
For the next several quarters our focus is on preparing for: successful customer launches in 2020 and heading into 2021, market adjustment initiatives to continue to drive efficiencies and improve cash flow, and continuing to win profitable new business.
2020 Outlook and Targets
Our 2020 outlook includes our core Active Safety and Restraint Control Systems business (Electronics segment) and the VBS US operations since we completed the VNBS JV divestiture on February 3, 2020.
Our current customer call-offs and deliveries point to a weak first quarter, mostly in China and Europe, both sequentially from the previous quarter and year-over-year. This leads us to expect a LVP decline for the first six months and a decline in the low single digits for 2020, both as compared to 2019.
Veoneer expects to return to organic sales growth in the mid-single digits in 2020. This expected sales growth is driven by new program launches, mostly in Active Safety, during the second half of the year. During the first half of 2020 our net sales are expected to remain relatively flat sequentially from the second half of 2019, and then ramp-up sequentially during the second half of 2020.
During 2020, our market adjustment initiatives are expected to generate further cost structure and balance sheet improvements. We expect RD&E, net along with the operating loss and cash flow before financing to improve in 2020 from 2019 levels, on a comparable basis, although most of the improvement is expected to come during the second half of the year. This excludes any one-time effects related to our strategic reviews. Based on the market opportunities we currently foresee in 2020, we estimate our order intake to be approximately $1 billion of average annual sales for our core Electronics segment.
Lastly, our medium-term targets are based on our approximately $19 billion order book, of which approximately 80% is for the Electronics segment (Active Safety and Restraint Control Systems). We estimate the net sales of this segment will increase to approximately $2.5 billion in 2022, which is a CAGR of approximately 19% from 2019. During this same period Active Safety net sales are expected to approximately double.
42
Financial Results
Net Sales- Veoneer’s net sales for the full year of 2019 declined by 15% to $1,902 million as compared to 2018.
Gross Profit - The gross profit of $311 million for the full year of 2019 was $119 million lower as compared to 2018. The negative volume and product mix effects that caused the lower organic sales were the main contributors to the gross profit decline. Net currency effects on the gross profit were approximately $28 million unfavorable for the same period as compared to 2018, primarily due to the stronger US dollar.
Operating Loss - The operating loss of $460 million for the full year of 2019 increased by $263 million as compared to 2018. Net currency effects on the operating loss were negative $8 million for the same period as compared to 2018.
Net Loss - The net loss for the full year of 2019 increased by $228 million to $522 million as compared to 2018. Veoneer’s net loss from its equity method investment (Zenuity) of $70 million for the full year of 2019 increased by $7 million as compared to 2018. This increase is mainly attributable to the hiring and continued build-up of software engineers through the first half of 2019.
The increase in equity method investment loss was partially offset by interest income, net of $8 million, which was an increase of $2 million as compared to 2018. Interest expense related to the convertible debt issuance in 2019 was approximately $10 million for the full year of 2019.
The Income tax expense for the full year of 2019 decreased by $41 million as compared to 2018, mainly due to a $10 million tax benefit from the convertible debt and $26 million of discrete tax items in 2018.
The non-controlling interest loss of $22 million in the VNBS JV for the full year of 2019 was $3 million higher as compared to 2018. The increase is mainly due to the organic sales impact on earnings.
Loss per Share - The loss per share of $4.92 for the full year of 2019 increased by $1.75 per share as compared to 2018 mainly due to the increase in the operating loss. The share count increase from the common stock issuance in 2019 reduced the loss by $0.80 per share.
Trends, Uncertainties and Opportunities
Trend toward Collaborative Driving
The environment around us iscontinues to be rapidly changing and we currently see a shift across the automotive and autotech industries. The industry developments during 2019 have further strengthened the trend toward advanced driver support - Collaborative Driving - and away from fully autonomous cars for the consumer based vehicle mass market.
New technologies, creating new levels of interaction and driver support are starting to revolutionize driving, but we also see the driver being actively involved for many years to come. We callWhile the industry refers to “Level 2+” or even "Level 2++" Veoneer calls this Collaborative Driving; the industry also calls it “Level 2+” driver support.Driving, and includes any SAE level of automation. At the same time there is also a growing realization that the introduction of truly self-driving cars will likely take longer and be more expensive than previously anticipated. This fundamental insight opens up new opportunities for companies, including Veoneer, but it also requires a reprioritization of resources.
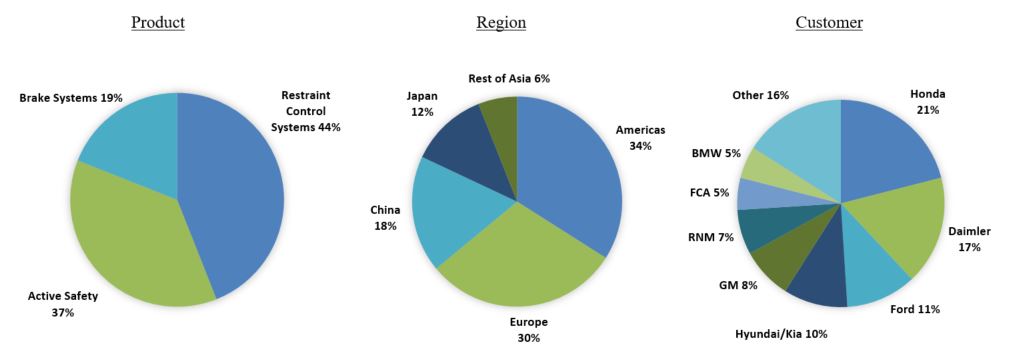
Europe continues to take a pro-activeproactive role in promoting or requiring active safetyActive Safety technologies. The European New Car Assessment Program (“NCAP”) continuously updates its test rating program to include more active safety technologies to help the European Union reach its target of cutting road fatalities by 50% by 2030, as compared to 2020. We anticipate strong global sensor adoption rate increases (forward, side and rear) due to the European NCAP's push for crash avoidance, increased adoption rates due to growing demand around ADAS software features, volume growth due to redundant sensing concepts needed for higher levels of autonomy, potential opportunities in relation to compliance with cyber-security and software updates and step-by-step increased demand for connectivity components as a result.
On May 17, 2018, the European Commission proposed a new mandate, as party of the EU generalGeneral Safety Regulation road-map tillthrough 2028, to make certain active safetyActive Safety features compulsory in light vehicles by 2022. Such aDuring March of 2019 the EU mandate shouldwas adopted as initially proposed by the European Commission. We believe that adoption of the mandate will significantly expand demand for our active safetyActive Safety products. If passedIndeed, with respect to sensors and Advanced Driver
43
Assistance Systems (ADAS) software features, our order intake since the adoption of the mandate seems to reflect the anticipated increase in demand. However, during 2019 we have seen OEM delays in the sourcing of these technologies as proposed, certain safety features could be mandatedcustomers reconsider how they want to architect and design, in 2022 asa scalable way to include these new vehicle models are introduced tostandard technologies. In addition, we believe that the European market. In any case,mandate and the EU General Safety RegulationRegulations (GSR) would have a positivegenerally will influence on other market regulators as they evaluate their respective vehicle test rating programs and safety legislations.legislation.
In China, the Ministry of Industry and Information Technology issued the Key Working Points of Intelligent Connected Vehicle Standardization for 2018 to promote and facilitate the development of the intelligent connected vehicles industry, and advance the development of fundamental standards and those that are in urgent demand. The guideline has pointed out that more than 30 key standards will be defined by 2020 to fund the systems for ADAS(ADAS) and low-level autonomous driving, and a system of over 100 standards will be set up by 2025 for higher level autonomous driving.
During the third quarter of 2018, the Chinese government commenced testing of new vehicles according to the new China New Car Assessment Program (CNAP)(CNCAP) where active safety features like Autonomous Emergency Braking (AEB) are required to achieve the maximum safety rating.
On October 4, 2018, the U.S. Department of Transportation (DoT) issued new voluntary guidelines on automated driving systems (ADS) under its “Preparing for the Future of Transportation: Automated Vehicles 3.0” initiative, building on its “Vision for Safety 2.0” from September 2017, which prioritized aligning federal guidance around twelve safety design elements of interest to the auto industry. This initiative should have a positive impact on the adoption of Advanced Driver Assistance Systems (ADAS)ADAS and Highly Automated Driving (HAD) on the road towards Autonomous Vehicles.Vehicles (AV).
Key future working fields forpotential regulations are expected for (i) safety critical ADAS-features (e.g. AEB); (ii) Highway AV-features (Physical Tests + Real World Test Drive + Audit); (iii) Cybersecurity & SW-Updates;Cyber-security and Software updates; and (iv) Connected Vehicles. On one hand, the agreement on minimal common base requirements for the industry will take a longer time and therefore may postpone introduction of regulations. On the other hand, the harmonization with base requirements would help the industry while a more active position from China may help to pull forward some safety critical ADAS technologies which are not yet considered as relevant for regulation in EU and Japan (e.g. Blind Spot or Night Vision).
Market Overview
Millions (except where specified) IHS as of January 16, 2020 | Light Vehicle Production by Region - 2019 | ||||||||||||||||||||||||||||||||||||||||||||||||||||||||||||||||||||||||||||
| China | Japan | Rest of Asia | Americas | Europe | Other | Total | |||||||||||||||||||||||||||||||||||||||||||||||||||||||||||||||||||||||
| Full Year 2019 | 23.3 | 9.0 | 12.2 | 18.3 | 21.0 | 2.0 | 85.9 | ||||||||||||||||||||||||||||||||||||||||||||||||||||||||||||||||||||||
| Change vs. 2018 | (9) | % | 0 | % | (6) | % | (4) | % | (4) | % | (23) | % | (6) | % | |||||||||||||||||||||||||||||||||||||||||||||||||||||||||||||||
Millions (except where specified, as of January 17, 2019) | Light Vehicle Production by Region - 2018 | ||||||||||||
| China | Japan | Rest of Asia | Americas | Europe | Other | Total | |||||||
| Full Year 2018 | 25.7 | 9.1 | 13.1 | 19.1 | 21.9 | 2.5 | 91.3 | ||||||
| Change vs. 2017 | (3.5)% | 0.3% | 3.4% | —% | (1.3)% | (2.2)% | (0.9)% | ||||||
This is the second consecutive annual decline in light vehicle production declines in Western Europe (4%), partially attributable to the introduction of the Worldwide Harmonized Light Vehicle Procedure ("WLTP"), China (4%), likely attributable to weaker consumer demand and record volumes infrom 2017 when tax incentive on 1.6 litera record 92 million vehicles were in place, along with South Korea (2%) likely attributable to fewer NAFTA exports due to production localization. Light vehicle demand in Japan and the Americas remained relatively flat, where South America increased 3% and North America declined slightly (1)% while India, included in Rest of Asia, increased 7% during the year as compared with 2017.
Millions (except where specified, as of January 17, 2019) | Light Vehicle Production by Region - 2017 | ||||||||||||
| China | Japan | Rest of Asia | Americas | Europe | Other | Total | |||||||
| Full Year 2017 | 26.6 | 9.0 | 12.6 | 19.1 | 22.2 | 2.6 | 92.2 | ||||||
| Change vs. 2016 | 2.3% | 5.6% | 1.1% | (1.4)% | 3.3% | 13.7% | 2.2% | ||||||
Non-U.S. GAAP Financial Measures
Non-U.S. GAAP financial measures are reconciled throughout this report.
In this report we refer to organic sales or changes in organic sales growth, a non-U.S. GAAP financial measure that we, investors and analysts use to analyze the Company's sales trends and performance. We believe that this measure assists investors and management in analyzing trends in the Company's business because the Company generates approximately 65% 68%
44
of sales, a significant amount ofits sales in currencies other than in U.S. dollars (its reporting currency) and currency rates have been and can be rather volatile. Additionally, theThe Company has historically made several acquisitions and divestitures.divestitures, although none that impacted the reporting periods in question. Organic sales and organic sales growth presentsrepresent the increase or decrease in the overall U.S. dollar net sales on a comparable basis, allowing separate discussions of the impact of acquisitions/divestitures and exchange rates on the Company’s performance. The tables in this report present the reconciliation of changes in the total U.S. GAAP net sales to changes in organic sales growth.
The Company also uses in this report EBITDA, a non-U.S. GAAP financial measure, which represents the Company’s net income excluding interest expense, income taxes, depreciation and amortization.amortization and including loss from equity method investment. The Company also uses Segment EBITDA, a non-U.S. GAAP financial measure, which represents the Company’s EBITDA which has been further adjusted on a segment basis to exclude certain corporate and other items. We believe that EBITDA and Segment EBITDA are useful measures for management, analysts and investors to evaluate operating performance on a consolidated and reportable segment basis, because it assists in comparing our performance on a consistent basis. The tables below provide reconciliations of net income (loss) to EBITDA and Segment EBITDA.
The Company also uses in this report net working capital, a non-U.S. GAAP financial measure, which is defined as current assets (excluding cash and cash equivalents) lessminus current liabilities.liabilities excluding short-term debt and net assets and liabilities held for sale. The Company also uses in this report cash flow before financing activities, a non-U.S. GAAP financial measure, which is defined as net cash used in operating activities plus net cash used in investing activities. Management uses this measurethese measures to improve its ability to assess liquidityoperating performance at a point in time as well as the trends over time. The tabletables below providesprovide a reconciliation of current assets and liabilities to net working capital.capital and cash flow before financing activities.
Investors should not consider these non-U.S. GAAP measures as substitutes, but rather as additions, to financial reporting measures prepared in accordance with U.S. GAAP. It should be noted that theseThese measures, as defined, may not be comparable to similarly titled measures used by other companies.
Results of Operations
Fiscal Year 20182019 compared to 20172018
The following tables show Veoneer’s performance by segment for the yearyears ended December 31, 20182019 and 20172018 along with components of change compared to the prior year.
| Electronics Segment | Year Ended December 31 | Components of Change vs. Prior Year | |||||||||||||||||||||||||||||||||||||||||||||||||||||||||||||||||||||||||||||||||||||||||||||||||||||||||
| Dollars in millions, (except where specified) | 2019 | 2018 | U.S. GAAP Reported | Currency | Organic1 | ||||||||||||||||||||||||||||||||||||||||||||||||||||||||||||||||||||||||||||||||||||||||||||||||||||||
| $ | % | $ | % | Chg. $ | Chg. % | $ | % | $ | % | ||||||||||||||||||||||||||||||||||||||||||||||||||||||||||||||||||||||||||||||||||||||||||||||||||
| Net Sales | $ | 1,530 | $ | 1,800 | $ | (270) | (15) | % | $ | (66) | (4) | % | $ | (204) | (11) | % | |||||||||||||||||||||||||||||||||||||||||||||||||||||||||||||||||||||||||||||||||||||||||||
| Operating Loss / Margin | $ | (324) | (21.2) | % | $ | (116) | (6.4) | % | $ | (208) | |||||||||||||||||||||||||||||||||||||||||||||||||||||||||||||||||||||||||||||||||||||||||||||||||
EBITDA1 / % | $ | (242) | (15.8) | % | $ | (43) | (2.4) | % | $ | (199) | |||||||||||||||||||||||||||||||||||||||||||||||||||||||||||||||||||||||||||||||||||||||||||||||||
| Associates | 7,384 | 7,105 | 279 | ||||||||||||||||||||||||||||||||||||||||||||||||||||||||||||||||||||||||||||||||||||||||||||||||||||||||
| Electronics Segment | Year Ended December 31 | Components of Change vs. Prior Year | |||||||||||||||||||||||||||||||
Dollars in millions, (except where specified) | 2018 | 2017 | U.S. GAAP Reported | Currency | Organic1 | ||||||||||||||||||||||||||||
| $ | % | $ | % | Chg. $ | Chg. % | $ | % | $ | % | ||||||||||||||||||||||||
| Net Sales | $ | 1,799 | $ | 1,850 | $ | (51 | ) | (3 | )% | $ | 17 | 1 | % | (68 | ) | (4 | )% | ||||||||||||||||
| Operating Loss / Margin | $ | (116 | ) | (6.4 | )% | $ | (14 | ) | (0.7 | )% | $ | (102 | ) | ||||||||||||||||||||
EBITDA1 / % | $ | (43 | ) | (2.4 | )% | $ | 67 | 3.6 | % | $ | (110 | ) | |||||||||||||||||||||
| Associates | 7,105 | 5,898 | 1,207 | ||||||||||||||||||||||||||||||
1Non-U.S. GAAP measure reconciliation for Organic Sales and EBITDA
Net Sales - NetThe net sales in the Electronics segment decreased by $270 million to $1,530 million for the full year of 2018 decreased by $51 million to $1,799 million2019 as compared to 2017. The difference2018. This decline was attributablemainly due to the organic sales1 decline in Active Safety and Restraint Control Systems of approximately $120 million which was partially offset by Active Safety organic sales growth of around $52 million.
Operating Loss - The operating loss infor the Electronics segment increased by $102 million to $116of $324 million for the full year of 20182019 increased by $208 million as compared to 2017. The2018. This increase iswas mainly due to the negative volume and product mix effecteffects causing the lower organic sales in Active Safety and a plannedRestraint Control Systems and an increase in RD&E costscost to support future organic sales growth.growth and current development programs.
EBITDA1 - The EBITDA - Forloss for the Electronics segment decreased by $199 million to negative $242 million for the full year of 2018 the Electronics segment EBITDA of negative $43 million declined by $110 million2019 as compared to 2017, which2018. This was partially offset by lower amortization of intangibles, mainly relateddue to the effects of the MACOM acquisition.increase in operating loss as depreciation and amortization increased by $9 million.
45
Associates - The number of associates in the Electronics segment increased by approximately 1,207 since December 31, 2017279 to 7,105 mainly7,384 as compared to 2018. This increase is primarily due to increases in RD&Ethe hiring of engineers to support the strong order intake for future organic sales growthgrowth. Deliveries - The quantities delivered during the full year of 2019 were 16.0 and current development programs.8.3 million units for Restraint Controls Systems and Active Safety, respectively.
| Brake Systems Segment | Year Ended December 31 | Components of Change vs. Prior Year | |||||||||||||||||||||||||||||||||||||||||||||||||||||||||||||||||||||||||||||||||||||||||||||||||||||||||
Dollars in millions, (except where specified) | 2019 | 2018 | U.S. GAAP Reported | Currency | Organic1 | ||||||||||||||||||||||||||||||||||||||||||||||||||||||||||||||||||||||||||||||||||||||||||||||||||||||
| $ | % | $ | % | Chg. $ | Chg. % | $ | % | $ | % | ||||||||||||||||||||||||||||||||||||||||||||||||||||||||||||||||||||||||||||||||||||||||||||||||||
| Net Sales | $ | 372 | $ | 428 | $ | (56) | (13) | % | $ | (3) | (1) | % | $ | (53) | (12) | % | |||||||||||||||||||||||||||||||||||||||||||||||||||||||||||||||||||||||||||||||||||||||||||
| Operating Loss / Margin | $ | (64) | (17.0) | % | $ | (30) | (7.1) | % | $ | (34) | |||||||||||||||||||||||||||||||||||||||||||||||||||||||||||||||||||||||||||||||||||||||||||||||||
EBITDA1/ % | $ | (32) | (8.5) | % | $ | 7 | 1.7 | % | $ | (39) | |||||||||||||||||||||||||||||||||||||||||||||||||||||||||||||||||||||||||||||||||||||||||||||||||
| Associates | 1,447 | 1,452 | (5) | ||||||||||||||||||||||||||||||||||||||||||||||||||||||||||||||||||||||||||||||||||||||||||||||||||||||||
| Brake Systems Segment | Year Ended December 31, 2018 | Components of Change vs. Prior Year | ||||||||||||||||||||||||||||||||
Dollars in millions, (except where specified) | 2018 | 2017 | U.S. GAAP Reported | Currency | Organic1 | |||||||||||||||||||||||||||||
| $ | % | $ | % | Chg. $ | Chg. % | $ | % | $ | % | |||||||||||||||||||||||||
| Net Sales | $ | 428 | $ | 476 | $ | (48 | ) | (10 | )% | $ | 7 | 1 | % | $ | (55 | ) | (11 | )% | ||||||||||||||||
| Operating Loss / Margin | $ | (30 | ) | (7.1 | )% | $ | (247 | ) | (51.9 | )% | $ | 217 | ||||||||||||||||||||||
EBITDA1/ % | $ | 7 | 1.7 | % | $ | (210 | ) | (44.2 | )% | $ | 217 | |||||||||||||||||||||||
| Associates | 1,452 | 1,586 | (134 | ) | ||||||||||||||||||||||||||||||
1Non-U.S. GAAP measure reconciliation for Organic Sales and EBITDA
Net Sales - The net sales of $428 million in the Brake Systems segment for the full year of 2018 decreased by $48 million as compared to 2017. The decline was mainly attributable to lower volumes on certain Honda models, primarily in North America and lower LVP in China which was partially offset by higher volumes in Japan.
Within the Brake Systems segment, the VNBS JV Asia operations (including China and Japan) generated Net Sales of $313 million for the full year of 2019 and $370 million for the full year of 2018. The RD&E, net for the VNBS JV Asia operations (including China and Japan) was approximately $25 million in 2019.
EBITDA1 - The EBITDA loss for Brake Systems segment decreased to negative $32 million for the full year of 2019 as compared to $7 million in 2018, mainly due to the increase in the operating loss.
loss for the segment. Associates - The number of associates in the Brake Systems segment declined by 134 since December 31, 2017slightly to 1,452 mainly due1,447 as compared to the2018. An increase in RD&E was mostly offset by reductions in direct manufacturing as well as production overhead and SG&A due toindirect labor associates. Deliveries - The quantities delivered during the decline in organic sales.full year of 2019 were 1.7 million units for Brake Systems.
| Corporate and Other | Year Ended December 31 | ||||||||||||||||||||||||||||||||||||||||||||||||||||||||||||||||
Dollars in millions, (except where specified) | 2019 | 2018 | U.S. GAAP Reported | ||||||||||||||||||||||||||||||||||||||||||||||||||||||||||||||
| $ | % | $ | % | Chg. $ | Chg.% | ||||||||||||||||||||||||||||||||||||||||||||||||||||||||||||
| Net Sales | $ | — | $ | — | $ | — | |||||||||||||||||||||||||||||||||||||||||||||||||||||||||||
| Operating Loss / Margin | $ | (72) | — | % | $ | (51) | — | % | $ | (21) | |||||||||||||||||||||||||||||||||||||||||||||||||||||||
Segment EBITDA1 / Margin | $ | (71) | — | % | $ | (51) | — | % | $ | (20) | |||||||||||||||||||||||||||||||||||||||||||||||||||||||
| Associates | 43 | 43 | — | ||||||||||||||||||||||||||||||||||||||||||||||||||||||||||||||
| Corporate and Other | Year Ended December 31 | |||||||||||||||||||
Dollars in millions, (except where specified) | 2018 | 2017 | U.S. GAAP Reported | |||||||||||||||||
| $ | % | $ | % | Chg. $ | Chg.% | |||||||||||||||
| Net Sales | $ | — | $ | — | $ | — | — | % | ||||||||||||
| Operating Loss / Margin | $ | (51 | ) | — | % | $ | (22 | ) | — | % | $ | (29 | ) | |||||||
Segment EBITDA1 / Margin | $ | (51 | ) | — | % | $ | (21 | ) | — | % | $ | (29 | ) | |||||||
| Associates | $ | 43 | $ | — | $ | 43 | ||||||||||||||
1 Non-U.S. GAAP measure reconciliation for EBITDA
Operating Loss and EBITDA1 - The operating loss and EBITDA loss for Corporate and other for the full year of 20182019 increased to $51 million from $22 million$72 and $21$71 million, respectively, as compared to 2017$51 million in 2018, mainly due to the additional costs associated with being a standalone listed company.
Associates - The number of associates in Corporate and other increased toremained unchanged at 43 as compared to December 31, 20172018 mainly relateddue to the hiring of additional personnel for beingto support a standalone listed company. that was completed in 2018.
The associateVeoneer associates and financial figures for the full year of 2019 are not comparable since the 2017 financial reports arefirst half of 2018 is based on carve-out basis accounting rules.reporting.
46
Net Sales by Product
The following tables show Veoneer’s consolidated net sales by product for the yearyears ended December 31, 20182019 and 20172018 along with components of change compared to the prior year.
| Consolidated Net Sales | Year Ended December 31 | Components of Change vs. Prior Year | |||||||||||||||||||||||||||||||||||||||||||||||||||||||||||||||||||||||||||||||||
Dollars in millions, (except where specified) | 2019 | 2018 | U.S. GAAP Reported | Currency | Organic1 | ||||||||||||||||||||||||||||||||||||||||||||||||||||||||||||||||||||||||||||||
| $ | $ | Chg. $ | Chg. % | $ | % | $ | % | ||||||||||||||||||||||||||||||||||||||||||||||||||||||||||||||||||||||||||||
| Restraint Control Systems | 822 | 974 | (152) | (16) | % | (29) | (3) | % | (123) | (13) | % | ||||||||||||||||||||||||||||||||||||||||||||||||||||||||||||||||||||||||
| Active Safety | 708 | 825 | (118) | (14) | % | (37) | (4) | % | (81) | (10) | % | ||||||||||||||||||||||||||||||||||||||||||||||||||||||||||||||||||||||||
| Brake Systems | 372 | 428 | (56) | (13) | % | (3) | (1) | % | (53) | (12) | % | ||||||||||||||||||||||||||||||||||||||||||||||||||||||||||||||||||||||||
| Total | $ | 1,902 | $ | 2,228 | $ | (326) | (15) | % | $ | (69) | (3) | % | $ | (257) | (12) | % | |||||||||||||||||||||||||||||||||||||||||||||||||||||||||||||||||||
| Consolidated Net Sales | Year Ended December 31 | Components of Change vs. Prior Year | ||||||||||||||||||||||||||
Dollars in millions, (except where specified) | 2018 | 2017 | U.S. GAAP Reported | Currency | Organic1 | |||||||||||||||||||||||
| $ | $ | Chg. $ | Chg. % | $ | % | $ | % | |||||||||||||||||||||
| Restraint Control Systems | $ | 974 | $ | 1,073 | $ | (99 | ) | (9 | )% | $ | 21 | 2 | % | $ | (120 | ) | (11 | )% | ||||||||||
| Active Safety | $ | 825 | $ | 777 | $ | 48 | 6 | % | $ | (4 | ) | (1 | )% | $ | 52 | 7 | % | |||||||||||
| Brake Systems | $ | 428 | $ | 473 | $ | (45 | ) | (9 | )% | $ | 7 | 1 | % | $ | (51 | ) | (11 | )% | ||||||||||
| Total | $ | 2,228 | $ | 2,322 | $ | (95 | ) | (4 | )% | $ | 24 | 1 | % | $ | (119 | ) | (5 | )% | ||||||||||
1Non-U.S. GAAP measure reconciliation for Organic Sales
Veoneer Performance
The following table shows Veoneer’s performance for the year ended December 31, 20182019 and 20172018 along with components of change compared to the prior year.
Net Sales - Veoneer’s net sales for the full year of 2019 declined by 15% to $1,902 million as compared to 2018. Organic sales1 declined by 12% while the combined currency translation effects were 3%. More than half of the organic sales decline for the full year of 2019 was in North America, and was related to both the Restraint Control Systems and the Active Safety product areas.
The LVP, according to IHS, declined by close to 6% for the full year of 2019 as compared to 2018. This decrease was mainly attributable to China, Western Europe, North America, South Korea and India. The global LVP of close to 86 million vehicles for 2019 is the lowest level since 2015 when the global LVP was approximately 86 million.
Restraint Control Systems - Net sales for the full year of 2019 decreased by 16% to $822 million as compared to 2018. The organic sales1 decline of 13% was due to lower volumes in North America, China and South Korea, where we have a temporary phase-out of our products on certain vehicle models, and lower underlying LVP.
Active Safety - Net sales for the full year of 2019 decreased by 14% to $708 million as compared to 2018. This decline was driven by currency translation effects of 4% while organic sales1 declined by 10%. The LVP in our major markets for Active Safety (Western Europe, North America, China and Japan), where we have a relatively higher CPV on premium brands produced in those markets, declined by close to 6%.
Strong demand for mono, stereo and night vision (thermal sensing) systems and ADAS ECUs on several models drove an increase in organic sales. This growth was more than offset by the negative product mix impact from 24GHz to 77GHz radar technology and the phase-out of mono vision cameras on certain BMW models.
Brake Systems - Net sales for the full year of 2019 decreased by 13% to $372 million as compared to 2018. The organic sales¹ decline of 12% was mainly due to lower volumes in China and Japan, where we have a temporary phase-out of our products on certain Honda vehicle models.
47
| Income Statement | Year Ended December 31 | Income Statement | Year Ended December 31 | ||||||||||||||||||||||||||||||||||||||||||||||||||||||||||||||||||||||
Dollars in millions, (except per share data) | 2018 3 | 2017 3 | Dollars in millions, (except per share data) | 2019 | 2018 3 | ||||||||||||||||||||||||||||||||||||||||||||||||||||||||||||||||||||
| $ | % | $ | % | Change | $ | % | $ | % | Change | ||||||||||||||||||||||||||||||||||||||||||||||||||||||||||||||||
| Net sales | $ | 2,228 | $ | 2,322 | $ | (95 | ) | Net sales | $ | 1,902 | $ | 2,228 | $ | (326) | |||||||||||||||||||||||||||||||||||||||||||||||||||||||||||
| Cost of sales | (1,798 | ) | (80.7 | )% | (1,857 | ) | (79.9 | )% | 59 | Cost of sales | (1,591) | (83.6) | % | (1,798) | (80.7) | % | 207 | ||||||||||||||||||||||||||||||||||||||||||||||||||||||||
| Gross profit | $ | 430 | 19.3 | % | $ | 466 | 20.1 | % | $ | (36 | ) | Gross profit | 311 | 16.4 | % | 430 | 19.3 | % | (119) | ||||||||||||||||||||||||||||||||||||||||||||||||||||||
| Selling, general & administrative expenses | (156 | ) | (7.0 | )% | (110 | ) | (4.7 | )% | (46 | ) | Selling, general & administrative expenses | (189) | (9.9) | % | (156) | (7.0) | % | (33) | |||||||||||||||||||||||||||||||||||||||||||||||||||||||
| Research, development & engineering expenses, net | (466 | ) | (20.9 | )% | (375 | ) | (16.2 | )% | (91 | ) | Research, development & engineering expenses, net | (562) | (29.5) | % | (466) | (20.9) | % | (96) | |||||||||||||||||||||||||||||||||||||||||||||||||||||||
| Goodwill impairment charges | — | — | (234 | ) | (10.1 | )% | 234 | ||||||||||||||||||||||||||||||||||||||||||||||||||||||||||||||||||
| Amortization of intangibles | (23 | ) | (1.0 | )% | (37 | ) | (1.6 | )% | 14 | Amortization of intangibles | (20) | (1.1) | % | (23) | (1.0) | % | 3 | ||||||||||||||||||||||||||||||||||||||||||||||||||||||||
| Other income | 18 | 0.8 | % | 8 | 0.3 | % | 10 | Other income | — | — | % | 18 | 0.8 | % | (18) | ||||||||||||||||||||||||||||||||||||||||||||||||||||||||||
| Operating loss | $ | (197 | ) | (8.8 | )% | $ | (283 | ) | (12.2 | )% | $ | 86 | Operating loss | (460) | (24.2) | % | (197) | (8.8) | % | (263) | |||||||||||||||||||||||||||||||||||||||||||||||||||||
| Loss from equity method investments | (63 | ) | (2.8 | )% | (31 | ) | (1.3 | )% | (32 | ) | Loss from equity method investments | (70) | (3.7) | % | (63) | (2.8) | % | (7) | |||||||||||||||||||||||||||||||||||||||||||||||||||||||
| Interest income | 7 | 0.3 | % | 1 | — | % | 6 | Interest income | 20 | 1.1 | % | 7 | 0.3 | % | 13 | ||||||||||||||||||||||||||||||||||||||||||||||||||||||||||
| Interest (expense) | (1 | ) | — | % | — | — | % | (1 | ) | Interest (expense) | (12) | (0.6) | % | (1) | 0.0 | % | (11) | ||||||||||||||||||||||||||||||||||||||||||||||||||||||||
| Other non-operating items, net | — | — | % | (1 | ) | — | % | 1 | Other non-operating items, net | 1 | 0.0 | % | — | — | % | 1 | |||||||||||||||||||||||||||||||||||||||||||||||||||||||||
| Loss before income taxes | $ | (253 | ) | (11.4 | )% | $ | (314 | ) | (13.5 | )% | $ | 61 | Loss before income taxes | (521) | (27.4) | % | (253) | (11.4) | % | (268) | |||||||||||||||||||||||||||||||||||||||||||||||||||||
| Income tax expense | (42 | ) | (1.9 | )% | (30 | ) | (1.3 | )% | (12 | ) | Income tax expense | (1) | 0.0 | % | (42) | (1.9) | % | 41 | |||||||||||||||||||||||||||||||||||||||||||||||||||||||
Net loss1 | $ | (294 | ) | (13.2 | )% | $ | (344 | ) | (14.8 | )% | $ | 50 | Net loss1 | (522) | (27.4) | % | (294) | (13.2) | % | (228) | |||||||||||||||||||||||||||||||||||||||||||||||||||||
| Less: Net loss attributable to non-controlling interest | (19 | ) | (0.9 | )% | (127 | ) | (5.5 | )% | 108 | Less: Net loss attributable to non-controlling interest | (22) | (1.2) | % | (19) | (0.9) | % | (3) | ||||||||||||||||||||||||||||||||||||||||||||||||||||||||
| Net loss attributable to controlling interest | $ | (276 | ) | (12.4 | )% | $ | (217 | ) | (9.3 | )% | $ | (59 | ) | Net loss attributable to controlling interest | $ | (500) | (26.3) | % | $ | (276) | (12.4) | % | $ | (224) | |||||||||||||||||||||||||||||||||||||||||||||||||
Net loss per share – basic2 | $ | (3.17 | ) | $ | (2.49 | ) | $ | (0.68 | ) | Net loss per share – basic2 | $ | (4.92) | $ | (3.17) | $ | (1.75) | |||||||||||||||||||||||||||||||||||||||||||||||||||||||||
Weighted average number of shares outstanding in millions2 | 87.16 | 87.13 | 0.03 | Weighted average number of shares outstanding in millions2 | 101.62 | 87.16 | 14.46 | ||||||||||||||||||||||||||||||||||||||||||||||||||||||||||||||||||
1Including Corporate and other sales.
2 Basic number of shares used to compute net loss per share. Participating share awards with right to receive dividend equivalents are (under the two class method) excluded from EPS calculation. 3 The first half of 2018 are according to Carve-out reporting from Autoliv Spin-Off of Veoneer. |
Gross Profit - The gross profit of $430$311 million for the full year of 20182019 was $36$119 million lower as compared to 2017.2018. The negative volume and product mix effect causingeffects that caused the lower organic sales was partially offset by a net favorable were the main contributors to the gross profit decline. Net currency benefit of around $10 million.effects on the gross profit were approximately $28 million unfavorable for the same period as compared to 2018, primarily due to the stronger US dollar.
Operating Loss - TheThe operating loss of $197$460 million for the full year of 2018 decreased2019 increased by $86$263 million as compared to 2017, including a net favorable2018. Net currency benefit of $4 million. In 2017effects on the operating loss included a goodwill impairment chargewere negative $8 million for the same period as compared to 2018.
The RD&E, net increase of $96 million for the full year of 2019 as compared to 2018 was mainly due to the ramp-up of engineering hiring during 2018 to support future organic sales growth.
The SG&A increase of $33 million for the full year of 2019 as compared to 2018 was mostly related to VNBS of $234 million.
Net Loss - The net loss for the full year of 2018 of $2942019 increased by $228 million decreased by $50to $522 million as compared to 2017. In addition to the operating loss impact, the Veoneer2018. Veoneer’s net loss from Zenuityits equity method investment (Zenuity) of $70 million for the full year of 2019 increased by $32 million. $7 million as compared to 2018. This increase is mainly attributable to the hiring and continued build-up of software engineers through the first half of 2019.
The Zenuityincrease in equity method investment loss was partially offset by interest income, net of $8 million, which was an increase of $2 million as compared to 2018. Interest expense related to the convertible debt issuance in 2019 was approximately $10 million for the full year of 2019.
The Income tax expense for the full year of 2019 decreased by $41 million as compared to 2018, mainly due to a $10 million tax benefit from the convertible debt and $26 million of discrete tax items in 2018.The non-controlling interest loss of $22 million in the VNBS JV for the full year of 2019 was $3 million higher as compared to 2018. The increase is mainly due to the higher net cost run-rate related to the hiring of software engineers and an additional quarter of cost in 2018, since the JV was formed in April 2017. Interest income net increased by $6 million as compared to 2017. Income tax expense for 2018 was $42 million as compared to $30 million in 2017. The change in tax expense was primarily impacted by the change in mix of pre-tax earnings in our profitable subsidiaries and a non-cash, one-time discrete tax item of $23 million in 2018. The non-controlling interest loss in the VNBS JV was $19 million for 2018 as compared to $127 million loss in 2017 which included the goodwill impairment charge of $113 million.organic sales impact on earnings.
Loss per Share - The loss per share of $4.92 for the full year of 20182019 increased to $3.17by $1.75 per share as compared to a loss of $2.49 per share in 20172018 mainly due to the increased netincrease in the operating loss. The share count was virtually unchanged.increase from the common stock issuance in 2019 reduced the loss by $0.80 per share.
48
Results of Operations
Fiscal Year 2018 compared to 2017
Veoneer’s results of operations for the year ended December 31, 2018 compared to the year ended December 31, 2017 along with components of change compared to the prior year that have been omitted under this item can be found in Part II, Item 7. Management’s Discussion and Analysis of Financial Condition and Results of Operations in the Company's Form 10-K for the year ended December 31, 2018 filed with the SEC on February 22, 2019.
Reconciliations of U.S. GAAP to non U.S. GAAP
| Dollars in millions | Year Ended December 31 | ||||||||||||||||
| Net Loss to EBITDA | 2019 | 2018 | |||||||||||||||
| Net Loss | $ | (522) | $ | (294) | |||||||||||||
| Depreciation and amortization | 115 | 111 | |||||||||||||||
| Loss from equity method investment | 70 | 63 | |||||||||||||||
| Interest and other non-operating items, net | (9) | (7) | |||||||||||||||
| Income tax expense / (benefit) | 1 | 42 | |||||||||||||||
| EBITDA | $ | (345) | $ | (87) | |||||||||||||
| Dollars in millions | Year Ended December 31 | ||||||
| Net Loss to EBITDA | 2018 | 2017 | |||||
| Net Loss | $ | (294 | ) | $ | (344 | ) | |
| Depreciation and amortization | 111 | 119 | |||||
| Loss from equity method investment | 63 | 31 | |||||
| Interest and other non-operating items, net | (7 | ) | 1 | ||||
| Income tax | 42 | 30 | |||||
| EBITDA | $ | (87 | ) | $ | (164 | ) | |
| Dollars in millions | Year Ended December 31 | ||||||||||||||||
| Segment EBITDA to EBITDA | 2019 | 2018 | |||||||||||||||
| Electronics | $ | (242) | $ | (43) | |||||||||||||
| Brake Systems | (32) | 7 | |||||||||||||||
| Segment EBITDA | (274) | (36) | |||||||||||||||
| Corporate and other | (71) | (51) | |||||||||||||||
| EBITDA | $ | (345) | $ | (87) | |||||||||||||
| Dollars in millions | Year Ended December 31 | ||||||
| Segment EBITDA to EBITDA | 2018 | 2017 | |||||
| Electronics | $ | (43 | ) | $ | 67 | ||
| Brake Systems | 7 | (210 | ) | ||||
| Segment EBITDA | (36 | ) | (143 | ) | |||
| Corporate and other | (51 | ) | (21 | ) | |||
| EBITDA | $ | (87 | ) | $ | (164 | ) | |
| Dollars in millions | Year Ended December 31 | ||||||||||||||||
| Working Capital to Net Working Capital | 2019 | 2018 | |||||||||||||||
| Total current assets | $ | 1,649 | $ | 1,543 | |||||||||||||
| less Total current liabilities | 591 | 636 | |||||||||||||||
| Working Capital | 1,058 | 907 | |||||||||||||||
| less Cash and cash equivalents | (859) | (864) | |||||||||||||||
| less Short-term debt | 3 | — | |||||||||||||||
| less Net current assets and liabilities held for sale | (199) | — | |||||||||||||||
| Net Working Capital | $ | 3 | $ | 42 | |||||||||||||
| Dollars in millions | Year Ended December 31 | ||||||||||||||||
| Cash Flow before Financing Activities | 2019 | 2018 | |||||||||||||||
| Net cash used in Operating Activities | $ | (325) | $ | (179) | |||||||||||||
| plus Net cash used in Investing Activities | (265) | (185) | |||||||||||||||
| Cash flow before Financing Activities | $ | (590) | $ | (364) | |||||||||||||
| Dollars in millions | Year Ended December 31 | ||||||
| Working Capital to Net Working Capital | 2018 | 2017 | |||||
| Total current assets | $ | 1,543 | $ | 649 | |||
| Total current liabilities | 636 | 590 | |||||
| Working capital | $ | 907 | $ | 59 | |||
| Cash and cash equivalents | (864 | ) | — | ||||
| Net working capital | $ | 42 | $ | 59 | |||
| Electronics Segment | Year Ended December 31 | Components of Change vs. Prior Year | ||||||||||||||||||||||||||||||||||||||
Dollars in millions, (except where specified) | 2017 | 2016 | U.S. GAAP Reported | Currency | Acquisitions / Divestitures | Organic1 | ||||||||||||||||||||||||||||||||||
| $ | % | $ | % | Chg. $ | Chg.% | $ | % | $ | % | $ | % | |||||||||||||||||||||||||||||
| Net Sales | $ | 1,850 | $ | 1,837 | $ | 14 | 1 | % | $ | 4 | — | % | $ | — | — | % | $ | 11 | 1 | % | ||||||||||||||||||||
| Operating Loss / Margin | $ | (14 | ) | (0.7 | )% | $ | 11 | 0.6 | % | $ | (25 | ) | ||||||||||||||||||||||||||||
EBITDA1/% | $ | 67 | 3.6 | % | $ | 81 | 4.4 | % | $ | (14 | ) | |||||||||||||||||||||||||||||
| Associates | 5,898 | 5,045 | 853 | |||||||||||||||||||||||||||||||||||||
| Brake Systems Segment | Year Ended December 31 | Components of Change vs. Prior Year | |||||||||||||||||||||||||||||||||||||||
Dollars in millions, (except where specified) | 2017 | 2016 | U.S. GAAP Reported | Currency | Acquisitions / Divestitures | Organic1 | |||||||||||||||||||||||||||||||||||
| $ | % | $ | % | Chg. $ | Chg.% | $ | % | $ | % | $ | % | ||||||||||||||||||||||||||||||
| Net Sales | $ | 476 | $ | 391 | $ | 85 | 22 | % | $ | (7 | ) | (2 | )% | $ | 121 | 31 | % | $ | (29 | ) | (7 | )% | |||||||||||||||||||
| Operating Loss / Margin | $ | (247 | ) | (51.9 | )% | $ | (12 | ) | (3.1 | )% | $ | (235 | ) | ||||||||||||||||||||||||||||
EBITDA1/% | $ | (210 | ) | (44.2 | )% | $ | 24 | 6.0 | % | $ | (234 | ) | |||||||||||||||||||||||||||||
| Associates | 1,586 | 1,733 | (147 | ) | |||||||||||||||||||||||||||||||||||||
| Corporate and Other | Year Ended December 31 | |||||||||||||||||||
Dollars in millions, (except where specified) | 2017 | 2016 | U.S. GAAP Reported | |||||||||||||||||
| $ | % | $ | % | Chg. $ | Chg.% | |||||||||||||||
| Net Sales | $ | — | $ | — | $ | — | — | % | ||||||||||||
| Operating Loss / Margin | $ | (22 | ) | — | % | $ | (24 | ) | — | % | $ | 2 | ||||||||
Segment EBITDA 1/ Margin | $ | (21 | ) | — | % | $ | (24 | ) | — | % | $ | 2 | ||||||||
| Associates | — | — | — | |||||||||||||||||
| Consolidated Net Sales | Year Ended December 31 | Components of Change vs. Prior Year | |||||||||||||||||||||||||||||||||
Dollars in millions, (except where specified) | 2017 | 2016 | U.S. GAAP Reported | Currency | Acquisitions/Divestitures | Organic1 | |||||||||||||||||||||||||||||
| $ | $ | Chg. $ | Chg. % | $ | % | $ | % | $ | % | ||||||||||||||||||||||||||
| Restraint Control Systems | $ | 1,073 | $ | 1,097 | $ | (24 | ) | (2 | )% | $ | 3 | — | % | $ | — | — | % | $ | (27 | ) | (3 | )% | |||||||||||||
| Active Safety | $ | 777 | $ | 739 | $ | 38 | 5 | % | $ | — | — | % | $ | — | — | % | $ | 38 | 5 | % | |||||||||||||||
| Brake Systems | $ | 473 | $ | 383 | $ | 90 | 23 | % | $ | (7 | ) | (2 | )% | $ | 121 | 31 | % | $ | (24 | ) | (6 | )% | |||||||||||||
| Total | $ | 2,322 | $ | 2,218 | $ | 104 | 5 | % | $ | (3 | ) | — | % | $ | 121 | 5 | % | $ | (13 | ) | (1 | )% | |||||||||||||
| Income Statement | Year Ended December 31 | ||||||||||||||||
Dollars in thousands, (except per share data) | 2017 3 | 2016 3 | |||||||||||||||
| $ | % | $ | % | Change | |||||||||||||
| Net sales | $ | 2,322 | $ | 2,218 | $ | 104 | |||||||||||
| Cost of sales | (1,857 | ) | (80.0 | )% | (1,795 | ) | (80.9 | )% | (62 | ) | |||||||
| Gross profit | $ | 466 | 20.0 | % | $ | 423 | 19.1 | % | $ | 43 | |||||||
| Selling, general & administrative expenses | (110 | ) | (4.7 | )% | (110 | ) | (5.0 | )% | — | ||||||||
| Research, development & engineering expenses, net | (375 | ) | (16.1 | )% | (300 | ) | (13.5 | )% | (75 | ) | |||||||
| Goodwill impairment charges | (234 | ) | (10.1 | )% | — | — | % | (234 | ) | ||||||||
| Amortization of intangibles | (37 | ) | (1.6 | )% | (35 | ) | (1.6 | )% | (2 | ) | |||||||
| Other income | 8 | 0.3 | % | (4 | ) | (0.2 | )% | 12 | |||||||||
| Operating loss | $ | (283 | ) | (12.2 | )% | $ | (25 | ) | (1.1 | )% | $ | (258 | ) | ||||
| Loss from equity method investments | (31 | ) | (1.3 | )% | — | — | % | (31 | ) | ||||||||
| Interest income | 1 | — | % | — | — | % | 1 | ||||||||||
| Interest (expense) | — | — | % | — | — | % | — | ||||||||||
| Other non-operating items, net | (1 | ) | — | % | 3 | — | % | (4 | ) | ||||||||
| Loss before income taxes | $ | (314 | ) | (13.5 | )% | $ | (22 | ) | (1.0 | )% | $ | (292 | ) | ||||
| Income tax expense | (30 | ) | (1.4 | )% | (38 | ) | (1.7 | )% | 8 | ||||||||
Net loss1 | $ | (344 | ) | (14.8 | )% | $ | (60 | ) | (2.7 | )% | $ | (284 | ) | ||||
| Less: Net loss attributable to non-controlling interest | (127 | ) | (5.5 | )% | (7 | ) | (0.3 | )% | (120 | ) | |||||||
| Net loss attributable to controlling interest | $ | (217 | ) | (9.0 | )% | $ | (53 | ) | (2.4 | )% | $ | (164 | ) | ||||
Net loss per share – basic2 | $ | (2.49 | ) | $ | (0.61 | ) | $ | (1.88 | ) | ||||||||
Weighted average number of shares outstanding in millions2 | 87.13 | 87.13 | 0.00 | ||||||||||||||
| Dollars in millions | Year Ended December 31 | ||||||
| Net Loss to EBITDA | 2017 | 2016 | |||||
| Net Loss | $ | (344 | ) | $ | (60 | ) | |
| Depreciation and amortization | 119 | 105 | |||||
| Loss from equity method investment | 31 | — | |||||
| Interest and other non-operating items, net | 1 | (3 | ) | ||||
| Income tax | 30 | 38 | |||||
| EBITDA | $ | (164 | ) | $ | 80 | ||
| Dollars in millions | Year Ended December 31 | ||||||
| Segment EBITDA | 2017 | 2016 | |||||
| Electronics | $ | 67 | $ | 81 | |||
| Brake Systems | (210 | ) | 24 | ||||
| Segment EBITDA | $ | (143 | ) | $ | 104 | ||
| Corporate and other | (21 | ) | (24 | ) | |||
| EBITDA | $ | (164 | ) | $ | 80 | ||
| Dollars in millions | Year Ended December 31 | ||||||
| Working Capital to Net Working Capital | 2017 | 2016 | |||||
| Total current assets | $ | 649 | $ | 649 | |||
| Total current liabilities | 590 | 576 | |||||
| Working capital | $ | 59 | $ | 73 | |||
| Cash and cash equivalents | — | — | |||||
| Net working capital | $ | 59 | $ | 73 | |||
Liquidity and Capital Resources
Liquidity
As of December 31, 2018,2019, the Company had cash and cash equivalents of $864$894 million and short-term investments of $5(includes $35 million in assets held for sale), which will be primarily useused for ongoing working capital requirements, capital expenditures and investments in joint ventures particularly Zenuity.
49
The Company has no other material obligations other than short-term obligations related to operations, inventory, services, tooling and property, plant and equipment purchased in the ordinary course of business.
On June 30, 2017, Veoneer committed to make a $15 million investment in Autotech Fund I, L.P. pursuant to a limited partnership agreement, and as a limited partner, will periodically make capital contributions toward this total commitment amount. As of December 31, 2018,2019, Veoneer contributed a total of approximately $8$10 million to the fund. As of December 31, 2019, the Company has received approximately $2 million of distributions from the fund. The initial term of the fund is set to expire on December 31, 2025. This fund focuses broadly on the automotive industry and complements the Company’s innovation strategy, particularly in the areas of active safety and autonomous driving. Under the limited partnership agreement, the general partner has the sole and exclusive right to manage, control and conduct the affairs of the fund.
Cash Flow
| Year Ended December 31 | ||||||||||||||||||||||||||||
| Year Ended December 31 | ||||||||||||||||||||||||||||
| Dollars in millions | 2018 | 2017 | 2016 | |||||||||||||||||||||||||
| (Dollars in millions) | (Dollars in millions) | 2019 | 2018 | |||||||||||||||||||||||||
| Selected cash flow items | $ | $ | $ | Selected cash flow items | $ | $ | ||||||||||||||||||||||
Net working capital1 | $ | 42 | $ | 59 | $ | 73 | Net working capital1 | $ | 3 | $ | 42 | |||||||||||||||||
| Net cash provided by operating activities | $ | (179 | ) | $ | (1 | ) | $ | (7 | ) | |||||||||||||||||||
| Net cash provided / (used) by operating activities | Net cash provided / (used) by operating activities | $ | (325) | $ | (179) | |||||||||||||||||||||||
| Capital expenditures | $ | (188 | ) | $ | (110 | ) | $ | (103 | ) | Capital expenditures | $ | (213) | $ | (188) | ||||||||||||||
| Equity method investment | $ | (71 | ) | $ | — | $ | — | Equity method investment | $ | (58) | $ | (71) | ||||||||||||||||
| Net Cash Used in investing activities | $ | (185 | ) | $ | (230 | ) | $ | (335 | ) | Net Cash Used in investing activities | $ | (265) | $ | (185) | ||||||||||||||
| Net Cash Provided by financing activities | $ | 1,226 | $ | 232 | $ | 343 | Net Cash Provided by financing activities | $ | 636 | $ | 1,226 | |||||||||||||||||
1Non-U.S. GAAP measure see reconciliation for Net Working Capital
Net Working Capital1 - The netNet working capital of $42$3 million asimproved by $39 million during the full year of December 31, 2018 was a decrease of $17 million and $31 million2019 as compared with 2017 and 2016, respectively. These decreases were mainlyto 2018 primarily due to favorable timing effectsa reduction in working capital.customer trade receivables and inventories, net.
Net Cash Usedcash used in Operating Activitiesoperating activities - Net cash used in operating activities of $179$325 million forduring the full year ended December 31, 2018 increased by $178of 2019 was $146 million and $172 millionhigher as compared with 2017 and 2016, respectively, due to 2018. The higher net loss was partially offset by the positive change in net lossworking capital1 and timing effects in working capital.other, net.
Net Cash Usedcash used in Investing Activitiesinvesting activities - Net cash used in investing activities of $185$265 million forduring the full year ended December 31, 2018 was $45of 2019 increased $80 million lower and $150 million lower as compared with 2017 and 2016, respectively, mainlyto 2018 due to higher capital expenditures which was more thanand lower related party notes receivable partially offset by lower affiliate investments and acquisitions.Zenuity funding.
Net Cash Provided by Financing Activities - Net cash provided by financing activities for the year ended December 31, 20182019 includes the net capital contributionraise of $603 million derived from Autoliv at the Distribution Date.issuance of common stock and convertible debt notes in May of 2019.
Capital Expenditures - Capital expenditures during the year ended December 31, 2018 of $188$213 million, around 8%or 11% of sales, was $78 million and $85 million higher as compared with 2017 and 2016, respectively. This level as a percentage of sales in 2018 was in line withfor the full year expectation.of 2019 increased by $25 million as compared to 2018. We expect the level of capital expenditures to be ~11% of sales for 2020, including VBS, to support sales growth in 2020 and in the future.
| Year Ended December 31 | ||||||||||||||||||||||||||
| Associates | 2019 | 2018 | ||||||||||||||||||||||||
| Total Associates | 8,874 | 8,600 | ||||||||||||||||||||||||
| Whereof: | Direct Manufacturing | 2,002 | 2,083 | |||||||||||||||||||||||
| R,D&E | 4,907 | 4,676 | ||||||||||||||||||||||||
| Temporary | 1,396 | 1,329 | ||||||||||||||||||||||||
| Year Ended December 31 | |||||||||||
| Associates | 2018 | 2017 | 2016 | ||||||||
| Total Associates | 8,600 | 7,484 | 6,778 | ||||||||
| Whereof: | Direct Manufacturing | 2,083 | 2,232 | 2,279 | |||||||
| R,D&E | 4,676 | 3,576 | 2,775 | ||||||||
| Temporary | 1,329 | 1,151 | 1,046 | ||||||||
Off-Balance Sheet Arrangements
The Company does not have any off-balance sheet arrangements.
50
Contractual Obligations and Commitments
The table below reflects our contractual obligations as of December 31, 2018.2019. The Company’s future contractual obligations have not changed materially.
| (Dollars in millions) | Payments due by Period | |||||||||||||||||||||||||||||||||||||||||||||||||||||||
Aggregate Contractual Obligations 1 | Total | Less than 1 year | 1-3 years | 3-5 years | More than 5 years | |||||||||||||||||||||||||||||||||||||||||||||||||||
| Operating lease obligations | 118 | 22 | 33 | 21 | 42 | |||||||||||||||||||||||||||||||||||||||||||||||||||
| Pension contribution requirements | 27 | 2 | 4 | 5 | 16 | |||||||||||||||||||||||||||||||||||||||||||||||||||
| Finance lease obligations | 51 | 3 | 7 | 7 | 34 | |||||||||||||||||||||||||||||||||||||||||||||||||||
| Other non-current liabilities reflected on the balance sheet | 6 | 1 | — | — | 5 | |||||||||||||||||||||||||||||||||||||||||||||||||||
| 4.00% Convertible Senior Notes and Financial loans | 218 | 3 | 3 | 212 | — | |||||||||||||||||||||||||||||||||||||||||||||||||||
| Fixed Interest on 4.00% Convertible Senior Notes | 37 | 8 | 17 | 12 | — | |||||||||||||||||||||||||||||||||||||||||||||||||||
| Total | $ | 457 | $ | 39 | $ | 64 | $ | 257 | $ | 97 | ||||||||||||||||||||||||||||||||||||||||||||||
Aggregate Contractual Obligations 1 | Payments due by Period | |||||||||||||||||||
| (DOLLARS IN MILLIONS) | Total | Less than 1 year | 1-3 years | 3-5 years | More than 5 years | |||||||||||||||
| Related party long-term debt | 13 | 1 | 12 | — | — | |||||||||||||||
| Operating lease obligations | 88 | 17 | 24 | 12 | 34 | |||||||||||||||
| Build-to-suit lease obligations | 51 | 3 | 6 | 6 | 35 | |||||||||||||||
| Pension contribution requirements | 36 | 3 | 5 | 6 | 22 | |||||||||||||||
| Capital lease obligations | 15 | 1 | 12 | 1 | 1 | |||||||||||||||
| Other non-current liabilities reflected on the balance sheet | 9 | 2 | 2 | — | 4 | |||||||||||||||
| Unconditional purchase obligations | 10 | 10 | — | — | — | |||||||||||||||
| Total | $ | 222 | $ | 37 | $ | 61 | $ | 25 | $ | 96 | ||||||||||
Contractual obligations include related party long-term debt, leaseleases and purchase obligations that are enforceable and legally binding on the Company. Non-controlling interest is not included in this table.
Operating lease obligations: The Company leases certain offices, manufacturing and research buildings, machinery, automobiles and data processing and other equipment. Such operating leases, some of which are non-cancelable and include renewals, expire on various dates. See Note 16, Commitments and Contingencies, to the consolidated financial statements included herein.
Pension contribution requirements: The Company sponsors defined benefit plans that cover eligible employees in Japan, Canada, and France. In 2019,2020, the expected contribution to all plans, including direct payments to retirees, is $3$2 million, of which the major contribution is $1 million for our Canada pension plans. Due to volatility associated with future changes in interest rates and plan asset returns, the Company cannot predict with reasonable reliability the timing and amounts of future funding requirements, and therefore the above table shows expected contributions (to funded plans, or direct payments to retirees in the case of unfunded plans) for 2019,2020, but only shows benefit payments (from funded plans, or direct to retirees in the case of unfunded plans) for 20202021 and subsequent years. We may elect to make contributions in excess of the minimum funding requirements for the Japan, Canada, and France plans in response to investment performance and changes in interest rates, or when we believe that it is financially advantageous to do so and based on other capital requirements. This contribution amount does not include plans considered to be multiemployer with Autoliv. See Note 2, Summary of Significant Accounting Policies, and Note 14,17, Retirement Plans, to the consolidated financial statements included herein.
Unconditional purchase obligations: During the year ended December 31, 2017, the Company entered into an unconditional purchase obligation of $30 million of which $10 million was paid in each of the years ended December 31, 2017 and December 31, 2018. The remaining $10 million will be paid in 2019. This amount will be reimbursed by Zenuity. There are no material obligations other than short-term obligations related to inventory, services, tooling, and property, plant and equipment purchased in the ordinary course of business.
Autotech Venture Fund: On June 30, 2017, Veoneer committed to make a $15 million investment in Autotech Fund I, L.P. pursuant to a limited partnership agreement, and, as a limited partner, will periodically make capital contributions toward this total commitment amount. As of December 31, 2018,2019, Veoneer has in total contributed $8$10 million to the fund. As of December 31, 2019, the Company has received approximately $2 million of distributions from the fund. The initial term of the fund is set to expire on December 31, 2025. This fund focuses broadly on the automotive industry and complements the Company’s innovation strategy, particularly in the areas of active safety and autonomous driving. Under the limited partnership agreement, the general partner has the sole and exclusive right to manage, control, and conduct the affairs of the fund.
51
Significant Accounting Policies and Critical Accounting Estimates
New Accounting Pronouncements
The Company has considered all applicable recently issued accounting guidance. The Company has summarized in Note 2, Summary of Significant Accounting Policies to the consolidated financial statements included herein each of the recently issued accounting pronouncements and stated the impact or whether management is continuing to assess the impact.
Critical Accounting Estimates
The application of accounting policies necessarily requires judgments and the use of estimates by a Company’s management. Actual results could differ from these estimates. By their nature, these judgments are subject to an inherent degree of uncertainty. These judgments are based on our historical experience, terms of existing contracts, and management’s evaluation of trends in the industry, information provided by our customers and information available from other outside sources, as appropriate. Certain policies relate to estimates that involve matters that are highly uncertain at the time the accounting estimate is made and different estimates or changes to an estimate could have a material impact on the reported financial position, changes in financial condition or results of operations. Such critical estimates are discussed below. For these, materially different amounts could be reported under varied conditions and assumption. Other items in the Company's consolidated financial statements require estimation, however, in our judgment, they are not as critical as those discussed below.
Revenue Recognition
In accordance with ASC 606, Revenue from Contracts with Customers, revenue is measured based on consideration specified in a contract with a customer, adjusted for any variable consideration (i.e. price concessions or annual price adjustments) and estimated at contract inception. The variable consideration calculation involves management assumptions including the volume of light vehicle production, future sales volumes for specific parts, or future price concessions to be granted. The Company recognizes revenue when it satisfies a performance obligation by transferring control over a product to a customer.
In addition, from time to time, Veoneer may make payments to customers in connection with ongoing and future business. These payments to customers are generally recognized as a reduction to revenue at the time of the commitment to make these payments, unless certain criteria are met, warranting capitalization. If the payments are capitalized, the amounts are amortized as the related goods are transferred. As of December 31, 2018,2019, and 2017,2018, the Company capitalized $54$81 million and $23$62 million, respectively, in Other non-current assets related payments to customers. The Company assesses these amounts for impairment. There was no impairment.
Taxes assessed by a governmental authority that are both imposed on and concurrent with a specific revenue-producing transaction, that are collected by the Company from a customer, are excluded from revenue.
Shipping and handling costs associated with outbound freight after control of a product has transferred to a customer are accounted for as a fulfillment cost and are included in cost of sales.
Nature of goods and services
The following is a description of principal activities from which the Company generates its revenue. The Company has two operating segments, Electronics and Brake Systems. Electronics includes all of electronics resources and expertise, restraint control systems and active safety products. Brake Systems provides brake control and actuation systems. The principal activities are essentially the same for each of the segments. Both of the segments generate revenue from the sale of production parts to original equipment manufacturers (“OEMs”).
The Company accounts for individual products separately if they are distinct (i.e., if a product is separately identifiable from other items and if a customer can benefit from it on its own or with other resources that are readily available to the customer). The consideration, including any price concession or annual price adjustments, is based on their stand-alone selling prices for each of the products. The stand-alone selling prices are determined based on the cost-plus margin approach.
The Company recognizes revenue for production parts primarily at a point in time.
52