UNITED STATES
SECURITIES AND EXCHANGE COMMISSION
Washington, D.C. 20549
FORM 10-K
☒ ANNUAL REPORT PURSUANT TO SECTION 13 OR 15(d) OF THE SECURITIES EXCHANGE ACT OF 1934
For the fiscal year ended November 30, 20212023
OR
☐ TRANSITION REPORT PURSUANT TO SECTION 13 OR 15(d) OF THE SECURITIES EXCHANGE ACT OF 1934
For the transition period from _______ to ________
Commission File Number: 001-39494
CONCENTRIX CORPORATION
(Exact name of Registrant as specified in its charter)
| | | | | | | | |
| Delaware | | 27-1605762 |
(State or other jurisdiction of
incorporation or organization) | | (I.R.S. employer
identification number) |
| | | | | | | | |
44111 Nobel39899 Balentine Drive, Fremont,Suite 235, Newark, California | | 9453894560 |
| (Address of principal executive offices) | | (Zip Code) |
(Registrant’s telephone number, including area code): (800) 747-0583
Securities registered pursuant to Section 12(b) of the Act:
| | | | | | | | |
| Title of each class | Trading Symbol(s) | Name of each exchange on which registered |
| Common Stock, par value $0.0001 per share | CNXC | The Nasdaq Stock Market LLC |
Securities registered pursuant to Section 12(g) of the Act: None
Indicate by check mark if the Registrant is a well-known seasoned issuer, as defined in Rule 405 of the Securities Act. Yes ☒ No ☐
Indicate by check mark if the Registrant is not required to file reports pursuant to Section 13 or Section 15(d) of the Act. Yes ☐ No ☒
Indicate by check mark whether the Registrant (1) has filed all reports required to be filed by Section 13 or 15(d) of the Securities Exchange Act of 1934 during the preceding 12 months (or for such shorter period that the Registrant was required to file such reports), and (2) has been subject to such filing requirements for the past 90 days. Yes ☒ No ☐
Indicate by check mark whether the Registrant has submitted electronically every Interactive Data File required to be submitted pursuant to Rule 405 of Regulation S-T (§232.405 of this chapter) during the preceding 12 months (or for such shorter period that the Registrant was required to submit such files). Yes ☒ No ☐
Indicate by check mark whether the Registrant is a large accelerated filer, an accelerated filer, a non-accelerated filer, a smaller reporting company, or an emerging growth company. See the definitions of “large accelerated filer,” “accelerated filer,” “smaller reporting company,” and “emerging growth company” in Rule 12b-2 of the Exchange Act.
Large accelerated filer ☒ Accelerated filer ☐ Non-accelerated filer ☐ Smaller reporting company ☐ Emerging growth company ☐
If an emerging growth company, indicate by check mark if the Registrant has elected not to use the extended transition period for complying with any new or revised financial accounting standards provided pursuant to Section 13(a) of the Exchange Act. ☐
Indicate by check mark whether the Registrant has filed a report on and attestation to its management’s assessment of the effectiveness of its internal control over financial reporting under Section 404(b) of the Sarbanes-Oxley Act (15 U.S.C. 7262(b)) by the registered public accounting firm that prepared or issued its audit report. ☒
If securities are registered pursuant to Section 12(b) of the Act, indicate by check mark whether the financial statements of the registrant included in the filing reflect the correction of an error to previously issued financial statements. ☐
Indicate by check mark whether any of those error corrections are restatements that required a recovery analysis of incentive-based compensation received by any of the registrant’s executive officers during the relevant recovery period pursuant to §240.10D-1(b). ☐
Indicate by check mark whether the Registrant is a shell company (as defined in Rule 12b-2 of the Act). Yes ☐ No ☒
The aggregate market value of the company’s common stock held by non-affiliates of the registrant was $7,821,634,825,$4,534,950,512, computed by reference to the closing sale price of the common stock on the Nasdaq Stock Market LLC on May 28, 2021,31, 2023, the last business day of the registrant’s most recently completed second fiscal quarter.
As of January 17, 2022,2024, there were 52,317,51766,331,695 shares of common stock issued and outstanding.
DOCUMENTS INCORPORATED BY REFERENCE
Items 10, 11, 12, 13 and 14 of Part III of this Annual Report on Form 10-K incorporate by reference portions of the Registrant’s definitive proxy statement relating to its 20222024 Annual Meeting of Stockholders (the “2022“2024 Proxy Statement”) where indicated. The 20222024 Proxy Statement will be filed with the U.S. Securities and Exchange Commission within 120 days after the end of the fiscal year to which this report relates.
Table of Contents
Note Regarding Forward-Looking Statements
Unless otherwise indicated or except where the context otherwise requires, the terms “Concentrix,“Concentrix,” “we,” “us” and “our” and other similar terms in this Annual Report on Form 10-K refer to Concentrix Corporation and its subsidiaries.
This Annual Report on Form 10-K includes forward-looking statements within the meaning of Section 27A of the Securities Act of 1933, as amended (the “Securities Act”), and Section 21E of the Securities Exchange Act of 1934, as amended (the “Exchange Act”). Forward-looking statements include, but are not limited to, statements regarding our expected future financial condition, results of operations, effective tax rate, cash flows, leverage, liquidity, business strategy, competitive position, demand for our services and seasonality of our business, international operations, acquisition opportunities and the anticipated impact of acquisitions, capital allocation and dividends, growth opportunities, spending, capital expenditures and investments, competition and market forecasts, industry trends, our human capital resources and sustainability initiatives, and statements that include words such as believe, expect, may, will, provide, could and should and other similar expressions. These forward-looking statements are inherently uncertain and involve substantial risks and uncertainties that could cause actual results to differ materially from those expressed or implied by such statements. Risks and uncertainties include, among other things: risks related to our combination with Webhelp, including the ability to retain key employees and successfully integrate the Webhelp business; our ability to realize estimated cost savings, synergies or other anticipated benefits of our combination with Webhelp, or that such benefits may take longer to realize than expected; diversion of management’s attention; the potential impact of the consummation of our combination with Webhelp on relationships with clients and other third parties; risks related to general economic conditions, including uncertainty related to the COVID-19 pandemic and its impact on the global economy,consumer demand, interest rates, inflation, supply chains inflation, our business and the businesseffects of our clients; other communicable diseases, natural disasters, adverse weather conditions or public health crises;the conflicts in Ukraine and Gaza; cyberattacks on our or our clients’ networks and information technology systems; uncertainty around, and disruption from, new and emerging technologies, including the inability to protect personaladoption and proprietary information;utilization of generative artificial intelligence; the failure of our staff and contractors to adhere to our and our clients’clients’ controls and processes; the inability to protect personal and proprietary information; the effects of communicable diseases or other public health crises, natural disasters, and adverse weather conditions; geopolitical, economic and climate- or weather-related risks in regions with a significant concentration of our operations; the inability to execute on our digital customer experience strategy; the inability to successfully identify, complete and integrate strategic acquisitions or investments, including our integration of PK; competitive conditions in our industry and consolidation of our competitors; geopolitical, economic and climate or weather related risks in regions with a significant concentration of our operations; higher than expected tax liabilities; the loss of key personnel; the demand for customer experience solutions and technology; variability in demand by our clients or the early termination of our client contracts; the level of business activity of our clients and the market acceptance and performance of their products and services; the operability of our communication servicesdemand for customer experience solutions and information technology systems and networks; changes in law, regulations or regulatory guidance; currency exchange rate fluctuations;technology; damage to our reputation through the actions or inactions of third parties; changes in law, regulations or regulatory guidance; the operability of our communication services and information technology systems and networks; the loss of key personnel or the inability to attract and retain staff with the skills and expertise needed for our business; increases in the cost of labor; the inability to successfully identify, complete and integrate strategic acquisitions or investments; higher than expected tax liabilities; currency exchange rate fluctuations; investigative or legal actions; and other risks that are described under “Risk Factors”“Risk Factors” in Part I, Item 1A of this Annual Report on Form 10-K. We do not intend to update forward-looking statements, which speak only as of the date hereof, unless otherwise required by law.
Concentrix, Webhelp, Concentrix + Webhelp, the Concentrix Logo,logo, the Webhelp logo, and all other Concentrix company, product and services names and slogans are trademarks or registered trademarks of Concentrix Corporation and its subsidiaries. Concentrix, Webhelp, the Concentrix logo and the Concentrix LogoWebhelp logo Reg. U.S. Pat. & Tm. Off. and applicable non-U.S. jurisdictions. Other names and marks are the property of their respective owners.
Part I
ITEM 1. BUSINESS
We are a leading global provider of Customer Experience (“CX”) solutions and technology that help iconic and disruptive brands drive deep understanding, full lifecycle engagement, and differentiated experiences for their end-customersend-
customers around the world. We provide end-to-end capabilities, including CX process optimization, technology innovation, front- and back-office automation, analytics and business transformation services to clients in five primary industry verticals. Our differentiated portfolio of solutions supportsupports Fortune Global 500 as well as high-growth companies across the globe in their efforts to deliver an optimized, consistent brand experience across all channels of communication, such as voice, chat, email, social media, asynchronous messaging, and custom applications. We strive to deliver exceptional services globally supported by our deep industry knowledge, technology and security practices, talented people, and digital and analytics expertise.
We offer our clients integrated solutions supporting the entirety of the customer lifecycle; CX and user experience (“UX”) strategy and design; analytics and actionable insights; and innovative new approaches to enhancing the customer experience through the latest technological advancements in our industry. We are a leader in the shift from traditional Customer Relationship Management (“CRM”), which is focused on a portion of the customer lifecycle, to CX, which supports the entirety of it. Through our end-to-end capabilities, we deliver better economic outcomes for our clients with solutions designed to meet their unique needs as they navigate a landscape characterized by discerning consumers and new market entrants.
We have strong relationships with companies across the globe and are a partner of choice for industry leaders. We believe in supporting our clients over the long term to build enduring relationships. Our average client tenure for our top 30 clients is approximately 16more than 15 years. As of November 30, 2021,2023, we served over 100155 Fortune Global 500 clients as well as more than 115320 new economy clients. We primarily support clients in verticals with certain characteristics, such as high growth, high transaction volume, high levels of compliance and security, and steep barriers to entry. Our strategic verticals include technology and consumer electronics, communications and media, retail, travel and e-commerce,ecommerce, banking, financial services and insurance, healthcare, communications and media, and other. Our clients include:
•7 of the top 10 consumer electronics companies
•4 of the top 5 tech companies
•67 of the top 10 fintech companies
•5 of the top 510 U.S. banks
•3 of the top 5 ecommerce companies
•4 of the top 5 U.S. health insurance companies
•3 of the top 5 2021 global IPOs
•4 of the top 5 social brands
Through our technology-infused offerings, our clients benefit from having a single resource that enables them to address the entirety of the customer journey from acquisition to support to renewal. Our end-to-end capabilities and broad service offerings help our clients acquire, retain, and improve the lifetime value of their customer relationships while optimizing their back-office processes.
We combine global consistency with local expertise, enhancing the end user experience for our clients’ customers through services rendered by a team of approximately 290,000440,000 employees and staff, which we refer to as game-changers, across approximately 270500 locations in more than 4070 countries and 6six continents, where we conduct business in over 70150 languages.
OnIn September 2023, we completed our acquisition (the “Webhelp Combination”) of all of the issued and outstanding capital stock of Marnix Lux SA, a public limited liability company (société anonyme) incorporated under the laws of the Grand Duchy of Luxembourg (“Webhelp Parent”) and the parent company of the Webhelp business (“Webhelp”), from the holders thereof (the “Sellers”). Webhelp is a leading provider of CX solutions, including sales, marketing, and payment services, with significant operations and client relationships in Europe, Latin America, and Africa. The Webhelp Combination strengthens our position as a global CX leader, with an expanded breadth of artificial intelligence (“AI”) solutions, digital capabilities, and high-value services. We believe it also strengthens our end-to-end CX value proposition, with one of the most robust, well-balanced global footprints in the industry.
In July 2022, we completed our acquisition of ServiceSource International, Inc. (“ServiceSource”), a global outsourced go-to-market services provider, delivering business-to-business (“B2B”) digital sales and customer success solutions, which complemented our existing offerings in this area.
In December 27, 2021, we completed our acquisition of PK, a leading CX design engineering company with more than 5,000 staff in four countries. PKcountries, which creates pioneering experiences that accelerate digital outcomes for their clients’ customers, partners and staff. The acquisition of PK expandsexpanded our scale in the digital IT services market and supportssupported our growth strategy of investing in digital transformation to deliver exceptional customer experiences. The addition of the PK staff and technology to our team further strengthensstrengthened our capabilities in CX design and development, artificial intelligence (“AI”),AI, intelligent automation, and customer loyalty.
On December 1, 2020, the previously announced separation (the “separation”) of Concentrix andWe trace our technology-infused CX solutions business fromroots back to 2004 when SYNNEX Corporation, now known as TD SYNNEX Corporation (“TD SYNNEX”), was completed through a tax-free distribution of all of the issued and outstanding shares of our common stock to TD SYNNEX stockholders (the “distribution” and, together with the separation, the “spin-off”). TD SYNNEX stockholders received one share of our common stock for each share of TD SYNNEX common stock held as of the close of business on November 17, 2020. As a result of the spin-off, we became an independent public company and our common stock commenced trading on the Nasdaq Stock Market (“Nasdaq”) under the symbol “CNXC” on December 1, 2020. In connection with the spin-off, on November 30, 2020, we entered into a separation and distribution agreement, an employee matters agreement, a tax matters agreement and a commercial agreement with TD SYNNEX to set forth the principal actions to be taken in connection with the spin-off and define our ongoing relationship with TD SYNNEX after the spin-off.
We trace our roots back to 2004 when TD SYNNEX acquired BSA Sales, Inc., a company with 20 employees focused on helping clients through outsourced sales and marketing services. In 2006, TD SYNNEX combined New York-based Concentrix with BSA Sales under the Concentrix name, with the goal of bringing technology and innovation into businesses to help clients reimagine and design the next generation of experiences. Concentrix Corporation was incorporated in Delaware in December 2009. In December 2020, Concentrix and our technology-infused CX solutions business were separated from TD SYNNEX through a tax-free distribution of all of the issued and outstanding shares of our common stock to TD SYNNEX stockholders (such separation and distribution, the “spin-off”). As a result of the spin-off, we became an independent public company and our common stock commenced trading on the Nasdaq Stock Market (“Nasdaq”) under the symbol “CNXC” on December 1, 2020.
Our Market Opportunity
In order to maintain relevancy, our clients must transform their systems in response to increased competition and consumer demands. To meet the evolving needs of their customers, our clients are looking to large CX solutions and technology providers, such as Concentrix, to automate their systems and provide professional support to address complexities beyond the scope of automation. We are a leader in next-generation CX technology driven by a focus on innovation, which we believe will increase our total addressable market as we enter and grow across new and existing markets.
We offer a unique combination of CX solutions and services at scale. Our suite of integrated solutions include: digital transformation services that design and engineer CX solutions to enable efficient customer self-service and build customer loyalty; customer engagement solutions and services that address the entirety of the customer lifecycle; AI technology that can intelligently act on customer intent to improve customer experience with non-human engagement; voice of the customer (“VOC”) solutions to gather and analyze customer feedback to foster loyalty to, and growth with, clients; analytics and consulting solutions that synthesize data and provide professional insight to improve clients’ customer experience strategies; AI technology that can intelligently act on customer intent to improve customer experience with non-human engagement; vertical business process outsourcing (“BPO”) services that provide specialized support to specific industry verticals; and back office BPO services that support clients in non-customer facing areas.
Industry Trends
•Growing Importance of Customer Experience. We believe customer experience has become a strategic imperative for all enterprises today. Data, analytics, and digital solutions have reshaped the ways firmsenterprises interact with their customers. As a result, enterprises are modernizing how they manage the customer experience across all channels of communication. The market is evolving from customer relationship management solutions that act as a cost cutting measure toward end-to-end CX management solutions that create value throughout the entire customer lifecycle at an appropriate cost.
•Technological Innovation. Emerging technology is driving change within our industry and shaping the demands of our clients. Advancements in areas such as digital services, generative AI (“GenAI”), and machine learning (“ML”) are further disrupting our markets and our clients’ markets while opening new avenues for growth and opportunities for us to better serve our clients. These technologies provide clients the opportunity to interact more effectively with their customers and improve the customer experience by
automating processes, optimizing customer journeys to reach faster solutions, enabling personalized engagement across multiple platforms, and focusing human engagement on the most complex interactions.
•Empowered Consumers and Users. The modern consumer isModern consumers are discerning and hashave come to expect a high level of care and responsiveness from their service providers. Old paradigms have shifted as increasingly competitive markets and easily accessible crowd-sourced information have empowered consumers to unprecedented levels. As consumers demand more and have an increasing number of alternatives, companies must differentiate on how they manage their customer relationships. This shift is driving the market toward consumer-centric solutions that reduce customer churn and promote brand loyalty.
•Technological Innovation. Emerging technology is driving change within our industry and shaping the demands of our clients. Advancements in areas such as digital services, AI and machine learning (“ML”) are further disrupting our markets and our clients’ markets while opening new avenues for growth and opportunities for us to better serve our clients. These technologies provide clients the opportunity to interact more effectively with their customers and improve the customer experience by automating processes, optimizing customer journeys to reach faster solutions, enabling personalized engagement across multiple platforms, and focusing human engagement on the most complex interactions.
•Evolving Role of People. The skill set required of advisors in the CRM and BPO industry is shifting as enterprises continue to place increased importance on CX. Increasing complexity in the voice channel is driving a trend of longer customer engagements requiring CRM and BPO support professionals to have a more robust skill set. The increasing importance of skilled labor in our industry is offset by the transition of low complexity support to online support (self-service), driven by heavy automation and digitization. Despite growth in digital channels, phone conversations currently remain the preferred option for customer services interactions. We believe the human element will continue to be important in our industry, as focus shifts
from routine service to “last-mile” support requiring human-touch to deliver a stronger customer experience. In our view, attracting and retaining skilled talent that can adapt to the evolving focus of customer engagements will require a diverse and inclusive workplace that supports staff wellness.
•Mission Critical Nature of Cybersecurity. Technological innovation coupled with the proliferation of smart devices and mobile connectivity is generating sensitive data at scale. At the same time, the avenues for access have become numerous, and an increasing number of malicious actors are becoming more sophisticated and active. Data security is paramount in an environment where external intrusion, improper access, or carelessness can compromise customers and businesses. The COVID-19 pandemic significantly expanded the prevalence of CX solutions that rely on remote staff further underscoring the importance of robust data security. Businesses require scalable, industry-leading data protection and security to avoid reputational and operational risks in an environment characterized by the threats and benefits of free-flowing information.
•Enterprise Preferences Driving Vendor Consolidation. Enterprises have become increasingly global. As their scope of business increases, enterprises require a partner that can serve their needs by rapidly deploying solutions and new technology consistently across multiple geographies and channels. Enterprises therefore prefer vendors with scale and end-to-end capabilities that can be a one-stop shop and are consolidating existing relationships to vendors with scale to achieve their business objectives and pursue cost savings.
•Market Fragmentation Driving Industry Consolidation. We operate in a fragmented marketplace characterized by numerous vendors offering services across various levels of the value chain. Currently the top 10 players in CX only hold an approximate 35% market share with the remaining market share held by thousands of other vendors. As client preferences continue to evolve in line with enterprise preferences, we anticipate that our market will undergo further consolidation.
•Existing Solutions Have Many Limitations. As executives look to successfully navigate digital transformation and manage their customers’ experience across a wider variety of channels, unsophisticated providers and solutions often fail to meet customers’ needs. Currently there is a limited set of providers with end-to-end, global offerings of scale in the marketplace. The fragmentation of the market and, for many industries, high regulatory hurdles create additional complexity as most providers are small, niche, or local players. These issues are compounded by a lack of sufficient investment in cybersecurity, creating exposure to regulatory, reputational, and operational risks. These pain points, coupled with the prevalence of providers offering legacy solutions that fail to address the demands of the modern consumer, create an opportunity for large-scale, global CX solutions providers.
Our CX Solutions and Technology
Through our strategy, talent and technology, we offer solutions that help our clients enhance the experience for their customers and improve business performance. Our CX solutions encompass our core service offering of Customer Lifecycle Management, and threeas well as complementary areas:areas, including CX/UX Strategy and Design;Design, Digital Transformation;Transformation, and VOC and Analytics. Through our integrated CX solutions offering, our clients engage us to acquire, support and renew customers, leverage customer feedback and insights to constantly improve business performance, and identify and implement customer-facing and back-office process improvements. We help our clients by creating tools that their customers and employees love to use, enable better customer interactions through real-time sentiment analysis, and integrate multiple customer interactions and touchpoints into one-stop smart mobile applications. We provide these solutions and other complementary services in 70more than 150 languages, across 6six continents, from approximately 270500 locations in the Americas, Asia-Pacific and EMEA.Europe, the Middle East and Africa (“EMEA”).
Customer Lifecycle Management. We seek to deliver next-generation customer engagement solutions and services that address the entirety of the customer lifecycle. We offer our clients the means to acquire, support and renew customers across all channels while minimizing attrition and increasing customer lifetime value. Our Customer Lifecycle Management solutions include services such as customer care, sales support, digital marketing, technical support, digital self-service, content moderation, creative design and content production, and back office
services. Customer Lifecycle Management represents our core service offering and a significant majority of the services we provide.
In addition to our Customer Lifecycle Management services, we also provide the complementary services described below, whichthat are provided to clients as integrated solutions with our core service offering:offering, including:
•CX/UX Strategy and Design. We strive to help our clients reimagine what great is, designing next generation CX solutions to exceed customer expectations. Our CX/UX Strategy and Design solutions, including CX strategy, data-driven user design, journey mapping, and multi-platform engineering, enable our clients to create effortless, personalized customer engagements and align business priorities around measurable goals. Through these services, which we expanded with our acquisition of PK, we promote a more rapid integration of digital and enabling technologies, providing transformational business services to our clients.
•Digital Transformation. We seek to offer cutting edge solutions to reshape how brands better engage with their customers. Our innovative solutions and services are focused on creating disruption to help our clients stay relevant and achieve better business outcomes. Our Digital Transformation solutions include services such as Robotic Process Automation (“RPA”) and cognitive automation that automate processes to improve efficiency and accuracy, mobile app development to solve business challenges through new channels of customer engagement, work-at-home and gig platforms that capitalize on a changing and flexible workforce, Interactive Voice Response (“IVR”) and natural language understanding solutions that improve outcomes and customer experience with automated responses to verbal interactions, messaging and social platforms that allow clients to engage with customers across myriad platforms, and system integration services. OurThrough our acquisition of PK and the Webhelp Combination, we have added breadth and scale to our digital transformation services, further strengthening our capabilities in CX design and development, AI, intelligent automation, and customer loyalty.
•Voice of the Customer and Analytics. ConcentrixCX, our VOC solutions platform, helps turn customer feedback into actionable insights. Our Analytics solutions provide businesses with insight into rapidly changing markets through data, which provides our clients with a competitive edge. Our VOC and
Analytics solutions include offerings such as VOC Essentials, our VOC SaaS platform, speech and text insights, sentiment analysis, advanced analytics and real-time reporting.
Our Competitive Strengths
We believe the following strengths differentiate us from our competitors and provide us with a competitive advantage:
•Market Leader with a Differentiated Brand and Value Proposition: We strive to have a compelling brand and reputation as a leading provider of solutions and technology that shape the customer experience. We have a differentiated combination of global scale, local reach, technological expertise, end-to-end solution capabilities and full lifecycle services. We are widely recognized as a leading provider of CX solutions and technology, garnering industry attention via 86131 industry awards in fiscal year 2021.2023. Third-party researchers have also taken note of our leading global practice with Everest Group Research distinguishing us as a leader for the 68th time, recognizing us as a company with high buyer satisfaction, strong visionconsecutive year in 2023 for our innovative CX practices, risk mitigation strategies, and strategy, portfolio mix, innovation and investment and scope of services.agent engagement policies.
•Strong Relationships with a Growing and Diversified Client Base: We provide CX solutions for over 750more than 2,000 clients worldwide. Leading global companies, including more than 100155 Fortune Global 500 brands and more than 125320 new economy clients, rely upon our solutions and technology. We serve a wide variety of clients, extending across numerous verticals. Our end-to-end capabilities and global scale have enabled us to build long-lasting relationships with our largest clients spanning approximately 16more than 15 years on average. Our commitment to our clients is our primary focus and has generated numerous accolades to date, including 5453 client awards in fiscal year 2021.2023.
•Extensive Global Presence: We operate globally in over 4070 countries across 6six continents with the ability to conduct business in 70more than 150 different languages. We believe we are well-positioned to serve the largest global brands in nearly every market in which they operate. Our global footprint includes a strong presence in emerging markets such as India, Brazil, Turkey, Egypt, China, Brazil,South Africa, Vietnam, ThailandIndonesia and Indonesia,Thailand, which provides an opportunity to grow with our clients in these regions. Our ability to create value for our clients across a global delivery platform has enabled us to be a partner of choice.
•Continued Investment in Research and Development: We believe that our investment in technology differentiates us from our competitors. We have provided technology-infused CX solutions for longer than a decade. We have been at the forefront of developing CX solutions and technology that improve the customer experience and will continue to strive for this in the future. Our December 2021 acquisition of PK, a leading CX design engineering company, demonstratesand our September 2023 combination with Webhelp, which expanded our breadth of AI solutions, digital capabilities, and high-value services, demonstrate our commitment to being a leader in CX technology and digital transformation.
We have been a leader in our industry in advancements such as conversational virtual assistants, multichannel and augmented CRM, predictive analytics, emotion analytics, cognitive learning and AI and enjoy a first mover advantage. We are also an industry leader in cybersecurity best practices. We believe our strong focus on innovation has enabled us to maximize value for our clients and made it harder for our competitors to compete with us. Due to our size and scale, and the regular implementation of technology as part of our CX solutions, our costs of developing, maintaining and integrating new technologies are not material on a stand-alone basis.
•Track Record of Sustainable Organic Growth: We have an established track record of long-term organic revenue growth, and we believe we will continue to enjoy sustainable growth while rebalancing our portfolio from acquisitions as a result of:
•NatureThe nature of our offeringsofferings;
•Substantial switching costs for our clientsclients;
•High net revenue retention ratesrates;
•Strong barriers to entry in the CX solutions marketmarket; and
•LargeA large and expanding addressable marketmarket.
•Demonstrated History of Strategic Acquisitions: We have acquired and integrated more than 15 companies since our inception. We have a demonstrated ability to turn aroundcomplete scale acquisitions, as well as revive underutilized assets and maximize their value, which we believe allows us to explore a broader scope of opportunities than our peers. In December 2021,fiscal year 2023, we completed our combination with Webhelp, which significantly expanded our geographic footprint in Europe, Latin America and Africa, and expanded the breadth and global reach of our higher-value services and digital capabilities. In fiscal year 2022, we acquired PK, which expandsexpanded our scale in the digital IT services market and supportssupported our growth strategy of investing in digital transformation to deliver exceptional customer experiences.experiences, and ServiceSource, which complemented our B2B digital sales and customer success solutions.
•Corporate Culture Committed to Our Clients’ Success: Our unified team allows us to deliver consistent and exceptional results. As of November 30, 2021,2023, our team consisted of approximately 290,000 staff440,000 game-changers globally. We enjoy high staff engagement because of a strong company culture that champions our people and is fanatical about servingcommitted to creating game-changing brand experiences for our clients throughand their customers. We promote integrity with bold and disruptive thought. Wecollaboration, strive for diversity and inclusion in the workplace, and emphasize staffthe wellness and mental health.health of our game-changers. We believe this supportive environment reinforces the commitment of our team, empowers our staffgame-changers to make an impact on our global community, and drives better customer experiences and improved outcomes for our clients.
•Experienced Management Team: Our passionate and committed management team is led by industry experts with a deep understanding of our clients’ needs. We have a highly talented management team with significant experience in the CX industry, with our senior leadership team having an average of more than 30 years of experience. Through our acquisitions we have benefited from the addition of management talent, who have contributed valuable new perspectives and insights. Under our tenured management team, we have grown our revenue from $1.1 billion in fiscal year 2014 to $5.6$7.1 billion in fiscal year 2021,2023, while delivering strong profitability.
Our Growth Strategy
The key elements to our growth strategy are:
•Expand and Deepen Relationships with Existing Clients: We have a well-established track record of cross-selling and offering additional solutions and premium services to sustain and grow our relationships with our existing clients. We have historically focused on clients with high transaction volume on a recurring basis, fast growing verticals, and large enterprises, and will continue to do so. We believe our scale, efficiency, and technology generates incremental value for our clients with each process we manage, naturally driving our customers to spend more with us. We believe our focus on technology innovation and responding to our clients’ needs positions us for continued growth.
•Relentlessly Innovate and Develop New Digital Services and Solutions: We have developed innovative solutions for our clients, and we are focused on investing in technology. Investment in CX solutions technologies and digital transformation can enable more effective engagement with customers and improve the customer experience through increased automation, optimize customer journeys to reach faster solutions, enable personalized engagement across multiple platforms, and focus human engagement on the most complex interactions. For these reasons, we believe investments in disruptive technologies, applications, and services, such as our acquisition of PK,including generative AI, will continue to be instrumental in driving better value for our clients and result in increased profitability.
•Further Expand into Adjacent Markets: Our marketplace continues to expand beyond CRM and BPO. We see significant opportunity for growth across adjacent markets, and we strengthened our presence in the digital IT services market by acquiring PK.PK and combining with Webhelp. We intend to continue to provide our clients with an integrated offering of solutions that include digital services, AI technology, VOC solutions, analytics and consulting, AI technology, vertical BPO services and back office BPO services. To further
capitalize on new market adjacencies, we have made significant investments across emerging technologies such as RPA, AI, ML, VOC, IVR, and Internet of Things (“IoT”), which we believe will enhance our clients’ ability to offer personalized, effective engagement in all customer interactions to increase customer satisfaction and promote brand loyalty. As our industry evolves, we will continue to invest in these new and fast growing markets to further sustain long-term growth.
•Selectively Pursue Strategic Acquisitions: We have made targeted acquisitions to increase our technology expertise, enter new verticals and geographies, and increase our scale, including the IBM Customer Care Business, Convergys Corporation, PK, ServiceSource and PK.Webhelp. Our market remains highly fragmented and we believe that our acquisition strategy enhances and augments our growth avenues. We intend to continue to evaluate and pursue complementary, value enhancing acquisitions.
•Invest in Emerging Markets: We have invested in delivery operations in emerging, high-growth markets such as India, Brazil, Turkey, Egypt, China, Brazil,South Africa, Vietnam, ThailandIndonesia and Indonesia.Thailand. We expect to continue to invest in similar markets to be well-positioned to serve global brands and enable us to grow with our clients in the regions and countries where they are growing.
Our CustomersClients
In fiscal year 2021,2023, we served more than 7502,000 clients across various verticals and geographies. Our strategic verticals include: technology and consumer electronics, communications and media,electronics; retail, travel and e-commerce,e-commerce; banking, financial services and insurance, healthcareinsurance; healthcare; communications and media; and other. We focus on developing long-term, strategic relationships with clients in verticals with certain characteristics, such as high growth, high transaction volume, high levels of compliance and security, and steep barriers to entry.
Sales and Marketing
We market our services through a sales force organized by industry vertical and geography. The length of our selling cycle varies depending on the type of engagement. Our efforts may begin in response to our lead generation
program, a perceived opportunity, a reference by an existing client, a request for proposal or otherwise. The length of our sales cycle varies depending on the type of services work as well as whether there is an existing relationship with the client.
We have designated client partners or global relationship managers for each of our strategic relationships. The relationship manager is supported by process improvement, quality, transition, finance, human resources, information technology and industry or subject matter expert teams to ensure the best possible solution is provided to our clients.
We also strive to foster relationships between our senior leadership team and our clients’ senior management. These “C-level” relationships ensure that both parties are focused on establishing priorities, aligning objectives and driving client value from the top down. High-level executive relationships have been particularly constructive as a means of increasing business from our existing clients. It also provides us with a forum for addressing client concerns. We constantly measure our client satisfaction levels to ensure that we maintain high service levels for each client.
Our Operations
We have global delivery capabilities that allow us to scale our operations with people and other resources from around the world, including language fluency, proximity to clients and time-zone advantages. A critical component of this capability is our approximately 270500 locations in more than 4070 countries throughoutacross six continents, including the Americas, Asia-Pacific and EMEA. Our service delivery centers improve the efficiency of our engagement teams through the reuse of processes, solution designs and infrastructure by leveraging the experience of delivery center professionals. Services are provided from these global locations to customers worldwide in multiple languages. These services are supported by proprietary and third-party technologies to enable efficient and secure customer contact through various channels including voice, chat, web, email, social media and other digital platforms. Allplatforms, including automated bots, RPA, AI and GenAI.
Our delivery centers and data centers are subject to annual certifications and attestationsattestation audits that include Payment Card Industry Data Security Standard (PCI DSS) version 3.2.1,4.0, ISO 27001:20132022 and SOC2 Type II. Our risk-based independent assurance requirements, as well as client requirements, help define the scope of these certification and attestation audits. Twenty-eight of our delivery centers around the world are certified to the COPC (Customer Operation Performance Center) Outsource Service Provider standard. For our healthcare clients, we have achieved HITRUST Common Security Framework (CSF) 9.39.5 certification. We also maintain a Level 3 CMMI version 1.3 certification for services and development for our major technology development centers globally. For IT service management (ITIL standard), we have more than 100 delivery centers that are ISO/IEC 20000-1:2018 certified.
We operate a globally distributed data processing environment that can seamlessly connect and integrate our service delivery centers with our data centers and points of presence with multiple resilient circuits. Our technologically advanced and secured data centers provide availability 24 hours a day, 365 days a year, with redundant equipment, power and communication feeds and emergency power back-up, and are designed to withstand most natural disasters. We maintain a 24x7 security monitoring and alert function to guard against and respond to the threat of malicious actors.
We also have the capability to provide services for our clients through our utilization of remote staff. The COVID-19 pandemic has significantly expanded the prevalence of CX solutions that rely on utilization of remote staff, and as of November 30, 2021, more than 60% of our global team was remote. Our SecureCXTM platform supports secure remote work environments through digital tools and technology that authenticate the remote advisor, restrict unauthorized personnel and devices, and deliver real-time alerting of attempts to circumvent control.
We operate a globally distributed data processing environment that can seamlessly connect and integrate As of November 30, 2023, more than 30% of our service delivery centers with our data centers and points of presence. Our technologically advanced and secured data centers provide availability 24 hours a day, 365 days a year, with redundant power and communication feeds and emergency power back-up, and are designed to withstand most natural disasters.global team was remote.
The capacity of our data center and service delivery center operations, our nimble approach to remote staff, and the scalability of our customer management solutions enable us to meet the dynamic and challenging needs of large-scale and rapidly growing companies and government entities.companies. By leveraging our scale and efficiencies across our common system platforms, we can provide rapid client-specific enhancements and modifications at competitive costs, which positions us as a value-added provider of customer support products and services.
International Operations
Approximately 84%In fiscal year 2023, approximately 82% of our revenue iswas generated by our non-U.S. operations. A key element in our business strategy has been to locate our service delivery centers in markets that are strategic to our client requirements and
cost beneficial. We have operations in more than 70 countries across six continents, with a significant operationspresence in the Philippines and India, as well as throughout Europe and the Americas.India.
Sales and cost concentrations in international jurisdictions subject us to various risks, including the impact of changes in the value of foreign currencies relative to the U.S. dollar, which in turn can impact reported revenuesrevenue and cost of revenues.revenue.
See Note 10 to the consolidated financial statements included elsewhere in this Annual Report on Form 10-K for additional financial information related to our international and domestic operations.
Seasonality
Our revenue and margins fluctuate with the underlying trends in our clients’ businesses. As a result, our revenuesrevenue and margins are typically the highest in our fourth fiscal quarter.
Information Technology
We invest in IT systems, infrastructure, automation and security to enhance workforce management and enhance productivity. Our CX delivery centers employ a broad range of technology, including advanced network and computing platforms, digital switching, intelligent call routing and tracking, proprietary workforce management systems, case management tools, computer telephony integration, interactive voice response and advanced speech recognition, with multiple layers of embedded security. Our innovative use of technology, including automation and AI, enables us to improve our voice, chat, web and e-mail handling and personnel scheduling, thereby increasing our
efficiency and enhancing the quality of the services we deliver to our clients and their customers. We are able to dynamically scale to respond to changes in our clients’ business volumes. Additionally, we use technology to collectanalyze information forand trends from our clients about theclients’ customer interactions to support quality of service and improve the customer journey.journey and experience.
To support data security, we have established an integrated risk management framework with practices that are derived from industry standards, including ISO 31000, ISO 27001, HITRUST, PCI DSS and the NIST Cybersecurity Framework, and data privacy regulations, including the Health Insurance Portability and Accountability Act of 1996 (“HIPAA”) and the General Data Protection Regulation (“GDPR”). The data security controls from these standards and regulations are evaluated for our risk management framework based on the needs of our business and our clients, the nature of our industry, and applicable regulations.
Competition
Our major competitors include core CX solutions competitors, including Majorel Group Luxembourg S.A., SitelFoundever Group, TaskUs Inc., TDCX Inc., Teleperformance S.A., TELUS International, and TTEC Holdings, Inc., and Webhelp SAS, other CX solutions competitors that primarily provide complementary services such as consulting and design, IT services, business process services, VOC and analytics, including Accenture plc, Capgemini SE, Cognizant Technology Solutions Corporation, ExlService Holdings, Inc., Genpact Limited, Medallia, Inc., Qualtrics, LLC, and WNS (Holdings) Limited, and digital IT services competitors, including Endava UK Ltd., EPAM Systems, Inc., Globant S.A. and Thoughtworks Holding, Inc.
In the future, we may face greater competition due to the consolidation of CX solutions providers. Consolidation activity may result in competitors with greater scale, a broader footprint or more attractive pricing than ours. In addition, a client or potential client may choose not to outsource its business, by setting up captive outsourcing operations or performing formerly outsourced services for themselves, or may switch CX solutions providers.
Human Capital Resources
We are committed to fostering a diverse and inclusive workplace that attracts and retains exceptional talent. Through ongoing staff development, comprehensive compensation and benefits, and a focus on health, safety and staff wellbeing, we strive to help our team in all aspects of their lives so they can do their best work.
As of November 30, 2021,2023, we had approximately 290,000440,000 full-time staff,game-changers, of which approximately 60,00090,000 were based in the Americas, approximately 200,000230,000 were based in Asia-Pacific, and approximately 30,000120,000 were based in EMEA. Except for a small portion of our team in certain countries, generally required by local regulations or brought in through acquisitions, our staff are not represented by a labor union, nor are they covered by a collective bargaining agreement.
Diversity, Equity and Inclusion
A diverse team, including across background,backgrounds, genders and gender ethnicity,identities, ethnicities, sexual orientationorientations and lived experiences, is critical to our success and contributes to a work environment that promotes bold and contrarian thinking and an entrepreneurial mindset.innovation in our pursuit of game-changing experiences for our clients. We strive to create an inclusive workplace where people can bring their authentic selves to work. Our staffgame-changers are encouraged to leverage their personal strengths and experiences to continually innovate and contribute to the development of new ideas and process improvements that drive better customer experiences and improved outcomes for our clients. Our commitment to these principles is set out in our Human Rights Policy, our Diversity, Equity and Inclusion Policy, and our Code of Ethical Business Conduct, requireswhich require all of our staffgame-changers to adhere to our dedication to an inclusive work environment that fosters respect for all of our team members.
Our commitment to diversity and inclusion starts with our highly skilled and diverse board of directors and senior leadership team. More than halfHalf of the members of our board of directors and approximatelymore than 40% of our senior leadership
team are women, and approximately 25%20% of our board and senior leadership teammembers are ethnic minorities. In 2020, Concentrix strengthened its commitment to diversity by creating the role of Senior Director of Community and Culture to lead efforts for staff experience, diversity, equity and inclusion, wellbeing, and global citizenship. In 2021, we offeredWe offer virtual learning opportunities on diversity, equity and inclusion topics that were attended by several thousandsmore than 65% of our staff.managers in fiscal year 2023. Our team has also openedsupports LGBTQ+, persons with disabilities, women, and black professionals staff resource groups to supportpromote a diverse and inclusive workplace. In 2020 and 2021,each of the past four years, our Chief Executive Officer, Chris Caldwell, was named one of the ten best CEOs for Women and one of the ten best CEOs for Diversity by Comparably, a workplace culture and compensation website.
Pay Equity and Total Rewards
People should be paid for what they do and how they do it, regardless of their gender, race, or other characteristics. To deliver on that commitment, we benchmark and set pay ranges based on market data and consider factors such as a team member’sgame-changer’s role and experience, the location of their job, and their performance. We also review our compensation practices, both in terms of our overall workforce and individual team members,game-changers, to ensure our pay is fair and equitable. We have reviewed the compensation of our staffgame-changers to ensure consistent pay practices by conducting a gender pay equity analysis comparing staff in the same role within a country or location.
We require a uniquely talented workforce and are committed to providing total rewards that are market-competitive and performance based, driving innovation and operational excellence. Our compensation programs, practices, and policies reflect our commitment to reward short- and long-term performance that aligns with and drives long-term stockholder value. Total direct compensation is generally positioned within a competitive range of the market median, with differentiation based on tenure, skills, proficiency, and performance to attract and retain key talent.
StaffGame-Changer Engagement
We pride ourselves on being fanatical aboutchampioning our staff.people. Our company culture emphasizes the satisfaction and well-being of our staffgame-changers and a diverse, engaged team. We regularly solicit the opinion and views of our staffgame-changers through a staff satisfaction survey, the results of which inform key initiatives to support engagement and foster retention. The
global participation rate for our most recent staff satisfaction survey in 20212023 was more than 85%approximately 88%, and our overall positive engagement rating (staff members(game-changers that gave a satisfaction score of 4 or 5) was 83%approximately 84%. In 2022, we were named as one of the 25 World’s Best WorkplacesTM by Great Place to Work and Fortune magazine, ranking twenty-second.
Training and Development
Human capital development underpins our efforts to execute our strategy and continue to deliver exceptional services globally. We invest in staff career growth and provide our teamgame-changers with a wide range of development opportunities, including face-to-face, virtual, social and self-directed learning, mentoring, coaching, and external development. Front-line staff receive continual feedback and reinforcement from supervisors who provide coaching, often in real time, so that staff can more readily apply their training to assist our clients and their customers. In addition, our staffgame-changers have access to more than 16,40032,000 online courses and 7001,000 learning paths through Concentrix University, our virtual learning platform, to develop skills specific to their current roles and promote ongoing career growth.
Health, Safety and Wellness
The physical health, financial stability, life balance and mental health of our team is vital to our success. We sponsor a wellness program designed to enhance physical, financial, and mental well-being for all of our staff.game-changers. Throughout the year, we encourage healthy behaviors through regular communications, educational sessions, voluntary progress tracking, wellness challenges, and other incentives. Since the onset of the COVID-19 pandemic, we have takenWe take an integrated approach to helping our staff manage their work and personal responsibilities, with a strong focus on mental health. We also successfully transitioned a significant portion of our workforce to a remote working environment and implemented a number of safety and social distancing measures in our sites to protectDuring the health and safety of our team. We are focused on supportingCOVID-19 pandemic, we supported access to COVID-19 vaccines for our staffgame-changers around the world. world, includingIn 2021, we committed to provide providing our staff in the Philippines and India with free COVID-19 vaccines and we delivered on that commitment withproviding voluntary vaccination programs in the Philippines that were also made available to staff family members in the Philippines.members.
Sustainability
We have a responsibility to improve the lives of our people and the health of our planet. In 2020,Since we began work onbecame a formalpublic company, we have maintained an Environmental, Social and Governance (“ESG”) program with direction and we releasedoversight from our first Sustainability Report in 2021, our first year as a public company.board of directors. Our ESG program seeks to use our global reach and the strength of our team of approximately 290,000440,000 game-changers to further three priorities:
•Care for the environment to leave it better than we found it;
•Create a better place for people to work and live in the communities where we operate; and
•Act with integrity and do the right thing.
Our 2021We publish an annual Sustainability Report that outlines our long-term ESG commitments for 2025goals and how these commitments align with the Sustainable Development Goals established by the United Nations. We will continue to reportNations, and updates stakeholders on our progress with respect totoward these commitments in future Sustainability Reports.goals.
Available Information
Our website is www.concentrix.com. We make available free of charge, on or through our website, our Annual Report on Form 10-K, quarterly reports on Form 10-Q, current reports on Form 8-K and amendments to those reports, if any, or other filings filed or furnished pursuant to Section 13(a) or 15(d) of the Exchange Act, as soon as reasonably practicable after electronically filing or furnishing these reports with the Securities and Exchange Commission (the “SEC”). Our Sustainability Report is also available on our website. Information contained on our website is not a part of this Annual Report on Form 10-K.
The SEC maintains a website at www.sec.gov that contains our Annual Report on Form 10-K, quarterly reports on Form 10-Q, current reports on Form 8-K and amendments to those reports, if any, or other filings filed or furnished pursuant to Section 13(a) or 15(d) of the Exchange Act, and our proxy and information statements.
ITEM 1A. RISK FACTORS
This section discusses the most significant factors that could affect our business, results of operations and financial condition. You should carefully consider the following risks and the other information contained in this Annual Report on Form 10-K in evaluating our company and our common stock. If any of the risks discussed below occur, our business, financial condition, results of operations, or liquidity could be materially adversely affected and, as a result, the trading price of our common stock could decline. The risks described below are not the only ones we face. Additional risks not presently known to us or that we currently deem immaterial may also harm our business, results of operations, or financial condition.
We have grouped these risk factors into threefour categories:
•Risksrisks related to our business and the industry in which we operate;
•Risksrisks related to the spin-off;Webhelp Combination;
•risks related to our capital structure; and
•General risk factorsrisks related to ownership of our common stock.
Risks Related to Our Business and Industry
We anticipate thatHistorically, our revenue and operating results have fluctuated and we anticipate that in the future they will continue to fluctuate, which could adversely affect the enterprise value of our Company and the trading value of our common stock.
Our operating results have fluctuated and will fluctuate in the future as a result of many factors, including:
•general economicglobal macroeconomic conditions, including: uncertainty related toeconomic slowdowns or recessions, consumer demand, interest rate and currency rate fluctuations, inflation and supply chain disruptions; public health crises, political or social unrest, and military conflicts, including the COVID-19 pandemicconflicts in Ukraine and itsGaza, and their impact on the global economy, supply chains and inflation;economy; international trade negotiations, such as between the United States and China and between China and India; the United Kingdom’s exit from the European Union; escalating tensions along the Russia-Ukraine border; U.S. federal government budget disruptions; and market volatility, including as a result of political leadership in certain countries;
•the level of business activity of our clients, which in turn is affected by the level of economic activity in the industries and markets that they serve and the market acceptance and performance of their products and services;
•the demand for the CX solutions and technology we provide, as well as other competitive conditions in our industry; and
•the impact of the business acquisitions and dispositions we make, including our combination with Webhelp, as well as consolidation of our competitors or clients;
•changes in the tax rates in the various jurisdictions in which we do business; and
•fluctuations in the exchange rates for the currencies in which we transact.clients.
Although we attempt to control our expense levels, our expenses are based, in part, on anticipated revenue. We may be unable to reduce spending in a timely manner to compensate for an unexpected decrease in revenue. Our future operating results may be below our expectations or those of our public market analysts or investors, which would likely cause the trading price of our common stock to decline.
Cyberattacks or the improper disclosure or control of personal or confidential information could result in liability and harm our reputation, which could adversely affect our business.
Our business is heavily dependent upon information technology networks and systems. Internal or external attacks on our networks and systems or those of our clients or vendors, including through phishing, password attacks, and ransomware, and other malware, could significantly disrupt our operations and impede our ability to
provide critical solutions and services to our clients and their customers, subjecting us to liability under our contracts and damaging our reputation. Cybercriminals, including those supported by nation states, political activists, and organized crime, are
well organized and becoming increasingly sophisticated, and we expect they will continue to seek out and attempt to exploit vulnerabilities in our and our clients’ networks and systems.
We represent our clients in certain critical operations of their business processes such as sales, marketing, and customer support and manage large volumes of customer information and confidential data. As a result, our business involves the use, storage, and transmission of information about not only our staff, but also our clients and the customers of our clients. While we take measures to protect the security of, and prevent unauthorized access to, our networks and systems and personal and proprietary information, the security controls for our networks and systems, as well as other security practices we follow, may not prevent improper access to, or disclosure of, personally identifiable or proprietary information. If we fail to adhere to or successfully implement effective internal controls and other processes, technology, and training to protect our networks and systems and the information that we store, our clients experience disruptions in their systems or operations, or the confidentiality of data is compromised by a malicious actor, our client relationships may suffer, and we may face possible legal or regulatory action.
Any failure in protecting networks, systems or information could result in legal liability, monetary penalties, or impairment to our reputation in the marketplace, which could have a material adverse effect on our business, financial condition, and results of operations.
Uncertainty around, and disruption from, new and emerging technologies, including the adoption and utilization of GenAI, may result in risks and challenges that could impact our business.
We utilize new and emerging technologies, including GenAI, in our solutions and services. As with many innovations, GenAI presents risks and challenges that could significantly disrupt our business model. If we do not execute on GenAI effectively, this could result in loss of revenue and reduced margins.
Our success depends, in part, on our ability to continue to acquire, develop, and implement solutions that meet the evolving needs of our clients. The ongoing COVID-19 pandemicrapid evolution of GenAI will require us to expend resources to develop, test, and implement solutions that utilize GenAI effectively, which may lead us to incur significant expense to maintain a competitive advantage within the industry. We will also be required to attract, motivate, and retain top professionals with the skills necessary to execute our strategy relating to GenAI and other emerging technologies. If we do not employ new technologies, including GenAI, as quickly or the widespread outbreak of another communicable disease,efficiently as our competitors, or if our competitors develop more cost-effective or client-preferred technologies, it could have a natural disaster or any other public health crisis, couldmaterial adverse effect on our ability to win and retain business from clients, which would adversely affect our business, results of operationsbusiness.
The regulatory landscape surrounding AI and financial condition.
We couldGenAI technologies is also evolving, and the ways in which these technologies will be negatively impactedregulated by the COVID-19 pandemic, the widespread outbreak of another illnessgovernmental authorities, self-regulatory institutions, or other communicable disease, a natural disaster,regulatory authorities remains uncertain. Such regulations may result in significant operational costs or any other public health crisis. The COVID-19 pandemic has negatively impacted the global economy, disrupted supply chains and labor force participation, and created significant volatility in financial markets. During fiscal year 2021, we experienced the continued effects of the COVID-19 pandemic, as the Delta variant caused new waves of COVID-19 cases around the globe. We incurred COVID-19 related costs of $33 million in fiscal year 2021, including in support and resources for our staff to care for themselves and their families. The extent of the continued impact of the COVID-19 pandemic on our operational and financial performance, includingconstrain our ability to execute our business strategies and initiatives in the expected time frame, will depend on future developments, including the duration, spread and severity of the pandemic, the evolution of the virus and the effects of mutations in its genetic code, country and state restrictions regarding virus containment, the availability and effectiveness of vaccines and treatment options, accessibility to our delivery and operations locations, our continued utilization of remote work environments in response to future health and safety restrictions, and the effect on our clients’ businesses and the demand for their products and services, all of which are uncertain and cannot be predicted.develop, deploy, or maintain these technologies.
We also have substantial operations in countries, most notably the Philippines and India, that have experienced severe natural events, such as typhoons, mudslides, and floods, in the recent past. Any natural disaster or extreme weather event in a region where we have operations could severely disrupt the lives of our staff and lead to service interruptions or reduce the quality level of services that we provide. Weather patterns may become more volatile, and extreme weather events may become more frequent or widespread as a result of the potential effects of climate change. Our disaster recovery plan and business interruption insurance may not provide sufficient recovery to compensate for losses that we may incur.
An extended disruption to the global economy or business operations caused by the COVID-19 pandemic, another communicable disease, a natural disaster or any other public health crisis, or a regional disruption in an area in which we have significant operations, could materially affect our business, our results of operations, our access to sources of liquidity, the carrying value of our goodwill and intangible assets, and our financial condition.
IfWhen our staff or contractors fail to adhere to the controls and processes we and our clients have established, we may be subject to financial liability or our client relationships or reputation may suffer, which in turn may adversely affect our revenue and results of operations.suffer.
We depend on our staff and contractors to deliver our services to our clients and adhere to the controls and processes we and our clients have established. Although we believe our controls are effective and we require all staff
to be trained onin their responsibilities under our Code of Ethical Business Conduct, with a team of approximately 290,000,440,000, we cannot eliminateprevent all risk of fault. Ifmisconduct. When any of our staff or contractors negligently disregards or intentionally breaches our or our client’s established controls or processes, whether acting alone or in collusion with other internal or external parties, we could be subject to monetary damages, fines, or criminal prosecution. Unauthorized disclosure of sensitive or confidential information of our clients or our clients’ customers or financial loss by a clientour clients or a client’s customerour clients’ customers as a result of our staff’s negligence, fraud, misappropriation, or unauthorized access to or through our information systems or those we develop for clients could result in negative
publicity, loss of clients, legal liability, and damage to our reputation, business, results of operations, and financial condition.
Our industry is subject to intense competition and dynamic changes in business model, which in turn could cause our operations to suffer.
The CX solutions industry is highly competitive, highly fragmented, and subject to rapid change. We believe that the principal competitive factors in this market are breadth and depth of process and domain expertise, service quality, ability to tailor specific solutions to the needs of clients and their customers, the ability to attract, train, and retain qualified staff, cybersecurity infrastructure, compliance rigor, global delivery capabilities, pricing, and marketing and sales capabilities. We compete for business with a variety of companies, including in-house operations of existing and potential clients. If our clients place more focus in this area or utilize new or emerging technologies to internalize these operations, the size of the available market for third-party service providers like us could reduce significantly. Similarly, if competitors offer their services at lower prices to gain market share or provide services that gain greater market acceptance than the services we offer or develop, the demand for our services may decrease. Specialized providers or new entrants can enter markets by developing new systems or services that could impact our business. The opportunity for new entrants in our industry may expand as digital engagement and offerings increase in importance. New competitors, new strategies by existing competitors or clients, and consolidation among clients or competitors could result in significant market share gain by our competitors, which could have an adverse effect on our revenue.
Some emerging technologies, such as AI, RPA, ML, VOC, IVR, and IoT, may cause an adverse shift in the way certain of our existing business operations are conducted, including by replacing human contacts with automated or self-service options, or by decreasing the size of the available market. We may be unsuccessful at anticipating or responding to new developments on a timely and cost-effective basis, and our use of technology may differ from accepted practices in the marketplace. Certain of our solutions may require lengthy and complex implementations that can be subject to changing client preferences and continuing changes in technology, which can increase costs or adversely affect our business.
Economic downturns, geopolitical tensions, communicable diseases or any other public health crises, and natural disasters could adversely affect our business, results of operations, and financial condition.
We could be negatively impacted by factors that are outside of our control, including economic downturns, geopolitical tensions, the widespread outbreak of communicable diseases or other public health crises, and natural disasters. General global economic downturns and macroeconomic trends, including heightened inflation, capital market volatility, interest rate and currency rate fluctuations, and an economic slowdown or recession, may result in unfavorable conditions that could negatively affect our clients’ businesses, and, as a result, impact demand for our products and services and our potential for growth. An economic slowdown or recession may also negatively impact the wellbeing of our game-changers and increase the risk of staff misconduct or fraud. Geopolitical tensions and acts of violence or war or other international conflicts may also negatively impact the global financial markets and could lead to or exacerbate an economic slowdown or recession. Even if we do not have operations in countries where such conflicts are taking place, the effect on supply chains, the demand for our clients’ products and services or other broader impacts of the conflict could result in a decline in our revenue, supply shortages or delays, particularly of technological equipment, and increased costs.
Outbreaks of communicable diseases, including variants of COVID-19, may negatively affect our operational and financial performance, including our ability to execute our business strategies and initiatives in the expected time frame.The extent of such future impact is unknown and would depend on many factors, including the duration, spread, and severity of the disease, the evolution of the disease and the effects of mutations in its genetic code, country and state restrictions regarding containment, the availability and effectiveness of vaccines and treatment options, accessibility to our delivery and operations locations, our continued utilization of remote work environments in response to future health and safety restrictions, our clients’ acceptance of remote work environments, and the effect on our clients’ businesses and the demand for their products and services, all of which are uncertain and cannot be predicted.
We also have substantial operations in countries, most notably the Philippines, India, Brazil, Turkey, Colombia, and Egypt, that have experienced severe natural events, such as typhoons, mudslides, droughts, wildfires, earthquakes, and floods, in the recent past. Any natural disaster or extreme weather event in a region where we have operations could severely disrupt the lives of our game-changers and lead to service interruptions, increase our operating costs, or reduce the quality level of services that we provide. Weather patterns may become more volatile, and extreme weather events may become more frequent or widespread as a result of the effects of climate change. Our disaster recovery plan and business interruption insurance may not provide sufficient recovery to compensate for losses that we may incur.
An extended disruption to the global economy or business operations caused by global macroeconomic trends, geopolitical tensions or war, communicable diseases or other public health crises, natural disasters, or a regional disruption in an area in which we have significant operations, could materially affect our business, our results of operations, our access to sources of liquidity, the carrying value of our goodwill and intangible assets, and our financial condition.
Our delivery center activities are located around the world, which may expose us to business risks and disrupt our operations.
Our operations are based on a global delivery model with client services provided from delivery centers in more than 70 countries, with a significant concentration of our workforce located in the Philippines, India, Brazil, Turkey, Colombia, Egypt, the United Kingdom, Morocco, and China. A significant geo-political event in any of the countries in which we operate could disrupt our operations and expose us to risk. Operating globally subjects us to risks in the countries in which we do business, which may include political and economic instability, armed conflicts, domestic or foreign terrorism, foreign currency volatility, the time and expense required to comply with different laws and regulations, challenges with hiring and retaining adequate staff, inflation, longer payment cycles or difficulties in collecting accounts receivable, and seasonal reductions in business activity.
Socio-economic situations that are specific to the Philippines, India, Brazil, Turkey, Colombia, Egypt, the United Kingdom, Morocco, and China can severely disrupt our operations and impact our ability to fulfill our contractual obligations to our clients. If these countries experience natural disasters, extreme weather events or political unrest, our staff’s ability to work may be disrupted, our IT and communication infrastructure may be at risk and the client processes that we manage may be adversely affected. We may also continue to expand our operations internationally to respond to competitive pressure and client and market requirements, which could increase these risks. If we are unable to manage the risks associated with our international operations and expanding such operations, our business could be adversely affected, and our revenue and earnings could decrease.
The inability to successfully execute on our digital CX strategy and deliver value for our clients could harm our client relationships and reputation, which in turn could adversely affect our revenue and our results of operations.
Our strategy has focusedfocuses on being a leading global provider of CX solutions and technology. Our success depends, in part, on our ability to continue to acquire, develop, and implement services and solutions that anticipate and respond to rapid and continuing changes in technology and offerings to serve the evolving needs of our clients and their customers. We have continuedcontinue to invest in technology and in our digital capabilities to pursue this strategy, most notably through our acquisition of PK in December 2021.strategy. If we are unable to successfully deliver to our clients the differentiated combination of digital CX solutions and services that we believe we offer, or our solutions do not achieve the desired outcomes, our client relationships and reputation may suffer, which could result in a loss of business with existing clients and hinder our ability to engage new clients. We may also incur significant expenses in an effort to keep pace with clients’ preferences for technology or to gain a competitive advantage through technological expertise or new technologies. If we cannot offer new technologies as quickly or efficiently as our competitors, or if our competitors develop more cost-effective or client-preferred technologies, it could have a material adverse effect on our ability to obtain and complete client engagements, which could adversely affect our business.
We have pursued and intend to continue to pursue strategic acquisitions or investments in new markets and may encounter risks associated with these activities, which could harm our business and operating results.
We have in the past pursued, and in the future expect to pursue, acquisitions of, or investments in, businesses, technologies and assets in new or existing markets, either within or outside the CX solutions industry, that complement or expand our existing business. In December 2021, we acquired PK, a leading global CX design engineering company for aggregate consideration of approximately $1.6 billion to pursue our strategy of further investing in digital transformation capabilities.
Our acquisition strategy, including our acquisition of PK, involves a number of risks, including:
•difficulty in successfully integrating acquired operations, IT and other systems, clients, services, businesses, and staff with our operations on a timely and cost-effective basis;
•risk that the acquired businesses will fail to maintain the quality of services or results of operations that we have historically provided or that we expect from the acquired businesses;
•the announcement or consummation of a transaction may have an adverse impact on relationships with third parties, including existing and potential clients;
•loss of key staff of the acquired operations or inability to attract, retain and motivate staff necessary for our expanded operations;
•acquired businesses located in regions where we have not historically conducted business may subject us to new operational risks, laws, regulations, staff expectations, customs, and practices;
•difficulty in scaling critical resources and facilities for the business needs of the expanded enterprise;
•diversion of our capital and management attention away from operational matters and other business issues;
•increase in our expenses and working capital requirements;
•in the case of acquisitions that we may make outside of the United States, difficulty in operating internationally and over significant geographical distances;
•other financial risks, such as potential liabilities of the businesses we acquire; and
•our due diligence process may fail to identify significant issues with the acquired company’s service quality, financial disclosures, legal liabilities, accounting practices or internal control deficiencies.
We may incur additional costs and certain redundant expenses in connection with our acquisitions and investments, which may have an adverse impact on our operating margins. Future acquisitions may result in dilutive issuances of equity securities, the incurrence of additional debt, large asset write-offs, a decrease in future profitability, or future losses. The incurrence of debt in connection with any future acquisitions could restrict our ability to obtain working capital or other financing necessary to operate our business. Our recent and future acquisitions or investments, including our acquisition of PK, may not be successful, and if we fail to realize the anticipated benefits of these acquisitions or investments, our business and operating results could be harmed.
Our industry is subject to intense competition and dynamic changes in business model, which in turn could cause our operations to suffer.
The CX solutions industry is highly competitive, highly fragmented and subject to rapid change. We believe that the principal competitive factors in this market are breadth and depth of process and domain expertise, service quality, ability to tailor specific solutions to the needs of clients and their customers, the ability to attract, train and retain qualified staff, cybersecurity infrastructure, compliance rigor, global delivery capabilities, pricing, and marketing and sales capabilities. We compete for business with a variety of companies, including in-house operations of existing and potential clients. If our clients place more focus in this area and internalize these operations, the size of the available market for third-party service providers like us could reduce significantly. Similarly, if competitors offer their services at lower prices to gain market share or provide services that gain greater market acceptance than the services we offer or develop, the demand for our services may decrease. Niche providers or new entrants can enter markets by developing new systems or services that could impact our business. The opportunity for new entrants in our industry may expand as digital engagement and offerings increase in importance. New competitors, new strategies by existing competitors or clients, and consolidation among clients or competitors could result in significant market share gain by our competitors, which could have an adverse effect on our revenues.
Some emerging technologies, such as RPA, AI, ML, VOC, IVR, and IoT, may cause an adverse shift in the way certain of our existing business operations are conducted, including by replacing human contacts with automated or self-service options, or by decreasing the size of the available market. We may be unsuccessful at anticipating or responding to new developments on a timely and cost-effective basis, and our use of technology may differ from accepted practices in the marketplace. Certain of our solutions may require lengthy and complex implementations that can be subject to changing client preferences and continuing changes in technology, which can increase costs or adversely affect our business.
Our delivery center activities are located around the world, with a significant concentration in the Philippines, India, China, and Brazil, which may expose us to business risks and disrupt our operations.
Our operations are based on a global delivery model with client services provided from delivery centers located throughout the Americas, Asia-Pacific, and EMEA, with a significant percentage of our workforce located in the Philippines, India, China, and Brazil. Operating globally subjects us to risks in the countries in which we do business, which may include political and economic instability, foreign currency volatility, the time and expense required to comply with different laws and regulations, challenges with hiring and retaining adequate staff, inflation, longer payment cycles or difficulties in collecting accounts receivable, and seasonal reductions in business activity. Socio-economic situations that are specific to the Philippines, India, China and Brazil can severely disrupt our operations and impact our ability to fulfill our contractual obligations to our clients. If these countries experience natural disasters, extreme weather events or political unrest, our staff’s ability to work may be disrupted, our IT and communication infrastructure may be at risk and the client processes that we manage may be adversely affected. We may also continue to expand our operations internationally to respond to competitive pressure and client and market
requirements, which could increase these risks. If we are unable to manage the risks associated with our international operations and expanding such operations, our business could be adversely affected, and our revenues and earnings could decrease.
We may have higher than anticipated tax liabilities, which could result in a material adverse effect on our business.
Due to the global nature of our operations, we are subject to the complex and varying tax laws and rules of many countries and have material tax-related contingent liabilities that are difficult to predict or quantify. In preparing our financial statements, we calculate our effective income tax rate based on current tax laws and regulations and our estimated taxable income within each jurisdiction. Our effective tax rate could be adversely affected by several factors, many of which are outside of our control, including:
•changes in income before taxes in the countries in which we operate that have differing statutory tax rates;
•changes in tax rates or tax laws and regulations, or the implementation or interpretation of such laws and regulations;
•effect of tax rates on accounting for acquisitions and dispositions;
•issues arising from tax audits or examinations and any related interest or penalties; and
•uncertainty in obtaining tax holiday extensions or the expiration or loss of tax holidays in various jurisdictions.
In the United States, proposed tax law changes could subject us to higher than anticipated tax liabilities, including by increasing the statutory corporate tax rate, imposing a minimum tax on global income, reducing the deduction for global intangible low-taxed income (GILTI), eliminating the qualified business asset investment exemption, repealing the deduction for foreign-derived intangible income or imposing a surcharge on corporations that employ staff in non-U.S. countries to deliver services to the United States. Any one or more of these changes, if adopted, could have a material adverse effect on our effective tax rate and our results of operations.
We report our results of operations based on our determination of the amount of taxes owed in various jurisdictions in which we operate. The determination of our worldwide provision for income taxes and other tax liabilities requires estimation, judgment and calculations where the ultimate tax determination may not be certain.
We are also subject to tax audits, including with respect to transfer pricing, in the United States and other jurisdictions and our tax positions may be challenged by tax authorities. There can be no assurance that our current tax provisions will be settled for the amounts accrued, that additional tax exposures will not be identified in the future or that additional tax reserves will not be necessary for any such exposures. Any increase in the amount of taxation incurred as a result of challenges to our tax filing positions could result in a material adverse effect on our business, results of operations and financial condition.
If we are unable to retain key personnel, hire and retain staff with the skills and expertise we need, or manage the costs and utilization rate of our staff, our profitability may be negatively impacted and our operations may be disrupted.
We are dependent in large part on our ability to retain the services of our key senior executives and other technical and industry experts and personnel. With the exception of our Chief Executive Officer and in countries where employment agreements are customary, we generally do not have employment agreements with our executives or staff. We also do not carry “key person” insurance coverage for any of our key executives. We compete for qualified senior management and technical personnel. The loss of, or inability to hire, key executives or qualified staff could inhibit our ability to operate and grow our business successfully.
The success of our operations and the quality of our services are also highly dependent on our ability to attract and retain skilled personnel in all of our global delivery centers. Our industry is characterized by high staff attrition
rates and we face competition in hiring, retaining and motivating talented and skilled leaders and staff with domain experience. Any increase in our staff turnover rate could increase recruiting and training costs and could decrease operating effectiveness and productivity. Potential labor organizing and works council negotiations in certain of the countries in which we do business could also contribute to rising costs or otherwise disrupt our business.
We generally sign multi-year client contracts with pricing models that are based on prevailing labor costs in the jurisdictions where we will perform services. Quickly rising wages or changes in laws or governmental regulations related to wages, mandatory time off, severance, healthcare, other staff benefits or other working conditions with little notice or transition period can increase our costs and limit our ability to adjust in a timely manner. Our profitability is also affected by the utilization rate of our personnel resources. If we are unable to achieve optimum utilization of our personnel resources, we may experience erosion in our profit margin. However, if our utilization is too high, the quality of services provided to our clients may deteriorate and we may also experience higher attrition rates. Rising costs, our inability to manage rising costs, or our inability to adequately motivate our team or utilize our personnel resources efficiently could negatively impact our profitability or disrupt our operations.
We are subject to uncertainties and rapid variability in demand by our clients, and our client contracts include provisions such as termination for convenience, which could cause fluctuations in our revenue and adversely affect our operating results.
Our revenues depend,revenue depends, in large part, on the volumes, geographic locations, and types of CX services demanded. The demand for our services can be affected by events outside of our control, including consolidation among our clients, changing marketplace trends, financial challenges faced by our clients, and fluctuations in the use of our clients’ products and services. CX solutions can also be provided in different geographies and through different service channels. While we have the capacitycapability to provide multi-channel services in countries across the globe, changes in the types of services utilized and the geographic locations where the services are provided can impact our revenuesrevenue and profitability. There can be no assurance that the current demand for our CX services will continue or grow, that organizations will not elect to perform such services in-house, or that clients will not elect to move CX services to lower-cost or lower-margin geographies or customer contact channels.
Our client contracts typically include provisions that, if triggered, could impact our profitability. For example, many of our contracts may be terminated with limited notice for any reason and, to the extent our clients terminate these contracts, we could experience unexpected fluctuations in our revenue and operating results from period to period. Additionally, some contracts have performance-related bonus or penalty provisions, whereby we receive a bonus if we satisfy certain performance levels or pay a penalty for failing to do so. Such performance-related conditions are based on metrics that measure customer satisfaction and the quality, quantity, and efficiency of our handling of the client’s customer interactions across multiple channels. Generally, performance-related bonus or penalty provisions account for less than 1% of our annual revenue in the aggregate. However, whether we receive a bonus or are required to pay a penalty changesvaries with our performance and may cause fluctuations in our financial results. In addition, our clients may not guarantee a minimum volume; however, we hire staff based on anticipated volumes.
If we fail to anticipate volumes correctly, our operations and financial results may suffer. A reduction of volume,volumes, loss of clients, payment of penalties, failure to receive performance-related bonuses, or inability to terminate any unprofitable contracts could have an adverse impact on our results of operations and financial condition.
We depend on a limited number of clients for a significant portion of our revenue, and the loss of business from one or more of these clients could adversely affect our results of operations.
Our five largest clients collectively represented approximately 25%22% of our revenue in fiscal year 2021.2023. This client concentration increases the risk of quarterly fluctuations in our operating results, depending on the seasonal pattern of our top clients’ businesses. In addition, our top clients could make greater demands on us with regard to pricing and contractual terms in general.
At any given time, we typically have multiple master service agreements or statements of work with our largest clients. Clients may have the right to terminate such agreements for convenience or may have risk tolerances that limit how much business they retain with a single service provider. While we do not expect all master service
agreements and statements of work to terminate at the same time, the loss of significant agreements with one of our largest clients could adversely affect our business, results of operations and financial condition if the lost revenues arerevenue is not replaced with profitable revenuesrevenue from that client or other clients.
We often carry significant accounts receivable balances from a limited number of clients that generate a large portion of our revenues.revenue. For example, approximately 27%22% of our accounts receivable billed balance as of November 30, 20212023 was attributable to five clients. A client may become unable or unwilling to timely pay its balance due to a general economic slowdown, economic weakness in its industry, or the financial insolvency of its business. While we closely monitor our accounts receivable balances, a client’s financial inability or unwillingness, for any reason, to pay a large accounts receivable balance or many clients’ inability or unwillingness to pay accounts receivable balances that are large in the aggregate would adversely impact our income and cash flow.
Our operations, reputation, and results of operations may be damaged through the actions, inactions, or vulnerabilities of third parties.
We depend on a variety of third parties to enable us to deliver services to our clients, including communications services providers, information technology systems and network providers, electric and other utility providers, transportation providers, and recruiting firms. Although we believe we have a rigorous procurement process to evaluate our vendors and service providers, we depend on these third parties to maintain the confidentiality, availability, and integrity of the products and services they provide. These third parties can damage our reputation or cause financial loss through cybersecurity or data privacy breaches, inadequate information technology infrastructure, insufficient updates to software, non-conformance to servicing standards, or financial distress that disrupts business operations.
Moreover, with an increased reliance on remote staff, we depend on the communications and other service providers necessary for our staff to perform their work from our facilities and their homes. Power or communications failures could interrupt the operations of our facilities or the ability of our staff to work remotely. Natural disasters, severe weather events, or labor disputes that disrupt transportation services could limit the ability of our staff to reach our facilities or increase the cost of transportation services that we procure for our staff in certain countries. Any prolonged disruption in the operations of our facilities or the ability of our remote staff to deliver services to our clients and their customers, whether due to technical difficulties, power failures, or any other reason, could cause service interruptions or reduce the quality level of services that we provide and harm our operating results.
Our business is subject to many regulatory requirements, and changes in current regulations or their interpretation and enforcement, or the adoption of new regulations, could significantly increase our cost of doing business.
Our business is subject to many laws and regulatory requirements in the United States and the other countries and jurisdictions in which we operate, covering matters that include but are not limited to: data privacy; labor matters, including immigration and equal employment opportunity (“EEO”) compliance; the Foreign Corrupt Practices Act and other anti-corruption and anti-money laundering laws; taxation; securities and insider trading; healthcare, including HIPAA compliance; banking; outsourcing; consumer protection, including the method and timing of placing outbound telephone calls and the recording or monitoring of telephone calls; collections activities; insurance claims administration; gaming licensing; internal and disclosure control obligations; governmental affairs; and trade restrictions, sanctions and tariffs.
Many of these regulations, including those related to data privacy, climate-related disclosures, labor matters, and anti-corruption, change frequently and may conflict among the various jurisdictions and countries in which we provide services. The pace of regulatory change in these areas has accelerated in recent years. The GDPR in Europe, the SEC’s proposed climate disclosure rules and recently adopted cybersecurity disclosure rules, the Data Privacy Act in the Philippines, the California Consumer Privacy Act, the California Climate Corporate Data Accountability Act and Climate-Related Financial Risk Act, and other similar laws have resulted, and will continue to result, in increased compliance costs, and the failure to comply with these laws can result in significant monetary penalties. For example, fines of up to 4% of an entity’s annual global revenue can be imposed for violations of the GDPR. We expect that the regulatory burden associated with compliance with privacy laws will continue to expand as more jurisdictions adopt privacy laws with different requirements.
Laws and regulatory requirements may also be subject to interpretation, and the transition of a significant portion of our staff to a remote work environment has increased the uncertainty related to the application and interpretation of certain laws and regulations that have historically been applied to onsite work environments. If our interpretation of any laws or regulatory requirements conflicts with positions taken by regulatory agencies or other government bodies in the future, we may be subject to legal liability or be unable to conduct business in the same manner. Violations of any laws and regulations to which we are subject, including failing to adhere to or successfully implement processes in response to changing regulatory requirements or work practices, could result in liability for damages, fines, criminal prosecution, unfavorable publicity and damage to our reputation, and
restrictions on our ability to operate, which could have a material adverse effect on our business, results of operations, and financial condition.
In addition, changes in the policies or laws of the United States or other countries or jurisdictions resulting in, among other things, higher taxation, limitations on the ability of companies to utilize offshore outsourcing, currency conversion limitations, restrictions on fund transfers, or the expropriation of private enterprises, could reduce the anticipated benefits of our global operations. Any actions by countries in which we conduct business to reverse policies that encourage international trade or investment could also adversely affect our business.
We depend on a variety of communications services and information technology systems and networks, and any failure or increase in the cost of these systems and networks could adversely impact our business and operating results.
The services we provide to our clients depend on the persistent availability and uncompromised security of our communications, technology, and information technology systems. Our business uses a wide variety of technologies to allow us to manage large volumes of work.data and perform services with staff located around the globe. We deploy leading edge digital transformation capabilities such as AI-based automation bots, omnichannel services, and internally-developed and third-party software solutions to enhance customer and staff experience across various technology environments and platforms. We operate an extensive internal voice and data network that links our global sites together in a multi-hub model that enables the rerouting of voice and data across the network, and we rely on multiple public communication channels and telephone, internet, and data services provided by various third parties for connectivity to our clients. Maintenance of, and investment in, this technology is critical to keeping our team productive and the success of our service delivery model.
Any failure in technology, or in our ability to manage or optimize our resources, may impair service quality and have a negative impact on our operations. Failures or significant downtime of our IT or telecommunications systems could prevent us from handling client volume, and frequent or prolonged interruption in our ability to provide services could result in contractual performance penalties, damage to our reputation, and the loss of business from existing and potential clients. Any increase in average waiting time or handling time or a lack of promptness or technical expertise offrom our staff will negatively impact customer satisfaction and our business. Telephone, internet, and data service providers may elect not to renew their contracts with us or increase the cost of such services. If our communications or information technology systems are disrupted or the cost of maintaining those systems increases significantly, our results of operations could be adversely affected.
OurIf we are unable to retain key personnel, hire, develop, and retain staff with the skills and expertise we need, or manage the costs and utilization rate of our staff, our profitability may be negatively impacted and our operations may be disrupted.
We are dependent in large part on our ability to retain the services of our key senior executives and other technical and industry experts and personnel. With the exception of our Chief Executive Officer and in countries where employment agreements are customary, we generally do not have employment agreements with our executives or staff. We also do not carry “key person” insurance coverage for any of our key executives. We compete for qualified senior management and technical personnel. The loss of, or inability to hire, key executives or qualified staff could inhibit our ability to operate and grow our business is subject to many regulatory requirements, and changes in current regulations or their interpretation and enforcement, or the adoptionsuccessfully.
The success of new regulations, could significantly increase our cost of doing business.
Our business is subject to many laws and regulatory requirements in the United Statesoperations and the quality of our services are also highly dependent on our ability to attract and retain skilled personnel in all of our global delivery centers. We face competition in hiring, retaining, developing, and motivating talented and skilled leaders and staff with domain experience, and we have, at times, struggled to hire sufficient technical talent to meet the demand for our services. Our industry is also characterized by high staff attrition rates. Any increase in our staff turnover rate could increase recruiting and training costs, decrease operating effectiveness and productivity, and potentially impact our relationship with our key clients and other employees. Potential labor organizing and works council negotiations in certain of the countries in which we operate, covering such matters as: data privacy; labor matters, including immigration and equal employment opportunity (EEO) compliance; the Foreign Corrupt Practices Act and other anti-corruption and anti-money laundering laws; taxation; securities and insider trading; healthcare, including HIPAA compliance; banking; outsourcing; consumer protection, including the method and timing of placing outbound telephone calls and the recordingdo business could also contribute to rising costs or monitoring of telephone calls; collections activities; insurance policy administration; internal and disclosure control obligations; governmental affairs; and trade restrictions, sanctions and tariffs.
Many of these regulations, including those related to data privacy, labor matters and anti-corruption, change frequently and may conflict among the various jurisdictions and countries in which we provide services. The pace of regulatory change in these areas has accelerated in recent years. The GDPR in Europe, the Data Privacy Act in the Philippines, the California Consumer Privacy Act and other similar laws have resulted, and will continue to result, in increased compliance costs, and the failure to comply with these laws can result in significant monetary penalties. For example, fines of up to 4% of an entity’s annual global revenues can be imposed for violations of the GDPR.otherwise disrupt our business.
We generally sign multi-year client contracts with pricing models that are based on prevailing labor costs in the jurisdictions where we perform services. Quickly rising wages during periods of high inflation or changes in laws or governmental regulations related to wages, mandatory time off, severance, healthcare, other staff benefits or other working conditions could increase our costs and limit our ability to adjust in a timely manner. Our profitability is also affected by the utilization rate of our personnel resources. If we are unable to achieve optimum utilization of our personnel resources, we may experience erosion in our profit margin. However, if our utilization is too high, the quality of services provided to our clients may deteriorate and we may also experience higher attrition rates. Rising costs, our inability to manage rising costs, or our inability to adequately motivate our team or utilize our personnel resources efficiently could negatively impact our profitability or disrupt our operations.
We have pursued and intend to continue to pursue strategic acquisitions or investments and may encounter risks associated with these activities, which could harm our business and operating results.
We have historically pursued, and in the future expect to pursue, acquisitions of, or investments in, businesses, technologies, and assets in new or existing markets, either within or outside the CX solutions industry, that complement or expand our existing business. In September 2023, we completed our combination with Webhelp, a leading provider of CX solutions, for aggregate consideration of approximately $3.8 billion, consisting of cash, stock, and a note payable to sellers. In July 2022, we acquired ServiceSource, a global outsourced go-to-market services provider that delivers B2B digital sales and customer success solutions, for aggregate consideration of approximately $142 million. In December 2021, we acquired PK, a leading global CX design engineering company for aggregate consideration of approximately $1.6 billion to pursue our strategy of further investing in digital transformation capabilities.
Our acquisition strategy, including our combination with Webhelp, involves a number of risks, including:
•risk that we encounter difficulty in successfully integrating acquired operations, IT and other systems, clients, services, businesses, and staff with our operations on a timely and cost-effective basis;
•risk that the regulatory burden associated with compliance with privacy lawsacquired businesses will continuefail to expand as more jurisdictions adopt privacy laws with different requirements.maintain the quality of services or results of operations that we have historically provided or that we expect from the acquired businesses;
Laws and regulatory requirements may also be subject to interpretation, and •the transitionannouncement or consummation of a significant portiontransaction may have an adverse impact on relationships with third parties, including existing and potential clients, or may negatively affect our brand identity;
•loss of key staff of the acquired operations or inability to attract, retain, and motivate staff necessary for our expanded operations;
•acquired businesses located in regions where we have not historically conducted business may subject us to new operational risks, laws, regulations, staff expectations, customs, and practices;
•risk that we encounter challenges in scaling critical resources and facilities for the business needs of the expanded enterprise;
•diversion of our staffcapital and management attention away from operational matters and other business issues;
•increase in our expenses and working capital requirements;
•in the case of acquisitions that we may make outside of the United States, difficulty in operating internationally and over significant geographical distances;
•other financial risks, including unknown liabilities or inconsistent accounting practices of the businesses we acquire or the impairment of goodwill or intangible assets we record in connection with acquisitions; and
•our due diligence process may fail to identify significant issues with the acquired company’s service quality, financial disclosures, legal liabilities, accounting practices, or internal control deficiencies.
We may incur additional costs and certain redundant expenses in connection with our acquisitions and investments, which may have an adverse impact on our operating margins. Future acquisitions may result in dilutive issuances of equity securities, the incurrence of additional debt, large asset write-offs, a remote work environmentdecrease in future profitability, or future losses. For example, we have recorded substantial goodwill and amortizable intangible assets as a result of the COVID-19 pandemic has increased the uncertainty related to the applicationour acquisitions, and interpretation of certain laws and regulations that have historically been applied to onsite work environments. If our interpretation of any laws or regulatory requirements conflicts with positions taken by regulatory agencies or other government bodies in the future we could be required to record a significant charge to earnings in our financial statements during the period in which any impairment of our goodwill or intangible assets was determined, negatively impacting our results of operations. The incurrence of debt in connection with any future acquisitions could restrict our ability to obtain working capital or other financing necessary to operate our business. Our recent and future acquisitions or investments, including our combination with Webhelp, may not be successful, and if we fail to realize the anticipated benefits of these acquisitions or investments, our business and operating results could be harmed.
We may have higher than anticipated tax liabilities, which could result in a material adverse effect on our business.
Due to the global nature of our operations, we are subject to legal liabilitythe complex and varying tax laws and rules of many jurisdictions and have material tax-related contingent liabilities that are difficult to predict or be unable to conduct business in the same manner. Violations of anyquantify. In preparing our financial statements, we calculate our effective income tax rate based on current tax laws and regulations toand our estimated taxable income within each jurisdiction. Our effective tax rate could be adversely affected by several factors, many of which are outside of our control, including:
•changes in income before taxes in the countries in which we areoperate that have differing statutory tax rates;
•changes in tax rates or tax laws and regulations, or the implementation or interpretation of such laws and regulations;
•the effect of tax rates on accounting for acquisitions and dispositions;
•issues arising from tax audits or examinations and any related interest or penalties; and
•uncertainty in obtaining tax holiday extensions or the expiration or loss of tax holidays in various jurisdictions.
In the United States, proposed tax law changes could subject us to higher than anticipated tax liabilities, including failingby increasing the statutory corporate tax rate, imposing a minimum tax on global income, reducing the deduction for global intangible low-taxed income (“GILTI”), eliminating the qualified business asset investment exemption, limiting the deductibility of interest expense, repealing the deduction for foreign-derived intangible income or imposing a surcharge on corporations that employ staff in non-U.S. countries to adheredeliver services to the United States. Any one or successfully implement processes in responsemore of these changes, if adopted, could have a material adverse effect on our effective tax rate and our results of operations. Outside of the United States, proposed tax law changes could subject us to changing regulatory requirements or work practices,a global minimum tax on profits, which could result in liabilitydouble taxation and increased tax audit risk due to uncertainty in application.
We report our results of operations based on our determination of the amount of taxes owed in various jurisdictions in which we operate. The determination of our worldwide provision for damages, fines, criminal prosecution, unfavorable publicityincome taxes and damageother tax liabilities requires estimation, judgment and calculations where the ultimate tax determination may not be certain.
We are also subject to tax audits, including with respect to transfer pricing, in the United States and other jurisdictions, and our tax positions may be challenged by tax authorities. There can be no assurance that our current tax provisions will be settled for the amounts accrued, that additional tax exposures will not be identified in the future or that additional tax reserves will not be necessary for any such exposures. Any increase in the amount of taxation incurred as a result of challenges to our reputation, and restrictions on our ability to operate, whichtax filing positions could haveresult in a material adverse effect on our business, results of operations, and financial condition.
In addition, changes in policies or laws
Changes in foreign currency exchange rates could adversely affect our business and operating results.
We operate in more than 4070 countries, and volatility in the value of the currencies used in these countries can increaseincreases the uncertainty in our revenue and profitability forecasts. While mosta majority of our contracts are priced in U.S. dollars, we recognize a substantial amount of revenue under contracts that are denominated in euros, British pounds, Australian dollars and Japanese yen, among other currencies. A significant increase in the value of the U.S. dollar relative to these currencies may have a material adverse impact on the value of those revenuesour revenue when translated to U.S. dollars.
Our services are delivered from several delivery centers located around the world, with significant operations in the Philippines and India, as well as throughout EuropeEMEA and the Americas. Although our contracts with U.S.-based clients are typically priced in U.S. dollars, a substantial portion of our costs to deliver services under these contracts are denominated in the local currency of the country where services are performed. We also have certain client contracts that are priced in non-U.S. dollar currencies for which a substantial portion of the costs to deliver the services are in other currencies. As a result, our revenue may be earned in currencies that are different from the currencies in which we incur corresponding expenses. Fluctuations in the value of currencies, such as the Philippine peso, the Indian rupee, the euro, and the Canadian dollar, against the U.S. dollar or other currencies in which we bill our clients, and inflation in the local economies in which these delivery centers are located, could increase the operating and labor costs in these delivery centers, which can result in reduced profitability. A significant decrease in the value of the contractual currency, relative to the currencies where services are provided, could have a material adverse impact on our operating results that are not fully offset by gains realized under the hedging contracts we have in place in certain currencies to limit our potential foreign currency exposure.
Our operations, reputation and results of operations may be damaged through the actions, inactions or vulnerabilities of third parties.
We depend on a variety of third parties to enable us to deliver services to our clients, including communications services providers, information technology systems and network providers, electric and other utility providers, transportation providers, and recruiting firms. Although we believe we have a rigorous procurement process to evaluate our vendors and service providers, these third parties can damage our reputation or cause financial loss through cybersecurity or data privacy breaches, inadequate information technology infrastructure, non-conformance to servicing standards, or financial distress that interrupts business operations.
Moreover, with an increased reliance on remote staff due to the COVID-19 pandemic, we depend on the communications and other service providers necessary for our staff to perform their work from our facilities and their homes. Power or communications failures could interrupt the operations of our facilities or the ability of our staff to work remotely. Natural disasters, severe weather events or labor disputes that disrupt transportation services could limit the ability of our staff to reach our facilities or increase the cost of transportation services that we procure for our staff in certain countries. Any prolonged disruption in the operations of our facilities or the ability of our remote staff to deliver services to our clients and their customers, whether due to technical difficulties, power failures, or any other reason, could cause service interruptions or reduce the quality level of services that we provide and harm our operating results.
Our goodwill and identifiable intangible assets could become impaired, which could have a material non-cash adverse effect on our results of operations.
We have recorded substantial goodwill and amortizable intangible assets as a result of our previous acquisitions and will record additional amounts related to our PK acquisition in fiscal year 2022. We review our goodwill and intangible assets for impairment when events or changes in circumstances indicate the carrying value may not be recoverable. We assess whether there has been an impairment in the value of goodwill at least annually. Factors that may be considered a change in circumstances indicating that the carrying value of our goodwill or intangible assets may not be recoverable include declines in stock price, market capitalization or cash flows, and slower growth rates in our industry. We could be required to record a significant charge to earnings in our financial statements during the period in which any impairment of our goodwill or intangible assets was determined, negatively impacting our results of operations.
The terms of our debt arrangements impose significant restrictions on our ability to operate and could have an adverse effect on our business and results of operations.
The terms of the agreements under which our indebtedness was incurred may limit or restrict, among other things, our ability to:
•incur additional indebtedness;
•make investments;
•pay dividends or make certain other restricted payments;
•repurchase common stock;
•consummate certain asset sales or acquisitions;
•enter into certain transactions with affiliates; and
•merge, consolidate or sell, assign, transfer, lease, convey or otherwise dispose of all or substantially all of our assets.
We are also required to maintain specified financial ratios and satisfy certain financial condition tests under certain of our debt arrangements. Our inability to meet these ratios and tests could result in the acceleration of the repayment of the related debt, termination of the applicable debt arrangement, an increase in our effective cost of funds or the cross-default of other indebtedness. As a result, our ability to operate may be restricted and our ability to respond to business and market conditions may be limited, which could have an adverse effect on our business and operating results.
Our level of indebtedness could have adverse consequences for our business or our financial condition.
In connection with our acquisition of PK in December 2021, we amended our senior secured credit facility to, among other things, increase our outstanding term loan borrowings to $2.1 billion. We may further increase our indebtedness in the future, including as a result of having amended our senior secured credit facility in December
2021 to increase the revolving loan commitment of the lenders to $1.0 billion. Our level of indebtedness could have adverse consequences for us and our stockholders, including:
•requiring us to dedicate a substantial portion of our cash flow from operations to make principal and interest payments on our indebtedness, thereby reducing the availability of such cash flow to fund working capital, capital expenditures and other general corporate requirements, and to grow our business;
•limiting our ability to borrow additional funds as needed, make strategic acquisitions or take advantage of other business opportunities as they arise, or pay cash dividends;
•increasing future debt costs and limiting the future availability of debt financing;
•increasing our vulnerability to general adverse economic and industry conditions; and
•limiting our flexibility in planning for, or reacting to, changes in our business and industry.
To the extent that we incur additional indebtedness, the risks described above could increase. In addition, our actual cash requirements in the future may be greater than expected. Our cash flows from operations may not be sufficient to service our outstanding debt or to repay our outstanding debt as it becomes due, and we may be unable to borrow money, sell assets or otherwise raise funds on acceptable terms, if at all, to service or refinance our debt.
If the interest rates on our outstanding borrowings increase, our net income could be adversely affected.
Our outstanding borrowings under our senior secured credit facility and our accounts receivable securitization facility are variable-rate obligations that expose us to interest rate risk. If interest rates increase, our debt service obligations and our interest expense will increase even if our outstanding borrowings remain the same. Our net income and cash flows, including cash available for servicing indebtedness, will correspondingly decrease.
Borrowings under our amended senior secured credit facility bear interest at a variable rate that is based on the Secured Overnight Financing Rate (“SOFR”), which may have consequences for us that cannot be reasonably predicted and may adversely affect our liquidity, financial condition, and results of operations.
Borrowings under our amended senior secured credit facility may bear interest, at our election, at a rate per annum that is based upon SOFR. Although SOFR has been endorsed by the Alternative Reference Rates Committee as its preferred replacement for the London Interbank Offered Rate (“LIBOR”), it remains uncertain whether or when SOFR or other alternative reference rates will be widely accepted by lenders as the replacement for LIBOR. This may, in turn, impact the liquidity of the SOFR loan market, and SOFR itself. Since the initial publication of SOFR, daily changes in the rate have, on occasion, been more volatile than daily changes in comparable benchmark or market rates, and SOFR over time may bear little or no relation to the historical actual or historical indicative data. Additionally, our amended senior secured credit facility includes a credit adjustment on SOFR due to LIBOR representing an unsecured lending rate while SOFR represents a secured lending rate. The possible volatility of and uncertainty around SOFR as a LIBOR replacement rate and the applicable credit adjustment could result in higher borrowing costs for us, which would adversely affect our liquidity, financial condition, and results of operations.
Our results of operations could be adversely affected by litigation and other commitments and contingencies.
We face risks arising from various unasserted and asserted claims, including, but not limited to, commercial, labor and employment, consumer protection, tax, and patent infringement claims. Certain claims may be structured as class action lawsuits or otherwise allege substantial damages. We may be unable to obtain insurance coverage for certain claims at a reasonable cost, if at all. Unfavorable outcomes in pending or future litigation or the settlement of asserted claims could negatively affect us. Regardless of the outcome, litigation could result in substantial expense and could divert the efforts of our management.
We have developed proprietary IT systems, mobile applications, and cloud-based technology and acquired technologies that play an important role in our business, including through our acquisition of PK.business. If any claim alleging infringement of intellectual property rights is successful against us and if indemnification is not available or sufficient, we may be required to pay substantial damages to the third partyparties and indemnify our clients for losses
arising out of the infringement. In order to continue delivering services to our clients, we may also need to seek and obtain a license of a third party’s intellectual property rights. We may be unable to obtain such a license on commercially reasonable terms, if at all, which could disrupt our business and adversely affect our results of operations.
In addition, in the ordinary course of business, we may make certain commitments, including representations, warranties, and indemnities relating to current and past operations and divested businesses, and issue guarantees of third-party obligations. The amounts of such commitments can only be estimated, and the actual amounts for which we are responsible may differ materially from our estimates. If we incur liability as a result of any current or future litigation, commitments or contingencies, and such liability exceeds any amounts accrued, our business, results of operations, and financial condition could be adversely affected.
Risks RelatingRelated to the Spin-OffWebhelp Combination
We have operatedmay fail to realize the anticipated benefits of the Webhelp Combination within the anticipated time frame, or at all, which could adversely affect the value of our common stock.
The success of the Webhelp Combination will depend, in part, on our ability to realize the anticipated benefits from combining the businesses of Concentrix and Webhelp. Our ability to realize these anticipated benefits is subject to certain risks including:
•whether the combined business performs as an independent public company forexpected, including with respect to growth, profitability, cash flow, and synergies;
•our ability to successfully integrate the two organizations;
•our ability to identify and realize estimated cost savings and synergies from the combination;
•the need to dedicate a limited periodgreater amount of time.cash flow from operations to make payments on our indebtedness incurred to finance the acquisition; and
•the assumption of known and unknown liabilities of Webhelp.
If we are not able to successfully combine the businesses of Concentrix and Webhelp within the anticipated time frame, or at all, the benefits of the Webhelp Combination may not be realized fully or may take longer to realize than expected, the combined business may not perform as expected, including with respect to growth, profitability, cash flow, and synergies, client relationships may be disrupted, our cash flows may not be sufficient to repay our outstanding indebtedness as it becomes due or within the anticipated time frame, and the value of our common stock may be adversely affected.
Prior to the spin-off, we did not operate ascompletion of the Webhelp Combination, Concentrix and Webhelp operated independently and there can be no assurances that the two organizations can be integrated successfully. It is possible that the integration process could result in the loss of key Concentrix or Webhelp staff, the disruption of the combined business, higher than expected integration costs, and an independent public company,overall integration process that takes longer than originally anticipated. Specifically, ongoing elements of the integration include, among other things:
•identifying and adopting the best practices to position the combined business for future growth;
•integrating the Company’s resources, including its people, technologies, systems, and services;
•harmonizing the Company’s operating practices, reporting structure, staff development and compensation programs, internal controls and other policies, procedures and processes, including compliance by the acquired operations with generally accepted accounting principles in the United States and the documentation and testing of internal control procedures under Section 404 of the Sarbanes-Oxley Act;
•rebranding operations and addressing possible differences in business backgrounds, corporate cultures and management philosophies;
•consolidating the Company’s corporate, administrative, and information technology infrastructure; and
•identifying and eliminating redundant assets and expenses and consolidating locations that are currently in close proximity to each other.
In addition, at times, the attention of certain members of our management had no experience, as a group, in operatingand resources may be focused on the integration of the businesses and diverted from our day-to-day business as a stand-alone entity. Subsequent to the spin‑off, we have been fully responsible for arrangingoperations, which may disrupt our own financing, managing all of our own administrative and staff arrangements, supervising all of our legal and financial affairs, and reporting our global consolidated financial position and results of operations in accordance with U.S. GAAP. We have adopted separate stock-based and performance-based incentive plans for our staff and developed our own compliance and administrative procedures necessary for a publicly held company. We anticipate that our continued success in these endeavors will depend substantially upon the ability of our senior management and other key team members to work together. Accordingly, we cannot assure you that our results of operations will continue at the same level.business.
The requirements of being a stand-alone public company have increased certain of our costs compared to our costs prior to the spin-off.
As a stand-alone public company, weWe have incurred and will continue to incur integration-related costs in connection with the Webhelp Combination.
We have incurred significant legal, accountingtransaction costs related to the Webhelp Combination and other expenses associated with compliance-relatedwill continue to incur significant integration-related fees and other activities. The Sarbanes-Oxley Act of 2002,costs related SEC rulesto our ongoing integration, including facilities and Nasdaq regulate our corporate governance practices. Compliance with these requirements will result in additionalsystems consolidation costs and obligationsstaff-related costs. We continue to assess the magnitude of these costs, and make some activities more time-consuming. For example,additional unanticipated costs may be incurred. Although we appointed a new independent boardexpect that the elimination of directors uponduplicative costs, as well as the spin-off and have adopted additional internal controls and disclosure controls and procedures. In addition, we have incurred additional expenses associated with director and officer liability insurance, our SEC reporting requirements andrealization of other securities law compliance measures.
As a new public company, our brand identityefficiencies related to the integration of the businesses, will allow us to offset integration-related costs over time, this net benefit may not be fully aligned with our service offerings andachieved in the value we deliver to our clients, which may adversely affect our ability to grow and attract talented staff.
As a provider of CX solutions and technology, our brand identity is important to growing our business with new and existing clients and attracting and retaining our people. As a subsidiary of TD SYNNEX prior to the spin-off in 2020, the Concentrix brand identity did not fully reflect our rapid growth from a 20-person outsourced sales and marking services operation in 2004 to a leading global provider of CX solutions and technology. Moreover, certain of our historical acquisitions of companies continue to affect how our company is viewed today. If prospective and current clients do not associate our company with the high-value CX solutions and technology we believe we offer, we may experience difficulty in winning new businessnear term, or attracting and retaining talented staff, which could adversely affect our business and results of operations.
Our brand identity can also be affected by events outside of our control, including negative publicity associated with our clients’ businesses or social media campaigns directed against us or our clients. Responding to such events can distract from our business and increase costs. If the brand identity we are fostering as a new public company is damaged, we could experience increased difficulty in attracting and retaining clients and staff, which could adversely affect our business and results of operations.at all.
The spin-off may not achieve someIf our due diligence investigation of Webhelp was inadequate or if unexpected risks related to the acquired Webhelp operations materialize, it could have a material adverse effect on our investment and the trading price of our common stock.
Even though we conducted a due diligence investigation of Webhelp, we cannot be sure that our due diligence investigation surfaced all of the anticipated benefits.
We may not realize some or all of the anticipated strategic, financial, operational, marketing or other benefits from the spin-off, or such benefitsmaterial issues that may be delayed bypresent inside the acquired Webhelp operations, or that it would be possible to uncover all material issues through a varietycustomary amount of circumstances, which may bedue diligence, or that factors outside of our control. As an independent publicly traded company, we are smallerWebhelp and less diversified with a narrowerits business focus than when we were a business segmentand outside of TD SYNNEX andWebhelp’s control will not arise later. If any such material issues arise, they may be more vulnerable to changing market conditions, which could materially and adversely affect ourimpact the combined business financial condition and results of operations.
If the spin-off is determined to be taxable for U.S. federal income tax purposes, we and our stockholders could incur significant U.S. federal income tax liabilities.
If the spin-off fails to qualify for tax-free treatment, TD SYNNEX would be subject to tax as if it had sold our common stock in a taxable sale for its fair market value, and our initial public stockholders at the time of the spin-off would be subject to tax as if they had received a taxable distribution equal to the fair market valuetrading price of our common stock.
Certain stockholders are able to exercise influence over the composition of our board of directors, matters subject to stockholder approval, and our operations, and actual or potential conflicts of interest may develop.
As of January 17, 2024, affiliates of Groupe Bruxelles Lambert (“GBL”) owned approximately 13.2% of our common stock. In connection with the Webhelp Combination, on March 29, 2023, we entered into an Investor Rights Agreement with certain stockholders of Webhelp Parent, which, among other things, provides that GBL has the right to nominate a certain number of directors, up to a maximum of two, depending on the percentage of the outstanding shares of Concentrix common stock held by GBL, our director, Oliver Duha, and certain of their respective affiliates.
As a result of the Concentrix common stock that was distributed to them. Underis held by affiliates of GBL and Olivier Duha and the tax matters agreement between TD SYNNEX and us, we are generally required to indemnify TD SYNNEX for any taxes resulting from the separation (and related costs and other damages) to the extent such amounts result from (1) an acquisition of all or a portion of our equity securities or assets by any means, (2) any action or failure to act by us after the distribution affecting the voting rights of our stock, (3) other actions or failures to act by us, or (4) certain breaches of our agreements and representations in the tax matters agreement. Our indemnification obligations to TD SYNNEX and its subsidiaries, officers, and directors are not limited by any maximum amount. If we are required to indemnify TD SYNNEX or such other persons under the circumstances set forth in the tax matters agreement, weInvestor Rights Agreement described above, GBL may be subject to substantial liabilities.
We must abide by certain restrictions to preserve the tax-free treatment of the spin-off and may not be able to engageinfluence (subject to organizational documents and Delaware law) the composition of our board of directors and thus, potentially, the outcome of corporate actions requiring stockholder approval, such as mergers, business combinations and dispositions of assets, among other corporate transactions. The interests of GBL may not always coincide with the interest of our other stockholders, and GBL may seek to cause us to take actions that might involve risks to our business or adversely affect us or our other stockholders. This concentration of investment and voting power, in desirable acquisitionsaddition to the investment and voting power of certain other strategiclarge stockholders, could discourage others from initiating a potential merger, takeover or capital-raising transactions.
To preserve the tax-free treatmentother change of the spin-offcontrol transaction that may otherwise be beneficial to TD SYNNEXConcentrix and its stockholders, underwhich could adversely affect the tax matters agreement between TD SYNNEX and us,market price of Concentrix common stock.
Risks Related to our Capital Structure
Our level of indebtedness could have adverse consequences for the two-year period following the spin-off, we may be prohibited, except in specified circumstances, from:
•issuing equity securities to satisfy financing needs;
•acquiring businesses or assets with equity securities; or
•engaging in mergers or asset transfers that could jeopardize the tax-free status of the distribution.
These restrictions may limit our ability to pursue strategic transactions or engage in new business or other transactions that may maximize the value of our company.
We are subject to potential indemnification liabilities to TD SYNNEX pursuant to the separation and distribution agreement.
The separation and distribution agreement between TD SYNNEX and us provides for indemnification obligations designed to make us financially responsible for substantially all liabilities that may exist relating to our business activities, whether incurred before or after the spin-off. If we are required to indemnify TD SYNNEX under the circumstances set forth in this agreement, we may be subject to substantial liabilities.financial condition.
In connection with the spin-off, TD SYNNEX has agreed to indemnify us for certain liabilitiesWebhelp Combination, the Company issued and liabilities related to TD SYNNEX assets; however, these indemnities may be insufficient to protect us against the fullsold $2.15 billion aggregate principal amount of senior notes and entered into an amendment and restatement of our senior credit facility that provided for the extension of a senior unsecured revolving credit facility not to exceed an aggregate principal amount of approximately $1.04 billion and a senior unsecured term loan facility in an aggregate principal amount not to exceed approximately $2.14 billion. As of November 30, 2023, we had approximately $5.00 billion of indebtedness prior to debt issuance costs, and we may further increase our indebtedness in the future. Our level of indebtedness could have adverse consequences for us and our stockholders, including:
•requiring us to dedicate a substantial portion of our cash flow from operations to make principal and interest payments on our indebtedness, thereby reducing the availability of such liabilities.cash flow to fund working capital, capital expenditures, and other general corporate requirements, and to grow our business;
Pursuant•limiting our ability to make strategic acquisitions or take advantage of other business opportunities as they arise, or pay cash dividends;
•increasing future debt costs and limiting the separationfuture availability of debt financing;
•increasing our vulnerability to general adverse economic and distribution agreement, TD SYNNEX has agreedindustry conditions; and
•limiting our flexibility in planning for, or reacting to, indemnify us for certain liabilities. However, third parties could seek to hold us responsible for any of the liabilities that TD SYNNEX agreed to retain,changes in our business and there can be no assurance that TD SYNNEX will be able to fully satisfy its indemnification obligations. Moreover, even if we ultimately succeed in recovering from TD SYNNEX any amounts for which weindustry.
are held liable, such indemnificationTo the extent that we incur additional indebtedness, the risks described above could increase. In addition, our actual cash requirements in the future may be insufficientgreater than expected. Our cash flows from operations may not be sufficient to fully offsetservice our outstanding debt or to repay our outstanding debt as it becomes due or within the financial impacttime frame that we expect. A negative change in our credit ratings could make it more expensive to service our outstanding debt or to raise additional capital in the future. We may also be unable to borrow money, sell assets, or otherwise raise funds on acceptable terms, if at all, to service or refinance our debt.
Rising interest rates increase the cost of such liabilitiesour outstanding borrowings and could adversely affect our net income.
Our outstanding borrowings under our senior unsecured credit facility and our accounts receivable securitization facility are variable-rate obligations that expose us to interest rate risk. When interest rates increase, our debt service obligations and our interest expense increase even if our outstanding borrowings remain the same. Our net income and cash flows, including cash available for servicing indebtedness, will correspondingly decrease.
The terms of our debt arrangements impose restrictions on our ability to operate and could have an adverse effect on our business and results of operations.
The terms of the agreements under which our indebtedness was incurred may limit or we may be requiredrestrict, among other things, our ability to bear these losses while seeking recovery from TD SYNNEX.incur additional indebtedness, consummate certain asset sales or acquisitions, and merge, consolidate or sell, assign, transfer, lease, convey or otherwise dispose of all or substantially all of our assets.
We are also required to maintain specified financial ratios and satisfy certain financial condition tests under certain of our debt arrangements. Our inability to meet these ratios and tests could result in the acceleration of the repayment of the related debt, termination of the applicable debt arrangement, an increase in our effective cost of funds or the cross-default of other indebtedness. As a smaller company than the combined organization priorresult, our ability to the spin-off, and we may experience increased costs resulting from the decrease in purchasing power or from increased efforts to build and maintain relationships.
Prior to the spin-off, we benefited from the size and purchasing power of TD SYNNEX in sourcing certain products and services from third-parties, as well as from TD SYNNEX’ reputation as a Fortune 500 company with close to 40 years of operating experience. Subsequent to the spin-off, we are a smaller company without the same purchasing power that we had as part of TD SYNNEX. Weoperate may be unablerestricted and our ability to obtain productsrespond to business and services at prices and on terms as favorable as those available to us prior to the separation ormarket conditions may need to expend greater time and effort to build and maintain relationships with third parties,be limited, which could increasehave an adverse effect on our costsbusiness and reduce our profitability.operating results.
General Risks Related to Ownership of Our Common Stock
The share price and trading volume of our common stock may fluctuate significantly.
Our common stock has been traded on Nasdaq under the symbol “CNXC” since December 1, 2020. The market price of our common stock may fluctuate significantly due to a number of factors, some of which may be beyond our control, including:
•our financial results;
•developments generally affecting the CX solutions industry;
•the performance of our business and the performance of similar companies;
•our capital structure, including the amount of our indebtedness;
•the announcement of acquisitions or dispositions;
•additions or departures of key personnel;
•changes in market valuations of similar companies;
•general economic, industry, and market conditions;
•the depth and liquidity of the market for our common stock;
•fluctuations in currency exchange rates;
•our dividend policy;
•investor perception of our business and us;our company;
•the passage of legislation or other regulatory developments that adversely affect us or our industry; and
•the impact of the factors referred to elsewhere in “Risk Factors.”
In addition, the stock market regularly experiences significant price and volume fluctuations. This volatility has had a significant impact on the market price of securities issued by many companies, including companies in our industry. The changes may occur without regard to the operating performance of the affected companies. Hence, the price of our common stock could fluctuate based upon factors that have little or nothing to do with our company, and these fluctuations could materially reduce our share price.
We cannot guarantee the continued payment of dividends on our common stock, or the timing or amount of any such dividends.
The continued payment of dividends in the future, and the timing and amount thereof, to our stockholders is within the discretion of our board of directors. Our board of directors’ decisions regarding the payment of dividends will depend on many factors, such as our financial condition, earnings, capital requirements, debt service obligations, restrictive covenants in our debt agreements, industry practice, legal requirements, regulatory constraints, and other factors that our board of directors deems relevant. Our ability to pay dividends will depend on our ongoing ability to generate cash from operations and on our access to the capital markets. We cannot guarantee that we will continue to pay a dividend in the future.
Your percentage ownership in Concentrix may be diluted in the future.
In the future, your percentage ownership in Concentrix may be diluted because of equity issuances for acquisitions, capital market transactions or otherwise, including equity awards that we grant to our directors, officers and staff and purchases of shares from Concentrix through our employee stock purchase plan. The compensation committee of our board of directors grants stock-based awards to members of our staff and our directors, from time to time, under our stock incentive plan. Such awards have a dilutive effect on our earnings per share, which could adversely affect the market price of our common stock.
Certain provisions of our certificate of incorporation and bylaws and of Delaware law make it difficult for stockholders to change the composition of our board of directors and may discourage hostile takeover attempts that some of our stockholders may consider to be beneficial.
Certain provisions of our certificate of incorporation and bylaws and of Delaware law may have the effect of delaying or preventing changesa change in control if our board of directors determines that such changeschange in control areis not in the best interests of us and our stockholders. These provisions may include, among other things, the following:
•the ability of our board of directors to issue shares of preferred stock and to determine the price and other terms, including preferences and voting rights, of those shares without stockholder approval;
•stockholder action can only be taken at a special or regular meeting and not by written consent;
•the inability of our stockholders to call a special meeting;
•advance notice procedures for nominating candidates to our board of directors or presenting matters at stockholder meetings;
•allowing only our board of directors to fill vacancies on our board of directors;
•supermajority voting requirements to amend our bylaws and certain provisions of our certificate of incorporation; and
•restrictions on an “interested stockholder” to engage in certain business combinations with us for a three-year period following the date the interested stockholder became such.
While these provisions have the effect of encouraging persons seeking to acquire control of our company to negotiate with our board of directors, they could enable the board of directors to hinder or frustrate a transaction that some, or a majority, of the stockholders might believe to be in their best interests and, in that case, may prevent or discourage attempts to remove and replace incumbent directors. We are also subject to Delaware laws that could have similar effects. One of these laws prohibits us from engaging in a business combination with a significant stockholder unless specific conditions are met.
Our bylaws designate the Court of Chancery of the State of Delaware and U.S. federal district courts as the exclusive forums for certain types of actions and proceedings that may be initiated by our stockholders, which limits our stockholders’ ability to choose the judicial forum for disputes with us or our directors, officers, or other employees.
Our bylaws provide that, with certain limited exceptions, any action or proceeding:
•brought in a derivative manner in the name or right of the company or on our behalf;
•asserting a claim of breach of a fiduciary duty owed by any of our directors, officers, employees or agents to us or our stockholders;
•asserting a claim against us arising pursuant to any provision of the General Corporation Law of the State of Delaware or any provision of our certificate of incorporation or bylaws; or
•asserting a claim governed by the internal affairs doctrine,doctrine;
will be exclusively brought in the Court of Chancery of the State of Delaware (or, if no state court located within the State of Delaware has jurisdiction, the U.S. federal district court for the District of Delaware).
Furthermore, any complaint asserting a cause of action under the Securities Act against us or any of our directors, officers, employees, or agents will be exclusively brought in U.S. federal district court. Any person or entity purchasing or otherwise acquiring any interest in shares of Concentrix common stock is deemed to have notice of and consented to the exclusive forum provisions.
To the fullest extent permitted by law, the Delaware exclusive forum provision will apply to state and federal law claims other than those claims under the Securities Act for which our bylaws designate U.S. federal district court as the exclusive forum. However, stockholders will not be deemed to have waived our compliance with the U.S. federal securities laws and the rules and regulations thereunder. The enforceability of similar choice of forum provisions in other companies’ certificates of incorporation or similar governing documents has been challenged in legal proceedings, and it is possible that a court could find the choice of forum provisions contained in our bylaws to be inapplicable or unenforceable, including with respect to claims arising under the U.S. federal securities laws.
This exclusive forum provision may limit the ability of a stockholder to commence litigation in a forum that the stockholder prefers, or may require a stockholder to incur additional costs in order to commence litigation in Delaware or U.S. federal district court, each of which may discourage such lawsuits against us or our directors or officers. Alternatively, if a court were to find this exclusive forum provision inapplicable to, or unenforceable in respect of, one or more of the specified types of actions or proceedings described above, we may incur additional costs associated with resolving such matters in other jurisdictions, which could negatively affect our business, results of operations, and financial condition.
The concentration of ownership of our common stock could allow our principal stockholders to influence matters requiring stockholder approval and could delay or prevent a change of control.
As of January 17, 2022, MiTAC Holdings Corporation (“MiTAC Holdings”), a publicly traded company on the Taiwan Stock Exchange, and its affiliates owned approximately [17]% of our common stock. As a result of their ownership of our common stock, these stockholders have the potential ability to influence or control matters requiring stockholder approval, including the election of directors and the approval of mergers and acquisitions, or exert influence on actions of our board of directors. This concentration of ownership may have the effect of delaying, preventing or deterring a change of control of our company, could deprive our stockholders of an opportunity to receive a premium for their common stock as part of a sale of our company and might ultimately affect the market price of our common stock.
ITEM 1B. UNRESOLVED STAFF COMMENTS
None.
ITEM 2. PROPERTIES
OurWe lease our principal executive offices are located in Fremont, California, and are leased by us.Newark, California. As of November 30, 2021,2023, we occupied approximately 270500 facilities, located in more than 70 countries across six continents, comprising service and delivery centers and administrative facilities covering approximately 16.623.2 million square feet, of which approximately 1.21.3 million square feet was owned and the remainder was leased.
ITEM 3. LEGAL PROCEEDINGS
From time to time, we are involved in legal proceedings in the ordinary course of business. We do not believe that these proceedings will have a material adverse effect on the results of our operations, our financial position or the cash flows of our business.
ITEM 4. MINE SAFETY DISCLOSURES
Not applicable.
Part II
ITEM 5. MARKET FOR REGISTRANT’S COMMON EQUITY, RELATED STOCKHOLDER MATTERS AND ISSUER PURCHASES OF EQUITY SECURITIES
Our common stock is listed on Nasdaq under the symbol “CNXC”. As of January 17, 2022,2024, there were 52,317,517 66,331,695 shares of common stock outstanding held by approximately 2,540 3,016 stockholders of record.
Dividends
On September 27, 2021, we announcedDuring fiscal years 2023 and 2022, the initiation of a quarterly cash dividend of $0.25 per share. The first quarterly dividend wasCompany paid in cash on November 2, 2021 to stockholders of record on October 22, 2021. On January 18, 2022, we announced a cash dividend of $0.25the following dividends per share to stockholdersapproved by the Company’s board of record as of January 28, 2022, payable on February 8, 2022. directors:
| | | | | | | | | | | |
| Announcement Date | Record Date | Per Share Dividend Amount | Payment Date |
| January 18, 2022 | January 28, 2022 | $0.25 | February 8, 2022 |
| March 29, 2022 | April 29, 2022 | $0.25 | May 10, 2022 |
| June 27, 2022 | July 29, 2022 | $0.25 | August 9, 2022 |
| September 28, 2022 | October 28, 2022 | $0.275 | November 8, 2022 |
| January 19, 2023 | January 30, 2023 | $0.275 | February 10, 2023 |
| March 29, 2023 | April 28, 2023 | $0.275 | May 9, 2023 |
| June 28, 2023 | July 28, 2023 | $0.275 | August 8, 2023 |
| September 27, 2023 | October 27, 2023 | $0.3025 | November 7, 2023 |
Our board of directors expects that cash dividends will be paid on a quarterly basis in the future. However, any decision to pay future cash dividends will be subject to our board of directors’ approval, and will depend on many factors, such as our financial condition, earnings, capital requirements, debt service obligations, restrictive covenants in our debt agreements, industry practice, legal requirements, regulatory constraints, and other factors that our board of directors deems relevant. Our ability to pay dividends will depend on our ongoing ability to generate cash from operations and on our access to the capital markets. We cannot guarantee that we will continue to pay a dividend in the future.
Share Repurchases
In September 2021, our board of directors authorized the Company to purchaserepurchase of up to $500 million of the Company’s outstanding shares ofour common stock from time to time as market and business conditions warrant, including through open market purchases or Rule 10b-110b5-1 trading plans. The repurchase program has no termination date and may be suspended or discontinued at any time. As of November 30, 2021,2023, we had repurchased 138,4551,689,872 shares under the share repurchase program for approximately $25.1$209.9 million in the aggregate. At November 30, 2021,2023, we had approximately $474.9$290.1 million remaining for share repurchases under the existing authorization from our board of directors.
The following table summarizes the Company’s purchases of common stock during the fourth quarter of the fiscal year ended November 30, 2021:2023:
| | | | | | | | | | | | | | |
| Period | Total number of shares purchased (1), (2) | Average price paid
per share | Total number of shares purchased as part of publicly announced program(2) | Maximum dollar amount that may yet be
purchased under the program (in thousands) |
| September 1, 2021 - September 30, 2021 | 1,521 | | $ | 172.06 | | — | | $ | 500,000 | |
| October 1, 2021 - October 31, 2021 | 224,092 | | $ | 181.76 | | 123,379 | | $ | 477,575 | |
| November 1, 2021 - November 30, 2021 | 15,438 | | $ | 176.15 | | 15,076 | | $ | 474,905 | |
| Total | 241,051 | | $ | 180.55 | | 138,455 | | |
| | | | | | | | | | | | | | |
| Period | Total number of shares purchased (1), (2) | Average price paid
per share | Total number of shares purchased as part of publicly announced program(2) | Maximum dollar amount that may yet be
purchased under the program (in thousands) |
| September 1, 2023 - September 30, 2023 | 95,673 | | $ | 74.31 | | 95,111 | | $ | 305,082 | |
| October 1, 2023 - October 31, 2023 | 200,859 | | $ | 79.67 | | 100,976 | | $ | 297,110 | |
| November 1, 2023 - November 30, 2023 | 82,890 | | $ | 84.32 | | 82,822 | | $ | 290,127 | |
| Total | 379,422 | | $ | 79.33 | | 278,909 | | |
(1) Includes shares withheld upon the vesting of certain equity awards to satisfy tax withholding obligations.
(2) Includes shares repurchased as part of the Company’s share repurchase program initiated in September of 2021.
Stock Price Performance Graph
The stock price performance graph below which assumes a $100 investment oncompares our cumulative total stockholder return for the period from December 1, 2020 compares our cumulative stockholder return,through November 30, 2023 with the cumulative total return of the S&P Midcap 400 Index for the same period and a Peer Group for the period from December 1, 2020 through November 30, 2021. The Peer Group consistscomprised of the following peerour core CX solutions competitors that are publicly traded companies: Majorel Group Luxembourg S.A. (from initial public offering in September 2021)2021 through acquisition by Teleperformance on November 23, 2023), TaskUs Inc. (from initial public offering in June 2021), TDCX Inc. (from initial public offering in October 2021), Teleperformance S.A., TELUS International (from initial public offering in February 2021), and TTEC Holdings, Inc., which represent our core CX solutions competitors that are publicly traded companies.in each case assuming a $100 initial investment.
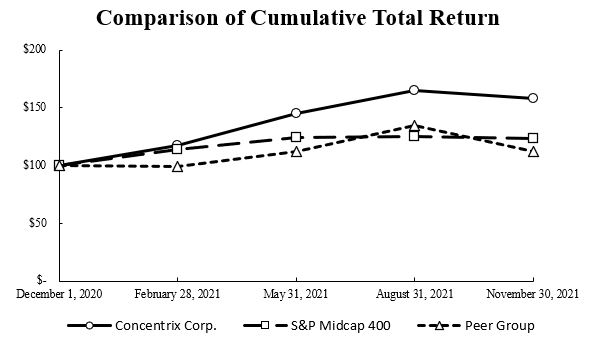

| | December 1, 2020 | February 28, 2021 | May 31, 2021 | August 31, 2021 | November 30, 2021 |
| December 1, 2020 | | | December 1, 2020 | November 30, 2021 | November 30, 2022 | November 30, 2023 |
| Concentrix Corporation | Concentrix Corporation | $ | 100.00 | | $ | 117.63 | | $ | 145.45 | | $ | 165.13 | | $ | 158.10 | |
| S&P Midcap 400 | S&P Midcap 400 | $ | 100.00 | | $ | 113.75 | | $ | 124.29 | | $ | 125.46 | | $ | 123.43 | |
| Peer Group | Peer Group | $ | 100.00 | | $ | 99.61 | | $ | 112.05 | | $ | 134.41 | | $ | 112.21 | |
ITEM 6. RESERVED[RESERVED]
ITEM 7. MANAGEMENT’S DISCUSSION AND ANALYSIS OF FINANCIAL CONDITION AND RESULTS OF OPERATIONS
This Management’s Discussion and Analysis of Financial Condition and Results of Operations should be read in conjunction with our historical consolidated financial statements and the notes to those consolidated financial statements. It contains forward-looking statements, which are subject to risk, uncertainties, and other factors that could cause actual results to differ materially from those projected or implied in the forward-looking statements. Please see “Risk Factors” and “Note Regarding Forward-Looking Statements” in this Annual Report on Form 10-K for a discussion of the uncertainties, risks and assumptions associated with these statements.
The following discussion compares our results for the fiscal year ended November 30, 20212023 to the fiscal year ended November 30, 2020.2022. The discussion comparing our results for the fiscal year ended November 30, 20202022 to the fiscal year ended November 30, 20192021 is included within Management’s Discussion and Analysis of Financial Condition and Results of Operations in our 20202022 Annual Report on Form 10-K filed with the SEC on February 16, 2021,January 27, 2023, and is incorporated by reference herein.
Unless otherwise indicated or except where the context otherwise requires, references to “we,” “our,” “us,” “the Company”Company,” or “Concentrix”“Concentrix,” in this Management’s Discussion and Analysis of Financial Condition and Results of Operations refer to Concentrix Corporation and its subsidiaries.
Overview and Basis of Presentation
Concentrix is a leading global provider of Customer Experience (“CX”) solutions and technology that help iconic and disruptive brands drive deep understanding, full lifecycle engagement, and differentiated experiences for their end-customers. We provide end-to-end capabilities, including CX process optimization, technology innovation and design engineering, front- and back-office automation, analytics and business transformation services to clients in five primary industry verticals. Our differentiated portfolio of solutions supports Fortune Global 500 as well as new economy clients across the globe in their efforts to deliver an optimized, consistent brand experience across all channels of communication, such as voice, chat, email, social media, asynchronous messaging, and custom applications. We strive to deliver exceptional services globally supported by our deep industry knowledge, technology and security practices, talented people, and digital and analytics expertise.
We generate revenue from performing services that are generally tied to our clients’ products and services. Any shift in business or the size of the market for our clients’ products or services, or any failure of technology or failure of acceptance of our clients’ products or services in the market may impact our business. The staff turnover rate in our business is high, as is the risk of losing experienced team members. High staff turnover rates may increase costs and decrease operating efficiencies and productivity. For more information on the risks associated with our business, please see “Risk Factors” in this Annual Report on Form 10-K.
Webhelp Combination
On September 25, 2023, we completed our acquisition (the “Webhelp Combination”) of all of the issued and outstanding capital stock (the “Shares”) of Marnix Lux SA, a public limited liability company (société anonyme) incorporated under the laws of the Grand Duchy of Luxembourg (“Webhelp Parent”) and the parent company of the Webhelp business (“Webhelp”), from the holders thereof (the “Sellers”). The acquisition was completed pursuant to the terms and conditions of the Share Purchase and Contribution Agreement, dated as of June 12, 2023, as amended by First Amendment to Share Purchase and Contribution Agreement, dated as of July 14, 2023 by and among Concentrix, OSYRIS S.à r.l., a private limited liability company (société à responsabilité limitée) incorporated under the laws of the Grand Duchy of Luxembourg and a direct wholly owned subsidiary of Concentrix Corporation, Webhelp Parent, the Sellers, and certain representatives of the Sellers.
Webhelp is a leading provider of CX solutions, including sales, marketing, and payment services, with significant operations and client relationships in Europe, Latin America, and Africa. Since the closing of the Webhelp Combination, we have operated under the trade name “Concentrix + Webhelp” while we transition Webhelp operations and branding to the Concentrix name. The preliminary purchase consideration for the acquisition of the Shares is valued at approximately $3,752.4 million, net of cash and restricted cash acquired.
PK Acquisition
On December 27, 2021, we completed our acquisition of PK, a leading CX design engineering company with more than 5,000 staff in four countries.countries, for total consideration of $1,573.3 million, net of cash and restricted cash acquired. PK creates pioneering experiences that accelerate digital outcomes for their clients’ customers, partners and staff. The acquisition of PK expandsexpanded our scale in the digital IT services market and supportssupported our growth strategy of investing in digital transformation to deliver exceptional customer experiences. The addition of the PK staff and technology to our team further strengthensstrengthened our capabilities in CX design and development, artificial intelligence (“AI”), intelligent automation, and customer loyalty.
Spin-offServiceSource Acquisition
On December 1, 2020, the previously announced separation (the “separation”July 20, 2022, we completed our acquisition of ServiceSource International, Inc. (“ServiceSource”) for total consideration of Concentrix$141.5 million, net of cash and restricted cash acquired. ServiceSource is a global outsourced go-to-market services provider, delivering business-to-business (“B2B”) digital sales and customer success solutions that complemented our technology-infused CX solutions business from TD SYNNEX was completed through a tax-free distribution of all of the issued and outstanding shares of our common stock to TD SYNNEX stockholders (the distribution and, together with the separation, the “spin-off”). TD SYNNEX stockholders received one share of our common stock for each share of TD SYNNEX common stock held as of the close of business on November 17, 2020. As a result of the
spin-off, we became an independent public company and our common stock commenced trading on the Nasdaq Stock Market (“Nasdaq”) under the symbol “CNXC” on December 1, 2020. In connection with the spin-off, on November 30, 2020, we entered into a separation and distribution agreement, an employee matters agreement, a tax matters agreement and a commercial agreement with TD SYNNEX to set forth the principal actions to be taken in connection with the spin-off and define our ongoing relationship with TD SYNNEX after the spin-off.
Risks and uncertainties related to the COVID-19 pandemic
In December 2019, there was an outbreak of a new strain of coronavirus (“COVID-19”), which was declared a pandemic by the World Health Organization in March 2020. The COVID-19 pandemic has negatively impacted the global economy, disrupted global supply chains and labor force participation, and created significant volatility and disruption of financial markets. We successfully transitioned a significant portion of our workforce to a remote working environment throughout the second quarter of 2020 and implemented a number of safety and social distancing measures in our sites to protect the health and safety of our team. During fiscal year 2021, almost all of our workforce was productive, but we experienced the continued effects of the COVID-19 pandemic, as the Delta variant caused new waves of COVID-19 cases around the globe. We incurred net costs of approximately $33 million and $86 million associated with COVID-19 during the fiscal years ended November 30, 2021 and 2020, respectively. The COVID-19 related costs consist of certain out-of-pocket costs and non-productive workforce costs, including support and resources for our staff to care for themselves and their families.
The extent of the continued impact of the COVID-19 pandemic on our operational and financial performance, including our ability to execute our business strategies and initiatives in the expected time frame, will depend on future developments, including the duration, spread and severity of the pandemic, the evolution of the virus and the effects of mutations in its genetic code, country and state restrictions regarding virus containment, the availability and effectiveness of vaccines and treatment options, accessibility to the Company’s delivery and operations locations, our continued utilization of remote work environments in response to future health and safety restrictions, and the effect on our clients’ businesses and the demand for their products and services, all of which are uncertain and cannot be predicted. We are unable to predict how long the pandemic conditions will persist in regions in which we operate, if or when countries or localities may experience an increase in COVID-19 cases, what additional measures may be introduced by governments or our clients in response to the pandemic generally or to an increase in COVID-19 cases in a particular country or locality, and the effect of any such additional measures on our business. As a result, many of the estimates and assumptions involved in preparation of the consolidated financial statements includedexisting offerings in this Annual Report on Form 10-K required increased judgment and carry a higher degree of variability and volatility. As events continue to evolve with respect to the pandemic and global recovery from the pandemic, our estimates may materially change in future periods. Accordingly, current results and financial condition discussed herein may not be indicative of future operating results and trends.area.
Revenue and Cost of Revenue
We generate revenue through the provision of CX solutions and technology to our clients pursuant to client contracts. Our client contracts typically consist of a master services agreement, supported in most cases by multiple statements of work, which containscontain the terms and conditions of each contracted solution. Our client contracts can range from less than one year to over five years in term and are subject to early termination by our clients for any reason, typically with 30 to 90 days’ notice.
Our CX solutions and technology are generally characterized by flat unit prices. Approximately 96%97% of our revenue is recognized as services are performed, based on staffing hours or the number of client customer transactions handled using contractual rates. Remaining revenuesrevenue from the sale of these solutions are typically recognized as the services are provided over the duration of the contract using contractual rates.
Our cost of revenue consists primarily of personnel costs related to the delivery of our solutions.solutions and technology. The costs of our revenue can be impacted by the mix of client contracts, where we deliver the CX solutions and technology, additional lead time for programs to be fully scalable and transition and initial set-up costs. Our cost of revenue as a percentage of revenue has also fluctuated in the past, based primarily on our ability to achieve economies of scale, the
management of our operating expenses, and the timing and costs incurred related to our acquisitions and investments.
In fiscal years 20212023 and 2020,2022, approximately 84%82% and 83%78%, respectively, of our consolidated revenue was generated from our non-U.S. operations, and approximately 62%64% and 63%68%, respectively, of our consolidated revenue was priced in U.S. dollars and wedollars. We expect thisthat a majority of our revenue will continue to continue.be generated from our non-U.S. operations while being priced in U.S. dollars. As a result, we have certain client contracts that are priced in non-U.S. dollar currencies for which a substantial portion of the costs to deliver the services are in other currencies. Accordingly, our revenue may be earned in currencies that are different from the currencies in which we incur corresponding expenses. Fluctuations in the value of currencies, such as the Philippine peso, the Indian rupee, the euro, and the Canadian dollar, against the U.S. dollar or other currencies in which we bill our clients, and inflation in the local economies in which these delivery centers are located, can impact the operating and labor costs in these delivery centers, which can result in reduced profitability. As a result, our revenue growth, costs and profitability has
have been impacted, and we expect will continue to be impacted, by fluctuations in foreign currency exchange rates.
Margins
Our gross margins fluctuate and can be impacted by the mix of client contracts, services provided, shifts in the geography from which our CX services and technology are delivered, client volume trends, and the amount of lead time that is required for programs to become fully scaled, and transition and set-up costs. Our operating margin fluctuates based on changes in gross margins as well as overall volume levels, as we are generally able to gain scale efficiencies in our selling, general and administrative costs in periods of higher volume.as our volumes increase.
Economic and Industry Trends
The CX solutions industry in which we operate is competitive. Clients’ performance measures are basedcompetitive, including on competitivethe basis of pricing terms, delivery capabilities and quality of services. Further, there can be competitive pressure for labor in various markets, which could result in increased labor costs. Accordingly, we could be subject to pricing pressureand labor cost pressures and may experience a decrease in revenue and operating income. Our business operates globally in over 4070 countries across 6six continents. We have significant concentrations in the Philippines, India, Brazil, the United States, Turkey, Colombia, Egypt, the United Kingdom, throughout Europe,Morocco, China, and Japan.elsewhere throughout EMEA, Latin America, and Asia-Pacific. Accordingly, we would be impacted by economic strength or weakness in these geographies and by the strengthening or weakening of local currencies relative to the U.S. dollar.
Seasonality
Our revenue and margins fluctuate with the underlying trends in our clients’ businesses and trends in the level of consumer activity. As a result, our revenuesrevenue and margins are typically higher in the fourth fiscal quarter of the year than in any other fiscal quarter.
Critical Accounting Policies and Estimates
The discussion and analysis of our consolidated financial condition and results of operations are based on our consolidated financial statements, which have been prepared in conformity with generally accepted accounting principles in the United States (“GAAP”). The preparation of these financial statements requires us to make estimates and assumptions that affect the reported amounts of assets and liabilities, disclosure of any contingent assets and liabilities at the financial statement date and reported amounts of revenue and expenses during the reporting period. On an ongoing basis, we review and evaluate our estimates and assumptions. Our estimates are based on our historical experience and a variety of other assumptions that we believe to be reasonable under the circumstances, the results of which form the basis for making our judgment about the carrying values of assets and liabilities that are not readily available from other sources. Actual results could differ from these estimates under different assumptions or conditions.
We believe the following critical accounting policies involve the more significant judgments, estimates and/or assumptions used in the preparation of our consolidated financial statements.
Revenue Recognition
We recognize revenue from our client contracts over time as the promised services are delivered to clients for an amount that reflects the consideration to which we are entitled in exchange for those services. We recognize revenue over time as the client simultaneously receives and consumes the benefits provided by us as we perform the services. We account for a contract with a client when it has written approval, the contract is committed, the rights of the parties, including payments terms, are identified, the contract has commercial substance and the consideration is probable of collection. Revenue is presented net of taxes collected from clients and remitted to government authorities. We generally invoice a client after the performance of services, or in accordance with the specific contractual provisions. Payments are due as per contract terms and do not contain a significant financing component.
In most cases, our contracts consist of a single performance obligation comprised of a series of distinct services that are substantially the same and that have the same pattern of transfer (i.e., distinct days of service).
Service contracts are most significantly based on a fixed unit-price per transaction or other objective measure of output. Revenue on unit-price transactions is recognized over time using an objective measure of output such as staffing hours or the number of transactions processed by service advisors. Certain contracts may be based on a fixed price. Revenue on fixed price contracts is recognized over time using an input measure or on a straight line basis over the term of the contract as the services are provided based on the nature of the contract.
Certain client contracts include additional payments from the client based upon the achievement of certain agreed-upon service levels and performance metrics. Certain contracts also provide for a reduction in consideration paid to the Company in the event that certain agreed-upon service levels or performance metrics are not achieved. Revenue based on such arrangements is accounted for as variable consideration when the likely amount of revenue to be recognized can be estimated to the extent that it is unlikely that a significant reversal will occur.
Business Combinations
We continuallyseek to augment organic growth with strategic acquisitions of businesses and assets that complement and expand our existing capabilities. Recent acquisitions have sought to enhance our capabilities and domain expertise in our strategic industry verticals, expand our geographic footprint, and further expand into higher value service offerings.
We allocate the fair value of purchase consideration to the assets acquired and liabilities assumed generally based on their fair values at the acquisition date. The excess of the fair value of purchase consideration over the fair value of the assets acquired and liabilities assumed is recorded as goodwill. The determination of the fair value of assets and liabilities may involve engaging independent third parties to perform an appraisal. When determining the fair values of assets acquired and liabilities assumed, we make significant estimates and assumptions, especially with respect to intangible assets. Critical estimates in valuing intangible assets include, but are not limited to, expected future cash flows, which includes consideration of future growth rates and margins, attrition rates and discount rates. Fair value estimates are based on the assumptions we believe a market participant would use in pricing the asset or liability. Amounts recorded in a business combination may change during the measurement period, which is a period not to exceed one year from the date of acquisition, as additional information about conditions existing at the acquisition date becomes available.
Goodwill
As of November 30, 2021,2023, we had goodwill of $1,813.5$5,078.7 million recorded on our consolidated balance sheet. The Company tests goodwill for impairment annually at the reporting unit level in the fiscal fourth quarter or more frequently if events or changes in circumstances indicate that it may be impaired. For purposes of the goodwill impairment test, the Company can elect to perform a quantitative or qualitative analysis. If the qualitative analysis is elected, goodwill is tested for impairment at the reporting unit level by performing a qualitative assessment to determine whether it is more likely than not that the fair value of the reporting unit is less than its carrying value. The factors that are considered in the qualitative analysis includeinclude: macroeconomic conditions,conditions; industry and market considerations,considerations; cost factors such as increases in labor, or other costs that would have a negative effect on earnings and cash flows; and other relevant entity-specific events and information.
If we elect to perform or are required to perform a quantitative analysis, then the reporting unit’s carrying value is compared to its fair value. Goodwill is considered impaired if the carrying value of the reporting unit exceeds its fair value and the excess is recognized as an impairment loss. As part of our fiscal year 20212023 assessment, and analysis ofwe reconciled the fair value of our reporting unit we reconciled to our market capitalization. The result of the analysis shows thedemonstrated that our reporting unit’s fair value substantially exceedsexceeded its carrying value.
Based on our 20212023 impairment assessment, we concluded that no impairment charges were necessary. We have not recorded anyno impairment charges related to goodwill during the fiscal years ended November 30, 20212023 and 2020.2022.
Other Intangible Assets
As of November 30, 2021,2023, we had other intangible assets, net of amortization, of $655.5$2,805.0 million. This amount consists primarily of $653.3$2,659.0 million in client relationship intangible assets. As amortizable intangible assets, we evaluate the intangible assets for recoverability whenever events or circumstances indicate a possible inability to recover their carrying value (an indicator of impairment). If an impairment indicator is present, we perform a test of recoverability by comparing estimates of undiscounted future cash flows to the carrying values of the related assets.
We have not recorded anyno impairment charges related to other intangible assets during the fiscal years ended November 30, 20212023 and 2020.2022.
Recently Issued Accounting Pronouncements
For a summary of recent accounting pronouncements and the anticipated effects on our consolidated financial statements, see Note 2—Summary of Significant Accounting Policies to the consolidated financial statements included elsewhere in this Annual Report on Form 10-K.
Results of Operations – Fiscal Years Ended November 30, 20212023 and 20202022
| | Fiscal Years Ended November 30, | | | Fiscal Years Ended November 30, |
| 2023 | | | 2023 | | 2022 |
| | Fiscal Years Ended November 30, |
| 2021 | | 2020 |
| | (in thousands) |
| (in thousands) | |
| (in thousands) | |
| (in thousands) | |
| Revenue | Revenue | $ | 5,587,015 | | | $ | 4,719,534 | |
| Cost of revenue | Cost of revenue | 3,617,527 | | | 3,058,009 | |
| Gross profit | Gross profit | 1,969,488 | | | 1,661,525 | |
| Selling, general and administrative expenses | Selling, general and administrative expenses | 1,397,091 | | | 1,352,764 | |
| Operating income | Operating income | 572,397 | | | 308,761 | |
| Interest expense and finance charges, net | Interest expense and finance charges, net | 23,046 | | | 48,313 | |
| Other expense (income), net | Other expense (income), net | (6,345) | | | (7,447) | |
| Income before income taxes | Income before income taxes | 555,696 | | | 267,895 | |
| Provision for income taxes | Provision for income taxes | 150,119 | | | 103,084 | |
| Net income | $ | 405,577 | | | $ | 164,811 | |
| Net income before non-controlling interest | |
| Less: Net income attributable to non-controlling interest | |
| Net income attributable to Concentrix Corporation | |
Revenue
| | Fiscal Years Ended November 30, | | | Fiscal Years Ended November 30, | | Percent Change |
| 2023 | | | 2023 | | 2022 | | 2023 to 2022 |
| | Fiscal Years Ended November 30, | | Percent Change |
| 2021 | | 2020 | | 2021 to 2020 |
| | (in thousands) | |
| (in thousands) | |
| (in thousands) | |
| (in thousands) | |
| Industry vertical: | |
| Industry vertical: | |
| Industry vertical: | Industry vertical: | |
| Technology and consumer electronics | Technology and consumer electronics | $ | 1,759,203 | | | $ | 1,422,817 | | | 23.6 | % |
| Technology and consumer electronics | |
| Technology and consumer electronics | | $ | 2,205,834 | | | $ | 1,980,666 | | | 11.4 | % |
| Retail, travel and ecommerce | | Retail, travel and ecommerce | 1,448,666 | | | 1,184,086 | | | 22.3 | % |
| Communications and media | Communications and media | 1,005,283 | | | 954,234 | | | 5.3 | % | Communications and media | 1,117,694 | | | 1,076,289 | | 1,076,289 | | | 3.8 | | 3.8 | % |
| Retail, travel and ecommerce | 985,550 | | | 796,324 | | | 23.8 | % |
| Banking, financial services and insurance | Banking, financial services and insurance | 862,033 | | | 712,469 | | | 21.0 | % | Banking, financial services and insurance | 1,091,853 | | | 967,810 | | 967,810 | | | 12.8 | | 12.8 | % |
| Healthcare | Healthcare | 489,855 | | | 392,686 | | | 24.7 | % | Healthcare | 696,266 | | | 608,169 | | 608,169 | | | 14.5 | | 14.5 | % |
| Other | Other | 485,091 | | | 441,004 | | | 10.0 | % | Other | 554,393 | | | 507,453 | | 507,453 | | | 9.3 | | 9.3 | % |
| Total | Total | $ | 5,587,015 | | | $ | 4,719,534 | | | 18.4 | % | Total | $ | 7,114,706 | | | $ | | $ | 6,324,473 | | | 12.5 | | 12.5 | % |
We generate revenue by delivering our CX solutions and technology to our clients categorized in the above primary industry verticals. TheseOur solutions focus on customer engagement,end-to-end capabilities, including CX process optimization, technology innovation, front and back-office automation.back office automation, analytics and business transformation services.
Our revenue increased 18.4%12.5% in fiscal year 2021,2023, including revenue from Webhelp acquired operations of $574.4 million, or an increase of 9.1%, compared to fiscal year 2020,2022. The increase in revenue from Webhelp acquired operations combined with higher volumes across most verticals caused the increase in our revenue compared to the prior year. These increases were partially offset by an unfavorable translation effect of foreign currencies of $56.0 million, or 0.9%. The unfavorable foreign currency translation effect on revenue was primarily due to an increase in volumes across all verticals. the weakening of the Argentine peso, Japanese yen and Australian dollar against the U.S. dollar.
Revenue in our technology and consumer electronics vertical increased as a result of largerover the prior year due to contributions from acquired operations, increases in volumes from several social media and internet-related service clients and increases in volumes from a broad-based group of hardware and software clients. Revenue in our communications and media vertical increased due to larger volumes primarily as a result of prior year impacts from COVID-19 that did not recur in the current year, partially offset by our portfolio re-
balancing efforts which were largely completed by the end of fiscal year 2020. Revenue in our retail, travel and ecommerce vertical increased over the prior year primarily due to largercontributions from acquired operations and increased volumes across thefrom a majority of our retail and ecommerce clients and an increase in volumes for several travel and tourism clients. Revenue in our communications and media vertical increased over the prior year primarily due to contributions from acquired operations partially offset by decreases in volumes related to several clients in this industry vertical. Revenue from clients in the banking, financial services and insurance vertical increased over the prior year due to largercontributions from acquired operations and increased volumes from the majority of our banking and financial services clients.clients in this industry vertical. Revenue in our healthcare vertical increased over the prior year due to largerincreased volumes across thefrom a majority of our health insurance clients.clients and contributions from acquired operations. Revenue in our other vertical increased reflecting growth with several government clients. Also contributing toover the increase in total revenue in fiscalprior year 2021 were favorable foreign currency translation effects of $93.3 million, or 2.0%. The favorable foreign currency translation effects on revenue were primarily due to the strengthening of the euro, British poundcontributions from acquired operations partially offset by a decrease in revenue from a government client and Australian dollar against the U.S. dollar.a few other clients in this vertical.
Cost of Revenue, Gross Profit and Gross Margin Percentage
| | Fiscal Years Ended November 30, | | | Fiscal Years Ended November 30, | | Percent Change |
| 2023 | | | 2023 | | 2022 | | 2023 to 2022 |
| | Fiscal Years Ended November 30, | | Percent Change |
| 2021 | | 2020 | | 2021 to 2020 |
| | ($ in thousands) | |
| ($ in thousands) | |
| ($ in thousands) | |
| ($ in thousands) | |
| Cost of revenue | |
| Cost of revenue | |
| Cost of revenue | Cost of revenue | $ | 3,617,527 | | | $ | 3,058,009 | | | 18.3 | % | $ | 4,536,771 | | | $ | | $ | 4,067,210 | | | 11.5 | | 11.5 | % |
| Gross profit | Gross profit | $ | 1,969,488 | | | $ | 1,661,525 | | | 18.5 | % | Gross profit | $ | 2,577,935 | | | $ | | $ | 2,257,263 | | | 14.2 | | 14.2 | % |
| Gross margin % | Gross margin % | 35.3 | % | | 35.2 | % | |
Cost of revenue consists primarily of personnel costs. Gross margins can be impacted by resource location, client mix and pricing, additional lead time for programs to be fully scalable, and transition and initial set-up costs.
Our cost of revenue increased by 18.3%11.5% in fiscal y fiscal year 2021,ear 2023, compared to fiscal year 2020,2022, primarily due to the increase in our revenue wage increases and foreign currency translation effects of $78.2 million on the cost of revenue. Thepersonnel costs related to staff supporting our acquired operations. These increases were partially offset by a decrease$143.0 million, or 3.5%, reduction in COVID-19 related coststhe cost of approximately $41 million.revenue due to foreign currency translation. The foreign currency translation effectsimpacts on theour cost of revenue were caused primarily by the strengtheningweakening of the Canadian dollar, euro, BritishPhilippine peso, Egyptian pound, Indian rupee and PhilippineArgentine peso against the U.S. dollar.
Our gross profit increased 18.5%by 14.2% in fiscal year 2021,2023, compared to fiscal year 2020,2022, primarily due to the increase in revenue and contributions from acquired operations and a net favorable foreign currency impact of $15.1 million on gross profit and the decrease in COVID-19 related costs.$87.0 million. Our gross margin percentage remained materially consistent at 35.3%increased from 35.7% in fiscal year 2021 compared2022 to 35.2%36.2% in the priorfiscal year 2023 and was impactedaffected by the mix of geographies where our services were delivered.
Selling, General and Administrative Expenses
| | Fiscal Years Ended November 30, | | | Fiscal Years Ended November 30, | | Percent Change |
| 2023 | | | 2023 | | 2022 | | 2023 to 2022 |
| | Fiscal Years Ended November 30, | | Percent Change |
| 2021 | | 2020 | | 2021 to 2020 |
| | ($ in thousands) | |
| ($ in thousands) | |
| ($ in thousands) | |
| ($ in thousands) | |
| Selling, general and administrative expenses | |
| Selling, general and administrative expenses | |
| Selling, general and administrative expenses | Selling, general and administrative expenses | $ | 1,397,091 | | | $ | 1,352,764 | | | 3.3 | % | $ | 1,916,608 | | | $ | | $ | 1,617,071 | | | 18.5 | | 18.5 | % |
| Percentage of revenue | Percentage of revenue | 25.0 | % | | 28.7 | % | |
Our selling, general and administrative expenses consist primarily of support personnel costs such as salaries, commissions, bonuses, employee benefits and share-based compensation costs. Selling, general and administrative expenses also include the cost of our global delivery facilities, utility expenses, hardware and software costs related to our technology infrastructure, legal and professional fees, depreciation on our technology and facility equipment, amortization of intangible assets resulting from acquisitions, marketing expenses and acquisition-related transaction and integration expenses, and spin-off related expenses.
Our selling, general and administrative expenses increased by 3.3%18.5% in fiscal year 2021,2023, compared to fiscal year 2020,2022, primarily due to incremental expenses associated with acquired operations, increases in expenses to support our revenue growth, foreign currency translation effectsan increase in amortization expense of $23.7$52.1 million primarily associated with the intangible assets recognized in the Webhelp Combination and our acquisitions of PK and ServiceSource, an increase in acquisition-related and integration expenses of $37.5 million related to the Webhelp Combination and our acquisitions of PK and ServiceSource, and an increase in share-based compensation expense of $20.9$15.0 million. These increases were partially offset by a $34.5 million reduction in selling, general and administrative expenses due to foreign currency translation. As a percentage of revenue, selling, general and administrative expenses increased from 25.6% for fiscal year 2022 to 26.9% for fiscal year 2023 due to the net effect of the changes described above.
Operating Income
| | | | | | | | | | | | | | | | | |
| Fiscal Years Ended November 30, | | Percent Change |
| 2023 | | 2022 | | 2023 to 2022 |
| | | | | |
| ($ in thousands) | | |
| Operating income | $ | 661,327 | | | $ | 640,192 | | | 3.3 | % |
| Operating margin | 9.3 | % | | 10.1 | % | | |
Our operating income increased during fiscal year 2023, compared to fiscal year 2022, primarily due to the increase in gross profit partially offset by the increase in selling, general and administrative expenses.
Our operating margin decreased during fiscal year 2023, compared to fiscal year 2022, due to the increase in gross margin percentage more than offset by the increase in selling, general and administrative expenses as a percentage of revenue.
offset by a gain on divestitures and related transaction costs of $13.2 million primarily associated with our sale of Concentrix Insurance Solutions (“CIS”), a decrease in acquisition-related and integration expenses of $27.2 million, and a decrease in COVID-19 related expenses of approximately $12 million. These items and scale efficiencies resulted in a decrease in selling, general and administrative expenses as a percentage of revenue from 28.7% for fiscal year 2020 to 25.0% for fiscal year 2021.
Operating Income
| | | | | | | | | | | | | | | | | |
| Fiscal Years Ended November 30, | | Percent Change |
| 2021 | | 2020 | | 2021 to 2020 |
| | | | | |
| ($ in thousands) | | |
| Operating income | $ | 572,397 | | | $ | 308,761 | | | 85.4 | % |
| Operating margin | 10.2 | % | | 6.5 | % | | |
Our operating income and operating margin increased during fiscal year 2021, compared to fiscal year 2020, primarily due to increases in gross profit and the reduction in selling, general and administrative expenses as a percentage of revenue.
Interest Expense and Finance Charges, Net
| | Fiscal Years Ended November 30, | | | Fiscal Years Ended November 30, | | Percent Change |
| 2023 | | | 2023 | | 2022 | | 2023 to 2022 |
| | Fiscal Years Ended November 30, | | Percent Change |
| 2021 | | 2020 | | 2021 to 2020 |
| | ($ in thousands) | |
| ($ in thousands) | |
| ($ in thousands) | |
| ($ in thousands) | |
| Interest expense and finance charges, net | |
| Interest expense and finance charges, net | |
| Interest expense and finance charges, net | Interest expense and finance charges, net | $ | 23,046 | | | $ | 48,313 | | | (52.3) | % | $ | 201,004 | | | $ | | $ | 70,076 | | | 186.8 | | 186.8 | % |
| Percentage of revenue | Percentage of revenue | 0.4 | % | | 1.0 | % | |
Amounts recorded in interest expense and finance charges, net for fiscal year 2021 consist primarily of interest on our term loan andborrowings under our senior credit facility, interest on borrowings under our accounts receivable securitization facility borrowings, while amounts recorded for the prior year related primarily to(the “Securitization Facility”), interest on our borrowings from TD SYNNEX.senior notes issued in August 2023, interest expense on the promissory note issued by us to certain Sellers in connection with the Webhelp Combination (the “Sellers’ Note”) and financing expenses associated with the commitment letter dated March 29, 2023 (the “Bridge Commitment Letter,” and the commitments pursuant to the Bridge Commitment Letter, the “Bridge Facility”), entered into in connection with the Webhelp Combination.
Interest
The increase in interest expense decreasedand finance charges, net during fiscal year 2021, in comparison2023, compared to fiscal year 2020, as a result2022, was due to Bridge Facility financing fees and credit facility amendment fees of the reduction of$22.5 million, higher interest rates on increased outstanding term loan borrowings under our senior credit facility, higher interest rates on outstanding borrowings and more favorableunder our Securitization Facility, interest rate termsexpense on our senior notes of $49.0 million, interest expense, including imputed interest, associated with the Sellers’ Note of $5.7 million, partially offset by interest income of $14.3 million earned on the borrowingssenior notes proceeds included in fiscal year 2021.cash equivalents prior to the Webhelp Combination.
Other Expense (Income), Net
| | Fiscal Years Ended November 30, | | | Fiscal Years Ended November 30, | | Percent Change |
| 2023 | | | 2023 | | 2022 | | 2023 to 2022 |
| | Fiscal Years Ended November 30, | | Percent Change |
| 2021 | | 2020 | | 2021 to 2020 |
| | ($ in thousands) | |
| ($ in thousands) | |
| ($ in thousands) | |
| ($ in thousands) | |
| Other expense (income), net | |
| Other expense (income), net | |
| Other expense (income), net | Other expense (income), net | $ | (6,345) | | | $ | (7,447) | | | (14.8) | % | $ | 52,095 | | | $ | | $ | (34,887) | | | (249.3) | | (249.3) | % |
| Percentage of revenue | Percentage of revenue | 0.1 | % | | 0.2 | % | |
Amounts recorded as other expense (income), net include foreign currency transaction gains and losses other than cash flow hedges, investment gains and losses, the non-service component of pension costs, and other non-operating gains and losses.losses, and changes in the fair value of acquisition contingent consideration related to the Webhelp Combination.
Other expense (income), net in fiscal year 20212023 was $6.3$52.1 million of incomeexpense compared to $7.4$34.9 million of income in fiscal year 2020.2022. The decreasechange in other expense (income), net was primarily due to a favorable resolutionexpense associated with an increase in the fair value of a previously-recognized tax indemnity obligation inthe acquisition contingent consideration associated with the Webhelp Combination from the closing date of the Webhelp Combination (the “Closing Date”) to fiscal year 2020 that did not recurend of $15.7 million, a loss on derivative contracts entered into in fiscal year 2021.connection with the Webhelp Combination of $14.6 million, losses associated with hedges, and unfavorable foreign currency transaction changes compared to the prior year.
Provision for Income Taxes
| | Fiscal Years Ended November 30, | | | Fiscal Years Ended November 30, | | Percent Change |
| 2023 | | | 2023 | | 2022 | | 2023 to 2022 |
| | Fiscal Years Ended November 30, | | Percent Change |
| 2021 | | 2020 | | 2021 to 2020 |
| | ($ in thousands) | |
| ($ in thousands) | |
| ($ in thousands) | |
| ($ in thousands) | |
| Provision for income taxes | |
| Provision for income taxes | |
| Provision for income taxes | Provision for income taxes | $ | 150,119 | | | $ | 103,084 | | | 45.6 | % | $ | 94,386 | | | $ | | $ | 169,363 | | | (44.3) | | (44.3) | % |
| Percentage of income before income taxes | Percentage of income before income taxes | 27.0 | % | | 38.5 | % | |
IncomeOur provision for income taxes consistconsists of our current and deferred tax expense resulting from our income earned in domestic and international jurisdictions. For fiscal year 2020, although our financial results were included in the consolidated tax returns of TD SYNNEX in certain jurisdictions, our tax provision was recorded as if we had filed our taxes on a stand-alone basis.
Our provision for income taxes increasedand effective tax rate decreased for fiscal year 2021,2023, compared to fiscal year 2020,2022, due to the increase in our income before taxes and an additional expense of $13.0 million in fiscal year 2021 related to the divestiture of CIS.
The effective tax rate for fiscal year 2021 decreased compared to the effective tax rate for the fiscal year 2020 due to hypothetical tax expense being only applicable to prior year, resulting in a decrease in the effective tax rate of 10%, partially offset by the change ingeographical mix of income earnedthat resulted in differentlower U.S. minimum tax jurisdictions between fiscal years.related to foreign earnings and higher use of net operating loss carryforwards.
See Note 14—Income13—Income Taxes to the consolidated financial statements included elsewhere in this Annual Report on Form 10-K for further details.
Certain non-GAAP financial informationNon-GAAP Financial Information
In addition to disclosing financial results that are determined in accordance with GAAP, we also disclose certain non-GAAP financial information, including:
•Revenue in constant currency, which is revenue adjusted for the translation effect of foreign currencies so that certain financial results can be viewed without the impact of fluctuations in foreign currency exchange rates, thereby facilitating period-to-period comparisons of our business performance. Revenue in constant currency is calculated by translating the revenue of each fiscal year in the billing currency to U.S. dollars using the comparable prior year’s currency conversion rate. Generally, when the U.S. dollar either strengthens or weakens against other currencies, our revenue growth at constant currency rates or adjusting for currency will be higher or lower than our revenue growth reported at actual exchange rates.
•Revenue in adjusted constant currency, which is constant currency revenue excluding revenue for businesses acquired or divested since the beginning of the prior year period so that revenue growth can be viewed without the impact of acquisitions or divestitures, thereby facilitating period-to-period comparisons of our business performance.
•Non-GAAP operating income, which is operating income, adjusted to exclude acquisition-related and integration expenses, including related restructuring costs, spin-off related expenses, amortization of intangible assets and share-based compensation and gain on divestitures and related transaction costs.compensation.
•Non-GAAP operating margin, which is non-GAAP operating income, as defined above, divided by revenue.
•Adjusted earnings before interest, taxes, depreciation, and amortization, or adjusted EBITDA, which is non-GAAP operating income, as defined above, plus depreciation.
•Adjusted EBITDA margin, which is adjusted EBITDA, as defined above, divided by revenue.
•Non-GAAP net income, which is net income excluding the tax effected impact of acquisition-related and integration expenses, including related restructuring costs, spin-off related expenses, amortization of intangible assets, share-based compensation, imputed interest related to the sellers’ note, change in the fair value of acquisition contingent consideration and gain on divestitures and related transaction costs.foreign currency losses (gains), net.
•Free cash flow, which is cash flows from operating activities less capital expenditures. We believe that free cash flow is a meaningful measure of cash flows since capital expenditures are a necessary component of ongoing operations. However, free cash flow has limitations because it does not represent the residual cash flow available for discretionary expenditures. For example, free cash flow does not incorporate payments for business acquisitions.
•Non-GAAP diluted earnings per common share (“EPS”), which is diluted EPS excluding the per share, tax effected impact of acquisition-related and integration expenses, including related restructuring costs, spin-off related expenses, amortization of intangible assets, share-based compensation, imputed interest related to the Sellers' Note,
change in the fair value of acquisition contingent consideration and gain on divestituresforeign currency losses (gains), net. Non-GAAP EPS excludes net income attributable to participating securities, and related transaction costs.the per share, tax-effected impact of adjustments to net income described above reflect only those amounts that are attributable to common shareholders.
We believe that providing this additional information is useful to the reader to better assess and understand our base operating performance, especially when comparing results with previous periods and for planning and forecasting in future periods, primarily because management typically monitors the business adjusted for these items in addition to GAAP results. Management also uses these non-GAAP measures to establish operational goals and, in some cases, for measuring performance for compensation purposes. These non-GAAP financial measures exclude amortization of intangible assets. Our acquisition activities have resulted in the recognition of intangible assets, which consist primarily of client relationships, technology and trade names. Finite-lived intangible assets are amortized over their estimated useful lives and are tested for impairment when events indicate that the carrying value may not be recoverable. The amortization of intangible assets is reflected in our statements of operations. Although intangible assets contribute to our revenue generation, the amortization of intangible assets does not directly relate to the services performed for our clients. Additionally, intangible asset amortization expense typically fluctuates based on the size and timing of our acquisition activity. Accordingly, we believe excluding the amortization of intangible assets, along with the other non-GAAP adjustments, which neither relate to the ordinary course of our business nor reflect our underlying business performance, enhances our and our investors’ ability to compare our past financial performance with its current performance and to analyze underlying business performance and trends. Intangible asset amortization excluded from the related non-GAAP financial measure represents the entire amount recorded within our GAAP financial statements, and the revenue generated by the associated intangible assets has not been excluded from the related non-GAAP financial measure. Intangible asset amortization is excluded from the related non-GAAP financial measure because the amortization, unlike the related revenue, is not affected by operations of any particular period unless an intangible asset becomes impaired or the estimated useful life of an intangible asset is revised. These non-GAAP financial measures also exclude share-based compensation expense. Given the subjective assumptions and the variety of award types that companies can use when calculating share-based compensation expense, management believes this additional information allows investors to make additional comparisons between our operating results and those of our peers. As these non-GAAP financial measures are not calculated in accordance with GAAP, they may not necessarily be comparable to similarly titled measures employed by other companies. These non-GAAP financial measures should not be considered in isolation or as a substitute for the comparable GAAP measures and should be used as a complement to, and in conjunction with, data presented in accordance with GAAP.
| | | | | | | | | | | |
| Fiscal Years Ended November 30, |
| 2021 | | 2020 |
| ($ in thousands except per share amounts) |
| Revenue | $ | 5,587,015 | | | $ | 4,719,534 | |
| Foreign currency translation | (93,280) | | | — | |
| Revenue in constant currency | $ | 5,493,735 | | | $ | 4,719,534 | |
| Effect of excluding revenue of acquired and divested businesses | (37,911) | | | (66,701) | |
| Revenue in adjusted constant currency | $ | 5,455,824 | | | $ | 4,652,833 | |
| | | |
| Operating income | $ | 572,397 | | | $ | 308,761 | |
| Acquisition-related and integration expenses | 825 | | | 27,982 | |
| Spin-off related expenses | — | | | 9,483 | |
| Amortization of intangibles | 136,939 | | | 147,283 | |
| Share-based compensation | 36,762 | | | 15,914 | |
| Gain on divestitures and related transaction costs | (13,197) | | | — | |
| Non-GAAP operating income | $ | 733,726 | | | $ | 509,423 | |
| | | |
| Net income | $ | 405,577 | | | $ | 164,811 | |
| Interest expense and finance charges, net | 23,046 | | | 48,313 | |
| Provision for income taxes | 150,119 | | | 103,084 | |
| Other income, net | (6,345) | | | (7,447) | |
| Acquisition-related and integration expenses | 825 | | | 27,982 | |
| Spin-off related expenses | — | | | 9,483 | |
| Gain on divestitures and related transaction costs | (13,197) | | | — | |
| Amortization of intangibles | 136,939 | | | 147,283 | |
| Share-based compensation | 36,762 | | | 15,914 | |
| Depreciation (excluding accelerated depreciation included in acquisition-related and integration expenses above) | 140,236 | | | 129,126 | |
| Adjusted EBITDA | $ | 873,962 | | | $ | 638,549 | |
| | | |
| Operating margin | 10.2 | % | | 6.5 | % |
| Non-GAAP operating margin | 13.1 | % | | 10.8 | % |
| Adjusted EBITDA margin | 15.6 | % | | 13.5 | % |
| | | |
| Net income | $ | 405,577 | | | $ | 164,811 | |
| Acquisition-related and integration expenses | 825 | | | 27,982 | |
| Spin-off related expenses | — | | | 9,483 | |
| Amortization of intangibles | 136,939 | | | 147,283 | |
| Share-based compensation | 36,762 | | | 15,914 | |
| Gain on divestitures and related transactions costs | (13,197) | | | — | |
Income taxes related to the above (1) | (32,291) | | | (49,010) | |
| Non-GAAP net income | $ | 534,615 | | | $ | 316,463 | |
| | | | | | | | | | | |
| Fiscal Years Ended November 30, |
| 2021 | | 2020 |
| Diluted earnings per common share (“EPS”) | $ | 7.70 | | | $ | 3.19 | |
| Acquisition-related and integration expenses | 0.02 | | | 0.54 | |
| Spin-off related expenses | — | | | 0.18 | |
| Amortization of intangibles | 2.60 | | | 2.85 | |
| Share-based compensation | 0.70 | | | 0.31 | |
| Gain on divestitures and related transaction costs | (0.25) | | | — | |
Income taxes related to the above (1) | (0.62) | | | (0.94) | |
| Non-GAAP Diluted EPS | $ | 10.15 | | | $ | 6.13 | |
| | | | | | | | | | | |
| Fiscal Years Ended November 30, |
| 2023 | | 2022 |
| ($ in thousands except per share amounts) |
| Revenue | $ | 7,114,706 | | | $ | 6,324,473 | |
| Foreign currency translation | 56,041 | | | — | |
| Revenue in constant currency | $ | 7,170,747 | | | $ | 6,324,473 | |
| | | |
| Operating income | $ | 661,327 | | | $ | 640,192 | |
| Acquisition-related and integration expenses | 71,336 | | | 33,763 | |
| Amortization of intangibles | 214,832 | | | 162,673 | |
| Share-based compensation | 62,493 | | | 47,516 | |
| Non-GAAP operating income | $ | 1,009,988 | | | $ | 884,144 | |
| | | |
| Net income | $ | 313,842 | | | $ | 435,049 | |
| Net income attributable to non-controlling interest | — | | | 591 | |
| Interest expense and finance charges, net | 201,004 | | | 70,076 | |
| Provision for income taxes | 94,386 | | | 169,363 | |
| Other expense (income), net | 52,095 | | | (34,887) | |
| Acquisition-related and integration expenses | 71,336 | | | 33,763 | |
| Amortization of intangibles | 214,832 | | | 162,673 | |
| Share-based compensation | 62,493 | | | 47,516 | |
| Depreciation | 171,801 | | | 146,864 | |
| Adjusted EBITDA | $ | 1,181,789 | | | $ | 1,031,008 | |
| | | |
| Operating margin | 9.3 | % | | 10.1 | % |
| Non-GAAP operating margin | 14.2 | % | | 14.0 | % |
| Adjusted EBITDA margin | 16.6 | % | | 16.3 | % |
| | | |
| Net income | $ | 313,842 | | | $ | 435,049 | |
| Acquisition-related and integration expenses | 71,336 | | | 33,763 | |
Acquisition-related expenses included in interest expense and finance charges, net (1) | 25,556 | | | — | |
Acquisition-related expenses included in other expense (income), net (1) | 14,629 | | | — | |
| Imputed interest related to Sellers' Note included in interest expense and finance charges, net | 2,998 | | | — | |
| Change in acquisition contingent consideration included in other expense (income), net | 15,681 | | | — | |
Foreign currency losses (gains), net (3) | 14,938 | | | (38,871) | |
| Amortization of intangibles | 214,832 | | | 162,673 | |
| Share-based compensation | 62,493 | | | 47,516 | |
Income taxes related to the above (2) | (105,616) | | | (52,091) | |
| Non-GAAP net income | $ | 630,689 | | | $ | 588,039 | |
| | | | | | | | | | | |
| Fiscal Years Ended November 30, |
| 2023 | | 2022 |
| Diluted earnings per common share (“EPS”) | $ | 5.70 | | | $ | 8.28 | |
| Acquisition-related and integration expenses | 1.30 | | | 0.64 | |
Acquisition-related expenses included in interest expense and finance charges, net (1) | 0.46 | | | — | |
Acquisition-related expenses included in other expense (income), net (1) | 0.27 | | | — | |
| Imputed interest related to Sellers' Note included in interest expense and finance charges, net | 0.05 | | | — | |
| Change in acquisition contingent consideration included in other expense (income), net | 0.28 | | | — | |
Foreign currency losses (gains), net (3) | 0.27 | | | (0.74) | |
| Amortization of intangibles | 3.90 | | | 3.10 | |
| Share-based compensation | 1.14 | | | 0.90 | |
Income taxes related to the above (2) | (1.92) | | | (0.99) | |
| Non-GAAP Diluted EPS | $ | 11.45 | | | $ | 11.19 | |
(1) Included in these amounts are a) expensed Bridge Facility financing fees and interest expense associated with our senior notes, net of interest earned on the invested senior notes proceeds in advance of the Webhelp Combination, and b) losses associated with non-designated call option contracts put in place to hedge foreign exchange movements in connection with the Webhelp Combination that are included within interest expense and finance charges, net and other expense (income), net, respectively, in the consolidated statement of operations.
(2) The tax effect of taxable and deductible non-GAAP adjustments was calculated using the tax-deductibletax deductible portion of the expenses and applying the entity-specific,entity specific, statutory tax rates applicable to each item during the respective fiscal years.
(3) Foreign currency losses (gains), net are included in other expense (income), net and primarily consist of gains and losses recognized on the revaluation and settlement of foreign currency transactions and realized and unrealized gains and losses on derivative contracts that do not qualify for hedge accounting. The reported amounts for non-GAAP net income and non-GAAP EPS for the fiscal year ended November 30, 2023 include adjustments to exclude these foreign currency losses (gains), net, which were not adjusted in similar non-GAAP measures previously reported for the corresponding periods in fiscal year 2022. In order to enhance comparability, similar adjustments were made for non-GAAP net income and non-GAAP EPS for the fiscal year ended November 30, 2022.
Client Concentration
Our largest client accounted for 11.9% and 11.5% of our revenues inIn fiscal years 20212023 and 2020, respectively. The revenues that we recognize from this client are earned under multiple contracts and statements of work. No other2022, no client accounted for more than 10% of our revenues in 2021 or 2020.consolidated revenue.
Liquidity and Capital Resources
Our primary uses of cash are working capital, capital expenditures to expand our delivery footprint and enhance our technology solutions, debt repayment,repayments and acquisitions, including our recent acquisitioncombination with Webhelp in September 2023 and our acquisitions of PK.PK and ServiceSource in fiscal year 2022. Our financing needs for these uses of cash have been a combination of operating cash flows and third-party debt arrangements and, prior to the spin-off, related party borrowings from TD SYNNEX.arrangements. Our working capital needs are primarily to finance accounts receivable. When our revenue is increasing, our net investment in working capital typically increases. Conversely, when revenue is decreasing, our net investment in working capital typically decreases. To increase our market share and better serve our clients, we may further expand our operations through investments or acquisitions. We expect that such expansion would require an initial investment in working capital, personnel, facilities, and operations. These investments or acquisitions would likely be funded primarily by our existing cash and cash equivalents, available liquidity, including capacity on our debt arrangements, or the issuance of securities. We funded the Webhelp Combination through (i) proceeds from our August 2023 offering and sale of senior notes, (ii) term loan borrowings under our senior credit facility, and (iii) cash on hand.
In September 2021, considering our strong free cash flow, low leverage and adequate liquidity to support capital return to stockholders while maintaining flexibility to pursue acquisitions, our board of directors authorized a share repurchase program. Under the share repurchase program, the board of directors authorized the Company to purchaserepurchase of up to $500
$500 million of our common stock from time to time as market and business conditions warrant, including through open market purchases or Rule 10b5-1 trading plans. The share repurchase program has no termination date and may be suspended or discontinued at any time. During the fiscal yearyears ended November 30, 2021,2023 and 2022, we repurchased 138,455 aggregate709,438 and 841,979 shares, respectively, of our common stock under the share repurchase program for approximately $64.0 million and $120.8 million, respectively, in the aggregate. At November 30, 2023, approximately $290.1 million remained available for share repurchases under the existing authorization from our board of directors.
During December 2023, we repurchased 65,995 shares of our common stock for an aggregate purchase price of $25.1$6.3 million. At November 30, 2021,
During fiscal years 2023 and 2022, we had approximately $474.9 million remaining forpaid the following dividends per share repurchases under the existing program.approved by our board of directors:
| | | | | | | | | | | |
| Announcement Date | Record Date | Per Share Dividend Amount | Payment Date |
| January 18, 2022 | January 28, 2022 | $0.25 | February 8, 2022 |
| March 29, 2022 | April 29, 2022 | $0.25 | May 10, 2022 |
| June 27, 2022 | July 29, 2022 | $0.25 | August 9, 2022 |
| September 28, 2022 | October 28, 2022 | $0.275 | November 8, 2022 |
| January 19, 2023 | January 30, 2023 | $0.275 | February 10, 2023 |
| March 29, 2023 | April 28, 2023 | $0.275 | May 9, 2023 |
| June 28, 2023 | July 28, 2023 | $0.275 | August 8, 2023 |
| September 27, 2023 | October 27, 2023 | $0.3025 | November 7, 2023 |
On September 27, 2021, we announcedJanuary 24, 2024, the initiation of a quarterly cash dividend of $0.25 per share. The first quarterly dividend was paid in cash on November 2, 2021 to stockholders of record on October 22, 2021. On January 18, 2022, weCompany announced a cash dividend of $0.25$0.3025 per share to stockholders of record as of January 28, 2022,February 5, 2024, payable on February 8, 2022. The board of directors expects15, 2024.
We expect that future cash dividends will be paid on a quarterly basis. However, any decision to pay future cash dividends will be subject to our board of directors’ approval, and will depend on many factors, such as our financial condition, earnings, capital requirements, debt service obligations, restrictive covenants in our debt agreements, industry practice, legal requirements, regulatory constraints, and other factors that our board of directors deems relevant. Our ability to pay dividends will depend on
our ongoing ability to generate cash from operations and on our access to the capital markets. We cannot guarantee that we will continue to pay a dividend in the future.
Debt Arrangements
Senior Notes
On August 2, 2023, we issued and sold (i) $800 million aggregate principal amount of 6.650% Senior Notes due 2026 (the “2026 Notes”), (ii) $800 million aggregate principal amount of 6.600% Senior Notes due 2028 (the “2028 Notes”) and (iii) $550 million aggregate principal amount of 6.850% Senior Notes due 2033 (the “2033 Notes” and, together with the 2026 Notes and 2028 Notes, the “Senior Notes”). The Senior Notes were sold in a registered public offering pursuant to our Registration Statement on Form S-3, which became effective upon filing, and a Prospectus Supplement dated July 19, 2023, to a Prospectus dated July 17, 2023.
The Senior Notes were issued pursuant to, and are governed by, an indenture, dated as of August 2, 2023 (the “Base Indenture”), between Concentrix and U.S. Bank Trust Company, National Association, as trustee (the “Trustee”), as supplemented by a first supplemental indenture dated as of August 2, 2023 between Concentrix and the Trustee relating to the 2026 Notes, a second supplemental indenture dated as of August 2, 2023 between Concentrix and the Trustee relating to the 2028 Notes, and a third supplemental indenture dated as of August 2, 2023 between Concentrix and the Trustee relating to the 2033 Notes (such supplemental indentures, together with the Base Indenture, the “Indenture”). The Indenture contains customary covenants and restrictions, including
covenants that limit Concentrix Corporation’s and certain of its subsidiaries’ ability to create or incur liens on shares of stock of certain subsidiaries or on principal properties, engage in sale/leaseback transactions or, with respect to Concentrix Corporation, consolidate or merge with, or sell or lease substantially all its assets to, another person. The Indenture also provides for customary events of default.
In connection with the closing of the Webhelp Combination, we entered into cross-currency swap arrangements with certain financial institutions for a total notional amount of $500 million of the Senior Notes. In addition to aligning the currency of a portion of our interest payments to our euro-denominated cash flows, the arrangements effectively converted $250 million aggregate principal amount of the 2026 Notes and $250 million aggregate principal amount of the 2028 Notes into synthetic fixed euro-based debt at weighted average interest rates of 5.12% and 5.18%, respectively.
Bridge Facility and Restated Credit Facility
On
To provide the debt financing required to consummate the Webhelp Combination, we entered into the Bridge Commitment Letter, under which certain financing institutions committed to provide a 364-day bridge loan facility in an aggregate principal amount of $5,290 million consisting of (i) a $1,850 million tranche of term bridge loans (the “Term Loan Amendment Tranche”), (ii) a $1,000 million tranche of revolving commitments (the “Revolver Amendment Tranche”) and (iii) a $2,440 million tranche of term bridge loans (the “Acquisition Tranche”), each subject to the satisfaction of certain customary closing conditions, including the consummation of the Webhelp Combination.
The incurrence of the acquisition-related indebtedness that would be funded by the Acquisition Tranche of the Bridge Facility (or permanent financing in lieu thereof) and the Sellers’ Note was not permitted under our prior credit agreement dated as of October 16, 2020 (the “Prior Credit Facility”). Therefore, on April 21, 2023, we entered into an Amendment and Restatement Agreement (the “Amendment Agreement”) with the lenders party thereto, JPMorgan Chase Bank, N.A. and Bank of America, N.A. to amend and restate the Prior Credit Facility (as amended and restated, the “Restated Credit Facility”). As a senior secured credit facility, which providedresult of having entered into the Amendment Agreement, among other things, we obtained requisite lender consent to incur acquisition-related indebtedness, and pursuant to the terms of the Bridge Commitment Letter, the commitments with respect to the Term Loan Amendment Tranche and the Revolver Amendment Tranche of the Bridge Facility were each reduced to zero, and the Acquisition Tranche was reduced by approximately $294.7 million. On August 2, 2023, the remaining outstanding commitment of approximately $2.15 billion under the Bridge Commitment Letter was reduced to zero in connection with the issuance of the Senior Notes.
The Restated Credit Facility provides for the extension of a senior unsecured revolving loanscredit facility not to exceed an aggregate principal amount of up to $600 million (the “Revolver”) and$1,042.5 million. The Restated Credit Facility also provides for a senior unsecured term loan borrowings of upfacility in an aggregate principal amount not to $900exceed approximately $2,144.7 million (the “Term Loan”), of which $1,850 million was incurred upon the amendment and together withapproximately $294.7 million was drawn on a delayed draw basis (the “Delayed Draw Term Loans”) on the Revolver, the “Credit Facility”). On November 30, 2020, in connection with the spin-off, we incurred $900 million of initial Term Loan borrowingsClosing Date. Aggregate borrowing capacity under the Restated Credit Facility and $250may be increased by up to an additional $500 million of borrowings underby increasing the Securitization Facility (as defined below). Substantially allamount of the proceeds from such indebtedness, net of debt issuance costs, were transferredrevolving credit facility or by incurring additional term loans, in each case subject to TD SYNNEX on November 30, 2020 to eliminate debt owed by the Company to TD SYNNEX and in exchange for the contributionsatisfaction of certain Company trademarks from TD SYNNEX toconditions set forth in the Company. We had no outstanding borrowings on the Revolver as of November 30, 2021 and 2020.
Beginning May 31, 2021, the outstanding principal of the Term Loan was payable in quarterly installments of $11.25 million, with the unpaid balance due in full on the maturity date. We may prepay the loans under theRestated Credit Facility, at any time without penalty, other than breakage fees.including the receipt of additional commitments for such increase. During the fiscal year ended November 30, 2021,2023, we paid $200voluntarily prepaid $194.7 million of the principal balance on the Term Loan, including $166.25 millionwithout penalty, resulting in an outstanding balance at November 30, 2023 of voluntary prepayments.approximately $1,950 million.
We may request,The maturity date of the Restated Credit Facility remains December 27, 2026, subject, in the case of the revolving credit facility, to obtaining commitments from any participatingtwo one-year extensions upon our prior notice to the lenders and certain other conditions, incremental commitments to increase the amountagreement of the Revolver or Term Loan available underlenders to extend such maturity date. Due to the Credit Facility in an aggregatevoluntary prepayments previously described, no principal payment on the term loans is due until fiscal year 2026 with the remaining outstanding principal amount of up to $450 million, plus an additional amount, so long as after giving effect todue in full on the incurrence of such additional amount, our pro forma first lien leverage ratio (as defined in the Credit Facility) would not exceed 3.00 to 1.00.
Obligations under the Credit Facility are secured by substantially all of the assets of Concentrix and certain of its U.S. subsidiaries and are guaranteed by certain of its U.S. subsidiaries.maturity date.
Borrowings under the Restated Credit Facility that were LIBORbear interest, in the case of SOFR rate loans, bore interest at a per annum rate equal to the applicable LIBORSOFR rate (but not less than 0.25%0.0%), plus an applicable margin, which rangedranges from 1.25%1.125% to 2.25%
2.000%, based on the credit ratings of our consolidated leverage ratio.senior unsecured non-credit enhanced long-term indebtedness for borrowed money plus a credit spread adjustment to the SOFR rate of 0.10%. Borrowings under the Restated Credit Facility that were not LIBORare base rate loans borebear interest at a per annum rate (but not less than 1.0%) equal to (i) the greatest of (a)(A) the Federal FundsPrime Rate (as defined in the Restated Credit Facility) in effect on such day, (B) the NYFRB Rate (as defined in the Restated Credit Facility) in effect on such day plus ½ of 1.00%1.0%, (b)and (C) the rate of interest last publicly announced by Bank of America as its “prime rate” and (c) the LIBORadjusted one-month term SOFR rate plus 1.00%,1.0% per annum, plus (ii) an applicable margin, which rangedranges from 0.25%0.125% to 1.25%1.000%, based on the credit ratings of our consolidated leverage ratio. Commitments under the Revolver are subject to a commitment fee on the unused portion of the Revolver, which fee ranged from 25 to 45 basis points, based on our consolidated leverage ratio.senior unsecured non-credit enhanced long-term indebtedness for borrowed money.
The Restated Credit Facility and the Amended Credit Facility (as defined below) contain variouscontains certain loan covenants that are customary for credit facilities of this type and that restrict theour ability of Concentrix and its subsidiaries to take certain actions, including incurrence of indebtedness,the creation of liens, mergers or consolidations, dispositions of assets, repurchase or redemption of capital stock, making certain investments, entering into certain transactions with affiliates or changingchanges to the nature of our business.business, and, solely with respect to our subsidiaries, incurrence of indebtedness. In addition, the Restated Credit Facility and the Amended Credit Facility containcontains financial covenants that require us to maintain at the end of each fiscal quarter, (i) a consolidated leverage ratio (as defined in the Restated Credit Facility) not to exceed 3.75 to 1.0 (or for certain periods following certain qualified acquisitions, including the Webhelp Combination, 4.25 to 1.0) and (ii) a consolidated interest coverage ratio (as defined in the Restated Credit Facility) equal to or greater than 3.00 to 1.0. The Credit Facility and the AmendedRestated Credit Facility also containcontains various customary events of default, including payment defaults, defaults under certain other indebtedness, and a change of control of Concentrix.Concentrix Corporation.
43
Securitization Facility
On October 30, 2020, we entered into a $350 million accounts receivable securitization facility (the “Securitization Facility”) pursuant to certain agreements, including a receivables financing agreement and a receivables purchase agreement.
The Securitization Facility has a termination datethe assets of October 28, 2022. Under the Securitization Facility, Concentrix Corporation and certain of itsour U.S. based subsidiaries sell or otherwise transfer all of their accounts receivable to a special purpose bankruptcy-remote subsidiary of Concentrix that grants a security interest in the receivables to the lenders in exchange for available borrowings of up to $350 million. Borrowing availability under the Securitization Facility may be limitedand were guaranteed by our accounts receivable balances, changes in the credit ratingscertain of our clients comprising the receivables, client concentration levels in the receivables, and certain characteristics of the accounts receivable being transferred (including factors tracking performance of the accounts receivable over time).
U.S. subsidiaries. Borrowings under the Securitization Facility bear interest with respect to loans that are funded through the issuance of commercial paper at the applicable commercial paper rate plus a spread of 1.05% and, otherwise, at a per annum rate equal to the applicable LIBOR rate plus a spread of 1.15%. We are also obligated to pay a monthly undrawn fee that ranges from 30 to 37.5 basis points based on the portion of the Securitization Facility that is undrawn.
The Securitization Facility contains various affirmative and negative covenants, including a consolidated leverage ratio covenant that is consistent with thePrior Credit Facility and customary events of default, including payment defaults, defaults under certain other indebtedness, a change in control of Concentrix, and certain events negatively affecting the overall credit quality of the transferred accounts receivable.
As of November 30, 2021, we were in compliance with the debt covenants related to our debt arrangements.
Amended Credit Facility
On December 27, 2021, in connection with the closing of the acquisition of PK, we entered into an amendment of the Credit Facility (as amended, the “Amended Credit Facility”) (i) to refinance the Term Loan with a new term loan, which was fully advanced, in the aggregate outstanding principal amount of $2,100 million (the “New Term Loan”), (ii) to increase the Revolver to $1,000 million, (iii) to extend the maturity of the Credit Facility from November 30, 2025 to December 27, 2026, (iv) to replace LIBOR with SOFR as the primary reference rate used to calculate interest on the loans under the Credit Facility, and (v) to modify the commitment fee on the unused portion of the Revolver and the margins in excess of the reference rates at which the loans under the Credit Facility bear interest. The proceeds from the New Term Loan and additional borrowings on the Securitization Facility were used to repay the existing Term Loan and to finance the acquisition of PK, including the repayment of certain indebtedness of PK and the payment of fees and expenses in connection therewith.
Borrowings under the Amended Credit Facility bearbore interest, in the case of term or daily SOFR rate loans, at a per annum rate equal to the applicable SOFR rate (but not less than 0.0%), plus an adjustment of between 0.10% and 0.25% depending on the interest period of each SOFR loan, plus an applicable margin, which rangesranged from 1.25% to 2.00%, based on our consolidated leverage ratio. Borrowings under the AmendedPrior Credit Facility that are not SOFRwere base rate loans bearbore interest at a per annum rate equal to (i) the greatest of (a) the Federal Funds Rate in effect on such day plus ½ of 1.00%, (b) the rate of interest last publicly announced by Bank of America as its “prime rate” and (c) the term SOFR rate plus 1.00%, plus (ii) an applicable margin, which rangesranged from 0.25% to 1.00%, based on our consolidated leverage ratio. As amended,From August 31, 2022 through the date of the Amendment Agreement, the outstanding principal of the term loans under the Prior Credit Facility was payable in quarterly installments of $26.25 million.
At November 30, 2023 and 2022, no amounts were outstanding under our revolving credit facility.
During the fiscal year ended November 30, 2023, we voluntarily prepaid $25.0 million of the principal balance on the term loans under the Prior Credit Facility.
Securitization Facility
On July 6, 2022, we entered into an amendment to our Securitization Facility, which was initially entered into on October 30, 2020, to (i) increase the commitment fee on the unused portion of the Revolver rangeslenders to provide available borrowings from 22.5up to 30 basis points,$350 million to up to $500 million, (ii) extend the termination date of the Securitization Facility from October 28, 2022 to July 5, 2024, and (iii) replace LIBOR with SOFR as one of the reference rates used to calculate interest on borrowings under the Securitization Facility. In addition, the interest rate margins were amended, such that borrowings under the Securitization Facility that are funded through the issuance of commercial paper bear interest at the applicable commercial paper rate plus a spread of 0.70% and, otherwise, at a per annum rate equal to the applicable SOFR rate (which includes a credit spread adjustment to the SOFR rate of 0.10%), plus a spread of 0.80%.
Under the Securitization Facility, Concentrix Corporation and certain of its U.S. based onsubsidiaries sell or otherwise transfer all of their accounts receivable to a special purpose bankruptcy-remote subsidiary of Concentrix Corporation that grants a security interest in the receivables to the lenders in exchange for available borrowings of up to $500 million. Borrowing availability under the Securitization Facility may be limited by our consolidated leverage ratio.accounts
Beginning August 31, 2022,receivable balances, changes in the outstanding principalcredit ratings of our clients comprising the receivables, client concentration levels in the receivables, and certain characteristics of the New Term Loan is payable in quarterly installmentsaccounts receivable being transferred (including factors tracking performance of $26.25 million, with the unpaid balance due in full on the maturity date.accounts receivable over time).
Obligations underThe Securitization Facility contains various affirmative and negative covenants, including a consolidated leverage ratio covenant that is consistent with the AmendedRestated Credit Facility remain secured by substantially alland customary events of default, including payment defaults, defaults under certain other indebtedness, a change in control of Concentrix Corporation, and certain events negatively affecting the overall credit quality of the assetstransferred accounts receivable.
Sellers’ Note
On September 25, 2023, as part of Concentrix andthe consideration for the Webhelp Combination, we issued the Sellers’ Note in the aggregate principal amount of €700 million to certain of its U.S. subsidiaries and are guaranteed by certain of its U.S. subsidiaries. There were no changesSellers (the “Noteholders”). Pursuant to the Company’s various loanSellers’ Note, the unpaid principal amount outstanding accrues interest at a rate of two percent (2%) per annum, and all principal and accrued interest will be due and payable on September 25, 2025. The stated rate of interest is below our expected borrowing rate. As a result, we discounted the Sellers’ Note by €31,500. The discounted value is being amortized into interest expense over the two-year term.
As of November 30, 2023 and 2022, we were in compliance with the debt covenants including financials covenants, under the Amended Credit Facility.related to our debt arrangements.
Cash Flows – Fiscal Years Ended November 30, 20212023 and 20202022
The following summarizes our cash flows for the fiscal years ended November 30, 20212023 and 2020,2022, as reported in our consolidated statement of cash flows in the accompanying consolidated financial statements.
| | Fiscal Years Ended November 30, | | | Fiscal Years Ended November 30, |
| 2023 | | | 2023 | | 2022 |
| | Fiscal Years Ended November 30, |
| 2021 | | 2020 |
| | ($ in thousands) |
| ($ in thousands) | |
| ($ in thousands) | |
| ($ in thousands) | |
| Net cash provided by operating activities | Net cash provided by operating activities | $ | 514,178 | | | $ | 507,614 | |
| Net cash used in investing activities | Net cash used in investing activities | (78,650) | | | (109,216) | |
| Net cash used in financing activities | (401,871) | | | (335,224) | |
| Net cash provided by financing activities | |
| Effect of exchange rate changes on cash, cash equivalents and restricted cash | Effect of exchange rate changes on cash, cash equivalents and restricted cash | (6,998) | | | 9,663 | |
| Net increase in cash, cash equivalents and restricted cash | $ | 26,659 | | | $ | 72,837 | |
| Net increase (decrease) in cash, cash equivalents and restricted cash | |
| Cash, cash equivalents and restricted cash at beginning of year | Cash, cash equivalents and restricted cash at beginning of year | 156,351 | | | 83,514 | |
| Cash, cash equivalents and restricted cash at end of year | Cash, cash equivalents and restricted cash at end of year | $ | 183,010 | | | $ | 156,351 | |
Operating Activities
Net cash provided by operating activities was $514.2$678.0 million for fiscal year 20212023 in comparison to $507.6$600.7 million for fiscal year 2020.2022. The increase in net cash provided by operating activities over the prior year was primarily related to the increase in net income, partially offset byfavorable changes in working capital and operating assets and liabilities over the prior year period, including an increase in accounts receivable andpartially offset by a decrease in payables.net income.
Investing Activities
Net cash used in investing activities for fiscal year 20212023 was $78.7 million in comparison to $109.2 million in fiscal year 2020.$2,109.2 million. The decrease in net cash used in investing activities overconsisted primarily of the prior year primarily related to $73.7aggregate cash paid in connection with the Webhelp Combination of approximately $1,914.1 million, purchases of proceeds in fiscal year 2021 from divestitures mainly attributable to the saleproperty and equipment of CIS$180.5 million, and a decreasepremium paid for call options entered into in capital expendituresconnection with the Webhelp Combination of $22.3 million from fiscal year 2020. These decreases were partially offset by proceeds of $67.7 million in fiscal year 2020 related to a loan to a non-Concentrix subsidiary of our former parent as part of its centralized treasury operations.
Financing Activities
Net cash used in financing activities in fiscal year 2021 was $401.9 million, consisting primarily of principal payments of $200.0 million under the Credit Facility, net payments of $145.0 million under the Securitization Facility, repurchases of common stock, including repurchases under our share repurchase program and tax withholdings of $57.5 million on vestings of share-based awards, and dividends of $13.1$14.6 million.
Net cash used in financing activities in fiscal year 2020 was $335.2 million, consisting of third-party borrowings of $900 million under the Credit Facility and $250 million under the Securitization Facility, more than offset by $1,476.7 million in repayments on borrowings from TD SYNNEX and debt issuance costs related to these facilities.
Net cash used by investing activities in fiscal year 2022 was $1,839.3 million, consisting primarily of the aggregate cash paid in connection with the acquisitions of PK and ServiceSource of $1,698.3 million and purchases of property and equipment of $140.0 million.
Financing Activities
Net cash provided by financing activities in fiscal year 2023 was $1,802.7 million, consisting primarily of proceeds, before expenses, of $2,137.0 million from the issuance of the Senior Notes in August 2023, proceeds from the Delayed Draw Term Loans of $294.7 million, partially offset by principal payments of $194.7 million made on the Term Loan, principal payments of $25.0 million made on term loan borrowings under our Prior Credit Facility, net repayments of $228.0 million under our Securitization Facility, repurchases of our common stock of $81.2 million, including repurchases under our share repurchase program and shares withheld upon the vesting of share-based awards to satisfy tax withholding obligation, dividends of $63.5 million, and cash paid of $30.5 million related to debt issuance costs for the Senior Notes, financing fees for the Bridge Facility and amendment fees related to our Restated Credit Facility.
Net cash provided by financing activities in fiscal year 2022 was $1,237.5 million, consisting primarily of net proceeds of $1,400.0 million from the refinancing of the term loan under our Prior Credit Facility and net proceeds of $251.5 million from borrowings under our Securitization Facility. The increases were offset primarily by payments of $225.0 million made on the term loan borrowings, repurchases of our common stock of $133.3 million, including repurchases under our share repurchase program and shares withheld upon the vesting of share-based awards to satisfy tax withholding obligations, and dividends paid of $53.4 million.
We believe our current cash balances and credit availability are enough to support our operating activities for at least the next twelve months.
Free Cash Flow (a non-GAAP measure)
| | Fiscal Years Ended November 30, | | | Fiscal Years Ended November 30, |
| 2023 | | | 2023 | | 2022 |
| | Fiscal Years Ended November 30, |
| 2021 | | 2020 |
| | ($ in thousands) |
| ($ in thousands) | |
| ($ in thousands) | |
| ($ in thousands) | |
| Net cash provided by operating activities | Net cash provided by operating activities | $ | 514,178 | | | $ | 507,614 | |
| Purchases of property and equipment | Purchases of property and equipment | (149,079) | | | (171,332) | |
| Free cash flow (a non-GAAP measure) | Free cash flow (a non-GAAP measure) | $ | 365,099 | | | $ | 336,282 | |
Our free cash flow was $365.1$497.5 million in fiscal year 2021,2023, compared to $336.3$460.7 million in fiscal year 2020.2022. The increase in free cash flow in fiscal year 20212023 over fiscalthe prior year 2020 primarily reflects increased net cash provided by operating activities as a result of thepartially offset by an increase in net income and a decrease in capital expenditures.
Capital Resources
As of November 30, 2021,2023, we had total liquidity of $1,027$1,709.3 million, which includes undrawn capacity on our revolving credit facility of $600$1,042.5 million, on the Credit Facility, undrawn capacity of $245$371.5 million on theunder our Securitization Facility, and cash and cash equivalents.
Our cash and cash equivalents totaled $182.0$295.3 million and $152.7$145.4 million as of November 30, 20212023 and 2020,2022, respectively. Of our total cash and cash equivalents, 87%99% and 89% was97% were held by our non-U.S. legal entities as of November 30, 20212023 and 2020,2022, respectively. The cash and cash equivalents held by our non-U.S. legal entities are no longer subject to U.S. federal tax on repatriation into the United States. RepatriationStates; repatriation of some non-U.S. balances is restricted by local laws. Historically, we have fully utilized and reinvested all non-U.S. cash to fund our international operations and expansion;expansions; however, the Company haswe have recorded deferred tax liabilities related to non-U.S. withholding taxes on the earnings of certain previously acquired non-U.S. entities that are likely to be repatriated in
the future. If in the future our intentions change, and we repatriate the cash back to the United States, we will report in our consolidated financial statements the impact of the state and withholding taxes depending upon the planned timing and manner of such repatriation. Presently, we believe we have sufficient resources, cash flow and liquidity within the United States to fund current and expected future working capital, investment and other general corporate funding requirements.
We believe that our available cash and cash equivalents balances, the cash flows expected to be generated from operations, and our sources of liquidity will be sufficient to satisfy our current and planned working capital and investment needs for the next twelve months. We also believe that our longer-term working capital, planned capital expenditures and other general corporate funding requirements will be satisfied through cash flows from operations and, to the extent necessary, from our borrowing facilities and future financial marketfinancing activities.
Material Cash Requirements, including Contractual Obligations to Third Parties
The following table summarizes our material cash requirements from known contractual or other obligations as of November 30, 20212023 that are not disclosed elsewhere in this Annual Report on Form 10-K:
| | Payments Due by Period | | | Payments Due by Period |
| Total | | | Total | | Less than 1 Year | | 1 - 3 Years | | 3 - 5 Years | | >5 Years |
| | Payments Due by Period |
| Total | | Less than 1 Year | | 1 - 3 Years | | 3 - 5 Years | | >5 Years |
| | (in thousands) |
| (in thousands) | |
| (in thousands) | |
| (in thousands) | |
| Certain Contractual Obligations: | Certain Contractual Obligations: | |
| Interest on financing agreements (a) | Interest on financing agreements (a) | $ | 43,070 | | | $ | 11,603 | | | $ | 21,000 | | | $ | 10,467 | | | $ | — | |
Interest on financing agreements (a) | |
Interest on financing agreements (a) | |
| Defined benefit plan funding (b) | Defined benefit plan funding (b) | 62,580 | | | — | | | 4,040 | | | 10,020 | | | 48,520 | |
(a) Cash obligations for required interest requirement related topayments on our variable-rate debt obligations at the current rates as of November 30, 2021.2023.
(b) Includes projected contributions to achieve minimum funding objectives for our cash balance pension plan.
As of November 30, 2021,2023, we have established a reserve of $56.3$87.9 million for unrecognized tax benefits. As we are unable to reasonably predict the timing of settlement related to these unrecognized tax benefits, the table above excludes such liabilities.
We currently expect our 20222024 capital expenditures to be approximately $170$225 million to $180$255 million, which includes investments into support our growth initiatives and maintenance capital expenditures.
ITEM 7A. QUANTITATIVE AND QUALITATIVE DISCLOSURES ABOUT MARKET RISK
Market Risk
We are and will be exposed to a variety of market risks, including the effects of changes in foreign currency exchange rates and interest rates. Market risk is the potential loss arising from changes in market rates and prices. Our risk management strategy includes managing these risks through our regular operating and financing activities and, when appropriate, through the use of derivative financial instruments. We utilize derivative financial instruments to hedge economic exposures, as well as reduce earnings and cash flow volatility resulting from shifts in market rates. In using derivative financial instruments to hedge our exposures to changes in exchange rates, we expose ourselves to counterparty credit risk. We manage our exposure to counterparty credit risk by entering into derivative financial instruments with investment grade-rated institutions that can be expected to perform fully under the terms of the agreements and by diversifying the number of financial institutions with which we enter into such agreements. There can be no guarantee that the risk management activities that we have entered into will be sufficient to fully offset market risk or reduce earnings and cash flow volatility resulting from shifts in market rates. See Note 7 of the consolidated financial statements included elsewhere in this Annual Report on Form 10-K for additional discussion of our financial risk management.
Foreign Currency Risk
While approximately 62%64% of our revenue is priced in U.S. dollars, we recognize a substantial amount of revenue under contracts that are denominated in euros, British pounds, Australian dollars and Japanese yen, among other currencies. A significant increase in the value of the U.S. dollar relative to these currencies may have a material adverse effect on the value of those services when translated into U.S. dollars.
We serve many of our U.S.-based, European and British clients from our CX delivery centers located around the world. As a result, a substantial portion of the costs to deliver these services are denominated in the local currency of the country where the services are performed. This creates a foreign exchange exposure for us. As of November 30, 2021,2023, we have hedged a portion of our exposure related to the anticipated cash flow requirements denominated in certain foreign currencies by entering into hedging contracts with institutions to acquire a total of PHP 34,970.0040,640.0 million at a fixed price of $686.7$719.8 million at various dates through November 2023;2025; and INR 18,350.0022,440.0 million at a fixed price of $233.3$265.2 million at various dates through November 2023.2025. The fair value of these derivative instruments as of November 30, 20212023 is presented in Note 8 of the consolidated financial statements included elsewhere in this Annual Report on Form 10-K. The potential loss in fair value at November 30, 20212023 for such contracts resulting from a hypothetical 10% adverse change in the underlying foreign currency exchange rates is approximately $91.8$99.7 million. This loss would be substantially mitigated by corresponding gains on the underlying foreign currency exposures.
Other foreign currency exposures arise from transactions denominated in a currency other than the functional currency. We periodically enter into hedging contracts that are not denominated as hedges. The purpose of these derivative instruments is to protect us againstmitigate the risk of foreign currency exposure related to receivables, payables and intercompany transactions that are denominated in currencies that are different from the functional currencies of our respective legal entities that are party to the transactions. As of November 30, 2021,2023, the fair value of these derivatives not designated as hedges was a net payable of $2.5$4.8 million.
Interest Rate Risk
At November 30, 2021, all of2023, our outstanding debt under theour Restated Credit Facility and our Securitization Facility is variable rate debt, which exposes the Company to changes in interest rates. Holding other variables constant, including the total amount of outstanding indebtedness, a one hundred basis point increase in interest rates on our variable-rate debt would cause an estimated increase in interest expense of approximately $8.1$20.8 million per year.
ITEM 8. FINANCIAL STATEMENTS AND SUPPLEMENTARY DATA
Index to Consolidated Financial Statements
| | | | | |
| Page |
| Audited Consolidated Financial Statements of Concentrix Corporation: | |
| |
| |
| |
| |
| |
| |
| |
| |
Management’s Report on Internal Control over Financial Reporting
Our management is responsible for establishing and maintaining adequate internal control over financial reporting, as such term is defined in Rule 13a-15(f) under the Securities Exchange Act Rules 13a-15(f).of 1934, as amended. Our internal control over financial reporting is designed to provide reasonable assurance regarding the reliability of financial reporting and the preparation of financial statements for external purposes in accordance with U.S. generally accepted accounting principles. Our internal control over financial reporting includes those policies and procedures that (i) pertain to the maintenance of records that, in reasonable detail, accurately and fairly reflect the transactions and dispositions of our assets; (ii) provide reasonable assurance that transactions are recorded as necessary to permit preparation of financial statements in accordance with generally accepted accounting principles, and that receipts and expenditures of ours are being made only in accordance with authorizations of management and directors; and (iii) provide reasonable assurance regarding prevention or timely detection of unauthorized acquisition, use, or disposition of our assets that could have a material effect on the financial statements.
Because of its inherent limitations, internal control over financial reporting may not prevent or detect misstatements. Also, projections of any evaluation of effectiveness to future periods are subject to the risk that controls may become inadequate because of changes in conditions, or that the degree of compliance with the policies or procedures may deteriorate.
Under the supervision and with the participation of our management, including our principal executive officer and principal financial officer, we conducted an evaluation of the effectiveness of our internal control over financial reporting based on criteria established in Internal Control – Integrated Framework (2013) issued by the Committee of Sponsoring Organizations of the Treadway Commission. Our evaluation of internal control over financial reporting did not include internal controls of Webhelp, which we acquired during the fourth quarter of fiscal year 2023. The acquired Webhelp operations represented 48.7% of our total assets (of which 33.3% represented goodwill and intangible assets included within the scope of the assessment) and 8.1% of our total revenue as of and for the fiscal year ended November 30, 2023. We have included the financial results of the acquired operations in the consolidated financial statements from the date of acquisition. Based on this assessment, our management has concluded that, as of November 30, 2021,2023, our internal control over financial reporting was effective at the reasonable assurance level based on those criteria.
The effectiveness of our internal control over financial reporting as of November 30, 20212023 has been audited by KPMG LLP, an independent registered public accounting firm, as stated in their report which appears beginning on the following page of this Annual Report on Form 10-K.
Report of Independent Registered Public Accounting Firm
To the Stockholders and Board of Directors
Concentrix Corporation:
Opinions on the Consolidated Financial Statements and Internal Control Over Financial Reporting
We have audited the accompanying consolidated balance sheets of Concentrix Corporation and subsidiaries (the Company) as of November 30, 20212023 and 2020,2022, the related consolidated statements of operations, comprehensive income, stockholders’ equity, and cash flows for each of the years in the three-year period ended November 30, 20212023, and the related notes and financial statement schedule II:Schedule II - Valuation and Qualifying Accounts (collectively, the consolidated financial statements). We also have audited the Company’s internal control over financial reporting as of November 30, 2021,2023, based on criteria established in Internal Control – Integrated Framework (2013) issued by the Committee of Sponsoring Organizations of the Treadway Commission.
In our opinion, the consolidated financial statements referred to above present fairly, in all material respects, the financial position of the Company as of November 30, 20212023 and 2020,2022, and the results of its operations and its cash flows for each of the years in the three-year period ended November 30, 2021,2023, in conformity with U.S. generally accepted accounting principles. Also in our opinion, the Company maintained, in all material respects, effective internal control over financial reporting as of November 30, 20212023 based on criteria established in Internal Control – Integrated Framework (2013) issued by the Committee of Sponsoring Organizations of the Treadway Commission.Commission.
ChangeThe Company acquired Webhelp during fiscal year 2023, and management excluded from its assessment of the effectiveness of the Company’s internal control over financial reporting as of November 30, 2023, Webhelp’s internal control over financial reporting associated with total assets of 48.7% (of which 33.3% represented goodwill and intangible assets included within the scope of the assessment) and total revenue of 8.1% included in Accounting Principle
As discussed in Note 2 to the consolidated financial statements of the Company changed its method of accounting for leases as of December 1, 2019 due toand for the adoptionyear ended November 30, 2023. Our audit of Accounting Standards Codification Topic 842, Leases.internal control over financial reporting of the Company also excluded an evaluation of the internal control over financial reporting of Webhelp.
Basis for Opinions
The Company’s management is responsible for these consolidated financial statements, for maintaining effective internal control over financial reporting, and for its assessment of the effectiveness of internal control over financial reporting, included in the accompanying Management’sManagement's Report on Internal Control over Financial Reporting. Our responsibility is to express an opinion on the Company’s consolidated financial statements and an opinion on the Company’s internal control over financial reporting based on our audits. We are a public accounting firm registered with the Public Company Accounting Oversight Board (United States) (PCAOB) and are required to be independent with respect to the Company in accordance with the U.S. federal securities laws and the applicable rules and regulations of the Securities and Exchange Commission and the PCAOB.
We conducted our audits in accordance with the standards of the PCAOB. Those standards require that we plan and perform the audits to obtain reasonable assurance about whether the consolidated financial statements are free of material misstatement, whether due to error or fraud, and whether effective internal control over financial reporting was maintained in all material respects.
Our audits of the consolidated financial statements included performing procedures to assess the risks of material misstatement of the consolidated financial statements, whether due to error or fraud, and performing procedures that respond to those risks. Such procedures included examining, on a test basis, evidence regarding the amounts and disclosures in the consolidated financial statements. Our audits also included evaluating the accounting principles used and significant estimates made by management, as well as evaluating the overall presentation of the consolidated financial statements. Our audit of internal control over financial reporting included obtaining an understanding of internal control over financial reporting, assessing the risk that a material weakness exists, and testing and evaluating the design and operating effectiveness of internal control based on the assessed risk. Our
audits also included performing such other procedures as we considered necessary in the circumstances. We believe that our audits provide a reasonable basis for our opinions.
Definition and Limitations of Internal Control Over Financial Reporting
A company’s internal control over financial reporting is a process designed to provide reasonable assurance regarding the reliability of financial reporting and the preparation of financial statements for external purposes in accordance with generally accepted accounting principles. A company’s internal control over financial reporting includes those policies and procedures that (1) pertain to the maintenance of records that, in reasonable detail, accurately and fairly reflect the transactions and dispositions of the assets of the company; (2) provide reasonable assurance that transactions are recorded as necessary to permit preparation of financial statements in accordance with generally accepted accounting principles, and that receipts and expenditures of the company are being made only in accordance with authorizations of management and directors of the company; and (3) provide reasonable assurance regarding prevention or timely detection of unauthorized acquisition, use, or disposition of the company’s assets that could have a material effect on the financial statements.
Because of its inherent limitations, internal control over financial reporting may not prevent or detect misstatements. Also, projections of any evaluation of effectiveness to future periods are subject to the risk that controls may become inadequate because of changes in conditions, or that the degree of compliance with the policies or procedures may deteriorate.
Critical Audit MatterMatters
The critical audit mattermatters communicated below is a matterare matters arising from the current period audit of the consolidated financial statements that waswere communicated or required to be communicated to the audit committee and that: (1) relatesrelate to accounts or disclosures that are material to the consolidated financial statements and (2) involved our especially challenging, subjective, or complex judgments. The communication of a critical audit mattermatters does not alter in any way our opinion on the consolidated financial statements, taken as a whole, and we are not, by communicating the critical audit mattermatters below, providing separate opinions on the critical audit mattermatters or on the accounts or disclosures to which they relate.
Fair value of acquired intangible assets
As discussed in Note 3 to the consolidated financial statements, on September 25, 2023, the Company acquired Webhelp in a transaction accounted for as a business combination. As a result of the transaction, the Company recognized an acquired customer relationships intangible asset associated with the generation of future income from Webhelp’s existing customers. The acquisition-date fair value of the customer relationships intangible asset was $1,882 million.
We identified the evaluation of the acquisition-date fair value of the customer relationships intangible asset as a critical audit matter. A high degree of subjective auditor judgment was required to evaluate the key assumptions within the discounted cash flows model used to estimate the acquisition-date fair value of the customer relationships intangible asset, specifically the revenue growth rate, margin, attrition rate, and discount rate. There was limited observable market information related to these assumptions and the estimated acquisition-date fair value of the customer relationships intangible asset was sensitive to minor changes in such amounts. Additionally, the audit effort associated with the estimate required specialized skills and knowledge.
The following are the primary procedures we performed to address this critical audit matter. We evaluated the design and tested the operating effectiveness of certain internal controls related to the Company’s acquisition-date valuation process, including controls over the key assumptions noted above. We evaluated the Company’s revenue growth rate and margin assumptions by comparing them to Webhelp’s pre-acquisition budget and the Company’s historical financial results. We evaluated the projected attrition rate assumption by comparing it relates.to historical attrition experienced by Webhelp and to the attrition rate assumption used in previous acquisitions made by the Company. We involved valuation professionals with specialized skills and knowledge who assisted in:
•evaluating the discount rate used by comparing it to a discount rate that was developed using publicly available market data for comparable entities
•comparing the revenue growth rate, margin, and attrition rate to those of comparable entities
•validating the mathematical accuracy of the Company’s calculations to determine the discount rate and attrition rate
Sufficiency of audit evidence over revenue
As discussed in Notes 2 and 10 to the consolidated financial statements, and presented in the consolidated statementsstatement of operations, the Company reported revenue of $5,587,015 thousand$7,115 million for the fiscal year ended November 30, 2021.2023. Revenue is generated primarily from the provision of Customer Experience solutions and technology to its clients. The Company recognizes revenue from contracts, and accounts for a contract with a client, when it has written approval, the contract is committed, the rights of the parties, including payment terms, are identified, the contract has commercial substance, and consideration is probable of collection. The Company operates in over 4070 countries across six continents, with significant concentrations in the Philippines, India, Brazil, the United States, Turkey, Colombia, Egypt, the United Kingdom, throughout Europe,Morocco, China, and Japan.elsewhere throughout EMEA, Latin America, and Asia-Pacific.
We identified the evaluation of the sufficiency of audit evidence over revenue as a critical audit matter. Evaluating the sufficiency of audit evidence obtained required especially subjective auditor judgment because of the geographical dispersion of the Company’s revenue generating activities. This included determining the locations for which procedures were performed and evaluating the evidence obtained over revenue.
The following are the primary procedures we performed to address this critical audit matter. We applied auditor judgment to determine the nature and extent of procedures to be performed over revenue, including the determination of the locations at which those procedures were performed. For each location for which procedures were performed, we, where applicable, evaluated the design and tested the operating effectiveness of certain internal controls related to the revenue process, including controls related to the appropriate recording of revenue. For a sample of transactions, we compared the amounts recognized as revenue for consistency with relevant underlying documentation, including contracts and other third-party evidence. We evaluated the sufficiency of the audit evidence obtained over revenue by assessing the results of the procedures performed, including the appropriateness of the nature and extent of such evidence.
/s/ KPMG LLP
We have served as the Company’s auditor since 2019.
Cincinnati, Ohio
January 28, 202229, 2024
CONCENTRIX CORPORATION
CONSOLIDATED BALANCE SHEETS
(currency and share amounts in thousands, except par value)
| | November 30, 2021 | | November 30, 2020 |
| November 30, 2023 | | | November 30, 2023 | | November 30, 2022 |
| ASSETS | ASSETS | | | |
| Current assets: | Current assets: | |
| Current assets: | |
| Current assets: | |
| Cash and cash equivalents | |
| Cash and cash equivalents | |
| Cash and cash equivalents | Cash and cash equivalents | $ | 182,038 | | | $ | 152,656 | |
| Accounts receivable, net | Accounts receivable, net | 1,207,953 | | | 1,081,481 | |
| Other current assets | Other current assets | 153,074 | | | 189,239 | |
| Total current assets | Total current assets | 1,543,065 | | | 1,423,376 | |
| Property and equipment, net | Property and equipment, net | 407,144 | | | 451,649 | |
| Goodwill | Goodwill | 1,813,502 | | | 1,836,050 | |
| Intangible assets, net | Intangible assets, net | 655,528 | | | 798,959 | |
| Deferred tax assets | Deferred tax assets | 48,413 | | | 47,423 | |
| Other assets | Other assets | 578,715 | | | 620,099 | |
| Total assets | Total assets | $ | 5,046,367 | | | $ | 5,177,556 | |
| | LIABILITIES AND EQUITY | LIABILITIES AND EQUITY | |
| LIABILITIES AND EQUITY | |
| LIABILITIES AND EQUITY | |
| Current liabilities: | |
| Current liabilities: | |
| Current liabilities: | Current liabilities: | |
| Accounts payable | Accounts payable | $ | 129,359 | | | $ | 140,575 | |
| Accounts payable | |
| Accounts payable | |
| Current portion of long-term debt | Current portion of long-term debt | — | | | 33,750 | |
| Payable to former parent | — | | | 22,825 | |
| Accrued compensation and benefits | Accrued compensation and benefits | 453,434 | | | 419,715 | |
| Other accrued liabilities | Other accrued liabilities | 351,642 | | | 371,072 | |
| Income taxes payable | Income taxes payable | 33,779 | | | 20,725 | |
| Total current liabilities | Total current liabilities | 968,214 | | | 1,008,662 | |
| Long-term debt, net | Long-term debt, net | 802,017 | | | 1,111,362 | |
| Other long-term liabilities | Other long-term liabilities | 546,410 | | | 601,887 | |
| Deferred tax liabilities | Deferred tax liabilities | 109,471 | | | 153,560 | |
| Total liabilities | Total liabilities | 2,426,112 | | | 2,875,471 | |
| Commitments and contingencies (Note 15) | 0 | | 0 |
| Commitments and contingencies (Note 14) | | Commitments and contingencies (Note 14) | | | |
| Stockholders’ equity: | Stockholders’ equity: | |
| Preferred stock, $0.0001 par value, 10,000 shares authorized as of November 30, 2021; no shares issued and outstanding as of November 30, 2021 | — | | | — | |
| Common stock, $0.0001 par value, 250,000 shares authorized as of November 30, 2021; 51,927 shares issued and 51,594 shares outstanding as of November 30, 2021 | 5 | | | — | |
| Preferred stock, $0.0001 par value, 10,000 shares authorized and no shares issued and outstanding as of November 30, 2023 and 2022, respectively | |
| Preferred stock, $0.0001 par value, 10,000 shares authorized and no shares issued and outstanding as of November 30, 2023 and 2022, respectively | |
| Preferred stock, $0.0001 par value, 10,000 shares authorized and no shares issued and outstanding as of November 30, 2023 and 2022, respectively | |
| Common stock, $0.0001 par value, 250,000 shares authorized; 67,883 and 52,367 shares issued as of November 30, 2023 and 2022, respectively, and 65,734 and 51,096 shares outstanding as of November 30, 2023 and 2022, respectively | |
| Additional paid-in capital | Additional paid-in capital | 2,355,767 | | | — | |
| Treasury stock, 333 shares as of November 30, 2021 | (57,486) | | | — | |
| Treasury stock, 2,149 and 1,271 shares as of November 30, 2023 and 2022, respectively | |
| Retained earnings | Retained earnings | 392,495 | | | — | |
| Former parent company investment | — | | | 2,305,899 | |
| Accumulated other comprehensive loss | Accumulated other comprehensive loss | (70,526) | | | (3,814) | |
| Total stockholders’ equity | Total stockholders’ equity | 2,620,255 | | | 2,302,085 | |
| Total liabilities and stockholders’ equity | Total liabilities and stockholders’ equity | $ | 5,046,367 | | | $ | 5,177,556 | |
(Amounts may not add due to rounding)
The accompanying notes are an integral part of these consolidated financial statements.
CONCENTRIX CORPORATION
CONSOLIDATED STATEMENTS OF OPERATIONS
(currency and share amounts in thousands, except per share amounts)
| | Fiscal Years Ended November 30, |
| 2021 | | 2020 | | 2019 |
| Fiscal Years Ended November 30, | | | Fiscal Years Ended November 30, |
| 2023 | | | 2023 | | 2022 | | 2021 |
| Revenue | Revenue | $ | 5,587,015 | | | $ | 4,719,534 | | | $ | 4,707,912 | |
| Cost of revenue | Cost of revenue | 3,617,527 | | | 3,058,009 | | | 2,959,464 | |
| Gross profit | Gross profit | 1,969,488 | | | 1,661,525 | | | 1,748,448 | |
| Selling, general and administrative expenses | Selling, general and administrative expenses | 1,397,091 | | | 1,352,764 | | | 1,454,116 | |
| Operating income | Operating income | 572,397 | | | 308,761 | | | 294,332 | |
| Interest expense and finance charges, net | Interest expense and finance charges, net | 23,046 | | | 48,313 | | | 92,196 | |
| Other expense (income), net | Other expense (income), net | (6,345) | | | (7,447) | | | (2,280) | |
| Income before income taxes | Income before income taxes | 555,696 | | | 267,895 | | | 204,416 | |
| Provision for income taxes | Provision for income taxes | 150,119 | | | 103,084 | | | 87,252 | |
| Net income | $ | 405,577 | | | $ | 164,811 | | | $ | 117,164 | |
| Net income before non-controlling interest | |
| Less: Net income attributable to non-controlling interest | |
| Net income attributable to Concentrix Corporation | |
| | Earnings per common share: | |
| Earnings per common share: | |
| Earnings per common share: | Earnings per common share: | | | | | |
| Basic | Basic | $ | 7.78 | | | $ | 3.19 | | | $ | 2.27 | |
| Diluted | $ | 7.70 | | | $ | 3.19 | | | $ | 2.27 | |
| Weighted-average common shares outstanding | | | | | |
| Basic | |
| Basic | Basic | 51,355 | | 51,602 | | 51,602 |
| Diluted | Diluted | 51,914 | | 51,602 | | 51,602 |
| Weighted-average common shares outstanding: | |
| Basic | |
| Basic | |
| Basic | | 53,801 | | 51,353 | | 51,355 |
| Diluted | | Diluted | 54,010 | | 51,740 | | 51,914 |
(Amounts may not add due to rounding)
The accompanying notes are an integral part of these consolidated financial statements.
CONCENTRIX CORPORATION
CONSOLIDATED STATEMENTS OF COMPREHENSIVE INCOME
(currency in thousands)
| | | | | | | | | | | | | | | | | |
| Fiscal Years Ended November 30, |
| 2021 | | 2020 | | 2019 |
| Net income | $ | 405,577 | | | $ | 164,811 | | | $ | 117,164 | |
| Other comprehensive income (loss): | | | | | |
| Unrealized gains (losses) of defined benefit plans, net of taxes of $(2,761), $3,749 and $5,909 for fiscal years ended November 30, 2021, 2020 and 2019, respectively | 15,839 | | | (8,644) | | | (28,289) | |
| Reclassification of net losses to net income, net of tax of $0 for fiscal years ended November 30, 2021, 2020 and 2019, respectively | — | | | — | | | 1,791 | |
| Total change in unrealized gains (losses) of defined benefit plans, net of taxes | 15,839 | | | (8,644) | | | (26,498) | |
| Unrealized gains (losses) on cash flow hedges during the period, net of taxes of $2,709, $(11,478), $(5,197) for fiscal years ended November 30, 2021, 2020, and 2019, respectively | (8,396) | | | 34,508 | | | 15,574 | |
| Reclassification of net gains on cash flow hedges to net income, net of taxes of $7,498, $7,581, and $5,891 for fiscal years ended November 30, 2021, 2020, and 2019, respectively | (22,246) | | | (22,792) | | | (17,493) | |
| Total change in unrealized gains (losses) on cash flow hedges, net of taxes | (30,642) | | | 11,716 | | | (1,919) | |
| Foreign currency translation adjustments, net of taxes of $0 for fiscal years ended November 30, 2021, 2020 and 2019, respectively | (51,909) | | | 43,196 | | | 17,534 | |
| Other comprehensive income (loss) | (66,712) | | | 46,268 | | | (10,883) | |
| Comprehensive income | $ | 338,865 | | | $ | 211,079 | | | $ | 106,281 | |
| | | | | | | | | | | | | | | | | |
| Fiscal Years Ended November 30, |
| 2023 | | 2022 | | 2021 |
| Net income before non-controlling interest | $ | 313,842 | | | $ | 435,640 | | | $ | 405,577 | |
| Other comprehensive income (loss): | | | | | |
| Unrealized gains (losses) of defined benefit plans, net of taxes of $(894), $(4,329), and $(2,761) for fiscal years ended November 30, 2023, 2022 and 2021, respectively | (2,800) | | | 14,274 | | | 15,839 | |
| Unrealized gains (losses) on hedges during the period, net of taxes of $(4,938), $15,427, and $2,709 for fiscal years ended November 30, 2023, 2022 and 2021, respectively | 10,610 | | | (45,464) | | | (8,396) | |
| | | | | |
| Reclassification of net (gains) losses on hedges to net income, net of taxes of $(4,594), $(9,276), and $7,498 for fiscal years ended November 30, 2023, 2022 and 2021, respectively | 13,793 | | | 26,953 | | | (22,246) | |
| Total change in unrealized gains (losses) on hedges, net of taxes | 24,403 | | | (18,511) | | | (30,642) | |
| Foreign currency translation adjustments, net of taxes of $0 for fiscal years ended November 30, 2023, 2022 and 2021, respectively | 102,419 | | | (240,986) | | | (51,909) | |
| Other comprehensive income (loss) | 124,022 | | | (245,223) | | | (66,712) | |
| Comprehensive income | 437,864 | | | 190,417 | | | 338,865 | |
| Less: Comprehensive income attributable to non-controlling interest | — | | | 591 | | | — | |
| Comprehensive income attributable to Concentrix Corporation | $ | 437,864 | | | $ | 189,826 | | | $ | 338,865 | |
(Amounts may not add due to rounding)
The accompanying notes are an integral part of these consolidated financial statements.
CONCENTRIX CORPORATION
CONSOLIDATED STATEMENTS OF STOCKHOLDERS’ EQUITY
(currency and share amounts in thousands)
| | Common Stock | | Treasury stock | |
| Shares | | Amount | | Additional paid-in capital | | Shares | | Amount | | Retained earnings | | Former parent company investment | | Accumulated other comprehensive income (loss) | | Total |
| Balances, November 30, 2018 | — | | | $ | — | | | $ | — | | | — | | | $ | — | | | $ | — | | | $ | 1,359,001 | | | $ | (39,199) | | | $ | 1,319,802 | |
| Share-based compensation | — | | | — | | | — | | | — | | | — | | | — | | | 10,351 | | | — | | | 10,351 | |
| Other comprehensive loss | — | | | — | | | — | | | — | | | — | | | — | | | — | | | (10,883) | | | (10,883) | |
| Hypothetical current tax expense recorded for separate return basis presentation | — | | | — | | | — | | | — | | | — | | | — | | | 33,407 | | | — | | | 33,407 | |
| Net income | — | | | — | | | — | | | — | | | — | | | — | | | 117,164 | | | — | | | 117,164 | |
| Balances, November 30, 2019 | — | | | — | | | — | | | — | | | — | | | — | | | 1,519,923 | | | (50,082) | | | 1,469,841 | |
| Share-based compensation | — | | | — | | | — | | | — | | | — | | | — | | | 15,572 | | | — | | | 15,572 | |
| Capital contribution | — | | | — | | | — | | | — | | | — | | | — | | | 594,320 | | | — | | | 594,320 | |
| Transfers from former parent | — | | | — | | | — | | | — | | | — | | | — | | | (5,950) | | | — | | | (5,950) | |
| Other comprehensive income | — | | | — | | | — | | | — | | | — | | | — | | | — | | | 46,268 | | | 46,268 | |
| Hypothetical current tax expense recorded for separate return basis presentation | — | | | — | | | — | | | — | | | — | | | — | | | 17,223 | | | — | | | 17,223 | |
| Net income | — | | | — | | | — | | | — | | | — | | | — | | | 164,811 | | | — | | | 164,811 | |
| | | Concentrix Corporation Stockholders’ Equity | | | | | Concentrix Corporation Stockholders’ Equity |
| | | Common Stock | |
| Redeemable non-controlling interest | |
| Redeemable non-controlling interest | |
| Redeemable non-controlling interest | | | Shares | | Amount | | Additional paid-in capital | | Shares | | Amount | | Retained earnings | | Former parent company investment | | Accumulated other comprehensive income (loss) | | Total |
| Balances, November 30, 2020 | Balances, November 30, 2020 | — | | | — | | | — | | | — | | | — | | | — | | | 2,305,899 | | | (3,814) | | | 2,302,085 | |
| Other comprehensive loss | Other comprehensive loss | — | | | — | | | — | | | — | | | — | | | — | | | — | | | (66,712) | | | (66,712) | |
| Reclassification of net former parent investment in Concentrix | Reclassification of net former parent investment in Concentrix | — | | | — | | | 2,305,899 | | | — | | | — | | | — | | | (2,305,899) | | | — | | | — | |
| Issuance of common stock at separation and spin-off | Issuance of common stock at separation and spin-off | 51,135 | | | 5 | | | (5) | | | — | | | — | | | — | | | — | | | — | | | — | |
| Share-based compensation activity | Share-based compensation activity | 459 | | | — | | | 49,873 | | | — | | | — | | | — | | | — | | | — | | | 49,873 | |
| Repurchase of common stock for tax withholdings on equity awards | Repurchase of common stock for tax withholdings on equity awards | — | | | — | | | — | | | 195 | | | (32,390) | | | — | | | — | | | — | | | (32,390) | |
| Repurchase of common stock | Repurchase of common stock | — | | | — | | | — | | | 138 | | | (25,096) | | | — | | | — | | | — | | | (25,096) | |
| Dividends | Dividends | — | | | — | | | — | | | — | | | — | | | (13,082) | | | — | | | — | | | (13,082) | |
| Net income | Net income | — | | | — | | | — | | | — | | | — | | | 405,577 | | | — | | | — | | | 405,577 | |
| Balances, November 30, 2021 | Balances, November 30, 2021 | 51,594 | | | $ | 5 | | | $ | 2,355,767 | | | 333 | | | $ | (57,486) | | | $ | 392,495 | | | $ | — | | | $ | (70,526) | | | $ | 2,620,255 | |
| Other comprehensive loss | |
| Equity awards issued as acquisition purchase consideration | |
| Acquisition of non-controlling interest in subsidiary | |
| Net income attributable to non-controlling interest | |
| Purchase of non-controlling interest in subsidiary | |
| Share-based compensation activity | |
| Repurchase of common stock for tax withholdings on equity awards | |
| Repurchase of common stock | |
| Dividends | |
| Net income | |
| Balances, November 30, 2022 | |
| Other comprehensive income | |
| Common stock issued as acquisition purchase consideration | |
| Share-based compensation activity | |
| Repurchase of common stock for tax withholdings on equity awards | |
| Repurchase of common stock | |
| Dividends | |
| Net income | |
| Balances, November 30, 2023 | |
(Amounts may not add due to rounding)
The accompanying notes are an integral part of these consolidated financial statements.
CONCENTRIX CORPORATION
CONSOLIDATED STATEMENTS OF CASH FLOWS
(currency in thousands)
| | | | | | | | | | | | | | | | | |
| Fiscal Years Ended November 30, |
| 2021 | | 2020 | | 2019 |
| Cash flows from operating activities: | | | | | |
| Net income | $ | 405,577 | | | $ | 164,811 | | | $ | 117,164 | |
| Adjustments to reconcile net income to net cash provided by operating activities: | | | | | |
| Depreciation | 140,236 | | | 129,283 | | | 139,174 | |
| Amortization | 136,939 | | | 147,283 | | | 166,606 | |
| Non-cash share-based compensation | 36,176 | | | 15,572 | | | 10,351 | |
| Provision for doubtful accounts | (202) | | | 8,140 | | | 5,134 | |
| Deferred income taxes | (25,729) | | | (19,850) | | | (16,281) | |
| Hypothetical current tax expense recorded for separate return basis presentation | — | | | 17,223 | | | 33,407 | |
| Unrealized foreign exchange (gain) loss | (305) | | | 5,647 | | | 1,973 | |
| Convertible debt conversion option fair value and extinguishment (gains) losses | — | | | — | | | 1,559 | |
| Gain on divestitures and related transaction costs | (13,197) | | | — | | | — | |
| Other | 140 | | | 1,932 | | | 1,410 | |
| Changes in operating assets and liabilities: | | | | | |
| Accounts receivable, net | (139,104) | | | (124,093) | | | 3,645 | |
| Payable to former parent | (22,825) | | | 4,230 | | | (4,446) | |
| Accounts payable | (4,546) | | | 36,557 | | | (4,998) | |
| Other operating assets and liabilities | 1,018 | | | 120,879 | | | (4,962) | |
| Net cash provided by operating activities | 514,178 | | | 507,614 | | | 449,736 | |
| Cash flows from investing activities: | | | | | |
| Repayments of (proceeds from) loan to non-Concentrix subsidiary of former parent as part of its centralized treasury operations | — | | | 67,676 | | | (30,466) | |
| Purchases of property and equipment | (149,079) | | | (171,332) | | | (111,122) | |
| Acquisitions of business, net of cash acquired and refunds | (3,279) | | | (5,560) | | | (9,426) | |
| Proceeds from divestitures, net of cash sold | 73,708 | | | — | | | — | |
| Net cash used in investing activities | (78,650) | | | (109,216) | | | (151,014) | |
| Cash flows from financing activities: | | | | | |
| Proceeds from the Credit Facility - Term Loan | — | | | 900,000 | | | — | |
| Repayments of the Credit Facility - Term Loan | (200,000) | | | — | | | — | |
| Proceeds from the Securitization Facility | 1,316,000 | | | 250,000 | | | — | |
| Repayments of the Securitization Facility | (1,461,000) | | | — | | | — | |
| Debt issuance costs | — | | | (8,521) | | | — | |
| Repayments of convertible debentures assumed in the Convergys acquisition | — | | | — | | | (148,047) | |
| Repayments of borrowings from former parent | — | | | (1,476,703) | | | (191,592) | |
| Proceeds from exercise of stock options | 13,697 | | | — | | | — | |
| Repurchase of common stock for tax withholdings on equity awards | (32,390) | | | — | | | — | |
| Repurchase of common stock | (25,096) | | | — | | | — | |
| Dividends paid | (13,082) | | | — | | | — | |
| Net cash used in financing activities | (401,871) | | | (335,224) | | | (339,639) | |
| Effect of exchange rate changes on cash, cash equivalents and restricted cash | (6,998) | | | 9,663 | | | (3,453) | |
| Net increase (decrease) in cash, cash equivalents and restricted cash | 26,659 | | | 72,837 | | | (44,370) | |
| Cash, cash equivalents and restricted cash at beginning of year | 156,351 | | | 83,514 | | | 127,884 | |
| Cash, cash equivalents and restricted cash at end of year | $ | 183,010 | | | $ | 156,351 | | | $ | 83,514 | |
| | | | | |
| Supplemental disclosures of cash flow information: | | | | | |
| Interest paid on borrowings | $ | 20,775 | | | $ | — | | | $ | — | |
| Income taxes paid | $ | 159,826 | | | $ | 76,609 | | | $ | 103,644 | |
| Non-cash capital contribution from former parent | $ | — | | | $ | 594,320 | | | $ | — | |
| Supplemental disclosure of non-cash investing activities: | | | | | |
| Accrued costs for property and equipment purchases | $ | 16,251 | | | $ | 9,398 | | | $ | 8,344 | |
| | | | | | | | | | | | | | | | | |
| Fiscal Years Ended November 30, |
| 2023 | | 2022 | | 2021 |
| Cash flows from operating activities: | | | | | |
| Net income before non-controlling interest | $ | 313,842 | | | $ | 435,640 | | | $ | 405,577 | |
| Adjustments to reconcile net income to net cash provided by operating activities: | | | | | |
| Depreciation | 173,463 | | | 146,864 | | | 140,236 | |
| Amortization | 214,832 | | | 162,673 | | | 136,939 | |
| Non-cash share-based compensation | 62,113 | | | 47,142 | | | 36,176 | |
| Provision for doubtful accounts | 10,236 | | | 3,329 | | | (202) | |
| Deferred income taxes | (121,711) | | | (30,824) | | | (25,729) | |
| Unrealized foreign exchange loss (gain) | — | | | 374 | | | (305) | |
| Loss on call options | 14,629 | | | — | | | — | |
| Amortization of debt issuance costs | 6,089 | | | 1,771 | | | 1,653 | |
| Pension and other post-retirement benefit costs | 11,328 | | | 9,437 | | | 13,427 | |
| Pension and other post-retirement plan contributions | (12,143) | | | (12,776) | | | (14,563) | |
| Gain on divestitures and related transaction costs | — | | | — | | | (13,197) | |
| Change in acquisition contingent consideration | 15,681 | | | — | | | — | |
| Other | 306 | | | 537 | | | 140 | |
| Changes in operating assets and liabilities: | | | | | |
| Accounts receivable, net | (45,895) | | | (53,129) | | | (139,104) | |
| Payable to former parent | — | | | — | | | (22,825) | |
| Accounts payable | 9,341 | | | 14,626 | | | (4,546) | |
| Other operating assets and liabilities | 25,897 | | | (124,944) | | | 501 | |
| Net cash provided by operating activities | 678,008 | | | 600,720 | | | 514,178 | |
| Cash flows from investing activities: | | | | | |
| Purchases of property and equipment | (180,532) | | | (140,018) | | | (149,079) | |
| Premiums paid for call options | (14,629) | | | — | | | — | |
| Acquisitions of business, net of cash and restricted cash acquired | (1,914,079) | | | (1,698,261) | | | (3,279) | |
| Proceeds from divestitures, net of cash sold | — | | | — | | | 73,708 | |
| Other investments | — | | | (1,000) | | | — | |
| Net cash used in investing activities | (2,109,240) | | | (1,839,279) | | | (78,650) | |
| Cash flows from financing activities: | | | | | |
| Proceeds from the Restated Credit Facility - Term Loan | 294,702 | | | — | | | — | |
| Repayments of the Restated Credit Facility - Term Loan | (194,702) | | | — | | | — | |
| Proceeds from the Prior Credit Facility - Term Loan | — | | | 2,100,000 | | | — | |
| Repayments of the Prior Credit Facility - Term Loan | (25,000) | | | (225,000) | | | — | |
| Repayments of the original credit facility - original term loan | — | | | (700,000) | | | (200,000) | |
| Proceeds from the Securitization Facility | 1,964,000 | | | 1,831,000 | | | 1,316,000 | |
| Repayments of the Securitization Facility | (2,192,000) | | | (1,579,500) | | | (1,461,000) | |
| Proceeds from the issuance of Senior Notes | 2,136,987 | | | — | | | — | |
| Cash paid for debt issuance costs | (30,519) | | | (9,331) | | | — | |
| Purchase of non-controlling interest in subsidiary | — | | | (2,500) | | | — | |
| Cash paid for acquired earnout liabilities | (13,309) | | | — | | | — | |
| Proceeds from exercise of stock options | 7,201 | | | 9,588 | | | 13,697 | |
| Repurchase of common stock for tax withholdings on equity awards | (17,231) | | | (12,474) | | | (32,390) | |
| Repurchase of common stock | (63,958) | | | (120,819) | | | (25,096) | |
| Dividends paid | (63,495) | | | (53,430) | | | (13,082) | |
| Net cash provided by (used in) financing activities | 1,802,676 | | | 1,237,534 | | | (401,871) | |
| Effect of exchange rate changes on cash, cash equivalents and restricted cash | (12,420) | | | (24,522) | | | (6,998) | |
| Net increase (decrease) in cash, cash equivalents and restricted cash | 359,024 | | | (25,547) | | | 26,659 | |
| Cash, cash equivalents and restricted cash at beginning of year | 157,463 | | | 183,010 | | | 156,351 | |
| Cash, cash equivalents and restricted cash at end of year | $ | 516,487 | | | $ | 157,463 | | | $ | 183,010 | |
(Amounts may not add due to rounding)
The accompanying notes are an integral part of these consolidated financial statements.
CONCENTRIX CORPORATION
CONSOLIDATED STATEMENTS OF CASH FLOWS
(currency in thousands)
| | | | | | | | | | | | | | | | | |
| Fiscal Years Ended November 30, |
| 2023 | | 2022 | | 2021 |
| Supplemental disclosures of cash flow information: | | | | | |
| Interest paid on borrowings | $ | 142,598 | | | $ | 67,601 | | | $ | 20,775 | |
| Income taxes paid | $ | 217,252 | | | $ | 143,865 | | | $ | 159,826 | |
| Supplemental disclosure of non-cash investing activities: | | | | | |
| Accrued costs for property and equipment purchases | $ | 26,374 | | | $ | 12,675 | | | $ | 16,251 | |
The accompanying notes are an integral part of these consolidated financial statements.
CONCENTRIX CORPORATION
NOTES TO CONSOLIDATED FINANCIAL STATEMENTS
(currency and share amounts in thousands, except per share amounts)
NOTE 1—BACKGROUND AND BASIS OF PRESENTATION:
Background
Concentrix Corporation (“Concentrix,” the “CX business” or the “Company”) is a leading global provider of Customer Experience (“CX”) solutions and technology that help iconic and disruptive brands drive deep understanding, full lifecycle engagement, and differentiated experiences for their end-customers around the world. We provideThe Company provides end-to-end capabilities, including CX process optimization, technology innovation and design engineering, front- and back-office automation, analytics and business transformation services to clients in 5five primary industry verticals. The Company’s primary verticals are technology and consumer electronics, retail, travel and e-commerce, communications and media, banking, financial services and insurance, and healthcare.
On December 1, 2020, the separation ofConcentrix and the CX business (the “separation”)were separated from SYNNEX Corporation, now known as TD SYNNEX Corporation (“TD SYNNEX” or the “former parent”) was completed, through a tax-free distribution of all of the issued and outstanding shares of the Company’s common stock to TD SYNNEX stockholders (the “distribution”(such separation and together with the separation,distribution, the “spin-off”). TD SYNNEX stockholders received 1 share of the Company’s common stock for each share of TD SYNNEX common stock held as of the close of business on November 17, 2020. As a result of the spin-off, the Company became an independent public company and the Company’s common stock commenced trading on the Nasdaq Stock Market (“Nasdaq”) under the symbol “CNXC” on December 1, 2020.
In connection with the spin-off, on November 30, 2020, the Company entered into a separation and distribution agreement, an employee matters agreement, a tax matters agreement and a commercial agreement with TD SYNNEX to set forth the principal actions to be taken in connection with the spin-off and define the Company’s ongoing relationship with TD SYNNEX after the spin-off.
Basis of presentation (including principles of consolidation)
The accompanying consolidated financial statements have been prepared in accordance with accounting principles generally accepted in the United States of America (“U.S. GAAP”) and include the accounts of the Company, its majority-owned subsidiaries and entities over which the Company has control. All intercompany balances and transactions have been eliminated in consolidation.
Prior to the spin-off on December 1, 2020
Prior to the spin-off, the CX business was held entirely within certain wholly-owned subsidiaries of TD SYNNEX dedicated to the CX business. As the separate legal entities that make up the CX business were not historically held by a single legal entity, the financial statements of the Company were prepared in connection with the expected separation and were derived from the TD SYNNEX consolidated financial statements and accounting records as if the Company had been operated on a stand-alone basis during the periods presented. Accordingly, for periods prior to December 1, 2020, the Company’s financial statements are presented on a combined basis, and for the periods subsequent to December 1, 2020, they are presented on a consolidated basis (all periods hereinafter are referred to as “consolidated financial statements”). All direct revenue and expenses attributable to the CX business, including certain allocations of former parent costs and expenses, were separately maintained in a separate ledger in the legal entities that make up the CX business. As the separate legal entities that make up the CX business were not historically held by a single legal entity, former parent company investment was shown in lieu of stockholders’ equity in the prior year periods. All significant intercompany balances and transactions between the legal entities that comprise the CX business were eliminated.
Management of the Company and former parent consider allocations of former parent costs to be a reasonable reflection of the utilization of services by, or the benefits provided to, the Company. The allocations may not, however, have reflected the expense the Company would have incurred as a stand-alone company for those periods presented. Actual costs that may have been incurred if the Company had been a stand-alone company would depend on a number of factors, including the chosen organizational structure, what functions were outsourced or performed by employees and other strategic decisions.
Prior to the spin-off, certain Concentrix legal entities in the United States jointly and severally guaranteed certain of TD SYNNEX’ borrowing arrangements and substantially all of the assets of these Concentrix legal entities secured TD SYNNEX’ obligations under the borrowing arrangements. Historically, Concentrix received or provided funding for acquisitions or ongoing operations as part of TD SYNNEX’ centralized treasury program. Accordingly, only cash amounts specifically recorded in the separate Concentrix ledger were reflected in the balance sheets. The Company reflected transfers of the cash from the former parent’s cash management system as loan or other accounts payable to the former parent or a reduction of accounts or loans receivable in the prior year balance sheet based on the purpose for which the cash was provided by the former parent. Similarly, cash transfers to the former parent were reflected as reductions of loans or other accounts payable to the former parent or loans receivable from the former parent. The cash payments and receipts were recorded in the prior year statements of cash flows as operating or financing activities based on the nature of the transactions for which the funds were transferred between the Company and the former parent.
Prior to the spin-off, operations of Concentrix were included in the consolidated U.S. federal, and certain state and local income tax returns filed by TD SYNNEX, where applicable. Concentrix also filed certain separate state, local and foreign tax returns. Income tax expense and other income tax related information contained in the financial statements prior to the spin-off were presented on a separate return basis, which required the Company to estimate tax expense as if the Company filed a separate return apart from TD SYNNEX. The income taxes of Concentrix as presented in the financial statements for these periods may not be indicative of the income taxes that Concentrix has incurred following the spin-off or will incur in the future.
Reclassifications
Certain amounts in the consolidated financial statements related to the prior years have been reclassified to conform to the current year’s presentation.
Risks and uncertainties related to the COVID-19 pandemic
In December 2019, there was an outbreak of a new strain of the coronavirus (“COVID-19”), which was declared a pandemic by the World Health Organization in March 2020. The COVID-19 pandemic has negatively impacted the global economy, disrupted global supply chains and labor force participation, and created significant volatility and disruption of financial markets. The Company successfully transitioned a significant portion of its workforce to a remote working environment throughout the second quarter of 2020 and implemented a number of safety and social distancing measures in our sites to protect the health and safety of our team. During fiscal year 2021, almost all of the Company’s workforce was productive, but the Company experienced the continued effects of the COVID-19 pandemic, as the Delta variant caused new waves of COVID-19 cases around the globe.
The extent of the continued impact of the COVID-19 pandemic on our operational and financial performance, including our ability to execute our business strategies and initiatives in the expected time frame, will depend on future developments, including the duration, spread and severity of the pandemic, the evolution of the virus and the effects of mutations in its genetic code, country and state restrictions regarding virus containment, the availability and effectiveness of vaccines and treatment options, accessibility to the Company’s delivery and operations locations, our continued utilization of remote work environments in response to future health and safety restrictions, and the effect on the Company’s clients’ businesses and the demand for their products and services, all of which are uncertain and cannot be predicted. The Company is unable to predict how long the pandemic conditions will persist in regions in which the Company operates, if or when countries or localities may experience an increase in COVID-19 cases, what additional measures may be introduced by governments or the Company’s clients in
response to the pandemic generally or to an increase in COVID-19 cases in a particular country or locality, and the effect of any such additional measures on the Company’s business. As a result, many of the estimates and assumptions used in preparation of these consolidated financial statements required increased judgment and carry a higher degree of variability and volatility. As events continue to evolve with respect to the pandemic and the global recovery from the pandemic, the Company’s estimates may materially change in future periods.
NOTE 2—SUMMARY OF SIGNIFICANT ACCOUNTING POLICIES:
Use of estimates
The preparation of financial statements in conformity with U.S. GAAP requires management to make estimates and assumptions that affect the reported amounts of assets and liabilities, the disclosure of contingent assets and liabilities at the date of the financial statements, and the reported amounts of revenue and expense during the reporting period. The Company evaluates these estimates on a regular basis and bases them on historical experience and on various assumptions that the Company believes are reasonable. Actual results could differ from the estimates.
Segment reporting
Concentrix operations are based on an integrated global delivery model whereby services under a client contract in one location may be provided from delivery centers located in one or more different countries, with more than halfa significant portion of the Company’s workforce located in the Philippines and India. Given the homogeneity of technology-infused CX services and the integrated delivery model, the Company operates in a single segment, based on how the chief operating decision maker (“CODM”) views and evaluates the Company’s operations in making operational
and strategic decisions and assessments of financial performance. The Company’s President and Chief Executive Officer has been identified as the CODM.
Cash equivalents
The Company considers all highly liquid debt instruments purchased with an original maturity or remaining maturity at the date of purchase of three months or less to be cash equivalents. Cash equivalents consist principally of money market deposit accounts that are stated at cost, which approximates fair value. The Company is exposed to credit risk in the event of default by financial institutions to the extent that cash balances with financial institutions are in excess of amounts that are insured.
Accounts receivable and allowance for doubtful accounts
Accounts receivable are comprised primarily of amounts owed to the Company by clients and are presented net of an allowance for doubtful accounts. The allowance for doubtful accounts is an estimate to cover the losses resulting from uncertainty regarding collections from customers to make payments for outstanding balances. In estimating the required allowance, the Company considers the overall quality and aging of the accounts receivable and credit evaluations of its clients’ financial condition. The Company also evaluates the collectability of accounts receivable based on specific client circumstances, current economic trends, historical experience with collections and the value and adequacy of any collateral received from clients.
Unbilled receivables
InFor the majority of service contracts, the Company performs the services prior to billing the client, and this amount is captured as an unbilled receivable included in accounts receivable, net on the consolidated balance sheet. Billing usually occurs in the month after the Company performs the services or in accordance with the specific contractual provisions.
Accounts receivable factoring
Following the combination with Webhelp (as further described in Note 3), the Company has continued Webhelp’s pre-existing factoring program with certain clients to sell accounts receivable under non-recourse agreements in exchange for cash proceeds.
Since the acquisition date through November 30, 2023, the Company sold $312,894 of receivables under these agreements. In some instances, the Company may continue to service the transferred receivables after factoring has occurred. However, any servicing of the trade receivable does not constitute significant continuing involvement and the Company does not carry any material servicing assets or liabilities.
Derivative financial instruments
The Company accounts for its derivative instruments as either assets or liabilities and carries them at fair value.
For derivative instruments that hedge the exposure to variability in expected future cash flows that are designated as cash flow hedges, the gain or loss on the derivative instrument is reported as a component of “Accumulated other comprehensive income (loss),” in stockholders’ equity and reclassified into earnings in the same line associated with the forecasted transactions, in the same period or periods during which the hedged transaction affects earnings. To receive hedge accounting treatment, cash flow hedges must be highly effective in offsetting changes to expected future cash flows on hedged transactions.
For derivative instruments that are not designated as cash flow hedges, gains and losses on derivative instruments are reported in the consolidated statements of operations in the current period.
Software costs
The Company develops software platforms for internal use. The Company capitalizes costs incurred to develop software subsequent to the software product reaching the application development stage. The Company also capitalizes the costs incurred to extend the life of existing software, or the cost of significant enhancements that are added to the features of existing software. The capitalized development costs primarily comprise payroll costs and related software costs. Capitalized costs are amortized over the economic life of the software using the straight line method.
Property and equipment
Property and equipment are stated at cost, less accumulated depreciation and amortization. Depreciation and amortization are computed using the straight line method based upon the shorter of the estimated useful lives of the assets, or the lease term of the respective assets, if applicable. Maintenance and repairs are charged to expense as incurred, and improvements are capitalized. When assets are retired or otherwise disposed of, the cost and accumulated depreciation and amortization are removed from the accounts and any resulting gain or loss is reflected in operations in the period realized. The ranges of estimated useful lives for property and equipment categories are as follows:
| | | | | |
| Equipment and furniture | 3 - 10 years |
| Software | 3 - 7 years |
| Leasehold improvements | 2 - 15 years |
| Buildings and building improvements | 10 - 39 years |
Leases
The Company enters into leases as a lessee for property and equipment in the ordinary course of business. When procuring services, or upon entering into a contract with its clients, the Company determines whether an arrangement contains a lease at its inception. As part of that evaluation, the Company considers whether there is an implicitly or explicitly identified asset in the arrangement and whether the Company, as the lessee, or the client, if the Company is the lessor, has the right to control the use of that asset. Effective December 1, 2019, whenWhen the Company is the lessee, all leases with a term of more than 12 months are recognized as right-of-use (“ROU”) assets and associated lease liabilities in the consolidated balance sheet. Lease liabilities are measured at the lease commencement date and determined using the present value of the lease payments not yet paid, at the Company’s incremental borrowing rate, which approximates the rate at which the Company would borrow on a secured basis in the country where the lease was executed. The interest rate implicit in the lease is generally not determinable in the transactions where the Company is the lessee. The ROU asset equals the lease liability adjusted for any initial direct costs, prepaid rent and lease incentives. The Company’s variable lease payments generally relate to payments tied to various indexes, non-lease components and payments above a contractual minimum fixed amount.
Operating leases are included in other assets, net, other accrued liabilities and other long-term liabilities in the consolidated balance sheet. Substantially all of the Company’s leases are classified as operating leases. The Company recognizes options to extend or terminate the lease when it is reasonably certain that the Company will
exercise that option. The Company made a policy election to not recognize leases with a lease term of 12 months or less in the consolidated balance sheet. Lease expenses are recorded within selling, general, and administrative expenses in the consolidated statements of operations. Operating lease payments are presented within “Cash flows from operating activities” in the consolidated statements of cash flows.
For all asset classes, the Company has elected the lessee practical expedient to combine lease and non-lease components (e.g., maintenance services) and account for the consolidated unit as a single lease component. Variable lease payments are recognized in the periods in which the obligations for those payments are incurred.
Business combinations
The purchase price of a business combination is allocated to the assets acquired, liabilities assumed, and non-controlling interests in the acquired entity generally based on their fair values at the acquisition date. The excess of the fair value of purchase consideration over the fair value of these assets acquired, liabilities assumed and non-controlling interests in the acquired entity is recorded as goodwill. The primary items that generate goodwill include the value of the synergies between the acquired entity and the Company and the value of the acquired assembled workforce, neither of which qualify for recognition as an intangible asset. Amounts recorded in a business combination may change during the measurement period, which is a period not to exceed one year from the date of acquisition, as additional information about conditions existing at the acquisition date becomes available. The Company includes the results of operations of the acquired business in the consolidated financial statements prospectively from the date of acquisition. Acquisition-related charges are recognized separately from the business combination and are expensed as incurred. These charges primarily include direct third-party professional and legal fees and integration-related costs.
Goodwill and intangible assets
The Company tests goodwill for impairment annually at the reporting unit level in the fiscal fourth quarter or more frequently if events or changes in circumstances indicate that it may be impaired. For purposes of the goodwill impairment test, the Company can elect to perform a quantitative or qualitative analysis. If the qualitative analysis is elected, goodwill is tested for impairment at the reporting unit level by first performing a qualitative assessment to determine whether it is more likely than not that the fair value of the reporting unit is less than its carrying value. The factors that are considered in the qualitative analysis includeinclude: macroeconomic conditions,conditions; industry and market considerations,considerations; cost factors such as increases in labor, or other costs that would have a negative effect on earnings and cash flows; and other relevant entity-specific events and information.
If the Company elects to perform or is required to perform a quantitative analysis, then the reporting unit’s carrying value is compared to its fair value. As part of this analysis, the Company reconciles the fair value of its reporting unit to its market capitalization. Goodwill is considered impaired if the carrying value of the reporting unit exceeds its fair value and the excess is recognized as an impairment loss.
No goodwill impairment has been identified for any of the fiscal years presented in these consolidated financial statements.
The values assigned to intangible assets are based on estimates and judgment regarding expectations for the length of customer relationships and the success of the life cycle of technologies acquired in a business combination. Purchased intangible assets are amortized over the useful lives based on estimates of the use of the economic benefit of the asset or by using the straight line method.
Intangible assets consist of customer relationships, technology, trade names and trade names.non-compete agreements. Amortization is based on the pattern over which the economic benefits of the intangible assets will be consumed or, when the consumption pattern is not apparent, by using the straight line method over the following useful lives:
| | | | | |
| Customer relationships | 10 - 15 years |
| Technology | 5 years |
| Trade names | 3 - 5 years |
5Non-compete agreements | 3 years |
Impairment of long-lived assets
The Company reviews the recoverability of its long-lived assets, such as intangible assets subject to amortization, property and equipment and certain other assets, including lease right-of-use assets, when events or changes in circumstances occur that indicate the carrying value of the asset or asset group may not be recoverable.
The assessment of possible impairment is based on the Company’s ability to recover the carrying value of the asset or asset group from the expected future pre-tax cash flows, undiscounted and without interest charges, of the related operations. If these cash flows are less than the carrying value of such assets, an impairment loss is recognized for the difference between estimated fair value and carrying value.
Concentration of credit risk
Financial instruments that potentially subject the Company to significant concentration of credit risk consist principally of cash and cash equivalents, accounts receivable and derivative instruments.
The Company’s cash and cash equivalents and derivative instruments are transacted and maintained with financial institutions with high credit standing, and their compositions and maturities are regularly monitored by management. Through November 30, 2021,2023, the Company has not experienced any credit losses on such deposits and derivative instruments.
Accounts receivable comprise amounts due from clients. The Company performs ongoing credit evaluations of its clients’ financial condition and limits the amount of credit extended when deemed necessary, but generally requires no collateral. The Company also maintains allowances for potential credit losses. In estimating the required allowances, the Company takes into consideration the overall quality and aging of its receivable portfolio and specifically identified client risks.
In fiscal years 2021, 20202023 and 2019,2022, no client accounted for more than 10% of the Company’s consolidated revenue. In fiscal year 2021, one client accounted for 11.9%, 11.5% and 10.4%, respectively, of the Company’s consolidated revenue.
As of November 30, 2021 and 2020,2023, no client comprised more than 10% of the Company’s total accounts receivable balance. As of November 30, 2022, one client comprised 15.3% and 16.2%, respectively,12.4% of the Company’s total accounts receivable balance.
Revenue recognition
The Company generates revenue primarily from the provision of CX solutions and technology to its clients. The Company recognizes revenue from services contracts over time as the promised services are delivered to clients for an amount that reflects the consideration to which the Company is entitled in exchange for those services. The Company recognizes revenue over time as the client simultaneously receives and consumes the benefits provided by the Company as the Company performs the services. The Company accounts for a contract with a client when it has written approval, the contract is committed, the rights of the parties, including payment terms, are identified, the contract has commercial substance and consideration is probable of collection. Revenue is presented net of taxes collected from clients and remitted to government authorities. The Company generally invoices a client after performance of services, or in accordance with specific contractual provisions. Payments are due as per contract terms and do not contain a significant financing component.
The Company determines whether the services performed during the initial phases of an arrangement, such as setup activities, are distinct. In most cases, the arrangement is a single performance obligation comprised of a series of distinct services that are substantially the same and that have the same pattern of transfer (i.e., distinct days of service).
Service contracts are most significantly based on a fixed unit-price per transaction or other objective measure of output. Revenue on unit-price transactions is recognized over time using an objective measure of output such as staffing hours or the number of transactions processed by service advisors. Certain contracts may be based on a fixed price. Revenue on fixed price contracts is recognized over time using an input measure or on a straight-line basis over the term of the contract as the services are provided based on the nature of the contract. Client contract terms can range from less than one year to more than five years.
Certain client contracts include incentive payments from the client upon achieving certain agreed-upon service levels and performance metrics or service level agreements that could result in credits or refunds to the client.
Revenue relating to such arrangements is accounted for as variable consideration when the likely amount of revenue to be recognized can be estimated to the extent that it is probable that a significant reversal of any incremental revenue will not occur.
Cost of revenue
Recurring direct operating costs for services are recognized as incurred. Cost of services revenue consists primarily of personnel costs and transition and initial set up costs.
Selling, general and administrative expenses
Selling, general and administrative expenses are charged to income as incurred. Expenses of promoting and selling products and services are classified as selling expense and include such items as compensation, sales commissions and travel. General and administrative expenses include such items as compensation, cost of delivery centers, legal and professional costs, office supplies, non-income taxes, insurance and utility expenses. In addition, selling, general and administrative expenses include other operating items such as allowances for credit losses, depreciation and amortization of non-technology related intangible assets.
Advertising
Costs related to advertising and service promotion expenditures are charged to “Selling, general and administrative expenses” as incurred. To date, net costs related to advertising and promotion expenditures have not been material.
Income taxes
Prior to December 1, 2020, the Company’s operations were included in the tax returns filed by the respective former parent entities of which the Company’s businesses were a part. For the fiscal years ended November 30, 2020 and 2019, income tax expense and other income tax related information contained in these consolidated financial statements are presented on a separate return basis as if the Company filed its own tax returns.
The asset and liability method is used in accounting for income taxes. Under this method, deferred tax assets and liabilities are recognized for the expected tax consequences of temporary differences between the tax bases of assets and liabilities and their reported amounts in the financial statements using enacted tax rates and laws that will be in effect when the difference is expected to reverse. Tax on global low-taxed intangible income is accounted for as a current expense in the period in which the income is includable in a tax return using the “period cost” method. Valuation allowances are provided against deferred tax assets that are not likely to be realized.
The Company recognizes tax benefits from uncertain tax positions only if that tax position is more likely than not to be sustained on examination by the taxing authorities, based on the technical merits of the position. The tax
benefits recognized in the financial statements from such positions are then measured based on the largest benefit that has a greater than 50% likelihood of being realized upon settlement. The Company recognizes interest and penalties related to unrecognized tax benefits in the provisions for income taxes.
Foreign currency translations
The financial statementsfunctional currencies of the legal entitiesentities’ financial statements included in these consolidated financial statements whose functional currencies are the local currencies of the legal entities and are translated into U.S. dollars for consolidation as follows: assets and liabilities at the exchange rate as of the balance sheet date, equity at the historical rates of exchange, and income and expense amounts at the average exchange rate for the month. Translation adjustments resulting from the translation of the legal entities’ accounts are included in “Accumulated other comprehensive income (loss).” Transactions denominated in currencies other than the applicable functional currency are converted to the functional currency at the exchange rate on the transaction date. At period end, monetary assets and liabilities are remeasured to the functional currency using exchange rates in effect at the balance sheet date. Non-monetary assets and liabilities are remeasured at historical exchange rates. Gains and losses resulting from foreign currency transactions are included within “Other expense (income), net.”
Other comprehensive income
The primary components of other comprehensive income for the Company include foreign currency translation adjustments arising from the combination ofCompany’s foreign legal entities, engaged in the CX business, unrealized gains and losses on cash flowqualifying hedges, and changes in unrecognized pension and post-retirement benefits.
Share-based compensation
Share-based compensation cost for stock options, restricted stock awards and restricted stock units is determined based on the fair value at the measurement date. The Company recognizes share-based compensation cost as expense for these awards ratably on a straight-line basis over the requisite service period. Share-based compensation for performance-based restricted stock units is measured based on fair value at the initial measurement date and is adjusted each reporting period, as necessary, to reflect changes in the Company’s stock and management’s assessment of the probability that performance conditions will be satisfied.satisfied and, for certain awards, for changes in the trading price of the Company’s common stock. The Company recognizes share-based compensation cost associated with its performance-based restricted stock units over the requisite service period if it is probable that the performance conditions will be satisfied. The Company accounts for expense reductions that result from the forfeiture of unvested awards in the period that the forfeitures occur.
Pension and post-retirement benefits
The funded status of the Company’s pension and other post-retirement benefit plans is recognized in the consolidated balance sheets. The funded status is measured as the difference between the fair value of plan assets and the benefit obligation at November 30, the measurement date. For defined benefit pension plans, the benefit obligation is the projected benefit obligation (“PBO”) and, for the other post-retirement benefit plans, the benefit obligation is the accumulated post-retirement benefit obligation (“APBO”). The PBO represents the actuarial present value of benefits expected to be paid upon retirement. For active plans, the present value reflects estimated future compensation levels. The APBO represents the actuarial present value of post-retirement benefits attributed to employee services already rendered. The fair value of plan assets represents the current market value of assets held by an irrevocable trust fund for the sole benefit of participants. The measurement of the benefit obligation is based on the Company’s estimates and actuarial valuations. These valuations reflect the terms of the plans and use participant-specific information such as compensation, age and years of service, as well as certain key assumptions that require significant judgment, including, but not limited to, estimates of discount rates, expected return on plan assets, inflation, rate of compensation increases, interest crediting rates and mortality rates. The assumptions used are reviewed on an annual basis.
Earnings per common share
Basic and diluted earnings per common share are calculated using the two-class method. The two-class method is an earnings allocation proportional to the respective ownership among holders of common stock and participating securities. The Company’s restricted stock awards and, effective in the fourth quarter of fiscal year 2023, restricted stock units are considered participating securities. These restricted stock awards and units are considered participating securities because they are legally issued at the grant date and holders have a non-forfeitable right to receive dividends. Basic earnings per common share is computed by dividing net income attributable to the Company’s common stockholders by the weighted-average common shares outstanding during the period. Diluted earnings per common share also considers the dilutive effect of in-the-money stock options and restricted stock units,non-participating securities, calculated using the treasury stock method.
Treasury stock
Repurchases of shares of common stock are accounted for at cost and are included as a component of stockholders’ equity in the consolidated balance sheets.
Accounting pronouncements adopted during the three-year period ended November 30, 2021
In June 2016, the Financial Accounting Standards Board (the “FASB”) issued a credit loss standard that replaced the incurred loss impairment model with a methodology that reflects expected credit losses and requires consideration of a broader range of reasonable and supportable information to determine credit loss estimates. This standard became effective for the Company’s fiscal year beginning December 1, 2020. The adoption did not have a material impact on the consolidated financial statements.
In August 2018, the FASB issued new guidance to add, remove, and clarify disclosure requirements related to defined benefit pension and other post-retirement plans. The guidance requires the Company to disclose the weighted-average interest crediting rates used in cash balance pension plans. It also requires the Company to disclose the reasons for significant changes in the benefit obligation or plan assets, including significant gains and losses affecting the benefit obligation for the period. This standard became effective for fiscal year 2021 and did not have a material impact on the Company’s consolidated financial statements.
In February 2018, the FASB issued guidance that permitted the Company to reclassify disproportionate tax effects in accumulated other comprehensive income caused by the Tax Cuts and Jobs Act of 2017 to retained earnings. The guidance was effective for fiscal years, and interim periods within those fiscal years, beginning after December 15, 2018, with early adoption permitted. The adoption of this new guidance did not have a material impact on the Company’s consolidated financial statements.
In February 2016, the FASB issued a new standard which revised various aspects of accounting for leases, with amendments in 2018 and 2019 codified as Accounting Standards Codification Topic 842, Leases (“ASC Topic 842”). The Company adopted the guidance effective December 1, 2019, applying the optional transition method, which allows an entity to apply the new standard at the adoption date with a cumulative-effect adjustment to the opening balance of retained earnings in the period of adoption. In addition, the Company elected the package of practical expedients not to reassess prior conclusions related to contracts containing leases, lease classification and initial direct costs, and the lessee practical expedient to combine lease and non-lease components for all asset classes. The Company made a policy election to not recognize ROU assets and lease liabilities for short-term leases for all asset classes. The most significant impact of adoption to the Company’s consolidated financial statements related to the recognition of a ROU asset and a lease liability for virtually all of its leases other than short-term leases. The liability was equal to the present value of lease payments. The asset is based on the liability, and subject to adjustment, such as for initial direct costs. The recognition, measurement, and presentation of expenses and cash flows arising from a lease by a lessee primarily will depend on its classification. For income statement purposes, operating leases will result in a straight-line expense while finance leases will result in a front-loaded expense pattern. Upon adoption, the Company recorded $525,344 of ROU assets and $571,940 of liabilities relating to its operating leases on its consolidated balance sheet. The adoption did not have an impact on the Company’s consolidated statements of operations or its consolidated statements of cash flows.
In May 2014, the FASB issued a comprehensive new revenue recognition standard for contracts with customers with amendments in 2015 and 2016, codified as Accounting Standards Codification Topic 606, Revenue from Contracts with Customers. The Companypronouncements recently adopted the guidance effective December 1, 2018 on a full retrospective basis to ensure a consistent basis of presentation within the Company’s consolidated financial statements for all periods reported. In addition, the Company elected the one year practical expedient for contract costs. The impact of adoption was not material and related primarily to the capitalization of certain sales commissions that are assessed to be incremental for obtaining new contracts. Such costs are amortized over the period of expected benefit rather than being expensed as incurred as was the Company’s prior practice.
In January 2016, the FASB issued new guidance that amended various aspects of the recognition, measurement, presentation, and disclosure of financial instruments. With respect to the Company’s consolidated financial statements, the most significant impact related to the accounting for equity investments (other than those that are consolidated or accounted under the equity method), which are measured at fair value through earnings. The Company has elected to use the measurement alternative for non-marketable equity securities, defined as cost, adjusted for changes from observable transactions for identical or similar investments of the same issuer, less impairment. The Company adopted the guidance as of December 1, 2018, with amendments related specifically to equity securities without readily determinable fair values applied prospectively. The adoption did not have a material impact on the Company’s consolidated financial statements.
Recently issued accounting pronouncements not yet adopted
In March 2020, the FASB issued optional guidance for a limited time to ease the potential burden in accounting for or recognizing the effects of reference rate reform, particularly, the risk of cessation of the London Interbank Offered Rate (“LIBOR”) on financial reporting. The guidance provides optional expedients and exceptions for applying GAAP to contracts, hedging relationships, and other transactions affected by reference rate reform if certain criteria are met. The amendments are elective and are effective upon issuance for all entities through December 31, 2022. The Company is currently evaluating the impact of the guidance on its consolidated financial statements.
In December 2019, the FASBFinancial Accounting Standards Board (the “FASB”) issued new guidance that simplifiessimplified the accounting for income taxes. The guidance iswas effective for annual reporting periods beginning after December 15, 2020, and interim periods within those reporting periods. Certain amendments should be applied prospectively, while other amendments should be applied retrospectively to allThis standard became effective for the Company in fiscal year 2022 and did not have a material impact on the consolidated financial statements.
In November 2023, the FASB issued accounting standards update (“ASU”) 2023-07, which enhances the disclosures required for reportable segments in annual and interim consolidated financial statements. ASU 2023-07 is effective for the Company for annual reporting periods presented.beginning with the fiscal year ending November 30, 2025 and for interim reporting periods beginning in fiscal year 2026. Early adoption is permitted. The Company is currently evaluating the impact of the new guidancethat this update will have on its disclosures in the consolidated financial statements.
In December 2023, the FASB issued ASU 2023-09, which requires enhanced income tax disclosures, including disaggregation of information in the rate reconciliation table and disaggregated information related to income taxes paid. The amendments in ASU 2023-09 are effective for the fiscal year ending November 30, 2026. The Company is currently evaluating the impact that this update will have on its disclosures in the consolidated financial statements.
No other new accounting pronouncements recently adopted or issued had or are expected to have a material impact on the consolidated financial statements.
NOTE 3—ACQUISITIONS AND DIVESTITURES:
Webhelp Combination
Background
On September 25, 2023, the Company completed its acquisition (the “Webhelp Combination”) of all of the issued and outstanding capital stock (the “Shares”) of Marnix Lux SA, a public limited liability company (société anonyme) incorporated under the laws of the Grand Duchy of Luxembourg (“Webhelp Parent”) and the parent company of the Webhelp business (“Webhelp”), from the holders thereof (the “Sellers”). The Webhelp Combination was completed pursuant to the terms and conditions of the Share Purchase and Contribution Agreement, dated as of June 12, 2023, as amended by the First Amendment to the Share Purchase and Contribution Agreement, dated as of July 14, 2023 (the “SPA”), by and among Concentrix, OSYRIS S.à r.l., a private limited liability company (société à responsabilité limitée) incorporated under the laws of the Grand Duchy of Luxembourg and a direct wholly owned subsidiary of Concentrix Corporation, Webhelp Parent, the Sellers, and certain representatives of the Sellers.
Webhelp is a leading provider of CX solutions, including sales, marketing, and payment services, with significant operations and client relationships in Europe, Latin America, and Africa. Since the closing of the Webhelp Combination, the Company has operated under the trade name “Concentrix + Webhelp” while it transitions Webhelp operations and branding to the Concentrix name.
Preliminary purchase price consideration
The total preliminary purchase price consideration, net of cash and restricted cash acquired, for the acquisition of Webhelp was $3,752.4 million, which was funded by proceeds from the Company’s August 2023 offering and sale of senior notes, term loan borrowings under the Company’s senior credit facility, and cash on hand. See Note 9—Borrowings for a further discussion of the Company’s senior notes, term loan, and senior credit facility.
The preliminary purchase price consideration to acquire Webhelp consisted of the following:
| | | | | |
Cash consideration for Shares (1) | $ | 529,160 | |
Cash consideration for repayment of Webhelp debt and shareholder loan (2) | 1,915,197 | |
| Total cash consideration | 2,444,357 | |
Equity consideration (3) | 1,084,894 | |
Earnout shares contingent consideration (4) | 32,919 | |
Sellers’ note consideration (5) | 711,830 | |
| Total consideration transferred | 4,274,000 | |
Less: Cash and restricted cash acquired (6) | 521,602 | |
| Total purchase price consideration | $ | 3,752,398 | |
(1) Represents the cash consideration paid, and to be paid, in the aggregate amount of €500,000, as adjusted in accordance with the SPA.
(2) Represents the cash consideration paid to repay Webhelp’s outstanding senior loan debt and shareholder loan.
(3) Represents the issuance of 14,862 shares of common stock, par value $0.0001 per share, of Concentrix Corporation (the “Concentrix common stock”).
(4) Represents the contingent right for the Sellers to earn additional shares of Concentrix common stock (the “Earnout Shares”). The estimated fair value of this contingent consideration was determined using a Monte-Carlo simulation model. The inputs include the closing price of Concentrix common stock as of the Closing Date, Concentrix-specific historical equity volatility, and the risk-free rate. See further details below.
(5) Represents a promissory note issued by Concentrix Corporation in the aggregate principal amount of €700,000 to certain Sellers. See Note 9—Borrowings for a further discussion of this promissory note.
(6) Represents the Webhelp cash and restricted cash balance acquired at the Closing Date.
The Company granted Sellers the contingent right to earn an additional 750 shares of Concentrix common stock if certain conditions set forth in the SPA occur, including the share price of Concentrix common stock reaching $170.00 per share within seven years from the closing of the Webhelp Combination (the “Closing Date”) (based on daily volume weighted average prices measured over a specified period). Prior to the Closing Date, Concentrix and certain Sellers entered into stock restriction agreements (the “Stock Restriction Agreements”), pursuant to which such Sellers (the “Restricted Stock Participants”) agreed to contribute in kind to the Company, and the Company agreed to receive, certain of the Restricted Stock Participants’ Shares in exchange for the issuance of shares of Concentrix common stock with certain restrictions thereon (the “Restricted Shares”) in lieu of such Sellers’ right to a portion of the Earnout Shares. On the Closing Date, the Company issued approximately 80 Restricted Shares in exchange for certain of the Restricted Stock Participants’ Shares. The Restricted Shares are non-transferable and non-assignable and are not entitled to any dividends or distributions unless and until the restrictions lapse, as set forth in the Stock Restriction Agreements. The Restricted Shares will be automatically cancelled by the Company for no consideration in the event that the restrictions on the Restricted Shares do not lapse. The Restricted Stock Participants have waived any and all rights as a holder of Restricted Shares to vote on any matter submitted to the holders of Concentrix common stock.
Preliminary purchase price allocation
The acquisition was accounted for as a business combination in accordance with Accounting Standards Codification (“ASC”) Topic 805, Business Combinations. The purchase price was allocated to the assets acquired and liabilities assumed based on management’s estimate of the respective fair values at the date of acquisition. Goodwill was calculated as the excess of the consideration transferred over the net assets recognized and represents the estimated future economic benefits arising from other assets acquired that could not be individually identified and separately recognized. The factors contributing to the recognition of goodwill were the assembled workforce, comprehensive service portfolio delivery capabilities and strategic benefits that are expected to be realized from the acquisition. None of the goodwill is expected to be deductible for income tax purposes.
The following table summarizes the preliminary fair values of the assets acquired and liabilities assumed as of the acquisition date:
| | | | | |
| As of |
| September 25, 2023 |
| Assets acquired: | |
| Cash and cash equivalents | $ | 332,749 | |
| Accounts receivable | 457,264 | |
Other current assets (1) | 454,906 | |
| Property and equipment | 325,753 | |
| Identifiable intangible assets | 1,984,000 | |
| Goodwill | 2,085,344 | |
| Deferred tax assets | 17,680 | |
| Other assets | 408,884 | |
| 6,066,580 | |
| |
| Liabilities assumed: | |
| Accounts payable | 68,132 | |
| Accrued compensation and benefits | 268,213 | |
| Other accrued liabilities | 563,738 | |
| Income taxes payable | 72,052 | |
| Debt (current portion and long-term) | 8,589 | |
| Deferred tax liabilities | 410,918 | |
| Other long-term liabilities | 400,938 | |
| Total liabilities assumed | 1,792,580 | |
| |
| Total consideration transferred | $ | 4,274,000 | |
(1) Includes restricted cash acquired of $188,853.
As of November 30, 2023, the purchase price allocation is preliminary. The preliminary purchase price allocation was based upon a preliminary valuation, and the Company’s estimates and assumptions are subject to change within the measurement period (not to exceed twelve months following the acquisition date). The primary areas of the preliminary purchase price allocation that are not yet finalized relate to the valuation of identifiable intangible assets acquired, the fair value of certain tangible assets acquired and liabilities assumed, and deferred income taxes. The Company expects to continue to obtain information for the purpose of determining the fair value
of the assets acquired and liabilities assumed on the acquisition date throughout the remainder of the measurement period.
The preliminary purchase price allocation includes $1,984,000 of acquired identifiable intangible assets, all of which have finite lives. The fair value of the identifiable intangible assets has been estimated by using the income approach through a discounted cash flow analysis of certain cash flow projections. The cash flow projections are based on forecasts used by the Company to price the Webhelp Combination, and the discount rates applied were benchmarked by referencing the implied rate of return of the Company’s pricing model and the weighted average cost of capital. The intangible assets are being amortized over their estimated useful lives on either a straight-line basis or an accelerated method that reflects the economic benefit of the asset. The determination of the useful lives is based upon various industry studies, historical acquisition experience, economic factors, and future forecasted cash flows of the Company following the acquisition of Webhelp.
The preliminary amounts allocated to intangible assets are as follows:
| | | | | | | | | | | | | | | | | |
| Gross Carrying Amount | | Weighted-Average Useful Life | | Amortization Method |
| Customer relationships | $ | 1,882,000 | | | 15 years | | Accelerated |
| Trade name | 102,000 | | | 3 years | | Straight-line |
| Total | $ | 1,984,000 | | | | | |
Supplemental Pro Forma Information (unaudited)
The supplemental pro forma financial information presented below is for illustrative purposes only, does not include the pro forma adjustments that would be required under Regulation S-X for pro forma financial information, is not necessarily indicative of the financial position or results of operations that would have been realized if the combination with Webhelp had been completed on December 1, 2021, does not reflect synergies that might have been achieved, nor is it indicative of future operating results or financial position. The pro forma adjustments are based upon currently available information and certain assumptions that the Company believes are reasonable under the circumstances.
The supplemental pro forma financial information reflects pro forma adjustments to present the combined pro forma results of operations as if the combination with Webhelp had occurred on December 1, 2021 to give effect to certain events that the Company believes to be directly attributable to the acquisition. These pro forma adjustments primarily include:
•A net increase in amortization expense that would have been recognized due to acquired identifiable intangible assets.
•A net increase to interest expense to reflect the additional borrowings of Concentrix incurred in connection with the combination as previously described and the repayment of Webhelp’s historical debt in conjunction with the combination.
•The related income tax effects of the adjustments noted above.
The supplemental pro forma financial information for the prior fiscal years ended November 30, 2023 and 2022 is as follows:
| | | | | | | | | | | |
| Fiscal Years Ended November 30, |
| 2023 | | 2022 |
| Revenue | $ | 9,485,600 | | | $ | 8,919,195 | |
| Net income | 177,611 | | | 238,242 | |
Results of acquired operations
The results of the acquired operations of Webhelp have been included in the consolidated financial statements since the acquisition date. The following table provides the results of acquired operations included in the consolidated statement of operations from the acquisition date through November 30, 2023:
| | | | | |
| Fiscal Year Ended |
| November 30, 2023 |
| Revenue | $ | 574,351 | |
| Income before income taxes | 1,302 | |
PK Acquisition
Background
On December 27, 2021, the Company completed its acquisition of PK, a leading CX design engineering company with more than 5,000 staff in four countries. PK creates pioneering experiences that accelerate digital outcomes for their clients’ customers, partners and staff. The acquisition of PK expandsexpanded the Company’s scale in the digital IT services market and supportssupported the Company’s growth strategy of investing in digital transformation to deliver exceptional customer experiences. The addition of the PK staff and technology to the Company’s team further strengthensstrengthened its capabilities in CX design and development, artificial intelligence (“AI”), intelligent automation, and customer loyalty.
At the completionPurchase price consideration
The total purchase price consideration, net of cash and restricted cash acquired, for the acquisition the Company paid approximately $1.6 billion in cash. The Company usedof PK was $1,573.3 million, which was funded by proceeds from the Company’s term loan under its Amendedprior credit agreement dated as of October 16, 2020 (the “Prior Credit Facility to fund the payment.Facility”) and additional borrowings under its accounts receivable securitization facility (the “Securitization Facility”). See Note 9—Borrowings for a further discussion of the financing thatCompany’s term loan, senior credit facility and the Company securedSecuritization Facility.
The purchase price consideration to fund the acquisition.
Given the short period of time from the closeacquire PK consisted of the acquisitionfollowing:
| | | | | |
Cash consideration for PK stock (1) | $ | 1,177,342 | |
Cash consideration for PK vested equity awards (2) | 246,229 | |
Cash consideration for repayment of PK debt, including accrued interest (3) | 148,492 | |
Cash consideration for transaction expenses of PK (4) | 22,842 | |
| Total cash consideration | 1,594,905 | |
Non-cash equity consideration for conversion of PK equity awards (5) | 15,725 | |
| Total consideration transferred | 1,610,630 | |
Less: Cash and restricted cash acquired (6) | 37,310 | |
| Total purchase price consideration | $ | 1,573,320 | |
(1) Represents the cash consideration paid for the outstanding shares of PK common stock, which includes the final settlement of the merger consideration adjustment paid pursuant to the filing of this Annual Report on Form 10-K,merger agreement.
(2) Represents the Company iscash consideration paid for certain vested PK stock option awards and restricted stock unit awards.
(3) Represents the cash consideration paid to retire PK’s outstanding third-party debt, including accrued interest.
(4) Represents the cash consideration paid for expenses incurred by PK in connection with the process of compilingmerger and paid by Concentrix pursuant to the initial accounting for the PK acquisition, including the determination of the fair values of tangible assets acquired and liabilities assumed, the valuation of intangible assetsmerger agreement. These expenses primarily related to third-party consulting services.
(5) Represents the issuance of vested Concentrix stock options that were issued in conversion of certain vested PK stock options that were assumed by Concentrix pursuant to the merger agreement.
(6) Represents the PK cash and restricted cash balance acquired at the acquisition.
Purchase price allocation
The acquisition was accounted for as a business combination in accordance with ASC Topic 805, Business Combinations. The purchase price was allocated to the assets acquired, liabilities assumed and non-controlling interest based on management’s estimate of the respective fair values at the date of acquisition. Goodwill was calculated as the excess of the consideration transferred over the net assets recognized and represents the estimated future economic benefits arising from other assets acquired that could not be individually identified and separately recognized. The factors contributing to the recognition of goodwill were the assembled workforce, comprehensive service portfolio delivery capabilities and strategic benefits that are expected to be realized from the acquisition. None of the goodwill is deductible for income tax purposes.
The following table summarizes the final fair values of the assets acquired, liabilities assumed and non-incomenon-controlling interest as of the acquisition date:
| | | | | |
| As of |
| December 27, 2021 |
| Assets acquired: | |
| Cash and cash equivalents | $ | 30,798 | |
| Accounts receivable | 85,367 | |
| Property and equipment | 11,158 | |
| Operating lease right-of-use assets | 12,288 | |
| Identifiable intangible assets | 469,300 | |
| Goodwill | 1,119,068 | |
| Other assets | 26,449 | |
| Total assets acquired | 1,754,428 | |
| |
| Liabilities assumed and non-controlling interest: | |
| Accounts payable and accrued liabilities | 78,092 | |
| Operating lease liabilities | 12,288 | |
| Deferred tax liabilities | 51,418 | |
| Non-controlling interest | 2,000 | |
| Total liabilities assumed and non-controlling interest | 143,798 | |
| |
| Total consideration transferred | $ | 1,610,630 | |
The purchase price allocation includes $469,300 of acquired identifiable intangible assets, all of which have finite lives. The fair value of the identifiable intangible assets has been estimated by using the income approach through a discounted cash flow analysis of certain cash flow projections. The cash flow projections are based taxes, residual goodwillon forecasts used by the Company to price the PK acquisition, and the amountdiscount rates applied were benchmarked by referencing the implied rate of return of the Company’s pricing model and the weighted average cost of capital. The intangible assets are being amortized over their estimated useful lives on either a straight-line basis or an accelerated method that reflects the economic benefit of the asset. The determination of the useful lives is based upon various industry studies, historical acquisition experience, economic factors, and future forecasted cash flows of the Company following the acquisition of PK.
The amounts allocated to intangible assets are as follows:
| | | | | | | | | | | | | | | | | |
| Gross Carrying Amount | | Weighted-Average Useful Life | | Acceleration Method |
| Customer relationships | $ | 398,600 | | | 15 years | | Accelerated |
| Technology | 63,500 | | | 5 years | | Straight-line |
| Trade name | 5,000 | | | 3 years | | Straight-line |
| Non-compete agreements | 2,200 | | | 3 years | | Straight-line |
| Total | $ | 469,300 | | | | | |
ServiceSource Acquisition
Background
On July 20, 2022, the Company completed its acquisition of ServiceSource International, Inc. (“ServiceSource”), a global outsourced go-to-market services provider, delivering business-to-business (“B2B”) digital sales and customer success solutions that complemented Concentrix’ offerings in this area.
Purchase price consideration
The total purchase price consideration, net of cash acquired, for the acquisition of ServiceSource was $141.5 million, which was primarily funded by cash on the Company’s balance sheet, as well as borrowings under the Company’s Securitization Facility.
The purchase price consideration to acquire ServiceSource consisted of the following:
| | | | | |
Cash consideration for ServiceSource stock (1) | $ | 150,392 | |
Cash consideration for ServiceSource vested and unvested equity awards (2) | 6,704 | |
Cash consideration for repayment of ServiceSource debt, including accrued interest (3) | 10,063 | |
| Total consideration transferred | 167,159 | |
Less: Cash and restricted cash acquired (4) | 25,652 | |
| Total purchase price consideration | $ | 141,507 | |
(1) Represents the cash consideration paid for the outstanding shares of ServiceSource common stock.
(2) Represents the cash consideration paid or to be paid for vested and unvested ServiceSource stock option awards, restricted stock units and performance stock units.
(3) Represents the cash consideration paid to retire ServiceSource’s outstanding third-party debt, including accrued interest.
(4) Represents the ServiceSource cash and restricted cash balance acquired at the acquisition.
Purchase price allocation
The purchase price was allocated to the assets acquired and liabilities assumed based on management’s estimate of the respective fair values at the date of acquisition. Goodwill was calculated as the excess of the consideration transferred over the net assets recognized and represents the estimated future economic benefits arising from other assets acquired that could not be individually identified and separately recognized. The factors contributing to the recognition of goodwill were the assembled workforce, high-value service delivery capabilities and strategic benefits that willare expected to be realized from the acquisition. None of the goodwill is deductible for income tax purposes.
The following table summarizes the final fair values of the assets acquired and liabilities assumed as of the acquisition date:
| | | | | |
| As of |
| July 20, 2022 |
| Assets acquired: | |
| Cash and cash equivalents | $ | 24,355 | |
| Accounts receivable | 40,097 | |
| Property and equipment | 8,112 | |
| Operating lease right-of-use assets | 29,487 | |
| Identifiable intangible assets | 40,200 | |
| Goodwill | 34,910 | |
| Net deferred tax assets | 32,701 | |
| Other assets | 19,649 | |
| Total assets acquired | 229,511 | |
| |
| Liabilities assumed: | |
| Accounts payable and accrued liabilities | 32,865 | |
| Operating lease liabilities | 29,487 | |
| Total liabilities assumed | 62,352 | |
| |
| Total consideration transferred | $ | 167,159 | |
The purchase price allocation includes $40,200 of acquired identifiable intangible assets, all of which have finite lives. The fair value of the identifiable intangible assets has been estimated using the income approach through a discounted cash flow analysis of certain cash flow projections. The intangible assets are being amortized over their estimated useful lives on either a straight-line basis or an accelerated method that reflects the economic benefit of the asset. The determination of the useful lives is based upon various industry studies, historical acquisition experience, economic factors, and future forecasted cash flows of the Company following the acquisition of ServiceSource. During the measurement period included in the fiscal year ended November 30, 2023, measurement period adjustments were recorded to finalize net deferred tax assets at the acquired value as disclosed in the table above, resulting in a corresponding decrease to goodwill. The purchase price allocation is now final.
The amounts allocated to intangible assets are as follows:
| | | | | | | | | | | | | | | | | |
| Gross Carrying Amount | | Weighted-Average Useful Life | | Acceleration Method |
| Customer relationships | $ | 31,370 | | | 15 years | | Accelerated |
| Technology | 5,640 | | | 5 years | | Straight-line |
| Trade name | 3,190 | | | 3 years | | Straight-line |
| Total | $ | 40,200 | | | | | |
Acquisition-related and integration expenses
In connection with the acquisitions of PK and ServiceSource and the Webhelp Combination, the Company incurred $71,336, $33,763, and $825 of acquisition-related and integration expenses for the fiscal years ended 2023, 2022 and 2021, respectively. These expenses primarily include legal and professional services, cash-settled awards, severance and retention payments and costs associated with lease terminations to integrate the businesses. These
acquisition-related and integration expenses were recorded within selling, general and administrative expenses in the consolidated statement of operations.
Divestitures
In July 2021, the Company completed the sales of its insurance third-party administration operations and software platform, Concentrix Insurance Solutions (“CIS”), and another non-CX solutions business in separate transactions for total cash consideration of approximately $73,708, both subject to customary post-closing adjustments.$73,708. The divestitures generated a pre-tax gain of approximately $13,197, net of related transaction costs. The gain on divestitures and related transaction costs arewere included in selling, general and administrative expenses in the consolidated statements of operations.
The Company determined that the sale of the businesses did not qualify as discontinued operations. The results of the sold businesses’ operations are included within the Company’s statements of operations for the fiscal year 2021 through the sales dates in Julyended November 30, 2021.
NOTE 4—SHARE-BASED COMPENSATION:
In November 2020, in connection with the spin-off, TD SYNNEX, as sole stockholder of Concentrix, approved the Concentrix Corporation 2020 Stock Incentive Plan (the “Concentrix Stock Incentive Plan”) and the Concentrix Corporation 2020 Employee Stock Purchase Plan (the “Concentrix ESPP”), each to be effective upon completion of the spin-off. 4,000 shares of Concentrix common stock were reserved for issuance under the Concentrix Stock Incentive Plan, and 1,000 shares of Concentrix common stock were authorized for issuance under the Concentrix ESPP.
Prior to the spin-off, certain In December 2021 and 2022, respectively, 523 and 520 additional shares of the Company’s employees participated in a long-term incentive plan sponsored by TD SYNNEX. The Company recognized share-based compensation expense for all share-based awards made to Concentrix employees, including employee stock options, restricted stock awards, restricted stock units, performance-based restricted stock units and employee stock purchases, based on estimated fair values. In connection with the completion of the spin-off and pursuant to the employee matters agreement with TD SYNNEX, each outstanding TD SYNNEX share-based award as of the distribution date was converted into either (a) TD SYNNEX and Concentrix share-based awards, each with the same number of shares as the original TD SYNNEX award, or (b) a share-based award of only TD SYNNEX common stock or only Concentrix common stock with an adjustment to the number of shares to preserve the value of the award. As a result of the conversion of awards, on December 1, 2020, 827 restricted stock awards and restricted stock units and 684 stock options were issuedreserved for issuance under the Concentrix Stock Incentive Plan. FollowingPlan resulting from an automatic annual increase pursuant to the conversion, it was determined that the share-based awards were modified in accordance with the applicable accounting guidance. As a result, the fair valuesterms of the share-based awards immediately before and after the modification were assessed in order to determine if the modification resulted in any incremental compensation cost related to the awards. Based on the analysis performed, including consideration of the anti-dilution feature contained in the TD SYNNEX stock incentive plan, it was determined that the conversion resulted in an immaterial amount of incremental compensation cost for the outstanding awards.plan.
The Company recorded share-based compensation expense in the consolidated statements of operations for fiscal years 2021, 20202023, 2022 and 20192021 as follows:
| | Fiscal Years Ended November 30, |
| 2021 | | 2020 | | 2019 |
| Fiscal Years Ended November 30, | | | Fiscal Years Ended November 30, |
| 2023 | | | 2023 | | 2022 | | 2021 |
| Total share-based compensation | Total share-based compensation | $ | 36,762 | | | $ | 15,914 | | | $ | 10,554 | |
| Tax benefit recorded in the provision for income taxes | Tax benefit recorded in the provision for income taxes | (9,234) | | | (3,979) | | | (2,417) | |
| Effect on net income | Effect on net income | $ | 27,528 | | | $ | 11,935 | | | $ | 8,137 | |
Share-based compensation expense is included in selling, general and administrative expenses in the consolidated statements of operations.
Employee Stock Options
The Company uses the Black-Scholes valuation model to estimate the fair value of stock options. The Black-Scholes option-pricing model was developed for use in estimating the fair value of short-lived exchange traded options that have no vesting restrictions and are fully transferable. In addition, option-pricing models require the input of subjective assumptions, including the option’s expected life and the price volatility of the underlying stock. The stock options have a ten-year termterms and vesting terms of five years.
A summary of the changes in the employee stock options during fiscal years 20192021, 2022, and 20202023 is presented below:
| | | | | | | | | | | |
| Options Outstanding |
| Number of former parent shares (in thousands) | | Weighted- average exercise price per former parent share |
| Balance as of November 30, 2018 | 92 | | $ | 86.87 | |
| Options granted | 30 | | 110.44 |
| Balance as of November 30, 2019 | 122 | | 92.68 |
| Options granted | — | | | — | |
| Balance as of November 30, 2020 | 122 | | $ | 92.68 | |
A summary of the changes in the employee stock options during fiscal year 2021 is presented below:
| | Options Outstanding |
| Number of shares (in thousands) | | Weighted- average exercise price per share |
Balance as of December 1, 2020 (converted from former parent in connection with the spin-off) (1) | 684 | | | $ | 45.84 | |
| Options Outstanding | | | Options Outstanding |
| Number of shares (in thousands) | | | Number of shares (in thousands) | | Weighted- average exercise price per share |
Balance as of December 1, 2020 (converted from former parent stock options in connection with the spin-off) (1) | |
| Options granted | Options granted | 26 | | | 119.72 |
| Options exercised | Options exercised | (269) | | | 43.34 |
| Balance as of November 30, 2021 | Balance as of November 30, 2021 | 441 | | $ | 51.75 | |
| Options granted | |
Options issued in conversion of certain vested PK stock options (2) | |
| Options exercised | |
| Balance as of November 30, 2022 | |
| Options granted | |
| Options exercised | | Options exercised | (100) | | | 45.50 |
| Options cancelled | | Options cancelled | (1) | | | 30.70 |
| Balance as of November 30, 2023 | |
(1)Amounts represent Concentrix awards, including those held by TD SYNNEX employees.
The weighted-average grant date fair valueAmounts represent the issuance of thevested Concentrix stock options granted during fiscal year 2021 is $38.15.that were issued in conversion of certain vested PK stock options that were assumed by Concentrix pursuant to the merger agreement with PK.
As of November 30, 2021, 4412023, 294 options were outstanding with a weighted-average life of 6.554.85 years and an aggregate pre-tax intrinsic value of $50,235.$12,326. As of November 30, 2021, 2662023, 262 options were vested and exercisable with a weighted-average life of 5.954.68 years, a weighted-average exercise price of $49.23$51.87 per share, and an aggregate pre-tax intrinsic value of $31,041.$11,431.
As of November 30, 2021,2023, the unamortized share-based compensation expense related to unvested stock options under the Concentrix Stock Incentive Plan was $1,779,$538, which will be recognized over an estimated weighted-average amortization period of 3.001.54 years.
Restricted Stock Awards, Restricted Stock Units and Performance-Based Restricted Stock Units
The fair value of restricted stock awards and restricted stock units granted under the Concentrix Stock Incentive Plan in fiscal year 20212023 were determined based on the trading price of the Company’s common stock price aton the date of grant. The awards are expensed on a straight line basis over the vesting term, typically fourthree or fivefour years. The holders of restricted stock awards are entitled to the same voting, dividend and other rights as the Company’s common stockholders.
ForIn fiscal years 2023 and 2022, the Company granted performance-based restricted stock units to the grant date fair value assumes that the targeted performance goals will be achieved.Company’s senior executive team. The performance-based restricted stock units will vest, if at all, upon the achievement of certain annual financial targets during the three-year periods ending November 30, 2025 and November 30, 2024, respectively.
The Company granted performance-based restricted stock units in fiscal year 2021. These performance-based restricted stock units vested during fiscal year 2023 upon achievement of certain annual financial targets during the three-year period ending November 30, 2023.
A summary of the changes in the non-vested restricted stock awards, restricted stock units, and performance-based restricted stock units during fiscal years 2019 and 2020 is presented below:
| | | | | | | | | | | |
| Number of former parent shares (in thousands) | | Weighted-average, grant-date fair value per former parent share |
| Non-vested as of November 30, 2018 | 324 | | | $ | 97.53 | |
| Awards granted | 205 | | | 110.39 |
| Units granted | 181 | | | 97.33 |
| Awards and units vested | (61) | | | 94.36 |
| Awards and units cancelled/forfeited | (57) | | | 96.78 |
| Non-vested as of November 30, 2019 | 591 | | | 102.12 |
| Awards granted | 7 | | | 78.47 |
| Units granted | 1 | | | 83.88 |
| Awards and units vested | (110) | | | 102.77 |
| Awards and units cancelled/forfeited | (31) | | | 102.04 |
| Non-vested as of November 30, 2020 | 458 | | | $ | 101.57 | |
A summary of the changes in the non-vested restricted stock awards, restricted stock units, and performance-based stock units during fiscal yearyears 2021, 2022, and 2023, including the resultsconversion of the conversion offormer parent awards and stock units previously discussed, is presented below:
| | | | | | | | | | | |
| Number of shares (in thousands) | | Weighted-average, grant-date fair value per share |
Balance as of December 1, 2020 (converted from former parent in connection with the spin-off) (1) | 827 | | | $ | 51.53 | |
| Awards granted | 495 | | | 134.65 |
Units granted (2) | 226 | | | 154.53 |
| Awards and units vested | (504) | | | 61.95 |
| Awards and units cancelled/forfeited | (64) | | | 84.20 |
| Non-vested as of November 30, 2021 | 980 | | | $ | 109.92 | |
| | | | | | | | | | | |
| Number of shares (in thousands) | | Weighted-average, grant-date fair value per share |
Balance as of December 1, 2020 (converted from former parent awards and units in connection with the spin-off) (1) | 827 | | | $ | 51.53 | |
| Awards granted | 495 | | | 134.65 | |
Units granted (2) | 226 | | | 154.53 | |
| Awards and units vested | (504) | | | 61.95 | |
| Awards and units cancelled/forfeited | (64) | | | 84.20 | |
| Non-vested as of November 30, 2021 | 980 | | | 109.92 | |
| Awards granted | 510 | | | 139.31 | |
Units granted (2) | 294 | | | 130.98 | |
| Awards and units vested | (283) | | | 91.62 | |
| Awards and units cancelled/forfeited | (106) | | | 118.79 | |
| Non-vested as of November 30, 2022 | 1,395 | | | 124.69 | |
| Awards granted | 60 | | | 135.01 | |
Units granted (2) | 1,828 | | | 74.64 | |
Performance-based units vested in excess of target (3) | 17 | | | 159.97 | |
| Awards and units vested | (513) | | | 122.76 | |
| Awards and units cancelled/forfeited | (114) | | | 138.88 | |
| Non-vested as of November 30, 2023 | 2,673 | | | $ | 92.80 | |
(1)Amounts represent Concentrix awards, including those held by TD SYNNEX employees.
(2)For performance-based restricted stock units, the maximumtarget number of shares that can be awarded upon full vesting of the grants is included.
(3)Amounts represent performance-based awards that vested in excess of the target number of shares for the fiscal year 2021 performance-based grants.
As of November 30, 2021,2023, there was $99,570$211,603 of total unamortized share-based compensation expense related to non-vested restricted stock awards, restricted stock units and performance-based restricted stock units granted under the Concentrix Stock Incentive Plan. That cost is expected to be recognized over an estimated weighted-average amortization period of 3.052.65 years.
NOTE 5—BALANCE SHEET COMPONENTS:
Cash, cash equivalents and restricted cash:
The following table provides a reconciliation of cash, cash equivalents and restricted cash reported within the consolidated balance sheets that sum to the total of the same amounts shown in the consolidated statements of cash flows:
| | As of November 30, |
| 2021 | | 2020 |
| As of November 30, | | | As of November 30, |
| 2023 | | | 2023 | | 2022 |
| Cash and cash equivalents | Cash and cash equivalents | $ | 182,038 | | | $ | 152,656 | |
| Restricted cash included in other current assets | Restricted cash included in other current assets | 972 | | | 3,695 | |
| Cash, cash equivalents and restricted cash | Cash, cash equivalents and restricted cash | $ | 183,010 | | | $ | 156,351 | |
Restricted cash balances relate primarily to funds held for clients, restrictions placed on cash deposits by banks as collateral for the issuance of bank guarantees and the terms of a government grant.grant, and letters of credit for leases. The Company had a corresponding current liability recorded in other accrued liabilities on the consolidated balance sheet related to funds held for clients of approximately $218,228 and $9,679 as of November 30, 2023 and 2022, respectively.
Accounts receivable, net:
Accounts receivable, net is comprised of the following as of November 30, 20212023 and 2020:2022:
| | As of November 30, |
| 2021 | | 2020 |
| As of November 30, | | | As of November 30, |
| 2023 | | | 2023 | | 2022 |
| Billed accounts receivable | Billed accounts receivable | $ | 714,032 | | | $ | 644,789 | |
| Unbilled accounts receivable | Unbilled accounts receivable | 499,342 | | | 445,655 | |
| Less: Allowance for doubtful accounts | Less: Allowance for doubtful accounts | (5,421) | | | (8,963) | |
| Accounts receivable, net | Accounts receivable, net | $ | 1,207,953 | | | $ | 1,081,481 | |
Allowance for doubtful trade receivables:
Presented below is a progression of the allowance for doubtful trade receivable:receivables:
| | | | | |
Balance at November 30, 2018 | $ | 1,000 | |
Additions | 5,134 | |
Write-offs and reclassifications | (79) | |
Balance at November 30, 2019 | 6,055 | |
Additions | 8,140 | |
Write-offs and reclassifications | (5,232) | |
Balance at November 30, 2020 | 8,963 | |
Reductions | (202) | |
Write-offs and reclassifications | (3,340) | |
Balance at November 30, 2021 | $ | 5,421 | |
| | | | | | | | | | | | | | | | | |
| Fiscal Years Ended November 30, |
| 2023 | | 2022 | | 2021 |
| Balance at beginning of period | $ | 4,797 | | | $ | 5,421 | | | $ | 8,963 | |
| Net additions (reductions) | 10,236 | | | 3,329 | | | (202) | |
| Write-offs and reclassifications | (2,500) | | | (3,953) | | | (3,340) | |
| Balance at end of period | $ | 12,533 | | | $ | 4,797 | | | $ | 5,421 | |
Property and equipment, net:
The following tables summarizetable summarizes the carrying amounts and related accumulated depreciation for property and equipment as of November 30, 20212023 and 2020:2022:
| | As of November 30, |
| 2021 | | 2020 |
| As of November 30, | | | As of November 30, |
| 2023 | | | 2023 | | 2022 |
| Land | Land | $ | 27,677 | | | $ | 29,000 | |
| Equipment, computers and software | Equipment, computers and software | 488,270 | | | 476,243 | |
| Furniture and fixtures | Furniture and fixtures | 90,442 | | | 90,944 | |
| Buildings, building improvements and leasehold improvements | Buildings, building improvements and leasehold improvements | 364,166 | | | 336,194 | |
| Construction-in-progress | Construction-in-progress | 10,741 | | | 10,115 | |
| Total property and equipment, gross | Total property and equipment, gross | $ | 981,296 | | | $ | 942,496 | |
| Less: Accumulated depreciation | Less: Accumulated depreciation | (574,152) | | | (490,847) | |
| Property and equipment, net | Property and equipment, net | $ | 407,144 | | | $ | 451,649 | |
Shown below are the countries where 10% or more and other significant concentrations of the Company’s property and equipment, net are located as of November 30, 20212023 and 2020:2022:
| | As of November 30, |
| 2021 | | 2020 |
| As of November 30, | | | As of November 30, |
| 2023 | | | 2023 | | 2022 |
| Property and equipment, net: | Property and equipment, net: | | | |
| United States | United States | $ | 101,333 | | | $ | 149,903 | |
| United States | |
| United States | |
| Philippines | Philippines | 87,548 | | | 87,686 | |
| France | |
| India | India | 46,167 | | | 46,642 | |
| Others | Others | 172,096 | | | 167,418 | |
| Total | Total | $ | 407,144 | | | $ | 451,649 | |
Accumulated other comprehensive income (loss):
The components of accumulated other comprehensive income (loss) (“AOCI”), net of taxes, were as follows:
| | Unrecognized gains (losses) on defined benefit plan, net of taxes | | Unrealized gains (losses) on cash flow hedges, net of taxes | | Foreign currency translation adjustment and other, net of taxes | | Total |
| Balance, November 30, 2019 | $ | (29,940) | | | $ | 17,523 | | | $ | (37,665) | | | $ | (50,082) | |
| Unrecognized gains (losses) on defined benefit plan, net of taxes | |
| Unrecognized gains (losses) on defined benefit plan, net of taxes | |
| Unrecognized gains (losses) on defined benefit plan, net of taxes | | | Unrealized gains (losses) on hedges, net of taxes | | | Foreign currency translation adjustment and other, net of taxes | | Total |
| Balance, November 30, 2021 | |
| Other comprehensive income (loss) before reclassification | Other comprehensive income (loss) before reclassification | (8,644) | | | 34,508 | | | 43,196 | | | 69,060 | |
| Reclassification of (gains) losses from other comprehensive income (loss) | Reclassification of (gains) losses from other comprehensive income (loss) | — | | | (22,792) | | | — | | | (22,792) | |
| Balance, November 30, 2020 | $ | (38,584) | | | $ | 29,239 | | | $ | 5,531 | | | $ | (3,814) | |
| Balance, November 30, 2022 | |
| Other comprehensive income (loss) before reclassification | Other comprehensive income (loss) before reclassification | 15,839 | | | (8,396) | | | (51,909) | | | (44,466) | |
| Reclassification of gains from other comprehensive income (loss) | Reclassification of gains from other comprehensive income (loss) | — | | | (22,246) | | | — | | | (22,246) | |
| Balance, November 30, 2021 | $ | (22,745) | | | $ | (1,403) | | | $ | (46,378) | | | $ | (70,526) | |
| Balance, November 30, 2023 | |
Refer to Note 77—Derivative Instruments for the location of gains and losses fromon cash flow hedges reclassified from other comprehensive income (loss) to the consolidated statements of operations. Reclassifications of amortization of
actuarial (gains) losses of defined benefit plans is recorded in “Other expense (income), net” in the consolidated statement of operations.
Restructuring:
The following table presents the activity related to liabilities for restructuring charges of previous acquisitions for the fiscal years ended November 30, 2021 and 2020:
| | | | | | | | | | | | | | | | | |
| Severance and benefits | | Facility and exit costs | | Total |
| Accrued balance as of November 30, 2019 | $ | 2,828 | | | $ | 14,164 | | | $ | 16,992 | |
| Additional (release of) accrual during the period | (584) | | | 12,155 | | | 11,571 | |
| Cash payments | (2,244) | | | (8,509) | | | (10,753) | |
| Accrued balance as of November 30, 2020 | $ | — | | | $ | 17,810 | | | $ | 17,810 | |
| Release of accrual during the period | — | | | (248) | | | (248) | |
| Cash payments | — | | | (5,156) | | | (5,156) | |
| Accrued balance as of November 30, 2021 | $ | — | | | $ | 12,406 | | | $ | 12,406 | |
NOTE 6—GOODWILL AND INTANGIBLE ASSETS:
Goodwill
The Company tests goodwill for impairment annually as of the fourth quarter of its fiscal year and at other times if events have occurred or circumstances exist that indicate the carrying value of goodwill may no longer be recoverable. Goodwill impairment testing is performed at the reporting unit level. Based on the current year assessment, wethe Company concluded that no impairment charges were necessary for the Company’s reporting unit. We haveThe Company has not recorded any impairment charges related to goodwill during the three-year period ended November 30, 2021.2023.
Below is a progression of goodwill for fiscal years 20212023 and 2020:2022:
| | | | | | | | | | | |
| Fiscal Years Ended November 30, |
| 2021 | | 2020 |
| Balance, beginning of year | $ | 1,836,050 | | | $ | 1,829,328 | |
| Acquisitions | 3,502 | | | — | |
| Divestitures | (14,690) | | | — | |
| Foreign currency translation | (11,360) | | | 6,722 | |
| Balance, end of year | $ | 1,813,502 | | | $ | 1,836,050 | |
| | | | | | | | | | | |
| Fiscal Years Ended November 30, |
| 2023 | | 2022 |
| Balance, beginning of year | $ | 2,904,402 | | | $ | 1,813,502 | |
| Acquisitions | 2,085,344 | | | 1,165,072 | |
| Acquisition measurement period adjustments | (10,592) | | | — | |
| Foreign currency translation | 99,514 | | | (74,172) | |
| Balance, end of year | $ | 5,078,668 | | | $ | 2,904,402 | |
Other Intangible Assets
The Company’s other intangible assets, primarily acquired through business combinations, are subject to amortization and are evaluated periodically if events or circumstances indicate a possible inability to recover their carrying amounts. No impairment charges were recognized in any period presented. As of November 30, 20212023 and 2020,2022, the Company’s other intangible assets consisted of the following:
| | As of November 30, 2021 | | As of November 30, 2020 |
| Gross amounts | | Accumulated amortization | | Net amounts | | Gross amounts | | Accumulated amortization | | Net amounts |
| As of November 30, 2023 | | | As of November 30, 2023 | | As of November 30, 2022 |
| Gross amounts | | | Gross amounts | | Accumulated amortization | | Net amounts | | Gross amounts | | Accumulated amortization | | Net amounts |
| Customer relationships | Customer relationships | $ | 1,347,961 | | | $ | (694,701) | | | $ | 653,260 | | | $ | 1,389,341 | | | $ | (595,024) | | | $ | 794,317 | |
| Technology | Technology | 10,835 | | | (8,900) | | | 1,935 | | | 14,830 | | | (11,045) | | | 3,785 | |
| Trade names | Trade names | 6,724 | | | (6,391) | | | 333 | | | 6,846 | | | (5,989) | | | 857 | |
| $ | 1,365,520 | | | $ | (709,992) | | | $ | 655,528 | | | $ | 1,411,017 | | | $ | (612,058) | | | $ | 798,959 | |
| Non-compete agreements | |
| $ | |
Amortization expense for intangible assets was $136,939, $147,283,$214,832, $162,673, and $166,606$136,939 for the fiscal years ended November 30, 2021, 20202023, 2022 and 2019,2021, respectively, and the related estimated expense for the five subsequent fiscal years and thereafter is as follows:
| | Fiscal Years Ending November 30, | Fiscal Years Ending November 30, | | Fiscal Years Ending November 30, | Amortization Expense |
| 2022 | $ | 114,593 | |
| 2023 | 100,590 | |
| 2024 | 2024 | 84,268 | |
| 2025 | 2025 | 74,320 | |
| 2026 | 2026 | 61,402 | |
| 2027 | |
| 2028 | |
| Thereafter | Thereafter | 220,355 | |
| Total | Total | $ | 655,528 | |
The remaining weighted average amortization period for customer relationships and other intangible assets is approximately 1114 years.
NOTE 7—DERIVATIVE INSTRUMENTS:
In the ordinary course of business, the Company is exposed to foreign currency risk and credit risk. The Company enters into transactions, and owns monetary assets and liabilities, that are denominated in currencies other than the legal entity’s functional currency. The Company may enter into forward contracts, option contracts, or other derivative instruments to offset a portion of the risk on expected future cash flows, earnings, net investments in certain non-U.S. legal entities and certain existing assets and liabilities. However, the Company may choose not to hedge certain exposures for a variety of reasons including, but not limited to, accounting considerations and the prohibitive economic cost of hedging particular exposures. There can be no assurance the hedges will offset more than a portion of the financial impact resulting from movements in foreign currency exchange or interest rates. Generally, the Company does not use derivative instruments to cover equity risk and credit risk. The Company’s hedging program is not used for trading or speculative purposes.
All derivatives are recognized on the consolidated balance sheets at their fair values. Changes in the fair value of derivatives are recorded in the consolidated statements of operations, or as a component of AOCI in the consolidated balance sheets, as discussed below.
Cash Flow Hedges
To protect gross margins from fluctuations in foreign currency exchange rates, certain of the Company’s legal entities with functional currencies that are not in U.S. dollars may hedge a portion of forecasted revenue or costs not denominated in the entities’ functional currencies. These instruments mature at various dates through November 2023.2025. Gains and losses on cash flow hedges are recorded in AOCI until the hedged item is recognized in earnings. Deferred gains and losses associated with cash flow hedges of foreign currency revenue are recognized as a component of “Revenue” in the same period as the related revenue is recognized, and deferred gains and losses related to cash flow hedges of foreign currency costs are recognized as a component of “Cost of revenue” and/or “Selling, general and administrative expenses” in the same period as the related costs are recognized. Derivative instruments designated as cash flow hedges must be de-designated as hedges when it is probable the forecasted hedged transaction will not occur in the initially identified time period or within a subsequent two-month time period. Deferred gains and losses in AOCI associated with such derivative instruments are reclassified into earnings in the period of de-designation. Any subsequent changes in fair value of such derivative instruments are recorded in earnings unless they are re-designated as hedges of other transactions.
Non-Designated Derivatives
The Company uses short-term forward contracts to offset the foreign exchange risk of assets and liabilities denominated in currencies other than the functional currencycurrencies of the respective entities.Company’s legal entities that own the assets or liabilities. These contracts, which are not designated as hedging instruments, mature or settle within twelve months. Derivatives that are not designated as hedging instruments are adjusted to fair value through earnings in the financial statement line item to which the derivative relates.
During the second quarter of 2023, the Company entered into short-term foreign exchange forward call option contracts to offset the foreign exchange risk associated with the cash payment required to be made in euros upon the closing of the Webhelp Combination. These derivatives were not designated as hedging instruments and were adjusted to fair value through earnings and included in other expense (income), net in the consolidated statement of operations. These derivatives were settled subsequent to the Webhelp Combination.
Cross-currency interest rate swaps
In connection with the closing of the Webhelp Combination, the Company entered into cross-currency swap arrangements with certain financial institutions for a total notional amount of $500,000 of the Company’s senior notes. In addition to aligning the currency of a portion of the Company’s interest payments to the Company’s euro-denominated cash flows, the arrangements, together with intercompany loans and additional intercompany cross-currency interest rate swap arrangements described below, effectively converted $250,000 aggregate principal
amount of the Company’s 6.650% Senior Notes due 2026 and $250,000 aggregate principal amount of the Company’s 6.660% Senior Notes due 2028 into synthetic fixed euro-based debt at weighted average interest rates of 5.12% and 5.18%, respectively.
Concurrent with entering into the cross-currency interest rate swaps with certain financial institutions, Marnix SAS, a wholly owned subsidiary of Concentrix, entered into corresponding U.S. dollar denominated intercompany loan agreements with certain other subsidiaries of Concentrix with identical terms and notional amounts as the underlying $500,000 U.S. dollar denominated senior notes, with reciprocal cross currency interest rate swaps.
The cross-currency interest rate swaps are designated as fair value hedges.
Fair Values of Derivative Instruments in the Consolidated Balance Sheets
The fair values of the Company’s derivative instruments are disclosed in Note 8—Fair Value Measurements and summarized in the table below:
| | Value as of |
| | Value as of | | | | Value as of |
| Balance Sheet Line Item | Balance Sheet Line Item | | November 30, 2021 | | November 30, 2020 | Balance Sheet Line Item | | November 30, 2023 | | November 30, 2022 |
| Derivative instruments not designated as hedging instruments: | Derivative instruments not designated as hedging instruments: | | | | |
| Foreign exchange forward contracts (notional value) | Foreign exchange forward contracts (notional value) | | $ | 1,415,447 | | | $ | 1,153,352 | |
| Foreign exchange forward contracts (notional value) | |
| Foreign exchange forward contracts (notional value) | |
| Other current assets | Other current assets | | 10,058 | | | 15,666 | |
| Other accrued liabilities | Other accrued liabilities | | 12,542 | | | 6,215 | |
| Derivative instruments designated as fair value hedges: | |
| Cross-currency interest rate swaps (notional value) | |
| Cross-currency interest rate swaps (notional value) | |
| Cross-currency interest rate swaps (notional value) | |
| Other long-term liabilities | |
| Derivative instruments designated as cash flow hedges: | Derivative instruments designated as cash flow hedges: | |
| Foreign exchange forward contracts (notional value) | |
| Foreign exchange forward contracts (notional value) | |
| Foreign exchange forward contracts (notional value) | Foreign exchange forward contracts (notional value) | | $ | 918,097 | | | $ | 814,731 | |
| Other current assets and other assets | Other current assets and other assets | | 7,851 | | | 38,212 | |
| Other accrued liabilities and other long-term liabilities | Other accrued liabilities and other long-term liabilities | | 9,736 | | | 309 | |
Volume of activity
The notional amounts of foreign exchange forward contracts represent the gross amounts of foreign currency, including, principally, the Philippine peso, the Indian rupee, the euro, the British pound, the Canadian dollar, and the Japanese yen and the Australian dollar, that will be bought or sold at maturity. The notional amounts for outstanding derivative instruments provide one measure of the transaction volume outstanding and do not represent the amount of the Company’s exposure to credit or market loss. The Company’s exposure to credit loss and market risk will vary over time as currency exchange rates change.
The Effect of Derivative Instruments on AOCI and the Consolidated Statements of Operations
The following table shows the gains and losses, before taxes, of the Company’s derivative instruments designated as cash flow hedges and not designated as hedging instruments in other comprehensive income (“OCI”), and the consolidated statements of operations for the periods presented:
| | Fiscal Years Ended November 30, |
| Location of gain (loss) in statement of operations | | 2021 | | 2020 | | 2019 |
| Derivative instruments designated as cash flow hedges: | | | | | | | |
| | | Fiscal Years Ended November 30, | | | | | Fiscal Years Ended November 30, |
| Location of gain (loss) in statement of operations | | | Location of gain (loss) in statement of operations | | 2023 | | 2022 | | 2021 |
| Derivative instruments designated as cash flow and fair value hedges: | |
| (Losses) gains recognized in OCI: | |
| (Losses) gains recognized in OCI: | |
| (Losses) gains recognized in OCI: | (Losses) gains recognized in OCI: | |
| Foreign exchange forward contracts | Foreign exchange forward contracts | | $ | (11,105) | | | $ | 45,986 | | | $ | 20,772 | |
| Foreign exchange forward contracts | |
| Foreign exchange forward contracts | |
| Cross-currency interest rate swaps | |
| | | $ | |
| | Gains (losses) reclassified from AOCI into income: | Gains (losses) reclassified from AOCI into income: | |
| Gains (losses) reclassified from AOCI into income: | |
| Gains (losses) reclassified from AOCI into income: | |
| Foreign exchange forward contracts | |
| Foreign exchange forward contracts | |
| Foreign exchange forward contracts | Foreign exchange forward contracts | |
| Gain reclassified from AOCI into income | Gain reclassified from AOCI into income | Revenue for services | | $ | — | | | $ | — | | | $ | 127 | |
| Gain reclassified from AOCI into income | Gain reclassified from AOCI into income | Cost of revenue for services | | 21,138 | | | 21,532 | | | 16,454 | |
| Gain reclassified from AOCI into income | Gain reclassified from AOCI into income | Selling, general and administrative expenses | | 8,606 | | | 8,841 | | | 6,767 | |
| Gain reclassified from AOCI into income | Other expense (income), net | | — | | | — | | | 36 | |
| (Loss) gain reclassified from AOCI into income | |
| (Loss) gain reclassified from AOCI into income | |
| Total | Total | | $ | 29,744 | | | $ | 30,373 | | | $ | 23,384 | |
| | Derivative instruments not designated as hedging instruments: | Derivative instruments not designated as hedging instruments: | |
(Loss) gain recognized from foreign exchange forward contracts, net(1) | Other expense (income), net | | $ | (2,880) | | | $ | 32,150 | | | $ | 20,833 | |
| Derivative instruments not designated as hedging instruments: | |
| Derivative instruments not designated as hedging instruments: | |
Loss recognized from foreign exchange forward contracts, net(1) | |
Loss recognized from foreign exchange forward contracts, net(1) | |
Loss recognized from foreign exchange forward contracts, net(1) | |
| Loss recognized from foreign exchange call options contracts, net | |
| Total | |
(1) The gains and losses largely offset the currency gains and losses that resulted from changes in the assets and liabilities denominated in nonfunctional currencies.
There were no material gain or loss amounts excluded from the assessment of effectiveness. Existing net lossesgains in AOCI that are expected to be reclassified into earnings in the normal course of business within the next twelve months are $968.$9,209.
Offsetting of Derivatives
In the consolidated balance sheets, the Company does not offset derivative assets against liabilities in master netting arrangements.
Credit exposure for derivative financial instruments is limited to the amounts, if any, by which the counterparties’ obligations under the contracts exceed the Company’s obligations to the counterparties. The Company manages the potential risk of credit losses through careful evaluation of counterparty credit standing and selection of counterparties from a limited group of financial institutions.institutions with high credit standing.
NOTE 8—FAIR VALUE MEASUREMENTS:
The Company’s fair value measurements are classified and disclosed in one of the following three categories:
Level 1: Unadjusted quoted prices in active markets that are accessible at the measurement date for identical, unrestricted assets or liabilities;
Level 2: Quoted prices in markets that are not active, or inputs which are observable, either directly or indirectly, for substantially the full term of the asset or liability; and
Level 3: Prices or valuation techniques that require inputs that are both significant to the fair value measurement and unobservable (i.e., supported by little or no market activity).
The following table summarizes the valuation of the Company’s investments and financial instruments that are measured at fair value on a recurring basis:
| | | | | | | | | | | | | | | | | | | | | | | | | | | | | | | | | | | | | | | | | | | | | | | |
| As of November 30, 2021 | | As of November 30, 2020 |
| | Fair value measurement category | | | Fair value measurement category |
| Total | | Level 1 | | Level 2 | | Level 3 | | Total | | Level 1 | | Level 2 | | Level 3 |
| Assets: | | | | | | | | | | | | | | | |
| Cash equivalents | $ | 77,332 | | | $ | 77,332 | | | $ | — | | | $ | — | | | $ | 60,242 | | | $ | 60,242 | | | $ | — | | | $ | — | |
| Foreign government bond | 1,446 | | | 1,446 | | | — | | | — | | | 1,355 | | | 1,355 | | | — | | | — | |
| Forward foreign currency exchange contracts | 17,909 | | | — | | | 17,909 | | | — | | | 53,878 | | | — | | | 53,878 | | | — | |
| Liabilities: | | | | | | | | | | | | | | | |
| Forward foreign currency exchange contracts | $ | 22,278 | | | $ | — | | | $ | 22,278 | | | $ | — | | | $ | 6,524 | | | $ | — | | | $ | 6,524 | | | $ | — | |
| | | | | | | | | | | | | | | | | | | | | | | | | | | | | | | | | | | | | | | | | | | | | | | |
| As of November 30, 2023 | | As of November 30, 2022 |
| | Fair value measurement category | | | Fair value measurement category |
| Total | | Level 1 | | Level 2 | | Level 3 | | Total | | Level 1 | | Level 2 | | Level 3 |
| Assets measured at fair value: | | | | | | | | | | | | | | | |
| Cash equivalents | $ | 52,847 | | | $ | 52,847 | | | $ | — | | | $ | — | | | $ | 89,932 | | | $ | 89,932 | | | $ | — | | | $ | — | |
| Foreign government bond | 1,853 | | | 1,853 | | | — | | | — | | | 1,529 | | | 1,529 | | | — | | | — | |
| Forward foreign currency exchange contracts | 30,408 | | | — | | | 30,408 | | | — | | | 29,228 | | | — | | | 29,228 | | | — | |
| Liabilities measured at fair value: | | | | | | | | | | | | | | | |
| Forward foreign currency exchange contracts | 23,580 | | | — | | | 23,580 | | | — | | | 47,869 | | | — | | | 47,869 | | | — | |
| Cross-currency interest rate swaps | 17,219 | | | — | | | 17,219 | | | — | | | — | | | — | | | — | | | — | |
| Acquisition contingent consideration | 48,600 | | | — | | | 48,600 | | | — | | | — | | | — | | | — | | | — | |
| Liabilities measured at other than fair value: | | | | | | | | | | | | | | | |
| Long term debt (senior notes) | | | | | | | | | | | | | | | |
| Fair value | 2,146,554 | | | — | | | 2,146,554 | | | — | | | — | | | — | | | — | | | — | |
| Carrying amount | 2,131,870 | | | — | | | — | | | — | | | — | | | — | | | — | | | — | |
The Company’s cash equivalents consist primarily of highly liquid investments in money market funds and term deposits with maturity periods of three months or less. The carrying values of cash equivalents approximate fair value since they are near their maturity. Investment in foreign government bond classified as an available-for-sale debt security is recorded at fair value based on quoted market prices. The fair values of forward exchange contracts are measured based on the foreign currency spot and forward rates. Fair values of long-term foreign currency exchange contracts are measured using valuations based upon quoted prices for similar assets and liabilities in active markets and are valued by reference to similar financial instruments, adjusted for terms specific to the contracts. The fair values of the cross-currency interest rate swaps are determined using a market approach that is based on observable inputs other than quoted market prices, including contract terms, interest rates, currency rates, and other market factors. The estimated fair value of the acquisition contingent consideration was determined using a Monte-Carlo simulation model. The inputs include the closing price of Concentrix common stock as of the reporting period end date, Concentrix-specific historical equity volatility, and the risk-free rate.
The effect of nonperformance risk on the fair value of derivative instruments was not material as of November 30, 20212023 and 2020.2022.
The carrying values of term deposits with maturities less than one year, accounts receivable and accounts payable approximate fair value due to their short maturities and interest rates whichthat are variable in nature. The carrying values of the outstanding balance on the Term Loanterm loan under the Company’s Credit Facilitysenior credit facility and the outstanding balance on the Securitization Facility approximate their fair values since they bear interest rates that are similar to existing market rates. The fair values of the 2026 Notes, 2028 Notes, and 2033 Notes (as defined in Note 9) were based on quoted prices in active markets and are classified within Level 2 of the fair value hierarchy. The Company does not adjust the quoted market prices for such financial instruments.
During fiscal years 2021, 20202023, 2022 and 2019,2021, there were no transfers between the fair value measurement category levels.
NOTE 9—BORROWINGS:
Borrowings consist of the following:
| | | | | | | | | | | |
| As of November 30, |
| 2023 | | 2022 |
| Other loans | $ | 2,313 | | | $ | — | |
| Current portion of long-term debt | $ | 2,313 | | | $ | — | |
| | | |
| 6.650% Senior Notes due 2026 | $ | 800,000 | | | $ | — | |
| 6.600% Senior Notes due 2028 | 800,000 | | | — | |
| 6.850% Senior Notes due 2033 | 550,000 | | | — | |
| Credit Facility - Term Loan component | 1,950,000 | | | 1,875,000 | |
| Securitization Facility | 128,500 | | | 356,500 | |
| Sellers' Note | 762,286 | | | — | |
| Other loans | 5,301 | | | — | |
| Long-term debt, before unamortized debt discount and issuance costs | 4,996,087 | | | 2,231,500 | |
| Less: unamortized debt discount and issuance costs | (56,375) | | | (7,212) | |
| Long-term debt, net | $ | 4,939,712 | | | $ | 2,224,288 | |
Senior Notes
On August 2, 2023, the Company issued and sold (i) $800,000 aggregate principal amount of 6.650% Senior Notes due 2026 (the “2026 Notes”), (ii) $800,000 aggregate principal amount of 6.600% Senior Notes due 2028 (the “2028 Notes”) and (iii) $550,000 aggregate principal amount of 6.850% Senior Notes due 2033 (the “2033 Notes” and, together with the 2026 Notes and 2028 Notes, the “Senior Notes”). The Senior Notes were sold in a registered public offering pursuant to the Company’s Registration Statement on Form S-3, which became effective upon filing, and a Prospectus Supplement dated July 19, 2023, to a Prospectus dated July 17, 2023.
The Senior Notes were issued pursuant to, and are governed by, an indenture, dated as of August 2, 2023 (the “Base Indenture”), between Concentrix and U.S. Bank Trust Company, National Association, as trustee (the “Trustee”), as supplemented by a first supplemental indenture dated as of August 2, 2023 between Concentrix and the Trustee relating to the 2026 Notes, a second supplemental indenture dated as of August 2, 2023 between Concentrix and the Trustee relating to the 2028 Notes, and a third supplemental indenture dated as of August 2, 2023 between Concentrix and the Trustee relating to the 2033 Notes (such supplemental indentures, together with the Base Indenture, the “Indenture”). The Indenture contains customary covenants and restrictions, including covenants that limit Concentrix Corporation’s and certain of its subsidiaries’ ability to create or incur liens on shares
NOTE 9—BORROWINGS:of stock of certain subsidiaries or on principal properties, engage in sale/leaseback transactions or, with respect to Concentrix Corporation, consolidate or merge with, or sell or lease substantially all its assets to, another person. The Indenture also provides for customary events of default.
Borrowings consist
The Company used the net proceeds of the following:offering and sale of the Senior Notes, together with approximately $294,702 of delayed draw borrowings under its $2,144,700 senior unsecured term loan facility and cash on hand, to pay the cash portion of the Webhelp Combination consideration, repay approximately $1,915,197 of existing indebtedness of Webhelp Parent and its subsidiaries, and pay related fees and expenses in connection with the Webhelp Combination. The remaining proceeds were used for general corporate purposes of the Company.
| | | | | | | | | | | |
| As of November 30, |
| 2021 | | 2020 |
| Credit Facility - current portion of Term Loan component | $ | — | | | $ | 33,750 | |
| Current portion of long term debt | $ | — | | | $ | 33,750 | |
| | | |
| Credit Facility - Term Loan component | $ | 700,000 | | | $ | 866,250 | |
| Securitization Facility | 105,000 | | | 250,000 | |
| Long-term debt, before unamortized debt discount and issuance costs | 805,000 | | | 1,116,250 | |
| Less: unamortized debt discount and issuance costs | (2,983) | | | (4,888) | |
| Long-term debt, net | $ | 802,017 | | | $ | 1,111,362 | |
The Company incurred debt discount and issuance costs of approximately $19,300 associated with the Senior Notes during the fiscal year ended November 30, 2023, which are being amortized over the applicable maturity dates.
Bridge Facility and Restated Credit Facility
On October 16, 2020, ConcentrixTo provide the debt financing required by the Company to consummate the Webhelp Combination, the Company entered into a senior secured creditcommitment letter dated March 29, 2023 (the “Bridge Commitment Letter,” and the commitments pursuant to the Bridge Commitment Letter, the “Bridge Facility”), under which certain financing institutions committed to provide a 364-day bridge loan facility whichin an aggregate principal amount of $5,290,000 consisting of (i) a $1,850,000 tranche of term bridge loans (the “Term Loan Amendment Tranche”), (ii) a $1,000,000 tranche of revolving commitments (the “Revolver Amendment Tranche”) and (iii) a $2,440,000 tranche of term bridge loans (the “Acquisition Tranche”), each subject to the satisfaction of certain customary closing conditions, including the consummation of the Webhelp Combination.
The incurrence of the acquisition-related indebtedness that would be funded by the Acquisition Tranche of the Bridge Facility (or permanent financing in lieu thereof) and by the Sellers’ Note was not permitted under the Prior Credit Facility. Therefore, on April 21, 2023, the Company entered into an Amendment and Restatement Agreement (the “Amendment Agreement”) with the lenders party thereto, JPMorgan Chase Bank, N.A. and Bank of America, N.A. to amend and restate the Prior Credit Facility (as amended and restated, the “Restated Credit Facility”). As a result of having entered into the Amendment Agreement, among other things, the Company obtained requisite lender consent to incur acquisition-related indebtedness, and pursuant to the terms of the Bridge Commitment Letter, the commitments with respect to the Term Loan Amendment Tranche and the Revolver Amendment Tranche of the Bridge Facility were each reduced to zero, and the Acquisition Tranche was reduced by approximately $294,702. On August 2, 2023, the remaining outstanding commitment of approximately $2,145,298 under the Bridge Commitment Letter was reduced to zero in connection with the issuance of the Senior Notes.
The Restated Credit Facility provides for the extension of a senior unsecured revolving loanscredit facility not to exceed an aggregate principal amount of $1,042,500. The Restated Credit Facility also provides for a senior unsecured term loan facility in an aggregate principal amount not to exceed approximately $2,144,700 (the “Term Loan”), of which $1,850,000 was incurred upon the amendment and approximately $294,702 was drawn on a delayed draw basis on the Closing Date (the “Delayed Draw Term Loans”). Aggregate borrowing capacity under the Restated Credit Facility may be increased by up to $600,000 (the “Revolver”) and term loan borrowings of up to $900,000 (the “Term Loan” and, together withan additional $500,000 by increasing the Revolver, the “Credit Facility”). On November 30, 2020, in connection with the spin-off, the Company incurred $900,000 of initial Term Loan borrowings under the Credit Facility. Substantially allamount of the proceeds from such indebtedness, net of debt issuance costs, were transferredrevolving credit facility or by incurring additional term loans, in each case subject to TD SYNNEX on November 30, 2020 to eliminate debt owed by Concentrix to TD SYNNEX and in exchange for the contributionsatisfaction of certain Concentrix trademarks from TD SYNNEX to Concentrix.
Beginning May 31, 2021,conditions set forth in the outstanding principal of the Term Loan was payable in quarterly installments of $11,250, with the unpaid balance due in full on the maturity date. Concentrix may prepay the loans under theRestated Credit Facility, at any time without penalty, other than breakage fees.including the receipt of additional commitments for such increase. During the fiscal year ended November 30, 2021,2023, the Company paid $200,000voluntarily prepaid $194,702 of the principal balance on the Term Loan, including $166,250without penalty, resulting in an outstanding balance at November 30, 2023 of voluntary prepayments.approximately $1,950,000.
Concentrix may request,The maturity date of the Restated Credit Facility remains December 27, 2026, subject, in the case of the revolving credit facility, to obtaining commitments from any participatingtwo one-year extensions upon the Company’s prior notice to the lenders and certain other conditions, incremental commitments to increase the amountagreement of the Revolver or Term Loan availablelenders to extend such maturity date. Due to the voluntary prepayments previously described, no principal payment on the term loans is due until fiscal year 2026 with the remaining outstanding principal amount due in full on the maturity date.
Borrowings under the Restated Credit Facility bear interest, in an aggregate principal amountthe case of SOFR rate loans, at a per annum rate equal to $450,000,the applicable SOFR rate (but not less than 0.0%), plus an additional amount, so long as after giving effectapplicable margin, which ranges from 1.125% to 2.000%, based on the credit ratings of the Company’s senior unsecured non-credit enhanced long-term indebtedness for borrowed money plus a credit spread adjustment to the SOFR rate of 0.10%. Borrowings under the Restated Credit Facility that are base rate loans bear interest at a per annum rate (but not less than 1.0%) equal to (i) the greatest of (A) the Prime Rate (as defined in the Restated Credit Facility) in effect on such day, (B) the NYFRB Rate (as defined in the Restated Credit Facility) in effect on such day plus ½ of 1.0%, and (C) the adjusted one-month term SOFR rate plus 1.0% per annum, plus (ii) an applicable margin, which ranges from 0.125% to 1.000%, based on the credit ratings of the Company’s senior unsecured non-credit enhanced long-term indebtedness for borrowed money.
The Restated Credit Facility contains certain loan covenants that are customary for credit facilities of this type and that restrict the ability of Concentrix Corporation and its subsidiaries to take certain actions, including the creation of liens, mergers or consolidations, changes to the nature of their business, and, solely with respect to subsidiaries of Concentrix Corporation, incurrence of such additional amount,indebtedness. In addition, the pro forma first lienRestated Credit Facility contains financial covenants that require the Company to maintain at the end of each fiscal quarter, (i) a consolidated leverage ratio (as defined in the Restated Credit Facility) would not to exceed 3.75 to 1.0 (or for certain periods following certain qualified acquisitions, including the Webhelp Combination, 4.25 to 1.0) and (ii) a consolidated interest coverage ratio (as defined in the Restated Credit Facility) equal to or greater than 3.00 to 1.00.1.0. The Restated Credit Facility also contains various customary events of default, including payment defaults, defaults under certain other indebtedness, and a change of control of Concentrix Corporation.
ObligationsNone of Concentrix’ subsidiaries guarantees the obligations under the Restated Credit Facility.
Prior to entering into the Amendment Agreement, obligations under the Company’s Prior Credit Facility arewere secured by substantially all of the assets of Concentrix Corporation and certain of its U.S. subsidiaries and arewere guaranteed by certain of its U.S. subsidiaries.
Borrowings under the Prior Credit Facility that were LIBOR rate loans bore interest, in the case of term or daily SOFR loans, at a per annum rate equal to the applicable LIBORSOFR rate (but not less than 0.25%0.0%), plus an adjustment of between 0.10% and 0.25% depending on the interest period of each SOFR loan, plus an applicable margin, which ranged from 1.25% to 2.25%2.00%, based on Concentrix’the Company’s consolidated leverage ratio. Borrowings under the Prior Credit Facility that were not LIBORbase rate loans bore interest at a per annum rate equal to (i) the greatest of (a) the Federal Funds Rate in effect on such day plus ½ of 1.00%, (b) the rate of interest last publicly announced by Bank of America as its “prime rate” and (c) the LIBORterm SOFR rate plus 1.00%, plus (ii) an applicable margin, which ranged from 0.25% to 1.25%1.00%, based on Concentrix’the Company’s consolidated leverage ratio. CommitmentsFrom August 31, 2022 through the date of the Amendment Agreement, the outstanding principal of the term loans under the Revolver are subject to a commitment feePrior Credit Facility was payable in quarterly installments of $26,250.
At November 30, 2023 and 2022, no amounts were outstanding under the Company’s revolving credit facility.
During the fiscal year ended November 30, 2023, the Company voluntarily prepaid $25,000 of the principal balance on the unused portionterm loans under the Prior Credit Facility, without penalty.
The Company paid and expensed a total of $21,617 in Bridge Facility financing fees during the fiscal year ended November 30, 2023. During the fiscal year ended November 30, 2023, the Company paid $3,369 in debt amendment fees related to the Restated Credit Facility. The debt amendment fees that were capitalized are being amortized over the remaining life of the Revolver,Restated Credit Facility.
Securitization Facility
On July 6, 2022, the Company entered into an amendment to the Securitization Facility, which fee rangedwas initially entered into on October 30, 2020, to (i) increase the commitment of the lenders to provide available borrowings from 25up to 45 basis points, based on Concentrix’ consolidated leverage ratio.
The Credit$350,000 to up to $500,000, (ii) extend the termination date of the Securitization Facility from October 28, 2022 to July 5, 2024, and (iii) replace LIBOR with SOFR as one of the Amended Credit Facility (as defined below) contain various loan covenants that restrict the ability of Concentrix and its subsidiariesreference rates used to take certain actions, including, incurrence of indebtedness, creation of liens, mergers or consolidations, dispositions of assets, repurchase or redemption of capital stock, makingcalculate interest
certain investments, entering into certain transactions with affiliates or changing the nature of their business. In addition, the Credit Facility and the Amended Credit Facility contain financial covenants that require Concentrix to maintain at the end of each fiscal quarter, (i) a consolidated leverage ratio (as defined in the Credit Facility) not to exceed 3.75 to 1.0 and (ii) a consolidated interest coverage ratio (as defined in the Credit Facility) equal to or greater than 3.00 to 1.0. The Credit Facility and the Amended Credit Facility also contain various customary events of default, including payment defaults, defaults under certain other indebtedness, and a change of control of Concentrix.
At November 30, 2021 and 2020, no amounts were outstanding under the Revolver.
Securitization Facility
On October 30, 2020, Concentrix entered into a $350,000 accounts receivable securitization facility (the “Securitization Facility”) pursuant to certain agreements, including a Receivables Financing Agreement and a Receivables Purchase Agreement. On November 30, 2020, in connection with the spin-off, the Company incurred $250,000 ofon borrowings under the Securitization Facility. Substantially allIn addition, the interest rate margins were amended, such that borrowings under the Securitization Facility that are funded through the issuance of commercial paper bear interest at the proceeds from such indebtedness were transferredapplicable commercial paper rate plus a spread of 0.70% and, otherwise, at a per annum rate equal to TD SYNNEXthe applicable SOFR rate (which includes a credit spread adjustment to the SOFR rate of 0.10%), plus a spread of 0.80%. Amounts drawn under this Securitization Facility have been classified as long-term debt within the consolidated balance sheet based on the Company’s ability and intent to refinance on a long-term basis as of November 30, 2020 to eliminate debt owed by Concentrix to TD SYNNEX and in exchange for the contribution of certain Concentrix trademarks from TD SYNNEX to Concentrix.2023.
Under the Securitization Facility, Concentrix Corporation and certain of its subsidiaries (the “Originators”) sell or otherwise transfer all of their accounts receivable to a special purpose bankruptcy-remote subsidiary of Concentrixthe Company (the “Borrower”) that grants a security interest in the receivables to the lenders in exchange for available borrowings of up to $350,000.$500,000. The amount received under the Securitization Facility is recorded as debt on the Company’s consolidated balance sheet.sheets. Borrowing availability under the Securitization Facility may be limited by the Company’s accounts receivable balances, changes in the credit ratings of the clients comprising the receivables, client concentration levels in the receivables, and certain characteristics of the accounts receivable being transferred (including factors tracking performance of the accounts receivable over time). The Securitization Facility has a termination date of October 28, 2022. Amounts drawn under this Securitization Facility have been classified as long-term debt within the consolidated balance sheet based on the Company’s ability and intent to refinance on a long-term basis as of November 30, 2021.
Borrowings under the Securitization Facility bear interest with respect to loans that are funded through the issuance of commercial paper at the applicable commercial paper rate plus a spread of 1.05% and, otherwise, at a per annum rate equal to the applicable LIBOR rate plus a spread of 1.15%. Concentrix is also obligated to pay a monthly undrawn fee that ranges from 30 to 37.5 basis points based on the portion of the Securitization Facility that is undrawn.
The Securitization Facility contains various affirmative and negative covenants, including a consolidated leverage ratio covenant that is consistent with the Restated Credit Facility and customary events of default, including payment defaults, defaults under certain other indebtedness, a change in control of Concentrix Corporation, and certain events negatively affecting the overall credit quality of the transferred accounts receivable.
The Borrower’s sole business consists of the purchase or acceptance through capital contributions of the receivables and related security from Concentrix and its subsidiariesthe Originators and the subsequent retransfer of or granting of a security interest in such receivables and related security to the administrative agent under the Securitization Facility for the benefit of the lenders. The Borrower is a separate legal entity with its own separate creditors who will be entitled, upon its liquidation, to be satisfied out of the Borrower’s assets prior to any assets or value in the Borrower becoming available to the Borrower’s equity holders, and the assets of the Borrower are not available to pay creditors of Concentrixthe Company and its subsidiaries.
Sellers’ Note
On September 25, 2023, as part of the consideration for the Webhelp Combination, Concentrix Corporation issued the Sellers’ Note in the aggregate principal amount of €700,000 to certain Sellers (the “Noteholders”). The stated rate of interest associated with the Sellers’ Note is two percent (2%) per annum, which is below the Company’s expected borrowing rate. As a result, the Company discounted the Sellers’ Note by €31,500 using an approximate 4.36% imputed annual interest rate. This discounting resulted in an initial value of €668,500 or $711,830. The discount value is being amortized into interest expense over the two-year term. All stated principal and accrued interest will be due and payable on September 25, 2025.
Covenant compliance
As of November 30, 2021,2023, Concentrix was in compliance with all covenants for the above arrangements.
Future principal payments
As of November 30, 2021,2023, future principal payments under the above loans for the subsequent fiscal years are as follows: | | Amount |
| Amount | | | Amount |
| Fiscal Years Ending November 30, | Fiscal Years Ending November 30, | |
| 2022 | $ | 105,000 | |
| 2023 | — | |
| 2024 | |
| 2024 | |
| 2024 | 2024 | — | |
| 2025 | 2025 | 700,000 | |
| 2026 | |
| 2027 | |
| 2028 | |
| Thereafter | |
| Total | Total | $ | 805,000 | |
Amended Credit Facility
On December 27, 2021, in connection with the closing of the acquisition of PK, Concentrix entered into an amendment of the Credit Facility (as amended, the “Amended Credit Facility”) (i) to refinance the Term Loan with a new term loan, which was fully advanced, in the aggregate outstanding principal amount of $2,100,000 (the “New Term Loan”), (ii) to increase the Revolver to $1,000,000 (iii) to extend the maturity of the Credit Facility from November 30, 2025 to December 27, 2026, (iv) to replace LIBOR with SOFR (the Secured Overnight Financing Rate) as the primary reference rate used to calculate interest on the loans under the Credit Facility, and (v) to modify the commitment fee on the unused portion of the Revolver and the margins in excess of the reference rates at which the loans under the Credit Facility bear interest. The proceeds from the New Term Loan and additional borrowings on the Securitization Facility were used to repay the existing Term Loan and to finance the acquisition of PK, including the repayment of certain indebtedness of PK and the payment of fees and expenses in connection therewith.
Borrowings under the Amended Credit Facility bear interest, in the case of SOFR rate loans, at a per annum rate equal to the applicable SOFR rate (but not less than 0.0%), plus an adjustment of between 0.10% and 0.25% depending on the interest period of each SOFR loan, plus an applicable margin, which ranges from 1.25% to 2.00%, based on Concentrix’ consolidated leverage ratio. Borrowings under the Amended Credit Facility that are not SOFR rate loans bear interest at a per annum rate equal to (i) the greatest of (a) the Federal Funds Rate in effect on such day plus ½ of 1.00%, (b) the rate of interest last publicly announced by Bank of America as its “prime rate” and (c) the term SOFR rate plus 1.00%, plus (ii) an applicable margin, which ranges from 0.25% to 1.00%, based on Concentrix’ consolidated leverage ratio. As amended, the commitment fee on the unused portion of the Revolver ranges from 22.5 to 30 basis points, based on Concentrix’ consolidated leverage ratio.
Beginning August 31, 2022, the outstanding principal of the New Term Loan is payable in quarterly installments of $26.25 million, with the unpaid balance due in full on the maturity date.
NOTE 10—REVENUE:
Disaggregated revenue
In the following tables, the Company’s revenue is disaggregated by primary industry verticals and geographic location:locations:
| | Fiscal Years Ended November 30, |
| 2021 | | 2020 | | 2019 |
| Fiscal Years Ended November 30, | | | Fiscal Years Ended November 30, |
| 2023 | | | 2023 | | 2022 | | 2021 |
| Industry vertical: | Industry vertical: | | | | | |
| Technology and consumer electronics | Technology and consumer electronics | $ | 1,759,203 | | | $ | 1,422,817 | | | $ | 1,283,084 | |
| Technology and consumer electronics | |
| Technology and consumer electronics | |
| Retail, travel and ecommerce | |
| Communications and media | Communications and media | 1,005,283 | | | 954,234 | | | 1,142,242 | |
| Retail, travel and ecommerce | 985,550 | | | 796,324 | | | 763,265 | |
| Banking, financial services and insurance | Banking, financial services and insurance | 862,033 | | | 712,469 | | | 676,246 | |
| Healthcare | Healthcare | 489,855 | | | 392,686 | | | 369,187 | |
| Other | Other | 485,091 | | | 441,004 | | | 473,888 | |
| Total | Total | $ | 5,587,015 | | | $ | 4,719,534 | | | $ | 4,707,912 | |
The following table presents revenue by geographical locationlocations where the Company’s services are delivered. Shown below are the countries that account for the Company’s revenue for the periods presented:
| | Fiscal Years Ended November 30, |
| 2021 | | 2020 | | 2019 |
| Fiscal Years Ended November 30, | | | Fiscal Years Ended November 30, |
| 2023 | | | 2023 | | 2022 | | 2021 |
| Revenue by geography: | Revenue by geography: | | | | | |
| Philippines | |
| Philippines | |
| Philippines | Philippines | $ | 1,335,326 | | | $ | 1,205,764 | | | $ | 1,255,937 | |
| United States | United States | 884,777 | | | 812,903 | | | 942,779 | |
| India | India | 723,495 | | | 615,291 | | | 631,534 | |
| Canada | Canada | 338,255 | | | 215,248 | | | 218,206 | |
| Germany | |
| Great Britain | Great Britain | 307,109 | | | 235,006 | | | 228,643 | |
| Others | Others | 1,998,053 | | | 1,635,322 | | | 1,430,813 | |
| Total | Total | $ | 5,587,015 | | | $ | 4,719,534 | | | $ | 4,707,912 | |
Deferred revenue contract liabilities and deferred costs to obtain or fulfill a contract are not material.
NOTE 11—TRANSACTIONS WITH FORMER PARENT:
The Company provides certain services related to its core business to TD SYNNEX, its former parent. Revenue from CX services to former parent is included in the statements of operations. The cost associated with such services is reported as cost of revenue in the statements of operations. The Company purchases certain products from TD SYNNEX and records compensation expense for share-based awards granted by TD SYNNEX to Concentrix employees. Prior to November 30, 2020, the Company received allocations of corporate expenses by way of a monthly management fee and received financing for acquisition and operations under the terms of intra-TD SYNNEX group borrowing arrangements.
Prior to December 1, 2020, the Company consisted of the CX business of TD SYNNEX and thus, transactions with TD SYNNEX were considered related party transactions. On December 1, 2020, in connection with the spin-
off, the Company became an independent publicly-traded company. The following table presents the Company’s related party transactions with TD SYNNEX prior to the spin-off.
| | | | | | | | | | | | | | |
| | Fiscal Years Ended November 30, |
| | 2020 | | 2019 |
| Revenue from customer experience services to Parent | | $ | 20,855 | | | $ | 20,585 | |
| Purchases from Parent and its non-Concentrix subsidiaries | | — | | | 4 | |
| Interest expense on borrowings from Parent | | 50,615 | | | 95,395 | |
| Interest income on borrowings made to Parent | | 2,065 | | | 2,066 | |
| Corporate allocations | | 1,574 | | | 1,574 | |
| Share-based compensation | | 15,914 | | | 10,554 | |
As of November 30, 2020, the payable to former parent and its non-Concentrix subsidiaries was primarily trade in nature.
Prior to the spin-off, TD SYNNEX had issued guarantees to certain of the Company’s clients to guarantee the performance obligations of the Company’s legal entities. These TD SYNNEX guarantees were released or replaced by Concentrix guarantees on or prior to the spin-off.
In connection with the spin-off, on November 30, 2020, the Company entered into a separation and distribution agreement, an employee matters agreement, a tax matters agreement and a commercial agreement with TD SYNNEX to set forth the principal actions to be taken in connection with the spin-off and define the Company’s ongoing relationship with TD SYNNEX after the spin-off.
NOTE 12—11—PENSION AND EMPLOYEE BENEFITS PLANS:
The Company has a 401(k) plansplan in the United States under which eligible employees may contribute up to the maximum amount as provided by law. Employees become eligible to participate in these plansthe 401(k) plan on the first day of the month after their employment date. The Company may make discretionary contributions under the plans.plan. Employees in most of the Company’s non-U.S. legal entities are covered by government mandated defined contribution plans. During fiscal years 2021, 20202023, 2022 and 2019,2021, the Company contributed $72,561, $64,286$89,767, $83,792 and $43,963,$72,561, respectively, to defined contribution plans.
Defined Benefit Plans
The Company has defined benefit pension and retirement plans for eligible employees of certain U.S. and non-U.S. legal entities. For eligible employees in the U.S.,United States, the Company maintains a frozen defined benefit pension plan (“the cash balance plan”), which includes both a qualified and non-qualified portion. The pension benefit formula for the cash balance plan is determined by a combination of compensation, age-based credits and annual guaranteed interest credits. The qualified portion of the cash balance plan has been funded through contributions made to a trust fund.
The Company maintains funded or unfunded defined benefit pension or retirement plans for certain eligible employees in the Philippines, Malaysia, India, and France. Benefits under these plans are primarily based on years of service and compensation during the years immediately preceding retirement or termination of participation in the plans.
The Company’s measurement date for all defined benefit plans and other post-retirement benefits is November 30. The plan assumptions for both the U.S. and non-U.S. defined benefit pension plans are evaluated annually and are updated as deemed necessary. Net benefit costs related to defined benefit plans were $13,427 $13,602$11,328, $9,437 and $9,731,$13,427, during fiscal years 2023, 2022 and 2021, 2020 and 2019, respectively.
Components of pension cost for the Company’s defined benefit plans are as follows:
| | | | | | | | | | | | | | | | | |
| Fiscal Years Ended November 30, |
| 2021 | | 2020 | | 2019 |
| Service cost | $ | 8,148 | | | $ | 7,498 | | | $ | 5,797 | |
| Interest cost on projected benefit obligation | 6,284 | | | 8,385 | | | 10,266 | |
| Expected return on plan assets | (6,032) | | | (6,403) | | | (9,091) | |
| Amortization and deferrals, net | 4,542 | | | 2,851 | | | 822 | |
| Settlement charge | 485 | | | 1,271 | | | 1,937 | |
| Total pension cost | $ | 13,427 | | | $ | 13,602 | | | $ | 9,731 | |
| | | | | | | | | | | | | | | | | |
| Fiscal Years Ended November 30, |
| 2023 | | 2022 | | 2021 |
| Service costs | $ | 6,937 | | | $ | 7,031 | | | $ | 8,148 | |
| Interest costs on projected benefit obligation | 10,306 | | | 6,828 | | | 6,284 | |
| Expected return on plan assets | (6,208) | | | (6,562) | | | (6,032) | |
| Amortization and deferrals, net | 98 | | | 1,540 | | | 4,542 | |
| Settlement charges | 195 | | | 600 | | | 485 | |
| Total pension costs | $ | 11,328 | | | $ | 9,437 | | | $ | 13,427 | |
Service costs are recorded in cost of services and selling, general and administrative expenses while the remaining components of total pension costs are recorded within other expense (income), net in the consolidated statements of operations.
The status of the Company’s defined benefit plans is summarized below:
| | Fiscal Years Ended November 30, |
| 2021 | | 2020 |
| Fiscal Years Ended November 30, | | | Fiscal Years Ended November 30, |
| 2023 | | | 2023 | | 2022 |
| Change in Benefit Obligation: | Change in Benefit Obligation: | | | |
| Benefit obligation at beginning of year | Benefit obligation at beginning of year | $ | 281,957 | | | $ | 261,028 | |
| Service cost | 8,148 | | | 7,498 | |
| Interest cost | 6,284 | | | 8,385 | |
| Actuarial (gain) loss | (6,679) | | | 23,776 | |
| Benefit obligation at beginning of year | |
| Benefit obligation at beginning of year | |
| Service costs | |
| Interest costs | |
Actuarial gains (1) | |
| Benefits paid | Benefits paid | (14,844) | | | (12,906) | |
| Acquisitions | |
| Settlements | Settlements | (5,893) | | | (7,579) | |
| Foreign currency adjustments | Foreign currency adjustments | (2,353) | | | 1,755 | |
| Projected obligation at end of year | Projected obligation at end of year | $ | 266,620 | | | $ | 281,957 | |
| | Change in Plan Assets: | Change in Plan Assets: | |
| Change in Plan Assets: | |
| Change in Plan Assets: | |
| Fair value of plan assets at beginning of year | |
| Fair value of plan assets at beginning of year | |
| Fair value of plan assets at beginning of year | Fair value of plan assets at beginning of year | $ | 147,558 | | | $ | 145,645 | |
| Actual return on assets | Actual return on assets | 13,534 | | | 13,718 | |
| Settlements | Settlements | (5,893) | | | (7,579) | |
| Employer contributions | Employer contributions | 14,563 | | | 3,152 | |
| Benefits paid | Benefits paid | (7,711) | | | (7,149) | |
| Foreign currency adjustments | Foreign currency adjustments | (120) | | | (229) | |
| Fair value of plan assets at end of year | Fair value of plan assets at end of year | $ | 161,931 | | | $ | 147,558 | |
| | Funded Status of Plans: | Funded Status of Plans: | |
| Funded Status of Plans: | |
| Funded Status of Plans: | |
| Unfunded status | Unfunded status | $ | 104,689 | | | $ | 134,399 | |
| Unfunded status | |
| Unfunded status | |
(1)The actuarial gains in fiscal year 2022 were primarily due to an increase in the discount rate for the Company’s cash balance plan as of the November 30, 2022 measurement date.
Amounts recognized in the consolidated balance sheet and recorded within other accrued liabilities and other long-term liabilities as of November 30, 20212023 and 20202022 consist of the following:
| | As of November 30, |
| 2021 | | 2020 |
| As of November 30, | | | As of November 30, |
| 2023 | | | 2023 | | 2022 |
| Current liability | Current liability | $ | 15,884 | | | $ | 10,451 | |
| Non-current liability | Non-current liability | 88,805 | | | 123,948 | |
| Total | Total | $ | 104,689 | | | $ | 134,399 | |
The accumulated benefit obligation for all defined benefit pension plans was $188,058 and $200,198 at November 30, 2023 and 2022, respectively.
The following weighted-average rates were used in determining the benefit obligations as of November 30, 20212023 and 2020:2022:
| | As of November 30, |
| 2021 | | 2020 |
| As of November 30, | | | As of November 30, |
| 2023 | | | 2023 | | 2022 |
| Discount rate | Discount rate | 1.2% - 5.3% | | 0.3% - 4.7% | Discount rate | 3.6% - 7.1% | | 4.0% - 7.5% |
| Interest crediting rate for cash balance plan | Interest crediting rate for cash balance plan | 4.0 | % | | 4.0 | % | Interest crediting rate for cash balance plan | 4.0 | % | | 4.0 | % |
| Expected rate of future compensation growth | Expected rate of future compensation growth | 1.8% - 8.5% | | 1.8% - 8.5% | Expected rate of future compensation growth | 1.8% - 8.0% | | 1.8% - 8.8% |
The following weighted-average rates were used in determining the pension costs for the fiscal years ended November 30, 20212023 and 2020:2022:
| | Fiscal Years Ended November 30, |
| 2021 | | 2020 |
| Fiscal Years Ended November 30, | | | Fiscal Years Ended November 30, |
| 2023 | | | 2023 | | 2022 |
| Discount rate | Discount rate | 0.3% - 4.8% | | 0.6% - 6.0% | Discount rate | 4.0% - 7.5% | | 1.2% - 5.3% |
| Interest crediting rate for cash balance plan | Interest crediting rate for cash balance plan | 4.0 | % | | 4.0 | % | Interest crediting rate for cash balance plan | 4.0 | % | | 4.0 | % |
| Expected return on plan assets | Expected return on plan assets | 1.0% - 7.5% | | 4.5% - 7.5% | Expected return on plan assets | 1.0% - 7.0% | | 1.0% - 7.0% |
| Expected rate of future compensation growth | Expected rate of future compensation growth | 1.8% - 8.5% | | 1.8% - 8.5% | Expected rate of future compensation growth | 1.8% - 8.8% | | 1.8% - 10.0% |
For the cash balance plan, the discount rate reflects the rate at which benefits could effectively be settled and is based on current investment yields of high-quality corporate bonds. The Company uses an actuarially-developed yield curve approach to match the timing of cash flows of expected future benefit payments by applying specific spot rates along the yield curve to determine the assumed discount rate.
The range of discount rates utilized in determining the pension cost and projected benefit obligation of the Company’s defined benefit plans reflects a lower prevalent rate applicable to the frozen cash balance plan for eligible employees in U.S. and a higher applicable rate for the unfunded defined benefit plan for certain eligible employees in the Philippines, France and Malaysia. The plans outside the U.S. represented approximately 25%39% and 24%28% of the Company’s total projected benefit obligation for all defined benefit plans as of November 30, 20212023 and 2020,2022, respectively.
Plan Assets
As of November 30, 20212023 and 2020,2022, plan assets for the cash balance plan consisted of common/collective trusts (of which approximately 60%49% are invested in equity backed funds and approximately 40%51% are invested in funds in fixed income instruments) and a private equity fund. The Company’s targeted allocation was 60%50% equity and 40%50% fixed income. The investment objectives for the plan assets are to generate returns that will enable the plan to meet its future obligations. The Company’s expected long-term rate of return was determined based on the asset mix of the plan, projected returns, past performance and other factors. The following table sets forth by level within the fair value hierarchy, total plan assets at fair value as of November 30, 2023 and 2022, including the cash balance plan and other funded benefit plans:
| | | | | | | | | | | | | | | | | | | | | | | | | | |
| Investments | | As of November 30, 2023 | | As of Quoted Prices in Active Markets for Identical Assets
(Level 1) | | As of Significant Other Observable Inputs (Level 2) | | As of Significant Unobservable Inputs (Level 3) |
| Cash and cash equivalents | | $ | 3,951 | | | $ | 3,951 | | | $ | — | | | $ | — | |
| Common/collective trusts: | | | | | | | | |
| Fixed income | | 55,550 | | | — | | | 55,550 | | | — | |
| U.S. large cap | | 24,816 | | | — | | | 24,816 | | | — | |
| U.S. small cap | | 6,641 | | | — | | | 6,641 | | | — | |
| International equity | | 25,556 | | | — | | | 25,556 | | | — | |
| Governmental bonds | | 6,245 | | | — | | | 6,245 | | | — | |
| Corporate bonds | | 3,955 | | | — | | | 3,955 | | | — | |
| Investment funds | | — | | | — | | | — | | | — | |
| Limited partnership | | 38 | | | — | | | — | | | 38 | |
| Total investments | | $ | 126,752 | | | $ | 3,951 | | | $ | 122,763 | | | $ | 38 | |
| | | | | | | | | | | | | | | | | | | | | | | | | | |
| Investments | | As of November 30, 2022 | | As of Quoted Prices in Active Markets for Identical Assets
(Level 1) | | As of Significant Other Observable Inputs (Level 2) | | As of Significant Unobservable Inputs (Level 3) |
| Cash and cash equivalents | | $ | 4,034 | | | $ | 4,034 | | | $ | — | | | $ | — | |
| Common/collective trusts: | | | | | | | | |
| Fixed income | | 47,439 | | | — | | | 47,439 | | | — | |
| U.S. large cap | | 31,352 | | | — | | | 31,352 | | | — | |
| U.S. small cap | | 8,567 | | | — | | | 8,567 | | | — | |
| International equity | | 36,773 | | | — | | | 36,773 | | | — | |
| Governmental bonds | | 6,073 | | | — | | | 6,073 | | | — | |
| Corporate bonds | | 2,998 | | | — | | | 2,998 | | | — | |
| Investment funds | | — | | | — | | | — | | | — | |
| Limited partnership | | 115 | | | — | | | — | | | 115 | |
| Total investments | | $ | 137,351 | | | $ | 4,034 | | | $ | 133,202 | | | $ | 115 | |
value hierarchy, total plan assets at fair value as of November 30, 2021 and 2020, including the cash balance plan and other funded benefit plans:
| | | | | | | | | | | | | | | | | | | | | | | | | | |
| Investments | | As of November 30, 2021 | | As of Quoted Prices in Active Markets for Identical Assets
(Level 1) | | As of Significant Other Observable Inputs (Level 2) | | As of Significant Unobservable Inputs (Level 3) |
| Cash and cash equivalents | | $ | 3,383 | | | $ | 3,383 | | | $ | — | | | $ | — | |
| Common/collective trusts: | | | | | | | | |
| Fixed Income | | 59,955 | | | — | | | 59,955 | | | — | |
| U.S. large cap | | 39,318 | | | — | | | 39,318 | | | — | |
| U.S. small cap | | 10,100 | | | — | | | 10,100 | | | — | |
| International equity | | 39,930 | | | — | | | 39,930 | | | — | |
| Governmental bonds | | 5,493 | | | — | | | 5,493 | | | — | |
| Corporate bonds | | 3,528 | | | — | | | 3,528 | | | — | |
| Investment funds | | — | | | — | | | — | | | — | |
| Limited partnership | | 224 | | | — | | | — | | | 224 | |
| Total investments | | $ | 161,931 | | | $ | 3,383 | | | $ | 158,324 | | | $ | 224 | |
| | | | | | | | | | | | | | | | | | | | | | | | | | |
| Investments | | As of November 30, 2020 | | As of Quoted Prices in Active Markets for Identical Assets
(Level 1) | | As of Significant Other Observable Inputs (Level 2) | | As of Significant Unobservable Inputs (Level 3) |
| Cash and cash equivalents | | $ | 3,404 | | | $ | 3,404 | | | $ | — | | | $ | — | |
| Common/collective trusts: | | | | | | | | |
| Fixed Income | | 50,986 | | | — | | | 50,986 | | | — | |
| U.S. large cap | | 43,020 | | | — | | | 43,020 | | | — | |
| U.S. small cap | | 9,662 | | | — | | | 9,662 | | | — | |
| International equity | | 31,892 | | | — | | | 31,892 | | | — | |
| Governmental bonds | | 3,094 | | | — | | | 3,094 | | | — | |
| Corporate bonds | | 5,232 | | | — | | | 5,232 | | | — | |
| Investment funds | | — | | | — | | | — | | | — | |
| Limited partnership | | 268 | | | — | | | — | | | 268 | |
| Total investments | | $ | 147,558 | | | $ | 3,404 | | | $ | 143,886 | | | $ | 268 | |
The Company’s cash balance plan holds level 2 investments in common/collective trust funds that are public investment vehicles valued using a net asset value (NAV)(“NAV”) provided by the manager of each fund. The NAV is based on the underlying net assets owned by the fund, divided by the number of shares outstanding. The NAV’s unit price is quoted on a private market that may not be active. However, the NAV is based on the fair value of the underlying securities within the fund, which are traded on an active market, and valued at the closing price reported on the active market on which those individual securities are traded. The significant investment strategies of the funds are as described in the financial statements provided by each fund. There are no restrictions on redemptions from these funds. Level 3 investments are equity based funds that primarily invest in domestic early stage capital funds.
Benefit Payments
The following table details expected benefit payments for the cash balance plan and other defined benefit plans:
| | Fiscal Years Ending November 30, | Fiscal Years Ending November 30, | |
| 2022 | $ | 34,451 | |
| 2023 | 30,264 | |
| 2024 | |
| 2024 | |
| 2024 | 2024 | 27,446 | |
| 2025 | 2025 | 25,292 | |
| 2026 | 2026 | 23,467 | |
| 2027 | |
| 2028 | |
| Thereafter | Thereafter | 97,363 | |
| Total | Total | $ | 238,283 | |
The Company expects to make approximately $8,871$4,522 in contributions during fiscal year 2022.2024.
NOTE 13—12—LEASES:
The Company leases certain of its facilities and equipment under operating lease agreements, which expire in various periods through 2035.2037. The Company’s finance leases are not material.
The following table presents the various components of operating lease costs:
| | Fiscal Years Ended November 30, |
| 2021 | | 2020 |
| Fiscal Years Ended November 30, | | | Fiscal Years Ended November 30, |
| 2023 | | | 2023 | | 2022 | | 2021 |
| Operating lease cost | Operating lease cost | $ | 203,508 | | | $ | 202,852 | |
| Short-term lease cost | Short-term lease cost | 15,767 | | | 9,917 | |
| Variable lease cost | Variable lease cost | 40,215 | | | 41,060 | |
| Sublease income | Sublease income | (1,738) | | | (1,668) | |
| Total operating lease cost | Total operating lease cost | $ | 257,752 | | | $ | 252,161 | |
The following table presents a maturity analysis of expected undiscounted cash flows for operating leases on an annual basis for the next five fiscal years and thereafter as of November 30, 2021:2023:
| | Fiscal Years Ending November 30, | Fiscal Years Ending November 30, | |
| 2022 | $ | 185,065 | |
| 2023 | 149,084 | |
| 2024 | |
| 2024 | |
| 2024 | 2024 | 110,781 | |
| 2025 | 2025 | 72,724 | |
| 2026 | 2026 | 29,204 | |
| 2027 | |
| 2028 | |
| Thereafter | Thereafter | 20,810 | |
| Total payments | Total payments | 567,668 | |
| Less: imputed interest* | Less: imputed interest* | (59,868) | |
| Total present value of lease payments | Total present value of lease payments | $ | 507,800 | |
*Imputed interest represents the difference between undiscounted cash flows and discounted cash flows.
The following amounts were recorded in the consolidated balance sheet as of November 30, 20212023 and 2020:
| | | | | | | | | | | | | | | | | | | | |
| | | | As of November 30, |
| Operating leases | | Balance sheet location | | 2021 | | 2020 |
| Operating lease ROU assets | | Other assets, net | | $ | 489,171 | | | $ | 506,368 | |
| Current operating lease liabilities | | Other accrued liabilities | | 153,329 | | | 163,052 | |
| Non-current operating lease liabilities | | Other long-term liabilities | | 354,471 | | | 373,644 | |
The Company decided to cease-use, sublease or abandon leases prior to the end of their lease terms at certain of its sites and recorded impairment losses during the fiscal year ended November 30, 20202022 related to the exit of leased facilities. These losses are recorded as a component of selling, general and administrative expenses. As the fair value of the ROU assets was less than the carrying value, the Company recognized an impairment of ROU assets of approximately $9.3 million, reducing the carrying value of the ROU assets to its estimated fair value. The fair value of the ROU assets that the Company intends to sublease was estimated using level 3 inputs such as market comparables to estimate future cash flows expected from sublease income over the remaining lease terms.Company’s operating leases:
| | | | | | | | | | | | | | | | | | | | |
| | | | As of November 30, |
| Operating leases | | Balance sheet location | | 2023 | | 2022 |
| Operating lease ROU assets | | Other assets, net | | $ | 813,590 | | | $ | 473,039 | |
| Current operating lease liabilities | | Other accrued liabilities | | 229,010 | | | 158,801 | |
| Non-current operating lease liabilities | | Other long-term liabilities | | 623,290 | | | 340,673 | |
The following table presents supplemental cash flow information related to the Company’s operating leases. Cash payments related to variable lease costs and short-term leases are not included in the measurement of operating lease liabilities, and, as such, are excluded from the amounts below:
| | Fiscal Years Ended November 30, |
| | Fiscal Years Ended November 30, | | | | Fiscal Years Ended November 30, |
| Cash flow information | Cash flow information | | 2021 | | 2020 | Cash flow information | | 2023 | | 2022 | | 2021 |
| Cash paid for amounts included in the measurement of lease liabilities | Cash paid for amounts included in the measurement of lease liabilities | | $ | 200,096 | | | $ | 206,585 | |
| Non-cash ROU assets obtained in exchange for lease liabilities | Non-cash ROU assets obtained in exchange for lease liabilities | | 156,406 | | | 147,292 | |
The weighted-average remaining lease term and discount rate as of November 30, 20212023 and 2020,2022, respectively, were as follows:
| | As of November 30, |
| | As of November 30, | | | | As of November 30, |
| Operating lease term and discount rate | Operating lease term and discount rate | | 2021 | | 2020 | Operating lease term and discount rate | | 2023 | | 2022 |
| Weighted-average remaining lease term (years) | Weighted-average remaining lease term (years) | | 3.81 | | 3.97 | Weighted-average remaining lease term (years) | | 4.88 | | 3.72 |
| Weighted-average discount rate | Weighted-average discount rate | | 5.82 | % | | 6.97 | % | Weighted-average discount rate | | 6.41 | % | | 5.24 | % |
NOTE 14—13—INCOME TAXES:
The sources of income before the provision for income taxes are as follows:
| | Fiscal Years Ended November 30, |
| 2021 | | 2020 | | 2019 |
| Fiscal Years Ended November 30, | | | Fiscal Years Ended November 30, |
| 2023 | | | 2023 | | 2022 | | 2021 |
| United States | United States | $ | 66,274 | | | $ | (64,491) | | | $ | (121,886) | |
| Foreign | Foreign | 489,422 | | | 332,386 | | | 326,302 | |
| Total income before income taxes | Total income before income taxes | $ | 555,696 | | | $ | 267,895 | | | $ | 204,416 | |
Provision for income taxes consists of the following:
| | | | | | | | | | | | | | | | | |
| Fiscal Years Ended November 30, |
| 2021 | | 2020 | | 2019 |
| Current tax provision (benefit): | | | | | |
| Federal | $ | 54,809 | | | $ | 22,336 | | | $ | 34,076 | |
| State | 8,058 | | | 10 | | | (6,260) | |
| Foreign | 112,981 | | | 100,588 | | | 75,717 | |
| $ | 175,848 | | | $ | 122,934 | | | $ | 103,533 | |
| Deferred tax provision (benefit): | | | | | |
| Federal | $ | (19,119) | | | $ | 49 | | | $ | (19,139) | |
| State | (2,798) | | | (336) | | | 362 | |
| Foreign | (3,812) | | | (19,563) | | | 2,496 | |
| (25,729) | | | (19,850) | | | (16,281) | |
| Total income tax provision | $ | 150,119 | | | $ | 103,084 | | | $ | 87,252 | |
Provision for income taxes for fiscal years 2020 and 2019 was increased by an adjustment of $26,823 ($17,203 current tax expense plus $9,600 deferred tax expense) and $23,807 ($33,407 current tax expense offset by $9,600 deferred tax benefit), respectively, to reflect the hypothetical tax impact if Concentrix was not part of TD SYNNEX’ U.S. consolidated group and thereby suffered a much higher U.S. foreign tax credit limitation. The offset to the hypothetical tax expense was reflected in the former parent company investment balance, a component of equity on the consolidated balance sheet. | | | | | | | | | | | | | | | | | |
| Fiscal Years Ended November 30, |
| 2023 | | 2022 | | 2021 |
| Current tax provision (benefit): | | | | | |
| Federal | $ | 78,961 | | | $ | 65,423 | | | $ | 54,809 | |
| State | 11,064 | | | 5,151 | | | 8,058 | |
| Foreign | 126,072 | | | 129,613 | | | 112,981 | |
| $ | 216,097 | | | $ | 200,187 | | | $ | 175,848 | |
| Deferred tax provision (benefit): | | | | | |
| Federal | $ | (97,371) | | | $ | (19,596) | | | $ | (19,119) | |
| State | (12,850) | | | (12,303) | | | (2,798) | |
| Foreign | (11,490) | | | 1,075 | | | (3,812) | |
| (121,711) | | | (30,824) | | | (25,729) | |
| Total income tax provision | $ | 94,386 | | | $ | 169,363 | | | $ | 150,119 | |
The following presents the breakdown of net deferred tax liabilities after netting by taxing jurisdiction:
| | | | | | | | | | | |
| As of November 30, |
| 2021 | | 2020 |
| Deferred tax assets | $ | 48,413 | | | $ | 47,423 | |
| Deferred tax liabilities | 109,471 | | | 153,560 | |
| Total net deferred tax liabilities | $ | 61,058 | | | $ | 106,137 | |
| | | | | | | | | | | |
| As of November 30, |
| 2023 | | 2022 |
| Deferred tax assets | $ | 72,333 | | | $ | 48,541 | |
| Deferred tax liabilities | 414,246 | | | 105,458 | |
| Total net deferred tax liabilities | $ | 341,913 | | | $ | 56,917 | |
Net deferred tax liabilities consist of the following:
| | As of November 30, |
| 2021 | | 2020 |
| As of November 30, | | | As of November 30, |
| 2023 | | | 2023 | | 2022 |
| Assets: | Assets: | | | |
| Net operating losses | |
| Net operating losses | |
| Net operating losses | Net operating losses | $ | 68,360 | | | $ | 75,799 | |
| Accruals and other reserves | Accruals and other reserves | 48,469 | | | 43,973 | |
| Depreciation and amortization | Depreciation and amortization | 12,625 | | | 7,762 | |
| U.S. interest limitation carry forward | U.S. interest limitation carry forward | 984 | | | — | |
| Share-based compensation expense | Share-based compensation expense | 4,464 | | | 3,964 | |
| Deferred revenue | Deferred revenue | 4,629 | | | 2,421 | |
| Tax credits | Tax credits | 2,506 | | | 1,817 | |
| Foreign tax credit | Foreign tax credit | 2,359 | | | 5,829 | |
| Operating lease liabilities | Operating lease liabilities | 90,270 | | | 104,429 | |
| Intercompany loans payable | |
| Other | Other | 16,607 | | | 8,271 | |
| Gross deferred tax assets | Gross deferred tax assets | 251,273 | | | 254,265 | |
| Valuation allowance | Valuation allowance | (31,016) | | | (45,026) | |
| Total deferred tax assets | Total deferred tax assets | $ | 220,257 | | | $ | 209,239 | |
| Liabilities: | Liabilities: | | | |
| Intangible assets | Intangible assets | $ | 160,802 | | | $ | 183,970 | |
| Intangible assets | |
| Intangible assets | |
| Unremitted non-US earnings | Unremitted non-US earnings | 32,199 | | | 28,882 | |
| Operating lease right-of-use assets | Operating lease right-of-use assets | 88,314 | | | 99,604 | |
| Other | — | | | 2,920 | |
| Total deferred tax liabilities | Total deferred tax liabilities | 281,315 | | | 315,376 | |
| Net deferred tax liabilities | Net deferred tax liabilities | $ | 61,058 | | | $ | 106,137 | |
The valuation allowance relates primarily to certain state and foreign net operating loss carry forwards, foreign deferred items and state credits. The Company’s assessment is that it is not more likely than not that these deferred tax assets will be realized.
A reconciliation of the statutory U.S. federal income tax rate to the Company’s effective income tax rate is as follows: | | | | | | | | | | | | | | | | | |
| Fiscal Years Ended November 30, |
| 2021 | | 2020 | | 2019 |
| Federal statutory income tax rate | 21.0 | % | | 21.0 | % | | 21.0 | % |
| State taxes, net of federal income tax benefit | 0.6 | % | | (0.2) | % | | (2.2) | % |
| International rate difference | (1.0) | % | | 1.3 | % | | (1.9) | % |
| Withholding taxes | 0.4 | % | | 0.8 | % | | 1.2 | % |
| Uncertain tax benefits | 0.3 | % | | 0.9 | % | | 5.0 | % |
| Changes in valuation allowance | (1.6) | % | | 0.5 | % | | 2.7 | % |
| Contingent debentures | — | % | | — | % | | (0.2) | % |
| Adjustments related to the Tax Cuts and Jobs Act | 2.8 | % | | 3.3 | % | | 8.4 | % |
| Hypothetical current tax expense recorded for separate return basis presentation | — | % | | 10.0 | % | | 11.6 | % |
Other(1) | 4.5 | % | | 0.9 | % | | (2.9) | % |
| Effective income tax rate | 27.0 | % | | 38.5 | % | | 42.7 | % |
| | | | | | | | | | | | | | | | | |
| Fiscal Years Ended November 30, |
| 2023 | | 2022 | | 2021 |
| Federal statutory income tax rate | 21.0 | % | | 21.0 | % | | 21.0 | % |
| State taxes, net of federal income tax benefit | (1.0) | % | | (1.4) | % | | 0.6 | % |
| International rate difference | (2.3) | % | | (2.7) | % | | (1.0) | % |
| Withholding taxes | 2.5 | % | | 1.1 | % | | 0.4 | % |
| Uncertain tax benefits | 1.3 | % | | (0.3) | % | | 0.3 | % |
| Changes in valuation allowance | 1.7 | % | | 1.3 | % | | (1.6) | % |
Impact of inclusion of foreign income (1) | (4.7) | % | | 9.2 | % | | 2.8 | % |
Other (2) | 4.6 | % | | (0.2) | % | | 4.5 | % |
| Effective income tax rate | 23.1 | % | | 28.0 | % | | 27.0 | % |
(1) Represents Subpart F income, Base Erosion and Anti-Abuse Tax (BEAT), and Global Intangible Low-Taxed Income (GILTI) (less Section 250 deduction), net of associated foreign tax credits.
(2) Includes tax costs related to future legal entity restructuring for the fiscal year ended November 30, 2023. Includes additional tax gain on the sale of CISConcentrix Insurance Solutions for the fiscal year ended November 30, 2021.
The Company’s U.S. business has sufficient cash flow and liquidity to fund its operating requirements and the Company expects and intends that profits earned outside the United States will be fully utilized and reinvested outside of the United States with the exception of earnings of certain previously acquired non-U.S. entities. The Company has recorded deferred tax liabilities related to non-U.S. withholding taxes on the earnings of its non-U.S. subsidiaries likely to be repatriated in the future.
As of November 30, 2021,2023, the Company had approximately $1,684,899$2,078,260 of undistributed earnings of its non-U.S. subsidiaries for which it has not provided for non-U.S. withholding taxes and state taxes because such earnings are intended to be reinvested indefinitely in international operations. It is not practicable to determine the amount of applicable taxes that would be due if such earnings were distributed. Accordingly, the Company has not provisioned U.S. state taxes and non-U.S. withholding taxes on the non-U.S. legal entities for which the earnings are permanently reinvested.
As of November 30, 2021,2023, the Company had net operating loss carry forwards of approximately $48,737$310,536 and $26,228$40,792 for federal and state purposes, respectively. The federal net operating loss carry forward and the state net operating loss carry forwards will both start expiringbegin to expire in the fiscal year ending November 30, 2022.2024. The Company also had approximately $139,754$179,929 of foreign net operating loss carry forwards that will also start expiringbegin to expire in fiscal year ending November 30, 20222024 if not used. In addition, the Company has approximately $5,273$6,384 of various federal and state income tax credit carry forwards that, if not used, will begin expiringto expire in the fiscal year ending November 30, 2022.2024. Utilization of the acquired loss carry forwards may be limited pursuant to Section 382 of the Internal Revenue Code of 1986.
The Company enjoys tax holidays in certain jurisdictions, primarily Algeria, China, Colombia, Costa Rica, Dominican Republic, El Salvador, Estonia, Guatemala, Honduras, India, Jordan, Latvia, Madagascar, Nicaragua, the Philippines and the Philippines.Turkey. The tax holidays provide for lower or zero rates of taxation and require various thresholds of investment and business activities in those jurisdictions. The estimated tax benefits from the above tax holidays for fiscal years 2021, 2020,2023, 2022, and 20192021 were approximately $9,160, $12,850,$7,961, $10,315, and $8,247,$9,160, respectively.
The aggregate changes in the balances of gross unrecognized tax benefits, excluding accrued interest and penalties, during fiscal years 2021, 2020,2023, 2022, and 20192021 were as follows:
| | | | | |
Balance as of November 30, 2018 | $ | 38,675 | |
Additions based on tax positions related to the current year | 10,753 | |
Net additions for tax positions of prior years and acquisition | 4,198 | |
Lapse of statute of limitations | (4,698) | |
Balance as of November 30, 2019 | 48,928 | |
Additions based on tax positions related to the current year | 5,081 | |
Additions for tax positions of prior years and acquisition | 4,108 | |
Settlements | (144) | |
Lapse of statute of limitations | (10,061) | |
Changes due to translation of foreign currencies | 1 | |
| Balance as of November 30, 2020 | $ | 47,913 | |
| Additions based on tax positions related to the current year | 3,602 | |
| Reductions for tax positions of prior years | (1,638) | |
| Settlements | (2,108) | |
| Lapse of statute of limitations | (7,872)(426) | |
| Changes due to translation of foreign currencies | 104 | |
| Balance as of November 30, 2021 | 47,447 | |
| Additions based on tax positions related to the current year | 42,749 | |
| Settlements | (4,882) | |
| Lapse of statute of limitations | (14,351) | |
| Balance as of November 30, 2022 | 70,963 | |
| Additions based on tax positions related to the current year | 5,819 | |
| Additions based on tax positions related to the prior year / acquisition | 6,071 | |
| Lapse of statute of limitations | (4,938) | |
| Changes due to translation of foreign currencies | 1,407 | |
| Balance as of November 30, 2023 | $ | 40,00179,322 | |
The Company conducts business globally and files income tax returns in various U.S. and non-U.S. jurisdictions. The Company is subject to continuous examination and audits by various tax authorities. Significant audits are underway in the United States and India. The Company is not aware of any material exposures arising from these tax audits or in other jurisdictions not already provided for.
Although timing of the resolution of audits and/or appeals is highly uncertain, the Company believes it is reasonably possible that the total amount of unrecognized tax benefits as of November 30, 20212023 could decrease between $6,464$34,854 and $13,447$37,817 in the next twelve months. The Company is no longer subject to U.S. federal income tax audit for returns covering years through fiscal year 2017. The Company is no longer subject to non-U.S. or U.S. state income tax audits for returns covering years through fiscal year 2012 and fiscal year 2014, respectively.
The liability for unrecognized tax benefits was $56,308$87,939 and $62,315$78,501 at November 30, 20212023 and November 30, 2020,2022, respectively, and is included in other long-term liabilities in the consolidated balance sheets. As of November 30, 20212023 and 2020, $48,4382022, $52,779 and $54,910$40,793 of the total unrecognized tax benefits, net of federal benefit, would affect the effective tax rate, if realized. The Company’s policy is to include interest and penalties related to income taxes, including unrecognized tax benefits, within the provision for income taxes. As of November 30, 20212023 and 2020,2022, the Company had accrued $16,306$8,617 and $14,402,$7,538, respectively, in income taxes payable related to accrued interest and penalties.
Under the tax matters agreement with TD SYNNEX, the Company generally has liability and is required to indemnify TD SYNNEX for (1) any taxes incurred in the ordinary course of the Company’s business by the Company or its subsidiaries and (2) a portion of the taxes for tax periods that ended on or prior to the distribution related to transactions between Concentrix and TD SYNNEX or their respective subsidiaries, or other transactions in which both Concentrix and TD SYNNEX or their respective subsidiaries received a financial benefit.
NOTE 15—14—COMMITMENTS AND CONTINGENCIES:
From time to time, the Company receives notices from third parties, including clientscustomers and suppliers, seeking indemnification, payment of money or other actions in connection with claims made against them. Also, from time to time, the Company has been involved in various bankruptcy preference actions where the Company was a supplier to the companies now in bankruptcy. In addition, the Company is subject to various other claims, both asserted and unasserted, that arise in the ordinary course of business. The Company evaluates these claims and records the related liabilities. It is possible that the ultimate liabilities ultimately incurred by the Company could differ from the amounts recorded.
Under the separation and distribution agreement with TD SYNNEX, the Company agreed to indemnify TD SYNNEX, each
Under the tax matters agreement with TD SYNNEX, if the spin-off fails to qualify for tax-free treatment, the Company is generally required to indemnify TD SYNNEX for any taxes resulting from the spin-off (and related costs and other damages) to the extent such amounts result from (1) an acquisition of all or a portion of the Company’s equity securities or assets by any means, (2) any action or failure to act by the Company after the distribution affecting the voting rights of the Company’s stock, (3) other actions or failures to act by the Company, or (4) certain breaches of the Company’s agreements and representations in the tax matters agreement. The Company’s indemnification obligations to TD SYNNEX and its subsidiaries, officers, directors and employees are not limited by any maximum amount.
The Company does not believe that the above commitments and contingencies will have a material adverse effect on the Company’s results of operations, financial position or cash flows.
NOTE 16—15—EARNINGS PER SHARE:
Basic and diluted earnings per common share (“EPS”) are computed using the two-class method, which is an earnings allocation formula that determines EPS for each class of common stock and participating securities.security.
Basic EPS is generally computed by dividing net income attributable to common stockholders by the weighted-average number of shares of common stock outstanding during the period. Diluted earnings per common share is generally computed by dividing net income attributable to common stockholders by the weighted-average number of shares of common stock outstanding during the period, increased to include the number of shares of common stock that would have been outstanding had potential dilutive shares of common stock been issued. The dilutive effect of restricted stock units and stock options are reflected in diluted net income per share by applying the treasury stock method. There were no Concentrix equity awards outstanding prior to the spin-off, thus the computation of basic and diluted earnings per common share for all prior year periods disclosed is calculated using the shares issued in connection with the spin-off of 51.6 million shares.
| | Fiscal Years Ended November 30, |
| 2021 | | 2020 | | 2019 |
| Fiscal Years Ended November 30, | | | Fiscal Years Ended November 30, |
| 2023 | | | 2023 | | 2022 | | 2021 |
| Basic earnings per common share: | Basic earnings per common share: | | | | | |
| Net income | |
| Net income | |
| Net income | Net income | $ | 405,577 | | | $ | 164,811 | | | 117,164 | |
Less: net income allocated to participating securities(1) | Less: net income allocated to participating securities(1) | (5,785) | | | — | | | — | |
| Net income attributable to common stockholders | Net income attributable to common stockholders | $ | 399,792 | | | $ | 164,811 | | | $ | 117,164 | |
| | Weighted average common shares - basic | Weighted average common shares - basic | 51,355 | | | 51,602 | | | 51,602 | |
| Weighted average common shares - basic | |
| Weighted average common shares - basic | |
| | Basic earnings per common share | |
| Basic earnings per common share | |
| Basic earnings per common share | Basic earnings per common share | $ | 7.78 | | | $ | 3.19 | | | $ | 2.27 | |
| | Diluted earnings per common share: | Diluted earnings per common share: | |
| Diluted earnings per common share: | |
| Diluted earnings per common share: | |
| Net income | |
| Net income | |
| Net income | Net income | $ | 405,577 | | | $ | 164,811 | | | $ | 117,164 | |
Less: net income allocated to participating securities(1) | Less: net income allocated to participating securities(1) | (5,724) | | | — | | | — | |
| Net income attributable to common stockholders | Net income attributable to common stockholders | $ | 399,853 | | | $ | 164,811 | | | $ | 117,164 | |
| | Weighted-average number of common shares - basic | Weighted-average number of common shares - basic | 51,355 | | | 51,602 | | | 51,602 | |
| Weighted-average number of common shares - basic | |
| Weighted-average number of common shares - basic | |
| Effect of dilutive securities: | Effect of dilutive securities: | |
| Stock options and restricted stock units | |
| Stock options and restricted stock units | |
| Stock options and restricted stock units | Stock options and restricted stock units | 559 | | | — | | | — | |
| Weighted-average number of common shares - diluted | Weighted-average number of common shares - diluted | 51,914 | | | 51,602 | | | 51,602 | |
| | Diluted earnings per common share | Diluted earnings per common share | $ | 7.70 | | | $ | 3.19 | | | $ | 2.27 | |
| Diluted earnings per common share | |
| Diluted earnings per common share | |
(1) Restricted stock awards granted to employees by the Company are considered participating securities.
NOTE 17—16—STOCKHOLDERS’ EQUITY:
Share repurchase program
In September 2021, the Company’s board of directors authorized the Company to purchaserepurchase of up to $500,000 of the Company’s outstanding shares of common stock from time to time as market and business conditions warrant, including through open market purchases or Rule 10b5-1 trading plans. The repurchase program has no termination date and may be suspended or discontinued at any time. During the fiscal yearyears ended November 30, 2021,2023 and 2022, the Company repurchased 138 aggregate709 and 842 shares, respectively, of its common stock for an aggregate purchase price of $25,100.$63,958 and $120,819, respectively. The share repurchases were made on the open market and the shares repurchased by the Company are held in treasury for general corporate purposes. At November 30, 2023, approximately $290,127 remained available for share repurchases under the existing authorization from the Company’s board of directors.
During December 2023, the Company repurchased 66 shares of its common stock for an aggregate purchase price of $6,347.
Dividends
In September 2021,During fiscal years 2023 and 2022, the Company paid the following dividends per share approved by the Company’s board of directors declared a quarterly cash dividend of $0.25 per share. The dividend was paid in November 2021, to stockholders of record at the close of business on October 22, 2021. On directors:
| | | | | | | | | | | |
| Announcement Date | Record Date | Per Share Dividend Amount | Payment Date |
| January 18, 2022 | January 28, 2022 | $0.25 | February 8, 2022 |
| March 29, 2022 | April 29, 2022 | $0.25 | May 10, 2022 |
| June 27, 2022 | July 29, 2022 | $0.25 | August 9, 2022 |
| September 28, 2022 | October 28, 2022 | $0.275 | November 8, 2022 |
| January 19, 2023 | January 30, 2023 | $0.275 | February 10, 2023 |
| March 29, 2023 | April 28, 2023 | $0.275 | May 9, 2023 |
| June 28, 2023 | July 28, 2023 | $0.275 | August 8, 2023 |
| September 27, 2023 | October 27, 2023 | $0.3025 | November 7, 2023 |
On January 24, 2024, the Company announced a cash dividend of $0.25$0.3025 per share to stockholders of record as of January 28, 2022,February 5, 2024, payable on February 8, 2022.15, 2024.
ITEM 9. CHANGES AND DISAGREEMENTS WITH ACCOUNTANTS ON ACCOUNTING AND FINANCIAL DISCLOSURES
None.
ITEM 9A. CONTROL AND PROCEDURES
Evaluation of disclosure controls and procedures
Based on the evaluation of our disclosure controls and procedures (as defined in Rules 13a-15(e) and 15d-15(e) under the Exchange Act) as required by Rules 13a-15(b) or 15d-15(b) under the Exchange Act, our principal executive officer and principal financial officer have concluded that as of the end of the period covered by this report, our disclosure controls and procedures were effective to ensure that information required to be disclosed by Concentrix in reports that it files or submits under the Exchange Act is recorded, processed, summarized and reported within the time periods specified in SEC rules and forms, and include controls and procedures designed to ensure that information required to be disclosed by us in such reports is accumulated and communicated to our management, including the principal executive officer and principal financial officer, as appropriate, to allow timely decisions regarding required disclosure.
Report of management on internal control over financial reporting
The Company’s management is responsible for establishing and maintaining adequate internal control over the Company’s financial reporting. Under the supervision and with the participation of our management, including our principal executive officer and principal financial officer, we conducted an evaluation of the effectiveness of our internal control over financial reporting basedManagement’s Report on criteria established in Internal Control – Integrated Framework (2013) issuedover Financial Reporting, as of November 30, 2023, appears in Part II, Item 8, of this Annual Report on Form 10-K, and is incorporated herein by the Committee of Sponsoring Organizations of the Treadway Commission.reference.
The effectiveness of the Company’s internal control over financial reporting, as of November 30, 2021,2023, has been audited by KPMG LLP, an independent registered public accounting firm, as stated in their report, which appears in Part II, Item 8, of this Annual Report on Form 10-K.
Changes in internal control over financial reporting
ThereWe acquired Webhelp in the fourth quarter of fiscal year 2023. We are currently in the process of evaluating and integrating the acquired operations, processes, and internal controls. See Note 3 of the consolidated financial statements included in this report for additional information on this acquisition.
Except for this acquisition, there were no changes in our internal control over financial reporting that occurred during our fourth fiscal quarter of fiscal year 20212023 that have materially affected, or are reasonably likely to materially affect, our internal control over financial reporting.
Limitations on controls
Our disclosure controls and procedures and internal control over financial reporting are designed to provide reasonable assurance of achieving their objectives as specified above. Management does not expect, however, that our disclosure controls and procedures or our internal control over financial reporting will prevent or detect all error and fraud. Any control system, no matter how well designed and operated, is based upon certain assumptions and can provide only reasonable, not absolute, assurance that its objectives will be met. Further, no evaluation of controls can provide absolute assurance that misstatements due to error or fraud will not occur or that all control issues and instances of fraud, if any, within the Company have been detected.
ITEM 9B. OTHER INFORMATION
None.Rule 10b5-1 trading arrangements
During the three months ended November 30, 2023, none of our directors or officers adopted or terminated a “Rule 10b5-1 trading arrangement” or “non-Rule 10b5-1 trading arrangement,” as those terms are defined in Item 408 of Regulation S-K.
ITEM 9C. DISCLOSURE REGARDING FOREIGN JURISDICTIONS THAT PREVENT INSPECTIONS
Not applicable.
PART III
ITEM 10. DIRECTORS, EXECUTIVE OFFICERS AND CORPORATE GOVERNANCE
Certain information required by this Item 10 is incorporated by reference to the material under the headings “Board of Directors,” “Board Committees,” “Proposals Requiring Your Vote—Proposal No. 1: Election of Directors,” and “Our Named Executive Officers” in the Company’s definitive Proxy Statement for the 20222024 Annual Meeting of Stockholders, which we will file with the SEC not later than March 30, 2022.2024.
Item 405 of Regulation S-K calls for disclosure of any known late filing or failure by an insider to file a report required by Section 16(a) of the Exchange Act. To the extent disclosure for delinquent reports is being made, it can be found under the caption “Delinquent Section 16(a) Reports” in the Company’s definitive Proxy Statement for the 20222024 Annual Meeting of Stockholders, which we will file with the SEC not later than March 30, 2022,2024, and is incorporated herein by reference.
Our Code of Ethical Business Conduct, with which our directors, officers and staff must comply, establishes legal and ethical standards for conducting our business, including in accordance with applicable Nasdaq listing standards and SEC regulations. Our Code of Ethical Business Conduct is available free of charge on the “Governance Documents” page of the Investor Relations section of our website at www.concentrix.com, and a copy may also be obtained, upon request, from our Corporate Secretary at 44111 Nobel39899 Balentine Drive, Fremont,Suite 235, Newark, California, 94538.94560. Future waivers from, or amendments to, our Code of Ethical Business Conduct that apply to our principal executive officer, principal financial officer, principal accounting officer or controller or persons performing similar functions will be timely posted on the webpage referenced in this paragraph.
ITEM 11. EXECUTIVE COMPENSATION
The information required by this Item 11 is incorporated by reference to the material under the headings “Board Committees—Compensation Committee,” “Director Compensation,” “Compensation Discussion and Analysis,” “2021“2023 Summary Compensation Table,” “Grants of Plan-Based Awards in Fiscal 2021,Year 2023,” “Outstanding Equity Awards at 20212023 Fiscal Year-End,” “Option Exercises and Stock Vested in Fiscal 2021,Year 2023,” “Pension Benefits,” “Potential Payments upon Termination or in Connection with a Change of Control,” and “CEO Pay Ratio”Ratio,” “Pay Versus Performance,” and “Corporate Governance—Risk Management” in the Company’s definitive Proxy Statement for the 20222024 Annual Meeting of Stockholders, which we will file with the SEC not later than March 30, 2022.2024.
ITEM 12. SECURITY OWNERSHIP OF CERTAIN BENEFICIAL OWNERS AND MANAGEMENT AND RELATED STOCKHOLDER MATTERS
The information required by this Item 12 is incorporated by reference to the material under the headings “Beneficial Ownership of Securities” and “Equity Compensation Plan Information” in the Company’s definitive Proxy Statement for the 20222024 Annual Meeting of Stockholders, which we will file with the SEC not later than March 30, 2022.2024.
ITEM 13. CERTAIN RELATIONSHIPS AND RELATED TRANSACTIONS AND DIRECTOR INDEPENDENCE
The information required by this Item 13 is incorporated by reference to the material under the headings “Corporate Governance—Related Party Transactions” and “Board of Directors—Director Independence” in the Company’s definitive Proxy Statement for the 20222024 Annual Meeting of Stockholders, which we will file with the SEC not later than March 30, 2022.2024.
ITEM 14. PRINCIPAL ACCOUNTING FEES AND SERVICES
The information required by this Item 14 is incorporated by reference to the material under the heading “Proposals Requiring Your Vote—Proposal No. 2: Ratification of Appointment of Independent Registered Public
Accounting Firm” in the Company’s definitive Proxy Statement for the 20222024 Annual Meeting of Stockholders, which we will file with the SEC not later than March 30, 2022.2024.
PART IV
ITEM 15. EXHIBITS AND FINANCIAL STATEMENT SCHEDULES
(a)(1) Financial Statements
The consolidated financial statements of the Company filed as part of this Annual Report on Form 10-K are included in Item 8. Financial Statements and Supplementary Data.
(a)(2) Financial Statement Schedules
Schedules Omitted
Schedules other than Schedule II are omitted because they are not required or applicable under instructions contained in Regulation S-X or because the information called for is shown in the consolidated financial statements.
CONCENTRIX
SCHEDULE II—VALUATION AND QUALIFYING ACCOUNTS
For the Fiscal Years Ended November 30, 2021, 20202023, 2022 and 20192021
(in thousands)
(Amounts may not add due to rounding)
| | Additions/Deductions | |
| Balances at Beginning of Fiscal Year | | Charged to Revenue and Expense, net | | Additions from Acquisitions | | Reclassifications and Write-offs | | Balances at End of Fiscal Year |
| | | Additions/Deductions | |
| Balances at Beginning of Fiscal Year | |
| Balances at Beginning of Fiscal Year | |
| Balances at Beginning of Fiscal Year | | | Charged to Revenue and Expense, net | | Additions from Acquisitions | | Reclassifications and Write-offs | | Balances at End of Fiscal Year |
| Fiscal Year Ended November 30, 2023 | |
| Allowance for deferred tax assets | |
| Allowance for deferred tax assets | |
| Allowance for deferred tax assets | |
| Fiscal Year Ended November 30, 2022 | |
| Allowance for deferred tax assets | |
| Allowance for deferred tax assets | |
| Allowance for deferred tax assets | |
| Fiscal Year Ended November 30, 2021 | Fiscal Year Ended November 30, 2021 | $ | 45,026 | | | $ | 239 | | | $ | — | | | $ | (14,249) | | | $ | 31,016 | |
| Allowance for deferred tax assets | Allowance for deferred tax assets | |
| Fiscal Year Ended November 30, 2020 | |
| Allowance for deferred tax assets | Allowance for deferred tax assets | $ | 44,892 | | | $ | 6,037 | | | $ | — | | | $ | (5,903) | | | $ | 45,026 | |
| Fiscal Year Ended November 30, 2019 | |
| Allowance for deferred tax assets | Allowance for deferred tax assets | $ | 56,033 | | | $ | 5,589 | | | $ | — | | | $ | (16,730) | | | $ | 44,892 | |
(a)(3) Exhibits
| | | | | | | | |
| Exhibit No. | | Exhibit Description |
| 2.1 | | |
| | |
2.2 | | |
| | |
2.32.2 | | |
| | |
| 2.3 | | |
| | |
| 2.4 | | First Amendment to Share Purchase and Contribution Agreement, dated July 14, 2023, by and among Concentrix Corporation, OSYRIS S.à r.l., Marnix Lux SA, Sandrine Asseraf as the PoA Seller Representative, Priscilla Maters, as the representative of the GBL Sellers and Frédéric Jousset, and Sapiens, as the representative of the Non-PoA Sellers (incorporated by reference to Exhibit 10.1 to the Company’s Current Report on Form 8-K filed on July 17, 2023).* |
| | |
| 3.1 | | |
| | |
| 3.2 | | |
| | |
| 4.1 | | |
| | |
| 4.2 | | |
| | |
| 4.3 | | |
| | |
| 4.4 | | |
| | |
| 4.5 | | |
| | |
| 10.1 | | Tax MattersAmendment and Restatement Agreement, dated as of November 30, 2020,April 21, 2023, by and betweenamong Concentrix Corporation, the Companylenders party thereto, JPMorgan Chase Bank, N.A., and SYNNEX CorporationBank of America, N.A. (incorporated by reference to Exhibit 10.1 to the Company’s Current Report on Form 8-K filed on December 2, 2020)April 26, 2023). |
| | |
| | | | | | | | |
| 10.2 | | |
| | |
10.3 | | |
| | |
10.4 | | |
| | |
10.5 | | |
| | |
10.6 | | Receivables Financing Agreement, dated as of October 30, 2020, by and among Concentrix Receivables, Inc., as borrower, the Company, as initial servicer, the lenders party thereto, and PNC Bank, National Association, as administrative agent (incorporated by referencereference to Exhibit 10.7 to Amendment No. 2 to the Company’s Registration Statement on Form 10 filed on October 30, 2020). |
| | |
10.710.3 | | |
| | |
| | | | | | | | |
10.810.4 | | First Omnibus Amendment, dated as of May 5, 2021, by and among the Company, as servicer, Concentrix Receivables, Inc., as borrower, the subsidiaries of the Company named therein, as originators, the lenders party thereto, and PNC Bank, National Association, as administrative agent (incorporated by reference to Exhibit 10.1 to the Company’s Quarterly Report on Form 10-Q filed on July 9, 2021). |
| | |
| 10.5 | | Second Amendment to Receivables Financing Agreement, dated as of July 6, 2022, by and among Concentrix Receivables, Inc., as borrower, the Company, as servicer, the lenders party thereto, and PNC Bank, National Association, as administrative agent (incorporated by reference to Exhibit 10.2 to the Company’s Quarterly Report on Form 10-Q filed on July 8, 2022). |
| | |
| 10.6 | | |
| | |
| 10.7 | | |
| | |
| 10.8 | | |
| | |
| 10.9 | | |
| | |
| 10.10 | | |
| | |
| 10.11 | | |
| | |
10.1010.12 | | |
| | |
10.1110.13 | | |
| | |
10.1210.14 | | |
| | | | | | | | |
| 10.13 | |
| 10.15 | | |
| | |
10.1410.16 | | |
| | |
10.1510.17 | | |
| | |
10.1610.18 | | |
| | |
10.1710.19 | | |
| | |
| 10.20 | | |
| | |
10.1810.21 | | |
| | |
10.1910.22 | | |
| | |
10.2010.23 | | |
| | |
10.2110.24 | | |
| | |
| 21.1 | | |
| | |
| 23.1 | | |
| | |
| 24.1 | | |
| | |
| 31.1 | | |
| | |
| | | | | | | | |
| 31.2 | | |
| | |
| 32.1 | | |
| | |
| 97.1 | | |
| | |
| 101.INS | | Inline XBRL Instance Document - the instance document does not appear in the Interactive Data File because its XBRL tags are embedded within the Inline XBRL document. |
| | |
| 101.SCH | | Inline XBRL Taxonomy Extension Schema Document. |
| | |
| 101.CAL | | Inline XBRL Taxonomy Extension Calculation Linkbase Document. |
| | |
| | | | | | | | |
| 101.LAB | | Inline XBRL Taxonomy Extension Label Linkbase Document. |
| | |
| 101.PRE | | Inline XBRL Taxonomy Extension Presentation Linkbase Document. |
| | |
| 101.DEF | | Inline XBRL Taxonomy Extension Definition Linkbase Document. |
| | |
| 104 | | Cover Page Interactive Data File (Embedded within the Inline XBRL document and included in Exhibit 101). |
* Schedules and exhibits have been omitted pursuant to Item 601(b)(2) of Regulation S-K. Concentrix Corporation hereby undertakes to furnish copies of any of the omitted schedules and exhibits upon request by the U.S. Securities and Exchange Commission.
† Management contract or compensatory plan or arrangement required to be filed as an exhibit pursuant to Item 15(b) of Form 10-K.
ITEM 16. FORM 10-K SUMMARY
None.
SIGNATURES
Pursuant to the requirements of Section 13 or 15(d) of the Securities Exchange Act of 1934, the registrant has duly caused this report to be signed on its behalf by the undersigned, thereunto duly authorized.
Date: January 28, 202229, 2024
| | | | | |
| CONCENTRIX CORPORATION |
| |
| By: | /s/ Christopher Caldwell |
| Christopher Caldwell |
| President and Chief Executive Officer |
POWER OF ATTORNEY
KNOW ALL MEN BY THESE PRESENTS, that each person whose signature appears below constitutes and appoints Christopher Caldwell and Andre Valentine, and each of them, his true and lawful attorneys-in-fact, each with full power of substitution, for him or her in any and all capacities, to sign any amendments to this Annual Report on Form 10-K and to file the same, with exhibits thereto and other documents in connection therewith, with the Securities and Exchange Commission, hereby ratifying and confirming all that each of said attorneys-in-fact or their substitute or substitutes may do or cause to be done by virtue hereof.
Pursuant to the requirements of the Securities Exchange Act of 1934, this report has been signed below by the following persons on behalf of the registrant and in the capacities and on the dates indicated.
| | | | | | | | | | | | | | |
| Name | | Title | | Date |
| | | | |
| /s/ Christopher Caldwell | | President and Chief Executive Officer (Principal Executive Officer) and Director | | January 28, 202229, 2024 |
| Christopher Caldwell | | | | |
| | | | |
| /s/ Andre Valentine | | Chief Financial Officer (Principal Financial and Principal Accounting Officer) | | January 28, 202229, 2024 |
| Andre Valentine | | | | |
| | | | |
| /s/ Teh-Chien Chou | | Director | | January 28, 202229, 2024 |
| Teh-Chien Chou | | | | |
| | | | |
| /s/ LaVerne Council | | Director | | January 28, 202229, 2024 |
| LaVerne Council | | | | |
| | | | | | | | | | | | | | |
| | | | |
| /s/ Jennifer Deason | | Director | | January 28, 202229, 2024 |
| Jennifer Deason | | | | |
| | | | |
| /s/ Olivier Duha | | Director | | January 29, 2024 |
| Olivier Duha | | | | |
| | | | |
| /s/ Nicolas Gheysens | | Director | | January 29, 2024 |
| Nicolas Gheysens | | | | |
| | | | |
| /s/ Kathryn Hayley | | Director | | January 28, 202229, 2024 |
| Kathryn Hayley | | | | |
| | | | |
| /s/ Kathryn Marinello | | Director | | January 28, 202229, 2024 |
| Kathryn Marinello | | | | |
| | | | |
| /s/ Dennis Polk | | Director | | January 28, 202229, 2024 |
| Dennis Polk | | | | |
| | | | |
| /s/ Ann Vezina | | Director | | January 28, 202229, 2024 |
| Ann Vezina | | | | |
