0001818874srt:MaximumMembersofi:OtherFinancingNotesMemberus-gaap:LondonInterbankOfferedRateLIBORMemberus-gaap:NotesPayableOtherPayablesMember2021-12-31
UNITED STATES
SECURITIES AND EXCHANGE COMMISSION
Washington, D.C. 20549
FORM 10-K
(Mark One)
| | | | | |
x☒ | ANNUAL REPORT PURSUANT TO SECTION 13 OR 15(d) OF THE SECURITIES EXCHANGE ACT OF 1934 |
For the fiscal year ended December 31, 20212023
or
| | | | | |
| ☐ | TRANSITION REPORT PURSUANT TO SECTION 13 OR 15(d) OF THE SECURITIES EXCHANGE ACT OF 1934 |
For the transition period from to
Commission file number 001-39606
SoFi Technologies, Inc.
(Exact name of registrant as specified in its charter)
| | | | | | | | |
| Delaware | | 98-1547291 |
| (State or other jurisdiction of incorporation or organization) | | (I.R.S. Employer Identification No.) |
234 1st Street San Francisco, California | | 94105 |
| (Address of Principal Executive Offices) | | (Zip Code) |
Registrant’s telephone number, including area code: (855) 456-7634
Securities registered pursuant to Section 12(b) of the Act:
| | | | | | | | | | | | | | |
| Title of each class | | Trading Symbol(s) | | Name of each exchange on which registered |
| Common stock, $0.0001 par value per share | | SOFI | | The Nasdaq Global Select Market |
Securities registered pursuant to Section 12(g) of the Act: None
Indicate by check mark if the registrant is a well-known seasoned issuer, as defined in Rule 405 of the Securities Act. Yes ☐ No x☒
Indicate by check mark if the registrant is not required to file reports pursuant to Section 13 or Section 15(d) of the Act. Yes ☐ No x☒
Indicate by check mark whether the registrant:registrant (1) has filed all reports required to be filed by Section 13 or 15(d) of the Securities Exchange Act of 1934 during the preceding 12 months (or for such shorter period that the registrant was required to file such reports);, and (2) has been subject to such filing requirements for the past 90 days. Yes x☒ No ☐
Indicate by check mark whether the registrant has submitted electronically every Interactive Data File required to be submitted pursuant to Rule 405 of Regulation S-T during the preceding 12 months (or for such shorter period that the registrant was required to submit such files). Yes x No ☐
Indicate by check mark whether the registrant is a large accelerated filer, an accelerated filer, a non-accelerated filer, a smaller reporting company, or an emerging growth company. See the definitions of “large accelerated filer,” “accelerated filer,” “smaller reporting company,” and “emerging growth company” in Rule 12b-2 of the Exchange Act.
| | | | | | | | | | | | | | |
| Large accelerated filer | x☒ | | Accelerated filer | ☐
|
| Non-accelerated filer | ☐ | | Smaller reporting company | ☐ |
| | | Emerging growth company | ☐ |
If an emerging growth company, indicate by check mark if the registrant has elected not to use the extended transition period for complying with any new or revised financial accounting standards provided pursuant to Section 13(a) of the Exchange Act. ☐
Indicate by check mark whether the registrant has filed a report on and attestation to its management’s assessment of the effectiveness of its internal control over financial reporting under Section 404(b) of the Sarbanes-Oxley Act (15 U.S.C. 74262(b)) by the registered public accounting firm that prepared or issued its audit report. ☒
If securities are registered pursuant to Section 12(b) of the Act, indicate by check mark whether the financial statements of the registrant included in the filing reflect the correction of an error to previously issued financial statements. ☐
Indicate by check mark whether any of those error corrections are restatements that required a recovery analysis of incentive-based compensation received by any of the registrant’s executive officers during the relevant recovery period pursuant to §240.1D-1(b). ☐
Indicate by check mark whether the registrant is a shell company (as defined in Rule 12b-2 of the Act). Yes ☐ No x☒
The aggregate market value of the voting and non-voting common equity of the Registrant held by non-affiliates as of June 30, 2021: $10.02023: $7.4 billion
The number of shares of the registrant’s common stock, par value $0.0001 per share, outstanding as of February 15, 20222024 was 828,591,590976,736,877 shares.
DOCUMENTS INCORPORATED BY REFERENCE
Portions of the Proxy Statement for the 20222024 Annual Meeting of Stockholders are incorporated by reference in Part III. The Proxy Statement will be filed with the Securities and Exchange Commission within 120 days of the Registrant’s fiscal year ended December 31, 2021.2023.
SOFI TECHNOLOGIES, INC.
TABLE OF CONTENTS
Glossary of Terms and Acronyms
| | | | | |
ACH: Automated clearing house | GAAP: U.S. Generally Accepted Accounting Principles |
AFS: Available-for-sale | GLBA: Gramm-Leach-Bliley Act |
ALCO: Asset Liability Committee | Golden Pacific: Golden Pacific Bancorp, Inc. |
AWS: Amazon Web Services | GSE: Government-Sponsored Enterprise |
AOCI: Accumulated other comprehensive income (loss) | HFI: Held for investment |
ASU: Accounting Standards Update | HFS: Held for sale |
ATDS: Automatic telephone dialing systems | HMDA: Home Mortgage Disclosure Act |
BHCA: Bank Holding Company Act of 1956, as amended | IRLC: Interest rate lock commitment |
BPS: Basis points | IRS: Internal Revenue Service |
BSA: Bank Secrecy Act | LIBOR: London Inter-Bank Offered Rate |
CALM: Capital and Asset Liability Management policy | MLA: Military Lending Act |
CARES Act: Coronavirus Aid, Relief, and Economic Security Act | MOHELA: Missouri Higher Education Loan Authority |
CCPA: California Consumer Privacy Act | MSB: Money services business |
CD: Community Development | MSRB: Municipal Securities Rulemaking Board |
CET1: Common Equity Tier 1 | NACHA: National Automated Clearinghouse Association |
CFP: Certified financial planners | Nasdaq: The Nasdaq Global Select Market |
CFPB: Consumer Financial Protection Bureau | OCC: Office of the Comptroller of the Currency |
CFTC: Commodity Futures Trading Commission | OFAC: Office of Foreign Assets Control |
CISO: Chief Information Security Officer | PCD: Purchased credit deteriorated |
CODM: Chief Operating Decision Maker | PFOF: Payment for order flow |
CPA: Colorado Privacy Act | PSU: Performance stock units |
CPPA: California Privacy Protection Act | QIA: Qatar Investment Authority |
CPRA: California Privacy Rights Act | RESPA: Real Estate Settlement Procedures Act |
CRA: Community Reinvestment Act | ROU: Right-of-use |
DACA: Deferred Access for Childhood Arrival | RSU: Restricted stock units |
DCF: Discounted cash flow | SCH: Social Capital Hedosophia Holdings Corp. V |
DE&I: Diversity, Equity and Inclusion | SCRA: Servicemembers’ Civil Relief Act |
DEP: Digital engagement practices | SEC: U.S. Securities and Exchange Commission |
Dodd-Frank Act: Dodd-Frank Wall Street Reform and Consumer | SPAC: Special purpose acquisition company |
| Protection Act of 2010 | Social Finance: Social Finance, Inc. |
DSU: Deferred stock units | SoFi Bank: SoFi Bank, National Association |
EC: European Commission | SoFi Capital Advisors: SoFi Capital Advisors, LLC |
ECOA: Equal Credit Opportunity Act | SoFi Securities: SoFi Securities LLC |
EFTA: Electronic Fund Transfer Act | SoFi Stadium: The LA Stadium and Entertainment District at Hollywood |
ESG: Environmental, social and corporate governance | Park in Inglewood, California |
ESIGN: Electronic Signatures in Global and National Commerce Act | SoFi Wealth: SoFi Wealth LLC |
ETF: Exchange-Traded Funds | SOFR: Secured Overnight Financing Rate |
FCA: Financial Conduct Authority | SPE: Special purpose entity |
FCRA: Fair Credit Reporting Act | SRO: Self-regulatory organizations |
FDCPA: Fair Debt Collection Practices Act | TBA: To-be-announced |
FDIA: Federal Deposit Insurance Act | TCJA: Tax Cuts and Jobs Act |
FDIC: Federal Deposit Insurance Corporation | TCPA: Federal Telephone Consumer Protection Act |
Federal Reserve: Board of Governors of the Federal Reserve System | Technisys: Technisys S.A., a Luxembourg société anonyme |
FHA: Fair Housing Act | TDR: Troubled debt restructuring |
FHFA: Federal Housing Finance Agency | TILA: Truth in Lending Act |
FHLB: Federal Home Loan Bank | UDAAP: Unfair, deceptive or abusive acts or practices |
FinCEN: Financial Crimes Enforcement Network | UETA: Uniform Electronic Transactions Act |
FINRA: Financial Industry Regulatory Authority | URG: Underrepresented Group |
FRB: Federal Reserve Bank of San Francisco | VA: United Stated Department of Veterans Affairs |
FTC: Federal Trade Commission | VIE: Variable interest entity |
FTP: Fund transfer pricing | Wyndham: Wyndham Capital Mortgage |
SoFi Technologies, Inc.
As used in this Annual Report on Form 10-K, unless the context requires otherwise, references to “SoFi”, the “Company”, “we”, “us”, and “our”, and similar references refer to SoFi Technologies, Inc. and its wholly-owned subsidiaries following the Business Combination (as defined herein) and to Social Finance, Inc. prior to the Business Combination.
Social Finance, Inc. (“Social Finance”) entered into a merger agreement (the “Agreement”) with Social Capital Hedosophia Holdings Corp. V (“SCH”) on January 7, 2021. The transactions contemplated by the terms of the Agreement were completed on May 28, 2021 (the “Closing”), in conjunction with which SCH changed its name to SoFi Technologies, Inc. (hereafter referred to, collectively with its subsidiaries, as “SoFi”, the “Company”, “we”, “us” or “our”, unless the context otherwise requires). The transactions contemplated in the Agreement are collectively referred to as the “Business Combination”. As a result of the Business Combination completed on May 28, 2021, share and per share amounts presented in this Annual Report on Form 10-K for periods prior to the Business Combination for Social Finance, Inc. have been retroactively converted by application of the exchange ratio of 1.7428. For more information regarding the Business Combination, see Item 8, Note 2 to the Notes to Consolidated Financial Statements included in this Annual Report on Form 10-K.
In March 2021,February 2022, we entered into an agreement to acquireacquired Golden Pacific Bancorp, Inc. (“Golden Pacific”), a bank holding company, and its wholly-owned subsidiary, Golden Pacific Bank, National Association, a national bank for a total cash purchase price of $22.3 million (the “Bank Merger”). The Bank Merger closed in February 2022,, after which we became a bank holding company and renamed Golden Pacific Bank as SoFi Bank, National Association (“SoFi Bank”).
In FebruaryMarch 2022, we entered into an agreement to acquireacquired Technisys S.A. (“Technisys”), a Luxembourg société anonyme and a cloud-native digital multi-product core banking platform for total purchase consideration, in the form of shares of SoFi common stock, of $1.1 billion (the “Technisys Merger”).
In April 2023, we acquired Wyndham, a fintech mortgage lender.
See Note 2. Business Combinations to the Notes to Consolidated Financial Statements within Part II, Item 8. for information on our business combinations.
Refer to Glossary of Terms and Acronyms for the definitions of certain terms, acronyms and abbreviations used in this document.
CAUTIONARY STATEMENT REGARDING FORWARD-LOOKING STATEMENTS
This Annual Report on Form 10-K contains statements that are forward-looking and as such are not historical facts. This includes, without limitation, statements regarding the financial position, business strategy and the plans and objectives of management for our future operations; anticipated trends and prospects in the industries in which our business operates; and new products, services and related strategies.strategies; anticipated actions by governmental authorities; and macroeconomic conditions. These statements constitute projections, forecasts and forward-looking statements, and are not guarantees of performance. Such statements can be identified by the fact that they do not relate strictly to historical or current facts. When used in this Annual Report on Form 10-K, words such as “aim”, “allow”, “anticipate”, “believe”, “can”, “continue”, “could”, “estimate”, “expect”, “if”, “intend”, “likely”, “may”, “might”, “opportunity”, “plan”, “possible”, “potential”, “predict”, “project”, “should”, “strive”, “will”, “would” and similar expressions may identify forward-looking statements, but the absence of these words does not mean that a statement is not forward-looking.
Forward-looking statements are subject to risks, uncertainties and other factors described in Part I, Item 1A. “Risk Factors” and elsewhere in this Annual Report on Form 10-K mayand our other filings with the SEC and include, for example, statements about:
•the effect of and uncertainties related to the ongoing COVID-19 pandemic (including any government responses thereto) and any continued recovery from the impact of the COVID-19 pandemic;among other things:
•our ability to achieve and maintain profitability in the future;
•the impact on our business of the regulatory environment and complexities with compliance;
•our ability to respond to generalthe effect and impact of evolving laws, rules, regulations and government enforcement policies, including any federal or state loan forgiveness programs;
•the impact of adverse developments affecting the U.S. or global banking industry, including bank failures and liquidity concerns, which could cause economic conditions;and market volatility, and regulatory responses thereto;
•our ability to manage our growth effectively and our expectations regarding the development and expansion of our business;
•our ability to continue to originate and sell loans to third parties, and the impact of the performance of loans held on our balance sheet;
•our ability to access sources of capital on favorable terms, if at all, including debt financing, deposits and other sources of capital to finance operations and growth;
•the impact of and our ability to respond to general economic conditions and other macroeconomic and geopolitical factors, such as elevated and fluctuating interest rates, inflationary pressures, counterparty risk, changing customer
demand, capital markets volatility, instability in the financial services industry, a potential U.S. government shutdown, the possibility of a recession, and domestic or international conflicts or disputes;
•the success of our marketing efforts and our ability to expand our member base;
•our ability to grow market share in existing markets or any new markets we may enter;
•our ability to develop new products, features and functionality that are competitive and meet market needs;
•our ability to diversify our core student loan business into other lending products and broaden our suite of financial services offerings;
•our ability to realize the benefits of our strategy, including what we refer to as our Financial Services Productivity Loop, and achieve scale in our Financial Services segment;
•our ability to successfully operate as a bank holding company, and to own and operate SoFi Bank;
•our ability to make accurate credit and pricing decisions or effectively forecast our loss rates;
•our ability to establish and maintain an effective system of internal controls over financial reporting;
•our ability to maintain the listing of our securities on The Nasdaq Global Select Market (“Nasdaq”);the Nasdaq;
•our ability to realize the anticipated benefits of the Business Combination, the Bank Merger, the Technisys Merger, our acquisition of Wyndham, and the anticipated Technisys Merger;any other acquisitions we undertake, including our expectations with regards to such acquisitions;
•our ability to successfully expand our operations into foreign jurisdictions, including compliance with a variety of foreign laws; and
•the outcome of any legal or governmental proceedings that may be instituted against us.
These forward-lookingForward-looking statements are based on information available as of the date of this Annual Report on Form 10-K and reflect current expectations, forecasts and assumptions, and involve a number of judgments, risks and uncertainties. New risks and uncertainties emerge from time to time and it is not possible for us to predict all risks and uncertainties that could have an impact on the forward-looking statements contained in this Annual Report on Form 10-K. The results, events and circumstances reflected in the forward-looking statements may not be achieved or occur, and actual results, events or circumstances could differ materially from those described in the forward-looking statements. Accordingly, forward-looking statements should not be relied upon as representing our views as of any subsequent date, and we do not undertake any obligation to update forward-looking statements to reflect events or circumstances after the date they were made, whether as a result of new information, future events or otherwise, except as may be required under applicable securities laws.
As a result of a number of known and unknown risks and uncertainties, our actual results or performance may be materially different from those expressed or implied by these forward-looking statements. You should not place undue reliance on these forward-looking statements.
TRADEMARKS
This document contains references to trademarks, service marks and trade names owned by us or belonging to other entities. Solely for convenience, trademarks, service marks and trade names referred to in this document may appear without the ® or ™ symbols, but such references are not intended to indicate, in any way, that we or the applicable licensor will not assert, to the fullest extent under applicable law, our or its rights to these trademarks, service marks and trade names. SoFi Technologies does not intend its use or display of other companies’ trademarks, service marks or trade names to imply a relationship with, or endorsement or sponsorship of it by, any other companies. All trademarks, service marks and trade names included in this document are the property of their respective owners.
PART I
Item 1. Business
We are a member-centric, one-stop shop for financial services that, through our Lending and Financial Services products, allows members to borrow, save, spend, invest and protect their money. We refer to our customers as “members” and “clients”.
Our mission is to help our members achieve financial independence in order to realize their ambitions. To us, financial independence does not mean being wealthy, but rather represents the ability of our members to have the financial means to achieve their personal objectives at each stage of life, such as owning a home, having a family, or having a career of their choice — more simply stated, to have enough money to do what they want. We were founded in 2011 and have developed a suite of financial products that offers the speed, selection, content and convenience that only an integrated digital platform can provide. In order for us to achieve our mission, we have to help people get their money right, which means providing them with the ability to borrow better, save better, spend better, invest better and protect better. Everything we do today is geared toward helping our members “Get Your Money Right” and we strive to innovate and build ways for our members to achieve this goal.
In order to help achieve our mission, we offer personal loans, student loans, home loans and related servicing. We offer a variety of financial services products, such as SoFi Money, SoFi Credit Card, SoFi Invest and SoFi Relay, that provide more daily interactions with our members, as well as lending as a service which helps a broader range of borrowers to find lending solutions. We offer products and capabilities, such as SoFi At Work, that are designed to appeal to enterprises. We have created an innovative financial services platform designedalso made strategic acquisitions to offer best-in-class products to meet the broad objectives of our members and the lifecycle of their financial needs. We define a member as someone who has a lending relationship with us through origination and/or ongoing servicing, opened a financial services account, linked an external account tofurther expand our platform or signed upcapabilities for enterprises, which we believe will deepen our credit score monitoring service. Once someone becomesparticipation in the entire technology ecosystem powering digital financial services.
We have built a social area within our digital native application, which we refer to as the member they are always considered a member unless they violate our terms of service. Our members have continuous access to our certified financial planners (“CFPs”), our career advice services, our member events, our content, educational material, news, tools and calculators at no cost to the member. Additionally, our mobile app and website have ahome feed. The member home feed that is personalized and delivers content to a member about what they must do that day in their financial life, what they should consider doing that day in their financial life, and what they can do that day in their financial life. Through the member home feed, there are significant opportunities to build frequent engagement and, to date, the member home feed has been an important driver of new product adoption. The member home feed is an important part of our strategy and our ability to use data as a competitive advantage.
To complement these products and services, we believe in establishing partnerships with other enterprises to leverage our existing capabilities to reach a broader market and in building vertically-integrated technology platforms designed to manage and deliver our suite of products and technology solutions to our members and clients in a low-cost and differentiated manner.
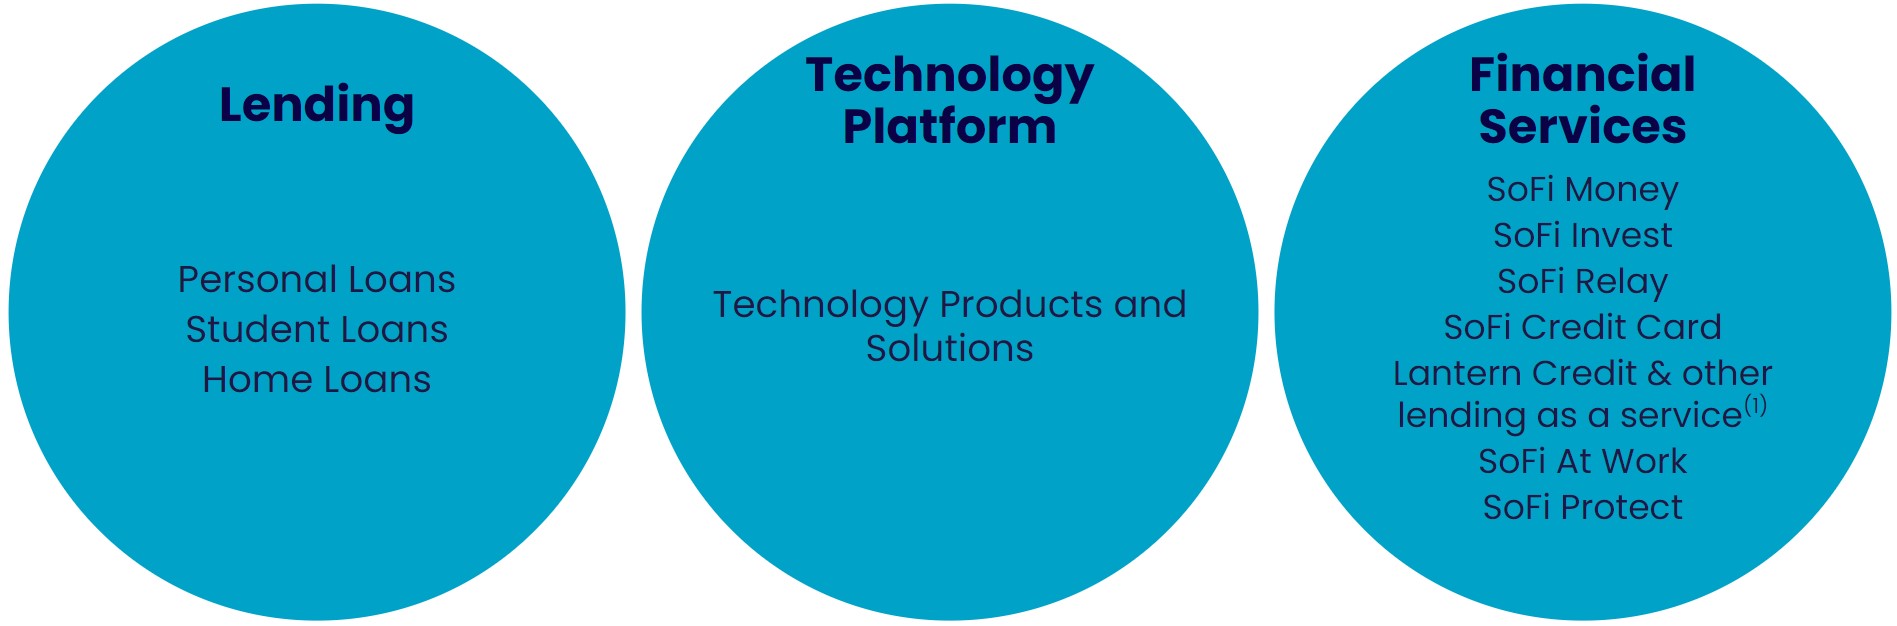
Our three reportable segments and their primary product offerings as of December 31, 2023 were as follows:
_________________
(1)Lending as a service includes referred loans which are originated by a third-party partner to which we provide pre-qualified borrower referrals, certain loans which we originate and subsequently sell to a third-party partner, and certain loans associated with our Lantern Credit financial services marketplace platform.
Members
We believe we are inhave created an innovative financial services platform designed to offer best-in-class products to meet the early stagesbroad objectives of our members and the digital transformationlifecycle of their financial needs. Our platform offers our members (as defined under Part II, Item 7. “Key Business Metrics”) a suite of financial products and services, enabling them to borrow, save, spend, invest and protect their finances across one integrated platform, as well as personal financial management tools and benefits to complement our products. Our aim is to create a result, havebest-in-class, integrated financial services platform that will generate a substantial opportunityvirtuous cycle whereby positive member experiences will lead to continuenew product adoption by existing members and enhanced profitability for each additional product by lowering overall member acquisition costs and increasing the lifetime value of our members. We refer to growthis virtuous cycle as our member base and increase the number of products that our members use on the SoFi platform.“Financial Services Productivity Loop”, which is further discussed below.
Enterprises
In addition to benefiting our members, our products and capabilities are also designed to appeal to enterprises, such as financial services institutions that subscribe to our enterprise services called SoFi At Work, and have become interconnected with the SoFi platform. We have continued to expand our platform capabilities for enterprises through strategic acquisitions, including: (i) our acquisition of Galileo in 2020, which provides technology platform services to financial and non-financial institutions and which has allowed us to vertically integrate across more of our financial services, and our anticipated acquisition(ii) the Technisys Merger in the first quarter of Technisys in 2022, through which we will expandadded a cloud-native digital and core banking platform into our technology platform offerings and expanded our technology platform services to a broader international market.
While we primarily operate in the United States, we expanded into Hong Kong with our acquisition of 8 Limited (an investment business), we gained clients in Mexico and Colombia with our acquisition of Galileo, and we expect to further expand into Latin America with our anticipated acquisition of Technisys.
We believe that these These expansions will deepenhave deepened our participation in the entire technology ecosystem powering digital financial services, allowing us to not only reduce costs to operate our member-centric business, but also deliver increasing value to our enterprise customers. While our enterprises are not considered members, they are important contributors to the growth of the SoFi platform, and also have their own constituents who might benefit from our products in the future.
National Bank Charter
A key element of our long-term strategy to better serve our members has been to secure a national bank charter. In January 2022, we received regulatory approval to become a bank holding company and to acquire Golden Pacific, and its wholly-owned subsidiary, Golden Pacific Bank, National Association, a national bank (“Golden Pacific Bank”). We also received approval to change the composition of Golden Pacific Bank’s assets. We closed the Bank Merger in February 2022, after which we became a bank holding company and Golden Pacific Bank began operating as SoFi Bank. See “Management’s Discussion and Analysis of Financial Condition and Results of Operations—National Bank Charter” for additional information on our regulatory approval process and the Bank Merger.
We believe that operating as a bank holding company can enhance our overall profitability. While we have historically relied on third-party bank holding companies to provide banking services to our members (as discussed further in “Our Products” below), we believe that operating under a national bank charter will allow us to provide members and prospective members broader and more competitive options across their financial services needs, including deposit accounts and loan products, and lower our cost to fund loans (by utilizing our members deposits held at SoFi Bank to fund our loans), which we
believe will enable us to offer lower interest rates on loans to members as well as offer higher interest rates on deposit accounts. Following the Bank Merger, we have begun to transfer SoFi Money products to SoFi Bank and intend to continue to transfer our SoFi Money, lending, and SoFi Credit Card products to SoFi Bank over time.
Our Differentiation
In order to build best-in-class offerings, we focus on four differentiators: fast, selection, content and convenience.
(1)Fast — We aspire to be the fastest place for our members to responsibly do anything, whether it’s applying for a loan, getting a funded loan, opening an account, buying or selling a stock, uploading a mobile check, getting access to money, paying a friend, or accessing relevant financial content. Other than certain products acquired and offered through SoFi Bank, our products are all digital and we have a culture of iteration to help drive faster and faster services.
(2)Selection — Given the digital nature of our products, the permutations of features and services that can be made available to our members across their needs to borrow, save, spend, invest and protect are significant. We will continue to iterate, learn and innovate to broaden our selection in the same way we did by providing our members with the ability to buy single stocks without commissions, purchase fractional shares, invest in SoFi proprietary robo-advisory portfolios, and invest in SoFi-branded Exchange-Traded Funds.
(3)Content — Our financial education, insights, research content, actionable tools and advice are designed to provide meaningful value for our members. Our carefully-crafted and personalized content is offered through our member home feed and is designed to help our members get their money right. We strive to provide digestible financial education, meaningful answers, salient information, advice, credit scores, financial calculators, investment research and financial news that enhance member loyalty and increase the likelihood that members will use additional SoFi products in the future.
(4)Convenience — We hold ourselves accountable to providing the most convenient member experience possible in terms of ease of use, ubiquity, functionality, simplicity and responsive customer service. Our long-term goal is to provide the most convenient 24x7 service and dispel the historical construct of financial service availability based on 9-5 Monday through Friday.
Each product we offer is delivered in a member-centric way and is built and enhanced with these differentiators in mind. We believe that our member-centric one stop shop for financial services serves as a competitive differentiator for us relative to other financial services providers.
We offer our members a full suite of financial products and services all in one common mobile platform. To complement these products and services, we believe in building vertically-integrated technology platforms designed to manage and deliver the suite of solutions to our members in a low-cost and differentiated manner.
Our Strategy
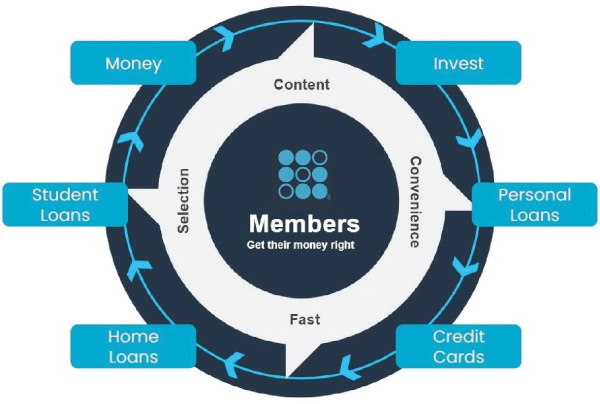
The Financial Services Productivity Loop
We believe that developing a relationship with our members and gaining their trust is central to our success as a financial services platform. Moreover, we believe that some of the current frictions faced by other financial institutions are caused by a disjointed and non-seamless product experience, a lack of digital acquisition, subpar mobile web products instead of digital native apps and incomplete product offerings to meet a customer’s holistic financial needs. Through our mobile technology and continuous effort to improve our financial services products, we are seeking to build a financial services platform that members can access for all of their financial services needs.
Our strategy, which we refer to as the “Financial Services Productivity Loop”, is centered around building trust and a lifetime relationship with our members, which we believe will help build a sustainable competitive advantage. In order to deliver on our strategy, we must develop best-in-class unit economics and best-in-class products that build trust and reliability between our members and our platform. Our acquisition of SoFi Bank was also an important step in continuing to build best-in-class unit economics and best-in-class products, as we believe it will enable us to offer additional products and lower fees. When we do this on a member’s first product, and they later consider using an additional product, they are more likely to start with our platform and we have a higher chance that they will select one of our products to meet their other financial needs. This results in delivering more revenue per member with no second member acquisition costs, resulting in higher lifetime value per member. This also reinforces the benefits of our platform, which simplifies the entire financial ecosystem for our members, helping them get their money right. We are able to use the increased profits to further improve member benefits and product experience.
We believe we are in the early stages of realizing the benefits of the Financial Services Productivity Loop. During the year ended December 31, 2021, approximately 600,000 members became multi-product members. In addition to realizing the benefits of more of our members adopting multiple SoFi products, both in terms of additional revenue and lower member acquisition costs per product, the Financial Services Productivity Loop strategy delivers operating and technology efficiencies to deliver better unit economics on a per product basis. One of the success factors of our lending business is that it is vertically integrated across our technology stack, risk protocols and operations processes.
| | |
Financial Services Productivity Loop |
Our Products
We offer our members a suite of financial products and services all in one digital native application to help members get their money right. In 2011, we started our company with an innovative approach to the private student loan market and later expanded our lending product offerings to include personal loans and home loans. We have continued to expand our overall strategy to not only include products that enable our members to borrow better, but also to save better, spend better, invest better and protect better. In the first quarter of 2019, we launched SoFi Money, SoFi Invest and SoFi Relay. In that same quarter, we also redesigned our end-to-end approach to mortgage lending and relaunched home loans. In the third quarter of 2019, we introduced in-school loans and in the third quarter of 2020, we launched SoFi Credit Card, which was expanded to a broader market in the fourth quarter of 2020.
In addition, we have built a social area within our digital native application, which we refer to as the member home feed. In the member home feed, we show our members what is happening in their financial lives through personalized cards with relevant content, news and tools. Through the member home feed, there are significant opportunities to build frequent engagement and, to date, the member home feed has been an important and additional driver of new product adoption. The member home feed is an important part of our strategy and our ability to use data as a competitive advantage.
To complement these products and services, we believe in establishing partnerships to leverage our existing capabilities to reach a broader market and in building vertically-integrated technology platforms designed to manage and deliver our suite of solutions to our members in a low-cost and differentiated manner.
Our Reportable Segments
We conduct our business through three reportable segments: Lending, Technology Platform and Financial Services. Below is a discussion of our segments and their corresponding products.
Lending Segment
Our origins are in student loans. On the strength of our capabilities in student lending, we expanded into personal loans and home loans and related services. We believe that our market opportunity within each of these lending channels is significant. Our lending process primarily leverages an in-application, digital borrowing experience, which we believe serves as a competitive advantage as digital lending becomes increasingly ubiquitous. We expect to begin accepting new loan applications and originating new loans within SoFi Bank over time. As a bank holding company, we expect to be able to offer a wider range of loan sizes and interest rates through SoFi Bank.
Student Loans. We primarily operate in the student loan refinance space, with a focus on super-prime graduate school loans. We later expanded into “in-school” lending, which allows members to borrow funds while they attend school. We offer flexible loan sizes and repayment options, competitive rates, and the ability to lock in an interest rate for funding at a later time on our student loan products.
Personal Loans. We primarily originate personal loans for debt consolidation purposes and home improvement projects. We offer fixed and variable rate loans with no origination fees and flexible repayment terms, such as unemployment protection. There are other personal loan purposes or channels that we have not aggressively pursued, which we believe could represent opportunities for us in the future.
Home Loans. We have historically offered agency and non-agency loans for members purchasing a home or refinancing an existing mortgage. For our home loan products, we offer competitive rates, flexible down payment options for as little as 3% and educational tools and calculators.
A key element of our underwriting process is the ability to facilitate risk-based interest rates that are appropriate for each loan. Using SoFi’s proprietary risk models, we project quarterly loan performance, including expected losses and prepayments. The outcome of this process helps us determine a more data-driven, risk-adjusted interest rate that we can offer our members.
We have developed an extensive underwriting process across each lending product that is focused on willingness to pay (measured by credit attributes), ability to pay (measured through income verification), and capacity to pay (measured by debt service in relation to other loans). Our student loan and personal loan underwriting models consider credit reports, industry credit and bankruptcy prediction models, custom credit assessment models, and debt capacity analysis, as indicated by borrower free cash flow (defined as borrower monthly net income less revolving and installment payments less housing payments). We decreased our in-school loan minimum FICO requirement in conjunction with our launch of a revised underwriting strategy during 2021, which utilizes an advanced risk model that focuses on borrowers’ ability to pay and provides refined risk separation. Home loans originated by SoFi that are agency conforming loans are subject to credit, debt service, and collateral eligibility established by Fannie Mae. Existing members generally experience a higher approval rate than new members, subject to the existing member being in good standing on their existing products. Home loans originated by us that are non-agency loans are subject to our credit criteria, which typically includes a minimum tri-bureau credit score, established credit history requirements, income verification, as well as maximum qualified mortgage limits on debt-to-income service and caps on loan-to-value based on an accredited appraisal. We also leverage our data to provide existing members a streamlined application process through automation.
Our lending business is primarily a gain-on-sale model, whereby we seek to originate loans and recognize a gain from these loans when we sell them into either our whole loan or securitization channels. We sell our whole loans primarily to large financial institutions, such as bank holding companies, typically at a premium to par, and in excess of our costs to originate the loans. Our loan premiums fluctuate from time to time based on benchmark rates and credit spreads, and we are not guaranteed a gain on all or any of our loan sales. When securitizing loans, we first isolate the underlying loans in a trust and then sell the beneficial interests in the trust to a bankruptcy-remote entity. In securitization transactions that do not qualify for sale accounting, the related assets remain on our consolidated balance sheet and cash proceeds received are reported as liabilities, with related interest expense recognized over the life of the related borrowing. In securitization transactions that qualify for sale accounting, we typically have insignificant continuing involvement as an investor.
Prior to selling our loans, we hold our loans on our consolidated balance sheet at fair value and primarily rely upon warehouse financing and our own capital to enable us to expand our origination capabilities. By securing our national bank charter, we believe we can lower our cost of funding by utilizing our members’ deposits held at SoFi Bank to fund our loans. Net interest income, which we define as the difference between the earned interest income and interest expense to finance loans, is a key component of the profitability of our Lending segment.
In the case of both whole loan sales and securitizations, and with the exception of certain of our home loans, we also continue to retain servicing rights to our originated loans following transfer. We view servicing as an integral component of the Lending segment, as we believe our servicing function is an important asset because of the connection to the member it affords us throughout the life of the loan. We directly service all of the personal loans that we originate. We act as master servicer for, and rely on sub-servicers to directly service, all of our student loans and Federal National Mortgage Association (“FNMA”) conforming home loans. We believe this ongoing relationship with our members enhances the effectiveness of our Financial Services Productivity Loop by increasing member touchpoints and driving increases in the number of products per member.
Furthermore, our platform supports the full transaction lifecycle, including credit application, underwriting, approval, funding and servicing. Through data derived at loan origination and throughout the servicing process, SoFi has life-of-loan
performance data on each loan in its ecosystem that we originate and on which we retain servicing, which provides a meaningful data asset.
Technology Platform Segment
Our Technology Platform segment consists of Galileo, which we acquired in May 2020. Galileo is a provider of technology platform services to financial and non-financial institutions. Through Galileo, we provide services through a suite of program, event and authorization application programming interfaces for financial and non-financial institutions. Additionally, Galileo provides vertical integration benefits with SoFi Money and deposit accounts held at SoFi Bank.
We earn revenue on Galileo’s platform in the following two ways:
•Technology Platform Fees: We earn Technology Platform revenues for providing continuous delivery of an integrated technology platform as an outsourced service for financial and non-financial institutions. The platform fees we earn are based on access to the platform and are specific to the type of transaction. For example, we offer “event pricing”, which includes a specific charge for an account setup, an active account on file, use of Program, Event and Authorization Application Programming Interfaces (“APIs”), card activation, authorizations and processing, and card loads. In addition, we offer “partner pricing”, which is the back-end support we provide to Galileo’s clients, such as live agent customer service, chargeback and fraud analysis and credit bureau reporting, all within one integrated solution for our clients.
•Program Management Fees: Also referred to as “card program fees”, these transaction fees are generated from the creation and management of card programs issued by banks and requested by enterprise partners. In these arrangements, Galileo performs card management services and the revenue stems from the payment network and card program fees generated by the card program. This revenue is reduced by association and bank issuer costs, and a revenue share passed along to the enterprise partner that markets the card program. We categorize this class of revenue as payment network fees.
Galileo typically enters into multi-year service contracts with its clients. The contracts provide for a variety of integrated platform services, which vary by client and are generally either non-cancellable or cancellable with a substantive payment. Pricing structures under these contracts are typically volume-based, or a combination of activity- and volume-based, and payment terms are predominantly monthly in arrears. Most of Galileo’s contracts contain minimum monthly payments with agreed upon monthly service levels and may contain penalties if service levels are not met.
The Technology Platform segment historically included our minority ownership of Apex Clearing Holdings, LLC (“Apex”), a technology-enabled provider of investment custody and clearing brokerage services, in which we invested in December 2018 and which investment was called by the seller in January 2021. Apex continues to provide investment custody and clearing services for SoFi Invest, including for our brokerage activities, under a multi-year revenue sharing arrangement.
Financial Services Segment
Our digital suite of financial services products, by nature, provides more daily interactions with our members and is, therefore, differentiated from our lending products, which inherently have less consistent touchpoints with our members. We offer a suite of financial services solutions, including cash management and investment services across our SoFi Money, SoFi Invest, SoFi Credit Card and SoFi Relay products. SoFi Money is a digitally-native, mobile cash management experience for our members. Following the Bank Merger, we have begun to transfer SoFi Money products to deposit accounts held at SoFi Bank. SoFi Invest is a mobile-first investment platform offering members access to trading and advisory solutions, such as active investing, robo-advisory and digital assets accounts. SoFi Credit Card has no annual fee and is designed to help our members save, invest and pay down debt through a variable rewards program, with higher rewards offerings when redeeming into other SoFi products, such as SoFi Money or deposit accounts held at SoFi Bank, SoFi Invest or SoFi personal or student loans. To complement these products, we offer financial tracking through SoFi Relay, and partner with other enterprises through loan referrals and our SoFi At Work service. We also developed a financial services marketplace platform branded Lantern Credit to help applicants that do not qualify for SoFi products with alternative products from other providers, as well as providing a product comparison experience.
SoFi Money. SoFi Money is a digital, mobile cash management account offered by SoFi Securities LLC (“SoFi Securities”), a FINRA registered broker dealer. The SoFi Money account is a brokerage account powered by the SoFi application and SoFi Money Debit Card.
Prior to becoming a bank holding company, we exclusively relied on member bank holding companies (each a “Member Bank”) to provide cash management services to our members through our bank sweep program at our broker-dealer
subsidiary, wherein our members place funds on deposit with us that are then swept out and placed on deposit with Member Banks. We continue to rely on Member Banks to provide such cash management services for our members’ SoFi Money accounts, which we expect to transition to deposits held at SoFi Bank over time, as further discussed below. We generate interest income from deposits sitting in our various Member Banks, which rates are determined with each bank and are variable in nature, and which is reduced by the interest fees paid to members. We create and manage the digital, mobile cash management experience for our members. We also earn payment network fees on member expenditures via SoFi-branded debit cards issued by one of our Member Banks. Payment network fees are reduced by direct fees payable to card associations and the Member Bank.
The Bancorp Bank (“Bancorp”) is the issuer of all SoFi Money debit cards and sponsors access to debit networks for payment transactions, funding transactions and associated settlement of funds under a sponsorship agreement with SoFi Securities. Additionally, Bancorp provides sponsorship and support for ACH, check, and wire transactions along with associated funds settlement. The SoFi Money product also utilizes a sweep administrator, UMB Bank, National Association (“UMB”), to sweep funds to and from the SoFi Money program banks, as necessary, under a program broker agreement between SoFi Securities and UMB and program account and program bank agreements with a variety of sweep program banks. SoFi Securities’ agreement with Bancorp provides for receipt by Bancorp of program revenue and transaction fees, and is subject to a minimum monthly card activity fee. The agreement with Bancorp is terminable by SoFi Securities with 120 days prior notice. The program broker agreement between SoFi Securities and UMB provides for one-year terms that automatically renew and is terminable by either party with at least 90 days’ written notice prior to the end of the current term. The program account agreements and program bank agreements between SoFi Securities, UMB and the sweep banks provide for the rate of interest payable on the balances in a member’s SoFi Money account and include certain maximum transfer requirements on transfers. These arrangements are generally terminable upon termination of SoFi Securities’ sweep arrangement with UMB.
As a bank holding company, in 2022 we have begun to allow existing members to convert their SoFi Money cash management accounts into deposit accounts held at SoFi Bank, which allows us to offer both checking and savings features and higher interest rates on the accounts, and through which SoFi Bank is expected to use the deposit accounts as an alternative and more cost-effective source of funding for loans. Additionally, through SoFi Bank we expect to, among other things, issue debit cards and provide ACH, check, and wire transaction services over time.
We believe SoFi Money and deposit accounts held at SoFi Bank are attractive to our members and prospective members because our digital banking platform allows members to spend, save and earn interest and rewards in flexible ways, all within our mobile application. Finally, our “vaults” feature provides a nimble account balance resource that can facilitate budgeting and saving, and provides members with enhanced tracking visibility toward their financial goals.
SoFi Invest. SoFi Invest is a digital brokerage service that provides a streamlined mobile investing experience through which we offer multiple ways to invest and give members access to active investing, robo-advisory and digital assets services. Our active investing service enables members to buy and sell stocks and exchange-traded funds, or ETFs. Our robo-advisory service offers managed portfolios of stocks, bonds and ETFs. Our digital assets service allows members to buy and sell select digital assets. Furthermore, our innovative “stock bits” feature allows members to purchase fractional shares in various companies.
Our interactive investing experience fosters virality by allowing members to engage with other investors’ activity on the platform. Finally, consistent with our aim for our members to “Get Your Money Right” and as part of our commitment to helping our members, we provide access to CFPs at no cost to the member. Additionally, we provide introductory brokerage services to our members and have invested heavily to create an appealing mobile investing experience. While we do not charge trading fees, other than for digital assets trading and for accounts on our 8 Limited platform, our platform benefits from increasing assets under management, as we generate interest income on cash balances that we hold. We also earn brokerage revenue through share lending and pay for order flow arrangements.
With respect to our digital assets trading activities, we do not hold or store members’ digital assets, but instead rely on a third-party custodian, and we hold an immaterial amount of digital assets in order to facilitate paying new member bonuses when members initiate their first digital assets trade. We do this for member convenience to facilitate a seamless payment of digital assets. In connection with our approval as a bank holding company, the Board of Governors of the Federal Reserve (the “Federal Reserve”) determined that the activities of SoFi Digital Assets, LLC in providing members with the ability to buy or sell various digital currencies through SoFi Digital Assets, LLC's omnibus account with a third-party custodian is not a permissible activity under the Bank Holding Company Act and Regulation Y. However, under Section 4 of the Bank Holding Company Act, the Federal Reserve has permitted us to continue our current digital assets related offering for a two-year conformance period from the date we became a bank holding company, with the possibility for three one-year extensions, provided that we do not expand our impermissible activities, except as authorized by the Bank Holding Company Act and
Regulation Y, or increase our established risk limits for total customer digital assets maintained in wallets that are accessible online, referred to as “hot wallets”, or held on balance sheet.
Through our “stock bits” offering, members with SoFi Invest active brokerage accounts may buy or sell fractional shares in a variety of equity securities. Members can place orders in dollars or shares. During the course of a trading day, all member orders are consolidated into a single order for each equity security, which may be a sell or buy order. These fractional orders are rounded up to the next whole share and executed as a market order prior to market close on a standard trading day. Following market close, we allocate the trades to each individual member.
Within our SoFi Invest product, we also believe there are opportunities to generate incremental future revenue through margin lending and options. Through our acquisition of 8 Limited in 2020, we expanded SoFi Invest into the Hong Kong market. We view SoFi Invest as an attractive first product for members who may later become deposit account holders or borrow with SoFi.
Other. We launched the SoFi Credit Card in the second half of 2020. We expect to transition the SoFi Credit Card assets to SoFi Bank, which is not expected to impact the member experience. Additionally, we developed SoFi Relay within the SoFi mobile application, a personal finance management product which allows members to track all of their financial accounts in one place and utilize credit score monitoring services. Further, we leverage our technology and information infrastructure to offer services to other enterprises, such as loan referrals, referral fulfillment and SoFi At Work, which is a platform we offer to enterprises that are looking for a seamless way to provide financial benefits to their employees, such as student loan payments made on their employees’ behalf, for which we earn a fee. We have also developed a financial services marketplace platform branded as Lantern Credit to help applicants that do not qualify for SoFi products find alternative products, as well as providing a product comparison experience. Our other services also include SoFi Protect, which partners with providers who offer products to help our members protect their assets, including insurance providers across auto, life, homeowners, property and casual, and renters products and estate planning. Finally, beginning in 2021, we earned revenues for providing equity capital markets services, either by serving in underwriting syndicates or for providing dealer services in partnership with underwriting syndicates in connection with helping companies successfully complete the business combination or initial public offering (“IPO”) process, as well as advisory services, inclusive of obtaining required shareholder votes.
We believe that the content and features we provide within our mobile application can spur more financial education, which leads to more ways for our members to engage in getting their money right and will ultimately demonstrate the effectiveness of our Financial Services Productivity Loop. SoFi Relay also provides us with unified intelligence about our members and offers us meaningful insights about what SoFi products may help our members best achieve their financial goals.
We earn revenues in connection with our Financial Services segment through various partnerships and our SoFi Money and SoFi Invest products in the following ways:
•Brokerage fees: We earn brokerage fees from our share lending and payment for order flow arrangements related to our SoFi Invest product (for which Apex serves as principal, and we are an agent), exchange conversion services and digital assets activity. In our share lending arrangements and payment for order flow arrangements with Apex, we do not oversee the execution of the transactions by our members, but benefit through a negotiated multi-year revenue sharing arrangement, since our members' brokerage activity drives the share lending and payment for order flow volume. Apex connects with market makers (order flow) and institutions (share lending) to facilitate the service and is responsible for execution. Apex carries inventory risk with the share lending and fractional share programs and ultimately is responsible for successful order routing to market makers that trigger the payment for order flow revenue, and therefore is in control of this offering. Apex sets the gross price and negotiates with market makers and institutions as part of our order flow and share lending arrangements. We have no discretion or visibility into this pricing and, instead, negotiate a net fee for our order flow and share lending arrangements, which is settled with Apex rather than with market makers or other institutions. In our digital assets arrangements, our fee is calculated as a negotiated percentage of the transaction volume. In our exchange conversion arrangements, we earn fees for exchanging one currency for another. Historically, these fees have not been a significant portion of our total net revenue. Our arrangements with Apex are governed by an agreement which contains certain minimum monthly requirements and which is terminable by either party upon notice. Although we no longer have an equity method investment in Apex as of December 31, 2021, Apex continues to provide the services under this agreement.
Beginning in the fourth quarter of 2021, we introduced a flat monthly platform fee that is charged to members associated with our 8 Limited business in Hong Kong. The fee is assessed at each month end on all members with at least one open 8 Limited brokerage account (with the exception of accounts for which the applicable fee exceeds the account’s net asset value at month end) regardless of the volume or frequency of trading activity during the month. The fee is deducted directly from the member’s primary brokerage account.
•Referral fees: Through strategic partnerships, we earn a specified referral fee in connection with referral activity we facilitate through our platform. Referral fees are paid to us by third-party partners that offer services to end users who do not use one of our product offerings, but who were referred to the partners through our platform. As such, the third-party enterprise partners are our customers in these referral arrangements. Beginning in the third quarter of 2021, referral fees also include referral fulfillment fees earned for providing pre-qualified borrower referrals to a third-party partner who separately contracts with a loan originator. The referral fulfillment fee is determined as either of two fixed amounts based on the aggregate origination principal balance of the loan. As such, the third-party partner is our customer in this referral fulfillment arrangement.
•Payment network fees: We earn payment network fees, which primarily constitute interchange fees from our SoFi Money and SoFi Credit Card products, which are reduced by fees payable to card associations and the issuing bank holding company. These fees are remitted by merchants and are calculated by multiplying a set fee percentage (as stipulated by the debit card payment network) by the transaction volume processed through such network. We arrange for performance by a card association and the bank issuer to enable certain aspects of the SoFi branded transaction card process. We enter into contracts with both parties that establish the shared economics of SoFi branded transaction cards. As we continue to transition our SoFi Money cash management accounts to deposit accounts held at SoFi Bank, we expect to decrease certain fees payable to third parties over time.
•Enterprise service fees: These fees are earned in connection with services we provide to enterprise partners through our At Work product, such as when we facilitate transactions for the benefit of their employees, such as 529 plan contributions or student loan payments. In the second quarter of 2021, enterprise services also included fees for providing advisory services to an enterprise partner to facilitate reaching a quorum on their shareholder vote. Our fee for these advisory services was a success-based fee for achieving contractually-specified targets.
•Equity capital markets fees: Equity capital markets fees consist of underwriting fees and dealer fees. Beginning in the second quarter of 2021, we earned underwriting fees related to our membership in underwriting syndicates for IPOs. Beginning in the fourth quarter of 2021, we also earned dealer fees for providing dealer services in partnership with underwriting syndicates for IPOs. We are engaged to place IPO shares that are allocated to us by the underwriters with third-party investors for which we have received a confirmed order. We recognize both types of equity capital markets fees on the applicable trade date.
•Net interest income: Our SoFi Invest and SoFi Money products also generate net interest income based on the cash balances held in these accounts. Historically, this income has not been a significant portion of our total net revenue. As a bank holding company, we expect to reduce our interest expense as we are able to increasingly use deposit accounts as an alternative and more cost-effective and less interest-rate sensitive source of funding for loans. Additionally, through operating under a national bank charter, we expect to be able to offer a wider range of loan sizes and interest rates through SoFi Bank, which we expect to positively impact our interest income.
Competition
We compete at multiple levels, including: (i) competition among other personal loan, student loan, credit card and residential mortgage lenders; (ii) competition for money deposits among other banks, some challenger banks and a variety of technology and retail companies; (iii) competition for investment accounts among other introductory brokerage firms and a variety of technology and other companies; (iv) competition for subscribers to financial services content; and (v) competition among other technology platforms for the enterprise services we provide, such as platform-as-a-service through Galileo.
Competition to fund prime loans. The prime lending market is highly fragmented and competitive. We face competition from a diverse landscape of consumer lenders, including other banks, credit unions and specialty finance lenders, as well as alternative technology-enabled lenders.
Competition to acquire money accounts. Although we now operate a bank, many other banks are larger, have been in business longer and often have greater brand awareness than us. Some large technology and retail companies have large consumer bases and strong balance sheets, which could enhance their competitive ability.
Competition to acquire investment brokerage accounts. The leading incumbent brokerage firms are larger, have been in business longer and generally have greater brand awareness than us. We also face competition from neo-brokerage platforms that provide some of the same features as us, such as a mobile brokerage experience and fractional share investing. In addition, technology and other companies have begun to offer some basic investing features and the ability to buy and sell digital assets.
Competition to attract financial services content viewership. There are many sources of financial news in the marketplace, many of which are more established and have a larger subscriber base.
Competition for debit and credit card sponsors, particularly some challenger banks who need a platform-as-a-service solution, such as the one provided by Galileo. Generally, these arrangements are multi-year contracts, which require us to spend the necessary resources on implementation and interconnecting new customers onto our platform. We face competition from larger institutions that could make investments into an integrated platform-as-a-service solution, and also undercut our pricing, preventing our current customers from renewing, while also impeding our attempts to acquire new members.
Marketing
Our sales and marketing efforts are designed to drive brand awareness, improve member acquisition efficiency and accelerate our Financial Services Productivity Loop. We attract and retain members through multiple marketing channels, including social media, traditional media such as the press, online affiliations, search engine optimization, search engine marketing, offline partnerships, preapproved direct mailings and television advertising. We continue to optimize our marketing strategy through a focus on our full suite of financial products and iterate on opportunities to accelerate the Financial Services Productivity Loop.
Government Supervision and Regulation
We are subject to extensive and complex rules and regulations, licensing and examination by various federal, state and local government authorities designed to, among other things, protect depositors, borrowers and customers. The following is a summary of certain aspects of the various statutes and regulations applicable to us and our subsidiaries. This summary is not a comprehensive analysis of all applicable laws, and is qualified by reference to the full text of statutes and regulations referenced below.
As a bank holding company, we are subject to regulation, supervision and examination by the Federal Reserve under the Bank Holding Company Act of 1956, as amended (“BHCA”), and SoFi Bank is subject to regulation, supervision and examination by the Office of the Comptroller of the Currency (the “OCC”).
SoFi Bank
In February 2022, we closed the Bank Merger, pursuant to which we became a bank holding company and began operating as SoFi Bank. Golden Pacific’s community bank business continues to operate as a division of SoFi Bank.
As a bank holding company, we offer checking and savings accounts and credit cards through SoFi Bank. We are originating all new loan applications within SoFi Bank, and we intend to continue to explore other products for SoFi Bank over time. The key current and expected financial benefits to us of operating a national bank include: (i) lowering our cost to fund loans, as we can utilize deposits held at SoFi Bank to fund loans, which have a lower borrowing cost of funds than our warehouse and securitization financing model, (ii) increasing our flexibility to hold loans on our balance sheet for longer periods, thereby enabling us to earn interest on these loans for a longer period, (iii) supporting origination volume growth by providing an alternative financing option, while also maintaining our warehouse capacity, and (iv) through deposits, providing us with meaningful member data that can allow us to better serve our members’ financial needs. See Part I, Item 1A. “Risk Factors” for a discussion of certain potential risks related to being a bank holding company.
International Operations
While we primarily operate in the United States, we also operate internationally in Latin America and Canada, largely through our Technology Platform segment, as well as in Hong Kong through SoFi Holdings (Hong Kong) Limited (an investment business).
In order to build best-in-class offerings, we focus on four differentiators: fast, selection, content and convenience.
(1)Fast — We aspire to be the fastest place for our members to responsibly do anything, whether it’s applying for a loan, getting a funded loan, opening an account, buying or selling a stock, uploading a mobile check, getting access to money, paying a friend, or accessing relevant financial content. Other than certain products acquired and offered through SoFi Bank, our products are all digital and we have a culture of iteration to help drive faster and faster services.
(2)Selection — Given the digital nature of our products, the permutations of features and services that can be made available to our members across their needs to borrow, save, spend, invest and protect are significant. We will continue to iterate, learn and innovate to broaden our selection in the same way we did this year by providing our members with
competitive interest rates on checking and savings accounts, options trading, “Pay in 4” (a buy now, pay later product), and SoFi Plus membership benefits.
(3)Content — Our financial education, insights, research content, actionable tools and advice are designed to provide meaningful value for our members. Our carefully-crafted and personalized content is offered through our member home feed and is designed to help our members get their money right. We strive to provide digestible financial education, meaningful answers, salient information, advice, credit scores, financial calculators, investment research and financial news that enhance member loyalty and increase the likelihood that members will use additional SoFi products in the future.
(4)Convenience — We hold ourselves accountable and aim to provide the most convenient member experience possible in terms of ease of use, ubiquity, functionality, simplicity and responsive customer service. Our long-term goal is to provide the most convenient 24x7 service and dispel the historical construct of financial service availability based on 9-5 Monday through Friday.
Each product we offer is delivered in a member-centric way and is built and enhanced with these differentiators in mind. We believe that our member-centric, one-stop shop for financial services serves as a competitive differentiator for us relative to other financial services providers.
We offer our members a full suite of financial products and services all in one common mobile platform. To complement these products and services, we believe in building vertically-integrated technology platforms designed to manage and deliver the suite of solutions to our members in a low-cost and differentiated manner.
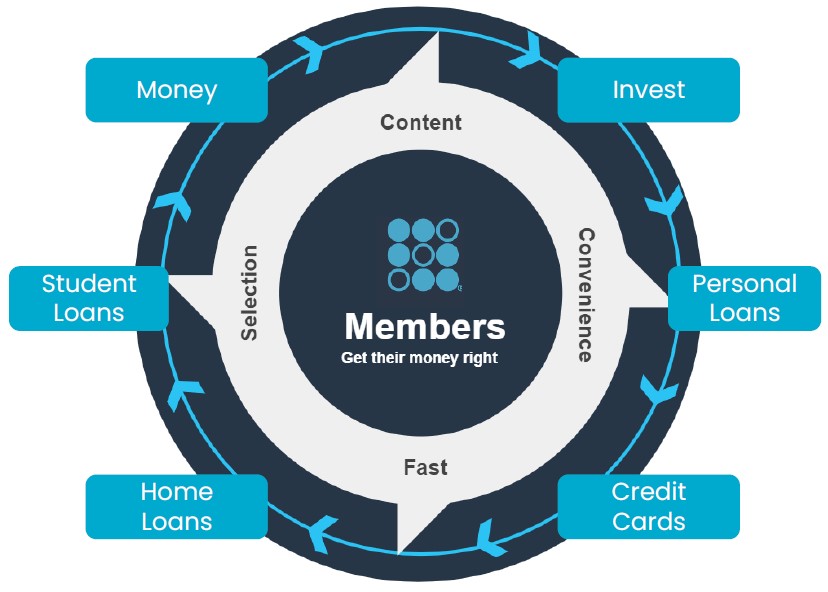
The Financial Services Productivity Loop We believe that developing a relationship with our members and gaining their trust is central to our success as a financial services platform. Moreover, we believe that some of the current frictions faced by other financial institutions are caused by a disjointed and non-seamless product experience, a lack of digital customer acquisition, subpar mobile web products instead of digital native apps and incomplete product offerings to meet a customer’s holistic financial needs. Through our mobile technology and continuous effort to improve our financial services products, we are seeking to build a financial services platform that can support all of our members’ financial services needs throughout their lifetime.
Our strategy, which is rooted in what we refer to as our “Financial Services Productivity Loop”, is centered around building trust and a lifetime relationship with our members, which we believe will help build a sustainable competitive advantage.
| | |
| Financial Services Productivity Loop |
In order to deliver on our strategy, we must develop best-in-class unit economics and best-in-class products that build trust and reliability between our members and our platform. Our acquisition of SoFi Bank was also an important step in continuing to build best-in-class unit economics and best-in-class products, as it has enabled us to achieve lower cost of funding through deposits, and improved unit economics and engagement on SoFi Money. When we do this on a member’s first product, and they later consider using an additional product, we believe they are more likely to start with our platform and we have a
higher chance that they will select one of our products to meet their other financial needs. This results in delivering more revenue per member with no second member acquisition costs, resulting in higher lifetime value per member. This also reinforces the benefits of our platform, which simplifies the entire financial ecosystem for our members, helping them get their money right. We are able to use the increased profits to further improve member benefits and product experience.
In addition to realizing the benefits of more of our members adopting multiple SoFi products, the Financial Services Productivity Loop strategy delivers operating and technology efficiencies to deliver better unit economics on a per product basis. One of the success factors of our lending business is that it is vertically integrated across our technology stack, risk protocols and operations processes.
We conduct our business through three reportable segments: Lending, Technology Platform and Financial Services. Below is a discussion of our segments and their primary products and non-product offerings.
Lending Segment
We offer personal loans, student loans, home loans and related servicing. We believe that our market opportunity within each of these lending channels is significant. Our lending process primarily leverages an in-application, digital borrowing experience, which we believe serves as a competitive advantage as digital lending becomes increasingly ubiquitous. Furthermore, our platform supports the full transaction lifecycle, including credit application, underwriting, approval, funding and servicing. Through data derived at loan origination and throughout the servicing process, SoFi has life-of-loan performance data on each loan in our ecosystem that we originate and on which we retain servicing, which provides a meaningful data asset. Net interest income, which we define as the difference between the earned interest income and interest expense to finance loans, is a key component of the profitability of our Lending segment.
Personal Loans. We originate personal loans to help our members with a variety of financial needs, such as debt consolidation, home improvement projects, family planning, travel and weddings, to name a few. We offer fixed rate loans with flexible repayment terms, including unemployment protection. We generally offer loan sizes of $5,000 to $100,000, subject to legal and/or licensing requirements, with terms generally ranging from 2 to 7 years. We regularly update the annual percentage rates offered on our personal loans.
Student Loans. We operate in the student loan refinance space, with a focus on prime and super-prime school loans, as well as the “in-school” lending space, which allows members to borrow funds while they attend school. We offer flexible loan sizes, repayment options and competitive rates. Within student loan refinancing, we generally offer loan sizes of $5,000 or higher, subject to legal and/or licensing requirements, with terms generally ranging from 5 to 20 years. Within in-school loans, we generally offer loan sizes of $1,000 or higher, subject to legal and/or licensing requirements, with terms generally ranging from 5 to 15 years. We regularly update the annual percentage rates offered on our fixed and variable-rate student loans.
Home Loans. We offer agency, non-agency and, beginning in the second quarter of 2023, certain government loans (e.g., VA and Federal Housing Administration loans) for members purchasing a home or refinancing an existing mortgage. For our home loan products, we offer competitive rates, flexible down payment options for as little as 3% (or 0% for VA loans), a close on time guarantee, and educational tools and calculators. For one-unit properties, we generally offer loan sizes of $75,000 to $766,550 for in conforming normal cost areas (with exceptions for smaller loan sizes considered on a case-by-case basis), up to $1,149,825 in conforming high cost areas (GSE-eligible loans above the normal conforming limit, which is determined by county). For multi-unit properties, we offer loan sizes up to $2,211,600. In addition, we offer loan sizes up to $3,000,000 for jumbo loans (loans in the jumbo loan program), up to $1,500,000 for VA loans, and up to $472,030 for Federal Housing Administration loans in most areas. Our fixed rate home loans generally have terms of 10, 15, 20, 25 or 30 years. We offer adjustable rate mortgage products for conforming and jumbo loans, with a fixed rate for 5, 7 or 10 years followed by rate adjustments every six months for the remainder of the 30-year term, and for VA and Federal Housing Administration loans, with a fixed rate for 5 years followed by rate adjustments every year for the remainder of the 30-year term. We regularly update the annual percentage rates offered on our home loans.
Lending Model
We originate loans through our lending business, and have the option of pursuing a gain-on-sale origination model, whereby we seek to recognize a gain from these loans and sell them into either our whole loan or securitization channels, or holding loans on our balance sheet when advantageous. This enables us to maximize our return and balance our risk by earning
interest on these loans for a longer period and to be selective in our sales arrangements. We expect to benefit from the continued mix towards deposit funding through operating SoFi Bank.
We sell our whole loans primarily to large financial institutions, such as bank holding companies. In securitization transactions that do not qualify for sale accounting, the related assets remain on our balance sheet and cash proceeds received are reported as liabilities, with related interest expense recognized over the life of the related borrowing. In securitization transactions that qualify for sale accounting, we typically have insignificant continuing involvement as an investor. In the case of both whole loan sales and securitizations, and with the exception of certain of our home loans, we also continue to retain servicing rights to our originated loans following transfer. We directly service all of the personal loans that we originate. We act as master servicer for, and rely on sub-servicers to directly service, all of our student loans and GSE conforming home loans. We view servicing as an integral component of the Lending segment, as we believe our servicing function is an important asset because of the connection to the member it affords us throughout the life of the loan thereby enhancing the effectiveness of our Financial Services Productivity Loop by increasing member touchpoints and driving new product adoption by existing members.
We rely upon deposits, warehouse financing and our own capital to enable us to continue to expand our origination capabilities. Our ability to utilize deposits held at SoFi Bank to fund our loans has lowered our overall cost of asset-backed financing relative to alternative sources of funding.
Underwriting Process
We have developed an extensive underwriting process across each lending product that is focused on willingness to pay (measured by credit attributes and risk scores), ability to pay (measured through income and free cash flow), and stability (measured by credit experience). A key element of our underwriting process is the ability to facilitate risk-based interest rates that we believe are appropriate for each loan using proprietary risk models through which we project quarterly loan performance, including expected losses and prepayments. We believe the outcome of this process helps us determine a more data-driven, risk-adjusted interest rate that we can offer our members. Further, our data and monitoring tools enable us to implement risk mitigation strategies quickly and efficiently, including underwriting standard adjustments to adapt our operations to changing environments and expectations.
Our personal loan and student loan underwriting models are typically based on credit reports, industry credit and bankruptcy prediction models, custom credit assessment models, and debt capacity analysis, as indicated by borrower free cash flow. Our underwriting strategy utilizes an advanced risk model that provides refined risk separation. Home loans originated by SoFi that are agency-conforming loans are subject to credit, debt service, and collateral eligibility established by GSEs. Government loans, such as VA and Federal Housing Administration loans, are subject to the underwriting requirements established by the appropriate government agency. In addition to these requirements, agency-conforming and government loans are subject to credit eligibility overlays imposed by SoFi as well as individual investor requirements. Other non-agency loans originated by us, such as Jumbo loans, are subject to investor credit criteria, which typically includes a minimum tri-bureau credit score, established credit history requirements, income verification, as well as maximum limits on debt-to-income service and caps on loan-to-value based on an accredited appraisal.
We also leverage our data to provide existing members a streamlined application process through automation. Across our loan products, existing members generally experience a higher approval rate than new members, subject to the existing member being in good standing on their existing products.
Technology Platform Segment
We provide technology platform services through a diversified suite of offerings which include an event and authorization platform accessed via application programming interfaces, a cloud-native digital and core banking platform and services related to both platforms. Our customers include financial and non-financial institutions in North and Latin America. We earn technology product and solutions revenue through the use of the platforms, either on a per use basis, or from overall license and maintenance fee service arrangements related to those respective platforms. We also offer additional add-on technology solutions to support our clients and drive engagement, such as an AI-based virtual assistant for customers of banks and financial institutions, and a real-time payment risk platform to enhance payment fraud mitigation strategies for financial customers. We continue to leverage investments made to integrate Galileo and Technisys and position the Technology Platform segment for diversified durable growth.
Financial Services Segment
Our suite of financial services products, by nature, provides more daily interactions with our members and is, therefore, differentiated from our lending products, which inherently have less consistent touchpoints with our members. We offer a suite of financial services solutions, the most significant of which are discussed below.
SoFi Money
Checking and savings accounts provide a digital banking experience which allows members to spend, save and earn interest and rewards in flexible ways. We believe SoFi Checking and Savings accounts held at SoFi Bank are attractive to our members and prospective members due to our differentiated offerings, including competitive interest rates, access to expanded FDIC insurance coverage of up to $2 million through our Insured Deposit Program and the convenience and benefits of being part of a cohesive, simplified financial ecosystem within our mobile platform.
SoFi Bank has also continued to expand its services. In the fourth quarter of 2022, SoFi Bank gained direct access to debit networks and began to perform certain services previously sponsored by the third party bank, including debit card issuance, and processing and settlement of ACH, check, and wire transactions.
Our legacy cash management product utilizes a sweep administrator to sweep funds to and from program banks, as necessary, under a program broker agreement between SoFi Securities and the sweep administrator, as well as program account and program bank agreements with a variety of sweep program banks. Since becoming a bank, a significant portion of remaining cash management account balances are swept to SoFi Bank as a program bank. The program broker agreement provides for one-year terms that automatically renew and is terminable by either party with at least 90 days prior written notice. Historically, the program account agreements and program bank agreements provided for the rate of interest payable on the balances in a member’s cash management account. Following the Bank Merger, we began to allow members to convert their cash management accounts into checking and savings accounts held at SoFi Bank. Effective June 5, 2022, most of our SoFi Money cash management accounts no longer earn interest, as we implemented our plan to build new features only for SoFi Checking and Savings and reduce support of our SoFi Money cash management accounts.
SoFi Invest
SoFi Invest is a mobile-first investment platform offering members access to trading and advisory solutions, such as active investing and robo-advisory. Our interactive investing experience fosters engagement by allowing members to view and monitor other investors’ activity on the platform. We view SoFi Invest as an attractive first product for members who may later become deposit account holders or borrow with SoFi.
Our active investing service enables members to buy and sell stocks and ETFs, as well as alternative investment funds, mutual funds and money market funds beginning in January 2024, to engage in options trading, to purchase shares in IPOs before they trade on an exchange, to buy and sell fractional shares, to engage in margin investing and to access a retirement savings account. Our robo-advisory service offers managed portfolios of stocks, bonds and ETFs. Additionally, we provide introductory brokerage services to our members and have invested heavily to create an appealing mobile investing experience.
In connection with our approval as a bank holding company in February 2022, the Federal Reserve determined that the activities of SoFi Digital Assets, LLC in providing members with the ability to buy or sell various digital currencies through SoFi Digital Assets, LLC's omnibus account with a third-party custodian is not a permissible activity under the Bank Holding Company Act and Regulation Y. However, under Section 4 of the Bank Holding Company Act, the Federal Reserve has permitted us to continue our current digital assets related offering for a two-year conformance period from the date we became a bank holding company, with the possibility for three one-year extensions, provided that we do not expand our impermissible activities, except as authorized by the Bank Holding Company Act and Regulation Y, or increase our established risk limits for total customer digital assets maintained in wallets that are accessible online, referred to as “hot wallets”, or held on balance sheet. Based on this, in the fourth quarter of 2023, we made the decision to transfer the crypto services provided within SoFi Digital Assets, LLC, and began closing existing digital assets accounts. See Note 1. Organization, Summary of Significant Accounting Policies and New Accounting Standards for additional information on the transfer of the crypto services.
Other
Additional financial services solutions offered within our platform include:
•SoFi Credit Card: Designed to help eligible members spend better with cash back rewards on every purchase and without limits. Our unlimited cash back credit card features no annual fee, no foreign transaction fees and flexible redemption options through statement credit or other SoFi products.
•Lantern Credit: A financial services marketplace platform developed to help applicants that do not qualify for SoFi products to seek alternative products from other providers, as well as to provide a product comparison experience.
•Other lending as a service: Includes referred loans which are originated by a third-party partner to which we provide pre-qualified borrower referrals, and certain loans which we originate and subsequently sell to a third-party partner.
•SoFi Relay: A personal finance management product that allows members to track all of their financial accounts in one place and gain meaningful insights into their financial health and habits, such as credit score monitoring and spending behaviors. SoFi Relay also provides us with unified intelligence about our members that offers information about what SoFi products and features may help our members best achieve their financial goals, allowing us to further personalize the SoFi experience for our members.
•SoFi Protect: A service through which we partner with providers who offer insurance products to help our members protect their assets, including providers across auto, life, homeowners, renters, and cyber insurance products and estate planning.
•SoFi Travel: A service through which we partner with a provider to offer an easy travel search and booking experience that can be managed directly through the SoFi app or website, alongside expanded member benefits including member prices on certain bookings and additional cash back rewards on purchases made with SoFi Credit Card.
•SoFi At Work: A service through which we partner with other enterprises looking for a seamless way to provide financial benefits to their employees, such as student loan payments made on their employees’ behalf.
We believe that the content and features we provide within our mobile application can spur more financial education, which leads to more ways for our members to actively engage in getting their money right and can ultimately demonstrate the effectiveness of our Financial Services Productivity Loop.
We compete at multiple levels, including: (i) competition among other personal loan, student loan, credit card and residential mortgage lenders, (ii) competition for deposits among other banks, some challenger banks and a variety of technology and retail companies, (iii) competition for investment accounts among other introductory brokerage firms and a variety of technology and other companies, (iv) competition for subscribers to financial services content, and (v) competition among other technology platforms for the enterprise services we provide, such as platform as a service and cloud-native digital and core banking services.
Competition to fund prime loans. The prime lending market is highly fragmented and competitive. We face competition from a diverse landscape of consumer lenders, including other banks, credit unions and specialty finance lenders, as well as alternative technology-enabled lenders.
Competition to acquire deposits. Although we now operate a bank, many other banks are larger, have been in business longer and often have greater brand awareness than us. Some large technology and retail companies have large consumer bases and strong balance sheets, which could enhance their competitive ability.
Competition to acquire investment brokerage accounts. We face competition from brokerage platforms that provide some of the same features as us, such as a mobile brokerage experience, robo-investing, fractional share investing and options trading. In addition, the leading incumbent brokerage firms are larger, have been in business longer and generally have greater brand awareness than us. Technology and other companies have begun to offer some basic investing features and the ability to buy and sell digital and other assets.
Competition to attract financial services content viewership. There are many sources of financial news in the marketplace, many of which are more established and have a larger subscriber base.
Competition for technology products and solutions. Generally, these arrangements are multi-year contracts, which require us to spend the necessary resources on implementation and interconnecting new clients onto our platform. We face competition from larger institutions that could make investments into an integrated platform as a service solution or to a cloud-native digital and core banking solution, and also undercut our pricing, preventing our current clients from renewing, while also impeding our attempts to acquire new clients.
Our sales and marketing efforts are designed to drive brand awareness, improve member acquisition efficiency and accelerate our Financial Services Productivity Loop. We attract and retain members through multiple marketing channels, including social media, traditional media such as the press, online affiliations, search engine optimization, search engine marketing, offline partnerships and sponsorship arrangements, preapproved direct mailings and television advertising. We continue to optimize our marketing strategy through a focus on our full suite of financial products and iterate on opportunities to accelerate the Financial Services Productivity Loop.
Government Supervision and Regulation We are subject to extensive and complex supervision and examination by various federal, state and local government authorities designed to, among other things, protect depositors, borrowers and other customers. The following is a summary of certain aspects of the various statutes and regulations applicable to us and our subsidiaries. This summary is not a comprehensive analysis of all applicable laws, and is qualified by reference to the full text of statutes and regulations referenced below, which may be modified or amended from time to time.
As a bank holding company, we are subject to regulation, supervision and examination by the Federal Reserve under the BHCA, and SoFi Bank is subject to regulation, supervision and examination by the OCC, and beginning January 1, 2024, SoFi Bank and its affiliates became subject to supervision and examination by the CFPB. SoFi Securities is subject to regulation by FINRA and the SEC and the Company and its affiliates are subject to supervision and examination by various state regulators.
Bank Holding Company Regulation. The Federal Reserve has the authority, among other things, to order bank holding companies such as the Company to cease and desist from unsafe or unsound banking practices;practices, to assess civil money penalties;penalties and to order termination of non-banking activities or termination of ownership and control of a non-banking subsidiary by a bank holding company.
Source of Strength. Under the Dodd-Frank Wall Street Reform and Consumer Protection Act, (“Dodd-Frank Act”), we are required to serve as a source of financial strength for SoFi Bank. This means that we may be required to provide capital or liquidity support to SoFi Bank, even at times when we may not have the resources to provide such support to SoFi Bank.
Acquisitions and Activities. The BHCA prohibits a bank holding company, without prior approval of the Federal Reserve, from acquiring all or substantially all the assets of a bank, acquiring control of a bank, merging or consolidating with another bank holding company, or acquiring direct or indirect ownership or control of any voting shares of another bank or bank holding company if, after such acquisition, the acquiring bank holding company would control more than 5% of any class of the voting shares of such other bank or bank holding company. The BHCA also prohibits a bank holding company from engaging directly or indirectly in activities other than those of banking, managing or controlling banks or furnishing services to its subsidiary banks. However, a bank holding company may engage in and may own shares of companies engaged in activities that the Federal Reserve has determined, by order or regulation, to be so closely related to banking as to be a proper incident thereto.
The Company has elected to be treated as a financial holding company pursuant to Section 4(l) of the BHC Act. As a financial holding company, the Company is authorized to engage in a broader set of financial activities than a bank holding company that has not elected to be a treated as a financial holding company, including insurance underwriting and broker-dealer services as well as activities that are jointly determined by the Federal Reserve and the U.S. Treasury to be financial in nature or incidental to such financial activity. Financial holding companies may also engage in activities that are determined by the Federal Reserve to be complementary to financial activities. “Financial activities” is broadly defined to include not only banking, insurance and securities activities, but also merchant banking and additional activities that the Federal Reserve, in consultation with the Secretary of the Treasury, determines to be financial in nature, incidental to such financial activities, or complementary activities that do not pose a substantial risk to the safety and soundness of depository institutions or the financial system generally.
If a financial holding company or any depository institution subsidiary of a financial holding company fails to remain well capitalized and well managed, the Federal Reserve may impose such limitations on the conduct or activities of the financial holding company as the Federal Reserve determines to be appropriate, and the company and its affiliates may not commence any new activity or acquire control of shares of any company engaged in any activity that is authorized particularly
for financial holding companies without first obtaining the approval of the Federal Reserve. The companyCompany must also comply with all applicable Federal Reserve requirements for financial holding companies. If a financial holding company remains out of compliance for 180 days or such longer period as the Federal Reserve permits, the Federal Reserve may require the financial holding company to divest either its insured depository institution or all of its non-banking subsidiaries engaged in activities not permissible for a bank holding company. If an insured depository institution subsidiary of a financial holding company fails to maintain a “satisfactory” or better record of performance under the Community Reinvestment Act, the financial holding company will be prohibited, until the rating is raised to “satisfactory” or better, from engaging in new activities authorized particularly for financial holding companies or acquiring companies engaged in such activities.
Limitations on Acquisitions of Our Common Stock. The Change in Bank Control Act prohibits a person or group of persons acting in concert from acquiring “control” of a bank holding company unless the Federal Reserve has been notified and has not objected to the transaction. Under a rebuttable presumption established by the Federal Reserve, the acquisition by a person or group of persons acting in concert of 10% or more of a class of voting securities of a bank holding company with a class of securities registered under Section 12 of the Exchange Act constitutes the acquisition of control of a bank holding company for purposes of the Change in Bank Control Act. In addition, the BHCA prohibits any company from acquiring control of a bank or bank holding company without first having obtained the approval of the Federal Reserve. Under the BHCA, a company is deemed to control a bank or bank holding company if the company owns, controls or holds with power to vote 25% or more of a class of voting securities of the bank or bank holding company, controls in any manner the election of a majority of directors or trustees of the bank or bank holding company, or the Federal Reserve determines that the company has the power to exercise a controlling influence over the management or policies of the bank or bank holding company. Under a rebuttable presumption of control established by the Federal Reserve, the acquisition of control of more than 5% of a class of voting securities of a bank holding company, together with other factors enumerated by the Federal Reserve, could constitute the acquisition of control of a bank holding company under the BHCA.
Enhanced Prudential Supervision. SoFi Bank does not currently have $10 billion or more of consolidated assets, but may in the future. The Dodd-Frank Act and other federal banking laws subject companies with $10 billion or more of consolidated assets to additional regulatory requirements. More specifically, among other things, section 1075 of the Dodd-Frank Act, which is commonly known as the “Durbin Amendment”, amended the Electronic Fund Transfer Act to restrict the amount of interchange fees that may be charged and prohibit network exclusivity for debit card transactions, and as such, if we were to become subject to such restriction, it may negatively impact future payment network fees. The restrictions on interchange fees in the Durbin Amendment do not apply to any issuer that, together with its affiliates, has assets of less than $10 billion. Section 619 of the Dodd-Frank Act, commonly known as the “Volcker Rule”, which generally prohibits banking entities from engaging in proprietary trading and from acquiring or retaining an ownership interest in or sponsoring certain types of investment funds, does not apply to an insured depository institution if it, and every company that controls it, has total consolidated assets of $10 billion or less and consolidated trading assets and liabilities that are 5% or less of consolidated assets. If SoFi Bank or the Company exceed these thresholds, we would become subject to the Volcker Rule. In addition, section 1025 of the Dodd-Frank Act provides that the CFPB has authority to examine any insured depository institution with total assets of more than $10 billion and any affiliate thereof.
Bank Regulation. SoFi Bank is subject to regulation, supervision and examination by the OCC. Additionally, the FDIC has secondary supervisory authority as the insurer of SoFi Bank’s deposits. SoFi Bank is also subject to regulations issued by the CFPB, as enforced by the OCC. Pursuant to the Dodd-Frank Act, the Federal Reserve may directly examine the subsidiaries of the Company, including SoFi Bank. The enforcement powers available to the federal banking regulators include, among other things, the ability to issue cease and desist or removal orders; to terminate insurance of deposits;deposits, to assess civil money penalties;penalties, to issue directives to increase capital;capital, to place SoFi Bank into receivership;receivership, and to initiate injunctive actions against banking organizations and institution-affiliated parties.
CFPB Regulation. Beginning January 1, 2024, SoFi Bank and its affiliates became subject to supervision and regulation by the CFPB with respect to federal consumer protection laws, including laws relating to fair lending and the prohibition of unfair, deceptive or abusive acts or practices in connection with the offer, sale or provision of consumer financial products and services. As part of its regulatory oversight, the CFPB has authority to take enforcement actions against firms that offer certain products and services to consumers using practices that are deemed to be unfair, deceptive or abusive.
Deposit Insurance. Deposit obligations of SoFi Bank are insured by the FDIC’s Deposit Insurance Fund up to $250,000 per depositor. Deposit insurance premiums are based on assets, while taking into account various factors, including certain financial metrics and a bank’s supervisory ratings. The FDIC has the authority to adjust deposit insurance assessment rates at any time. Further through SoFi Money, members have access to expanded FDIC insurance coverage of up to $2 million through a reciprocal deposit network of participating banks in our Insured Deposit Program. Under the Federal Deposit Insurance Act (“FDIA”),FDIA, insurance of deposits may be terminated by the FDIC if the FDIC finds that the insured depository institution has engaged in unsafe and unsound practices, is in an unsafe or unsound condition to continue operations or has violated any applicable law, regulation, rule, order or condition imposed by the FDIC. In addition,For 2023, the FDIC insurance expense for SoFi Bank is subject to deposit insurance assessments.was $21.7 million.
Activities and Investments of National Banking Associations. National banking associations must comply with the National Bank Act and the regulations promulgated thereunder by the OCC, which generally limit the activities of national banking associations to those that are deemed to be part of, or incidental to, the “business of banking”. Activities that are part
of, or incidental to, the business of banking include taking deposits, borrowing and lending money and discounting or negotiating promissory notes, drafts, bills of exchange, and other evidences of debt. Subsidiaries of national banking associations generally may only engage in activities permissible for the parent national bank.
Acquisitions and Branching. Prior approval from the OCC is required in order for SoFi Bank to acquire another bank or establish a new branch office. Well capitalized and well managed banks may acquire other banks in any state, subject to certain deposit concentration limits and other conditions, pursuant to the Riegle-Neal Interstate Banking and Branching Efficiency Act of 1994, as amended by the Dodd-Frank Act.
Brokered Deposits. The FDIA and FDIC regulations generally limit the ability of an insured depository institution to accept, renew or roll over any brokered deposit unless the institution’s capital category is “well capitalized” or, with the FDIC’s
approval, “adequately capitalized.” Certain depository institutions that have brokered deposits in excess of 10% of total assets are subject to increased FDIC deposit insurance premium assessments; however, for institutions that are “well capitalized” and have a CAMELS composite rating of 1 or 2, reciprocal deposits are deducted from brokered deposits. Section 202 of the Economic Growth, Regulatory Relief, and Consumer Protection Act (the “Economic Growth Act”), which was enacted in 2018, amended the FDIA to exempt a capped amount of reciprocal deposits from treatment as brokered deposits for certain insured depository institutions.
Community Reinvestment Act. The Community Reinvestment Act (“CRA”)CRA requires the OCC to evaluate SoFi Bank’s performance in helping to meet the credit needs of the entire communities it serves, including low and moderate-income neighborhoods, consistent with its safe and sound banking operations, and to take this recordoperation. A bank’s performance under the CRA is taken into consideration when evaluating certain applications. The OCC’sand approving applications for charters, bank mergers, acquisitions, and branch openings. On January 1, 2023, SoFi Bank began operating under a five-year CRA regulations are generallystrategic plan which includes measurable goals relating to: (i) CD Lending and CD Investments, (ii) CD Contributions, (iii) CD Services, (iv) Small Business Lending, and (v) Retail Services and Products. SoFi Bank’s 2023-2027 CRA performance will be examined based upon objectivethe CRA strategic plan’s five measurable goals as defined in the strategic plan and, as a result, the OCC’s standard performance evaluation criteria will not be utilized to evaluate SoFi Bank’s CRA performance throughout the duration of the performance of institutions under three key assessment tests: (i) a lending test, to evaluate the institution’s record of making loans in its service areas; (ii) an investment test, to evaluate the institution’s record of investing in community development projects, affordable housing, and programs benefiting low- or moderate-income individuals and businesses; and (iii) a service test, to evaluate the institution’s delivery of services through its branches, ATMs, and other offices.strategic plan period. The OCC rates a national bank’s compliance with the CRA as “Outstanding”, “Satisfactory”, “Needs to Improve” or “Substantial Noncompliance”. On October 23, 2023, the Federal Reserve, OCC and FDIC approved changes to their CRA regulations, maintaining the existing CRA ratings (Outstanding, Satisfactory, Needs to Improve, and Substantial Noncompliance) but modifying the evaluation framework to replace the existing tests generally applicable to banks with at least $2 billion in assets (the lending, investment, and services tests) with four new tests and associated performance metrics. The new CRA regulations will become effective on January 1, 2026. Failure of SoFi Bank to receive at least a “Satisfactory” rating could inhibit SoFi Bank or the Company from undertaking certain activities, including acquisitions of other financial institutions. Golden Pacific Bank, the predecessor to SoFi Bank, received a “Satisfactory” rating as of April 1, 2019.
Regulatory Capital Requirements.Lending Restrictions. WeFederal law limits a bank’s authority to extend credit to directors and executive officers of the bank or its affiliates and persons or companies that own, control or have power to vote more than 10% of any class of securities of a bank or an affiliate of a bank, as well as to entities controlled by such persons. Among other things, extensions of credit to insiders are required to be made on terms that are substantially the same as, and follow credit underwriting procedures that are not less stringent than, those prevailing for comparable transactions with unaffiliated persons. The terms of such extensions of credit may not involve more than the normal risk of repayment or present other unfavorable features and may not exceed certain limitations on the amount of credit extended to such persons, individually and in the aggregate, which limits are based, in part, on the amount of the bank’s capital.
Enhanced Prudential Supervision. Both SoFi Bank and the Company, which controls SoFi Bank, had total consolidated assets in excess of $10 billion as of December 31, 2023 which subjects them to additional regulatory requirements under the Dodd-Frank Act and other federal banking laws.
Section 1025 of the Dodd-Frank Act and the CFPB’s interpretations thereof provide that the CFPB has authority to examine any insured depository institution and with total assets of more than $10 billion for four consecutive quarters and any affiliate thereof. Beginning January 1, 2024, SoFi Bank and its affiliates became subject to CFPB supervision and regulation with respect to federal consumer protection laws, including laws relating to fair lending and the prohibition of unfair, deceptive or abusive acts or practices in connection with the offer, sale or provision of consumer financial products and services. As part of its regulatory oversight, the CFPB has authority to take enforcement actions against firms that offer certain products and services to consumers using practices that are deemed to be unfair, deceptive or abusive.
Section 1075 of the Dodd-Frank Act, which is commonly known as the “Durbin Amendment”, amended the Electronic Fund Transfer Act to restrict the amount of interchange fees that may be charged and prohibit network exclusivity for debit card transactions. The restrictions on interchange fees became applicable to SoFi Bank on July 1, 2023, which may negatively impact future interchange fees.
In addition, Section 619 of the Dodd-Frank Act, commonly known as the “Volcker Rule”, which generally prohibits banking entities from engaging in proprietary trading and from acquiring or retaining an ownership interest in or sponsoring certain types of investment funds, applies to insured depository institutions if it, and every company that controls it, has total consolidated assets of $10 billion or more and consolidated trading assets and liabilities that are 5% or more of consolidated assets. The Volcker Rule, while applicable, does not significantly impact the operations of the Company and SoFi Bank, areas we do not engage in a significant amount of activity that is subject to risk-based capital requirementsthe Volcker Rule.
Finally, Section 165 of the Dodd-Frank Act, as amended by the Economic Growth, Regulatory Relief and rules issued byConsumer Protection Act, and 12 C.F.R. Part 30 require the Federal Reserve and the OCC.OCC, respectively, to implement enhanced prudential
regulation applicable to bank holding companies with consolidated assets of $100 billion or more and national banks with total assets of $50 billion or more. The enhanced prudential standards include risk-based and leverage capital requirements, liquidity standards, requirements for overall risk management, and stress-test requirements. Once the Company’s or SoFi Bank’s assets are equal to or greater than the applicable asset thresholds, we will be subject to these enhanced prudential regulations.
Capital Adequacy and Safety and Soundness
Regulatory Capital Requirements. The Federal Reserve and the OCC have issued substantially similar risk-based and leverage capital rules applicable to U.S. banking organizations such as the Company and SoFi Bank. These rules are intended to reflect the relationship between the banking organization’s capital and the degree of risk associated with its operations based on transactions recorded on-balance sheet as well as off-balance sheet items. The FDIA requiresFederal Reserve and the federalOCC may from time to time require that a banking agenciesorganization maintain capital above the minimum levels discussed below, due to takethe banking organization’s financial condition or actual or anticipated growth.
The capital adequacy rules define qualifying capital instruments and specify minimum amounts of capital as a percentage of assets that banking organizations are required to maintain. Common equity Tier 1 capital generally includes common stock and related surplus, retained earnings and, in certain cases and subject to certain limitations, minority interests in consolidated subsidiaries, less goodwill, other non-qualifying intangible assets and certain other deductions. Tier 1 capital for banks and bank holding companies generally consists of the sum of common equity Tier 1 capital, non-cumulative perpetual preferred stock, and related surplus and, in certain cases and subject to limitations, minority interests in consolidated subsidiaries that do not qualify as common equity Tier 1 capital, less certain deductions. Tier 2 capital generally consists of hybrid capital instruments, perpetual debt and mandatory convertible debt securities, cumulative perpetual preferred stock, term subordinated debt and intermediate-term preferred stock, and, subject to limitations, allowances for loan losses. The sum of Tier 1 and Tier 2 capital less certain required deductions represents qualifying total risk-based capital.
Under the capital rules, risk-based capital ratios are calculated by dividing common equity Tier 1 capital, Tier 1 capital, and total capital, respectively, by risk-weighted assets. Assets and off-balance sheet credit equivalents are assigned to one of several categories of risk weights based primarily on relative credit risk. The Tier 1 leverage ratio is calculated by dividing Tier 1 capital by average assets, less certain items such as goodwill and intangible assets, as permitted under the capital rules.
Under the Federal Reserve’s rules that are applicable to the Company and the OCC’s capital rules applicable to SoFi Bank, the Company and SoFi Bank are each required to maintain a minimum common equity Tier 1 capital to risk-weighted assets ratio of at least 4.5%, a minimum Tier 1 capital to risk-weighted assets ratio of 6.0%, a minimum total capital to risk-weighted assets ratio of 8.0% and a minimum leverage ratio requirement of 4.0%. Additionally, these rules require an institution to establish a capital conservation buffer of common equity Tier 1 capital in an amount above the minimum risk-based capital requirements for “adequately capitalized” institutions of more than 2.5% of total risk weighted assets, or face restrictions on the ability to pay dividends, pay discretionary bonuses and to engage in share repurchases.
Under the OCC’s prompt corrective action with respectrules, an OCC supervised institution is considered well capitalized if it: (i) has a total capital to depository institutionsrisk-weighted assets ratio of 10.0% or greater, (ii) a Tier 1 capital to risk-weighted assets ratio of 8.0% or greater, (iii) a common Tier 1 equity ratio of 6.5% or greater, (iv) a leverage capital ratio of 5.0% or greater, and (v) is not subject to any written agreement, order, capital directive or prompt corrective action directive to meet and maintain a specific capital level for any capital measure. SoFi Bank is considered well capitalized under all regulatory definitions.
Generally, a bank, upon receiving notice that it is not adequately capitalized (i.e., that it is “undercapitalized”), becomes subject to the prompt corrective action provisions of Section 38 of the FDIA that, for example: (i) restrict payment of capital distributions and management fees, (ii) require that its federal bank regulator monitor the condition of the institution and its efforts to restore its capital, (iii) require submission of a capital restoration plan, (iv) restrict the growth of the institution’s assets, and (v) require prior regulatory approval of certain expansion proposals. A bank that is required to submit a capital restoration plan must concurrently submit a performance guarantee by each company that controls the bank. A bank that is “critically undercapitalized” (i.e., has a ratio of tangible equity to total assets that is equal to or less than 2.0%) will be subject to further restrictions, and generally will be placed in conservatorship or receivership within 90 days.
Current capital rules do not establish standards for determining whether a bank holding company is well capitalized. However, for purposes of processing regulatory applications and notices, the Federal Reserve’s Regulation Y provides that a bank holding company is considered “well capitalized” if: (i) on a consolidated basis, the bank holding company maintains a total risk-based capital ratio of 10.0% or greater, (ii) on a consolidated basis, the bank holding company maintains a Tier 1 risk-based capital ratio of 6.0% or greater, and (iii) the bank holding company is not subject to any written agreement, order, capital
directive, or prompt corrective action directive issued by the Federal Reserve to meet the minimumand maintain a specific capital requirements set forth in thelevel for any capital rules. These capital requirements are different from, and may be in addition to, those required of SoFi Securities under the SEC’s Net Capital Rule, as defined below.measure.
Safety and Soundness Standards.Standard. The FDIA requires the federal bank regulatory agencies to prescribe safety and soundness standards, by regulations or guidelines, as the agencies deem appropriate. Guidelines adopted by the federal bank regulatory agencies pursuant to the FDIA establish general standards relating to internal controls and information systems, internal audit systems, loan documentation, credit underwriting, interest rate exposure, asset growth, asset quality, earnings, and compensation fees and benefits. In general, these guidelines require, among other things, appropriate systems and practices to identify and manage the risk and exposures specified in the guidelines. The guidelines prohibit excessive compensation as an unsafe and unsound practice and describe compensation as excessive when the amounts paid are unreasonable or disproportionate to the services performed by an executive officer, employee, director or principal shareholder. In addition, the federal banking agencies adopted regulations that authorize, but do not require, an agency to order an institution that has been given notice by an agency that it is not satisfying any of such safety and soundness standards to submit a compliance plan. If, after being so notified, an institution fails to submit an acceptable compliance plan or fails in any material respect to implement an acceptable compliance plan, the agency must issue an order directing action to correct the deficiency and may issue an order restricting asset growth, requiring an institution to increase its ratio of tangible equity to assets or directing action to correct the deficiency and may issue an order other actions of the types to which an undercapitalized institution is subject under the “prompt corrective action” provisions of the FDIA. See “Regulatory Capital Requirements” above. If an institution fails to comply with such an order, the agency may seek to enforce such order in judicial proceedings and to impose civil money penalties.
Dividend Restrictions
The Company is a legal entity separate and distinct from its subsidiaries. The right of the Company, and consequently the right of shareholders of the Company, to participate in any distribution of the assets or earnings of its subsidiaries through the payment of dividends or otherwise is subject to the prior claims of creditors of the subsidiaries, including, with respect to SoFi Bank, depositors of SoFi Bank, except to the extent that certain claims of the Company in a creditor capacity may be recognized.
Restrictions on Bank Holding Company Dividends. The Federal Reserve has the authority to prohibit bank holding companies from paying dividends if such payment is deemed to be an unsafe or unsound practice. The Federal Reserve has indicated generally that it may be an unsafe or unsound practice for bank holding companies to pay dividends on regulatory capital instruments unless the bank holding company’s net income over the preceding year is sufficient to fund the dividends and the expected rate of earnings retention is consistent with the organization’s capital needs, asset quality and overall financial condition. In addition, under Federal Reserve policy, the Company should inform the Federal Reserve reasonably in advance of declaring or paying a dividend on regulatory capital instruments that exceeds earnings for the period for which the dividend is being paid or that could result in a material adverse change to the Company’s capital structure. Further, under the Federal Reserve’s capital rules, the Company’s ability to pay dividends is restricted if it does not maintain capital above the capital conservation buffer. See “Capital Adequacy and Safety and Soundness—Regulatory Capital Requirements” above.
Restrictions on Bank Dividends. The OCC has the authority to use its enforcement powers to prohibit a bank from paying dividends if, in its opinion, the payment of dividends would constitute an unsafe or unsound practice. Federal law also prohibits the payment of dividends by a bank that will result in the bank failing to meet its applicable capital requirements on a pro forma basis. In addition, under the National Bank Act, SoFi Bank generally may, without prior approval of the OCC, declare a dividend so long as the total amount of all dividends (common and preferred), including the proposed dividend, in the current year do not exceed net income for the current year to date plus retained net income for the prior two years.
Certain Transactions by Bank Holding Companies with their Affiliates
There are various statutory restrictions on the extent to which bank holding companies and their non-bank subsidiaries may borrow, obtain credit from or otherwise engage in “covered transactions” with their insured depository institution subsidiaries. An insured depository institution (and its subsidiaries) may not lend money to, or engage in covered transactions with, its non-depository institution affiliates if the aggregate amount of covered transactions outstanding involving the bank, plus the proposed transaction exceeds the following limits: (i) in the case of any one such affiliate, the aggregate amount of covered transactions of the insured depository institution and its subsidiaries cannot exceed 10% of the capital stock and surplus of the insured depository institution, and (ii) in the case of all affiliates, the aggregate amount of covered transactions of the insured depository institution and its subsidiaries cannot exceed 20% of the capital stock and surplus of the insured depository institution. For this purpose, “covered transactions” are defined by statute to include a loan or extension of credit to an affiliate; a purchase of or investment in securities issued by an affiliate; a purchase of assets from an affiliate unless exempted by the Federal Reserve; the acceptance of securities issued by an affiliate as collateral for a loan or extension of credit to any person or company; the issuance of a guarantee, acceptance or letter of credit on behalf of an affiliate; securities borrowing or lending transactions with an affiliate that creates a credit exposure to such affiliate; or a derivatives transaction with an affiliate that
creates a credit exposure to such affiliate. Covered transactions are also subject to certain collateral security requirements. Covered transactions as well as other types of transactions between a bank and a bank holding company must be conducted under terms and conditions, including credit standards, which are at least as favorable to the bank as prevailing market terms. Moreover, Section 106 of the Bank Holding Company Act Amendments of 1970 provides that, to further competition, a bank holding company and its subsidiaries are prohibited from engaging in certain tying arrangements in connection with any extension of credit, lease or sale of property of any kind, or the furnishing of any service.
Consumer Financial Services Laws and Regulations
We are subject to federal and state laws designed to protect consumers and prohibit unfair or deceptive business practices. These laws and regulations mandate certain disclosure requirements and regulate the manner in which financial institutions must interact with customers when taking deposits, making loans, collecting loans and providing other services. The Consumer Financial Protection Bureau (the “CFPB”)CFPB also has a broad mandate to prohibit unfair, deceptive or abusive acts and practices, which can be referred to as “UDAAP”, and is specifically empowered to require certain disclosures to consumers and draft model disclosure forms. Failure to comply with consumer protection laws and regulations can subject financial institutions to enforcement actions, fines and other penalties. ThePrior to January 1, 2024, the OCC examinesexamined SoFi Bank for compliance with CFPB rules and enforcesenforced CFPB rules with respect to SoFi Bank. As noted above, beginning January 1, 2024, SoFi Bank and its affiliates became subject to supervision and regulation by the CFPB as an insured depository institution with total assets of more than $10 billion.
Truth in Lending Act. The Truth in Lending Act (“TILA”)TILA and Regulation Z, which implements it, require lenders to provide consumers with uniform, understandable information concerning certain terms and conditions of their loan and credit transactions prior to the consummation of a credit transaction and, in the case of certain education, mortgage, and open-end loans, at the time of a loan solicitation, application, approval and origination of a credit transaction. TILA also regulates the advertising of credit, including limitations on co-branding private education lender’s products with educational institutions in the marketing of private education loans, and gives borrowers, among other things, certain rights regarding updated disclosures and periodic statements, security interests taken to secure the credit, the right to rescind certain loan transactions, a right to an investigation
and resolution of billing errors, and the treatment of credit balances. For certain types of credit transactions, lenders are not permitted to originate loans with certain high-risk features, such as negative amortization and balloon payments, and must provide certain consumer protections during the underwriting and origination process, such as providing a right to an appraisal of mortgaged property, and verifying the consumer’s ability to repay the loan prior to making a decision to approve an application for the loan. Private Education Lenderseducation lenders must provide multiple disclosures to applicants under TILA and must provide applicants with 30 days in which to accept or reject a loan offer as well as the right to rescind the loan transaction for three business days following receipt of the Final TILA disclosure.
Real Estate Settlement Procedures Act. The federal Real Estate Settlement Procedures Act (“RESPA”)RESPA and Regulation X, which implements it, require certain disclosures to be made to the borrower at application, as to the lender’s initial disclosures (or good faith estimateestimate) of loan origination costs, and at closing with respect to the real estate settlement statement; apply to certain loan servicing practices including escrow accounts, member complaints, servicing transfers, lender-placed insurance, error resolution and loss mitigation. RESPA also prohibits giving or accepting any fee, kickback or a thing of value for the referral of real estate settlement services, and giving or accepting any portion of any fee charged for rendering a real estate settlement service other than for services actually performed. To the extent that a lender makes or receives a referral to an affiliate,a third-party with whom it has an affiliated business arrangement, for settlement services, RESPA requires a disclosure to the customer of the affiliation to the person whose business is referred.service provider. For most home loans, the time of application (loan estimate) and time of loan closing disclosure requirements for RESPA and TILA have been combined into integrated disclosures under the TILA-RESPA Integrated Disclosure rule.
Equal Credit Opportunity Act. The federal Equal Credit Opportunity Act (“ECOA”)ECOA prohibits creditors from discriminating against credit applicants on the basis of race, color, sex, age, religion, national origin, marital status, the fact that all or part of the applicant’s income derives from any public assistance program or the fact that the applicant has in good faith exercised any right under the federal Consumer Credit Protection Act or any applicable state law. Regulation B, which implements ECOA, restricts creditors from requesting certain types of information from loan applicants and from using advertising or making statements that would discourage on a prohibited basis a reasonable person from making or pursuing an application. ECOA also requires creditors to provide consumers and certain small businesses with timely responses to applications for credit, including notices of adverse action taken on credit applications.
Fair Housing Act. The federal Fair Housing Act (“FHA”)FHA applies to credit related to housing and prohibits discrimination on the basis of race or color, national origin, religion, sex, familial status and handicap. The FHA prohibits discrimination in advertising regarding the sale or rental of a dwelling, which includes mortgage credit discrimination. The FHA may place restrictions on a creditor’s targeted marketing strategies, due to the risk that such strategies may increase a creditor’s fair lending risk.
Home Mortgage Disclosure Act. The federal Home Mortgage Disclosure Act (“HMDA”)HMDA requires lenders to collect, report and disclose certain information about their mortgage lending activity to the CFPB. Much of the data reported pursuant to HMDA is made public and can be used by regulators and third parties to ascertain information about our mortgage lending activity. Regulators and litigants may use the data to make inferences about our compliance with ECOA, FHA and similar anti-discrimination laws. Effective in 2018, the CFPB issued a final rule which greatly expanded the amount of data that mortgage lenders are required to collect and report under HMDA. The CFPB has proposed and is expected to issue another final rule amending HMDA.
Secure and Fair Enforcement for Mortgage Licensing Act. We employ and contract with mortgage loan originators which are required by state and federal law to be licensed as mortgage loan originators in the relevant jurisdictions where they operate. To obtain and maintain licensure, the mortgage loan originator must meet the minimum education, experience and character requirements set forth by the relevant state’s law, and periodically renew their licenses. We may not be permitted to employ, take applications from, or originate loans processed by mortgage loan originators who fail to maintain a license in good standing in each relevant jurisdiction.
Fair Credit Reporting Act. The federal Fair Credit Reporting Act (“FCRA”),FCRA, as amended by the Fair and Accurate Credit Transactions Act, (“FACTA”), promotes the accuracy, fairness and privacy of information in the files of consumer reporting agencies. FCRA requires a permissible purpose to obtain a consumer credit report and requires persons that furnish loan payment information to credit bureaus to report such information accurately. We are also required to perform a reasonable investigation in the event we receive indirect disputes from the credit bureaus about the accuracy of our credit reporting for a particular consumer and to update any inaccurate information we discover. FCRA also imposes disclosure requirements on creditors who take adverse action on credit applications based on information contained in a consumer report or received from a third party and requires creditors who use consumer reports in establishing loan terms to provide risk-based pricing or credit score notices to affected consumers. The FCRA also imposes rules and disclosure requirements on creditors’ use of consumer reports for marketing purposes, which impacts our ability to use consumer reports and prescreened lists to market consumer loans through direct mail and other means.
Fair Debt Collection Practices Act. The federal Fair Debt Collection Practices Act (“FDCPA”)FDCPA provides guidelines and limitations on the conduct of third-party debt collectors in connection with the collection of consumer debts. The FDCPA limits certain communications with third parties, imposes notice and debt validation requirements, and prohibits threatening, harassing or abusive conduct in the course of debt collection. While the FDCPA applies to third-party debt collectors, and not original creditors, debt collection and loan servicing laws of certain states impose similar requirements on creditors who collect their own debts or contract with third parties to collect their debts. In addition, the CFPB prohibits UDAAP in debt collection, including first-party debt collection. The CFPB’s Regulation F, which implements the FDCPA, addresses communications in connection with debt collection, interprets and applies prohibitions on harassment or abuse, false or misleading representations, and unfair practices in debt collection, and clarifies requirements for certain consumer-facing debt collection disclosures.
Servicemembers Civil Relief Act. The federal Servicemembers Civil Relief Act (“SCRA”)SCRA allows military members to suspend or postpone certain civil obligations so that the military member can devote his or her full attention to military duties. The SCRA requires us to adjust the interest rate of borrowers who qualify for and request relief. The SCRA also places limitations on remedies that may otherwise be available to a creditor, such as foreclosures and default judgments.
Military Lending Act. The Military Lending Act (“MLA”)MLA restricts, among other things, the interest rate and other terms that can be offered to active military personnel and their dependents. The MLA caps the interest rate that may be offered to a covered borrower for most types of consumer credit to a 36% military annual percentage rate, or “MAPR”, which includes certain fees such as application fees, participation fees and fees for add-on products. The MLA also requires certain disclosures and prohibits certain terms, such as mandatory arbitration if a dispute arises concerning the consumer credit product.
Electronic Fund Transfer Act and NACHA Rules. The federal Electronic Fund Transfer Act (“EFTA”)EFTA, and Regulation E that implements it, provide guidelines and restrictions on the provision of electronic fund transfer services to consumers, and on making an electronic transfer of funds from consumers’ bank accounts. In addition, transfers performed by ACH electronic transfers using the ACH network are subject to detailed timing and notification rules and guidelines administered by the National Automated Clearinghouse Association (“NACHA”).NACHA. Most transfers of funds in connection with the origination and repayment of loans are performed by electronic fund transfers, such as ACH transfers. We obtain necessary electronic authorization from borrowers and investors for such transfers in compliance with such rules. EFTA requires that lenders make available loan payment methods other than automatic preauthorized electronic fund transfers, and prohibits lenders from conditioning the approval of a loan transaction on the borrower’s agreement to repay the loan through automatic fund transfers. Recently, the NACHA Board of Directors approved a change in the NACHA Operating Rules that requires ACH Originators to perform account validation as part of their commercially reasonable fraudulent transaction detection systems.
Electronic Signatures in Global and National Commerce Act/Uniform Electronic Transactions Act. The federal Electronic Signatures in Global and National Commerce Act (“ESIGN”),ESIGN, and similar state laws, particularly the Uniform Electronic Transactions Act (“UETA”),UETA, authorize the creation of legally binding and enforceable agreements utilizing electronic records and signatures. ESIGN and UETA require businesses that want to use electronic records or signatures in consumer transactions and to provide electronic disclosures and other electronic communications to consumers, to obtain the consumer’s consent to receive information electronically.
Bank Secrecy Act. We have implemented various anti-money laundering policies and procedures to comply with applicable federal anti-money laundering laws, regulations and requirements, such as designating a Bank Secrecy Act (“BSA”)BSA officer, conducting an annual risk assessment, developing internal controls, independent testing, training, and suspicious activity monitoring and reporting. We apply the customer identification and verification program rules pursuant to the USA PATRIOT Act amendments to the BSA and its implementing regulations and screen certain customer information against the list of specially designated nationals and other lists of sanctioned countries, persons, and entities maintained by the Treasury Department’s Office of Foreign Assets Control (“OFAC”).OFAC. Additionally, SoFi Digital Assets, LLC is registered with and regulated by the FinCEN as a money services business (“MSB”)MSB with respect to its digital assets business activities.activities, which were transferred in the first quarter of 2024. As an MSB, we are subject to FinCEN regulations implementing the BSA, which requires MSBs to develop and implement risk-based anti-money laundering programs, report large cash transactions and suspicious activity, and maintain transaction records, among other requirements. Similarly, SoFi Bank is a financial institution under the BSA that is required to implement a risk-based anti-money laundering program, including customer identification procedures, currency transaction reporting, suspicious activity monitoring and reporting and other recordkeeping requirements. In addition, our contracts with financial institution partners and other third parties may contractually require us to maintain an anti-money laundering program.
Office of Foreign Assets Control. The U.S. has imposed economic sanctions that affect transactions with designated foreign countries, nationals and others. These sanctions, which are administered by OFAC, take many different forms. Generally, however, they contain one or more of the following elements: (i) restrictions on trade with or investment in a sanctioned country, including prohibitions against direct or indirect imports from and exports to a sanctioned country and
prohibitions on “U.S. persons” engaging in financial or other transactions relating to a sanctioned country or with certain designated persons and entities; (ii) a blocking of assets in which the government or specially designated nationals of the sanctioned country have an interest, by prohibiting transfers of property subject to U.S. jurisdiction (including property in the possession or control of U.S. persons); and (iii) restrictions on transactions with or involving certain persons or entities. Blocked assets (for example, property and bank deposits) cannot be paid out, withdrawn, set off or transferred in any manner without a license from OFAC. Failure to comply with these sanctions could have serious legal and reputational consequences for the Company.
Loan Servicing. With respect to our private education loan business, weWe are subject to the CFPB’s rule that enables it to supervise certain non-bank student loan servicers that service more than one million borrower accounts. The rule covers servicersCFPB supervision and regulation of both federal and private education loans and is designed to ensure that bank and non-bank servicers follow the same rules in the studentour loan servicing market. We are impactedactivities conducted by the rule becauseSoFi Bank and SoFi Lending Corp. even in scenarios where we have engaged the Missouri Higher Education Loan Authority (“MOHELA”)third-party servicers such as MOHELA to service our private education loans and Cenlar FSB to service our home loans. MOHELA currently services more than one million student loan borrower accounts. In addition, for so long as SoFi Lending Corp. acts as servicer of any of our private education loans, we are subject to certain state licensing requirements applicable to student loan servicers even though we have engaged MOHELA to service our private education loans, as we retain master servicing rights. With respect to our broader consumer loan business, we are subject to federal and state laws regulating loan servicers. We are impacted by these rules even though we service loans we originate, and engage third parties like MOHELA and Cenlar FSB to service certain types of loans, because some state laws, such as the California Rosenthal Act, apply to creditors and first party servicers. Some state laws also apply to parties that indirectly service loans through the use of third-party servicer contracts. Additionally, we sell some of the loans we originate to third parties and are therefore subject to laws governing parties that service loans on behalf of another person to whom the debt is owed. We are currently licensed as a loan servicer in several states and may be required to seek additional licenses. If we seek additional licenses, a state has in the past and may in the future impose fines, restrict our activity in that state, or seek other relief for activity conducted prior to the issuance of a license. For example, in 2019, we entered into a consent order with the Commonwealth of Pennsylvania Department of Banking and Securities, requiring us to pay a civil fine for conducting mortgage servicing activity as a master servicer before we obtained a mortgage servicing license in Pennsylvania.
Other State Lending and Money Transmission Laws. SoFi Lending Corp. will continue to service and, for an interim period, originate certain of our loans, and our money transmission activities will continue to be provided by SoFi Digital Assets.Assets, LLC. Consequently, in addition to applicable federal laws and regulations governing our operations, our ability to originate and service loans through SoFi Lending Corp. in any particular state, and transmit money to or from any particular state, is subject to that state’s laws, regulations and licensing requirements, which may differ from the laws, regulations and licensing requirements of other states. State laws often include fee limitations and disclosure and other requirements. Many states have adopted lending regulations that prohibit various forms of high-risk or sub-prime lending and place obligations on lenders to substantiate that a member will derive a tangible benefit from the proposed credit transaction and/or have the ability to repay the loan. These laws have required most lenders to devote considerable resources to building and maintaining automated systems to perform loan-by-loan analysis of points, fees and other factors set forth in the laws, which often vary depending on the location of the mortgaged property. Many of these state lending and money transmitter laws are vague and subject to differing interpretation, which exposes us to some risks. The number and complexity of these laws, and vagaries in their interpretations, present compliance and litigation risks from inadvertent error and omissions which we may not
be able to eliminate from our operations or activities. The laws, regulations and rules described above are subject to legislative, administrative and judicial interpretation, and some of these laws and regulations have been infrequently interpreted or only recently enacted. Infrequent interpretations of these laws and regulations or an insignificant number of interpretations of recently-enacted laws and regulations can result in ambiguity with respect to permitted conduct under these laws and regulations. Any ambiguity under the laws and regulations to which we are subject may lead to regulatory investigations or enforcement actions and private causes of action, such as class-action lawsuits, with respect to our compliance with applicable laws and regulations.
Risk Retention Regulations. Our balance sheet is impacted by the risk retention regulations adopted by the SEC that became effective for non-mortgage securitizations in 2016. These rules require issuers of asset-backed securities or persons who organize and initiate asset-backed securities transactions to retain a portion of the underlying assets’ credit risk.
Marketing Regulations. Our marketing and other business practices are subject to federal and state regulation and our expansion into new product offerings, including digital assetsETFs and, exchange-tradedbeginning in January 2024, alternative investment funds, mutual funds and money market funds, under the SoFi Invest product, subject us to additional regulatory scrutiny. For example, we and the FTC entered into the FTC Consent Order regarding savings calculations in our student loan refinancing advertisements. In addition, we are subject to the Federal Telephone Consumer Protection Act (“TCPA”),TCPA, which regulates, among other things (a)things: (i) the use of automated telephone dialing systems to make certain calls or text messages to cellphones without prior consent, and (b)(ii) certain calls and text messages to numbers properly registered on the federal do not call list without permission or an established business relationship, and the Federal CAN-SPAM
Act and the Telemarketing Sales Rule, and analogous state laws, to the extent that we market credit or other products and services by use of email or telephone marketing.
Bankruptcy Laws. We are subject to the United States Bankruptcy Code, which limits the extent to which creditors may seek to enforce debts against parties who have filed for bankruptcy protection. In the event of a bank holding company’s bankruptcy, any commitment by the bank holding company to a federal bank regulatory agency to maintain the capital of a bank subsidiary will be assumed by the bankruptcy trustee and entitled to a priority of payment.
Federal and State Securities Laws. We offer the securities issued in our sponsored securitizations only to, or for the account or benefit of, “qualified institutional buyers” (as defined in Rule 144A under the Securities Act) in compliance with Rule 144A and to “non-U.S. persons” outside of the United States in reliance on Regulation S under the Securities Act. The securities issued in the securitizations that we sponsor are not registered under the Securities Act or registered or qualified under any state securities laws. We do not offer securitized products to retail investors. We receive opinions from legal counsel for each securitization confirming that the relevant issuing entity is not required to register under the Investment Company Act in reliance on the exclusion available under Rule 3a-7 of the Investment Company Act, although other exemptions or exceptions may also be available.
SoFi Invest and SoFi Money. SoFi Invest is the brand name for the following legal entities: SoFi Wealth LLC, SoFi Capital Advisors, LLC, SoFi Securities, and SoFi Digital Assets, LLC, each of which provides different products and services. We offer investment management services through SoFi Wealth LLC, an internet-based investment adviser and SoFi Capital Advisors, LLC, which sponsors privateprovides portfolio management services for pooled investment fundsvehicles that invest in asset-backed securitizations. Both SoFi Wealth LLC and SoFi Capital Advisors, LLC are registered as investment advisers under the Investment Advisers Act of 1940, as amended (the “Advisers Act”), and are subject to regulation by the SEC. SoFi Securities is an affiliated registered broker-dealer and FINRA member, and SoFi Digital Assets, LLC is a FinCEN registered money service businessMSB that also holds money transmitter or money service licenses in a majority of states and the District of Columbia. In the fourth quarter of 2023, we transferred the crypto services provided by SoFi Digital Assets, LLC, and began closing existing digital assets accounts. This process was completed in the first quarter of 2024. We offer cash management accounts, which are brokerage products, through SoFi Securities.
The investment advisers are subject to the anti-fraud provisions of the Advisers Act and to fiduciary duties derived from these provisions, which apply to our relationships with our advisory members, including the funds we manage. These provisions and duties impose restrictions and obligations on us with respect to our dealings with our members, fund investors and our investments, including, for example, restrictions on transactions with our affiliates.
Our investment advisers and our broker-dealer have in the past been, and will in the future be, subject to periodic Securities and Exchange Commission (“SEC”)SEC examinations. Our investment advisers and our broker-dealer are also subject to other requirements under the Advisers Act and the Exchange Act, respectively, and related regulations. These additional requirements relate to matters including maintaining effective and comprehensive compliance programs, record-keeping and reporting and disclosure requirements. The Advisers Act and the Exchange Act generally grantsgrant the SEC broad administrative powers, including the power to limit or restrict an investment adviser or our broker-dealer from conducting advisory or brokerage activities, respectively, in the event they fail to comply with federal securities laws. Additional sanctions that may be imposed for failure to comply with applicable
requirements include the prohibition of individuals from associating with an investment adviser or broker-dealer, the revocation of registrations and other censures and fines. Even if an investigation or proceeding did not result in a sanction or the sanction imposed against us or our personnel by a regulator was small in monetary amount, the adverse publicity relating to the investigation, proceeding or imposition of these sanctions could harm our reputation and cause us to lose existing members or fail to gain new members.
SoFi Securities is subject to Rule 15c3-1 under the Exchange Act, the “SEC Net Capital Rule”, which requires the maintenance of minimum levels of net capital. The SEC Net Capital Rule is designed to protect members, counterparties, and creditors by requiring a broker-dealer to have sufficient liquid resources available to satisfy its financial obligations. Net capital is a measure of a broker-dealer’s readily available liquid assets, reduced by its total liabilities (other than approved subordinated debt). Among other things, the SEC Net Capital Rule requires that a broker-dealer provide notice to the SEC and FINRA if its net capital is below certain required levels. There are also certain “early warning” requirements that apply. Our affiliates operating outside the United States may also be subject to other regulatory capital requirements imposed by non-U.S. regulatory authorities.
SoFi Securities is an “introducing” brokera broker-dealer that does not carry customer security accounts; rather, customer security accounts are carried by an unaffiliated broker-dealer that also clears transactions for these accounts and maintains segregated cash and investments pursuant to Rule 15c3-3 under the Exchange Act (the “Customer Protection Rule”). SoFi Securities carries customer cash accounts (related to(i.e., the SoFi Money)Money cash management accounts) that are subject to the Customer Protection Rule.
FINRA has adopted extensive regulatory requirements relating to sales practices, registration of personnel, compliance and supervision, and compensation and disclosure, to which SoFi Securities and its personnel are subject. FINRA and the SEC
also have the authority to conduct periodic examinations of SoFi Securities, and may also conduct administrative proceedings, and have the authority to levy fines and other penalties on SoFi Securities.
SoFi Securities is registered with the Municipal Securities Rulemaking Board (“MSRB”)MSRB and subject to the MSRB’s regulatory regime, including applicable MSRB rules.
SoFi Securities is a Participant of DTC and is, therefore, is subject to DTC’s regulatory regime, including applicable DTC rules and bylaws.
Moreover, through SoFi Securities, we are licensed to underwrite securities offerings and have served as a firm commitment underwriter of, registered equity securities offerings on five offerings, andor as selling agent on, two registered equity securities offerings.
State Licensing Requirements
One or more of our subsidiaries may need, and have obtained, one or more state licenses to broker, acquire, service and/or enforce loans, and to engage in money transmitter activities.loans. Where we have obtained licenses, state licensing statutes may impose a variety of requirements and restrictions on us, including:
•record-keeping requirements;
•restrictions on servicing and collection practices, including limits on finance charges and fees;
•restrictions on collections;
•usury rate caps;caps to the extent the non-bank subsidiary originates loans;
•restrictions on permissible terms in consumer agreements;
•disclosure requirements;
•examination requirements;
•surety bond and minimum net worth requirements;
•permissible investment requirements;
•financial reporting requirements;
•annual or biennial activity reporting and license renewal requirements;
•notification and approval requirements for changes in principal officers, directors, stock ownership or corporate control;
•restrictions on marketing and advertising;
•qualified individual requirements;
•anti-money laundering and compliance program requirements;
•data security and privacy requirements; and
•review requirements for loan forms and other customer-facing documents.
These statutes may also subject us to the supervisory and examination authority of state regulators in certain cases, and we have experienced, are currently and will likely continue to be subject to and experience exams by state regulators. These examinations have and may continue to result in findings or recommendations that require us to modify our internal controls and/or business practices. If we are found to have engaged in activities that require a state license without having the requisite license, the licensing authority may impose fines, impose restrictions on our operations in the relevant state, or seek other remedies for activities conducted in the state.
Regulation of Other Activities
Through SoFi Protect,the Company’s website and mobile app under the brand name “SoFi Protect”, we offer members access to multiple insurance products and services, which today include life insurance, auto insurance, homeowners insurance, and renters insurance and cyber insurance. All such insurance products are offered through third-party insurance carriers, and may be made available to customers through Social Finance Life Insurance Agency LLC. Certain insurance products may be offered by outside insurance providers through a marketing arrangement with the Company. Social Finance Life Insurance Agency LLC and its licensed agents, which areis subject to certain state insurance, insurance brokering and insurance agency statutes and regulations.
Privacy and Consumer Information Security
In the ordinary course of our business, we access, collect, store, use, transmit and otherwise process certain types of data, including PII,personal information, which subjects us to certain federal, state and stateforeign privacy and information security laws, rules, industry
standards and regulations designed to regulate consumer information and data privacy, security and protection, and mitigate identity theft. These laws impose obligations with respect to the collection, processing, storage, disposal, use, transfer, retention and disclosure of PII,personal information, and, with limited exceptions, give consumers the right to prevent use of their PIIpersonal information and disclosure of it to third parties. The GLBA requires us to disclose certain information sharing practices to consumers, and any subsequent changes to such practices, and provide an opportunity for consumers to opt out of certain sharing of their PII.non-public personal information. This may limit our ability to share PIIpersonal information with third parties for certain purposes, such as marketing. In addition, the CFPB is expected to issue a new rule regulating the disclosure of consumer information, which may limit our ability to receive or use PIIpersonal information and other consumer information and records supplied by third parties, or share information with third parties. Further, all 50 states and the District of Columbia have adopted data breach notification laws that impose, in varying degrees, an obligation to notify affected individuals and government authorities in the event of a data or security breach or compromise, including when a consumer’s PIIpersonal information has or may have been accessed by an unauthorized person. These laws may also require us to notify relevant law enforcement, regulators or consumer reporting agencies in the event of a data breach. Some laws may also impose physical and electronic security requirements regarding the safeguarding of PII.personal information.
On January 1, 2020, the California Consumer Privacy Act (“CCPA”)CCPA took effect, directly impacting our California business operations and indirectly impacting our operations nationwide. The CCPA provides for civil penalties for violations, as well as a private right of action for certain data breaches that result in the loss of personal information. While personal information that we process that is subject to the GLBA is exempt from the CCPA, the CCPA regulates other personal information that we collect and process in connection with the business. A new California ballot initiative, the California Privacy Rights Act (“CPRA”), was passed in November 2020. Effective starting on January 1, 2023, the CPRA, imposeswhich amended the CCPA, imposed additional obligations on companies covered by the legislation, and will significantly modify the CCPA, including by expanding consumers’ rights with respect to certain sensitive personal information. The CPRA also createscreated a new state agency that will beis vested with authority to implement and enforce the CCPA and the CPRA.
Some observersIn addition to California, several other states have noted that the CCPA and CPRA could mark the beginning of a trend toward more stringentpassed comprehensive privacy legislation in the U.S., which could increase our potential liability and adversely affect our business. For example, on March 2, 2021, Virginia enacted the Consumer Data Protection Act (the “CDPA”) and, on July 8, 2021, Colorado’s governor signed the Colorado Privacy Act (“CPA”) into law. The CDPA and the CPA will both become effective January 1, 2023. While the CDPA and CPA incorporate many similar concepts of the CCPA and CPRA, there are also several key differences in the scope, application, and enforcement of the laws that will change the operational practices of regulated businesses. The new laws will, among other things, impact how regulated businesses collect and process personal sensitive data, conduct data protection assessments, transfer personal data to affiliates, and respond to consumer rights requests.
Certain other state laws impose similar privacy obligations and, in many others, lawmakers have proposed laws that would be similar to the CCPA. Certain of these laws are in force and others will enter in effect in the coming years. Like the CCPA, or CPRA. We anticipatethese laws create obligations related to the processing of personal information, as well as special obligations for the processing of “sensitive” data. Some of the provisions of these laws may apply to our business activities. There are also states that more states may enactare strongly considering comprehensive privacy laws and it is anticipated that other states will be considering these laws in the future. Further, Congress has also been debating passing a federal privacy law. In addition, other states have proposed and/or passed legislation which provides consumersthat regulates the privacy and/or security of certain specific types of information. For example, a small number of states have passed laws that regulate biometric data specifically and Washington has passed a law that governs health data, with new privacy rights and increases the“health data” defined broadly. These various privacy and security obligationslaws may impact our business activities, including our identification of entities handling certain personal informationresearch subjects, relationships with business partners and ultimately the marketing and distribution of such consumers. These proposals, if enacted, may add complexity, variation in requirements, restrictions and potential legal risk, require additional investment of resources in compliance programs, impact strategies and the availability of previously useful data and could result in increased compliance costs and/or changes in business practices and policies.our products.
The existence of comprehensive privacy laws in different U.S. states in the country would make our compliance obligations more complex and costly and may increase the likelihood that we may be subject to enforcement actions, civil litigation or otherwise incur liability for noncompliance.
Our broker-dealer and investment advisers are subject to SEC Regulation S-P, which requires that these businesses maintain policies and procedures addressing the protection of customer information and records. This includes protecting against any anticipated threats or hazards to the security or integrity of customer records and information and against unauthorized access to or use of customer records or information. Regulation S-P also requires these businesses to provide initial and annual privacy notices to customers describing information sharing policies and informing customers of their rights.
We seek to protect our intellectual property by relying on a combination of federal, state and common law in the United States, as well as on contractual measures. We use a variety of measures, such as trademarks, trade secrets and with respect to Galileo, patents, to protect our intellectual property. We also place appropriate restrictions on our proprietary information to control access and prevent unauthorized disclosures, a key part of our broader risk management strategy.
We have registered several trademarks, including but not limited to: (i) related to our name, “SoFi”, as well as(ii) SoFi’s logo, (iii) our company motto “Get Your Money Right”, and (iv) certain SoFi products, such as “SoFi Money” and “SoFi Invest”, and the names of our affiliated
entities.. We believe our name, logo, motto and products are important brand identifiers for our members and enterprise partners. In addition, Galileo has been granted eightseveral patents.
We believe building a durable culture will be a key determinatedeterminant in our ability to help our members get their money right and ultimately to achieve our mission. Creating great culture is a journey, not a destination. We challenge our employees to integrate each distinct SoFi value enumerated below into their work.
Our number one Company priority is building a durable culture of diversity, where people love where they work in alignment with our core values. Our resulting initiatives are designed to support, develop and inspire our employees, which in
turn we believe will ultimately unlock the potential of the organization, drive excellence across the business and solidify SoFi as a top career destination where people love to work.
We have established the following guiding principles to help us achieve our goals:
•Embodying SoFi’s values across the entire organization to work to ensure everyone feels welcome, included and able to contribute;
•Integrating a diversity, equity and inclusion lens into everything we do;
•Guiding team members regarding where they are and where they are going — and giving them the tools and resources to get there;
•Supporting managers to become effective people leaders;
•Taking a principled approach to providing fair, relevant and competitive compensation and benefits to a dynamic workforce with diverse needs; and
•Leveraging data to better understand the employee experience, measure our success and innovate as needed.innovate.
Diversity, Equity and Inclusion
Part of what makes SoFi a dynamic place to work is our commitment to living our 11 core values, one of which is to “embrace diversity.” A diverse workforce unlocks collaboration, accelerates creativity, and ultimately enables us to collaborate, create and, ultimately, accomplish our mission of helping millions of people achieve financial independence. Our Diversity, Equity and Inclusion (“DE&I”)&I objective is to create a company culture where every employee feels like they genuinely belong, are respected and valued, and can do their best work. In addition to this being ingrained within our culture, we also see it asThis approach will unlock the potential of the organization and is a competitive advantage. To showcaseadvantage for SoFi.
One of the ways we ensure our global, diverse employees feel a sense of connection to our strategy and mission is through our quarterly Objectives and Key Results (“OKR”) process. Each year, company priorities are developed in partnership with our executive staff team and the SoFi Leadership Group. These priorities are shared with the company at the beginning of each year, as well as quarterly. Teams and individuals are then able to map their OKRs to the company objectives, which align all employees on the company vision and strategy. For the last three years, our #1 company priority has been culture and DE&I. As part of this commitment to DE&I,improving representation at all levels of the company, we launched a new DE&I siteset ambitious three-year goals in 2020: to increase our total URG population to 60%, and to increase URG representation in management to 50%. Based on voluntary employee self-identification data by our U.S.-based workforce, as of December 2021 that features our ambitious goals to improve representation and the programs we have in place to meet and exceed these goals to both hold ourselves accountable and make this information easily accessible to the public.
As57% of January 1, 2022, 41% of our global workforce was comprised of employees who identify as female and 54% of our United States-based workforce was comprised of individuals who identify as part of an underrepresented group (“URG”). We are committed to increasingURG; individuals who identify with a URG represented 51% of our total population of URGs to 60% by the end of 2023.full-time management positions (defined as people-manager and above); and
•Individuals who identify with a URG represent 47% of our full-time senior leadership positions (defined as people-manager and above) and 66%represented 63% of our executive workforce. We
Additionally, 44.1% of our U.S.-based workforce was comprised of employees who identify as female, 3.5% as veterans, 6.2% as LGBTQIA+, and 5.7% as people with disabilities as of December 31, 2023.
Creating lasting and meaningful change is not a short-term project. Improving DE&I requires a multi-faceted approach to ensure that all employees are increasing our goalhaving an equitable experience. This journey requires transparency and accountability at all levels of URGs in senior leadership positions to 50% by the end of 2023.
organization. To help meet and achieve theseour long-term goals, we will focushave focused on attraction, assessment, engagement and development at all levels. This means that we will ensure fair and transparent processes in talent assessment and hiring, to performance management, career progression and retention, we have developed programs that support our all employees across all stages of the employee lifecycle.
As a foundation to this work, we have developed competency-based assessments for roles in marketing, operations and engineering to reduceassist in reducing unconscious biases in both our hiring and promotion practices. We have also invested in formalizing aformalized university hiring program and returning military programprograms to ensure we are bringing in talent at all levels of the Company.company.
We arehave also workingworked to create a stronger sense of inclusion and belonging for ourall employees, in general with a lens on representation. We launchedSoFi proudly sponsors nine Employee Resource Groups, known internally as SoFi Circles. These employee-led communities help build high-trust relationships, create safe and brave spaces to raise awareness on important, pertinent topics, and help our organization thrive by fostering a targeted mentorship programsense of community. Examples of their programs include: listen & learn workshops, cultural events, keynote speaker series, give back donation initiatives, and volunteering opportunities for our URG population called SoFi GROW.all. We also work with our international offices in Mexico City and Hong Kong to work to ensure our employees have access to our Employee Resource Groups (called SoFi Circles, some of which are further described below), and that we are taking into consideration local and regional differences as it pertains to DE&I.
The four key focus areasSoFi Circles and associated programs outlined below enable ustheir defined missions:
Each SoFi Circle is open to createall of our employees, regardless of location, tenure, or subsidiary. Being a SoFi Circle member gives employees access to unique programming and sustain a culture where everyone feels valued, heard and has equal opportunityopportunities to thrive.
| | | | | |
Goals | Programs |
Enablement, Awareness and Education: Create awareness around how social identities contribute to our professional environment and our success
| •Expanded voluntary, confidential Employee Self Identification to include LGBTQ, Persons with a disability, and Veterans
•Mandatory employee trainings: Unconscious Bias, Building an Inclusive Culture, and Hiring the SoFi Way
•Manager onboarding training with a focus on managing for inclusion and development
|
Access, Development and Network: Develop a connected workforce with high job satisfaction and engagement, and provide our allies with leadership development opportunities
| •SoFi Circles: Internal groups that identify through a common identity that builds community and empowerment for our employees
•SoFi Grow URM Internal Mentorship Program: Seeks to inspire and elevate our most underrepresented communities at SoFi by fostering professional development and accelerating the path for allies to take action
•Explorer Program: Six-month development program designed to help our hourly operations employees learn new skills and promote internal mobility
•Manager onboarding program: Designed to provide new managers at SoFi with the tools and resources they need to create a supportive, inclusive work environment where their team can do their best work
•The Embracing Diversity Podcast: Monthly podcast to inform our broader SoFi community on important topics that aim to embrace inclusivity, belonging and awareness
|
Fairness and Clarity in Processes: Actively attempt to mitigate unconscious and conscious bias in the hiring process and in annual performance calibrations by working to ensure the processes are objective and inclusive
| •Competency-based interviewing: Anchor our interview process to identify success competencies associated with each role versus informal interviews
•Mandatory employee trainings: Manage the SoFi Way (for employees), Unconscious Bias (for all hiring teams), Managing within the Law (for people managers) and Bystander Intervention and Prevention (for all employees)
•Regular reviews of employee data to help ensure fairness in our development and compensation processes
•Partnering with national military organizations and universities to increase the diversity of our applicant pool
|
Accelerated Increase in Representation: We foster attraction, engagement and retention of underrepresented employees by increasing external brand awareness and supporting SoFi employee career development
| •Increase accessibility and visibility of jobs by partnering with organizations like Diversity Jobs, Fairygodboss and Talenya.
•Work towards the goal of having, by 2023, 20% of our incoming workforce comprised of early career seekers with a focus on veterans and underrepresented minorities from university programs
•Cultivate career development for employees through SoFi Grow mentorship and Explorer programs, as well as Meet our SoFi-ety initiative, where we can “meet” our employees who are part of these programs, and see how they are learning, growing and helping to transform the Fintech industry
|
We believe that a combination of these approaches will help increase the representation, engagement and retention of women, Black, Latinx, and all employees who identifyconnect with other SoFi Circle members—either as being from a URG across all levels, roles and business groups.identifying members or as an ally.
In order to stay accountable to our DE&I goals, we have expanded our accountability metrics to include retention,review hiring, engagement, promotion and engagement alongside hiring, and we aim to review these practicesretention metrics with each executive business leader quarterly to monitor progress.bi-annually. We actively track our self-reported URG/URM hiring rates against the total addressable market, the rate of our promotions of this population against their dominant peer group’s rate, as well as the rate of attrition, to monitor and try to help ensure we are not disproportionately losing URG/URM at a faster rate than our peer group. We action plan to address opportunities with each business unit group.
TrainingWhile we are proud of the progress we have made, our DE&I journey has only just begun. In order to unlock the potential of our organization, to scale and grow as a company, we have expanded our DE&I approach to focus on a holistic strategy that will impact the entire SoFi ecosystem - from our members and clients, to our stakeholders, and current and prospective employees. We call this new approach the 4 P’s: People, Practices, Partnerships, and Policy:
•People focuses on FINDing, GROWing, and KEEPing our talent in order for them to invest in themselves, their futures and in the financial world.
•Practices focuses on ensuring we have the right systems, structures, and processes in place that drive accountability and equitable outcomes for everyone including for leaders and managers.
•Partnerships focus is on finding and establishing external strategic partnerships that create a diverse talent pipeline, provide professional development and networking opportunities for our staff, and amplify the SoFi brand (specifically within underserved communities).
•Policy focuses on building a world-class supplier diversity program so that small businesses have an opportunity to successfully participate and compete to supply goods and services for SoFi.
In 2024, we continue to focus on our four priorities to ensure we achieve our long term efforts.
Learning and Manager Excellence
We believe strongly in investing in our employees and this is a focus throughout the employee lifecycle. Great care is taken to onboard new hires and set them up for success, both in terms of a broad understanding of SoFi’s mission, values, strategic pointpoints of differentiation and products, as well as role-specific learning. To this end, throughout the year we offer ongoing learnings, including: weekly company-level All Hands meetings, monthly programming on a diverse range of topics
including: regular company-level All Hands meetings, periodic programming on a diverse range of topics spanning general business updates to developmental topics, such as financial and personal wellness, and other opportunities for learning from internal and external speakers. To enable continuous learning, we have deployed an online training platform, which offers thousands of courses and training sessions, ranging from skill development to manager resources. The training sessions consist of live training, speakers and targeted learning content.
We also offer ongoing learning opportunities for our people managers to ensure they are well equipped to support their employees.and lead diverse and distributed teams. In addition to training on our compensation philosophy and tools, manager effectiveness and other basic ongoing processes administered by the People team, we also employ a seven-weekan eight-week manager onboarding program. This program covers a variety of topics, including DE&I, how to give effective feedback, a recruiting overview and best practices and various other components to set new leaders at SoFi up for success. Within our online training platform,We also create opportunities for employees and managers to provide feedback on their learning experiences via surveys and focus group sessions. In 2023, we developedalso launched Manager Central, a centralized hub of resources, learning and support for managers. We also offer a suite of bespoke, just-in-time self-access learning content that is tailored to meet the needs of a growing organization, and that is tied to key activities on the calendar. This approach is being rolled out for the internal Performance and Rewards program, for which we have created a manager excellence series, ranging over 22 identified competencies.toolkit of resources and a learning curriculum on Giving and Receiving Feedback, both for managers and employees at SoFi. In 2024, we will continue to focus on manager development by offering an array of solutions for them to be upskilled, build inclusion and create thriving teams.
Compensation
Our compensation programs are designed to attract, retain and motivate talented, deeply qualified and committed individuals who believe in our mission, while rewarding employees for long-term value creation. We have a pay-for-performance culture in which employee compensation is aligned to Company performance, as well as individual contributions and impact. Our equitylong-term incentive program aligns employee compensation to the long-term interests of our shareholders, while encouraging them to think and act like owners. As we continue to evolve our programs and practices, we strive for a fair, competitive, transparent and equitable approach in recognizing and rewarding our employees.
Employee Benefits
The health and wellness of our employees and their families is integral to SoFi’s success. We have a comprehensive benefits program to support the physical, mental and financial well-being of our employees. WeFor our U.S. based workforce we have one core medical plan in which SoFi pays 100% of the monthly premium and three additional medical plans with premiums that are significantly subsidized. In addition to core medical, we offer fertility and maternityparental benefits to help employees who are looking to grow their family, including a reimbursement solution for eligible family building expenses, a paid parental leave benefit, as well as a partially subsidized back-up family care benefit. To support the mental health of our employees, we offer a digital benefit that allows our employees to meet with coaches and clinical care providers at no cost to them. Our tuition reimbursement and student loan repayment programs in the U.S. provide financial support to our employees that allows them to advance their education and pay off existing student loan debt.
Our benefits packagepackages also includes,include, among other things, basic life insurance and supplemental life insurance, short-term and long-term disability insurance, a Section 401(k) retirement savings plan, and competitive paid time off. Additionally, in February 2022, we announced the launch ofour program SoFi Gives is a benefit that provides eligible employees with paid time off to engage in volunteer opportunities within their community.
In response to the COVID-19 pandemic, we transitioned to a flexible-first workforce model that not only puts the health and safety of our employees first, but also takes into account what our employees need to be successful. We now offer all of our employees the choice of working full time in the office, a hybrid approach, or full-time remote. Coming into the office remains 100% voluntary, unless a person’s role requires them to be on site to do their job. Additionally, to support our employees through these challenging times, we introduced additional programs focused on childcare as well as support specific to balancing the demands of work and personal family needs. An additional benefit that came out of this was the introduction of “SoFridays,” where exempt employees are encouraged to end their work week at 2:00 pm local time each Friday. While this started in 2020 in response to the COVID-19 pandemic, it will continue as a permanent benefit moving forward.communities.
Employees
As of December 31, 2021,2023, we employed approximately 2,5004,400 employees, of which approximately 97%73% were located in the United States and 3%27% were located internationally. None of our U.S. based employees isare currently represented by a labor union or hashave terms of employment that are subject to a collective bargaining agreement. We consider our relationship with our employees to be very strong and have not historically experienced any work stoppages.
Environmental, Social, and Corporate Governance Sustainable business practices are embedded into our day-to-day operations, as we continue to make critical investments in our team and infrastructure to be further able to scale and support new avenues of growth. We believe this not only aligns with our number one company priority of making our culture better every second and ensuring DE&I is at the center of everything we do, but also improves our profitability and supports long-term value creation for our shareholders.
In December 2023, we published our first comprehensive ESG report which shares how our company priorities, core values, mission and commitments to the communities we serve shape how we do business, support our employees, and create a meaningful and lasting impact for our members and customers. This report covers a broad set of ESG-related efforts which have been key to informing our approach, including our people programs, product development processes, community investments and social impact, environmental footprint, corporate governance strategies, risk management operations, public policy initiatives and more. In addition, we have an ESG Committee comprised of key management stakeholders who are tasked with tracking our progress within our ESG initiatives using real world, data-based metrics, as well as devising and executing strategies to create an even greater impact.
This and any other ESG-related reports and information included on our investor relations website are not incorporated by reference into, and do not form any part of, this Annual Report on Form 10-K.
Additional information about SoFi is available on our corporate website at https://www.sofi.com, as well as SoFi’s Investor Relations website at https://investors.sofi.com.
We use our website to distribute company information, including financial and other material information. We make available free of charge, on or through our website, our annual reports on Form 10-K, quarterly reports on Form 10-Q, current reports on Form 8-K, proxy statements, beneficial ownership reports on Forms 3 and 4, as well as other filings and any
amendments to these documents, as soon as reasonably practicable following the time they are electronically filed with or furnished to the SEC. These reports can also be found on the SEC’s website at www.sec.gov.
The content of any websites referred to in this report is not incorporated by reference into this report or any other report filed with or furnished to the SEC.
Item 1A. Risk Factors
In evaluating our company and our business, you should carefully consider the risks and uncertainties described below, together with the other information in this Annual Report on Form 10-K, including our unaudited condensed consolidated financial statements and the related notes and the section titled “Management’s Discussion and Analysis of Financial Condition and Results of Operations”. The occurrence of one or more of the events or circumstances described in these risk factors, alone or in combination with other events or circumstances, may have a material adverse effect on our business, reputation, revenue, financial condition, results of operations or future prospects, in which case the market price of our common stock could decline, and you could lose part or all of your investment. Unless otherwise indicated, referencereferences in this section and elsewhere in this Annual Report on Form 10-K to our business being adversely affected, negatively impacted or harmed will include an adverse effect on, or a negative impact or harm to, our business, reputation, financial condition, results of operations, revenue or our future prospects. The material and other risks and uncertainties summarized in this Annual Report on Form 10-K and described below are not intended to be exhaustive and are not the only ones we face. Additional risks and uncertainties not presently known to us or that we currently deem immaterial may also impair our business. This Annual Report on Form 10-K also contains forward-looking statements that involve risks and uncertainties. Our actual results could differ materially from those anticipated in the forward-looking statements as a result of a number of factors, including the risks described below. See the section titled “Cautionary Statement Regarding Forward-Looking Statements”.
Our business is subject to numerous risks and uncertainties, which illuminate challenges that we face in connection with the successful implementation of our strategy and the growth of our business. Our business, prospects, financial condition or operating results could be harmed by any of these risks, as well as other risks not currently known to us or that we currently consider immaterial. These risks are discussed more fully below and include, but are not limited to, risks related to:
Risks related to Business, Financial and Operational Risks
•our ability to successfully identify and address the risks and uncertainties we face;
•demands on our resources, intense and increasing competition, and the success of our business model (including futurecontinuing profitability);
•legislative and regulatory policies and related actions that apply or may apply to us, particularly as a result of our operating a bank and as a bank holding company, in connection with student loans, given our brokerage and investment advisory activity, or as a result ofrelated to services provided by our acquisition of SoFi Bank;technology platform;
•loss of one or more significant purchasers of our loans;loans or one or more significant technology platform clients;
•adverse developments affecting the financial services industry, such as actual events or concerns involving liquidity, defaults, or non-performance by financial institutions or transactional counterparties;
•impact of the ongoing COVID-19 pandemic,macroeconomic factors, including regulatory responses, elevated and fluctuating inflation, increased delinquency rates on consumer debt, reduced consumer discretionary spending and economic uncertainty;
Risks related to Strategic and New Products Risks
•potential and recent acquisitions that could require significant attention, disrupt our business and adversely affect our financials;
•failure to innovate or respond to evolving technological or other changes;
•an increase in fraudulent activity;
•failure of third partythird-party service providers or systems on which we rely;
•increased business, economicrely or, in the event we move certain services or systems in-house, our ability to successfully perform those services or implement and regulatory risks from continued expansion abroad;operate those systems;
Risks related to Credit Risks
•worsening economic conditions, the cyclical nature of our industry and ability to maintain expected levels of liquidity;
•inability to make accurate credit and pricing decisions or effectively forecast our loss rates;
•the discharge of student loans in certain circumstances;
•failure of a third-party service provider to perform various functions related to the origination and servicing of loans;
•risk of litigation by consumers related to non-qualified home loans;
Risks relatedRelated to Market and Interest Rate RisksRates
•cost and availability of funding in the capital markets and fluctuations in interest rates;
•higher than expected payment speeds of loans or longer holding periods of loans could negatively impact our returns;returns as the holder of the residual interests in securitization trusts;
•transition awaydecreased demand for certain lending products in the face of high interest rates, such as student loans and home loans;
Risks Related to Strategic and New Products
•potential and past acquisitions that require significant attention and could disrupt our business and adversely affect our financials;
•our failure to innovate or respond to evolving technological or other changes;
•an increase in fraudulent activity, particularly in connection with our personal loans product, credit card and SoFi Money;
•increased business, economic and regulatory risks from the London Inter-Bank Offered Rate (“LIBOR”) as a benchmark referencecontinued expansion abroad, given our brokerage and financial risks that cannot be eliminatedinvestment advisory activity, or related to services provided by our hedging activities, which carrytechnology platform;
Credit Market Related Risks
•worsening economic conditions, including general economic uncertainty, elevated and fluctuating inflation and interest rates, market volatility, the cyclical nature of our industry, and our ability to maintain expected levels of liquidity;
•our inability to make accurate credit and pricing decisions or effectively forecast our loss rates;
•the discharge of qualified student loans in bankruptcy in certain circumstances;
•the failure of our third-party service providers to perform various functions related to the origination and servicing of loans;
•financial issues or liquidity issues experienced by our technology platform clients that could result in termination of, or inability to pay for, their own risks;services;
Risks relatedRelated to Funding and Liquidity Risks
•our ability to retain, increase or secure new or alternative financing;financing, including through deposits, to finance our business and the receivables that we originate or other assets that we hold;
•termination of one or more of our warehouse facilities on which we are highly dependent;
•our ability to sell the loans we originate to third parties;
•increases in member loan default rates or the possibility of being required to retain or repurchase loans or indemnify the purchaserpurchasers of our loans;
•ability to finance the receivables that we originate or other assets that we hold;
Risks related to Regulatory, Tax and Other Legal Risks
•our exposure to evolving laws, rules, regulations and government enforcement policies, federal or state loan forgiveness programs, expansion of the federal student loan income-driven repayment plan, and potential enforcement actions, litigation, investigations, exams or inquiries or impairment of licenses;
•our ability to effectively mitigate risk exposure;
•changes in business, economic or political conditions;
•failure to comply with laws and regulations, including related to banks and bank holding companies, consumer financial protection, anti-money laundering, anti-corruption or privacy, laws;information security and data protection;
•increased regulatory scrutiny of the services provided by our technology platform;
•application of regulations and supervision under banking laws;and securities laws and regulations;
•our ability to efficiently protect our intellectual property rights;
•failure to comply with open source licenses for open source software included in our platform;or any of our subsidiaries’ platforms;
•the risk that we are, or any of our subsidiaries is, determined to have been subject to registration as an investment company under the Investment Company Act;
Risks related to Personnel and Business Continuity Risks
•loss of key management members or key employees, or an inability to hire key personnel;
•increased business continuity and cyber risks due to our primarily remote workforce;
•natural disasters, power outages, telecommunications failures, man-made problems and similar;
•employee misconduct;
Risks related to Risk Management and Financial Reporting Risks
•ability to establish and maintain proper and effective internal control over financial reporting and risk management processes and procedures;
•changes in accounting principles generally accepted in the United States;
•as a result of our business combination with a special purpose acquisition company, regulatory obligations may impact us differently than other publicly traded companies;
•incorrect estimates or assumptions by management in connection with the preparation of our financial statements;
Risks related to Information Technology and Data Risks
•breach or violation of law by a third party on which we depend;
•cyberattacks and other security breaches or disruptions of our systems or third-party systems on which we rely, including disruptions that may impact our ability to collect loan payments and maintain accurate accounts;
•liabilities related to the collection, processing, use, storage and transmission of personal data;
Risks related to Ownership of Our Securities
•volatility in the price of our common stock and future dilution of our stockholders;
•possibility of securities litigation, which is expensive and time consuming; and
•failure to comply with Nasdaq continued listing standards.
Business, Financial and Operational Risks
We operate in a rapidly evolving industry, and have limited experience in parts of our Financial Services and Technology Platform segments, which may make it difficult for us to successfully identify and address the risks and uncertainties we face.
We operate in a rapidly evolving industry, and have limited experience in parts of our Financial Services and Technology Platform segments, which may make it difficult to identify risks to our business and evaluate our future prospects. In particular, we have limited experience offering cash management, investment services and technology solutions. In the first quarter of 2022, we acquired a bank charter and face risks as a result of our lack of experience operating a bank and as a bank holding company. We face numerous challenges to our success, including our ability to:
•increase or maintain the number, volume and types of, and add new features to, the loans we extend to our members as the market for loans evolves and as we face new and increasing competitive threats;
•increase the number of members utilizing non-lending products, including our direct deposit feature, and maintain and build on the loyalty of existing members by increasing their use of new or additional products;
•successfully maintain and enhance our diversified funding strategy, including through securitization financing from consolidated and nonconsolidated variable interest entities (“VIEs”), whole loan sales and debt warehouse facilities;
•further establish, diversify and refine our cash management, investment and brokerage offerings to meet evolving consumer needs and preferences;
•diversify our revenue streams across our products and services;
•favorably compete with other companies, including traditional and alternative technology-enabled lenders, financial service providers, broker dealers, and technology platform-as-a-service providers;
•realize the benefits of operating a bank;
•introduce new products or other offerings to meet the needs of our existing and prospective members or to keep pace with competitive lending, cash management, investment and other developments;
•maintain or increase the effectiveness of our direct marketing, and other sales and marketing efforts;
•successfully navigate economic conditions and fluctuations in the credit markets;
•establish fraud prevention strategies that proactively identify threat vectors and mitigate losses;
•defend our platform from information security vulnerabilities, cyberattacks or malicious attacks;
•effectively manage the growth of our business;
•effectively manage our expenses;
•obtain debt or equity capital on attractive terms or at all;
•successfully continue to expand internationally;
•adequately respond to macroeconomic and other exogenous challenges, including the ongoing COVID-19 pandemic; and
•anticipate and react to changes in an evolving regulatory and political environment.
We may not be able to successfully address the risks and uncertainties we face, which could negatively impact our business, financial condition, results of operations, cash flows and future prospects.
We have a history of losses, may not achieve profitability in the future and there is no assurance that our revenue and business model will be successful.
Our net losses were $483.9 million, $224.1 million and $239.7 million for the years ended December 31, 2021, 2020 and 2019, respectively. We may continue to incur net losses in the future, and such losses may fluctuate significantly from quarter to quarter. We will need to generate and sustain significant revenues for our business generally, and achieve greater scale and generate greater operating cash flows from our Financial Services segment, in particular, in future periods, in order to achieve, maintain or increase our level of profitability. We intend to continue to invest in sales and marketing, technology, and new products and services in order to enhance our brand recognition and our value proposition to our members, and these additional costs will create further challenges to generating near term profitability. Our general and administrative expenses have also increased, and we expect they may continue to increase to meet the increased compliance and other requirements associated with operating as a public company, acquiring a bank and operating a bank, and evolving regulatory requirements. See “We recently acquired a national bank, which subjects us to significant additional regulation”.
We are continually refining our revenue and business model, which is premised on creating a virtuous cycle for our members to engage in more products across our platform, a strategy we refer to as the Financial Services Productivity Loop. There is no assurance that our revenue and business model or any changes to our revenue and business model to better compete with our competitors will be successful. Our efforts to grow our business may be more costly than we expect, and we may not be able to increase our revenue sufficiently to offset our higher operating expenses. We may continue to incur losses and not achieve future profitability or, if achieved, be unable to maintain such profitability, due to a number of reasons, including the risks described in this Annual Report on Form 10-K, unforeseen expenses, difficulties, complications and delays, and other unknown events.
We have experienced rapid growth in recent years, including through the addition of new lines of business, which may place significant demands on our operational, risk management, sales and marketing, technology, compliance, and finance and accounting resources.
Our rapid growth in certain areas of our business in recent years, primarily within our Financial Services and Technology Platform segments, has placed significant demands on our operational, risk management, sales and marketing, technology, compliance, and finance and accounting infrastructure, and has resulted in increased expenses, a trend that we expect to continue as our business grows. In addition, we are required to continuously develop and adapt our systems and infrastructure in response to the increasing sophistication of the consumer financial services market, evolving fraud and information security landscape, and regulatory developments relating to existing and projected business activities. Our future growth will depend, among other things, on our ability to maintain an operating platform and management system able to address such growth, and will require us to incur significant additional expenses, expand our workforce and commit additional time from senior management and operational resources. We may not be able to manage supporting and expanding our operations effectively, and any failure to do so would adversely affect our ability to increase the scale of our business, generate projected revenue and control expenses.
Our results of operations and future prospects depend on our ability to retain existing members and attract new members. We face intense and increasing competition and, if we do not compete effectively, our competitive positioning and our operating results will be harmed.
We refer to our customers as “members”. We define a member as someone who has a lending relationship with us through origination or servicing, opened a financial services account, linked an external account to our platform, or signed up for our credit score monitoring service. We operate in a rapidly changing and highly competitive industry, and our results of operations and future prospects depend on, among others:
•the continued growth of our member base;
•our ability to monetize our member base, including through the use of additional products by our existing members;
•our ability to acquire members at a lower cost; and
•our ability to increase the overall value to us of each of our members while they remain on our platform (which we refer to as a member’s lifetime value).
We expect our competition to continue to increase, as there are generally no substantial barriers to entry to the markets we serve. In addition to established enterprises, we may also face competition from early-stage companies attempting to capitalize on the same, or similar, opportunities as we are. Some of our current and potential competitors have longer operating histories, particularly with respect to our financial services products, significantly greater financial, technical, marketing and other resources and a larger customer base than we do. This allows them to potentially offer more competitive pricing or other terms or features, a broader range of financial products, or a more specialized set of specific products or services, as well as respond more quickly than we can to new or emerging technologies and changes in member preferences. Our existing or future competitors may develop products or services that are similar to our products and services or that achieve greater market acceptance than our products and services. This could attract current or potential members away from our services and reduce our market share in the future. Additionally, when new competitors seek to enter our markets, or when existing market participants seek to increase their market share, these competitors sometimes undercut, or otherwise exert pressure on, the pricing terms prevalent in that market, which could adversely affect our market share and/or our ability to capitalize on new market opportunities.
We currently compete at multiple levels with a variety of competitors, including:
•other personal loan, student loan refinancing, in-school student loan and mortgage lenders, including other banks and other non-bank financial institutions, as well as credit card issuers, that can offer more competitive interest rates or terms;
•banks and other non-bank financial institutions, for our SoFi Money cash management accounts and SoFi Bank deposit products and services;
•rewards credit cards provided by other financial institutions, for our SoFi Credit Card;
•other brokerage firms, including online or mobile platforms, and technology and other companies for our SoFi Invest accounts;
•other technology platforms for the enterprise services we provide, such as technology platform services via Galileo;
•with other content providers for subscribers to our financial services content, including content from alternative providers available to our subscribers through our Lantern Credit service, which is a financial services aggregator providing marketplace lending products, and various enterprise partnerships; and
•other financial services firms offering leading employers a comprehensive platform for employees to build financial well-being through student loan and 529 educational plan contributions, educational tools, and financial resources, all of which we provide through SoFi at Work.
We believe that our ability to compete depends upon many factors both within and beyond our control, including, among others, the following:
•the size, diversity and activity levels of our member base;
•our ability to introduce successful new products and services, or to iterate and innovate on existing products or services to satisfy evolving member preferences or to keep pace with market trends;
•our ability to diversify our revenue streams across our products and services;
•the timing and market acceptance of our products and services, including developments and enhancements to those products and services, offered by us and our competitors;
•member service and support efforts;
•selling and marketing and promotional efforts;
•the ease of use, performance, price and reliability of solutions developed either by us or our competitors;
•our ability to attract and retain talent;
•changes in economic conditions, regulatory and policy developments;
•our ability to successfully operate a national bank and realize the potential benefits to our members;
•our ability to successfully execute on the Financial Services Productivity Loop and our other business plans;
•general credit markets conditions and their impact on our liquidity and ability to access funding;
•the ongoing impact of the COVID-19 pandemic and related developments on the lending and financial services markets we serve; and
•our brand strength relative to our competitors.
Our current and future business prospects demand that we act to meet these competitive challenges but, in doing so, our revenues and results of operations could be adversely affected if we, for example, increase marketing or other expenditures or make new expenditures in other areas. Competitive pressures could also result in us reducing the annual percentage rate on the loans we originate, incurring higher member acquisition costs, or making it more difficult for us to grow our loan originations in both number of loans and volume for new as well as existing members. All of the foregoing factors and events could adversely affect our business, financial condition, results of operations, cash flows and future prospects.
We recently acquired a national bank, which subjects us to significant additional regulation.
In March 2021, we entered into an agreement to acquire Golden Pacific, a bank holding company, and its wholly-owned subsidiary, Golden Pacific Bank, National Association, a national bank. In January 2022, we received regulatory approval for the Bank Merger. We closed the Bank Merger in February 2022, after which we became a bank holding company and Golden Pacific Bank began operating as SoFi Bank.
As a bank holding company, we are subject to regulation, supervision and examination by the Federal Reserve, and SoFi Bank is subject to regulation, supervision and examination by the OCC and the FDIC, as well as regulations issued by the CFPB. Federal laws and regulations govern numerous matters affecting us, including changes in the ownership or control of banks and bank holding companies, maintenance of adequate capital and the financial condition of a financial institution, permissible types, amounts and terms of extensions of credit and investments, permissible nonbanking activities, the level of
reserves against deposits and restrictions on dividend payments. The OCC possesses the power to issue cease and desist orders to prevent or remedy unsafe or unsound practices or violations of law by banks subject to their regulation, and the Federal Reserve possesses similar powers with respect to bank holding companies. In general, the bank supervisory framework is intended to protect insured depositors and the safety, soundness and stability of the U.S. financial system and not shareholders in depository institutions or their holding companies. Our efforts to comply with such additional regulations may require substantial time, monetary and human resource commitments. If any new regulations or interpretations of existing regulations to which we are subject impose requirements on us that are impractical or that we cannot satisfy, our financial performance, and our stock price, may be adversely affected.
In connection with applying for approval to become a bank holding company, we developed a financial and bank capitalization plan and enhanced our governance, compliance, controls and management infrastructure and capabilities in order to work to be compliant with all applicable regulations and operate to the satisfaction of the banking regulators, which required substantial time, monetary and human resource commitments. Our efforts to comply with such regulations and new and additional regulations may require substantial time, monetary and human resource commitments. If any new regulations or interpretations of existing regulations to which we are subject impose requirements on us that are impractical or that we cannot satisfy, our financial performance, and our stock price, may be adversely affected.
Additionally, certain of our stockholders may need to comply with applicable federal banking statutes and regulations, including the Change in Bank Control Act and the Bank Holding Company Act. Specifically, stockholders holding 10.0% or more of our voting interests may be required to provide certain information and/or commitments on a confidential basis to, among other regulators, the Federal Reserve. This requirement may deter certain existing or potential stockholders from purchasing shares of our common stock, which may suppress demand for the stock and cause the price to decline.
Our future growth depends significantly on our branding and marketing efforts, and if our marketing efforts are not successful, our business and results of operations will be harmed.
We have dedicated and intend to continue to dedicate significant resources to marketing efforts. Our ability to attract members depends in large part on the success of these marketing efforts and the success of the marketing channels we use to promote our products. Our marketing channels include, but are not limited to, earned media through press and social media, as well as traditional advertising, such as online affiliations, search engine optimization and digital marketing, offline partnerships, out-of-home, direct mail, lifecycle marketing and television and radio advertising.
While our goal remains to increase the strength, recognition and trust in our brand by increasing our member base and expanding our products and services, if any of our current marketing channels becomes less effective, if we are unable to continue to use any of these channels, if the cost of using these channels significantly increases or if we are not successful in generating new channels, we may not be able to attract new members in a cost-effective manner or increase the activity of our existing members on our platform, including by using additional products or services we offer. If we are unable to recover our marketing costs through increases in the size, value or overall number of loans we originate, or other product selection and utilization, it could have a material adverse effect on our business, financial condition, results of operations, cash flows and future prospects.
Legislative and regulatory policies and related actions in connection with student loans could have a material adverse effect on our student loan portfolios.
In recent years, there has been increased focus by policymakers on outstanding student loans, including, among other things, on the total volume of outstanding loans and on the number of loans outstanding per borrower. In response, there has been discussion of potential legislative and regulatory actions and other possible steps to, among other things:
•permit private education loans such as our refinanced student loan and in-school student loan products to be discharged in bankruptcy without the need to show undue hardship;
•amend the federal postsecondary education loan programs, including to reduce interest rates on certain loans, to revise repayment plans, to implement loan forgiveness plans, to provide for refinancing of private education loans into federal student loans at low interest rates, to reduce or eliminate the Grad PLUS program (which authorizes loans that comprise a substantial portion of our student loan refinancing business) and to provide for refinancing of existing federally held student loans into new federal student loans at low interest rates;
•require private education lenders to reform loan agreements to provide for income-based repayment plans and other payment plans; and
•make sweeping changes to the entire cost structure and financial aid system for higher education in the United States, including proposals to provide free postsecondary education.
In the first half of 2021, the Biden administration ordered a formal legal review of authorities that could be used to cancel student debt and there has been public pressure for the Biden administration to publicly release the memo outlining the conclusions of the legal review. Prominent politicians, including Senator Elizabeth Warren and Majority Leader Senator Chuck Schumer, have also advocated for executive action to forgive student loan debt. If student loans were forgiven or canceled in any meaningful scale, or if federal loan borrowers were permitted to refinance at lower interest rates, our profitability, results of operations, financial condition, cash flows or future business prospects could be materially and adversely affected as a result. In particular, our student loan refinancing business within our Lending segment, which is our largest segment, would be materially and adversely affected. There has also been pressure on policymakers to address underlying factors that contributed to the current volume of outstanding student loans, such as the cost of higher education and the ability for additional methods by the federal government and other organizations to subsidize the same, such as through increased use of Pell grants in lieu of loans. Further, proposals to eliminate or amend Section 523(a)(8) of the Bankruptcy Code, which makes student loans presumptively non-dischargeable in bankruptcy, could make whole loan purchasers less likely to purchase our student loans, securitization investors less likely to purchase securities backed by our student loans or warehouse lenders less likely to lend against our student loans at attractive advance rates. If steps were taken to materially reduce future demand by students for student loan refinancing and in-school student loan products, our student loan originations would be materially and adversely affected. As a result of any material adverse effect to our Lending segment, our overall profitability, results of operations, financial condition, cash flows or future business prospects may be adversely affected. See “— COVID-19 Pandemic Risks — Legislative and regulatory responses to the COVID-19 pandemic and related economic uncertainty could have a material adverse effect on our current student loan portfolios and our loan origination volume”.
Negative publicity could result in a decline in our member growth, or a loss of members, and impact our ability to compete for lending counterparties and corporate partners, and have a material adverse effect on our business, our brand and our results of operations.
We have invested significantly in our brand. We believe that maintaining and enhancing our brand identity is critical to our success. Our ability to compete for, attract and maintain members, lending counterparties, marketing partners and other partners relies to a large extent on their trust in our business and the value of our brand. The failure or perceived failure to maintain our brand could adversely affect our brand value, financial condition and results of operations. Negative publicity can adversely affect our reputation and damage our brand, and may arise from many sources, including actual or alleged misconduct, errors or improper business practices by employees, employee claims of discrimination or harassment, product failures, existing or future litigation or regulatory actions, inadequate protection of consumer information, data breaches, matters affecting our financial reporting or compliance with SEC and Nasdaq listing requirements and media coverage, whether accurate or not. Negative publicity or allegations of unfavorable business practices, poor governance, or workplace misconduct can be rapidly and widely shared over social or traditional media or other means, and could reduce demand for our products, undermine the loyalty of our members and the confidence of our lending counterparties, impact our partnerships, reduce our ability to recruit and retain employees or lead to greater regulatory scrutiny of our operations. In addition, we and our officers, directors and/or employees have been, and may in the future be, named or otherwise involved in litigation or claims, including employment-related claims such as workplace discrimination or harassment, which could result in negative publicity and/or adversely impact our business, even if we are ultimately successful in defending against such claims.
We may experience fluctuations in our quarterly operating results.
We may experience fluctuations in our quarterly operating results due to a number of factors, including changes in the fair values of our instruments (including, but not limited to, our loans), the level of our expenses, the degree to which we encounter competition in our markets, general economic conditions, the rate and credit market environment, legal or regulatory developments, legislative or policy changes and the ongoing impact of the COVID-19 pandemic. In light of these factors, results for any period should not be relied upon as being indicative of performance in future periods.
We sell a significant percentage of our loans to a concentrated number of whole loan purchasers and the loss of one or more significant purchasers could have a negative impact on our operating results.
We sell a significant percentage of our personal loans, student loans and home loans to a concentrated number of whole loan purchasers. Our top five whole loan purchasers by total unpaid principal balance of loans sold accounted for approximately 67% of the aggregate principal balance of our loans sold during the year ended December 31, 2021. During the year ended December 31, 2021, the two largest third-party buyers accounted for a combined 42% of our loan sales volume. See Note 16 to the Notes to Condensed Consolidated Financial Statements in this Annual Report on Form 10-K. There are inherent risks whenever a large percentage of a business is concentrated with a limited number of parties. It is not possible for us to predict the future level of demand for our loans by these or other purchasers. In addition, purchases of our loans by these purchasers have historically fluctuated and may continue to fluctuate based on a number of factors, some of which may be
outside of our control, including economic conditions, the availability of alternative investments, changes in the terms of the loans, loans offered by competitors and prevailing interest rates. If any of these purchasers significantly reduce the dollar amount of the loans they purchase from us, we may be unable to sell those loans to another purchaser on favorable terms or at all, which may have a material adverse effect on our revenues, results of operations, liquidity and cash flows.
The accounting method for reflecting the convertible notes on our balance sheet, accruing interest expense for the convertible notes and reflecting the underlying shares of our common stock in our reported diluted earnings per share may adversely affect our reported earnings and financial condition.
In August 2020, the Financial Accounting Standards Board issued Accounting Standards Update (“ASU”) 2020-06, Debt — Debt with Conversion and Other Options (Subtopic 470-20) and Derivatives and Hedging — Contracts in Entity’s Own Equity (Subtopic 815-40): Accounting for Convertible Instruments and Contracts in an Entity’s Own Equity (“ASU 2020-06”), which, among other things, simplifies the accounting for certain convertible instruments. We early adopted the provisions of ASU 2020-06 effective January 1, 2021.
In accordance with ASU 2020-06, the convertible notes we issued in October 2021 (the “notes”) are reflected as a liability on our consolidated balance sheets, with the initial carrying amount equal to the principal amount of the notes, net of issuance costs. The issuance costs were treated as a debt discount for accounting purposes, which will be amortized into interest expense over the term of the notes. As a result of this amortization, the interest expense that we expect to recognize for the notes for accounting purposes will be greater than the cash interest payments we will pay on the notes, which will result in lower reported earnings.
In addition, the shares underlying the notes will be reflected in our diluted earnings per share using the “if converted” method. Under that method, if the conversion value of the notes exceeds their principal amount for a reporting period, then we will calculate our diluted earnings per share assuming that all of the notes were converted at the beginning of the reporting period and that we issued shares of our common stock to settle the excess. However, if reflecting the notes in diluted earnings per share in this manner is anti-dilutive, or if the conversion value of the notes does not exceed their principal amount for a reporting period, then the shares underlying the notes will not be reflected in our diluted earnings per share. The application of the if-converted method may reduce our reported diluted earnings per share, and accounting standards may change in the future in a manner that may adversely affect our diluted earnings per share.
The conditional conversion feature of the notes, if triggered, may adversely affect our financial condition.
Holders of notes may be entitled to convert the notes during specified periods at their option. If one or more holders elect to convert their notes, we may settle any converted principal through the payment of cash, which could adversely affect our liquidity.
The capped call transactions may affect the value of the notes and our common stock.
In connection with the issuance of the notes, we entered into privately negotiated capped call transactions with certain financial institutions (the “Capped Call Counterparties”). The capped call transactions are expected generally to reduce the potential dilutive effect on the common stock upon any conversion of the notes and/or offset any potential cash payments we are required to make in excess of the principal amount of converted notes, as the case may be, with such reduction and/or offset subject to a cap. In connection with establishing their initial hedges of the capped call transactions, the Capped Call Counterparties or their respective affiliates entered into various derivative transactions with respect to our common stock and/or purchased shares of our common stock concurrently with or shortly after the pricing of the notes.
In addition, the Capped Call Counterparties and/or their respective affiliates may modify their hedge positions by entering into or unwinding various derivatives with respect to our common stock and/or purchasing or selling our common stock or other securities of ours in secondary market transactions following the pricing of the notes and from time to time prior to the maturity of the notes (and are likely to do so following any conversion of the notes, any repurchase of the notes by us on any fundamental change repurchase date, any redemption date or any other date on which the notes are retired by us, in each case if we exercise the relevant election to terminate the corresponding portion of the capped call transactions). This activity could also cause or avoid an increase or a decrease in the market price of our common stock or the notes. The potential effect, if any, of these transactions and activities on the market price of our common stock or the notes will depend, in part, on market conditions and cannot be ascertained at this time. Any of these activities could adversely affect the value of our common stock.
We are subject to counterparty risk with respect to the capped call transactions, and the capped call transactions may not operate as planned.
The Capped Call Counterparties are financial institutions or affiliates of financial institutions, and we will be subject to the risk that any or all of them might default under the capped call transactions. Our exposure to the credit risk of the Capped Call Counterparties will not be secured by any collateral. Global economic conditions have, from time to time, resulted in the actual or perceived failure or financial difficulties of many financial institutions. If a Capped Call Counterparty becomes subject to insolvency proceedings, we will become an unsecured creditor in those proceedings with a claim equal to our exposure at that time under our transactions with that Capped Call Counterparty. Our exposure will depend on many factors, but, generally, an increase in our exposure will be correlated with increases in the market price or the volatility of our common stock. In addition, upon a default by a Capped Call Counterparty, we may suffer more dilution than we currently anticipate with respect to our common stock. We can provide no assurances as to the financial stability or viability of any Capped Call Counterparty.
In addition, the capped call transactions are complex, and they may not operate as planned. For example, the terms of the capped call transactions may be subject to adjustment, modification or, in some cases, renegotiation if certain corporate or other transactions occur. Accordingly, these transactions may not operate as we intend if we are required to adjust their terms as a result of transactions in the future or upon unanticipated developments that may adversely affect the functioning of the capped call transactions.
COVID-19 Pandemic Risks
Our financial condition and results of operations have been and may continue to be adversely impacted by the ongoing COVID-19 pandemic.
Occurrences of epidemics or pandemics, depending on their scale, may cause different degrees of disruption to the regional, state and local economies in which we offer our products and services. The ongoing COVID-19 pandemic has had and could continue to have a material adverse effect on the value, operating results and financial condition of our business.
The COVID-19 pandemic has caused changes in consumer and student behavior, as well as economic disruptions. In the initial stages of the COVID-19 pandemic, extraordinary actions taken by international, federal, state and local public health and governmental authorities to contain and combat the outbreak and spread of COVID-19 and variants thereof, including travel bans, quarantines, “stay-at-home” orders, suspension of interest accrual and collections on certain federally-backed student loans, and similar mandates for many individuals and businesses to substantially restrict daily activities led to decreases in consumer activity generally. Although consumer activity has begun to recover and many government mandates to restrict daily activities have been lifted, worker shortages, supply chain issues, inflationary pressures, vaccine and testing requirements, the emergence of new variants and the reinstatement and subsequent lifting of restrictions and health and safety related measures in response to the emergence of new variants, such as the Delta and Omicron variants, contributed to the volatility of ongoing recovery. The reinstatement and subsequent lifting of these measures may occur periodically, which could adversely affect our business, operations and financial condition, as well as the business, operations and financial conditions of our customers and partners. There can be no assurance that economic recovery will continue or that consumer behavior will return to pre-pandemic levels.
Regulatory actions in response to the impacts of the ongoing COVID-19 pandemic, among other factors, also have an impact on our business. For example, the Federal Reserve announced in January 2022 that it expects it will soon raise the target range for the federal funds rate in part due to inflation and a strong labor market. Increased interest rates could unfavorably impact demand for all refinancing loan activities and reduce demand across student loans, personal loans and home loans, including, but not limited to, any variable-rate loan products. Additionally, demand for our student loan products in particular may continue to be impacted by legislative and regulatory actions taken in response to the COVID-19 pandemic, as described in more detail in these risk factors. There have been, and may continue to be, other factors that put downward pressure on demand for our loan products.
We are uncertain of the full effect the pandemic will have on the longer term prospects for our business since the scope, duration and impact of the COVID-19 pandemic is unknown and evolving factors such as the extent of any resurgences of the virus or emergence of new variants will impact the stability of economic recovery and growth.
See “Management’s Discussion and Analysis of our Financial Condition and Results of Operations — Key Business Metrics”and“Results of Operations” for further discussion of the impact of the COVID-19 pandemic in recent periods on our business and operating results. The COVID-19 pandemic, and its impact, may also have the effect of heightening many of the other risks described herein.
Legislative and regulatory responses to the COVID-19 pandemic and related economic uncertainty could have a material adverse effect on our current loan portfolios and our loan origination volume.
Legislative and regulatory responses to the COVID-19 pandemic have had and could continue to have a significant impact on our student loan portfolios. On March 27, 2020, the Coronavirus Aid, Relief, and Economic Security Act (“CARES Act”) was signed into law. In compliance with the CARES Act, payments and interest accrual on all loans owned by the Department of Education were suspended through September 30, 2020 and were further extended by a series of executive actions most recently through May 1, 2022. There is no guarantee that the moratorium on student loan payments will not be further extended past May 1, 2022. Additionally, on March 25, 2020, the Department of Education announced that private collection agencies were required to stop making outbound collection calls and sending letters or billing statements to borrowers in default on such federally held loans and such restrictions were extended most recently through May 1, 2022. As a result of such forbearance measures and protections, borrowers with federally held student loans lacked the incentive to refinance their student loans with us, which negatively impacted our business by reducing our loan origination volume.
The various legislative and regulatory responses to the COVID-19 pandemic, particularly the mandatory suspension of payments and interest accrual on federally held loans until May 2022, which could be further extended, are likely to continue to serve as a disincentive for borrowers to refinance their loans through our platform, thereby reducing our loan origination volume and negatively impacting our revenue. In addition, the ongoing COVID-19 pandemic has contributed to increasing pressure on policymakers to reduce or cancel student loans at a significant scale which would further reduce demand for our student loan refinance product and have a negative impact on our loan origination volume and revenue. For example, President Biden proposed $10,000 in forgiveness for federal student loan borrowers during his campaign and the Justice Department and Department of Education are reviewing whether the Biden administration has the authority to cancel student loan debt or whether any wide scale student loan debt forgiveness must be through legislation.
Although we continue to evaluate the ultimate impact of local, state and federal legislation and regulation, guidance and actions, future legislative actions, and the on-going impact of our own forbearance measures on our financial results, business operations and strategies, there is no guarantee that our estimates will be accurate or that any actions we take based on such estimates will be successful. Furthermore, we believe that the cost of responding to, and complying with, evolving laws and regulations, as well as any guidance from enforcement actions, will continue to increase, as will the risk of penalties and fines from any enforcement actions that may be imposed on our businesses. Our profitability, results of operations, financial condition, cash flows or future business prospects could be materially and adversely affected as a result.
Strategic and New Product Risks
We have in the past consummated and, from time to time we may evaluate and potentially consummate, acquisitions, which could require significant management attention, disrupt our business and adversely affect our financial results.
Our success will depend, in part, on our ability to expand our business. In some circumstances, we may determine to do so through the acquisition of complementary assets, businesses and technologies rather than through internal development. For example: (i) in April 2020, we acquired 8 Limited, an investment business in Hong Kong, (ii) in May 2020, we acquired Galileo, a company that provides technology platform services to financial and non-financial institutions, (iii) in February 2022, we acquired Golden Pacific, a bank holding company, and (iv) in February 2022, we entered into an agreement to acquire Technisys, a cloud-native digital multi-product core banking platform. The identification of suitable acquisition candidates can be difficult, time-consuming and costly, and we may not be able to successfully complete identified acquisitions. The risks we face in connection with acquisitions include:
•diversion of management time and focus from operating our business to addressing acquisition integration challenges;
•coordination of technology, product development, risk management and sales and marketing functions;
•retention of employees from the acquired company and retention of our employees due to cultural challenges associated with integrating employees from the acquired company into our organization;
•integration of the acquired company’s accounting, management information, human resources and other administrative systems;
•the need to implement or improve controls, procedures and policies at a business that prior to the acquisition may have lacked effective controls, information security safeguards, procedures and policies;
•potential write-offs or impairments of intangible assets or other assets acquired in the acquisition;
•liability for activities of the acquired company before the acquisition, including patent and trademark infringement claims, violations of laws, commercial disputes, tax liabilities and other known and unknown liabilities;
•litigation or other claims in connection with the acquired company, including claims from terminated employees, customers, former stockholders or other third parties; and
•geographic expansion exposes our business to known and unknown regulatory compliance risks including elevated risk factors for tax compliance, money laundering controls, and supervisory controls oversight.
Our failure to address these risks or other problems encountered in connection with our acquisitions and investments could cause us to fail to realize the anticipated benefits of these acquisitions or investments, cause us to incur unanticipated liabilities and harm our business, generally. Future acquisitions could also result in dilutive issuances of our equity securities, the incurrence of debt, contingent liabilities, regulatory obligations to further capitalize our business, and goodwill and intangible asset impairments, any of which could harm our financial condition and negatively impact our stockholders. To the extent we pay the consideration for any future acquisitions or investments in cash, it would reduce the amount of cash available to us for other purposes.
Galileo depends on a small number of clients, the loss or disruptions in operations of any of which could have a material adverse effect on its business and financial results, and negatively impact our financial results and results of operations.
During the year ended December 31, 2021, our Technology Platform segment consisted entirely of net revenues from Galileo, which accounted for 20% of our consolidated total net revenue (excluding intercompany revenues). Galileo’s clients are highly concentrated, with its five largest clients contributing approximately 63% of the total net revenue within the Technology Platform segment during the year ended December 31, 2021, which represented approximately 13% of our consolidated total net revenue for the period then ended. There are inherent risks whenever a large percentage of net revenue is concentrated with a limited number of customers, including the loss of any one or more of those clients as a result of bankruptcy or insolvency proceedings involving the client, the loss of the client to a competitor, harm to that client’s reputation or financial prospects or other reasons. In addition, disruptions in the operations of any of Galileo’s key clients have in the past disrupted and may in the future disrupt Galileo’s operations, and these disruptions could be material and have an adverse impact on our results of operations.
Demand for our products may decline if we do not continue to innovate or respond to evolving technological or other changes.
We operate in a dynamic industry characterized by rapidly evolving technology, frequent product introductions, and competition based on pricing and other differentiators. We continue to explore new product offerings and may rely on our proprietary technology to make our platform available to members, to service members and to introduce new products, which both fosters innovation and introduces new potential liabilities and risks. For example, in 2021, we launched our IPO investment center, through which we allow SoFi Invest members to invest in initial public offerings, that we underwrite through SoFi Securities, as well as provide dealer services in partnership with underwriting syndicates for IPOs. While this enables us to generate underwriting fees, it could also subject us to liability under the Securities Act of 1933, as amended (the “Securities Act”) for the contents of the prospectuses for the initial public offerings that we underwrite, which could be material. In addition, we may increasingly rely on technological innovation as we introduce new types of products, expand our current products into new markets, and continue to streamline our platform. The process of developing new technologies and products is complex, and if we are unable to successfully innovate and continue to deliver a superior member experience, members’ demand for our products may decrease and our growth and operations may be harmed. The brokerage industry also competes on price, and demand for our products and services may be affected if we are unable to compete on price.
SoFi Securities is a participant in the Depository Trust Company’s settlement services. Broker-dealers that settle their own trades are subject to substantially more regulatory requirements than brokers that outsource these functions to third-party providers. Errors in performing settlement functions, including clerical, technological and other errors related to the handling of funds and securities could lead to censures, fines or other sanctions imposed by applicable regulatory authorities as well as losses and liabilities in related lawsuits and proceedings brought by transaction counterparties and others. Any unsettled securities transactions or wrongly executed transactions may expose the broker dealer to adverse movements in the prices of such securities.
An increase in fraudulent activity could lead to reputational damage to our brand and material legal, regulatory and financial exposure (including fines and other penalties), and could reduce the use and acceptance of SoFi Money and SoFi Credit Card.
Financial institutions like us, as well as our members, colleagues, regulators, vendors and other third parties, have experienced a significant increase in fraudulent activity in recent years and will likely continue to be the target of increasingly sophisticated fraudsters and fraud rings in the future. This is particularly true for our newer products where we have limited experience evaluating customer behavior and performing tailored risk assessments, such as SoFi Money and SoFi Credit Card.
We develop and maintain systems and processes aimed at detecting and preventing fraudulent activity, which require significant investment, maintenance and ongoing monitoring and updating as technologies and regulatory requirements change and as efforts to overcome security and anti-fraud measures become more sophisticated. Despite our efforts, we have in the past and may in the future be subject to fraudulent activity. The possibility of fraudulent or other malicious activities and human error or malfeasance cannot be eliminated entirely and will evolve as new and emerging technology is deployed, including the increasing use of personal mobile and computing devices that are outside of our network and control environments, particularly as a large part of our workforce works remotely. Risks associated with each of these include theft of funds and other monetary loss, the effects of which could be compounded if not detected quickly. Indeed, fraudulent activity may not be detected until well after it occurs and the severity and potential impact may not be fully known for a substantial period of time after it has been discovered.
Fraudulent activity and other actual or perceived failures to maintain a product’s integrity and/or security has led to increased regulatory scrutiny and may lead to regulatory investigations and intervention (such as mandatory card reissuance), increased litigation (including class action litigation), remediation, fines and response costs, negative assessments of us and our subsidiaries by regulators and rating agencies, reputational and financial damage to our brand, and reduced usage of our products and services, all of which could have a material adverse impact on our business.
Successful fraudulent activity and other incidents related to the actual or perceived failures to maintain the integrity of our processes and controls could negatively affect us, including harming the market perception of the effectiveness of our security measures or harming the reputation of the financial system in general, which could result in reduced use of our products and services. Such events could also result in legislation and additional regulatory requirements. Although we maintain insurance, there can be no assurance that liabilities or losses we may incur will be covered under such policies or that the amount of insurance will be adequate.
We rely on third parties and their systems to process transaction data and for settlement of funds on SoFi Money and SoFi Credit Card, and these third parties’ failure to perform these services adequately could materially and adversely affect our business.
To provide our cash management account and credit card and other products and services, we rely on third parties that we do not control, such as payment card networks, our acquiring and issuing processors, payment card issuers, various financial institution partners, systems like the ACH, and other partners. We rely on these third parties for a variety of services, including the transmission of transaction data, processing of chargebacks and refunds, settlement of funds, and the provision of information and other elements of our services. In the event these third parties fail to provide these services adequately, including as a result of financial difficulty or insolvency, errors in their systems, outages or events beyond their control, or refuse to provide these services on terms acceptable to us or at all, and we are not able to find suitable alternatives, our business may be materially and adversely affected.
SoFi Credit Card is a relatively new product and we may not be successful in our efforts to promote its usage through marketing and promotion, or to effectively control the costs of such investments, both of which may materially impact our profitability.
Revenue growth for SoFi Credit Card is dependent on increasing the volume of members who open an account and on growing loan balances on those accounts. We have been investing in a number of new product initiatives to attract new SoFi Credit Card members and capture a greater share of our members’ total spending and borrowings. There can be no assurance that our investments in SoFi Credit Card to acquire members, provide differentiated features and services and spur usage of our card will be effective. Further, developing our service offerings, marketing SoFi Credit Card in additional customer acquisition channels and forming new partnerships could have higher costs than anticipated, and could adversely impact our results or dilute our brand. See — “Funding and Liquidity Risks —SoFi Credit Card is a relatively new product and any failure to execute our funding strategy for it could have a negative impact on our business, operating results and financial condition”.
SoFi may be unable to close or successfully integrate Technisys’ operations and may not realize the anticipated benefits of acquiring Technisys.
SoFi and Technisys have operated and, until the completion of the Technisys acquisition, will continue to operate, independently. The success of the Technisys acquisition, including anticipated benefits and cost savings and potential additional revenue opportunities, will depend, in part, on SoFi’s ability to close the Technisys acquisition, successfully integrate Technisys’ operations in a manner that results in various benefits, including, among other things, the development of an end-to-end vertically integrated banking technology stack to support multiple products and enable the combined company to meet the expanding needs of existing parties and serve additional established banks, fintechs and non-financial brands looking to enter financial services. The process of integrating operations could result in a loss of key personnel or cause an interruption of, or
loss of momentum in, the activities of one or more of SoFi’s businesses or inconsistencies in standards, controls, procedures and policies that adversely affect the ability of SoFi to maintain relationships with customers and employees. The diversion of management’s attention and any delays or difficulties encountered in connection with the Technisys acquisition and the integration of Technisys’ operations could have an adverse effect on the business, financial condition, operating results and prospects of SoFi.
If the Technisys acquisition is not consummated for any reason, or SoFi experiences difficulties in the integration process, including those listed above, SoFi may fail to realize the anticipated benefits of the Technisys acquisition in a timely manner or at all. Failure to achieve these anticipated benefits could result in increased costs, decreases in the amount of expected revenues, lost cost savings and incremental revenue opportunities and diversion of management’s time and energy and could have an adverse effect on SoFi’s business, financial condition, operating results and prospects.
We may continue to expand operations abroad where we have limited operating experience and may be subject to increased business, economic and regulatory risks that could adversely impact our financial results.
In April 2020, we undertook our first international expansion by acquiring 8 Limited, an investment business in Hong Kong. Additionally, with the acquisition of Galileo in May 2020, we gained clients in Mexico and Colombia and, with the anticipated acquisition of Technisys in February 2022, we expect to further expand our operations into Latin America. We may, in the future, pursue further international expansion of our business operations, either organically or through acquisitions, in new international markets where we have limited or no experience in marketing, selling and deploying our product and services. If we fail to deploy or manage our operations in these countries successfully, our business and operations may suffer. In addition, we are subject to a variety of risks inherent in doing business internationally, including:
•political, social and/or economic instability;
•risks related to governmental regulations in foreign jurisdictions, including regulations relating to privacy, and unexpected changes in regulatory requirements and enforcement;
•fluctuations in currency exchange rates;
•higher levels of credit risk and fraud;
•enhanced difficulties of integrating any foreign acquisitions;
•burdens of enforcing and complying with a variety of foreign laws;
•reduced protection for intellectual property rights in some countries;
•difficulties in staffing and managing global operations and the increased travel, infrastructure and legal compliance costs associated with multiple international locations and subsidiaries;
•different regulations and practices with respect to employee/employer relationships, existence of workers’ councils and labor unions, and other challenges caused by distance, language, and cultural differences, making it harder to do business in certain international jurisdictions;
•compliance with statutory equity requirements; and
•management of tax consequences.
If we are unable to manage the complexity of global operations successfully, our financial performance and operating results could suffer.
Credit Risks
We operate in a cyclical industry. In an economic downturn, member default rates may increase, there may be decreased demand for our products, and there may be adverse impacts to our lending business.
Uncertainty and negative trends in general economic conditions can have a significant negative impact on our ability to generate adequate revenue and to absorb expected and unexpected losses. Many factors, including factors that are beyond our control, may result in higher default rates by our members, a decline in the demand for our products, and potentially impact our ability to make accurate credit assessments or lending decisions. Any of these factors could have a detrimental impact on our operating performance and liquidity.
Our Lending and Financial Services segments may be particularly negatively impacted by worsening economic conditions that place financial stress on our members resulting in loan defaults or charge-offs. If a loan charges off while we are still the owner, the loan either enters a collections process or is sold to a third-party collection agency and, in either case, we will receive less than the full outstanding interest on, and principal balance of, the loan. Declining economic conditions may
also lead to either decreased demand for our loans or demand for a higher yield on our loans, and consequently lower prices or a lower advance rate, from institutional whole loan purchasers, securitization investors and warehouse lenders on whom we rely for liquidity.
The longevity and severity of a downturn will also place pressure on lenders under our debt warehouses, whole loan purchasers and investors in our securitizations. Furthermore, long-term market disruptions could negatively impact the securitizations market. Although certain of our debt warehouses and whole loan sale agreements contain committed terms, there can be no assurance that our financing arrangements will remain available to us through any particular business cycle or be renewed on the same terms. The timing and extent of a downturn may also require us to change, postpone or cancel our strategic initiatives or growth plans to pursue shorter-term sustainability. The longer and more severe an economic downturn, the greater the potential adverse impact on us.
There can be no assurance that economic conditions will remain favorable for our business or that interest in purchasing our loans by financial institutions, will remain at current levels, or that default rates by our members will not increase. Reduced demand or lower prices or a lower advance rate for our products from institutional whole loan purchasers, securitization investors and warehouse lenders and increased default rates by our members may limit our access to capital, including debt warehouse facilities and securitizations, and negatively impact our profitability.
If we do not make accurate credit and pricing decisions or effectively forecast our loss rates, our business and financial results will be harmed, and the harm could be material.
In making a decision whether to extend credit to prospective or existing members, we rely upon data to assess our ability to extend credit within our risk appetite, our debt servicing capacity, and overall risk level to determine lending exposure and loan pricing. If the decision components, rapidly deteriorating macro-economic conditions or analytics are either unstable, biased, or missing key pieces of information, the wrong decisions will be made, which will negatively affect our financial results. If our credit decisioning strategy fails to adequately predict the creditworthiness of our members, including a failure to predict a member’s true credit risk profile and ability to repay their loan, higher than expected loss rates will impact the fair value of our loans. Additionally, if any portion of the information pertaining to the prospective member is false, inaccurate or incomplete, and our systems did not detect such falsities, inaccuracies or incompleteness, or any or all of the other components of our credit decision process fails, we may experience higher than forecasted losses, including losses attributed to fraud. Furthermore, we rely on credit reporting agencies to obtain credit reports and other information we rely upon in making underwriting and pricing decisions. If one of these third parties experiences an outage, if we are unable to access the third-party data used in our decision strategy, or our access to such data is limited, our ability to accurately evaluate potential members will be compromised, and we may be unable to effectively predict credit losses inherent in our loan portfolio, which would negatively impact our results of operations, which could be material.
Additionally, if we make errors in the development, validation, or implementation of any of the underwriting models or tools that we use for the loans securing our debt warehouses or included in securitization transactions or whole loan sales, such loans may experience higher delinquencies and losses, which would negatively impact our debt warehouse financing terms and future securitization and whole loan sale transactions.
If the information provided to us by members is incorrect or fraudulent, we may misjudge a member’s qualification to receive a loan or use one of our products, and our results of operations may be harmed.
Our lending decisions are based partly on information provided to us by loan applicants or members. To the extent that these applicants provide information to us in a manner that we are unable to verify, our credit decisioning process may not accurately reflect the associated risk. In addition, data provided by third-party sources, including credit reporting agencies, is a significant component of our credit decisions and this data may contain inaccuracies. Inaccurate analysis of credit data that could result from false loan application information could harm our reputation, business and results of operations. Additionally, we rely on the accuracy of member information in approving members for our non-lending products, such as SoFi Money or SoFi Invest accounts.
We use identity and fraud prevention tools to analyze data provided by external databases to authenticate each applicant’s identity. From time to time in the past, however, these checks have failed and there is a risk that these checks could fail in the future, and fraud, which may be significant, may occur and go undetected. For example, we recently identified certain fraudulent activity related to our personal loans product. While the fraudulent activity was detected and the losses are not expected to be material, there can be no assurance there will not be future instances of fraud, that we will be able to detect such fraudulent activity in a timely manner, or that such future fraudulent activity will not be material. We may not be able to recoup funds underlying loans made in connection with inaccurate statements, omissions of fact or fraud, in which case our revenue, results of operations and profitability will be harmed. Fraudulent activity or significant increases in fraudulent activity could
also lead to regulatory intervention, which could negatively impact our results of operations, brand and reputation, and require us to take steps to reduce fraud risk, which could increase our costs.
Internet-based loan origination processes may give rise to greater risks than paper-based processes.
We use Internet-based loan processes to obtain application information and distribute certain legally required notices to applicants for, and borrowers of, our loans, and to obtain electronically signed loan documents in lieu of paper documents with ink signatures obtained in person. These processes may entail greater risks than paper-based loan origination processes, including regarding the sufficiency of notice for compliance with consumer protection laws, risks that borrowers may challenge the authenticity of loan documents, or the validity of the borrower’s electronic signature on loan documents, and risks that unauthorized changes are made to the electronic loan documents. If any of those factors were to cause our loans, or any of the terms of our loans, to be unenforceable against the relevant borrowers, or impair our ability as master servicer or servicer to service our loans, the value of our loan assets would decrease significantly to us and to our whole loan purchasers, securitization investors and warehouse lenders. In addition to increased default rates and losses on our loans, this could lead to the loss of whole loan purchasers and securitization investors and trigger terminations and amortizations under our debt warehouse facilities, each of which would materially adversely impact our business.
Student loans are subject to discharge in certain circumstances.
Private education loans, including the refinanced student loans and other student loans made by us, are generally not dischargeable by a borrower in bankruptcy. However, a private education loan may be discharged if a debtor files an adversary claim and the bankruptcy court determines that not discharging the debt would impose an undue hardship on the debtor and the debtor’s dependents. Further, bills have been introduced in Congress that would make student loans dischargeable in bankruptcy to the same extent as other forms of unsecured credit without regard to a hardship analysis. For example, Senator Dick Durbin and Senator John Cornyn introduced a bill in 2021, the Fresh Start Through Bankruptcy Act, which would amend the bankruptcy code to more easily permit student loan discharges of federal student loans after ten years and it is possible similar legislation could be proposed with respect to private student loans. It is possible that a higher percentage of borrowers will obtain relief under bankruptcy or other debtor relief laws as a result of financial and economic disruptions related to the COVID-19 pandemic than is reflected in our historical experience. A private education loan that is not a refinanced parent-student loan is also generally dischargeable as a result of the death or disability of the borrower. The discharge of a significant amount of our loans could adversely affect our business and results of operations.
We offer personal loans, which have a limited performance history, and therefore we have only limited prepayment, loss and delinquency data with respect to such loans on which to base projections.
The performance of the personal loans we offer is significantly dependent on the ability of the credit decisioning, income validation, and scoring models we use to originate such loans, which include a variety of factors, to effectively evaluate an applicant’s credit profile and likelihood of default. Despite recession-readiness planning and stress forecasting, there is no assurance that our credit criteria can accurately predict loan performance under economic conditions such as a prolonged down-cycle or recessionary economic environment or the governmental response to periods of disruption, such as measures implemented in response to the COVID-19 pandemic, which may drive unexpected outcomes. If our criteria do not accurately reflect credit risk on the personal loans, greater than expected losses may result on these loans and our business, operating results, financial condition and prospects could be materially and adversely affected.
In addition, personal loans are dischargeable in a bankruptcy proceeding involving a borrower without the need for the borrower to file an adversary claim. The discharge of a significant amount of our personal loans could adversely affect our financial condition. Furthermore, other characteristics of personal loans may increase the risk of default or fraud and there are few restrictions on the uses that may be made of personal loans by borrowers, which may result in increased levels of credit consumption. We also originate a material portion of our personal loans through ACH deposits directly to the borrowers, which may result in a higher risk of fraud. The effect of these factors may be to reduce the amounts collected on our personal loans and adversely affect our operating results and financial condition.
We service all of the personal loans we originate and have limited loan servicing experience, and we rely on third-party service providers to service the student loans, home loans and credit card loans that we originate, and to perform various other functions in connection with the origination and servicing of certain of our loans. If a third-party service provider fails to properly perform these functions, our business and our ability to service our loans may be adversely affected.
We service all of the personal loans we originate, and we have limited experience with such servicing. We may begin servicing the student loans that we originate at some time in the future. We rely on sub-servicers to service all of our student loans and all of our FNMA conforming home loans that we do not sell servicing-released, to perform certain back-up servicing
functions with respect to our personal loans, and to service all of our credit card loans. In addition, we rely on third-party service providers to perform various functions relating to our loan origination and servicing business, including underwriting, fraud detection, marketing, operational functions, cloud infrastructure services, information technology, telecommunications and processing remotely created checks, and, historically because we were not a bank and could not belong to or directly access the ACH payment network, ACH processing, and debit card and credit issuance or payment processing. While we oversee these service providers to ensure they service our loans in accordance with our agreements and regulatory requirements, we do not have control over the operations of any of the third-party service providers that we utilize. In the event that a third-party service provider for any reason fails to perform such functions, including through negligence, willful misconduct or fraud, our ability to process payments and perform other operational functions for which we currently rely on such third-party service providers will suffer and our business, cash flows and future prospects may be negatively impacted.
Any failure on our part or on the part of third parties on whom we rely to perform functions related to our servicing activities to properly service our loans could result in us being removed as the servicer on the loans we originate, including loans financed by our warehouse facilities or sold into our whole loan sales channel and securitization transactions. If we fail to monitor our student loan sub-servicer and ensure that such sub-servicer complies with its obligations under state laws that require student loan servicers to be licensed, we may face civil claims for damages under such state laws. Because we receive revenue from such servicing activities, any such removal as the servicer or, with respect to our student loans, master servicer, could adversely affect our business, operating results, financial condition or prospects, as would the cost of onboarding a new servicer. Furthermore, we have agreed in our servicing agreements to service loans in accordance with the standards set forth therein, and may be obligated to repurchase loans if we fail to meet those standards.
Additionally, if one or more key third-party service providers were to cease to exist, to become a debtor in a bankruptcy or an insolvency proceeding or to seek relief under any debtor relief laws or to terminate its relationship with us, there could be delays in our ability to process payments and perform other operational functions for which we are currently relying on such third-party service provider, and we may not be able to promptly replace such third-party service provider with a different third-party service provider that has the ability to promptly provide the same services in the same manner and on the same economic terms. As a result of any such delay or inability to replace such key third-party service provider, our ability to process payments and perform other business functions could suffer and our business, cash flows and future prospects may be negatively impacted.
We may make non-qualified home loans, which may increase the risk of litigation by consumers.
We do not currently offer, but may expand our product selection to offer, non-qualified home loans, which, unlike qualified home loans, do not benefit from a presumption that the borrower has the ability to repay the loan. If we were to make a loan for which we did not satisfy the regulatory standards for ascertaining the borrower’s ability to repay the loan and the borrower were to default, we may be prevented from collecting interest and principal on that loan in court. As such, non-qualified home loans carry increased risk of exposure to litigation and claims of borrowers.
Potential geographic concentration of our members may increase the risk of loss on the loans that we originate and negatively impact our business.
Any concentration of our members in specific geographic areas may increase the risk of loss on our loans. Certain regions of the United States from time to time will experience weaker economic conditions and higher unemployment and, consequently, will experience higher rates of delinquency and loss than on similar loans in other regions of the country. Moreover, a deterioration in economic conditions, outbreaks of disease (such as new or worsening outbreaks of COVID-19 or additional strains or variants), the continued increase in extreme weather conditions and other natural events (such as hurricanes, tornadoes, floods, drought, wildfires, mudslides, earthquakes and other extreme conditions) could adversely affect the ability and willingness of borrowers in affected regions to meet their payment obligations under their loans and may consequently affect the delinquency and loss experience of such loans. In addition, we, as master servicer for all student loans and home loans and as servicer of our personal loans, have offered in the past, and may in the future offer, hardship forbearance or other relief programs in certain circumstances to affected borrowers.
Conversely, an improvement in economic conditions in one or more states could result in higher prepayments of their payment obligations under their loans by borrowers in such states. As a result, we and the whole loan purchasers who hold our loans or securitization investors or warehouse lenders who hold securities backed by our loans may receive principal payments earlier than anticipated, and fewer interest payments than anticipated, and face certain reinvestment risks, such as the inability to acquire loans on equally attractive terms as the prepaid loans. In addition, higher prepayments than anticipated may have a negative impact on our servicing revenue which could cause our operating results and financial condition to be materially and adversely affected.
Further, the concentration of our loans in one or more states may have a disproportionate effect on us or investors in our loans or securities backed by our loans if governmental authorities in any of those states take action against us as originator, master servicer or servicer of those loans or take action affecting our ability as master servicer or servicer to service those loans in such states.
Market and Interest Rate Risks
Our business and results of operations may be adversely affected by the financial markets, fiscal, monetary, and regulatory policies, and economic conditions generally.
General economic, political, social and health conditions in the U.S. and in countries abroad affect markets in the U.S. and abroad and our business. In particular, markets in the U.S. or abroad may be affected by the level and volatility of interest rates, availability and market conditions of financing, unexpected changes in gross domestic product, economic growth or its sustainability, inflation, supply chain disruptions, consumer spending, employment levels, labor shortages, wage stagnation, federal government shutdowns, developments related to the U.S. federal debt ceiling, energy prices, home prices, commercial property values, bankruptcies, a default by a significant market participant or class of counterparties, fluctuations or other significant changes in both debt and equity capital markets and currencies, liquidity of the global financial markets, the growth of global trade and commerce, trade policies, the availability and cost of capital and credit, disruption of communication, transportation or energy infrastructure and investor sentiment and confidence. Additionally, global markets may be adversely affected by the current or anticipated impact of climate change, extreme weather events or natural disasters, the emergence or continuation of widespread health emergencies or pandemics, cyberattacks or campaigns, military conflict, including Russia’s invasion of Ukraine, terrorism or other geopolitical events. Also, any sudden or prolonged market downturn in the U.S. or abroad, as a result of the above factors or otherwise, could adversely affect our business, results of operations and financial condition, including capital and liquidity levels.
Actions taken by the Federal Reserve, including changes in its target funds rate, balance sheet management, and lending facilities, and any exit, or perceived exit, from qualitative easing, and other central banks are beyond our control and difficult to predict. These actions can affect interest rates and the value of financial instruments and other assets and liabilities and can impact our members. Sudden changes in monetary policy, for example in response to high inflation, could lead to financial market volatility, increases in market interest rates, and a flattening or inversion of the yield curve.
Changes to existing U.S. laws and regulatory policies and evolving priorities, including those related to financial regulation, taxation, international trade, fiscal policy, climate change (including required reduction of greenhouse gas emissions) and healthcare, may adversely impact U.S. or global economic activity and our members', our counterparties' and our earnings and operations. For example, the expiration of pandemic-related government assistance in the U.S. could result in a reduction in economic activity and lead to a deterioration in households’ finances, particularly if consumers also continue to face high inflation. A slowdown in consumer demand could limit the ability of firms to pass on fast-rising costs for labor and other inputs, weighing on earnings and potentially leading to an equity market downturn. Significant fiscal policy changes and/or initiatives may also raise the federal debt, affect businesses and household after-tax incomes and increase uncertainty surrounding the formulation and direction of U.S. monetary policy and volatility of interest rates. A rise in U.S. interest rates could increase the likelihood of a more volatile and appreciating U.S. dollar. Changes, or proposed changes, to certain U.S. trade and international investment policies, particularly with important trading partners (including China and the EU) have in recent years negatively impacted financial markets. An escalation of tensions could lead to further measures that adversely affect financial markets, disrupt world trade and commerce and lead to trade retaliation, including through the use of tariffs, foreign exchange measures or the large-scale sale of U.S. Treasury Bonds. Actions taken by other countries, particularly China, to restrict the activities of businesses, could also negatively affect financial markets.
Any of these developments could adversely affect our business, our members, the value of our loan portfolios, our level of charge-offs and provision for credit losses, our capital levels, our liquidity and our results of operations.
We utilize a gain-on-sale origination model and, consequently, our business is affected by the cost and availability of funding in the capital markets.
In addition to the issuance of equity, historically, we have funded our operations and capital expenditures through sales of our loans, secured and unsecured borrowing facilities and securitizations. We utilize a gain-on-sale origination model and, consequently, our earnings and financial condition are largely dependent on the price we can obtain for our products in the capital markets, which may also be negatively impacted by rising interest rates combined with longer periods during which we are required to hold loans on-balance sheet. Our ability to obtain these types of financing depends, among other things, on our development efforts, business plans, operating performance, lending activities, and condition of, and our access to, the capital markets at the time we seek financing. The capital markets have from time to time experienced periods of significant volatility,
including volatility driven by the COVID-19 pandemic. This volatility can dramatically and adversely affect financing costs when compared to historical norms or make funding unavailable at any cost. Additional factors that could make financing more expensive or unavailable to us include, but are not limited to, financial losses, events that have an adverse impact on our reputation, lawsuits challenging our business practices, adverse regulatory changes, changes in the activities of our business partners, events that have an adverse impact on the financial services industry generally, counterparty availability, negative credit rating actions with respect to our rated securities, corporate and regulatory actions, interest rate changes, general economic conditions, including changing expectations for inflation and deflation, and the legal, regulatory and tax environments governing funding transactions, including existing or future securitization transactions. If financing is difficult, expensive or unavailable, our business, financial condition, results of operations, cash flows and future prospects could be materially and adversely affected.
Changing expectations for inflation and deflation and corresponding fluctuations in interest rates could decrease demand for our lending products and negatively affect loan performance, as well as increase certain operating costs, such as employee compensation.
There is particular uncertainty about the prospects for growth in the U.S. economy. A number of factors influence the potential uncertainty, including, but not limited to, rising government debt levels, prospective executive branch or Federal Reserve policy shifts, the withdrawal of government interventions into the financial markets, changing U.S. consumer spending patterns, and changing expectations for inflation and deflation which may impact interest rates. For example, at its January 2022 Federal Open Market Committee Meeting, the Federal Reserve indicated it expects to raise benchmark interest rates in 2022, partially in response to increasing inflation and a strong labor market. Increased interest rates may decrease borrower demand for our lending products, even as inflation places pressure on consumer spending, borrowing and saving habits as consumers evaluate their prospects for future income growth and employment opportunities in the current economic environment, and as borrowers face uncertainty about the impact of rising prices on their ability to repay a loan. A change in demand for our lending products and any steps we may take to mitigate such change could impact credit quality and overall growth of our Lending Segment. Furthermore, inflationary and other economic pressure resulting in the inability of a borrower to repay a loan could translate into increased loan defaults, foreclosures and charge-offs and negatively affect our business, financial condition, results of operations, cash flows and future prospects.
Additionally, an inflationary environment, combined with the tight labor market, could make it more costly for us to attract or retain employees. In order to meet the compensation expectations of our prospective and current employees due to inflationary factors, we may be required to increase our operating costs or risk losing skilled workers to competitors.
Fluctuations in interest rates could negatively affect the demand for our SoFi Money product.
Falling or low interest rates may have a negative impact on the demand for our SoFi Money product. SoFi Money is a cash management account offered through SoFi Securities, which offers members the opportunity to earn a variable interest rate on their account balances. Deposits made into a SoFi Money account earn a variable rate of interest. Falling or low interest rates may discourage account holders and prospective account holders from using the SoFi Money product, which would adversely affect our business, financial condition, results of operations, cash flows and future prospects.
Higher than expected payment speeds of loans could negatively impact our returns as the holder of the residual interests in securitization trusts holding student and personal loans. These factors could materially alter our net revenue or the value of our residual interest holdings.
The rate at which borrowers prepay their loans can have a material impact on our net revenue and the value of our residual interests in securitization trusts. Prepayment rates and levels are subject to a variety of economic, social, competitive and other factors, including fluctuations in interest rates, availability of alternative financings, regulatory changes affecting the student loan market, the home loan market, consumer lending generally and the general economy, including changing expectations for inflation and deflation.
While we anticipate some variability in prepayment levels, extraordinary or extended increases or decreases in prepayment rates could materially affect our liquidity and net revenue. For example, when as a result of unanticipated prepayment levels, student, and personal loans, as applicable, within a securitization trust amortize faster (due to prepayments) than originally contracted, the trust’s pool balance may decline at a rate faster than the prepayment rate assumed when the trust’s bonds were originally issued. If the trust’s pool balance declines faster than originally anticipated, in most of our securitization structures, the bonds issued by that trust will also be repaid faster than originally anticipated. In such cases, our net revenue may decrease, inclusive of the diminished value of any retained residual interest by us in the trust.
Finally, rating agencies may place bonds on watch or change their ratings on (or their ratings methodology for) the bonds issued by a securitization trust, possibly raising or lowering their ratings, based upon these prepayment rates and their perception of the risk posed by those rates to the timing of the trust cash flows. Placing bonds on watch, changing ratings negatively, proposing or making changes to ratings methodology could: (i) affect our liquidity, (ii) impede our access to the securitization markets, (iii) require changes to our securitization structures and (iv) raise or lower the value of the residual interests of our future securitization transactions.
The transition away from LIBOR as a benchmark reference for interest rates may affect our cost of capital, our liquidity, or expose us to borrower litigation or damage to the SoFi brand.
LIBOR has served as a global benchmark for determining interest rates on commercial and consumer loans, bonds, derivatives and numerous other financial instruments. Prior to December 31, 2021, we typically used USD LIBOR as the reference rate for the securities issued under certain of our securitizations (such as student loan securitizations), certain secured and unsecured financing facilities (such as the loan warehouse facilities, risk retention facilities and revolving credit facility), certain hedging arrangements, and our Series 1 redeemable preferred stock dividends. LIBOR was set based on interest rate information reported by certain banks, which stopped reporting such information after 2021. After December 31, 2021, the ICE Benchmark Administration Limited, the administrator of LIBOR (the “IBA”), ceased publishing one-week and two-month USD LIBOR, in addition to certain other non-USD tenors. The IBA expects to continue to publish all remaining USD LIBOR tenors through June 30, 2023, with the overnight and 12-month tenors ceasing immediately thereafter and the one-month, three-month and six-month tenors becoming non-representative from that date. Uncertainty relating to the LIBOR calculation process, the valuation of LIBOR alternatives, and other economic consequences from the phasing out of LIBOR may adversely affect our results of operations, financial condition and liquidity.
In the fourth quarter of 2021, we began to use the Secured Overnight Financing Rate (“SOFR”), the rate recommended by the U.S. Federal Reserve, in conjunction with the Alternative Reference Rates Committee, as the recommended risk-free reference rate for the United States, as the pricing index on all new variable-rate loan originations, and on new warehouse facility agreements and other financial instruments. We also transitioned some existing warehouse facility lines to SOFR. As of December 31, 2021, we had approximately $191 million of financial instruments indexed to USD LIBOR, consisting of loans, bonds and economic hedge positions. Our derivative agreements are governed by the International Swap Dealers Association, which established a 2020 IBOR Fallbacks Protocol and supplement effective in January 2021, as well as additional subsequent supplements, to allow counterparties to modify legacy trades to reference amended standard definitions inclusive of the new fallback language. However, most of these legacy financial instruments do not include provisions clearly specifying a method for transitioning from LIBOR to an alternative benchmark rate, and it is not yet known how courts or regulators will view the transition away from LIBOR to an alternative benchmark rate. As a result, it is difficult to predict the impact that a cessation of LIBOR would have on the value and performance of our existing financial instruments.
As of the date of this filing, we have not modified any existing loan agreements with borrowers that use USD LIBOR. We expect to begin transitioning these agreements, along with continuing to transition other financial instruments, from USD LIBOR to SOFR or other representative alternative reference rates in 2022. As of December 31, 2021, we identified approximately $185 million of variable-rate loans for which the pricing index was tied to USD LIBOR. Our loan agreements generally allow us to choose a new alternative reference rate based upon comparable information if the current index is no longer available.
The market transition away from LIBOR to an alternative reference rate is complex. We may incur significant expenses in implementing replacement reference rates for the calculation of interest rates under our loan agreements with borrowers, developing systems and analytics to successfully transition our risk management processes, and we may be subject to disputes or litigation with our borrowers over the appropriateness or comparability to LIBOR of the replacement reference rates or the interpretation or enforcement of certain fallback language in LIBOR-based products. The replacement reference rates could also result in a reduction in our interest income, which could have an adverse impact on our value, liquidity and results of operations. We may also receive inquiries and other actions from regulators in respect to our replacement of LIBOR with alternative reference rates.
These uncertainties regarding the possible cessation of LIBOR or their resolution could have a material adverse impact on our funding costs, net interest margin, loan and other asset values, asset-liability management strategies, and other aspects of our business and financial results.
We are exposed to financial risks that may be partially mitigated but cannot be eliminated by our hedging activities, which carry their own risks.
We have used, and may in the future use, financial instruments for hedging and risk management purposes in order to protect against possible fluctuations in interest rates, or for other reasons that we deem appropriate. In particular, we expect our interest rate risk to increase as our home loans business grows. However, any current and future hedges we enter into will not completely eliminate the risk associated with rising interest rates and our hedging activities may prove to be ineffective.
The success of our hedging strategy will be subject to our ability to correctly assess counterparty risk and the degree of correlation between the performance of the instruments used in the hedging strategy and any changes in interest rates, along with our ability to continually recalculate, readjust and execute hedges in an efficient and timely manner. Therefore, though we may enter into transactions to seek to reduce risks, unanticipated changes may create a more negative consequence than if we had not engaged in any such hedging transactions. Moreover, for a variety of reasons, we may not seek to establish a perfect correlation between such hedging instruments and the instruments being hedged. Any such imperfect correlation may prevent us from achieving the effect of the intended hedge and expose us to risk of loss. Any failure to manage our hedging positions properly or inability to enter into hedging instruments upon acceptable terms could affect our financial condition and results of operations.
Funding and Liquidity Risks
If we are unable to retain and/or increase our current sources of funding and secure new or alternative methods of financing, our ability to finance additional loans and introduce new products will be negatively impacted.
Historically, in addition to the issuance of equity, we have funded our operations and capital expenditures primarily through access to the capital markets through sales of our loans, access to secured and unsecured borrowing facilities and utilization of securitization financing from consolidated and nonconsolidated VIEs. In each of these instances (other than for certain whole loan sales of home loans), we retain the servicing rights to our loans from which we earn a servicing fee. In securitization financing transactions, we transfer a pool of loans originated by SoFi Lending Corp. to a VIE which is sponsored by SoFi Lending Corp. and we retain risk in the VIE, typically in the form of asset-backed bonds and residual interest investments. As of December 31, 2021, we had 13 VIEs consolidated on our consolidated balance sheet. We rely on each of these outlets for liquidity and the loss or reduction of any one of these outlets could materially adversely impact our business. There can be no assurance that we will be able to successfully access the securitization markets at any given time, and in the event of a sudden or unexpected shortage of funds in the banking and financial system, we cannot be sure that we will be able to maintain necessary levels of funding without incurring high funding costs, a reduction in the term of funding instruments, an increase in the amount of equity we are required to hold or the liquidation of certain assets. Furthermore, there is a risk that there will be no market at all for our loans either from whole loan buyers or through investments in securities backed by our loans.
We may require capital in excess of amounts we currently anticipate, and depending on market conditions and other factors, we may not be able to obtain additional capital for our current operations or anticipated future growth on reasonable terms or at all. As the volume of loans that we originate, and the increased suite of products that we make available to members, increases, we may be required to expand the size of our debt warehousing facilities or seek additional sources of capital. The availability of these financing sources depends on many factors, some of which are outside of our control. We may also experience the occurrence of events of default or breaches of financial performance or other covenants under our debt agreements, which could reduce or terminate our access to institutional funding.
If we are unable to increase our current sources of funding and secure new or alternative methods of financing, our ability to finance additional loans and to develop and offer new products, such as SoFi Credit Card, will be negatively impacted. The interest rates, advance rates and other costs of new, renewed or amended facilities may also be higher than those currently in effect. If we are unable to renew or otherwise replace these facilities or generally arrange new or alternative methods of financing on favorable terms, we may be forced to curtail our origination of loans or reduce lending or other operations, which would have a material adverse effect on our business, financial condition, operating results and cash flows.
If one or more of our warehouse facilities, on which we are highly dependent, is terminated, we may be unable to find replacement financing on favorable terms, or at all, which would have a material adverse effect on our business and financial condition.
We require a significant amount of short-term funding capacity for loans we originate. As of December 31, 2021, we had $6.9 billion of warehouse loan funding capacity through 23 warehouse facility arrangements. Additionally, consistent with industry practice, all of our existing warehouse facilities require periodic renewal. If any of our committed warehouse facilities
are terminated or are not renewed or our uncommitted facilities are not honored, we may be unable to find replacement financing on favorable terms, or at all, and we might not be able to originate an acceptable or sustainable volume of loans, which would have a material adverse effect on our business. Additionally, as our business continues to expand, including our home loan business, we may need additional warehouse funding capacity for the loans we originate. There can be no assurance that, in the future, we will be able to obtain additional warehouse funding capacity on favorable terms, on a timely basis, or at all.
If we fail to meet or satisfy any of the financial or other covenants included in our warehouse facilities, we would be in default under one or more of these facilities and our lenders could elect to declare all amounts outstanding under the facilities to be immediately due and payable, enforce their interests against loans pledged under such facilities and restrict our ability to make additional borrowings. Certain of these facilities also contain cross-default provisions. These restrictions may interfere with our ability to obtain financing or to engage in other business activities, which could materially and adversely affect us. There can be no assurance that we will maintain compliance with all financial and other covenants included in our warehouse facilities in the future.
Increases in member default rates on loans could make us and our loans less attractive to whole loan buyers, lenders under debt warehouse facilities and investors in securitizations, which may adversely affect our access to financing and our business.
Increases in member default rates could make us and our loans less attractive to our existing or prospective funding sources, including whole loan buyers, securitizations and debt warehousing facilities. If our existing funding sources do not achieve their desired financial returns or if they suffer losses, they or prospective funding sources may increase the cost of providing future financing or refuse to provide future financing or purchase loans on terms acceptable to us or at all.
Our securitizations are non-recourse to SoFi Technologies and are collateralized by the pool of our loans pledged to the relevant securitization issuer. If the loans securing our securitizations fail to perform as expected, the lenders under our warehouse facilities, the whole loan purchasers who purchase our loans, the investors in our securitizations who purchase securities backed by our loans, or future lenders, whole loan purchasers or securitization investors in similar arrangements, may increase the cost of providing future financing or refuse to provide future financing or purchase loans on terms acceptable to us or at all.
If we were to be unable to arrange new or alternative methods of financing on favorable terms, we may have to curtail or cease our origination of loans, which could have a material adverse effect on our business, financial condition, operating results and cash flows.
We make representations and warranties in connection with the transfer of loans to whole loan purchasers, government-sponsored enterprises, such as the FNMA, and our debt warehouse lenders and securitization trusts. If such representations and warranties are not correct, we could be required to repurchase loans or indemnify the purchaser, which could have an adverse effect on our ability to operate and fund our business.
We sell the loans we originate to third parties, including, with respect to home loans, counterparties like the FNMA and we make representations and warranties when we sell loans to third parties and in our financing transactions. In the ordinary course of business, we are exposed to liability under these representations and warranties made to purchasers of loans. Such representations and warranties typically include, among other things, that the loans were originated and serviced in compliance with law and with our credit risk origination policy and servicing guidelines and that, to the best of our knowledge, each loan was originated by us without any fraud or misrepresentation on our part or on the part of the borrower or any other person. In addition, purchasers require loans to meet strict underwriting and loan term criteria in order to be eligible for purchase. If those representations and warranties are breached as to a given loan, or if a certain loan we sell does not meet the relevant eligibility criteria, we will be obligated to repurchase the loan, typically at a purchase price equal to the then-outstanding principal balance of such loan, plus accrued interest and any premium. We may also be required to indemnify the purchaser for losses resulting from the breach of representations and warranties. In connection with our whole loan sales, we also typically covenant to repurchase any loan that enters delinquent status within the first thirty to sixty days following origination of the loan. Any significant increase in our obligation to repurchase home loans or indemnify purchasers of home loans, could have a significant adverse impact on our cash flows, even if they are reimbursable, and could also have a detrimental effect on our business and financial condition. If any such repurchase event occurs on a large scale, we may not have sufficient funds to meet our repurchase obligations, which would result in a default under the underlying agreements. Moreover, we may not be able to resell or refinance loans repurchased due to a breach of a representation or warranty or we may sell such loans below par. Any such event could have an adverse impact on our business, operating results, financial condition and prospects.
Our agreements with our lenders contain a number of early payment triggers and covenants. A breach of such triggers or covenants or other terms of such agreements could result in an early amortization, default, and/or acceleration of the related funding facilities which could materially impact our operations.
Primary funding sources available to support the maintenance and growth of our business include, among others, securitizations, debt warehouse facilities and corporate revolving debt. Our liquidity would be materially adversely affected by our inability to comply with various covenants and other specified requirements set forth in our agreements with our lenders which could result in the early amortization, default and/or acceleration of our existing facilities. Such covenants and requirements include financial covenants, portfolio performance covenants and other events. For a description of these covenants, requirements and events, see “Management’s Discussion and Analysis of Financial Condition and Results of Operations — Liquidity and Capital Resources”.
During an early amortization period or occurrence of a termination event or an event of default, principal collections from the loans in our asset-based facilities would be applied to repay principal under such facilities rather than being available to fund newly originated loans. During the occurrence of a termination event or an event of default under any of our facilities, the applicable lenders could accelerate the related debt and such lenders’ commitments to extend further credit under the related facility, if any, would terminate. If we were unable to repay the amounts due and payable under such facilities and securitizations, the applicable lenders and noteholders could seek remedies, including against the collateral pledged under such facilities and by the securitization trust. An acceleration of the debt under certain facilities could also lead to a default under other facilities and, in certain instances, our hedging arrangements, due to cross-acceleration provisions.
An early amortization event or event of default would negatively impact our liquidity, including our ability to originate new loans, and require us to rely on alternative funding sources, which might increase our funding costs or which might not be available when needed. If we were unable to arrange new or alternative methods of financing on favorable terms, we might have to curtail the origination of loans, which could have a material adverse effect on our business, financial condition, operating results and cash flows, which in turn could have a material adverse effect on our ability to meet our obligations under our facilities.
We require substantial capital and, in the future, may require additional capital to pursue our business objectives and achieve recurring profitability. If adequate capital is not available to us, including due to the cost and availability of funding in the capital markets, our business, operating results and financial condition may be harmed.
Since our founding, we have raised substantial equity and debt financing to support the growth of our business. Because we intend to continue to make investments to support the growth of our business, we may require additional capital to pursue our business objectives and growth strategy and respond to business opportunities, challenges or unforeseen circumstances, including lending to our members, increasing our marketing expenditures to attract new members and improve our brand awareness, developing our other products, introducing new services, further expanding internationally in existing or new countries or further improving existing offerings and services, enhancing our operating infrastructure and potentially acquiring complementary businesses and technologies. Accordingly, on a regular basis we need, or we may need, to engage in additional debt or equity financings to secure additional funds. However, additional funds may not be available when we need them, in amounts we need, or permitted to be applied to specific use cases, on terms that are acceptable to us or at all. In particular, we may require additional access to capital to support our lending operations. Volatility in the credit markets in general or in the market for student, personal and home loans and credit cards in particular may also have an adverse effect on our ability to obtain debt financing. Furthermore, the cost of our borrowing may increase due to market volatility, changes in the risk premiums required by lenders or if traditional sources of debt capital are unavailable. Volatility or depressed valuations or trading prices in the equity markets may similarly adversely affect our ability to obtain equity financing. Furthermore, if we raise additional funds through further issuances of equity or convertible debt securities, our existing stockholders could suffer significant dilution and any new equity securities we issue could have rights, preferences and privileges superior to those of holders of our common stock.
We are required to serve as a source of financial strength for SoFi Bank, which means that we may be required to provide capital or liquidity support to SoFi Bank, even at times when we may not have the resources to provide such support. In addition, maintaining adequate liquidity is crucial to our securities brokerage and our money services business operations, including key functions such as transaction settlement, custody requirements and margin lending. We meet our liquidity needs primarily from working capital and cash generated by customer activity, as well as from external debt and equity financing. Increases in the number of customers, fluctuations in customer cash or deposit balances, as well as market conditions or changes in regulatory treatment of customer deposits, may affect our ability to meet our liquidity needs. Our broker-dealer subsidiary, SoFi Securities, is subject to Rule 15c3-1 under the Exchange Act, which specifies minimum capital requirements
intended to ensure the general financial soundness and liquidity of broker-dealers, and SoFi Securities is subject to Rule 15c3-3 under the Exchange Act, which requires broker-dealers to maintain certain liquidity reserves.
A reduction in our liquidity position could reduce our customers’ confidence in us, which could result in the withdrawal of customer assets and loss of customers, or could cause us to fail to satisfy broker-dealer or other regulatory capital guidelines, which may result in immediate suspension of securities activities, regulatory prohibitions against certain business practices, increased regulatory inquiries and reporting requirements, increased costs, fines, penalties or other sanctions, including suspension or expulsion by the SEC, FINRA or other self-regulatory organizations (“SROs”) or state regulators, and could ultimately lead to the liquidation of our broker-dealers or other regulated entities. Factors which may adversely affect our liquidity positions include temporary liquidity demands due to timing differences between brokerage transaction settlements and the availability of segregated cash balances, timing differences between digital asset transaction settlements between us and our digital asset market makers and between us and our digital asset customers, fluctuations in cash held in customer accounts, a significant increase in our margin lending activities, increased regulatory capital requirements, changes in regulatory guidance or interpretations, other regulatory changes or a loss of market or customer confidence resulting in unanticipated withdrawals of customer assets. We expect that we will continue to use our available cash to fund our lending activities and help scale our Financial Services segment. To supplement our cash resources, we may seek to enter into additional securitizations and whole loan sale agreements or increase the size of existing debt warehousing facilities, increase the size of, or replace, our revolving credit facility and pursue other potential options. If we are unable to adequately maintain our cash resources, we may delay non-essential capital expenditures, implement cost cutting procedures, delay or reduce future hiring, discontinue the pursuit of our strategic objectives and growth strategies or reduce our rate of future originations compared to the current level. There can be no assurance that we can obtain sufficient sources of external capital to support the growth of our business. Delays in doing so or failure to do so may require us to reduce loan originations or reduce our operations, which would harm our ability to pursue our business objectives as well as harm our business, operating results and financial condition.
We are unable to finance all of the receivables that we originate or other assets that we hold, and that illiquidity could result in a negative impact on our financial condition.
We operate a gain-on-sale origination model, the success of which is tied to our ability to finance the assets that we originate. Certain of our assets, however, are ineligible for sale to a whole loan buyer or securitization trust, or are ineligible for, or are subject to a lower advance rate under, warehouse funding, each of which has specific eligibility criteria for receivables it purchases or holds as collateral. Ineligible receivables include, among others, those in default or that are delinquent, receivables with defects in their origination or servicing, including fraud, or receivables generated under origination guidelines and credit policies that are no longer in effect. In addition, many of our warehouse funding sources contain excess concentration limits for loans in forbearance or with specific loan level characteristics such as time-to-maturity or loan type. Once these limits have been exceeded, the advance rate applied to those receivables becomes less advantageous to us. If we are unable to sell or reasonably fund these receivables, we are required to hold them on our consolidated balance sheet which, in sufficient volume, negatively impact our financial condition.
In addition to the receivables described above, we also hold on our balance sheet certain risk retention assets with respect to which we have a reduced ability to receive financing. These risk retention assets include residuals from our securitization trusts that are either ineligible for transfer or are subject to European Union regulations. The illiquidity of these positions may negatively impact our financial condition.
SoFi Credit Card is a relatively new product and any failure to execute our funding strategy for it could have a negative impact on our business, operating results and financial condition.
SoFi Credit Card is a new product and we have limited experience originating and administering it. We began originating credit card receivables in the third quarter of 2020 (and launched the product to a broader market in the fourth quarter of 2020). We established a debt warehouse to finance the credit card receivables in Spring 2021. We may establish a credit card receivable securitization program in the future. There is no guarantee, however, that we will be successful in establishing a securitization program for these assets. In the event we are unable to finance our credit card receivables, we may be required to hold those assets on our consolidated balance sheet or sell them for a loss, either of which could have a negative impact on our business, operating results and financial condition.
Regulatory, Tax and Other Legal Risks
We are subject to extensive, complex and evolving laws, rules and regulations, which are interpreted and enforced by various federal, state and local government authorities.
We are subject to various federal, state and local regulatory regimes. The principal policy objectives of these regulatory regimes are to protect borrowers, investors and other financial services customers and to prevent fraud, money laundering, and terrorist financing. Laws and regulations, among other things, impose licensing and qualifications requirements; require various disclosures and consents; mandate or prohibit certain terms and conditions for various financial products; prohibit discrimination based on certain prohibited bases; prohibit unfair, deceptive or abusive acts or practices; require us to submit to examinations by federal, state and local regulatory regimes; and require us to maintain various policies, procedures and internal controls. Monitoring and complying with all applicable laws and regulations can be difficult and costly. Failure to comply with any of these requirements may result in, among other things, enforcement action by governmental authorities, lawsuits, monetary damages, fines or monetary penalties, restitution or other payments to borrowers or investors, modifications to business practices, revocation of required licenses or registrations, voiding of loan contracts and reputational harm. See Part I, Item 3 “Legal Proceedings”.
Our Lending segment is highly regulated, and if we fail to comply with federal and state consumer protection laws, rules, regulations and guidance, our business could be adversely affected.
The Consumer Financial Protection Bureau (“CFPB”), an agency which oversees compliance with and enforces federal consumer financial protection laws, has supervisory authority over the student and mortgage lending activity in which we engage. The CFPB has the authority to pursue enforcement actions against companies that offer or provide consumer financial products or services, including lenders and loan servicers that engage in unfair, deceptive or abusive acts or practices (“UDAAP”). The CFPB may also seek a range of other remedies, including rescission of contracts, refund of money, return of real property, restitution, disgorgement of profits or other compensation for unjust enrichment, damages, public notification of the violation and “conduct” restrictions (i.e., future limits on the target’s activities or functions). In addition, where a company has violated Title X of the Dodd Frank Wall Street Reform and Consumer Protection Act (the “Dodd-Frank Act”) or CFPB regulations under Title X, the Dodd-Frank Act empowers state attorneys general and state regulators to bring certain civil actions.
We hold lending licenses or similar authorizations in multiple states, each of which has the authority to supervise and examine our activities. As a licensed consumer lender, mortgage lender, loan broker, collection agency, money services business and loan servicer in certain states, we are subject to examinations by state agencies in those states. Similarly, we are subject to licensure requirements and regulations as an education loan servicer in multiple states. An administrative proceeding, litigation, investigation or regulatory proceeding relating to allegations or findings of the violation of such laws by us, any sub-servicer we engage, or our collection agents, could impair our ability to service and collect on our loans or could result in requirements that we pay damages, fines or penalties and/or cancel the balance or other amounts owing under one or more of our loans. There is no assurance that allegations of violations of the provisions of applicable federal or state consumer protection laws will not be asserted against us, any sub-servicers we engage or our collection agents or other prior owners of our loans in the future. To the extent it is determined that any of our loans were not originated in accordance with all applicable laws, we may be obligated to repurchase such loan from a whole loan buyer, securitization trust or warehouse facility.
We must comply with federal, state and local consumer protection laws including, among others, the federal and state UDAAP laws, the Federal Trade Commission Act, the Truth in Lending Act, the Real Estate Settlement Procedures Act, the Equal Credit Opportunity Act, the Fair Housing Act, the Home Mortgage Disclosure Act, the Secure and Fair Enforcement for Mortgage Licensing Act, the Fair Credit Reporting Act (“FCRA”), the Fair Debt Collection Practices Act, the Servicemembers Civil Relief Act, the Military Lending Act, the Electronic Fund Transfer Act, the Gramm-Leach-Bliley Act, the CARES Act and the Dodd-Frank Act. We must also comply with laws on advertising, as well as privacy laws, including the Telephone Consumer Protection Act (the “TCPA”), the Telemarketing Sales Rule, the CAN-SPAM Act, the Personal Information Protection and Electronic Documents Act, applicable laws and regulations of Hong Kong including the Personal Data (Privacy) Ordinance and the Personal Data (Privacy) (Amendment) Ordinance 2012 and the California Consumer Privacy Act (the “CCPA”). Privacy and data security concerns, data collection and transfer restrictions, contractual obligations and U.S. laws and regulations related to data privacy, security and protection could materially and adversely affect our business, financial condition and results of operations.
Compliance with applicable law is costly, and our failure to comply with applicable federal, state and local law could lead to:
•loss of our licenses and approvals to engage in our lending and servicing businesses;
•damage to our reputation in the industry;
•governmental investigations and enforcement actions;
•administrative fines and penalties and litigation;
•civil and criminal liability, including class action lawsuits;
•inability to enforce loan agreements;
•diminished ability to sell loans that we originate or purchase, requirements to sell such loans at a discount compared to other loans or repurchase or address indemnification claims from purchasers of such loans;
•loss or restriction of warehouse facilities to fund loans;
•inability to raise capital; and
•inability to execute on our business strategy, including our growth plans.
For example, in the first quarter of 2019, we were subject to a consent order from the Federal Trade Commission (the “FTC Consent Order”), which resolved allegations that we misrepresented how much money student loan borrowers have saved or would save from financing their loans with us, in violation of the Federal Trade Commission Act. Under the consent order, we are prohibited from misrepresenting to consumers how much money they would save by using our products, unless the claims are backed up by reliable evidence. In August 2021, we settled charges with the SEC against SoFi Wealth for allegedly breaching its fiduciary duties to clients in connection with the investment of client assets in two ETFs sponsored by Social Finance in 2019. Without admitting or denying the SEC’s findings, SoFi Wealth agreed to a cease-and-desist order, a censure, a penalty of $300 thousand, and to perform certain undertakings.
While we have developed and monitor policies and procedures designed to assist in compliance with laws and regulations, no assurance can be given that our compliance policies and procedures will be effective and that we will not be subject to fines and penalties, including with respect to any alleged noncompliance with the FTC Consent Order. Ambiguities in applicable statutes and regulations may leave uncertainty with respect to permitted or restricted conduct and may make compliance with laws, and risk assessment decisions with respect to compliance with laws, difficult and uncertain. In addition, ambiguities make it difficult, in certain circumstances, to determine if, and how, compliance violations may be cured. We may fail to comply with applicable statutes and regulations even if acting in good faith, or because governmental bodies or courts interpret existing laws or regulations in a more restrictive manner, which may lead to regulatory investigations, governmental enforcement actions or private causes of action with respect to our compliance. To resolve issues raised in examinations or other governmental actions, we may be required to take various corrective actions, including changing certain business practices, making refunds or taking other actions that could be financially or competitively detrimental to us. In some cases, regardless of fault, it may be less time-consuming or costly to settle these matters, which may require us to implement certain changes to our business practices, provide remediation to certain individuals or make a settlement payment to a given party or regulatory body. There is no assurance that any future settlements will not have a material adverse effect on our business.
We hold state licenses that result in substantial compliance costs, and our business would be adversely affected if our licenses are impaired as a result of non-compliance with those requirements.
We currently hold state licenses in connection with our lending activities, our student loan servicing activities, our securities business as well as our money services business activities. Although maintaining state licenses for our lending and servicing activities may become unnecessary as we transition certain of our products to SoFi Bank, for the immediate future, for as long as SoFi Lending Corp. originates or purchases loans, we must comply with certain state licensing requirements and varying compliance requirements in all the states in which we operate and the District of Columbia. Changes in licensing laws may result in increased disclosure requirements, increased fees, or may impose other conditions to licensing that we or our personnel are unable to meet. In most states in which we operate, a regulatory agency or agencies regulate and enforce laws relating to loan servicers, brokers, and originators, collection agencies, and money services businesses. We are subject to periodic examinations by state and other regulators in the jurisdictions in which we conduct business, which can result in increases in our administrative costs and refunds to borrowers of certain fees earned by us, and we may be required to pay substantial penalties imposed by those regulators due to compliance errors, or we may lose our license or our ability to do business in the jurisdiction otherwise may be impaired. Fines and penalties incurred in one jurisdiction may cause investigations or other actions by regulators in other jurisdictions.
We may not be able to maintain all currently required licenses and permits. If we change or expand our business activities, we may be required to obtain additional licenses before we can engage in those activities. If we apply for a new license, a regulator may determine that we were required to do so at an earlier point in time, and as a result, may impose penalties or refuse to issue the license, which could require us to modify or limit our activities in the relevant state. For
example, in 2019, we applied, through a subsidiary, for a Pennsylvania Mortgage Servicer license. The Commonwealth of Pennsylvania, acting through the Department of Banking and Securities, issued a consent agreement and order, ordering us to pay a $110 thousand fine for engaging in the home loan servicing activity prior to obtaining the license.
States may also expand or otherwise modify their current regulations and if such states so act, we may not be able to comply with such updated regulations or maintain all requisite licenses and permits in such states or our costs of compliance with and maintenance of such licenses or permits may materially increase. For example, California, Colorado and Maine have implemented additional regulations related to student loan servicers which impose additional registration, reporting and disclosure requirements and which, if applicable to us, may increase our costs of originating and servicing loans in those states.
In addition, the states that currently do not provide extensive regulation of our business may later choose to do so, and if such states so act, we may not be able to obtain or maintain all requisite licenses and permits, which could require us to modify or limit our activities in the relevant state or states. The failure to satisfy those and other regulatory requirements could result in a default under our warehouse facilities, other financial arrangements and/or servicing agreements and thereby have a material adverse effect on our business, financial condition and results of operations.
Our compliance and risk management policies and procedures as a regulated financial services company may not be fully effective in identifying or mitigating compliance and risk exposure in all market environments or against all types of risk.
As a financial services company operating in the securities industry, among others, our business exposes us to a number of heightened risks. We have devoted significant resources to develop our compliance and risk management policies and procedures and will continue to do so, but there can be no assurance these are sufficient, especially as our business is rapidly growing and evolving. Nonetheless, our limited operating history in many of the products we offer, our evolving business and our rapid growth make it difficult to predict all of the risks and challenges we may encounter and may increase the risk that our policies and procedures to identify, monitor and manage compliance risks may not be fully effective in mitigating our exposure in all market environments or against all types of risk. Further, some controls are manual and are subject to inherent limitations and errors in oversight. This could cause our compliance and other risk management strategies to be ineffective. Other compliance and risk management methods depend upon the evaluation of information regarding markets, customers, catastrophe occurrence or other matters that are publicly available or otherwise accessible to us, which may not always be accurate, complete, up-to-date or properly evaluated. Insurance and other traditional risk-shifting tools may be held by or available to us in order to manage certain exposures, but they are subject to terms such as deductibles, coinsurance, limits and policy exclusions, as well as risk of counterparty denial of coverage, default or insolvency. Any failure to maintain effective compliance and other risk management strategies could have an adverse effect on our business, financial condition and results of operations. We are also exposed to heightened regulatory risk because our business is subject to extensive regulation and oversight in a variety of areas, and such regulations are subject to evolving interpretations and application and it can be difficult to predict how they may be applied to our business, particularly as we introduce new products and services and expand into new jurisdictions. Additionally, the regulatory landscape involving digital assets is constantly evolving and SoFi Digital Assets may be subject to loss of revenue, fines, penalties or loss of regulatory licenses if the SEC or any other regulators issue new regulations or interpretive guidance related to digital assets that prohibit any of our current business practices. Also, due to market volatility, it is difficult to predict how much capital we will need in the future to meet net capital requirements. Any perceived or actual breach of laws and regulations could negatively impact our business, financial condition or results of operations. It is possible that these laws and regulations could be interpreted or applied in a manner that would prohibit, alter or impair our existing or planned products and services.
We may become subject to enforcement actions or litigation as a result of our failure to comply with laws and regulations, even though noncompliance was inadvertent or unintentional.
We maintain systems and procedures designed to ensure that we comply with applicable laws and regulations; however, some legal/regulatory frameworks provide for the imposition of fines or penalties for noncompliance even though the noncompliance was inadvertent or unintentional and even though there were systems and procedures designed to ensure compliance in place at the time.
For example, we engage in outbound telephone and text communications with consumers, and accordingly must comply with a number of federal and state statutes and regulations that govern said communications and the use of automatic telephone dialing systems (“ATDS”), and artificial or pre-recorded voice, including the TCPA and Telemarketing Sales Rules. The U.S. Federal Communications Commission (the “FCC”), and the FTC have responsibility for regulating various aspects of some of these laws. Among other requirements, the TCPA requires us to obtain prior express written consent for certain telemarketing calls and to adhere to “do-not-call” registry requirements which, in part, mandate we maintain and regularly update lists of consumers who have chosen not to be called and restrict calls to consumers who are on the national do-not-call list. Florida and other states have mini-TCPA and other similar consumer protection laws regulating telemarketing directed to
their residents. These federal and state laws limit our ability to communicate with consumers and reduce the effectiveness of our marketing programs. As currently construed, the TCPA does not distinguish between voice and data, and, as such, SMS/MMS messages are also “calls” for the purpose of TCPA obligations and restrictions.
For violations of the TCPA, the law provides for a private right of action under which a plaintiff may recover monetary damages of $500 for each call or text made in violation of the prohibitions on certain calls made using an “artificial or pre-recorded voice” or an ATDS and certain calls made to numbers properly registered on the federal do not call list. A court may treble the $500 amount upon a finding of a “willful or knowing” violation. There is no statutory cap on maximum aggregate exposure (although some courts have applied in TCPA class actions constitutional limits on excessive penalties). An action may be brought by the FCC, a state attorney general, an individual, or a class of individuals. As with the TCPA, Florida’s mini-TCPA restricts certain calls and calls and texts made using an automated system to Florida residents without prior consent, allows a plaintiff to obtain $500 for each call or text made in violation of its prohibitions, and permits a court to treble the $500 amount for willful or knowing violations of the statute. Like other companies that rely on telephone and text communications, we may be subject to putative class action suits alleging violations of the TCPA, Florida mini-TCPA or other similar state laws. If in the future we are found to have violated the TCPA, the Florida mini-TCPA or another federal or state law regulating telemarketing, the amount of damages and potential liability could be extensive and adversely impact our business. Accordingly, were such a class certified or if we are unable to successfully defend such a suit, then the damages could have a material adverse effect on our results of operations and financial condition.
Changes in consumer finance and other applicable laws and regulations, as well as changes in government enforcement policies and priorities, may negatively impact the management of our business, results of operations, ability to offer certain products or the terms and conditions upon which they are offered, and ability to compete.
Consumer finance regulation is constantly changing, and new laws or regulations, or new interpretations of existing laws or regulations, could have a materially adverse impact on our ability to operate as currently intended, and cause us to incur significant expense in order to ensure compliance. Federal and state financial services regulators are also enforcing existing laws, regulations, and rules aggressively and enhancing their supervisory expectations regarding the management of legal and regulatory compliance risks. These regulatory changes and uncertainties make our business planning more difficult and could result in changes to our business model and potentially adversely impact our results of operations. As to the parts of our business that operate as a non-bank lender, we are subject to state licensing and usury laws. Furthermore, to the extent applicable, these laws can impose specific statutory liabilities upon creditors who fail to comply with their provisions and may affect the enforceability of a loan. If the application of consumer protection laws were to cause our loans, or any of the terms of our loans, to be unenforceable against the relevant borrowers, our business will be materially adversely affected. Even if we seek to comply with licensing and other requirements that we believe may be applicable to us, if we are found to not have complied with applicable laws, we could lose one or more of our licenses or authorizations or face other sanctions or penalties or be required to obtain a license in one or more such jurisdictions, which may have an adverse effect on our business.
Proposals to change the statutes affecting financial services companies are frequently introduced in Congress and state legislatures that, if enacted, may affect their operating environment in substantial and unpredictable ways. In addition, numerous federal and state regulators have the authority to promulgate or change regulations that could have a similar effect on our operating environment. We cannot determine with any degree of certainty whether any such legislative or regulatory proposals will be enacted and, if enacted, the ultimate impact that any such potential legislation or implementing regulations, or any such potential regulatory actions by federal or state regulators, would have upon our business.
New laws, regulations, policy or changes in enforcement of existing laws or regulations applicable to our business, or reexamination of current practices, could adversely impact our profitability, limit our ability to continue existing or pursue new business activities, require us to change certain of our business practices, affect retention of key personnel, or expose us to additional costs (including increased compliance costs and/or customer remediation). These changes also may require us to invest significant resources, and devote significant management attention, to make any necessary changes and could adversely affect our business.
We are subject to the risk that regulatory or enforcement agencies and/or consumer advocacy groups may assert that our business practices may violate certain rules, laws and regulations, including anti-discrimination statutes.
Anti-discrimination statutes, such as the Fair Housing Act and the Equal Credit Opportunity Act and state law equivalents, prohibit creditors from discriminating against loan applicants and borrowers based on certain characteristics, such as race, religion and national origin. Various federal regulatory and enforcement departments and agencies, including the Department of Justice and CFPB, take the position that these laws apply not only to intentional discrimination, but also to facially neutral practices that have a disparate impact on a group that shares a characteristic that a creditor may not consider in making credit decisions. State and federal regulators, as well as consumer advocacy groups and plaintiffs’ attorneys, are
focusing greater attention on “disparate impact” claims. Similarly, these regulatory agencies and litigants could take the position that the geographical footprint within which we conduct lending activity or the manner in which we advertise loans, disproportionately excludes potential borrowers belonging to a protected class, and constitutes unlawful “redlining”. In addition to reputational harm, violations of the Equal Credit Opportunity Act and the Fair Housing Act can result in actual damages, punitive damages, injunctive or equitable relief, attorneys’ fees and civil money penalties.
Our Financial Services segment is subject to the regulatory framework applicable to investment managers and broker-dealers, including regulation by the SEC and FINRA.
We offer investment management services through SoFi Wealth LLC, an internet based investment adviser and SoFi Capital Advisors, LLC, which sponsors private investment funds that invest in asset-backed securitizations. Both SoFi Wealth LLC and SoFi Capital Advisors LLC are registered as investment advisers under the Investment Advisers Act of 1940, as amended (the “Advisers Act”), and are subject to regulation by the SEC. SoFi Securities is an affiliated registered broker-dealer and FINRA member. We offer cash management accounts, which are brokerage products, through SoFi Securities.
The investment advisers are subject to the anti-fraud provisions of the Advisers Act and to fiduciary duties derived from these provisions, which apply to our relationships with our members who are advisory clients, as well as the funds we manage. These provisions and duties impose restrictions and obligations on us with respect to our dealings with our members, fund investors and our investments, including for example restrictions on transactions with our affiliates. Our investment advisers have in the past and will in the future be subject to periodic SEC examinations. Our investment advisers are also subject to other requirements under the Advisers Act and related regulations. These additional requirements relate to matters including maintaining effective and comprehensive compliance programs, record-keeping and reporting and disclosure requirements. The Advisers Act generally grants the SEC broad administrative powers, including the power to limit or restrict an investment adviser from conducting advisory activities in the event it fails to comply with federal securities laws. Additional sanctions that may be imposed for failure to comply with applicable requirements include the prohibition of individuals from associating with an investment adviser, the revocation of registrations and other censures and fines. Even if an investigation or proceeding did not result in a sanction or the sanction imposed against us or our personnel by a regulator were small in monetary amount, the adverse publicity relating to the investigation, proceeding or imposition of these sanctions could harm our reputation and cause us to lose existing members or fail to gain new members. See Part I, Item 3 “Legal Proceedings”.
Our subsidiary, SoFi Securities, is an affiliated registered broker-dealer and FINRA member. The securities industry is highly regulated, including under federal, state and other applicable laws, rules, and regulations, and we may be adversely affected by regulatory changes related to suitability of financial products, supervision, sales practices, advertising, application of fiduciary standards, best execution, and market structure, any of which could limit our business and damage our reputation. FINRA has adopted extensive regulatory requirements relating to sales practices, advertising, registration of personnel, compliance and supervision, and compensation and disclosure, to which SoFi Securities and its personnel are subject. FINRA and the SEC also have the authority to conduct periodic examinations of SoFi Securities, and may also conduct administrative proceedings. Additionally, material expansions of the business in which SoFi Securities engages are subject to approval by FINRA. This could delay, or even prevent, the firm’s ability to expand its securities and brokerage offerings in the future.
From time to time, SoFi Securities and SoFi Wealth may be threatened with or named as a defendant in lawsuits, arbitrations and administrative claims. The firm is also subject to periodic regulatory examinations and inspections by regulators (including the SEC and FINRA). Compliance and trading problems or other deficiencies or weakness that are reported to regulators, such as the SEC and FINRA, by dissatisfied customers or others, or that are identified by regulators themselves are investigated by such regulators, and may, if pursued, result in formal claims being filed against SoFi Securities and SoFi Wealth by customers or disciplinary action being taken by regulators against the firm or its employees. Our failure to comply with applicable laws or regulations or our own policies and procedures could result in fines, litigation, suspensions of personnel or other sanctions, which could have a material effect on our overall financial results. For example, in August 2021, we settled charges with the SEC against SoFi Wealth for allegedly breaching its fiduciary duties to clients in connection with the investment of client assets in two ETFs sponsored by Social Finance by agreeing to a cease-and-desist order, a censure, a penalty of $300 thousand, and to perform certain undertakings. Even if a sanction imposed against us or our personnel is small in monetary amount, the adverse publicity arising from the imposition of sanctions against us by regulators could harm our reputation and our brand and lead to material legal, regulatory and financial exposure (including fines and other penalties), cause us to lose existing members or fail to gain new members. In addition, in the normal course of business, SoFi Securities and SoFi Wealth discuss matters raised by its regulators during regulatory examinations or otherwise upon their inquiry. These matters could result in censures, fines, penalties or other sanctions.
Evolving laws and government regulations could adversely affect our Financial Services segment.
Governmental regulation of global financial markets and financial institutions is pervasive and continually evolving. This includes regulation of investment managers and activities, through the implementation of compliance, risk management and anti-money laundering procedures; restrictions on specific types of investments and the provision and use of leverage; capital requirements; limitations on compensation to managers; books and records, reporting and disclosure requirements; and new or increased regulation of the payments industry such as caps on interchange reimbursement fees and increased scrutiny of routing practices. The effects on us of future regulation, or of changes in the interpretation and enforcement of existing regulation, could have an adverse effect on our investment strategies or our business model. Policy changes and regulatory reform by the U.S. federal government may create regulatory uncertainty for our members’ portfolios and our investment strategies and adversely affect our profitability.
Our business and reputation may be harmed by changes in business, economic or political conditions that impact global financial markets or by a systemic market event.
As a financial services company, our business, results of operations and reputation are directly affected by elements beyond our control, such as economic and political conditions, changes in the volatility in financial markets (including volatility as a result of the COVID-19 pandemic), significant increases in the volatility or trading volume of particular securities, broad trends in business and finance, changes in the volume of securities trading generally, changes in the markets in which such transactions occur and changes in how such transactions are processed. These elements can arise suddenly and the full impact of such conditions can remain uncertain. A prolonged weakness in equity markets, such as a slowdown causing reduction in trading volume in securities, derivatives or digital assets markets, may result in reduced revenues and would have an adverse effect on our business, financial condition and results of operations. Significant downturns in the securities markets or in general economic and political conditions may also cause individuals to be reluctant to make their own investment decisions and thus decrease the demand for our products and services and could also result in our customers reducing their engagement with our platform. Conversely, significant upturns in the securities markets or in general economic and political conditions may cause individuals to be less proactive in seeking ways to improve the returns on their trading or investment decisions and, thus, decrease the demand for our products and services. Any of these changes could cause our future performance to be uncertain or unpredictable, and could have an adverse effect on our business, financial condition and results of operations.
In addition, a prolonged weakness in the U.S. equity markets or a general economic downturn could cause our customers to incur losses, which in turn could cause our brand and reputation to suffer. If our reputation is harmed, the willingness of our existing customers, and potential new customers, to do business with us could be negatively impacted, which would adversely affect our business, financial condition and results of operations.
The regulatory regime governing blockchain technologies and digital assets is uncertain, and new regulations or policies may alter our business practices with respect to digital assets.
We currently offer virtual currency and digital asset-related trading services through a subsidiary that is licensed and registered with various governmental authorities as a money service business, money transmitter, virtual currency business or the equivalent. Although many regulators have provided some guidance, regulation of digital assets based on or incorporating blockchain, such as digital assets and digital asset exchanges, remains uncertain and will continue to evolve. Further, regulation varies significantly among international, federal, state and local jurisdictions. As blockchain networks and blockchain assets have grown in popularity and in market size, federal and state agencies are increasingly taking interest in, and in certain cases regulating, their use and operation. For example, SoFi Bank’s activities with respect to digital assets may be restricted. The conditional approval of the bank charter by the OCC was conditioned on SoFi Bank not engaging in any crypto-related activities or services unless it has received a prior written determination of no supervisory objection from the OCC. In addition, in connection with our approval as a bank holding company, the Federal Reserve determined that certain activities of SoFi Digital Assets, LLC in providing members with the ability to buy or sell various digital currencies through SoFi Digital Assets, LLC's omnibus account with a third-party custodian is not a permissible activity under the Bank Holding Company Act and Regulation Y. However, under Section 4 of the Bank Holding Company Act, the Federal Reserve has permitted us to continue our current digital assets related offering for a two-year conformance period from the date we became a bank holding company, with the possibility for three one-year extensions, provided that we do not expand our impermissible activities, except as authorized by the Bank Holding Company Act and Regulation Y, or increase our established risk limits for total customer digital assets maintained in wallets that are accessible online, referred to as “hot wallets”, or held on balance sheet. Treatment of virtual currencies continues to evolve under federal and state law. Many U.S. regulators, including the SEC, the Financial Crimes Enforcement Network (“FinCEN”), the Commodity Futures Trading Commission, (the “CFTC”), the Internal Revenue Service (the “IRS”), and state regulators including the New York State Department of Financial Services (the “NYSDFS”), have made official pronouncements or issued guidance or rules regarding the treatment of Bitcoin and other digital currencies.
The IRS released guidance treating virtual currency as property that is not currency for U.S. federal income tax purposes, although there is no indication yet whether other courts or federal or state regulators will follow this classification. Both federal and state agencies have instituted enforcement actions against those violating their interpretation of existing laws. Other U.S. and many state agencies have offered little official guidance and issued no definitive rules regarding the treatment of digital assets. The CFTC has publicly taken the position that certain virtual currencies, which term includes digital assets, are commodities. To the extent that Bitcoin is deemed to fall within the definition of a “commodity interest” under the Commodity Exchange Act (the “CEA”), we may be subject to additional regulation under the CEA and CFTC regulations.
As blockchain technologies and digital assets business activities grow in popularity and market size, and as new digital assets businesses and technologies emerge and proliferate, foreign, federal, state and local regulators revisit and update their laws and policies, and can be expected to continue to do so in the future. Changes in this regulatory environment, including changing interpretations and the implementation of new or varying regulatory requirements by the government, may significantly affect or change the manner in which we currently conduct some aspects of our business.
States may require licenses that apply to blockchain technologies and digital assets.
In the case of virtual currencies, state regulators such as the NYSDFS have created regulatory frameworks. For example, in July 2014, the NYSDFS proposed the first U.S. regulatory framework for licensing participants in virtual currency business activity. The regulations, known as the “BitLicense”, are intended to focus on consumer protection. The NYSDFS issued its final BitLicense regulatory framework in June 2015. The BitLicense regulates the conduct of businesses that are involved in virtual currencies in New York or with New York customers and prohibits any person or entity involved in such activity from conducting such activities without a license. SoFi Digital Assets, LLC currently holds a BitLicense.
Other states may adopt similar statutes and regulations which will require us to obtain a license to conduct digital asset activities. In July 2020, Louisiana adopted the Virtual Currency Business Act, which requires operators of virtual currency businesses to obtain a virtual currency license in order to conduct business in Louisiana, and in December 2021, the Louisiana Office of Financial Institutions issued guidance establishing how it will license and regulate virtual currency businesses under the act. Other states, such as Florida and Texas, have published guidance on how their existing regulatory regimes governing money transmitters apply to virtual currencies. Some states, such as New Hampshire, North Carolina and Washington, have amended their state’s statutes to include virtual currencies into existing licensing regimes, while others have interpreted their existing statutes as requiring a money transmitter license to conduct certain virtual currency business activities. SoFi Digital Assets, LLC is licensed as a money transmitter or the equivalent in a majority of states and the District of Columbia, but may be required to obtain additional licenses in light of evolving regulation of virtual currency businesses.
It is likely that, as blockchain technologies and the use of virtual currencies continues to grow, additional states will take steps to monitor the developing industry and perhaps require us to obtain additional licenses in connection with our virtual currency activity.
There are financial and third party risks associated with using a custodian to store cryptocurrency offerings.
Cryptocurrency is a new and emerging asset class and there are financial and third party risks related to our digital assets offerings, such as inappropriate access to or theft or destruction of digital assets held by our custodian, insufficient insurance coverage by the custodian to reimburse us for all such losses, the custodian’s failure to maintain effective controls over the custody and settlement services provided to us, the custodian’s inability to purchase or liquidate digital assets holdings, and defaults on financial or performance obligations by counterparty financial institutions. The realization of any one or combination of these risks could materially and adversely affect our financial performance and significantly harm our business.
Failure to comply with anti-money laundering, economic and trade sanctions regulations, and similar laws could subject us to penalties and other adverse consequences.
Various laws and regulations in the United States and abroad, such as the Bank Secrecy Act, the Dodd-Frank Act, the USA PATRIOT Act, and the Credit Card Accountability Responsibility and Disclosure Act, impose certain anti-money laundering requirements on companies that are financial institutions or that provide financial products and services. Under these laws and regulations, financial institutions are broadly defined to include money services businesses such as money transmitters. In 2013, FinCEN issued guidance regarding the applicability of the Bank Secrecy Act to administrators and exchangers of convertible virtual currency, clarifying that they are money service businesses, and more specifically, money transmitters. The Bank Secrecy Act requires money services businesses (“MSBs”) to develop and implement risk-based anti-money laundering programs, report large cash transactions and suspicious activity, and maintain transaction records, among other requirements. State regulators may impose similar requirements on licensed money transmitters. In addition, our contracts with financial institution partners and other third parties may contractually require us to maintain an anti-money laundering
program. Our subsidiary, SoFi Digital Assets, LLC, is registered with FinCEN as an MSB. Registration as an MSB subjects us to the regulatory and supervisory jurisdiction of FinCEN and the IRS, the anti-money laundering provisions of the BSA and its implementing regulations applicable to MSBs.
We are also subject to economic and trade sanctions programs administered by OFAC, which prohibit or restrict transactions to or from or dealings with specified countries, their governments, and in certain circumstances, their nationals, and with individuals and entities that are specially-designated nationals of those countries, narcotics traffickers, terrorists or terrorist organizations, and other sanctioned persons and entities.
Our failure to comply with anti-money laundering, economic and trade sanctions regulations, and similar laws could subject us to substantial civil and criminal penalties, or result in the loss or restriction of our MSB or broker-dealer registrations and state licenses, or liability under our contracts with third parties, which may significantly affect our ability to conduct some aspects of our business. Changes in this regulatory environment, including changing interpretations and the implementation of new or varying regulatory requirements by the government, may significantly affect or change the manner in which we currently conduct some aspects of our business.
We are subject to anti-corruption, anti-bribery and similar laws, and non-compliance with such laws can subject us to significant adverse consequences, including criminal or civil liability and harm our business.
We are subject to the Foreign Corrupt Practices Act, U.S. domestic bribery laws and other U.S. and foreign anti-corruption laws. Anti-corruption and anti-bribery laws have been enforced aggressively in recent years and are interpreted broadly to generally prohibit companies, their employees and their third-party intermediaries from authorizing, offering or providing, directly or indirectly, improper payments or benefits to recipients in the public sector. These laws also require that we keep accurate books and records and maintain internal controls and compliance procedures designed to prevent any such actions. Although our operations are currently concentrated in the United States, as we increase our international cross-border business and expand operations abroad, we have engaged and may further engage with business partners and third-party intermediaries to market our services and to obtain necessary permits, licenses and other regulatory approvals. In addition, we or our third-party intermediaries may have direct or indirect interactions with officials and employees of government agencies or state-owned or affiliated entities. We can be held liable for the corrupt or other illegal activities of these third-party intermediaries, our employees, representatives, contractors, partners, and agents, even if we do not explicitly authorize such activities. The failure to comply with any such laws could subject us to criminal or civil liability, cause us significant reputational harm and have an adverse effect on our business, financial condition and results of operations.
We conduct our brokerage and other business operations through subsidiaries and may in the future rely on dividends from our subsidiaries for a substantial amount of our cash flows.
We may in the future depend on dividends, distributions and other payments from our subsidiaries to fund payments on our obligations, including any debt obligations we may incur. Regulatory and other legal restrictions may limit our ability to transfer funds to or from certain subsidiaries, including SoFi Securities and SoFi Bank. In addition, certain of our subsidiaries are subject to laws and regulations that authorize regulatory bodies to block or reduce the flow of funds to us, or that prohibit such transfers altogether in certain circumstances. These laws and regulations may hinder our ability to access funds that we may need to make payments on our obligations, including any debt obligations we may incur and otherwise conduct our business by, among other things, reducing our liquidity in the form of corporate cash. In addition to negatively affecting our business, a significant decrease in our liquidity could also reduce investor confidence in us. Certain rules and regulations of the SEC and FINRA may limit the extent to which our broker-dealer subsidiaries may distribute capital to us. For example, under FINRA rules applicable to SoFi Securities, a dividend in excess of 10% of a member firm’s excess net capital may not be paid without FINRA’s prior written approval. Compliance with these rules may impede our ability to receive dividends, distributions and other payments from SoFi Securities.
We have in the past, continue to be, and may in the future be subject to inquiries, exams, pending investigations, or enforcement matters.
The financial services industry is subject to extensive regulation under federal, state, and applicable international laws. From time to time, we have been threatened with or named as a defendant in lawsuits, arbitrations and administrative claims involving securities, consumer financial services and other matters. We are also subject to periodic regulatory examinations and inspections. Compliance and trading problems or other deficiencies or weaknesses that are reported to regulators, such as the SEC, FINRA, the CFPB, or state regulators, by dissatisfied customers or others, or that are identified by regulators themselves, are investigated by such regulators, and may, if pursued, result in formal claims being filed against us by customers or disciplinary action being taken against us or our employees by regulators or enforcement agencies. To resolve issues raised in examinations or other governmental actions, we may be required to take various corrective actions, including changing certain
business practices, making refunds or taking other actions that could be financially or competitively detrimental to us. We expect to continue to incur costs to comply with governmental regulations. Any such claims or disciplinary actions that are decided against us could have a material impact on our financial results.
Recent statements by lawmakers, regulators and other public officials have signaled an increased focus on new or additional regulations that could impact our business and require us to make significant changes to our business model and practices, and could result in significant costs to our business or loss of current revenue streams.
Various lawmakers, regulators and other public officials have recently made statements about our business practices in which we and other broker-dealers engage, including SoFi Securities, and signaled an increased focus on new or additional laws or regulations that, if acted upon, could impact our business. On October 5, 2021, for example, SEC Chair Gary Gensler, speaking before the U.S. House of Representatives Committee on Financial Services, reiterated his view that payment for order flow and exchange rebates may present a number of conflicts of interest. This follows the Spring 2021 House Committee on Financial Services hearings on the events surrounding the January 2021 market volatility and disruptions surrounding GameStop and other “meme” stocks at which various members of Congress expressed their concerns about various market practices, including payment for order flow (“PFOF”) and options trading. Gary Gensler previously instructed the staff of the SEC to study, and in some cases make rulemaking recommendations to the SEC regarding, a variety of market issues and practices, including PFOF, so-called gamification, and whether broker-dealers are adequately disclosing their policies and procedures around potential trading restrictions; whether margin requirements and other payment requirements are sufficient; and whether broker-dealers have appropriate tools to manage their liquidity and risk. On October 14, 2021, the SEC issued the “Staff Report on Equity and Options Market Structure Conditions in Early 2021.” In its report, the SEC concluded that “consideration should be given to whether game-like features and celebratory animations that are likely intended to create positive feedback from trading lead investors to trade more than they would otherwise,” and that “payment for order flow and the incentives it creates may cause broker-dealers to find novel ways to increase customer trading, including through the use of digital engagement practices.” In addition, on August 27, 2021, the SEC issued a request for information and comments on broker-dealer and investment adviser digital engagement practices (“DEPs”), related tools and methods, regulatory considerations, and potential approaches. In its request, the SEC noted that certain competition practices, such as PFOF, in combination with zero commissions, create incentives for firms to use DEPs to encourage frequent trading, and that these incentives may not be transparent to retail investors. The SEC noted that DEPs can potentially harm retail investors if they prompt them to engage in trading activities that may not be consistent with their investment goals or risk tolerance. Previously, on May 6, 2021, in testimony to the House Committee on Financial Services, Chair Gensler also discussed the use of mobile app features such as rewards, bonuses, push notifications and other prompts. Chair Gensler suggested that such prompts could promote behavior that is not in the interest of the customer, such as excessive trading and advised that he had directed the SEC staff to consider whether expanded enforcement mechanisms are necessary. Additionally, on June 9, 2021, Chair Gensler remarked at a public conference that he had instructed the SEC staff to make recommendations for the SEC’s consideration on best execution, Regulation National Market System, PFOF (both on-exchange and off-exchange), minimum pricing increments and the National Best Bid and Offer. The regulatory agenda published by the SEC on October 4, 2021, identified that the SEC would be considering proposing rules in the next year to modernize equity market structure, including possible new rules on PFOF, best execution (amendments to Rule 605), market concentration and certain other practices. A previous agenda also indicated that the SEC might be considering potential rules related to gamification, behavioral prompts, predictive analytics and differential marketing (although it is unclear if this will materialize).
In addition, on March 18, 2021, FINRA issued a regulatory notice reminding member firms of their obligations with respect to maintaining margin requirements, customer order handling and effectively managing liquidity, with a particular focus on best execution practices and the need for member firms to make “meaningful disclosures” to inform customers of a firm’s order handling procedures during extreme market conditions. Further, at a public conference on May 19, 2021, FINRA indicated an intention to solicit public feedback, such as through notices or surveys, regarding so-called gamification in order to determine whether to adopt additional guidance or additional rules in that regard. Also, on June 23, 2021, FINRA issued a regulatory notice reminding member firms of the requirement that customer order flow be directed to markets providing the “most beneficial terms for their customers” and indicated that member firms may not negotiate the terms of order routing arrangements in a manner that reduces price improvement opportunities that would otherwise be available to those customers in the absence of PFOF.
To the extent that the SEC, FINRA or other regulatory authorities or legislative bodies adopt additional regulations or legislation in respect of any of these areas or relating to any other aspect of our business, we could face a heightened risk of potential regulatory violations and could be required to make significant changes to our business model and practices, which changes may not be successful. Any of these outcomes could have an adverse effect on our business, financial condition and results of operations. For more information about the potential impact of legal and regulatory changes, see “We are subject to
extensive, complex and evolving laws and regulations, which are interpreted and enforced by various federal, state, and local government authorities”.
Regulations relating to privacy, information security and data protection could increase our costs, affect or limit how we collect and use personal information, and adversely affect our business opportunities.
We are subject to various privacy, information security and data protection laws, including requirements concerning security breach notification, and we could be negatively impacted by them. For example, we are subject to the Gramm-Leach-Bliley Act (“GLBA”) and implementing regulations and guidance. Among other things, the GLBA (i) imposes certain limitations on the ability to share consumers’ nonpublic personal information with nonaffiliated third parties and (ii) requires certain disclosures to consumers about their information collection, sharing and security practices and their right to “opt out” of the institution’s disclosure of their personal financial information to nonaffiliated third parties (with certain exceptions). The GLBA and other state laws also require that we implement and maintain certain security measures, policies and procedures to protect personal information.
Furthermore, legislators and/or regulators are increasingly adopting new and/or amending existing privacy, information security and data protection laws that potentially could have a significant impact on our current and planned privacy, data protection and information security-related practices; our policies and practices related to the collection, use, sharing, retention and safeguarding of consumer and/or employee information; and some of our current or planned business activities. New requirements, originating from new or amended laws, could also increase our costs of compliance and business operations and could reduce income from certain business initiatives.
Compliance with current or future privacy, information security and data protection laws (including those regarding security breach notification) affecting customer and/or employee data to which we are subject could result in higher compliance and technology costs and could restrict our ability to provide certain products and services (such as products or services that involve sharing information with third parties or storing sensitive credit card information), which could materially and adversely affect our profitability. Additionally, there is always a danger that regulators can attempt to assert authority over our business in the area of privacy, information security and data protection. In addition, if our vendors and/or service providers are or become subject to laws and regulations in the jurisdictions that have enacted more stringent and expansive legislation applicable to privacy, information and/or data protection, the costs that these vendors and service providers must incur in becoming compliant may be passed along to us, resulting in increasing costs on our business.
Privacy requirements, including notice and opt-out requirements, under the GLBA and the FCRA are enforced by the Federal Trade Commission and by the CFPB through UDAAP and are a standard component of CFPB examinations. State entities also may initiate actions for alleged violations of privacy or security requirements under state law. Our failure to comply with privacy, information security and data protection laws could result in potentially significant regulatory investigations and government actions, litigation, fines or sanctions, consumer or merchant actions and damage to our reputation and brand, all of which could have a material adverse effect on our business.
Should we undertake an international expansion of our business, particularly if we commence doing business in one or more countries of the European Union (the “EU”) or the United Kingdom (the “UK”), we will be required to comply with stringent privacy and data protection laws. Within the EU, legislators have adopted the General Data Protection Regulation (the “GDPR”), which became effective in May 2018. Should we commence doing business in Europe, the GDPR will impose additional obligations and risk upon our business, which may increase substantially the penalties to which we could be subject in the event of any non-compliance. We may incur substantial expense in complying with obligations imposed by the GDPR and we may be required to make significant changes in our business operations, all of which may adversely affect our revenues and our business overall.
In addition, further to the UK’s exit from the EU on January 31, 2020, the GDPR ceased to apply in the UK at the end of the transition period on December 31, 2020. However, as of January 1, 2021, the UK’s European Union (Withdrawal) Act 2018 incorporated the GDPR (as it existed on December 31, 2020 but subject to certain UK specific amendments) into UK law, referred to as the “UK GDPR”. The UK GDPR and the UK Data Protection Act 2018 set out the UK’s data protection regime, which is independent from but aligned to the EU’s data protection regime. Non-compliance with the UK GDPR may result in monetary penalties of up to £17.5 million or 4% of worldwide revenue, whichever is higher. Although the UK is regarded as a third country under the EU’s GDPR, the European Commission (“EC”) has now issued a decision recognizing the UK as providing adequate protection under the EU GDPR and, therefore, transfers of personal data originating in the EU to the UK remain unrestricted. Like the EU GDPR, the UK GDPR restricts personal data transfers outside the UK to countries not regarded by the UK as providing adequate protection. The UK government has confirmed that personal data transfers from the UK to the EEA remain free flowing.
If we do business in the United Kingdom, we will have to comply with both the GDPR and separately the GDPR as implemented in the United Kingdom, each regime having the ability to fine up to the greater of €20 million/£17 million or 4% of global turnover.
In addition, around the world many jurisdictions outside of Europe are also considering and/or have enacted comprehensive data protection legislation. For example, we are subject to stringent privacy and data protection requirements in Hong Kong. Also, many jurisdictions outside of Europe where we may seek to expand our business in the future are also considering and/or have enacted comprehensive data protection legislation. Additional jurisdictions with stringent data protection laws include Brazil and China. We also continue to see jurisdictions, such as Russia, imposing data localization laws, which under Russian laws require personal information of Russian citizens to be, among other data processing operations, initially collected, stored, and modified in Russia. These regulations may interfere with our intended business activities, inhibit our ability to expand into those markets or prohibit us from continuing to offer services in those markets without significant additional costs.
The regulatory framework governing the collection, processing, storage, use and sharing of certain information, particularly financial and other personal information, is rapidly evolving and is likely to continue to be subject to uncertainty and varying interpretations. It is possible that these laws may be interpreted and applied in a manner that is inconsistent with laws in other jurisdictions or with our existing data management practices or the features of our services and platform capabilities. We therefore cannot yet fully determine the impact these or future laws, rules, regulations and industry standards may have on our business or operations. Any failure or perceived failure by us, or any third parties with which we do business, to comply with our posted privacy policies, changing consumer expectations, evolving laws, rules and regulations, industry standards, or contractual obligations to which we or such third parties are or may become subject, may result in actions or other claims against us by governmental entities or private actors, the expenditure of substantial costs, time and other resources or the imposition of significant fines, penalties or other liabilities. In addition, any such action, particularly to the extent we were found to be guilty of violations or otherwise liable for damages, would damage our reputation and adversely affect our business, financial condition and results of operations.
We cannot yet fully determine the impact these or future laws, rules, regulations and industry standards may have on our business or operations. Any such laws, rules, regulations and industry standards may be inconsistent among different jurisdictions, subject to differing interpretations or may conflict with our current or future practices. Additionally, our customers may be subject to differing privacy laws, rules and legislation, which may mean that they require us to be bound by varying contractual requirements applicable to certain other jurisdictions. Adherence to such contractual requirements may impact our collection, use, processing, storage, sharing and disclosure of various types of information including financial information and other personal information, and may mean we become bound by, or voluntarily comply with, self-regulatory or other industry standards relating to these matters that may further change as laws, rules and regulations evolve. Complying with these requirements and changing our policies and practices may be onerous and costly, and we may not be able to respond quickly or effectively to regulatory, legislative and other developments. These changes may in turn impair our ability to offer our existing or planned features, products and services and/or increase our cost of doing business. As we expand our customer base, these requirements may vary from customer to customer, further increasing the cost of compliance and doing business.
We publicly post documentation regarding our practices concerning the collection, processing, use and disclosure of data. Although we endeavor to comply with our published policies and documentation, we may at times fail to do so or be alleged to have failed to do so. Any failure or perceived failure by us to comply with our privacy policies or any applicable privacy, security or data protection, information security or consumer-protection related laws, regulations, orders or industry standards could expose us to costly litigation, significant awards, fines or judgments, civil and/or criminal penalties or negative publicity, and could materially and adversely affect our business, financial condition and results of operations. The publication of our privacy policy and other documentation that provide promises and assurances about privacy and security can subject us to potential state and federal action if they are found to be deceptive, unfair, or misrepresentative of our actual practices, which could, individually or in the aggregate, materially and adversely affect our business, financial condition and results of operations.
We may in the future be subject to federal or state regulatory inquiries regarding our business.
From time to time, in the normal course of business, we may receive or be subject to, inquiries or investigations by state and federal regulatory or enforcement agencies and bodies, such as the CFPB, SEC, the Federal Reserve, the OCC, the FDIC, the state attorneys general, state financial regulatory agencies, other state or federal agencies, and SROs like FINRA. We also may receive inquiries from state regulatory agencies regarding requirements to obtain licenses from or register with those states, including in states where we have determined that we are not required to obtain such a license or be registered with the state. Any such inquiries or investigations could involve substantial time and expense to analyze and respond to, could divert
management’s attention and other resources from running our business, and could lead to public enforcement actions or lawsuits and fines, penalties, injunctive relief, and the need to obtain additional licenses that we do not currently possess. Our involvement in any such matters, whether tangential or otherwise and even if the matters are ultimately determined in our favor, could also cause significant harm to our reputation, lead to additional investigations and enforcement actions from other agencies or litigants, and further divert management attention and resources from the operation of our business. As a result, the outcome of legal and regulatory actions arising out of any state or federal inquiries we receive could have a material adverse effect on our business, financial condition or results of operations. See Part I, Item 3 “Legal Proceedings”.
It may be difficult and costly to protect our intellectual property rights, and we may not be able to ensure their protection.
Our ability to lend to our members depends, in part, upon our proprietary technology. We may be unable to protect our proprietary technology effectively, which would allow competitors to duplicate our business processes and know-how, and adversely affect our ability to compete with them. A third party may attempt to reverse engineer or otherwise obtain and use our proprietary technology without our consent. The pursuit of a claim against a third party for infringement of our intellectual property could be costly, and there can be no guarantee that any such efforts would be successful.
In addition, our platform may infringe upon claims of third-party intellectual property, and we may face intellectual property challenges from such other parties. We may not be successful in defending against any such challenges or in obtaining licenses to avoid or resolve any intellectual property disputes. The costs of defending any such claims or litigation could be significant and, if we are unsuccessful, could result in a requirement that we pay significant damages or licensing fees, which would negatively impact our financial performance. If we cannot protect our proprietary technology from intellectual property challenges, our ability to maintain the our platform could be adversely affected.
Some aspects of our platform include open source software, and any failure to comply with the terms of one or more of these open source licenses could negatively affect our business.
We incorporate open source software into our proprietary platform and into other processes supporting our business. Such open source software may include software covered by licenses like the GNU General Public License and the Apache License or other open source licenses. The terms of various open source licenses have not been interpreted by U.S. courts, and there is a risk that such licenses could be construed in a manner that limits our use of the software, inhibits certain aspects of our platform and negatively affects our business operations.
Some open source licenses contain requirements that we make available source code for modifications or derivative works we create based upon the type of open source software we use. If portions of our proprietary platform are determined to be subject to an open source license, or if the license terms for the open source software that we incorporate change, we could be required to publicly release the affected portions of our source code, re-engineer all or a portion of our platform or change our business activities. In addition to risks related to license requirements, the use of open source software can lead to greater risks than the use of third-party commercial software, as open source licensors generally do not provide warranties or controls on the origin of the software. Many of the risks associated with the use of open source software cannot be eliminated and could adversely affect our business.
We rely on third parties to perform certain key functions, and their failure to perform those functions could adversely affect our business, financial condition and results of operations.
We rely on certain third-party computer systems or third-party service providers, including cloud technology providers such as Amazon Web Services, internet service providers, payment services providers, market and third-party data providers, regulatory services providers, clearing systems, market makers, exchange systems, banking systems, co-location facilities, communications facilities and other facilities to run our platform, facilitate trades by our customers and support or carry out certain regulatory obligations. In addition, external content providers provide us with financial information, market news, charts, option and stock quotes, digital assets quotes, research reports and other fundamental data that we provide to our customers. These providers and any of our other service providers are susceptible to operational, technological and security vulnerabilities, including security breaches, which may impact our business, and our ability to monitor our third-party service providers’ data security is limited. In addition, these third-party service providers may rely on subcontractors to provide services to us that face similar risks. Any interruption in these third-party services, or deterioration in the quality of their service or performance, could be disruptive to our business.
Any failure or security breaches by or of our third-party service providers or their subcontractors that result in an interruption in service, unauthorized access, misuse, loss or destruction of data or other similar occurrences could interrupt our business, cause us to incur losses, result in decreased customer satisfaction and increase customer attrition, subject us to customer complaints, significant fines, litigation, disputes, claims, regulatory investigations or other inquiries and harm our
reputation. Through contractual provisions and third-party risk management processes, we take steps to require that our providers, and their subcontractors, protect our data and information, including personal data. However, due to the size and complexity of our technology platform and services, the amount of data that we store and the number of customers, employees and third-party service providers with access to personal data, we, our third-party service providers and their subcontractors are potentially vulnerable to a variety of intentional and inadvertent cybersecurity breaches and other security-related incidents and threats, which could result in a material adverse effect on our business, financial condition and results of operation. Any contractual protections we may have from our third-party service providers may not be sufficient to adequately protect us against such consequences, and we may be unable to enforce any such contractual protections.
In addition, there is no assurance that our third-party service providers or their subcontractors will be able to continue to provide these services to meet our current needs in an efficient, cost-effective manner or that they will be able to adequately expand their services to meet our needs in the future. An interruption in or the cessation of service by our third-party service providers or their subcontractors, coupled with our possible inability to make alternative arrangements in a smooth, cost-effective and timely manner, could have adverse effects on our business, financial condition and results of operations.
Further, if there were deficiencies in the oversight and control of our third-party relationships, and if our regulators held us responsible for those deficiencies, it could have an adverse effect on our business, reputation and results of operations.
Litigation, regulatory actions and compliance issues could subject us to significant fines, penalties, judgments, remediation costs, negative publicity, changes to our business model, and requirements resulting in increased expenses.
Our business is subject to increased risks of litigation and regulatory actions as a result of a number of factors and from various sources, including as a result of the highly regulated nature of the financial services industry and the focus of state and federal enforcement agencies on the financial services industry.
From time to time, we are also involved in, or the subject of, reviews, requests for information, investigations and proceedings (both formal and informal) by state and federal governmental agencies and SROs, regarding our business activities and our qualifications to conduct our business in certain jurisdictions, which could subject us to significant fines, penalties, obligations to change our business practices and other requirements resulting in increased expenses and diminished earnings. Our involvement in any such matter also could cause significant harm to our reputation and divert management attention from the operation of our business, even if the matters are ultimately determined in our favor. Moreover, any settlement, or any consent order or adverse judgment in connection with any formal or informal proceeding or investigation by a government agency, may prompt litigation or additional investigations or proceedings as other litigants or other government agencies begin independent reviews of the same activities. See “Regulatory, Tax and Other Legal Risks — Our Lending segment is highly regulated, and if we fail to comply with federal and state consumer protection laws, rules, regulations and guidance, our business could be adversely affected” for a discussion of the FTC Consent Order and “Regulatory, Tax and Other Legal Risks — We are subject to state licensing and operational requirements that result in substantial compliance costs, and our business would be adversely affected if our licenses are impaired”.
In addition, a number of participants in the financial services industry have been the subject of: putative class action lawsuits; state attorney general actions and other state regulatory actions; federal regulatory enforcement actions, including actions relating to alleged unfair, deceptive or abusive acts or practices; violations of state licensing and lending laws, including state usury laws; actions alleging discrimination on the basis of race, ethnicity, gender or other prohibited bases; and allegations of noncompliance with various state and federal laws and regulations relating to originating and servicing consumer finance loans. For example, we are defendants in a putative class action in which it was alleged that we engaged in unlawful lending discrimination through policies and practices by making applicants who are conditional permanent residents or DACA holders ineligible for loans or eligible only with a co-signer who is United States citizen or lawful permanent resident. In January 2022, the parties advised the court that they had reached agreement on nearly all material terms of the settlement, were in the process of documenting the settlement and accompanying class action settlement notice and claim form, and that plaintiffs expected to file a motion for preliminary approval of the settlement on or before March 28, 2022. In addition, Galileo was a defendant in a putative class action in which various claims arising from an intermittent disruption in service experienced by certain holders of deposit accounts at one of Galileo’s clients, which prevented individuals from accessing or using account funds for a period of time. The parties entered into a class action settlement agreement to resolve the claims in the action. See Part I, Item 3. “Legal Proceedings” for further information about this action.
The current regulatory environment, increased regulatory compliance efforts and enhanced regulatory enforcement have resulted in significant operational and compliance costs and may prevent us from providing certain products and services. There is no assurance that these regulatory matters or other factors will not, in the future, affect how we conduct our business and, in turn, have a material adverse effect on our business. In particular, legal proceedings brought under state consumer protection statutes or under several of the various federal consumer financial services statutes may result in a separate fine for
each violation of the statute, which, particularly in the case of class action lawsuits, could result in damages substantially in excess of the amounts we earned from the underlying activities.
In addition, from time to time, through our operational and compliance controls, we identify compliance and other issues that require us to make operational changes and, depending on the nature of the issue, result in financial remediation to impacted members. These self-identified issues and voluntary remediation payments could be significant, depending on the issue and the number of members impacted, and also could generate litigation or regulatory investigations that subject us to additional risk. See Part I, Item 3 “Legal Proceedings”.
Changes in tax law and differences in interpretation of tax laws and regulations may adversely impact our financial statements.
We operate in multiple jurisdictions and are subject to tax laws and regulations of the U.S. federal, state and local and non-U.S. governments. U.S. federal, state and local and non-U.S. tax laws and regulations are complex and subject to varying interpretations. U.S. federal, state and local and non-U.S. tax authorities may interpret tax laws and regulations differently than we do and challenge tax positions that we have taken. This may result in differences in the treatment of revenues, deductions, credits and/or differences in the timing of these items. The differences in treatment may result in payment of additional taxes, interest or penalties that could have an adverse effect on our financial condition and results of operations. Further, future changes to U.S. federal, state and local and non-U.S. tax laws and regulations could increase our tax obligations in jurisdictions where we do business or require us to change the manner in which we conduct some aspects of our business.
We will be adversely affected if we are, or any of our subsidiaries is, determined to have been subject to registration as an investment company under the Investment Company Act.
We are currently not deemed an “investment company” subject to regulation under the Investment Company Act of 1940, as amended (the “Investment Company Act”). No opinion or no-action position has been requested of the SEC on our status as an Investment Company. There is no guarantee we will continue to be exempt from registration under the Investment Company Act and were we to be deemed to be an investment company under the Investment Company Act, and thus subject to regulation under the Investment Company Act, the increased reporting and operating requirements could have an adverse impact on our business, operating results, financial condition and prospects.
In addition, if the SEC or a court of competent jurisdiction were to find that we are in violation of the Investment Company Act for having failed to register as an investment company thereunder, possible consequences include, but are not limited to, the following: (i) the SEC could apply to a district court to enjoin the violation; (ii) we could be sued by investors in us and in our securities for damages caused by the violation; and (iii) any contract to which we are a party that is made in, or whose performance involves a, violation of the Investment Company Act would be unenforceable by any party to the contract unless a court were to find that under the circumstances enforcement would produce a more equitable result than nonenforcement and would not be inconsistent with the purposes of the Investment Company Act. Should we be subjected to any or all of the foregoing, our business would be materially and adversely affected.
Personnel and Business Continuity Risks
We rely on our management team and will require additional key personnel to grow our business, and •the loss of key management members or key employees, or an inability to hire key personnel, could harm our business.
We believe our success has depended, and continues to depend, on the efforts and talents of our senior management, who have significant experience in the financial services and technology industries, are responsible for our core competencies and would be difficult to replace. Our future success depends on our continuing ability to attract, develop, motivate and retain highly qualified and skilled employees. Qualified individuals are in high demand, and we may incur significant costs to attract and retain them. In addition, the loss of any of our senior management or key employees could materially adversely affect our ability to execute our business plan and strategy, and we may not be able to find adequate replacements on a timely basis, or at all. Furthermore, many candidates evaluate year over year stock growth trends for a sense of the potential long-term value of their proposed stock awards, or have recently begun to discount the value of growth stocks on the whole. The volatility of the market price of our common stock could harm ability to attract and retain talent. Our executive officers and other employees are at-will employees, which means they may terminate their employment relationship with us at any time, and their knowledge of our business and industry would be extremely difficult to replace. We cannot ensure that we will be able to retain the services of any members of our senior management or other key employees. If we do not succeed in attracting well-qualified employees or retaining and motivating existing employees, our business could be materially and adversely affected.
The competitive job market creates a challenge and potential risk as we strive to attract and retain a highly skilled workforce.
Competition for our employees, including highly skilled technology and product professionals, is extremely intense reflecting a tight labor market. This can present a risk as we compete for experienced candidates, especially if the competition is able to offer more attractive financial terms of employment. This risk extends to our current employee population. We also invest significant time and expense in engaging and developing our employees, which also increases their value to other companies that may seek to recruit them. Turnover can result in significant replacement costs and lost productivity.
In addition, recent U.S. immigration policy has made it more difficult for qualified foreign nationals to obtain or maintain work visas under the H-1B classification. These H-1B visa limitations make it more difficult and/or more expensive for us to hire the skilled professionals we need to execute our growth strategy, especially engineering, data analytics and risk management personnel, and may adversely impact our business.
We transitioned to a flexible-first workforce model, which could subject us to increased business continuity and cyber risks as well as other operational challenges and risks that could significantly harm our business and operations.
In response to the COVID-19 pandemic, we transitioned to a flexible-first workforce model that not only puts the health and safety of our employees first, but also takes into account what our employees need to be successful. We now offer all of our employees the choice of working full time in the office, a hybrid approach, or full-time remote. Coming into the office remains 100% voluntary, unless a person’s role requires them to be on site to do their job. As a result, we expect to continue to be subject to the challenges and risks of having a remote workforce, as well as new challenges and risks from operating with a hybrid workforce. For example, our employees are accessing our servers remotely through home or other networks to perform their job responsibilities. Such security systems may be less secure than those used in our offices, which may subject us to increased security risks, including cybersecurity-related events, and expose us to risks of data or financial loss and associated disruptionsdue to our business operations. Additionally, employees who access company data and systems remotely may not have access to technology that is as robust as that in our offices, which could place additional pressure on our user infrastructure and third parties that are not easily mitigated. These risks include home internet availability affecting work continuity and efficiency, and additional dependencies on third-party communication tools, such as instant messaging and online meeting platforms. We may also be exposed to risks associated with the locations of remote employees, including compliance with local laws and regulations or exposure to compromised internet infrastructure. Allowing our employees to work remotely may create intellectual property risk if employees create intellectual property on our behalf while residing in a jurisdiction with unenforced or uncertain intellectual property laws. Further, if employees fail to inform us of changes in their work location, we may be exposed to additional risks without our knowledge.hybrid workforce;
While most of our operations can be performed remotely and have operated effectively during the pandemic, there is no guarantee that this will continue or that we will continue to be as effective while operating a flexible-first workforce model because our team is dispersed, many employees may have additional personal needs to attend to (such as looking after children as a result of school closures and mandated quarantines or a family member who becomes sick), and employees may become sick themselves and be unable to work. Additionally, operating our business with both remote and in-person workers, or workers who work in flexible locations and on flexible schedules, could have a negative impact on our corporate culture, decrease the ability of our workforce to collaborate and communicate effectively, decrease innovation and productivity, or negatively affect workforce morale. If we are unable to manage the cybersecurity and other risks of a flexible-first workforce model, and maintain our corporate culture and workforce morale, our business could be harmed or otherwise adversely impacted.
Our business is subject to the risks of •natural disasters, power outages, telecommunications failures, man-made problems and similar events, including COVID-19 and additional public health crises, and to interruptions by human-made problems such as terrorism, cyberattack, and other actions, which may impact the demand for our products or our members’ ability to repay their loans.
Events beyond our control may damage our ability to maintain our platform and provide services to our members. Such events include, but are not limited to, hurricanes, earthquakes, fires, floods and other natural disasters, public health crises, such as the ongoing COVID-19 pandemic or other infectious diseases, power outages, telecommunications failures and similar events. See “ —COVID-19 Pandemic Risks” for further discussion of risks related to the COVID-19 pandemic. Despite any precautions we may take, system interruptions and delays could occur if there is a natural disaster, if a third-party provider closes a facility we use without adequate notice for financial or other reasons, or if there are other unanticipated problems at our leased facilities. Because we rely heavily on our servers, computer and communications systems and the Internet to conduct our business and provide high-quality service to our members, disruptions could harm our ability to effectively run our business. Moreover, our members and customers face similar risks, which could directly or indirectly impact our business. For example, in October 2019, one of Galileo's customers experienced intermittent disruptions in service, which prevented its customers from
accessing or using their deposit accounts. Galileo was named as a defendant in a putative class action as a result of the disruption in service its customer experienced, captioned as Richards, et. al v. Chime Financial, Inc., Galileo Financial Technologies and The Bancorp, Inc., Civil Action No. 4:19-cv-6864-HSG (N.D. Cal.), filed in the United States District Court for the Northern District of California in October 2019, and entered into a class action settlement to resolve the claims. See Part I, Item 3 “Legal Proceedings” for further information about this matter. We currently use Amazon Web Services (“AWS”) and would be unable to switch instantly to another system in the event of failure to access AWS. This means that an outage of AWS could result in our system being unavailable for a significant period of time. Terrorism, cyberattacks and other criminal, tortious or unintentional actions could also give rise to significant disruptions to our operations. Our business interruption insurance may not be sufficient to compensate us for losses that may result from interruptions in our service as a result of system failures or other disruptions. Comparable natural and other risks may reduce demand for our products or cause our members to suffer significant losses and/or incur significant disruption in their respective operations, which may affect their ability to satisfy their obligations towards us. All of the foregoing could materially and adversely affect our business, results of operations and financial condition.
Employee misconduct, which can be difficult to detect and deter, could harm our reputation and subject us to significant legal liability.
We operate in an industry in which integrity and the confidence of our members is of critical importance. We are subject to risks of errors and misconduct by our employees that could adversely affect our business, including:
•engaging in misrepresentation or fraudulent activities when marketing or performing online brokerage and other services to our members;events;
•improperly using or disclosing confidential information of our members or other parties;employee misconduct;
•concealing unauthorized or unsuccessful activities; or
•otherwise not complying with applicable laws and regulations or our internal policies or procedures.
There have been numerous highly-publicized cases of fraud and other misconduct by financial services industry employees. The precautions that we take to detect and deter employee misconduct might not be effective. If any of our employees engage in illegal, improper, or suspicious activity or other misconduct, we could suffer serious harm to our reputation, financial condition, member relationships, and our ability to attract new members. We also could become subject to regulatory sanctions and significant legal liability, which could cause serious harm to our financial condition, reputation, member relationships and prospects of attracting additional members.
Risk Management and Financial Reporting Risks
If we fail•our ability to establish and maintain proper and effective internal control over financial reporting and risk management processes and procedures;
•adjustments to our abilitykey business metrics, including adjustments to produce accurate and timely financial statements could be impaired, investors may lose confidencethe total number of members or products in our financial reporting and the trading price of our common stock may decline.
Pursuant to Section 404 of the Sarbanes-Oxley Act,event a report by management on internal control over financial reporting, and an attestation of our independent registered public accounting firm will be required. The rules governing the standards that must be met for management to assess internal control over financial reporting are complex and require significant documentation, testing and possible remediation. Inmember is removed in accordance with the considerations pursuant to Section 215.02our terms of the SEC Division of Corporation Finance’s Regulation S-K Compliance & Disclosure Interpretations, beginning with our annual report on Form 10-K for the year ended December 31, 2022, we will be required, pursuant to Section 404 of the Sarbanes-Oxley Act, to furnish a report by management on, among other things, the effectiveness of our internal control over financial reporting for our annual reports on Form 10-K. This assessment will need to include disclosure of any material weaknesses identified by our management in our internal control over financial reporting. Our independent registered public accounting firm will also be required to attest to the effectiveness of our internal control over financial reporting in our annual reports on Form 10-K. We are required to disclose changes made in our internal controls and procedures on a quarterly basis. Failure to comply with the Sarbanes-Oxley Act could potentially subject us to sanctions or investigations by the SEC, the applicable stock exchange or other regulatory authorities,service which would require additional financial and management resources.
The internal control assessment required by Section 404 of Sarbanes-Oxley has diverted internal resources and we have and may experience higher operating expenses, higher independent auditor and consulting fees in the future. To comply with the Sarbanes-Oxley Act, the requirements of being a reporting company under the Exchange Act and any new or revised accounting rules in the future, as necessary, we are in the process of upgrading SoFi’s legacy information technology systems; implementing additional financial and management controls, reporting systems and procedures; and hiring additional accounting and finance staff. If we are unable to hire the additional accounting and finance staff necessary to comply with these
requirements, we may need to retain additional outside consultants. In addition, our current controls and any new controls that we develop may become inadequate because of poor design and changes in our business. For example, our continuing growth and expansion in globally dispersed markets, such as our anticipated acquisition of Technisys, may place significant additional pressure on our system of internal control over financial reporting, as acquisition targets may not be in compliance with the provisions of the Sarbanes-Oxley Act. We do not conduct a formal evaluation of companies’ internal control over financial reporting prior to an acquisition. We may be required to hire additional staff and incur substantial costs to implement the necessary new internal controls at companies we acquire. Any failure to implement and maintain effective internal controls over financial reporting could adversely affect the results of assessments by our independent registered public accounting firm and their attestation reports. If we or, if required, our independent registered public accounting firm, are unable to conclude that our internal control over financial reporting is effective, investors may lose confidence in its financial reporting, which could negatively impact the price of our securities.
On April 12, 2021, the Acting Director of the Division of Corporation Finance and Acting Chief Accountant of the SEC together issued a statement regarding the accounting and reporting considerations for warrants issued by special purpose acquisition companies entitled “Staff Statement on Accounting and Reporting Considerations for Warrants Issued by Special Purpose Acquisition Companies (“SPACs”)” (the “SEC Statement”). Specifically, the SEC Statement focused on certain settlement terms and provisions related to certain tender offers following a business combination, which terms are similar to those containedreflected in the warrant agreement governing the public warrants and private placement warrants issued initially by SCH. Following the issuance of the SEC statement, on April 22, 2021, SCH concluded that it was appropriate to restate its previously issued audited financial statements as of and for the period ended December 31, 2020, and as part of such process, SCH identified a material weakness in its internal control over financial reporting. As the accounting acquirer in the Business Combination, we inherited this material weakness and the warrants.current period;
As a result of the material weakness, the restatement, the change in accounting for the SoFi Technologies warrants, and other matters raised or that may in the future be raised by the SEC, we may face potential litigation or other disputes, which may include, among others, claims invoking the federal and state securities laws, contractual claims or other claims arising from the restatement and material weaknesses in our internal control over financial reporting and the preparation of our financial statements. As of the date of this Annual Report on Form 10-K, we have no knowledge of any such litigation or dispute. However, we can provide no assurance that such litigation or dispute will not arise in the future. Any such litigation or dispute, whether successful or not, could have a material adverse effect on our business, results of operations and financial condition.
We cannot assure you that there will not be additional material weaknesses in our internal control over financial reporting now or in the future. Any failure to maintain internal control over financial reporting could cause us to fail to timely detect errors and severely inhibit our ability to accurately report our financial condition, results of operations or cash flows. If we are unable to conclude that our internal control over financial reporting is effective, or if our independent registered public accounting firm determines that we have a material weakness in our internal control over financial reporting, investors may lose confidence in the accuracy and completeness of our financial reports, the market price of our common stock could decline, and we could be subject to sanctions or investigations by Nasdaq, the SEC or other regulatory authorities. Failure to remedy any material weakness in our internal control over financial reporting, or to implement or maintain other effective control systems required of public companies, could also restrict our future access to the capital markets.
Our reported financial results may be adversely affected by •changes in accounting principles generally accepted in the United States.
Generally accepted accounting principles in the United States are subject to interpretation by the Financial Accounting Standards Board, the American Institute of Certified Public Accountants, the SEC and various bodies formed to promulgate and interpret appropriate accounting principles. A change in these principles or interpretations could have a significant effect on our reported financial results, and could affect the reporting of transactions completed before the announcement of a change.
Our management has limited experience in operating a public company.
We have incurred and will continue to incur increased costs as a result of operating as a relatively new public company, and our management will continue to devote substantial time to new compliance initiatives. As a public company, we are subject to the reporting requirements of the Exchange Act, the Sarbanes-Oxley Act, the Dodd-Frank Act, as well as rules adopted, and to be adopted, by the SEC and Nasdaq. Our management and other personnel devote and we expect will continue to devote a substantial amount of time to these compliance initiatives. Furthermore, new or changes to existing rules and regulations in the future may increase our legal and financial compliance costs and make some activities more time-consuming and costly, which would increase our net loss for the foreseeable future. The impact of these requirements could also make it more difficult for us to attract and retain qualified persons to serve on our Board of Directors, its board committees or as executive officers.States;
Our executive officers have limited experience in the management of a publicly traded company. Their limited experience in dealing with the increasingly complex laws pertaining to public companies increases the amount of their time devoted to these activities, which will result in less time being devoted to the management and growth of the business. We continue to evaluate whether we have adequate personnel with the appropriate level of knowledge, experience and training in the accounting policies, practices or internal control over financial reporting required of public companies. If we are required to expand our employee base and hire additional employees to support our operations•regulatory obligations as a public company, our operating costs will increase in future periods. See “Risk Management and Financial Reporting Risks — If we fail to establish and maintain proper and effective internal control over financial reporting, our ability to produce accurate and timely financial statements could be impaired, investors may lose confidence in our financial reporting and the trading price of our common stock may decline”.
As a result of our business combination with a special purpose acquisition company regulatory obligationsthat may impact us differently than other publicly traded companies.
We became a publicly traded company by completing a transaction with SCH, a special purpose acquisition company, or SPAC. As a result of this transaction, regulatory obligations have, and may continue, to impact us differently than other publicly traded companies. For instance, the SEC and other regulatory agencies may issue additional guidance or apply further regulatory scrutiny to companies like us that have completed a business combination with a SPAC. Managing this regulatory environment, which has and may continue to evolve, could divert management’s attention from the operation of our business, negatively impact our ability to raise additional capital when needed or have an adverse effect on the price of our common stock.
Our risk management processes and procedures may not be effective.
Our risk management processes and procedures seek to appropriately balance risk and return and mitigate risks. We have established processes and procedures intended to identify, measure, monitor and control the types of risk to which we are subject, including interest rate risk, credit risk, deposit risk, market risk, liquidity risk, strategic risk, operational risk, cybersecurity risk, and reputational risk. Credit risk is the risk of loss that arises when a loan obligor fails to meet the terms of a loan repayment obligation, the loan enters default, and if uncured results in financial loss of remaining principal and interest to the loan purchaser. Our exposure to credit risk mainly arises from our lending activities. Deposit risk refers to accelerated availability of depositor funds, prior to settlement, risk of ACH returns or merchant settlements, and transactional limits that may be applied to deposit accounts. Market risk is the risk of loss due to changes in external market factors, such as interest rates, asset prices, and foreign exchange rates. Liquidity risk is the risk that financial condition or overall safety and soundness are adversely affected by an inability, or perceived inability, to meet obligations (e.g., current and future cash flow needs) and support business growth. We actively monitor our liquidity position and at the broker-dealer subsidiary level. Strategic risk is the risk from changes in the business environment, ineffective business strategies, improper implementation of decisions or inadequate responsiveness to changes in the business and competitive environment.
Operational risk is the risk of loss arising from inadequate or failed internal processes, controls, people (e.g., human error or misconduct) or systems (e.g., technology problems), business continuity or external events (e.g., natural disasters), compliance, reputational, regulatory, or legal matters and includes those risks as they relate directly to us, fraud losses attributed to applications and any associated fines and monetary penalties as a result, transaction processing, or employees, as well as to third parties with whom we contract or otherwise do business. Operational risk is one of the most prevalent forms of risk in our risk profile. We strive to manage operational risk by establishing policies and procedures to accomplish timely and efficient processing, obtaining periodic internal control attestations from management, conducting internal process Risk Control Self-Assessments and audit reviews to evaluate the effectiveness of internal controls.
In order to be effective, among other things, our enterprise risk management capabilities must adapt and align to support any new product or loan features, capability, strategic development, or external change. Cybersecurity risk is the risk of a malicious technological attack intended to impact the confidentiality, availability, or integrity of our systems and data, including, but not limited to, sensitive client data. Our technology and information security teams rely on a layered system of preventive and detective technologies, practices, and policies to detect, mitigate, and neutralize cybersecurity threats. In addition, our information security team and third-party consultants regularly assesses our cybersecurity risks and mitigation efforts. Cyberattacks can also result in financial and reputational risk.
Reputational risk is the risk arising from possible negative perceptions of us, whether true or not, among our current and prospective members, counterparties, employees, and regulators. The potential for either enhancing or damaging our reputation is inherent in almost all aspects of business activity. We attempt to manage this risk through our commitment to a set of core values that emphasize and reward high standards of ethical behavior, maintaining a culture of compliance, and by being responsive to member and regulatory requirements.
Risk is inherent in our business, and therefore, despite our efforts to manage risk, there can be no assurance that we will not sustain unexpected losses. We could incur substantial losses and our business operations could be disrupted to the extent our business model, operational processes, control functions, technological capabilities, risk analyses, and business/product knowledge do not adequately identify and manage potential risks associated with our strategic initiatives. There also may be risks that exist, or that develop in the future, that we have not appropriately anticipated, identified or mitigated, including when processes are changed or new products and services are introduced. If our risk management framework does not effectively identify and control our risks, we could suffer unexpected losses or be adversely affected, which could have a material adverse effect on our business.
Incorrectincorrect estimates or assumptions by management in connection with the preparation of our consolidated financial statements could adversely affect our reported assets, liabilities, income, revenues or expenses.statements;
The preparation of our consolidated financial statements requires management to make critical accounting estimates and assumptions that affect the reported amounts of assets, liabilities, income, revenues or expenses during the reporting periods. Incorrect estimates and assumptions by management could adversely affect our reported amounts of assets, liabilities, income, revenues and expenses during the reporting periods. If we make incorrect assumptions or estimates, our reported financial results may be over- or understated, which could materially and adversely affect our business, financial condition and results of operations.
Our forecasts are subject to significant risks, assumptions, estimates and uncertainties. As a result, our forecasted revenues, market share, expenses and profitability may differ materially from our expectations.
We operate in a rapidly changing and competitive industry and our projections will be subject to the risks and assumptions made by management with respect to our industry. Operating results are difficult to forecast because they generally depend on a number of factors, including the competition we face, and our ability to attract and retain members and enterprise partnerships, while generating sustained revenues through the Financial Services Productivity Loop. Additionally, our business may be affected by reductions in consumer borrowing, spending and investing from time to time as a result of a number of factors which may be difficult to predict. This may result in decreased revenue levels, and we may be unable to adopt measures in a timely manner to compensate for any unexpected shortfall in income. This inability could cause our operating results in a given quarter to be higher or lower than expected. These factors make creating accurate forecasts and budgets challenging and, as a result, we may fall materially short of our forecasts and expectations, which could cause our stock price to decline and investors to lose confidence in us.
Information Technology and Data Risks
We depend on third parties for a wide array of services, systems and information technology applications, and a •breach or violation of law by one of thesea third parties could disrupt our business or provide our competitors with an opportunity to enhance their position at our expense.
We dependparty on third parties for a wide array of financial, technology and insurance services, systems and information technology applications. Third-party vendors are significantly involved in many aspects of our software and systems development, servicing systems, the timely transmission of information across our data communication network, and for other telecommunications, processing, remittance and technology-related services in connection with our servicing or payment services businesses. Certain of our vendor agreements are terminable on short or no notice, and if current vendors were to stop providing services to us on acceptable terms,which we may be unable to procure alternatives from other vendors in a timely and efficient manner and on acceptable terms, or at all. If a service provider fails to provide the services required or expected, or fails to meet applicable contractual or regulatory requirements such as service levels or compliance with applicable laws, the failure could negatively impact our business. Such a failure could also adversely affect the perception of the reliability of our networks and services and the quality of our brand, which could materially adversely affect our business and results of operations.
Cyberattacks and other security breaches could have an adverse effect on our business, harm our reputation and expose us to liability.
In the normal course of business, we collect, process and retain non-public and confidential information regarding our members and prospective members. We also have arrangements in place with certain third-party service providers that require us to share consumer information. Although we devote significant resources and management focus to ensuring the integrity of our systems through information/cyber security and business continuity programs, our facilities and systems, and those of third-party service providers, are vulnerable to external or internal security breaches, acts of vandalism, computer viruses, misplaced or lost data, programming or human errors, and other similar events. We and third-party service providers have experienced
such instances in the past and expect to continue to experience them in the future. We also face security threats from malicious threat actors that could obtain unauthorized access to our systems and networks, which threats we anticipate will continue to grow in scope and complexity over time. These events could interrupt our business or operations, result in significant legal and financial exposure, supervisory liability, damage to our reputation and a loss of confidence in the security of our systems, products and services. Although the impact to date from these events has not had a material adverse effect on us, no assurance is given that this will be the case in the future.
Cyber security risks in the financial services industry have increased recently, in part because of new technologies, the use of the Internet and telecommunications technologies (including mobile devices) to conduct financial and other business transactions and the increased sophistication and activities of organized criminals, perpetrators of fraud, hackers, terrorists and others. In addition to cyberattacks and other security breaches involving the theftor disruptions of non-publicour systems or third-party systems on which we rely, including our cloud computing services arrangement, disruptions that may impact our ability to collect loan payments and confidential information, hackers recently have engaged in attacks that are designedmaintain accurate accounts, or our ability to disrupt key businessprovide services such as consumer-facing websites. We may not be able to anticipate or implement effective preventive measures against all security breaches of these types, especially because the techniques used change frequently and because attacks can originate from a wide variety of sources. We employ detection and response mechanisms designed to contain and mitigate security incidents. Nonetheless, early detection efforts may be thwarted by sophisticated attacks and malware designed to avoid detection. We also may fail to detect the existence of a security breachour technology platform clients;
•liabilities related to the information of our members.
The access by unauthorized persons to, or the improper disclosure by us of, confidential information regarding our members or our proprietary information, software, methodologies and business secrets could interrupt our business or operations, result in significant legal and financial exposure, supervisory liability, damage to our reputation or a loss of confidence in the security of our systems, products and services, all of which could have a material adverse impact on our business. In addition, there recently have been a number of well-publicized attacks or breaches affecting companies in the financial services industry that have heightened concern by consumers, which could also intensify regulatory focus, cause users to lose trust in the security of the industry in general and result in reduced use of our services and increased costs, all of which could also have a material adverse effect on our business.
The collection, processing, use, storage sharing and transmission of personal data could give rise to data;
•liabilities as a result of federal, state and international laws and regulations, as well as our failure to adhererelated to the privacydata, models, and data security practices that we articulate to our members.
We collect, process, store, use, share and/or transmit a large volume of personally identifiable information (“PII”) and other non-public data from current, past and prospective members. There are federal, state, and foreign laws regarding privacy, data security and the collection, use, storage, protection, sharing and/or transmission of PII and non-public data. Additionally, many states continue to enact legislation on matters of privacy, information security, cybersecurity, data breach and data breach notification requirements. For example, as of January 1, 2020, the CCPA granted additional consumer rights with respect to data privacy in California. The CCPA, among other things, entitles California residents to know how their personal information is being collected and shared, to access or request the deletion of their personal information and to opt out of the sharing of their personal information. The CCPA is subject to further amendments pending certain proposed regulations that are being reviewed and revised by the California Attorney General. While personal information that we process is exempt from the GLBA, the CCPA regulates other personal information that we collect and process in connection with the business. We cannot predict the impact of the CCPA on our business, operations or financial condition, but it could require us to modify certain processes or procedures, which could result in additional costs and liability. Additionally, our broker-dealer and investment adviser are subject to SEC Regulation S-P, which requires that these businesses maintain policies and procedures addressing the protection of customer information and records. This includes protecting against any anticipated threats or hazards to the security or integrity of customer records and information and against unauthorized access to or use of customer recordsartificial intelligence in products or information. Regulation S-P also requires these businesses to provide initial and annual privacy notices to customers describing information sharing policies and informing customers of their rights.
Additionally, a California ballot initiative, the California Privacy Rights Act (the “CPRA”) was passed in November 2020. Effective starting on January 1, 2023, the CPRA imposes additional obligations on companies covered by the legislation and will significantly modify the CCPA, including by expanding consumers’ rights with respect to certain sensitive personal information. The CPRA also creates a new state agency that will be vested with authority to implement and enforce the CCPA and the CPRA. The effects of the CCPA and the CPRA are potentially significant and may require us to modify our data collection or processing practices and policies and to incur substantial costs and expenses in an effort to comply and increase our potential exposure to regulatory enforcement and/or litigation.
Virginia and Colorado recently enacted comprehensive privacy laws that are similar to the CCPA and CPRA and we expect more states to enact legislation similar to the CCPA, which provides consumers with new privacy rights and increases
the privacy and security obligations of entities handling certain personal information of such consumers. The CCPA has prompted a number of proposals for new federal and state-level privacy legislation. Such proposed legislation, if enacted, may add additional complexity, variation in requirements, restrictions and potential legal risk, require additional investment of resources in compliance programs, impact strategies and the availability of previously useful data and could result in increased compliance costs and/or changes in business practices and policies.
Any violations of these laws and regulations may require us to change our business practices or operational structure, including limiting our activities in certain states and/or jurisdictions, address legal claims, and sustain monetary penalties, reputational damage and/or other harms to our business.
Furthermore, our online privacy policy and website make certain statements regarding our privacy, information security, and data security practices with regard to information collected from our members. Failure to adhere to such practices may result in regulatory scrutiny and investigation (including the potential for fines and monetary penalties), complaints by affected members, reputational damage and other harm to our business. If either we, or the third-party service providers with which we share member data, are unable to address privacy concerns, even if unfounded, or to comply with applicable laws and regulations, it could result in additional costs and liability, damage our reputation, and harm our business.
Our ability to collect payments on loans and maintain accurate accounts may be adversely affected by computer malware, social engineering, phishing, physical or electronic break-ins, technical errors and similar disruptions.
The automated nature of our platform may make it an attractive target for hacking and potentially vulnerable to computer viruses, physical or electronic break-ins and similar disruptions. It is possible that we may not be able to anticipate or to implement effective preventive measures against all security breaches of these types, in which case there would be an increased risk of fraud or identity theft, and we may experience losses on, or delays in the collection of amounts owed on, a fraudulently induced loan. Security breaches could occur from outside our company, and also from the actions of persons inside our company who may have authorized or unauthorized access to our technology systems. In addition, the software that we have developed to use in our daily operations is highly complex and may contain undetected technical errors that could cause our computer systems to fail. Because each loan that we make involves, in part, our proprietary automated underwriting process, any failure of our computer systems involving our automated underwriting process and any technical or other errors contained in the software pertaining to our automated underwriting process could compromise our ability to accurately evaluate potential members, which would negatively impact our results of operations. Furthermore, any failure of our computer systems could cause an interruption in operations and result in disruptions in, or reductions in the amount of, collections from the loans we make to our members.
Additionally, if hackers were able to access our secure files, they might be able to gain access to the personal information of our members. If we are unable to prevent such activity, we may be subject to significant liability, negative publicity and a material loss of members, all of which may negatively affect our business.
Disruptions in the operation of our computer systems and third-party data centers could have an adverse effect on our business.
Our ability to deliver products and services to our members and partners, and otherwise operate our business and comply with applicable laws, depends on the efficient and uninterrupted operation of our computer systems and third-party data centers, as well as third-party service providers. Our computer systems and third-party providers may encounter service interruptions at any time due to system or software failure, natural disasters, severe weather conditions, health pandemics, terrorist attacks, cyberattacks or other events. Any such events could have a negative effect on our business and technology infrastructure (including our computer network systems), which could lead to member dissatisfaction or long-term disruption of our operations.
Additionally, our reliance on third-party providers may mean that we will not be able to resolve operational problems internally or on a timely basis, as our operations will depend upon such third-party service providers communicating appropriately and responding swiftly to their own service disruptions through industry standard best practices in business continuity and/or disaster recovery. As a last resort, we may rely on our ability to replace a third-party service provider if it experiences difficulties that interrupt operations for a prolonged period of time or if an essential third-party service terminates. If these service arrangements are terminated for any reason without an immediately available substitute arrangement, our operations may be severely interrupted or delayed. If such interruption or delay were to continue for a substantial period of time, our business, prospects, financial condition and results of operations could be adversely affected.
The implementation of technology changes and upgrades to maintain current and integrate new systems may cause service interruptions, transaction processing errors or system conversion delays and may cause us to fail to comply with
applicable laws, all of which could have a material adverse effect on our business. We expect that new technologies and business processes applicable to the financial services industry will continue to emerge and that these new technologies and business processes may be better than those we currently use. There is no assurance that we will be able to successfully adopt new technology as critical systems and applications become obsolete and better ones become available. A failure to maintain and/or improve current technology and business processes could cause disruptions in our operations or cause our solution to be less competitive, all of which could have a material adverse effect on our business.
Risks Related to Ownership of Our Securities
•volatility in the price of our common stock, changes in analyst ratings or expectations, and future dilution of our stockholders;
•possibility of securities litigation, which is expensive and time consuming; and
•failure to comply with Nasdaq continued listing standards.
Business, Financial and Operational Risks We operate in rapidly evolving industries, and have limited experience in parts of our Financial Services and Technology Platform segments, which may make it difficult for us to successfully identify and address the risks and uncertainties we face.
We operate in rapidly evolving industries which may make it difficult to quickly identify risks to our business and evaluate our future prospects. In addition, in recent years, we have rapidly expanded our operations to include or expand, among other things, deposit accounts, credit cards, investment services, technology solutions, home loan originations, and international operations, and we have limited experience in these areas. In the first quarter of 2022, we acquired a bank charter and face risks as a result of our lack of experience operating a bank and as a bank holding company. We also acquired Technisys in the first quarter of 2022, which furthered our international expansion into Latin America and introduced new risks due to our limited history of operations in certain Latin American countries. In 2023, we acquired Wyndham, a fintech mortgage lender, which expanded our home loan business.
In addition to the recent events above, we face numerous challenges to our success, including our ability to:
•increase or maintain the number, volume and types of, and add new features to, the loans we extend to our members as the market for loans evolves and as we face new and increasing competitive threats;
•successfully integrate our past and future acquisitions, including continuing to integrate Wyndham’s technology and employees, performing functions in home loans origination, such as home loans processing and underwriting, which we have not previously performed, and managing the origination of new home loan types;
•increase the number of members utilizing our non-lending products, including our direct deposit feature, and maintain and build on the loyalty of existing members by increasing their use of new or additional products;
•successfully maintain and enhance our diversified funding strategy, including through deposits, securitization financing from consolidated and nonconsolidated VIEs, whole loan sales, and debt warehouse facilities;
•further establish, diversify and refine our checking and savings, investment and brokerage offerings to meet evolving consumer needs and preferences;
•offer an attractive annual percentage yield on our deposits compared to our competitors and manage deposit costs;
•diversify our revenue streams across our products and services;
•favorably compete with other companies and banks, including traditional and alternative technology-enabled lenders, financial service providers, broker-dealers, and technology platform as a service providers;
•continue to realize the benefits of operating a bank;
•introduce new products or other offerings, as well as new or improved technologies, to meet the needs of our existing and prospective members or to keep pace with competitive lending, checking and savings, investment, technology and other developments;
•maintain or increase the effectiveness of our direct marketing, and other sales and marketing efforts, and maintain our brand;
•successfully design, develop, integrate, operate and maintain technology systems at scale and with a high degree of reliability that support our member growth and product adoption;
•successfully navigate economic conditions and fluctuations in the credit markets, including elevated and fluctuating inflation, interest rates that are higher than those in the recent past, recessionary pressures and economic uncertainty;
•continue to add new clients and new products to existing clients in our technology platform as a service business;
•successfully identify financial issues or liquidity issues experienced by our technology platform clients that could result in termination of, or their inability to pay for, our technology platform services;
•successfully diversify our technology platform clients into new industry verticals and new geographies;
•successfully identify a slowdown or acceleration in the business growth of our technology platform clients to ensure aligned costs and capabilities;
•successfully navigate the evolving regulatory environment for technology platform-as-a-service providers;
•establish fraud prevention strategies that proactively identify threat vectors and mitigate losses;
•defend our platform from information security vulnerabilities, cyberattacks or malicious attacks;
•effectively manage the growth of our business;
•effectively manage our expenses;
•obtain debt or equity capital on attractive terms or at all;
•successfully continue to expand internationally;
•adequately respond to macroeconomic and other exogenous challenges, including continued government efforts to curb inflation, which may impact the overall economy and affect demand for our products and services, market volatility, particularly in the financial services industry, changes in consumer confidence, consumer discretionary spending and loan delinquency rates, pandemics or other health-related crises, the war between Israel and Hamas, and the ongoing war in Ukraine;
•maintain successful relationships with our governmental regulatory agencies and law enforcement authorities, as well as self-regulatory agencies; and
•anticipate and react to changes in an evolving regulatory and political environment.
We may not be able to successfully address the risks and uncertainties we face, which could negatively impact our business, financial condition, results of operations, cash flows and future prospects.
We have a history of losses, and may experience net losses in the future and there is no assurance that our revenue and business model will be successful.
We have a history of net losses prior to the fourth quarter of 2023. We may incur net losses in the future, and such losses may fluctuate significantly from quarter to quarter. We will need to generate and sustain significant revenues for our business generally, and achieve greater scale and generate greater operating cash flows from our Financial Services segment, in particular, in future periods, as well as successfully navigate the macroeconomic environment, in order to maintain or increase our level of profitability. We intend to continue to invest in sales and marketing, technology, and products and services in order to enhance our brand recognition and our value proposition to our members, prospective members and clients in our technology platform business, and these additional costs will create further challenges to maintaining or increasing near-term profitability. Our general and administrative expenses have in the past and may in the future increase to meet the increased compliance and other requirements associated with operating as a public company and a bank holding company, operating a bank, and evolving regulatory requirements. See “Regulatory, Tax and Other Legal Risks—As a bank holding company, we are subject to extensive supervision and regulation, and changes in laws and regulations applicable to bank holding companies could limit or restrict our activities and could have a material adverse effect on our operations”.
We are continuously refining our revenue and business model, which is premised on creating a virtuous cycle for our members to engage with more products across our platform, a strategy we refer to as the Financial Services Productivity Loop,
and, with respect to our Technology Platform segment, adoption by clients of additional platform as a service offerings. There is no assurance that our revenue and business model or any changes to our revenue and business model to better position us with respect to our competitors will be successful. Our efforts to grow our business may be more costly than we expect, and we may not be able to maintain or increase our revenue sufficiently to offset our higher operating expenses. We may incur losses and we may be unable to maintain profitability, for a number of reasons, including the risks described in this Annual Report on Form 10-K, unforeseen expenses, difficulties, complications and delays, differences between our assumptions and estimates and results, the effects of macroeconomic conditions and other unknown events.
We have experienced rapid growth in recent years, including through the addition of new products and lines of business and into new geographies, which may place significant demands on our operational, risk management, sales and marketing, technology, compliance, and finance and accounting resources.
Our rapid growth in certain areas of our business in recent years, primarily within our Financial Services and Technology Platform segments, as well as operating a bank and as a bank holding company, has placed significant demands on our operational, risk management, sales and marketing, technology, compliance, and finance and accounting infrastructure, and has resulted in increased expenses, a trend that we expect to continue as our business grows. In addition, we are required to continuously develop and adapt our systems and infrastructure in response to the increasing sophistication of the consumer financial services market, changing technologies, evolving fraud, privacy and information security landscape, and regulatory developments, both domestically and internationally, relating to our existing and projected business activities. Our future growth will depend on, among other things, our ability to maintain an operating platform and management system able to address such growth, our ability to grow and optimize deposit balances, and our ongoing ability to demonstrate to our regulators that our risk management and compliance practices are growing in a commensurate fashion, all of which has required and we expect will continue to require us to incur significant additional expenses, expand our workforce and commit additional time from senior management and operational resources. We may not be able to manage supporting and expanding our operations effectively, and any failure to do so would adversely affect our ability to increase the scale of our business, generate projected revenue and control expenses.
Our results of operations and future prospects depend on our ability to retain existing members and attract new members. We face intense and increasing competition and, if we do not compete effectively, our competitive positioning and our operating results will be harmed.
We operate in a rapidly changing and highly competitive industry, and our results of operations and future prospects depend on, among others:
•the continued growth and engagement of our member base;
•our ability to monetize our member base, including through the use of additional products by our existing members;
•our ability to acquire members at a lower cost; and
•our ability to increase the overall value to us of each of our members while they remain on our platform (which we refer to as a member’s lifetime value).
We expect our competition to continue to increase, as there are no substantial barriers to entry to certain of the markets we serve. Some of our current and potential competitors have longer operating histories, particularly with respect to our financial services products, significantly greater financial, technical, marketing and other resources, and a larger customer base than we do. This allows them to potentially offer more competitive pricing or other terms or features, a broader range of financial products, or a more specialized set of specific products or services, as well as respond more quickly than we can to new or emerging technologies and changes in member preferences. In addition to established enterprises, we may also face competition from early-stage companies attempting to capitalize on the same, or similar, opportunities as we are. Our existing or future competitors may develop products or services that are similar to our products and services or that achieve greater market acceptance than our products and services. This could attract current or potential members away from our services and reduce our market share in the future. Additionally, when new competitors seek to enter our markets, or when existing market participants seek to increase their market share, these competitors sometimes undercut, or otherwise exert pressure on, the pricing terms prevalent in that market, which could adversely affect our market share and/or our ability to capitalize on market opportunities.
We currently compete at multiple levels with a variety of competitors, including:
•other personal loan, student loan refinancing, in-school student loan and home loan lenders, including other banks and other financial institutions, as well as credit card issuers, that can offer more competitive interest rates or terms;
•banks and other financial institutions, with respect to our checking and savings accounts;
•rewards credit cards provided by other financial institutions, with respect to our SoFi Credit Card;
•other brokerage firms, including online or mobile platforms, and other companies for our SoFi Invest accounts;
•other mortgage lenders, including fintech-focused lenders, and other companies for our home loans;
•other technology platforms with respect to the enterprise services we provide, such as technology products and solutions via Galileo and Technisys;
•other content providers for subscribers to our financial services content, including content from alternative providers available to our subscribers through our Lantern Credit service, which is a financial services aggregator providing marketplace lending products, and various enterprise partnerships; and
•other financial services firms offering employers a comprehensive platform for employees to build financial well-being through student loan and 529 educational plan contributions, educational tools, and financial resources, all of which we provide through SoFi At Work.
We believe that our ability to compete depends upon many factors both within and beyond our control, including, among others, the following:
•the size, diversity and lifetime value of our member base and technology platform clients;
•our ability to introduce successful new products and services, as well as new or improved technologies, or to iterate and innovate on existing products or services to satisfy evolving member and technology platform client preferences or to keep pace with market trends;
•our ability to diversify our revenue streams across our products and services, and cost effectively acquire new members and technology platform clients;
•the timing and market acceptance of our products and services, including developments and enhancements to those products and services, offered by us and our competitors;
•member and technology platform client service and support efforts;
•selling, marketing and promotional efforts;
•our ability to compete on price, particularly with respect to SoFi Invest and the Technology Platform where demand for our products and services may be affected if we are unable to compete with other brokerages or technology-as-a-service providers on price;
•our ability to offer competitive interest rates on deposit accounts;
•the ease of use, performance, price and reliability of solutions developed either by us or our competitors;
•our ability to attract and retain talent;
•changes in economic conditions, and regulatory and policy developments;
•our ability to successfully operate a national bank, grow deposits and realize the potential benefits to our members;
•our ability to successfully scale our products and services and execute on our Financial Services Productivity Loop strategy and our other business plans, including successfully integrating our acquisitions and diversifying our technology platform clients into new industry verticals and new geographies;
•general market conditions and their impact on our liquidity and ability to access funding;
•the impact of macroeconomic conditions, including the impacts from current efforts to curb inflation, stock market volatility, changes in consumer confidence, consumer discretionary spending, and any changes in loan default rates, and related developments on the lending and financial services markets we serve; and
•our brand strength relative to our competitors.
Our current and future business prospects demand that we act to meet these competitive challenges but, in doing so, our revenues and results of operations could be adversely affected if we, for example, increase marketing or other expenditures or make new expenditures in other areas. Competitive pressures could also result in us reducing the annual percentage rate on the loans we originate, increasing the annual percentage rate we pay on the checking and savings product, charging fees for services we currently provide for free, incurring higher member or technology platform client acquisition costs, or make it more difficult for us to grow our loan originations in both number of loans and volume for new as well as existing members or expand the adoption of additional products by our current, or acquire new, technology platform clients. All of the foregoing factors and events could adversely affect our business, financial condition, results of operations, cash flows and future prospects.
Adverse developments affecting the financial services industry, such as actual events or concerns involving liquidity, defaults, or non-performance by financial institutions or transactional counterparties, could adversely affect our financial condition and results of operations.
Actual events involving limited liquidity, defaults, non-performance or other adverse developments that affect financial institutions, transactional counterparties or other companies in the financial services industry or the financial services industry generally, or concerns or rumors about any events of these kinds or other similar risks, have in the past and may in the future lead to market-wide liquidity problems and adversely affect our financial condition and results of operations. For example, Silicon Valley Bank and Signature Bank were put into FDIC receivership in March 2023 and First Republic Bank was put into FDIC receivership in May 2023. These market developments have negatively impacted customer confidence in the safety and soundness of certain banks. As a result, although we have not observed a decline in our deposits to date, our members may choose to maintain deposits with other financial institutions or spread their deposit funds among multiple financial institutions. The closure of financial institutions, even if such financial institutions are unrelated to our business, may result in a deterioration of consumer confidence in banks and the banking system more broadly as well as declines in the price of our stock or reluctance of our members to use our products and services.
Inflation and rapid increases in interest rates have led to a decline in the trading value of previously issued government securities with interest rates below current market interest rates. On March 12, 2023, the Federal Reserve announced the creation of the Bank Term Funding Program, a new emergency lending program for FDIC-insured banks, as well as certain U.S. branches and agencies of foreign banks. Under the Bank Term Funding Program, the Treasury Department provided $25 billion of credit protection to the Federal Reserve Banks, in order to provide loans with terms up to one year secured by certain government securities held by eligible financial institution borrowers. The program was established to reduce the need for eligible borrowers to sell the securities in times of stress, thus, mitigating the risk of potential losses on the sale of such securities. On January 24, 2024, the Federal Reserve announced that the program would cease making new loans, as scheduled, on March 11, 2024. There is no guarantee that the Federal Reserve would establish a similar facility in the future or that the Treasury, FDIC and Federal Reserve will provide access to uninsured funds in the event of the closure of other banks or financial institutions, or that they would do so in a timely fashion.
It is likely that, if the banking sector deteriorates, the U.S. and/or other global economies would be adversely affected, including facing the possibility of a recession, the duration and severity of which is difficult to predict. These developments may adversely affect our business, financial condition and results of operations.
Our future growth depends significantly on our branding and marketing efforts, and if our marketing efforts are not successful or we receive negative publicity, our business and results of operations will be harmed.
We have invested significantly in our brand and believe that maintaining and enhancing our brand identity is critical to our success. Our ability to attract members depends in large part on the success of these marketing efforts and the success of the marketing channels we use to promote our products. Our marketing channels include, but are not limited to, earned media through press, social media and search engine optimization, as well as paid advertising, such as online affiliations, search engine marketing, digital marketing, social media marketing, influencer marketing, offline partnerships, out-of-home, direct mail, lifecycle marketing and television and radio advertising. Our ability to compete for, attract and maintain members, lending counterparties, marketing partners and other partners relies to a large extent on their trust in our business, our reputation and the value of our brand. While our goal remains to increase the strength, recognition and trust in our brand by increasing our member base and expanding our products and services, if any of our current marketing channels becomes less effective, if regulatory requirements, including the FDIC’s advertising rules, restrict or diminish our ability to use these channels, if we are unable to continue to use any of these channels, if we receive negative publicity or fail to maintain our brand, if the cost of using these channels significantly increases or if we are not successful in generating new channels, we may not be able to attract new members or increase the activity of our existing members on our platform in a cost-effective manner. If we are unable to recover our marketing costs through increases in the size, value or the overall number of loans we originate, or member selection and utilization of other SoFi products such as SoFi Money, SoFi Invest and SoFi Credit Card, it could have a material adverse effect on our business, financial condition, results of operations, cash flows and future prospects. In addition, negative publicity can adversely affect our reputation and damage our brand, and may arise from many sources, including actual or alleged misconduct, errors or improper business practices by employees, employee claims of discrimination or harassment, product failures, existing or future litigation or regulatory actions, inadequate protection of consumer information by us or our third-party service providers, data breaches, matters related to or affecting our financial reporting or compliance with SEC and Nasdaq listing requirements and media coverage, whether accurate or not. Negative publicity or allegations could reduce demand for our products, result in a decrease in the price of our stock, undermine the loyalty of our members and the confidence of our lending counterparties and technology platform clients, impact our partnerships, reduce our ability to recruit and retain employees or lead to greater regulatory scrutiny, all of which could lead to the attrition of our members, lending
counterparties, technology platform clients and harm our results of operations. In addition, we and our officers, directors and/or employees have been, and may in the future be, named or otherwise involved in litigation or claims, including employment-related claims such as workplace discrimination or harassment, which could result in negative publicity and/or adversely impact our business, even if we are ultimately successful in defending against or litigating such claims.
Reputational harm, including as a result of our actual or alleged conduct or public opinion of the financial services industry generally, could adversely affect our business, results of operations, and financial condition.
Reputation risk, or the risk to our business, earnings and capital from negative public opinion, is inherent in our business and has increased substantially because of our size and profile in the financial services industry. Moreover, negative public opinion has in the past and could in the future result from actions by the financial services industry generally, including due to the failure of one or more additional banks, or by certain members or individuals in the industry and can adversely affect our reputation with no actual or alleged actions on our part. For example, public opinion of the financial services industry was negatively impacted following the closure of Silicon Valley Bank and generally resulted in decreases in the stock prices of financial services companies.
Negative public opinion could result from our actual or alleged conduct in any number of activities, including sales and marketing practices; home loan or other consumer lending practices; loan origination or servicing activities; mortgage foreclosure actions; management of client accounts or investments; lending, investing or other business relationships; identification and management of potential conflicts of interest from transactions; obligations and interests with and among our members or customers; environmental, social and governance practices; litigation or regulatory actions taken by us or to which we are a party; regulatory compliance; risk management; incentive compensation practices; and disclosure, sharing or inadequate protection or improper use of member or customer information, and from actions taken by government regulators and community or other organizations in response to that conduct. Although we have policies and procedures in place intended to detect and prevent conduct by employees and third-party service providers that could potentially harm members or customers or our reputation, there is no assurance that such policies and procedures will be fully effective in preventing such conduct.
Furthermore, our actual or perceived failure to address or prevent any such conduct or otherwise to effectively manage our business or operations could result in significant reputational harm. For example, our marketing strategy includes an emphasis on social media. Social media provides a powerful medium for consumers, employees and others to communicate their approval of or displeasure with a business. This aspect of social media is especially challenging because it allows any individual to reach a broad audience with an ability to respond or react, in near real time, with comments that are often not filtered or checked for accuracy. We monitor social media metrics for their impact on our business but if we are unable to quickly and effectively respond, any negative publicity could “go viral”, causing nearly immediate and potentially significant harm to our brand and reputation, and our business, whether or not factually accurate, including a significant withdrawal of deposits from SoFi Bank within a short period of time.
Our reputation and/or business could be negatively impacted by ESG matters and/or our reporting of such matters.
There is an increasing focus from regulators, certain investors, and other stakeholders concerning ESG matters, both in the United States and internationally. We communicate certain ESG-related initiatives and/or commitments regarding our employees, diversity, equity and inclusion goals, and other matters in our ESG Report, on our website, in our filings with the SEC, and elsewhere. These initiatives and commitments could be difficult to achieve and costly to implement. We could fail to achieve, or be perceived to fail to achieve, our ESG-related initiatives, or commitments. In addition, we could be criticized for the timing, scope or nature of these initiatives, goals, or commitments, or for any revisions to them. To the extent that our required and voluntary disclosures about ESG matters increase, we could be criticized for the accuracy, adequacy, or completeness of such disclosures. Our actual or perceived failure to achieve our ESG-related initiatives, goals, or commitments could negatively impact our reputation, result in ESG-focused investors not purchasing and holding our stock, or otherwise materially harm our business.
We may experience fluctuations in our quarterly operating results.
We may experience fluctuations in our quarterly operating results due to a number of factors, including changes in the fair values of our instruments (including, but not limited to, our loans), the level of our expenses, the degree to which we encounter competition in our markets, general economic conditions, significant changes in default rates on loans, the rate and credit market environment and our ability to raise our coupon rates along with interest rates that are higher than those in the recent past, legal or regulatory developments, changing demographics, and legislative, regulatory or policy changes. In light of these factors, results for any period should not be relied upon as being indicative of performance in future periods.
We sell our loans to a concentrated number of whole loan purchasers and the loss of one or more significant purchasers could have a negative impact on our operating results.
Although we have begun to hold loans on-balance sheet for longer periods, when we sell our personal loans, student loans and home loans, we sell to a concentrated number of whole loan purchasers. There are inherent risks whenever a large percentage of a business is concentrated with a limited number of parties. It is not possible for us to predict the future level of demand for our loans by these or other purchasers. In addition, purchases of our loans by these purchasers have historically fluctuated and may continue to fluctuate based on a number of factors, some of which may be outside of our control, including economic conditions, the availability of alternative investments, changes in the terms of the loans, loans offered by competitors, prevailing interest rates and a change in business plan, liquidity or strategy by the purchaser. If any of these purchasers significantly reduces the dollar amount of the loans it purchases from us, we may be unable to sell those loans to another purchaser on favorable terms or at all, which may require us to reduce originations or hold additional loans on balance sheet and may reduce our flexibility in making financing decisions. In addition, the loss of one or more significant purchasers of our loans could increase the volatility of the mark-to-market methodology we use to determine the fair value of the loans we hold on balance sheet. This may have a material adverse effect on our revenues, results of operations, capital requirements, liquidity and cash flows.
Galileo and Technisys depend on a small number of clients, the loss or disruptions in operations of any of which could have a material adverse effect on their businesses and financial results, and negatively impact our financial results and results of operations.
Galileo and Technisys revenue from clients is highly concentrated. There are inherent risks whenever a large percentage of net revenue is concentrated with a limited number of clients, including fluctuations in revenue, the loss of any one or more of those clients as a result of bankruptcy or insolvency proceedings involving the client, the loss of the client to a competitor, harm to that client’s reputation or financial prospects or other reasons, including adverse general economic conditions affecting Galileo and Technisys clients many of which are fintechs and other financial services firms. Any reduction in the amount of revenues that we derive from these clients, without an offsetting increase in new sales to other clients, has had and could have a material adverse effect on our operating results in the future. A significant change in the liquidity or financial position of our clients could also have a material adverse effect on our liquidity and our future operating results. In addition, disruptions in the operations of certain of Galileo’s key clients have had an adverse impact on Galileo, and any future disruptions in the operations of any key Galileo or Technisys clients could be material and have an adverse impact on our results of operations.
We rely on third parties to perform certain key functions, and their failure to perform those functions could adversely affect our business, financial condition and results of operations.
We rely on certain third-party computer systems or third-party service providers, including cloud technology providers such as AWS, internet service providers, payment services providers, market and third-party data providers, regulatory and compliance services providers, clearing systems, market makers, exchange systems, banking technology systems, co-location facilities, communications facilities and other facilities to run our platform, facilitate trades by our members and support or carry out certain functions. For example, to provide our checking and savings account, cash management account, credit card and other products and services, we rely on third parties that we do not control, such as payment card networks, our acquiring and issuing processors, payment card issuers, various financial institution partners, systems like the ACH, and other partners. We rely on these third parties for a variety of services, including the transmission of transaction data, processing of chargebacks and refunds, settlement of funds, and the provision of information and other elements of our services. In addition, external content providers provide us with financial information, market news, charts, option and stock quotes, digital assets quotes, research reports and other fundamental data that we provide to our members. Any interruption in these third-party services, or deterioration in the quality of their service or performance, could be disruptive to our business. Furthermore, third parties may rely on artificial intelligence or machine learning for the services they provide us and, given that the regulatory framework relating to the use of machine learning and artificial services in the provision of financial services is still developing, the third parties’ use of such technologies may impact their ability to carry out certain functions or impact the quality of their service or performance.
Because we are a bank holding company subject to regulation, supervision and examination by the Federal Reserve, and because SoFi Bank is subject to regulation, supervision and examination by the OCC and the FDIC, and SoFi Bank and its affiliates are subject to regulations issued by the CFPB, our and SoFi Bank’s oversight of third-party service providers is also subject to regulatory oversight. If a regulatory authority found our or SoFi Bank’s service provider oversight to be lacking, the regulatory authority could require that we or SoFi Bank implement corrective action, including limiting or terminating certain relationships with service providers, which could be costly and disruptive to our business.
Further, we may, from time to time, decide to modify or terminate relationships with third-party service providers and to perform certain functions and/or services internally. For example, we historically used a third party bank to issue the SoFi Money debit cards and sponsor access to debit networks for payment transactions, funding transactions and associated settlement of funds, and sponsor and support ACH, check and wire transactions along with associated funds settlement. However, after gaining direct access to debit networks, we directly perform certain services previously sponsored by the third party bank. Although we have performed these services satisfactorily to date, there is no guarantee we will be able to continue to do so. Additionally, the migration of any such functions and/or services may introduce additional risks and could cause disruption to our business.
Our third-party service providers are susceptible to operational, technological and security vulnerabilities, including security breaches, which may impact our business, and our ability to monitor our third-party service providers’ data security is limited. In addition, these third-party service providers may rely on subcontractors to provide services to us that face similar risks.
Failures or security breaches by or of our third-party service providers or their subcontractors that result in an interruption in service, unauthorized access, misuse, loss or destruction of data or other similar occurrences could interrupt our business, have in the past and could in the future cause us to incur losses, result in decreased member or client satisfaction and increase member or client attrition, subject us to member or client complaints, significant fines, litigation, disputes, claims, regulatory investigations or other inquiries and harm our reputation. Through contractual provisions and third-party risk management processes, we take steps to require that our providers, and their subcontractors, protect our data and information, including personal data. However, due to the size and complexity of our technology platform and services, the amount of data that we store and the number of members, technology platform clients, employees and third-party service providers with access to personal data, we, our third-party service providers and their subcontractors are potentially vulnerable to a variety of intentional and inadvertent cybersecurity breaches and other security-related incidents and threats, which could result in a material adverse effect on our business, financial condition and results of operations. Any contractual protections we may have from our third-party service providers may not be sufficient to adequately protect us against such consequences, and we may be unable to enforce any such contractual protections.
In addition, there is no assurance that our third-party service providers or their subcontractors will be able to continue to provide these services to meet our current needs in an efficient, cost-effective manner or that they will be able to adequately expand their services to meet our needs in the future. Certain of our vendor agreements are terminable on short or no notice, and if current vendors were to stop providing services to us on acceptable terms, we may be unable to procure alternatives from other vendors in a timely and efficient manner and on acceptable terms, or at all. An interruption in or the cessation of service by our third-party service providers or their subcontractors, coupled with our possible inability to make alternative arrangements in a smooth, cost-effective and timely manner, could have adverse effects on our business, financial condition and results of operations.
If a service provider fails to provide the services required or expected, or fails to meet applicable contractual or regulatory requirements such as service levels or compliance with applicable laws, the failure could negatively impact our business. Such a failure could also adversely affect the perception of the reliability of our networks and services and the quality of our brand, which could materially adversely affect our business and results of operations. Further, if there were deficiencies in the oversight and control of our third-party relationships, and if our regulators held us responsible for those deficiencies, it could have an adverse effect on our business, reputation and results of operations.
The conditional conversion feature of the notes, if triggered, may adversely affect our financial condition.
Holders of our convertible notes issued in October 2021 and due in 2026 (the “notes”) may be entitled to convert the notes during specified periods at their option. If one or more holders elect to convert their notes, we may settle any converted principal through the payment of cash, which could adversely affect our financial results and liquidity and could result in a decline in our stock price.
The Capped Call Transactions may affect the value of the notes and our common stock.
In connection with the issuance of the notes, we entered into privately negotiated capped call transactions (the “Capped Call Transactions”) with certain financial institutions (the “Capped Call Counterparties”). The Capped Call Transactions are expected generally to reduce the potential dilutive effect on our common stock upon any conversion of the notes and/or offset any potential cash payments we are required to make in excess of the principal amount of converted notes, as the case may be, with such reduction and/or offset subject to a cap. In connection with establishing their initial hedges of the Capped Call Transactions, the Capped Call Counterparties or their respective affiliates entered into various derivative
transactions with respect to our common stock and/or purchased shares of our common stock concurrently with or shortly after the pricing of the notes.
In addition, the Capped Call Counterparties and/or their respective affiliates may modify their hedge positions by entering into or unwinding various derivatives with respect to our common stock and/or purchasing or selling our common stock or other securities of ours in secondary market transactions following the pricing of the notes and from time to time prior to the maturity of the notes (and are likely to do so following any conversion of the notes, any repurchase of the notes by us on any fundamental change repurchase date, any redemption date or any other date on which the notes are retired by us, in each case if we exercise the relevant election to terminate the corresponding portion of the Capped Call Transactions). This activity could also cause or avoid an increase or a decrease in the market price of our common stock or the notes. The potential effect, if any, of these transactions and activities on the market price of our common stock or the notes will depend, in part, on market conditions and cannot be ascertained at this time. Any of these activities could adversely affect the value of our common stock.
We are subject to counterparty risk with respect to the Capped Call Transactions, and the Capped Call Transactions may not operate as planned.
The Capped Call Counterparties are financial institutions or affiliates of financial institutions, and we will be subject to the risk that any or all of them might default under the Capped Call Transactions. Our exposure to the credit risk of the Capped Call Counterparties will not be secured by any collateral. Global economic conditions have, from time to time, resulted in the actual or perceived failure or financial difficulties of many financial institutions. If a Capped Call Counterparty becomes subject to insolvency proceedings, we will become an unsecured creditor in those proceedings with a claim equal to our exposure at that time under our transactions with that Capped Call Counterparty. Our exposure will depend on many factors, but, generally, an increase in our exposure will be correlated with increases in the market price or the volatility of our common stock. In addition, upon a default by a Capped Call Counterparty, we may suffer more dilution than we currently anticipate with respect to our common stock. We can provide no assurances as to the financial stability or viability of any Capped Call Counterparty.
In addition, the Capped Call Transactions are complex, and they may not operate as planned. For example, the terms of the Capped Call Transactions may be subject to adjustment, modification or, in some cases, renegotiation if certain corporate or other transactions occur. Accordingly, these transactions may not operate as we intend if we are required to adjust their terms as a result of transactions in the future or upon unanticipated developments that may adversely affect the functioning of the Capped Call Transactions.
Market and Interest Rate Risks Our business and results of operations have in the past and may in the future be adversely affected by the financial markets, fiscal, monetary, and regulatory policies, and economic conditions generally.
Our business, results of operations and reputation are directly affected by elements beyond our control, including general economic, political, social and health conditions in the U.S. and in countries abroad. These elements can arise suddenly and the full impact can remain unknown or result in adverse effects, including, but not limited to, extreme volatility in credit, equity and foreign currency markets, changes to buying patterns of our members and prospective members or reductions in the credit quality of our members, and changes to the financial condition of our technology platform clients and prospective clients.
In particular, markets in the U.S. or abroad have been and may in the future be affected by the level and volatility of interest rates, availability and market conditions of financing, recessionary pressures, inflation and hyperinflation, supply chain disruptions, changes in consumer spending, employment levels, labor shortages, federal government shutdowns, developments related to the U.S. federal debt ceiling, changes in legislation, regulations or policy, energy prices, home prices, commercial property values, bankruptcies, a default by a significant market participant or class of counterparties, market volatility, liquidity of the global financial markets, the growth of global trade and commerce, exchange rates, trade policies, the availability and cost of capital and credit, disruption of communication, transportation or energy infrastructure and investor sentiment and confidence. Additionally, global markets have been and may in the future be adversely affected by the current or anticipated impact of climate change, extreme weather events or natural disasters, the emergence or continuation of widespread health emergencies or pandemics, cyberattacks or campaigns, military conflict, including the war between Israel and Hamas and the ongoing war in Ukraine, terrorism or other geopolitical events which may affect our results of operations. For example, although we do not have operations in the locations impacted by these conflicts, the ongoing war in these locations has led and could in the future lead to macroeconomic effects, including volatility in commodity prices and the supply of energy resources, instability in financial markets, supply chain interruptions, political and social instability, as well as an increase in cyberattacks and espionage. Also, any sudden or prolonged market downturn in the U.S. or abroad, as a result of the above factors or otherwise, could adversely affect our business, results of operations and financial condition, including capital and liquidity
levels. We are not able to predict with any certainty the ultimate impact that any of these events, as well as any other future events, may have on our business.
Significant downturns in the securities markets or in general economic and political conditions may also decrease the demand for our products and services and could also result in our members reducing their engagement with our platform. In addition, such significant downturns may cause default rates on our loans to increase and cause funding and liquidity concerns for our current and prospective technology platform clients reducing their adoption and use of our platform as a service products and services. Conversely, significant upturns in the securities markets or in general economic and political conditions may cause individuals to be less proactive in seeking ways to improve the returns on their trading or investment decisions and, thus, decrease the demand for our products and services. Any of these changes could cause our future performance to be uncertain or unpredictable, and could have an adverse effect on our business, financial condition and results of operations. In addition, a prolonged weakness in the U.S. equity markets or a general extended economic downturn could cause our members or technology platform clients to incur losses, which in turn could cause our brand and reputation to suffer. If our reputation is harmed, the willingness of our existing members or technology platform clients and potential new members or clients to do business with us could be negatively impacted, which would adversely affect our business, financial condition and results of operations.
Our business is sensitive to interest rates and interest rates are highly sensitive to many factors that are beyond our control, including global, domestic and local economic conditions and the policies of various governmental and regulatory agencies and, in particular, the Federal Reserve. The Federal Reserve increased interest rates throughout 2022 and multiple times in 2023, and we are unable to predict whether it will continue to raise rates further. Further changes to prevailing interest rates could influence not only the interest we receive on loans and investments and the amount of interest we pay on deposits and borrowings, but such changes could also affect (i) our ability to originate loans at competitive rates and obtain deposits; (ii) the fair value of our financial assets and liabilities; (iii) the average duration of our loan portfolios and other interest-earning assets; (iv) the mix of lending products we originate which is influenced by demand for refinancing products; and (v) the competition faced by our SoFi Money deposit product from other investment products which may become more attractive as interest rates rise. See “Changing expectations for inflation and deflation and corresponding fluctuations in interest rates could decrease demand for our lending products and negatively affect loan performance, as well as increase certain operating costs, such as employee compensation” for additional information on the risks of interest rate fluctuations to our business.
Interest rate increases and other actions, including balance sheet management, lending facilities, and the Federal Reserve’s exit from quantitative easing, and similar actions taken by the Federal Reserve or other central banks, are beyond our control and difficult to predict. These actions affect interest rates and the value of financial instruments, increase the likelihood of a more volatile market, a further appreciating U.S. dollar and negative growth in gross domestic product, and affect other assets and liabilities and can impact our members and technology platform clients. Any such downturn, especially in the regions in which we operate, may adversely affect our asset quality, deposit levels, loan demand and results of operations.
Changes to existing laws, regulations and policies and evolving priorities, including those related to financial regulation, taxation, international trade, fiscal policy, cybersecurity and privacy, digital assets, climate change (including any required reduction of greenhouse gas emissions) and healthcare, may adversely impact U.S. or global economic activity and our members, our technology platform clients, our counterparties and our earnings and operations. For example, changes, or proposed changes, to certain U.S. trade and international investment policies, particularly with important trading partners (including China and the European Union (the “EU”)) have in recent years negatively impacted financial markets. Actions taken by other countries, particularly China, to restrict the activities of businesses, could also negatively affect financial markets. An escalation of tensions, such as a further escalation in conflict in the Middle East in connection with the Israel-Hamas war, could lead to further measures that adversely affect financial markets, disrupt world trade and commerce and lead to trade retaliation, including through the use of duties and tariffs, foreign exchange measures or the large-scale sale of U.S. Treasury Bonds.
Any of these developments could adversely affect our business, our members, our technology platform clients, the value of our loan portfolios, our level of charge-offs and provision for credit losses, our capital levels, our liquidity and our results of operations.
We have the option of pursuing a gain-on-sale origination model and, consequently, our business is affected by the cost and availability of funding in the capital markets.
In addition to the issuance of equity, historically we have funded our operations and capital expenditures through sales of our loans, secured and unsecured borrowing facilities and securitizations. We have the option of pursuing a gain-on-sale origination model and, consequently, our earnings and financial condition are largely dependent on the price we can obtain for our products in the capital markets, which has been and may be negatively impacted by interest rates that are higher than those
in the recent past combined with longer periods during which we have held, and may continue to hold, loans on-balance sheet. These capital markets risks may be partially mitigated by the availability of bank deposits and other corporate cash (if any) to temporarily hold the loans on our balance sheet. However, bank deposits and corporate cash have not historically been our primary source of funding and can be impacted by a number of factors. Our ability to obtain financing in the capital markets depends, among other things, on our development efforts, business plans, operating performance, lending activities, public perceptions of the financial services industry, and condition of, and our access to, the capital markets at the time we seek financing. The capital markets have recently and from time to time experienced periods of significant volatility, including volatility driven by rising inflation, uncertainty in the financial services sector, the war between Israel and Hamas, and the ongoing war in Ukraine, among other things. This volatility can dramatically and adversely affect financing costs when compared to historical norms or make funding unavailable. Additional factors that could make financing more expensive or unavailable to us include, but are not limited to, financial losses, events that have an adverse impact on our reputation, lawsuits challenging our business practices, adverse regulatory changes, changes in the activities of our business partners, loan performance, events that have an adverse impact on the financial services industry generally, counterparty availability, negative credit rating actions with respect to our rated securities, corporate and regulatory actions, interest rate changes, general economic conditions, including changing expectations for inflation and deflation, and the legal, regulatory and tax environments governing funding transactions, including existing or future securitization transactions. If financing is difficult, expensive or unavailable, our business, financial condition, results of operations, cash flows and future prospects could be materially and adversely affected.
Changing expectations for inflation and deflation and corresponding fluctuations in interest rates could decrease demand for our lending products and negatively affect loan performance, as well as increase certain operating costs, such as employee compensation.
There is particular uncertainty about the prospects for growth in the U.S. economy. A number of factors influence the potential economic uncertainty, including, but not limited to, changing U.S. consumer spending patterns, elevated and fluctuating inflation and interest rates, reduced consumer discretionary spending, and weakening wage growth and employment levels. For example, the Federal Reserve increased interest rates throughout 2022 and multiple times in 2023, and we are unable to predict whether it will continue to raise rates further. Increased interest rates may decrease borrower demand for certain of our lending products, even as inflation places pressure on consumer spending, borrowing and saving habits as consumers evaluate their prospects for future income growth and employment opportunities in the current economic environment, and as borrowers face uncertainty about the impact of elevated prices on their ability to repay a loan. A change in demand for our lending products and any steps we may take to mitigate such change could impact our credit quality and overall growth. For example, we have experienced lower demand for our home loans in an elevated interest rate environment, as our historical demand has primarily resulted from refinancing, which is less attractive in a higher interest rate environment. Although demand for refinanced student loans has increased following the expiration of the moratorium on federal student loan payments at the end of August 2023, it has not yet returned to pre-COVID levels. We have also focused on personal loan originations to offset the lower demand in other lending products. Personal loans are a higher risk product than home loans or student loans and we have recently seen an increase in the amount of personal loans that we originate which may increase the inherent risk in our overall portfolio. In addition, fluctuating interest rates may increase our cost of capital and ability to offer a competitive interest rate on our loans. Although we closely monitor these increased risks, there is no guarantee we will make the correct adjustments to our originations or make adjustments quickly enough. Furthermore, economic pressure resulting in the inability of a borrower to repay a loan could translate into increased loan defaults, foreclosures and charge-offs and negatively affect our business, financial condition, results of operations, cash flows and future prospects.
Additionally, an inflationary environment combined with a healthy labor market and decreases in the market value of our equity awards could make it more costly for us to attract or retain employees. In order to meet the compensation expectations of our prospective and current employees due to inflationary and other factors, we have in the past and may in the future be required to increase our operating costs or risk losing skilled workers to competitors. See “Personnel and Business Continuity Risks—The job market and the optimization of our workforce creates a challenge and potential risk as we strive to attract and retain a highly skilled workforce” for more information on the risks posed by a competitive labor market.
Fluctuations in interest rates could negatively affect the demand for our checking and savings product.
Falling, low or fluctuating interest rates, which we have experienced in the past and may experience again in the future, may have a negative impact on the demand for our checking and savings product. Checking and savings provides members a digital banking experience that offers a variable annual percentage yield, which is at our discretion. If we are not able to offer competitive interest rates on deposit accounts, demand for our checking and savings product may decrease, which may impact our ability to access deposits as a more cost-effective source of funding for our loans. Although we have been in an elevated interest rate environment in recent years, there is no guarantee that it will remain so or that the interest rate we offer on
deposit accounts will remain competitive and in a falling or low interest rate environment, account holders and prospective account holders may be discouraged from using these products, which would adversely affect our business, financial condition, results of operations, cash flows and future prospects.
Higher than expected payment speeds of loans could negatively impact our returns as the holder of the residual interests in securitization trusts holding personal and student loans. These factors could materially alter our net revenue or the value of our residual interest holdings.
The rate at which borrowers prepay their loans can have a material impact on our net revenue and the value of our residual interests in securitization trusts. Prepayment rates are subject to a variety of economic, social, competitive and other factors, including fluctuations in interest rates, availability of alternative financings, legislative, regulatory or policy changes affecting the student loan market, the home loan market, consumer lending generally and the general economy, including changing expectations for inflation and deflation.
While we anticipate some variability in prepayment rates, extraordinary or extended increases or decreases in prepayment rates could materially affect our liquidity and net revenue. For example, when, as a result of unanticipated prepayment levels, loans within a securitization trust amortize faster than originally contracted due to prepayments, the trust’s pool balance may decline at a rate faster than the prepayment rate assumed when the trust’s bonds were originally issued. If the trust’s pool balance declines faster than originally anticipated, in most of our securitization structures, the bonds issued by that trust will also be repaid faster than originally anticipated. In such cases, our net revenue may decrease, inclusive of our servicing revenue and the diminished value of any retained residual interest by us in the trust.
Finally, rating agencies may place bonds on watch or change their ratings on (or their ratings methodology for) the bonds issued by a securitization trust, possibly raising or lowering their ratings, based upon these prepayment rates and their perception of the risk posed by those rates to the timing of the trust cash flows. Placing bonds on watch, changing ratings negatively, proposing or making changes to ratings methodology could: (i) affect our liquidity, (ii) impede our access to the securitization markets, (iii) require changes to our securitization structures, and (iv) raise or lower the value of the residual interests of our future securitization transactions.
We are exposed to financial risks that may be partially mitigated but cannot be eliminated by our hedging activities, which carry their own risks.
We continue to use, and may in the future use, financial instruments for hedging and risk management purposes in order to protect against possible fluctuations in interest rates, or for other reasons that we deem appropriate. In particular, we expect our interest rate risk to increase with our home loans business which continues to grow, including as a result of our acquisition of Wyndham. However, any current and future hedges we enter into will not completely eliminate the risk associated with fluctuating interest rates and our hedging activities may prove to be ineffective.
The success of our hedging strategy will be subject to our ability to correctly assess counterparty risk and the degree of correlation between the performance of the instruments used in the hedging strategy and any changes in interest rates, along with our ability to continuously recalculate, readjust and execute hedges in an efficient and timely manner. Therefore, though we may enter into transactions to seek to reduce risks, unanticipated changes may create a more negative consequence than if we had not engaged in any such hedging transactions. Moreover, for a variety of reasons, we may not seek to establish a perfect correlation between such hedging instruments and the instruments being hedged. Any such imperfect correlation may prevent us from achieving the effect of the intended hedge and expose us to risk of loss. Any failure to manage our hedging positions properly or inability to enter into hedging instruments under acceptable terms, or any other unintended or unanticipated economic consequences of our hedging activities, could affect our financial condition and results of operations.
Our financial condition and results of operations have been and may in the future be adversely impacted by an epidemic or pandemic, including the COVID-19 pandemic.
Occurrences of epidemics or pandemics, depending on their scale, may cause different degrees of disruption to the regional, state and local economies in which we offer our products and services. For example, the COVID-19 pandemic caused changes in consumer and student behavior, as well as economic disruptions. Any future pandemic or public health crisis may result in, among other impacts, worker shortages, supply chain issues, inflationary pressures, and the reinstatement and subsequent lifting of restrictions and health and safety related measures. Any COVID-19 resurgences or future epidemics or pandemics or other public health crises could adversely affect our business, operations and financial condition, as well as the business, operations and financial conditions of our members, other customers and partners.
See “Our business and results of operations have in the past and may in the future be adversely affected by the financial markets, fiscal, monetary, and regulatory policies, and economic conditions generally” and “Management’s Discussion and Analysis of our Financial Condition and Results of Operations—Key Business Metrics” and “—Consolidated Results of Operations” for further discussion of the impact of macroeconomic conditions in recent periods on our business and operating results.
Strategic and New Product Risks We have in the past consummated, and from time to time we may evaluate and potentially consummate, acquisitions, which could require significant management attention, disrupt our business and adversely affect our financial results.
Our success depends, in part, on our ability to expand our business. In some circumstances, we may determine to do so through the acquisition of complementary assets, businesses and technologies rather than through internal development. For example: (i) in April 2020, we acquired 8 Limited, an investment business in Hong Kong, (ii) in May 2020, we acquired Galileo, a company that provides technology platform services to financial and non-financial institutions, (iii) in February 2022, we acquired Golden Pacific, a bank holding company, (iv) in March 2022, we acquired Technisys, a cloud-native digital multi-product core banking platform, and (v) in April 2023, we acquired Wyndham, a mortgage lender. The identification of suitable acquisition candidates can be difficult, time-consuming and costly, and we may not be able to successfully complete identified acquisitions. The risks we face in connection with acquisitions include, among others:
•diversion of management time and focus from operating our business to addressing acquisition integration challenges;
•coordination of technology, product development, risk management and sales and marketing functions;
•retention of employees from the acquired company and retention of our employees due to cultural challenges associated with integrating employees from the acquired company into our organization;
•integration of the acquired company’s accounting, management information, human resources, third-party risk management and other administrative systems;
•the need to implement or improve controls, procedures and policies at a business that prior to the acquisition may have lacked effective controls, information security and cybersecurity safeguards, procedures and policies, including third-party risk management practices;
•write-offs or impairments of intangible assets, goodwill or other assets recognized in connection with the acquisition;
•liability for activities of the acquired company before the acquisition, including patent and trademark infringement claims, violations of laws, including employment laws, commercial disputes, tax liabilities and other known and unknown liabilities;
•litigation or other claims in connection with the acquired company, including claims from terminated or current employees, customers, former stockholders or other third parties; and
•known and unknown regulatory compliance risks resulting from geographic expansion, including elevated risk factors for tax compliance, money laundering controls, and supervisory controls oversight.
Our failure to address these risks or other problems encountered in connection with our acquisitions and investments could cause us to fail to realize the anticipated benefits of these acquisitions or investments, cause us to incur unanticipated liabilities and harm our business, generally. Future acquisitions could also result in dilutive issuances of our equity securities, the incurrence of debt, contingent liabilities, regulatory obligations to further capitalize our business, goodwill and intangible asset impairments, and increased regulatory scrutiny, any of which could harm our financial condition and negatively impact our stockholders. To the extent we pay the consideration for any future acquisitions or investments in cash, it would reduce the amount of cash available to us for other purposes.
Demand for our products may decline if we do not continue to innovate or respond to evolving technological or other changes.
We operate in a dynamic industry characterized by rapidly evolving technology, frequent product introductions, and competition based on pricing and other differentiators. We continue to explore new product offerings and may rely on our proprietary technology to make our platform available to members, to service member accounts, to provide our technology platform as a service to clients and to introduce new products, which both fosters innovation and introduces new potential liabilities and risks. In addition, we may increasingly rely on technological innovation as we introduce new types of products, expand our current products into new markets, and continue to streamline our platform. For example, while we do not currently
rely heavily on artificial intelligence, we expect to integrate more artificial intelligence into our technology in the future especially to improve the experience of our members. Even if we enhance our current products or release new products that incorporate artificial intelligence, there can be no assurance that our products will be successful or that we will innovate effectively to keep pace with the rapid evolution of artificial intelligence. The process of developing new technologies and products is complex, and if we are unable to successfully innovate and continue to deliver a superior member and technology platform client experience, members’ and clients’ demand for our products may decrease and our growth and operations may be harmed.
An increase in fraudulent activity could lead to reputational damage to our brand and material legal, regulatory and financial exposure (including fines and other penalties), and could reduce the use and acceptance of SoFi Money and SoFi Credit Card.
Financial institutions like us, as well as our members, colleagues, regulators, vendors and other third parties, have experienced a significant increase in fraudulent activity in recent years and will likely continue to be the target of increasingly sophisticated fraudsters and fraud rings in the future. This is particularly true for our newer products where we have limited experience evaluating customer behavior and performing tailored risk assessments, such as checking and savings and credit card.
We develop and maintain systems and processes aimed at detecting and preventing fraudulent activity, which require significant investment, maintenance and ongoing monitoring and updating as technologies and regulatory requirements change and as efforts to overcome security and anti-fraud measures become more sophisticated. Despite our efforts, we have in the past and may in the future be subject to fraudulent activity, which may affect our results of operations. For example, our general and administrative expenses in the past have included charges related to fraud events. The possibility of fraudulent or other malicious activities and human error or malfeasance cannot be eliminated entirely and will evolve as new and emerging technology is deployed, including the increasing use of personal mobile and computing devices that are outside of our network and control environments, particularly as a large part of our workforce works remotely. Risks associated with each of these include theft of funds and other monetary loss, the effects of which could be compounded if not detected quickly. Fraudulent activity may not be detected until well after it occurs and the severity and potential impact may not be fully known for a substantial period of time after it has been discovered.
Fraudulent activity and other actual or perceived failures to maintain a product’s integrity and/or security has led to increased regulatory scrutiny and may lead to regulatory investigations and intervention (such as mandatory card reissuance), increased litigation (including class action litigation), remediation, fines and response costs, negative assessments of us and our subsidiaries by regulators and rating agencies, reputational and financial damage to our brand, and reduced usage of our products and services, all of which could have a material adverse impact on our business. In addition, we offer certain fraud and compliance and risk management services to technology platform clients as part of our platform as a service offerings and regulatory scrutiny of these types of services has increased recently. Any failure in these services provided to technology platform clients could result in regulatory actions or fines, and potential loss of client accounts.
Successful fraudulent activity and other incidents related to the actual or perceived failures to maintain the integrity of our processes and controls could negatively affect us, including harming the market perception of the effectiveness of our security measures or harming the reputation of the financial system in general, which could result in reduced use of our products and services. Such events could also result in legislation and additional regulatory requirements. Although we maintain insurance, there can be no assurance that liabilities or losses we may incur will be covered under such policies or that the amount of insurance will be adequate.
SoFi may be unable to realize the anticipated benefits of acquiring Technisys.
We closed the Technisys acquisition in March 2022 and its operations have been largely integrated into our business. The success of the Technisys acquisition, including anticipated benefits and cost savings and potential additional revenue opportunities, will depend, in part, on our ability to realize various benefits, including, among other things, the development of an end-to-end vertically integrated banking technology stack to support multiple products and enable the combined company to meet the expanding needs of existing customers and serve additional established banks, fintechs and non-financial brands looking to enter financial services. The inability to realize our expected cost savings in connection with the Technisys’ acquisition could have an adverse effect on our business, financial condition, operating results and prospects. Failure to achieve these anticipated benefits could result in increased costs, decreases in the amount of expected revenues, lost cost savings and incremental revenue opportunities and diversion of management’s time and energy and could have an adverse effect on our business, financial condition, operating results and prospects.
We may continue to expand operations abroad where we have limited operating experience and may be subject to increased business, economic and regulatory risks that could adversely impact our financial results.
In April 2020, we undertook our first international expansion by acquiring 8 Limited, an investment business in Hong Kong. Additionally, with the acquisition of Galileo in May 2020, we gained clients in Canada, Mexico and Colombia and, with the acquisition of Technisys in March 2022, we further expanded our operations into Latin America. We may, in the future, continue to pursue further international expansion of our business operations, either organically or through acquisitions, in new international markets where we have limited or no experience in marketing, selling and deploying our products and services. If we fail to deploy or manage our operations in these countries successfully, our business and operations may suffer. In addition, we are subject to a variety of risks inherent in doing business internationally, including:
•political, social and/or economic instability or military conflict;
•risks related to governmental regulations in foreign jurisdictions, including regulations relating to privacy, and unexpected changes in regulatory requirements and enforcement;
•fluctuations in currency exchange rates and global market volatility;
•higher levels of credit risk and fraud;
•enhanced difficulties of integrating foreign acquisitions;
•burdens of enforcing and complying with a variety of foreign laws;
•reduced protection for intellectual property rights in some countries;
•difficulties in staffing and managing global operations and the increased travel, infrastructure and legal compliance costs associated with multiple international locations and subsidiaries;
•different regulations and practices with respect to employee/employer relationships, existence of workers’ councils and labor unions, and other challenges caused by distance, language, and cultural differences, making it harder to do business in certain international jurisdictions;
•compliance with statutory equity requirements; and
•management of tax consequences.
If we are unable to manage the complexity of global operations successfully, our financial performance and operating results could suffer.
Credit Market Related Risks We operate in a cyclical industry. In an economic downturn, member default rates may increase, there may be decreased demand for our products, and there may be adverse impacts to our business.
Recent macroeconomic factors, such as elevated interest rates, global events and market volatility, may cause the economy to enter into a period of slower economic growth or a recession, the length and severity of which cannot be predicted. Such uncertainty and negative trends in general economic conditions can have a significant negative impact on our ability to generate adequate revenue and to absorb expected and unexpected losses. Many factors, including factors that are beyond our control, may result in higher default rates by our members and non-payment by our technology platform clients, a decline in the demand for our products, and potentially impact our ability to make accurate credit assessments, lending decisions or technology platform client selections. Any of these factors could have a detrimental impact on our financial performance and liquidity.
Our Lending and Financial Services segments may be particularly negatively impacted by worsening economic conditions that place financial stress on our members resulting in loan defaults or charge-offs. If a loan charges off while we are still the owner, the loan either enters a collections process or is sold to a third-party collection agency and, in either case, we will receive less than the full outstanding interest on, and principal balance of, the loan. Declining economic conditions may also lead to either decreased demand for our loans or demand for a higher yield on our loans, and consequently lower prices or a lower advance rate, from institutional whole loan purchasers, securitization investors and warehouse lenders on whom we rely for liquidity.
The longevity and severity of a downturn or recession will also place pressure on lenders under our debt warehouses, whole loan purchasers and investors in our securitizations, each of whom may have less available liquidity to invest in our loans, and long-term market disruptions could negatively impact the securitization market as a whole. Although certain of our
debt warehouses contain committed terms, there can be no assurance that our financing arrangements will remain available to us through any particular business cycle or be renewed on the same terms. The timing and extent of a downturn may also require us to change, postpone or cancel our strategic initiatives or growth plans to pursue shorter-term sustainability. The longer and more severe an economic downturn, the greater the potential adverse impact on us.
Our Technology Platform segment is also susceptible to worsening economic conditions that place financial stress on our current clients using our platform as a service products and services and potential new clients interested in such services. These clients and potential clients may experience liquidity and other financial issues or strategically slowdown growth, any of which could lead them to decrease or terminate their use of our technology platform services or delay or reject implementation of new or expanded products and services. Any such actions with respect to our technology platform products and services could have an adverse impact on our business.
There can be no assurance that economic conditions will be favorable for our business, that interest in purchasing our loans by financial institutions or investment by clients in our platform as a service products and services will remain at current levels, or that default rates by our members or instances of non-payment by our technology platform clients will not increase. Reduced demand, lower prices or a lower advance rate for our loan products from institutional whole loan purchasers, securitization investors and warehouse lenders, increased default rates by our members, and reduced demand, lower prices and increased non-payment by our technology platform clients, may limit our access to capital, including debt warehouse facilities, securitizations and secured and unsecured borrowing facilities, and negatively impact our profitability. These impacts, in addition to limiting our access to capital and negatively impacting our profitability, could also, in turn, increase the volatility of the mark-to-market methodology we use to determine the fair value of the loans and credit card receivables we hold on balance sheet and consequently have a material adverse effect on our revenues, results of operations, capital requirements, liquidity and cash flows.
If we do not make accurate credit and pricing decisions or effectively forecast our loss rates, our business and financial results will be harmed, and the harm could be material.
In making a decision whether to extend credit to prospective or existing members, we rely upon data to assess our ability to extend credit within our risk appetite, our debt servicing capacity, and overall risk level to determine lending exposure and loan pricing. If the decision components, rapidly deteriorating macroeconomic conditions or analytics are either unstable, biased, or missing key pieces of information, the wrong decisions will be made, which will negatively affect our financial results. If our credit decisioning strategy fails to adequately predict the creditworthiness of our members, including a failure to predict a member’s true credit risk profile and ability to repay their loan or credit card balance, higher than expected loss rates will impact the fair value of our loans and credit card receivables. Additionally, if any portion of the information pertaining to the prospective member is false, inaccurate or incomplete, and our systems did not detect such falsities, inaccuracies or incompleteness, or any or all of the other components of our credit decision process fails, we may experience higher than forecasted losses, including losses attributed to fraud. Furthermore, we rely on credit reporting agencies to obtain credit reports and other information we rely upon in making underwriting and pricing decisions. If one of these third parties experiences an outage, if we are unable to access the third-party data used in our decision strategy, if such data contains inaccuracies or our access to such data is limited, our ability to accurately evaluate potential members will be compromised, and we may be unable to effectively predict credit losses inherent in our loan portfolio, which would negatively impact our results of operations, which could be material.
Additionally, if we make errors in the development, validation, or implementation of any of the underwriting models or tools that we use for the loans securing our debt warehouses or included in securitization transactions or whole loan sales, such loans may experience higher delinquencies and losses, which would negatively impact our debt warehouse financing terms and future securitization and whole loan sale transactions.
If the information provided to us by applicants is incorrect or fraudulent, we may misjudge an applicant’s qualification to receive a loan or use one of our products, and our results of operations may be harmed.
Our lending and platform access decisions are based partly on information provided to us by applicants. To the extent that an applicant provides information to us in a manner that we are unable to verify, or the information provided by an applicant consists of data obtained under false pretenses by third parties, is a manufactured/synthetic identity, or is a stolen identity, our credit decisioning process may not accurately reflect the associated risk. In addition, data provided by third-party sources, including credit reporting agencies, is a significant component of our credit decisions and this data may contain inaccuracies. Inaccurate analysis of credit data that could result from false loan application information could harm our reputation, business and results of operations. Additionally, we rely on the accuracy of applicant information in approving applicants for our non-lending products, such as SoFi Money, SoFi Credit Card or SoFi Invest accounts. If the information provided to us by these applicants is incorrect or fraudulent and we are unable to detect the inaccuracies, it increases our
regulatory and fraud risk and the risk of identity theft to our members, and could harm our reputation, business and results of operations.
We use identity and fraud prevention tools to analyze data provided by external databases or automated physical identity document proofing technologies to authenticate each applicant’s identity. These fraud prevention tools, scores, and data aggregators are reliant on sustained access to reliable data sources to facilitate robust verification which have reduced effectiveness with diminished data access. From time to time in the past, however, these checks have failed and there is a risk that these checks could fail in the future and fraud, which may be significant, may occur and go undetected. For example, in the past we have identified certain fraudulent activity related to our personal loans product. While the fraudulent activity was detected and the losses were recognized in our results of operations, there can be no assurance there will not be future instances of fraud, that we will be able to detect such fraudulent activity in a timely manner, or that such future fraudulent activity will not be material. We may not be able to recoup funds underlying loans made in connection with inaccurate statements, omissions of fact or fraud, in which case our revenue, results of operations and profitability will be harmed. Fraudulent activity or significant increases in fraudulent activity could also lead to regulatory intervention, which could negatively impact our results of operations, brand and reputation, and require us to take steps to reduce fraud risk, which could increase our costs.
Internet-based loan origination processes may give rise to greater risks than paper-based processes.
We use internet-based loan processes to obtain application information and distribute certain legally required notices to applicants for, and borrowers of, our loans and to obtain electronically signed loan documents in lieu of paper documents with ink signatures obtained in person. These processes may entail greater risks than paper-based loan origination processes, including regarding the sufficiency of notice for compliance with consumer protection laws, risks that borrowers may challenge the authenticity of loan documents, or the validity of the borrower’s electronic signature on loan documents, and risks that unauthorized changes are made to the electronic loan documents. If any of those factors were to cause our loans, or any of the terms of our loans, to be unenforceable against the relevant borrowers, or impair our ability to service our loans (as master servicer or servicer), the value of our loan assets would decrease significantly to us and to our whole loan purchasers, securitization investors and warehouse lenders. In addition to increased default rates and losses on our loans, this could lead to the loss of whole loan purchasers and securitization investors and trigger terminations and amortizations under our debt warehouse facilities, each of which would materially adversely impact our business.
Student loans are subject to discharge in certain circumstances.
Private education loans, including the refinanced student loans and other student loans made by us, are generally not dischargeable by a borrower in bankruptcy. However, a private education loan may be discharged if a debtor files an adversary claim and the bankruptcy court determines that not discharging the debt would impose an undue hardship on the debtor and the debtor’s dependents. New policies implemented by the Biden Administration in late 2022 gave judges more leeway to discharge student loans, resulting in more borrowers discharging their student loans in bankruptcy in 2023, compared to prior years. In addition, in November 2022, the Department of Justice introduced a new process for handling student loan discharge cases intended to reduce the burden on debtors pursuing discharge of their federal student loans in bankruptcy. Further, bills have been introduced in Congress that would make student loans dischargeable in bankruptcy to the same extent as other forms of unsecured credit without regard to a hardship analysis. For example, in October 2022, then House Judiciary Chair Jerrold Nadler and Representative David Cicilline introduced the Student Borrower Bankruptcy Relief Act of 2022, which would eliminate the section of the U.S. bankruptcy code that makes private and federal student loans non-dischargeable through bankruptcy. It is possible that a higher percentage of borrowers will obtain relief under bankruptcy or other debtor relief laws in the future than is reflected in our historical experience. A private education loan that is not a refinanced parent-student loan is also generally dischargeable as a result of the death or disability of the borrower. The discharge of a significant amount of our loans could adversely affect our business and results of operations. See “Regulatory, Tax and Other Legal Risks—Legislative and regulatory policies and related actions have had and could in the future have a material adverse effect on our student loan portfolios and our student loan origination volume.”
We offer personal loans, which have a limited performance history, and therefore we have only limited prepayment, loss and delinquency data with respect to such loans on which to base projections.
The performance of the personal loans we offer is significantly dependent on the ability of the credit decisioning, income validation, and scoring models we use to originate such loans, which include a variety of factors, to effectively evaluate an applicant’s credit profile and likelihood of default. Despite recession-readiness planning and stress forecasting, there is no assurance that our credit criteria can accurately predict loan performance under economic conditions such as a prolonged down-cycle or recessionary economic environment or the governmental response to periods of disruption, which may drive unexpected outcomes. If our criteria do not accurately reflect credit risk on the personal loans, greater than expected losses may
result on these loans and our business, operating results, financial condition and prospects could be materially and adversely affected.
In addition, personal loans are dischargeable in a bankruptcy proceeding involving a borrower without the need for the borrower to file an adversary proceeding. The discharge of a significant amount of our personal loans could adversely affect our financial condition. Furthermore, other characteristics of personal loans may increase the risk of default or fraud and there are few restrictions on the uses that may be made of personal loans by borrowers, which may result in increased levels of credit consumption. We also originate a material portion of our personal loans through ACH deposits directly to the borrowers, which may result in a higher risk of fraud. The effect of these factors may be to reduce the amounts collected on our personal loans and adversely affect our operating results and financial condition.
We service all of the personal loans we originate and credit cards we issue and have limited servicing experience, and we rely on third-party service providers to service the student loans and home loans we originate, and to perform various other functions in connection with the origination and servicing of certain of our loans. If we or a third-party service provider fails to properly perform these functions, our business and our ability to service our loans may be adversely affected.
We service all of the personal loans we originate and, in all material respects, all of the credit cards we issue, and we have limited experience with such servicing. We may begin servicing the student loans that we originate at some time in the future. We rely on sub-servicers to service all of our student loans and our home loans that we deliver to GSEs and do not sell servicing-released, and to perform certain back-up servicing functions with respect to our personal loans. In addition, we rely on third-party service providers to perform various functions relating to our loan origination and servicing business, including fraud detection, marketing, operational functions, cloud infrastructure services, information technology, telecommunications and processing remotely created checks. While we oversee these service providers to ensure they service our loans in accordance with our agreements and regulatory requirements, we do not have control over the operations of any of the third-party service providers that we utilize. In the event that a third-party service provider for any reason fails to perform such functions, including through negligence, willful misconduct or fraud, our ability to process payments and perform other operational functions for which we currently rely on such third-party service providers will suffer and our business, cash flows and future prospects may be negatively impacted.
Any failure on our part or on the part of third parties on whom we rely to perform functions related to our servicing activities to properly service our loans could result in us being removed as the servicer on the loans we originate, including loans financed by our warehouse facilities or sold into our whole loan sales channel and securitization transactions. If we fail to monitor our student loan sub-servicer and ensure that such sub-servicer complies with its obligations under state laws that require student loan servicers to be licensed, we may face civil claims for damages under such state laws. Because we receive revenue from such servicing activities, any such removal as the servicer or, with respect to our student loans, master servicer, could adversely affect our business, operating results, financial condition or prospects, as would the cost of onboarding a new servicer. Furthermore, we have agreed in our servicing agreements to service loans in accordance with the standards set forth therein, and may be obligated to repurchase loans or indemnify the buyer of any such loans if we fail to meet those standards.
Additionally, if one or more key third-party service providers were to cease to exist, to become a debtor in a bankruptcy or an insolvency proceeding or to seek relief under any debtor relief laws or to terminate its relationship with us, there could be delays in our ability to process payments and perform other operational functions for which we are currently relying on such third-party service provider, and we may not be able to promptly replace such third-party service provider with a different third-party service provider that has the ability to promptly provide the same services in the same manner and on the same economic terms. As a result of any such delay or inability to replace such key third-party service provider, our ability to process payments and perform other business functions could suffer and our business, cash flows and future prospects may be negatively impacted.
We perform and manage the loan origination process for all of the home loans that we originate. If we fail to properly perform these functions, our home loans business may be adversely affected.
In April 2023, we acquired Wyndham, a mortgage lender, expanding our home loans business. In connection with the acquisition of Wyndham, we adopted loan origination technology which facilitates performing many functions in connection with the origination of home loans, including processing, underwriting, pricing, vendor management, closing, and additional functions for loan origination that we previously outsourced to third-party providers, and we now directly manage loan underwriters and loan processors which are services previously managed by third-party providers. In the event that we fail for any reason to perform or manage such functions in accordance with all applicable requirements, including through human errors, technology errors, negligence, willful misconduct or fraud, our ability to originate home loans will suffer and our business, cash flows and future prospects may be negatively impacted, and we could incur penalties or liabilities including obligations to repurchase loans from investors to whom we sold the loans. Additionally, if we fail to perform such functions or
properly manage our new resources, we may be unable to complete, or be delayed in the completion of, the origination of home loans in our pipeline and to originate new home loans, and we may not be able to onboard a replacement service provider that has the ability to promptly provide the same services in the same manner and on the same economic terms.
Potential geographic concentration of our members may increase the risk of loss on the loans that we originate and negatively impact our business.
Any concentration of our members in specific geographic areas may increase the risk of loss on our loans. Certain regions of the U.S. from time to time will experience weaker economic conditions and higher unemployment and, consequently, will experience higher rates of delinquency and loss than on similar loans in other regions of the country. Moreover, a further deterioration in economic conditions or a recession, outbreaks of disease (such as additional COVID-19 strains or variants), the continued increase in extreme weather conditions and other natural events (such as hurricanes, tornadoes, floods, drought, wildfires, mudslides, earthquakes and other extreme conditions) and other factors could adversely affect the ability and willingness of borrowers in affected regions to meet their payment obligations under their loans and may consequently affect the delinquency and loss experience of such loans. In addition, we, as master servicer for all student loans and home loans and as servicer of our personal loans, have offered in the past, and may in the future offer, hardship forbearance or other relief programs in certain circumstances to affected borrowers.
Conversely, an improvement in economic conditions in one or more of the geographic areas in which we have members could result in higher prepayments of their payment obligations under their loans by borrowers in such states. As a result, we and the whole loan purchasers who hold our loans or securitization investors or warehouse lenders who hold securities backed by our loans may receive principal payments earlier than anticipated, and fewer interest payments than anticipated, and face certain reinvestment risks, such as the inability to acquire loans on equally attractive terms as the prepaid loans. In addition, higher prepayments than anticipated may have a negative impact on our servicing revenue which could cause our operating results and financial condition to be materially and adversely affected.
Further, the concentration of our loans in one or more geographic locations may have a disproportionate effect on us or investors in our loans or securities backed by our loans if governmental authorities in any of those areas take action against us as originator, master servicer or servicer of those loans or take action affecting our ability as master servicer or servicer to service those loans.
Funding and Liquidity Risks If we are unable to retain and/or increase our current sources of funding, including deposits, and secure new or alternative methods of financing, our ability to finance additional loans and introduce new products will be negatively impacted.
Historically, in addition to the issuance of equity, we have funded our operations and capital expenditures primarily through access to the capital markets through sales of our loans, access to secured and unsecured borrowing facilities and utilization of securitization financing from consolidated and nonconsolidated VIEs. In each of these instances (other than for certain whole loan sales of home loans), we retain the servicing rights to our loans from which we earn a servicing fee. In securitization financing transactions, we transfer a pool of loans originated by SoFi Lending Corp. or SoFi Bank to a VIE which is sponsored by SoFi Lending Corp. or SoFi Bank, and we retain risk in the VIE, typically in the form of asset-backed bonds and residual interest investments. Through SoFi Bank, we utilize deposits as well, which offer us a lower cost source of funds, and we have the ability to access other funding sources, such as the FHLB and certain brokered deposit channels established by SoFi Bank. We rely on each of these outlets for liquidity and the loss or reduction of any one of these outlets, including deposits, could materially adversely impact our business. For example, certain banks have faced operational difficulties in accessing the FHLB discount window and there is no guarantee that we will not face the same or similar issues. In addition, there can be no assurance that we will be able to successfully access the securitization markets at any given time, or that deposits at SoFi Bank will remain at current levels or grow, and in the event of a sudden or unexpected shortage of funds in the banking and financial system, we cannot be sure that we will be able to maintain necessary levels of funding without incurring high funding costs, a reduction in the term of funding instruments, an increase in the amount of equity we are required to hold or the liquidation of certain assets. Furthermore, there is a risk that there will be no market at all for our loans either from whole loan buyers or through investments in securities backed by our loans.
We may require capital in excess of amounts we currently anticipate, and depending on market conditions and other factors, we may not be able to maintain our capital or obtain additional capital for our current operations or anticipated future growth on reasonable terms or at all. As the volume of loans that we originate, and the increased suite of products that we make available to members, increases, we may be required to expand the size of our debt warehousing facilities or seek additional sources of capital. The availability of these financing sources depends on many factors, some of which are outside of our
control. We may also experience the occurrence of events of default or breaches of financial performance or other covenants under our debt agreements, which could reduce or terminate our access to institutional funding.
If we are unable to increase our current sources of funding, including deposits, and secure new or alternative methods of financing, our ability to finance additional loans and to develop and offer new products will be negatively impacted. The interest rates, advance rates and other costs of new, renewed or amended facilities may also be higher than those currently in effect. If we are unable to renew or otherwise replace these facilities or generally arrange new or alternative methods of financing on favorable terms, we may be forced to curtail our origination of loans or reduce lending or other operations, which would have a material adverse effect on our business, financial condition, operating results and cash flows.
If one or more of our warehouse facilities, on which we are highly dependent, is terminated or otherwise becomes unavailable, we may be unable to find replacement financing on favorable terms, or at all, which would have a material adverse effect on our business and financial condition.
We require a significant amount of short-term funding capacity for loans we originate. Consistent with industry practice, our existing warehouse facilities generally require periodic renewal. If any of our committed warehouse facilities are terminated or are not renewed or our uncommitted facilities are not honored, we may be unable to find replacement financing on favorable terms, or at all, and we might not be able to originate an acceptable or sustainable volume of loans, which would have a material adverse effect on our business. Additionally, as our business continues to expand, including our home loan business, we may need additional warehouse funding capacity for the loans we originate. There can be no assurance that, in the future, we will be able to obtain additional warehouse funding capacity on favorable terms, on a timely basis, or at all.
If we fail to meet or satisfy any of the financial or other covenants included in our warehouse facilities, we would be in default under one or more of these facilities and our lenders could elect to declare all amounts outstanding under the facilities to be immediately due and payable, enforce their interests against loans pledged under such facilities and restrict our ability to make additional borrowings. Certain of these facilities also contain cross-default provisions. These restrictions may interfere with our ability to obtain financing or to engage in other business activities, which could materially and adversely affect us. There can be no assurance that we will maintain compliance with all financial and other covenants included in our warehouse facilities in the future.
In addition, our agreements with our warehouse lenders contain various concentration limits and triggers, including related to excess spread. As high interest rates place pressure on our net cost of funds for loans held at SoFi Lending Corp., which do not benefit from deposit funding through SoFi Bank, the likelihood of reaching an excess spread limit increases. A breach of such limits or other similar terms of such agreements could result in an inability to place loans in the relevant warehouse facilities and require us to pursue other forms of financing. If we are unable to find replacement financing on favorable terms, or at all, our operations could be impacted materially.
Increases in member default rates on loans could make us and our loans less attractive to whole loan buyers, lenders under debt warehouse facilities and investors in securitizations, which may adversely affect our access to financing and our business.
Increases in member default rates, due to deteriorating economic conditions or other factors, could make us and our loans less attractive to our existing or prospective funding sources, including whole loan buyers, securitization investors and lenders under debt warehousing facilities. If our existing funding sources do not achieve their desired financial returns or if they suffer losses, they or prospective funding sources may increase the cost of providing future financing or refuse to provide future financing or purchase loans on terms acceptable to us or at all.
Our securitizations are nonrecourse to the Company and are collateralized by the pool of our loans pledged to the relevant securitization issuer. If the loans securing our securitizations fail to perform as expected, rating agencies may place our bonds on watch or change their ratings on (or their ratings methodology for) the bonds issued by our securitization trusts. Our loans performance and any actions taken by the rating agencies could result in the lenders under our warehouse facilities, the whole loan purchasers who purchase our loans, the investors in our securitizations who purchase securities backed by our loans, or future lenders, whole loan purchasers or securitization investors in similar arrangements, increasing the cost of providing future financing or refusing to provide future financing or purchase loans on terms acceptable to us or at all.
While this risk may be partially mitigated by our ability to hold loans on our balance sheet, in sufficient volume this will negatively impact our financial condition. Consequently, if we were to be unable to arrange new or alternative methods of financing on favorable terms, we may have to curtail or cease our origination of loans, which could have a material adverse effect on our business, financial condition, operating results and cash flows.
We make representations and warranties in connection with the transfer of loans to whole loan purchasers, government-sponsored enterprises, and our debt warehouse lenders and securitization trusts. If such representations and warranties are not correct, we could be required to repurchase loans or indemnify the purchaser, which could have an adverse effect on our ability to operate and fund our business.
We sell and finance the loans we originate to and with third parties, including, with respect to home loans, counterparties like GSEs, and we make certain representations and warranties to those third parties in connection with the transfer of loans described below. In the ordinary course of business, we are exposed to liability under these representations and warranties made to purchasers of loans. Such representations and warranties typically include, among other things, that the loans were originated and serviced in compliance with the law and with our credit risk origination policy and servicing guidelines, and, in connection with transfers to GSEs, that the loans were originated in compliance with the guidelines of the relevant GSE, and that, to the best of our knowledge, each loan was originated by us without any fraud or misrepresentation on our part or on the part of the borrower or any other person. In addition, purchasers require loans to meet strict underwriting and loan term criteria in order to be eligible for purchase. If those representations and warranties are breached as to a given loan, or if a certain loan we sell does not meet the relevant eligibility criteria, we will be obligated to repurchase the loan, typically at a purchase price equal to the then-outstanding principal balance of such loan, plus accrued interest and any premium. We may also be required to indemnify the purchaser for losses resulting from the breach of representations and warranties. With regard to home loans insured by the Federal Housing Administration or the VA, and to the extent that any of our home loans do not comply with Federal Housing Administration or VA guidelines, we could also face claims under the False Claims Act. In connection with our whole loan sales, we also typically covenant to repurchase any loan that enters delinquent status within the first thirty to sixty days following origination of the loan. Any significant increase in our obligation to repurchase loans or indemnify purchasers of loans could have a significant adverse impact on our cash flows, even if they are reimbursable, and could also have a detrimental effect on our business and financial condition. If any such repurchase event occurs on a large scale, we may not have sufficient funds to meet our repurchase obligations, which would result in a default under the underlying agreements. Moreover, we may not be able to resell or refinance loans repurchased due to a breach of a representation or warranty or we may be forced to sell such loans below par. Any such event could have an adverse impact on our business, operating results, financial condition and prospects. In addition, in the acquisition of Wyndham, we also acquired Wyndham's liability to its loan investors and loan insurers for mortgage loans originated by Wyndham, including repurchase obligations that might not be contingent upon the investor proving an error by Wyndham.
In addition to loan level representations and warranties, our agreements with the lenders and investors on our securitizations, debt warehouse facilities and corporate revolving debt contain a number of corporate financial covenants and early payment triggers and performance covenants. These facilities, together with deposits, are the primary funding sources available to support the maintenance and growth of our business and our liquidity would be materially adversely affected by our inability to comply with the various covenants and other specified requirements set forth in our agreements with our lenders and investors, which could result in the early amortization, default and/or acceleration of our existing facilities. Such covenants and requirements include financial covenants, portfolio performance covenants and other events. For a description of these covenants, requirements and events, see “Management’s Discussion and Analysis of Financial Condition and Results of Operations — Liquidity and Capital Resources”.
During an early amortization period or occurrence of a termination event or an event of default, principal collections from the loans in our warehouse facilities would be applied to repay principal under such facilities rather than being available to fund newly originated loans. During the occurrence of a termination event or an event of default under any of our facilities, the applicable lenders could accelerate the related debt and such lenders’ commitments to extend further credit under the related facility, if any, would terminate. If we were unable to repay the amounts due and payable under such facilities and securitizations, the applicable lenders and noteholders could seek remedies, including against the collateral pledged under such facilities and by the securitization trust. An acceleration of the debt under certain facilities could also lead to a default under other facilities and, in certain instances, our hedging arrangements, due to cross-default and cross-acceleration provisions.
An early amortization event or event of default would negatively impact our liquidity, including our ability to originate new loans, and require us to rely on alternative funding sources, which might increase our funding costs or which might not be available when needed. If we were unable to arrange new or alternative methods of financing on favorable terms, we might have to hold loans on balance sheet in an amount that may negatively impact our financial condition, or curtail or cease the origination of loans, which could impair our growth, and, in each case, have a material adverse effect on our business, financial condition, operating results and cash flows, which in turn could have a material adverse effect on our ability to meet our obligations under our facilities.
We require substantial capital and, in the future, may require additional capital to pursue our business objectives and achieve recurring profitability. If adequate capital is not available to us or is unavailable on favorable terms, including due to the cost and availability of funding in the capital markets, our business, operating results and financial condition may be harmed.
Since our founding, we have raised substantial equity and debt financing to support the growth of our business. We may require additional capital to pursue our business objectives and growth strategy and respond to business opportunities, challenges or unforeseen circumstances, including supporting our lending operations, increasing our marketing expenditures to attract new members and technology platform clients and improve our brand awareness, developing our products, introducing new services, further expanding internationally in existing or new countries or further improving existing offerings and services, enhancing our operating infrastructure and potentially acquiring complementary businesses and technologies, and complying with the increased regulatory requirements for bank holding companies and banks. Accordingly, on a regular basis we need, or we may need, to engage in additional debt or equity financings to secure additional funds. However, additional funds may not be available when we need them, in amounts we need, or permitted to be applied to specific use cases, on terms that are acceptable to us or at all. Volatility in the credit markets in general or in the market for personal, student and home loans and credit cards in particular may also have an adverse effect on our ability to obtain debt financing. Furthermore, the cost of our borrowing has increased and may continue to increase due to market volatility, interest rates that are higher than those in the recent past, changes in the risk premiums required by lenders or the unavailability of traditional sources of debt capital. Volatility or depressed valuations or trading prices in the equity markets may similarly adversely affect our ability to obtain equity financing. Furthermore, if we raise additional funds through further issuances of equity or convertible debt securities, our existing stockholders could suffer significant dilution and any new equity securities we issue could have rights, preferences and privileges superior to those of holders of our common stock.
We are required to serve as a source of financial strength for SoFi Bank, which is subject to minimum capital requirements imposed by federal regulators, which means that we may be required to provide capital or liquidity support to SoFi Bank, even at times when we may not have the resources to provide such support. In addition, maintaining adequate liquidity is crucial to our securities brokerage, including key functions such as transaction settlement, custody requirements and margin lending. Our broker-dealer subsidiary, SoFi Securities, is subject to Rule 15c3-1 under the Exchange Act, which specifies minimum capital requirements intended to ensure the general financial soundness and liquidity of broker-dealers, and SoFi Securities is subject to Rule 15c3-3 under the Exchange Act, which requires broker-dealers to maintain certain liquidity reserves. We meet our liquidity needs primarily from working capital, deposits and cash generated by member activity, as well as from external debt and equity financing. Increases in the number of members, fluctuations in member cash or deposit balances, as well as market conditions or changes in regulatory treatment of member deposits, may affect our ability to meet our liquidity needs.
A reduction in our liquidity position could reduce our members’ confidence in us, which could result in the withdrawal of member assets, including deposits held at SoFi Bank, and loss of members, or could cause us to fail to satisfy minimum capital requirements for SoFi Bank, or broker-dealer or other regulatory capital guidelines, which may result in immediate suspension of banking and other securities activities, regulatory prohibitions against certain business practices, increased regulatory inquiries and reporting requirements, increased costs, fines, penalties or other sanctions, by the Federal Reserve, the OCC, the SEC, FINRA or other SROs or state regulators, and could ultimately lead to the liquidation of SoFi Bank or our broker-dealer or other regulated entities. Factors which may adversely affect our liquidity position include temporary liquidity demands due to timing differences between brokerage transaction settlements and the availability of segregated cash balances, fluctuations in cash held in member accounts, a significant increase in our margin lending activities, increased regulatory capital requirements, changes in regulatory guidance or interpretations, or Federal Housing Administration or VA guidelines, other regulatory changes or a loss of market or member confidence resulting in unanticipated withdrawals of member assets. We expect that we will continue to use our available cash to fund our lending activities and help scale our Financial Services segment. To supplement our cash resources, we may seek to enter into additional securitizations and whole loan sale agreements or increase the size of existing debt warehousing facilities, increase the size of, or replace, our revolving credit facility, continue to grow deposits and pursue other potential options. In addition, a reduction in our liquidity position could impair our technology platform clients’ confidence in us and our platform as a service products and services, many of which require capital investments and ongoing platform maintenance by us, which could result in decisions by our technology platform clients to terminate or not renew their existing contracts or to not add new products to their account.
If we are unable to adequately maintain our cash resources, we may delay non-essential capital expenditures, implement cost cutting procedures, delay or reduce future hiring, discontinue the pursuit of our strategic objectives and growth strategies or reduce our rate of future originations compared to the current level. There can be no assurance that we can obtain sufficient sources of external capital to support the growth of our business. Delays in doing so or failure to do so may require us
to reduce loan originations or reduce our operations, which would harm our ability to pursue our business objectives as well as harm our business, operating results and financial condition.
We are unable to finance all of the receivables that we originate or other assets that we hold, and that illiquidity could result in a negative impact on our financial condition.
We have the option of pursuing a gain-on-sale origination model, the success of which is tied to our ability to finance the assets that we originate. Certain of our assets, however, are ineligible for sale to a whole loan buyer or securitization trust, or are ineligible for, or are subject to a lower advance rate under, warehouse funding, each of which has specific eligibility criteria for receivables it purchases or holds as collateral. Ineligible receivables include, among others, those in default or that are delinquent, receivables with defects in their origination or servicing, including fraud, or receivables generated under origination guidelines and credit policies that are no longer in effect. In addition, many of our warehouse funding sources contain excess concentration limits for loans in forbearance or with specific loan level characteristics such as time-to-maturity or loan type. Once these limits have been exceeded, the advance rate applied to those receivables becomes less advantageous to us. If we are unable to sell or reasonably fund these receivables, we are required to hold them on our consolidated balance sheet which, in sufficient volume, negatively impacts our financial condition.
In addition to the receivables described above, we also hold on our consolidated balance sheet certain risk retention assets with respect to which we have a reduced ability to receive financing. These risk retention assets include residuals from our securitization trusts that are either ineligible for transfer or are subject to EU regulations. The illiquidity of these positions may negatively impact our financial condition.
Our checking and savings product is expected to continue to provide us with an important source of cost-efficient funding and any failure to scale the product due to our limited experience or a competitive marketplace could have a negative impact on our business, operating results and financial condition.
We expect that checking and savings, a deposit account product, will continue to provide us with an important source of deposits to use for cost-effective funding of loan originations and other activities. However, revenue growth for checking and savings is dependent on increasing the volume of members who open an account and on growing balances in those accounts. Although checking and savings accounts have grown since its introduction in the first quarter of 2022, there is no guarantee that account openings and the amount on deposit in those accounts will continue to grow. In addition, although we have invested in a number of initiatives to attract new checking and savings account holders and capture a greater share of our members’ savings, including offering a competitive annual percentage yield on deposits and offering SoFi Plus membership benefits to deposit holders, there can be no assurance that these investments to acquire and retain members, provide differentiated features and services and spur usage of our deposit account product will be effective or cost effective. There are also no assurances that we will be able to maintain a competitive annual percentage yield on deposits, and members can easily transfer checking and savings account balances to our competitors. Further, developing our service offerings and marketing the checking and savings product in additional customer acquisition channels could have higher costs than anticipated or be less effective than anticipated, and could adversely impact our results or dilute our brand. Finally, our checking and savings product faces competition from similar products offered by our competitors which may offer more attractive features, including a higher interest rate on deposits, which may impact the success of the product. In the event we are unable to sufficiently grow the checking and savings product, we may be required to find alternative, higher-cost funding for our lending and other activities, or we might not be able to originate an acceptable or sustainable volume of loans, either of which could have a negative impact on our business, operating results and financial condition. See “Market and Interest Rate Risks — Fluctuations in interest rates could negatively affect the demand for our checking and savings product”.
Any failure to accurately capture credit risk or to execute our funding strategy for SoFi Credit Card could have a negative impact on our business, operating results and financial condition.
The performance of the SoFi Credit Card product is significantly dependent on the ability of the credit and fraud decisioning and scoring models we use to originate the product, which includes a variety of factors, to effectively prevent fraud, evaluate an applicant’s credit profile and likelihood of default. Despite establishing a defined risk appetite and leveraging third-party stress testing of product loss forecasts, there is no assurance that our credit criteria can accurately predict repayment and loss profiles. If our criteria do not accurately prevent fraud or reflect credit risk on the SoFi Credit Card product, greater than expected losses may result and our business, operating results, financial condition and prospects could be materially and adversely affected.
In addition, revenue growth for SoFi Credit Card is dependent on increasing the volume of members who open an account and on growing loan balances on those accounts. Over time we will continue to invest in a number of new product initiatives to attract new SoFi Credit Card members and capture a greater share of our members’ total spending and borrowings.
Revenue growth for SoFi Credit Card may be adversely affected by new restrictions on credit card fees, which were proposed by the CFPB in 2023. If finalized as written, the rule would significantly reduce the penalty fees that could be charged to a SoFi Credit Card customer who fails to make a timely payment, which may adversely affect revenue and our ability to limit losses resulting from such delinquencies. While we have generally seen increases in revenue from SoFi Credit Card, there can be no assurance that our investments in SoFi Credit Card to acquire members, provide differentiated features and services and spur usage of our card will continue to be effective, and developing our service offerings and forming new partnerships could have higher costs than anticipated, and could adversely impact our results or dilute our brand.
Furthermore, the success of the SoFi Credit Card product depends on our ability to execute on our funding strategy for the resulting credit card receivables. We may establish a credit card receivable securitization program in the future. There is no guarantee, however, that we will be successful in establishing a securitization program for these assets. In the event we are unable to finance our credit card receivables, we may be required to hold those assets on our consolidated balance sheet or sell them for a loss, either of which could have a negative impact on our business, operating results and financial condition.
Regulatory, Tax and Other Legal Risks As a bank holding company, we are subject to extensive supervision and regulation, and changes in laws and regulations applicable to bank holding companies could limit or restrict our activities and could have a material adverse effect on our operations.
As a bank holding company, we are subject to regulation, supervision and examination by the Federal Reserve, and SoFi Bank is subject to regulation, supervision and examination by the OCC and the FDIC, as well as regulations issued by the CFPB. Federal laws and regulations govern numerous matters affecting us, including changes in the ownership or control of banks and bank holding companies, maintenance of adequate capital and the financial condition of a financial institution, permissible types, amounts and terms of extensions of credit and investments, permissible nonbanking activities, the level of reserves against deposits and restrictions on dividend payments. The OCC possesses the power to issue cease and desist orders to prevent or remedy unsafe or unsound practices or violations of law by banks subject to their regulation, and the Federal Reserve possesses similar powers with respect to bank holding companies. In general, the bank supervisory framework is intended to protect insured depositors and the safety, soundness and stability of the U.S. financial system and not shareholders in depository institutions or their holding companies.
In connection with applying for approval to become a bank holding company, we developed a financial and bank capitalization plan and enhanced our governance, compliance, controls and management infrastructure and capabilities in order to ensure compliance with all applicable regulations, which required, and will continue to require, substantial time, monetary and human resource commitments. If any new regulations or interpretations of existing regulations to which we are subject impose requirements on us that are impractical or that we cannot satisfy, our financial performance, and our stock price, may be adversely affected.
Federal regulations establish minimum capital requirements for insured depository institutions, including minimum risk-based capital and leverage ratios, and define “capital” for calculating these ratios. The minimum capital requirements are: (i) a common equity Tier 1 capital ratio of 4.5%; (ii) a Tier 1 to risk-based assets capital ratio of 6%; (iii) a total capital ratio of 8%; and (iv) a Tier 1 leverage ratio of 4%. The regulations also establish a “capital conservation buffer” of 2.5% of common equity Tier 1 capital. An institution will be subject to limitations on paying dividends, engaging in share repurchases and paying discretionary bonuses if its capital level falls below the capital conservation buffer amount. The federal banking regulators could also require the Company and/or SoFi Bank, as applicable, to hold capital that exceeds minimum capital requirements for insured depository institutions. The application of these capital requirements could, among other things, require us to maintain higher capital resulting in lower returns on equity, and we may be required to obtain additional capital, or face regulatory actions if we are unable, to comply with such requirements.
We are also subject to the requirements in Sections 23A and 23B of the Federal Reserve Act and the Federal Reserve’s implementing Regulation W, which regulate loans, extensions of credit, purchases of assets, and certain other transactions between an insured depository institution (such as SoFi Bank) and its affiliates. The statute and regulation require us to impose certain quantitative limits, collateral requirements and other restrictions on “covered transactions” between SoFi Bank and its affiliates and require all transactions be on “market terms” and conditions consistent with safe and sound banking practices.
The laws, rules, regulations, and supervisory guidance and policies applicable to us are subject to regular modification and change, including increased regulation as a result of the turmoil in the banking industry. These changes could adversely and materially impact us. For example, the Dodd-Frank Act and other federal banking laws subject companies with $10 billion or more of consolidated assets to additional regulatory requirements. Section 1075 of the Dodd-Frank Act, which is commonly
known as the “Durbin Amendment”, amended the Electronic Fund Transfer Act to restrict the amount of interchange fees that may be charged and prohibit network exclusivity for debit card transactions. SoFi Bank is required to comply with the restrictions on interchange fees that went into effect on July 1, 2023, which may negatively impact future interchange fees we collect. In addition, in October 2023, the Federal Reserve proposed changes to the regulations implementing the Electronic Fund Transfer Act that would further restrict the amount of interchange fees that may be charged and require biennial reviews of those fees. Changes in laws, rules, regulations and supervisory guidance and policies could, among other things, subject us to additional costs, including costs of compliance; limit the types of financial services and products we may offer; and/or increase the ability of non-banks to offer competing financial services and products. Failure to comply with laws, regulations, policies, or supervisory guidance could result in enforcement and other legal actions by federal and state authorities, including criminal and civil penalties, the loss of FDIC insurance, revocation of a banking charter or registration as a broker-dealer and investment adviser, other sanctions by regulatory agencies, civil money penalties, and/or reputational damage, which could have a material adverse effect on our business, financial condition, and results of operations.
Finally, we intend to continue to explore other products for SoFi Bank over time. Some of those products may require, or be deemed to require, additional data, procedures, partnerships, regulatory approvals, or capabilities that we have not yet obtained or developed. Should we fail to expand and evolve SoFi Bank products in a successful manner, or should these new products, or new regulations or interpretations of existing regulations, impose requirements on us that are cumbersome or that we cannot satisfy, our business may be materially and adversely affected.
Failure to comply with applicable laws, regulations or commitments, or to satisfy our regulators’ supervisory expectations, could subject us to, among other things, supervisory or enforcement action, which could adversely affect our business, financial condition and results of operations.
If we do not comply with applicable laws, regulations or commitments, including SoFi Bank’s operating agreement, if we are deemed to have engaged in unsafe or unsound conduct, or if we do not satisfy our regulators’ supervisory expectations, then we may be subject to increased scrutiny, supervisory criticism, governmental or private litigation and/or a wide range of potential monetary penalties or consequences, enforcement actions, criminal liability and/or reputational harm. Such actions could be public or of a confidential nature, and arise even if we are acting in good faith or operating under a reasonable interpretation of the law and could include, for example, monetary penalties, payment of damages or other monetary relief, restitution or disgorgement of profits, directives to take remedial action or to cease or modify practices, restrictions on growth or expansionary proposals, denial or refusal to accept applications, removal of officers or directors, prohibition on dividends or capital distributions, increases in capital or liquidity requirements and/or termination of SoFi Bank’s deposit insurance. Additionally, compliance with applicable laws, regulations and commitments requires significant investment of management attention and resources. Any failure to comply with applicable laws, regulations or commitments could have an adverse effect on our business, financial condition and results of operations.
An inability to accept or maintain deposits due to market demand or regulatory constraints could materially adversely affect our liquidity position and our ability to fund our business.
SoFi Bank accepts deposits and uses the proceeds as a source of funding, with our direct retail deposits becoming a larger proportion of our funding over time. Although we launched the SoFi Insured Deposit Program in 2023, whereby funds (up to $2 million) are deposited into deposit accounts at banks which are insured by the FDIC up to the applicable limits, we continue to face strong competition with regard to deposits, and pricing and product changes may adversely affect our ability to attract and retain cost-effective deposit balances. To the extent we offer higher interest rates to attract or maintain deposits, our funding costs will be adversely impacted.
Our ability to obtain deposit funding and offer competitive interest rates on deposits is also dependent on SoFi Bank’s capital levels. The FDIA’s brokered deposit provisions and related FDIC rules in certain circumstances prohibit banks from accepting or renewing brokered deposits and apply other restrictions, such as a cap on interest rates that can be paid. For example, while SoFi Bank met the definition of “well-capitalized” as of December 31, 2023 and currently has no restrictions regarding acceptance of brokered deposits or setting of interest rates, there can be no assurance that we will continue to meet this definition. Additionally, our regulators can adjust applicable capital requirements at any time and have authority to place limitations on our deposit businesses. An inability to attract or maintain deposits in the future could materially adversely affect our ability to fund our business.
Legislative and regulatory policies and related actions have had and could in the future have a material adverse effect on our student loan portfolios and our student loan origination volume.
Legislative and regulatory actions have had and could continue to have a significant impact on our student loan refinancing business. On March 27, 2020, the CARES Act was signed into law. In compliance with the CARES Act, payments
and interest accrual on all loans owned by the U.S. Department of Education were initially suspended through September 30, 2020, a pause on student loan repayments that was subsequently extended through August 30, 2023 by a series of executive actions. Interest on federal student loans began accruing on September 1, 2023 and borrowers’ first loan payments were due in October 2023. Although federal student loans are largely back in repayment, the increased focus in recent years by policymakers on outstanding federal student loans, including, among other things, on the total volume of outstanding loans and on the number of loans outstanding per borrower, has led to discussion of additional potential legislative and regulatory actions and other possible steps to, among other things:
•permit private education loans such as our refinanced student loan and in-school student loan products to be discharged in bankruptcy without the need to show undue hardship;
•amend the federal postsecondary education loan programs, including to reduce interest rates on certain loans, to revise repayment plans, to make income-driven repayment plans more attractive to borrowers, to implement broader loan forgiveness plans, to provide for refinancing of private education loans into federal student loans at low interest rates, to reduce or eliminate the Grad PLUS program (which authorizes loans that comprise a substantial portion of our student loan refinancing business) and to provide for refinancing of existing federally held student loans into new federal student loans at low interest rates;
•require private education lenders to reform loan agreements to provide for income-driven repayment plans and other payment plans; and
•make sweeping changes to the entire cost structure and financial aid system for higher education in the U.S., including proposals to provide free postsecondary education.
In addition, there is pressure on policymakers to reduce or cancel student loans or accrued interest at a significant scale, which would further reduce demand for our student loan refinancing product and have a negative impact on our loan origination volume and revenue. For example, despite legal challenges at the Supreme Court to some of the Biden Administration’s prior student loan forgiveness measures, the Biden Administration continues to pursue options for providing relief to student borrowers, announcing additional relief in June 2023 and January 2024. In June 2023, the Biden administration announced that it would cancel more than $132 billion of student debt for more than three million borrowers and continue to pursue debt forgiveness strategies including through the Saving on a Valuable Education (SAVE) Plan which offers forgiveness after as few as 10 years of payments for borrowers who originally took out $12,000 or less for college. In January 2024, the Biden administration announced that it will implement that plan beginning in February 2024, including by automatically canceling loans for certain eligible borrowers.
The future impact to our student loan refinancing product will largely depend on expectations regarding the introduction or implementation of these or any additional relief measures, the interest rate environment, how competitive our student loan refinancing products are compared to our competitors and macroeconomic factors. If in the future, student loans were forgiven or canceled in any meaningful scale, or if federal loan borrowers were permitted to refinance at lower interest rates, our student loan refinancing business within our Lending segment, which is our largest segment, would be materially and adversely affected and our profitability, results of operations, financial condition, cash flows or future business prospects could be materially and adversely affected as a result. In addition, proposals to make student loans dischargeable in bankruptcy or similar proposals could make whole loan purchasers less likely to purchase our student loans, securitization investors less likely to purchase securities backed by our student loans or warehouse lenders less likely to lend against our student loans at attractive advance rates. As a result of any material adverse effect to our Lending segment, our overall profitability, results of operations, financial condition, cash flows or future business prospects may be adversely affected.
Although we continue to evaluate the ultimate impact of local, state and federal legislation, regulation and politics, guidance and actions, future legislative, regulatory and executive actions, and the ongoing impact of our own forbearance measures on our financial results, business operations and strategies, there is no guarantee that our estimates will be accurate or that any actions we take based on such estimates will be successful. Furthermore, we believe that the cost of responding to, and complying with, evolving laws and regulations, as well as any guidance from enforcement actions, will continue to increase, as will the risk of penalties and fines from any enforcement actions that may be imposed on our businesses. Our profitability, results of operations, financial condition, cash flows or future business prospects could be materially and adversely affected as a result.
If we fail to comply with federal and state consumer protection laws, rules, regulations and guidance, our business could be adversely affected.
The CFPB, an agency which oversees compliance with and enforces federal consumer financial protection laws, has supervisory authority over the offer, sale or provision of our consumer financial products and services. Prior to January 1, 2024,
the OCC examined SoFi Bank for compliance with CFPB rules and enforced CFPB rules with respect to SoFi Bank. In addition, to the extent certain of our lending or loan servicing activity was conducted outside of SoFi Bank, the CFPB had the authority to pursue enforcement actions against us as a company offering those certain consumer financial products or services. Beginning January 1, 2024, SoFi Bank and its affiliates became subject to supervision and regulation by the CFPB with respect to federal consumer protection laws, including laws relating to fair lending and the prohibition of UDAAP in connection with the offer, sale or provision of consumer financial products and services. As part of its regulatory oversight, the CFPB may seek a range of remedies, including rescission of contracts, refund of money, return of real property, restitution, disgorgement of profits or other compensation for unjust enrichment, damages, public notification of the violation and “conduct” restrictions (i.e., future limits on the target’s activities or functions). Under the current administration and leadership of the agency, the CFPB has pursued a more aggressive enforcement policy with respect to a range of regulatory compliance matters. For example, on January 6, 2022, the CFPB announced a new initiative to scrutinize so-called consumer “junk fees.” Since then, the CFPB has taken action to constrain “pay-to-pay” fees and has announced a rulemaking proceeding on credit card late fees. On October 26, 2022, the CFPB issued guidance to banks on how to avoid charging unlawful overdraft and depositor fees. On February 1, 2023, the CFPB proposed a rule to curb credit card late fees, including proposing an $8 immunity provision to any missed payment. On March 16, 2023, the CFPB issued a bulletin on unfair billing and collection practices after bankruptcy discharges of certain student loan debt, in violation of the Consumer Financial Protection Act, to notify regulated entities how the CFPB intends to exercise its enforcement and supervisory authorities on this issue. On July 13, 2023, the CFPB sued Prehired for illegal student lending practices, including misrepresenting the nature of its loans, tricking consumers in its debt collection practices, and suing students in faraway jurisdictions. In addition, where a company has violated Title X of the Dodd Frank Act, the Dodd-Frank Act empowers state attorneys general and state regulators to bring certain civil actions. Increased enforcement or rules from the CFPB could increase our legal and financial compliance costs, make some activities more difficult, time-consuming and costly, and increase demand on our systems and resources.
We hold lending licenses or similar authorizations in multiple states, each of which has the authority to supervise and examine our activities. As a licensed consumer lender, mortgage lender, loan broker, collection agency, MSB and loan servicer in certain states, we are subject to examinations by state agencies in those states. Similarly, we are subject to licensure requirements and regulations as an education loan servicer in multiple states. An administrative proceeding, litigation, investigation or regulatory proceeding relating to allegations or findings of the violation of such laws by us, any sub-servicer we engage, or our collection agents, could impair our ability to service and collect on our loans or could result in requirements that we pay damages, fines or penalties and/or cancel the balance or other amounts owing under one or more of our loans. There is no assurance that allegations of violations of the provisions of applicable federal or state consumer protection laws will not be asserted against us, any sub-servicers or collection agents we engage or other prior owners of our loans in the future. To the extent it is determined that any of our loans were not originated in accordance with all applicable laws, we may be obligated to repurchase such loan from a whole loan buyer, securitization trust or warehouse facility.
We must comply with federal, state and local consumer protection laws including, among others, the federal and state UDAAP laws, the Federal Trade Commission Act, the Truth in Lending Act, the CRA, the Real Estate Settlement Procedures Act, the ECOA, the FHA, the HMDA, the Secure and Fair Enforcement for Mortgage Licensing Act, FCRA, the Fair Debt Collection Practices Act, the Servicemembers Civil Relief Act, the Military Lending Act, the Electronic Fund Transfer Act, the GLBA, the CARES Act and the Dodd-Frank Act. We must also comply with laws on advertising, as well as privacy laws, including the TCPA, the Telemarketing Sales Rule, the CAN-SPAM Act, the Personal Information Protection and Electronic Documents Act, applicable laws and regulations of Hong Kong including the Personal Data (Privacy) Ordinance and the Personal Data (Privacy) (Amendment) Ordinance 2012 and the CCPA and other state privacy laws. Privacy and data security concerns, data collection and transfer restrictions, contractual obligations and U.S. laws and regulations related to data privacy, security and protection could materially and adversely affect our business, financial condition and results of operations. Compliance with applicable laws is costly, and our failure to comply with applicable federal, state and local laws could lead to:
•loss of our licenses and approvals to engage in our lending and servicing businesses;
•damage to our reputation in the industry;
•governmental investigations and enforcement actions;
•administrative fines and penalties and litigation;
•civil and criminal liability, including class action lawsuits;
•inability to enforce loan agreements;
•diminished ability to sell loans that we originate or purchase, requirements to sell such loans at a discount compared to other loans or repurchase or address indemnification claims from purchasers of such loans;
•loss or restriction of warehouse facilities to fund loans;
•inability to raise capital; and
•inability to execute on our business strategy, including our growth plans.
The CRA, to which SoFi Bank is subject, presents a useful example of how a failure to comply with applicable laws could hamper our growth. On January 1, 2023, SoFi Bank began operating under a five-year CRA strategic plan which includes measurable goals relating to: (i) CD Lending and CD Investments, (ii) CD Contributions, (iii) CD Services, (iv) Small Business Lending, and (v) Retail Services and Products. On October 23, 2023, the Federal Reserve, OCC and FDIC approved changes to their CRA regulations, maintaining the existing CRA ratings (Outstanding, Satisfactory, Needs to Improve, and Substantial Noncompliance) but modifying the evaluation framework to replace the existing tests generally applicable to banks with at least $2 billion in assets (the lending, investment, and services tests) with four new tests and associated performance metrics. The new CRA regulations, which become effective on January 1, 2026, increase the geographic areas in which banks will be evaluated for CRA performance and may be particularly burdensome on banks focused on mobile and digital banking such as SoFi Bank. The OCC’s assessment of our compliance with the CRA is taken into account when evaluating any application we submit for, among other things, a merger or the acquisition of another financial institution. Our failure to satisfy our CRA obligations could, at a minimum, result in the denial of such applications and limit our growth.
In the first quarter of 2019, we were subject to a consent order from the FTC (the “FTC Consent Order”), which resolved allegations that we misrepresented how much money student loan borrowers have saved or would save from financing their loans with us, in violation of the Federal Trade Commission Act. Under the FTC Consent Order, we are prohibited from misrepresenting to consumers how much money they would save by using our products, unless the claims are backed up by reliable evidence.
While we have developed and monitor policies and procedures designed to assist in compliance with laws and regulations, no assurance can be given that our compliance policies and procedures will be effective and that we will not be subject to fines and penalties, including with respect to any alleged noncompliance with the FTC Consent Order. Ambiguities in applicable statutes and regulations may leave uncertainty with respect to permitted or restricted conduct and may make compliance with laws, and risk assessment decisions with respect to compliance with laws, difficult and uncertain. In addition, ambiguities make it difficult, in certain circumstances, to determine if, and how compliance violations may be cured. We have in the past and may in the future fail to comply with applicable statutes and regulations even if acting in good faith, or because governmental bodies or courts interpret existing laws or regulations in a more restrictive manner, which have in the past and may in the future lead to regulatory investigations, governmental enforcement actions or private causes of action with respect to our compliance. To resolve issues raised in examinations or other governmental actions, we may be required to take various corrective actions, including changing certain business practices, making refunds or taking other actions that could be financially or competitively detrimental to us. In some cases, regardless of fault, it may be less time-consuming or costly to settle these matters, which may require us to implement certain changes to our business practices, provide remediation to certain individuals or make a settlement payment to a given party or regulatory body. There is no assurance that any future settlements will not have a material adverse effect on our business.
We hold state licenses that result in substantial compliance costs, and our business would be adversely affected if our licenses are impaired as a result of noncompliance with those requirements.
We currently hold state licenses in connection with our lending activities, our student loan servicing activities, our securities business as well as our prior MSB activities. Although we have transitioned our lending products to SoFi Bank, for as long as SoFi Lending Corp. originates, purchases or master services or services loans, we must comply with certain state licensing requirements and varying compliance requirements. In addition. although we have transferred our digital assets business, we still hold MSB licenses while we determine whether to maintain or relinquish those licenses. Changes in licensing laws may result in increased disclosure requirements, increased fees, or may impose other conditions to licensing that we or our personnel are unable to meet. In most states in which we operate, a regulatory agency or agencies regulate and enforce laws relating to loan servicers, brokers, and originators, collection agencies, and MSBs. We are subject to periodic examinations by state and other regulators in the jurisdictions in which we conduct business, which can result in increases in our administrative costs and refunds to borrowers of certain fees earned by us, and we may be required to pay substantial penalties imposed by those regulators due to compliance errors, or we may lose our license or our ability to do business in the jurisdiction otherwise may be impaired. Fines and penalties incurred in one jurisdiction may cause investigations or other actions by regulators in other jurisdictions.
We may not be able to maintain all currently required licenses and permits. If we change or expand our business activities, we may be required to obtain additional licenses before we can engage in those activities. If we apply for a new license, a regulator may determine that we were required to do so at an earlier point in time, and as a result, may impose penalties or refuse to issue the license, which could require us to modify or limit our activities in the relevant state. For
example, we have been fined in the past by state regulators for engaging in financial services related activities prior to obtaining a license. Based on changes to our businesses, we may also forfeit certain of our licenses that are no longer required, such as our MSB licenses following the transfer of our digital assets business. Regulators may impose conditions, requirements or penalties in connection with the forfeiture of any of our licenses.
States may also expand or otherwise modify their current regulations and if such states so act, we may not be able to comply with such updated regulations or maintain all requisite licenses and permits in such states or our costs of compliance with and maintenance of such licenses or permits may materially increase. For example, California, Colorado and Maine have implemented additional regulations related to student loan servicers which impose additional registration, reporting and disclosure requirements and which, if applicable to us, may increase our costs of originating and servicing loans in those states.
In addition, the states that currently do not provide extensive regulation of our business may later choose to do so, and if such states so act, we may not be able to obtain or maintain all requisite licenses and permits, which could require us to modify or limit our activities in the relevant state or states. The failure to satisfy those and other regulatory requirements could result in a default under our warehouse facilities, other financial arrangements and/or servicing agreements and thereby have a material adverse effect on our business, financial condition and results of operations.
Our compliance and risk management policies and procedures as a bank, bank holding company and otherwise regulated financial services company may not be fully effective in identifying or mitigating compliance and risk exposure in all market environments or against all types of risk.
As a bank, a bank holding company and a financial services company operating in the banking and securities industry, among others, our business exposes us to a number of heightened risks. We have devoted significant resources to developing our compliance and risk management policies and procedures and will continue to do so, but there can be no assurance these are sufficient, especially as our business is rapidly growing and evolving. Nonetheless, our limited operating history in many of the products we offer, our evolving business and our rapid growth make it difficult to predict all of the risks and challenges we may encounter and may increase the risk that our policies and procedures that serve to identify, monitor and manage compliance risks may not be fully effective in mitigating our exposure in all market environments or against all types of risk. Further, some controls are manual and are subject to inherent limitations and errors in oversight. This could cause our compliance and other risk management strategies to be ineffective. Other compliance and risk management methods depend upon the evaluation of information regarding markets, customers, catastrophic occurrences or other matters that are publicly available or otherwise accessible to us, which may not always be accurate, complete, up-to-date or properly evaluated. Insurance and other traditional risk-shifting tools may be held by or available to us in order to manage certain exposures, but they are subject to terms such as deductibles, coinsurance, limits and policy exclusions, as well as risk of counterparty denial of coverage, default or insolvency. Any failure to maintain effective compliance and other risk management strategies could have an adverse effect on our business, financial condition and results of operations.
We are also exposed to heightened regulatory risk because our business is subject to extensive regulation and oversight in a variety of areas, and such regulations are subject to evolving interpretations and application and it can be difficult to predict how they may be applied to our business, particularly as we introduce new products and services and expand into new jurisdictions. Additionally, the regulatory landscape involving digital assets is constantly evolving. Although we have exited our digital assets business, the Company, including SoFi Digital Assets, LLC, may still be subject to regulatory scrutiny related to our prior business practices.
Also, due to market volatility, it is difficult to predict how much capital we will need in the future to meet net capital requirements. Any perceived or actual breach of laws and regulations could negatively impact our business, financial condition or results of operations. It is possible that these laws and regulations could be interpreted or applied in a manner that would prohibit, alter or impair our existing or planned products and services.
Regulatory scrutiny of banking as a service, or BaaS, solutions has recently increased and may require us to devote significant resources to enhancing our Technology Platform policies, procedures, operations, controls and products, and the failure to satisfy such increased scrutiny may cause regulators to take action against us or our BaaS partners, or result in a loss of one or more of our BaaS partners.
Our Technology Platform facilitates the provision of BaaS products and services to third parties through various card, deposit, payment, transfer, credit and lending solutions that allow financial technology companies or other third parties to, among other things, connect to sponsor banks’ systems directly via application programming interfaces and cloud infrastructure so they can build banking offerings on top of the sponsor banks’ regulated infrastructure. In addition, our Technology Platform offers an end-to-end core banking platform solution with integrated payment processing. Furthermore, in connection with our Technology Platform's BaaS solutions, we sometimes offer certain program management, data, analytics, compliance and risk
management functions. The third parties that use these BaaS solutions include a variety of financial entities, including banks, fintech companies and other financial intermediaries. SoFi Bank is one of the sponsor banks that utilizes our BaaS products and services and may continue to do so in the future.
Federal bank regulators have increasingly focused on the risks related to BaaS solutions, including risk management, oversight, internal controls, information security, change management and information technology operational resilience, as well as potential systemic risk posed by BaaS solutions to the larger banking industry. Recently, regulators have even brought enforcement actions against financial entities that have allegedly not adequately addressed these concerns while growing their BaaS offerings. Regulators have specifically required these financial entities to enhance oversight of third-party fintech partnerships, improve control frameworks related to anti-money laundering and Bank Secrecy Act compliance, and adopt, implement and adhere to revised and expanded risk-based policies, procedures and processes. If we or any of the fintech clients or sponsor bank partners supported by our Technology Platform were to face regulatory actions that limit the growth of our or their fintech business, or if we were forced to stop growing our Technology Platform, or if any of our fintech clients or sponsor banks were to limit or cease their participation in BaaS solutions, this could have a negative impact on our revenue and results of operation for the Technology Platform segment.
Furthermore, regulatory scrutiny of BaaS solutions extends directly to middleware providers, such as our Technology Platform, which, in certain circumstances, bear accountability for their partners’ compliance and risk management, including with respect to penalties, fines, and other measures that bank regulatory agencies take in the event of non-compliant activity or risks that are not well controlled. This is particularly true when the BaaS solution includes program management, and compliance and risk management controls, including managing anti-money laundering and fraud risks. In addition, as our fintech and sponsor bank partners face increased regulatory scrutiny, their scrutiny of our services will likely increase and our inability to satisfactorily respond to partner demands could result in those partners moving to different solutions. Assessing and managing risk for our Technology Platform clients in the face of regulatory and client scrutiny has in the past and will continue to require us to devote significant resources to enhancing relevant policies, procedures, operations and products. Finally, as a subsidiary of a bank holding company, any failure of our Technology Platform's BaaS solutions to withstand regulatory scrutiny could reflect badly on our relationship with our regulators and on our overall reputation.
While we believe we are a leader in managing, monitoring and overseeing BaaS relationships with third parties and corresponding technologies, if we are not successful in continuing to enhance our controls for assessing and managing the third-party, anti-money laundering, fraud and information technology risks stemming from certain of our fintech and sponsor bank partnerships, we could be subject to additional regulatory scrutiny with respect to that portion of our business which could subject us to regulatory fines or other penalties, or business or reputational harm, and could adversely affect our financial condition and results of operations.
We may become subject to enforcement actions or litigation as a result of our failure to comply with laws and regulations, even though noncompliance was inadvertent or unintentional.
We maintain systems and procedures designed to ensure that we comply with applicable laws and regulations; however, some legal/regulatory frameworks provide for the imposition of fines or penalties for noncompliance even though the noncompliance was inadvertent or unintentional and even though there were systems and procedures designed to ensure compliance in place at the time.
For example, we engage in outbound telephone and text communications with consumers, and accordingly must comply with a number of federal and state statutes and regulations that regulate certain such communications, including the TCPA and Telemarketing Sales Rules. The U.S. Federal Communications Commission (the “FCC”), and the FTC have responsibility for regulating various aspects of some of these federal laws. Among other requirements, the TCPA requires us to obtain prior express written consent for certain telemarketing calls and to adhere to “do-not-call” registry requirements which, in part, mandate we maintain and regularly update lists of consumers who have chosen not to be called and restrict calls to consumers who are on the national do-not-call list. In addition, in December 2023, the FCC introduced new regulations under the TCPA addressing lead generator relationships, among other things. Florida and several other states also have mini-TCPA and other similar consumer protection laws regulating certain telemarketing directed to their residents. These federal and state laws limit our ability to communicate with consumers and reduce the effectiveness of our marketing programs. As currently construed, the TCPA does not distinguish between voice and data, and, as such, SMS/MMS messages are also “calls” for the purpose of TCPA obligations and restrictions.
For violations of the TCPA, the law provides for a private right of action under which a plaintiff may recover monetary statutory damages of $500 for each call or text made in violation of the statute. A court may treble the $500 amount upon a finding of a willful or knowing violation. There is no statutory cap on maximum aggregate exposure for TCPA violations (although some courts have applied in TCPA class actions constitutional limits on excessive penalties). Like the TCPA, several
mini-TCPA and other similar state laws also provide for a private right of action under which a plaintiff may recover statutory damages of $500 or more for each violative call or text and enhanced statutory if the violation is knowing or willful. An action may be brought by the FCC, a state attorney general, an individual, or a class of individuals. Like other companies that rely on telephone and text communications, we may be subject to putative class action suits alleging violations of the TCPA, and state mini-TCPA and other similar state laws. If in the future we are found to have violated any federal or state law regulating telemarketing, the amount of damages and potential liability could be extensive and adversely impact our business.
In addition, we use credit reports in our credit decisioning processes and, accordingly, must comply with FCRA which requires a permissible purpose to obtain a consumer credit report and requires persons that furnish loan payment information to credit bureaus to report such information accurately. We are also required to perform a reasonable investigation in the event we receive indirect disputes from the credit bureaus about the accuracy of our credit reporting for a particular consumer and to update any inaccurate information we discover. Although we have policies and procedures in place to comply with FCRA, we are subject to lawsuits alleging that we failed under FCRA to adequately investigate indirect disputes over credit reporting which we receive from one or more credit bureaus. We have experienced an increase in such FCRA claims since our business has grown and even if we are ultimately successful in defending against such suits, they could involve substantial time and expense to analyze and respond to, could divert management’s attention and other resources from running our business, and could lead to settlements, judgments, fines, penalties or injunctive relief.
Changes in applicable laws and regulations, as well as changes in government enforcement policies and priorities, may negatively impact the management of our business, results of operations, ability to offer certain products or the terms and conditions upon which they are offered, and ability to compete.
Financial services regulation is constantly changing, and new laws or regulations, or new interpretations of existing laws or regulations, could have a materially adverse impact on our ability to operate as currently intended, and cause us to incur significant expense in order to ensure compliance. Federal and state financial services regulators are also enforcing existing laws, regulations, and rules aggressively and enhancing their supervisory expectations regarding the management of legal and regulatory compliance risks. These regulatory changes and uncertainties make our business planning more difficult and could result in changes to our business model and potentially adversely impact our results of operations. Furthermore, to the extent applicable, these laws can impose specific statutory liabilities upon creditors who fail to comply with their provisions and may affect the enforceability of a loan.
Proposals to change the statutes affecting financial services companies are frequently introduced in Congress and state legislatures that, if enacted, may affect their operating environment in substantial and unpredictable ways. In addition, numerous federal and state regulators and SROs have the authority to promulgate or change regulations that could have a similar effect on our operating environment. We cannot determine with any degree of certainty whether any such legislative or regulatory proposals will be enacted and, if enacted, the ultimate impact that any such potential legislation or implementing regulations, or any such potential regulatory actions by federal or state regulators, would have upon our business.
New laws, regulations, policy or changes in enforcement of existing laws or regulations applicable to our business, or reexamination of current practices, could adversely impact our profitability, limit our ability to continue existing or pursue new business activities, require us to change certain of our business practices, affect retention of key personnel, or expose us to additional costs (including increased compliance costs and/or customer remediation). These changes also may require us to invest significant resources, and devote significant management attention, to make any necessary changes and could adversely affect our business. For example, the SEC proposed Regulation Best Execution, along with other proposals related to equity market structure, in December 2022. If adopted as proposed, Regulation Best Execution and other recent proposals would substantially alter existing order routing, execution incentives and business practices. The SEC also finalized rules in February 2023 to shorten the standard settlement cycle for most broker-dealer transactions in securities from two business days after the trade (T+2) to one (T+1). While the SEC compliance date for T+1 is not until May 2024, this change will require technological, operational, and compliance adjustments across the industry that are likely to be time consuming and costly for all market participants. In March 2023, the SEC proposed multiple rules related to privacy and cybersecurity. Proposed amendments to Regulation S-P would, among other things: (i) require covered institutions (including broker-dealers and investment advisers) to adopt written policies and procedures for an incident response program to address unauthorized access to or use of customer information; and (ii) require covered institutions to have written policies and procedures to provide timely notification to affected individuals whose sensitive customer information was or is reasonably likely to have been accessed or used without authorization. The SEC reopened the comment period for the Investment Management Cybersecurity Release which proposed new rules that would require registered investment advisers and investment companies to adopt and implement written cybersecurity policies and procedures reasonably designed to address cybersecurity risks, disclose information about cybersecurity risks and incidents, report information confidentially to the SEC about certain cybersecurity incidents, and maintain related records. In July 2023, the SEC proposed new rules and amendments to address certain conflicts of interest
associated with the use of predictive data analytics by broker-dealers and investment advisers (“firms”) in investor interactions. If adopted, the proposed rules would require broker-dealers and investment advisers to evaluate and determine whether their use of certain technologies in investor interactions such as analytical, technological or computational functions, algorithms, models, correlation matrices or similar methods or processes that direct or optimize for investment related behavior, involves a conflict of interest that results in the broker-dealer or investment adviser’s interests being placed ahead of investors’ interests. Depending on the outcome of any final rule, our ability to use these technologies to generate business activity and revenue may be limited. See also “Lawmakers, regulators and other public officials have signaled an increased focus on new or additional laws or regulations that could impact our broker-dealer business and require us to make significant changes to our business model and practices, and could result in significant costs to our business or loss of current revenue streams”. Compliance with each of these rules, when and if required, would impose additional costs on our business. To the extent such proposals affect the equity market structure more broadly, our ability to generate revenue may be impaired. There is also the risk that, despite our best efforts, the SEC does not view our compliance measures as sufficient. This risk is substantially elevated where regulators adopt a substantial number of new rules in a short time frame. On October 13, 2023, the SEC adopted rules relating to providing additional disclosures in the securities lending market. These rules require any covered person that loans a reportable security on behalf of itself or another person to report certain material terms of those loans and related information to FINRA by the end of the day on which the loan is effected. FINRA in turn will make certain information it receives publicly available by the next business day. These regulations could make securities lending more costly, leading to less overall lending activity and a decrease in revenue. In addition, non-compliance with any adopted requirements would likely result in enforcement action by the SEC or FINRA.
Extensive regulation and supervision have a negative impact on our ability to compete in a cost-effective manner and may subject us to material compliance costs and penalties.
The Company, primarily through its subsidiary SoFi Bank and certain non-bank subsidiaries, is subject to extensive federal and state regulation and supervision. Banking regulations are primarily intended to protect depositors’ funds, federal deposit insurance funds and the banking system as a whole. Many laws and regulations affect our lending practices, capital structure, investment practices, dividend policy and growth, among other things. They encourage us to ensure a satisfactory level of lending in defined areas and establish and maintain comprehensive programs relating to anti-money laundering and customer identification. Congress, state legislatures, and federal and state regulatory agencies continually review banking laws, regulations and policies for possible changes. Changes to statutes, regulations or regulatory policies, including changes in interpretation or implementation of statutes, regulations or policies, could affect us in substantial and unpredictable ways. Such changes could subject us to additional costs, limit the types of financial services and products it may offer and/or increase the ability of non-banks to offer competing financial services and products, among other things. Failure to comply with laws, regulations or policies could result in sanctions by regulatory agencies, civil money penalties and/or reputation damage, which could have a material adverse effect on our business, financial condition and results of operations.
We are subject to the risk that regulatory or enforcement agencies and/or consumer advocacy groups may assert that our business practices may violate certain rules, laws and regulations, including anti-discrimination statutes.
Anti-discrimination statutes, such as the FHA and the ECOA and state law equivalents, prohibit creditors from discriminating against loan applicants and borrowers based on certain characteristics, such as race, religion and national origin. Various federal regulatory and enforcement departments and agencies, including the Department of Justice and CFPB, take the position that these laws apply not only to intentional discrimination, but also to facially neutral practices that have a disparate impact on a group that shares a characteristic that a creditor may not consider in making credit decisions. State and federal regulators, as well as consumer advocacy groups and plaintiffs’ attorneys, are focusing greater attention on “disparate impact” claims. Similarly, these regulatory agencies and litigants could take the position that the geographical footprint within which we conduct lending activity or the manner in which we advertise loans, disproportionately excludes potential borrowers belonging to a protected class, and constitutes unlawful “redlining”. Although we utilize an automated underwriting process to originate loans, we frequently adjust pricing strategies which increases our risk of inadvertently violating the FHA and the ECOA. These regulatory agencies could also take the position that the underwriting or credit models or algorithms we use produce disparate outcomes or do not produce sufficient information about a credit decision to satisfy applicant notification requirements under ECOA. In addition to reputational harm, violations of the FHA and the ECOA can result in actual damages, punitive damages, injunctive or equitable relief, attorneys’ fees and civil money penalties.
Our investment adviser and broker-dealer subsidiaries are subject to regulation by the SEC and FINRA.
We offer investment management services through SoFi Wealth, an internet based investment adviser, and SoFi Capital Advisors, which sponsors private investment funds that invest in asset-backed securitizations. Both SoFi Wealth and SoFi Capital Advisors (collectively, the “Investment Advisers”) are registered as investment advisers under the Investment
Advisers Act of 1940, as amended (the “Advisers Act”), which does not imply any level of skill or training, and are subject to regulation by the SEC. SoFi Securities is an affiliated SEC-registered broker-dealer and FINRA member. We offer cash management accounts, which are brokerage products, through SoFi Securities.
The Investment Advisers operate in a highly regulated environment and are subject to, among other things, the anti-fraud provisions of the Advisers Act and to fiduciary duties derived from these provisions, which apply to their relationships with our members who are their advisory clients, as well as the funds managed by the Investment Advisers. These provisions and duties also impose certain restrictions and obligations on us with respect to our dealings with our members, fund investors and our investments, including for example restrictions on transactions with our affiliates. Our Investment Advisers are also subject to other requirements under the Advisers Act and related regulations. These additional requirements relate to matters including, among others, maintaining effective and comprehensive compliance programs, record-keeping and reporting and disclosure requirements. Further, in 2022 and 2023, the SEC proposed numerous amendments to the Advisers Act rules, which are likely to present a number of additional significant and burdensome compliance challenges for registered investment advisers. In addition, our Investment Advisers have been in the past, and will be in the future, subject to SEC examination. Moreover, the Advisers Act generally grants the SEC broad administrative powers, including the power to limit or restrict an investment adviser from conducting advisory activities in the event it fails to comply with federal securities laws. The investment advisers are also subject to applicable state securities laws. Additional sanctions that may be imposed for failure to comply with applicable requirements include the prohibition of individuals from associating with an investment adviser, the revocation of registrations and other censures and fines. Even if an investigation or proceeding did not result in a sanction or the sanction imposed against us or our personnel by a regulator was small in monetary amount, the adverse publicity relating to the investigation, proceeding or imposition of these sanctions could harm our reputation and cause us to lose existing members or fail to gain new members. See Part I, Item 3. “Legal Proceedings”.
Our subsidiary, SoFi Securities, is an affiliated SEC-registered broker-dealer and FINRA member. The securities industry is highly regulated, including under federal, state and other applicable laws, rules and regulations, and we may be adversely affected by regulatory changes related to suitability of financial products, supervision, sales practices, advertising, application of fiduciary standards, best execution and market structure, any of which could limit our business and damage our reputation. FINRA has adopted extensive regulatory requirements relating to sales practices, advertising, registration of personnel, compliance and supervision, and compensation and disclosure, to which SoFi Securities and its personnel are subject. FINRA and the SEC also have the authority to conduct examinations of SoFi Securities, and may also conduct administrative proceedings. Additionally, material expansions of the business in which SoFi Securities engages are subject to approval by FINRA. This could delay, or even prevent, the firm’s ability to expand its securities and brokerage offerings in the future.
From time to time, SoFi Securities and the Investment Advisers may be threatened with or named as a defendant in lawsuits, arbitrations and administrative claims. As previously noted, these entities are also subject to regulatory examinations and inspections by regulators (including the SEC and FINRA, as applicable). Compliance and trading problems or other deficiencies or weaknesses that are reported to regulators, such as the SEC and FINRA, by dissatisfied members or others, or that are identified by regulators themselves are investigated by such regulators, and may, if pursued, result in formal claims being filed against SoFi Securities and the Investment Advisers by members or disciplinary action being taken by regulators against us or our personnel. Our failure to comply with applicable laws or regulations or our own policies and procedures could result in fines, litigation, suspensions of personnel or other sanctions, which could have a material effect on our overall financial results. For example, in December 2023, FINRA found that SoFi Securities failed to establish, maintain, and enforce a supervisory system reasonably designed to supervise its fully paid securities lending offerings. Even if a sanction imposed against us or our personnel is small in monetary amount, the adverse publicity arising from the imposition of sanctions against us by regulators could harm our reputation and our brand and lead to material legal, regulatory and financial exposure (including fines and other penalties), cause us to lose existing members or fail to gain new members. In addition, in the normal course of business, SoFi Securities and the Investment Advisers discuss matters raised by its regulators during regulatory examinations or otherwise upon their inquiry. These matters could also result in censures, fines, penalties or other sanctions.
In addition to the broker-dealer proposals described above under “Changes in applicable laws and regulations, as well as changes in government enforcement policies and priorities, may negatively impact the management of our business, results of operations, ability to offer certain products or the terms and conditions upon which they are offered, and ability to compete”, a substantial number of proposed rules for investment advisers were introduced in 2023 and may be adopted this year. These proposals cover material regulatory topics, including: (i) environmental, social, and governance issues for investment advisers and registered investment companies; (ii) outsourcing by investment advisers; and (iii) safeguarding and custody of client assets. If enacted, compliance with each of these proposed rules would impose additional costs on our business. There is also the risk that, despite our best efforts, the SEC does not view our compliance measures as sufficient. This risk is substantially elevated where regulators adopt a substantial number of new rules in a short time frame.
We recently transferred our digital assets-related trading services to comply with regulations governing bank holding companies; this transfer could adversely impact our member relationships and our reputation.
Until recently, we offered virtual currency and digital asset-related trading services through SoFi Digital Assets, LLC, a subsidiary licensed and registered with various governmental authorities as a MSB, money transmitter, virtual currency business or the equivalent. In connection with our approval as a bank holding company in February 2022, the Federal Reserve determined that SoFi Digital Assets, LLC was engaged in certain digital asset-related activities that the Federal Reserve has not found to be permissible for a bank holding company under the Bank Holding Company Act and Regulation Y. Section 4(a)(2) of the Bank Holding Company Act permitted us to continue our digital assets related offering for a two-year conformance period from the date we became a bank holding company. In compliance with the requirement that we conform our activities to those permissible for a bank holding company, in December 2023, we ceased offering digital-asset related trading services in all states except New York. We provided a majority of our members with the option to either close their digital asset account or migrate their digital assets accounts to Blockchain.com. Members located in New York were not eligible for account migration, so those member accounts remained open for sell orders only until January 28, 2024, following which any open New York accounts were closed. All transaction fees from any sales from digital assets accounts will be reimbursed. As part of our transfer of our digital asset-related activities we entered into a referral arrangement with Blockchain.com, and we have and may continue to enter into additional referral arrangements with other companies that can provide digital-asset related trading services to our members. Although we do not expect the transfer of our digital asset-related activities or entry into the referral arrangements to have a material adverse impact on our business, results of operation or financial results, we cannot guarantee that our members will not experience a negative impact with respect to their digital asset positions. In addition, these are recent events and there is no guarantee we will not face member dissatisfaction or litigation, or harm to our reputation, or adverse regulatory consequences, from such developments.
Furthermore, if our prior digital asset-related trading services are the subject of regulatory scrutiny or enforcement actions, it could have a material adverse effect on our business, results of operations and reputation. There has been a significant amount of guidance, reports, and public statements issued by federal and state financial regulators regarding the legal permissibility of, and supervisory considerations relating to, financial institutions engaging in digital assets-related activities. Many U.S. regulators, including the SEC, FinCEN, the CFTC, the IRS, and state regulators including the New York State Department of Financial Services, have made official pronouncements, pursued cases against businesses in the digital assets space or issued guidance or rules regarding the treatment of Bitcoin and other digital currencies. Both federal and state agencies have instituted enforcement actions against those violating their interpretation of existing laws. Other U.S. and many state agencies have offered little or incomplete official guidance regarding the treatment of digital assets. For example, the CFTC has publicly taken the position that certain virtual currencies, which term includes digital assets, are commodities. Senior SEC staff members have created additional ambiguity about certain digital assets, including Ether, by refusing to affirmatively state whether they are “commodities” subject to CFTC jurisdiction or “securities” subject to SEC jurisdiction. In addition, in 2023, the SEC brought high profile enforcement actions against companies that intermediate transactions in digital assets. For example, in June 2023, the SEC filed lawsuits against cryptocurrency exchanges Coinbase and Binance Holdings Limited and its affiliate BAM Trading Services Inc. (collectively, “Binance”) alleging, among other allegations, that Coinbase operated its crypto trading platform as an unregistered national securities exchange, broker and clearing agency and for its failure to register the offer and sale of its crypto asset staking-as-a-service program. The SEC alleges that Binance was operating unregistered national exchanges, broker-dealers and clearing agencies and the unregistered offer and sale of crypto assets. If the SEC or another federal or state regulator alleges that any assets we offered are securities or that we have violated any other federal or state securities law or regulation, we could face potential liability, including an enforcement action or private class action lawsuits, and face the costs of defending ourselves in the action, including potential fines, penalties, reputation harm, and potential loss of revenue. See “We may become subject to enforcement actions or litigation as a result of our failure to comply with laws and regulations, even though noncompliance was inadvertent or unintentional”.
Failure to comply with anti-money laundering, economic and trade sanctions regulations, and similar laws could subject us to penalties and other adverse consequences.
Various laws and regulations in the U.S. and abroad, such as the BSA, the Dodd-Frank Act, the USA PATRIOT Act, and the Credit Card Accountability Responsibility and Disclosure Act, impose certain anti-money laundering requirements on companies that are financial institutions or that provide financial products and services. Under these laws and regulations, financial institutions are broadly defined to include banks and MSBs such as money transmitters. In 2013, FinCEN issued guidance regarding the applicability of the BSA to administrators and exchangers of convertible virtual currency, clarifying that they are MSBs, and more specifically, money transmitters. The BSA requires banks and MSBs to develop and implement risk-based anti-money laundering programs, report large cash transactions and suspicious activity, and maintain transaction records, among other requirements. State regulators may impose similar requirements on licensed money transmitters. In addition, our contracts with financial institution partners and other third parties may contractually require us to maintain an anti-money
laundering program. SoFi Bank is subject to the regulatory and supervisory jurisdiction of the OCC with respect to the BSA and its implementing regulations applicable to banks. Our subsidiary, SoFi Digital Assets, LLC, is registered with FinCEN as an MSB. Registration as an MSB subjects us to the regulatory and supervisory jurisdiction of FinCEN and the IRS, the anti-money laundering provisions of the BSA and its implementing regulations applicable to MSBs. Although we have exited our digital assets business, the Company, including SoFi Digital Assets, LLC, may still be subject to regulatory scrutiny related to our prior business practices.
We are also subject to economic and trade sanctions programs administered by OFAC, which prohibit or restrict transactions to or from or dealings with specified countries, their governments, and in certain circumstances, their nationals, and with individuals and entities that are specially-designated nationals of those countries, narcotics traffickers, terrorists or terrorist organizations, and other sanctioned persons and entities.
Our failure to comply with anti-money laundering, economic and trade sanctions regulations, and similar laws could subject us to substantial civil and criminal penalties, or result in the loss or restriction of our national bank charter, MSB or broker-dealer registrations and state licenses, or liability under our contracts with third parties, which may significantly affect our ability to conduct some aspects of our business. Changes in this regulatory environment, including changing interpretations and the implementation of new or varying regulatory requirements by the government, may significantly affect or change the manner in which we currently conduct some aspects of our business.
We are subject to anti-corruption, anti-bribery and similar laws, and noncompliance with such laws can subject us to significant adverse consequences, including criminal or civil liability, and harm our business.
We are subject to the Foreign Corrupt Practices Act, U.S. domestic bribery laws and other U.S. and foreign anti-corruption laws. Anti-corruption and anti-bribery laws have been enforced aggressively in recent years and are interpreted broadly to generally prohibit companies, their employees and their third-party intermediaries from authorizing, offering or providing, directly or indirectly, improper payments or benefits to recipients in the public sector. These laws also require that we keep accurate books and records and maintain internal controls and compliance procedures designed to prevent any such actions. Although our operations are currently concentrated in the U.S., as we increase our international cross-border business and expand operations abroad, we have engaged and may further engage with business partners and third-party intermediaries to market our services and to obtain necessary permits, licenses and other regulatory approvals. In addition, we or our third-party intermediaries may have direct or indirect interactions with officials and employees of government agencies or state-owned or affiliated entities. We can be held liable for the corrupt or other illegal activities of these third-party intermediaries, our employees, representatives, contractors, partners, and agents, even if we do not explicitly authorize such activities. The failure to comply with any such laws could subject us to criminal or civil liability, cause us significant reputational harm and have an adverse effect on our business, financial condition and results of operations.
We conduct our business operations through subsidiaries and may in the future rely on dividends from our subsidiaries for a substantial amount of our cash flows.
We may in the future depend on dividends, distributions and other payments from our subsidiaries to fund payments on our obligations, including any debt obligations we may incur. Regulatory and other legal restrictions may limit our ability to transfer funds to or from certain subsidiaries, including SoFi Securities and SoFi Bank. In addition, certain of our subsidiaries are subject to laws and regulations that authorize regulatory bodies to block or reduce the flow of funds to us, or that prohibit such transfers altogether in certain circumstances. These laws and regulations may hinder our ability to access funds that we may need to make payments on our obligations, including any debt obligations we may incur and otherwise conduct our business by, among other things, reducing our liquidity in the form of corporate cash. In addition to negatively affecting our business, a significant decrease in our liquidity could also reduce investor confidence in us. Certain rules and regulations of the SEC and FINRA may limit the extent to which our broker-dealer subsidiaries may distribute capital to us. For example, under FINRA rules applicable to SoFi Securities, a dividend in excess of 10% of a member firm’s excess net capital may not be paid without FINRA’s prior written approval. In addition, the OCC has the authority to use its enforcement powers to prohibit a bank from paying dividends if, in its opinion, the payment of dividends would constitute an unsafe or unsound practice. Federal law also prohibits the payment of dividends by a bank that will result in the bank failing to meet its applicable capital requirements on a pro forma basis. In addition, under the National Bank Act, SoFi Bank generally may, without prior approval of the OCC, declare a dividend but only so long as the total amount of all dividends (common and preferred), including the proposed dividend, in the current year do not exceed net income for the current year to date plus retained net income for the prior two years. Compliance with these rules may impede our ability to receive dividends, distributions and other payments from SoFi Securities and SoFi Bank.
We have in the past, continue to be, and may in the future be subject to inquiries, exams, pending investigations, or enforcement matters.
The financial services industry is subject to extensive regulation and oversight under federal, state, and applicable international laws. From time to time, in the normal course of business, we have received and may receive or be subject to inquiries or investigations by state and federal regulatory or enforcement agencies and bodies, such as the CFPB, SEC, the Federal Reserve, the OCC, the FDIC, the FHFA, the VA, the state attorneys general, state financial regulatory agencies, other state or federal agencies and SROs like FINRA. We also have in the past and may in the future receive inquiries from state regulatory agencies regarding requirements to obtain licenses from or register with those states, including in states where we have previously determined that we are not required to obtain such a license or be registered with the state. In addition, we have been threatened with or named as a defendant in lawsuits, arbitrations and administrative claims involving securities, consumer financial services and other matters. We are also subject to periodic regulatory examinations and inspections. Compliance and trading problems or other deficiencies or weaknesses that are reported to regulators, such as the OCC, SEC, FINRA, the CFPB or state regulators, by dissatisfied customers or others, or that are identified by regulators themselves, are investigated by such regulators, and may, if pursued, result in formal claims being filed against us by customers or disciplinary action being taken against us or our employees by regulators or enforcement agencies. To resolve issues raised in examinations or other governmental actions, we may be required to take various corrective actions, including changing certain business practices, making refunds or taking other actions that could be financially or competitively detrimental to us.
Any such inquiries, investigations, lawsuits, arbitrations, administrative claims or other inquiries have in the past and could in the future involve substantial time and expense to analyze and respond to, divert management’s attention and other resources from running our business, and lead to fines, penalties, injunctive relief, and the need to obtain additional licenses that we do not currently possess. Our involvement in any such matters, whether tangential or otherwise and even if the matters are ultimately determined in our favor, could also cause significant harm to our reputation, lead to additional investigations and enforcement actions from other agencies or litigants, and further divert management attention and resources from the operation of our business. As a result, the outcome of legal and regulatory actions arising out of any state or federal inquiries we receive could have a material adverse effect on our business, financial condition or results of operations.
Lawmakers, regulators and other public officials have signaled an increased focus on new or additional laws or regulations that could impact our broker-dealer business and require us to make significant changes to our business model and practices, and could result in significant costs to our business or loss of current revenue streams.
Various lawmakers, regulators and other public officials have recently made statements about business practices in which we and other broker-dealers engage, including SoFi Securities, and signaled an increased focus on new or additional laws or regulations that, if acted upon, could impact our business. For example, a focus by regulators and lawmakers on PFOF, exchange rebates, and related conflicts of interest have resulted in new proposed rules. Additionally, the SEC has proposed new requirements regarding best execution (Regulation Best Execution), PFOF and a rule to prohibit volume-based transaction pricing in connection with the execution of agency-related orders in national market system stock. The SEC also issued an order in September 2023 directing the equity exchanges and FINRA to file a new national marketing system plan. This order and other proposals have the potential to substantially reshape U.S. equities markets in intended and unintended ways, and to substantially alter existing order routing, execution incentives and business practices. The SEC also finalized rules in February 2023 to shorten the standard settlement cycle for most broker-dealer transactions in securities from two business days after the trade (T+2) to one (T+1). The SEC compliance date for T+1 is in May 2024 and this change has required and will continue to require technological, operational, and compliance adjustments across the industry that are likely to be time consuming and costly for all market participants. Additionally, a focus by lawmakers and regulators on so-called gamification and digital engagement practices has resulted in a new rule proposed by the SEC and, in July 2023, the SEC proposed new rules and amendments to address certain conflicts of interest associated with the use of predictive data analytics by broker-dealers and investment advisers in investor interactions. If adopted, the proposed rules would require broker-dealers and investment advisers to evaluate and determine whether their use of certain technologies in investor interactions such as analytical, technological or computational functions, algorithms, models, correlation matrices or similar methods or processes that direct or optimize for investment related behavior, involves a conflict of interest that results in the broker-dealer or investment adviser’s interests being placed ahead of investors’ interests. A Fall 2023 SEC rulemaking agenda indicates that adoptions of these proposed rules are likely.
To the extent that the SEC, FINRA or other regulatory authorities or legislative bodies adopt additional regulations or legislation in respect of any of these areas or relating to any other aspect of our business, we could face a heightened risk of potential regulatory violations and could be required to make significant changes to our business model and practices, which changes may not be successful. Any of these outcomes could have an adverse effect on our business, financial condition and results of operations. Additionally, any negative publicity surrounding PFOF practices generally, or our implementation of this
practice, could harm our brand and reputation. For more information about the potential impact of legal and regulatory changes, see “We may become subject to enforcement actions or litigation as a result of our failure to comply with laws and regulations, even though noncompliance was inadvertent or unintentional”.
Regulations relating to privacy, information security and data protection could increase our costs, affect or limit how we collect and use personal information, and adversely affect our business opportunities.
We are subject to various privacy, information security and data protection laws, including requirements concerning security breach notification, and we could be negatively impacted by them. For example, we are subject to the GLBA and implementing regulations and guidance. Among other things, the GLBA (i) imposes certain limitations on the ability to share consumers’ nonpublic personal information with nonaffiliated third parties and (ii) requires certain disclosures to consumers about our practices for the collection, sharing and safeguarding of their information and their right to “opt out” of the institution’s disclosure of their personal financial information to nonaffiliated third parties (with certain exceptions). The GLBA and other state laws also require that we implement and maintain certain security measures, policies and procedures to protect personal information.
Furthermore, legislators and/or regulators are increasingly adopting new and/or amending existing privacy, information security and data protection laws that potentially could have a significant impact on our current and planned privacy, data protection and information security-related practices; our policies and practices related to the collection, use, sharing, retention and safeguarding of consumer and/or employee information; and some of our current or planned business activities. New requirements, originating from new or amended laws, could also increase our costs of compliance and business operations and could reduce income from certain business initiatives.
Compliance with current or future privacy, information security and data protection laws (including those regarding security breach notification) affecting customer and/or employee data to which we are subject could result in higher compliance and technology costs and could restrict our ability to provide certain products and services (such as products or services that involve sharing information with third parties or storing sensitive credit card information), which could materially and adversely affect our profitability. A failure by us or a third-party contractor providing services to us to comply with applicable data privacy and security laws, regulations, self-regulatory requirements or industry guidelines, or our terms of use with our users, may result in sanctions, statutory or contractual damages or litigation (including class actions) and may subject us to reputational harm. Additionally, there is always a danger that regulators can attempt to assert authority over our business in the area of privacy, information security and data protection. Furthermore, if our vendors and/or service providers are or become subject to laws and regulations in the jurisdictions that have enacted more stringent and expansive legislation applicable to privacy, information and/or data protection, the costs that these vendors and service providers must incur in becoming compliant may be passed along to us, resulting in increasing costs on our business.
Concerns in our ability, perceived or otherwise, to protect the privacy and security of personal information may affect our ability to retain and engage new and existing members, clients, investors, and employees, and thereby affect our financial condition. Furthermore, failure to comply or perceived failure to comply with applicable privacy or data protection laws, rules, and regulations may subject us to examinations, investigations, and general heightened scrutiny that may cause us to modify or cease certain operations or practices, significant liabilities or regulatory fines, penalties or other sanctions. Any of these could damage our reputation and adversely affect our business, financial condition, and results of operations.
Privacy requirements, including notice and opt-out requirements, under the GLBA and FCRA are enforced by the FTC, the OCC and by the CFPB through UDAAP and are a standard component of OCC and CFPB compliance and examinations. State entities also may initiate actions for alleged violations of privacy or security requirements under state law. Our failure to comply with privacy, information security and data protection laws could result in potentially significant regulatory investigations and government actions, litigation, fines or sanctions, consumer or merchant actions and damage to our reputation and brand, all of which could have a material adverse effect on our business.
Should we undertake an international expansion of our business, particularly if we commence doing business in one or more countries of the EU or the United Kingdom (the “UK”), we will be required to comply with stringent privacy and data protection laws. Within the EU, legislators have adopted the General Data Protection Regulation (the “GDPR”), which became effective in May 2018. Should we commence doing business in Europe, the GDPR will impose additional obligations and risk upon our business, which may increase substantially the penalties to which we could be subject in the event of any noncompliance. We may incur substantial expense in complying with obligations imposed by the GDPR and we may be required to make significant changes in our business operations, all of which may adversely affect our revenues and our business overall.
In addition, further to the UK’s exit from the EU on January 31, 2020, the GDPR ceased to apply in the UK at the end of the transition period on December 31, 2020. However, as of January 1, 2021, the UK’s European Union (Withdrawal) Act 2018 incorporated the GDPR (as it existed on December 31, 2020 but subject to certain UK specific amendments) into UK law, referred to as the “UK GDPR”. The UK GDPR and the UK Data Protection Act 2018 set out the UK’s data protection regime, which is independent from but aligned to the EU’s data protection regime. Noncompliance with the UK GDPR may result in significant monetary penalties. Although the UK is regarded as a third country under the EU’s GDPR, the EC has issued a decision recognizing the UK as providing adequate protection under the EU GDPR and, therefore, transfers of personal data originating in the EU to the UK remain unrestricted. Like the EU GDPR, the UK GDPR restricts personal data transfers outside the UK to countries not regarded by the UK as providing adequate protection. The UK government has confirmed that personal data transfers from the UK to the EEA remain free flowing.
In addition, around the world many jurisdictions outside of Europe are also considering and/or have enacted comprehensive data protection legislation. For example, we are subject to stringent privacy and data protection requirements in Hong Kong. Also, many jurisdictions where we may seek to expand our business in the future are also considering and/or have enacted comprehensive data protection legislation. Additional jurisdictions with stringent data protection laws include Brazil and China. In the United States, the SEC proposed multiple rules related to privacy and cybersecurity in March 2023. Proposed amendments to Regulation S-P would, among other things: (i) require covered institutions (including broker-dealers and investment advisers) to adopt written policies and procedures for an incident response program to address unauthorized access to or use of customer information; and (ii) require covered institutions to have written policies and procedures to provide timely notification to affected individuals whose sensitive customer information was or is reasonably likely to have been accessed or used without authorization. The SEC reopened the comment period for the Investment Management Cybersecurity Release which proposed new rules that would require registered investment advisers and investment companies to adopt and implement written cybersecurity policies and procedures reasonably designed to address cybersecurity risks, disclose information about cybersecurity risks and incidents, report information confidentially to the SEC about certain cybersecurity incidents, and maintain related records. While we believe we have robust policies and procedures addressing incidents involving unauthorized access to or use of customer information, these regulations have and may in the future require us to amend our current incident response program. In addition, these regulations may interfere with our intended business activities, inhibit our ability to expand into those markets or prohibit us from continuing to offer services in those markets without significant additional costs.
The regulatory framework governing the collection, processing, storage, use and sharing of certain information, particularly financial and other personal information, is rapidly evolving and is likely to continue to be subject to uncertainty and varying interpretations. It is possible that these laws may be interpreted and applied in a manner that is inconsistent with laws in other jurisdictions or with our existing data management practices or the features of our services and platform capabilities. We therefore cannot yet fully determine the impact existing and/or future laws, rules, regulations and industry standards may have on our business or operations. Any failure or perceived failure by us, or any third parties with which we do business, to comply with our posted privacy policies, changing consumer expectations, evolving laws, rules and regulations, industry standards, or contractual obligations to which we or such third parties are or may become subject, may result in actions or other claims against us by governmental entities or private actors, the expenditure of substantial costs, time and other resources or the imposition of significant fines, penalties or other liabilities. In addition, any such action, particularly to the extent we were found to be guilty of violations or otherwise liable for damages, would damage our reputation and adversely affect our business, financial condition and results of operations.
Any such laws, rules, regulations and industry standards may be inconsistent among different jurisdictions, subject to differing interpretations or may conflict with our current or future practices. Additionally, our customers may be subject to differing privacy laws, rules and legislation, which may mean that they require us to be bound by varying contractual requirements applicable to certain other jurisdictions. Adherence to such contractual requirements may impact our collection, use, processing, storage, sharing and disclosure of various types of information including financial information and other personal information, and may mean we become bound by, or voluntarily comply with, self-regulatory or other industry standards relating to these matters that may further change as laws, rules and regulations evolve. Complying with these requirements and changing our policies and practices may be onerous and costly, and we may not be able to respond quickly or effectively to regulatory, legislative and other developments. These changes may in turn impair our ability to offer our existing or planned features, products and services and/or increase our cost of doing business. As we expand our customer base, these requirements may vary from customer to customer, further increasing the cost of compliance and doing business.
We publicly post documentation regarding our practices concerning the collection, processing, use and disclosure of data. Although we endeavor to comply with our published policies and documentation, we may at times fail to do so or be alleged to have failed to do so. Any failure or perceived failure by us to comply with our privacy policies or any applicable privacy, security or data protection, information security or consumer-protection related laws, regulations, orders or industry standards could expose us to costly litigation, significant awards, fines or judgments, civil and/or criminal penalties or negative
publicity, and could materially and adversely affect our business, financial condition and results of operations. The publication of our privacy policy and other documentation that provide promises and assurances about privacy and security can subject us to potential state and federal action if they are found to be deceptive, unfair, or misrepresentative of our actual practices, which could, individually or in the aggregate, materially and adversely affect our business, financial condition and results of operations.
It may be difficult and costly to protect our intellectual property rights, and we may not be able to ensure their protection.
Our ability to provide our products and services to our members and technology platform clients depends, in part, upon our proprietary technology. We may be unable to protect our proprietary technology effectively, which would allow competitors to duplicate our business processes and know-how, and adversely affect our ability to compete with them. A third party may attempt to reverse engineer or otherwise obtain and use our proprietary technology without our consent. The pursuit of a claim against a third party for infringement of our intellectual property could be costly, and there can be no guarantee that any such efforts would be successful.
In addition, our platform or those of third-party service providers that we utilize may infringe upon claims of third-party intellectual property, and we may face intellectual property challenges from such other parties. We may not be successful in defending against any such challenges or in obtaining licenses to avoid or resolve any intellectual property disputes, or in receiving amounts due to us under indemnification obligations from third-party service providers. The costs of defending any such claims or litigation could be significant and, if we are unsuccessful, could result in a requirement that we pay significant damages or licensing fees, which would negatively impact our financial performance. If we cannot protect our proprietary technology from intellectual property challenges, our ability to maintain our platform could be adversely affected.
Some aspects of our platform include open source software, and any failure to comply with the terms of one or more of these open source licenses could negatively affect our business.
We incorporate open source software into our proprietary platform and into other processes supporting our business. Such open source software may include software covered by licenses like the GNU General Public License and the Apache License or other open source licenses. The terms of various open source licenses have not been interpreted by U.S. courts, and there is a risk that such licenses could be construed in a manner that limits our use of the software, inhibits certain aspects of our platform and negatively affects our business operations.
Some open source licenses contain requirements that we make available source code for modifications or derivative works we create based upon the type of open source software we use. If portions of our proprietary platform are determined to be subject to an open source license, or if the license terms for the open source software that we incorporate change, we could be required to publicly release the affected portions of our source code, re-engineer all or a portion of our platform or change our business activities. In addition to risks related to license requirements, the use of open source software can lead to greater risks than the use of third-party commercial software, as open source licensors generally do not provide warranties or controls on the origin of the software. Many of the risks associated with the use of open source software cannot be eliminated and could adversely affect our business.
Litigation, regulatory actions and compliance issues could subject us to significant fines, penalties, judgments, remediation costs, negative publicity, changes to our business model, and requirements resulting in increased expenses.
Our business is subject to increased risks of litigation and regulatory actions as a result of a number of factors and from various sources, including as a result of the highly regulated nature of the financial services industry and the focus of state and federal enforcement agencies on the financial services industry.
From time to time, we are also involved in, or the subject of, reviews, requests for information, investigations and proceedings (both formal and informal) by state and federal governmental agencies and SROs, regarding our business activities and our qualifications to conduct our business in certain jurisdictions, which has in the past and could in the future subject us to significant fines, penalties, obligations to change our business practices and other requirements resulting in increased expenses and diminished earnings. Our involvement in any such matter also has in the past and could in the future cause significant harm to our reputation and divert management attention from the operation of our business, even if the matters are ultimately determined in our favor. Moreover, any settlement, or any consent order or adverse judgment in connection with any formal or informal proceeding or investigation by a government agency, may prompt litigation or additional investigations or proceedings as other litigants or other government agencies begin independent reviews of the same activities. See “If we fail to comply with federal and state consumer protection laws, rules, regulations and guidance, our business could be adversely affected” for a discussion of the FTC Consent Order.
In addition, a number of participants in the financial services industry have been the subject of: putative class action lawsuits; state attorney general actions and other state regulatory actions; federal regulatory enforcement actions, including actions relating to alleged unfair, deceptive or abusive acts or practices; violations of state licensing and lending laws, including state usury laws; actions alleging discrimination on the basis of race, ethnicity, gender or other prohibited bases; and allegations of noncompliance with various state and federal laws and regulations relating to originating and servicing consumer finance loans. For example, we entered into a settlement agreement on April 18, 2022 related to a putative class action in which it was alleged that we engaged in unlawful lending discrimination through policies and practices by making applicants who are conditional permanent residents or DACA holders ineligible for loans or eligible only with a co-signer who is U.S. citizen or lawful permanent resident. We made an aggregate payment to the class and the class counsel in an immaterial amount. In addition, as a financial services company, errors in performing settlement functions, including clerical, technological and other errors related to the handling of funds and securities could lead to censures, fines or other sanctions imposed by applicable regulatory authorities as well as losses and liabilities in related lawsuits and proceedings brought by transaction counterparties and others.
The current regulatory environment, increased regulatory compliance efforts and enhanced regulatory enforcement have resulted in significant operational and compliance costs and may prevent us from providing certain products and services. There is no assurance that these regulatory matters or other factors will not, in the future, affect how we conduct our business and, in turn, have a material adverse effect on our business. In particular, legal proceedings brought under state consumer protection statutes or under several of the various federal consumer financial services statutes may result in a separate fine for each violation of the statute, which, particularly in the case of class action lawsuits, could result in damages substantially in excess of the amounts we earned from the underlying activities.
In addition, from time to time, through our operational and compliance controls, we identify compliance and other issues that require us to make operational changes and, depending on the nature of the issue, result in financial remediation to impacted members. These self-identified issues and voluntary remediation payments could be significant, depending on the issue and the number of members impacted, and also could generate litigation or regulatory investigations that subject us to additional risk. See Part I, Item 3. “Legal Proceedings”.
Changes in tax law and differences in interpretation of tax laws and regulations may adversely impact our financial statements.
We operate in multiple jurisdictions and are subject to tax laws and regulations of the U.S. federal, state and local and non-U.S. governments. U.S. federal, state and local and non-U.S. tax laws and regulations are complex and subject to varying interpretations. U.S. federal, state and local and non-U.S. tax authorities may interpret tax laws and regulations differently than we do and challenge tax positions that we have taken. This may result in differences in the treatment of revenues, deductions, credits and/or differences in the timing of these items. The differences in treatment may result in payment of additional taxes, interest or penalties that could have an adverse effect on our financial condition and results of operations. Further, future changes to U.S. federal, state and local and non-U.S. tax laws and regulations could increase our tax obligations in jurisdictions where we do business or require us to change the manner in which we conduct some aspects of our business. Proposals to reform U.S. and foreign tax laws could significantly impact how U.S. multinational corporations are taxed on foreign earnings and could increase the U.S. corporate tax rate. Several of the proposals currently being considered, if enacted, could have an adverse impact on our future effective tax rate, income tax expense, and cash flows. Further, the Organisation for Economic Co-operation and Development (the “OECD”), an international association of 38 countries, including the U.S., has issued guidelines that change long-standing tax principles. These guidelines create tax uncertainty as countries amend their tax laws to adopt certain parts of the guidelines.
We will be adversely affected if we, or any of our subsidiaries, are determined to have been subject to registration as an investment company under the Investment Company Act.
We are currently not deemed to be an “investment company” subject to regulation under the Investment Company Act of 1940, as amended (the “Investment Company Act”). No opinion or no-action position has been requested of the SEC on our status as an Investment Company. There is no guarantee we will continue to be exempt from registration under the Investment Company Act and were we to be deemed to be an investment company under the Investment Company Act, and thus subject to regulation under the Investment Company Act, the increased reporting and operating requirements could have an adverse impact on our business, operating results, financial condition and prospects.
In addition, if the SEC or a court of competent jurisdiction were to find that we are in violation of the Investment Company Act for having failed to register as an investment company thereunder, possible consequences include, but are not limited to, the following: (i) the SEC could apply to a district court to enjoin the violation; (ii) we could be sued by investors in us and in our securities for damages caused by the violation; and (iii) any contract to which we are a party that is made in, or
whose performance involves a, violation of the Investment Company Act would be unenforceable by any party to the contract unless a court were to find that under the circumstances enforcement would produce a more equitable result than nonenforcement and would not be inconsistent with the purposes of the Investment Company Act. Should we be subjected to any or all of the foregoing, our business would be materially and adversely affected.
Personnel and Business Continuity Risks We rely on our management team and will require additional key personnel to grow our business, and the loss of key management members or key employees, or an inability to hire key personnel, could harm our business.
We believe our success has depended, and continues to depend, on the efforts and talents of our senior management, who have significant experience in the financial services and technology industries, are responsible for our core competencies and would be difficult to replace. Our future success depends on our continuing ability to attract, develop, motivate and retain highly qualified and skilled employees. Qualified individuals are usually in high demand even in an uncertain economy, and we may incur significant costs to attract and retain them. In addition, the loss of any of our senior management or key employees could materially adversely affect our ability to execute our business plan and strategy, and we may not be able to find adequate replacements on a timely basis, or at all, and our other employees may be required to take on additional responsibilities. Furthermore, many candidates evaluate year over year stock growth trends for a sense of the potential long-term value of their proposed stock awards, or have recently begun to discount the value of growth stocks on the whole. The volatility of the market price of our common stock could harm our ability to attract and retain talent. Our executive officers and other employees are at-will employees, which means they may terminate their employment relationship with us at any time, and their knowledge of our business and industry would be extremely difficult to replace. We cannot ensure that we will be able to retain the services of any members of our senior management or other key employees. If we do not succeed in attracting well-qualified employees or retaining and motivating existing employees, our business could be materially and adversely affected.
The job market and the optimization of our workforce creates a challenge and potential risk as we strive to attract and retain a highly skilled workforce.
Competition for certain of our employees, including highly skilled technology and product professionals responsible for the design, engineering and operation of systems, is competitive, which can present a risk as we compete for experienced candidates, especially if the competition is able to offer more attractive financial terms of employment. This risk extends to our current employee population. We also invest significant time and expense in engaging and developing our employees, which also increases their value to other companies that may seek to recruit them. Turnover can result in significant replacement costs and lost productivity.
In addition, from time to time, we implement organizational changes to pursue greater efficiency and realign our business and strategic priorities. For example, in the recent past, we laid off a relatively small number of employees even though we intend to continue to hire in other areas. As our organization continues to evolve, and we are required to implement and optimize our business and organizational structures, we may find it difficult to maintain the benefits of our corporate culture, including our ability to quickly develop and launch new and innovative products. This could negatively affect our business performance. See also “We transitioned to a flexible-first workforce model, which could subject us to increased business continuity and cyber risks, as well as other operational challenges and risks that could significantly harm our business and operations” for more information on the impact of a flexible workforce model on corporate culture and employee retention.
In addition, U.S. immigration policy has made it more difficult for qualified foreign nationals to obtain or maintain work visas under the H-1B classification. These H-1B visa limitations make it more difficult and/or more expensive for us to hire the skilled professionals we need to execute our growth strategy, especially engineering, data analytics and risk management personnel, and may adversely impact our business.
We transitioned to a flexible-first workforce model, which could subject us to increased business continuity and cyber risks, as well as other operational challenges and risks that could significantly harm our business and operations.
We offer most of our employees the choice of working full time in the office, a hybrid approach, or full-time remote. In 2023 we announced an increase in in-office collaboration for non-remote employees who are returning to the office for a specified number of days per month, varying by business team. This return to the office for non-remote employees is limited, and we expect many employees to continue to work remotely for a number of days per week. As a result, we expect to continue to be subject to the challenges and risks of having a remote workforce, as well as new challenges and risks from operating with a hybrid workforce. For example, our employees are accessing our servers remotely through home or other networks to perform their job responsibilities. Such security systems may be less secure than those used in our offices, which may subject us to
increased security risks, including cybersecurity-related events, and expose us to risks of data or financial loss and associated disruptions to our business operations. Additionally, employees who access company data and systems remotely may not have access to technology that is as robust as that in our offices, which could place additional pressure on our user infrastructure and third parties that are not easily mitigated. These risks include home internet availability affecting work continuity and efficiency, and additional dependencies on third-party communication tools, such as instant messaging and online meeting platforms. We may also be exposed to risks associated with the locations of remote employees, including compliance with local laws and regulations or exposure to compromised internet infrastructure. Allowing our employees to work remotely may create intellectual property risk if employees create intellectual property on our behalf while residing in a jurisdiction with unenforced or uncertain intellectual property laws. Further, if employees fail to inform us of changes in their work location, we may be exposed to additional risks without our knowledge. While most of our operations can be performed remotely and we believe have operated effectively, there is no guarantee that this will continue or that we will continue to be as effective while operating a flexible-first workforce model because our team is dispersed.
Additionally, operating our business with both remote and in-person workers, or workers who work in flexible locations and on flexible schedules, could have a negative impact on our corporate culture, decrease the ability of our workforce to collaborate and communicate effectively, decrease innovation and productivity, or negatively affect workforce morale. If we are unable to manage the cybersecurity and other risks of a flexible-first workforce model, and maintain our corporate culture and workforce morale, our business could be harmed or otherwise adversely impacted.
Our business is subject to the risks of natural disasters, power outages, telecommunications failures and similar events, including public health crises, and to interruptions by human-made problems such as terrorism, cyberattacks, and other actions, which may impact the demand for our products or our members’ ability to repay their loans.
Events beyond our control may damage our ability to maintain our platform and provide services to our members. Such events include, but are not limited to, hurricanes, earthquakes, fires, floods and other natural disasters, public health crises, power or other outages, telecommunications failures and similar events. Despite any precautions we may take, system interruptions and delays could occur if there is a natural disaster, if a third-party provider closes a facility we use without adequate notice for financial or other reasons, or if there are other unanticipated problems at our leased facilities. Because we rely heavily on our servers, computer and communications systems and the Internet to conduct our business and provide high-quality service to our members, disruptions could harm our ability to effectively run our business. Moreover, our members and customers face similar risks, which could directly or indirectly impact our business. We currently use AWS and would be unable to switch instantly to another system in the event of failure to access AWS. This means that an outage of AWS could result in our system being unavailable for a significant period of time. Terrorism, cyberattacks and other criminal, tortious or unintentional actions could also give rise to significant disruptions to our operations. In addition, the long-term effects of climate change on the global economy and our industry in particular are unclear, however we recognize that there are inherent climate-related risks wherever business is conducted. For example, our offices may be vulnerable to the adverse effects of climate change. We have large offices located in the San Francisco Bay Area and Salt Lake City, Utah, regions that are prone to events such as seismic activity and severe weather, that have experienced and may continue to experience, climate-related events and at an increasing rate. Examples include drought and water scarcity, warmer temperatures, wildfires and air quality impacts and power shut-offs associated with wildfire prevention. The increasing intensity of drought throughout California and Utah and annual periods of wildfire danger increase the probability of planned power outages. Although we maintain a disaster response plan and insurance, such events could disrupt our business, the business of our partners or third-party suppliers, and may cause us to experience losses and additional costs to maintain and resume operations. Our business interruption insurance may not be sufficient to compensate us for losses that may result from interruptions in our service as a result of system failures or other disruptions. Comparable natural and other risks may reduce demand for our products or cause our members to suffer significant losses and/or incur significant disruption in their respective operations, which may affect their ability to satisfy their obligations towards us. All of the foregoing could materially and adversely affect our business, results of operations and financial condition.
Employee misconduct, which can be difficult to detect and deter, could harm our reputation and subject us to significant legal liability.
We operate in an industry in which integrity and the confidence of our members is of critical importance. We are subject to risks of errors and misconduct by our employees that could adversely affect our business, including:
•engaging in misrepresentation or fraudulent activities when marketing or performing online brokerage and other services to our members;
•improperly using or disclosing confidential information of our members, technology platform clients, or other parties;
•concealing unauthorized or unsuccessful activities; or
•otherwise not complying with applicable laws and regulations or our internal policies or procedures.
There have been numerous highly-publicized cases of fraud and other misconduct by financial services industry employees. The precautions that we take to detect and deter employee misconduct might not be effective. If any of our employees engage in illegal, improper, or suspicious activity or other misconduct, we could suffer serious harm to our reputation, financial condition, member relationships, and our ability to attract new members. We also could become subject to regulatory sanctions and significant legal liability, which could cause serious harm to our financial condition, reputation, member relationships and prospects of attracting additional members.
Risk Management and Financial Reporting Risks If we fail to establish and maintain proper and effective internal control over financial reporting, our ability to produce accurate and timely financial statements could be impaired, investors may lose confidence in our financial reporting and the trading price of our common stock may decline.
Pursuant to Section 404 of the Sarbanes-Oxley Act, a report by management on internal control over financial reporting and an attestation of our independent registered public accounting firm are required. The rules governing the standards that must be met for management to assess internal control over financial reporting are complex and require significant documentation, testing and possible remediation. We are required, pursuant to Section 404 of the Sarbanes-Oxley Act, to furnish a report by management on, among other things, the effectiveness of our internal control over financial reporting for our annual reports on Form 10-K. This assessment must include disclosure of any material weaknesses identified by our management in our internal control over financial reporting. Our independent registered public accounting firm must also attest to the effectiveness of our internal control over financial reporting in our annual reports on Form 10-K. We are required to disclose changes made in our internal controls and procedures on a quarterly basis. Failure to comply with the Sarbanes-Oxley Act could potentially subject us to sanctions or investigations by the SEC, the applicable stock exchange or other regulatory authorities, which would require additional financial and management resources.
The annual internal control assessment required by Section 404 of Sarbanes-Oxley has diverted, and may in the future divert, internal resources and we have and may experience higher operating expenses, higher independent auditor and consulting fees in the future. To comply with the Sarbanes-Oxley Act, the requirements of being a reporting company under the Exchange Act and any new or revised accounting rules in the future, as necessary, we have, and may in the future further, work to upgrade SoFi’s legacy information technology systems; implement additional financial and management controls, reporting systems and procedures; and hire additional accounting and finance staff. If we are unable to hire the additional accounting and finance staff necessary to comply with these requirements, we may need to retain additional outside consultants. In addition, our current controls and any new controls that we develop may become inadequate because of poor design and changes in our business. For example, our continuing growth and expansion in globally dispersed markets, such as our acquisition of Technisys, has placed and may in the future place significant additional pressure on our system of internal control over financial reporting, as acquisition targets may not be in compliance with the provisions of the Sarbanes-Oxley Act. We do not conduct a formal evaluation of companies’ internal control over financial reporting prior to an acquisition. We may be required to hire additional staff and incur substantial costs to implement the necessary new internal controls at companies we acquire. Any failure to implement and maintain effective internal controls over financial reporting could adversely affect the results of assessments by our independent registered public accounting firm and their attestation reports. If we or, if required, our independent registered public accounting firm, are unable to conclude that our internal control over financial reporting is effective, investors may lose confidence in our financial reporting, which could negatively impact the price of our securities.
As a result of any material weakness, restatement, change in accounting, or other matters raised or that may in the future be raised by the SEC, we may face potential litigation or other disputes, which may include, among others, claims invoking the federal and state securities laws, contractual claims or other claims arising from the restatement and material weaknesses in our internal control over financial reporting and the preparation of our financial statements. We can provide no assurance that litigation or disputes will not arise in the future. Any such litigation or dispute related to our financial statements or internal controls, whether successful or not, could have a material adverse effect on our business, results of operations and financial condition.
We cannot assure you that there will not be additional material weaknesses in our internal control over financial reporting now or in the future. For example, as the accounting acquirer in the Business Combination, we inherited a material weakness from SCH related to the treatment of warrants issued by special acquisition companies which required SCH to restate its previously issued audited financial statements as of December 31, 2020. Any failure to maintain internal control over financial reporting could cause us to fail to timely detect errors and severely inhibit our ability to accurately report our financial condition, results of operations or cash flows. If we are unable to conclude that our internal control over financial reporting is
effective, or if our independent registered public accounting firm determines that we have a material weakness in our internal control over financial reporting, investors may lose confidence in the accuracy and completeness of our financial reports, the market price of our common stock could decline, and we could be subject to sanctions or investigations by Nasdaq, the SEC or other regulatory authorities. Failure to remedy any material weakness in our internal control over financial reporting, or to implement or maintain other effective control systems required of public companies, could also restrict our future access to the capital markets.
We adjust our total number of members in the event a member is removed in accordance with our terms of service, and our total member count in any one period may not yet reflect such adjustments.
We adjust our total number of members in the event a member is removed in accordance with our terms of service. This could occur for a variety of reasons—including fraud or pursuant to certain legal processes or if a member requests that we close their account in accordance with our terms of service—and, as our terms of service evolve together with our business practices, product offerings and applicable regulations, additional grounds for removing members from our total member count could occur. The determination that a member should be removed in accordance with our terms of service is subject to an evaluation process, following the completion, and based on the results, of which, relevant members and their associated products are removed from our total member count. However, depending on the length of the evaluation process, that removal may not take place in the same period in which the member was added to our member count or the same period in which the circumstances leading to their removal occurred. For this reason, our total member count in any one period may not yet reflect such adjustments. In any given period, we estimate that up to 10% of our members may be under evaluation for removal in accordance with our terms of service; however, we cannot assure you that this percentage in any period will not be more significant and have an adverse impact on our stock price or results of operations.
Our reported financial results may be adversely affected by changes in accounting principles generally accepted in the United States.
Generally accepted accounting principles in the United States are subject to interpretation by the Financial Accounting Standards Board, the American Institute of Certified Public Accountants, the SEC and various bodies formed to promulgate and interpret appropriate accounting principles. A change in these principles or interpretations could have a significant effect on our reported financial results, and could affect the reporting of transactions completed before the announcement of a change.
Our management has limited experience in operating a public company.
We have incurred and will continue to incur increased costs as a result of operating as a public company, and our management intends to continue to devote substantial time to new compliance initiatives. As a public company, we are subject to the reporting requirements of the Exchange Act, the Sarbanes-Oxley Act, the Dodd-Frank Act, as well as rules adopted, and to be adopted, by the SEC and Nasdaq. Our management and other personnel devote and we expect will continue to devote a substantial amount of time to these compliance initiatives. Furthermore, new rules and regulations or changes to existing rules and regulations in the future may increase our legal and financial compliance costs and make some activities more time-consuming and costly, which would increase our net loss for the foreseeable future. The impact of these requirements could also make it more difficult for us to attract and retain qualified persons to serve on our Board of Directors, its board committees or as executive officers.
Our executive officers have limited experience in dealing with the increasingly complex laws pertaining to public companies, which may increase the amount of their time devoted to these activities and result in less time being devoted to the management and growth of the business. We continue to evaluate whether we have adequate personnel with the appropriate level of knowledge, experience and training in the accounting policies, practices or internal control over financial reporting required of public companies. We have in the past and may in the future expand our employee base and hire additional employees to support our operations as a public company, which has caused and may in the future cause our operating costs to increase. See “If we fail to establish and maintain proper and effective internal control over financial reporting, our ability to produce accurate and timely financial statements could be impaired, investors may lose confidence in our financial reporting and the trading price of our common stock may decline”.
As a result of our business combination with a special purpose acquisition company, regulatory obligations may impact us differently than other publicly traded companies.
We became a publicly traded company by completing a transaction with SCH, a SPAC. As a result of this transaction, regulatory obligations have, and may continue, to impact us differently than other publicly traded companies. For instance, the SEC and other regulatory agencies may issue additional guidance or apply further regulatory scrutiny to companies like us that have completed a business combination with a SPAC. Managing this regulatory environment, which has and may continue to
evolve, could divert management’s attention from the operation of our business, negatively impact our ability to raise additional capital when needed or have an adverse effect on the price of our common stock.
Our risk management processes and procedures may not be effective.
Our risk management processes and procedures seek to appropriately balance risk and return and mitigate risks. We have established processes and procedures intended to identify, measure, monitor and control the types of risk to which we are subject, including interest rate risk, credit risk, deposit risk, market risk, foreign currency exchange rate risk, liquidity risk, strategic risk, operational risk, cybersecurity risk, and reputational risk. Credit risk is the risk of loss that arises when a loan obligor fails to meet the terms of a loan repayment obligation, the loan enters default, and if uncured results in financial loss of remaining principal and interest to the loan purchaser. Our exposure to credit risk mainly arises from our lending activities, including SoFi Credit Card. Deposit risk refers to accelerated availability of depositor funds, prior to settlement, risk of ACH returns or merchant settlements, and transactional limits that may be applied to deposit accounts. Market risk is the risk of loss due to changes in external market factors, such as interest rates, asset prices, and foreign exchange rates. Foreign currency exchange rate risk is the risk that our financial position or results of operations could be positively or negatively impacted by fluctuations in exchange rates. We may in the future be subject to increasing foreign currency exchange rate risk with our acquisition of Technisys, a foreign company, and we continue to pursue a diversified durable growth strategy with expansion via new products and geographies. Liquidity risk is the risk that financial condition or overall safety and soundness are adversely affected by an inability, or perceived inability, to meet obligations (e.g., current and future cash flow needs) and support business growth. We actively monitor our liquidity position at the broker-dealer and SoFi Bank. Strategic risk is the risk from changes in the business environment, ineffective business strategies, improper implementation of decisions or inadequate responsiveness to changes in the business and competitive environment.
Operational risk is the risk of loss arising from inadequate or failed internal processes, controls, people (e.g., human error or misconduct) or systems (e.g., technology problems), business continuity or external events (e.g., natural disasters), compliance, reputational, regulatory, or legal matters and includes those risks as they relate directly to us, fraud losses attributed to applications and any associated fines and monetary penalties as a result, transaction processing, or employees, as well as to third parties with whom we contract or otherwise do business. We believe operational risk is one of the most prevalent forms of risk in our risk profile. We strive to manage operational risk by establishing policies and procedures to accomplish timely and efficient processing, obtaining periodic internal control attestations from management, conducting internal process Risk Control Self-Assessments and audit reviews to evaluate the effectiveness of internal controls. Our operational risk, and the amount we invest in risk management, may increase as we introduce new products and product features, and as new threat actors and evolving threat vectors, such as account takeover tactics, increase and become more sophisticated. In order to be effective, among other things, our enterprise risk management capabilities must adapt and align to support any new product or loan features, capability, strategic development, or external change.
Cybersecurity risk is the risk of a malicious technological attack intended to impact the confidentiality, availability, or integrity of our systems and data, including, but not limited to, sensitive client data. Our technology and cybersecurity teams rely on a layered system of preventive and detective technologies, controls, and policies to detect, mitigate, and contain cybersecurity threats. In addition, our cybersecurity team, and the third-party consultants they engage, regularly assess our cybersecurity risks and mitigation efforts. Cyberattacks can also result in financial and reputational risk.
Reputational risk is the risk arising from possible negative perceptions of us, whether true or not, among our current and prospective members, clients, counterparties, employees, and regulators. The potential for either enhancing or damaging our reputation is inherent in almost all aspects of business activity. We attempt to manage this risk through our commitment to a set of core values that emphasize and reward high standards of ethical behavior, maintaining a culture of compliance, and by being responsive to member and regulatory requirements.
Risk, including, but not limited to, the risks outlined above, is inherent in our business, and therefore, despite our efforts to manage risk, there can be no assurance that we will not sustain unexpected losses. We could incur substantial losses and our business operations could be disrupted to the extent our business model, operational processes, control functions, technological capabilities, risk analyses, and business/product knowledge do not adequately identify and manage potential risks associated with our strategic initiatives. There also may be risks that exist, or that develop in the future, that we have not appropriately anticipated, identified or mitigated, including when processes are changed or new products and services are introduced. If our risk management framework does not effectively identify and control our risks, we could suffer unexpected losses or be otherwise adversely affected, which could have a material adverse effect on our business.
Incorrect estimates or assumptions by management in connection with the preparation of our consolidated financial statements or forecasts could adversely affect our reported or forecasted assets, liabilities, income, revenues or expenses.
The preparation of our consolidated financial statements requires management to make critical accounting estimates and assumptions that affect the reported amounts of assets, liabilities, income, revenues or expenses during the reporting periods. Incorrect estimates and assumptions by management could adversely affect our reported amounts of assets, liabilities, income, revenues and expenses during the reporting periods. If we make incorrect assumptions or estimates, our reported financial results may be over- or understated, which could materially and adversely affect our business, financial condition and results of operations.
In addition, operating results are difficult to forecast because they generally depend on a number of factors, including the competition we face, and our ability to attract and retain members and enterprise partnerships, and macroeconomic risks, while generating sustained revenues through the Financial Services Productivity Loop. Additionally, our business may be affected by reductions in consumer borrowing, spending and investing, consumer deposits or investment by technology platform clients from time to time as a result of a number of factors, including the state of the overall economy, which may be difficult to predict. This may result in decreased revenue levels, and we may be unable to adopt measures in a timely manner to compensate for any unexpected shortfall in income. This inability could cause our operating results in a given quarter to be higher or lower than expected. These factors make creating accurate forecasts and budgets challenging and, as a result, we may fall materially short of our forecasts and expectations, which could cause our stock price to decline and investors to lose confidence in us.
We may fail to meet our publicly announced guidance or other expectations about our business and future operating results, which could cause our stock price to decline.
From time to time, we release earnings guidance in our quarterly and annual earnings conference calls, quarterly and annual earnings releases, or otherwise, regarding our future performance that represents our management’s estimates as of the date of release. On January 29, 2024, we provided guidance for the first quarter and full year 2024, as well as through 2026 and beyond. This guidance includes forward-looking statements based on projections prepared by our management. Projections are based upon a number of assumptions and estimates that are based on information known when they are issued, and, while presented with numerical specificity, are inherently subject to significant business, economic and competitive uncertainties and contingencies relating to our business, many of which are beyond our control and are based upon specific assumptions with respect to future business decisions, some of which will change.
Guidance is necessarily speculative in nature, and some or all of the assumptions underlying the guidance furnished by us may not materialize or may vary significantly from actual outcomes. Accordingly, our guidance is only an estimate of what management believes is realizable as of the date of release. Actual results may vary from our guidance and the variations may be material. In light of the foregoing, investors are urged not to rely upon our guidance in making an investment decision regarding our common stock.
Information Technology and Data Risks Cyberattacks and other security breaches could have an adverse effect on our business, harm our reputation and expose us to liability and adversely affect our ability to collect payments and maintain accurate accounts. Efforts to prevent and respond to these attacks and breaches are costly.
In the normal course of business, we collect, process and retain non-public and confidential information regarding our members, prospective members, technology platform clients and the customers of our technology platform clients. We also have arrangements in place with certain third-party service providers that require us to share consumer information.
We likely will not be able to anticipate or prevent all security breaches even if we have implemented the required preventive measures, in which case there would be an increased risk of fraud or identity theft, and we have in the past and may in the future experience losses on, or delays in the collection of amounts owed. Although we devote significant resources and management focus to work to ensure the integrity of our systems through information/cybersecurity and business continuity programs, our facilities and systems, and those of third-party service providers, have been and will likely continue to be targeted by external or internal threats, security breaches, acts of vandalism, including other intentional acts by employees or third-party service providers that we are unable to predict and protect against or that compromise our security systems, computer viruses, misplaced or lost data, programming or human errors, and other similar events. In addition, the digital nature of our platform may make it lucrative for hacking and potentially vulnerable to computer viruses, physical or electronic break-ins and similar disruptions.
We and third-party service providers have experienced such attempts in the past and expect to continue to experience them in the future. Security breaches could occur from outside our company, and also from the actions of persons inside our company who may have authorized or unauthorized access to our technology systems, despite the required investment in security controls. We also face security threats from malicious threat actors that could obtain unauthorized access to our systems and networks, which threats we anticipate will continue to grow in scope and complexity over time. In addition, security threats may increase as a result of geopolitical events, such as in connection with the war between Israel and Hamas, and the ongoing war in Ukraine. These events could interrupt our business or operations, result in significant legal and financial exposure, supervisory liability, damage to our reputation and a loss of confidence in the security of our systems, products and services. Although the impact to date from these events has not had a material adverse effect on us, no assurance is given that this will continue to be the case in the future.
Cybersecurity risks in the financial services industry have increased, in part because of new technologies, the use of the Internet and telecommunications technologies (including mobile devices) to conduct financial and other business transactions and the increased sophistication and activities of organized criminals, perpetrators of fraud, hackers, terrorists and others. In addition to cyberattacks and other security breaches involving the theft of non-public and confidential information, hackers have engaged in attacks that are designed to disrupt key business services, such as consumer-facing websites. We may not be able to anticipate or implement effective preventive measures against all security breaches, especially because the techniques used change frequently and because attacks can originate from a wide variety of sources. We employ detection and response mechanisms designed to contain and mitigate security incidents, but there are no assurances that these mechanisms will be effective and early detection efforts may be thwarted by sophisticated attacks and malware designed to avoid detection. Despite our investments in detection strategy and a 24/7/365 security operations center, we also may fail to detect the existence of a security breach related to the information of our members.
Cybersecurity risks have also subjected us to additional regulation. For example, in July 2023, the SEC proposed new rules and amendments to address certain conflicts of interest associated with the use of predictive data analytics by broker-dealers and investment advisers in investor interactions. If adopted, the proposed rules would require broker-dealers and investment advisers to evaluate and determine whether their use of certain technologies in investor interactions such as analytical, technological or computational functions, algorithms, models, correlation matrices or similar methods or processes that direct or optimize for investment related behavior, involves a conflict of interest that results in the broker-dealer or investment adviser’s interests being placed ahead of investors’ interests. To the extent we determined there were conflicts of interest, we would be required to eliminate, or neutralize the effect of, any such conflicts. The proposed rules would also require us to have written policies and procedures reasonably designed to achieve compliance with the proposed rules and to make and keep books and records related to these requirements.
The access by unauthorized persons to, or the improper disclosure by us of, confidential information regarding our members, prospective members, technology platform clients and the customers of our technology platform clients, or our proprietary information, software, methodologies and business secrets could interrupt our business or operations, result in significant legal and financial exposure, supervisory liability, damage to our reputation or a loss of confidence in the security of our systems, products and services, all of which could have a material adverse impact on our business. Because each loan that we originate involves, in part, our proprietary automated underwriting process, any failure of our computer systems involving our automated underwriting process and any technical or other errors contained in the software pertaining to our automated underwriting process could compromise our ability to accurately evaluate potential members, which could negatively impact our results of operations. Furthermore, any failure of our computer systems could cause an interruption in operations and result in disruptions in, or reductions in the amount of, collections from the loans we make to our members. Additionally, if hackers were able to access our secure files, they might be able to gain access to the personal information of our members, prospective members, technology platform clients and the customers of our technology platform clients. If we are unable to prevent such activity, we may be subject to significant liability, negative publicity and a material loss of members or technology platform clients, all of which may negatively affect our business. In addition, there have in the past been a number of well-publicized attacks or breaches affecting companies in the financial services industry that have heightened concern by consumers, which could also intensify regulatory focus, cause users to lose trust in the security of the industry in general and result in reduced use of our services and increased costs, all of which could also have a material adverse effect on our business.
The collection, processing, use, storage, sharing and transmission of personal data could give rise to liabilities as a result of federal, state and international laws and regulations, as well as our failure to adhere to the privacy and data security practices that we articulate to our members.
We collect, process, store, use, share and/or transmit a large volume of personal information and other non-public data from current, past and prospective members. There are federal, state, and foreign laws regarding privacy, data security and the collection, use, storage, protection, sharing and/or transmission of personal information and non-public data. Additionally,
many states continue to enact legislation on matters of privacy, information security, cybersecurity, data breach and data breach notification requirements. For example, as of January 1, 2020, the CCPA granted additional consumer rights with respect to data privacy in California. The CCPA was amended by a California ballot initiative, the CPRA, in November 2020. The CCPA amendments, including expanded rights for consumers and obligations for businesses, went into effect on January 1, 2023. The CCPA, among other things, entitles California residents to know how their personal information is being collected and shared, to access or request the deletion of their personal information and to opt out of the sharing of their personal information. The amended CCPA also created a new state agency, the CPPA, and vested it with full administrative power, authority and jurisdiction to implement and enforce the CCPA. Generally, personal information that we process is subject to GLBA and thereby exempt from CCPA coverage. However, the CCPA regulates other personal information that we collect and process in connection with the business. While we have made modifications to our data collection and processing practices and policies to comply with the CCPA and CPRA, we cannot predict their impact on our business, operations or financial condition. The effects of the CCPA and the CPRA are potentially significant and may require us to further modify our data collection or processing practices and policies and to incur substantial costs and expenses in an effort to comply and increase our potential exposure to regulatory enforcement and/or litigation. Additionally, our broker-dealer and investment adviser are subject to SEC Regulation S-P, which requires that these businesses maintain policies and procedures addressing the protection of customer information and records. This includes protecting against any anticipated threats or hazards to the security or integrity of customer records and information and against unauthorized access to or use of customer records or information. Regulation S-P also requires these businesses to provide initial and annual privacy notices to customers describing information sharing policies and informing customers of their rights. In March 2023, the SEC proposed multiple rules related to privacy and cybersecurity. Proposed amendments to Regulation S-P would, among other things: (i) require covered institutions (including broker-dealers and investment advisers) to adopt written policies and procedures for an incident response program to address unauthorized access to or use of customer information; and (ii) require covered institutions to have written policies and procedures to provide timely notification to affected individuals whose sensitive customer information was or is reasonably likely to have been accessed or used without authorization. The SEC reopened the comment period for the Investment Management Cybersecurity Release which proposed new rules that would require registered investment advisers and investment companies to adopt and implement written cybersecurity policies and procedures reasonably designed to address cybersecurity risks, disclose information about cybersecurity risks and incidents, report information confidentially to the SEC about certain cybersecurity incidents, and maintain related records.
Outside the United States, an increasing number of laws, regulations, and industry standards apply to data privacy and security. For example, the European Union’s General Data Protection Regulation (EU GDPR), the United Kingdom’s GDPR (UK GDPR), various Latin American (LATAM) privacy laws such as Brazil’s Lei Geral de Proteção de Dados Pessoais (LGPD) and Argentina’s Ley de Protección de los Datos Personales (PDPA) impose strict requirements for the processing of personal data of individuals located, respectively, within the European Economic Area (EEA), the United Kingdom (UK) and LATAM region. For example, under the EU GDPR, government regulators may impose temporary or definitive bans on data processing, as well as fines of up to 20 million Euros or 4% of the annual global revenue of the company, whichever is greater; or private litigation related to processing of personal data brought by classes of data subjects or consumer protection organizations authorized at law to represent their interests. Certain jurisdictions, such as the EU, Switzerland, the UK and LATAM have enacted cross-border personal data transfers laws regulating personal data flows to third countries. For example, absent appropriate safeguards or other circumstances, the EU GDPR generally restricts the transfer of personal data to countries outside of the EEA, such as the United States, which the European Commission does not consider to provide an adequate level of personal data protection. The European Commission released a set of “Standard Contractual Clauses” that are designed to be a valid mechanism by which entities can transfer personal data out of the EEA to jurisdictions that the European Commission has not found to provide an adequate level of protection. Currently, these Standard Contractual clauses are a valid mechanism to transfer personal data outside of the EEA. The Standard Contractual Clauses, however, require parties that rely upon that legal mechanism to comply with additional obligations such as conducting transfer impact assessments to determine whether additional security measures are necessary to protect the at-issue personal data. In addition, laws in Switzerland, the UK and LATAM similarly restrict personal data transfers outside of those jurisdictions to countries such as the United States of America that do not provide an adequate level of personal data protection. In addition to European restrictions on cross-border personal data transfers, other jurisdictions have enacted or are considering similar cross-border personal data transfer laws and local personal data residency laws, any of which could increase the cost and complexity of doing business. If we cannot implement a valid compliance mechanism for cross-border personal data transfers, we may face increased exposure to regulatory actions, substantial fines, and injunctions against processing or transferring personal data from Europe or elsewhere. Inability to import personal data to the United States may significantly and negatively impact our business operations, including by limiting our ability to collaborate with parties subject to European and other data protection laws or requiring us to increase our personal data processing capabilities in Europe and/or elsewhere at significant expense.
Any violations of these laws and regulations may require us to change our business practices or operational structure, including limiting our activities in certain states and/or jurisdictions, address legal claims, and sustain monetary penalties, reputational damage and/or other harms to our business. Further, in certain cases we rely on the data processing, privacy, data protection and cybersecurity practices of our third-party service providers, including with regard to maintaining the confidentiality, security and integrity of data. If we fail to manage our third-party service providers or their relevant practices, or if they fail to meet any requirements with regard to data processing, privacy, data protection or cybersecurity required by applicable legal or contractual obligations that we face (including any applicable requirements of our clients), we may be liable in certain cases. Legal obligations relating to privacy, cybersecurity and data protection may require us to manage our third-party service providers and their practices and to enter into agreements with them in certain cases. We may face difficulties in binding our third-party service providers to these agreements and otherwise managing their relevant practices, which may subject us to claims, proceedings, and liabilities.
Furthermore, our online privacy policy and website make certain statements regarding our privacy, information security, and data security practices with regard to information collected from our members. Failure to adhere to such practices may result in regulatory scrutiny and investigation (including the potential for fines and monetary penalties), complaints by affected members, reputational damage and other harm to our business. If either we, or the third-party service providers with which we share member data, are unable to address privacy concerns, even if unfounded, or to comply with applicable laws and regulations, it could result in additional costs and liability, damage our reputation, and harm our business.
Disruptions in the operation of our computer systems and third-party data centers and service providers could have an adverse effect on our business.
Our ability to deliver products and services to our members and clients, and otherwise operate our business and comply with applicable laws, depends on the efficient and uninterrupted operation of our computer systems and third-party data centers, as well as third-party service providers. Our computer systems and third-party providers may encounter service interruptions at any time due to system or software failure or errors, employee misconfiguration of resources or misdirected communications, natural disasters, severe weather conditions, health pandemics, terrorist attacks, cyberattacks or other events. For example, in September 2023, the SoFi Invest platform experienced a service interruption that resulted in some of our members being unable to view certain of their account information and unable to buy and sell securities and other financial products on our platform for a period of time. Any such events, including persistent interruptions or perceptions of such interruptions whether true or not, in our products and services could cause members to believe that our products and services are unreliable, leading them to switch to our competitors or to otherwise avoid our products and services, and otherwise have a negative effect on our business and technology infrastructure (including our computer network systems), which could lead to member dissatisfaction or long-term disruption of our operations. Additionally, our insurance policies might be insufficient to cover a claim made against us by any such members affected by any disruptions, outages, or other performance or infrastructure problems.
Additionally, our reliance on third-party providers may mean that we will not be able to resolve operational problems internally or on a timely basis, as our operations will depend upon such third-party service providers communicating appropriately and responding swiftly to their own service disruptions through industry standard best practices in business continuity and/or disaster recovery. As a last resort, we may rely on our ability to replace a third-party service provider if it experiences difficulties that interrupt operations for a prolonged period of time or if an essential third-party service terminates. If these service arrangements are terminated for any reason without an immediately available substitute arrangement, our operations may be severely interrupted or delayed. If such interruption or delay were to continue for a substantial period of time, our business, prospects, financial condition and results of operations could be adversely affected.
The implementation of technology changes and upgrades to maintain current and integrate new systems may cause service interruptions, transaction processing errors or system conversion delays and may cause us to fail to comply with applicable laws, all of which could have a material adverse effect on our business. We have made and expect to continue to make substantial and increasing investments in “observability”, or the monitoring of our systems, but limitations or failures in those systems may exacerbate other problems by preventing us from anticipating or quickly detecting issues. In addition, our ability to monitor third party services and service providers is limited, and so our ability to anticipate, detect, and remediate anomalies in those services is also more limited when compared to our internal systems monitoring.
Although our current use of artificial intelligence and machine learning is limited, our systems and those of our partners are increasingly reliant on artificial intelligence machine learning systems, which are complex and may have errors or inadequacies that are not easily detectable. These systems may inadvertently reduce the efficiency of our systems, or may cause unintentional or unexpected outputs that are incorrect, do not match our business goals, do not comply with our policies, or otherwise are inconsistent with our brands, guiding principles and mission. Errors or breakdowns in our machine learning
systems could also result in damage to our reputation, loss of members, loss of revenue or liability for damages, any of which could adversely affect our growth prospects and our business.
We expect that new technologies and business processes applicable to the financial services industry will continue to emerge and that these new technologies and business processes may be better than those we currently use. There is no assurance that we will be able to successfully adopt new technology as critical systems and applications become obsolete and better ones become available. A failure to maintain and/or improve current technology and business processes could cause disruptions in our operations or cause our solution to be less competitive, all of which could have a material adverse effect on our business.
Risks Related to Ownership of Our Securities The price of our common stock has fluctuated and may be volatile in the future.
The price of our common stock has fluctuated and may continue to fluctuate due to a variety of factors, including:
•changes in the industry in which we operate;operate, including public perception of such industry;
•developments involving our competitors;
•changes in laws and regulations affecting our business, or changes in policies with respect to student loan forgiveness;
•changes in interest rates;rates and inflation;
•variations in our operating performance and the performance of our competitors in general;
•actual or anticipated fluctuations in our quarterly or annual operating results;
•publication of research reports by securities analysts about us or our competitors or our industry;
•the public’s reaction to our press releases, our other public announcements and our filings with the SEC;SEC or any changes in our reputation;
•actions by stockholders;
•additions and departures of key personnel;
•commencement of, or involvement in, litigation or regulatory enforcement investigations involving our company;
•changes in our capital structure, such as future issuances of securities or the incurrence of additional debt;debt, including in connection with acquisitions;
•any reverse stock split of our outstanding shares of common stock, which may increase the price of our common stock;
•volatility in capital markets and changes in the volume of shares of our common stock available for public sale; and
•general economic and political conditions, such as the effects of the COVID-19 pandemic, recessions, interest rates, inflation, consumer confidence and spending, public perception of the financial services industry, availability of loans and liquidity in the capital markets, local and national elections, corruption, political instability and acts of war or terrorism.terrorism, including the war between Israel and Hamas, and the ongoing war in Ukraine.
These market and industry factors, as well as others, may materially reduce the market price of our common stock regardless of our operating performance.
We do not intend to pay cash dividends on our common stock for the foreseeable future.
We currently intend to retain our future earnings, if any, to finance the further development and expansion of our business and do not intend to pay cash dividends on our common stock in the foreseeable future. Any future determination to pay dividends on our common stock will be at the discretion of our Board of Directors and will depend on obtaining regulatory approvals, if required, our financial condition, results of operations, capital requirements, restrictions contained in future agreements and financing instruments, business prospects and such other factors as our Board of Directors deems relevant.
If analysts publish inaccurate or unfavorable research, our stock price and trading volume could decline.
The trading market for our common stock depends in part on the research and reports that analysts publish about our business. We do not have any control over these analysts. If one or more of the analysts who cover us downgrade our common stock or publish inaccurate or unfavorable research about our business, as they have done in the past, the price of our common stock would likely decline. If few analysts cover us, demand for our common stock could decrease and our common stock price
and trading volume may decline. Similar results may occur if one or more of these analysts stop covering us in the future or fail to publish reports on us regularly. In addition, analysts may establish and publish their own periodic projections for us. These projections may vary widely and may not accurately predict the results we actually achieve. Our share price may decline if our actual results do not match the projections of these research analysts. In addition, if the market for technology stocks or financial services stocks or the broader stock market experiences a loss of investor confidence, the trading price of our common stock could decline for reasons unrelated to our business, financial condition or results of operations.
We may be subject to securities litigation, which is expensive and could divert management attention.
The market price of our common stock may be volatile and, in the past, companies that have experienced volatility in the market price of their stock have been subject to securities class action litigation. We may be the target of this type of
litigation in the future. Securities litigation against us could result in substantial costs and divert management’s attention from other business concerns, which could seriously harm our business.
Future resales of our common stock may cause the market price of our securities to drop significantly, even if our business is doing well.
Sales of a substantial number of shares of our common stock in the public market or the perception that these sales might occur, have in the past and could in the future depress the market price of our common stock and could impair our ability to raise capital through the sale of additional equity securities. Sales of a substantial number of shares, upon any future waivers or expiration of lock-up agreements entered into by our stockholders, or the perception that such sales may occur, could have a material and adverse effect on the trading price of our common stock. For example, lock-up restrictions entered into in connection with the Business Combination have expired. As such, salesSales of a substantial number of shares of common stock in the public market could occur at any time. We have filed with the SEC, and the SEC has declared effective, a registration statement covering shares of our common stock issued in connection with the Agreement, including shares issued to the Third Party PIPE Investors, among others, to facilitate such sales.sales and we have filed a registration statement on Form S-3 which allows us to sell securities from time to time. These sales, or the perception in the market that the holders of a large number of shares intend to sell shares, could cause the market price of our common stock to decline or increase the volatility in the market price of our common stock.
Our warrants are exercisable for shares of common stock, which could increase the number of shares eligible for future resale in the public market and result in dilution to our stockholders.
In December 2021, we completed the redemption of outstanding warrants to purchase shares of the Company’s common stock that were issued under the Warrant Agreement, dated October 8, 2020. There are 12,170,990 Series H warrants issued in connection with the Series 1 and Series H preferred stock issuances in December 2019 that remain outstanding and were previously converted into SoFi Technologies common stock warrants. To the extent such warrants are exercised, additional shares of common stock will be issued, which will result in dilution to the holders of our common stock and increase the number of shares eligible for resale in the public market. Sales of substantial numbers of such shares in the public market or the fact that such warrants may be exercised could adversely affect the market price of our common stock.
Our issuance of additional capital stock in connection with financings, acquisitions, investments, our stock incentive plans or otherwise will dilute all other stockholders.
Our issuance of additional capital stock in connection with financings, acquisitions, investments, our stock incentive plans or otherwise will dilute our stockholders. We expect to issue additional capital stock in the future that will result in dilution to all other stockholders. We expect to grantcontinue granting equity awards to employees, directors, and consultants under our stock incentive plans. We may also raise capital through equity financings in the future. As part of our business strategy, we may acquire or make investments in complementary companies, products, or technologies and issue equity securities to pay for any such acquisition or investment. Any such issuances of additional capital stock may cause stockholders to experience significant dilution of their ownership interests and the per share value of our common stock to decline.
There can be no assurance that we will be able to comply with the continued listing standards of Nasdaq.
If Nasdaq delists our shares of common stock from trading on its exchange for failure to meet Nasdaq’s listing standards, we and our stockholders could face significant material adverse consequences, including:
•a limited availability of market quotations for our securities;
•reduced liquidity for our securities;
•a determination that our common stock is a “penny stock”stock,” which will require brokers trading in our common stock to adhere to more stringent rules and possibly result in a reduced level of trading activity in the secondary trading market for our securities;
•a limited amount of news and analyst coverage; and
•a decreased ability to issue additional securities or obtain additional financing in the future.
Delaware law and our organizational documents contain certain provisions, including anti-takeover provisions that limit the ability of stockholders to take certain actions and could delay or discourage takeover attempts that stockholders may consider favorable.
The Delaware General Corporation Law of the State of Delaware (the “DGCL”) and our organizational documents contain provisions that could have the effect of rendering more difficult, delaying, or preventing an acquisition that stockholders may consider
favorable, including transactions in which stockholders might otherwise receive a premium for their shares. These provisions could also limit the price that investors might be willing to pay in the future for shares of our common stock, and therefore depress the trading price of our common stock. Additionally, these provisions could also make it difficult for stockholders to take certain actions, including electing directors who are not nominated by the current members of our Board of Directors or taking other corporate actions, including effecting changes in our management. Among other things, our organizational documents include provisions regarding:
•the ability of our Board of Directors to issue shares of preferred stock, including “blank check” preferred stock and to determine the price and other terms of those shares, including preferences and voting rights, without stockholder approval, which could be used to significantly dilute the ownership of a hostile acquirer;
•the prohibition of cumulative voting in the election of directors, which limits the ability of minority stockholders to elect director candidates;
•limitations on the liability of our directors, and the indemnification of our directors and officers;
•the ability of our Board of Directors to amend our bylaws, which may allow our Board of Directors to take additional actions to prevent an unsolicited takeover and inhibit the ability of an acquirer to amend our bylaws to facilitate an unsolicited takeover attempt; and
•advance notice procedures with which stockholders must comply to nominate candidates to our Board of Directors or to propose matters to be acted upon at a stockholders’ meeting, which could preclude stockholders from bringing matters before annual or special meetings of stockholders and delay changes in our Board of Directors and also may discourage or deter a potential acquirer from conducting a solicitation of proxies to elect the acquirer’s own slate of directors or otherwise attempting to obtain control of our company.
These provisions, alone or together, could delay or prevent hostile takeovers and changes in control or changes in the Board of Directors or management of our company.
The provisions of our bylaws requiring exclusive forum in the Court of Chancery of the State of Delaware and the federal district courts of the United States for certain types of lawsuits may have the effect of discouraging certain lawsuits, including derivative lawsuits and lawsuits against our directors and officers, by limiting plaintiffs’ ability to bring a claim in a judicial forum that they find favorable.
Our bylaws provide that, to the fullest extent permitted by law, and unless we consent in writing to the selection of an alternative forum, the Court of Chancery of the State of Delaware (or, in the event that such court does not have jurisdiction, the federal district court for the District of Delaware or other state courts of the State of Delaware) will be the sole and exclusive forum for any state law claims for (i) any derivative action or proceeding brought on our behalf, (ii) any action asserting a claim for or based on a breach of a fiduciary duty owed by any of our current or former directors, officers or other employees to us or our stockholders, (iii) any action asserting a claim against us or any of our current or former directors, officers or other employees arising pursuant to any provision of the DGCL or our bylaws or Certificate of Incorporation (as either may be amended from time to time), (iv) any action asserting a claim related to or involving our company that is governed by the internal affairs doctrine, and (v) any action asserting an “internal corporate claim” as that term is defined in Section 115 of the DGCL (the “Delaware Forum Provision”). The Delaware Forum Provision, however, does not apply to actions or claims arising under the Exchange Act. Our bylaws also provide that, unless we consent in writing to the selection of an alternate forum, the sole and exclusive forum for the resolution of any complaint asserting a cause of action arising under the Securities Act of 1933, as amended, and the rules and regulations promulgated thereunder, will be the United States Federal District Courts.Courts (the “Federal Forum Provision”). Section 27 of the Exchange Act creates exclusive federal jurisdiction over all suits brought to enforce any duty or liability created by the Exchange Act or the rules and regulations thereunder; our stockholders cannot and will not be deemed to have waived compliance with the U.S. federal securities laws and the rules and regulations thereunder.
These provisionsThe Delaware Forum Provision and the Federal Forum Provision in our bylaws may have the effect of discouraging certain lawsuits, including derivative lawsuitsimpose additional litigation costs on stockholders in pursuing any such claims and lawsuits againstmay also impose additional litigation costs on stockholders who assert that
either such provision is not enforceable or invalid. Additionally, these forum selection clauses may limit our directors and officers, by limiting plaintiffs’stockholders’ ability to bring a claim in a judicial forum that they find favorable. The enforceabilityfavorable for disputes with us or our directors, officers or employees, which may discourage the filing of similar choicelawsuits against us and our directors, officers and employees, even though an action, if successful, might benefit our stockholders. In addition, while the Delaware Supreme Court and other states courts have upheld the validity of federal forum selection provisions purporting to require claims under the Securities Act be brought in federal court, there is still some uncertainty as to whether other companies’ certificates of incorporation or bylaws has been challenged in legal proceedings, and itcourts will enforce our Federal Forum Provision. If the Federal Forum Provision is possible that, in connection with any applicable action brought against our company, a court could find the choice of forum provisions contained in the Bylawsfound to be inapplicableunenforceable, we may incur additional costs associated with resolving such matters. The Court of Chancery of the State of Delaware and the federal district courts of the United States may reach different judgments or unenforceable inresults than would other courts, including courts where a stockholder considering an action may be located or would otherwise choose to bring the action, and such action.judgments may be more or less favorable to us than our stockholders.
Item 1B. Unresolved Staff Comments
None.
Item 1C. Cybersecurity
Cyber Risk Management and Strategy
At SoFi, we recognize the importance of information security practices designed to protect the confidentiality, integrity, and availability of company information and the personal information that our customers share with us. Using guidance set forth in our Enterprise Risk Management program, we have implemented a cybersecurity risk management program to lead and support the management of information security risks in accordance with our risk profile and business strategy, which is informed by recognized industry standards and frameworks, such as International Organization for Standardization 27002:2013. For additional guidance, we also refer to the National Institute of Standards and Technology Cybersecurity Framework, Payment Card Industry Data Security Standard, Federal Financial Institutions Examination Council information security guidelines, and Center of Internet Security controls.
Our cybersecurity risk management program includes a number of components, designed to identify, analyze, and respond to cybersecurity risks, including reliance on a layered system of preventative and detective technologies, controls, and policies designed to detect, mitigate, and contain cybersecurity threats. Information security program risk assessments and third party attestations and assessments are conducted periodically by both internal and external resources. We leverage qualified third-party security assessors to identify vulnerabilities through both internal and external penetration tests and perform internal cybersecurity maturity assessments. In addition, our internal audit team conducts an information security and information technology audit on an annual basis. We are also subject to examinations by applicable regulators. We conduct cybersecurity awareness training for personnel upon hire and on a periodic basis thereafter, which includes phishing training campaigns.
As part of our cybersecurity risk management program, SoFi maintains a formal Third-Party Security Risk Management program that provides oversight of cybersecurity risks related to supplier relationships. During supplier onboarding, we perform risk-based due diligence for suppliers with access to confidential SoFi information or that require technical integration with SoFi systems. This program includes the provision of a cybersecurity risk assessment to these suppliers during onboarding as well as ongoing monitoring, assessment, and contract review.
We have not identified any cybersecurity incidents or threats that have materially affected us or are reasonably likely to materially affect us, including our business strategy, results of operations, or financial condition. For more information on risks to us from cybersecurity threats, see “Cyberattacks and other security breaches could have an adverse effect on our business, harm our reputation and expose us to liability and adversely affect our ability to collect payments and maintain accurate accounts. Efforts to prevent and respond to these attacks and breaches are costly” in Part I, Item 1A. “Risk Factors—Information Technology and Data Risks”.
Governance Related to Cybersecurity Risks
The Board of Directors has overall responsibility for risk oversight and has delegated oversight of our cybersecurity program to the Risk Committee, which is comprised of a minimum of three Board members. The Risk Committee is responsible for the information technology and cybersecurity function at the Company. Relevant duties include, but are not limited to, annually reviewing the cybersecurity program roadmap and materials related to significant planned projects and budgeted costs and approving the cybersecurity program. The Risk Committee meets at least four times each year and discusses cybersecurity risk management as relevant and applicable.
Our CISO has primary responsibility for assessing and managing our cybersecurity program. The CISO has served in this role at SoFi for three years and has over twenty years of experience working in senior leadership positions in the
cybersecurity industry. He previously served as the CISO at leading software and data analytics companies and co-founded a cybersecurity company. The CISO provides cybersecurity updates, including risks and threats to the Risk Committee as appropriate, on a quarterly basis.
Item 2. Properties
We primarily operate through a network of leased properties, including largely office spaces, which are primarily located in the United States. We believe our existing facilities are adequate to meet our current business requirements, andparticularly as we now offer our employees the choice of working full time in the office, a hybrid approach, or full-time remote. We expect that we will be able to find suitable space to accommodate any potential future expansion. Our leased properties total approximately 400,000430,000 square feet, with the most significant properties and the reportable segments that primarily utilize those properties as follows:
| | | | | | | | | | | | | | |
| Location | | Approximate Square Footage | | Segments(1) |
California (San Francisco HQ, Healdsburg)Sacramento) | | 105,000111,000 | | L, TP, FS |
Utah (Cottonwood Heights, Sandy, Murray)Sandy) | | 154,00092,000 | | L, TP, FS |
| North Carolina (Charlotte) | | 43,000 | | L |
| Florida (Jacksonville) | | 37,000 | | L, FS |
| Delaware (Claymont) | | 28,000 | | L, FS |
| Montana (Helena) | | 20,000 | | L |
| Uruguay (Montevideo) | | 14,000 | | TP |
| New York (New York City) | | 13,000 | | L, FS |
| Texas (Frisco) | | 13,000 | | L FS |
| Argentina (Buenos Aires) | | 12,000 | | TP |
| Washington (Seattle) | | 10,000 | | L, FS |
| Kansas (Overland Park) | | 10,000 | | L |
___________________
(1)Segment references include: L = Lending, TP = Technology Platform, and FS = Financial Services.
Item 3. Legal Proceedings
The information required by Item 103 of Regulation S-K is included in Note 1618. Commitments, Guarantees, Concentrations and Contingencies to the Notes to Consolidated Financial Statements in Part II, Item 88. of this Annual Report on Form 10-K.
Item 4. Mine Safety Disclosures
Not applicable.
PART II
Item 5. Market for Registrant’s Common Equity, Related Stockholder Matters and Issuer Purchases of Equity Securities
Market Information and Holders of Record
On June 1, 2021, our common stock began trading on the Nasdaq Global Select Market under the symbol “SOFI”. Prior to that time, there was no public market for our stock. As of February 15, 2022,2024, there were 530482 holders of record of our common stock, which does not include persons whose stock is held in nominee or “street name” accounts through brokers, banks and intermediaries. As many of our shares of common stock are held by brokers and other institutions on behalf of stockholders, we are unable to estimate the total number of stockholders represented by these record holders.
Securities Authorized for Issuance Under Equity Compensation Plans
The equity compensation plan information required by Item 201(d) of Regulation S-K will be set forth in the definitive Proxy Statement for the Company's annual meeting of stockholders, which we intend to file with the SEC within 120 days of the end of our 20212023 fiscal year, and is incorporated by reference in this Annual Report on Form 10-K. Additionally, refer to
Note 1316. Share-Based Compensation to the Notes to Consolidated Financial Statements included in Part II, Item 88. for additional information on our equity compensation plans.
Performance Graph
The following graph shows the cumulative seven-month total stockholder return on our common stock compared to the cumulative total returns of the Nasdaq Composite index and the S&P Financial index. The graph tracks the performance of a $100 investment in our common stock and in each index (with the reinvestment of all dividends, as applicable) from June 1, 2021 (the date our common stock commenced trading on the Nasdaq Global Select Market) to December 31, 2021.2023.
| | June 1, 2021 | | June 30, 2021 | | September 30, 2021 | | December 31, 2021 |
| June 1,
2021 | |
| June 1,
2021 | |
| June 1,
2021 | | | | | | | December 31, 2021 | | | | | | | | December 31, 2022 | | | | | | | | December 31, 2023 |
| SoFi | SoFi | | $ | 100.00 | | | $ | 84.64 | | | $ | 70.11 | | | $ | 70.42 | |
| Nasdaq Composite | Nasdaq Composite | | 100.00 | | | 105.64 | | | 105.40 | | | 114.30 | |
| S&P Financial | S&P Financial | | 100.00 | | | 96.40 | | | 99.05 | | | 103.57 | |
Recent Sales of Unregistered Securities
In connection with our acquisition of 8 Limited in April 2020, 320,649 shares were contingently issuable, subject to an indemnification period which expired in October 2021. At that time,On December 6, 2023, we issued alla total of 9,490,000 shares of common stock to repurchase and settle $88.0 million aggregate principal amount of convertible notes pursuant to the exemption from registration contained in Section 3(a)(9) of the shares as unregistered shares under Rule 145Securities Act. This issuance was to a limited number of holders of our convertible notes, and exempt from the former shareholdersregistration requirements of 8 Limited.the Securities Act because such issuance did not involve a public offering.
Issuer Purchases of Equity Securities
We did not have any purchases of our equity securities during the fourth quarter of 2021.2023.
Dividends
We have never declared nor paid cash dividends on our common stock. The terms of our Series 1 preferred stockRedeemable Preferred Stock provide for the payment of semiannual dividends on the 30th day of June and 31st day of December of each year. Other than with respect to our Series 1 preferred stock,Redeemable Preferred Stock, we currently do not intend to pay cash dividends infor the foreseeable future.
Item 6. Reserved
Item 7. MANAGEMENT’S DISCUSSION AND ANALYSIS OF FINANCIAL CONDITION AND RESULTS OF OPERATIONS
The following discussion and analysis provides information that management believes is relevant to an assessment and understanding of our consolidated results of operations and financial condition. You should read this discussion and analysis in conjunction with ourthe consolidated financial statements and notes thereto included elsewhere in this Annual Report on Form 10-K. Certain amounts may not foot or tie to other disclosures due to rounding. Certain information in this discussion and analysis or set forth elsewhere in this Annual Report on Form 10-K contains forward-looking statements that involve numerous risks and uncertainties, including, but not limited to, those described under the sections entitled “Cautionary Note Regarding Forward-Looking Statements” and Part I, Item 1A. “Risk Factors”. We assume no obligation to update any of these forward-looking statements. Actual results may differ materially from those contained in any forward-looking statements.
Social Finance, Inc. (“Social Finance”) entered into a merger agreement (the “Agreement”) with Social Capital Hedosophia Holdings Corp. V (“SCH”) on January 7, 2021. The transactions contemplated by the terms of the Agreement were completed on May 28, 2021 (the “Closing”), in conjunction with which SCH changed its name to SoFi Technologies, Inc. (hereafter referred to, collectively with its subsidiaries, as “SoFi”, the “Company”, “we”, “us” or “our”, unless the context otherwise requires). The transactions contemplated in the Agreement are collectively referred to as the “Business Combination”.
Business Overview
Our three reportable segments and their respective offerings as of December 31, 2021 were as follows:
| | | | | | | | | | | | | | | | | | | | | | | |
| Lending | Technology Platform | | Financial Services |
• | Student Loans(1)
| | • | Technology Platform Services (Galileo) | | • | SoFi Money |
• | Personal Loans | | | | • | SoFi Invest(2)
|
• | Home Loans | | | | | • | SoFi Relay |
| | | | | | • | SoFi Credit Card |
| | | | | | • | SoFi At Work |
| | | | | | • | SoFi Protect |
| | | | | | • | Lantern Credit |
| | | | | | • | Equity capital markets and advisory services |
__________________Business Overview(1)Composed of in-school loansWe are a member-centric, one-stop shop for financial services that allows members to borrow, save, spend, invest and student loan refinancing.
(2)Our SoFi Invest service is composed of three products: active investing accounts, robo-advisory accounts and digital assets accounts. SoFi Invest also includes our brokerage accounts through 8 Limited in Hong Kong.
protect their money. We refer to our customers as “members”, as defined under “Key Business Metrics”. Our mission is to help our members achieve financial independence in order to realize their ambitions. We definewere founded in 2011 and have developed a membersuite of financial products that offers the speed, selection, content and convenience that only an integrated digital platform can provide. Everything we do today is geared toward helping our members “Get Your Money Right” and we strive to innovate and build ways for our members to achieve this goal.
In order to help achieve our mission, we offer personal loans, student loans, home loans and related servicing, as someone whowell as senior secured loans. We also offer a variety of financial services products, such as SoFi Money checking and savings, SoFi Credit Card, SoFi Invest, and SoFi Relay, that provide more daily interactions with our members, and we offer products and capabilities, such as SoFi At Work, that are designed to appeal to enterprises. We continued to expand our platform capabilities for enterprises through: (i) our acquisition of Galileo in 2020, which provides technology platform services to financial and non-financial institutions and which has allowed us to vertically integrate across more of our financial services, and (ii) the Technisys Merger in the first quarter of 2022, through which we expanded our technology platform services to include a lending relationship with us through originationcloud-native, customizable, extensible core technology as well as access to a broader international market. We believe that these expansions will deepen our participation in the entire technology ecosystem powering digital financial services.
See Item 1. “Business—Our Reportable Segments” for a discussion of our segments and their corresponding products. The discussion below focuses on the ways in which our key products and services within each reportable segment generate revenues and/or ongoing servicing, opened a financial services account, linked an external account to our platform, or signed upincur expenses for the Company.
Business Highlights
We achieved strong results for our credit score monitoring service. Once someone becomescompany for the year ended December 31, 2023, including record total net revenue of $2.1 billion, representing an increase of 35% over total net revenue in 2022. Record revenue at the company level was driven by record net revenue across all three of our business segments. We realized strong momentum in member and product growth and cross-buy adds, reflecting the benefits of our broad product suite and Financial Services Productivity Loop strategy. We added approximately 2.3 million new members during 2023, with over 7.5 million total members as of December 31, 2023, a member, they are always considered44% year over year increase. We also added approximately 3.2 million new products, with over 11.1 million total products as of December 31, 2023, a member unless they violate41% year over year increase.
Lending segment contribution profit of $823.3 million for the year ended December 31, 2023, at a margin of 60%, increased 24% over 2022, which had a contribution margin of 58%. Total net revenue of $1.4 billion for the year ended December 31, 2023 increased 20% over 2022. Additionally, average net interest margin of 5.88% in 2023 increased 48 basis points compared to 5.40% in 2022. Growth in net interest income was driven by an increase in both average interest-earning assets and average yields, partially offset by an increase in the cost of interest-bearing liabilities. Origination volume increased 34% year over year, primarily driven by demand for personal loans and despite continued macroeconomic headwinds in the student and home loan businesses. Student loans saw some increasing demand in the third quarter of 2023 ahead of the resumption of principal and interest payments on federally-held student loans, and we expect that we may continue to see modest growth in student loan refinancing. Our acquisition of Wyndham in the second quarter of 2023 provided increased capacity and capabilities for our terms of service. Our members have continuous access to our certified financial planners (“CFPs”), our career advice services, our member events, our content, educational material, news, and our tools and calculators,home loans product, which is provided at no cost to the member. Additionally, our mobile app and website have a member home feed that is personalized and delivers contentcontributed to a member about what they must do that daynotable year over year increase in their financial life, what they should consider doing that dayhome loans, and which we expect to continue to provide benefits, while we expect overall home loans growth could be correlated with rate movements in their financial life, and what they can do that day in their financial life. Since our inception through December 31, 2021, we have served approximately 3.5 million members who have used approximately 5.2 million products on the SoFi platform.2024.
We offer our members a suiteTechnology Platform segment contribution profit of financial products and services, enabling them to borrow, save, spend, invest and protect their finances within one integrated platform. Our aim is to create a best-in-class, integrated financial services platform that will generate a virtuous cycle whereby positive member experiences will lead to more products adopted per member and enhanced profitability$94.8 million for each additional product by lowering overall member acquisition costs and increasing the lifetime value of our members. We refer to this virtuous cycle as our “Financial Services Productivity Loop”.
We believe that developing a relationship with our members and gaining their trust is central to our success as a financial services platform. Through our mobile technology and continuous effort to improve our financial services products, we are seeking to build a financial services platform that members can access for all of their financial services needs.
We believe we are in the early stages of realizing the benefits of the Financial Services Productivity Loop. During the year ended December 31, 2021, approximately 600,000 members became multi-product members.
In addition to benefiting our members, our products2023 increased 24% over 2022, and capabilities are also designed to appeal to enterprises, such as financial services institutions that subscribe to our enterprise services called SoFi At Work, and have become interconnected with the SoFi platform. While these enterprises are not considered members, they are important contributors to the growthtotal net revenue of the SoFi platform, and also have their own constituents who might benefit from our products in the future. Further, Galileo has approximately 100$352.3 million total accounts on its platform (including SoFi accounts) as of December 31, 2021. Galileo started contributing new accounts to the SoFi ecosystem during the second quarter of 2020.
National Bank Charter. A key element of our long-term strategy has been to secure a national bank charter. In February 2022, we acquired Golden Pacific pursuant to the “Bank Merger”, pursuant to which we acquired all of the outstanding equity interests in Golden Pacific and its wholly-owned subsidiary, Golden Pacific Bank, for total cash purchase consideration of $22.3 million. Upon closing the Bank Merger, we became a bank holding company and Golden Pacific Bank began operating as SoFi Bank. Golden Pacific’s community bank business will continue to operate as a division of SoFi Bank.
In order to be compliant with all applicable regulations, to operate to the satisfaction of the banking regulators, and to successfully execute our business plan for SoFi Bank, we have built out and continue to expand the required infrastructure to run SoFi Bank and to operate as a bank holding company. This effort spans our people and organization, technology, marketing/product management, risk management, compliance, and control functions. We incurred direct costs associated with securing our national bank charter of $17.0 million during the year ended December 31, 20212023 increased 12% over 2022. Growth was driven by continued strong organic growth of existing partners and $3.7new product adoption, as well as notable contributions from increasingly diversified clients which have launched within the second half of 2023. Margin improvements were driven primarily by Galileo account growth and decreases in directly attributable expenses, as we begin to realize the benefits of earlier investments made to support Technology Platform product development and the integration of Galileo and Technisys. The year over year comparison was also impacted by a partial period of contribution from Technisys in 2022 compared to a full period of contribution in 2023. We continue to make significant strides in our strategy of leveraging our unique product suite to pursue diversified growth and expansion via new products and geographies, in addition to larger, more durable revenue opportunities. We expect growth in segment revenue to continue to accelerate in 2024, as we are well positioned to capture opportunities from traditional financial institutions and nonfinancial categories.
Within Financial Services, contribution loss of $0.3 million duringfor the year ended December 31, 2020, which consisted primarily2023 significantly improved compared to a contribution loss of professional fees$199.4 million in 2022, and compensationreflected positive contribution profit during the third and benefits costs.
We have begun to transfer SoFi Money products to SoFi Bank and intend to continue to transfer our SoFi Money, lending, and SoFi Credit Card products to SoFi Bank over time. We have begun to allow existing members to convert their SoFi Money cash management accounts into deposit accounts held at SoFi Bank. Further, we expect to begin accepting new loan applications and originating new loans within SoFi Bank over time.
IPO Investment Center. Through our FINRA-registered broker-dealer subsidiary, SoFi Securities LLC (“SoFi Securities”), we are licensed to underwrite securities offerings. In March 2021, we launched an initial public offering (“IPO”) investment center that allows members with a SoFi active invest account to invest in initial public offerings. Through this offering, we earn underwriting feesfourth quarters of 2023. Total net revenue of $436.5 million for participating in the underwriting syndicate for IPO deals, or we recognize dealer fees for
providing dealer services in partnership with underwriting syndicates for IPOs. Together, these services are referred to as “equity capital markets services”. During the year ended December 31, 2021, we recognized revenue2023 increased 160% over 2022. We achieved continued strong growth in deposits, ending the year with $18.6 billion of $2.6 million within noninterest income—other in the consolidated statements of operations and comprehensive income (loss) associated with our IPO Investment Center services.
Our Reportable Segments
We conduct our business through three reportable segments: Lending, Technology Platform and Financial Services. See Item 1 “Business—Our Products” for a discussion of our segments, their corresponding products and the ways in which those products generate revenues and/or incur expenses for the Company.
COVID-19 Pandemic
On March 11, 2020, the World Health Organization designated the novel coronavirus (“COVID-19”) as a global pandemic. Although the long-term effects of the COVID-19 pandemic globally and in the United States remain unknown and consumer activity began to recover and many government mandates to restrict daily activities were lifted, worker shortages, supply chain issues, inflationary pressures, vaccine and testing requirements, the emergence of new variants and the reinstatement of restrictions and health and safety related measures in response to the emergence of new variants, such as the Delta and Omicron variants, contributed to the volatility of ongoing recovery. There can be no assurance that economic recovery will continue or that consumer behavior will return to pre-pandemic levels. Through our business continuity program, which was expanded in response to the COVID-19 pandemic, we continue to monitor the recommendations and protocols published by the U.S. Centers for Disease Control and Prevention (“CDC”) and the World Health Organization, as well as state and local governments, and to communicate with employees on a regular basis to provide updated information and corporate policies. Since the onset of the COVID-19 pandemic, we have taken a number of measures to proactively support our members, applicants for new loans and employees.
Members: We have and will continue to approach hardship programs from a member-first perspective. In addition to our Unemployment Protection Plan, which remains available to all eligible members, we launched comprehensive forbearance programs that provided meaningful FEMA disaster hardship relief. We discontinued enrollment in our COVID-19 forbearance programs, which were designed to be temporary in nature, for personal loans and student loans on March 31, 2021 and April 30, 2021, respectively. Although enrollment in COVID-19 forbearance programs for home loans remains open, new requests remain low and are primarily related to extensions of existing forbearance. There were no personal loans or student loans in this categorydeposits as of December 31, 2021 due2023, allowing us to the COVID-19 pandemic. Subjectmaintain diversified sources of funding and driving an increase in net interest income earned on our deposits. In addition, we grew total Financial Services products by 45% year over year. We continue to eligibility, members may participaterealize scale in other customary hardship programs.
Applicants: In response to deteriorating economic conditionsour marketing spend and market uncertainty amid the COVID-19 pandemic,improvement in 2020 we proactively executed our recession readiness credit risk strategies, which included introducing elevated credit eligibility requirements for personal loans, thorough validation of income and income continuity, and limiting loan amounts. Throughout the first half of 2021, we adapted our elevated credit eligibility requirements for personal loans through phases of reopening following our metric-driven, return-to-normalcy action plan. Additionally,operating leverage in the third quarter of 2021, we implemented a proprietary Recession Early Warning System (“REWS”), which applies a set of internal and external indicators to assist us in closely monitoring economic conditions and to be more proactive and agile in taking decisive credit actions in the event of an economic downturn. REWS is currently enabled for personal loans only, as it is a product with higher credit risk.
Employees: In order to safeguard the health and safety of our team members and their families, we virtualized our entire organization beginning in March 2020.segment. We offer, and planexpect to continue to offer, all ofscale our employees the choice of working full time in the office, a hybrid approach, or full-time remote. Coming into the office remains 100% voluntary, unless a person’s role requires them to be on site to do their job. We willproducts through increased brand awareness and network effects, and continue to align our office protocols with evolving CDC, state and local guidelines to continue to safeguard the health and safety of our team members and their families.
See Item 1A “Risk Factors—COVID-19 Pandemic Risks” for additional discussion of the risks and uncertainties associated with the repercussions of the ongoing COVID-19 pandemic.
Executive Overview
The following tables display key financial measures for our three reportable segments and our consolidated company that are used, along with our key business metrics, by management to evaluate our business, measure our performance, identify trends and make strategic decisions. Contribution profit (loss) is the primary measure of segment-level profit and loss reviewed by management and is defined as total net revenue for each reportable segment less expenses directly attributable to the corresponding reportable segment and, in the case of our Lending segment, adjusted for fair value adjustments attributable to assumption changes associated with our servicing rights and residual interests classified as debt. See “Results of Operations”, “Summary Results by Segment” and “Non-GAAP Financial Measures” herein for discussion and analysis of these key financial measures.
| | | | | | | | | | | | | | | | | | | | |
| | Year Ended December 31, |
| ($ in thousands) | | 2021 | | 2020 | | 2019 |
| Lending | | | | | | |
| Total interest income | | $ | 348,160 | | | $ | 354,383 | | | $ | 593,644 | |
| Total interest expense | | (90,058) | | | (155,038) | | | (268,055) | |
| Total noninterest income | | 480,221 | | | 281,521 | | | 108,712 | |
| Total net revenue | | 738,323 | | | 480,866 | | | 434,301 | |
Adjusted net revenue(1)(2) | | 763,776 | | | 536,541 | | | 442,971 | |
Contribution profit(1) | | 399,607 | | | 241,729 | | | 92,460 | |
Technology Platform(1) | | | | | | |
| Total interest expense | | $ | (29) | | | $ | (107) | | | $ | — | |
| Total noninterest income | | 194,915 | | | 96,423 | | | 795 | |
Total net revenue(3) | | 194,886 | | | 96,316 | | | 795 | |
| Contribution profit | | 64,447 | | | 53,889 | | | 795 | |
Financial Services(1) | | | | | | |
| Total interest income | | $ | 5,607 | | | $ | 2,796 | | | $ | 5,950 | |
| Total interest expense | | (1,842) | | | (2,312) | | | (5,336) | |
| Total noninterest income | | 54,313 | | | 11,386 | | | 3,318 | |
| Total net revenue | | 58,078 | | | 11,870 | | | 3,932 | |
Contribution loss(3) | | (134,918) | | | (132,096) | | | (118,800) | |
Other(4) | | | | | | |
| Total interest income | | $ | 1,253 | | | $ | 6,358 | | | $ | 8,599 | |
| Total interest expense | | (10,847) | | | (28,149) | | | (4,968) | |
| Total noninterest income (loss) | | 3,179 | | | (1,729) | | | — | |
Total net revenue (loss)(3) | | (6,415) | | | (23,520) | | | 3,631 | |
| Consolidated | | | | | | |
| Total interest income | | $ | 355,020 | | | $ | 363,537 | | | $ | 608,193 | |
| Total interest expense | | (102,776) | | | (185,606) | | | (278,359) | |
| Total noninterest income | | 732,628 | | | 387,601 | | | 112,825 | |
| Total net revenue | | 984,872 | | | 565,532 | | | 442,659 | |
Adjusted net revenue(1)(2) | | 1,010,325 | | | 621,207 | | | 451,329 | |
| Net loss | | (483,937) | | | (224,053) | | | (239,697) | |
Adjusted EBITDA(2) | | 30,221 | | | (44,576) | | | (149,222) | |
_________________
(1)Adjusted net revenue within our Lending segment is used by management to evaluate our Lending segment and our consolidated results. For our Lending segment, total net revenue is adjusted to exclude the fair value changes in servicing rights and residual interests classified as debt due to valuation inputs and assumption changes (including conditional prepayment and default and discount rates). We use this adjusted measure in our determination ofimprove contribution profit in the Lending segment,segment.
The strength of our results underscores our belief that our suite of differentiated products and services provides the foundation for a diversified business that can endure through market cycles as well as exogenous factors. For instance, our access to evaluatemultiple channels of funding, including deposit and loan warehouse funding, provides an advantage via increased optionality in sourcing liquidity through different environments and periods of capital markets volatility, as well as increases our consolidated results, as it removes non-cash charges that are not realizedflexibility to capture additional net interest margin and optimize returns, which typically provides more stable earnings in any macroeconomic environment but is particularly important during the period and, therefore, do not impact the cash available to fund our operations, and our overall liquidity position. For our Technology Platform and Financial Services segments, there are no adjustments from total net revenue to arrive at the consolidated adjusted net revenue shown in this table.times of excess macroeconomic volatility.
(2)Adjusted net revenueDuring 2023, we continued to have strong deposit contribution from direct deposit members with a high quality median FICO score. We expect that our funding mix will continue to move towards deposit funding, which has a lower borrowing cost of funds than our warehouse and adjusted EBITDA are non-GAAP financial measures. For information regardingsecuritization financing model. We also provided our uses and definitionsmembers with access to expanded FDIC insurance coverage through a network of these measures and for reconciliationsparticipating banks in our Insured Deposit Program, further enhancing our benefits offering to the most directly comparable U.S. Generally Accepted Accounting Principles (“GAAP”) measures, see “Non-GAAP Financial Measures” herein.
(3)Technology Platform segmentour members. Our total net revenue for the years endedcapital ratio, as calculated under applicable regulatory capital rules, was 15.3% as of December 31, 2021 and 2020 includes $1,863 and $686, respectively, of intercompany technology platform fees earned by Galileo from SoFi, which is a Galileo client. There is an equal and offsetting expense reflected within the Financial Services segment contribution loss representing the intercompany technology platform fees incurred to Galileo. The intercompany revenue and expense are eliminated in consolidation. The revenue is eliminated within “Other” and the expense represents a reconciling item of segment contribution profit (loss) to consolidated loss before income taxes. The prior year information was recast to conform to the current year presentation.2023. See Note 1821. Regulatory Capital to the Notes to Consolidated Financial Statements for additional information.
Lending Segment
(4)“Other” primarily includes total net revenue associated with corporate functions, non-recurring gains from non-securitization investment activities andNet interest income, which we define as the difference between the earned interest income and realized gains and losses associated with investments in available-for-sale (“AFS”) debt securities, allinterest expense to finance loans, is a key component of the profitability of our Lending segment. We implemented an FTP framework to attribute net interest income to our business segments based on their usage and/or provision of funding, under which are not directly related to a reportable segment. For further discussion, see Note 18 toLending segment net interest income represents the Notes to Consolidated Financial Statements.
Key Recent Developments
We continue to executedifference between interest income earned on our growthloans and other strategic initiatives and,an FTP charge for the segment’s use of funds to originate loans, which can fluctuate based on changes in doing so, we have celebrated launches across our product suite and strategic partnerships, establishing ourselves as a platform that enables individuals to borrow, save, spend, invest, and protect their assets. Someinterest rates, funding curves, the composition of our key recent achievements are discussed below.balance sheet and the availability of capital. See
In February 2022, we entered into the Technisys Merger. Technisys is a cloud-native digitalNote 20. Business Segment and core banking platform with an existing footprint of established banks, digital banks and fintechs in Latin America. See Note 2Geographic Information to the Notes to Consolidated Financial Statements for additional information on the Technisys Merger.FTP framework.
Technology Platform Segment
We earn technology products and solutions fees for providing an integrated platform as a service for financial and non-financial institutions. Many of our Technology Platform segment contracts are multi-year contracts. In certain of our contracts, we provide for a variety of integrated platform services, which vary by client and are either non-cancellable or cancellable with a substantive payment. Pricing structures under these contracts are typically volume-based, or a combination of activity and volume-based, and payment terms are predominantly monthly in arrears. Many of these contracts contain minimum monthly payments, which may result in credits if we do not meet the agreed upon monthly service levels. We also earn subscription and service fees for providing software licenses and associated services, including implementation, maintenance and subsequent development work. We charge a recurring subscription fee for the software license and related maintenance services. Other software-related services are billed on a periodic basis as the services are provided. Certain arrangements for software and related services contain a provision for a fixed upfront payment.
In February 2022, we closed
86
Financial Services Segment
We earn revenues in connection with our Financial Services segment primarily in the Bank Merger, after which we becamefollowing ways:
•Net interest income: Net interest income is a bank holding company and Golden Pacific Bank began operatingkey component of the profitability of our Financial Services segment as SoFi Bank. Following the Bank Merger, we have begunit relates primarily to transfer SoFi Money products to SoFi Bank and intend to continue to transfer our SoFi Money lending, and credit card products. Net interest income on SoFi Credit Card products to SoFi Bank over time. We believe operating a national bank will allow us to provide members and prospective members broader and more competitive options across their financial services needs, including deposit accounts, and lowerMoney is based on interest income determined using our cost to fund loans (by utilizing our members’ deposits held at SoFi Bank to fund our loans), which we expect will enable us to offer lowerFTP framework, net of interest rates on loans to members as well as offer higher interest rates on member deposit accounts. See “Business Overview—National Bank Charter” herein, as well as Item 1 “Business—Company Overview—National Bank Charter” and Note 2 to the Notes to Consolidated Financial Statements for additional information on our regulatory approval process and the Bank Merger.
In January 2021, Social Finance entered into the Agreement by and among SoFi, SCH, and Plutus Merger Sub Inc. The transactions contemplated by the terms of the Agreement were completed on May 28, 2021, upon which SoFi survived the merger and became a wholly owned subsidiary of SCH, which concurrently changed its name to “SoFi Technologies, Inc.” On June 1, 2021, shares of SoFi Technologies’ common stock and SoFi Technologies’ warrants began tradingexpense based on the Nasdaq underinterest rate offered to our members on their deposits. Net interest income on credit card is based on the symbols “SOFI”contractual interest included in credit card agreements, net of interest expense as determined using the FTP framework. See Note 20. Business Segment and “SOFIW”, respectively, in lieu of the ordinary shares, warrants and units of SCH. See Note 2Geographic Information to the Notes to Consolidated Financial Statements for additional information on the transaction. The SoFi Technologies warrants ceased trading onFTP framework.
•Referral fees: Through strategic partnerships, we earn a specified referral fee in connection with referral activity we facilitate through our platform. Referral fees are paid to us by third-party partners that offer services to end users who do not use one of our product offerings, but who were referred to the Nasdaq and were delisted following their redemption on December 6, 2021.
In September 2020, we celebrated the official opening of SoFi Stadium associatedpartners through our platform. We also earn referral fulfillment fees for providing pre-qualified borrower referrals to a third-party partner who separately contracts with the establishment in September 2019 of a 20-year partnership with LA Stadium and Entertainment District at Hollywood Park in Inglewood, California,loan originator. Our referral fee is calculated as either a multi-purpose sports and entertainment district that serves as the stadium for the National Football League teams the Los Angeles Chargers and Los Angeles Rams. SoFi's partnership with the ownerfixed price per successful referral or a percentage of the LA Stadiumtransaction volume between the enterprise partners and Entertainment District at Hollywood Park (“StadCo”) provides SoFi with exclusive naming rightsreferred consumers.
•Interchange fees: We earn interchange fees from our SoFi-branded debit cards and credit cards. These fees are remitted by merchants and represent a percentage of the stadiumunderlying transaction value processed through a payment network. We engage a card association and official partnerships withenter into contracts that establish the Los Angeles Chargersshared economics of SoFi-branded transaction cards.
•Brokerage fees: We earn brokerage fees primarily from our share lending and Los Angeles Rams and with the performance venue, which shares a roof with the stadium, and the surrounding planned entertainment district, which is anticipatedpayment for order flow arrangements related to include office space, retail space and hotel and dining options. The 20-year partnership, across the naming rights and sponsorship agreements, collectively requires SoFi to pay sponsorship fees quarterly in each contract year for an aggregate total of $625.0 million. See Note 16 to the Notes to Consolidated Financial Statements for discussion of an associated contingent matter.
In May 2020, we completed our acquisition of Galileo for a purchase price of $1.2 billion. Galileo provides technology platform services to financial and non-financial institutions.
In April 2020, we acquired 8 Limited, a Hong Kong based investment business, for a purchase price of $16.1 million. Our acquisition of 8 Limited marked our first expansion outside the United States and enables our non-United States members to experience many of the product features we have developed in the United States for SoFi Invest including non-digital assets trading.product, in which we benefit through a negotiated multi-year revenue sharing arrangement, since our members' brokerage activity drives the share lending and payment for order flow volume.
Non-GAAP Financial Measures Our management and Board of Directors use adjusted net revenue and adjusted EBITDA, which are non-GAAP financial measures, to evaluate our operating performance, formulate business plans, help better assess our overall liquidity position and make strategic decisions, including those relating to operating expenses and the allocation of internal resources.
Accordingly, we believe that adjusted net revenue and adjusted EBITDAthese non-GAAP measures provide useful information to investors and others in understanding and evaluating our operating results in the same manner as our management and Board of Directors.
Adjusted Net Revenue
Adjusted net revenue is defined as total net revenue, adjusted to exclude the fair value changes in servicing rights and residual interests classified as debt due to valuation inputs and assumptions changes, which relate only to our Lending segment.segment, as well as gains and losses on extinguishment of debt. We adjust total net revenue to exclude these items, as they are non-cash charges that are not realized during the period, and therefore positive or negative changes do not impact the cash available to fund our operations. This measure helps provide our management with an understanding of the net revenue available to finance our operations and helps management better decide on the proper expenses to authorize for each of our operating segments, to ultimately help achieve target contribution profit margins. Therefore, the measure of adjusted net revenue serves as both the starting point for how we think about the liquidity generated from our operations and also the starting point for our annual financial planning, the latter of which focuses on the cash we expect to generate from our operating segments to help fund the current year’s strategic objectives. Adjusted net revenue has limitations as an analytical tool and should not be considered in isolation from, or as a substitute for, the analysis of other GAAP financial measures, such as total net revenue. The primary limitation of adjusted net revenue is its lack of comparability to other companies that do not utilize this measure or that use a similar measure that is defined in a different manner.
| | |
AnnualTotal Net Revenue and Adjusted Net Revenue |
| In Thousands |
|
We reconcileThe following table reconciles adjusted net revenue to total net revenue, the most directly comparable GAAP measure, as presented below for the years indicated:measure:
| | Year Ended December 31, |
| | Year Ended December 31, | | | | Year Ended December 31, |
| ($ in thousands) | ($ in thousands) | | 2021 | | 2020 | | 2019 | ($ in thousands) | | 2023 | | 2022 | | 2021 |
| Total net revenue | Total net revenue | | $ | 984,872 | | | $ | 565,532 | | | $ | 442,659 | |
Servicing rights – change in valuation inputs or assumptions(1) | Servicing rights – change in valuation inputs or assumptions(1) | | 2,651 | | | 17,459 | | | (8,487) | |
Residual interests classified as debt – change in valuation inputs or assumptions(2) | Residual interests classified as debt – change in valuation inputs or assumptions(2) | | 22,802 | | | 38,216 | | | 17,157 | |
Gain on extinguishment of debt(3) | |
| Adjusted net revenue | Adjusted net revenue | | $ | 1,010,325 | | | $ | 621,207 | | | $ | 451,329 | |
__________________
(1)Reflects changes in fair value inputs and assumptions on servicing rights, including conditional prepayment, and default rates and discount rates. These assumptions are highly sensitive to market interest rate changes and are not indicative of our performance or results of operations. Moreover, these non-cash charges are unrealized during the period and, therefore, have no impact on our cash flows from operations. As such, these positive and negative changes are adjusted out of total net revenue to provide management and financial users with better visibility into the net revenue available to finance our operations and our overall performance.
(2)Reflects changes in fair value inputs and assumptions on residual interests classified as debt, including conditional prepayment, and default rates and discount rates. When third parties finance our consolidated securitization variable interest entities (“VIEs”)VIEs by purchasing residual interests, we receive proceeds at the time of the closing of the securitization and, thereafter, pass along contractual cash flows to the residual interest owner. These residual debt obligations are measured at fair value on a recurring basis, but they have no impact on our initial financing proceeds, our future obligations to the residual interest owner (because future residual interest claims are limited to contractual securitization collateral cash flows), or the general operations of our business. As such, these positive and negative non-cash changes in fair value attributable to assumption changes are adjusted out of total net revenue to provide management and financial users with better visibility into the net revenue available to finance our operations.
79
We reconcileThe following table reconciles adjusted net revenue to total net revenue, the most directly comparable GAAP measure, as presented below for the quarterly periods indicated:presented:
| | Quarter Ended |
| | Quarter Ended | | | | Quarter Ended |
| ($ in thousands) | ($ in thousands) | | December 31,
2021 | | September 30,
2021 | | June 30,
2021 | | March 31,
2021 | | December 31, 2020 | | September 30, 2020 | | June 30, 2020 | | March 31,
2020 | ($ in thousands) | | December 31, 2023 | | September 30, 2023 | | June 30, 2023 | | March 31, 2023 | | December 31, 2022 | | September 30, 2022 | | June 30, 2022 | | March 31, 2022 |
| Total net revenue | Total net revenue | | $ | 285,608 | | | $ | 272,006 | | | $ | 231,274 | | | $ | 195,984 | | | $ | 171,491 | | | $ | 200,787 | | | $ | 114,952 | | | $ | 78,302 | |
Servicing rights – change in valuation inputs or assumptions(1) | Servicing rights – change in valuation inputs or assumptions(1) | | (9,273) | | | (409) | | | 224 | | | 12,109 | | | 1,127 | | | 4,671 | | | 18,720 | | | (7,059) | |
Residual interests classified as debt – change in valuation inputs or assumptions(2) | Residual interests classified as debt – change in valuation inputs or assumptions(2) | | 3,541 | | | 5,593 | | | 5,717 | | | 7,951 | | | 9,401 | | | 11,301 | | | 2,578 | | | 14,936 | |
Gain on extinguishment of debt(3) | |
Adjusted net revenue | Adjusted net revenue | | $ | 279,876 | | | $ | 277,190 | | | $ | 237,215 | | | $ | 216,044 | | | $ | 182,019 | | | $ | 216,759 | | | $ | 136,250 | | | $ | 86,179 | |
__________________
(1)See footnote (1) to the table above.
(2)See footnote (2) to the table above.
The reconciling items to determine our non-GAAP measure of adjusted net revenue are applicable only(3)See footnote (3) to the Lending segmenttable above..
The following table below presentsreconciles adjusted net revenue for the Lending segment to total net revenue, the most directly comparable GAAP measure for the years indicated:Lending segment:
| | Year Ended December 31, |
| | Year Ended December 31, | | | | Year Ended December 31, |
| ($ in thousands) | ($ in thousands) | | 2021 | | 2020 | | 2019 | ($ in thousands) | | 2023 | | 2022 | | 2021 |
Total net revenue – Lending | Total net revenue – Lending | | $ | 738,323 | | | $ | 480,866 | | | $ | 434,301 | |
Servicing rights – change in valuation inputs or assumptions(1) | Servicing rights – change in valuation inputs or assumptions(1) | | 2,651 | | | 17,459 | | | (8,487) | |
Residual interests classified as debt – change in valuation inputs or assumptions(2) | Residual interests classified as debt – change in valuation inputs or assumptions(2) | | 22,802 | | | 38,216 | | | 17,157 | |
Adjusted net revenue – Lending | Adjusted net revenue – Lending | | $ | 763,776 | | | $ | 536,541 | | | $ | 442,971 | |
(1)See footnote (1) to the table above.
(2)See footnote (2) to the table above.
Adjusted EBITDA
Adjusted EBITDA is defined as net income (loss), adjusted to exclude:exclude, as applicable: (i) corporate borrowing-based interest expense (our adjusted EBITDA measure is not adjusted for warehouse or securitization-based interest expense, nor deposit interest expense and finance lease liability interest expense, as discussed further below)these are direct operating expenses), (ii) income tax expense (benefit), (iii) depreciation and amortization, (iv) share-based expense (inclusive of equity-based payments to non-employees), (v) restructuring charges (vi) impairment expense (inclusive of goodwill impairment and property, equipment and software abandonments), (vi)(vii) transaction-related expenses, (vii)(viii) foreign currency impacts related to operations in highly inflationary countries, (ix) fair value changes in warrant liabilities, and (viii)(x) fair value changes in each of servicing rights and residual interests classified as debt due to valuation assumptions.assumptions, (xi) gain on extinguishment of debt, and (xii) other charges, as appropriate, that are not expected to recur and are not indicative of our core operating performance. We believe adjusted EBITDA provides a useful measure to investors for period-over-period comparisons of our business, as it removes the effecteffects of certain non-cash items and certain charges that are not indicative of our core operating performance or results of operations. It is also a measure that management relies upon to evaluate cash flows generated from operations, and therefore the extent of additional capital, if any, required to invest in strategic initiatives. Adjusted EBITDA has limitations as an analytical tool and should not be considered in isolation from, or as a substitute for, the analysis of other GAAP financial measures, such as net income (loss). Some of the limitations of adjusted EBITDA include that it does not reflect the impact of working capital requirements or capital expenditures and it is not a universally consistent calculation among companies in our industry, which limits its usefulness as a comparative measure.
| | |
| Net Loss and Adjusted EBITDA |
| In Thousands |
We reconcileThe following table reconciles adjusted EBITDA to net loss, the most directly comparable GAAP measure, below for the years indicated:measure:
| | Year Ended December 31, |
| | Year Ended December 31, | | | | Year Ended December 31, |
| ($ in thousands) | ($ in thousands) | | 2021 | | 2020 | | 2019 | ($ in thousands) | | 2023 | | 2022 | | 2021 |
| Net loss | Net loss | | $ | (483,937) | | | $ | (224,053) | | | $ | (239,697) | |
| Non-GAAP adjustments: | Non-GAAP adjustments: | |
Interest expense – corporate borrowings(1) | Interest expense – corporate borrowings(1) | | 10,345 | | | 27,974 | | | 4,962 | |
Income tax expense (benefit)(2) | | 2,760 | | | (104,468) | | | 98 | |
Interest expense – corporate borrowings(1) | |
Interest expense – corporate borrowings(1) | |
Income tax (benefit) expense(2) | |
Depreciation and amortization(3) | Depreciation and amortization(3) | | 101,568 | | | 69,832 | | | 15,955 | |
| Share-based expense | Share-based expense | | 239,371 | | | 100,778 | | | 61,419 | |
Restructuring charges(4) | |
Impairment expense(4)(5) | Impairment expense(4)(5) | | — | | | — | | | 2,205 | |
Transaction-related expense(5) | | 27,333 | | | 9,161 | | | — | |
Fair value changes in warrant liabilities(6) | | 107,328 | | | 20,525 | | | (2,834) | |
Servicing rights – change in valuation inputs or assumptions(7) | | 2,651 | | | 17,459 | | | (8,487) | |
Residual interests classified as debt – change in valuation inputs or assumptions(8) | | 22,802 | | | 38,216 | | | 17,157 | |
Foreign currency impact of highly inflationary subsidiaries(6) | |
Transaction-related expense(7) | |
Fair value changes in warrant liabilities(8) | |
Servicing rights – change in valuation inputs or assumptions(9) | |
Residual interests classified as debt – change in valuation inputs or assumptions(10) | |
Gain on extinguishment of debt(11) | |
| Total adjustments | Total adjustments | | 514,158 | | | 179,477 | | | 90,475 | |
Adjusted EBITDA | Adjusted EBITDA | | $ | 30,221 | | | $ | (44,576) | | | $ | (149,222) | |
___________________
(1)Our adjusted EBITDA measure adjusts for corporate borrowing-based interest expense, as these expenses are a function of our capital structure. Corporate borrowing-based interest expense primarily included (i)includes interest on our revolving credit facility (ii)and the amortization of debt discount and debt issuance costs on our convertible notes, and (iii)for 2021, interest on the seller note issued in connection with our acquisition of Galileo. Our adjusted EBITDA measure does not adjust for interest expense on warehouse facilities and securitization debt, which are recorded within interest expense—securitizations and warehouses in the consolidated statements of operations and comprehensive income (loss), as these interest expenses are direct operating expenses driven by loan origination and sales activity. Additionally, our adjusted EBITDA measure does not adjust for interest expense on SoFi Money deposits or interest expense on our finance lease liability in connection with SoFi Stadium, which are recorded within interest expense—other, as these interest expenses are direct operating expenses driven by SoFi Money deposits and finance leases, respectively. The fluctuations in interest expense were impacted by interest expense on the Galileo seller note, which was issued in May 2020 and repaid in February 2021, as well as the amortization of debt discount and debt issuance costs on our convertible notes, which were issued in October 2021. Revolving credit facility interest expense decreased modestly during 2021in 2023 and 2022 increased due to higher interest rates relative to 2020, as a higher average balance in 2021 was more than offset by a decrease in LIBOR, and increased during 2020 relative to 2019 primarily due to a higher average balance following the acquisition of Galileo.prior years on identical outstanding debt.
(2)OurIncome taxes in 2023 were primarily attributable to income tax benefits from foreign losses in jurisdictions with net deferred tax liabilities related to Technisys, offset by income tax expense positionsassociated with the profitability of SoFi Bank in state jurisdictions where separate filings are required, as well as federal taxes where our tax credits and loss carryforwards may be limited. Income taxes in 2022 were primarily attributable to tax expense at SoFi Lending Corp and SoFi Bank due to profitability in state jurisdictions where separate filings are required and recognition of expense from Technisys in certain Latin American countries where separate returns are filed. The expense was partially offset by deferred tax benefits from the amortization of intangible assets acquired in the Technisys Merger. Income taxes in 2021 and 2019 were primarily a functionattributable to the profitability of SoFi Lending Corp.’s profitability in state jurisdictions where separate filings are required. Our income tax benefit position in 2020 was primarily due to a partial release of our valuation allowance in the second quarter in connection with deferred tax liabilities resulting from intangible assets acquired from Galileo in May 2020. See Note 1417. Income Taxes to the Notes to Consolidated Financial Statements for additional information.
(3)Depreciation and amortization expense for 2021in 2023 increased compared to 20202022 primarily due to the amortization of intangible assets recognized during the second quarter of 2020 associatedin connection with the Galileoacquisitions and 8 Limited acquisitions, amortization of purchased andgrowth in our internally-developed software balance. The increase in 2022 compared to 2021 was primarily in connection with acquisitions and depreciation related to SoFi Stadium fixed assets,growth in our software balance, partially offset by a decrease related to the acceleration of core banking infrastructure amortization. Depreciation and amortization expense for 2020 compared to 2019 increased primarily due to amortization expense on intangible assets acquired during the second2021 period.
(4)Restructuring charges in 2023 primarily included employee-related wages, benefits and severance associated with a small reduction in headcount in our Technology Platform segment in the first quarter of 2020 from Galileo2023 and 8 Limited, accelerationexpenses in the fourth quarter of 2023 related to a reduction in headcount across the Company, which do not reflect expected future operating expenses and are not indicative of our core banking infrastructure amortization, and amortization of purchased and internally-developed software.operating performance.
(4)(5)Impairment expense in 2019 primarily2023 includes software abandonment.
81
(5)(7)Transaction-related expenses duringin 2023 and 2022 primarily included financial advisory and professional services costs associated with our acquisitions of Wyndham and Technisys, respectively. Transaction-related expenses in 2021 included a $21.2 millionthe special payment to the holders of Series 1 preferred stockholdersRedeemable Preferred Stock in conjunction with the Business Combination and financial advisory and professional costs associated with transactions that occurred during the period. We incurred such costs as follows: (i) $2.2 million related to our acquisitionthen-pending acquisitions of Golden Pacific Bank, (ii) $3.3 million related to a recently announced acquisition, and (iii) $0.6 million related to debt and equity transactions, including our convertible debt, capped call and secondary offering on behalf of certain investors. During 2020, transaction-related expenses included certain costs, such as financial advisory and professional services costs, associated with our acquisitions of Galileo and 8 Limited.Technisys.
(6)(8)Our adjusted EBITDA measure excludes the non-cash fair value changes in warrants accounted for as liabilities, which were measured at fair value through earnings. The amountsamount in 2019 and 2020, as well as a portion of 2021 related to changes in the fair value of Series H warrants issued by Social Finance in 2019 in connection with certain redeemable preferred stock issuances. We did not measure the Series H warrants at fair value subsequent to May 28, 2021 in conjunction with the Business Combination, as they were reclassified into permanent equity. In addition, in conjunction with the Business Combination, SoFi Technologies assumed certain common stock warrants (“SoFi Technologies warrants”) that were accounted for as liabilities and measured at fair value on a recurring basis. The fair value of the SoFi Technologies warrants was based on the closing price of ticker SOFIW and, therefore, fluctuated based on market activity. The vast majority of outstanding SoFi Technologies warrants were either exercised during the fourth quarter of 2021 and therefore the Company incurred gains and losses associated with fair value changes until the warrant liabilities converted into SoFi common stock. The remaining unexercised warrants wereor redeemed at a redemption price of $0.10 on December 6, 2021. See Note 9 to the Notes to Consolidated Financial Statements for additional information.
(7)(9)Reflects changes in fair value inputs and assumptions, including market servicing costs, conditional prepayment, and default rates and discount rates. This non-cash change is unrealized during the period and, therefore, has no impact on our cash flows from operations. As such, these positive and negative changes in fair value attributable to assumption changes are adjusted out of net loss to provide management and financial users with better visibility into the earnings available to finance our operations.
(10)Reflects changes in fair value inputs and assumptions, including conditional prepayment, and default rates and discount rates. When third parties finance our consolidated VIEs through purchasing residual interests, we receive proceeds at the time of the securitization close and, thereafter, pass along contractual cash flows to the residual interest owner. These obligations are measured at fair value on a recurring basis, which has no impact on our initial financing proceeds, our future obligations to the residual interest owner (because future residual interest claims are limited to contractual securitization collateral cash flows), or the general operations of our business. As such, these positive and negative non-cash changes in fair value attributable to assumption changes are adjusted out of net loss to provide management and financial users with better visibility into the earnings available to finance our operations.
We reconcile(11)Reflects gain on extinguishment of debt. Gains and losses are recognized during the period of extinguishment for the difference between the net carrying amount of debt extinguished and the fair value of equity securities issued. These non-cash charges are not indicative of our core operating performance, and as such are adjusted out of total net revenue to provide management and financial users with better visibility into the net revenue available to finance our operations and our overall performance.
The following table reconciles adjusted EBITDA to net income (loss),loss, the most directly comparable GAAP measure, for the quarterly periods indicated below:presented:
| | Quarter Ended |
| | Quarter Ended | | | | Quarter Ended |
| ($ in thousands) | ($ in thousands) | | December 31,
2021 | | September 30,
2021 | | June 30,
2021 | | March 31,
2021 | | December 31,
2020 | | September 30,
2020 | | June 30,
2020 | | March 31,
2020 | ($ in thousands) | | December 31, 2023 | | September 30, 2023 | | June 30, 2023 | | March 31, 2023 | | December 31, 2022 | | September 30, 2022 | | June 30, 2022 | | March 31, 2022 |
| Net income (loss) | | $ | (111,012) | | | $ | (30,047) | | | $ | (165,314) | | | $ | (177,564) | | | $ | (82,616) | | | $ | (42,878) | | | $ | 7,808 | | | $ | (106,367) | |
| Net loss | |
| Non-GAAP adjustments: | Non-GAAP adjustments: | |
| Interest expense – corporate borrowings | Interest expense – corporate borrowings | | 2,593 | | | 1,366 | | | 1,378 | | | 5,008 | | | 19,125 | | | 4,346 | | | 3,415 | | | 1,088 | |
| Income tax expense (benefit) | | 1,558 | | | 181 | | | (78) | | | 1,099 | | | (4,949) | | | 192 | | | (99,768) | | | 57 | |
| Interest expense – corporate borrowings | |
| Interest expense – corporate borrowings | |
| Income tax (benefit) expense | |
| Depreciation and amortization | Depreciation and amortization | | 26,527 | | | 24,075 | | | 24,989 | | | 25,977 | | | 25,486 | | | 24,676 | | | 14,955 | | | 4,715 | |
| Share-based expense | Share-based expense | | 77,082 | | | 72,681 | | | 52,154 | | | 37,454 | | | 30,089 | | | 26,551 | | | 24,453 | | | 19,685 | |
| Restructuring charges | |
| Impairment expense | |
| Foreign currency impact of highly inflationary subsidiaries | |
| Transaction-related expense | Transaction-related expense | | 2,753 | | | 1,221 | | | 21,181 | | | 2,178 | | | — | | | 297 | | | 4,950 | | | 3,914 | |
| Fair value changes in warrant liabilities | | 10,824 | | | (64,405) | | | 70,989 | | | 89,920 | | | 14,154 | | | 4,353 | | | (861) | | | 2,879 | |
| | Servicing rights – change in valuation inputs or assumptions | |
| Servicing rights – change in valuation inputs or assumptions | |
| Servicing rights – change in valuation inputs or assumptions | Servicing rights – change in valuation inputs or assumptions | | (9,273) | | | (409) | | | 224 | | | 12,109 | | | 1,127 | | | 4,671 | | | 18,720 | | | (7,059) | |
| Residual interests classified as debt – change in valuation inputs or assumptions | Residual interests classified as debt – change in valuation inputs or assumptions | | 3,541 | | | 5,593 | | | 5,717 | | | 7,951 | | | 9,401 | | | 11,301 | | | 2,578 | | | 14,936 | |
| Gain on extinguishment of debt | |
| Total adjustments | Total adjustments | | 115,605 | | | 40,303 | | | 176,554 | | | 181,696 | | | 94,433 | | | 76,387 | | | (31,558) | | | 40,215 | |
| Adjusted EBITDA | Adjusted EBITDA | | $ | 4,593 | | | $ | 10,256 | | | $ | 11,240 | | | $ | 4,132 | | | $ | 11,817 | | | $ | 33,509 | | | $ | (23,750) | | | $ | (66,152) | |
The table below presents the key business metrics that management uses to evaluate our business, measure our performance, identify trends and make strategic decisions.decisions:
| | | | | | | | | | | | | | | | | | | | | | | | | | | | | | | | |
| | December 31, | | 2021 vs. 2020
% Change | | 2020 vs. 2019
% Change |
| | 2021 | | 2020 | | 2019 | | |
| Members | | 3,460,298 | | | 1,850,871 | | | 976,459 | | | 87 | % | | 90 | % |
| Total Products | | 5,173,197 | | | 2,523,555 | | | 1,185,362 | | | 105 | % | | 113 | % |
| Total Products — Lending segment | | 1,078,952 | | | 917,645 | | | 798,005 | | | 18 | % | | 15 | % |
| Total Products — Financial Services segment | | 4,094,245 | | | 1,605,910 | | | 387,357 | | | 155 | % | | 315 | % |
Total Accounts — Technology Platform segment(1) | | 99,660,657 | | | 59,735,210 | | | — | | | 67 | % | | n/m |
__________________ | | | | | | | | | | | | | | | | | | | | | | | | | | | | | | | | | | | | | | | | | | | | |
| | December 31, | | 2023 vs. 2022 | | 2022 vs. 2021 |
| | 2023 | | 2022 | | 2021 | | # Change | | % Change | | # Change | | % Change |
| Members | | 7,541,860 | | | 5,222,533 | | | 3,460,298 | | | 2,319,327 | | | 44 | % | | 1,762,235 | | | 51 | % |
| Total Products | | 11,142,476 | | | 7,894,636 | | | 5,173,197 | | | 3,247,840 | | | 41 | % | | 2,721,439 | | | 53 | % |
| Total Products — Lending segment | | 1,663,006 | | | 1,340,597 | | | 1,078,952 | | | 322,409 | | | 24 | % | | 261,645 | | | 24 | % |
| Total Products — Financial Services segment | | 9,479,470 | | | 6,554,039 | | | 4,094,245 | | | 2,925,431 | | | 45 | % | | 2,459,794 | | | 60 | % |
| Total Accounts — Technology Platform segment | | 145,425,391 | | | 130,704,351 | | | 99,660,657 | | | 14,721,040 | | | 11 | % | | 31,043,694 | | | 31 | % |
(1)Beginning in the fourth quarter of 2021, we included SoFi accounts on the Galileo platform-as-a-service in our total accounts metric to better align with the Technology Platform segment revenue reported in Note 18 to the Notes to Consolidated Financial Statements. Intercompany revenue is eliminated in consolidation. We recast the total accounts as of December 31, 2020 to conform to the current year presentation, which resulted in an increase of 375,367 in total accounts as of such date.
See “Summary Results by Segment” for additional metrics we review at the segment level.
Members
We refer to our customers as “members”, which we. We define a member as someone who has a lending relationship with us through origination and/or ongoing servicing, opened a financial services account, linked an external account to our platform or signed up for our credit score monitoring service. See Our members have continuous access to our CFPs, our career advice services, our member events, our content, educational material, news, and our tools and calculators, which are provided at no cost to the member. Additionally, our mobile app and website have a member home feed that is personalized and delivers content to a
member about what they must do that day in their financial life, what they should consider doing that day in their financial life, and what they can do that day in their financial life.
Once someone becomes a member, they are always considered a member unless they violate our terms of service. We adjust our total number of members in the event a member is removed in accordance with our terms of service. This could occur for a variety of reasons—including fraud or pursuant to certain legal processes—and, as our terms of service evolve together with our business practices, product offerings and applicable regulations, our grounds for removing members from our total member count could change. The determination that a member should be removed in accordance with our terms of service is subject to an evaluation process, following the completion, and based on the results, of which, relevant members and their associated products are removed from our total member count in the period in which such evaluation process concludes. However, depending on the length of the evaluation process, that removal may not take place in the same period in which the member was added to our member count or the same period in which the circumstances leading to their removal occurred. For this reason, our total member count may not yet reflect adjustments that may be made once ongoing evaluation processes, if any, conclude.
We view members as an indication not only of the size and a measurement of growth of our business, but also as a measure of the significant value of the data we have collected over time. The data we collect from our members helps us to, among other things: (i) assess loan life performance data on each loan in our ecosystem, which can inform risk-based interest rates that we can offer our members, (ii) understand our members’ spending behavior to identify and suggest other products we offer that may align with the members’ financial needs, and (iii) enhance our opportunities to sell additional products to our members, as our members represent a vital source of marketing opportunities. When we provide additional products to members, it helps improve our unit economics per member, as we save on marketing costs that we would otherwise incur to attract new members. It also increases the lifetime value of an individual member. This in turn enhances our Financial Services Productivity Loop. Member growth is generally an indicator of future revenue, but is not directly correlated with revenues, since not all members who sign up for one of our products fully utilize or continue to use our products, and not all of our products (such as our complimentary product, SoFi Relay) provide direct sources of revenue.
Since our inception through December 31, 2023, we have served approximately 7.5 million members who have used approximately 11.1 million products on the SoFi platform.
Total Products
Total products refers to the aggregate number of lending and financial services products that our members have selected on our platform since our inception through the reporting date, whether or not the members are still registered for such products. Total products is a primary indicator of the size and reach of our Lending and Financial Services segments. Management relies on total products metrics to understand the effectiveness of our member acquisition efforts and to gauge the propensity for members to use more than one product.
In our Lending segment, total products refers to the number of home loans, personal loans, student loans and studenthome loans that have been originated through our platform through the reporting date, whether or not such loans have been paid off. If a member has multiple loan products of the same loan product type, such as two personal loans, that is counted as a single product. However,
if a member has multiple loan products across loan product types, such as one personal loan and one home loan, that is counted as two products.
In our Financial Services segment, total products refers to the number of SoFi Money accounts (inclusive of checking and savings accounts held at SoFi Bank and cash management accounts), SoFi Invest accounts, SoFi Credit Card accounts (including accounts with a zero dollar balance at the reporting date), referred loans (which relate to an arrangement in the third quarter of 2021 and are originated by a third-party partner to which we provide pre-qualified borrower referrals), SoFi At Work accounts and SoFi Relay accounts (with either credit score monitoring enabled or external linked accounts) that have been opened through our platform through the reporting date. Checking and savings accounts are considered one account within our total products metric. Our SoFi Invest service is composed of three products: active investing accounts, robo-advisory accounts and digital assets accounts. Our members can select any one or combination of the three types of SoFi Invest products. See Note 1. Organization, Summary of Significant Accounting Policies and New Accounting Standards for additional information on the transfer of the crypto services. If a member has multiple SoFi Invest products of the same account type, such as two active investing accounts, that is counted as a single product. However, if a member has multiple SoFi Invest products across account types, such as one active investing account and one robo-advisory account, those separate account types are considered separate products. TotalIn the event a member is removed in accordance with our terms of service, as discussed under “Members” above, the member’s associated products is a primary indicator of the size and reach of our Lending and Financial Services segments. Management relies on total products metrics to understand the effectiveness of our member acquisition efforts and to gauge the propensity for members to use more than one product.
Total lending products were composed of the following as of the dates indicated:following:
| | December 31, | | 2021 vs. 2020 | | 2020 vs. 2019 |
| | December 31, | | | | December 31, | | 2023 vs. 2022 | | 2022 vs. 2021 |
| Lending Products | Lending Products | | 2021 | | 2020 | | 2019 | | Variance | | % Change | | Variance | | % Change | Lending Products | | 2023 | | 2022 | | 2021 | | Variance | | % Change | | Variance | | % Change |
| Home loans | | 23,035 | | | 13,977 | | | 7,859 | | | 9,058 | | | 65 | % | | 6,118 | | | 78 | % |
| Personal loans | Personal loans | | 610,348 | | | 501,045 | | | 445,559 | | | 109,303 | | | 22 | % | | 55,486 | | | 12 | % | Personal loans | | 1,113,864 | | | 837,462 | | 837,462 | | | 610,348 | | 610,348 | | | 276,402 | | 276,402 | | | 33 | | 33 | % | | 227,114 | | | 37 | | 37 | % |
| Student loans | Student loans | | 445,569 | | | 402,623 | | | 344,587 | | | 42,946 | | | 11 | % | | 58,036 | | | 17 | % | Student loans | | 519,489 | | | 477,132 | | 477,132 | | | 445,569 | | 445,569 | | | 42,357 | | 42,357 | | | 9 | | 9 | % | | 31,563 | | | 7 | | 7 | % |
| Home loans | | Home loans | | 29,653 | | | 26,003 | | | 23,035 | | | 3,650 | | | 14 | % | | 2,968 | | | 13 | % |
| Total lending products | Total lending products | | 1,078,952 | | | 917,645 | | | 798,005 | | | 161,307 | | | 18 | % | | 119,640 | | | 15 | % | Total lending products | | 1,663,006 | | | 1,340,597 | | 1,340,597 | | | 1,078,952 | | 1,078,952 | | | 322,409 | | 322,409 | | | 24 | | 24 | % | | 261,645 | | | 24 | | 24 | % |
Total financial services products were composed of the following as of the dates indicated:following:
| | December 31, | | 2021 vs. 2020 | | 2020 vs. 2019 |
| | December 31, | | | | December 31, | | 2023 vs. 2022 | | 2022 vs. 2021 |
| Financial Services Products | Financial Services Products | | 2021 | | 2020 | | 2019 | | Variance | | % Change | | Variance | | % Change | Financial Services Products | | 2023 | | 2022 | | 2021 | | Variance | | % Change | | Variance | | % Change |
| Money | | 1,436,955 | | | 645,502 | | | 156,603 | | | 791,453 | | | 123 | % | | 488,899 | | | 312 | % |
Money(1) | | Money(1) | | 3,374,310 | | | 2,195,402 | | | 1,436,955 | | | 1,178,908 | | | 54 | % | | 758,447 | | | 53 | % |
| Invest | Invest | | 1,595,143 | | | 531,541 | | | 181,817 | | | 1,063,602 | | | 200 | % | | 349,724 | | | 192 | % | Invest | | 2,380,641 | | | 2,158,864 | | 2,158,864 | | | 1,595,143 | | 1,595,143 | | | 221,777 | | 221,777 | | | 10 | | 10 | % | | 563,721 | | | 35 | | 35 | % |
| Credit Card | Credit Card | | 91,216 | | | 6,445 | | | — | | | 84,771 | | | n/m | | 6,445 | | | n/m | Credit Card | | 245,385 | | | 171,425 | | 171,425 | | | 91,216 | | 91,216 | | | 73,960 | | 73,960 | | | 43 | | 43 | % | | 80,209 | | | 88 | | 88 | % |
Referred loans(1) | | 7,659 | | | — | | | — | | | 7,659 | | | n/m | | — | | | n/m |
Referred loans(2) | | Referred loans(2) | | 55,231 | | | 40,980 | | | 7,659 | | | 14,251 | | | 35 | % | | 33,321 | | | 435 | % |
| Relay | Relay | | 930,181 | | | 408,735 | | | 43,012 | | | 521,446 | | | 128 | % | | 365,723 | | | 850 | % | Relay | | 3,336,868 | | | 1,921,986 | | 1,921,986 | | | 930,181 | | 930,181 | | | 1,414,882 | | 1,414,882 | | | 74 | | 74 | % | | 991,805 | | | 107 | | 107 | % |
| At Work | At Work | | 33,091 | | | 13,687 | | | 5,925 | | | 19,404 | | | 142 | % | | 7,762 | | | 131 | % | At Work | | 87,035 | | | 65,382 | | 65,382 | | | 33,091 | | 33,091 | | | 21,653 | | 21,653 | | | 33 | | 33 | % | | 32,291 | | | 98 | | 98 | % |
| Total financial services products | Total financial services products | | 4,094,245 | | | 1,605,910 | | | 387,357 | | | 2,488,335 | | | 155 | % | | 1,218,553 | | | 315 | % | Total financial services products | | 9,479,470 | | | 6,554,039 | | 6,554,039 | | | 4,094,245 | | 4,094,245 | | | 2,925,431 | | 2,925,431 | | | 45 | | 45 | % | | 2,459,794 | | | 60 | | 60 | % |
__________________
(1) This product type is limitedIncludes checking and savings accounts held at SoFi Bank, and cash management accounts.
(2) Limited to loans wherein we provide third party fulfillment services.
Technology Platform Total Accounts
In our Technology Platform segment, total accounts refers to the number of open accounts at Galileo as of the reporting date. Beginning in the fourth quarter of 2021, we included SoFiWe include intercompany accounts on the Galileo platform-as-a-serviceplatform as a service in our total accounts metric to better align with the Technology Platform segment revenue reported in Note 1820. Business Segment and Geographic Information to the Notes to Consolidated Financial Statements, which includes intercompany revenue from SoFi.revenue. Intercompany revenue is eliminated in consolidation. We recast the total accounts as of December 31, 2020 to conform to the current year presentation. No total accounts information is reported prior to our acquisition of Galileo on May 14, 2020. Total accounts is a primary indicator of the accounts dependent upon Galileo’sour technology platform to use virtual card products, virtual wallets, make peer-to-peer and bank-to-bank transfers, receive early paychecks, separate savings from spending balances, make debit transactions and rely upon real-time authorizations, all of which result in technology platform feesrevenues for the Technology Platform segment. We do not measure total accounts for the Technisys products and solutions, as the revenue model is not primarily dependent upon being a fully integrated, stand-ready service.
| | |
Technology Platform Accounts(1)(2) |
| In Millions |
___________________
(1)We include SoFi accounts on the Galileo platform as a service in Technology Platform total accounts to better align with the presentation of Technology Platform segment total net revenue.
(2)In 2023, Technology Platform total accounts reflects the previously disclosed migration by one of our clients of the majority of its processing volumes to a pure processor. These accounts remained open for administrative purposes through the end of 2022, and were included in our total accounts in such period.
| | | | | | | | | | | | | | | | | | | | | | | | | | | | | | | | |
| | December 31, | | 2023 vs. 2022 | | 2022 vs. 2021 |
| | 2023 | | 2022 | | 2021 | | % Change | | % Change |
| Total accounts | | 145,425,391 | | | 130,704,351 | | | 99,660,657 | | | 11 | % | | 31 | % |
Key Factors Affecting Operating Results Our future operating results and cash flows are dependent upon a number of opportunities, challenges and other factors, including our loan origination volume, financial services products and member activity on our platform, growth in
Galileo accounts, technology platform clients, competition and industry trends, general economic conditions and our ability to optimize our national bank charter.
Origination Volume
Our Lending segment is our largest segment, comprising 75%65%, 85%72% and 98%75% of total net revenue during the years ended December 31, 2021, 20202023, 2022 and 2019,2021, respectively. We are dependent upon the addition of new members and new activity from existing members within our Lending segment to generate origination volume, which we believe is a contributor to Lending segment net revenue. We believe we have a high-quality loan portfolio, as indicated by our Lending segment weighted average origination FICO score of 761749 during the year ended December 31, 2021.2023. See “Industry Trends and General Economic Conditions” for the impact of specific economic factors including those resulting from the COVID-19 pandemic, on origination volume.
Member Growth and Activity
We have invested heavily in our platform and are dependent on continued member growth, as well as our ability to generate additional revenues from our existing members using additional products and services. Member growth and activity is critical to our ability to increase our scale and earn a return on our technology and product investments. Growth in members and member activity will depend heavily on our ability to continue to offer attractive products and services at sustainable costs and our continued member acquisition and marketing efforts.
Product Growth
Our aim is to develop and offer a best-in-class integrated financial services platform with products that meet the broad objectives of our members and the lifecycle of their financial needs. We have invested, and continue to invest, heavily in the development, improvement and marketing of our suite of lending and financial services products and are dependent on continued growth in the number of products selected by our members, as well as our ability to build trust and reliability between our members and our platform to reinforce the effects of the Financial Services Productivity Loop. In order to deliver on our strategy, we aim to foster positive member experiences designed to lead to more products per member,product adoption by existing members, leading to enhanced profitability for each additional product by lowering overall member acquisition costs.
Galileo Account Growth
During 2020, we acquired Galileo which primarily provides technology platform services to financial and non-financial institutions, to enablewhich enabled us to diversify our business from a primarily consumer-based business to also serve enterprises that rely upon Galileo’s integrated platform-as-a-serviceplatform as a service to serve their clients. We are dependent on growth in the number of accounts at Galileo, which is an indication of the amount of users that are dependent upon the technology platform for a variety of products and services, including virtual card products, virtual wallets, peer-to-peer and bank-to-bank transfers, early paychecks and relying on real-time authorizations, all of which generate revenue for Galileo.
CompetitionSoFi Bank
A key element of our long-term strategy has been to secure a national bank charter. In February 2022, we closed the Bank Merger and began operating Golden Pacific Bank as SoFi Bank. In connection with operating a national bank, we have incurred and expect to continue to incur additional costs primarily associated with headcount, technology infrastructure, governance, compliance and risk management, marketing, and other general and administrative expenses.
We face competition from severalSee Part I, Item 1. “Company Overview—SoFi Bank” for a discussion of the key expected financial services institutions given our status asbenefits to us of operating a diversified financial services provider andnational bank. See Part I, Item 1A. “Risk Factors” for discussion of certain potential risks related to being a bank holding company. In each of our reportable segments, we may compete with more established financial institutions, some of which have more financial resources than we do. We compete at multiple levels, including competition among other personal loan, student loan, credit card and residential mortgage lenders, competition for deposits from other banks and non-bank lenders, competition for investment accounts in our SoFi Invest product from other brokerage firms, including those based on online or mobile platforms, competition for subscribers to our financial services content, and competition with other technology platforms for the enterprise services we provide. Some of our competitors may at times seek to increase their market share by undercutting pricing terms prevalent in that market, which could adversely affect our market share for any of our products and services or require us to incur higher member acquisition costs. Furthermore, our competitors could offer relatively attractive benefits to our current members, which could limit members using more than one product. See “Business—Competition” for more information.
Industry Trends and General Economic Conditions
Our results of operations have historically been relatively resilient to economic downturns but in the future may be impacted by the relative strength of the overall economy and its effect on unemployment, asset markets and consumer spending. As general economic conditions improve or deteriorate, the amount of consumer disposable income tends to fluctuate, which in turn impacts consumer spending levels and the willingness of consumers to take out loans to finance purchases or invest in financial assets. Specific economic factors, such as interest rate levels, changes in monetary and related policies, unemployment
rates, market volatility, consumer confidence and changing expectations for inflation and deflation, also influence consumer spending, saving, investing and borrowing patterns. Increased focus by policymakers
The Federal Reserve increased the benchmark interest rate throughout 2022 and several times in 2023, largely in response to high inflation, low unemployment and strong consumer demand, while balancing macroeconomic risks, such as increased market volatility. We have continued to see strong demand for our deposits as a result of our competitive interest rate offering and access to expanded FDIC insurance coverage through a network of participating banks in our Insured Deposit Program. However, rising interest rates have unfavorably impacted, and could continue to unfavorably impact, demand for refinancing loan products. Economic and market volatility may continue to occur and could worsen, including if there is additional turmoil in the current presidential administrationbanking and financial services sectors, which could adversely impact our liquidity, results of operations and financial condition. These market developments have negatively impacted customer confidence in the safety and soundness of certain banks. As a result, although we have not observed a decline in our overall deposits to date, our members may choose to maintain deposits with other financial institutions or spread their deposit funds among multiple financial institutions. In addition, if the Federal Reserve does not effectively curb inflation or interest rates further rise unexpectedly or too quickly or macroeconomic conditions deteriorate or do not improve, it could have a negative impact on outstandingthe overall economy and result in increased unemployment, which could adversely impact our results of operations. In 2023, we saw a continuation
from 2022 of elevated credit spreads across capital markets and changes in consumer credit. Our increased personal loan annualized charge-off rate year over year was reflective of our expectation of credit metrics to revert over time to more normalized levels, but remains healthy, while our higher credit card annualized charge-off rate was reflective of our maturing portfolio. Negative changes to macroeconomic conditions may result in decreased demand for our products, increased operating costs and negatively impact our results of operations.
Fair Value of Loans
We measure our personal loans, student loans has led to discussions of potential legislative and regulatory actions, among other possible steps, to reduce outstanding balances of loans, or cancelhome loans at fair value. During the year ended December 31, 2023, we transferred home loans out of Level 3 and into Level 2 due to an update to pricing sources utilized by third-party valuation specialists, as part of the integration of Wyndham. Other loans do not trade in an active market with readily observable prices and are classified as Level 3.
Our fair value adjustments on loans impact our consolidated results of operations and include adjustments related to loans originated during the period, loans held at the balance sheet date, as well as gains (losses) on loans sold or repurchased during the period. Fair value adjustments made in each reporting period are impacted by factors such as, among others, interest rates, weighted average coupon, credit spreads, actual and estimated losses, prepayment speeds, duration and previous loan sale execution on similar loans. In determining our fair value assumptions, we incorporate recent data impacting the capital markets, as well as factors specific to us. Changes in these factors, either positive or negative, can have a significant scale, including the potential forgiveness of federal student debt. Such actions resulting in forgiveness or cancellation at a meaningful scale would likely have an adversematerial impact on our results of operationsoperations.
The following table summarizes the significant inputs to the fair value model for personal and overall business.student loans:
| | | | | | | | | | | | | | | | | | | | | | | |
| Personal Loans | | Student Loans |
| December 31,
2023 | | September 30,
2023 | | December 31,
2023 | | September 30,
2023 |
Weighted average coupon rate(1) | 13.8 | % | | 13.8 | % | | 5.6 | % | | 5.3 | % |
| Weighted average annual default rate | 4.8 | | | 4.6 | | | 0.6 | | | 0.5 | |
| Weighted average conditional prepayment rate | 23.2 | | | 20.3 | | | 10.5 | | | 10.5 | |
| Weighted average discount rate | 5.5 | | | 6.6 | | | 4.3 | | | 4.8 | |
___________________(1)Represents the average coupon rate on loans held on balance sheet, weighted by unpaid principal balance outstanding at the balance sheet date.
As of the fourth quarter of 2023 relative to the third quarter of 2023, we observed the following trends:
•The weighted average coupon rates on personal loans and student loans increased by 4 bps and 24 bps, respectively, which reflects rate increases passed on to borrowers related to benchmark interest rates increases during the fourth quarter.
•The weighted average discount rates on personal loans and student loans decreased by 103 bps and 57, respectively, as of December 31, 2023 compared to September 30, 2023. For personal loans, our discount rate assumptions decreased in the fourth quarter due to benchmark rates declining by 90 bps, as well as spreads tightening by 13 bps. For student loans, our discount rate assumptions decreased in the fourth quarter due to benchmark rates declining by 86 bps, as well as spreads widening by 29 bps. Spread changes are indicated by asset-backed security and secondary bond markets.
•Annualized net charge-off rates on personal loans and student loans in the fourth quarter of 2023 were 3.98% and 0.59%, respectively, which remained lower than the assumed weighted average default rates in our fair value model of 4.76% and 0.61%, respectively. Our fair value assumption for annual default rate incorporates fair value markdowns on loans beginning when they are 10 days or more delinquent, with additional markdowns at 30 days, 60 days and 90 days past due. For instance, personal loans are marked down on average 70% when the loans are 30 days past due.
The combination of these and other factors resulted in fair value gains recognized on our personal loans and student loans portfolios during the fourth quarter of 2023.
Student Loan Relief
In June 2023, Congress passed the Fiscal Responsibility Act of 2023 which, among other things, ended the suspension of principal and interest payments on federally-held student loans pursuant to the CARES Act passed in 2020, which became effective 60 days after June 30, 2023, as well as prohibits the Secretary of Education from implementing any extension of any
executive action or rule pursuant thereto. Additionally, our business has been,in August 2022, President Biden announced relief measures for federal student loan borrowers, including forgiveness of $10,000 of student loans (or up to $20,000 if student loans are Pell Grants) for anyone earning less than $125,000 annually and certain changes to income-driven repayment plans for student loans (the “Biden Forgiveness Program”). Although the U.S. Supreme Court subsequently struck down the Biden Forgiveness Program, President Biden indicated between October 1, 2023 and September 30, 2024, he would allow federal loan borrowers to not be considered delinquent if they miss a payment and that the U.S. Department of Education will not refer borrowers who fail to pay their student loan bills to credit agencies. In addition, on July 14, 2023, President Biden announced that $39 billion in federal student loan debt would be eliminated to remedy mistakes of loan servicers, and other student loan holders will have their loans adjusted. On October 4, 2023, the Biden Administration approved an additional 125,000 borrowers for student loan debt relief, totaling an additional $9 billion in student debt forgiveness.
While we expect we may continue to be, impacted by somesee an increase in student loan refinancing volume following the end of the nationalfederal student loan payment moratorium after August 30, 2023, as borrowers may look to refinance at a lower rate or, given the high interest rate environment, may look to extend the loan term, the timing and impact to our student loan refinancing product will largely depend on expectations regarding the introduction or implementation of additional relief measures, taken to counteract the economic impact of the COVID-19 pandemic. For example, the CARES Act and subsequent extensions of certain hardship provisions led to decreased demand forinterest rate environment, how competitive our student loan refinancing products amid emerging signs of economic recovery from the pandemic. The Federal Reserve’s actions to reduce interest rates to near-zero benchmark levels during 2020 that were sustained during 2021 led to increased demand for home loan refinancing and we believe increased the attractiveness of our SoFi Invest product, as members looked for alternative ways to earn higher returns on their cash. Conversely, these lower benchmark rates reduced the deposit interest rates we could offer on our SoFi Money product, which we believe adversely impacted demand for the product. In its January 2022 meeting, the Federal Reserve signaled that the first of potentially several interest rate increases could occur in March 2022. We anticipate that in a rising interest rate environment, and operating under a bank charter, we will be able to offer more competitive interest ratesare compared to our members on their deposits, which we believe would result in increasing demand for the product. However, rising interest rates could unfavorably impact demand for all refinancing loan activitiescompetitors and reduce demand across student loans, personal loans and mortgage loans, including but not limited to any variable-rate loan products.
National Bank Charter
A key element of our long-term strategy has been to secure a national bank charter. In February 2022, we closed the Bank Merger and began operating Golden Pacific Bank as SoFi Bank. See “Business Overview—National Bank Charter” and Note 2 to the Notes to Consolidated Financial Statements for additional information on our regulatory approval process and the Bank Merger. In connection with operating a national bank, we have incurred and expect to continue to incur additional costs primarily associated with headcount, technology infrastructure, governance, compliance and risk management, marketing, and other general and administrative expenses.
The key expected financial benefits to us of operating a national bank include: (i) lowering our cost to fund loans, as we can utilize member deposits held at SoFi Bank to fund loans, which have a lower borrowing cost of funds than our current financing model, (ii) holding loans on our consolidated balance sheet for longer periods, thereby enabling us to earn interest on these loans for a longer period, and (iii) supporting origination volume growth by providing an alternative financing option, while also maintaining our warehouse capacity. See Item 1A “Risk Factors” for discussion of certain potential risks related to being a bank holding company.macroeconomic factors.
Key Components of Results of Operations Net Interest Income
InterestNet interest income primarily reflects the excess of interest income earned on our loans over the interest expense incurred to fund such loans. Net interest income is predominantly drivenimpacted by loan origination volume, prevailing interest rates that we receive on the loans we make andlevel of securitization activity, the amount of time we hold loans on our consolidated balance sheet. Securitizationssheet and the volume of member deposits, as well as prevailing interest income is driven byrates, which impact the rates we receive on our loans and securitization-related investments in bonds and residual interest positions, which are required under securitization risk retention rules. See Note 1 toand the Notes to Consolidated Financial Statements for additional information on our securitization-related investments. Beginning in the third quarter of 2021, other interest income also includes the interest earned on investments in available-for-sale (“AFS”) debt securities as well as amortization of premiums and discounts and other basis adjustments associated with the investments. Moreover, we earn other interest income on excess corporate cash balances and SoFi Money member balances. Related party interest income was derived from notes extended to Apex and one of our stockholders, and was not core to our operations. We had no outstanding related party notes as of December 31, 2021.
Interest Expense
Interest expense primarily includes interestrates we incur underfrom our funding sources including our warehouse facilities, inclusive of the amortization of debt issuance costs, and under our securitization debt inclusive of debt issuance costs, premiums and discounts. We incur securitization-related interest expense when securitization transfers do not qualify as true sales pursuant to ASC 810, Consolidation. Securitization-related interest expense fluctuates depending on the level of our securitization activity, market rates and whether and how much such activity results in true sale treatment.member deposits at SoFi Bank. We also incurredincur interest expense related to our revolving credit facility, on the seller note issued in connection with our acquisition of Galileo in May 2020, which was fully
repaid in February 2021, on the other financings assumed in the acquisition, which were repaid in July 2021, as well as on our convertible notes issued in October 2021 in the form of amortization of debt issuance costs and original issue discount.
For our residual interests classified as debt, we recognize interest expense over the expected life using the effective yield method, which represents a portion of the overall fair value change in the residual interests classified as debt. On a quarterly basis, we reevaluate the cash flow estimates to determine if a change to the accretable yield is required on a prospective basis, which is a reclassification between two income statement line items, and therefore has no net impact on earnings. We also pay interest income to our members who have SoFi Money account balances, which is interest expense to us. Interest expense is dependent on market interest rates (such as USD LIBOR, SOFR or other representative alternative reference rates, commercial paper rates, and the prime rate), interest rate spreads versus benchmark rates, the amount of warehouse capacity we can access, warehouse advance rates and the amount of loans we ultimately pledge to our warehouse facilities. Finally, we incur interest on our finance lease liabilities associated with SoFi Stadium, which relate to certain physical signage within the stadium. Our interest expense has historically fluctuated due to changes in the interest rate environment, and we expect it will continue to fluctuate in future periods.
Noninterest Income
Noninterest income primarily consists of: (i) revenue recognized from contracts with customers, which primarily relates to our technology products and solutions revenues and has grown due to our recent acquisitions and the growth and expansion of our financial services offerings, (ii) fair value changes in loans while we hold them on our consolidated balance sheet and our securitization activities, inclusive of our hedging activities; (ii)activities, (iii) gains on sales of loans transferred into the securitization or whole loan sale channels; (iii)channels, (iv) loan origination fees, whereby a borrower may optionally elect to pay origination fees to qualify for a lower annual percentage rate, (v) the income we receive from our loan servicing activities, as well as the assumption of servicing rights from third parties; (iv) fair value changes related to our securitization activities; (v) revenue recognized pursuant to ASC 606, Revenue from Contracts with Customers (“ASC 606”), which primarily relates to our technology platform fees;parties, (vi) realized gains and losses on non-securitization investments, in AFS debt securities, and (vii) gains and losses on non-securitization investments.
When we originate a loan, we generally expect that we will sell the loan for more than its par value, which will result in positive loan origination and sales results. Moreover, noninterest income—loan origination and sales also includes recognized servicing assets at the timeextinguishment of a loan sale. The subsequent measurement of our servicing assets at fair value, as well as the initial and ongoing measurement of servicing rights assumed from third parties, impact noninterest income—servicing in our consolidated statements of operations and comprehensive income (loss). When we sell a loan into a securitization trust that qualifies for true sale accounting, the gain or loss on sale is recorded within noninterest income—loan origination and sales. Noninterest income—securitizations is impacted by fair value changes in securitization loan collateral, which is impacted by the change in fair value of the loan collateral from the previous period end, residual interests classified as debt and our securitization investments associated with our continuing interest in the securitization subsequent to the sale. Our revenue recognized in accordance with ASC 606 is attributable to our Financial Services and Technology Platform segments and has grown due to our acquisitions of Galileo and 8 Limited during 2020, as well as due to the growth and expansion of our financial services offerings.debt.
Noninterest Expense
Noninterest expense primarily relates to the following categories of expenses: (i) technology and product development, (ii) sales and marketing, (iii) cost of operations, and (iv) general and administrative. Certain costs are included within each of these line items, such as compensation and benefits-related expense (inclusive of share-based compensation expense), professional services, depreciation and amortization, and occupancy-related costs. We allocate certain costs to each of these four categories based on department-level headcounts. We generally expect thethese expenses within each such category to increase in absolute dollars as our business continues to grow. Noninterest expense—general and administrativeexpense also includes the fair value changes in warrant liabilities, which will not be incurred in the future as the SoFi Technologies warrants were redeemed in December 2021 and the Series H warrants were reclassified to equity in connection with the Business Combination. Lastly, noninterest expense includes the provision for credit losses, which primarily relates primarily to our credit card product, withinas well as goodwill impairment, related to the Financial Services segment.Galileo and Technisys reporting units.
Directly Attributable Expenses
As presented within “Summary Results by Segment”, in our determination of the contribution profit (loss) for our Lending, Technology Platform and Financial Servicesreportable segments, we allocate certain expenses that are directly attributable to the corresponding segment. Directly attributable expenses primarily include compensation and benefits and sales and marketing, inclusive of member incentives, and vary based on the amount of activity within each segment. Directly attributable expenses also include loan origination and servicing expenses, professional services, product fulfillment and lead generation. Expenses are attributed to the reportable segments using either
direct costs of the segment or labor costs that can be attributed based upon the allocation of employee time for individual products.
Consolidated Results of Operations The following table sets forth selected consolidated statements of income data:
| | | | | | | | | | | | | | | | | | | | | | | | | | | | | | | | | | | | | | | | | | | | |
| | Year Ended December 31, | | 2023 vs. 2022 | | 2022 vs. 2021 |
| ($ in thousands) | | 2023 | | 2022 | | 2021 | | $ Change | | % Change | | $ Change | | % Change |
| Net interest income | | $ | 1,261,740 | | | $ | 584,096 | | | $ | 252,244 | | | $ | 677,644 | | | 116 | % | | $ | 331,852 | | | 132 | % |
| Total noninterest income | | 861,049 | | | 989,439 | | | 732,628 | | | (128,390) | | | (13) | % | | 256,811 | | | 35 | % |
| Total net revenue | | 2,122,789 | | | 1,573,535 | | | 984,872 | | | 549,254 | | | 35 | % | | 588,663 | | | 60 | % |
| Total noninterest expense | | 2,423,947 | | | 1,892,256 | | | 1,466,049 | | | 531,691 | | | 28 | % | | 426,207 | | | 29 | % |
| Loss before income taxes | | (301,158) | | | (318,721) | | | (481,177) | | | 17,563 | | | (6) | % | | 162,456 | | | (34) | % |
| Income tax benefit (expense) | | 416 | | | (1,686) | | | (2,760) | | | 2,102 | | | n/m | | 1,074 | | | (39) | % |
| Net loss | | $ | (300,742) | | | $ | (320,407) | | | $ | (483,937) | | | $ | 19,665 | | | (6) | % | | $ | 163,530 | | | (34) | % |
Net Interest Income
The tables below present average balance and interest information for each major category of interest-earning assets and interest-bearing liabilities, along with net interest income and net interest margin.
Average Balances and Net Interest Earnings Analysis
| | | | | | | | | | | | | | | | | | | | | | | | | | | | | | | | | | | | | | |
| | Year Ended December 31, |
| | 2023 | | 2022 | | 2021 |
| ($ in thousands) | | Average Balances(1) | Interest Income/Expense | Average Yield/Rate | | Average Balances(1) | Interest Income/Expense | Average Yield/Rate | | Average Balances(1) | Interest Income/Expense | Average Yield/Rate |
| Assets | | | | | | | | | | | | |
| Interest-earning assets: | | | | | | | | | | | | |
| Interest-bearing deposits with banks | | $ | 2,172,013 | | $ | 91,312 | | 4.20 | % | | $ | 1,122,364 | | $ | 10,841 | | 0.97 | % | | $ | 706,640 | | $ | 646 | | 0.09 | % |
| Investment securities | | 541,590 | | 25,096 | | 4.63 | | | 494,005 | | 12,542 | | 2.54 | | | 495,444 | | 14,355 | | 2.90 | |
Loans(2) | | 18,733,812 | | 1,934,659 | | 10.33 | | | 9,200,023 | | 749,071 | | 8.14 | | | 5,179,729 | | 337,862 | | 6.52 | |
| Related party receivables | | — | | — | | — | | | — | | — | | — | | | 2,767 | | 211 | | 7.63 | |
| Total interest-earning assets | | 21,447,415 | | 2,051,067 | | 9.56 | | | 10,816,392 | | 772,454 | | 7.14 | | | 6,384,580 | | 353,074 | | 5.53 | |
| Total noninterest-earning assets | | 3,055,580 | | | | | 2,812,054 | | | | | 1,933,759 | | | |
| Total assets | | $ | 24,502,995 | | | | | $ | 13,628,446 | | | | | $ | 8,318,339 | | | |
| Liabilities, Temporary Equity and Permanent Equity | | | | | | | | | | | | |
| Interest-bearing liabilities: | | | | | | | | | | | | |
| Demand deposits | | $ | 2,214,794 | | $ | 51,673 | | 2.33 | % | | $ | 1,336,006 | | $ | 21,814 | | 1.63 | % | | $ | — | | $ | — | | — | % |
| Savings deposits | | 8,481,895 | | 359,444 | | 4.24 | | | 1,403,750 | | 31,045 | | 2.21 | | | — | | — | | — | |
| Time deposits | | 1,958,002 | | 96,703 | | 4.94 | | | 281,633 | | 6,934 | | 2.46 | | | — | | — | | — | |
| Total interest-bearing deposits | | 12,654,691 | | 507,820 | | 4.01 | | | 3,021,389 | | 59,793 | | 1.98 | | | — | | — | | — | |
| Warehouse facilities | | 3,142,096 | | 192,987 | | 6.14 | | | 2,378,935 | | 71,717 | | 3.01 | | | 2,043,085 | | 29,596 | | 1.45 | |
| Securitization debt | | 751,869 | | 36,853 | | 4.90 | | | 593,824 | | 22,507 | | 3.79 | | | 931,476 | | 35,576 | | 3.82 | |
Other debt(3) | | 1,638,748 | | 51,526 | | 3.14 | | | 1,575,027 | | 30,618 | | 1.94 | | | 773,159 | | 27,458 | | 3.55 | |
| Total debt | | 5,532,713 | | 281,366 | | 5.09 | | | 4,547,786 | | 124,842 | | 2.75 | | | 3,747,720 | | 92,630 | | 2.47 | |
| Residual interests classified as debt | | 12,301 | | 141 | | 1.15 | | | 57,510 | | 3,723 | | 6.47 | | | 106,990 | | 8,200 | | 7.66 | |
| Total interest-bearing liabilities | | 18,199,705 | | 789,327 | | 4.34 | | | 7,626,685 | | 188,358 | | 2.47 | | | 3,854,710 | | 100,830 | | 2.62 | |
| Total noninterest-bearing liabilities | | 757,070 | | | | | 657,314 | | | | | 602,994 | | | |
| Total liabilities | | 18,956,775 | | | | | 8,283,999 | | | | | 4,457,704 | | | |
| Total temporary equity | | 320,374 | | | | | 320,374 | | | | | 1,637,173 | | | |
| Total permanent equity | | 5,225,846 | | | | | 5,024,073 | | | | | 2,223,462 | | | |
| Total liabilities, temporary equity and permanent equity | | $ | 24,502,995 | | | | | $ | 13,628,446 | | | | | $ | 8,318,339 | | | |
| | | | | | | | | | | | |
Net interest income(4) | | | $ | 1,261,740 | | | | | $ | 584,096 | | | | | $ | 252,244 | | |
Net interest margin(5) | | | | 5.88 | % | | | | 5.40 | % | | | | 3.95 | % |
___________________(1)Average balances were calculated on daily carrying balances for the 2023 period, and on thirteen-month ending carrying balances for the 2022 and 2021 periods, as the daily analysis in the prior periods would have involved undue burden. Both average calculations are representative of our operations.
(2)Interest income on loans measured at amortized cost for the 2022 and 2021 periods includes amortization of deferred loan fees, net of deferred loan costs, which were not material.
(3)Interest expense on other debt primarily includes debt issuance and discount expense, as well as interest expense on the revolving credit facility and seller note, which was repaid in early 2021.
(4)Net interest income is calculated as the excess of total interest income on interest-earning assets over total interest expense on interest-bearing liabilities.
(5)Net interest margin is calculated as net interest income divided by total average interest-earning assets.
2023 vs. 2022. Net interest income increased by $677.6 million, or 116%, during the year ended December 31, 2023 compared to the year ended December 31, 2022, and net interest margin increased by 48 basis points. The increases were primarily driven by higher interest income from (i) personal loans, which was primarily a function of increases in the average balance and origination volume, as well as longer loan holding periods for both personal and student loans, and (ii) interest-
Resultsbearing deposits with banks, which reflected our strong liquidity position in a rising interest rate environment. Average interest-earning assets increased by 98%, and average yields increased by 242 basis points.
These increases were partially offset by higher interest expense on deposits attributable to a higher average balance and higher interest rates offered to our members, and higher interest expense on warehouse facilities attributable to a higher average balance and higher interest rates incurred on our facilities, all of Operations
The following table sets forth consolidated statementswhich are reflective of income data for the years indicated:
| | | | | | | | | | | | | | | | | | | | | | | | | | | | | | | | |
| | Year ended December 31, | | 2021 vs. 2020 % Change | | 2020 vs. 2019 % Change |
| ($ in thousands) | | 2021 | | 2020 | | 2019 | | |
| Interest income | | | | | | | | | | |
| Loans | | $ | 337,862 | | | $ | 330,353 | | | $ | 570,466 | | | 2 | % | | (42) | % |
| Securitizations | | 14,109 | | | 24,031 | | | 23,179 | | | (41) | % | | 4 | % |
| Related party notes | | 211 | | | 3,189 | | | 3,338 | | | (93) | % | | (4) | % |
| Other | | 2,838 | | | 5,964 | | | 11,210 | | | (52) | % | | (47) | % |
| Total interest income | | 355,020 | | | 363,537 | | | 608,193 | | | (2) | % | | (40) | % |
| Interest expense | | | | | | | | | | |
| Securitizations and warehouses | | 90,485 | | | 155,150 | | | 268,063 | | | (42) | % | | (42) | % |
| Corporate borrowings | | 10,345 | | | 27,974 | | | 4,962 | | | (63) | % | | 464 | % |
| Other | | 1,946 | | | 2,482 | | | 5,334 | | | (22) | % | | (53) | % |
| Total interest expense | | 102,776 | | | 185,606 | | | 278,359 | | | (45) | % | | (33) | % |
| Net interest income | | 252,244 | | | 177,931 | | | 329,834 | | | 42 | % | | (46) | % |
| Noninterest income | | | | | | | | | |
|
| Loan origination and sales | | 497,626 | | | 371,323 | | | 299,265 | | | 34 | % | | 24 | % |
| Securitizations | | (14,862) | | | (70,251) | | | (199,125) | | | (79) | % | | (65) | % |
| Servicing | | (2,281) | | | (19,426) | | | 8,486 | | | (88) | % | | (329) | % |
| Technology platform fees | | 191,847 | | | 90,128 | | | — | | | 113 | % | | n/m |
| Other | | 60,298 | | | 15,827 | | | 4,199 | | | 281 | % | | 277 | % |
| Total noninterest income | | 732,628 | | | 387,601 | | | 112,825 | | | 89 | % | | 244 | % |
| Total net revenue | | 984,872 | | | 565,532 | | | 442,659 | | | 74 | % | | 28 | % |
| Noninterest expense | | | | | | | | | |
|
| Technology and product development | | 276,087 | | | 201,199 | | | 147,458 | | | 37 | % | | 36 | % |
| Sales and marketing | | 426,875 | | | 276,577 | | | 266,198 | | | 54 | % | | 4 | % |
| Cost of operations | | 256,980 | | | 178,896 | | | 116,327 | | | 44 | % | | 54 | % |
| General and administrative | | 498,534 | | | 237,381 | | | 152,275 | | | 110 | % | | 56 | % |
| Provision for credit losses | | 7,573 | | | — | | | — | | | n/m | | n/m |
| Total noninterest expense | | 1,466,049 | | | 894,053 | | | 682,258 | | | 64 | % | | 31 | % |
| Loss before income taxes | | (481,177) | | | (328,521) | | | (239,599) | | | 46 | % | | 37 | % |
| Income tax (expense) benefit | | (2,760) | | | 104,468 | | | (98) | | | (103) | % | | n/m |
| Net loss | | $ | (483,937) | | | $ | (224,053) | | | $ | (239,697) | | | 116 | % | | (7) | % |
| Other comprehensive loss | | | | | | | | | |
|
| Unrealized losses on available-for-sale securities, net | | $ | (1,351) | | | $ | — | | | $ | — | | | n/m | | n/m |
| Foreign currency translation adjustments, net | | 46 | | | (145) | | | (9) | | | (132) | % | | n/m |
| Total other comprehensive loss | | (1,305) | | | (145) | | | (9) | | | 800 | % | | n/m |
| Comprehensive loss | | $ | (485,242) | | | $ | (224,198) | | | $ | (239,706) | | | 116 | % | | (6) | % |
88
Year Ended December 31, 2021 Compared to Year Ended December 31, 2020
Interest Income
The following table presents the components of our totalNet interest income for the years indicated:
| | | | | | | | | | | | | | | | | | | | | | | | | | |
| | Year Ended December 31, | | | | |
| ($ in thousands) | | 2021 | | 2020 | | $ Change | | % Change |
| Loans | | $ | 337,862 | | | $ | 330,353 | | | $ | 7,509 | | | 2 | % |
| Securitizations | | 14,109 | | | 24,031 | | | (9,922) | | | (41) | % |
| Related party notes | | 211 | | | 3,189 | | | (2,978) | | | (93) | % |
| Other | | 2,838 | | | 5,964 | | | (3,126) | | | (52) | % |
Total interest income | | $ | 355,020 | | | $ | 363,537 | | | $ | (8,517) | | | (2) | % |
Total interest income decreasedincreased by $8.5$331.9 million, or 2%132%, forduring the year ended December 31, 20212022 compared to the year ended December 31, 2020 due to the following:
Loans. Loans interest income increased by $7.5 million, or 2%,2021, primarily driven by increases inhigher interest income from non-securitization personal loan and student loan interest income of $67.8 million (71%) and $16.5 million (22%), respectively,loans, which were primarily a function of increases in average balances, for personal loans and student loans of $657.5 million (74%) and $611.9 million (39%), respectively. Thehigher personal loan average balance increase was primarily attributable to higher origination volume. The student loan average balance increase was primarily attributable tovolume and longer loan holding periods, partially offset by lower origination volume. The student loan interest income was also negatively impacted by lower loan coupon rates. Theperiods. This increase from non-securitization loan interest income was partially offset by a decline of $81.4 million ininterest expense on deposits at SoFi Bank during 2022, and lower interest income from consolidated personal loan and student loan securitizations, which were impacted by an aggregate $1.0 billion (49%) declinedecreases in average balances primarily attributable to payment activity and the deconsolidationabsence of two VIEs in March 2020 and one VIE in July 2020. The remaining increase in loans interest income primarily included $3.7 million attributableadditions to credit card loans, which launched in the third quarter of 2020, and $1.0 million attributable to home loans.
Securitizations. Securitizations interest income decreased by $9.9 million, or 41%, which was primarily attributable to decreases in residual investment interest income of $4.1 million and asset-backed bonds of $4.4 million, due primarily to decreases in average securitization investment balances year over year, as securitization payments outpaced new securitization investments. We also had a decrease in securitization float interest income of $1.4 million related to decreases in averageour consolidated securitization loan balances and a decline inbalances.
Net interest rates year over year.
Related Party Notes. Related party notes interest income decreasedmargin increased by $3.0 million, or 93%, due to the absence of interest income on a stockholder loan and a decrease in interest income related to our loans to Apex, as the Apex loans were fully settled in February 2021.
Other. Other interest income decreased by $3.1 million, or 52%, primarily due to interest rate decreases period over period that impacted the interest income we earned on both our interest-bearing cash and cash equivalents balances and Member Bank deposits. For cash and cash equivalents, this impact was combined with a lower average balance year over year, while the impact on Member Bank deposits was partially offset by a higher average balance year over year. In addition, this variance was partially offset by interest income of $0.2 million earned on our investments in AFS debt securities in 2021.
Interest Expense
The following table presents the components of our total interest expense for the years indicated:
| | | | | | | | | | | | | | | | | | | | | | | | | | |
| | Year Ended December 31, | | | | |
| ($ in thousands) | | 2021 | | 2020 | | $ Change | |
% Change |
| Securitizations and warehouses | | $ | 90,485 | | | $ | 155,150 | | | $ | (64,665) | | | (42) | % |
| Corporate borrowings | | 10,345 | | | 27,974 | | | (17,629) | | | (63) | % |
| Other | | 1,946 | | | 2,482 | | | (536) | | | (22) | % |
Total interest expense | | $ | 102,776 | | | $ | 185,606 | | | $ | (82,830) | | | (45) | % |
Total interest expense decreased by $82.8 million, or 45%, for145 basis points during the year ended December 31, 20212022 compared to the year ended December 31, 2020, due2021, primarily driven by higher interest-earning assets at higher average yields, particularly related to the following:non-securitization loans, partially offset by higher interest rates paid on warehouse facilities and interest-bearing deposits used to fund our loan originations.
Securitizations and Warehouses.Analysis of Changes in Net Interest Income
The following tables presenttable presents year-over-year changes in net interest income and the componentsextent to which the variances are attributable to changes in the volume of securitizationsour interest-earning assets and warehousesinterest-bearing liabilities or changes in the interest expenserates related to these assets and other pertinent information.liabilities:
| | | | | | | | | | | | | | | | | | | | | | | | | | |
| | Year Ended December 31, | | | | |
| ($ in thousands) | | 2021 | | 2020 | | $ Change | | % Change |
| Securitization debt interest expense | | $ | 35,576 | | | $ | 66,110 | | | $ | (30,534) | | | (46) | % |
| Warehouse debt interest expense | | 29,596 | | | 51,983 | | | (22,387) | | | (43) | % |
| Residual interests classified as debt interest expense | | 8,200 | | | 12,678 | | | (4,478) | | | (35) | % |
Debt issuance cost interest expense(1) | | 17,113 | | | 24,379 | | | (7,266) | | | (30) | % |
Securitizations and warehouses interest expense | | $ | 90,485 | | | $ | 155,150 | | | $ | (64,665) | | | (42) | % |
| | | | | | | | | | | | | | | | | | | | | | | | | | | | | | | | | | | | | | |
| | 2023 vs. 2022 | | 2022 vs. 2021 |
| | Increase (Decrease) Due to Change in(1): | | Increase (Decrease) Due to Change in(1): |
| ($ in thousands) | | Volume | | Rate | | Total Variance | | Volume | | Rate | | Total Variance |
| Interest income: | | | | | | | | | | | | |
| Interest-bearing deposits with banks | | $ | 44,128 | | | $ | 36,343 | | | $ | 80,471 | | | $ | 4,016 | | | $ | 6,179 | | | $ | 10,195 | |
| Investment securities | | 2,205 | | | 10,349 | | | 12,554 | | | (37) | | | (1,776) | | | (1,813) | |
| Loans | | 984,564 | | | 201,024 | | | 1,185,588 | | | 327,335 | | | 83,874 | | | 411,209 | |
| Related party receivables | | — | | | — | | | — | | | — | | | (211) | | | (211) | |
| Total interest income | | $ | 1,030,897 | | | $ | 247,716 | | | $ | 1,278,613 | | | $ | 331,314 | | | $ | 88,066 | | | $ | 419,380 | |
| | | | | | | | | | | | |
| Interest expense: | | | | | | | | | | | | |
| Interest-bearing deposits | | $ | 386,575 | | | $ | 61,452 | | | $ | 448,027 | | | $ | 59,793 | | | $ | — | | | $ | 59,793 | |
| Debt | | 50,088 | | | 106,436 | | | 156,524 | | | 21,963 | | | 10,249 | | | 32,212 | |
| Residual interests classified as debt | | (519) | | | (3,063) | | | (3,582) | | | (3,203) | | | (1,274) | | | (4,477) | |
| Total interest expense | | $ | 436,144 | | | $ | 164,825 | | | $ | 600,969 | | | $ | 78,553 | | | $ | 8,975 | | | $ | 87,528 | |
Net interest income | | $ | 594,753 | | | $ | 82,891 | | | $ | 677,644 | | | $ | 252,761 | | | $ | 79,091 | | | $ | 331,852 | |
___________________(1)Debt issuance cost interest expense excludes the acceleration of debt issuance costs of $4.2 million during the year ended December 31, 2020 associated with the deconsolidation of VIEs, which is reported within noninterest income—securitizations in the consolidated statements of operations and comprehensive income (loss).
| | | | | | | | | | | | | | | | | | | | |
| | Year Ended December 31, | | |
| ($ in thousands) | | 2021 | | 2020 | | % Change |
Average debt balances(1) | | | | | | |
| Securitization debt | | $ | 903,902 | | | $ | 1,794,758 | | | (50) | % |
| Warehouse facilities | | 1,972,184 | | | 2,266,694 | | | (13) | % |
Weighted average interest rates(1)(2) | | | | | | |
| Securitization debt | | 3.9 | % | | 3.7 | % | | n/m |
| Warehouse facilities | | 1.5 | % | | 2.3 | % | | n/m |
___________________(1)Table excludes residual interests classified as debt, as interest expense is dependent on the timing and extent of securitization loan cash flows and, therefore, a derived weighted average interest rate using the methodology in the table herein is not meaningful for the purposes of understandingWe calculate the change in residual interests classified as debt related interest expense.
(2)Calculated as annualizedincome and interest expense divided by average debt balanceseparately for each item. Volume and rate changes have been allocated on a consistent basis using the respective debt category. Interest rates on securitization debt and warehouse facilities exclude the effect of debt issuance cost interest expense and amortization of debt discounts and premiums.
Securitizations and warehouses interest expense decreased by $64.7 million, or 42%, for the year ended December 31, 2021 compared to the year ended December 31, 2020, driven by the following:
•Securitization debt interest expense (exclusive of debt issuance and discount amortization) decreased by $30.5 million (46%), primarily driven by a declinepercentage changes in average balance of 50%, which was attributable to payment activity during the yearbalances and the deconsolidation of securitizations discussed within the “Interest Income” section. The impact of the year over year decrease in one-month LIBOR, which primarily affects our student loan securitization debt, was more than offset by payoffs of debt with lower interest rates, which raised the overall weighted average interest rate.
•Warehouse debt interest expense (exclusive of debt issuance amortization) decreased by $22.4 million, which was primarily related to decreases in reference rates year over year and lower warehouse facility interest rate spreads, as well as a 13% lower average warehouse debt balance outstanding in 2021, which was enabled by our other financing activities during 2021.
•Residual interests classified as debt interest expense decreased by $4.5 million, which was correlated with a lower balance of residual interests classified as debt during 2021, a significant driver of which was the deconsolidation of two securitizations in March 2020 and one securitization in July 2020, in combination with no consolidations of VIEs during 2021.
•Debt issuance cost interest expense decreased by $7.3 million, which was primarily driven by a lower run rate on our issuance cost amortization related to our loan warehouse facilities, as we extended certain loan warehouse facilities, which had the effect of lowering the quarterly debt issuance cost amortization. The variance was also impacted by a decrease in the acceleration of debt issuance costs in 2021 compared to 2020.rates.
Loan Maturity Schedule
The following table presents the maturities of our loan portfolio, as well as the separate presentation of the total amount of loans in each loan category that are due after one year that have variable rates and fixed rates:
| | | | | | | | | | | | | | | | | | | | | | | | | | | | | | | | |
| | As of December 31, 2023(1) |
| ($ in thousands) | | Within 1 year | | After 1 year through 5 years | | After 5 years through 15 years | | After 15 years | | Total |
| Loan Portfolio: | | | | | | | | | | |
| Personal loans | | $ | 229,827 | | | $ | 11,758,548 | | | $ | 2,510,254 | | | $ | — | | | $ | 14,498,629 | |
| Student loans | | 10,153 | | | 988,168 | | | 3,984,745 | | | 1,462,520 | | | 6,445,586 | |
| Home loans | | — | | | — | | | — | | | 67,406 | | | 67,406 | |
| Senior secured loans | | — | | | 445,733 | | | — | | | — | | | 445,733 | |
Credit card(2) | | 319,694 | | | — | | | — | | | — | | | 319,694 | |
| Commercial and consumer banking | | 1,565 | | | 2,447 | | | 12,709 | | | 102,242 | | | 118,963 | |
| Total loans | | $ | 561,239 | | | $ | 13,194,896 | | | $ | 6,507,708 | | | $ | 1,632,168 | | | $ | 21,896,011 | |
| Loans with variable rates: | | | | | | | | | | |
| Personal loans | | $ | 2,035 | | | $ | — | | | $ | — | | | $ | 2,035 | |
| Student loans | | 18,906 | | | 80,526 | | | 9,769 | | | 109,201 | |
| | | | | | | | |
| | | | | | | | |
| | | | | | | | |
| Commercial and consumer banking | | 679 | | | 5,532 | | | 97,070 | | | 103,281 | |
| Total loans | | $ | 21,620 | | | $ | 86,058 | | | $ | 106,839 | | | $ | 214,517 | |
| Loans with fixed rates: | | | | | | | | | | |
| Personal loans | | $ | 11,756,513 | | | $ | 2,510,254 | | | $ | — | | | $ | 14,266,767 | |
| Student loans | | 969,262 | | | 3,904,219 | | | 1,452,751 | | | 6,326,232 | |
| Home loans | | — | | | — | | | 67,406 | | | 67,406 | |
| Senior secured loans | | 445,733 | | | — | | | — | | | 445,733 | |
| | | | | | | | |
| Commercial and consumer banking | | 1,768 | | | 7,177 | | | 5,172 | | | 14,117 | |
| Total loans | | $ | 13,173,276 | | | $ | 6,421,650 | | | $ | 1,525,329 | | | $ | 21,120,255 | |
Corporate Borrowings.__________________(1) Corporate borrowings interest expense decreased by $17.6 million, or 63%, forMaturities presented are based upon the year ended December 31, 2021 comparedcontractual terms of the loans. Amounts represent unpaid principal balance of loans outstanding at period end.
(2)Due to the year ended December 31, 2020, primarilyrevolving nature of credit cards, we report all of our credit card balances as due to the following:
•Interest expense incurred on the Galileo seller note, which was issued in May 2020 and repaid in February 2021, decreased by $18.6 million. In 2020, we incurred imputed interest during the six-month interest-free period, followed by incremental interest at the note’s stated rate when the promotional period lapsed and we did not pay off the Galileo seller note. Comparatively, in 2021 we incurred interest at the Galileo seller note’s stated rate through its repayment in February 2021.
•Interest expense on the revolving credit facility decreased by $0.2 million, which reflected a decline in one-month LIBOR year over year, partially offset by a higher average balance in 2021, as we drew $325.0 million on the facility during the second quarter of 2020.
•These decreases were partially offset by interest expense of $1.2 million associated with our issuance of convertible notes in the fourth quarter of 2021, which consisted of the amortization of the debt discount and debt issuance costs.
Other. Other interest expense decreased by $0.5 million, or 22%, for the year ended December 31, 2021 compared to the year ended December 31, 2020, primarily due to the following:
•Interest expense related to our SoFi Money product decreased by $0.8 million, primarily attributable to lower weighted average interest rates offered to members, which was partially offset by an increase in cash balances in member SoFi Money accounts.
•Interest expense related to our finance leases increased by $0.3 million, primarily due to a full year of expense in 2021, as we entered into the arrangement in September 2020.within one year.
Noninterest Income and Net Revenue
The following table presents the components of our total noninterest income, as well as total net revenue for the years indicated:revenue:
| | | | Year Ended December 31, | | | | Year Ended December 31, | | 2023 vs. 2022 | | 2022 vs. 2021 |
| ($ in thousands) | ($ in thousands) | | 2021 | | 2020 | | $ Change | | % Change | ($ in thousands) | | 2023 | | 2022 | | 2021 | | $ Change | | % Change | | $ Change | | % Change |
| Loan origination and sales | | $ | 497,626 | | | $ | 371,323 | | | $ | 126,303 | | | 34 | % |
| Securitizations | | (14,862) | | | (70,251) | | | 55,389 | | | (79) | % |
| | Loan origination, sales, and securitizations | |
| | Loan origination, sales, and securitizations | |
| | Loan origination, sales, and securitizations | | | $ | 371,812 | | | $ | 565,372 | | | $ | 482,764 | | | $ | (193,560) | | | (34) | % | | $ | 82,608 | | | 17 | % |
| Servicing | Servicing | | (2,281) | | | (19,426) | | | 17,145 | | | (88) | % | Servicing | | 37,328 | | | 43,547 | | 43,547 | | | (2,281) | | (2,281) | | | (6,219) | | (6,219) | | | (14) | | (14) | | | 45,828 | | 45,828 | | | n/m | | n/m |
| Technology platform fees | | 191,847 | | | 90,128 | | | 101,719 | | | 113 | % |
| Technology products and solutions | |
| Other | Other | | 60,298 | | | 15,827 | | | 44,471 | | | 281 | % |
Total noninterest income | Total noninterest income | | $ | 732,628 | | | $ | 387,601 | | | $ | 345,027 | | | 89 | % |
Total net revenue | Total net revenue | | $ | 984,872 | | | $ | 565,532 | | | $ | 419,340 | | | 74 | % | Total net revenue | | $ | 2,122,789 | | | $ | | $ | 1,573,535 | | | $ | | $ | 984,872 | | | $ | | $ | 549,254 | | | 35 | | 35 | % | | $ | 588,663 | | | 60 | | 60 | % |
2023 vs. 2022. Total noninterest income increaseddecreased by $345.0$128.4 million, or 89%13%, for the year ended December 31, 20212023 compared to the year ended December 31, 2020, due to the following:
Loan Origination and Sales. Loan origination and sales increased by $126.3 million, or 34%, year over year, which was primarily related to the following:
•an increase of $187.0 million in personal loan origination and sales income,2022, which was primarily attributable toto: (i) higher personal loan write-offs in 2023, (ii) higher origination volumefees primarily related to a new product feature offered on personal loans, whereby a borrower may optionally elect to pay origination fees to qualify for a lower annual percentage rate, (iii) the net effect of higher income related to in period originations, loan sale execution and higher sales activity during 2021 combined with increased fair value adjustments at the end of 2021, as well as aon loans and securitization loans, which were primarily impacted by higher personal loan purchase price earn-out derivative position in 2021. We also had higher gains on our personal loan economic hedging activities;
•a decrease of $7.7 million inorigination volume, lower student loan originationprepayment assumptions, and sales income, netan increase in securitization loan fair market values primarily associated with a consolidated securitization transaction in the first quarter of a gain2023, partially offset by losses in 2023 compared to gains in 2022 on related student loan commitments. The student loan decrease was primarily attributablehedging and risk retention hedge activities due to lower origination volume and lower sales activity during 2021 at lower execution prices combined with decreased fair value adjustments at the end of 2021. The execution prices and fair value marks were impacted by lowersmaller increases in interest rates offeredduring the 2023 period, (iv) growth in 2021. These student loan decreases weretechnology products and solutions fees largely offset by gains on our student loan economic hedging activities;
•a $22.3 million gain on credit default swaps in 2020 that did not recur in 2021;
•a decrease of $19.4 million in home loan origination and sales related income, net of hedges and related IRLCs (exclusive of home loan origination fees), of which $19.0 million was attributable to lower sales execution and lowerdriven
home loan valuations despite higher originationby revenue contribution from Technisys for the full period in 2023, (v) increased interchange revenue, and sales volumes. The variance also reflected a decrease(vi) gain on extinguishment of $26.4 million associated with IRLCs that was correlated with a decline in the home loan pipeline and pricing in 2021 compared to significant increases in the home loan pipeline and pricingdebt during 2020. The decrease in IRLCs was largely offset2023.
2022 vs. 2021. Total noninterest income increased by a $26.0 million increase in home loan pipeline hedge values, which corresponded with a decline in home loan prices during 2021; and
•an increase of $2.9 million in home loan origination fees in conjunction with a 36% increase in origination volume.
Securitizations. Securitizations income improved by $55.4$256.8 million, or 79%35%, primarily due to an aggregate increase of $31.7 million year over year in securitization loan fair market value changes, principally due to the significantly improved economic environment during 2021 relative to 2020, when the impacts of the COVID-19 pandemic were more pronounced. Additionally, we experienced a reduction in securitization loan write-offs of $27.3 million in 2021, which was correlated with the deconsolidation of securitizations in 2020, stronger securitization loan credit performance and lower average securitization loan balances during 2021. Additionally, we had losses from deconsolidations of $14.7 million during 2020 and no corresponding losses in 2021. Finally, we had a positive variance in our securitization residual interest investments of $5.1 million.
Partially offsetting these effects was an unfavorable variance in residual debt fair value of $14.3 million year over year, which was correlated with underlying securitization performance and residual interest positions representing a greater percentage of securitization claims year over year. We also had a decline in bond fair values of $8.5 million year over year, which was primarily attributable to positive fair value adjustments in the second and third quarters of 2020 due to increased bond pricing following a resurgence in market demand for securitization bonds. Subsequent to those quarters and through 2021, we had negative fair value adjustments due to realized interest income cash flows (realized cash flows lower bond fair values and increase interest income by the amount realized during the period) and, therefore, realized interest income, which lowers bond fair values, had no net impact on earnings.
The table below presents additional information related to loan gains and losses and overall performance:
| | | | | | | | | | | | | | | | | | | | | | | | | | |
| | Year Ended December 31, | | | | |
| ($ in thousands) | | 2021 | | 2020 | | $ Change | | % Change |
| Gains from non-securitization loan transfers | | $ | 272,967 | | | $ | 259,451 | | | $ | 13,516 | | | 5 | % |
Gains from loan securitization transfers(1) | | 117,451 | | | 129,855 | | | (12,404) | | | (10) | % |
Economic derivative hedges of loan fair values(2) | | 49,090 | | | (54,829) | | | 103,919 | | | (190) | % |
Home loan origination fees(3) | | 14,452 | | | 11,576 | | | 2,876 | | | 25 | % |
Loan write-off expense – whole loans(4) | | (17,440) | | | (5,873) | | | (11,567) | | | 197 | % |
Loan write-off expense – securitization loans(5) | | (11,357) | | | (38,621) | | | 27,264 | | | (71) | % |
Loan repurchase expense(6) | | (3,117) | | | (342) | | | (2,775) | | | 811 | % |
___________________
(1)Represents the gains recognized on loan securitization transfers qualifying for sale accounting treatment. For the year ended December 31, 2020, the gains are exclusive of deconsolidation losses of $14.7 million. There were no deconsolidation losses during the year ended December 31, 2021.
(2)During2022 compared to the year ended December 31, 2021, we had gains of $42.7 million on interest rate swap positions primarily driven by loan hedging activities due to higher interest rates since the start of 2021. We also had gains of $6.5 million on home loan pipeline hedges primarily due to decreases in the underlying hedge price index during the year. During the year ended December 31, 2020, we had losses of $57.5 million on interest rate swap positions primarily due to significant declines in interest rates amid the COVID-19 pandemic. We also had losses of $19.5 million on home loan pipeline hedges primarily due to increases in the underlying hedge price index during the year. These losses were2022, partially offset by gains on our credit default swaps of $22.3 million during 2020. Amounts presented herein exclude IRLCs and student loan commitments, as they are not economic hedges of loan fair values.
(3)For the year ended December 31, 2021, these increases were correlated with a 36% increase in home loan origination volumes relative to 2020.
(4)For the years ended December 31, 2021 and 2020, includes gross write-offs of $27.6 million and $17.1 million, respectively. During 2021, $2.8 million of the $10.1 million of recoveries were captured via loan sales to a third-party collection agency. During 2020, $3.6 million of the $11.2 million of recoveries were captured via loan sales to a third-party collection agency.
(5)For the years ended December 31, 2021 and 2020, includes gross write-offs of $21.2 million and $54.7 million, respectively. During 2021, $2.4 million of the $9.8 million of recoveries were captured via loan sales to a third-party collection agency. During 2020, $7.2 million of the $16.1 million of recoveries were captured via loan sales to a third-party collection agency.
(6)Represents the expense associated with our estimated loan repurchase obligation. See Note 16 to the Notes to Consolidated Financial Statements for additional information.
Servicing. Servicinglower income increased by $17.1 million, or 88%, which was primarily related to in period originations, loan sale execution and fair value changes in our servicing assets that were largely attributable to a lower rate of increase in servicing asset prepayment speed assumptions in 2021 relative to 2020, and a decrease in the discount rate for homeadjustments on loans, as well as higher loan servicing assets during 2021. The home loan
servicing asset discount rate decline was informed from market trends which demonstrated stronger demand (lower required yields) for the home loan servicing asset class during 2021 as compared to during 2020.
We own the master servicing on all of the servicing rights that we retain and, in each case, recognize the gross servicing rate applicable to each serviced loan. Sub-servicers are utilized for all serviced student loans and home loans, which represents a cost to SoFi, but these arrangements do not impact our calculation of the weighted average basis points earned for each loan type serviced. Further, there is no impact on servicing income due to forbearance and moratoriums on certain debt collection activities, and there are no waivers of late fees. The table below presents additional information related to our loan servicing activities:
| | | | | | | | | | | | | | | | | | | | | | | | | | |
| | Year Ended December 31, | | | | |
| ($ in thousands) | | 2021 | | 2020 | | $ Change | | % Change |
| Servicing income recognized | | | | | | | | |
Home loans(1) | | $ | 8,975 | | | $ | 4,651 | | | $ | 4,324 | | | 93 | % |
Student loans(2) | | 46,519 | | | 50,491 | | | (3,972) | | | (8) | % |
Personal loans(3) | | 34,093 | | | 42,646 | | | (8,553) | | | (20) | % |
| Servicing rights fair value change | | | | | | | | |
Home loans(4) | | $ | 26,619 | | | $ | 10,733 | | | $ | 15,886 | | | 148 | % |
Student loans(5) | | (10,634) | | | (37,945) | | | 27,311 | | | (72) | % |
Personal loans(6) | | 2,677 | | | (24,809) | | | 27,486 | | | (111) | % |
______________(1)The contractual servicing earned on our home loan portfolio was 25 bps during the years ended December 31, 2021 and 2020.
(2)The weighted average bps earned for student loan servicing during the years ended December 31, 2021 and 2020 was 43 bps and 37 bps, respectively.
(3)The weighted average bps earned for personal loan servicing during the years ended December 31, 2021 and 2020 was 71 bps and 74 bps, respectively.
(4)The impact on the fair value change resulting from changes in valuation inputs and assumptions was $4.3 million and $(5.1) million during the years ended December 31, 2021 and 2020, respectively.
(5)The impact of the fair value change resulting from changes in valuation inputs and assumptions was $(16.2) million and $(20.2) million during the years ended December 31, 2021 and 2020, respectively. In addition, the impact of the fair value change resulting from the derecognition of servicing due to loan purchases was $(0.4) million and $(12.9) million during the years ended December 31, 2021 and 2020, respectively.
(6)The impact of the fair value change resulting from changes in valuation inputs and assumptions was $9.2 million and $7.8 million during the years ended December 31, 2021 and 2020, respectively. In addition, the impact of the fair value change resulting from the derecognition of servicing due to loan purchases was $(0.7) million and $(0.9) million during the years ended December 31, 2021 and 2020, respectively.
Technology Platform Fees. Technology platform fees earned by Galileo, which do not include fees earned from SoFi (as they are eliminated in consolidation), increased by $101.7 million, or 113%, in part due to a partial period of earnings in 2020, as we acquired Galileo on May 14, 2020. The increased fees were predominantly driven by growth from existing clients.
Other. Other income increased by $44.5 million, or 281%, primarily driven by increases in brokerage-related revenues of $19.3 million, payment network fees of $8.2 million and referral fees of $9.9 million. The brokerage-related fees earned during 2021 were primarily attributable to increased digital assets activities and were also positively impacted by our acquisition of 8 Limited in the second quarter of 2020, inclusive of a monthly platform fee that is charged to our SoFi Hong Kong members and was introduced in the fourth quarter of 2021.write offs. The increase in payment network fees (which includes interchange fees) was directly correlated with increased credit card spending (which was a product launched in the second half of 2020) and debit card transactions on our platform, in addition to the impact from the acquisition of Galileo in the second quarter of 2020. Lastly, the increase in referral fees was primarilyalso attributable to growth in technology products and solutions fees driven by account growth and increased activity among our partner relationships and related activity, as we continue to onboard new partners and help drive volume to our partners, as well as an increase associatedexisting integrated technology solutions clients combined with a referral fulfillment arrangement we entered intorevenue contribution from the Technisys Merger in the third quarter of 2021.2022.
Additionally, we had earnings from a historical period venture capital investment of $4.0 million in 2021 (for which we sold a portion of the investment during 2021). For another privately-held investment, we had earnings from an upward adjustment of $0.7 million in 2021 compared to a loss of $0.8 million in 2020. Finally, we had additional new sources of revenue in 2021 consisting of equity capital markets revenues of $2.6 million and advisory services of $2.6 million. These gains were primarily offset by a $4.6 million decrease in equity method income, primarily resulting from our equity method investment in Apex, which was called in the first quarter of 2021.
Noninterest Expense
The following table presents the components of our total noninterest expense for the years indicated:expense:
| | | | Year Ended December 31, | | | | Year Ended December 31, | | 2023 vs. 2022 | | 2022 vs. 2021 |
| ($ in thousands) | ($ in thousands) | | 2021 | | 2020 | | $ Change | | % Change | ($ in thousands) | | 2023 | | 2022 | | 2021 | | $ Change | | % Change | | $ Change | | % Change |
| Technology and product development | Technology and product development | | $ | 276,087 | | | $ | 201,199 | | | $ | 74,888 | | | 37 | % | Technology and product development | | $ | 511,419 | | | $ | | $ | 405,257 | | | $ | | $ | 276,087 | | | $ | | $ | 106,162 | | | 26 | | 26 | % | | $ | 129,170 | | | 47 | | 47 | % |
| Sales and marketing | Sales and marketing | | 426,875 | | | 276,577 | | | 150,298 | | | 54 | % |
| Cost of operations | Cost of operations | | 256,980 | | | 178,896 | | | 78,084 | | | 44 | % |
| General and administrative | General and administrative | | 498,534 | | | 237,381 | | | 261,153 | | | 110 | % |
| Goodwill impairment | | Goodwill impairment | | 247,174 | | | — | | | — | | | 247,174 | | | n/m | | — | | | n/m |
| Provision for credit losses | Provision for credit losses | | 7,573 | | | — | | | 7,573 | | | n/m |
Total noninterest expense | Total noninterest expense | | $ | 1,466,049 | | | $ | 894,053 | | | $ | 571,996 | | | 64 | % | Total noninterest expense | | $ | 2,423,947 | | | $ | | $ | 1,892,256 | | | $ | | $ | 1,466,049 | | | $ | | $ | 531,691 | | | 28 | | 28 | % | | $ | 426,207 | | | 29 | | 29 | % |
2023 vs. 2022. Total noninterest expense increased by $572.0$531.7 million, or 64%28%, for the year ended December 31, 20212023 compared to the year ended December 31, 2020, due2022, primarily driven by: (i) goodwill impairment expense related to the following:
TechnologyGalileo and Product Development.Technisys reporting units, further discussed within “ TechnologyCritical Accounting Policies and product development expenses increased by $74.9 million, or 37%Estimates—Goodwill”, primarily due to:
•an increase in amortization expense on intangible assets of $7.9 million, which included both an $11.5 million increase associated with intangible assets acquired during the second quarter of 2020 and a $3.6 million decrease associated with the acceleration of our core banking infrastructure amortization during 2020;
•an increase in purchased and internally-developed software amortization of $7.2 million, which was primarily reflective of increased investments in technology in our Technology Platform segment;
•an increase in(ii) higher employee compensation and benefits, of $48.5 million, inclusive of an increase in share-based compensation expense of $33.2 million, which was attributable to increases in headcount and salary and the inclusion of Technisys for the full 2023 period compared to a partial period in 2022, related to an increase in technology and product personnel in support of our growth and impacts of the effectinflationary environment, as well as restructuring charges during the first and fourth quarters of new award issuances at increased share prices. We also had an increase in average compensation in 2021;2023 and
•an increase in software licenses, and tools and subscriptions expense of $8.9 million related to headcount increases and internal technology initiatives.
Sales and Marketing. Sales and marketing expenses increased partially offset by $150.3 million, or 54%, primarily due to:
•an increase in amortization expense of $12.9 million associated with the customer-related intangible assets acquired in the second quarter of 2020;
•an increase in employee compensation and benefits of $20.2 million, inclusive of an increasedecreases in share-based compensation expense, of $8.1 million, which was correlated with an increase(iii) increases in salesadvertising and marketing personnel to support our growth, and the effect of new awards at increased share prices, partially offset by a decrease in average compensation in 2021;
•an increase of SoFi Stadium related expenditures, of $8.6 million, which is exclusive of depreciation and interest expense on the embedded lease portion of our SoFi Stadium agreement;
•an increase of $38.5 million related to increasing utilization of lead generation channels during 2021;
•and direct member incentives, (iv) increased amortization of purchased and internally-developed software, and in tools and subscriptions costs, reflective of continued investments in technology, (v) an increase in direct customer promotional expenditures of $18.5 million, which is one of our levers for stimulating member product adoption and engagement; and
•an increase in advertising expenditures of $44.2 million, which was attributable to an increase in search, social, television and digital advertising expenditures in 2021, partially offset by a decrease in direct mail marketing expenditures.
Cost of Operations. Cost of operations increased by $78.1 million, or 44%, primarily due to:
•an increase in loan origination and servicing expenses of $14.7 million, of which $12.9 million was related to home loans and was correlated with the growth in origination volume year over year;
•an increase of $16.1 million in product fulfillment costs, which wasincluded debit card fulfillment services, primarily related to our SoFi Money product, as well as payment processing network association fees associated with increased activity on our technology platform, and (vi) increases in amortization of intangible assets primarily due to acquired intangible assets in the Technisys Merger and Wyndham acquisition. These increases were partially offset by the absence of transaction expenses that were incurred in the 2022 period related to our acquisition of Technisys.
2022 vs. 2021. Total noninterest expense increased by $426.2 million, or 29%, for the year ended December 31, 2022 compared to the year ended December 31, 2021, primarily driven by: (i) higher employee compensation and benefits (inclusive of an increase in share-based compensation expense), a portion of which was predominantly attributable to post-acquisition Galileo operations;the Technisys Merger and the remainder of which was related to increased personnel to support our growth in 2022, (ii) increases in advertising expenditures and utilization of lead generation channels, (iii) an increase in the provision for credit losses, which reflected higher average credit card balances combined with elevated credit card loss rates during 2022, (iv) an increase in amortization of intangible assets due to acquired intangible assets in the Technisys Merger, and (v) an increase in purchased and internally-developed software amortization, reflective of continued investments in technology.
•an increase in employee compensation and benefits of $32.2 million, which was correlated with an increase in cost of operations personnel in support of our growth, in addition to an increase in average compensation in 2021;
•an increase in software licenses, tools and subscriptions and other related fees of $9.1 million related to headcount increases and internal technology initiatives;
•an increase in credit card expenses, primarily processing fees, of $3.5 million related to increased credit card activity;
•an increase in brokerage-related costs and debit card fulfillment costs of $5.3 million, primarily related to the growth of SoFi Invest and SoFi Money; and
•a decrease in SoFi Money account operational losses of $3.8 million.
General and Administrative. General and administrative expenses increased by $261.2 million, or 110%, primarily due to:
•an increase in employee compensation and benefits of $120.7 million, inclusive of an increase in share-based compensation expense of $92.2 million, which was related to an increase in general and administrative personnel to support our growing infrastructure and administrative needs in addition to an increase in average compensation in 2021, and the effect of new awards issued at increased share prices;
•an increase in the fair value of our warrant liabilities of $86.8 million, which was comprised of a larger fair value increase on the Series H redeemable preferred stock during 2021 prior to the Business Combination relative to 2020 of $101.3 million, partially offset by fair value decreases related to the SoFi Technologies warrants assumed in the Business Combination of $14.5 million;
•an increase of $21.2 million related to the special payment made to the Series 1 preferred stockholders in 2021 associated with the Business Combination, which was partially offset by $3.0 million lower other transaction-related expenses. Transaction-related expenses in 2021 were primarily related to our acquisition of Golden Pacific, our anticipated acquisition of Technisys, and debt and equity transactions, including our convertible debt, capped call and secondary offering on behalf of certain investors. Transaction-related expenses in 2020 included costs associated with our acquisitions of Galileo and 8 Limited;
•an increase in non-transaction related professional services of $14.5 million, such as accounting, advisory and legal services, and an increase in corporate insurance of $6.3 million, which were primarily attributable to the increased costs of being a public company and preparation to become a bank holding company;
•an increase in occupancy-related expenses of $3.2 million; and
•an increase in software licenses and tools and subscriptions of $4.3 million, which was correlated with increased headcount.
Provision for Credit Losses. The provisionLosses
Analysis of Allowance for credit losses of $7.6 million during the year ended December 31, 2021 reflects the expected credit losses associated with our credit card loans. The provisionCredit Losses
Allowance for credit losses was not meaningful during the year ended December 31, 2020, as we launched our credit card product in the third quarter of 2020 and had immaterial activity through the end of the year.
Net Loss
We had a net loss of $483.9 million for the year ended December 31, 2021 compared to $224.1 million for the year ended December 31, 2020. The increase in loss was due to the factors discussed above, as well as the change in income taxes. The significant tax benefit in 2020 was associated with the remeasurement of our valuation allowance during 2020 primarily as a result of the deferred tax liabilities recognized in connection with our acquisition of Galileo, which decreased the valuation allowance by $99.8 million.
Year Ended December 31, 2020 Compared to Year Ended December 31, 2019
Interest IncomeCredit Losses Ratios
The following table presents the componentsratio of ourallowance for credit losses to total interest income for the years indicated:loans outstanding that are measured at amortized cost:
| | | | | | | | | | | | | | | | | | | | | | | | | | |
| | Year Ended December 31, | | | | |
| ($ in thousands) | | 2020 | | 2019 | | $ Change | | % Change |
| Loans | | $ | 330,353 | | | $ | 570,466 | | | $ | (240,113) | | | (42) | % |
| Securitizations | | 24,031 | | | 23,179 | | | 852 | | | 4 | % |
| Related party notes | | 3,189 | | | 3,338 | | | (149) | | | (4) | % |
| Other | | 5,964 | | | 11,210 | | | (5,246) | | | (47) | % |
Total interest income | | $ | 363,537 | | | $ | 608,193 | | | $ | (244,656) | | | (40) | % |
Total interest income decreased by $244.7 million, or 40%, for the year ended December 31, 2020 compared to the year ended December 31, 2019 due to the following: | | | | | | | | | | | | | | |
| | December 31, |
| ($ in thousands) | | 2023 | | 2022 |
| Allowance for credit losses to total loans outstanding | | | | |
| Allowance for credit losses | | $ | 54,695 | | | $ | 40,788 | |
Total loans held for investment, at amortized cost outstanding(1) | | $ | 884,390 | | | $ | 344,106 | |
Ratio(2) | | 6.18 | % | | 11.85 | % |
__________________Loans. (1)Loans interest income decreased by $240.1 million, or 42%, primarily driven by a $218.3 millionTotal loans outstanding excludes accrued interest.
(2)The decrease in personal loan interest income year over year. A significant portion of this decreasethe ratio was relatedprimarily attributable to a decline in securitization loan interest income of $209.4 million,senior secured loans, for which was a function of our deconsolidation of three variable interest entities (“VIEs”) during 2020 that were previously consolidated during 2019, and earning interest income from loans in three consolidated VIEs in 2019 that were deconsolidated in the fourth quarter of 2019. In all cases, our deconsolidations of previously consolidated VIEs were triggered by a third party purchasing enough residual interest ownership in the VIEs from us such that we owned less than 10% of the VIE residual interest. As we no longer had a significant financial interest in the VIEs, we deconsolidated them, which included the related securitization loans.
Further, we did not consolidate any personal loan VIEs during 2020. In addition, our monthly average non-securitization personal loan balance during 2020 was 5% lower than in 2019, which contributed torecognize an $8.9 million decline in loan interest income year over year. This decline was heavily influencedallowance for credit losses, partially offset by the COVID-19 pandemic, which contributed to a year over year decline in personal loan origination volume of 31%. Student loan securitization interest income declined by $34.1 million,credit cards, which was correlated withprimarily reflective of an increase in prepayments and was also negatively impacted by the COVID-19 pandemic. These declines in interest were offset by an $11.6 million increase in non-securitization student loan interest income, which was consistent with a 33% higher average balance year over yearcombined with elevated loss rates.
We omitted the credit ratios associated with nonaccrual loans, as a result of a longer holding period for loans on the balance sheet and a significant strategic purchase of nonaccrual loans during 2020.was immaterial.
Securitizations. Securitizations interest income increased by $0.9 million, or 4%, which was attributable to an increase in residual investment interest incomeAllocation of $2.9 million and asset-backed bonds of $1.2 million. These increases were offset by a decline in securitization float interest income of $3.2 million, which was largely attributable to declining interest rates during 2020.
Related Party Notes. Related party notes interest income decreased by $0.1 million, or 4%, due to a decrease in interest income on a stockholder loan, which was fully settled in 2020, partially offset by an increase in interest income related to loans to Apex, as the first loan was issued in November 2019 with additional amounts loaned during 2020.
In March 2019, we entered into a $58.0 million note receivable agreement with a stockholder (the “Note Receivable Stockholder”), which accrued interest at 7.0%. In October 2019, we assigned a portion of our call option rights pursuant to such agreement to another stockholder who paid $15.2 million to purchase an aggregate of 3,095,078 common and preferred shares held by the Note Receivable Stockholder. The Note Receivable Stockholder then paid us $15.2 million to settle a portion of the outstanding note receivable and accrued interest owed to us. During the year ended December 31, 2020, the Note Receivable Stockholder made payments totaling $47.8 million to settle the remaining outstanding note receivable and accrued interest.
As of December 31, 2020, we had three notes receivable outstanding from Apex with a total principal balance of $16.7 million, of which $7.6 million was loaned by us during the year ended December 31, 2020 in two transactions and accrued interest annually at a fixed rate of 10.0%. The initial note receivable of $9.1 million was loaned by us in November 2019 and accrued interest annually at a fixed rate of 5.0% as of December 31, 2020. In February 2021, Apex repaid the total outstanding principal balances and accrued interest.
See Note 15 to the Notes to Consolidated Financial StatementsAllowance for additional information on our related party notes.
Other. Other interest income decreased by $5.2 million, or 47%, primarily due to interest rate decreases during 2020, which impacted the interest income we earn on our bank balances and Member Bank deposits.
Interest ExpenseCredit Losses
The following table presents the componentsallocation of ourthe allowance for credit losses and the percentage of loans outstanding by category to total interest expense for the years indicated:loans outstanding that are measured at amortized cost:
| | | | | | | | | | | | | | | | | | | | | | | | | | |
| | Year Ended December 31, | | | | |
| ($ in thousands) | | 2020 | | 2019 | | $ Change | | % Change |
| Securitizations and warehouses | | $ | 155,150 | | | $ | 268,063 | | | $ | (112,913) | | | (42) | % |
| Corporate borrowings | | 27,974 | | | 4,962 | | | 23,012 | | | 464 | % |
| Other | | 2,482 | | | 5,334 | | | (2,852) | | | (53) | % |
Total interest expense | | $ | 185,606 | | | $ | 278,359 | | | $ | (92,753) | | | (33) | % |
Total interest expense decreased by $92.8 million, or 33%, for the year ended December 31, 2020 compared to the year ended December 31, 2019, due to the following: | | | | | | | | | | | | | | | | | | | | | | | | | | |
| | December 31, 2023 | | December 31, 2022 |
| ($ in thousands) | | Allowance for credit losses | | Percent of loans to total loans(1) | | Allowance for credit losses | | Percent of loans to total loans(1) |
| Credit card | | $ | 52,385 | | | 36 | % | | $ | 39,110 | | | 71 | % |
| Commercial and consumer banking | | 2,310 | | | 13 | | | 1,678 | | | 29 | |
Senior secured loans(2) | | — | | | 51 | | | — | | | — | |
| Total | | $ | 54,695 | | | 100 | % | | $ | 40,788 | | | 100 | % |
__________________Securitizations and Warehouses.(1)Loans outstanding balances used in the calculation exclude accrued interest.
(2)For the periods presented, we did not recognize an allowance for credit losses on senior secured loans, as we determined that our expected exposure to credit losses was immaterial.
Analysis of Charge-offs
The following tables present the components of securitizations and warehouses interest expense and other pertinent information.
| | | | | | | | | | | | | | | | | | | | | | | | | | |
| | Year Ended December 31, | | | | |
| ($ in thousands) | | 2020 | | 2019 | | $ Change | | % Change |
| Securitization debt interest expense | | $ | 66,110 | | | $ | 132,811 | | | $ | (66,701) | | | (50) | % |
| Warehouse debt interest expense | | 51,983 | | | 80,895 | | | (28,912) | | (36) | % |
| Residual interests classified as debt interest expense | | 12,678 | | | 30,562 | | (17,884) | | (59) | % |
Debt issuance cost interest expense(1) | | 24,379 | | | 23,795 | | 584 | | 2 | % |
Securitizations and warehouses interest expense | | $ | 155,150 | | | $ | 268,063 | | | $ | (112,913) | | | (42) | % |
___________________
(1)Debt issuance cost interest expense excludes the acceleration of debt issuance costs of $4.2 million and $8.4 million during the years ended December 31, 2020 and 2019, respectively, associated with the deconsolidation of VIEs, which is reported within noninterest income—securitizations in the consolidated statements of operations and comprehensive income (loss).
| | | | | | | | | | | | | | | | | | | | |
| | Year Ended December 31, | | |
| ($ in thousands) | | 2020 | | 2019 | | % Change |
Average debt balances(1) | | | | | |
|
| Securitization debt | | $ | 1,794,758 | | | $ | 3,888,058 | | | (54) | % |
| Warehouses facilities | | 2,266,694 | | | 1,800,902 | | | 26 | % |
| | | | | | |
Weighted average interest rates(1)(2) | | | | | |
|
| Securitization debt | | 3.7 | % | | 3.4 | % | | n/m |
| Warehouse facilities | | 2.3 | % | | 4.5 | % | | n/m |
__________________
(1)Table excludes residual interests classified as debt, as interest expense is dependent on the timing and extent of securitization loan cash flows and, therefore, a derived weightedinformation regarding average interest rate using the methodology in the table herein is not meaningful for the purposes of understanding the change in residual interests classified as debt related interest expense.
(2)Calculated as annualized interest expense divided by average debt balance for the respective debt category. Interest rates on securitization debt and warehouse facilities exclude the effect of debt issuance cost interest expense and amortization of debt discounts.
Securitizations and warehouses interest expense decreased by $112.9 million, or 42%, for the year ended December 31, 2020 compared to the year ended December 31, 2019, driven by the following:
•Securitization debt interest expense (exclusive of debt issuance and discount amortization) decreased by $66.7 million, which was correlated with the deconsolidation of VIEsloans outstanding, net charge-offs and the absenceannualized ratio of new consolidated VIEs, with the exception of one student loan VIE, which was only briefly consolidated before we transferred the significant portion of our financial interest and subsequently deconsolidated it. Moreover, the majority of our student loan securitization debt is tiednet charge-offs to one-month LIBOR, which decreased during 2020;average loans outstanding:
| | | | | | | | | | | | | | | | | | | | | | | | | | | | | | | | | | | | | | | | | | | | | | | | | | | | | | | | |
| | Year Ended December 31, |
| | 2023 | | 2022 | | 2021 |
| ($ in thousands) | | Average Loans(1) | | Net Charge-offs(2) | | Ratio | | Average Loans(1) | | Net Charge-offs(2) | | Ratio | | Average Loans(1) | | Net Charge-offs(2) | | Ratio |
| Personal loans | | $ | 12,638,807 | | | $ | 432,706 | | | 3.42 | % | | $ | 4,767,708 | | | $ | 88,511 | | | 1.86 | % | | $ | 1,968,297 | | | $ | 19,398 | | | 0.99 | % |
| Student loans | | 5,641,787 | | | 25,048 | | | 0.44 | | | 4,059,001 | | | 12,677 | | | 0.31 | | | 2,964,404 | | | 9,399 | | | 0.32 | |
| Home loans | | 78,554 | | | — | | | — | | | 132,663 | | | — | | | — | | | 197,452 | | | — | | | — | |
| Senior secured loans | | 26,291 | | | — | | | — | | | — | | | — | | | — | | | — | | | — | | | — | |
Credit card(3) | | 238,832 | | | 40,992 | | | 17.16 | | | 167,290 | | | 20,957 | | | 12.53 | | | 47,533 | | | 2,048 | | | 4.31 | |
| Commercial and consumer banking | | 109,541 | | | 46 | | | 0.04 | | | 73,361 | | | 7 | | | 0.01 | | | 2,043 | | | — | | | — | |
| Total loans | | $ | 18,733,812 | | | $ | 498,792 | | | 2.66 | % | | $ | 9,200,023 | | | $ | 122,152 | | | 1.33 | % | | $ | 5,179,729 | | | $ | 30,845 | | | 0.60 | % |
___________________
•(1)Warehouse debt interest expense (exclusiveAverage balances were calculated on daily carrying balances for the 2023 period, and on thirteen-month ending carrying balances for the 2022 and 2021 periods, as the daily analysis in the prior periods would have involved undue burden. Both average calculations are representative of debt issuance amortization) decreasedour operations.
(2)Net charge-offs include both credit- and certain non-credit-related charge-offs.
(3)The increase in the net charge-off rate associated with credit card was primarily related to our maturing portfolio.
2022 vs. 2021. The provision for credit losses increased by $28.9$46.8 million, which was related to a decrease in one- and three-month LIBOR during 2020. Interest rate declines were partially offset by aprimarily reflected higher average warehouse debt balance outstanding during 2020;
•Residual interests classified as debt interest expense decreased by $17.9 million, which was correlatedcredit card balances combined with a lower balance of residual interests classified as debt during 2020, a significant driver of which was the deconsolidation of VIEs during 2020 and 2019; and
•Debt issuance cost interest expense increased by $0.6 million, which was associated with an initiative to increase our warehouse borrowing capacity to protect against potential future funding constraints attributable to the COVID-19 pandemic, partially offset by a decrease in securitization debt issuance costs in 2020, as the deconsolidation of VIEs contributed to lower debt issuance cost amortization in 2020.
Corporate Borrowings. Corporate borrowings interest expense increased by $23.0 million, or 464%, primarily due to the following:
•Interest expense incurred on the Galileo seller note issued in May 2020, which was comprised of two components: (i) non-cash interest expense accretion of $6.0 million incurred because of the seller note discount to face value, and (ii) interest expense incurred of $16.2 million related to the outstanding seller note balance of $250.0 million at a stated rate of 10.0%; and
•An increase of $0.8 million in interest expense on the revolvingelevated credit facility, which reflected a higher average balance during 2020, as we drew $325.0 million on the facility during the second quarter of 2020, partially offset by a decline in one-month LIBOR year over year.
Other. Other interest expense decreased by $2.9 million, or 53%, primarily due to a decrease in interest expense of $3.0 million associated with SoFi Money balances, which was correlated with the decline in interestcard loss rates during 2020.2022.
Noninterest Income and Net RevenueTaxes
The following table presents the components of our total noninterest income, as well as total net revenue for the years indicated:
| | | | | | | | | | | | | | | | | | | | | | | | | | |
| | Year Ended December 31, | | | | |
| ($ in thousands) | | 2020 | | 2019 | | $ Change | | % Change |
| Loan origination and sales | | $ | 371,323 | | | $ | 299,265 | | | $ | 72,058 | | | 24 | % |
| Securitizations | | (70,251) | | | (199,125) | | | 128,874 | | | (65) | % |
| Servicing | | (19,426) | | | 8,486 | | | (27,912) | | | (329) | % |
| Technology platform fees | | 90,128 | | | — | | | 90,128 | | | n/m |
| Other | | 15,827 | | | 4,199 | | | 11,628 | | | 277 | % |
Total noninterest income | | $ | 387,601 | | | $ | 112,825 | | | $ | 274,776 | | | 244 | % |
Total net revenue | | $ | 565,532 | | | $ | 442,659 | | | $ | 122,873 | | | 28 | % |
Total noninterest income increased by $274.8 million, or 244%, for the year ended December 31, 2020 compared to the year ended December 31, 2019, due to the following:
Loan Origination and Sales. Loan origination and sales increased by $72.1 million, or 24%. We experienced an $81.1 million year over year increase in home loan originations and sales related income, net of hedges, and related interest rate lock commitments, which was driven by a 182% increase in home loans origination volume and a mix shift toward more FNMA loans during 2020, which sold for a greater loan premium compared to non-agency home loans. Home loan origination fees also increased by $7.9 million year over year in conjunction with the increase in origination volume.
Offsetting these increases was a $16.9 million decline in aggregate personal and student loan origination and sales income, which was attributable to lower origination volumes, partially offset by combined lower write-offs and repurchase expense due to improved loan credit and underwriting performance. Student loan origination volume declined 26% year over year, primarily due to lower demand for our student loan refinancing products as a result of the payment deferral period on federal student loans enacted through the CARES Act in 2020. Personal loan origination volume declined 31% year over year, primarily due to our efforts in 2020 to further tighten our underwriting and credit policies to mitigate our credit risk exposure during the economic downturn combined with lower demand for personal loan financing, which we believe was a result of lower consumer spending behavior during the early stages of the COVID-19 pandemic.
Securitizations. Securitization income improved by $128.9 million, or 65%, primarily due to a reduction in securitization loan write-offs of $82.5 million, which was related to the deconsolidation of VIEs and stronger securitization loan credit performance during 2020. The decrease in securitization loan write-offs also had the impact of improving our assumed future credit outlook for our securitization loans, which contributed to an aggregate increase of $39.0 million year over year in securitization loan fair market value changes. Additionally, we had a $38.7 million loss realized in the fourth quarter of 2019 related to the deconsolidation of three personal loan VIEs compared to losses in 2020 of $8.6 million attributable to a previously consolidated VIE that was both consolidated and deconsolidated in 2020 and $6.1 million attributable to the deconsolidation of three additional VIEs. Finally, we had a positive variance in our securitization residual investments of $1.9 million.
Partially offsetting these effects was an unfavorable variance in residual debt fair value of $16.4 million year over year, which was correlated with underlying securitization performance and residual interest positions representing a greater percentage of securitization claims year over year.
The table below presents additional information related to loan gains and losses and overall performance:
| | | | | | | | | | | | | | | | | | | | | | | | | | |
| | Year Ended December 31, | | | | |
| ($ in thousands) | | 2020 | | 2019 | | $ Change | | % Change |
| Gains from non-securitization loan transfers | | $ | 259,451 | | | $ | 129,989 | | | $ | 129,462 | | | 100 | % |
Gains from loan securitization transfers(1) | | 129,855 | | | 226,394 | | | (96,539) | | | (43) | % |
| Economic derivative hedges of loan fair values | | (54,829) | | | (24,803) | | | (30,026) | | | 121 | % |
Home loan origination fees(2) | | 11,576 | | | 3,639 | | | 7,937 | | | 218 | % |
Loan write-off expense – whole loans(3) | | (5,873) | | | (13,888) | | | 8,015 | | | (58) | % |
Loan write-off expense – securitization loans(4) | | (38,621) | | | (121,102) | | | 82,481 | | | (68) | % |
Loan repurchase expense(5) | | (342) | | | (2,337) | | | 1,995 | | | (85) | % |
__________________
(1)Represents the gain recognized on loan securitization transfers qualifying for sale accounting treatment during the years presented. For the years ended December 31, 20202023, 2022 and 2019, the gains were exclusive2021, we recorded income tax benefit (expense) of deconsolidation losses of $14.7$0.4 million, $(1.7) million, and $38.7$(2.8) million, respectively.
(2)This variance was correlated with an increase Our income tax benefit position in home loan origination volume year over year.
(3)Includes gross write-offs of $17.1 million and $22.3 million for the years ended December 31, 2020 and 2019, respectively. During 2020, $3.6 million of the $11.2 million of recoveries were captured via loan sales to a third-party collection agency. During 2019, $0 of the $8.4 million of recoveries were captured via loan sales to a third-party collection agency.
(4)Includes gross write-offs of $54.7 million and $139.2 million for the years ended December 31, 2020 and 2019, respectively. During 2020, $7.2 million of the $16.1 million of recoveries were captured via loan sales to a third-party collection agency. During 2019, $7.6 million of the $18.1 million of recoveries were captured via loan sales to a third-party collection agency.
(5)Represents the expense associated with our estimated loan repurchase obligation. See Note 16 to the Notes to Consolidated Financial Statements for additional information.
Servicing. Servicing income decreased by $27.9 million, or 329%, and was primarily related to fair value changes in our servicing assets that were largely attributable to an increase in servicing asset prepayment speed assumptions year over year. We experienced an increase in loan prepayments during 2020, which we believe is correlated with the market interest rate declines in 2020 compared to 2019.
The table below presents additional information related to our loan servicing activities:
| | | | | | | | | | | | | | | | | | | | | | | | | | |
| | Year Ended December 31, | | | | |
| ($ in thousands) | | 2020 | | 2019 | | $ Change | | % Change |
| Servicing income recognized | | | | | | | | |
Home loans(1) | | $ | 4,651 | | | $ | 2,648 | | | $ | 2,003 | | | 76 | % |
Student loans(2) | | 50,491 | | | 47,489 | | | 3,002 | | | 6 | % |
Personal loans(3) | | 42,646 | | | 34,290 | | | 8,356 | | | 24 | % |
| Servicing rights fair value change | | | | | | | | |
Home loans(4) | | $ | 10,733 | | | $ | 4,558 | | | $ | 6,175 | | | 135 | % |
Student loans(5) | | (37,945) | | | 16,507 | | | (54,452) | | | (330) | % |
Personal loans(6) | | (24,809) | | | 14,849 | | | (39,658) | | | (267) | % |
_________________
(1)The contractual servicing earned on our home loan portfolio was 25 bps during the years ended December 31, 2020 and 2019.
(2)The weighted average bps earned for student loan servicing during the years ended December 31, 2020 and 2019 was 37 bps and 39 bps, respectively.
(3)The weighted average bps earned for personal loan servicing during the years ended December 31, 2020 and 2019 was 74 bps and 72 bps, respectively.
(4)The impact on the fair value change resulting from changes in valuation inputs and assumptions was $(5.1) million and $1.5 million during the years ended December 31, 2020 and 2019, respectively.
(5)The impact of the fair value change resulting from changes in valuation inputs and assumptions was $(20.2) million and $0.2 million during the years ended December 31, 2020 and 2019, respectively. The amount in 2020 includes the impact of the derecognition of servicing due to loan purchases, which had an effect of $(12.9) million on the total fair value change.
(6)The impact of the fair value change resulting from changes in valuation inputs and assumptions was $7.8 million and $6.8 million during the years ended December 31, 2020 and 2019, respectively.
Technology Platform Fees. Technology platform fees of $90.1 million during 2020 were earned by Galileo, which we acquired on May 14, 2020 and, therefore, had no impact in 2019.
Other. Other income increased by $11.6 million, or 277%, primarily due to increases of $3.4 million in equity method investment income, $3.4 million in brokerage-related fees, $2.9 million in payment network fees and $2.2 million in referral fees. The brokerage fees and payment network fees earned during 2020 were bolstered by our acquisitions of 8 Limited and Galileo. The equity method investment income increase was reflective of an increase in trading volume at Apex. This trend in trading volume also positively impacted our brokerage-related fees. Equity method investment income included a $4.3 million impairment charge recognized during the fourth quarter of 2020, which was incurred because the seller of our Apex interest exercised its call option on our equity investment in January 2021 and we measured the carrying value of our Apex equity method investment as of December 31, 2020 equal to the call payment. Payment network fees (which include interchange fees) were directly correlated with increased spending and card transactions on our platform during 2020 compared to 2019. Lastly, the referral fee increase2023 was primarily attributable to our material affiliate revenue relationships launched during the third quarter of 2019; therefore, 2019 is not fully comparable to 2020.
Noninterest Expense
The following table presents the components of our total noninterest expense for the years indicated:
| | | | | | | | | | | | | | | | | | | | | | | | | | |
| | Year Ended December 31, | | | | |
| ($ in thousands) | | 2020 | | 2019 | | $ Variance | | % Change |
| Technology and product development | | $ | 201,199 | | | $ | 147,458 | | | $ | 53,741 | | | 36 | % |
| Sales and marketing | | 276,577 | | | 266,198 | | | 10,379 | | | 4 | % |
| Cost of operations | | 178,896 | | | 116,327 | | | 62,569 | | | 54 | % |
| General and administrative | | 237,381 | | | 152,275 | | | 85,106 | | | 56 | % |
Total noninterest expense | | $ | 894,053 | | | $ | 682,258 | | | $ | 211,795 | | | 31 | % |
Total noninterest expense increased by $211.8 million, or 31%, for the year ended December 31, 2020 compared to the year ended December 31, 2019, due to the following:
Technology and Product Development. Technology and product development expenses increased by $53.7 million, or 36%, primarily due to:
•an increaseincome tax benefits from foreign losses in amortization expense on intangible assets of $24.6 million, of which $19.9 million was associatedjurisdictions with intangible assets acquired during 2020, and of which $5.8 million wasnet deferred tax liabilities related to the acceleration of our core banking infrastructure amortization.Technisys. These increasesbenefits were offset by lower amortizationincome tax expense associated with the profitability of SoFi Bank in 2020state jurisdictions where separate filings are required, as well as federal taxes where our tax credits and loss carryforwards may be limited. Our income tax expense position in 2022 was primarily attributable to tax expense at SoFi Lending Corp. and SoFi Bank due to profitability in state jurisdictions where separate filings are required and recognition of expense from Technisys in certain smaller intangible assets that were fully amortized during 2019;
•an increase in purchased and internally-developed software amortization of $4.2 million, which was reflective of increased investments in technology to support our growth;
•an increase in employee compensation and benefits of $27.1 million, inclusive of an increase in share-based compensationLatin American countries where separate returns are filed. The expense of $12.2 million, which was related to a 12% increase in technology and product personnel in support of our growth in addition to an increase in compensation per person in 2020;
•an increase in software licenses and tools and subscriptions spend of $6.9 million related to headcount increases and internal technology initiatives, which was partially offset by $2.1 milliondeferred tax benefits from the amortization of software abandonment in 2019 ; and
•partially offset by a decrease in the utilization of professional services of $2.3 million.
Sales and Marketing. Sales and marketing expenses increased by $10.4 million, or 4%, primarily due to:
•an increase in amortization expense of $22.1 million associated with the customer-related intangible assets acquired during 2020;in the Technisys Merger.
•Summary Results by Segmentan increase in employee compensationContribution profit (loss) is the primary measure of segment-level profit and benefits of $10.5 million, inclusive of an increase in share-based compensation expense of $3.9 million, which was correlatedloss that, along with a 29% increase in salesour key business metrics, is used by management to evaluate our business, measure our performance, identify trends and marketing personnel to support our growth. The headcount-related compensation increase was partially offset by higher severance expense of $1.0 million and higher bonus and commissionmake strategic decisions. Contribution profit (loss) is defined as total net revenue for each reportable segment less expenses of $0.8 million during 2019;
•an increase in professional services of $3.2 million during 2020;
•SoFi Stadium related marketing expenditures of $11.5 million related to the opening of SoFi Stadium, which is exclusive of depreciation and interest expense on the embedded lease portion of our SoFi Stadium agreement;
•partially offset by a decrease of $4.0 million related to decreased utilization of lead generation channels, which was reflective of an initiative to rely less on this channel for member growth during 2020; and
•further partially offset by a decrease in advertising expenditures of $31.1 million, which wasdirectly attributable to the impactreportable segment and, in the case of the COVID-19 pandemic on our live sports marketing strategy, the aforementioned SoFi Stadium related marketing expenditures in lieu of advertising expenditures, and the expected advertising benefits we expected to derive from the opening of SoFi Stadium.
Cost of Operations. Cost of operations increased by $62.6 million, or 54%, primarily due to:
•an increase in loan origination expenses of $16.2 million, of which $16.6 million was related to home loans, which supported the growth in home loan origination volume year over year;
•an increase in third-party fulfillment expenses of $12.5 million, which was primarilyLending segment, adjusted for fair value adjustments attributable to post-acquisition Galileo operations, and primarily relates to the fees we pay to payment networks to route authorized transactions;
•an increase in employee compensation and benefits of $20.0 million, inclusive of an increase in share-based compensation expense of $4.4 million, which was correlated with a 15% increase in cost of operations personnel in support of our growth in addition to an increase in home loan commissions of $5.8 million related to growth in the home loan product. The headcount-related compensation increase was partially offset by higher severance expense of $0.7 million during 2019;
•an increase in occupancy-related costs of $5.6 million;
•an increase in software licenses and tools and subscriptions of $5.1 million related to headcount increases and internal technology initiatives;
•an increase of $3.3 million associated with SoFi Money account write-offs; and
•an increase in brokerage-related costs of $2.1 million related to the growth of SoFi Invest and our wholly-owned subsidiary, 8 Limited, which we acquired in April 2020;
•partially offset by a decrease in professional services of $5.2 million, primarily due to non-recurring operations costs related to SoFi Money incurred in 2019.
General and Administrative. General and administrative expenses increased by $85.1 million, or 56%, primarily due to:
•an increase in employee compensation and benefits of $37.0 million, inclusive of an increase in share-based compensation expense of $18.5 million, which was related to a 46% increase in general and administrative personnel to support our growing infrastructure and administrative needs in addition to an increase in compensation per person in 2020;
•an increase in bank service charges of $5.8 million, which was primarily related to an increase in unused line fees as a result of increased capacity on our warehouse lines partially offset by a decrease in bank fees year over year;
•an increase in software licenses and tools and subscriptions of $3.6 million;
•transaction-related expenses of $9.2 million during 2020assumption changes associated with our acquisitionsservicing rights and residual interests classified as debt. See the sections entitled “Consolidated Results of 8 Limited and Galileo, which largely consisted of legal, accounting and financial advisory services;
•Operations”share-based payments to non-employees of $0.9 million during 2020 for financial advisory services related to our acquisitions;
•, an increase in non-transaction related professional services of $5.7 million, which included accounting and legal services; and
•an increase in the fair value of our warrant liabilities of $23.4 million related to an increase in the fair value of our Series H preferred stock.
Net Loss
We had a net loss of $224.1 million for the year ended December 31, 2020 compared to $239.7 million for the year ended December 31, 2019. The decrease in net loss was due to the factors discussed above, as well as the change in income taxes. The primary driver of the $104.6 million year over year decrease in income taxes was associated with the remeasurement of our valuation allowance during 2020, which was primarily a result of the deferred tax liabilities recognized in connection with our acquisition of Galileo, which decreased the valuation allowance by $99.8 million. The deferred tax liabilities recognized in the acquisition were substantially all related to acquired intangibles, which had a fair value of $388.0 million and a tax basis of zero.
“Summary Results by SegmentSegment” and “Non-GAAP Financial Measures” for discussion and analysis of these key financial measures.
Lending Segment
In the table below, we present certain metrics related to our Lending segment:
| | | | December 31, | | 2021 vs. 2020
% Change | | 2020 vs. 2019
% Change | | | December 31, | | 2023 vs. 2022 | | 2022 vs. 2021 |
| Metric | Metric | | 2021 | | 2020 | | 2019 | | Metric | | 2023 | | 2022 | | 2021 | | Change | | % Change | | Change | | % Change |
| Total products (number, as of period end) | Total products (number, as of period end) | | 1,078,952 | | | 917,645 | | | 798,005 | | | 18 | % | | 15 | % | Total products (number, as of period end) | | 1,663,006 | | | 1,340,597 | | 1,340,597 | | | 1,078,952 | | 1,078,952 | | | 322,409 | | 322,409 | | | 24 | | 24 | % | | 261,645 | | | 24 | | 24 | % |
| Origination volume ($ in thousands, during period) | Origination volume ($ in thousands, during period) | |
| Origination volume ($ in thousands, during period) | | | | | | | | | | | | | |
|
| Home loans | | $ | 2,978,222 | | | $ | 2,183,521 | | | $ | 773,684 | | | 36 | % | | 182 | % |
| Personal loans | Personal loans | | 5,386,934 | | | 2,580,757 | | | 3,731,981 | | | 109 | % | | (31) | % | Personal loans | | $ | 13,801,065 | | | $ | | $ | 9,773,705 | | | $ | | $ | 5,386,934 | | | $ | | $ | 4,027,360 | | | 41 | | 41 | % | | $ | 4,386,771 | | | 81 | | 81 | % |
| Student loans | Student loans | | 4,293,526 | | | 4,928,880 | | | 6,695,138 | | | (13) | % | | (26) | % | Student loans | | 2,630,040 | | | 2,245,499 | | 2,245,499 | | | 4,293,526 | | 4,293,526 | | | 384,541 | | 384,541 | | | 17 | | 17 | % | | (2,048,027) | | | (48) | | (48) | % |
| Home loans | | Home loans | | 997,492 | | | 966,177 | | | 2,978,222 | | | 31,315 | | | 3 | % | | (2,012,045) | | | (68) | % |
| Total | Total | | $ | 12,658,682 | | | $ | 9,693,158 | | | $ | 11,200,803 | | | 31 | % | | (13) | % | Total | | $ | 17,428,597 | | | $ | | $ | 12,985,381 | | | $ | | $ | 12,658,682 | | | $ | | $ | 4,443,216 | | | 34 | | 34 | % | | $ | 326,699 | | | 3 | | 3 | % |
Loans with a balance (number, as of period end)(1) | Loans with a balance (number, as of period end)(1) | | 603,201 | | | 598,682 | | | 623,511 | | | 1 | % | | (4) | % | Loans with a balance (number, as of period end)(1) | | 1,009,433 | | | 753,043 | | 753,043 | | | 603,201 | | 603,201 | | | 256,390 | | 256,390 | | | 34 | | 34 | % | | 149,842 | | | 25 | | 25 | % |
Average loan balance ($, as of period end)(1) | Average loan balance ($, as of period end)(1) | |
| Average loan balance ($, as of period end)(1) | | | | | | | | | | | | | |
|
| Home loans | | $ | 286,991 | | | $ | 291,382 | | | $ | 296,812 | | | (2) | % | | (2) | % |
| Personal loans | Personal loans | | 22,820 | | | 21,789 | | | 24,372 | | | 5 | % | | (11) | % | Personal loans | | $ | 24,223 | | | $ | | $ | 24,917 | | | $ | | $ | 22,820 | | | $ | | $ | (694) | | | (3) | | (3) | % | | $ | 2,097 | | | 9 | | 9 | % |
Student loans(2) | Student loans(2) | | 50,549 | | | 54,319 | | | 60,127 | | | (7) | % | | (10) | % | Student loans(2) | | 44,683 | | | 46,585 | | 46,585 | | | 50,549 | | 50,549 | | | (1,902) | | (1,902) | | | (4) | | (4) | % | | (3,964) | | | (8) | | (8) | % |
| Home loans | | Home loans | | 284,289 | | | 285,152 | | | 286,991 | | | (863) | | | — | % | | (1,839) | | | (1) | % |
(1)Loans with a balance and average loan balance include loans on our balance sheet, as well as transferred loans and transferredreferred loans with which we have a continuing involvement through our servicing agreements.
(2)In-school loans which we launched in the third quarter of 2019 and which have continued to increase in origination volume in each of 2020 and 2021, carry a lower average balance than student loan refinancing products.
The following table presents additional information on our terms for our lending products as of December 31, 2021:
| | | | | | | | | | | | | | | | | | | | |
Product | | Loan Size | | Rates(1)
| | Term |
Student Loan Refinancing | | $5,000+ (2)
| | Variable rate: 1.74% – 6.59% | | 5 – 20 years |
| | | | Fixed rate: 2.49% – 6.94% | |
In-School Loans | | $5,000+ (2)
| | Variable rate: 0.95% – 11.29% | | 5 – 15 years |
| | | | Fixed rate: 2.99% – 10.90% | |
Personal Loans | | $5,000 – $100,000 (2)
| | Fixed rate: 4.74% – 16.44% | | 2 – 7 years |
Home Loans | | $100,000 – $548,250 (3)
| | Fixed rate: 1.75% – 4.75% | | 10, 15, 20 or 30 years |
| (Conforming Normal Cost Areas) | | |
| OR | | |
| $1,050,000 (4)
(Conforming High Cost Areas)
| | |
| OR | | |
| $2,700,000 (4)
(Jumbo Loans)
| | |
__________________(1)Loan annual percentage rates presented reflect rates as advertised as of the date indicated, inclusive of an auto-pay discount.
(2)Minimum loan size may be higher within certain states due to legal or licensing requirements.
(3)Exceptions for loan size less than $100,000 are considered on a case-by-case basis.
(4)Represents the maximum loan size outstanding within the loan category as of the reporting date. “Conforming High Cost Areas” refers to FNMA eligible loans above the normal conforming limit, which is determined by county. “Jumbo Loans” refers to loans in the jumbo loan program. We began funding loans under our relaunched jumbo loan program in the fourth quarter of 2021.
In the table below, we present additional information related to our lending products:
| | | | | | | | | | | | | | | | | | | | |
| | Year Ended December 31, |
| | 2021 | | 2020 | | 2019 |
| Student Loans | | | | | | |
| Weighted average origination FICO | | 774 | | | 773 | | | 774 | |
Weighted average interest rate earned(1) | | 4.43 | % | | 4.97 | % | | 5.48 | % |
Interest income recognized ($ in thousands)(2) | | $ | 127,496 | | | $ | 134,917 | | | $ | 157,447 | |
Sales of loans ($ in thousands)(3) | | $ | 2,854,778 | | | $ | 4,534,286 | | | $ | 6,051,418 | |
| Home Loans | | | | | | |
| Weighted average origination FICO | | 755 | | | 764 | | | 761 | |
Weighted average interest rate earned(1) | | 1.94 | % | | 2.19 | % | | 3.39 | % |
Interest income recognized ($ in thousands)(2) | | $ | 3,778 | | | $ | 2,731 | | | $ | 2,230 | |
| Sales of loans ($ in thousands) | | $ | 2,935,038 | | | $ | 2,102,101 | | | $ | 726,443 | |
| Personal Loans | | | | | | |
| Weighted average origination FICO | | 754 | | | 764 | | | 756 | |
Weighted average interest rate earned(1) | | 10.58 | % | | 10.65 | % | | 10.92 | % |
Interest income recognized ($ in thousands)(2) | | $ | 202,706 | | | $ | 192,450 | | | $ | 410,789 | |
Sales of loans ($ in thousands)(3) | | $ | 4,290,424 | | | $ | 1,531,057 | | | $ | 2,604,263 | |
__________________
(1)Weighted average interest rate earned represents annualized interest income recognized divided by the average of the month-end unpaid principal balances of loans outstanding during the period, which are impacted by the timing and extent of loan sales.
(2)See “Results of Operations—Interest Income” for a discussion of interest income recognized during the years indicated.
(3)Excludes the impact of loans transferred into consolidated VIEs.
Total Products
Total products in our Lending segment is a subset of our total products metric that refers to the number of home loans, personal loans and student loans that have been originated through our platform since our inception through the reporting date, whether or not such loans have been paid off.metric. See “Key Business Metrics” for further discussion of this measure as it relates to our Lending segment.
Origination Volume
We refer to the aggregate dollar amount of loans originated through our platform in a given period as origination volume. Origination volume is an indicator of the size and health of our Lending segment and an indicator (together with the relevant loan characteristics, such as interest rate and prepayment and default expectations) of revenues and profitability. Changes in origination volume are driven by the addition of new members and existing members, the latter of which at times will either refinance into a new SoFi loan or secure an additional, concurrent loan, as well as macroeconomic factors impacting consumer spending and borrowing behavior. Since the profitability of the Lending segment is largely correlated with origination volume, management relies on origination volume trends to assess the need for external financing to support the Financial Services segment and the expense budgets for unallocated expenses.
Personal Loans.During the year ended December 31, 2023, personal loan origination volume increased significantly relative to 2022, primarily due to increased demand driven by expanded marketing efforts and increased demand for debt consolidation products in a rising interest rate environment.
Personal loan origination volume increased significantly during the year ended December 31, 2022 compared to 2021, homeprimarily due to increased demand driven by expanded marketing efforts and increased demand for debt consolidation products in a rising interest rate environment. This was combined with a positive impact from increased loan application approval rates within our existing credit parameters that were implemented during the second half of 2021 and maintained through mid-2022, with slight credit tightening implemented in the second half of 2022.
Student Loans. During the year ended December 31, 2023, student loan origination volume increased relative to 20202022, as demand for student loan refinancing products increased ahead of the resumption of principal and interest payments on federally-held student loans as borrowers looked to refinance at a lower rate or, given the high interest rate environment, to extend the loan term. This was partially offset by the unfavorable impact of the suspension of principal and interest payments on federally-held student loans through August 30, 2023 and the expectation of debt cancellation for certain federal student loan borrowers which was struck down by the U.S. Supreme Court in June 2023, combined with a continued rising interest rate environment in 2023.
Student loan origination volume decreased significantly during the year ended December 31, 2022 compared to 2021, as demand for student loan refinancing products continued to be unfavorably impacted by the ongoing suspension of principal and interest payments on federally-held student loans and the expectation of debt cancellation for certain federal student loan borrowers, combined with a rising interest rate environment in 2022.
Home Loans. During the year ended December 31, 2023, home loan origination volume remained relatively flat relative to 2022 due to an increasecontinued rising interest rates, which tends to lower demand for home loans overall and shift demand from refinance originations to purchase originations, the latter of which is a more competitive landscape. Although purchase originations historically represented a smaller percentage of our home loan originations, our mix during the 2023 period has shifted toward more purchase originations, which we would expect to continue under similar macroeconomic conditions. Our home loan origination volume increased notably beginning in the second quarter of 2023, aided by the increased capacity and capabilities subsequent to our acquisition of Wyndham.
Home loan application approval rate and operational efficiencies gained through scale oforigination volume decreased significantly during the platform, which were tempered byyear ended December 31, 2022 compared to 2021 due to continued rising U.S. treasuryinterest rates relative to the 20202021 levels, which tends to lower demand for home loans overall and shift demand from refinance originations to purchase originations, the latter of which is a more competitive landscape. Home loan origination volume increased significantly during the year ended December 31, 2020 compared to 2019 in part due toAlthough purchase originations have historically represented a full periodsmaller percentage of origination activity in 2020 compared to a partial period in 2019, as we relaunched our home loan productoriginations, our mix has shifted toward more purchase originations in the first quarter of 2019. The increase was also attributable to increased demand for home loan products in 2020 following the Federal Reserve’s actions to reduce interest rates to near-zero benchmark levels amid the COVID-19 pandemic.
During the year ended December 31, 2021, personal loan origination volume increased significantly relative to 2020, primarily due to the improved economic outlook and consumer confidence levels throughout 2021 relative to 2020, as there was lower consumer spending behavior during the earlier stages of the COVID-19 pandemic, which we believe decreased the
overall demand for debt consolidation loans (which is one of the primary stated purposes for our personal loan originations). We also increased our loan application approval rate during the second half of 2021, which was correlated with a reopening of our personal loan credit eligibility. Personal loan origination volume decreased during the year ended December 31, 2020 relative to 2019 primarily due to the combination of our efforts to further tighten our underwriting and credit policies to mitigate our credit risk exposure during the economic downturn and lower consumer spending behavior during the COVID-19 pandemic, which we believe decreased the overall demand for debt consolidation loans, despite us lowering the average coupon rate during 2020.
During the year ended December 31, 2021, student loan origination volume decreased relative to 2020, as demand for student loan refinancing products continued to be unfavorably impacted by the automatic suspension of principal and interest payments on federally-held student loans enacted through the CARES Act in March 2020 that was extended by executive action most recently until May 2022. During the year ended December 31, 2020, demand for our student loan refinancing products decreased relative to 2019, primarily due to the CARES Act suspensions. Although the in-school loan product, which we launched in the third quarter of 2019, had a modest impact on the full year 2019, we increased our origination volume during each of 2020 and 2021.
Loans with a Balance and Average Loan Balance
Loans with a balance refers to the number of loans that have a balance greater than zero dollars as of the reporting date. Loans with a balance allows management to better understand the unit economics of acquiring a loan in relation to the lifetime value of that loan. Average loan balance is defined as the total unpaid principal balance of the loans divided by loans with a balance within the respective loan product category as of the reporting date. Average loan balance tends to fluctuate based on the pace of loan originations relative to loan repayments and the initial loan origination size.
In the table below, we present additional information related to our lending products:
| | | | | | | | | | | | | | | | | | | | | |
| | Year Ended December 31, | |
| ($ in thousands) | | 2023 | | 2022 | | 2021 | |
| Overall weighted average origination FICO | | 749 | | | 752 | | | 761 | | |
| Personal Loans | | | | | | | |
| Weighted average origination FICO | | 745 | | | 747 | | | 754 | | |
Weighted average interest rate earned(1) | | 13.28 | % | | 11.82 | % | | 10.64 | % | |
| Interest income recognized | | $ | 1,600,527 | | | $ | 551,458 | | | $ | 202,706 | | |
| Sales of loans | | $ | 938,403 | | | $ | 2,911,491 | | | $ | 4,290,424 | | |
| Student Loans | | | | | | | |
| Weighted average origination FICO | | 770 | | | 773 | | | 774 | | |
Weighted average interest rate earned(1) | | 5.13 | % | | 4.27 | % | | 4.44 | % | |
| Interest income recognized | | $ | 281,921 | | | $ | 170,550 | | | $ | 127,496 | | |
| Sales of loans | | $ | 96,678 | | | $ | 877,920 | | | $ | 2,854,778 | | |
| Home Loans | | | | | | | |
| Weighted average origination FICO | | 755 | | | 749 | | | 755 | | |
Weighted average interest rate earned(1) | | 5.76 | % | | 3.42 | % | | 1.96 | % | |
| Interest income recognized | | $ | 4,982 | | | $ | 4,714 | | | $ | 3,778 | | |
| Sales of loans | | $ | 1,029,214 | | | $ | 1,094,981 | | | $ | 2,935,038 | | |
__________________
(1)Weighted average interest rate earned represents annualized interest income recognized divided by the average of the unpaid principal balances of loans outstanding during the period, determined on a daily basis for the 2023 period and on a thirteen-month basis for the 2022 and 2021 periods, as the daily analysis in the prior period would have involved undue burden. Both average calculations are representative of our operations.
Lending Segment Results of Operations
The following table presents the measure of contribution profit for the Lending segment for the years indicated. The information is derived from our internal financial reporting used for corporate management purposes. Refer to Note 18 to the Notes to Consolidated Financial Statements for more information regarding Lending segment performance.segment.
| | | | Year Ended December 31, | | 2021 vs. 2020 % Change | | 2020 vs. 2019 % Change | | | Year Ended December 31, | | 2023 vs. 2022 | | 2022 vs. 2021 |
| ($ in thousands) | ($ in thousands) | | 2021 | | 2020 | | 2019 | | ($ in thousands) | | 2023 | | 2022 | | 2021 | | $ Change | | % Change | | $ Change | | % Change |
| Net revenue | | | | | | | | | | |
| Net interest income | Net interest income | | $ | 258,102 | | | $ | 199,345 | | | $ | 325,589 | | | 29 | % | | (39) | % | Net interest income | | $ | 960,773 | | | $ | | $ | 531,480 | | | $ | | $ | 258,102 | | | $ | | $ | 429,293 | | | 81 | | 81 | % | | $ | 273,378 | | | 106 | | 106 | % |
| Noninterest income | Noninterest income | | 480,221 | | | 281,521 | | | 108,712 | | | 71 | % | | 159 | % | Noninterest income | | 409,848 | | | 608,511 | | 608,511 | | | 480,221 | | 480,221 | | | (198,663) | | (198,663) | | | (33) | | (33) | % | | 128,290 | | | 27 | | 27 | % |
| Total net revenue | Total net revenue | | 738,323 | | | 480,866 | | | 434,301 | | | 54 | % | | 11 | % | Total net revenue | | 1,370,621 | | | 1,139,991 | | 1,139,991 | | | 738,323 | | 738,323 | | | 230,630 | | 230,630 | | | 20 | | 20 | % | | 401,668 | | | 54 | | 54 | % |
Servicing rights – change in valuation inputs or assumptions(1) | Servicing rights – change in valuation inputs or assumptions(1) | | 2,651 | | | 17,459 | | | (8,487) | | | (85) | % | | (306) | % | Servicing rights – change in valuation inputs or assumptions(1) | | (34,700) | | | (39,651) | | (39,651) | | | 2,651 | | 2,651 | | | 4,951 | | 4,951 | | | (12) | | (12) | % | | (42,302) | | | n/m | | n/m |
Residual interests classified as debt – change in valuation inputs or assumptions(2) | Residual interests classified as debt – change in valuation inputs or assumptions(2) | | 22,802 | | | 38,216 | | | 17,157 | | | (40) | % | | 123 | % | Residual interests classified as debt – change in valuation inputs or assumptions(2) | | 425 | | | 6,608 | | 6,608 | | | 22,802 | | 22,802 | | | (6,183) | | (6,183) | | | (94) | | (94) | % | | (16,194) | | | (71) | | (71) | % |
Directly attributable expenses(3) | | (364,169) | | | (294,812) | | | (350,511) | | | 24 | % | | (16) | % |
| Directly attributable expenses | | Directly attributable expenses | | (513,073) | | | (442,945) | | | (364,169) | | | (70,128) | | | 16 | % | | (78,776) | | | 22 | % |
| Contribution profit | Contribution profit | | $ | 399,607 | | | $ | 241,729 | | | $ | 92,460 | | | 65 | % | | 161 | % | Contribution profit | | $ | 823,273 | | | $ | | $ | 664,003 | | | $ | | $ | 399,607 | | | $ | | $ | 159,270 | | | 24 | | 24 | % | | $ | 264,396 | | | 66 | | 66 | % |
Adjusted net revenue(3) | | Adjusted net revenue(3) | | $ | 1,336,346 | | | $ | 1,106,948 | | | $ | 763,776 | | | $ | 229,398 | | | 21 | % | | $ | 343,172 | | | 45 | % |
__________________
(1)Reflects changes in fair value inputs and assumptions, including market servicing costs, conditional prepayment, and default rates and discount rates. This non-cash change, which is recorded within noninterest income in the consolidated statements of operations and comprehensive income (loss)loss is unrealized during the period and, therefore, has no impact on our cash flows from operations. As such, the changes in fair value attributable to assumption changes are adjusted to provide management and financial users with better visibility into the cash flows available to finance our operations.
(2)Reflects changes in fair value inputs and assumptions, including conditional prepayment, and default rates and discount rates. When third parties finance our consolidated VIEs through purchasing residual interests, we receive proceeds at the time of the securitization close and, thereafter, pass along contractual cash flows to the residual interest owner. These obligations are measured at fair value on a recurring basis, with fair value changes recorded within noninterest income in the consolidated statements of operations and comprehensive income (loss).loss. The fair value change attributable to assumption changes has no impact on our initial financing proceeds, our future obligations to the residual interest owner (because future residual interest claims are limited to contractual securitization collateral cash flows), or the general operations of our business. As such, this non-cash change in fair value is adjusted to provide management and financial users with better visibility into the cash flows available to finance our operations.
(3)Adjusted net revenue is a non-GAAP financial measure. For information regarding our use and definition of this measure and for a disaggregation of the directly attributable expenses allocatedreconciliation to the most directly comparable U.S. GAAP measure, total net revenue, see “Non-GAAP Financial Measures” herein.
Net interest income
2023 vs. 2022.Net interest income in our Lending segment increased by $429.3 million, or 81%, for the year ended December 31, 2023 compared to 2022, which was primarily attributable to increases in eachaverage personal and student loan unpaid principal balances of the years presented, see “Directly Attributable Expenses” below.$7.0 billion, or 161%, and $1.7 billion, or 49%, respectively, combined with a higher weighted
Lending Segment — Year Ended December 31, 2021 Comparedaverage interest rate. The personal loan average balance increase was primarily attributable to Year Ended December 31, 2020higher origination volume and longer loan holding periods. The student loan average balance increase was primarily attributable to longer loan holding periods. Interest expense associated with funding our lending activities increased by $732.1 million, or 356%, primarily due to the sharp increases in benchmark rates which are reflective of the higher interest rate environment year over year, as well as higher average loan balances.
Net interest income
2022 vs. 2021.Net interest income in our Lending segment increased by $58.8$273.4 million, or 29%106%, for the year ended December 31, 20212022 compared to 2021, which was primarily attributable to non-securitization loans. Higher interest income on non-securitization personal loans and student loans was primarily a function of increases in aggregate average balances of $2.8 billion, or 185%, and $1.3 billion, or 62%, respectively. The personal loan average balance increase was primarily attributable to higher origination volume and purchase activity combined with a higher weighted average interest rate earned on whole loans and longer loan holding periods. The student loan average balance increase was primarily attributable to longer loan holding periods, partially offset by a lower weighted average interest rate earned on whole loans. Interest expense associated with funding our lending activities, which was determined using an FTP framework in 2022 and was based on actual interest expense on our use of securitizations and warehouse facilities in 2021, increased by $115.6 million, or 128%, year over year, primarily due to the sharp increase in benchmark rates.
Noninterest income
2023 vs. 2022. Noninterest income in our Lending segment decreased by $198.7 million, or 33%, for the year ended December 31, 2020, due2023 compared to the following:
Loans Interest Income. Loans interest2022, which was primarily driven by lower loan origination, sales, and securitizations income increased by $3.7 million, or 1%. See “Results of Operations—Interest Income—Loans” within the section “Year Ended December 31, 2021 Compared to Year Ended December 31, 2020” for information on the primary drivers of the variance related to our personal loans, student loans and home loans.
Securitizations Interest Income. Securitizations interest income decreased by $9.9 million, or 41%. See “Results of Operations—Interest Income—Securitizations” within the section “Year Ended December 31, 2021 Compared to Year Ended December 31, 2020” for information on the primary drivers of the variance.
Securitizations and Warehouses Interest Expense. Interest expense related to securitizations and warehouses decreased by $65.0 million, or 42%, due to:
•a decline in securitization debt interest expense (exclusive of debt issuance and discount amortization) of $30.5 million;
•a decline in warehouse debt interest expense (exclusive of debt issuance amortization) of $22.5 million;
•a decline in residual interests classified as debt interest expense of $4.5 million; and
•a decline in debt issuance cost interest expense of $7.5$193.3 million.
See “Results of Operations—Interest Expense—Securitizations and Warehouses”2022 vs. 2021. within the section “Year Ended December 31, 2021 Compared to Year Ended December 31, 2020” for information on the primary drivers of the variances.
Noninterest income
Noninterest income in our Lending segment increased by $198.7$128.3 million, or 71%27%, for the year ended December 31, 20212022 compared to 2021, which was primarily driven by higher loan origination, sales, and securitizations income of $82.4 million and higher servicing income of $45.6 million.
Loan Originations, Sales, and Securitizations
The following table presents the yearcomponents of noninterest income—loan origination, sales, and securitizations:
| | | | | | | | | | | | | | | | | | | | | | | | | | | | | | | | | | | | | | | | | | | | |
| | Year Ended December 31, | | 2023 vs. 2022 | | 2022 vs. 2021 |
| ($ in thousands) | | 2023 | | 2022 | | 2021 | | $ Change | | % Change | | $ Change | | % Change |
In period originations, loan sale execution and fair value adjustments(1) | | $ | 689,956 | | | $ | 295,562 | | | $ | 450,695 | | | $ | 394,394 | | | 133 | % | | $ | (155,133) | | | (34) | % |
| Economic derivative hedges of loan fair values | | (11,258) | | | 369,898 | | | 49,090 | | | (381,156) | | | n/m | | 320,808 | | | 654 | % |
Other derivative instruments(2) | | 7,560 | | | (11,032) | | | (2,742) | | | 18,592 | | | n/m | | (8,290) | | | 302 | % |
| Loan origination fees | | 134,399 | | | 7,452 | | | 14,452 | | | 126,947 | | | n/m | | (7,000) | | | (48) | % |
Loan write-off expense – whole loans(3) | | (455,194) | | | (101,188) | | | (28,797) | | | (354,006) | | | 350 | % | | (72,391) | | | 251 | % |
Loan repurchase (expense) benefit(4) | | (2,075) | | | 4,460 | | | (3,117) | | | (6,535) | | | n/m | | 7,577 | | | n/m |
| Other | | 8,453 | | | (10) | | | 3,183 | | | 8,463 | | | n/m | | (3,193) | | | n/m |
Loan origination, sales, and securitizations noninterest income | | $ | 371,841 | | | $ | 565,142 | | | $ | 482,764 | | | $ | (193,301) | | | (34) | % | | $ | 82,378 | | | 17 | % |
___________________(1)Includes fair value adjustments on loans originated during the period, fair value adjustments of loans and securitization bond and residual interest positions held at the balance sheet date, as well as gains (losses) on loans sold and consolidated securitization transactions during the period. Fair value adjustments are impacted by interest rates, weighted average coupon, credit spreads and loss estimates, prepayment speeds, duration and previous loan sale execution on similar loans.
(2)Includes IRLCs, interest rate caps and purchase price earn-out.
(3)For the years ended December 31, 2020, due2023, 2022 and 2021, includes gross write-offs of $533.3 million, $131.6 million and $48.7 million, respectively. Total recoveries were $78.1 million, $30.4 million and $19.9 million, respectively, of which $53.7 million, $10.5 million and $5.3 million, respectively, were captured via loan sales to a third-party collection agency.
(4)Represents the (expense) benefit associated with our estimated loan repurchase obligation. See Note 18. Commitments, Guarantees, Concentrations and Contingencies to the following:
Loan Origination and Sales. Loan origination and sales increased by $126.3 million, or 34%. See “Results of Operations—Noninterest Income and Net Revenue—Loan Origination and Sales” within the section “Year Ended December 31, 2021 ComparedNotes to Year Ended December 31, 2020” Consolidated Financial Statements for information on the primary drivers of the variance.additional information.
Securitizations.2023 vs. 2022 Securitizations. The decrease in loan origination, sales, and securitizations income improvedwas primarily driven by: (i) higher personal loan write-offs in the 2023 period, primarily driven by $55.4 million, or 79%. See “Results of Operations—Noninterest Incomelonger loan holding periods and Net Revenue—Securitizations” within the section “Year Ended December 31, 2021 Comparedelevated charge off rates, (ii) losses in 2023 compared to Year Ended December 31, 2020” for informationgains in 2022 on the primary drivers of the variance.
Servicing. Servicing income increased by $17.1 million, or 88%. See “Results of Operations—Noninterest Incomestudent loan, personal loan and Net Revenue—Servicing” within the section “Year Ended December 31, 2021 Compared to Year Ended December 31, 2020” for information on the primary drivers of the variance.risk retention interest rate swap positions primarily
driven by smaller increases in interest rates during the 2023 period, and (iii) lower gains on home loan pipeline hedges primarily driven by larger increases in the underlying hedge price index during the 2023 period.
These decreases were partially offset by: (i) higher fair value gains on personal loans and lower fair value losses on student loans in the 2023 period, which were primarily impacted by higher origination volume and lower prepayment assumptions, respectively, (ii) higher origination fees primarily related to a new product feature offered on personal loans, whereby a borrower may optionally elect to pay origination fees to qualify for a lower annual percentage rate, (iii) improvement in securitizations income primarily driven by an increase in securitization loan and residual interests in securitization trusts fair market values primarily associated with consolidated securitization transactions in the first and third quarters of 2023, and a positive variance in our securitization bond and residual interest position fair values, (iv) fair value gains on home loans (compared to losses in the 2022 period), which were primarily impacted by smaller decreases in benchmark rates, and (v) losses on home loan and student loan sale execution in the 2022 period, which were due to both volume and price factors.
2022 vs. 2021. The increase in loan origination, sales, and securitizations income was primarily driven by: (i) gains on student loan, personal loan and risk retention interest rate swap positions primarily driven by higher interest rates in 2022, (ii) fair value gains on personal loan originations in the year, partially offset by fair value losses on student loan and home loan originations in the year, each correlated with origination volume, (iii) gains on home loan pipeline hedges due to decreases in the underlying hedge price index, and (iv) favorable changes in residual debt fair value adjustments. This increase was partially offset by: (i) lower fair value marks on loans held on balance sheet at period end (including in period originations) across all loan products, primarily driven by deterioration in general market conditions, (ii) lower execution prices on sales activity across all loan products, due to both volume and price factors, (iii) higher loan write offs, primarily driven by higher average personal loan balances and elevated charge off rates in 2022, (iv) a decrease in securitization loan fair market value changes, principally due to increases in market interest rates, and (v) a decline in securitization bond fair values that were impacted by the interest rate volatility during the 2022 period.
Servicing
We own the master servicing on all of the servicing rights that we retain and, in each case, recognize the gross servicing rate applicable to each serviced loan. Sub-servicers are utilized for all serviced student loans and home loans, which represents a cost to SoFi, but these arrangements do not impact our calculation of the weighted average basis points earned for each loan type serviced. Further, there is no impact on servicing income due to forbearance and moratoriums on certain debt collection activities, and there are no waivers of late fees. The table below presents information related to our loan servicing activities:
| | | | | | | | | | | | | | | | | | | | | | | | | | | | | | | | | | | | | | | | | | | | |
| | Year Ended December 31, | | 2023 vs. 2022 | | 2022 vs. 2021 |
| ($ in thousands) | | 2023 | | 2022 | | 2021 | | $ Change | | % Change | | $ Change | | % Change |
| Servicing income recognized | | | | | | | | | | | | | | |
| Personal loans | | $ | 24,074 | | | $ | 35,653 | | | $ | 34,093 | | | $ | (11,579) | | | (32) | % | | $ | 1,560 | | | 5 | % |
| Student loans | | 25,174 | | | 36,256 | | | 46,519 | | | (11,082) | | | (31) | % | | (10,263) | | | (22) | % |
| Home loans | | 15,161 | | | 12,965 | | | 8,975 | | | 2,196 | | | 17 | % | | 3,990 | | | 44 | % |
| Servicing rights fair value change | | | | | | | | | | | | | | |
| Personal loans | | $ | 28,839 | | | $ | (4,245) | | | $ | 2,677 | | | $ | 33,084 | | | n/m | | $ | (6,922) | | | n/m |
| Student loans | | (4,929) | | | (24,058) | | | (10,634) | | | 19,129 | | | (80) | % | | (13,424) | | | 126 | % |
| Home loans | | 6,705 | | | 9,898 | | | 26,619 | | | (3,193) | | | (32) | % | | (16,721) | | | (63) | % |
2022 vs. 2021. The increase in servicing income was primarily related to favorable changes in valuation inputs and assumptions for student loans, which was primarily attributable to decreased prepayment rate assumptions during 2022 compared to increased assumptions during 2021, partially offset by increased discount rate assumptions during 2022.
Directly attributable expenses
The directly attributable expenses allocated to the Lending segment that were used in the determination of the segment's contribution profit were as follows:
| | Year Ended December 31, | |
| | Year Ended December 31, | | | | Year Ended December 31, | | 2023 vs. 2022 | | 2022 vs. 2021 |
| ($ in thousands) | ($ in thousands) | | 2021 | | 2020 | | $ Change | | % Change | ($ in thousands) | | 2023 | | 2022 | | 2021 | | $ Change | | % Change | | $ Change | | % Change |
| Direct advertising | Direct advertising | | $ | 126,367 | | | $ | 102,562 | | | $ | 23,805 | | | 23 | % | Direct advertising | | $ | 183,885 | | | $ | | $ | 178,263 | | | $ | | $ | 126,367 | | | $ | | $ | 5,622 | | | 3 | | 3 | % | | $ | 51,896 | | | 41 | | 41 | % |
| Compensation and benefits | Compensation and benefits | | 88,137 | | | 82,592 | | | 5,545 | | | 7 | % | Compensation and benefits | | 119,266 | | | 103,996 | | 103,996 | | | 88,137 | | 88,137 | | | 15,270 | | 15,270 | | | 15 | | 15 | % | | 15,859 | | | 18 | | 18 | % |
| Lead generation | | Lead generation | | 115,388 | | | 87,716 | | | 55,170 | | | 27,672 | | | 32 | % | | 32,546 | | | 59 | % |
| Loan origination and servicing costs | Loan origination and servicing costs | | 56,242 | | | 41,733 | | | 14,509 | | | 35 | % | Loan origination and servicing costs | | 46,241 | | | 41,535 | | 41,535 | | | 56,242 | | 56,242 | | | 4,706 | | 4,706 | | | 11 | | 11 | % | | (14,707) | | | (26) | | (26) | % |
| Lead generation | | 55,170 | | | 24,603 | | | 30,567 | | | 124 | % |
| Unused warehouse line fees | | 12,938 | | | 14,113 | | | (1,175) | | | (8) | % |
| Professional services | Professional services | | 5,663 | | | 7,139 | | | (1,476) | | | (21) | % | Professional services | | 9,592 | | | 6,649 | | 6,649 | | | 5,663 | | 5,663 | | | 2,943 | | 2,943 | | | 44 | | 44 | % | | 986 | | | 17 | | 17 | % |
| Intercompany technology platform expenses | | Intercompany technology platform expenses | | 948 | | | — | | | — | | | 948 | | | n/m | | — | | | n/m |
Other(1) | Other(1) | | 19,652 | | | 22,070 | | | (2,418) | | | (11) | % | Other(1) | | 37,753 | | | 24,786 | | 24,786 | | | 32,590 | | 32,590 | | | 12,967 | | 12,967 | | | 52 | | 52 | % | | (7,804) | | | (24) | | (24) | % |
| Directly attributable expenses | Directly attributable expenses | | $ | 364,169 | | | $ | 294,812 | | | $ | 69,357 | | | 24 | % | Directly attributable expenses | | $ | 513,073 | | | $ | | $ | 442,945 | | | $ | | $ | 364,169 | | | $ | | $ | 70,128 | | | 16 | | 16 | % | | $ | 78,776 | | | 22 | | 22 | % |
(1)Other expenses primarily include loan marketing expenses, member promotional expenses, tools and subscriptions, travel and occupancy-related costs.costs, and third-party loan fraud (net of related insurance recoveries).
2023 vs. 2022.Lending segment directly attributable expenses increased by $70.1 million, or 16%, for the year ended December 31, 2021 increased by $69.4 million, or 24%,2023 compared to the year ended December 31, 2020,2022, primarily due to:
•an increase of $23.8 million in direct advertising related to (i) an increase in search engine, television, social media and digital advertising expenditures, and offset by a decline in direct mail marketing expenditures;
•personal loan lead generation channels during 2023, (ii) an increase of $5.5 million in allocated compensation and related benefits, which correlated with increased overall headcount at the Company during the periodreflected increases in average compensation and average compensation per employeeheadcount in 2021, but was partially mitigated by a decline2023, (ii) an increase in the percentage of time allocated per employeedirect advertising primarily related to thedirect mail advertising, and (iv) an increase in other expenses, primarily related to loan marketing expenses and third-party loan fraud.
2022 vs. 2021. Lending segment during 2021;
•directly attributable expenses increased by $78.8 million, or 22%, for the year ended December 31, 2022 compared to 2021, primarily due to: (i) an increase of $14.5 million in loan originationdirect advertising primarily related to direct mail, search engine and servicing costs, which supported our growthsocial network advertising, partially offset by declines in origination volume year over year, primarily in home loans;
•an increase of $30.6 million due totelevision advertisement; (ii) increasing utilization of lead generation channels primarily associated with increased personal loan origination volume in 2021, which was partially offset by lower student loan origination volume through lead generation channels;
•a decrease of $1.2 million in unused warehouse line fees due to higher average committed warehouse line usage and lower unused fee rates;
•a decrease of $1.5 million in professional services costs primarily related to a decrease in the use of our third-party consultants for our operations and technology teams, partially offset by2022; (iii) an increase in advisory services;allocated compensation and
•a decrease of $2.4 million related benefits, which primarily reflected increases in other expenses, primarily related to decreases in occupancy-related costs, which was primarily driven by a decrease in the percentage of timeheadcount allocated to the Lending segment and increased average compensation in 2021.
Lending Segment — Year Ended December 31, 2020 Compared2022, partially offset by decreases in home loan commissions attributable to Year Ended December 31, 2019
Net interest income
Net interest incomedecreases in our Lending segment for the year ended December 31, 2020 decreasedhome loan originations; and (iv) a decrease in loan origination and servicing costs, which were largely attributable to decreases in home loan origination costs, partially offset by $126.2 million, or 39%, compared to the year ended December 31, 2019 due to the following:
Loans Interest Income. Loans interest income decreased by $240.1 million, or 42%. See “Resultsincreases in personal loan origination costs, each of Operations—Interest Income—Loans” within the section “Year Ended December 31, 2020 Compared to Year Ended December 31, 2019” for information on the primary drivers of the variance.
Securitizations Interest Income. Securitizations interest income increased by $0.9 million, or 4%. See “Results of Operations—Interest Income—Securitizations” within the section “Year Ended December 31, 2020 Compared to Year Ended December 31, 2019” for information on the primary drivers of the variance.which was correlated with origination volumes.
SecuritizationsTransfers of Financial Assets
We regularly transfer financial assets and Warehouses Interest Expense. Interest expense related to securitizations and warehouses decreased by $112.9 million,account for such transfers as either sales or 42%, due to:
•a decline in securitization debt interest expense (exclusive of debt issuance and discount amortization) of $66.7 million;
•a decline in warehouse debt interest expense (exclusive of debt issuance amortization) of $28.9 million;
•a decline in residual interests classified as debt interest expense of $17.9 million; and
•an offsetting increase in debt issuance cost interest expense of $0.6 million.
See “Results of Operations—Interest Expense—Securitizations and Warehouses” within the section “Year Ended December 31, 2020 Compared to Year Ended December 31, 2019” for informationsecured borrowings depending on the primary driversfacts and circumstances of the variances.transfer. The following table summarizes our whole loan sales:
Noninterest income | | | | | | | | | | | | | | | | | |
| Year Ended December 31, |
| 2023 | | 2022 | | 2021 |
| Personal loans | | | | | |
| Fair value of consideration received: | | | | | |
| Cash | $ | 567,904 | | | $ | 3,016,740 | | | $ | 3,373,655 | |
| Servicing assets recognized | 30,168 | | | 21,925 | | | 21,811 | |
| Repurchase liabilities recognized | (2,069) | | | (7,351) | | | (8,168) | |
| Total consideration received | 596,003 | | | 3,031,314 | | | 3,387,298 | |
| Aggregate unpaid principal balance and accrued interest of loans sold | 567,003 | | | 2,924,567 | | | 3,253,645 | |
| Realized gain | $ | 29,000 | | | $ | 106,747 | | | $ | 133,653 | |
Sale execution(1) | 105.5 | % | | 103.9 | % | | 104.4 | % |
| Student loans | | | | | |
| Fair value of consideration received: | | | | | |
| Cash | $ | 98,624 | | | $ | 883,859 | | | $ | 1,676,892 | |
| Servicing assets recognized | 2,792 | | | 9,275 | | | 15,526 | |
| Repurchase liabilities recognized | (16) | | | (134) | | | (300) | |
| Total consideration | 101,400 | | | 893,000 | | | 1,692,118 | |
| Aggregate unpaid principal balance and accrued interest of loans sold | 99,916 | | | 881,922 | | | 1,635,280 | |
| Realized gain | $ | 1,484 | | | $ | 11,078 | | | $ | 56,838 | |
Sale execution(1) | 101.5 | % | | 101.3 | % | | 103.5 | % |
| Home loans | | | | | |
| Fair value of consideration received: | | | | | |
| Cash | $ | 1,022,600 | | | $ | 1,057,596 | | | $ | 2,989,813 | |
| Servicing assets recognized | 10,184 | | | 13,926 | | | 31,294 | |
| Repurchase liabilities recognized | (1,765) | | | (1,158) | | | (3,288) | |
| Total consideration | 1,031,019 | | | 1,070,364 | | | 3,017,819 | |
| Aggregate unpaid principal balance and accrued interest of loans sold | 1,029,623 | | | 1,095,882 | | | 2,935,343 | |
| Realized gain (loss) | $ | 1,396 | | | $ | (25,518) | | | $ | 82,476 | |
Sale execution(1) | 100.3 | % | | 97.8 | % | | 102.9 | % |
Noninterest income in our Lending segment for the year ended December 31, 2020 increased by $172.8 million, or 159%, compared to the year ended December 31, 2019 due to the following:
Loan Origination and Sales. Loan origination and sales increased by $72.1 million, or 24%. See “Results of Operations—Noninterest Income and Net Revenue—Loan Origination and Sales” within the section “Year Ended December 31, 2020 Compared to Year Ended December 31, 2019” for information on the primary drivers of the variance.
Securitizations. Securitizations income increased by $128.9 million, or 65%. See “Results of Operations—Noninterest Income and Net Revenue—Securitizations” within the section “Year Ended December 31, 2020 Compared to Year Ended December 31, 2019” for information on the primary drivers of the variance.
Servicing. Servicing income decreased by $27.9 million, or 329%. See “Results of Operations—Noninterest Income and Net Revenue—Servicing” within the section “Year Ended December 31, 2020 Compared to Year Ended December 31, 2019” for information on the primary drivers of the variance.
Directly attributable expenses
The directly attributable expenses allocated to the Lending segment that were used in the determination of the segment's contribution profit were as follows:
| | | | | | | | | | | | | | | | | | | | | | | | | | |
| | Year Ended December 31, | | | | |
| ($ in thousands) | | 2020 | | 2019 | | $ Change | | % Change |
| Direct advertising | | $ | 102,562 | | | $ | 124,479 | | | $ | (21,917) | | | (18) | % |
| Compensation and benefits | | 82,592 | | | 126,710 | | | (44,118) | | | (35) | % |
| Loan origination and servicing costs | | 41,733 | | | 25,505 | | | 16,228 | | | 64 | % |
| Lead generation | | 24,603 | | | 30,255 | | | (5,652) | | | (19) | % |
| Unused warehouse line fees | | 14,113 | | | 8,073 | | | 6,040 | | | 75 | % |
| Professional services | | 7,139 | | | 8,080 | | | (941) | | | (12) | % |
Other(1) | | 22,070 | | | 27,409 | | | (5,339) | | | (19) | % |
| Directly attributable expenses | | $ | 294,812 | | | $ | 350,511 | | | $ | (55,699) | | | (16) | % |
_______________________________________
(1)Other expenses primarily include recruiting fees, as well as loan marketing expenses, toolsSale execution represents the ratio of cash proceeds and subscriptions and occupancy-related costs.
Lending segment directly attributable expenses for the year ended December 31, 2020 decreased by $55.7 million, or 16%, comparedservicing assets recognized to the year ended December 31, 2019 primarily due to:
•a decrease of $21.9 million in direct advertising related to an intentional reduction in advertising spend during the early stagesaggregate unpaid principal balance and accrued interest of the COVID-19 pandemic;loans sold. Amounts included in repurchase liabilities are excluded from the calculation, as they typically would not materially differ from the fair value markdown on the loans over the repurchase period had they been held on balance sheet and entered delinquency.
•a decrease of $44.1 million in allocated employee compensation and related benefits primarily driven by less direct time allocated to the Lending segment by the technology and product and operations teams related to an increased emphasis on non-lending initiatives in 2020;
•a decrease of $5.7 million in lead generation costs related to lower origination volume through our lead generation channels;
•a decrease of $0.9 million in professional services costs;
•a decrease of $5.3 million in other expenses, primarily related to decreases in occupancy-related costs;
•an increase of $16.2 million in loan origination and servicing costs driven primarily by volume increases in our home loan product; and
•an increase of $6.0 million in unused warehouse line fees correlated with an increase in warehouse facility capacity year over year.
Technology Platform Segment
In the table below, we present athe total accounts metric that is exclusiverelated to Galileo within our Technology Platform segment:
| | | | | | | | | | | | | | | | | | | | | | | | | | | | | | | | |
| | December 31, | | 2021 vs. 2020
% Change | | 2020 vs. 2019
% Change |
| | 2021 | | 2020 | | 2019 | | |
| Total accounts | | 99,660,657 | | | 59,735,210 | | | — | | | 67 | % | | n/m |
| | | | | | | | | | | | | | | | | | | | | | | | | | | | | | | | | | | | | | | | | | | | |
| | December 31, | | 2023 vs. 2022 | | 2022 vs. 2021 |
| | 2023 | | 2022 | | 2021 | | $ Change | | % Change | | $ Change | | % Change |
| Total accounts | | 145,425,391 | | | 130,704,351 | | | 99,660,657 | | | 14,721,040 | | | 11 | % | | 31,043,694 | | | 31 | % |
InSee “Key Business Metrics” for further discussion of this measure as it relates to our Technology Platform segment, total accounts refers to the number of open accounts at Galileo as of the reporting date. Beginning in the fourth quarter of 2021, we included segment.
SoFi accounts on the Galileo platform-as-a-service in our total accounts metric to better align with the Technology Platform segment revenue reported in Note 18 to the Notes to Consolidated Financial Statements. Intercompany revenue is eliminated in consolidation. We recast the total accounts as of December 31, 2020 to conform to the current year presentation. No information is reported prior to our acquisition of Galileo on May 14, 2020. Total accounts is a primary indicator of the amount of accounts that are dependent upon Galileo’s technology platform to use virtual card products, virtual wallets, make peer-to-peer and bank-to-bank transfers, receive early paychecks, separate savings from spending balances and rely upon real-time authorizations, all of which result in technology platform fees for the Technology Platform segment.Technologies, Inc.
Technology Platform Segment Results of Operations
The following table presents the measure of contribution profit for the Technology Platform segment for the years indicated. The information is derived fromsegment.
| | | | | | | | | | | | | | | | | | | | | | | | | | | | | | | | | | | | | | | | | | | | |
| | Year Ended December 31, | | 2023 vs. 2022 | | 2022 vs. 2021 |
| ($ in thousands) | | 2023 | | 2022 | | 2021 | | $ Change | | % Change | | $ Change | | % Change |
| Net interest income (expense) | | $ | 1,514 | | | $ | — | | | $ | (29) | | | $ | 1,514 | | | n/m | | $ | 29 | | | (100) | % |
| Noninterest income | | 350,826 | | | 315,133 | | | 194,915 | | | 35,693 | | | 11 | % | | 120,218 | | | 62 | % |
Total net revenue | | 352,340 | | | 315,133 | | | 194,886 | | | 37,207 | | | 12 | % | | 120,247 | | | 62 | % |
| Directly attributable expenses | | (257,554) | | | (238,620) | | | (130,439) | | | (18,934) | | | 8 | % | | (108,181) | | | 83 | % |
| Contribution profit | | $ | 94,786 | | | $ | 76,513 | | | $ | 64,447 | | | $ | 18,273 | | | 24 | % | | $ | 12,066 | | | 19 | % |
Net interest income
Net interest income in our internal financial reporting used for corporate management purposes. Refer to Note 18 in the Notes to Consolidated Financial Statements for further information regarding Technology Platform segment performance.
| | | | | | | | | | | | | | | | | | | | | | | | | | |
| | Year Ended December 31, | | 2021 vs. 2020
% Change |
| ($ in thousands) | | 2021 | | 2020 | | 2019(1) | |
| Net revenue | | | | | | | | |
| Net interest income (loss) | | $ | (29) | | | $ | (107) | | | $ | — | | | (73) | % |
| Noninterest income | | 194,915 | | | 96,423 | | | 795 | | | 102 | % |
Total net revenue | | 194,886 | | | 96,316 | | | 795 | | | 102 | % |
Directly attributable expenses(2) | | (130,439) | | | (42,427) | | | — | | | 207 | % |
| Contribution profit | | $ | 64,447 | | | $ | 53,889 | | | $ | 795 | | | 20 | % |
__________________
(1)A comparison of the year ended December 31, 2020in 2023 relates to the year ended December 31, 2019 for the Technology Platforminterest income earned on segment was not meaningful.
(2)For a disaggregation of the directly attributable expenses allocated tocash balances, which we began recording within the Technology Platform segment in eachthe third quarter of the years2023. Prior period amounts were determined to be immaterial, and presented see “Directly Attributable Expenses” below.
Technology Platform Segment — Year Ended December 31, 2021 Compared to Year Ended December 31, 2020within Corporate/Other.
Noninterest income
2023 vs. 2022. Noninterest income in our Technology Platform segment increased by $98.5$35.7 million, or 102%11%, for the year ended December 31, 20212023 compared to 2022. The increase was primarily attributable to growth in technology products and solutions fees driven by revenue contribution from Technisys for the full 2023 period compared to ten months of 2022. Noninterest income also included $22.2 million and $7.6 million of intercompany revenue for the years ended December 31, 2023 and 2022, respectively. The increase in intercompany revenue was primarily attributable to increased usage of technology platform services during the 2023 periods by our Financial Services segment, as well as within our Technology Platform segment, as we continue to leverage synergies to enhance our product offerings.
2022 vs. 2021. Noninterest income in our Technology Platform segment increased by $120.2 million, or 62%, for the year ended December 31, 2020, due2022 compared to 2021, of which $69.2 million was attributable to revenue contribution from the following:
Technology Platform Fees. Technology platformTechnisys Merger in 2022. The remaining increase was primarily attributable to growth in technology products and solutions fees driven by account growth and increased by $101.7activity among our existing integrated technology solutions clients. Noninterest income included $7.6 million or 113%, excluding an increase inand $1.9 million of intercompany Technology platform fees of $1.2 million. See “Results of Operations—Noninterest Income and Net Revenue—Technology Platform Fees” underrevenue for the section “Year Endedyears ended December 31, 2022 and 2021, Compared to Year Ended December 31, 2020” for information on the primary drivers of the variance.
Other. Other income decreased by $4.4 million, or 79%, which was primarily related to equity method investment income during 2020 that did not recur, as our Apex equity method investment was called in the first quarter of 2021.respectively.
Directly attributable expenses
The directly attributable expenses allocated to the Technology Platform segment which are related to the operations of Galileo, that were used in the determination of the segment's contribution profit were as follows:
| | Year Ended December 31, | |
| | Year Ended December 31, | | | | Year Ended December 31, | | 2023 vs. 2022 | | 2022 vs. 2021 |
| ($ in thousands) | ($ in thousands) | | 2021 | | 2020 | | $ Change | |
% Change | ($ in thousands) | | 2023 | | 2022 | | 2021 | | $ Change | | % Change | | $ Change | | % Change |
| Compensation and benefits | Compensation and benefits | | $ | 68,277 | | | $ | 19,168 | | | $ | 49,109 | | | 256 | % | Compensation and benefits | | $ | 151,041 | | | $ | | $ | 143,843 | | | $ | | $ | 68,277 | | | $ | | $ | 7,198 | | | 5 | | 5 | % | | $ | 75,566 | | | 111 | | 111 | % |
| Product fulfillment | Product fulfillment | | 31,492 | | | 12,913 | | | 18,579 | | | 144 | % | Product fulfillment | | 47,731 | | | 39,237 | | 39,237 | | | 31,492 | | 31,492 | | | 8,494 | | 8,494 | | | 22 | | 22 | % | | 7,745 | | | 25 | | 25 | % |
| Tools and subscriptions | | Tools and subscriptions | | 26,384 | | | 21,745 | | | 9,544 | | | 4,639 | | | 21 | % | | 12,201 | | | 128 | % |
| Professional services | Professional services | | 6,037 | | | 1,694 | | | 4,343 | | | 256 | % | Professional services | | 13,230 | | | 11,460 | | 11,460 | | | 6,037 | | 6,037 | | | 1,770 | | 1,770 | | | 15 | | 15 | % | | 5,423 | | | 90 | | 90 | % |
| Tools and subscriptions | | 9,544 | | | 4,243 | | | 5,301 | | | 125 | % |
Other(1) | Other(1) | | 15,089 | | | 4,409 | | | 10,680 | | | 242 | % | Other(1) | | 19,168 | | | 22,335 | | 22,335 | | | 15,089 | | 15,089 | | | (3,167) | | (3,167) | | | (14) | | (14) | % | | 7,246 | | | 48 | | 48 | % |
| Directly attributable expenses | Directly attributable expenses | | $ | 130,439 | | | $ | 42,427 | | | $ | 88,012 | | | 207 | % | Directly attributable expenses | | $ | 257,554 | | | $ | | $ | 238,620 | | | $ | | $ | 130,439 | | | $ | | $ | 18,934 | | | 8 | | 8 | % | | $ | 108,181 | | | 83 | | 83 | % |
(1)Other expenses are primarily related to marketing,travel and occupancy-related costs, bad debtadvertising and marketing, and data center expenses and other costs associated with the operation of our technology platform-as-a-service.costs.
The increase in 2023 vs. 2022.Technology Platform segment directly attributable expenses increased by $18.9 million, or 8%, for the year ended December 31, 20212023 compared to the year ended December 31, 2020 in each of the expense categories was partially impacted by the timing of our acquisition of Galileo during the second quarter of 2020 compared to full year results in 2021. The increase was also2022, primarily driven by the following:
•due to: (i) an increase of $49.1 million in compensation and benefits expense, which was correlated with an increase in Galileo and other allocated personnel to support segment growth, as well as an increase in average compensation during 2021;
•an increase of $18.6 million in product fulfillment costs, primarily related to payment processing network association fees associated with increased activity on the platform. These fees grew by 130% during 2021 compared to 2020, which correlated with growth of 113% in technology platform, fees;
•(ii) an increase in compensation and benefits expense, primarily related to bonus adjustments in the second quarter of $4.3 million2023 and the inclusion of Technisys in professional servicesour results for the full 2023 period, partially offset by a decrease in average headcount in 2023 corresponding with restructuring during the first quarter of 2023, and (iii) an increase in tools and subscriptions costs related to third-partyinternal technology and product consultinginitiatives to support the growth of the platform, along with the inclusion of Technisys in our results for technology infrastructure support;the full 2023 period.
2022 vs. 2021.Technology Platform segment directly attributable expenses increased by $108.2 million, or 83%, for the year ended December 31, 2022 compared to 2021, primarily due to: (i) an increase in compensation and benefits expense, which was correlated with an increase in personnel to support segment growth and of $5.3which Technisys compensation and benefits contributed $53.0 million during 2022; and (ii) an increase in tools and subscriptions costs related to headcount increases and internal technology initiatives to support the growth of the platform; and
•an increase of $10.7 million in other expenses, which was primarily related to (i) data center expenses, which correlatedplatform, along with the growthinclusion of Technisys in accounts on the Galileo platform, (ii) bad debt expense, which correlated with growing contract assets from increasing technology platform revenue, and (iii) occupancy-related costs.our 2022 results.
Technology Platform Segment — Year Ended December 31, 2020 Compared to Year Ended December 31, 2019
Noninterest income
Total net revenue of $96.3 million during the year ended December 31, 2020 was primarily related to our acquisition of Galileo in May 2020, which earns revenues from contracts with customers in accordance with ASC 606. The Technology Platform total net revenue primarily consisted of technology platform fees at Galileo. During the year ended December 31, 2019, total net revenue was comprised of our investment in Apex, from which we earned income under the equity method of accounting. Total net revenue contributed by Apex equity method income increased by $3.6 million year over year, and represented $4.4 million of the total net revenue balance for 2020. Our Apex equity method income during 2020 included an impairment charge of $4.3 million that resulted from measuring the carrying value of the investment as of December 31, 2020 equal to the payment we received in January 2021 upon the seller of our equity interest exercising its call rights on our investment in Apex.
Directly attributable expenses
For the year ended December 31, 2020, the directly attributable expenses allocated to the Technology Platform segment were related to the operations of Galileo. Refer to the corresponding table above for the partial period expenses during
2020. There were no directly attributable expenses allocated to the Technology Platform segment during the year ended December 31, 2019.
Financial Services Segment
In the table below, we present a keythe total products metric related to our Financial Services segment:
| | | | | | | | | | | | | | | | | | | | | | | | | | | | | | | | |
| | December 31, | | 2021 vs. 2020
% Change | | 2020 vs. 2019
% Change |
| Metric | | 2021 | | 2020 | | 2019 | | |
| Total products (number, as of period end) | | 4,094,245 | | | 1,605,910 | | | 387,357 | | | 155 | % | | 315 | % |
| | | | | | | | | | | | | | | | | | | | | | | | | | | | | | | | | | | | | | | | | | | | |
| | December 31, | | 2023 vs. 2022 | | 2022 vs. 2021 |
| | 2023 | | 2022 | | 2021 | | $ Change | | % Change | | $ Change | | % Change |
| Total products | | 9,479,470 | | | 6,554,039 | | | 4,094,245 | | | 2,925,431 | | | 45 | % | | 2,459,794 | | | 60 | % |
Total products in our Financial Services segment is a subset of our total products metric that refers to the number of SoFi Money accounts, SoFi Invest accounts, SoFi Credit Card accounts (including accounts with a zero dollar balance at the reporting date), SoFi At Work accounts and SoFi Relay accounts (with either credit score monitoring enabled or external linked accounts) that have been opened through our platform since our inception through the reporting date.metric. See “Key Business Metrics” for a further discussion of this measure as it relates to our Financial Services segment.
Financial Services Segment Results of Operations
The following table presents the measure of contribution loss for the Financial Services segment for the years indicated. The information is derived from our internal financial reporting used for corporate management purposes. Refer to Note 18 to the Notes to Consolidated Financial Statements for further information regarding Financial Services segment performance.segment.
| | | | Year Ended December 31, | | 2021 vs. 2020 % Change | | 2020 vs. 2019 % Change | | | Year Ended December 31, | | 2023 vs. 2022 | | 2022 vs. 2021 |
| ($ in thousands) | ($ in thousands) | | 2021 | | 2020 | | 2019 | | ($ in thousands) | | 2023 | | 2022 | | 2021 | | $ Change | | % Change | | $ Change | | % Change |
| Net revenue | | | | | | | | | | |
| Net interest income | | $ | 3,765 | | | $ | 484 | | | $ | 614 | | | 678 | % | | (21) | % |
Net interest income(1) | | Net interest income(1) | | $ | 334,847 | | | $ | 92,574 | | | $ | 3,765 | | | $ | 242,273 | | | 262 | % | | $ | 88,809 | | | n/m |
| Noninterest income | Noninterest income | | 54,313 | | | 11,386 | | | 3,318 | | | 377 | % | | 243 | % | Noninterest income | | 101,668 | | | 75,102 | | 75,102 | | | 54,313 | | 54,313 | | | 26,566 | | 26,566 | | | 35 | | 35 | % | | 20,789 | | | 38 | | 38 | % |
Total net revenue | Total net revenue | | 58,078 | | | 11,870 | | | 3,932 | | | 389 | % | | 202 | % | Total net revenue | | 436,515 | | | 167,676 | | 167,676 | | | 58,078 | | 58,078 | | | 268,839 | | 268,839 | | | 160 | | 160 | % | | 109,598 | | | 189 | | 189 | % |
Directly attributable expenses(1) | | (192,996) | | | (143,966) | | | (122,732) | | | 34 | % | | 17 | % |
| Directly attributable expenses | | Directly attributable expenses | | (436,777) | | | (367,102) | | | (192,996) | | | (69,675) | | | 19 | % | | (174,106) | | | 90 | % |
Contribution loss | Contribution loss | | $ | (134,918) | | | $ | (132,096) | | | $ | (118,800) | | | 2 | % | | 11 | % | Contribution loss | | $ | (262) | | | $ | | $ | (199,426) | | | $ | | $ | (134,918) | | | $ | | $ | 199,164 | | | (100) | | (100) | % | | $ | (64,508) | | | 48 | | 48 | % |
__________________
(1)Net interest income and, thereby, total net revenue and contribution loss for our Financial Services segment reported for the years ended December 31, 2023 and 2022 reflect the implementation of an FTP framework, under which Financial Services segment net interest income reflects the difference between an FTP credit for the segment’s provision of deposits as a source of funding and an FTP charge for the segment’s use of funds related to credit cards. For a disaggregation of the directly attributable expenses allocated tocomparative period ended December 31, 2021, our Financial Services segment net interest income was nominal, as it did not have deposits and the credit card product was nascent. If we had applied our current FTP framework during the comparative period, the Financial Services segment in each of the years presented, see “net interest income would not have materially changed.Directly Attributable Expenses” below.
Financial Services Segment — Year Ended December 31, 2021 Compared to Year Ended December 31, 2020
Net interest income
2023 vs. 2022.Net interest income in our Financial Services segment increased by $3.3$242.3 million, or 678%262%, for the year ended December 31, 20212023 compared to the year ended December 31, 2020,2022, which was primarily attributable to net interest income earned on our deposits, which includes interest income based on our FTP framework (which eliminates in consolidation) and interest expense to members. This net increase corresponds with the growth of deposits at SoFi Bank, as well as the impact of higher interest rates offered to members. In addition, net interest income earned on our credit card loans,cards increased, which launched duringincludes interest income earned on outstanding balances as well as interest expense incurred under the third quarterFTP framework, and was primarily attributable to growth in total credit cards.
2022 vs. 2021.Net interest income in our Financial Services segment increased by $88.8 million for the year ended December 31, 2022 compared to 2021, which was primarily attributable to net interest income earned on our deposits, which includes interest income based on our FTP framework (which eliminates in consolidation) and interest expense to members, and corresponds with the level of 2020.deposits at SoFi Bank. In addition, net interest income earned on our credit cards increased primarily due to growth in the average balance.
Noninterest income
2023 vs. 2022.Noninterest income in our Financial Services segment increased by $42.9$26.6 million, or 377%35%, for the year ended December 31, 20212023 compared to the year ended December 31, 2020,2022, primarily due to the following:
•increasesan increase in brokerage-relatedinterchange fees, of $19.3 million, which coincided with increases in digital assets trading volume on our platform during 2021, and payment network fees of $8.2 million, which coincided with increased credit card and debit card transaction volume;
•an increase of $2.7 million in enterprise servicetransactions, as well as brokerage-related fees, which primarily consisted of advisory service fees;
•an increase associated with equity capital markets services of $2.6 million, consisting of underwriting fees and dealer fees, which arrangements commenced in 2021; and
•an increase in referral fees of $9.9 million, which waswere primarily attributable to growth inincreased trading volume on our partner relationships and related activity, as we continue to onboard new partners and help drive volume to these partners, as well as an increase associated with a referral fulfillment arrangement we entered in the third quarter of 2021.platform during 2023.
2022 vs. 2021. Noninterest income in our Financial Services segment increased by $20.8 million, or 38%, for the year ended December 31, 2022 compared to 2021, primarily due to growth in referral fulfillment activity, as we continue to drive volume to our partners and an increase in interchange fees, which coincided with increased credit card and debit card transactions. The increase was partially offset by a decrease in brokerage-related fees, which was primarily attributable to decreased digital assets trading volume on our platform during 2022.
Directly attributable expenses
The directly attributable expenses allocated to the Financial Services segment that were used in the determination of the segment’s contribution loss were as follows:
| | Year Ended December 31, | |
| | Year Ended December 31, | | | | Year Ended December 31, | | 2023 vs. 2022 | | 2022 vs. 2021 |
| ($ in thousands) | ($ in thousands) | | 2021 | | 2020 | | $ Change | | % Change | ($ in thousands) | | 2023 | | 2022 | | 2021 | | $ Change | | % Change | | $ Change | | % Change |
| Compensation and benefits | Compensation and benefits | | $ | 81,176 | | | $ | 81,354 | | | $ | (178) | | | — | % | Compensation and benefits | | $ | 125,143 | | | $ | | $ | 110,288 | | | $ | | $ | 81,176 | | | $ | | $ | 14,855 | | | 13 | | 13 | % | | $ | 29,112 | | | 36 | | 36 | % |
| Provision for credit losses | | Provision for credit losses | | 54,945 | | | 54,332 | | | 7,573 | | | 613 | | | 1 | % | | 46,759 | | | 617 | % |
| Member incentives | | Member incentives | | 54,616 | | | 45,923 | | | 19,544 | | | 8,693 | | | 19 | % | | 26,379 | | | 135 | % |
| Product fulfillment | Product fulfillment | | 23,638 | | | 10,459 | | | 13,179 | | | 126 | % | Product fulfillment | | 49,829 | | | 33,713 | | 33,713 | | | 23,638 | | 23,638 | | | 16,116 | | 16,116 | | | 48 | | 48 | % | | 10,075 | | | 43 | | 43 | % |
| Member incentives | | 19,544 | | | 9,100 | | | 10,444 | | | 115 | % |
| Direct advertising | Direct advertising | | 19,051 | | | 8,083 | | | 10,968 | | | 136 | % | Direct advertising | | 44,347 | | | 36,660 | | 36,660 | | | 19,051 | | 19,051 | | | 7,687 | | 7,687 | | | 21 | | 21 | % | | 17,609 | | | 92 | | 92 | % |
| Lead generation | Lead generation | | 10,308 | | | 2,352 | | | 7,956 | | | 338 | % | Lead generation | | 36,447 | | | 30,418 | | 30,418 | | | 10,308 | | 10,308 | | | 6,029 | | 6,029 | | | 20 | | 20 | % | | 20,110 | | | 195 | | 195 | % |
| Intercompany technology platform expenses | | Intercompany technology platform expenses | | 12,961 | | | 4,600 | | | 1,863 | | | 8,361 | | | 182 | % | | 2,737 | | | 147 | % |
| Professional services | Professional services | | 3,832 | | | 5,853 | | | (2,021) | | | (35) | % | Professional services | | 12,719 | | | 4,590 | | 4,590 | | | 3,832 | | 3,832 | | | 8,129 | | 8,129 | | | 177 | | 177 | % | | 758 | | | 20 | | 20 | % |
| Intercompany technology platform expenses | | 1,863 | | | 686 | | | 1,177 | | | 172 | % |
| Provision for credit losses | | 7,573 | | | — | | | 7,573 | | | n/m |
Other(1) | Other(1) | | 26,011 | | | 26,079 | | | (68) | | | — | % | Other(1) | | 45,770 | | | 46,578 | | 46,578 | | | 26,011 | | 26,011 | | | (808) | | (808) | | | (2) | | (2) | % | | 20,567 | | | 79 | | 79 | % |
| Directly attributable expenses | Directly attributable expenses | | $ | 192,996 | | | $ | 143,966 | | | $ | 49,030 | | | 34 | % | Directly attributable expenses | | $ | 436,777 | | | $ | | $ | 367,102 | | | $ | | $ | 192,996 | | | $ | | $ | 69,675 | | | 19 | | 19 | % | | $ | 174,106 | | | 90 | | 90 | % |
(1)Other expenses primarily include operational product losses, third party fraud expense, travel and occupancy-related costs, tools and subscriptions, SoFi Money, SoFi Invest and SoFi Credit Card account write-offs and occupancy-related and marketing-relatedmarketing expenses.
2023 vs. 2022.Financial Services directly attributable expenses increased by $69.7 million, or 19%, for the year ended December 31, 20212023 compared to 2022, primarily due to: (i) an increase in product fulfillment costs, which included debit card fulfillment services, primarily related to our SoFi Money product, (ii) an increase in compensation and benefits expense, which reflected growth in the Financial Services segment that required additional staffing, as well as increased average compensation in 2023, (iii) an increase in direct member incentives utilized to drive adoption and usage of our Financial Services products, the most significant of which was our SoFi Money product, (iv) an increase in direct advertising costs primarily driven by an increase in online and digital advertising largely related to the promotion of our SoFi Money product, and (v) an increase related to utilization of lead generation channels, primarily related to our credit card and Relay products.
2022 vs. 2021. Financial Services directly attributable expenses increased by $49.0$174.1 million, or 34%90%, compared tofor the year ended December 31, 2020,2022 compared to 2021, primarily due to the following:
•to: (i) an increase of $13.2 million in product fulfillment costs related to SoFi Invest and SoFi Money, which included such activities as operating our cash management sweep program, brokerage expenses and debit card fulfillment services, and is also inclusive of the impact of our 8 Limited acquisition on a full year of operations during 2021. In addition, corresponding with the launch of ourprovision for credit card product during the third quarter of 2020, we had additional costs related to credit card fulfillment, which had a more significant impact in 2021;
•an increase of $10.4 million primarily related to direct member incentives for our SoFi Money and SoFi Invest products;
•an increase of $11.0 million in direct advertising costs,losses, which was primarily related to increases in the provision for credit cards due to higher average credit card balances combined with elevated credit card loss rates during 2022; (ii) an increase in compensation and benefits expense, which reflected our ongoing prioritization of growth in the Financial Services segment that required additional staffing, as well as increased social mediaaverage compensation in 2022; (iii) an increase in direct member incentives utilized to drive adoption and usage of our Financial Services products, the most significant of which was SoFi Checking and Savings; (iv) an increase related to utilization of lead generation channels during 2022, primarily related to SoFi Checking and Savings; and (v) an increase in direct advertising costs primarily driven by an increase in search engine and social network marketing costs. All marketing initiatives were primarily related to the continued promotion of SoFi Checking and growth in, our Financial Services products;Savings.
•an increase
Corporate/Other Non-Reportable Segment
Non-segment operations are classified as Corporate/Other, which includes net revenues associated with corporate functions, non-recurring gains and losses from non-securitization investment activities and interest income and realized gains and losses associated with investments in AFS debt securities, all of $8.0 million in lead generation costswhich are not directly related to increased activity through this channel, which was predominantly associated with SoFi Invest;
•an increase of $1.2 million in intercompany technology platform expenses related to higher volume of technology platform services provided to SoFi by Galileo;
•an increase of $7.6 million related to our provision for credit losses on our credit card product, which launched duringa reportable segment. For the third quarter of 2020 and, therefore, did not have meaningful activity during 2020; and
•a decrease of $2.0 million in professional services costs, which was primarily related to reduced third-party consulting for SoFi Money.
Financial Services Segment — Year Ended December 31, 2020 Compared to Year Ended December 31, 2019
Net interest income
Net interest income in our Financial Services segment for the yearyears ended December 31, 2020 decreased by $0.1 million, or 21%, compared to the year ended December 31, 2019 due to interest rate decreases during 2020, which resulted in lower2023 and 2022, net interest income earned onexpense within Corporate/Other also reflects the financial impact of our SoFi Money account balances.
Noninterest income
Noninterest income in our Financial Services segment forcapital management activities within the year ended December 31, 2020 increased by $8.1 million, or 243%, compared totreasury function, which reflects the year ended December 31, 2019, which was primarily due to a $2.2 million increase in referral fees, a $3.4 million increase in brokerage-related fees,residual impact from FTP charges and a $1.8 million increase in payment network fees. TheFTP
brokerage fees and payment network fees earned during 2020 were collectively bolstered by our acquisition of 8 Limited and increased member activity in both the SoFi Invest and SoFi Money products. The referral fee increase was primarily attributablecredits allocated to our material referral-related revenue relationships launched duringreportable segments under our FTP framework. The following table presents the third quartermeasure of 2019; therefore, 2019 is not fully comparable to 2020.total net loss for Corporate/Other:
Directly attributable expenses | | | | | | | | | | | | | | | | | | | | | | | | | | | | | | | | | | | | | | | | | | | | |
| | Year Ended December 31, | | 2023 vs. 2022 | | 2022 vs. 2021 |
| ($ in thousands) | | 2023 | | 2022 | | 2021 | | $ Change | | % Change | | $ Change | | % Change |
| Net interest expense | | $ | (35,394) | | | $ | (39,958) | | | $ | (9,594) | | | $ | 4,564 | | | (11) | % | | $ | (30,364) | | | 316 | % |
| Noninterest income (loss) | | (1,293) | | | (9,307) | | | 3,179 | | | 8,014 | | | (86) | % | | (12,486) | | | n/m |
Total net loss | | $ | (36,687) | | | $ | (49,265) | | | $ | (6,415) | | | $ | 12,578 | | | (26) | % | | $ | (42,850) | | | 668 | % |
The directly attributable expenses allocated to the Financial Services segment that were used in the determination of the segment's contribution loss were as follows:
| | | | | | | | | | | | | | | | | | | | | | | | | | |
| | Year Ended December 31, | | | | |
| ($ in thousands) | | 2020 | | 2019 | | $ Change | | % Change |
| Compensation and benefits | | $ | 81,354 | | | $ | 52,977 | | | $ | 28,377 | | | 54 | % |
| Product fulfillment | | 10,459 | | | 11,554 | | | (1,095) | | | (9) | % |
| Member incentives | | 9,100 | | | 8,894 | | | 206 | | | 2 | % |
| Direct advertising | | 8,083 | | | 23,038 | | | (14,955) | | | (65) | % |
| Lead generation | | 2,352 | | | 743 | | | 1,609 | | | 217 | % |
| Professional services | | 5,853 | | | 10,290 | | | (4,437) | | | (43) | % |
| Intercompany technology platform expenses | | 686 | | | — | | | 686 | | | n/m |
Other(1) | | 26,079 | | | 15,236 | | | 10,843 | | | 71 | % |
| Directly attributable expenses | | $ | 143,966 | | | $ | 122,732 | | | $ | 21,234 | | | 17 | % |
__________________
(1)Other expenses primarily include tools and subscriptions, SoFi Money and SoFi Invest account write-offs and occupancy-related and marketing-related expenses.
Financial Services directly attributable expenses for the year ended December 31, 2020 increased by $21.2 million, or 17%, compared to the year ended December 31, 2019 primarily due to the following:
•an increase in employee compensation and related benefits of $28.4 million, which dovetailed with the continued infrastructure, technology and support investments we made in our SoFi Money and SoFi Invest products during 2020;
•an increase of $0.2 million related to direct member incentives, which was reflective of relatively stable costs relative to our initial year costs for SoFi Money and SoFi Invest;
•an increase of $1.6 million in lead generation costs related to higher origination volume through our lead generation channels;
•an increase of $0.7 million in intercompany technology platform fees, related to technology platform services provided to SoFi by Galileo during our initial year of acquisition, which was 2020;
•an increase of $10.8 million in other expenses primarily related to write offs of SoFi Money accounts and tools and subscription costs;
•a decrease of $1.1 million in product fulfillment costs related to SoFi Invest and SoFi Money, which included such activities as operating our cash management sweep program, brokerage expenses and debit card fulfillment services. The net decrease in 2020 is primarily attributable to nonrecurring expenses incurred in 2019 due to the launch of the SoFi Money product, which was partially offset by increased fulfillment costs in 2020 driven by the growth of the SoFi Money and SoFi Invest products;
•a decrease of $15.0 million in direct advertising costs, such as social media and search engine advertising costs, which was primarily related to a strategic decision to spend less on marketing during the early stages of the COVID-19 pandemic; and
•a decrease of $4.4 million in professional services costs as a result of nonrecurring costs incurred in 2019 to support the launch of the SoFi Money and SoFi Invest products.
Reconciliation of Directly Attributable Expenses
The following table reconciles directly attributable expenses allocated to our reportable segments to total noninterest expense in the consolidated statements of operations and comprehensive income (loss) for the years indicated:loss:
| | Year Ended December 31, |
| 2021 | | 2020 | | 2019 |
| Year Ended December 31, | | | Year Ended December 31, |
| ($ in thousands) | | ($ in thousands) | 2023 | | 2022 | | 2021 |
| Reportable segments directly attributable expenses | Reportable segments directly attributable expenses | $ | (687,604) | | | $ | (481,205) | | | $ | (473,243) | |
| Intercompany technology platform expenses | 1,863 | | | 686 | | | — | |
| Intercompany expenses | |
| Expenses not allocated to segments: | Expenses not allocated to segments: | |
Share-based expense(1) | (239,011) | | | (99,870) | | | (60,936) | |
| Share-based compensation expense | |
| Share-based compensation expense | |
| Share-based compensation expense | |
Employee-related costs(1) | |
| Depreciation and amortization expense | Depreciation and amortization expense | (101,568) | | | (69,832) | | | (15,955) | |
| Goodwill impairment | |
| Fair value changes in warrant liabilities | Fair value changes in warrant liabilities | (107,328) | | | (20,525) | | | 2,834 | |
Employee-related costs(2) | (143,847) | | | (114,599) | | | (53,080) | |
Special payment(3)(2) | Special payment(3)(2) | (21,181) | | | — | | | — | |
Other corporate and unallocated expenses(4)(3) | Other corporate and unallocated expenses(4)(3) | (167,373) | | | (108,708) | | | (81,878) | |
| Total noninterest expense | Total noninterest expense | $ | (1,466,049) | | | $ | (894,053) | | | $ | (682,258) | |
__________________
(1)Includes share-based compensation expense and equity-based payments to non-employees.
(2)Includes compensation, benefits, restructuring charges, recruiting, certain occupancy-related costs and various travel costs of executive management, certain technology groups and general and administrative functions that are not directly attributable to the reportable segments.
(3)(2)Represents a special payment to the Series 1 preferred stockholders in connection with the Business Combination.Combination in the second quarter of 2021. See Note 1113. Equity to the Notes to Consolidated Financial Statements for additional information.
(3)Represents corporate overhead costs that are not allocated to reportable segments, which primarily includes corporate marketing and advertising costs, tools and subscription costs, professional services costs, corporate and FDIC insurance costs, foreign currency translation adjustments and transaction-related expenses.
Liquidity and Capital Resources Liquidity
We strive to maintain access to diverse funding sources and ample liquidity to fund our operating requirements, to pursue strategic growth initiatives and to meet our legal and regulatory requirements. Our principal sources of liquidity are our cash and cash equivalents, including cash from operations, and investments in other highly liquid assets.
We maintain a CALM policy that outlines specific requirements relating to the oversight of SoFi Technologies, Inc. (and its subsidiaries) capital planning, financial planning and forecasting, liquidity risk management, contingency funding planning, interest rate risk management, cash management and financial operations, among other activities. Oversight of these activities is the responsibility of our ALCO. The ALCO is comprised of a cross-functional leadership team that is responsible for managing our use of capital, liquidity, sources and uses of funding, and sensitivities to various market risks, by identifying key risks and exposures, monitoring them appropriately, establishing tolerances and limits, and mitigating risks where appropriate, to ensure the Company has the ability to meet its obligations.
The following table summarizes our total liquidity reserves:
| | | | | | | | | | | | | | | | | |
| December 31, 2023 |
| Amount Available | | Amount Borrowed / Utilized | | Remaining Available Capacity |
| Cash and cash equivalents | $ | 3,085,020 | | | n/a | | $ | 3,085,020 | |
Investments in AFS debt securities(1) | 463,448 | | | n/a | | 463,448 | |
Warehouse facilities(2) | 9,170,000 | | | 3,239,528 | | | 5,930,472 | |
Revolving credit facility(3) | 645,000 | | | 499,100 | | | 145,900 | |
FHLB advances(4) | 166,525 | | | 27,200 | | | 139,325 | |
Other lines of credit(5) | 50,000 | | | — | | | 50,000 | |
| Total liquidity | $ | 13,579,993 | | | $ | 3,765,828 | | | $ | 9,814,165 | |
___________________(1)Excludes investments in AFS debt securities which are pledged as collateral to the FHLB.
(2)Includes personal loan, student loan, credit card and risk retention warehouse facilities. For risk retention facilities, we only include capacity amounts wherein we can pledge additional asset-backed bonds and residual investments as of the date indicated. As of December 31, 2023, warehouse facility maturity dates ranged from January 2024 through January 2032. See Note 9. Debt to the Notes to Consolidated Financial Statements for additional information.
(3)As of December 31, 2023, the amount utilized under the revolving credit facility includes $13.1 million utilized to secure letters of credit. See Note 9. Debt to the Notes to Consolidated Financial Statements for additional information.
(4)Includes corporate overhead costs that are not allocated to reportable segments, such as brand advertising and corporate marketing costs, certain tools and subscription costs, and professional services costs.
Liquidity and Capital Resources
We require substantial liquidity to fund our current operating requirements, which primarily include loan originations and the losses generated by our Financial Services segment. We expect these requirements to increase as we pursue our strategic growth goals. Historically, our Lending cash flow variability has related to loan origination volume, our available funding sources and utilization of our warehouse facilities. Moreover, given our continued growth initiatives, we have seen variability in financing cash flows due to the timing and extent of common stock and redeemable preferred stock raises, redemptions, and additional uses and repayments of debt, and our convertible notes issuance. During February 2021, we paid off the seller note issued in 2020 in connection with our acquisition of Galileo, inclusive of all outstanding interest payable, for a total payment of $269.9 million. Remaining operating cash flow variability is largely related to our investments in our business, such as technology and product investments and sales and marketing initiatives, as well as our operating lease facilities. Our capital expenditures have historically been less significant relative to our operating and financing cash flows, and we expect this trend to continue for the foreseeable future. During the year ended December 31, 2021, we received significant liquidity from the Business Combination and the sale, in connection with the Business Combination, of 122,500,000 shares of SCH common stock at $10.00 per share (which automatically converted into shares of SoFi Technologies common stock) (the “PIPE Investment”) during the second quarter, as well as from our issuance of $1.2 billion aggregate principal amount of convertible senior notes in the fourth quarter, as further discussed herein.
To continue to achieve our liquidity objectives, we analyze and monitor liquidity needs and strive to maintain excess liquidity and access to diverse funding sources. We define our liquidity risk as the risk that we will not be able to:
•Originate loans at our current pace, or at all;
•Sell our loans at favorable prices, or at all;
•Meet our minimum capital requirements as a bank holding company and a national banking association;
•Meet our contractual obligations as they become due;
•Increase or extend the maturity of our revolving credit facility capacity;
•Satisfy our obligation to repay the convertible notes if they do not convert into common stock before maturity;
•Meet margin requirements associated with hedging or financing agreements;
•Fund continued operating losses in our business, especially if such operating losses continue at the current level for an extended period of time; or
•Make future investments in the necessary technological and operating infrastructure to support our business.
During the years ended December 31, 2021, 2020 and 2019, we generated negative cash flows from operations. The primary driver of operating cash flows related to our Lending segment are origination volume, the holding period of our loans, loan sale execution and, to a lesser extent, the timing of loan repayments. We either fund our loan originations entirely using our own capital, through proceeds from securitization transactions, or receive an advance rate from our various warehouse facilities to finance the majority of the loan amount. Our cash flows from operations were also impacted by material net losses in each of the years presented. The net losses were primarily driven by our technology and product investments and sales and marketing initiatives, which benefit each of our reportable segments. Our practice of not charging account or trading fees on the majority of our products within the Financial Services segment could result in sustained negative cash flows generated from the Financial Services segment in the short and long term. If our current net losses continue for the foreseeable future, we may raise additional capital in the form of equity or debt, which may not be at favorable terms when compared to previous financing transactions.
We have also utilized our revolving credit facility capacity to fund current liquidity needs in the normal course of business, such as general corporate activities. Our revolving credit facility had remaining capacity of $74.0 million as of December 31, 2021, of which $6.0 million was not available for general borrowing purposes because it was utilized to secure the uncollateralized portion of certain letters of credit issued to secure certain of our operating lease obligations. As of December 31, 2021, the remaining $3.12023, we had $131.7 million of the $9.1 million letters of credit outstanding was collateralized by cash deposits with the banking institution, which were presented within restricted cash and restricted cash equivalents in the consolidated balance sheets.
Our warehouse facility and securitization debt is secured by a continuing lien on, and security interest in, the loans financed by the proceeds.
Our operating lease obligations consist of our leases of real property from third parties under non-cancellable operating lease agreements, which primarily include the leases of office space, as well as our rights to certain suites and event space within SoFi Stadium, which commenced in the third quarter of 2020 and the latter of which we apply the short-term lease exemption practical expedient and do not capitalize the lease obligation. Our finance lease obligations consist of our rights to certain physical signage within SoFi Stadium, which commenced in the third quarter of 2020. Additionally, our securitization transactions require us to maintain a continuing financial interest in the form of securitization investments when we deconsolidate the special-purpose entity (“SPE”) or in consolidation of the SPE when we have a significant financial interest. In either instance, the continuing financial interest requires us to maintain capital in the SPE that would otherwise be available to us if we had sold loans through a different channel.
We are currently dependent on the success of our Lending segment. Our ability to access whole loan buyers, to sell our loans on favorable terms, to maintain adequate warehouse capacity at favorable terms, and to strategically manage our continuing financial interest in securitization-related transfers is critical to our growth strategy and our ability to have adequate liquidity to fund our balance sheet. There is no guarantee that we will be able to execute on our strategy as it relates to the timing and pricing of securitization-related transfers. Therefore, we may hold securitization interests for longer than planned or be forced to liquidate at suboptimal prices. Securitization transfers are also negatively impacted during recessionary periods, wherein purchasers may be more risk averse.
Further, future uncertainties around the demand for our personal loans and around the student loan refinance market in general should be considered when assessing our future liquidity and solvency prospects. Through the CARES Act that passed during 2020 in response to the COVID-19 pandemic and subsequent extensions, principal and interest payments on federally-held student loans were suspended most recently until May 2022, which in turn lowered the propensity for borrowers to refinance into SoFi student loans relative to pre-COVID levels. To the extent that additional measures, such as student loan forgiveness, are implemented, it may negatively impact our future student loan origination volume. In addition, we have previously altered our credit strategy to defend against adverse credit consequences during recessionary periods, as we did following the outbreak of COVID-19, although those elevated credit eligibility requirements for personal loans were adapted during the first half of 2021 through phases of reopening following our metric-driven, return-to-normalcy action plan. In the future, our loan origination volume and our resulting loan balances, and any positive cash flows thereof, could be lower based on strategic decisions to tighten our credit standards. See “Key Factors Affecting Operating Results—Industry Trends and General Economic Conditions” and “Business Overview—COVID-19 Pandemic” for discussions of the impact of certain measures taken in response to the COVID-19 pandemic on our loan origination volumes and uncertainties that exist with respect to future operations in light of the ongoing pandemic.
Our material commitments requiring, or potentially requiring, the use of cash in future periods are primarily composed of:
•warehouse facility borrowings, which primarily carry variable interest rates, and have terms expiring through January 2030. See Note 10 to the Notes to Consolidated Financial Statements for additional key terms;
•revolving credit facility borrowings, which includes principal balance and variable interest, assuming (i) such interest remains unchanged, (ii) the borrowings are held to maturity, and (iii) interest is incurred at the rate for standard withdrawals in effect as of December 31, 2021. See Note 10 for additional information;
•convertible senior notes, which do not bear regular interest, and will mature in October 2026 unless earlier repurchased, redeemed or converted. See “Borrowings” below for additional information;
•operating lease obligations, primarily composed of leases of office premises with terms expiring from 2022 through 2031, as well as operating leases associated with SoFi Stadium, which expire in 2040;
•finance lease obligations, composed of our rights to certain physical signage within SoFi Stadium, which expire in 2040;
•the remaining commitment arising out of our agreement (which does not include the foregoing operating lease and finance lease obligations, but includes certain payments for which we are applying the short-term lease exemption) for the naming and sponsorship rights to SoFi Stadium, which pertain primarily to sponsorship and advertising opportunities related to the stadium itself, as well as the surrounding performance venue and planned retail district. See Note 16 to the Notes to Consolidated Financial Statements for additional information on our SoFi Stadium arrangement, including a contingent matter associated with SoFi Stadium payments; and
•the remaining commitment related to a four-year cloud computing services arrangement that we executed in the fourth quarter of 2021. See Note 16 to the Notes to Consolidated Financial Statements for additional information.
As it relates to our securitization debt, the maturity of the notes issued by the various trusts occurs upon either the maturity of the loan collateral or full payment of the loan collateral held in the trusts, the timing of which cannot be reasonably estimated. Our own liquidity resources are not required to make any contractual payments on our securitization borrowings.
We may require liquidity resources associated with our guarantee arrangements. We have a three-year obligation to FNMA on loans that we sell to FNMA, to repurchase any originated loans that do not meet FNMA guidelines, and we are required to pay the full initial purchase price back to FNMA. In addition, we make standard representations and warranties related to other student, personal and non-FNMA home loan transfers, as well as limited credit-related repurchase guarantees on certain such transfers. If realized, any of the repurchases would require the use of cash. See “Off-Balance Sheet Arrangements”, as well as Note 1 and Note 16 to the Notes to Consolidated Financial Statements for further information on our guarantee obligations. We believe we have adequate liquidity to meet these expected obligations.
Our long-term liquidity strategy includes maintaining adequate warehouse capacity, corporate debt and other sources of financing, as well as effectively managing the capital raised through debt and equity transactions. Although our goal is to increase our cash flow from operations, there can be no assurance that our future operating plans will lead to improved operating cash flows.
We had unrestricted cash and cash equivalents of $494.7 million and $872.6 million as of December 31, 2021 and 2020, respectively. We believe our existing cash and cash equivalents balance, investments in AFS debt securities availableand $54.8 million of loans pledged as collateral to the FHLB to secure undrawn borrowing capacity underof $166.5 million, of which $27.2 million was utilized to secure letters of credit.
(5)Borrowing capacity with correspondent banks is unsecured.
We believe our revolving credit facility (and expected extensions or replacements of the facility), together with additional warehouses or other financing we expect to be able to obtain at reasonable terms and cash proceeds received from the Business Combination,existing liquidity will be sufficient to cover net losses, meet our existing working capital and capital expenditure needs, as well as our planned growth for at least the next 12 months.
Sources of Funding
Our non-securitization loansprimary funding sources include SoFi Bank deposits, warehouse funding, common and preferred equity capital, convertible debt, corporate revolving credit facility, securitizations, and other financings.
We offer deposit accounts (checking and savings accounts) to our members through SoFi Bank. We also representsource brokered and non-brokered wholesale deposits, which include certificates of deposit. As of December 31, 2023 and December 31, 2022, time deposit balances due in less than one year totaled $2.6 billion and $1.0 billion, respectively. As of December 31, 2023 and December 31, 2022, the amount of uninsured deposits totaled $348.1 million and $615.9 million, respectively. In 2023, we began to provide our members with access to expanded FDIC insurance coverage through a key sourcenetwork of liquidity for us,participating banks in our Insured Deposit Program, which contributed to the decrease in uninsured deposits relative to year end. As of December 31, 2023, approximately 98% of our total deposits were insured.
The following table presents uninsured time deposits as of December 31, 2023 by remaining time to maturity:
| | | | | | | | |
| ($ in thousands) | | December 31, 2023 |
| | |
| 3 months or less | | $ | 4,843 | |
| Over 3 months through 6 months | | 4,286 | |
| Over 6 months through 12 months | | 11,939 | |
| Over 12 months | | 200 | |
| Total uninsured time deposits | | $ | 21,268 | |
Uses of Funding
Our primary uses of funds include loan originations, investments in our business, such as technology and should be considered in assessingproduct investments and sales and marketing initiatives, as well as the losses generated by our overall liquidity. WeFinancial Services segment on a year-to-date basis. Our capital expenditures have relationships with whole loan buyers whohistorically been less significant relative to our operating and financing cash flows, and we believe we will be ableexpect this trend to continue to rely on to generate near-term liquidity. Securitization markets can also generate additional liquidity, albeit to a lesser extent, as it involves accessing a much less liquid securitization residual investment market, and in certain cases we are required to maintain a minimum investment due to securitization risk retention rules.for the foreseeable future.
We received gross cash consideration from the Business CombinationAs of $764.8 million, from which we made payments totaling $27.0 million during the year ended December 31, 2021 for costs directly attributable to the issuance of2023, we had debt obligations, common stock in connection with the Business Combination. Additionally, we used a portion of the funds for the repurchase of certainand redeemable commonpreferred stock from a shareholder for $150.0 million and for a special payment to Series 1 preferred stockholders for $21.2 million in accordance with the Agreement. In addition, we received gross cash consideration of $1.225outstanding.
billion from the PIPE Investment. The remaining net cash proceeds were utilized by the Company to help fund future strategic and capital needs, including repayment of $1.5 billion of loan warehouse facility debt in June 2021.
In October 2021, we closed on the issuance of $1.2 billion aggregate principal amount of convertible senior notes, from which we received net proceeds of $1.176 billion, after deducting the initial purchasers’ discount. See “Borrowings” below for additional information.
In November 2021, we announced that we would redeem all outstanding SoFi Technologies warrants that remained outstanding on December 6, 2021 (the “Redemption Date”) for a redemption price of $0.10 per warrant. The Warrants were exercisable by the holders thereof until the Redemption Date to purchase fully paid and non-assessable shares of common stock underlying such warrants. As a result of warrant exercises, we issued 15,193,668 shares of common stock and received cash proceeds of $95.0 million. At the end of the redemption period, we paid an immaterial amount to redeem unexercised SoFi Technologies warrants, which when combined with the warrant exercises, eliminated our SoFi Technologies warrants liability as of December 31, 2021. See Note 9 to the Notes to Consolidated Financial Statements for additional information.
In February 2022, we acquired Golden Pacific, after which we became a bank holding company and Golden Pacific Bank began operating as SoFi Bank. Shortly after the acquisition closed, we allocated $750 million in capital to SoFi Bank to pursue our national digital business plan. Golden Pacific Bank’s community bank business will continue to operate as a division of SoFi Bank.
Borrowings
Our borrowings as of December 31, 2021 primarily includeincluded our loan and risk retention warehouse facilities, asset-backed securitization debt, revolving credit facility and convertible notes. A detailed description of each of our borrowing arrangements is included in Note 10 to the Notes to Consolidated Financial Statements.
The amount of financing actually advanced on each individual loan under our loan warehouse facilities, as determined by agreed-upon advance rates, may be less than the stated advance rate depending, in part, on changes in underlying loan characteristics of the loans securing the financings. Each of our loan warehouse facilities allows the lender providing the funds to evaluate the market value of the loans that are serving as collateral for the borrowings or advances being made. As it relates to our current risk retention warehouse facilities, if the lender determines that the value of the collateral has decreased, the lender can require us to provide additional collateral or reduce the amount outstanding with respect to those loans (e.g., initiate a margin call). Our inability or unwillingness to satisfy the request could result in the termination of the facilities and possible default under our other loan funding facilities. In addition, a large unanticipated margin call could have a material adverse effect on our liquidity.
The amount owed and outstanding on our loan warehouse facilities fluctuates significantly based on our origination volume, sales volume, the amount of time it takes us to sellwe strategically hold loans on our loans,balance sheet, and the amount of loans being self-funded with cash. We may, from time to time, use surplus cash to self-fund a portion of our loan originations and risk retention in the case of securitization transfers.
We have various affirmative and negative financial covenants, as well as non-financial covenants, related to our warehouse debt and revolving credit facility, as well as our Series 1 preferred stock. Additionally, we have compliance requirements associatedfunded with our convertible notes, and certain provisions of the arrangement could change in the event of a “Make-Whole Fundamental Change”, as defined in the indenture.
The availability of funds under our warehouse facilities and revolving credit facility is subject to, among other conditions, our continued compliance with the covenants. These financial covenants include, but are not limited to, maintaining: (i) a certain minimum tangible net worth, (ii) minimum cash and cash equivalents, and (iii) a maximum leverage ratio of total debt to tangible net worth. A breach of these covenants can result in an event of default under these facilities and allows the lenders to pursue certain remedies. Our subsidiaries are restricted in the amount that can be distributed to SoFi only to the extent that such distributions would cause the financial covenants to not be met.
In addition, pursuant to our amended and restated Series 1 redeemable preferred stock agreement, we are subject to the following financial covenants:or member deposits.
•Tangible net worth to total debt ratio requirement, which excludes our warehouse, risk retention and securitization related debt;
•Tangible net worth to Series 1 redeemable preferred stock ratio requirement; and
•Minimum excess equity requirements, where the measure of equity includes permanent equity and redeemable preferred stock (exclusive of Series 1 redeemable preferred stock), as applicable.
We were in compliance with all covenants.
In October 2021, we closed on the issuance of $1.2 billion aggregate principal amount of convertible senior notes (the “Convertible Notes”“convertible notes”), which do not bear regular interest, will mature in October 2026 (unless earlier repurchased, redeemed or converted) and will be convertible by the noteholders beginning in April 2026 under certain circumstances. We will settle conversions by paying or delivering, at our election, cash, shares of our common stock or a combination of cash and shares of our common stock, based onIn December 2023, the applicable conversion rate(s). The Convertible Notes will be redeemable, in whole or in part, at our option at any time, and from timeCompany entered into agreements to time, beginning in October 2024 at a cash redemption price equal to therepurchase $88.0 million aggregate principal amount of the convertible notes, for which the Company issued 9,490,000 shares of common stock to be redeemed, plus accrued interest, if any. The conversion rate and conversion price will be subject to customary adjustments uponsettle. Following these repurchases, $1.1 billion aggregate principal amount of the occurrence of certain events. In addition, if certain corporate events that constitute a “Make-Whole Fundamental Change” (as defined in the indenture) occur, then the conversion rate will, in certain circumstances, be increased for a specified period of time. In addition, calling any note for redemption will also constitute a Make-Whole Fundamental Change with respect to that note, in which case the conversion rate applicable to the conversion of that note will be increased in certain circumstances if it is converted after it is called for redemption. Therefore, redemptionconvertible notes remain outstanding. Redemption events and conversion events (to the extent we elect to cash settle) could require a material use of cash at the time of the event.
See Note 12. Debt to the Notes to Consolidated Financial Statements for additional information on the conversion, settlement and redemption terms of the convertible notes. Additionally, the Convertible Notes may incur special interest in the event of default, or additional interest if the Company has not satisfied certain reporting conditions or the Convertible Notes are not otherwise freely tradable, as such term is defined in the indenture. If special interest or additional interest is incurred on the Convertible Notes,convertible notes, it could require an additional use of cash.
In connection with the pricingissuance of the Convertible Notes and with the exercise by the initial purchasers of their option to purchase additionalconvertible notes, which option was exercised, we entered into privately negotiated capped call transactionsCapped Call Transactions with certain financial institutions, (the “Capped Call Transactions”). The Capped Call Transactionswhich are expected to generally reduce the potential dilutive effect on the common stock upon any conversion of the notes and/or offset any cash payments we are required to make in excess of the principal amount of the converted notes, as the case may be. Refer to Note 13. Equity for additional information on the Capped Call Transactions. All of these transactions are expected to remain in effect notwithstanding the December 2023 repurchases.
The net proceeds from the October 2021 convertible debt issuance were $1.176$1.2 billion. We used $113.8 million of the net proceeds to fund the cost of entering into the Capped Call Transactions. We allotted the remainder of the net proceeds (i) to pay related expenses and (ii) for general corporate purposes.
Covenants
We have various affirmative and negative financial covenants, as well as non-financial covenants, related to our warehouse debt and revolving credit facility, as well as our Series 1 Redeemable Preferred Stock. Additionally, we have compliance requirements associated with our convertible notes, and certain provisions of the arrangement could change in the event of a “Make-Whole Fundamental Change”, as defined in the indenture governing such convertible notes.
The availability of funds under our warehouse facilities and revolving credit facility is subject to, among other conditions, our continued compliance with the covenants. These financial covenants include, but are not limited to, maintaining: (i) a certain minimum tangible net worth, (ii) minimum unrestricted cash and cash equivalents, (iii) a maximum leverage ratio of total debt to tangible net worth, and (iv) minimum risk-based capital and leverage ratios. A breach of these covenants can result in an event of default under these facilities and allows the lenders to pursue certain remedies. See Note 1012. Debt to the Notes to Consolidated Financial Statements for additional information. Our subsidiaries are restricted in the amount that can be distributed to SoFi only to the extent that such distributions would cause the financial covenants to not be met.
In addition, pursuant to our amended and restated agreement related to our Series 1 Redeemable Preferred Stock, we are subject to the following financial covenants:
•Tangible net worth to total debt ratio requirement, which excludes our warehouse, risk retention and securitization related debt;
•Tangible net worth to Series 1 Redeemable Preferred Stock ratio requirement; and
•Minimum excess equity requirements, where the measure of equity includes permanent equity and SoFi Technologies Redeemable Preferred Stock (exclusive of Series 1 Redeemable Preferred Stock), as applicable.
We were in compliance with all covenants as of December 31, 2023.
Capital Management
SoFi Technologies, a bank holding company, and SoFi Bank, a nationally chartered association, are required to comply with regulatory capital rules issued by the Federal Reserve and other U.S. banking regulators, including the OCC and FDIC. From time to time, we may contribute capital to SoFi Bank. We are required to manage our capital position to maintain sufficient capital to satisfy these regulatory rules and support our business activities, including the requirement to maintain minimum regulatory capital ratios in accordance with the Basel Committee on Banking Supervision standardized approach for U.S. banking organizations (U.S. Basel III). If the Federal Reserve finds that we are not “well-capitalized” or “well-managed”, we would be required to take remedial action, which may contain additional limitations or conditions relating to our activities.
These requirements establish required minimum ratios for CET1 risk-based capital, Tier 1 risk-based capital, total risk-based capital and a Tier 1 leverage ratio; set risk-weighting for assets and certain other items for purposes of the risk-based capital ratios; and define what qualifies as capital for purposes of meeting the capital requirements.
As of December 31, 2023, our regulatory capital ratios exceeded the thresholds required to be regarded as a well-capitalized institution, and meet all capital adequacy requirements to which we are subject. There have been no events or conditions since December 31, 2023 that management believes would change the categorization. See Note 21. Regulatory Capital to the Notes to Consolidated Financial Statements for the risk- and leverage-based capital ratios and amounts for SoFi Bank and SoFi Technologies.
Cash Requirements from Known Contractual Obligations and Other Commitments
The following table summarizes our cash requirements from known contractual obligations and other commitments as of December 31, 2021:2023:
| | | | | | | | | | | | | | | | | | | | | | | | | | | | | | | | |
| | Payments Due by Period |
| ($ in thousands) | | Total | | Less than 1 Year | | 1 – 3 Years | | 3 – 5 Years | | More than 5 Years |
Warehouse debt(1) | | $ | 1,641,253 | | | $ | 329,840 | | | $ | 1,205,589 | | | $ | 39,269 | | | $ | 66,555 | |
Revolving credit facility(2) | | 495,336 | | | 5,377 | | | 489,959 | | | — | | | — | |
Convertible Notes(3) | | 1,200,000 | | | — | | | — | | | 1,200,000 | | | — | |
| Operating lease obligations | | 167,395 | | | 22,287 | | | 44,286 | | | 39,874 | | | 60,948 | |
| Finance lease obligations | | 19,042 | | | 959 | | | 1,932 | | | 2,098 | | | 14,053 | |
LA Stadium Complex naming rights(4) | | 540,345 | | | 22,890 | | | 46,073 | | | 54,900 | | | 416,482 | |
Purchase commitment(5) | | 76,430 | | | 19,938 | | | 39,876 | | | 16,616 | | | — | |
Total contractual obligations(6) | | $ | 4,139,801 | | | $ | 401,291 | | | $ | 1,827,715 | | | $ | 1,352,757 | | | $ | 558,038 | |
| | | | | | | | | | | | | | | | | | | | | | | | | | | | | | | | |
| | Payments Due by Period |
| ($ in thousands) | | Total | | Less than 1 Year | | 1 – 3 Years | | 3 – 5 Years | | More than 5 Years |
Warehouse debt(1) | | $ | 3,249,375 | | | $ | 638,473 | | | $ | 2,581,173 | | | $ | 29,729 | | | $ | — | |
Revolving credit facility(2) | | 632,501 | | | — | | | — | | | 632,501 | | | — | |
Convertible notes(3) | | 1,111,972 | | | — | | | 1,111,972 | | | — | | | — | |
| Operating lease obligations | | 133,479 | | | 24,536 | | | 44,663 | | | 30,984 | | | 33,296 | |
Sponsorship, advertising, and cloud computing agreements(4) | | 670,329 | | | 85,807 | | | 104,610 | | | 90,082 | | | 389,830 | |
Total contractual obligations(5) | | $ | 5,797,656 | | | $ | 748,816 | | | $ | 3,842,418 | | | $ | 783,296 | | | $ | 423,126 | |
__________________
(1)The amounts reported exclude future interest expense, other than interest accrued as of December 31, 2021,2023, as it is difficult to predict the amount of interest we will incur due to the variability of the utilization of our warehouse debt and timing of collateral cash flows. As such, only principal commitments and the aforementioned accrued interest are included herein. See Note 1012. Debt to the Notes to Consolidated Financial Statements for additional information on our warehouse debt.
(2)Includes principal balance and variable interest on our revolving credit facility. The estimated interest payments assume that our borrowings under the revolving credit facility (i) remain unchanged, (ii) are held to maturity, and (iii) incur interest at the rate for standard withdrawals in effect as of December 31, 20212023 through its maturity. See Note 1012. Debt to the Notes to Consolidated Financial Statements for additional information on our revolving credit facility.
(3)The Convertible Notesconvertible notes will mature on October 15, 2026, unless earlier repurchased, redeemed or converted. See “Borrowings” for additional information on these provisions.
(4)The contractual obligations associated with the operating leaseSee Note 18. Commitments, Guarantees, Concentrations and finance lease components of the Naming and Sponsorship Agreement with the LA Stadium and Entertainment District are reported in the corresponding lines and are, therefore, excluded from amounts reported in this line. As of December 31, 2021, all payments associated with the planned retail district, which is currently expected to commence no earlier than 2022, are attributed to non-lease components. We do not expect the agreement to contain a material lease component, although the evaluation remains ongoing. See Note 16Contingencies to the Notes to Consolidated Financial Statements for additional information on our leases and on a contingent matter associated with SoFi Stadium payments.these financial commitments.
(5)Relates to a four-year purchase commitment for cloud computing services with a total of $80 million to be incurred through the term, of which $3.6 million was already incurred in 2021. See Note 16 to the Notes to Consolidated Financial Statements for additional information.
(6)Contractual obligations exclude residual interests classified as debt that result from transfers of assets that are accounted for as secured financings. Similarly, contractual obligations exclude securitization debt, as the maturity of the notes issued by the various trusts occurs upon either the maturity of the loan collateral or full payment of the loan collateral held in the trusts, the timing of which cannot be reasonably estimated. Additionally, our own liquidity resources are not required to make any contractual payments on these borrowings, except in limited instances associated with our guarantee arrangements. Our maturity date represents the legal maturity of the last class of maturing notes. See Note 1618. Commitments, Guarantees, Concentrations and Contingencies to the Notes to Consolidated Financial Statements for further discussion of our guarantees. Finally, contractual obligations exclude the impact of uncertain tax positions, as we are not able to reasonably estimate the timing of such future cash flows. See Note 1417. Income Taxes to the Notes to Consolidated Financial Statements for additional information on income taxes and unrecognized tax benefits.
Guarantees
We may require liquidity resources associated with our guarantee arrangements. As a component of our loan sale agreements, we make certain representations to third parties that purchased our previously held loans. We have a three-year obligation to GSEs on loans that we sell to GSEs, to repurchase any originated loans that do not meet certain GSE guidelines,
and we are required to pay the full initial purchase price back to the GSEs. In addition, we make standard representations and warranties related to personal, student and home loan transfers, as well as limited credit-related repurchase guarantees on certain such transfers. If realized, any of the repurchases would require the use of cash. See Note 18. Commitments, Guarantees, Concentrations and Contingencies to the Notes to Consolidated Financial Statements for further information on these and other guarantee obligations. We believe we have adequate liquidity to meet these expected obligations.
Factors Affecting Liquidity
We are currently dependent on the success of our lending business. The primary drivers of operating cash flows related to our Lending segment are origination volume, the holding period of our loans, loan sale execution and the timing of loan repayments. Our ability to access whole loan buyers, to sell our loans on favorable terms, to maintain adequate warehouse capacity at favorable terms, to access new deposits and grow existing deposits and to strategically manage our continuing financial interest in securitization-related transfers is critical to our growth strategy and our ability to have adequate liquidity to fund our balance sheet. Our ability to attract and maintain deposits can be impacted by, among other things, general economic conditions, the condition of the banking sector (such as bank failures or exposure to credit, market, operational, legal and reputational risks), competition from other financial services firms, idiosyncratic events and the interest rates we offer, which can impact our liquidity from deposits. Through 2023, we continued to have strong deposit contribution. During 2023, we also provided our members with access to expanded FDIC insurance coverage through a network of participating banks in our Insured Deposit Program.
There is no guarantee that we will be able to execute on our strategy as it relates to the timing and pricing of securitization-related transfers. Therefore, we may hold securitization interests for longer than planned or be forced to liquidate at suboptimal prices. Securitization transfers are also negatively impacted during recessionary periods, wherein purchasers may be more risk averse.
Further, future uncertainties around the demand for our personal loans, home loans and around the student loan refinance market in general, including as a result of worsening macroeconomic conditions or continued turmoil in the banking and financial services sectors, should be considered when assessing our future liquidity and solvency prospects. In the future, our loan origination volume and our resulting loan balances, and any positive cash flows thereof, could also be lower based on strategic decisions to tighten our credit standards.
In addition to our ability to pledge unencumbered loans against available warehouse capacity, we have relationships with whole loan buyers who have historically demonstrated strong demand for our loans. Securitization markets can also generate additional liquidity; however, financing through the securitization market could result in worse execution as compared to whole loans sales depending on market conditions and, in certain cases, we are required to maintain a minimum investment due to securitization risk retention rules.
Additionally, our securitization transactions require us to maintain a continuing financial interest in the form of securitization investments when we deconsolidate the SPE or in consolidation of the SPE when we have a significant financial interest. In either instance, the continuing financial interest requires us to maintain capital in the SPE that would otherwise be available to us if we had sold loans through a different channel. As it relates to our securitization debt, the maturity of the notes issued by the various trusts occurs upon either the maturity of the loan collateral or full payment of the loan collateral held in the trusts, the timing of which cannot be reasonably estimated. Our own liquidity resources are not required to make any contractual payments on our securitization borrowings.
Our cash flows from operations have also historically been impacted by material net losses. While we achieved net income profitability for the first time during the fourth quarter of 2023, changing business, macroeconomic or other conditions could potentially lead us, in the future, to raise additional capital in the form of equity or debt, which may not be at favorable terms when compared to previous financing transactions.
Our long-term liquidity strategy includes continuing to grow our deposit base, maintaining adequate warehouse capacity, maintaining corporate debt and other sources of financing, as well as effectively managing the capital raised through debt and equity transactions. Although our goal is to increase our cash flow from operations, there can be no assurance that our future operating plans will lead to improved operating cash flows.
The FDIA and FDIC regulations generally limit the ability of an insured depository institution to accept, renew or roll over any brokered deposit unless the institution’s capital category is “well capitalized” or, with the FDIC’s approval, “adequately capitalized.” See Part I, Item 1. “Government Supervision and Regulation—Brokered Deposits” for additional information. As of December 31, 2023, our regulatory capital ratios exceeded the thresholds required to be regarded as a well-capitalized institution, and meet all capital adequacy requirements to which we are subject.
Cash Flow and Liquidity Analysis
The following table provides a summary of cash flow data:
| | Year Ended December 31, |
| | Year Ended December 31, | | | | Year Ended December 31, |
| ($ in thousands) | ($ in thousands) | | 2021 | | 2020 | | 2019 | ($ in thousands) | | 2023 | | 2022 | | 2021 |
| Net cash used in operating activities | Net cash used in operating activities | | $ | (1,350,217) | | | $ | (479,336) | | | $ | (54,733) | |
| Net cash provided by investing activities | | 110,193 | | | 258,949 | | | 114,868 | |
| Net cash (used in) provided by investing activities | |
| Net cash provided by financing activities | Net cash provided by financing activities | | 684,987 | | | 853,754 | | | 93,077 | |
Cash Flows from Operating Activities
For the year ended December 31, 2023, net cash used in operating activities of $7.2 billion stemmed from a net loss of $300.7 million and an unfavorable change in our operating assets net of operating liabilities of $7.6 billion, partially offset by a positive adjustment for non-cash items of $706.8 million. The change in operating assets net of operating liabilities was primarily a result of our loan origination and sales activities. We originated loans of $17.4 billion during the year and also purchased loans of $198.7 million. These cash uses were partially offset by principal payments on loans of $7.2 billion and proceeds from loan sales of $2.1 billion.
For the year ended December 31, 2022, net cash used in operating activities of $7.3 billion stemmed from a net loss of $320.4 million and an unfavorable change in our operating assets net of operating liabilities of $7.5 billion, partially offset by a positive adjustment for non-cash items of $560.1 million. The change in operating assets net of operating liabilities was primarily a result of our loan origination and sales activities. We originated loans of $13.0 billion during the year and also purchased loans of $2.5 billion. These cash uses were largely offset by principal payments on loans of $3.1 billion and proceeds from loan sales of $4.9 billion.
For the year ended December 31, 2021, net cash used in operating activities wasof $1.4 billion which stemmed from a net loss of $483.9 million that had a positive adjustment for non-cash items of $479.0 million and an unfavorable change in our operating assets net of operating liabilities of $1.3 billion.billion, partially offset by a positive adjustment for non-cash items of $479.0 million. The change in operating assets net of operating liabilities was primarily a result of our loan origination and sales activities. We originated loans of $13.0 billion during the year and also purchased loans of $451.0 million, the latter of which were primarily related to securitization clean-up calls (purchases we elect to make when the risk retention period has sunset).million. These cash uses were offset by principal payments on loans of $2.2 billion and proceeds from loan sales of $10.0 billion.
For the year ended December 31, 2020, net cash used in operating activities was $479.3 million, which stemmedCash Flows from a net loss of $224.1 million that had a positive adjustment for non-cash items of $142.0 million, and an unfavorable change in our operating assets net of operating liabilities of $397.3 million. The change in operating assets net of operating liabilities was primarily a result of our loan origination and sales activities. We originated loans of $9.7 billion during the year and also purchased loans of $690.2 million, of which $606.3 million related to strategic loan purchases we made during the year, wherein we believed we could earn net interest income prior to selling the loan for a subsequent gain. These cash uses were largely offset by principal payments from members of $1.9 billion and proceeds from loan sales of $8.0 billion.Investing Activities
For the year ended December 31, 2019,2023, net cash used in operatinginvesting activities of $1.9 billion was $54.7primarily attributable to $1.4 billion related to loan activities, primarily driven by student loans, senior secured loans and credit cards, net purchases of $381.0 million related to our investments in AFS debt securities, $111.4 million for purchases of property, equipment and software, which stemmed from a net loss of $239.7primarily included internally-developed software and purchased software, $72.3 million that had a positive adjustment for non-cash items of $114.9 million, and a favorable change in operating assetsrelated to business combinations, net of operating liabilitiescash acquired, which includes our acquisition of $70.0 million. The changeWyndham and settlements of vested employee performance awards associated with the Technisys Merger, and $66.6 million related to purchases of non-securitization investments, primarily FRB stock and FHLB stock. These uses were partially offset by proceeds of $108.3 million from our securitization investments.
For the year ended December 31, 2022, net cash used in operating assets netinvesting activities of operating liabilities$106.3 million was primarily a resultattributable to proceeds of $118.8 million from our loan originationsecuritization investments and sales activities. We originated loansthe aggregate net cash acquired from the Technisys Merger and Bank Merger of $11.2 billion during the period and also purchased certain loans$58.5 million. These sources were more than offset by net cash uses of $47.3$173.7 million the majority of which were related to securitization clean-up calls. Furthermore, we alsoloan activities, primarily driven by credit cards, $93.2 million for purchases of property, equipment and software, which primarily included internally-developed software and purchased loanssoftware, as well as $10.5 million related to costs incurred in the development and enhancement of $331.6 millionsoftware to provide additional loan collateral for securitizations that we sponsored during 2019. These cash uses were offset by principal payments from members of $2.5 billion and proceeds from loan sales of $9.1 billion.
Cash Flows from Investing Activitiesbe sold, leased or marketed.
For the year ended December 31, 2021, net cash provided by investing activities wasof $110.2 million which was primarily attributable to proceeds of $107.5 million from the call on our Apex equity method investment and $16.7 million from repayment of the outstanding principal balance on its related party notes, as well as proceeds of $247.1 million from our securitization investments. These cash proceeds were partially offset by $246.4 million of investments made in AFS debt securities, reduced by proceeds of $57.5 million from sales and maturities of these investments. Additionally, we made an
equity method investment of $20.0 million during the third quarter of 2021. Lastly, we used cash of $52.3 million for purchases of property, equipment and software, which primarily included internally-developed software, purchased software, and furniture and fixtures.
For the year ended December 31, 2020, net cash provided by investing activities was $258.9 million, which was primarily attributable to proceeds
Cash Flows from our securitization investments of $322.7 million, partially offset by our acquisition activities during the year, which resulted in a net use of cash of $32.4 million. Moreover, we extended additional financing to Apex during the year, which required a use of cash of $7.6 million. Lastly, we used $24.5 million for purchases of property, equipment and software.Financing Activities
For the year ended December 31, 2019,2023, net cash provided by investingfinancing activities of $10.9 billion was $114.9 million, primarily resulting from $165.1 million in proceedsattributable to net cash sources from our securitization investments,SoFi Bank deposits of $11.2 billion. This was partially offset by $37.6debt repayments of $799.9 million which exceeded our proceeds from debt financing activity of $520.5 million, which were primarily related to our warehouse facilities. Our payments of debt issuance costs were in purchasesthe normal course of property, equipmentbusiness and software. In 2019,reflective of our recurring debt warehouse facility activity, which involves securing new warehouse facilities and extending existing warehouse facilities.
For the year ended December 31, 2022, net cash provided by financing activities of $8.4 billion was primarily attributable to net cash sources from our SoFi Bank deposits of $7.2 billion. Additionally, our proceeds from debt financing activities of $1.9 billion exceeded our debt repayments of $516.4 million, which were primarily related to our warehouse facilities. Our payments of debt issuance costs were in the normal course of business and reflective of our recurring debt warehouse facility activity, which involves securing new warehouse facilities and extending existing warehouse facilities. Finally, we made significant leasehold improvement capital expenditures at our corporate headquarters in San Francisco, California. Lastly, we made our first loanpaid redeemable preferred stock dividends of $40.4 million and taxes related to Apex during 2019, which required a useRSU vesting of cash of $9.1$9.0 million.
Cash Flows from Financing Activities
For the year ended December 31, 2021, net cash provided by financing activities was $685.0 million. We received proceeds from the Business Combination and PIPE Investment of $2.0 billion, and paid costs directly related to the Business Combination and PIPE Investment of $27.0 million. We received $9.5$1.2 billion of proceeds from debt financing activities related to our lending activities and issuance of our convertible notes. These debt proceeds were more than offset by $10.4$0.9 billion of debt repayments, of which $9.5 billion were related to our warehouse facilities and $250 million were related to repayment of the seller note. We also had capped call purchases of $113.8 million in connection with the issuance of our Convertible Notes.convertible notes. Our payments of debt issuance costs were in the normal course of business and were primarily reflective of our recurring debt warehouse facility activity, which involves securing new warehouse facilities and extending existing warehouse facilities.activity. We also received proceeds from warrant exercises of $95.0 million. We paid taxes related to RSU vesting of $42.6 million, as well as redeemable preferred stock dividends of $40.4 million. We also received $25.2 million of proceeds from common stock option exercises during the period.exercises. Finally, we paid $282.9 million to repurchase redeemable common and preferred stock, and $0.5 million to repurchase common stock during the year.stock.
For the year ended December 31, 2020, net cash provided by financing activities was $853.8 million. We received $10.2 billion of proceeds from debt financing activities, which were primarily attributable to our lending activities and included a $325.0 million draw on our revolving credit facility during the year. These debt proceeds were partially offset by $9.7 billion of debt repayments, $8.6 billion of which were related to our warehouse facilities. Our payments of debt issuance costs were in the normal course of business and reflective of our recurring debt warehouse facility activity, which involves securing new warehouse facilities and extending existing warehouse facilities. We also generated cash of $369.8 million from a common stock issuance in the fourth quarter of 2020. We paid Series 1 redeemable preferred stock dividends of $40.5 million and taxes related to RSU vesting of $31.3 million. These uses were offset by principal repayments of $43.5 million related to our stockholder note receivable, which was fully paid off as of December 31, 2020.
For the year ended December 31, 2019, net cash provided by financing activities was $93.1 million. Our financing activities were primarily driven by proceeds from debt issuances of $12.5 billion, more than offset by principal payments on debt of $12.8 billion. In addition, we generated cash from preferred stock issuances of $573.8 million, gross of issuance costs of $2.4 million. The debt issuance and payment activity was related to our revolving credit facility, warehouse financing facilities, residual interests classified as debt and securitization debt. In May 2019, we issued 26,438,798 shares of Series H and 3,234,000 shares of Series 1 redeemable preferred stock for combined net proceeds of $536.6 million. In October 2019, we issued an additional 4,273,651 shares of Series H preferred stock for proceeds of $34.8 million. In 2019, we paid $23.9 million in dividends on the Series 1 redeemable preferred stock. Additionally, we issued a note receivable to a stockholder, which resulted in a net cash outflow of $43.5 million. Finally, we paid taxes in connection with RSU vesting of $21.4 million.
Other Arrangements
We enter into arrangements in which we originate loans, establish an SPE and transfer loans to the SPE, which has historically served as an important source of liquidity. We also retain the servicing rights of the underlying loans and hold additional interests in the SPE. When an SPE is determined not to be a VIE or when an SPE is determined to be a VIE but we are not the primary beneficiary, the SPE is not consolidated. In addition, a significant change to the pertinent rights of other parties or our pertinent rights, or a significant change to the ranges of possible financial performance outcomes used in our assessment of the variability of cash flows due to us, could impact the determination of whether or not a VIE is consolidated.
VIE consolidation and deconsolidation may lead to increased volatility in our financial results and impact period-over-period comparability. See Note 11. Organization, Summary of Significant Accounting Policies and New Accounting Standards to the Notes to Consolidated Financial Statements for our VIE consolidation policy.
WeHistorically, we have established personal loan trusts and student loan trusts that were created and designed to transfer credit and interest rate risk associated with the underlying loans through the issuance of collateralized notes and residual certificates. We hold a variable interest in the trusts through our ownership of collateralized notes in the form of asset-backed bonds and residual certificates in the trusts.certificates. The residual certificates absorb variability and represent the equity ownership interest in the equity portion of the personal loan trusts and student loan trusts.
We are also the servicer for all trusts in which we hold a financial interest. Although we have the power as servicer to perform the activities that most impact the economic performance of the VIE, we do not hold a significant financial interest in the trusts and, therefore, we are not the primary beneficiary. Further, we do not provide financial support beyond our initial equity investment, and our maximum exposure to loss as a result of our involvement with nonconsolidated VIEs is limited to our investment. For a more detailed discussion of nonconsolidated VIEs, including related activity in relation toduring the establishment of trusts, the aggregate outstanding values of variable interestsyear, see Note 7. Securitization and the deconsolidation of VIEs, see Note 6Variable Interest Entities to the Notes to Consolidated Financial Statements.
As a component of our loan sale agreements, we make certain representations to third parties that purchased our previously held loans, which includes FNMA repurchase requirements, general representations and warranties and credit-related repurchase requirements, all of which are standard in nature and, therefore, do not constrain our ability to recognize a sale for accounting purposes. Pursuant to ASC 460, Guarantees, we establish a loan repurchase liability, which is based on historical experience and any current developments which would make it probable that we would buy back loans previously sold to third parties at the historical sales price. Our credit-related repurchase requirements are assessed for loss under ASC 326, Financial Instruments—Credit Losses. During the year ended December 31, 2021, we made repurchases of $8.8 million associated with these arrangements. As of December 31, 2021, we accrued liabilities of $7.4 million related to our estimated repurchase obligation.
Financial Condition Summary
December 31, 2021 compared to December 31, 2020
Changes in the composition and balance of our assets and liabilities as of December 31, 20212023 compared to December 31, 20202022 were principally attributed to the following:
•a decreasean increase of $555.0 million$1.8 billion in cash and cash equivalents and restricted cash and restricted cash equivalents. See “Cash Flow and Liquidity Analysis” for further discussion of our cash flow activity;
•an increase of $194.9 million in investments in AFS debt securities, which we began purchasing during the third quarter of 2021;
•an increase in loans of $1.2$9.1 billion, which was primarily stemming from originations and purchases of $13.5 billion, offset by principal payments and sales of $12.3 billion;
•a decrease in equity method investments of $87.8 million, primarily from Apex calling our investment, which resulted in cash proceeds of $107.5 million, offset by a $20.0 million new equity method investment during the third quarter of 2021;
•a decrease in securitization investments of $122.2 million, primarily from collections outpacing new securitization investments in nonconsolidatedrelated to increased personal and student loan VIEs;
•a decrease in intangible assets of $70.5 million, primarily due to the amortization of developed technologyoriginations and customer-related intangible assets acquired in the second quarter of 2020;
•a decrease in related party notes receivable of $17.9 million, as Apex repaid their outstanding loans;
•a decrease of $1.2 billion in gross warehouse facility debt, which was primarily enabled by proceeds received from the Business Combination and PIPE Investment;
•an increase of $1.2 billion related to our issuance of Convertible Notes in the fourth quarter of 2021;
•a decrease of $250.0 million in liabilities related to the settlement in February 2021 of the Galileo seller note;
•a decrease of $595.5 million in liabilities related to gross securitization debt, which was settled with proceeds from related collateral repayments;
•a decrease in warrant liabilities of $40.0 million related to the reclassification of the Series H warrants to permanent equity classification in conjunction with the Business Combination; andlonger loan holding periods;
•a decreasean increase in deposits of $133.4$11.3 billion, which was primarily related to increased savings deposits from members and increased broker deposits; and
•an increase of $180.6 million in liabilities relatedgross warehouse and risk retention facility debt to support our originations during the exercisecurrent period, which reflected the net impact of our call option rights in December 2020, for which the payable outstanding at December 31, 2020 was paid in January 2021.$12.3 billion of cash borrowings and $12.1 billion of cash repayments.
Critical Accounting Policies and Estimates Our consolidated financial statements have been prepared in accordance with accounting principles generally accepted in the United States.GAAP. In preparing our consolidated financial statements, we make judgments, estimates and assumptions that affect reported amounts of assets and liabilities, as well as revenues and expenses. We base our assumptions, judgments and estimates on historical experience and various other factors that we believe to be reasonable under the circumstances. The results involve judgments about the carrying values of assets and liabilities not readily apparent from other sources. Actual results could differ materially from these estimates under different assumptions or conditions. We regularly evaluate our estimates, assumptions and judgments, particularly those that include the most difficult, subjective or complex judgments and are often about matters that are inherently uncertain. See Note 11. Organization, Summary of Significant Accounting Policies and New Accounting Standards to the Notes to Consolidated Financial Statements for a summary of our significant accounting policies. The most significant judgments, estimates and assumptions relate to the critical accounting policies, which are discussed in detail below. We evaluate our critical accounting policies and estimates on an ongoing basis and update them as necessary based on changes in market conditions or factors specific to us.
Share-Based Compensation
We have offered stock options, RSUs and PSUs to employees and non-employees. We measure and recognize compensation expense for all share-based awards made to employees based on estimated fair values on the date of grant. The compensation expense is recognized on a straight-line basis over the requisite service period for time-based awards with only service conditions. Share-based awards with performance conditions are expensed under the accelerated attribution method based on each vesting tranche. We recognize forfeitures as incurred and, therefore, reverse previously recognized share-based compensation expense at the time of forfeiture. We use the Black-Scholes Option Pricing Model (the “Black-Scholes Model”) to estimate the fair value of stock options. RSUs are measured based on the fair values of our underlying common stock on the dates of grant. We estimate the grant-date fair values of PSUs utilizing a Monte Carlo simulation model.
Stock Options
The Black-Scholes Model requires the use of subjective assumptions, including the risk-free interest rate, expected term, expected stock price volatility and dividend yield. The risk-free interest rate assumption was based upon observed interest rates for constant maturity U.S. Treasury securities consistent with the expected term of our stock options. The expected term represents the period of time the stock options are expected to be outstanding and was based on the simplified method. Under the simplified method, the expected term of a stock option is presumed to be the midpoint between the vesting date and the end of the contractual term. Management used the simplified method for stock option grants during the year ended December 31, 2020 due to the lack of sufficient historical exercise data to provide a reasonable basis upon which to otherwise estimate the expected term of the stock options. Expected volatility was based on historical volatility for publicly-traded stock of comparable companies over the estimated expected life of the stock options. In identifying comparable companies, we considered factors such as industry, stage of life cycle and size. We assumed no dividend yield because we do not expect to pay dividends in the near future, which is consistent with our history of not paying dividends. Stock option valuations also depend on the valuation of our common stock on the date of grant, as discussed below.
During the year ended December 31, 2020, our Board of Directors granted a total of 217,275 stock options. No stock options were granted during 2021 and 2019; therefore, a stock option valuation was not necessary. The inputs used for estimating the fair value of stock options granted during the year ended December 31, 2020 are disclosed in Note 13 to the Notes to Consolidated Financial Statements.
The following table summarizes the inputs used for estimating the fair value of stock options granted during the year ended December 31, 2020:
| | | | | | | | |
Input | | Year Ended December 31, 2020 |
Risk-free interest rate | | 0.3% – 1.4% |
Expected term (years) | | 5.5 – 6.0 |
Expected volatility | | 36.5% – 42.5% |
Fair value of common stock | | $6.43 – $6.95 |
Dividend yield | | —% |
Restricted Stock Units
During the years ended December 31, 2021, 2020 and 2019, our Board of Directors granted a total of 27,481,638, 35,965,456 and 15,922,648 RSUs, respectively, at weighted average share prices of $16.92, $7.79 and $6.47, respectively. The RSU share prices were based on the prevailing fair value of our common stock at the time of each share-based grant. See below for a discussion of our common stock valuation process during the period wherein we started to pursue a public market transaction.
Common Stock Valuations
Prior to us contemplating a public market transaction, due to the absence of an active market for our common stock, the fair value of our common stock, which was used as an input into the valuation of both our stock options and RSUs granted, was determined by our Board of Directors based on a third-party valuation and input from our management. The valuation of our common stock was performed by independent valuation specialists when the Board of Directors believed an event had occurred that would significantly impact the value of our common stock, which was at least on an annual basis, but had been more frequent during the years ended December 31, 2020 and 2019. The valuation specialists applied valuation techniques and methods that conformed to generally accepted valuation practices and standards established by the American Society of Appraisers in accordance with Uniform Standards of Professional Appraisal Practice. The valuation methodologies and techniques utilized were also consistent with guidance issued by the American Institute of Certified Public Accountants in its Accounting and Valuation Guide, Valuation of Privately-Held-Company Equity Securities Issued as Compensation, 2013. They used a number of objective and subjective factors, including:
•prices at which our common and preferred stock had been bought and sold in third-party, arms-length, non-employee based transactions;
•our capital structure and the prices at which we issued our preferred stock and the relative rights and characteristics of the preferred stock as compared to those of our common stock;
•our results of operations, financial position and our future business plans, which included financial forecasts and budgets;
•capital market data on interest rates, yields and rates of return for various investments;
•the material risks related to our business and the state of the development of our target markets;
•the market performance of publicly-traded companies in comparable market sectors;
•external market conditions affecting comparable market sectors;
•the degree of marketability for our common stock, including contractual restrictions on transfer of the units; and
•the likelihood of achieving a liquidity event for our preferred and common stockholders, given prevailing market conditions.
During the third quarter of 2020, once we made intentional progress toward pursuing a public market transaction, we began applying the probability-weighted expected return method (“PWERM”) to determine the fair value of our common stock. The probability weightings assigned to certain potential exit scenarios were based on management’s expected near-term and long-term funding requirements and assessment of the most attractive liquidation possibilities at the time of the valuation. During this process, we assigned probability weightings to “go public” event scenarios and a “stay private” scenario, wherein the enterprise valuation was based on either estimated exit valuations determined from conversations held with external parties or was based on public company comparable net book value multiples at the time of our valuation, respectively. In addition, our “stay private” scenario valuation approach continued to rely on a guideline public company multiples analysis with an option pricing model to determine the amount of aggregate equity value allocated to our common stock. The valuations from 2019 through the third quarter of 2020 also applied discounts for lack of marketability ranging from 16% to 25% to reflect the fact that there was no market mechanism to sell our common stock and, as such, the common stock option and RSU holders would need to wait for a liquidity event to facilitate the sale of their equity awards. In addition, there were contractual transfer restrictions placed on common stock in the event that we remained a private company.
During the fourth quarter of 2020, we valued our common stock on a monthly basis. A common stock transaction that closed in December 2020 at a price of $10.57 per common share, which was of substantial size and in close proximity to the Business Combination, served as the key input for the fair value of our common stock for grants made during the fourth quarter of 2020. We decreased the assumed discount for lack of marketability throughout the fourth quarter of 2020, corresponding with our decreased time to liquidity assumption throughout the quarter, as we became more certain about the possibility of entering into the Business Combination over time, and ultimately assumed no discount for lack of marketability for the month of December 2020.
For the period from January 7, 2021, the date on which we executed the Agreement, through May 28, 2021, the date the Business Combination closed, we determined the fair value of our common stock based on the observable daily closing price of SCH stock (ticker symbol “IPOE”) multiplied by the exchange ratio in effect for such transaction date. For periods subsequent to June 1, 2021, we determined the value of our common stock based on the observable daily closing price of SoFi Technologies stock (ticker symbol “SOFI”).
Application of these approaches and methodologies involves the use of estimates, judgment and assumptions that are highly complex and subjective, such as those regarding our expected operations, market multiples, the selection of comparable public companies, and the probability of and timing associated with possible future events. Changes in any or all of these estimates and assumptions or the relationships between those assumptions impact our valuations as of each valuation date and may have a material impact on the valuation of our common stock.
Performance Stock Units
In the second and third quarters of 2021, we granted performance stock units (“PSUs”), which are restricted common stock awards that vest upon the satisfaction of both service-based and performance-based conditions. The service-based condition for the PSUs generally is satisfied contemporaneously with the performance-based conditions. The performance-based conditions generally are satisfied upon achieving specified performance goals, such as the volume-weighted average closing price of our stock over a 90-trading day period (“Target Hurdles”) and maintaining certain minimum standards applicable to bank holding companies. We record share-based compensation expense for PSUs using the accelerated attribution method for each vesting tranche over the respective derived service period, and only if performance-based conditions are considered probable to be satisfied. We determine the grant-date fair value of PSUs utilizing a Monte Carlo simulation model, which relies on certain key assumptions, including expected stock price volatility, risk-free rate, dividend yield and the closing stock price at grant date. We estimated the volatility of common stock on the date of grant based on the historical volatility of comparable publicly-traded companies. The risk-free interest rate was based on the U.S. Treasury yield curve in effect at the time of grant. Finally, we assumed no dividend yield, as we have not historically paid, nor do we anticipate paying in the near future, dividends on our common stock.
During the year ended December 31, 2021, our Board of Directors granted a total of 23,141,462 PSUs, which had a weighted average grant date fair value of $9.50.
See Note 13 to the Notes to Consolidated Financial Statements for information about share-based compensation expense related to stock options, RSUs and PSUs reflected in our consolidated statements of operations and comprehensive income (loss).
Consolidation of Variable Interest Entities
We enter into arrangements in which we originate loans, establish a special purpose entity (“SPE”), and transfer the loans to the SPE. We retain the servicing rights of those loans and hold additional interests in the SPE. We evaluate each such arrangement to determine whether we have a variable interest. If we determine that we have a variable interest in an SPE, we then determine whether the SPE is a VIE. If the SPE is a VIE, we assess whether we are the primary beneficiary of the VIE. To determine if we are the primary beneficiary, we identify the most significant activities and determine who has the power over those activities, and who absorbs the variability in the economics of the VIE.
We periodically reassess our involvement with each VIE in which we have a variable interest. We monitor matters related to our ability to control economic performance, such as management of the SPE and its underlying loans, contractual changes in the services provided, the extent of our ownership, and the rights of third parties to terminate us as the VIE servicer. In addition, we monitor the financial performance of each VIE for indications that we may or may not have the right to absorb benefits or the obligation to absorb losses associated with variability in the financial performance of the VIE that could potentially be significant to that VIE, which we define as a variable interest of greater than 10%.
A significant change to our or other parties’ pertinent rights, or a significant change to the ranges of possible financial performance outcomes used in our assessment of the variability of cash flows due to us, could impact the determination of whether or not a VIE should be consolidated in future periods. VIE consolidation and deconsolidation may lead to increased volatility in our financial results and impact period-over-period comparability. Our maximum exposure to loss as a result of our involvement with consolidated VIEs is limited to our investment, which is eliminated in consolidation. There are no liquidity arrangements, guarantees or other commitments by third parties that may affect the fair value or risk of our variable interests in consolidated VIEs.
Fair Value
Fair value is defined as the price that would be received for an asset or paid to transfer a liability (an exit price) in the principal or most advantageous market for the asset or liability in an orderly transaction between market participants on the measurement date. We use a three-level fair value hierarchy to classify and disclose all assets and liabilities measured at fair value on a recurring basis in periods subsequent to their initial measurement. The hierarchy requires us to use observable inputs when available and to minimize the use of unobservable inputs when determining fair value. The three levels are defined as follows:
•Level 1 — Quoted prices in active markets for identical assets or liabilities, accessible by us at the measurement date.
•Level 2 — Quoted prices for similar assets or liabilities in active markets, or quoted prices for identical or similar assets or liabilities in markets that are not active, or observable inputs other than quoted prices.
•Level 3 — Unobservable inputs for assets or liabilities for which there is little or no market data, which requires us to develop our own assumptions. These unobservable assumptions reflect estimates of inputs that market participants would use in pricing the asset or liability. Valuation techniques include the use of option pricing models, discounted cash flow models, or similar techniques, which incorporate management’s own estimates of assumptions that market participants would use in pricing the asset or liability.
A financial instrument’s categorization within the fair value hierarchy is based on the lowest level of input that is significant to the fair value measurement. Instruments are categorized in Level 3 of the fair value hierarchy based on the significance of unobservable factors in the overall fair value measurement. Our involvement with VIEs and origination of studentpersonal loans, personalstudent loans and home loans which we measure at fair value on a recurring basis, results in Level 2 and Level 3 assumptions having a material impact on our consolidated financial statements.statements, as further discussed below. We utilize third-party valuation specialists to perform a valuation of these Level 2 and Level 3 financial instruments on a monthly basis with quarterly oversight by a Valuation Working Group established by the Company that comprises leaders across finance, capital markets and accounting.
Loans
We elected the fair value option to measure our personal loans and student loans, as we believe that fair value best reflects the expected economic performance of the loans. These loans do not trade in an active market with readily observable prices. prices, and are classified as Level��3 because the valuations utilize significant unobservable inputs.
We determine the fair value of our loans using a discounted cash flow methodology,DCF calculation, which is a form of the income approach, while also considering market data as it becomes available. We classifyIn applying the DCF methodology, we estimate the future cash flows of each loan portfolio using key loan metrics, such as term, vintage, coupon rate, coupon type and current balance, among others. The significant assumptions used in the valuation model include conditional prepayment rate, annual default rate and discount rate. The conditional prepayment rate represents the monthly annualized proportion of the principal of a pool of loans as Level 3 becausethat is assumed to be paid off prematurely in each period. The annual default rate represents the valuations utilize significant unobservable inputs.annualized rate of borrowers who do
not make loan payments on time. The conditional prepayment and annual default rate assumptions are determined using company-specific historical loan performance curves. The discount rate represents the weighted average rate at which the expected cash flows are discounted to arrive at the net present value of the loans. The discount rate is determined based on company-specific factors and market observations, including underlying benchmark rates, our weighted average coupon rate and expected duration of the assets, the last of which is also impacted by expected prepayment rates. We also consider the volume and terms of recent whole loan sales and securitization market pricing factors, as applicable, as indicators of loan fair values.
Securitizations
Loans in consolidated VIEs the loans remain on our consolidated balance sheet and are measured at fair value using Level 3 inputs.inputs in a manner consistent with our non-securitization loans. Moreover, third-party residual claims on these loans are measured at fair value on a recurring basis and are presented as residual interests classified as debt in our consolidated balance sheet. We record subsequent fair value measurement changes in the period in which the change occurs within noninterest income—securitizations in our consolidated statements of operations and comprehensive income (loss). We determine the fair value of our residual interests classified as debt using a discounted cash flow methodology, while also considering market data as it becomes available.
Consistent with ASC 325-40, Investments — Other — Beneficial Interests in Securitized Financial Assets, we recognize interest expense related to the residual interests classified as debt over the expected life using the effective yield method, which is effectively a reclassification between noninterest income and interest income for the portion of the overall fair value change attributable to interest expense. On a quarterly basis, we reevaluate the cash flow estimates to determine if a change to the accretable yield is required on a prospective basis. We classify the residual interests classified as debt as Level 3 due to the reliance on significant unobservable valuation inputs.
When we do not consolidate VIEs, we generally hold risk retention interests, which we refer to as securitization investments. In Company-sponsored securitization transactions that meet the applicable criteria to be accounted for as a sale, we retain certain asset-backed bonds, which are measured at fair value on a recurring basis using Level 2 inputs, and residual investments, which are measured at fair value on a recurring basis using Level 3 inputs. Gains and losses relatedThese risk retention interests in nonconsolidated VIEs are referred to ouras securitization investments are reported within investments.noninterest income—securitizations in our consolidated statements of operations and comprehensive income (loss).
We determine the fair value of our residual interests classified as debt and our securitization investments using a discounted cash flow methodology,DCF calculation, while also considering market data as it becomes available.
For our loans, residual interests classified In applying the DCF methodology, we estimate the future collateral cash flows using key securitization portfolio metrics, such as debtcontractual payments and securitization investments,delinquency profile, among others. The significant assumptions used in the fair value estimates are impacted by assumptions regarding credit performance, prepaymentsvaluation model include conditional prepayment rate, annual default rate and discount rates. rate. The conditional prepayment and annual default rate assumptions are determined using observed prepayment and default performance. The discount rate is determined based on market observations, such as secondary trading information, newly closed deals, benchmark rates and spread index, among others.
See “Quantitative and Qualitative Disclosures aboutAbout Market Risk” for discussion of the sensitivity of our financial instruments measured at fair value to changes in various market risks.
Business Combinations
We account for acquisitions of entities or asset groups that qualify as businesses using the acquisition method of accounting in accordance with ASC 805, Business Combinations.accounting. Purchase consideration is allocated to the tangible and intangible assets acquired and liabilities assumed based on the estimated fair values as of the acquisition date, which are measured in accordance with the principles outlined in ASC 820, Fair Value Measurement,and which are typically determined in consultation with an independent appraiser.
The determination of fair value requires management to make estimates about discount rates, future expected cash flows, market conditions and other future events that are highly subjective in nature. The judgments made in the determination of the estimated fair value assigned to the assets acquired and liabilities assumed, as well as the estimated useful life of each asset and the duration of each liability, could significantly impact the consolidated financial statements in periods after the acquisition, such as through depreciation and amortization expense. Assumptions
Management uses significant judgment to determine the fair value of intangible assets. For developed technology, management applies the Multi-Period Excess Earnings Method, which is a form of the income approach, for which the developed technologysignificant assumptions generally include expected earnings attributable to the asset (including an assumed technology migration curve andcurve), contributory asset charges)charges and an assumed discount rate. AssumptionsFor customer-related intangibles, management applies the With and Without Method, which is a form of the income approach, for which the customer-related intangiblessignificant assumptions generally include estimated annual revenues and net cash flows (including revenue ramp-up periods and customer attrition rates), and an assumed discount rate. Assumptions for theFor trade names, trademark and domain names, management applies the Relief from Royalty Method, which is a form of the income approach, for which the significant assumptions generally include expected earnings attributable to the asset, the probability of use of the asset, the royalty rate and an assumed discount rate. The assumed discount rates across the valuation methods reflect the risk of the asset relative to the overall risk of the acquired business. Definite-lived intangible assets are straight-line amortized over their useful lives and reviewed for impairment annually and whenever events or circumstances indicate that the carrying amount of such assets may not be recoverable. During the year ended December 31, 2023, we did not recognize any impairment of definite-lived intangible assets.
The excess of the total purchase consideration over the fair value of the identified net assets acquired is recognized as goodwill. Acquisition-related costs are expensed as incurred. The results of operations for each acquisition are included in the Company’sour consolidated financial results beginning on the respective acquisition date.
During the measurement period, which may be up to one year from the acquisition date, the Companywe may record adjustments to the allocation of purchase consideration and to the fair values of assets acquired and liabilities assumed to the extent that additional information becomes available. After this period, any subsequent adjustments are recorded in the consolidated statements of operations and comprehensive loss.
Goodwill
Goodwill represents the fair value of an acquired business in excess of the fair value of the identified net assets acquired. As of December 31, 2023, we had goodwill of $1.4 billion, of which $17.7 million was recognized during the year in connection with business combinations.
Goodwill is tested for impairment at the reporting unit level at least annually, with a recurring testing date of October 1, or whenever indicators of impairment exist. Impairment of goodwill is the condition that exists when the carrying amount of a reporting unit that includes goodwill exceeds its fair value. We may assess goodwill for impairment initially based on qualitative considerations, referred to as “step zero”, to determine whether conditions exist that indicate that it is more likely than not that the fair value of a reporting unit is less than its carrying amount. If management concludes, based on its assessment of relevant events, facts and circumstances that it is more likely than not that a reporting unit’s carrying value is greater than its fair value, then a quantitative analysis, referred to as step one, will be performed to determine if there is any impairment. We may alternatively elect to initially perform a quantitative assessment and bypass the qualitative assessment. Quantitative goodwill impairment assessments require a significant amount of management judgment, and a meaningful change in the forecasted future revenues and cash flows, the discount rate, and the determination of market multiples used in testing goodwill for impairment could result in a material impact on the Company’s results of operations and financial position.
A goodwill impairment loss is recognized for the amount that the carrying amount of a reporting unit, including goodwill, exceeds its fair value, limited to the total amount of goodwill allocated to that reporting unit. Therefore, if the fair value of a reporting unit exceeds its carrying amount, goodwill of the reporting unit is not impaired. Our reporting units for our goodwill impairment analysis represent components of our business at one level below our operating segments.
An interim test is performed when events or circumstances occur that may indicate that it is more likely than not that the fair value of any reporting unit may be less than its carrying value. During the third quarter of 2023, the Technology Platform segment continued to experience slower growth rates than expected at the time of acquisition due to: (i) the uncertain macroeconomic environment, which has continued to impact customer spend volume, and (ii) continued longer sales cycles as a result of our shift in strategy to focus on diversified durable growth driven by potential new partners with scaled customer bases and interest in multiple Technology Platform products. These factors constituted a triggering event for goodwill testing purposes. As a result, we performed an interim quantitative test on the Galileo and Technisys reporting units to determine the existence and magnitude of potential goodwill impairment. We determined it was not necessary to perform an interim goodwill impairment test for our other reporting units.
During the third quarter of 2023, management calculated the fair value amount of the Galileo and Technisys reporting units using a combination of a DCF calculation, which is a form of the income (loss).approach, and a market multiples calculation, which is a form of the market approach. The discount rates used for the Galileo and Technisys reporting units in our interim quantitative assessment were 14.0% and 23.5%, respectively. The higher discount rate at Technisys was primarily driven by macroeconomic factors in Latin America, specifically the highly inflationary economic environment in Argentina. Additionally, management applied a terminal year long-term growth rate of 3.5% to both reporting units, consistent with previous quantitative assessments. As a result of this assessment, the fair value of the Galileo and Technisys reporting units were determined to be below their carrying values by 9.9% and 14.8%, respectively, resulting in management recognizing non-cash goodwill impairment charges of $124.5 million and $122.7 million for the Galileo and Technisys reporting units, respectively. If the discount rate applied to the estimated cash flows was increased or decreased by 50 basis points, the fair value of the Galileo and Technisys reporting units would decrease or increase by 6% and 4%, respectively. Similarly, if the long-term growth rate was increased or decreased by 50 basis points, the fair value of the Galileo and Technisys reporting units would increase or decrease by approximately 3% and 1%, respectively.
In performing the qualitative assessments of each reporting unit as of October 1, 2023, the Company evaluated events and circumstances since the last quantitative goodwill assessments to determine if it was not more likely than not that our goodwill was not impaired as of our annual impairment testing date. The factors evaluated included an assessment of macroeconomic conditions, industry and market conditions, key financial metrics, overall financial performance of the reporting unit, or any other specific events or changes. After assessing the relevant events and circumstances, we concluded it is not more-likely-than-not that the fair value of the reporting unit is below its carrying value as of our annual impairment assessment date.
We monitored events and circumstances during the fourth quarter of 2023, concluding that it was not more-likely-than-not that the fair value of a reporting unit is below its respective carrying value as of December 31, 2023.
Management cannot predict the occurrence of certain events or changes in circumstances that might adversely affect the value of goodwill. We continue to monitor the aforementioned conditions, general macroeconomic deterioration, including the interest rate environment, inflationary pressures, and the potential for a prolonged economic downturn or recession, as well as other factors, including those listed in "Cautionary Statement Regarding Forward-Looking Statements" and "Risk Factors" in Part I, Item 1A of this Annual Report. Further persistence of the aforementioned conditions and these other factors could result in additional impairment charges in future periods.
See Note 8. Goodwill and Intangible Assets to the Notes to Consolidated Financial Statements for additional disclosures related to goodwill.
Recent Accounting Standards Issued, But Not Yet Adopted
See Note 11. Organization, Summary of Significant Accounting Policies and New Accounting Standards to the Notes to Consolidated Financial Statements.
Item 7A. Quantitative and Qualitative Disclosures About Market Risk
In the normal course of business, we are subject to a variety of market-related risks whichthat can affect our operations and profitability. We broadly define these areas of risk as interest rate risk, credit risk, marketcounterparty risk and counterpartyoperational risk. Historically, substantially all of our revenue and operating expenses were denominated in United States dollars. As a result of our acquisitions in the second quarter of 2020, as well as our anticipated acquisition of Technisys in February 2022, which are further discussed in Note 2 to the Notes to Consolidated Financial Statements, weWe may in the future be subject to increasing foreign currency exchange rate risk.risk with our acquisition of a foreign company. Foreign currency exchange rate risk is the risk that our financial position or results of operations could be positively or negatively impacted by fluctuations in exchange rates. Exchange rate risk was not a material risk for us during the Company during any of the periodsyears presented.
We are exposed to the risk of loss to future earnings, values or future cash flows that may result from changes in market discount rates or overall market conditions, such as instability in the banking and financial services sectors. We are subject to interest rate risk associated with our consolidated loans, securitization investments (including residual investments and asset-backed bonds), servicing rights variable-rate debt and our investments in AFS debt securities. Our loan portfolio consists of personal loans, student loans and home loans,securities, which are carriedmeasured at fair value on a recurring basis and credit cards,using a discounted cash flow methodology in which are measured at amortized cost. Thethe discount rate represents an estimate of the required rate of return by market participants. Our loans with variable interest rates are exposed to interest rate volatility, which impacts the amount of recognized interest income we recognize in our consolidated statements of operations and comprehensive income (loss).income. Our securitization residual investments are carried at fair value, which is subject to changes in market value by virtue of the impact of interest rates on the market yield of the residual investments. The value and earnings of our asset-backed bonds, which are associated with our personal loans and student loans, have a converse relationship to the movement of interest rates. That is, as interest rates rise, bond values and earnings fall and vice versa. Lastly,Additionally, we are subject to interest rate risk on our variable-rate warehouse facilities and our revolving credit facility. Market interest rates may also drive the interest we offer to members on their deposits. Future funding activities may increase our exposure to interest rate risk, as the interest rates payable on such funding may be tied to SOFR or another representative alternative reference rate. These arrangementsWe are also subjectexposed to market risk through our investments in equity securities, which are either measured at fair value using the reference rate reform guidance,net asset value practical expedient or which is further discussed in Note 1 to the Notes to Consolidated Financial Statements.may have positive or negative adjustments that impact our results of operations resulting from observable price changes based on current market conditions.
Interest rate risk also occurs in periods where changes in short-term interest rates result in loans being originated with terms that provide a smaller interest rate spread above the financing terms of our warehouse facilities or above the interest rate we offer on deposits, which can negatively impact our realized net interest income. We utilize simulations to evaluate changes in net interest income under multiple interest rate scenarios relative to the baseline forecast. The sensitivity is defined as the changes in net interest income relative to the baseline forecast.
The following table summarizes the potential effect on earnings over the next 12 monthsnet interest income and the potential effect on the fair valuesvalue of interest rate sensitive financial assets and liabilities recorded on our consolidated balance sheet as of December 31, 2021,2023, based upon a sensitivity analysis performed by management assuming ana hypothetical, immediate hypotheticaland parallel increase and decrease in market interest rates of 100 basis points. The net interest income sensitivities are applied to our 12 month forecast, which incorporates market expectations of interest rates, contractual cash flows, repricing characteristics, and our projected business activity, including deposit forecasts as a key assumption. Our consolidated balance sheet is liability sensitive, given liabilities reprice faster than assets, resulting in higher net interest income in decreasing interest rate scenarios. The fair value and earnings sensitivities are applied only to
interest rate sensitive financial assets and liabilities that existed at the balance sheet date, which included loans, measured at fair value, securitization investments, servicing rights investments in AFS debt securities, credit cards and certain variable rate debt as of December 31, 2021. For loans and investments in AFS debt securities interest rates impact both the fair value change and interest income, although the impact on interest income from AFS debt securities was immaterial. The sensitivity impact on interest income from loans was performed only on our variable-rate loans held on the consolidated balance sheet and reflects the impact from changes in interest rates, while holding all other factors constant. The sensitivity impact on interest income from credit cards was performed on the revolving portionas of our credit card portfolio at year end and reflects the impact from changes in interest rates, while holding all other factors constant. For debt, the sensitivity impact on interest expense was performed only on our variable-rate debt, which is not measured at fair value on a recurring basis and, therefore, only reflects the hypothetical impact on interest expense. Additionally, the amounts are gross of debt issuance costs and discounts or premiums.December 31, 2023.
| | | | | | | | | | | | | | | | |
| | | | Impact if Interest Rates: |
| ($ in thousands) | | | Increase 100 Basis Points | | Decrease 100 Basis Points |
| | | | | | |
| Fair value | | | | $ | (409,956) | | | $ | 438,486 | |
| Net interest income (expense) | | | | (33,942) | | | 42,855 | |
| | | | | | | | | | | | | | | | | | | | |
| | As of December 31, 2021 | | Impact if Interest Rates: |
| ($ in thousands) | | | Increase 100 Basis Points | | Decrease 100 Basis Points |
| Fair value | | $ | 6,690,826 | | | $ | 6,548,837 | | | $ | 6,839,514 | |
| Carrying value | | 2,637,636 | | | n/a | | n/a |
| Income (loss) before income taxes | | | | (164,544) | | | 172,050 | |
We are subject to credit risk, which is the risk of default that results from a borrower’s inability or unwillingness to make contractually required loan payments or declines in home loan collateral values. Generally, all loans sold into the secondary market are sold without recourse. For such loans, our credit risk is generally limited to repurchase obligations due to fraud or origination defects. For loans that were repurchased or not sold in the secondary market, we are subject to credit risk to the extent a borrower defaults and we are not able to fully recover the principal balance. We believe that this risk is mitigated through the implementation of stringent underwriting standards, strong fraud detection tools and technology designed to comply with applicable laws and our standards. In addition, we believe that this risk is mitigated through the quality of our loan portfolio. The Lending segment weighted average origination FICO during the year ended December 31, 2021 was 761.
The following table summarizes the potential effect on earnings over the next 12 months and the potential effect on the fair values of our loans for which we elected the fair value option and residual investments recorded on our consolidated balance sheet as of December 31, 20212023 based on upon a sensitivity analysis performed by management assuming an immediate hypothetical change in credit loss rates by a rate of 10%. The fair value and earnings sensitivities are applied only to financial assets that existed at the balance sheet date, which included loans, measured at fair value, credit card loans, investments in AFS debt securities (which had an immaterial impact from credit risk) and residual investments as of December 31, 2021.2023. Asset-backed bonds are excluded because they are not expected to absorb the losses of the VIE based on the extent of overcollateralization and expected credit losses of the VIE. Alternatively, residual investments are subject to credit exposure, and by design this is the portion of the SPE that is expected to absorb the losses of the VIE.
| | | | | | As of December 31, 2021 | | Impact if Credit Loss Rates: | | | | Impact if Credit Loss Rates: |
| ($ in thousands) | ($ in thousands) | | Increase 10 Percent | | Decrease 10 Percent | ($ in thousands) | | | Increase 10 Percent | | Decrease 10 Percent |
| | Fair value | |
| | Fair value | |
| | Fair value | Fair value | | $ | 6,268,898 | | | $ | 6,252,323 | | | $ | 6,285,473 | |
| Carrying value | Carrying value | | 115,912 | | | 115,208 | | | 116,616 | |
| Income (loss) before income taxes | Income (loss) before income taxes | | (17,279) | | | 17,279 | |
Market Risk
We are exposed to the risk of loss to future earnings, values or future cash flows that may result from changes in market discount rates. We are exposed to such market risk directly through our investments in AFS debt securities, loans, servicing rights and securitization investments held on our consolidated balance sheet, all of which are measured at fair value on a recurring basis. Investments in AFS debt securities are valued utilizing quoted prices in actively traded markets or rely upon observable inputs other than quoted prices, dealer quotes in markets that are not active and implied pricing derived from new issuances of similar securities. The other assets mentioned are measured at fair value using a discounted cash flow methodology in which the discount rate represents an estimate of the required rate of return by market participants. The discount rates for our loans and securitization investments may change due to expected loan performance or changes in the expected returns of similar financial instruments available in the market. For our servicing rights, the discount rate is commensurate with the risk of the servicing asset cash flow, which varies based on the characteristics of the serviced loan portfolio.
| | | | | | | | | | | | | | | | | | | | |
| | As of December 31, 2021 | | Impact if Discount Rates: |
| ($ in thousands) | | | Increase
100 Basis Points | | Decrease
100 Basis Points |
| Fair value | | $ | 6,690,826 | | | $ | 6,548,837 | | | $ | 6,839,514 | |
| Income (loss) before income taxes | | | | (141,989) | | | 148,688 | |
We are subject to risk that arises from our debt warehouse facilities, interest rate riskeconomic hedging activities, third-party custodians, and capped call options on our common stock. These activities generally involve an exchange of obligations with unaffiliated lenders or other individuals or entities, referred to in such transactions as “counterparties”. If a counterparty werewas to default, we could potentially be exposed to reputational damage and financial loss if such counterparty werewas unable to meet its obligations to us. We manage this risk by selecting only counterparties that we believe to be financially strong, spreading the risk among manymultiple such counterparties, placing contractual limits on the amount of dependence on any single counterparty, and entering into netting agreements with the counterparties, as appropriate.
In accordance with Treasury Market Practices Group’s recommendation, we execute Securities Industry and Financial Markets Association trading agreements with all material trading partners. Each such agreement provides for an exchange of margin money should either party’s exposure exceed a predetermined contractual limit. Such margin requirements limit our overall counterparty exposure. The master netting agreements contain a legal right to offset amounts due to and from the same counterparty. Derivative assets in the consolidated balance sheets represent derivative contracts in a gain position net of loss positions with the same counterparty and, therefore, also represent our maximum counterparty credit risk. We incurred no losses due to nonperformance by any of our counterparties during the year ended December 31, 2021.2023. As of December 31, 2021,2023, gross derivative asset and liability positions subject to master netting arrangements were $5.6$2.2 million and $(1.0)$6.0 million, respectively.
In the case of our loan warehouse facilities, we are subject to risk if the counterparty chooses not to renew a borrowing agreement and we are unable to obtain financing to originate loans. With our loan warehouse facilities, we seek to mitigate this risk by ensuring that we have sufficient borrowing capacity with a variety of well-established counterparties to meet our funding needs. As of December 31, 2021,2023, we had total borrowing capacity under loan warehouse facilities of $6.9$9.2 billion, of which $1.3$3.2 billion was utilized. Refer to Note 1012. Debt to the Notes to Consolidated Financial Statements for a listing ofadditional information regarding our loan warehouse facilities.
In the case of our call options on our common stock (referred to herein as the “Capped Call Transactions”), if the Capped Call Counterparties, which are financial institutions and initial purchasers of our senior convertible notes, issued in the fourth quarter of 2021, are unable to meet their obligations under the contract, we may not be able to mitigate the dilutive effect on our common stock upon conversions of our Convertible Notesconvertible notes or offset any potential cash payments we may be required to make in excess of the principal amount of converted Convertible Notes.convertible notes. Refer to Note 1 and Note 1013. Equity to the Notes to Consolidated Financial Statements for additional information on our Capped Call Transactions.
We are also subject to counterparty risk associated with our use of third-party custodians to safeguard digital assets on behalf of our members. Refer to Note 1. Organization, Summary of Significant Accounting Policies and New Accounting Standards to the Notes to Consolidated Financial Statements under the section entitled “Summary of Significant Accounting Policies—Safeguarding Asset and Liability” and to Part I, Item 1A. “Risk Factors” under “Regulatory, Tax and Other Legal Risks” for additional information on our counterparty risk as it relates to our digital assets product offering.
Operational risk is the risk of loss arising from inadequate or failed internal processes, controls, people (e.g., human error or misconduct) or systems (e.g., technology problems), business continuity or external events (e.g., natural disasters), compliance, reputational, regulatory, or legal matters and includes those risks as they relate directly to us, fraud losses attributed to applications and any associated fines and monetary penalties as a result, transaction processing, or employees, as well as to third parties with whom we contract or otherwise do business. We rely on third-party computer systems and third-party providers to support and carry out certain functions on our platform, which are themselves susceptible to operational risk or which may rely on subcontractors to provide services to us that face similar risks. Any interruption in services or deterioration in the quality of the service or performance of such third-party systems or providers could be disruptive to our business and adversely affect our results of operations and the perception of the reliability of our networks and services and the quality of our brand. In addition, we may be subjected to member complaints, fines, subpoenas, civil investigative demands, litigation, disputes, regulatory investigations and other similar actions. We strive to manage operational risk, including operational risk associated with our reliance on third-party systems, through contractual provisions, our system design, and a robust third-party risk management process, which includes establishing policies and procedures to accomplish timely and efficient processing, obtaining periodic internal control attestations from management, conducting internal process Risk Control Self-Assessments and audit reviews to evaluate the effectiveness of internal controls. Our operational risk, and the amount we invest in risk management, may increase as we introduce new products and product features, and as new threat actors and evolving threat vectors, such as account takeover tactics, increase and become more sophisticated. In order to be effective, among other things, our enterprise risk management capabilities must adapt and align to support any new product or loan features, capability, strategic development, or external change.
Item 8. Financial Statements and Supplementary Data
SOFI TECHNOLOGIES, INC.
INDEX TO CONSOLIDATED FINANCIAL STATEMENTS
| | | | | |
| Page |
| Consolidated Financial Statements | |
| |
| |
| |
| |
| |
| |
| |
| |
| |
| |
| |
| |
| |
| |
| |
| |
| |
| |
| |
| |
| |
| |
| |
| |
| |
| |
| |
| |
| |
| |
| |
| |
| |
REPORT OF INDEPENDENT REGISTERED PUBLIC ACCOUNTING FIRM
To the shareholders and the Board of Directors of SoFi Technologies, Inc.
Opinion on the Financial Statements
We have audited the accompanying consolidated balance sheets of SoFi Technologies, Inc. and subsidiaries (the "Company") as of December 31, 20212023 and 2020,2022, the related consolidated statements of operations and comprehensive loss, changes in temporary equity and permanent equity (deficit), and cash flows, for each of the three years in the period ended December 31, 2021,2023, and the related notes (collectively referred to as the "financial statements"). In our opinion, the financial statements present fairly, in all material respects, the financial position of the Company as of December 31, 20212023 and 2020,2022, and the results of its operations and its cash flows for each of the three years in the period ended December 31, 2021,2023, in conformity with accounting principles generally accepted in the United States of America.
We have also audited, in accordance with the standards of the Public Company Accounting Oversight Board (United States) (PCAOB), the Company's internal control over financial reporting as of December 31, 2023, based on criteria established in Internal Control — Integrated Framework (2013) issued by the Committee of Sponsoring Organizations of the Treadway Commission and our report dated February 27, 2024, expressed an unqualified opinion on the Company's internal control over financial reporting.
Basis for Opinion
These financial statements are the responsibility of the Company's management. Our responsibility is to express an opinion on the Company's financial statements based on our audits. We are a public accounting firm registered with the Public Company Accounting Oversight Board (United States) (PCAOB)PCAOB and are required to be independent with respect to the Company in accordance with the U.S. federal securities laws and the applicable rules and regulations of the Securities and Exchange Commission and the PCAOB.
We conducted our audits in accordance with the standards of the PCAOB. Those standards require that we plan and perform the audit to obtain reasonable assurance about whether the financial statements are free of material misstatement, whether due to error or fraud. The Company is not required to have, nor were we engaged to perform, an audit of its internal control over financial reporting. As part of our audits, we are required to obtain an understanding of internal control over financial reporting but not for the purpose of expressing an opinion on the effectiveness of the Company’s internal control over financial reporting. Accordingly, we express no such opinion.
Our audits included performing procedures to assess the risks of material misstatement of the financial statements, whether due to error or fraud, and performing procedures that respond to those risks. Such procedures included examining, on a test basis, evidence regarding the amounts and disclosures in the financial statements. Our audits also included evaluating the accounting principles used and significant estimates made by management, as well as evaluating the overall presentation of the financial statements. We believe that our audits provide a reasonable basis for our opinion.
Critical Audit MatterMatters
The critical audit mattermatters communicated below is a matterare matters arising from the current-period audit of the financial statements that waswere communicated or required to be communicated to the audit committee and that (1) relatesrelate to accounts or disclosures that are material to the financial statements and (2) involved our especially challenging, subjective, or complex judgments. The communication of critical audit matters does not alter in any way our opinion on the financial statements, taken as a whole, and we are not, by communicating the critical audit mattermatters below, providing a separate opinionopinions on the critical audit mattermatters or on the accounts or disclosures to which it relates.they relate.
Fair Value Measurement — Valuation of Loans Servicing Rights, Residual Investments, and Residual Interests Classified as Debt —at fair value— Refer to Notes 1, 5,4, and 915 to the financial statements
Critical Audit Matter Description
The Company has elected the fair value option to measure personal and student loans, servicing rights, residual investments, and measures residual interestswhich are classified as debt at fair value.Level 3 instruments because the valuations utilize significant unobservable inputs. The Company determines the fair value of each of its financial assetsthe loans using a discounted cash flow methodology,calculation, which is a form of the income approach, while also considering market data as it becomes available. The Company classifies loans, servicing rights, residual investments,Management estimates the future cash flows of each loan portfolio using key loan metrics and residual interests classified as debt as Level 3 because the valuations utilize significant unobservable inputs. The significant unobservable assumptions used in the valuation model include conditional prepayment rate, annual default rate and discount rate.
TheWe identified certain personal and student loans at fair value, measurementas a critical audit matter because of loans, servicing rights, residual investments, and residual interests classified as debt involves judgements made bythe unobservable inputs management including the use of assumptions and estimates, some of which are unobservable and require significant judgement.uses to estimate fair value. This required a high degree of auditor judgment and an increased extent of effort, including the need to involve our fair value specialists.
How the Critical Audit Matter Was Addressed in the Audit
Our audit procedures related to the fair value measurement of loans, servicing rights, residual investments,the personal and residual interests classified as debtstudent loans included the following, among others:
•We performed inquiries with managementtested the effectiveness of internal controls over the fair value of personal and student loans, including management’s controls over the Company’s third-party valuation expert to understandevaluation of the process for developing, and assumptionsreasonableness of unobservable inputs used in the valuation models.valuation.
•We tested the completeness and accuracy of the source information derived from the Company’s loan data, which is used in the valuation model.
•We evaluated the valuation models and the related assumptions, including significant unobservable inputs, and underlying loan data used by management.
•With the assistance of our fair value specialists, we developed independent fair value estimates of certain personal and student loans at fair value and compared our estimates to the Company’s estimates.
Goodwill — Galileo and Technisys Reporting Units - Refer to Notes 1 and 8 to the financial statements
Critical Audit Matter Description
The Company tests goodwill for impairment at the reporting unit level annually or whenever indicators of impairment exist. The Company’s evaluation of goodwill for impairment involves the comparison of the fair value of each reporting unit to its carrying amount. The Company determines the fair value of its reporting units using a combination of a discounted cash flow (“DCF”) calculation, which is a form of the income approach, and a market multiples calculation, which is a form of the market approach. The determination of the fair value of a reporting unit requires management to make significant estimates and assumptions related to forecasted future revenues and cash flows, the discount rate, and the determination of market multiples. Changes in these assumptions could have a significant impact on either the fair value of the reporting units, the amount of any goodwill impairment charge, or both. During the third quarter of 2023, the Company performed an interim quantitative assessment on the Galileo and Technisys reporting units. As a result of this assessment, the fair value of the Galileo and Technisys reporting units were determined to be below their carrying values by 9.9% and 14.8%, respectively, resulting in management recognizing goodwill impairment charges of $124.5 million and $122.7 million for the Galileo and Technisys reporting units, respectively.
We identified the Company’s interim quantitative assessment performed on the Galileo and Technisys reporting units as a critical audit matter because of certain significant estimates and assumptions made by management to estimate the fair values of these reporting units. This required a high degree of auditor judgment and an increased extent of effort, including the need to involve our fair value specialists, when performing procedures to evaluate the reasonableness of management’s estimates and assumptions related to the forecasted future revenues and cash flows, the discount rate, and the determination of market multiples, specifically due to the sensitivity of the fair value and the goodwill impairment charge to changes in the assumptions.
How the Critical Audit Matter Was Addressed in the Audit
Our audit procedures related to the significant estimates and assumptions made by management to estimate the fair value of the Galileo and Technisys reporting units used in the interim quantitative assessment included the following, among others:
•With the assistance of our fair value specialists, we evaluated the reasonableness of the valuation methodology and the key assumptions used in the assessment, including the selection of discount rates for which we tested the mathematical accuracy of the calculation, and developed a range of independent estimates and compared those to the discount rate selected by management. For the determination of market multiples, our specialist evaluated the peer set utilized, the selection and calculation of the multiples, and weighting of the multiples.
•We evaluated management's ability to accurately forecast future revenues and cash flows by (1) understanding management’s process for developing their forecasts, and (2) comparing the forecasts to historical results, projections utilized in the prior year goodwill impairment analysis, and forecasted information included in analyst and industry reports of the Company and companies in its peer group.
| | | | | | | | |
| /s/ | Deloitte & Touche LLP | |
| San Francisco, California | |
March 1, 2022February 27, 2024 | |
| | |
| We have served as the Company’s auditor since 2017. |
SoFi Technologies, Inc.
Consolidated Balance Sheets
(In Thousands, Except for Share Data)
| | | | | | | | | | | |
| December 31, |
| 2021 | | 2020 |
| Assets | | | |
| Cash and cash equivalents | $ | 494,711 | | | $ | 872,582 | |
Restricted cash and restricted cash equivalents(1) | 273,726 | | | 450,846 | |
| Investments in available-for-sale securities (amortized cost of $195,796 and $0, respectively) | 194,907 | | | — | |
Loans, less allowance for credit losses on loans at amortized cost of $7,037 and $219, respectively(1)(2) | 6,068,884 | | | 4,879,303 | |
| Servicing rights | 168,259 | | | 149,597 | |
| Securitization investments | 374,688 | | | 496,935 | |
| Equity method investments | 19,739 | | | 107,534 | |
| Property, equipment and software | 111,873 | | | 81,489 | |
| Goodwill | 898,527 | | | 899,270 | |
| Intangible assets | 284,579 | | | 355,086 | |
| Operating lease right-of-use assets | 115,191 | | | 116,858 | |
| Related party notes receivable | — | | | 17,923 | |
| Other assets, less allowance for credit losses of $2,292 and $562, respectively | 171,242 | | | 136,076 | |
| Total assets | $ | 9,176,326 | | | $ | 8,563,499 | |
| Liabilities, temporary equity and permanent equity (deficit) | | | |
| Liabilities: | | | |
Accounts payable, accruals and other liabilities(1) | $ | 298,164 | | | $ | 452,909 | |
| Operating lease liabilities | 138,794 | | | 139,796 | |
Debt(1) | 3,947,983 | | | 4,798,925 | |
Residual interests classified as debt(1) | 93,682 | | | 118,298 | |
| Total liabilities | 4,478,623 | | | 5,509,928 | |
| Commitments, guarantees, concentrations and contingencies (Note 16) | 0 | | 0 |
Temporary equity(3): | | | |
| Redeemable preferred stock, $0.00 par value: 100,000,000 and 570,562,965 shares authorized; 3,234,000 and 469,150,522 shares issued and outstanding as of December 31, 2021 and 2020, respectively | 320,374 | | | 3,173,686 | |
| Permanent equity (deficit): | | | |
Common stock, $0.00 par value: 3,100,000,000 and 789,167,056 shares authorized; 828,154,462 and 115,084,358 shares issued and outstanding as of December 31, 2021 and 2020, respectively(4) | 83 | | | — | |
| Additional paid-in capital | 5,561,831 | | | 579,228 | |
| | | |
| Accumulated other comprehensive loss | (1,471) | | | (166) | |
| Accumulated deficit | (1,183,114) | | | (699,177) | |
| Total permanent equity (deficit) | 4,377,329 | | | (120,115) | |
| Total liabilities, temporary equity and permanent equity (deficit) | $ | 9,176,326 | | | $ | 8,563,499 | |
| | | | | | | | | | | |
| December 31, |
| 2023 | | 2022 |
| Assets | | | |
| Cash and cash equivalents | $ | 3,085,020 | | | $ | 1,421,907 | |
| Restricted cash and restricted cash equivalents | 530,558 | | | 424,395 | |
| Investment securities (includes available-for-sale securities of $595,187 and $195,438 at fair value with associated amortized cost of $596,757 and $203,418, as of December 31, 2023 and 2022, respectively) | 701,935 | | | 396,769 | |
| Loans held for sale, at fair value | 15,396,771 | | | 13,557,074 | |
| Loans held for investment, at fair value | 6,725,484 | | | — | |
| Loans held for investment (less allowance for credit losses on loans at amortized cost of $54,695 and $40,788 as of December 31, 2023 and 2022, respectively) | 836,159 | | | 307,957 | |
| Servicing rights | 180,469 | | | 149,854 | |
| Property, equipment and software | 216,908 | | | 170,104 | |
| Goodwill | 1,393,505 | | | 1,622,991 | |
| Intangible assets | 364,048 | | | 442,155 | |
| Operating lease right-of-use assets | 89,635 | | | 97,135 | |
| Other assets (less allowance for credit losses of $1,837 and $2,785 as of December 31, 2023 and 2022, respectively) | 554,366 | | | 417,334 | |
| Total assets | $ | 30,074,858 | | | $ | 19,007,675 | |
| Liabilities, temporary equity and permanent equity | | | |
| Liabilities: | | | |
| Deposits: | | | |
| Interest-bearing deposits | $ | 18,568,993 | | | $ | 7,265,792 | |
| Noninterest-bearing deposits | 51,670 | | | 76,504 | |
| Total deposits | 18,620,663 | | | 7,342,296 | |
| Accounts payable, accruals and other liabilities | 549,748 | | | 516,215 | |
| Operating lease liabilities | 108,649 | | | 117,758 | |
| Debt | 5,233,416 | | | 5,485,882 | |
| Residual interests classified as debt | 7,396 | | | 17,048 | |
| Total liabilities | 24,519,872 | | | 13,479,199 | |
| Commitments, guarantees, concentrations and contingencies (Note 18) |
| |
|
Temporary equity(1): | | | |
| Redeemable preferred stock, $0.00 par value: 100,000,000 and 100,000,000 shares authorized; 3,234,000 and 3,234,000 shares issued and outstanding as of December 31, 2023 and 2022, respectively | 320,374 | | | 320,374 | |
| Permanent equity: | | | |
Common stock, $0.00 par value: 3,100,000,000 and 3,100,000,000 shares authorized; 975,861,793 and 933,896,120 shares issued and outstanding as of December 31, 2023 and 2022, respectively(2) | 97 | | | 93 | |
| Additional paid-in capital | 7,039,987 | | | 6,719,826 | |
| Accumulated other comprehensive loss | (1,209) | | | (8,296) | |
| Accumulated deficit | (1,804,263) | | | (1,503,521) | |
| Total permanent equity | 5,234,612 | | | 5,208,102 | |
| Total liabilities, temporary equity and permanent equity | $ | 30,074,858 | | | $ | 19,007,675 | |
__________________
(1)Financial statement line items include amounts in consolidated variable interest entities (“VIEs”). See Note 6.
(2)As of December 31, 2021 and 2020, includes loans measured at fair value of $5,952,972 and $4,859,068, respectively, and loans measured at amortized cost of $115,912 and $20,235, respectively. See Note 1, Note 5, Note 8 and Note 9.
(3)Redemption amounts areamount is $323,400 and $3,210,470 as of December 31, 20212023 and 2020, respectively.2022.
(4)(2)Includes 100,000,000 non-voting common shares authorized and 0no non-voting common shares issued and outstanding as of December 31, 2021,2023 and 8,714,000 shares authorized2022. See Note 13. Equity for additional information.
The accompanying notes are an integral part of these consolidated financial statements.
SoFi Technologies, Inc.
Consolidated Balance Sheets (Continued)
(In Thousands, Except for Share Data)
The following table presents the assets and 2,406,549 shares outstandingliabilities of consolidated VIEs which are included in our consolidated balance sheets. The assets in the below table may only be used to settle obligations of consolidated VIEs and are in excess of those obligations as of December 31, 2020. See Note 12 for additional information.the dates presented. Additionally, the assets and liabilities in the table below exclude intercompany balances, which eliminate upon consolidation.
| | | | | | | | | | | |
| December 31, |
| 2023 | | 2022 |
| Assets: | | | |
| Restricted cash and restricted cash equivalents | $ | 50,547 | | | $ | 68,151 | |
| Loans held for sale, at fair value | 502,757 | | | 931,701 | |
| Loans held for investment, at fair value | 221,461 | | | — | |
| Total assets | $ | 774,765 | | | $ | 999,852 | |
| Liabilities: | | | |
| Accounts payable, accruals and other liabilities | $ | 1,773 | | | $ | 3,053 | |
| Debt | 420,974 | | | 771,454 | |
| Residual interests classified as debt | 7,396 | | | 17,048 | |
| Total liabilities | $ | 430,143 | | | $ | 791,555 | |
The accompanying notes are an integral part of these consolidated financial statements.
SoFi Technologies, Inc.
Consolidated Statements of Operations and Comprehensive Loss
(In Thousands, Except for Share and Per Share Data)
| | | Year Ended December 31, | | Year Ended December 31, |
| | 2021 | | 2020 | | 2019 | | 2023 | | 2022 | | 2021 |
| Interest income | Interest income | | | | | | Interest income | | | |
| Loans | $ | 337,862 | | | $ | 330,353 | | | $ | 570,466 | |
| Securitizations | 14,109 | | | 24,031 | | | 23,179 | |
| Related party notes | 211 | | | 3,189 | | | 3,338 | |
| | Loans and securitizations | |
| | Loans and securitizations | |
| | Loans and securitizations | |
| Other | Other | 2,838 | | | 5,964 | | | 11,210 | |
| Total interest income | Total interest income | 355,020 | | | 363,537 | | | 608,193 | |
| Interest expense | Interest expense | | | | | |
| Securitizations and warehouses | Securitizations and warehouses | 90,485 | | | 155,150 | | | 268,063 | |
| Securitizations and warehouses | |
| Securitizations and warehouses | |
| Deposits | |
| Corporate borrowings | Corporate borrowings | 10,345 | | | 27,974 | | | 4,962 | |
| Other | Other | 1,946 | | | 2,482 | | | 5,334 | |
| Total interest expense | Total interest expense | 102,776 | | | 185,606 | | | 278,359 | |
| Net interest income | Net interest income | 252,244 | | | 177,931 | | | 329,834 | |
| Noninterest income | Noninterest income | |
| Loan origination and sales | 497,626 | | | 371,323 | | | 299,265 | |
| Securitizations | (14,862) | | | (70,251) | | | (199,125) | |
| | Loan origination, sales, and securitizations | |
| | Loan origination, sales, and securitizations | |
| | Loan origination, sales, and securitizations | |
| Servicing | Servicing | (2,281) | | | (19,426) | | | 8,486 | |
| Technology platform fees | 191,847 | | | 90,128 | | | — | |
| Technology products and solutions | |
| Other | Other | 60,298 | | | 15,827 | | | 4,199 | |
| Total noninterest income | Total noninterest income | 732,628 | | | 387,601 | | | 112,825 | |
| Total net revenue | Total net revenue | 984,872 | | | 565,532 | | | 442,659 | |
| Noninterest expense | Noninterest expense | |
| Technology and product development | Technology and product development | 276,087 | | | 201,199 | | | 147,458 | |
| Technology and product development | |
| Technology and product development | |
| Sales and marketing | Sales and marketing | 426,875 | | | 276,577 | | | 266,198 | |
| Cost of operations | Cost of operations | 256,980 | | | 178,896 | | | 116,327 | |
| General and administrative | General and administrative | 498,534 | | | 237,381 | | | 152,275 | |
| Goodwill impairment | |
| Provision for credit losses | Provision for credit losses | 7,573 | | | — | | | — | |
| Total noninterest expense | Total noninterest expense | 1,466,049 | | | 894,053 | | | 682,258 | |
| Loss before income taxes | Loss before income taxes | (481,177) | | | (328,521) | | | (239,599) | |
| Income tax (expense) benefit | (2,760) | | | 104,468 | | | (98) | |
| Income tax benefit (expense) | |
| Net loss | Net loss | $ | (483,937) | | | $ | (224,053) | | | $ | (239,697) | |
| Other comprehensive loss | | | | | |
| Unrealized losses on available-for-sale securities, net | (1,351) | | | — | | | — | |
| Other comprehensive income (loss) | |
| Unrealized gains (losses) on available-for-sale securities, net | |
| Unrealized gains (losses) on available-for-sale securities, net | |
| Unrealized gains (losses) on available-for-sale securities, net | |
| Foreign currency translation adjustments, net | Foreign currency translation adjustments, net | 46 | | | (145) | | | (9) | |
| Total other comprehensive loss | (1,305) | | | (145) | | | (9) | |
| Total other comprehensive income (loss) | |
| Comprehensive loss | Comprehensive loss | $ | (485,242) | | | $ | (224,198) | | | $ | (239,706) | |
| Loss per share (Note 17) | | | | | |
| Loss per share (Note 19) | |
| Loss per share – basic | |
| Loss per share – basic | |
| Loss per share – basic | Loss per share – basic | $ | (1.00) | | | $ | (4.30) | | | $ | (4.02) | |
| Loss per share – diluted | Loss per share – diluted | $ | (1.00) | | | $ | (4.30) | | | $ | (4.02) | |
| Weighted average common stock outstanding – basic | Weighted average common stock outstanding – basic | 526,730,261 | | | 73,851,108 | | | 65,619,361 | |
| Weighted average common stock outstanding – diluted | Weighted average common stock outstanding – diluted | 526,730,261 | | | 73,851,108 | | | 65,619,361 | |
The accompanying notes are an integral part of these consolidated financial statements.
SoFi Technologies, Inc.
Consolidated Statements of Changes in Temporary Equity and Permanent Equity (Deficit)
(In Thousands, Except for Share Data)
| | Common Stock | | Additional
Paid-In
Capital | | Treasury
Stock | | Accumulated
Other
Comprehensive
Loss | | Accumulated
Deficit | | Permanent
Equity (Deficit) | | | Temporary Equity |
| Shares | | Amount | Shares | | Amount |
| Balance at January 1, 2019 | 40,887,985 | | | $ | — | | | $ | 157,647 | | | $ | (2,914) | | | $ | (12) | | | $ | (223,143) | | | $ | (68,422) | | | | 199,355,696 | | | $ | 1,890,554 | |
| Retroactive conversion of shares due to Business Combination | 30,371,595 | | | — | | | — | | | — | | | — | | | — | | | — | | | | 170,868,620 | | | — | |
| Balance at January 1, 2019, as converted | 71,259,580 | | | — | | | 157,647 | | | (2,914) | | | (12) | | | (223,143) | | | (68,422) | | | | 370,224,316 | | | 1,890,554 | |
| Share-based compensation expense | — | | | — | | | 60,936 | | | — | | | — | | | — | | | 60,936 | | | | — | | | — | |
| Equity-based payments to non-employees | 76,084 | | | — | | | 483 | | | — | | | — | | | — | | | 483 | | | | — | | | — | |
| Vesting of RSUs | 7,698,481 | | | — | | | — | | | — | | | — | | | — | | | — | | | | — | | | — | |
| Stock withheld related to taxes on vested RSUs | (3,272,192) | | | — | | | (21,411) | | | — | | | — | | | — | | | (21,411) | | | | — | | | — | |
| Exercise of common stock options | 3,276,387 | | | — | | | 7,844 | | | — | | | — | | | — | | | 7,844 | | | | — | | | — | |
| Common stock purchases | (1,774,479) | | | — | | | — | | | — | | | — | | | (8,804) | | | (8,804) | | | | — | | | — | |
| Redeemable preferred stock dividends | — | | | — | | | (23,923) | | | — | | | — | | | — | | | (23,923) | | | | — | | | — | |
| Constructive retirement of treasury shares | (8,223,111) | | | — | | | — | | | 2,914 | | | — | | | (2,914) | | | — | | | | — | | | — | |
| Note receivable issuance to stockholder, inclusive of interest | — | | | — | | | (61,214) | | | — | | | — | | | — | | | (61,214) | | | | — | | | — | |
| Note receivable payments from stockholder, inclusive of interest | — | | | — | | | 15,155 | | | — | | | — | | | — | | | 15,155 | | | | — | | | — | |
| Issuance of redeemable preferred stock | — | | | — | | | — | | | — | | | — | | | — | | | — | | | | 33,946,449 | | | 551,577 | |
| Preferred stock issuance costs | — | | | — | | | — | | | — | | | — | | | — | | | — | | | | — | | | (2,400) | |
| Net loss | — | | | — | | | — | | | — | | | — | | | (239,697) | | | (239,697) | | | | — | | | — | |
| Other comprehensive loss, net | — | | | — | | | — | | | — | | | (9) | | | — | | | (9) | | | | — | | | — | |
| Balance at December 31, 2019, as converted | 69,040,750 | | | $ | — | | | $ | 135,517 | | | $ | — | | | $ | (21) | | | $ | (474,558) | | | $ | (339,062) | | | | 404,170,765 | | | $ | 2,439,731 | |
| Share-based compensation expense | — | | | — | | | 99,870 | | | — | | | — | | | — | | | 99,870 | | | | — | | | — | |
| Equity-based payments to non-employees | 130,710 | | | — | | | 908 | | | — | | | — | | | — | | | 908 | | | | — | | | — | |
| Vesting of RSUs | 11,528,031 | | | — | | | — | | | — | | | — | | | — | | | — | | | | — | | | — | |
| Stock withheld related to taxes on vested RSUs | (4,431,964) | | | — | | | (31,259) | | | — | | | — | | | — | | | (31,259) | | | | — | | | — | |
| Exercise of common stock options | 2,039,000 | | | — | | | 3,781 | | | — | | | — | | | — | | | 3,781 | | | | — | | | — | |
| Vested stock options assumed in acquisition | — | | | — | | | 32,197 | | | — | | | — | | | — | | | 32,197 | | | | — | | | — | |
| Common stock purchases | (114,819) | | | — | | | — | | | — | | | — | | | (566) | | | (566) | | | | — | | | — | |
| Redeemable preferred stock dividends | — | | | — | | | (40,536) | | | — | | | — | | | — | | | (40,536) | | | | — | | | — | |
| Note receivable issuance to stockholder, inclusive of interest | — | | | — | | | (1,764) | | | — | | | — | | | — | | | (1,764) | | | | — | | | — | |
| Note receivable payments from stockholder, inclusive of interest | — | | | — | | | 47,823 | | | — | | | — | | | — | | | 47,823 | | | | — | | | — | |
| Issuance of redeemable preferred stock | — | | | — | | | — | | | — | | | — | | | — | | | — | | | | 91,921,020 | | | 814,156 | |
| Preferred stock redemption | — | | | — | | | (52,658) | | | — | | | — | | | — | | | (52,658) | | | | (26,941,263) | | | (80,201) | |
| Issuance of common stock in acquisition | 1,919,356 | | | — | | | 15,565 | | | — | | | — | | | — | | | 15,565 | | | | — | | | — | |
| Issuance of common stock | 34,973,294 | | | — | | | 369,840 | | | — | | | — | | | — | | | 369,840 | | | | — | | | — | |
| Common stock issuance costs | — | | | — | | | (56) | | | — | | | — | | | — | | | (56) | | | | — | | | — | |
| Net loss | — | | | — | | | — | | | — | | | — | | | (224,053) | | | (224,053) | | | | — | | | — | |
| Other comprehensive loss, net | — | | | — | | | — | | | — | | | (145) | | | — | | | (145) | | | | — | | | — | |
| Balance at December 31, 2020, as converted | 115,084,358 | | | $ | — | | | $ | 579,228 | | | $ | — | | | $ | (166) | | | $ | (699,177) | | | $ | (120,115) | | | | 469,150,522 | | | $ | 3,173,686 | |
| Common Stock | | | Common Stock | | Additional Paid-In Capital | | Accumulated Other Comprehensive Income (Loss) | | Accumulated Deficit | | Permanent Equity (Deficit) | | | Temporary Equity |
| Shares | | | Shares | | Amount | Shares | | Amount |
| Balance at January 1, 2021 | |
| Share-based compensation expense | Share-based compensation expense | — | | | — | | | 246,787 | | | — | | | — | | | — | | | 246,787 | | | | — | | | — | |
| Equity-based payments to non-employees | Equity-based payments to non-employees | 18,058 | | | — | | | 360 | | | — | | | — | | | — | | | 360 | | | | — | | | — | |
| Vesting of RSUs | Vesting of RSUs | 16,427,162 | | | 2 | | | (2) | | | — | | | — | | | — | | | — | | | | — | | | — | |
| Stock withheld related to taxes on vested RSUs | Stock withheld related to taxes on vested RSUs | (2,405,588) | | | — | | | (42,644) | | | — | | | — | | | — | | | (42,644) | | | | — | | | — | |
| Exercise of common stock options | Exercise of common stock options | 8,523,468 | | | — | | | 25,154 | | | — | | | — | | | — | | | 25,154 | | | | — | | | — | |
| Redeemable preferred stock dividends | Redeemable preferred stock dividends | — | | | — | | | (40,426) | | | — | | | — | | | — | | | (40,426) | | | | — | | | — | |
| Issuance of contingently issuable stock | Issuance of contingently issuable stock | 1,601,781 | | | — | | | — | | | — | | | — | | | — | | | — | | | | — | | | — | |
| Conversion of common stock warrants issued in connection with Business Combination and PIPE Investment into permanent equity | Conversion of common stock warrants issued in connection with Business Combination and PIPE Investment into permanent equity | — | | | — | | | 185,762 | | | — | | | — | | | — | | | 185,762 | | | | — | | | — | |
| Issuance of common stock related to exercise of warrants | Issuance of common stock related to exercise of warrants | 15,193,668 | | | 2 | | | 95,045 | | | — | | | — | | | — | | | 95,047 | | | | — | | | — | |
| Cancellation of redeemable preferred stock related to a business combination | Cancellation of redeemable preferred stock related to a business combination | — | | | — | | | — | | | — | | | — | | | — | | | — | | | | (83,856) | | | (743) | |
| Conversion of redeemable preferred stock warrants into permanent equity | Conversion of redeemable preferred stock warrants into permanent equity | — | | | — | | | 161,775 | | | — | | | — | | | — | | | 161,775 | | | | — | | | — | |
| Conversion of redeemable preferred stock to common stock | Conversion of redeemable preferred stock to common stock | 450,832,666 | | | 45 | | | 2,702,524 | | | — | | | — | | | — | | | 2,702,569 | | | | (450,832,666) | | | (2,702,569) | |
| Issuance of common stock in connection with Business Combination and PIPE Investment | Issuance of common stock in connection with Business Combination and PIPE Investment | 222,878,889 | | | 22 | | | 1,789,579 | | | — | | | — | | | — | | | 1,789,601 | | | | — | | | — | |
| Costs directly attributable to the issuance of common stock in connection with Business Combination and PIPE Investment | Costs directly attributable to the issuance of common stock in connection with Business Combination and PIPE Investment | — | | | — | | | (27,539) | | | — | | | — | | | — | | | (27,539) | | | | — | | | — | |
| Repurchase of redeemable common stock | Repurchase of redeemable common stock | — | | | — | | | — | | | — | | | — | | | — | | | — | | | | (15,000,000) | | | (150,000) | |
| Change in par for historical SoFi common stock | Change in par for historical SoFi common stock | — | | | 12 | | | (12) | | | — | | | — | | | — | | | — | | | | — | | | — | |
| Purchase of capped calls | Purchase of capped calls | — | | | — | | | (113,760) | | | — | | | — | | | — | | | (113,760) | | | | — | | | — | |
| Net loss | Net loss | — | | | — | | | — | | | — | | | — | | | (483,937) | | | (483,937) | | | | — | | | — | |
| Other comprehensive loss, net | — | | | — | | | — | | | — | | | (1,305) | | | — | | | (1,305) | | | | — | | | — | |
| Other comprehensive loss, net of taxes | |
| Balance at December 31, 2021 | Balance at December 31, 2021 | 828,154,462 | | | $ | 83 | | | $ | 5,561,831 | | | $ | — | | | $ | (1,471) | | | $ | (1,183,114) | | | $ | 4,377,329 | | | | 3,234,000 | | | $ | 320,374 | |
| Share-based compensation expense | |
| Equity-based payments to non-employees | |
| Vesting of RSUs | |
| Stock withheld related to taxes on vested RSUs | |
| Exercise of common stock options | |
| Issuance of common stock in acquisition | |
| Vested awards assumed in acquisition | |
| Redeemable preferred stock dividends | |
| Net loss | |
| Other comprehensive loss, net of taxes | |
| Balance at December 31, 2022 | |
| Share-based compensation expense | |
| Vesting of RSUs | |
| Stock withheld related to taxes on vested RSUs | |
| Exercise of common stock options | |
| Common stock retired | |
| Extinguishment of convertible notes by issuance of common stock | |
| Redeemable preferred stock dividends | |
| Net loss | |
| Other comprehensive income, net of taxes | |
| Balance at December 31, 2023 | |
The accompanying notes are an integral part of these consolidated financial statements.
SoFi Technologies, Inc.
SoFi Technologies, Inc.
Consolidated Statements of Cash Flows
(In Thousands)
| | Year Ended December 31, |
| 2021 | | 2020 | | 2019 |
| Year Ended December 31, | | | Year Ended December 31, |
| 2023 | | | 2023 | | 2022 | | 2021 |
| Operating activities | Operating activities | | | | | |
| Net loss | Net loss | $ | (483,937) | | | $ | (224,053) | | | $ | (239,697) | |
| Net loss | |
| Net loss | |
| Adjustments to reconcile net loss to net cash used in operating activities: | Adjustments to reconcile net loss to net cash used in operating activities: | |
| Share-based compensation expense | |
| Share-based compensation expense | |
| Share-based compensation expense | |
| Depreciation and amortization | Depreciation and amortization | 101,568 | | | 69,832 | | | 15,955 | |
| Goodwill impairment | |
| Deferred debt issuance and discount expense | Deferred debt issuance and discount expense | 18,292 | | | 28,310 | | | 33,205 | |
| Share-based compensation expense | 239,011 | | | 99,870 | | | 60,936 | |
| Equity-based payments to non-employees | 360 | | | 908 | | | 483 | |
| Gain on extinguishment of convertible debt | |
| Provision for credit losses | |
| Deferred income taxes | Deferred income taxes | 1,204 | | | (104,504) | | | 52 | |
| Equity method investment earnings | 261 | | | (4,314) | | | (869) | |
| Accretion of seller note interest expense | — | | | 6,002 | | | — | |
| Fair value changes in loans held for investment | |
| Fair value changes in residual interests classified as debt | Fair value changes in residual interests classified as debt | 22,802 | | | 38,216 | | | 17,157 | |
| Fair value changes in securitization investments | Fair value changes in securitization investments | (6,538) | | | (13,919) | | | (11,363) | |
| Fair value changes in warrant liabilities | Fair value changes in warrant liabilities | 107,328 | | | 20,525 | | | (2,834) | |
| Fair value adjustment to related party notes receivable | (169) | | | 319 | | | — | |
| Equity method investment earnings | |
| Other | Other | (5,085) | | | 803 | | | 2,205 | |
| Changes in operating assets and liabilities: | Changes in operating assets and liabilities: | |
| Originations and purchases of loans | (13,500,706) | | | (10,406,813) | | | (11,579,679) | |
| Proceeds from sales and repayments of loans | 12,202,525 | | | 9,949,805 | | | 11,635,228 | |
| Other changes in loans | (10,148) | | | (58,743) | | | 69,214 | |
| Changes in loans held for sale, net | |
| Changes in loans held for sale, net | |
| Changes in loans held for sale, net | |
| Changes in loans previously classified as held for sale, net | |
| Servicing assets | Servicing assets | (18,662) | | | 52,021 | | | (35,913) | |
| Related party notes receivable interest income | 1,399 | | | 1,121 | | | (2,670) | |
| Other assets | Other assets | (10,700) | | | (29,883) | | | (18,171) | |
| Accounts payable, accruals and other liabilities | Accounts payable, accruals and other liabilities | (9,022) | | | 95,161 | | | 2,028 | |
| Related party notes receivable interest income | |
| Net cash used in operating activities | Net cash used in operating activities | $ | (1,350,217) | | | $ | (479,336) | | | $ | (54,733) | |
| Investing activities | Investing activities | | | | | |
| Purchases of property, equipment, software and intangible assets | $ | (52,261) | | | $ | (24,549) | | | $ | (37,590) | |
| Related party notes receivable issuances | — | | | (7,643) | | | (9,050) | |
| Proceeds from repayment of related party notes receivable | 16,693 | | | — | | | — | |
| Purchases of property, equipment and software | |
| Purchases of property, equipment and software | |
| Purchases of property, equipment and software | |
| Capitalized software development costs | |
| Purchases of available-for-sale investments | Purchases of available-for-sale investments | (246,372) | | | — | | | — | |
| Proceeds from sales of available-for-sale investments | Proceeds from sales of available-for-sale investments | 52,742 | | | — | | | — | |
| Proceeds from maturities of available-for-sale investments | 4,799 | | | — | | | — | |
| Proceeds from maturities and paydowns of available-for-sale investments | |
| Changes in loans held for investment, net | |
| Proceeds from securitization investments | |
| Proceeds from non-securitization investments | |
| Purchases of non-securitization investments | Purchases of non-securitization investments | (22,000) | | | (145) | | | (3,608) | |
| Proceeds from non-securitization investments | 109,534 | | | 974 | | | — | |
| Proceeds from securitization investments | 247,058 | | | 322,704 | | | 165,116 | |
| | Acquisition of business, net of cash acquired | — | | | (32,392) | | | — | |
| Net cash provided by investing activities | $ | 110,193 | | | $ | 258,949 | | | $ | 114,868 | |
| Acquisition of businesses, net of cash acquired | |
| Proceeds from repayment of related party notes receivable | |
| Net cash (used in) provided by investing activities | |
The accompanying notes are an integral part of these consolidated financial statements.
134
SoFi Technologies, Inc.
SoFi Technologies, Inc.
Consolidated Statements of Cash Flows (Continued)
(In Thousands)
| | | | | | | | | | | | | | | | | |
| Year Ended December 31, |
| 2021 | | 2020 | | 2019 |
| Financing activities | | | | | |
| Proceeds from debt issuances | $ | 9,521,314 | | | $ | 10,234,378 | | | $ | 12,458,120 | |
| Repayment of debt | (10,429,176) | | | (9,708,991) | | | (12,826,085) | |
| Payment of debt issuance costs | (9,465) | | | (16,443) | | | (20,596) | |
| Purchase of capped calls | (113,760) | | | — | | | — | |
| Taxes paid related to net share settlement of share-based awards | (42,644) | | | (31,259) | | | (21,411) | |
| Purchases of common stock | (526) | | | (40) | | | (8,804) | |
| Redemptions of redeemable common and preferred stock | (282,859) | | | — | | | — | |
| Proceeds from Business Combination and PIPE Investment | 1,989,851 | | | — | | | — | |
| Payment of costs directly attributable to the issuance of common stock in connection with Business Combination and PIPE Investment | (26,951) | | | — | | | — | |
| Proceeds from stock option exercises | 25,154 | | | 3,781 | | | 7,844 | |
| Proceeds from warrant exercises | 95,047 | | | — | | | — | |
| Payment of redeemable preferred stock dividends | (40,426) | | | (40,536) | | | (23,923) | |
| Payment of deferred equity costs | (56) | | | — | | | — | |
| Finance lease principal payments | (516) | | | (489) | | | — | |
| Note receivable issuance to stockholder | — | | | — | | | (58,000) | |
| Note receivable principal repayments from stockholder | — | | | 43,513 | | | 14,487 | |
| Proceeds from common stock issuances | — | | | 369,840 | | | — | |
| Proceeds from redeemable preferred stock issuances | — | | | — | | | 573,845 | |
| Payment of redeemable preferred stock issuance costs | — | | | — | | | (2,400) | |
| | | | | |
| Net cash provided by financing activities | $ | 684,987 | | | $ | 853,754 | | | $ | 93,077 | |
| Effect of exchange rates on cash and cash equivalents | 46 | | | (145) | | | (9) | |
| Net (decrease) increase in cash, cash equivalents, restricted cash and restricted cash equivalents | (554,991) | | | 633,222 | | | 153,203 | |
| Cash, cash equivalents, restricted cash and restricted cash equivalents at beginning of period | 1,323,428 | | | 690,206 | | | 537,003 | |
| Cash, cash equivalents, restricted cash and restricted cash equivalents at end of period | $ | 768,437 | | | $ | 1,323,428 | | | $ | 690,206 | |
| | | | | |
| Reconciliation to amounts on consolidated balance sheets (as of period end) | | | | | |
| Cash and cash equivalents | $ | 494,711 | | | $ | 872,582 | | | $ | 499,486 | |
| Restricted cash and restricted cash equivalents | 273,726 | | | 450,846 | | | 190,720 | |
| Total cash, cash equivalents, restricted cash and restricted cash equivalents | $ | 768,437 | | | $ | 1,323,428 | | | $ | 690,206 | |
| | | | | |
The accompanying notes are an integral part of these consolidated financial statements.
135
SoFi Technologies, Inc.
Consolidated Statements of Cash Flows (Continued)
(In Thousands)
| | | | | | | | | | | | | | | | | |
| Year Ended December 31, |
| 2021 | | 2020 | | 2019 |
| Supplemental cash flow information | | | | | |
| Interest paid | $ | 94,795 | | | $ | 129,131 | | | $ | 224,916 | |
| Income taxes paid, net | 1,759 | | | 529 | | | 8 | |
| | | | | |
| Supplemental non-cash investing and financing activities | | | | | |
| Securitization investments acquired via loan transfers | $ | 118,274 | | | $ | 151,768 | | | $ | 351,254 | |
| Non-cash property, equipment, software and intangible asset additions | 1,930 | | | 358 | | | 15,247 | |
| Available-for-sale investments securities purchased but unpaid | 7,457 | | | — | | | — | |
| Share-based compensation capitalized related to internally-developed software | 7,776 | | | — | | | — | |
| Third party warrants acquired with earnings initially deferred | 964 | | | — | | | — | |
| Deferred debt issuance costs accrued but unpaid | 925 | | | 1,600 | | | — | |
| Costs directly attributable to the issuance of common stock paid in 2020 | 588 | | | — | | | — | |
| Reduction to temporary equity associated with purchase price adjustments | 743 | | | — | | | — | |
| Conversion of temporary equity into permanent equity in conjunction with the Business Combination | 2,702,569 | | | — | | | — | |
| Deconsolidation of residual interests classified as debt | — | | | 101,718 | | | 97,928 | |
| Deconsolidation of securitization debt | — | | | 770,918 | | | 1,366,992 | |
| Seller note issued in acquisition | — | | | 243,998 | | | — | |
| Redeemable preferred stock issued in acquisition | — | | | 814,156 | | | — | |
| Redeemable preferred stock warrants accounted for as liabilities | — | | | — | | | 22,268 | |
| Common stock options assumed in acquisition | — | | | 32,197 | | | — | |
| Issuance of common stock in acquisition | — | | | 15,565 | | | — | |
| Finance lease right-of-use assets acquired | — | | | 15,100 | | | — | |
| Property, equipment and software acquired in acquisition | — | | | 2,026 | | | — | |
| Debt assumed in acquisition | — | | | 5,832 | | | — | |
| Issuance of residual interests classified as debt as consideration for loan additions | — | | | — | | | 116,906 | |
| Accrued but unpaid deferred equity costs | — | | | 56 | | | — | |
| Redeemed but unpaid common stock | — | | | 526 | | | — | |
| Redeemed but unpaid redeemable preferred stock | — | | | 132,859 | | | — | |
| | | | | |
| | | | | |
| | | | | |
| | | | | |
| | | | | | | | | | | | | | | | | |
| Year Ended December 31, |
| 2023 | | 2022 | | 2021 |
| Financing activities | | | | | |
| Net change in deposits | $ | 11,231,904 | | | $ | 7,152,975 | | | $ | — | |
| Net change in debt facilities | 180,554 | | | 1,418,456 | | | (1,186,880) | |
| Proceeds from other debt issuances | 339,995 | | | 439,990 | | | 1,191,908 | |
| Repayment of other debt | (799,859) | | | (516,363) | | | (912,890) | |
| Payment of debt issuance costs | (11,903) | | | (8,287) | | | (9,465) | |
| Taxes paid related to net share settlement of share-based awards | (15,300) | | | (8,983) | | | (42,644) | |
| Proceeds from stock option exercises | 1,145 | | | 2,610 | | | 25,154 | |
| Payment of redeemable preferred stock dividends | (40,425) | | | (40,425) | | | (40,426) | |
| Finance lease principal payments | (509) | | | (488) | | | (516) | |
| Purchases of common stock | — | | | — | | | (526) | |
| Redemptions of redeemable common and preferred stock | — | | | — | | | (282,859) | |
| Proceeds from Business Combination and PIPE Investment | — | | | — | | | 1,989,851 | |
| Payment of costs directly attributable to the issuance of common stock in connection with Business Combination and PIPE Investment | — | | | — | | | (26,951) | |
| Proceeds from warrant exercises | — | | | — | | | 95,047 | |
| Purchase of capped calls | — | | | — | | | (113,760) | |
| Payment of deferred equity costs | — | | | — | | | (56) | |
| Net cash provided by financing activities | $ | 10,885,602 | | | $ | 8,439,485 | | | $ | 684,987 | |
| Effect of exchange rates on cash and cash equivalents | 677 | | | 571 | | | 46 | |
| Net increase (decrease) in cash, cash equivalents, restricted cash and restricted cash equivalents | $ | 1,769,276 | | | $ | 1,077,865 | | | $ | (554,991) | |
| Cash, cash equivalents, restricted cash and restricted cash equivalents at beginning of period | 1,846,302 | | | 768,437 | | | 1,323,428 | |
| Cash, cash equivalents, restricted cash and restricted cash equivalents at end of period | $ | 3,615,578 | | | $ | 1,846,302 | | | $ | 768,437 | |
| | | | | |
| Reconciliation to amounts on consolidated balance sheets (as of period end) | | | | | |
| Cash and cash equivalents | $ | 3,085,020 | | | $ | 1,421,907 | | | $ | 494,711 | |
| Restricted cash and restricted cash equivalents | 530,558 | | | 424,395 | | | 273,726 | |
| Total cash, cash equivalents, restricted cash and restricted cash equivalents | $ | 3,615,578 | | | $ | 1,846,302 | | | $ | 768,437 | |
| | | | | |
| Supplemental cash flow information | | | | | |
| Interest paid | $ | 720,163 | | | $ | 150,866 | | | $ | 94,795 | |
| Income taxes paid, net | 14,326 | | | 2,567 | | | 1,759 | |
| | | | | |
| Supplemental non-cash investing and financing activities | | | | | |
| Deposits credited but not yet received in cash | $ | 67,257 | | | $ | 31,305 | | | $ | — | |
| Deconsolidation of securitization and residual debt | 92,914 | | | 99,695 | | | — | |
| Extinguishment of convertible notes by issuance of common stock | 87,047 | | | — | | | — | |
| Securitization investments acquired via loan transfers | 18,985 | | | — | | | 118,274 | |
| Derecognition of securitization investments | 5,325 | | | 40,933 | | | — | |
| Deposits assumed in acquisition | — | | | 158,016 | | | — | |
| Loans held for investment received in acquisition | — | | | 84,485 | | | — | |
| Available-for-sale securities received in acquisition | — | | | 10,014 | | | — | |
The accompanying notes are an integral part of these consolidated financial statements.
136135
SoFi Technologies, Inc.
SoFi Technologies, Inc.
Notes to Consolidated Financial Statements
(In Thousands, Unless Otherwise Stated and Except for Share and Per Share Data)
Note 1. Organization, Summary of Significant Accounting Policies and New Accounting Standards
Organization
Social Finance, Inc. (“Social Finance”) entered into a merger agreement (the “Agreement”) with Social Capital Hedosophia Holdings Corp. V (“SCH”)SCH on January 7, 2021. The transactions contemplated by the terms of the Agreement were completed on May 28, 2021 (the “Closing”), in conjunction with which SCH changed its name to SoFi Technologies, Inc. (hereafter referred to, collectively with its subsidiaries, as “SoFi”, the “Company”, “we”, “us” or “our”), unless the context otherwise requires). The transactions contemplated in the Agreement are collectively referred to as the “Business Combination”. See Note 2 for additional information on the Business Combination.
SoFi is a financial services platform that was founded in 2011 to offer an innovative approach to the private student loan market by providing student loan refinancing options. The Company conducts its business through 3three reportable segments: Lending, Technology Platform and Financial Services. Since its founding, SoFi has expanded its lending and financial services strategy to offer homepersonal loans, personalhome loans and credit cards. The Company has also developed non-lendingadditional financial products, such as money management and investment product offerings, and has also leveraged its financial services platform to empower other businesses. ThroughThe Company has continued to expand its product offerings through strategic acquisitions,acquisitions. During 2020, the Company expanded its investment product offerings into Hong Kong through the acquisition of 8 Limited, and also operatesbegan to operate as a platform-as-a-serviceplatform as a service for a variety of financial service providers, providing the infrastructure to facilitate core client-facing and back-end capabilities, such as account setup, account funding, direct deposit, authorizations and processing, payments functionality and check account balance features.features through the acquisition of Galileo. During 2022, the Company became a bank holding company and began operating as SoFi Bank, National Association, through its acquisition of Golden Pacific Bancorp, Inc., and expanded its platform to include a cloud-native digital and core banking platform with customers in Latin America through its acquisition of Technisys S.A., allowing the Company to expand its technology platform services to a broader international market. During 2023, the Company acquired Wyndham Capital Mortgage, a fintech mortgage lender. For additional information on theseour recent business combinations, see Note 2. Business Combinations. For additional information on our reportable segments, see Note 18.20. Business Segment and Geographic Information.
Summary of Significant Accounting Policies
Basis of Presentation
The consolidated financial statements include the accounts of the Company, its wholly-owned and majority-owned subsidiaries and certain consolidated VIEs. All intercompany accounts were eliminated in consolidation. The consolidated financial statements were prepared in conformity with accounting principles generally accepted in the United States (“GAAP”)GAAP and in accordance with the rules and regulations of the Securities and Exchange Commission (“SEC”).SEC.
As a result of the Business Combination completed on May 28, 2021, prior period share and per share amounts presented in the accompanyingIn our consolidated financial statements, we made the following presentation changes in 2023:
•in our consolidated statements of operations and these related notes have been retroactively converted comprehensive loss, (i) combined the financial statement line items for interest income—loans and interest income—securitizations and presented within interest income—loans and securitizations; and
•in accordance with Accounting Standards Codification (“ASC”) 805,our consolidated statements of operations and comprehensive loss, (i) combined the financial statement line items for Business Combinationsnoninterest income—loan origination and sales and noninterest income—securitizations and presented within noninterest income—loan origination, sales and securitizations. See Note 2 for additional information.
In all instances, the respective prior period amounts were recast to conform to the current period presentation.
Use of Judgments, Assumptions and Estimates
The preparation of our consolidated financial statements and related disclosures in conformity with GAAP requires management to make assumptions and estimates that affect the reported amounts reportedof assets, liabilities, revenue, expenses, and the disclosures of contingent assets and liabilities. These estimates and assumptions are inherently subjective in nature and, therefore, actual results may differ from our consolidated financial statementsestimates and accompanying notes.assumptions, and the differences could be material. Management bases its estimates on historical experience and on various other factors it believes to be reasonable under the circumstances, the results of which form the basis for making judgments about the carrying values of our assets and liabilities.circumstances. These judgments, assumptions and estimates include, but are not limited to, the following: (i) fair value measurements;measurements, (ii) share-based compensation expense;business combinations, and (iii) consolidation of variable interest entities;goodwill.
SoFi Technologies, Inc.
SoFi Technologies, Inc.
Notes to Consolidated Financial Statements (continued)
(In Thousands, Unless Otherwise Stated and (iv) business combinations. These judgments, estimatesExcept for Share and assumptions are inherently subjective in nature and, therefore, actual results may differ from our estimates and assumptions.Per Share Data)
Business Combinations
We account for acquisitions of entities or asset groups that qualify as businesses using the acquisition method of accounting in accordance with ASC 805, Business Combinations (“ASC 805”).accounting. Purchase consideration is allocated to the tangible and intangible assets acquired and liabilities assumed based on the estimated fair values as of the acquisition date, which are measured in accordance with the principles outlined in ASC 820, Fair Value Measurement (“ASC 820”).fair value measurement accounting principles. The determination of fair value requires management to make estimates about discount rates, future expected cash flows, market conditions and other future events that are highly subjective in nature. The excess of the total purchase consideration over the fair value of the identified net assets acquired is recognized as goodwill. The results of the acquired businesses are included in our results of operations beginning from the date of acquisition. Acquisition-related costs are expensed as incurred.
SoFi Technologies, Inc.
Notes to Consolidated Financial Statements (continued)
(In Thousands, Unless Otherwise Stated and Except for Share and Per Share Data)
During the measurement period, which may be up to one year from the acquisition date, we may record adjustments to the allocation of purchase consideration and to the fair values of assets acquired and liabilities assumed to the extent that additional information becomes available. After this period, any subsequent adjustments are recorded in the consolidated statements of operations and comprehensive income (loss).loss.
The Business Combination with SCH during the year ended December 31, 2021 was accounted for as a reverse recapitalization. See Note 2 for additional information.
Consolidation of Variable Interest Entities
We enter into arrangements in which we originate loans, establish a special purpose entity (“SPE”),SPE, and transfer loans to the SPE. We retain the servicing rights of those loans and hold additional interests in the SPE. We evaluate each such arrangement to determine whether we have a variable interest. If we determine that we have a variable interest in an SPE, we then determine whether the SPE is a VIE. If the SPE is a VIE, we assess whether we are the primary beneficiary of the VIE, such that we must consolidate the VIE on our consolidated balance sheets. To determine if we are the primary beneficiary, we identify the most significant activities and determine who has the power over those activities, and who absorbs the variability in the economics of the VIE. As of December 31, 2021 and 2020, we had 13 and 15 consolidated VIEs, respectively, on our consolidated balance sheets. Refer to Note 6 for more details regarding our consolidated VIEs.
We periodically reassess our involvement with each VIE in which we have a variable interest. We monitor matters related to our ability to control economic performance, such as management of the SPE and its underlying loans, contractual changes in the services provided, the extent of our ownership, and the rights of third parties to terminate us as the VIE servicer. In addition, we monitor the financial performance of each VIE for indications that we may or may not have the right to absorb benefits or the obligation to absorb losses associated with variability in the financial performance of the VIE that could potentially be significant to that VIE, which we define as a variable interest of greater than 10%.
A significant change to the pertinent rights of us or other parties, or a significant change to the ranges of possible financial performance outcomes used in our assessment of the variability of cash flows due to us, could impact the determination of whether or not a VIE should be consolidated in future periods. VIE consolidation and deconsolidation may lead to increased volatility in our financial results and impact period-over-period comparability. Our maximum exposure to loss as a result of our involvement with consolidated VIEs is limited to our investment, which is eliminated in consolidation. There are no liquidity arrangements, guarantees or other commitments by third parties that may affect the fair value or risk of our variable interests in consolidated VIEs. Refer to Note 7. Securitization and Variable Interest Entities for more details regarding our consolidated VIEs.
Fair Value Measurements
Fair value is defined as the price that would be received for an asset or paid to transfer a liability (an exit price) in the principal or most advantageous market for the asset or liability in an orderly transaction between market participants on the measurement date. We use a three-level fair value hierarchy to classify and disclose all assets and liabilities measured at fair value on a recurring basis in periods subsequent to their initial measurement. The hierarchy requires us to use observable inputs when available and to minimize the use of unobservable inputs when determining fair value. The three levels are defined as follows:
•Level 1 — Quoted prices in active markets for identical assets or liabilities, accessible by us at the measurement date.
•Level 2 — Quoted prices for similar assets or liabilities in active markets, or quoted prices for identical or similar assets or liabilities in markets that are not active, or observable inputs other than quoted prices.
•Level 3 — Unobservable inputs for assets or liabilities for which there is little or no market data, which requires us to develop our own assumptions. These unobservable assumptions reflect estimates of inputs that market participants would use in pricing the asset or liability. Valuation techniques include the use of option pricing models, discounted
SoFi Technologies, Inc.
SoFi Technologies, Inc.
Notes to Consolidated Financial Statements (continued)
(In Thousands, Unless Otherwise Stated and Except for Share and Per Share Data)
cash flow models, or similar techniques, which incorporate management’s own estimates of assumptions that market participants would use in pricing the asset or liability.
A financial instrument’s categorization within the fair value hierarchy is based on the lowest level of input that is significant to the fair value measurement. Instruments are categorized in Level 3 of the fair value hierarchy based on the significance of unobservable factors in the overall fair value measurement. As a result, the related gains and losses for assets
SoFi Technologies, Inc.
Notes to Consolidated Financial Statements (continued)
(In Thousands, Unless Otherwise Stated and Except for Share and Per Share Data)
and liabilities within the Level 3 category presented in Note 915. Fair Value Measurements may include changes in fair value that are attributable to both observable and unobservable inputs. We utilize third-party valuation specialists to perform a valuation of these Level 2 and Level 3 financial instruments on a monthly basis with quarterly oversight by a Valuation Working Group established by the Company that comprises leaders across finance, capital markets and accounting.
Transfers of Financial Assets
The transfer of an entire financial asset is accounted for as a sale if all of the following conditions are met:
•the financial asset is isolated from the transferor and its consolidated affiliates as well as its creditors, even in bankruptcy or other receivership;
•the transferee or beneficial interest holders have the right to pledge or exchange the transferred financial asset; and
•the transferor, its consolidated affiliates and its agents do not maintain effective control over the transferred financial asset.
Loan sales are aggregated in the financial statements due to the similarity of both the loans transferred and servicing arrangements. The portion of our income relating to ongoing servicing and the fair value of our servicing rights are dependent upon the performance of the sold loans. We measure the gain or loss on the sale of financial assets as the net assets received from the sale less the carrying amount of the loans sold. The net assets received from the sale represent the fair value of any assets obtained or liabilities incurred as part of the transaction, including but not limited to cash, servicing assets, retained securitization investments and recourse obligations.
When securitizing loans, we employ a two-step transaction that includes the isolation of the underlying loans in a trust and the sale of beneficial interests in the trust to a bankruptcy-remote entity. Transfers of financial assets that do not qualify for sale accounting are reported as secured borrowings. Accordingly, the related assets remain on our consolidated balance sheets and continue to be reported and accounted for as if the transfer had not occurred. Cash proceeds received from these transfers are reported as liabilities, with related interest expense recognized over the life of the related secured borrowing.
As a component of the loan sale agreements, we make certain representations to third parties that purchase our previously-held loans, some of which include Federal National Mortgage Association (“FNMA”)GSE repurchase requirements and all of which are standard in nature and do not constrain our ability to recognize a sale for accounting purposes. Any significant estimated post-sale obligations or contingent obligations to the purchaser of the loans arising from these representations are accrued if probable and estimable. Pursuant to ASC 460, Guarantees (“ASC 460”), weWe establish a loan repurchase liability, which is based on historical experience and any current developments which would make it probable that we would buy back loans previously sold to third parties at the historical sales price. The loan repurchase liability is presented within accounts payable, accruals and other liabilities in the consolidated balance sheets, with the corresponding charges recorded within noninterest income—loan origination, sales, and salessecuritizations in the consolidated statements of operations and comprehensive income (loss).loss.
Cash and Cash Equivalents
Cash and cash equivalents primarily include unrestricted deposits with financial institutions in checking, money market and short-term certificate of deposit accounts and certain short-term commercial paper. We consider all highly liquid investments with original maturity dates of three months or less to be cash equivalents.
Restricted Cash and Restricted Cash Equivalents
Restricted cash and restricted cash equivalents consist primarily ofinclude cash deposits, certificate of deposit accounts held on reserve, money market funds held by consolidated VIEs funds reserved for committed stock purchases, and collection balances. These accounts are earmarked as restricted because thesethe balances are either member balances held in our custody, cash segregated for regulatory purposes associated with brokerage activities, escrow requirements for certain debt facilities and derivative agreements, deposits required by various bank holding companies we partner with (“Member Banks”) that support one or more of our products, loan collection balances awaiting disbursement, consolidated VIE cash balances that we cannot use for general operating purposes, or other legally restricted balances.
Investments in Debt Securities
In the third quarter of 2021, we began investing in debt securities. The accounting and measurement framework for our investments in debt securities is determined based on the security classification. We classify investments in debt securities as
SoFi Technologies, Inc.
SoFi Technologies, Inc.
Notes to Consolidated Financial Statements (continued)
(In Thousands, Unless Otherwise Stated and Except for Share and Per Share Data)
available-for-sale (“AFS”) whenawaiting disbursement, consolidated VIE cash balances that we do not have ancannot use for general operating purposes, or other legally restricted balances.
Loans
Loan Classification
We classify loans as held for sale or held for investment based on management’s assessment of its intent and ability to hold the securitiesloans for the foreseeable future or until maturity. We do not hold investments in debt securitiesmaturity, which may change over time. A loan that is initially designated as held for trading purposes. As of December 31, 2021, all ofsale or held for investment may be reclassified when our investments in debt securities were classified as AFS. Hereafter, these investments are referred to as “investments in AFS debt securities”.
We record investments in AFS debt securities atintent for that loan changes. The accounting and measurement framework for loans differs depending on the loan classification and whether we elect the fair value in ouroption. The presentation within the consolidated balance sheets, with unrealized gains and losses recorded, net of tax, as a component of accumulated other comprehensive income (loss) (“AOCI”). See Note 9 for additional information on our fair value estimates for investments in AFS debt securities. The amortized cost basis of our investments in AFS debt securities reflects the security’s acquisition cost, adjusted for amortization of premium or accretion of discount, and net of deferred fees and costs, collectionstatements of cash and charge-offs, as applicable. For purposes of determining gross realized gains and losses on AFS debt securities, the cost of securities soldflows is based on specific identification. We electedmanagement’s intent at origination. Cash flows related to present accrued interest for AFS debt securities withinloans that are originated with the intent to sell are included in investments in available-for-sale securities in the consolidated balance sheets. Purchase discounts, premiums, and other basis adjustments for investments in AFS debt securities are generally amortized into interest income over the contractual life of the security using the effective interest method. However, premiums on certain callable debt securities are amortized to the earliest call date. Amortization of premiums and discounts and other basis adjustments for investments in AFS debt securities, as well as interest income earned on the investments, are recognized within interest income—other, and realized gains and losses on investments in AFS debt securities are recognized within noninterest income—othercash flows from operating activities in the consolidated statements of operations and comprehensive income (loss).
As of December 31, 2021, our investments in AFS debt securities portfolio included agency to-be-announced (“TBA”) securities, whichcash flows. Cash flows related to loans that are securities that will be delivered under the purchase contract at a later date when the underlying security is issued. We made a policy election to account for contracts to purchase or sell existing securities on a trade-date basis and, as such, we record the purchase at inception of the contract on a gross basis,originated with the offsetting payable for the settlement amount recorded within accounts payable, accruals and other liabilities in the consolidated balance sheets.
In accordance with ASC 326-30, Financial Instruments—Credit Losses—Available-For-Sale Debt Securities, an investment in AFS debt security is considered impaired if its fair value is less than its amortized cost. If we determine that we have the intent to sell the impairedhold for investment are included in AFS debt security, or if it is more likely than not that we will be required to sell the impaired investment in AFS debt security before recovery of its amortized cost, we recognize the full impairment loss reflecting the difference between the amortized cost (net of any prior recognized allowance) and the fair value of the investment in AFS debt security within noninterest income—othercash flows from investing activities in the consolidated statements of operations and comprehensive income (loss). If neither of the above conditions exists, we evaluate whether the impairment loss is attributable to credit-related or non-credit-related factors. Any impairment that is not credit-related is recognized in other comprehensive income (loss), net of taxes. See “Allowance for Credit Losses” below for the factors we consider in identifying credit-related impairment and the treatment of credit losses.cash flows.
See Note 4 for additional information on our investments in AFS debt securities.
Loans
As of December 31, 2021, ourOur loan portfolio consisted ofprimarily consists of: (i) personal loans, student loans and home loans, which are measured at fair value and held for sale or held for investment, and (ii) senior secured loans, credit cardcards, and commercial and consumer banking loans, which are measured at amortized cost. Ascost and held for investment. The commercial and consumer banking portfolio is primarily inclusive of December 31, 2020, we also had a commercial loan, which is further discussed below.real estate loans, commercial and industrial loans and residential real estate and other consumer loans.
Loans Measured at Fair Value
Our personal loans, student loans and home loans are carried at fair value on a recurring basis and, therefore, all direct fees and costs related to the origination process are recognized in earnings as earned or incurred. We elected the fair value option to measure theseour personal loans, student loans and home loans, as we believe that fair value best reflects the expected economic performance of the loans. Therefore, these loans are carried at fair value on a recurring basis. During the year ended December 31, 2023, we transferred home loans out of Level 3 and into Level 2 due to an update to pricing sources utilized by third-party valuation specialists, as wellpart of the integration of Wyndham. Other loans do not trade in an active market with readily observable prices and are classified as Level 3. We determine the fair value of our intentions given our gain-on-saleloans using a discounted cash flow methodology, while also considering market data as it becomes available.
Direct fees, which primarily relate to personal and home loan originations, are recognized in earnings as earned and are recorded within noninterest income—loan origination, model.sales, and securitizations in the consolidated statements of operations and comprehensive loss. Direct loan origination costs are recognized in earnings as incurred and are recorded within noninterest expense—cost of operations in the consolidated statements of operations and comprehensive loss. We record the initial fair value measurement and subsequent measurement changes in fair value in the period in which the changes occur within noninterest income—loan origination, sales, and salessecuritizations in the consolidated statements of operations and comprehensive income (loss). Our consolidatedloss. We record cash flows related to loans are originated with the intention to sell to third-party purchasers and are, therefore, considered held for sale. sale within cash flows from operating activities in the consolidated statements of cash flows.
Securitized loans are assets held by consolidated SPEs as collateral for bonds issued, for which fair value changes are recorded within noninterest income—loan origination, sales, and securitizations in the consolidated statements of operations and comprehensive income (loss).loss. Gains or losses recognized upon deconsolidation of a VIE are also recorded within noninterest income—loan origination, sales, and securitizations.
SoFi Technologies, Inc.
Notes to Consolidated Financial Statements (continued)
(In Thousands, Unless Otherwise Stated and Except for Share and Per Share Data)
Loans do not trade in an active market with readily observable prices. We determine the fair value of our loans using a discounted cash flow methodology, while also considering market data as it becomes available. We classify loans as Level 3 because the valuations utilize significant unobservable inputs.
We consider a loan to be delinquent when the borrower has not made the scheduled payment amount within one day after the scheduled payment date, provided the borrower is not in school or in deferment, forbearance or within an agreed-upon grace period. Loan deferment is a provision in thewithin student loan contractcontracts that permits the borrower to defer payments while enrolled at least half time in school. During the deferment period, interest accrues on the loan balance and is capitalized to the loan when the loan enters repayment status, which begins when the student no longer qualifies for deferment.
Whereas deferment only relates to student loans, forbearanceForbearance applies to student loans, personal loans and home loans. A borrower in repayment may generally request forbearance for reasons including a FEMA-declared disaster, unemployment, economic hardship or general economic uncertainty. Forbearance typically cannot exceed a total of 12 months over the life of the loan. If forbearance is granted, interest continues to accrue during the forbearance period and is capitalized to the loan when the borrower resumes making payments. At the conclusion of a forbearance period, the contractual monthly payment is recalculated and is generally higher as a result.
SoFi Technologies, Inc.
SoFi Technologies, Inc.
Notes to Consolidated Financial Statements (continued)
(In Thousands, Unless Otherwise Stated and Except for Share and Per Share Data)
For personal loans and student loans, delinquent loans are charged off after 120 days of delinquency or on the date of confirmed loss. For home loans, delinquent loans are charged off after 180 days of delinquency or on the date of confirmed loss. For all loans, we stop accruing interest and reverse all accrued but unpaid interest on the date of charge-off. Additional information about our loans measured at fair valueheld for sale is included in Note 5 through 4. Loans, Note 7, as well as 7. Securitization and Variable Interest Entities and Note 9.15. Fair Value Measurements.
Loans Measured at Amortized Cost
For our senior secured and commercial and consumer banking loans, direct loan origination costs are deferred and amortized using the effective interest method over the contractual term of the loans within interest income—loans and securitizations in the consolidated statements of operations and comprehensive loss. As of December 31, 2021,2023, the remaining balance of deferred costs was immaterial.
We present accrued interest for loans measured at amortized cost included credit card loans. We launched our credit card product in the third quarter of 2020, which was expanded to a broader market in the fourth quarter of 2020. During the fourth quarter of 2020, we also issued a commercial loan, which was repaid in January 2021. For within loans measuredheld for investment, at amortized cost we present accrued interest within loans in the consolidated balance sheets. The amortized cost of these loans is subject to our allowance for credit losses methodology described within “Allowance for Credit Losses” herein. We record cash flows related to loans held for investment within cash flows from investing activities in the consolidated statements of cash flows.
Credit card receivables are reported at the amounts due from members, including accrued interest and fees, and unamortized net deferred loan origination fees and costs. Loan origination fees and direct loan origination costs are amortized on a straight-line basis over a 12-month period as adjustments to income through interest income—loans and securitizations in the consolidated statements of operations and comprehensive loss. Credit card balances are reported as delinquent when they become 30 or more days past due. Credit card balances are charged off after 180 days of delinquency or on the date of the confirmed loss, at which time we stop accruing interest and fees and reverse all accrued but unpaid interest and fees through interest income as of such date. When a credit card balance is charged off, we record a reduction to the allowance and the credit card balance. When recovery payments are received against charged off credit card balances, we record a direct reduction to the provision for credit losses. Credit card receivables associated with alleged or potential fraudulent transactions are charged off through noninterest expense—general and administrative in the consolidated statements of operations and comprehensive loss.
Commercial and consumer banking loans are reported as delinquent when they become 30 or more days past due. For all commercial and consumer banking loans, we stop accruing interest and reverse all accrued but unpaid interest after 90 days of delinquency. For consumer banking loans, delinquent loans are charged off after 120 days of delinquency or on the date of confirmed loss. For commercial loans, performance is monitored on an individual loan basis and delinquent loans are charged off when collectability of interest and principal on the loan is not reasonably assured.
Senior secured loans are term loan arrangements secured by underlying loans owned by the debtor. Senior secured loans are reported as delinquent when they become 30 or more days past due, and are charged off after 120 days of delinquency or on the date of confirmed loss.
Financial Guarantees
We entered into a credit default swap related to our student loans which meets the definition of a financial guarantee and is excluded from derivative accounting treatment. We apply the insurance contract claim method by deferring the full estimated amount of premiums paid and payable at inception. The deferred premium is estimated using a discounted cash flow model considering the expected performance of the reference portfolio and recorded within other assets and accounts payable, accruals and other liabilities in the consolidated balance sheets. Deferred premiums are amortized based on actual premiums due and recognized in noninterest expense—general and administrative in the consolidated statements of operations and comprehensive loss. We recognize a receivable and related earnings when a loss event occurs, we have the right to submit a claim, and recovery is probable.
Allowance for Credit Losses
Effective January 1, 2020, we adopted the provisions of Accounting Standards Update (“ASU”) 2016-13, Measurement of Credit Losses on Financial Instruments, which requires upfront recognition of lifetimeWe primarily evaluate expected credit losses using aunder the current expected credit loss model. As of December 31, 2021,model for the standard was applicable tofollowing financial assets: (i) cash equivalents and restricted cash equivalents, (ii) accounts receivable from contracts with customers, inclusive of servicing related receivables, (iii) margin receivables, which were attributable to our activities at 8 Limited, (iv) certain loan repurchase reserves representing guarantees of credit exposure, (v) loans measured at amortized cost, including credit card loans, and (vi)(iv) investments in AFS debt securities. Our approaches to measuring the allowance for credit losses on the applicable financial assets are as follows:
SoFi Technologies, Inc.
SoFi Technologies, Inc.
Notes to Consolidated Financial Statements (continued)
(In Thousands, Unless Otherwise Stated and Except for Share and Per Share Data)
Cash equivalents and restricted cash equivalents: Our cash equivalents and restricted cash equivalents are short-term in nature and of high credit quality; therefore, we determined that our exposure to credit losses over the life of these instruments was immaterial.
Accounts receivable from contracts with customers: Accounts receivable from contracts with customers as of the balance sheet dates, all of which are short-term in nature, are recorded at their original invoice amounts reduced by any allowance for credit losses. In accordance withWe assess the standard, we pool our accounts receivable, all of which are short-term in nature and arise from contracts with customers, based on shared risk characteristics to assess their risk of loss for each individual customer, even when thatthe risk is remote. Certain of our historical accounts receivable balances did not have any write-offs. We use the aging method and historical loss rates as a basis for estimating the percentage of current and delinquent accounts receivable balances that will result in credit losses. We consider whether the conditions at the measurement date and reasonable and supportable forecasts about future conditions, warrant an adjustment to our historical loss experience. In applying such adjustments, we primarily evaluate changes inas customer creditworthiness, current economic conditions, customer location, expectations of near-term economic trends and changes in customer payment terms and collection trends. For the measurement dates presented herein, giventrends, warrant an adjustment to our methods of collecting funds, and that we have not observed meaningful changes in our customers’ payment behavior,historical loss experience. Based on this analysis, we determined that our historical loss rates remained most indicative of our lifetime expected losses. We record the provision for credit losses on accounts receivable from
SoFi Technologies, Inc.
Notes to Consolidated Financial Statements (continued)
(In Thousands, Unless Otherwise Stated and Except for Share and Per Share Data)
contracts with customers within noninterest expense—general and administrative in the consolidated statements of operations and comprehensive income (loss).loss.
When we determine that a receivable is not collectible, we write off the uncollectible amount as a reduction to both the allowance and the gross asset balance. Recoveries are recorded when received and credited to the provision for credit losses. Any change in the assumptions used in analyzing a specific account receivable may result in an additional allowance for credit losses being recognized in the period in which the change occurs. See Note 85. Allowance for Credit Losses for a rollforward of the allowance for credit losses related to our accounts receivable.
Margin receivablesSenior secured loans: Our margin receivables,We evaluate the credit quality of our senior secured loan portfolio based on the fair value of underlying collateral, which are associated with margin lending services we offersubject to members through 8 Limited, are fully collateralized by the borrowers’ securities underrequirements of our loan underwriting process and risk models upon origination. This analysis is performed on a quarterly basis utilizing a third-party valuation specialist, whereby the fair value of underlying collateral maintenance provisions, to which we regularly monitor adherence. Therefore, using the practical expedient in ASC 326-20-35-6, Financial Instruments — Credit Losses, we did not recordis reassessed based on relevant information such as funded loan rates and historical loss experience, among other factors. An allowance for credit losses is required when there is an expected credit losses on this pool of margin receivables, asloss after considering the fair value of the collateral as well as any anticipated future changes in the underlying collateral iscollateral. As of and for the year ended December 31, 2023, we determined that our expected exposure to exceed the amortized cost of the receivables.
Loan repurchase reserves: We issue financial guarantees related to certain non-agency loan transfers, which are subject to repurchase based on the occurrence of certain credit-related events within a specified amount of time following loan transfer, which doescredit losses was immaterial, and as such did not exceed 90 days from origination. We estimate the contingent guarantee liability based on our historical repurchase activity for similar types of loans and assess whether adjustments to our historical loss experience are required based on current conditions and forecasts of future conditions, as appropriate, as our exposure under the guarantee is short-term in nature. See Note 16 for additional information on our guarantees.
Credit card loans: Our estimates of therecognize an allowance for credit losses as of December 31, 2021 and 2020 were $7,037 and $219, respectively. Accordingly, our estimate of the allowance for credit losses as of December 31, 2020 was immaterial to the consolidated financial statements. During the third quarter of 2021, we began toon senior secured loans.
Credit cards: We segment pools of credit card loanscards based on consumer credit score bands as measured using FICO scores, which are obtained at the origination of the account (“origination FICO”)and are refreshed monthly thereafter, and also by delinquency status, which may be adjusted using other risk-differentiating attributes to model charge-off probabilities and the average life over which expected credit losses may occur for the credit card loanscards within each pool. As our historical internal risk tiers were assigned primarily based on origination FICO, our pooling of our historical assets did not materially change, nor would there have been a material impact on our historical provision for credit losses if we had utilized our current credit quality indicators when setting our historical provision. The pools estimate the likelihood of borrowers with similar origination FICO scores to pay credit obligations based on aggregate credit performance data. When necessary, we apply separate credit loss assumptions to assets that have deteriorated in credit quality such that they no longer share similar risk characteristics with other assets in the same FICO score band. We either estimate the allowance for credit losses on such non-performing assets individually based on individual risk characteristics or as part of a distinct pool of assets that shares similar risk characteristics. We reassess our credit card pools periodically to confirm that all loans within each pool continue to share similar risk characteristics.
We establish an allowance for the pooled credit card loans within each pool of credit cards utilizing the risk model described above, which may then be adjusted for current conditions and reasonable and supportable forecasts of future conditions, including economic conditions. We apply the probability-of-default and loss-given-default assumptions to the drawn balance of credit card loanscards within each pool to estimate the lifetime expected credit losses within each pool, which are then aggregated to determine the allowance for credit losses. We do not measure credit losses on the undrawn credit exposure, as such undrawn credit exposure is unconditionally cancellable by us. Management further considers an evaluation of overall portfolio credit quality based on indicatorsAdditionally, management evaluates whether to include qualitative reserves to cover losses that are expected but may not be adequately represented in the quantitative methods or the economic assumptions. The qualitative reserves address possible limitations within the models, such as changes in our credit decisioning process, underwritingexternal conditions including regulatory requirements, emerging portfolio trends, the nature and collectionsize of the portfolio, portfolio concentrations, the volume and severity of past due accounts, or management policies; the effects of external factors, such as regulatory requirements; general economic conditions; and inherent uncertainties in applying the methodology.risk actions. We record the provision for credit losses on credit card loanscards within noninterest expense—provision for credit losses in the consolidated statements of operations and comprehensive income (loss).
Credit card loans are reported as delinquent when they become 30 or more days past due. Credit card loans are charged off after 180 days of delinquency or on the date of the confirmed loss, at which time we stop accruing interest and reverse all accrued but unpaid interest through interest income as of such date. When a credit card loan is charged off, we record a reduction to the allowance and the credit card loan balance. When recovery payments are received against charged off credit card loans, we record a direct reduction to the provision for credit losses and resume the accrual of interest. Credit card receivables associated with alleged or potential fraudulent transactions are charged off through noninterest expense—general and administrative in the consolidated statements of operations and comprehensive income (loss).loss.
SoFi Technologies, Inc.
SoFi Technologies, Inc.
Notes to Consolidated Financial Statements (continued)
(In Thousands, Unless Otherwise Stated and Except for Share and Per Share Data)
There were no credit card loans on nonaccrual status as of December 31, 2021 and 2020. Credit card balances expensed due to alleged or potential fraudulent transactions, net of recoveries, during the year ended December 31, 2021 were $1,292. There were no such credit card loan charge offs during the year ended December 31, 2020. Accrued interest receivables written off during the year ended December 31, 2021 were $133, all of which were accrued during 2021. We did not have any accrued interest receivables written off during the year ended December 31, 2020. See Note 8 for a rollforward of the allowance for credit losses related to our credit card loans.
We elected to exclude interest on credit card loanscards from the measurement of our allowance, as our policy allows for accrued interest to be reversed in a timely manner. Further, we elected the practical expedient to exclude the accrued interest component of our credit card loanscards from the quantitative disclosures presented.
See Note 5. Allowance for Credit Losses for a rollforward of the allowance for credit losses related to our credit cards.
Commercial and consumer banking loans: We evaluate the credit quality of our commercial and consumer banking loan portfolio based on regulatory risk ratings. Loans are categorized into risk ratings based on relevant information about the ability of borrowers to service their debt, such as current financial information, historical payment experience, collateral adequacy, credit documentation, and current economic trends, among other factors. The allowance for credit losses is determined at a portfolio level and estimated based on weighted average remaining maturity and annualized loss rate according to the loan’s regulatory loan type, risk rating classification and historical loss rates in the industry. This analysis is performed on an ongoing basis as new information is obtained.
See Note 5. Allowance for Credit Losses for a rollforward of the allowance for credit losses related to our commercial and consumer banking loans.
Investments in AFS debt securities: Credit-related impairment is recognized as an allowance for credit losses in the consolidated balance sheets with a corresponding adjustment to noninterest expense—provision for credit losses in the statements of operations and comprehensive loss. For certain securities that are guaranteed by the U.S. Treasury or government agencies, or sovereign entities of high credit quality, we concluded that there is no risk of credit-related impairment due to the nature of the counterparties and history of no credit losses. For other investments in AFS debt securities, factors considered in evaluating credit losses include: (i) adverse conditions related to the macroeconomic environment or the industry, geographic area or financial condition of the issuer, (ii) other credit indicators of the security, such as external credit ratings, and (iii) payment structure of the security. For the year ended December 31, 2023, we did not recognize an allowance for credit losses on impaired investments in AFS debt securities.
Servicing Rights
Each time we enter into a servicing agreement, either in connection with transfers of our financial assets or in connection with a referral fulfillment arrangement in which we are a sub-servicer for financial assets that we do not legally own, we determine whether we should record a servicing asset or servicing liability. We elected the fair value option to measure our servicing rights subsequent to initial recognition. We measure the initial and subsequent fair value of our servicing rights using a discounted cash flow methodology, while also considering market data as it becomes available. The significant assumptions used in the valuation model include our contractual servicing fee, ancillary income, prepayment rate assumptions, default rate assumptions, a discount rate commensurate with the risk of the servicing asset or liability being valued, and an assumed market cost of servicing, which is based on active quotes from third-party servicers. The value of the servicing rights are dependent on the performance of the underlying loans. For servicing rights retained in connection with loan transfers that do not meet the requirements for sale accounting treatment, there is no recognition of a servicing asset or liability.
Servicing rights in connection with transfers of financial assets are initially measured at fair value and recognized as a component of the gain or loss from sales of loans and the initial capitalization is reported within noninterest income—loan origination, sales, and securitizations in the consolidated statements of operations and comprehensive loss. Servicing rights assumed from third parties for financial assets for which we are not the loan originator are initially measured at fair value and recognized within noninterest income—servicing in the consolidated statements of operations and comprehensive loss. Servicing rights are measured at fair value at each subsequent reporting date and changes in fair value are reported in earnings in the period in which they occur. Subsequent measurement changes for all servicing rights, including servicing fee payments and fair value changes, are included within noninterest income—servicing in the consolidated statements of operations and comprehensive loss. We elected the fair value option to measure our servicing rights to better align with the valuation of our transferred loans, which also tend to share a similar risk profile to the personal loan servicing we assume from third parties when we are not the loan originator. The loans are also impacted by similar factors, such as conditional prepayment rates and default rates. We consider the risk of the assets and the observability of inputs in determining the classes of servicing rights. We have three classes of servicing assets: personal loans, student loans and home loans.
See Note 15. Fair Value Measurements for the key inputs used in the fair value measurements of our classes of servicing rights.
SoFi Technologies, Inc.
SoFi Technologies, Inc.
Notes to Consolidated Financial Statements (continued)
(In Thousands, Unless Otherwise Stated and Except for Share and Per Share Data)
Investments in Debt Securities
The accounting and measurement framework for our investments in debt securities is determined based on the security classification. We do not hold investments in debt securities for trading purposes, nor do we have investments in debt securities that we have the intent and ability to hold to maturity. Therefore, we classify our investments in debt securities as available-for-sale.
We record investments in AFS debt securities at fair value in our consolidated balance sheets, with unrealized gains and losses recorded, net of tax, as a component of AOCI. See Note 15. Fair Value Measurements for additional information on our fair value estimates for investments in AFS debt securities. The amortized cost basis of our investments in AFS debt securities reflects the security’s acquisition cost, adjusted for amortization of premium or accretion of discount, and collection of cash and charge-offs, as applicable. For purposes of determining gross realized gains and losses on AFS debt securities, the cost of securities sold is based on specific identification. We elected to present accrued interest for AFS debt securities within investment securities in the consolidated balance sheets. Purchase discounts, premiums, and other basis adjustments for investments in AFS debt securities are generally amortized into interest income over the contractual life of the security using the effective interest method. However, premiums on certain callable debt securities are amortized to the earliest call date. Amortization of premiums and discounts and other basis adjustments for investments in AFS debt securities, as well as interest income earned on the investments, are recognized within interest income—other, and realized gains and losses on investments in AFS debt securities are recognized within noninterest income—other in the consolidated statements of operations and comprehensive loss.
An investment in AFS debt security is considered impaired if its fair value is less than its amortized cost. If we determine that we have the intent to sell the impaired investment in AFS debt security, or if it is more likely than not that we will be required to sell the impaired investment in AFS debt security before recovery of its amortized cost, we recognize the full impairment loss reflecting the difference between the amortized cost (net of any prior recognized allowance) and the fair value of the investment in AFS debt security within noninterest income—other in the consolidated statements of operations and comprehensive loss. If neither of the above conditions exists, we evaluate whether the impairment loss is attributable to credit-related or non-credit-related factors. Any impairment that is not credit-related is recognized within other comprehensive income (loss), net of taxes. See the section “Allowance for Credit Losses” in this Note for the factors we consider in identifying credit-related impairment and the treatment of credit losses.
See Note 6. Investment Securities for additional information on our investments in AFS debt securities.
Securitization Investments
In Company-sponsored securitization transactions that meet the applicable criteria to be accounted for as a sale, we retain certain residual interests and asset-backed bonds. We measure these investments at fair value on a recurring basis and report them within investment securities in the consolidated balance sheets. Gains and losses related to our securitization investments are reported within noninterest income—loan origination, sales, and securitizations in the consolidated statements of operations and comprehensive loss. We determine the fair value of our securitization investments using a discounted cash flow methodology, while also considering market data as it becomes available.
Our residual investments accrete interest income over the expected life using the effective yield method, which reflects a portion of the overall fair value adjustment recorded each period on our residual investments. On a quarterly basis, we reevaluate the cash flow estimates over the life of the residual investments to determine if a change to the accretable yield is required on a prospective basis. Additionally, we record interest income associated with asset-backed bonds over the term of the underlying bond using the effective interest method on unpaid bond amounts. Interest income on residual investments and asset-backed bonds is presented within interest income—loans and securitizations in the consolidated statements of operations and comprehensive loss.
See Note 15. Fair Value Measurements for the key inputs used in the fair value measurements of our residual investments and asset-backed bonds.
Investments in Equity Securities
Our investments in equity securities consist of investments for which fair values are not readily determinable, which we elect to measure using the alternative method of accounting, under which they are measured at cost less any impairment and
SoFi Technologies, Inc.
SoFi Technologies, Inc.
Notes to Consolidated Financial Statements (continued)
(In Thousands, Unless Otherwise Stated and Except for Share and Per Share Data)
adjusted for changes resulting from observable price changes in orderly transactions for identical or similar investments of the same issuers. Our investments in equity securities are presented within other assets in the consolidated balance sheets. Adjustments to the carrying values of our investments in equity securities, such as impairments and unrealized gains, are recognized within noninterest income—other in the consolidated statements of operations and comprehensive loss.
Property, Equipment and Software
All property, equipment and software are initially recorded at cost, while repairs and maintenance costs are expensed as incurred. Computer hardware, furniture and fixtures, software, buildings and finance lease ROU assets are depreciated or amortized on a straight-line basis over the estimated useful life of each class of depreciable or amortizable assets (ranging from one to 30 years). Leasehold improvements are amortized over the shorter of the respective lease term or the estimated lives of the leasehold improvements.
Software includes both purchased and internally-developed software. Internally-developed software is capitalized when preliminary project efforts are successfully completed, and it is probable that both the project will be completed and the software will be used as intended. Capitalized costs consist of salaries and compensation costs (inclusive of share-based compensation) for employees, fees paid to third-party consultants who are directly involved in development efforts and costs incurred for upgrades and functionality enhancements, and are amortized over a useful life ranging from 2.5 to 3 years. Other costs are expensed as incurred.
See Note 9. Property, Equipment, Software and Leases for additional information on our property, equipment and software.
Goodwill and Intangible Assets
Goodwill represents the fair value of an acquired business in excess of the fair value of the identified net assets acquired. Goodwill is tested for impairment at the reporting unit level annually or whenever indicators of impairment exist. Impairment of goodwill is the condition that exists when the carrying amount of a reporting unit that includes goodwill exceeds its fair value. We may assess goodwill for impairment initially using a qualitative approach, referred to as “step zero”, to determine whether conditions exist to indicate that it is more likely than not that the fair value of a reporting unit is less than its carrying amount. If management concludes, based on its assessment of relevant events, facts and circumstances, that it is more likely than not that a reporting unit’s carrying value is greater than its fair value, then a quantitative analysis will be performed to determine if there is any impairment. We may alternatively elect to initially perform a quantitative assessment and bypass the qualitative assessment.
A goodwill impairment loss is recognized for the amount that the carrying amount of a reporting unit, including goodwill, exceeds its fair value, limited to the total amount of goodwill allocated to that reporting unit. Therefore, if the fair value of a reporting unit exceeds its carrying amount, goodwill of the reporting unit is not impaired. Our reporting units for our goodwill impairment analysis represent components of our business at one level below our operating segments. Our annual impairment testing date is October 1.
Definite-lived intangible assets are amortized on a straight-line basis over their useful lives and reviewed for impairment annually and whenever events or circumstances indicate that the carrying amount of such assets may not be recoverable. Intangible assets include capitalized costs incurred in the development and enhancement of our software products to be sold, leased or marketed. These costs, consisting primarily of salaries and compensation costs (inclusive of share-based compensation) for employees, are expensed as incurred until technological feasibility has been established, after which the costs are capitalized until the product is available for general release to customers.
See Note 2. Business Combinations and Note 8. Goodwill and Intangible Assets for further discussion of goodwill and intangible assets, including those recognized in connection with recent business combinations.
Leases
We determine if an arrangement is or contains a lease at inception of the contract. A contract is or contains a lease if the contract conveys the right to control the use of identified property or equipment for a period of time in exchange for consideration. For our current office and non-office classes of operating leases, we elected the practical expedient to not separate non-lease components from lease components and to, instead, account for each separate lease component and the non-
SoFi Technologies, Inc.
SoFi Technologies, Inc.
Notes to Consolidated Financial Statements (continued)
(In Thousands, Unless Otherwise Stated and Except for Share and Per Share Data)
lease components associated with that lease component as a single lease component. For our current classes of finance leases, we did not elect to apply this practical expedient and, instead, separately identify and measure the non-lease components of the contracts. As an accounting policy election, we apply the short-term lease exemption practical expedient to any lease that, at the commencement date, has a lease term of 12 months or less and does not include an option to purchase the underlying asset that we are reasonably certain to exercise.
Operating leases are presented within operating lease right-of-use assets and operating lease liabilities in the consolidated balance sheets. Finance lease ROU assets are presented within property, equipment and software and finance lease liabilities are presented within accounts payable, accruals and other liabilities in the consolidated balance sheets. Operating and finance lease ROU assets represent our right to use an underlying asset for the lease term and operating and finance lease liabilities represent our obligation to make lease payments arising from the lease. ROU assets and lease liabilities are recognized at the commencement date based on the present value of lease payments over the lease term. As our leases do not provide an implicit borrowing rate, we use our incremental borrowing rate based on the information available at commencement date or modification date, as appropriate, in determining the present value of lease payments.
The operating lease ROU assets are increased by any prepaid lease payments and are reduced by any unamortized lease incentives. Our lease terms may include options to extend or terminate the lease when it is reasonably certain that we will exercise that option. Base rent is typically subject to rent escalations on each annual anniversary from the lease commencement dates. Lease expense for lease payments, including any step rent provisions specified in the lease agreements, is recognized on a straight-line basis over the lease term and is allocated among the components of noninterest expense in the consolidated statements of operations and comprehensive loss. The finance lease ROU assets are depreciated on a straight-line basis over the estimated useful life of seven years. Interest expense on finance leases is recognized for the difference between the present value of the lease liabilities and the scheduled lease payments within interest expense—other in the consolidated statements of operations and comprehensive loss.
When a lease agreement is modified, we determine if the modification grants us the right to use an additional asset that is not included in the original lease contract and if the lease payments increase commensurate with the standalone price for the additional ROU asset. If both conditions are met, we account for the agreement as two separate contracts: (i) the original, unmodified contract and (ii) a separate contract for the additional ROU asset. If both conditions are not met, the modification is not evaluated as a separate contract. Instead, based on the nature of the modification, we: (i) reassess the lease classification on the modification date under the modified terms, and (ii) use the modified lease payments and discount rate to remeasure the lease liability and recognize any difference between the new lease liability and the old lease liability as an adjustment to the ROU asset.
See Note 9. Property, Equipment, Software and Leases for additional information on our leases.
Derivative Financial Instruments
We enter into derivative contracts to manage future loan sale execution risk. We did not elect hedge accounting, as management’s hedging intentions are to economically hedge the risk of unfavorable changes in the fair values of our personal loans, student loans and home loans. Our derivative instruments used to manage future loan sale execution risk include interest rate swaps, interest rate caps and home loan pipeline hedges. We also have IRLCs, interest rate swaps and interest rate caps that were not related to future loan sale execution risk.
Changes in derivative instrument fair values are recognized in earnings as they occur. Depending on the measurement date position, derivative financial instruments are presented within other assets or accounts payable, accruals and other liabilities in the consolidated balance sheets. Our derivative instruments are reported within cash flows from operating activities in the consolidated statements of cash flows.
Certain derivative instruments are subject to enforceable master netting arrangements. Accordingly, we present our net asset or liability position by counterparty in the consolidated balance sheets. Additionally, since our cash collateral balances do not approximate the fair value of the derivative position, we do not offset our right to reclaim cash collateral or obligation to return cash collateral against recognized derivative assets or liabilities.
See Note 14. Derivative Financial Instruments and Note 15. Fair Value Measurements for additional information on our derivative assets and liabilities.
SoFi Technologies, Inc.
SoFi Technologies, Inc.
Notes to Consolidated Financial Statements (continued)
(In Thousands, Unless Otherwise Stated and Except for Share and Per Share Data)
Residual Interests Classified as Debt
Within consolidated securitizations, the residual interests held by third parties are presented as residual interests classified as debt in the consolidated balance sheets. We measure residual interests classified as debt at fair value on a recurring basis. We record subsequent measurement changes in fair value in the period in which the change occurs within noninterest income—loan origination, sales, and securitizations in the consolidated statements of operations and comprehensive loss. We determine the fair value of residual interests classified as debt using a discounted cash flow methodology, while also considering market data as it becomes available.
We recognize interest expense related to residual interests classified as debt over the expected life using the effective yield method, which reflects a portion of the overall fair value adjustment recorded each period on our residual interests classified as debt. Interest expense related to residual interests classified as debt is presented within interest expense—securitizations and warehouses in the consolidated statements of operations and comprehensive loss. On a quarterly basis, we reevaluate the cash flow estimates to determine if a change to the accretable yield is required on a prospective basis.
See Note 15. Fair Value Measurements for the key inputs used in the fair value measurements of residual interests classified as debt.
Safeguarding Asset and Liability
Through our SoFi Invest product (via our wholly-owned subsidiary, SoFi Digital Assets, LLC, a licensed money transmitter), our members were able to invest in digital assets. In the fourth quarter of 2023, we transferred the crypto services provided by SoFi Digital Assets, LLC, and began closing existing digital assets accounts. This process was completed in the first quarter of 2024. Certain accounts were eligible for transfer to a third party digital asset service provider who assumed responsibility for the transferred accounts on a go-forward basis, including the arrangement of custodial services for the transferred digital assets. We have no further ongoing responsibilities for the transferred digital assets subsequent to the executed transfer which took place in December 2023, and derecognized the corresponding digital assets safeguarding liability and safeguarding asset as of the date of the transfer.
For those digital assets that were not eligible to be transferred, we engage third parties to provide custodial services for our digital assets offering, which include holding the cryptographic key information and working to protect the digital assets from loss or theft. The third-party custodians hold digital assets as custodial assets in an account in SoFi’s name for the benefit of our members. We maintain the internal recordkeeping of our members’ digital assets, including the amount and type of digital assets owned by each of our members in the custodial accounts. As of December 31, 2023, we utilized one third-party custodian.
In accordance with Staff Accounting Bulletin No. 121 (“SAB 121”), we recognize a digital assets safeguarding liability within accounts payable, accruals and other liabilities in the consolidated balance sheets reflecting our obligation to safeguard the digital assets held by third-party custodians for the benefit of our members. We also recognize a corresponding safeguarding asset within other assets in the consolidated balance sheets. The safeguarding liability and corresponding safeguarding asset are measured and recorded at the fair value of the digital assets held by the custodians at each reporting date. Subsequent changes to the fair value measurement are reflected as equal and offsetting adjustments to the carrying values of the safeguarding liability and corresponding safeguarding asset. We evaluate any potential loss events, such as theft, loss or destruction of the cryptographic keys, that may affect the measurement of the safeguarding asset, which would be reflected in our results of operations in the period the loss occurs. Measurement changes do not impact the consolidated statements of operations and comprehensive loss unless such a loss event is identified. As of both December 31, 2023 and 2022, we did not identify any loss events.
See Note 15. Fair Value Measurements for additional information on the fair value measurement of the safeguarding liability and corresponding safeguarding asset.
Borrowings and Financing Costs
We borrow from various financial institutions to finance our lending activities. Direct costs incurred in connection with financing, such as banker fees, origination fees and legal fees, are classified as deferred debt issuance costs. We capitalize these costs and report the amounts as a direct deduction from the carrying amount of the debt balance. Any difference between the stated principal amount of debt and the amount of cash proceeds received, net of debt issuance costs, is presented as a
SoFi Technologies, Inc.
SoFi Technologies, Inc.
Notes to Consolidated Financial Statements (continued)
(In Thousands, Unless Otherwise Stated and Except for Share and Per Share Data)
discount or premium. The capitalized debt issuance costs and the original issue discount/premium are amortized into interest expense over the expected life of the related financing agreements using the straight-line method for revolving facilities and the effective interest method for securitization debt and our senior convertible notes, as defined and further discussed below. Remaining unamortized fees are expensed immediately upon early extinguishment of the debt. In a debt modification for revolving debt, the initial issuance costs and any additional fees incurred as a result of the modification are deferred over the term of the new agreement, if the borrowing capacity of the revolving facility is increased. In the case that a modification results in a decrease in our borrowing capacity, any fees paid to the creditor and any third-party costs incurred are considered to be associated with the new arrangement and are, therefore, deferred and amortized over the term of the new arrangement. Unamortized deferred costs relating to the old arrangement at the time of the modification are expensed immediately in proportion to the decrease in borrowing capacity of the old arrangement. Any remaining unamortized deferred costs relating to the old arrangement are deferred and amortized over the term of the new arrangement.
We elected the fair value option to measure certain securitization debt, with the intent to mitigate the accounting divergence between debt liabilities measured at historical cost and the corresponding loans securing these financings, which are risk-managed on a fair value basis. For securitization debt carried at fair value on a recurring basis, we record the initial fair value measurement and subsequent measurement changes in fair value in the period in which the changes occur within noninterest income—loan origination, sales, and securitizations in the consolidated statements of operations and comprehensive loss. We determined the fair value of the applicable securitization debt using a discounted cash flow methodology, while also considering market data as it becomes available. The key inputs to the calculation include the underlying contractual coupons, terms, discount rate and expectations for defaults and prepayments.
Convertible Senior Notes
In October 2021, we issued $1.2 billion aggregate principal amount of convertible senior notes due 2026 (the “convertible notes”). The convertible notes will mature on October 15, 2026, unless earlier repurchased, redeemed or converted. We will settle conversions by paying or delivering, at our election, cash, shares of our common stock or a combination of cash and shares of our common stock, based on the applicable conversion rate(s). The convertible notes will also be redeemable, in whole or in part, at our option at any time, and from time to time, on or after October 15, 2024 through the 30th scheduled trading day immediately before the maturity date, at a cash redemption price equal to the principal amount of the convertible notes to be redeemed, plus accrued interest, if any, thereon to, but excluding, the redemption date, but only if certain liquidity conditions described in the indenture are satisfied and certain conditions are met with respect to the last reported sale price per share of our common stock prior to conversion. In December 2023, we entered into repurchase agreements to repurchase $88.0 million aggregate principal amount of the convertible notes. See Note 12. Debt for more detailed disclosure of the term and features of the convertible notes.
We elected to evaluate each embedded feature of the arrangement individually. We concluded that each of the conversion rights, optional redemption rights, fundamental change make-whole provision and repurchase rights did not require bifurcation as derivative instruments, which we reevaluate each reporting period. The additional interest and special interest that accrue on the notes in the event of our failure to comply with certain registration or reporting requirements are required to be bifurcated from the host contract, as the reporting requirement triggering event is not clearly and closely related to the host convertible debt contract, and therefore we measure the contingent interest feature at fair value each reporting period. The value was determined to be immaterial; therefore, we accounted for the convertible notes wholly as debt, which was recognized on the settlement date. Accordingly, we allocated all debt issuance costs to the debt instrument on the basis of materiality.
In connection with the pricing of the convertible notes, we entered into privately negotiated capped call transactions with certain financial institutions, as defined and further discussed below.
Redeemable Preferred Stock
Series 1 Redeemable Preferred Stock (as defined in Note 13. Equity) is classified in temporary equity, as it is not fully controlled by SoFi. See Note 13. Equity for additional information.
Foreign Currency Translation Adjustments
We revalue assets, liabilities, income and expense denominated in non-United States currencies into United States dollars using applicable exchange rates. For foreign subsidiaries in which the functional currency is the subsidiary’s local
SoFi Technologies, Inc.
SoFi Technologies, Inc.
Notes to Consolidated Financial Statements (continued)
(In Thousands, Unless Otherwise Stated and Except for Share and Per Share Data)
currency, gains and losses relating to foreign currency translation adjustments are included in accumulated other comprehensive income (loss) in our consolidated balance sheets. For foreign subsidiaries in which the functional currency is the United States Dollar, gains and losses relating to foreign currency transaction adjustments are included within earnings in the consolidated statements of operations and comprehensive loss. Due to the highly inflationary economic environment in Argentina, we use the United States Dollar as the functional currency of our Argentinian operations. Our activities in Argentina are related to our Technology Platform segment and commenced in the first quarter of 2022 with the Technisys Merger.
Capped Call Transactions
We entered into privately negotiated capped call transactions (the “Capped Call Transactions”) with certain financial institutions (the “Capped Call Counterparties”). The Capped Call Transactions initially cover, subject to customary anti-dilution adjustments, the number of shares of our common stock that initially underlie the convertible notes. The Capped Call Transactions are net purchased call options on our own common stock. The Capped Call Transactions are separate transactions entered into by the Company with each of the Capped Call Counterparties, are not part of the terms of the convertible notes, and do not affect any holder’s rights under the convertible notes. Holders of the convertible notes do not have any rights with respect to the Capped Call Transactions. As the Capped Call Transactions are legally detachable and separately exercisable from the convertible notes, they were evaluated as freestanding instruments. We concluded that the Capped Call Transactions meet the scope exceptions for derivative instruments, and as such, the Capped Call Transactions meet the criteria for classification in equity and are included as a reduction to additional paid-in capital.
See Note 13. Equity for additional information on the Capped Call Transactions.
Interest Income
We record interest income associated with loans measured at fair value over the term of the underlying loans using the effective interest method on unpaid loan principal amounts, which is presented within interest income—loans and securitizations in the consolidated statements of operations and comprehensive loss. We also record accrued interest income associated with loans measured at amortized cost within interest income—loans and securitizations. We stop accruing interest and reverse all accrued but unpaid interest at the time a loan charges off. Loans are returned to accrual status if the loans are brought to nondelinquent status or have performed in accordance with the contractual terms for a reasonable period of time and, in management’s judgment, will continue to make scheduled periodic principal and interest payments.
Other interest income is primarily earned on our bank balances.
Loan Origination and Sales Activities
As part of our loan sale agreements, we may retain the rights to service sold loans. We calculate a gain or loss on the sale based on the sum of the proceeds from the sale and any servicing asset or liability recognized, less the carrying value of the loans sold. Our gain or loss calculation is also inclusive of repurchase liabilities recognized at the time of sale, and is recorded within noninterest income—loan origination, sales, and securitizations in the consolidated statements of operations and comprehensive loss.
Loan Commitments
We offer a program whereby applicants can lock in an interest rate on an in-school loan to be funded at a later time. Applicants can exit the loan origination process up until the loan funding date. SoFi is obligated to fund the loan at the committed terms on the disbursement date if the borrower does not cancel prior to the loan funding date. The student loan commitments meet the scope exception for issuers of commitments to originate non-mortgage loans. As the writer of the commitments, we elected the fair value option to measure our unfunded student loan commitments to align with the measurement methodology of our originated student loans. As such, our student loan commitments are carried at fair value on a recurring basis. Depending on the measurement date position, student loan commitments are presented within other assets or accounts payable, accruals and other liabilities in the consolidated balance sheets. We record the initial fair value measurement and subsequent measurement changes in fair value in the period in which the changes occur within noninterest income—loan origination, sales, and securitizations in the consolidated statements of operations and comprehensive loss.
Loan commitments also include IRLCs, whereby we commit to interest rate terms prior to completing the origination process for home loans. IRLCs are derivative instruments that are measured at fair value on a recurring basis. Changes in fair
SoFi Technologies, Inc.
SoFi Technologies, Inc.
Notes to Consolidated Financial Statements (continued)
(In Thousands, Unless Otherwise Stated and Except for Share and Per Share Data)
value are recognized within noninterest income—loan origination, sales, and securitizations in the consolidated statements of operations and comprehensive loss. See “Derivative Financial Instruments” in this Note for additional information on our derivative instruments.
See Note 15. Fair Value Measurements for the key inputs used in the fair value measurements of our loan commitments.
Revenue Recognition
In each of our revenue arrangements, revenue is recognized when control of the promised goods or services is transferred to the customer in an amount that reflects our expected consideration in exchange for those goods or services. Our primary revenue streams for the periods presented include the following:
•Technology Products and Solutions: We earn fees for providing an integrated platform as a service for financial and non-financial institutions.
•Referrals: We earn specified referral fees in connection with referral activities we facilitate through our platform, such as referrals to third-party partners that offer services to end users who do not use one of our product offerings and referrals of pre-qualified borrowers to a third-party partner who separately contracts with a loan originator.
•Interchange: We earn interchange fees from debit and credit cardholder transactions conducted through payment networks.
•Brokerage: We earn fees in connection with facilitating investment-related transactions through our platform, such as brokerage transactions, share lending and exchange conversion.
See Note 3. Revenue for additional information on our revenue recognition policy within each revenue stream.
Advertising, Sales and Marketing
Advertising production costs and advertising communication costs, as well as amounts paid to various affiliates to market our products, are included within noninterest expense—sales and marketing in the consolidated statements of operations and comprehensive loss. Advertising costs are expensed either as incurred or when the advertising takes place, depending on the nature of the advertising activity. For the years ended December 31, 2023, 2022 and 2021, advertising totaled $284,176, $256,125 and $183,106, respectively.
Expenses incurred by us related to member acquisition, including brand development, business development and direct member marketing expenses, are also presented within noninterest expense—sales and marketing in the consolidated statements of operations and comprehensive loss.
Technology and Product Development
Expenses incurred by us related to technology, product design and implementation, which includes compensation and benefits, are classified as noninterest expense—technology and product development in the consolidated statements of operations and comprehensive loss.
Loss Contingencies
Loss contingencies, including claims and legal actions arising in the ordinary course of business, are recorded in accounts payable, accruals and other liabilities in the consolidated balance sheets. Such liabilities and associated expenses are recorded when the likelihood of loss is probable and an amount or range of loss can be reasonably estimated. Such estimates are based on the best information available at the time. As additional information becomes available, we reassess the potential liability and record an estimate in the period in which the adjustment is probable and an amount or range can be reasonably estimated. Due to the inherent uncertainties of loss contingencies, estimates may be different from the actual outcomes. With respect to legal proceedings, we recognize legal fees as they are incurred within noninterest expense—general and administrative in the consolidated statements of operations and comprehensive loss. See Note 18. Commitments, Guarantees, Concentrations and Contingencies for discussion of contingent matters.
SoFi Technologies, Inc.
SoFi Technologies, Inc.
Notes to Consolidated Financial Statements (continued)
(In Thousands, Unless Otherwise Stated and Except for Share and Per Share Data)
Restructuring
During the year ended December 31, 2023, we recognized restructuring charges of $12,749 within the following categories of expenses within noninterest expense: (i) technology and product development, (ii) sales and marketing, (iii) cost of operations, and (iv) general and administrative in the consolidated statements of operations and comprehensive loss associated with a reduction in headcount in the Technology Platform segment in the first quarter of 2023, as well as expenses in the fourth quarter of 2023 related to a reduction in headcount across the Financial Services, Lending and corporate functions, which primarily included employee-related wages, benefits and severance.
Compensation and Benefits
Total compensation and benefits, inclusive of share-based compensation expense, was $894,720, $830,298 and $608,505 for the years ended December 31, 2023, 2022 and 2021, respectively. Compensation and benefits expenses are presented within the following categories of expenses within noninterest expense: (i) technology and product development, (ii) sales and marketing, (iii) cost of operations, and (iv) general and administrative in the consolidated statements of operations and comprehensive loss.
Share-Based Compensation
Share-based compensation made to employees and non-employees, including stock options, RSUs and PSUs, is measured based on the grant date fair value of the awards and is recognized as compensation expense typically on a straight-line basis over the period during which the share-based award holder is required to perform services in exchange for the award (the vesting period) for stock options and RSUs and on an accelerated attribution basis for each vesting tranche over the respective derived service period for PSUs. Share-based compensation expense is allocated among the following categories of expenses within noninterest expense: (i) technology and product development, (ii) sales and marketing, (iii) cost of operations, and (iv) general and administrative in the consolidated statements of operations and comprehensive loss. We used the Black-Scholes Option Pricing Model (the “Black-Scholes Model”) to estimate the grant-date fair value of stock options. RSUs are measured based on the fair values of the underlying stock on the dates of grant. We use a Monte Carlo simulation model to estimate the grant-date fair value of PSUs. We recognize forfeitures as incurred and, therefore, reverse previously recognized share-based compensation expense at the time of forfeiture. See Note 16. Share-Based Compensation for further discussion of share-based compensation.
Income Taxes
We recognize deferred tax assets and liabilities for the expected future tax consequences of temporary differences between the financial reporting and tax basis of assets and liabilities, as well as for operating loss and tax credit carryforwards. Deferred tax assets and liabilities are measured using the tax rates that are expected to apply to taxable income for the years in which those tax assets and liabilities are expected to be realized or settled. In assessing the realizability of deferred tax assets, management reviews all available positive and negative evidence. Valuation allowances are recorded to reduce deferred tax assets to the amount we believe is more likely than not to be realized.
The tax effects from an uncertain tax position can be recognized in the financial statements only if the tax position would more likely than not be upheld on examination by the taxing authorities based on the merits of the tax position. Management is required to analyze all open tax years, as defined by the statute of limitations, for all jurisdictions. We accrue tax penalties and interest, if any, as incurred and recognize them within income tax (expense) benefit in the consolidated statements of operations and comprehensive loss.
Related Parties
We define related parties as members of our Board of Directors, entity affiliates, executive officers and principal owners of our outstanding stock and members of their immediate families. Related parties also include any other person or entity with significant influence over our management or operations.
SoFi Technologies, Inc.
SoFi Technologies, Inc.
Notes to Consolidated Financial Statements (continued)
(In Thousands, Unless Otherwise Stated and Except for Share and Per Share Data)
Recently Adopted Accounting Standards
Troubled Debt Restructurings and Vintage Disclosures
In March 2022, the FASB issued ASU 2022-02, Financial Instruments — Credit Losses (Topic 326): Troubled Debt Restructurings and Vintage Disclosures. The ASU addresses two topics: (i) TDR by creditors, and (ii) vintage disclosures for gross write offs. Under the TDR provisions, the ASU eliminates the recognition and measurement guidance under ASC 310-40, Receivables — Troubled Debt Restructurings by Creditors, and instead requires that an entity evaluate whether the modification represents a new loan or a continuation of an existing loan, consistent with the accounting for other loan modifications. Additionally, the ASU enhances existing disclosure requirements around TDRs and introduces new requirements related to certain modifications of receivables made to borrowers experiencing financial difficulty. Under the vintage disclosure provisions, the ASU requires the entity to disclose current period gross write offs by year of origination for financing receivables and net investments in leases within the scope of ASC 326-20, Financial Instruments — Credit Losses — Measured at Amortized Cost. The standard should be applied prospectively; however, for the TDR provisions, an entity has the option to apply a modified retrospective transition method. We adopted the standard effective January 1, 2023. The adoption of this standard did not have a material impact on our consolidated financial statements.
Recent Accounting Standards Issued, But Not Yet Adopted
Improvements to Reportable Segment Disclosures
In November 2023, the FASB issued ASU 2023-07, Segment Reporting (Topic 280) — Improvements to Reportable Segment Disclosures. The ASU improves reportable segment disclosure requirements, primarily through enhanced disclosures about significant segment expenses. The standard is effective for fiscal years beginning after December 15, 2023, and interim periods within fiscal years beginning after December 15, 2024. The standard should be applied retrospectively to all prior periods presented in the financial statements. We are currently evaluating the impact of this amendment on our consolidated financial statements.
Improvements to Income Tax Disclosures
In December 2023, the FASB issued ASU 2023-09, Income Taxes (Topic 740) — Improvements to Income Tax Disclosures. The ASU improves income tax disclosures primarily related to enhancements of the rate reconciliation and income taxes paid information. The standard is effective for annual periods beginning after December 15, 2024. The standard should be applied on a prospective basis with the option to apply the standard retrospectively. We are currently evaluating the impact of this amendment on our consolidated financial statements.
Note 2. Business Combinations
Merger with Social Capital Hedosophia Holdings Corp. V
On January 7, 2021, Social Finance entered into an agreement by and among Social Finance, SCH, a Cayman Islands exempted company limited by shares, and Plutus Merger Sub Inc., a Delaware corporation and a wholly owned subsidiary of SCH (“Merger Sub”), pursuant to which Merger Sub merged with and into Social Finance. Upon the Closing on May 28, 2021, the separate corporate existence of Merger Sub ceased and Social Finance survived the merger and became a wholly-owned subsidiary of SCH. On May 28, 2021, SCH also filed a notice of deregistration with the Cayman Islands Registrar of Companies, together with the necessary accompanying documents, and filed a certificate of incorporation and a certificate of corporate domestication with the Secretary of State of the State of Delaware, under which SCH was domesticated as a Delaware corporation, changing its name from “Social Capital Hedosophia Holdings Corp. V” to “SoFi Technologies, Inc.” These transactions are collectively referred to as the “Business Combination”.
The Business Combination was accounted for as a reverse recapitalization whereby SCH was determined to be the accounting acquiree and Social Finance to be the accounting acquirer. This accounting treatment was the equivalent of Social Finance issuing stock for the net assets of SCH, accompanied by a recapitalization whereby no goodwill or other intangible assets were recorded. Operations prior to the Business Combination are those of Social Finance. At the Closing, we received gross cash consideration of $764.8 million as a result of the reverse recapitalization, which was then reduced by: (i) a redemption of redeemable common stock (classified as temporary equity) of $150.0 million, (ii) a special payment made to our
SoFi Technologies, Inc.
SoFi Technologies, Inc.
Notes to Consolidated Financial Statements (continued)
(In Thousands, Unless Otherwise Stated and Except for Share and Per Share Data)
Series 1 preferred stockholders of $21.2 million (which was expensed as incurred), and (iii) our equity issuance costs of $27.5 million, consisting of advisory, legal, share registration and other professional fees, which were recorded within additional paid-in capital as a reduction of proceeds.
In connection with the Business Combination, SCH entered into subscription agreements with certain investors (the “Third Party PIPE Investors”), whereby it issued 122,500,000 shares of common stock at $10.00 per share (“PIPE Shares”) for an aggregate purchase price of $1.225 billion (“PIPE Investment”), which closed simultaneously with the consummation of the Business Combination. Upon the Closing, the PIPE Shares were automatically converted into shares of SoFi Technologies common stock on a one-for-one basis.
Upon the Closing, holders of Social Finance common stock received shares of SoFi Technologies common stock in an amount determined by application of the exchange ratio of 1.7428 (“Exchange Ratio”), which was based on Social Finance’s implied price per share prior to the Business Combination. Additionally, holders of Social Finance preferred stock (with the exception of the Series 1 preferred stockholders) received shares of SoFi Technologies common stock in amounts determined by application of either the Exchange Ratio or a multiplier of the Exchange Ratio, as provided by the Agreement.
Acquisition of Golden Pacific Bancorp, Inc.
On February 2, 2022, we acquired Golden Pacific, pursuant to an Agreement and Plan of Merger dated as of March 8, 2021 by and among the Company, a wholly-owned subsidiary of the Company, and Golden Pacific. In the business combination, we acquired all of the outstanding equity interests in Golden Pacific for total cash purchase consideration of $22.3 million (the “Bank Merger”). The acquisition was not determined to be a significant acquisition. After closing the Bank Merger, we became a bank holding company and Golden Pacific began operating as SoFi Bank. We are duly registered as a bank holding company with the Federal Reserve. SoFi Bank is a national banking association whose primary federal regulator is the OCC. Deposit accounts of SoFi Bank are insured by the FDIC through the Deposit Insurance Fund to the fullest extent permitted by law.
The closing of the Bank Merger was subject to regulatory approval. On January 18, 2022, we received approval from the Federal Reserve of our application to become a bank holding company under the Bank Holding Company Act, and we received conditional approval from the OCC to close the Bank Merger. The OCC also approved our application to change the composition of Golden Pacific’s assets in connection with the Bank Merger. The OCC conditional approval imposed a number of conditions, including that SoFi Bank have initial paid-in capital of no less than $750 million and adhere to an operating agreement. Golden Pacific’s community bank business continues to operate as a division of SoFi Bank.
A portion of the total cash purchase consideration ($0.6 million) was held back by the Company to satisfy any indemnification or certain other obligations (“Holdback Amount”), as certain legal proceedings with which Golden Pacific is involved as a plaintiff were not resolved at the time the Bank Merger closed. During 2022, we incurred costs associated with the litigation involving Golden Pacific as a plaintiff in excess of the Holdback Amount. Therefore, none of the Holdback Amount will be released to the Golden Pacific shareholders. Additionally, we held back a $3.3 million payable to a dissenting Golden Pacific shareholder pending resolution of the shareholder’s dissenter’s rights appraisal claim. During the fourth quarter of 2023, the appraisal claim was settled and payment was released.
Acquisition of Technisys S.A.
On March 3, 2022, we acquired Technisys S.A., a Luxembourg société anonyme, (“Technisys”), pursuant to an Agreement and Plan of Merger dated as of February 19, 2022 and amended as of March 3, 2022, by and among the Company, Technisys, Atom New Delaware, Inc., a Delaware corporation and a wholly owned subsidiary of Atom, and Atom Merger Sub Corporation, a Delaware corporation and wholly owned subsidiary of SoFi Technologies (the “Technisys Merger”). In the business combination, we acquired all of the outstanding equity interests in Technisys for a preliminary purchase consideration of $915.4 million. During the third quarter of 2022, we finalized the closing net working capital calculation specified in the merger agreement, which resulted in a reduction to the equity consideration of 155,794 shares, representing an adjustment to the total purchase consideration of $1,665, and a corresponding reduction to the carrying value of recognized goodwill. The remaining 442,274 shares that were held in escrow associated with the working capital calculation were released to the former Technisys shareholders. The finalized closing net working capital calculation did not impact the estimated fair values of the assets acquired and liabilities assumed in conjunction with the transaction.
SoFi Technologies, Inc.
SoFi Technologies, Inc.
Notes to Consolidated Financial Statements (continued)
(In Thousands, Unless Otherwise Stated and Except for Share and Per Share Data)
The following table presents the components of the total purchase consideration to acquire Technisys as of December 31, 2022:
| | | | | |
Fair value of common stock issued(1) | $ | 873,377 | |
| Amounts payable to settle vested employee performance awards | 37,297 | |
Fair value of awards assumed(2) | 2,855 | |
| Settlement of pre-combination transactions between acquirer and acquiree | 235 | |
| Total purchase consideration | $ | 913,764 | |
___________________
(1) Reflects the shares of SoFi common stock issued in the acquisition of 81,700,318, multiplied by the closing stock price of SoFi common stock on the closing date of the Technisys Merger. Additionally, these shares are inclusive of 6,305,595 shares that were held in escrow.
(2) We contemporaneously converted outstanding performance awards into RSUs to acquire common stock of SoFi (“Replacement Awards”). The fair value of awards assumed in the purchase consideration was based on the closing stock price of SoFi common stock on the closing date of the Technisys Merger.
We settled vested employee performance awards, which were a component of the purchase consideration above, with payments during the years ended December 31, 2023 and 2022 of $19,656 and $17,641, respectively. During the year ended December 31, 2023, we released 6,259,736 escrow shares during the second and fourth quarters of 2023. The remaining 45,859 shares continue to be held in escrow pending resolution of outstanding indemnification claims by SoFi.
The following unaudited supplemental pro forma financial information presents the Company’s consolidated results of operations as if the business combination had occurred on January 1, 2020:
| | | | | | | | | | | | | | | | |
| | Year Ended December 31, |
| | 2022 | | 2021 | | |
| Total net revenue | | $ | 1,584,439 | | | $ | 1,055,219 | | | |
| Net loss | | (311,512) | | | (512,785) | | | |
The unaudited supplemental pro forma financial information is presented for comparative purposes only and is not necessarily indicative of the actual results of operations that would have been achieved, nor is it indicative of future results of operations. The unaudited supplemental pro forma financial information reflects pro forma adjustments that give effect to applying the Company’s accounting policies and certain events the Company believes to be directly attributable to the acquisition. The pro forma adjustments primarily include:
•incremental straight-line amortization expense associated with acquired intangible assets;
•an adjustment to reflect post-combination share-based compensation expense associated with the Replacement Awards as if the conversion had occurred on January 1, 2020;
•an adjustment to reflect acquisition-related costs for both parties as if they were incurred during the earliest period presented; and
•the related income tax effects, at the statutory tax rate applicable for each period, of the pro forma adjustments noted above.
The unaudited supplemental pro forma financial information does not give effect to any anticipated cost savings, operating efficiencies or other synergies that may be associated with the acquisition, or any estimated costs that have been or will be incurred by the Company to integrate the assets and operations of Technisys.
Acquisition of Wyndham Capital Mortgage
On April 3, 2023, we acquired all of the outstanding equity interests in Wyndham for cash consideration. With the acquisition of Wyndham, a fintech mortgage lender, we broadened our suite of home loan products and now manage the technology for a digitized mortgage experience. The acquisition is being accounted for as a business combination. The purchase consideration is being allocated to the tangible and intangible assets acquired and liabilities assumed based on the estimated fair values as of the acquisition date. The excess of the total purchase consideration over the fair value of the net assets acquired is allocated to goodwill, which is expected to be deductible for tax purposes. The fair value estimates are subject to change for up
SoFi Technologies, Inc.
SoFi Technologies, Inc.
Notes to Consolidated Financial Statements (continued)
(In Thousands, Unless Otherwise Stated and Except for Share and Per Share Data)
to one year after the acquisition date as additional information becomes available. The acquisition was not determined to be a significant acquisition.
In each of our revenue arrangements, revenue is recognized when control of the promised goods or services is transferred to the customer in an amount that reflects our expected consideration in exchange for those goods or services.
Technology Products and Solutions
We earn fees for providing an integrated platform as a service for financial and non-financial institutions. Within our technology products and solutions fee arrangements, certain contracts contain a provision for a fixed, upfront implementation fee related to setup activities, which represents an advance payment for future technology platform services provided over the contract term. These implementation fees are recognized ratably over the contract life.
Commencing in March 2022 with the Technisys Merger, we earn subscription and service fees for providing software licenses and associated services, including implementation and maintenance. We charge a recurring subscription fee for the software license and related maintenance services. Other software-related services are billed on a periodic basis as the services are provided. Certain arrangements for software and related services contain a provision for a fixed upfront payment.
We recognize revenue related to software licenses at a point in time upon delivery of the license and the close of the user-acceptance testing period. When implementation services are distinct, we recognize revenue over time during the implementation period. We recognize maintenance services ratably over the contractual maintenance term. If a fixed upfront payment provides a material right to the customer, we recognize revenue associated with the material right over the period of benefit associated with the right to subscribe or renew a subscription, which is typically the product life.
We allocate fees charged for software and related services to our performance obligations on the basis of the relative standalone selling price. The standalone selling prices either represent the prices at which we separately sell each license or service or are estimated using available information, such as market conditions and internal pricing policies. The standalone selling price of the software license and maintenance are determined based on the complexity and size of the license.
Payments to customers: We may provide incentives to our technology platform customers, which may be payable up front or applied to future or past technology products and solutions fees. Evaluating whether such incentives are payments to a customer requires judgment. When we determine that an incentive is consideration payable to a customer, the incentive is recorded as a reduction of revenue. Incentives that represent consideration payable to a customer may also contain variable consideration. Therefore, such incentives are constraints on the revenue expected to be realized. Upfront customer incentives are recorded as prepaid assets and presented within other assets in the consolidated balance sheets, and are applied against revenue in the period such incentives are earned by the customer. Any incentive in excess of cumulative revenue is expensed as a contract cost.
Referrals
We earn specified referral fees in connection with certain referral activities we facilitate through our platform. In one type of referral arrangement, we refer end users through our platform to third-party enterprise partners. Our referral fee is calculated as either a fixed price per successful referral or a percentage of the transaction volume between the enterprise partners and referred consumers. In another type of referral arrangement, we earn referral fulfillment fees for providing pre-qualified borrower referrals to a third-party partner who separately contracts with a loan originator. Our referral fees are based on the referred loan amount, subject to a referral fulfillment fee penalty if a loan is determined to be ineligible and becomes a charged-off loan as defined in the contract. We recognize revenue for each originated loan, less the estimated referral fulfillment fee penalty. The estimated referral fulfillment fee penalty was immaterial as of December 31, 2023 and 2022.
Interchange
We earn interchange fees from debit and credit cardholder transactions conducted through payment networks. Interchange fees from cardholder transactions represent a percentage of the underlying transaction value and are recognized
SoFi Technologies, Inc.
SoFi Technologies, Inc.
Notes to Consolidated Financial Statements (continued)
(In Thousands, Unless Otherwise Stated and Except for Share and Per Share Data)
daily, concurrently with the transaction processing services provided to the cardholder. Interchange is presented net of cardholder rewards associated with card transactions.
Brokerage
We earn fees in connection with facilitating investment-related transactions through our platform, which we refer to as brokerage revenue. Our brokerage revenue performance obligation is generally completely satisfied upon the completion of an investment-related transaction. In general, we act as the agent in these arrangements as we do not oversee the execution of the transactions and ultimately lack the requisite control.
Disaggregated Revenue
The table below presents revenue from contracts with customers disaggregated by type of service, which best depicts how the revenue and cash flows are affected by economic factors, and by the reportable segment to which each revenue stream relates, as well as a reconciliation of total revenue from contracts with customers to total noninterest income. Revenue from contracts with customers is presented within noninterest income—technology products and solutions and noninterest income—other in the consolidated statements of operations and comprehensive loss. There were no revenues from contracts with customers attributable to our Lending segment for any of the years presented.
| | | | | | | | | | | | | | | | | |
| Year Ended December 31, |
| 2023 | | 2022 | | 2021 |
| Financial Services | | | | | |
| Referrals | $ | 38,443 | | | $ | 36,052 | | | $ | 15,750 | |
| Interchange | 35,247 | | | 17,391 | | | 10,642 | |
| Brokerage | 21,127 | | | 15,446 | | | 22,733 | |
Other(1) | 2,647 | | | 2,245 | | | 5,541 | |
| Total financial services | $ | 97,464 | | | $ | 71,134 | | | $ | 54,666 | |
Technology Platform(2) | | | | | |
| Technology services | 319,845 | | | 299,379 | | | 191,847 | |
Other(1) | 4,145 | | | 6,583 | | | 1,205 | |
| Total technology platform | 323,990 | | | 305,962 | | | 193,052 | |
| Total revenue from contracts with customers | 421,454 | | | 377,096 | | | 247,718 | |
| Other Sources of Revenue | | | | | |
| | | | | |
| | | | | |
| Loan origination, sales, and securitizations | 371,812 | | | 565,372 | | | 482,764 | |
| Servicing | 37,328 | | | 43,547 | | | (2,281) | |
| Other | 30,455 | | | 3,424 | | | 4,427 | |
| Total other sources of revenue | $ | 439,595 | | | $ | 612,343 | | | $ | 484,910 | |
| Total noninterest income | $ | 861,049 | | | $ | 989,439 | | | $ | 732,628 | |
_____________________(1) Financial Services includes revenues from enterprise services and equity capital markets services. Technology Platform includes revenues from software licenses and associated services, and payment network fees for serving as a transaction card program manager for enterprise customers that are the program marketers for separate card programs.
(2) Related to these technology products and solutions arrangements, we had deferred revenue of $5,718 and $10,028 as of December 31, 2023 and 2022, respectively, which are presented within accounts payable, accruals and other liabilities in the consolidated balance sheets. During the years ended December 31, 2023, 2022 and 2021, we recognized revenue of $8,327, $7,773 and $685, respectively, associated with deferred revenue within noninterest income—technology products and solutions in the consolidated statements of operations and comprehensive loss.
Contract Balances
As of December 31, 2023 and 2022, accounts receivable, net associated with revenue from contracts with customers was $60,466 and $61,226, respectively, which were reported within other assets in the consolidated balance sheets.
SoFi Technologies, Inc.
SoFi Technologies, Inc.
Notes to Consolidated Financial Statements (continued)
(In Thousands, Unless Otherwise Stated and Except for Share and Per Share Data)
Note 4. Loans
As of December 31, 2023, our loan portfolio consisted of (i) loans held for sale, including personal loans and home loans, which are measured at fair value under the fair value option, (ii) loans held for investment, including student loans, which are measured at fair value under the fair value option, and (iii) loans held for investment, including senior secured loans, credit cards, and commercial and consumer banking loans, which are measured at amortized cost. Below is a disaggregated presentation of our loans, inclusive of fair market value adjustments and accrued interest income and net of the allowance for credit losses, as applicable:
| | | | | | | | | | | |
| December 31, |
| 2023 | | 2022 |
| Loans held for sale | | | |
Personal loans(1) | $ | 15,330,573 | | | $ | 8,610,434 | |
Student loans(2) | — | | | 4,877,177 | |
| Home loans | 66,198 | | | 69,463 | |
| Total loans held for sale, at fair value | 15,396,771 | | | 13,557,074 | |
Loans held for investment(3) | | | |
Student loans(4) | 6,725,484 | | | — | |
| Total loans held for investment, at fair value | 6,725,484 | | | — | |
| Senior secured loans | 446,463 | | | — | |
| Credit card | 272,628 | | | 209,164 | |
| Commercial and consumer banking: | | | |
| Commercial real estate | 106,326 | | | 88,652 | |
| Commercial and industrial | 6,075 | | | 7,179 | |
| Residential real estate and other consumer | 4,667 | | | 2,962 | |
| Total commercial and consumer banking | 117,068 | | | 98,793 | |
Total loans held for investment, at amortized cost(3) | 836,159 | | | 307,957 | |
| Total loans held for investment | 7,561,643 | | | 307,957 | |
| Total loans | $ | 22,958,414 | | | $ | 13,865,031 | |
_____________________
(1) Includes $502,757 and $663,004 of personal loans in consolidated VIEs as of December 31, 2023 and 2022, respectively.
(2) Includes $268,697 of student loans in consolidated VIEs as of December 31, 2022.
(3) See Note 1. Organization, Summary of Significant Accounting Policies and New Accounting Standards and Note 5. Allowance for Credit Losses for additional information on our loans at amortized cost as it pertains to the allowance for credit losses.
(4) As of December 31, 2023, includes $2,459,103 of student loans covered by financial guarantees, and $221,461 of student loans in consolidated VIEs.
SoFi Technologies, Inc.
SoFi Technologies, Inc.
Notes to Consolidated Financial Statements (continued)
(In Thousands, Unless Otherwise Stated and Except for Share and Per Share Data)
Loans Measured at Fair Value
The following table summarizes the aggregate fair value of our loans for which we elected the fair value option. See Note 15. Fair Value Measurements for the assumptions used in our fair value model.
| | | | | | | | | | | | | | | | | | | | | | | |
| Personal Loans | | Student Loans | | Home Loans | | Total |
| December 31, 2023 | | | | | | | |
| Unpaid principal | $ | 14,498,629 | | | $ | 6,445,586 | | | $ | 67,406 | | | $ | 21,011,621 | |
| Accumulated interest | 114,541 | | | 34,357 | | | 92 | | | 148,990 | |
| Cumulative fair value adjustments | 717,403 | | | 245,541 | | | (1,300) | | | 961,644 | |
Total fair value of loans(1) | $ | 15,330,573 | | | $ | 6,725,484 | | | $ | 66,198 | | | $ | 22,122,255 | |
| December 31, 2022 | | | | | | | |
| Unpaid principal | $ | 8,283,400 | | | $ | 4,794,517 | | | $ | 77,705 | | | $ | 13,155,622 | |
| Accumulated interest | 55,673 | | | 19,433 | | | 151 | | | 75,257 | |
| Cumulative fair value adjustments | 271,361 | | | 63,227 | | | (8,393) | | | 326,195 | |
Total fair value of loans(1) | $ | 8,610,434 | | | $ | 4,877,177 | | | $ | 69,463 | | | $ | 13,557,074 | |
_____________________(1) Each component of the fair value of loans is impacted by charge-offs during the period. Our fair value assumption for annual default rate incorporates fair value markdowns on loans beginning when they are 10 days or more delinquent, with additional markdowns at 30, 60 and 90 days past due.
The following table summarizes the aggregate fair value of loans 90 days or more delinquent. As delinquent personal loans and student loans are charged off after 120 days of delinquency, amounts presented below represent the fair value of loans that are 90 to 120 days delinquent.
| | | | | | | | | | | | | | | | | | | | | | | |
| Personal Loans | | Student Loans | | Home Loans | | Total |
| December 31, 2023 | | | | | | | |
| Unpaid principal balance | $ | 81,591 | | | $ | 8,446 | | | $ | 495 | | | $ | 90,532 | |
| Accumulated interest | 4,023 | | | 187 | | | 6 | | | 4,216 | |
Cumulative fair value adjustments(1) | (70,191) | | | (5,021) | | | (248) | | | (75,460) | |
| Fair value of loans 90 days or more delinquent | $ | 15,423 | | | $ | 3,612 | | | $ | 253 | | | $ | 19,288 | |
| December 31, 2022 | | | | | | | |
| Unpaid principal balance | $ | 27,989 | | | $ | 6,435 | | | $ | — | | | $ | 34,424 | |
| Accumulated interest | 1,207 | | | 304 | | | — | | | 1,511 | |
Cumulative fair value adjustments(1) | (25,022) | | | (3,332) | | | — | | | (28,354) | |
| Fair value of loans 90 days or more delinquent | $ | 4,174 | | | $ | 3,407 | | | $ | — | | | $ | 7,581 | |
__________________
(1) Our fair value assumption for annual default rate incorporates fair value markdowns on loans beginning when they are 10 days or more delinquent, with additional markdowns at 30, 60 and 90 days past due.
Transfers of Financial Assets
We regularly transfer financial assets and account for such transfers as either sales or secured borrowings depending on the facts and circumstances of the transfer. When a transfer of financial assets qualifies as a sale, in many instances we have continuing involvement as the servicer of those financial assets. As we expect the benefits of servicing to be more than just adequate, we recognize a servicing asset. Further, in the case of securitization-related transfers that qualify as sales, we have additional continuing involvement as an investor, albeit at insignificant levels relative to the expected gains and losses of the securitization. In instances where a transfer is accounted for as a secured borrowing, we perform servicing (but we do not recognize a servicing asset) and typically maintain a significant investment relative to the expected gains and losses of the securitization. In whole loan sales, we do not have a residual financial interest in the loans, nor do we have any other power over the loans that would constrain us from recognizing a sale. Additionally, we generally have no repurchase requirements related to transfers of personal loans, student loans and non-GSE home loans other than standard origination representations and warranties, for which we record a liability based on expected repurchase obligations. For GSE home loans, we have customary
SoFi Technologies, Inc.
SoFi Technologies, Inc.
Notes to Consolidated Financial Statements (continued)
(In Thousands, Unless Otherwise Stated and Except for Share and Per Share Data)
GSE repurchase requirements, which do not constrain sale treatment but result in a liability for the expected repurchase requirement.
The following table summarizes our personal loan and student loan securitization transfers qualifying for sale accounting treatment. There were no loan securitization transfers qualifying for sale accounting treatment during the year ended December 31, 2022.
| | | | | | | | | | | | | |
| Year Ended December 31, |
| 2023 | | | | 2021 |
| Personal loans | | | | | |
| Fair value of consideration received: | | | | | |
| Cash | $ | 359,927 | | | | | $ | 1,050,062 | |
| Securitization investments | 18,985 | | | | | 55,491 | |
| | | | | |
| Servicing assets recognized | 15,975 | | | | | 6,003 | |
| Repurchase liabilities recognized | (113) | | | | | — | |
| Total consideration | 394,774 | | | | | 1,111,556 | |
| Aggregate unpaid principal balance and accrued interest of loans sold | 375,770 | | | | | 1,054,171 | |
| Gain from loan sales | $ | 19,004 | | | | | $ | 57,385 | |
| Student loans | | | | | |
| Fair value of consideration received: | | | | | |
| Cash | $ | — | | | | | $ | 1,187,714 | |
| Securitization investments | — | | | | | 62,783 | |
| | | | | |
| Servicing assets recognized | — | | | | | 36,948 | |
| Total consideration | — | | | | | 1,287,445 | |
| Aggregate unpaid principal balance and accrued interest of loans sold | — | | | | | 1,227,379 | |
| Gain from loan sales | $ | — | | | | | $ | 60,066 | |
Deconsolidation of debt reflects the impacts of previously consolidated VIEs that became deconsolidated during the period because we no longer hold a significant financial interest in the underlying securitization entity, which can fluctuate from period to period. Gains and losses on deconsolidations are presented within noninterest income—loan origination, sales, and securitizations in the consolidatedstatements of operations and comprehensive loss. During the year ended December 31, 2023, we had deconsolidation of debt on student loans of $100.3 million. During the year ended December 31, 2022, we had deconsolidation of debt on personal loans of $70.6 million and on student loans of $126.0 million. For all periods, the impact on earnings from these deconsolidations was immaterial.
SoFi Technologies, Inc.
SoFi Technologies, Inc.
Notes to Consolidated Financial Statements (continued)
(In Thousands, Unless Otherwise Stated and Except for Share and Per Share Data)
The following table summarizes our whole loan sales:
| | | | | | | | | | | | | | | | | |
| Year Ended December 31, |
| 2023 | | 2022 | | 2021 |
| Personal loans | | | | | |
| Fair value of consideration received: | | | | | |
| Cash | $ | 567,904 | | | $ | 3,016,740 | | | $ | 3,373,655 | |
| Servicing assets recognized | 30,168 | | | 21,925 | | | 21,811 | |
| Repurchase liabilities recognized | (2,069) | | | (7,351) | | | (8,168) | |
| Total consideration received | 596,003 | | | 3,031,314 | | | 3,387,298 | |
| Aggregate unpaid principal balance and accrued interest of loans sold | 567,003 | | | 2,924,567 | | | 3,253,645 | |
| Realized gain | $ | 29,000 | | | $ | 106,747 | | | $ | 133,653 | |
| Student loans | | | | | |
| Fair value of consideration received: | | | | | |
| Cash | $ | 98,624 | | | $ | 883,859 | | | $ | 1,676,892 | |
| Servicing assets recognized | 2,792 | | | 9,275 | | | 15,526 | |
| Repurchase liabilities recognized | (16) | | | (134) | | | (300) | |
| Total consideration | 101,400 | | | 893,000 | | | 1,692,118 | |
| Aggregate unpaid principal balance and accrued interest of loans sold | 99,916 | | | 881,922 | | | 1,635,280 | |
| Realized gain | $ | 1,484 | | | $ | 11,078 | | | $ | 56,838 | |
| Home loans | | | | | |
| Fair value of consideration received: | | | | | |
| Cash | $ | 1,022,600 | | | $ | 1,057,596 | | | $ | 2,989,813 | |
| Servicing assets recognized | 10,184 | | | 13,926 | | | 31,294 | |
| Repurchase liabilities recognized | (1,765) | | | (1,158) | | | (3,288) | |
| Total consideration | 1,031,019 | | | 1,070,364 | | | 3,017,819 | |
| Aggregate unpaid principal balance and accrued interest of loans sold | 1,029,623 | | | 1,095,882 | | | 2,935,343 | |
| Realized gain (loss) | $ | 1,396 | | | $ | (25,518) | | | $ | 82,476 | |
For certain transferred loans that qualified for sale accounting and are, therefore, off-balance sheet, we have continuing involvement through our servicing agreements. For such loans, our exposure to loss is generally limited to the extent we would be required to repurchase such a loan due to a breach of representations and warranties associated with the loan transfer or servicing contract.
The following table presents information about the unpaid principal balances of loans originated by us and subsequently transferred, but with which we have continuing involvement:
| | | | | | | | | | | | | | | | | | | | | | | |
| Personal Loans | | Student Loans | | Home Loans | | Total |
| December 31, 2023 | | | | | | | |
| | | | | | | |
| Loans in delinquency (30+ days past due) | $ | 52,813 | | | $ | 60,989 | | | $ | 24,193 | | | $ | 137,995 | |
| Total loans in delinquency | 90,582 | | | 137,243 | | | 24,193 | | | 252,018 | |
Total transferred loans serviced(1) | 2,223,785 | | | 6,148,800 | | | 5,592,793 | | | 13,965,378 | |
| December 31, 2022 | | | | | | | |
| | | | | | | |
| Loans in delinquency (30+ days past due) | $ | 64,654 | | | $ | 46,986 | | | $ | 16,510 | | | $ | 128,150 | |
| Total loans in delinquency | 108,991 | | | 115,818 | | | 16,510 | | | 241,319 | |
Total transferred loans serviced(1) | 2,995,601 | | | 7,586,031 | | | 5,134,306 | | | 15,715,938 | |
_____________________
SoFi Technologies, Inc.
SoFi Technologies, Inc.
Notes to Consolidated Financial Statements (continued)
(In Thousands, Unless Otherwise Stated and Except for Share and Per Share Data)
(1)Total transferred loans serviced includes loans in delinquency, as well as loans in repayment, loans in-school/grace period/deferment (related to student loans), and loans in forbearance. The vast majority of total transferred loans serviced represent loans in repayment as of the dates indicated.
The following table presents additional information about the servicing cash flows received and net charge-offs related to loans originated by us and subsequently transferred, but with which we have a continuing involvement:
| | | | | | | | | | | | | | | | | |
| Year Ended December 31, |
| 2023 | | 2022 | | 2021 |
| Personal loans | | | | | |
| Servicing fees collected from transferred loans | $ | 20,577 | | | $ | 33,051 | | | $ | 34,421 | |
| Charge-offs, net of recoveries, of transferred loans | 167,643 | | | 93,095 | | | 102,217 | |
| Student loans | | | | | |
| Servicing fees collected from transferred loans | 27,401 | | | 35,203 | | | 46,657 | |
| Charge-offs, net of recoveries, of transferred loans | 41,642 | | | 34,136 | | | 24,675 | |
| Home loans | | | | | |
| Servicing fees collected from transferred loans | 14,530 | | | 12,893 | | | 8,749 | |
| | | | | |
| Total | | | | | |
| Servicing fees collected from transferred loans | $ | 62,508 | | | $ | 81,147 | | | $ | 89,827 | |
| Charge-offs, net of recoveries, of transferred loans | 209,285 | | | 127,231 | | | 126,892 | |
Loans Measured at Amortized Cost
Loan Portfolio Composition and Aging
The following table presents the amortized cost basis of our credit card and commercial and consumer banking portfolios (excluding accrued interest and before the allowance for credit losses) by either current status or delinquency status:
| | | | | | | | | | | | | | | | | | | | | | | | | | | | | | | | | | | |
| | | Delinquent Loans | | |
| Current | | 30–59 Days | | 60–89 Days | | ≥ 90 Days(1) | | Total Delinquent Loans | | Total Loans(2) |
| December 31, 2023 | | | | | | | | | | | |
| Senior secured loans | $ | 445,733 | | | $ | — | | | $ | — | | | $ | — | | | $ | — | | | $ | 445,733 | |
| Credit card | 297,612 | | | 5,451 | | | 4,829 | | | 11,802 | | | 22,082 | | | 319,694 | |
| Commercial and consumer banking: | | | | | | | | | | | |
| Commercial real estate | 107,757 | | | — | | | — | | | — | | | — | | | 107,757 | |
| Commercial and industrial | 6,108 | | | 1 | | | — | | | 439 | | | 440 | | | 6,548 | |
Residential real estate and other consumer(3) | 4,658 | | | — | | | — | | | — | | | — | | | 4,658 | |
| Total commercial and consumer banking | 118,523 | | | 1 | | | — | | | 439 | | | 440 | | | 118,963 | |
| Total loans | $ | 861,868 | | | $ | 5,452 | | | $ | 4,829 | | | $ | 12,241 | | | $ | 22,522 | | | $ | 884,390 | |
| December 31, 2022 | | | | | | | | | | | |
| Credit card | $ | 225,165 | | | $ | 4,670 | | | $ | 3,626 | | | $ | 10,498 | | | $ | 18,794 | | | $ | 243,959 | |
| Commercial and consumer banking: | | | | | | | | | | | |
| Commercial real estate | 89,544 | | | — | | | — | | | — | | | — | | | 89,544 | |
| Commercial and industrial | 7,636 | | | — | | | 1 | | | — | | | 1 | | | 7,637 | |
Residential real estate and other consumer(3) | 2,966 | | | — | | | — | | | — | | | — | | | 2,966 | |
| Total commercial and consumer banking | 100,146 | | | — | | | 1 | | | — | | | 1 | | | 100,147 | |
| Total loans | $ | 325,311 | | | $ | 4,670 | | | $ | 3,627 | | | $ | 10,498 | | | $ | 18,795 | | | $ | 344,106 | |
_____________________(1)All of the credit cards ≥ 90 days past due continued to accrue interest. As of the dates indicated, there were no credit cards on nonaccrual status. As of the dates indicated, commercial and consumer banking loans on nonaccrual status were immaterial.
SoFi Technologies, Inc.
SoFi Technologies, Inc.
Notes to Consolidated Financial Statements (continued)
(In Thousands, Unless Otherwise Stated and Except for Share and Per Share Data)
(2)For credit card, the balance is presented before allowance for credit losses of $52,385 and $39,110 as of December 31, 2023 and December 31, 2022, respectively, and accrued interest of $5,288 and $4,315, respectively. For senior secured loans, the balance is presented before accrued interest of $730 as of December 31, 2023. For commercial and consumer banking, the balance is presented before allowance for credit losses of $2,310 and $1,678, as of December 31, 2023 and December 31, 2022, respectively, and accrued interest of $415 and $324, respectively.
(3)Includes residential real estate loans originated by Golden Pacific for which we did not elect the fair value option.
Credit Quality IndicatorsServicing Rights
Each time we enter into a servicing agreement, either in connection with transfers of our financial assets or in connection with a referral fulfillment arrangement in which we are a sub-servicer for financial assets that we do not legally own, we determine whether we should record a servicing asset or servicing liability. We elected the fair value option to measure our servicing rights subsequent to initial recognition. We measure the initial and subsequent fair value of our servicing rights using a discounted cash flow methodology, while also considering market data as it becomes available. The primary credit quality indicators thatsignificant assumptions used in the valuation model include our contractual servicing fee, ancillary income, prepayment rate assumptions, default rate assumptions, a discount rate commensurate with the risk of the servicing asset or liability being valued, and an assumed market cost of servicing, which is based on active quotes from third-party servicers. The value of the servicing rights are important to understandingdependent on the overall credit performance of the underlying loans. For servicing rights retained in connection with loan transfers that do not meet the requirements for sale accounting treatment, there is no recognition of a servicing asset or liability.
Servicing rights in connection with transfers of financial assets are initially measured at fair value and recognized as a component of the gain or loss from sales of loans and the initial capitalization is reported within noninterest income—loan origination, sales, and securitizations in the consolidated statements of operations and comprehensive loss. Servicing rights assumed from third parties for financial assets for which we are not the loan originator are initially measured at fair value and recognized within noninterest income—servicing in the consolidated statements of operations and comprehensive loss. Servicing rights are measured at fair value at each subsequent reporting date and changes in fair value are reported in earnings in the period in which they occur. Subsequent measurement changes for all servicing rights, including servicing fee payments and fair value changes, are included within noninterest income—servicing in the consolidated statements of operations and comprehensive loss. We elected the fair value option to measure our credit card borrowers and their abilityservicing rights to repay are reflected by delinquency status and by credit performance expectations, as segmented by origination FICO bands as of December 31, 2021. The Company monitors these credit quality indicators on an ongoing basis.
The following table presentsbetter align with the amortized cost basisvaluation of our credit cardtransferred loans, which also tend to share a similar risk profile to the personal loan portfolio (excluding accrued interestservicing we assume from third parties when we are not the loan originator. The loans are also impacted by similar factors, such as conditional prepayment rates and beforedefault rates. We consider the allowance for credit losses) by either current status or delinquency status asrisk of the dates indicated:
| | | | | | | | | | | | | | | | | | | | | | | | | | | | | | | | | | | |
| | | Delinquent Loans | | |
| Current | | 30–59 Days | | 60–89 Days | | ≥ 90 Days(1) | | Total Delinquent Loans | | Total Loans(2) |
| December 31, 2021 | | | | | | | | | | | |
| Credit card loans | $ | 115,356 | | | 1,893 | | | 1,683 | | | 2,658 | | | 6,234 | | | $ | 121,590 | |
| December 31, 2020 | | | | | | | | | | | |
| Credit card loans | $ | 3,864 | | | 74 | | | 2 | | | — | | | 76 | | | $ | 3,940 | |
_____________________assets and the observability of inputs in determining the classes of servicing rights. We have three classes of servicing assets: personal loans, student loans and home loans.(1)See As of December 31, 2021, all ofNote 15. Fair Value Measurements for the credit card loans that were 90 days or more past due continued to accrue interest.
(2)Presented before allowance for credit losses of $7,037 and $219 as of December 31, 2021 and 2020, respectively, and excludes accrued interest of $1,359 and $2, respectively.
The following table presentskey inputs used in the amortized cost basisfair value measurements of our credit card loan portfolio (excluding accrued interest and before the allowance for credit losses) asclasses of December 31, 2021 based on origination FICO. Generally, higher origination FICO score bands reflect higher anticipated credit performance than lower origination FICO score bands.
| | | | | | | | |
Origination FICO | | December 31, 2021 |
≥ 800 | | $ | 10,016 | |
780 – 799 | | 8,624 | |
760 – 779 | | 9,976 | |
740 – 759 | | 13,581�� | |
720 – 739 | | 18,358 | |
700 – 719 | | 22,579 | |
680 – 699 | | 21,736 | |
660 – 679 | | 14,044 | |
640 – 659 | | 1,969 | |
< 640 | | 707 | |
Total credit card loans | | $ | 121,590 | |
Investments in AFS debt securities: An allowance for credit losses on our investments in AFS debt securities is required for any portion of impaired securities that is attributable to credit-related factors. For certain securities that areservicing rights.
SoFi Technologies, Inc.
SoFi Technologies, Inc.
Notes to Consolidated Financial Statements (continued)
(In Thousands, Unless Otherwise Stated and Except for Share and Per Share Data)
guaranteed byInvestments in Debt Securities
The accounting and measurement framework for our investments in debt securities is determined based on the U.S. Treasury or government agencies, or sovereign entities of high credit quality,security classification. We do not hold investments in debt securities for trading purposes, nor do we concludedhave investments in debt securities that there is no risk of credit-related impairment duewe have the intent and ability to the nature of the counterparties and history of no credit losses. For otherhold to maturity. Therefore, we classify our investments in debt securities as available-for-sale.
We record investments in AFS debt securities factors consideredat fair value in evaluating creditour consolidated balance sheets, with unrealized gains and losses include (i) adverse conditions relatedrecorded, net of tax, as a component of AOCI. See Note 15. Fair Value Measurements for additional information on our fair value estimates for investments in AFS debt securities. The amortized cost basis of our investments in AFS debt securities reflects the security’s acquisition cost, adjusted for amortization of premium or accretion of discount, and collection of cash and charge-offs, as applicable. For purposes of determining gross realized gains and losses on AFS debt securities, the cost of securities sold is based on specific identification. We elected to the macroeconomic environment or the industry, geographic area or financial condition of the issuer, (ii) other credit indicators of the security, such as external credit ratings, and (iii) payment structure of the security. As of December 31, 2021, we concluded that the credit-related impairment was immaterial.
Credit-related impairment is recognized as an allowancepresent accrued interest for credit lossesAFS debt securities within investment securities in the consolidated balance sheets with a corresponding adjustmentsheets. Purchase discounts, premiums, and other basis adjustments for investments in AFS debt securities are generally amortized into interest income over the contractual life of the security using the effective interest method. However, premiums on certain callable debt securities are amortized to the earliest call date. Amortization of premiums and discounts and other basis adjustments for investments in AFS debt securities, as well as interest income earned on the investments, are recognized within interest income—other, and realized gains and losses on investments in AFS debt securities are recognized within noninterest expense—provision for credit lossesincome—other in the consolidated statements of operations and comprehensive loss.
An investment in AFS debt security is considered impaired if its fair value is less than its amortized cost. If we determine that we have the intent to sell the impaired investment in AFS debt security, or if it is more likely than not that we will be required to sell the impaired investment in AFS debt security before recovery of its amortized cost, we recognize the full impairment loss reflecting the difference between the amortized cost (net of any prior recognized allowance) and the fair value of the investment in AFS debt security within noninterest income—other in the consolidated statements of operations and comprehensive loss. If neither of the above conditions exists, we evaluate whether the impairment loss is attributable to credit-related or non-credit-related factors. Any impairment that is not credit-related is recognized within other comprehensive income (loss), net of taxes. See the section “Allowance for Credit Losses” in this Note for the factors we consider in identifying credit-related impairment and the treatment of credit losses.
See Note 6. Investment Securities for additional information on our investments in AFS debt securities.
Securitization Investments
In Company-sponsored securitization transactions that meet the applicable criteria to be accounted for as a sale, we retain certain residual interests and asset-backed bonds. We measure these investments at fair value on a recurring basis and report them within investment securities in the consolidated balance sheets. Gains and losses related to our securitization investments are reported within noninterest income—loan origination, sales, and securitizations in the consolidated statements of operations and comprehensive loss. We determine the fair value of our securitization investments using a discounted cash flow methodology, while also considering market data as it becomes available.
Our residual investments accrete interest income over the expected life using the effective yield method, which reflects a portion of the overall fair value adjustment recorded each period on our residual investments. On a quarterly basis, we reevaluate the cash flow estimates over the life of the residual investments to determine if a change to the accretable yield is required on a prospective basis. Additionally, we record interest income associated with asset-backed bonds over the term of the underlying bond using the effective interest method on unpaid bond amounts. Interest income on residual investments and asset-backed bonds is presented within interest income—loans and securitizations in the consolidated statements of operations and comprehensive loss.
See Note 15. Fair Value Measurements for the key inputs used in the fair value measurements of our residual investments and asset-backed bonds.
Investments in Equity Securities
Our investments in equity securities consist of investments for which fair values are not readily determinable, which we elect to measure using the alternative method of accounting, under which they are measured at cost less any impairment and
SoFi Technologies, Inc.
SoFi Technologies, Inc.
Notes to Consolidated Financial Statements (continued)
(In Thousands, Unless Otherwise Stated and Except for Share and Per Share Data)
adjusted for changes resulting from observable price changes in orderly transactions for identical or similar investments of the same issuers. Our investments in equity securities are presented within other assets in the consolidated balance sheets. Adjustments to the carrying values of our investments in equity securities, such as impairments and unrealized gains, are recognized within noninterest income—other in the consolidated statements of operations and comprehensive loss.
Property, Equipment and Software
All property, equipment and software are initially recorded at cost, while repairs and maintenance costs are expensed as incurred. Computer hardware, furniture and fixtures, software, buildings and finance lease ROU assets are depreciated or amortized on a straight-line basis over the estimated useful life of each class of depreciable or amortizable assets (ranging from one to 30 years). Such credit lossesLeasehold improvements are amortized over the shorter of the respective lease term or the estimated lives of the leasehold improvements.
Software includes both purchased and internally-developed software. Internally-developed software is capitalized when preliminary project efforts are successfully completed, and it is probable that both the project will be completed and the software will be used as intended. Capitalized costs consist of salaries and compensation costs (inclusive of share-based compensation) for employees, fees paid to third-party consultants who are directly involved in development efforts and costs incurred for upgrades and functionality enhancements, and are amortized over a useful life ranging from 2.5 to 3 years. Other costs are expensed as incurred.
See Note 9. Property, Equipment, Software and Leases for additional information on our property, equipment and software.
Goodwill and Intangible Assets
Goodwill represents the fair value of an acquired business in excess of the fair value of the identified net assets acquired. Goodwill is tested for impairment at the reporting unit level annually or whenever indicators of impairment exist. Impairment of goodwill is the condition that exists when the carrying amount of a reporting unit that includes goodwill exceeds its fair value. We may assess goodwill for impairment initially using a qualitative approach, referred to as “step zero”, to determine whether conditions exist to indicate that it is more likely than not that the fair value of a reporting unit is less than its carrying amount. If management concludes, based on its assessment of relevant events, facts and circumstances, that it is more likely than not that a reporting unit’s carrying value is greater than its fair value, then a quantitative analysis will be performed to determine if there is any impairment. We may alternatively elect to initially perform a quantitative assessment and bypass the qualitative assessment.
A goodwill impairment loss is recognized for the amount that the carrying amount of a reporting unit, including goodwill, exceeds its fair value, limited to the total amount of goodwill allocated to that reporting unit. Therefore, if the fair value of a reporting unit exceeds its carrying amount, goodwill of the reporting unit is not impaired. Our reporting units for our goodwill impairment analysis represent components of our business at one level below our operating segments. Our annual impairment testing date is October 1.
Definite-lived intangible assets are amortized on a straight-line basis over their useful lives and reviewed for impairment annually and whenever events or circumstances indicate that the carrying amount of such assets may not be recoverable. Intangible assets include capitalized costs incurred in the development and enhancement of our software products to be sold, leased or marketed. These costs, consisting primarily of salaries and compensation costs (inclusive of share-based compensation) for employees, are expensed as incurred until technological feasibility has been established, after which the costs are capitalized until the product is available for general release to customers.
See Note 2. Business Combinations and Note 8. Goodwill and Intangible Assets for further discussion of goodwill and intangible assets, including those recognized in connection with recent business combinations.
Leases
We determine if an arrangement is or contains a lease at inception of the contract. A contract is or contains a lease if the contract conveys the right to control the use of identified property or equipment for a period of time in exchange for consideration. For our current office and non-office classes of operating leases, we elected the practical expedient to not separate non-lease components from lease components and to, instead, account for each separate lease component and the non-
SoFi Technologies, Inc.
SoFi Technologies, Inc.
Notes to Consolidated Financial Statements (continued)
(In Thousands, Unless Otherwise Stated and Except for Share and Per Share Data)
lease components associated with that lease component as a single lease component. For our current classes of finance leases, we did not elect to apply this practical expedient and, instead, separately identify and measure the non-lease components of the contracts. As an accounting policy election, we apply the short-term lease exemption practical expedient to any lease that, at the commencement date, has a lease term of 12 months or less and does not include an option to purchase the underlying asset that we are reasonably certain to exercise.
Operating leases are presented within operating lease right-of-use assets and operating lease liabilities in the consolidated balance sheets. Finance lease ROU assets are presented within property, equipment and software and finance lease liabilities are presented within accounts payable, accruals and other liabilities in the consolidated balance sheets. Operating and finance lease ROU assets represent our right to use an underlying asset for the lease term and operating and finance lease liabilities represent our obligation to make lease payments arising from the lease. ROU assets and lease liabilities are recognized at the commencement date based on the present value of lease payments over the lease term. As our leases do not provide an implicit borrowing rate, we use our incremental borrowing rate based on the information available at commencement date or modification date, as appropriate, in determining the present value of lease payments.
The operating lease ROU assets are increased by any prepaid lease payments and are reduced by any unamortized lease incentives. Our lease terms may include options to extend or terminate the lease when it is reasonably certain that we will exercise that option. Base rent is typically subject to rent escalations on each annual anniversary from the lease commencement dates. Lease expense for lease payments, including any step rent provisions specified in the lease agreements, is recognized on a straight-line basis over the lease term and is allocated among the components of noninterest expense in the consolidated statements of operations and comprehensive loss. The finance lease ROU assets are depreciated on a straight-line basis over the estimated useful life of seven years. Interest expense on finance leases is recognized for the difference between the present value of the lease liabilities and the scheduled lease payments within interest expense—other in the consolidated statements of operations and comprehensive loss.
When a lease agreement is modified, we determine if the modification grants us the right to use an additional asset that is not included in the original lease contract and if the lease payments increase commensurate with the standalone price for the additional ROU asset. If both conditions are met, we account for the agreement as two separate contracts: (i) the original, unmodified contract and (ii) a separate contract for the additional ROU asset. If both conditions are not met, the modification is not evaluated as a separate contract. Instead, based on the nature of the modification, we: (i) reassess the lease classification on the modification date under the modified terms, and (ii) use the modified lease payments and discount rate to remeasure the lease liability and recognize any difference between the new lease liability and the old lease liability as an adjustment to the ROU asset.
See Note 9. Property, Equipment, Software and Leases for additional information on our leases.
Derivative Financial Instruments
We enter into derivative contracts to manage future loan sale execution risk. We did not elect hedge accounting, as management’s hedging intentions are to economically hedge the risk of unfavorable changes in the fair values of our personal loans, student loans and home loans. Our derivative instruments used to manage future loan sale execution risk include interest rate swaps, interest rate caps and home loan pipeline hedges. We also have IRLCs, interest rate swaps and interest rate caps that were not related to future loan sale execution risk.
Changes in derivative instrument fair values are recognized in earnings as they occur. Depending on the measurement date position, derivative financial instruments are presented within other assets or accounts payable, accruals and other liabilities in the consolidated balance sheets. Our derivative instruments are reported within cash flows from operating activities in the consolidated statements of cash flows.
Certain derivative instruments are subject to enforceable master netting arrangements. Accordingly, we present our net asset or liability position by counterparty in the consolidated balance sheets. Additionally, since our cash collateral balances do not approximate the fair value of the derivative position, we do not offset our right to reclaim cash collateral or obligation to return cash collateral against recognized derivative assets or liabilities.
See Note 14. Derivative Financial Instruments and Note 15. Fair Value Measurements for additional information on our derivative assets and liabilities.
SoFi Technologies, Inc.
SoFi Technologies, Inc.
Notes to Consolidated Financial Statements (continued)
(In Thousands, Unless Otherwise Stated and Except for Share and Per Share Data)
Residual Interests Classified as Debt
Within consolidated securitizations, the residual interests held by third parties are presented as residual interests classified as debt in the consolidated balance sheets. We measure residual interests classified as debt at fair value on a recurring basis. We record subsequent measurement changes in fair value in the period in which the change occurs within noninterest income—loan origination, sales, and securitizations in the consolidated statements of operations and comprehensive loss. We determine the fair value of residual interests classified as debt using a discounted cash flow methodology, while also considering market data as it becomes available.
We recognize interest expense related to residual interests classified as debt over the expected life using the effective yield method, which reflects a portion of the overall fair value adjustment recorded each period on our residual interests classified as debt. Interest expense related to residual interests classified as debt is presented within interest expense—securitizations and warehouses in the consolidated statements of operations and comprehensive loss. On a quarterly basis, we reevaluate the cash flow estimates to determine if a change to the accretable yield is required on a prospective basis.
See Note 15. Fair Value Measurements for the key inputs used in the fair value measurements of residual interests classified as debt.
Safeguarding Asset and Liability
Through our SoFi Invest product (via our wholly-owned subsidiary, SoFi Digital Assets, LLC, a licensed money transmitter), our members were able to invest in digital assets. In the fourth quarter of 2023, we transferred the crypto services provided by SoFi Digital Assets, LLC, and began closing existing digital assets accounts. This process was completed in the first quarter of 2024. Certain accounts were eligible for transfer to a third party digital asset service provider who assumed responsibility for the transferred accounts on a go-forward basis, including the arrangement of custodial services for the transferred digital assets. We have no further ongoing responsibilities for the transferred digital assets subsequent to the executed transfer which took place in December 2023, and derecognized the corresponding digital assets safeguarding liability and safeguarding asset as of the date of the transfer.
For those digital assets that were not eligible to be transferred, we engage third parties to provide custodial services for our digital assets offering, which include holding the cryptographic key information and working to protect the digital assets from loss or theft. The third-party custodians hold digital assets as custodial assets in an account in SoFi’s name for the benefit of our members. We maintain the internal recordkeeping of our members’ digital assets, including the amount and type of digital assets owned by each of our members in the custodial accounts. As of December 31, 2023, we utilized one third-party custodian.
In accordance with Staff Accounting Bulletin No. 121 (“SAB 121”), we recognize a digital assets safeguarding liability within accounts payable, accruals and other liabilities in the consolidated balance sheets reflecting our obligation to safeguard the digital assets held by third-party custodians for the benefit of our members. We also recognize a corresponding safeguarding asset within other assets in the consolidated balance sheets. The safeguarding liability and corresponding safeguarding asset are measured and recorded at the fair value of the digital assets held by the custodians at each reporting date. Subsequent changes to the fair value measurement are reflected as equal and offsetting adjustments to the carrying values of the safeguarding liability and corresponding safeguarding asset. We evaluate any potential loss events, such as theft, loss or destruction of the cryptographic keys, that may affect the measurement of the safeguarding asset, which would be reflected in our results of operations in the period the loss occurs. Measurement changes do not impact the consolidated statements of operations and comprehensive loss unless such a loss event is identified. As of both December 31, 2023 and 2022, we did not identify any loss events.
See Note 15. Fair Value Measurements for additional information on the fair value measurement of the safeguarding liability and corresponding safeguarding asset.
Borrowings and Financing Costs
We borrow from various financial institutions to finance our lending activities. Direct costs incurred in connection with financing, such as banker fees, origination fees and legal fees, are classified as deferred debt issuance costs. We capitalize these costs and report the amounts as a direct deduction from the carrying amount of the total impairment. debt balance. Any difference between the stated principal amount of debt and the amount of cash proceeds received, net of debt issuance costs, is presented as a
SoFi Technologies, Inc.
SoFi Technologies, Inc.
Notes to Consolidated Financial Statements (continued)
(In Thousands, Unless Otherwise Stated and Except for Share and Per Share Data)
discount or premium. The capitalized debt issuance costs and the original issue discount/premium are amortized into interest expense over the expected life of the related financing agreements using the straight-line method for revolving facilities and the effective interest method for securitization debt and our senior convertible notes, as defined and further discussed below. Remaining unamortized fees are expensed immediately upon early extinguishment of the debt. In a debt modification for revolving debt, the initial issuance costs and any additional fees incurred as a result of the modification are deferred over the term of the new agreement, if the borrowing capacity of the revolving facility is increased. In the case that a modification results in a decrease in our borrowing capacity, any fees paid to the creditor and any third-party costs incurred are considered to be associated with the new arrangement and are, therefore, deferred and amortized over the term of the new arrangement. Unamortized deferred costs relating to the old arrangement at the time of the modification are expensed immediately in proportion to the decrease in borrowing capacity of the old arrangement. Any remaining unamortized deferred costs relating to the old arrangement are deferred and amortized over the term of the new arrangement.
We elected the fair value option to measure certain securitization debt, with the intent to mitigate the accounting divergence between debt liabilities measured at historical cost and the corresponding loans securing these financings, which are risk-managed on a fair value basis. For securitization debt carried at fair value on a recurring basis, we record the initial fair value measurement and subsequent measurement changes in fair value in the period in which the changes occur within noninterest income—loan origination, sales, and securitizations in the consolidated statements of operations and comprehensive loss. We determined the fair value of the applicable securitization debt using a discounted cash flow methodology, while also considering market data as it becomes available. The key inputs to the calculation include the underlying contractual coupons, terms, discount rate and expectations for defaults and prepayments.
Convertible Senior Notes
In October 2021, we issued $1.2 billion aggregate principal amount of convertible senior notes due 2026 (the “convertible notes”). The convertible notes will mature on October 15, 2026, unless earlier repurchased, redeemed or converted. We will settle conversions by paying or delivering, at our election, cash, shares of our common stock or a combination of cash and shares of our common stock, based on the applicable conversion rate(s). The convertible notes will also be redeemable, in whole or in part, at our option at any time, and from time to time, on or after October 15, 2024 through the 30th scheduled trading day immediately before the maturity date, at a cash redemption price equal to the principal amount of the convertible notes to be redeemed, plus accrued interest, if any, thereon to, but excluding, the redemption date, but only if certain liquidity conditions described in the indenture are satisfied and certain conditions are met with respect to the last reported sale price per share of our common stock prior to conversion. In December 2023, we entered into repurchase agreements to repurchase $88.0 million aggregate principal amount of the convertible notes. See Note 12. Debt for more detailed disclosure of the term and features of the convertible notes.
We elected to evaluate each embedded feature of the arrangement individually. We concluded that each of the conversion rights, optional redemption rights, fundamental change make-whole provision and repurchase rights did not require bifurcation as derivative instruments, which we reevaluate each reporting period. The additional interest and special interest that accrue on the notes in the event of our failure to comply with certain registration or reporting requirements are required to be bifurcated from the host contract, as the reporting requirement triggering event is not clearly and closely related to the host convertible debt contract, and therefore we measure the contingent interest feature at fair value each reporting period. The value was determined to be immaterial; therefore, we accounted for the convertible notes wholly as debt, which was recognized on the settlement date. Accordingly, we allocated all debt issuance costs to the debt instrument on the basis of materiality.
In connection with the pricing of the convertible notes, we entered into privately negotiated capped call transactions with certain financial institutions, as defined and further discussed below.
Redeemable Preferred Stock
Series 1 Redeemable Preferred Stock (as defined in Note 13. Equity) is classified in temporary equity, as it is not fully controlled by SoFi. See Note 13. Equity for additional information.
Foreign Currency Translation Adjustments
We revalue assets, liabilities, income and expense denominated in non-United States currencies into United States dollars using applicable exchange rates. For foreign subsidiaries in which the functional currency is the subsidiary’s local
SoFi Technologies, Inc.
SoFi Technologies, Inc.
Notes to Consolidated Financial Statements (continued)
(In Thousands, Unless Otherwise Stated and Except for Share and Per Share Data)
currency, gains and losses relating to foreign currency translation adjustments are included in accumulated other comprehensive income (loss) in our consolidated balance sheets. For foreign subsidiaries in which the functional currency is the United States Dollar, gains and losses relating to foreign currency transaction adjustments are included within earnings in the consolidated statements of operations and comprehensive loss. Due to the highly inflationary economic environment in Argentina, we use the United States Dollar as the functional currency of our Argentinian operations. Our activities in Argentina are related to our Technology Platform segment and commenced in the first quarter of 2022 with the Technisys Merger.
Capped Call Transactions
We entered into privately negotiated capped call transactions (the “Capped Call Transactions”) with certain financial institutions (the “Capped Call Counterparties”). The Capped Call Transactions initially cover, subject to customary anti-dilution adjustments, the number of shares of our common stock that initially underlie the convertible notes. The Capped Call Transactions are net purchased call options on our own common stock. The Capped Call Transactions are separate transactions entered into by the Company with each of the Capped Call Counterparties, are not part of the terms of the convertible notes, and do not affect any holder’s rights under the convertible notes. Holders of the convertible notes do not have any rights with respect to the Capped Call Transactions. As the Capped Call Transactions are legally detachable and separately exercisable from the convertible notes, they were evaluated as freestanding instruments. We concluded that the Capped Call Transactions meet the scope exceptions for derivative instruments, and as such, the Capped Call Transactions meet the criteria for classification in equity and are included as a reduction to additional paid-in capital.
See Note 13. Equity for additional information on the Capped Call Transactions.
Interest Income
We record interest income associated with loans measured at fair value over the term of the underlying loans using the effective interest method on unpaid loan principal amounts, which is presented within interest income—loans and securitizations in the consolidated statements of operations and comprehensive loss. We also record accrued interest income associated with loans measured at amortized cost within interest income—loans and securitizations. We stop accruing interest and reverse all accrued but unpaid interest at the time a loan charges off. Loans are returned to accrual status if the loans are brought to nondelinquent status or have performed in accordance with the contractual terms for a reasonable period of time and, in management’s judgment, will continue to make scheduled periodic principal and interest payments.
Other interest income is primarily earned on our bank balances.
Loan Origination and Sales Activities
As part of our loan sale agreements, we may retain the rights to service sold loans. We calculate a gain or loss on the sale based on the sum of the proceeds from the sale and any servicing asset or liability recognized, less the carrying value of the loans sold. Our gain or loss calculation is also inclusive of repurchase liabilities recognized at the time of sale, and is recorded within noninterest income—loan origination, sales, and securitizations in the consolidated statements of operations and comprehensive loss.
Loan Commitments
We offer a program whereby applicants can lock in an interest rate on an in-school loan to be funded at a later time. Applicants can exit the loan origination process up until the loan funding date. SoFi is obligated to fund the loan at the committed terms on the disbursement date if the borrower does not cancel prior to the loan funding date. The student loan commitments meet the scope exception for issuers of commitments to originate non-mortgage loans. As the writer of the commitments, we elected the fair value option to measure our unfunded student loan commitments to align with the measurement methodology of our originated student loans. As such, our student loan commitments are carried at fair value on a recurring basis. Depending on the measurement date position, student loan commitments are presented within other assets or accounts payable, accruals and other liabilities in the consolidated balance sheets. We record the initial fair value measurement and subsequent measurement changes in fair value in the period in which the changes occur within noninterest income—loan origination, sales, and securitizations in the consolidated statements of operations and comprehensive loss.
Loan commitments also include IRLCs, whereby we commit to interest rate terms prior to completing the origination process for home loans. IRLCs are derivative instruments that are measured at fair value on a recurring basis. Changes in fair
SoFi Technologies, Inc.
SoFi Technologies, Inc.
Notes to Consolidated Financial Statements (continued)
(In Thousands, Unless Otherwise Stated and Except for Share and Per Share Data)
value are recognized within noninterest income—loan origination, sales, and securitizations in the consolidated statements of operations and comprehensive loss. See “Derivative Financial Instruments” in this Note for additional information on our derivative instruments.
See Note 15. Fair Value Measurements for the key inputs used in the fair value measurements of our loan commitments.
Revenue Recognition
In each of our revenue arrangements, revenue is recognized when control of the promised goods or services is transferred to the customer in an amount that reflects our expected consideration in exchange for those goods or services. Our primary revenue streams for the periods presented include the following:
•Technology Products and Solutions: We earn fees for providing an integrated platform as a service for financial and non-financial institutions.
•Referrals: We earn specified referral fees in connection with referral activities we facilitate through our platform, such as referrals to third-party partners that offer services to end users who do not use one of our product offerings and referrals of pre-qualified borrowers to a third-party partner who separately contracts with a loan originator.
•Interchange: We earn interchange fees from debit and credit cardholder transactions conducted through payment networks.
•Brokerage: We earn fees in connection with facilitating investment-related transactions through our platform, such as brokerage transactions, share lending and exchange conversion.
See Note 3. Revenue for additional information on our revenue recognition policy within each revenue stream.
Advertising, Sales and Marketing
Advertising production costs and advertising communication costs, as well as amounts paid to various affiliates to market our products, are included within noninterest expense—sales and marketing in the consolidated statements of operations and comprehensive loss. Advertising costs are expensed either as incurred or when the advertising takes place, depending on the nature of the advertising activity. For the years ended December 31, 2023, 2022 and 2021, advertising totaled $284,176, $256,125 and $183,106, respectively.
Expenses incurred by us related to member acquisition, including brand development, business development and direct member marketing expenses, are also presented within noninterest expense—sales and marketing in the consolidated statements of operations and comprehensive loss.
Technology and Product Development
Expenses incurred by us related to technology, product design and implementation, which includes compensation and benefits, are classified as noninterest expense—technology and product development in the consolidated statements of operations and comprehensive loss.
Loss Contingencies
Loss contingencies, including claims and legal actions arising in the ordinary course of business, are recorded in accounts payable, accruals and other liabilities in the consolidated balance sheets. Such liabilities and associated expenses are recorded when the likelihood of loss is probable and an amount or range of loss can be reasonably estimated. Such estimates are based on the best information available at the time. As additional information becomes available, we reassess the potential liability and record an estimate in the period in which the adjustment is probable and an amount or range can be reasonably estimated. Due to the inherent uncertainties of loss contingencies, estimates may be different from the actual outcomes. With respect to legal proceedings, we recognize legal fees as they are incurred within noninterest expense—general and administrative in the consolidated statements of operations and comprehensive loss. See Note 18. Commitments, Guarantees, Concentrations and Contingencies for discussion of contingent matters.
SoFi Technologies, Inc.
SoFi Technologies, Inc.
Notes to Consolidated Financial Statements (continued)
(In Thousands, Unless Otherwise Stated and Except for Share and Per Share Data)
Restructuring
During the year ended December 31, 2023, we recognized restructuring charges of $12,749 within the following categories of expenses within noninterest expense: (i) technology and product development, (ii) sales and marketing, (iii) cost of operations, and (iv) general and administrative in the consolidated statements of operations and comprehensive loss associated with a reduction in headcount in the Technology Platform segment in the first quarter of 2023, as well as expenses in the fourth quarter of 2023 related to a reduction in headcount across the Financial Services, Lending and corporate functions, which primarily included employee-related wages, benefits and severance.
Compensation and Benefits
Total compensation and benefits, inclusive of share-based compensation expense, was $894,720, $830,298 and $608,505 for the years ended December 31, 2023, 2022 and 2021, respectively. Compensation and benefits expenses are presented within the following categories of expenses within noninterest expense: (i) technology and product development, (ii) sales and marketing, (iii) cost of operations, and (iv) general and administrative in the consolidated statements of operations and comprehensive loss.
Share-Based Compensation
Share-based compensation made to employees and non-employees, including stock options, RSUs and PSUs, is measured based on the grant date fair value of the awards and is recognized as compensation expense typically on a straight-line basis over the period during which the share-based award holder is required to perform services in exchange for the award (the vesting period) for stock options and RSUs and on an accelerated attribution basis for each vesting tranche over the respective derived service period for PSUs. Share-based compensation expense is allocated among the following categories of expenses within noninterest expense: (i) technology and product development, (ii) sales and marketing, (iii) cost of operations, and (iv) general and administrative in the consolidated statements of operations and comprehensive loss. We used the Black-Scholes Option Pricing Model (the “Black-Scholes Model”) to estimate the grant-date fair value of stock options. RSUs are measured based on the fair values of the underlying stock on the dates of grant. We use a Monte Carlo simulation model to estimate the grant-date fair value of PSUs. We recognize forfeitures as incurred and, therefore, reverse previously recognized share-based compensation expense at the time of forfeiture. See Note 16. Share-Based Compensation for further discussion of share-based compensation.
Income Taxes
We recognize deferred tax assets and liabilities for the expected future tax consequences of temporary differences between the financial reporting and tax basis of assets and liabilities, as well as for operating loss and tax credit carryforwards. Deferred tax assets and liabilities are measured using the tax rates that are expected to apply to taxable income for the years in which those tax assets and liabilities are expected to be realized or settled. In assessing the realizability of deferred tax assets, management reviews all available positive and negative evidence. Valuation allowances are recorded to reduce deferred tax assets to the amount we believe is more likely than not to be realized.
The tax effects from an uncertain tax position can be recognized in the financial statements only if the tax position would more likely than not be upheld on examination by the taxing authorities based on the merits of the tax position. Management is required to analyze all open tax years, as defined by the statute of limitations, for all jurisdictions. We accrue tax penalties and interest, if any, as incurred and recognize them within income tax (expense) benefit in the consolidated statements of operations and comprehensive loss.
Related Parties
We define related parties as members of our Board of Directors, entity affiliates, executive officers and principal owners of our outstanding stock and members of their immediate families. Related parties also include any other person or entity with significant influence over our management or operations.
SoFi Technologies, Inc.
SoFi Technologies, Inc.
Notes to Consolidated Financial Statements (continued)
(In Thousands, Unless Otherwise Stated and Except for Share and Per Share Data)
Recently Adopted Accounting Standards
Troubled Debt Restructurings and Vintage Disclosures
In March 2022, the FASB issued ASU 2022-02, Financial Instruments — Credit Losses (Topic 326): Troubled Debt Restructurings and Vintage Disclosures. The ASU addresses two topics: (i) TDR by creditors, and (ii) vintage disclosures for gross write offs. Under the TDR provisions, the ASU eliminates the recognition and measurement guidance under ASC 310-40, Receivables — Troubled Debt Restructurings by Creditors, and instead requires that an entity evaluate whether the modification represents a new loan or a continuation of an existing loan, consistent with the accounting for other loan modifications. Additionally, the ASU enhances existing disclosure requirements around TDRs and introduces new requirements related to certain modifications of receivables made to borrowers experiencing financial difficulty. Under the vintage disclosure provisions, the ASU requires the entity to disclose current period gross write offs by year of origination for financing receivables and net investments in leases within the scope of ASC 326-20, Financial Instruments — Credit Losses — Measured at Amortized Cost. The standard should be applied prospectively; however, for the TDR provisions, an entity has the option to apply a modified retrospective transition method. We adopted the standard effective January 1, 2023. The adoption of this standard did not have a material impact on our consolidated financial statements.
Recent Accounting Standards Issued, But Not Yet Adopted
Improvements to Reportable Segment Disclosures
In November 2023, the FASB issued ASU 2023-07, Segment Reporting (Topic 280) — Improvements to Reportable Segment Disclosures. The ASU improves reportable segment disclosure requirements, primarily through enhanced disclosures about significant segment expenses. The standard is effective for fiscal years beginning after December 15, 2023, and interim periods within fiscal years beginning after December 15, 2024. The standard should be applied retrospectively to all prior periods presented in the financial statements. We are currently evaluating the impact of this amendment on our consolidated financial statements.
Improvements to Income Tax Disclosures
In December 2023, the FASB issued ASU 2023-09, Income Taxes (Topic 740) — Improvements to Income Tax Disclosures. The ASU improves income tax disclosures primarily related to enhancements of the rate reconciliation and income taxes paid information. The standard is effective for annual periods beginning after December 15, 2024. The standard should be applied on a prospective basis with the option to apply the standard retrospectively. We are currently evaluating the impact of this amendment on our consolidated financial statements.
Note 2. Business Combinations
Merger with Social Capital Hedosophia Holdings Corp. V
On January 7, 2021, Social Finance entered into an agreement by and among Social Finance, SCH, a Cayman Islands exempted company limited by shares, and Plutus Merger Sub Inc., a Delaware corporation and a wholly owned subsidiary of SCH (“Merger Sub”), pursuant to which Merger Sub merged with and into Social Finance. Upon the Closing on May 28, 2021, the separate corporate existence of Merger Sub ceased and Social Finance survived the merger and became a wholly-owned subsidiary of SCH. On May 28, 2021, SCH also filed a notice of deregistration with the Cayman Islands Registrar of Companies, together with the necessary accompanying documents, and filed a certificate of incorporation and a certificate of corporate domestication with the Secretary of State of the State of Delaware, under which SCH was domesticated as a Delaware corporation, changing its name from “Social Capital Hedosophia Holdings Corp. V” to “SoFi Technologies, Inc.” These transactions are collectively referred to as the “Business Combination”.
The Business Combination was accounted for as a reverse recapitalization whereby SCH was determined to be the accounting acquiree and Social Finance to be the accounting acquirer. This accounting treatment was the equivalent of Social Finance issuing stock for the net assets of SCH, accompanied by a recapitalization whereby no goodwill or other intangible assets were recorded. Operations prior to the Business Combination are those of Social Finance. At the Closing, we received gross cash consideration of $764.8 million as a result of the reverse recapitalization, which was then reduced by: (i) a redemption of redeemable common stock (classified as temporary equity) of $150.0 million, (ii) a special payment made to our
SoFi Technologies, Inc.
SoFi Technologies, Inc.
Notes to Consolidated Financial Statements (continued)
(In Thousands, Unless Otherwise Stated and Except for Share and Per Share Data)
Series 1 preferred stockholders of $21.2 million (which was expensed as incurred), and (iii) our equity issuance costs of $27.5 million, consisting of advisory, legal, share registration and other professional fees, which were recorded within additional paid-in capital as a reduction of proceeds.
In connection with the Business Combination, SCH entered into subscription agreements with certain investors (the “Third Party PIPE Investors”), whereby it issued 122,500,000 shares of common stock at $10.00 per share (“PIPE Shares”) for an aggregate purchase price of $1.225 billion (“PIPE Investment”), which closed simultaneously with the consummation of the Business Combination. Upon the Closing, the PIPE Shares were automatically converted into shares of SoFi Technologies common stock on a one-for-one basis.
Upon the Closing, holders of Social Finance common stock received shares of SoFi Technologies common stock in an amount determined by application of the exchange ratio of 1.7428 (“Exchange Ratio”), which was based on Social Finance’s implied price per share prior to the Business Combination. Additionally, holders of Social Finance preferred stock (with the exception of the Series 1 preferred stockholders) received shares of SoFi Technologies common stock in amounts determined by application of either the Exchange Ratio or a multiplier of the Exchange Ratio, as provided by the Agreement.
Acquisition of Golden Pacific Bancorp, Inc.
On February 2, 2022, we acquired Golden Pacific, pursuant to an Agreement and Plan of Merger dated as of March 8, 2021 by and among the Company, a wholly-owned subsidiary of the Company, and Golden Pacific. In the business combination, we acquired all of the outstanding equity interests in Golden Pacific for total cash purchase consideration of $22.3 million (the “Bank Merger”). The acquisition was not determined to be a significant acquisition. After closing the Bank Merger, we became a bank holding company and Golden Pacific began operating as SoFi Bank. We are duly registered as a bank holding company with the Federal Reserve. SoFi Bank is a national banking association whose primary federal regulator is the OCC. Deposit accounts of SoFi Bank are insured by the FDIC through the Deposit Insurance Fund to the fullest extent permitted by law.
The closing of the Bank Merger was subject to regulatory approval. On January 18, 2022, we received approval from the Federal Reserve of our application to become a bank holding company under the Bank Holding Company Act, and we received conditional approval from the OCC to close the Bank Merger. The OCC also approved our application to change the composition of Golden Pacific’s assets in connection with the Bank Merger. The OCC conditional approval imposed a number of conditions, including that SoFi Bank have initial paid-in capital of no less than $750 million and adhere to an operating agreement. Golden Pacific’s community bank business continues to operate as a division of SoFi Bank.
A portion of the total cash purchase consideration ($0.6 million) was held back by the Company to satisfy any indemnification or certain other obligations (“Holdback Amount”), as certain legal proceedings with which Golden Pacific is involved as a plaintiff were not resolved at the time the Bank Merger closed. During 2022, we incurred costs associated with the litigation involving Golden Pacific as a plaintiff in excess of the Holdback Amount. Therefore, none of the Holdback Amount will be released to the Golden Pacific shareholders. Additionally, we held back a $3.3 million payable to a dissenting Golden Pacific shareholder pending resolution of the shareholder’s dissenter’s rights appraisal claim. During the fourth quarter of 2023, the appraisal claim was settled and payment was released.
Acquisition of Technisys S.A.
On March 3, 2022, we acquired Technisys S.A., a Luxembourg société anonyme, (“Technisys”), pursuant to an Agreement and Plan of Merger dated as of February 19, 2022 and amended as of March 3, 2022, by and among the Company, Technisys, Atom New Delaware, Inc., a Delaware corporation and a wholly owned subsidiary of Atom, and Atom Merger Sub Corporation, a Delaware corporation and wholly owned subsidiary of SoFi Technologies (the “Technisys Merger”). In the business combination, we acquired all of the outstanding equity interests in Technisys for a preliminary purchase consideration of $915.4 million. During the third quarter of 2022, we finalized the closing net working capital calculation specified in the merger agreement, which resulted in a reduction to the equity consideration of 155,794 shares, representing an adjustment to the total purchase consideration of $1,665, and a corresponding reduction to the carrying value of recognized goodwill. The remaining 442,274 shares that were held in escrow associated with the working capital calculation were released to the former Technisys shareholders. The finalized closing net working capital calculation did not impact the estimated fair values of the assets acquired and liabilities assumed in conjunction with the transaction.
SoFi Technologies, Inc.
SoFi Technologies, Inc.
Notes to Consolidated Financial Statements (continued)
(In Thousands, Unless Otherwise Stated and Except for Share and Per Share Data)
The following table presents the components of the total purchase consideration to acquire Technisys as of December 31, 2022:
| | | | | |
Fair value of common stock issued(1) | $ | 873,377 | |
| Amounts payable to settle vested employee performance awards | 37,297 | |
Fair value of awards assumed(2) | 2,855 | |
| Settlement of pre-combination transactions between acquirer and acquiree | 235 | |
| Total purchase consideration | $ | 913,764 | |
___________________
(1) Reflects the shares of SoFi common stock issued in the acquisition of 81,700,318, multiplied by the closing stock price of SoFi common stock on the closing date of the Technisys Merger. Additionally, these shares are inclusive of 6,305,595 shares that were held in escrow.
(2) We contemporaneously converted outstanding performance awards into RSUs to acquire common stock of SoFi (“Replacement Awards”). The fair value of awards assumed in the purchase consideration was based on the closing stock price of SoFi common stock on the closing date of the Technisys Merger.
We settled vested employee performance awards, which were a component of the purchase consideration above, with payments during the years ended December 31, 2023 and 2022 of $19,656 and $17,641, respectively. During the year ended December 31, 2023, we released 6,259,736 escrow shares during the second and fourth quarters of 2023. The remaining 45,859 shares continue to be held in escrow pending resolution of outstanding indemnification claims by SoFi.
The following unaudited supplemental pro forma financial information presents the Company’s consolidated results of operations as if the business combination had occurred on January 1, 2020:
| | | | | | | | | | | | | | | | |
| | Year Ended December 31, |
| | 2022 | | 2021 | | |
| Total net revenue | | $ | 1,584,439 | | | $ | 1,055,219 | | | |
| Net loss | | (311,512) | | | (512,785) | | | |
The unaudited supplemental pro forma financial information is presented for comparative purposes only and is not necessarily indicative of the actual results of operations that would have been achieved, nor is it indicative of future results of operations. The unaudited supplemental pro forma financial information reflects pro forma adjustments that give effect to applying the Company’s accounting policies and certain events the Company believes to be directly attributable to the acquisition. The pro forma adjustments primarily include:
•incremental straight-line amortization expense associated with acquired intangible assets;
•an adjustment to reflect post-combination share-based compensation expense associated with the Replacement Awards as if the conversion had occurred on January 1, 2020;
•an adjustment to reflect acquisition-related costs for both parties as if they were incurred during the earliest period presented; and
•the related income tax effects, at the statutory tax rate applicable for each period, of the pro forma adjustments noted above.
The unaudited supplemental pro forma financial information does not give effect to any anticipated cost savings, operating efficiencies or other synergies that may be associated with the acquisition, or any estimated costs that have been or will be incurred by the Company to integrate the assets and operations of Technisys.
Acquisition of Wyndham Capital Mortgage
On April 3, 2023, we acquired all of the outstanding equity interests in Wyndham for cash consideration. With the acquisition of Wyndham, a fintech mortgage lender, we broadened our suite of home loan products and now manage the technology for a digitized mortgage experience. The acquisition is being accounted for as a business combination. The purchase consideration is being allocated to the tangible and intangible assets acquired and liabilities assumed based on the estimated fair values as of the acquisition date. The excess of the total purchase consideration over the fair value of the net assets acquired is allocated to goodwill, which is expected to be deductible for tax purposes. The fair value estimates are subject to change for up
SoFi Technologies, Inc.
SoFi Technologies, Inc.
Notes to Consolidated Financial Statements (continued)
(In Thousands, Unless Otherwise Stated and Except for Share and Per Share Data)
to one year after the acquisition date as additional information becomes available. The acquisition was not determined to be a significant acquisition.
In each of our revenue arrangements, revenue is recognized when control of the promised goods or services is transferred to the customer in an amount that reflects our expected consideration in exchange for those goods or services.
Technology Products and Solutions
We earn fees for providing an integrated platform as a service for financial and non-financial institutions. Within our technology products and solutions fee arrangements, certain contracts contain a provision for a fixed, upfront implementation fee related to setup activities, which represents an advance payment for future technology platform services provided over the contract term. These implementation fees are recognized ratably over the contract life.
Commencing in March 2022 with the Technisys Merger, we earn subscription and service fees for providing software licenses and associated services, including implementation and maintenance. We charge a recurring subscription fee for the software license and related maintenance services. Other software-related services are billed on a periodic basis as the services are provided. Certain arrangements for software and related services contain a provision for a fixed upfront payment.
We recognize revenue related to software licenses at a point in time upon delivery of the license and the close of the user-acceptance testing period. When implementation services are distinct, we recognize revenue over time during the implementation period. We recognize maintenance services ratably over the contractual maintenance term. If a fixed upfront payment provides a material right to the customer, we recognize revenue associated with the material right over the period of benefit associated with the right to subscribe or renew a subscription, which is typically the product life.
We allocate fees charged for software and related services to our performance obligations on the basis of the relative standalone selling price. The standalone selling prices either represent the prices at which we separately sell each license or service or are estimated using available information, such as market conditions and internal pricing policies. The standalone selling price of the software license and maintenance are determined based on the complexity and size of the license.
Payments to customers: We may provide incentives to our technology platform customers, which may be payable up front or applied to future or past technology products and solutions fees. Evaluating whether such incentives are payments to a customer requires judgment. When we determine that an incentive is consideration payable to a customer, the incentive is recorded as a reduction of revenue. Incentives that represent consideration payable to a customer may also contain variable consideration. Therefore, such incentives are constraints on the revenue expected to be realized. Upfront customer incentives are recorded as prepaid assets and presented within other assets in the consolidated balance sheets, and are applied against revenue in the period such incentives are earned by the customer. Any incentive in excess of cumulative revenue is expensed as a contract cost.
Referrals
We earn specified referral fees in connection with certain referral activities we facilitate through our platform. In one type of referral arrangement, we refer end users through our platform to third-party enterprise partners. Our referral fee is calculated as either a fixed price per successful referral or a percentage of the transaction volume between the enterprise partners and referred consumers. In another type of referral arrangement, we earn referral fulfillment fees for providing pre-qualified borrower referrals to a third-party partner who separately contracts with a loan originator. Our referral fees are based on the referred loan amount, subject to a referral fulfillment fee penalty if a loan is determined to be ineligible and becomes a charged-off loan as defined in the contract. We recognize revenue for each originated loan, less the estimated referral fulfillment fee penalty. The estimated referral fulfillment fee penalty was immaterial as of December 31, 2023 and 2022.
Interchange
We earn interchange fees from debit and credit cardholder transactions conducted through payment networks. Interchange fees from cardholder transactions represent a percentage of the underlying transaction value and are recognized
SoFi Technologies, Inc.
SoFi Technologies, Inc.
Notes to Consolidated Financial Statements (continued)
(In Thousands, Unless Otherwise Stated and Except for Share and Per Share Data)
daily, concurrently with the transaction processing services provided to the cardholder. Interchange is presented net of cardholder rewards associated with card transactions.
Brokerage
We earn fees in connection with facilitating investment-related transactions through our platform, which we refer to as brokerage revenue. Our brokerage revenue performance obligation is generally completely satisfied upon the completion of an investment-related transaction. In general, we act as the agent in these arrangements as we do not oversee the execution of the transactions and ultimately lack the requisite control.
Disaggregated Revenue
The table below presents revenue from contracts with customers disaggregated by type of service, which best depicts how the revenue and cash flows are affected by economic factors, and by the reportable segment to which each revenue stream relates, as well as a reconciliation of total revenue from contracts with customers to total noninterest income. Revenue from contracts with customers is presented within noninterest income—technology products and solutions and noninterest income—other in the consolidated statements of operations and comprehensive loss. There were no revenues from contracts with customers attributable to our Lending segment for any of the years presented.
| | | | | | | | | | | | | | | | | |
| Year Ended December 31, |
| 2023 | | 2022 | | 2021 |
| Financial Services | | | | | |
| Referrals | $ | 38,443 | | | $ | 36,052 | | | $ | 15,750 | |
| Interchange | 35,247 | | | 17,391 | | | 10,642 | |
| Brokerage | 21,127 | | | 15,446 | | | 22,733 | |
Other(1) | 2,647 | | | 2,245 | | | 5,541 | |
| Total financial services | $ | 97,464 | | | $ | 71,134 | | | $ | 54,666 | |
Technology Platform(2) | | | | | |
| Technology services | 319,845 | | | 299,379 | | | 191,847 | |
Other(1) | 4,145 | | | 6,583 | | | 1,205 | |
| Total technology platform | 323,990 | | | 305,962 | | | 193,052 | |
| Total revenue from contracts with customers | 421,454 | | | 377,096 | | | 247,718 | |
| Other Sources of Revenue | | | | | |
| | | | | |
| | | | | |
| Loan origination, sales, and securitizations | 371,812 | | | 565,372 | | | 482,764 | |
| Servicing | 37,328 | | | 43,547 | | | (2,281) | |
| Other | 30,455 | | | 3,424 | | | 4,427 | |
| Total other sources of revenue | $ | 439,595 | | | $ | 612,343 | | | $ | 484,910 | |
| Total noninterest income | $ | 861,049 | | | $ | 989,439 | | | $ | 732,628 | |
_____________________(1) Financial Services includes revenues from enterprise services and equity capital markets services. Technology Platform includes revenues from software licenses and associated services, and payment network fees for serving as a transaction card program manager for enterprise customers that are the program marketers for separate card programs.
(2) Related to these technology products and solutions arrangements, we had deferred revenue of $5,718 and $10,028 as of December 31, 2023 and 2022, respectively, which are presented within accounts payable, accruals and other liabilities in the consolidated balance sheets. During the years ended December 31, 2023, 2022 and 2021, we recognized revenue of $8,327, $7,773 and $685, respectively, associated with deferred revenue within noninterest income—technology products and solutions in the consolidated statements of operations and comprehensive loss.
Contract Balances
As of December 31, 2023 and 2022, accounts receivable, net associated with revenue from contracts with customers was $60,466 and $61,226, respectively, which were reported within other assets in the consolidated balance sheets.
SoFi Technologies, Inc.
SoFi Technologies, Inc.
Notes to Consolidated Financial Statements (continued)
(In Thousands, Unless Otherwise Stated and Except for Share and Per Share Data)
Note 4. Loans
As of December 31, 2023, our loan portfolio consisted of (i) loans held for sale, including personal loans and home loans, which are measured at fair value under the fair value option, (ii) loans held for investment, including student loans, which are measured at fair value under the fair value option, and (iii) loans held for investment, including senior secured loans, credit cards, and commercial and consumer banking loans, which are measured at amortized cost. Below is a disaggregated presentation of our loans, inclusive of fair market value adjustments and accrued interest income and net of the allowance for credit losses, on impaired investmentsas applicable:
| | | | | | | | | | | |
| December 31, |
| 2023 | | 2022 |
| Loans held for sale | | | |
Personal loans(1) | $ | 15,330,573 | | | $ | 8,610,434 | |
Student loans(2) | — | | | 4,877,177 | |
| Home loans | 66,198 | | | 69,463 | |
| Total loans held for sale, at fair value | 15,396,771 | | | 13,557,074 | |
Loans held for investment(3) | | | |
Student loans(4) | 6,725,484 | | | — | |
| Total loans held for investment, at fair value | 6,725,484 | | | — | |
| Senior secured loans | 446,463 | | | — | |
| Credit card | 272,628 | | | 209,164 | |
| Commercial and consumer banking: | | | |
| Commercial real estate | 106,326 | | | 88,652 | |
| Commercial and industrial | 6,075 | | | 7,179 | |
| Residential real estate and other consumer | 4,667 | | | 2,962 | |
| Total commercial and consumer banking | 117,068 | | | 98,793 | |
Total loans held for investment, at amortized cost(3) | 836,159 | | | 307,957 | |
| Total loans held for investment | 7,561,643 | | | 307,957 | |
| Total loans | $ | 22,958,414 | | | $ | 13,865,031 | |
_____________________
(1) Includes $502,757 and $663,004 of personal loans in AFS debt securitiesconsolidated VIEs as of December 31, 2021.2023 and 2022, respectively.
(2) Includes $268,697 of student loans in consolidated VIEs as of December 31, 2022.
(3) See Note 1. Organization, Summary of Significant Accounting Policies and New Accounting Standards and Note 5. Allowance for Credit Losses for additional information on our loans at amortized cost as it pertains to the allowance for credit losses.
(4) As of December 31, 2023, includes $2,459,103 of student loans covered by financial guarantees, and $221,461 of student loans in consolidated VIEs.
SoFi Technologies, Inc.
SoFi Technologies, Inc.
Notes to Consolidated Financial Statements (continued)
(In Thousands, Unless Otherwise Stated and Except for Share and Per Share Data)
Loans Measured at Fair Value
The following table summarizes the aggregate fair value of our loans for which we elected the fair value option. See Note 15. Fair Value Measurements for the assumptions used in our fair value model.
| | | | | | | | | | | | | | | | | | | | | | | |
| Personal Loans | | Student Loans | | Home Loans | | Total |
| December 31, 2023 | | | | | | | |
| Unpaid principal | $ | 14,498,629 | | | $ | 6,445,586 | | | $ | 67,406 | | | $ | 21,011,621 | |
| Accumulated interest | 114,541 | | | 34,357 | | | 92 | | | 148,990 | |
| Cumulative fair value adjustments | 717,403 | | | 245,541 | | | (1,300) | | | 961,644 | |
Total fair value of loans(1) | $ | 15,330,573 | | | $ | 6,725,484 | | | $ | 66,198 | | | $ | 22,122,255 | |
| December 31, 2022 | | | | | | | |
| Unpaid principal | $ | 8,283,400 | | | $ | 4,794,517 | | | $ | 77,705 | | | $ | 13,155,622 | |
| Accumulated interest | 55,673 | | | 19,433 | | | 151 | | | 75,257 | |
| Cumulative fair value adjustments | 271,361 | | | 63,227 | | | (8,393) | | | 326,195 | |
Total fair value of loans(1) | $ | 8,610,434 | | | $ | 4,877,177 | | | $ | 69,463 | | | $ | 13,557,074 | |
_____________________(1) Each component of the fair value of loans is impacted by charge-offs during the period. Our fair value assumption for annual default rate incorporates fair value markdowns on loans beginning when they are 10 days or more delinquent, with additional markdowns at 30, 60 and 90 days past due.
The following table summarizes the aggregate fair value of loans 90 days or more delinquent. As delinquent personal loans and student loans are charged off after 120 days of delinquency, amounts presented below represent the fair value of loans that are 90 to 120 days delinquent.
| | | | | | | | | | | | | | | | | | | | | | | |
| Personal Loans | | Student Loans | | Home Loans | | Total |
| December 31, 2023 | | | | | | | |
| Unpaid principal balance | $ | 81,591 | | | $ | 8,446 | | | $ | 495 | | | $ | 90,532 | |
| Accumulated interest | 4,023 | | | 187 | | | 6 | | | 4,216 | |
Cumulative fair value adjustments(1) | (70,191) | | | (5,021) | | | (248) | | | (75,460) | |
| Fair value of loans 90 days or more delinquent | $ | 15,423 | | | $ | 3,612 | | | $ | 253 | | | $ | 19,288 | |
| December 31, 2022 | | | | | | | |
| Unpaid principal balance | $ | 27,989 | | | $ | 6,435 | | | $ | — | | | $ | 34,424 | |
| Accumulated interest | 1,207 | | | 304 | | | — | | | 1,511 | |
Cumulative fair value adjustments(1) | (25,022) | | | (3,332) | | | — | | | (28,354) | |
| Fair value of loans 90 days or more delinquent | $ | 4,174 | | | $ | 3,407 | | | $ | — | | | $ | 7,581 | |
__________________
(1) Our fair value assumption for annual default rate incorporates fair value markdowns on loans beginning when they are 10 days or more delinquent, with additional markdowns at 30, 60 and 90 days past due.
Transfers of Financial Assets
We regularly transfer financial assets and account for such transfers as either sales or secured borrowings depending on the facts and circumstances of the transfer. When a transfer of financial assets qualifies as a sale, in many instances we have continuing involvement as the servicer of those financial assets. As we expect the benefits of servicing to be more than just adequate, we recognize a servicing asset. Further, in the case of securitization-related transfers that qualify as sales, we have additional continuing involvement as an investor, albeit at insignificant levels relative to the expected gains and losses of the securitization. In instances where a transfer is accounted for as a secured borrowing, we perform servicing (but we do not recognize a servicing asset) and typically maintain a significant investment relative to the expected gains and losses of the securitization. In whole loan sales, we do not have a residual financial interest in the loans, nor do we have any other power over the loans that would constrain us from recognizing a sale. Additionally, we generally have no repurchase requirements related to transfers of personal loans, student loans and non-GSE home loans other than standard origination representations and warranties, for which we record a liability based on expected repurchase obligations. For GSE home loans, we have customary
SoFi Technologies, Inc.
SoFi Technologies, Inc.
Notes to Consolidated Financial Statements (continued)
(In Thousands, Unless Otherwise Stated and Except for Share and Per Share Data)
GSE repurchase requirements, which do not constrain sale treatment but result in a liability for the expected repurchase requirement.
The following table summarizes our personal loan and student loan securitization transfers qualifying for sale accounting treatment. There were no loan securitization transfers qualifying for sale accounting treatment during the year ended December 31, 2022.
| | | | | | | | | | | | | |
| Year Ended December 31, |
| 2023 | | | | 2021 |
| Personal loans | | | | | |
| Fair value of consideration received: | | | | | |
| Cash | $ | 359,927 | | | | | $ | 1,050,062 | |
| Securitization investments | 18,985 | | | | | 55,491 | |
| | | | | |
| Servicing assets recognized | 15,975 | | | | | 6,003 | |
| Repurchase liabilities recognized | (113) | | | | | — | |
| Total consideration | 394,774 | | | | | 1,111,556 | |
| Aggregate unpaid principal balance and accrued interest of loans sold | 375,770 | | | | | 1,054,171 | |
| Gain from loan sales | $ | 19,004 | | | | | $ | 57,385 | |
| Student loans | | | | | |
| Fair value of consideration received: | | | | | |
| Cash | $ | — | | | | | $ | 1,187,714 | |
| Securitization investments | — | | | | | 62,783 | |
| | | | | |
| Servicing assets recognized | — | | | | | 36,948 | |
| Total consideration | — | | | | | 1,287,445 | |
| Aggregate unpaid principal balance and accrued interest of loans sold | — | | | | | 1,227,379 | |
| Gain from loan sales | $ | — | | | | | $ | 60,066 | |
Deconsolidation of debt reflects the impacts of previously consolidated VIEs that became deconsolidated during the period because we no longer hold a significant financial interest in the underlying securitization entity, which can fluctuate from period to period. Gains and losses on deconsolidations are presented within noninterest income—loan origination, sales, and securitizations in the consolidatedstatements of operations and comprehensive loss. During the year ended December 31, 2023, we had deconsolidation of debt on student loans of $100.3 million. During the year ended December 31, 2022, we had deconsolidation of debt on personal loans of $70.6 million and on student loans of $126.0 million. For all periods, the impact on earnings from these deconsolidations was immaterial.
SoFi Technologies, Inc.
SoFi Technologies, Inc.
Notes to Consolidated Financial Statements (continued)
(In Thousands, Unless Otherwise Stated and Except for Share and Per Share Data)
The following table summarizes our whole loan sales:
| | | | | | | | | | | | | | | | | |
| Year Ended December 31, |
| 2023 | | 2022 | | 2021 |
| Personal loans | | | | | |
| Fair value of consideration received: | | | | | |
| Cash | $ | 567,904 | | | $ | 3,016,740 | | | $ | 3,373,655 | |
| Servicing assets recognized | 30,168 | | | 21,925 | | | 21,811 | |
| Repurchase liabilities recognized | (2,069) | | | (7,351) | | | (8,168) | |
| Total consideration received | 596,003 | | | 3,031,314 | | | 3,387,298 | |
| Aggregate unpaid principal balance and accrued interest of loans sold | 567,003 | | | 2,924,567 | | | 3,253,645 | |
| Realized gain | $ | 29,000 | | | $ | 106,747 | | | $ | 133,653 | |
| Student loans | | | | | |
| Fair value of consideration received: | | | | | |
| Cash | $ | 98,624 | | | $ | 883,859 | | | $ | 1,676,892 | |
| Servicing assets recognized | 2,792 | | | 9,275 | | | 15,526 | |
| Repurchase liabilities recognized | (16) | | | (134) | | | (300) | |
| Total consideration | 101,400 | | | 893,000 | | | 1,692,118 | |
| Aggregate unpaid principal balance and accrued interest of loans sold | 99,916 | | | 881,922 | | | 1,635,280 | |
| Realized gain | $ | 1,484 | | | $ | 11,078 | | | $ | 56,838 | |
| Home loans | | | | | |
| Fair value of consideration received: | | | | | |
| Cash | $ | 1,022,600 | | | $ | 1,057,596 | | | $ | 2,989,813 | |
| Servicing assets recognized | 10,184 | | | 13,926 | | | 31,294 | |
| Repurchase liabilities recognized | (1,765) | | | (1,158) | | | (3,288) | |
| Total consideration | 1,031,019 | | | 1,070,364 | | | 3,017,819 | |
| Aggregate unpaid principal balance and accrued interest of loans sold | 1,029,623 | | | 1,095,882 | | | 2,935,343 | |
| Realized gain (loss) | $ | 1,396 | | | $ | (25,518) | | | $ | 82,476 | |
For certain transferred loans that qualified for sale accounting and are, therefore, off-balance sheet, we have continuing involvement through our servicing agreements. For such loans, our exposure to loss is generally limited to the extent we would be required to repurchase such a loan due to a breach of representations and warranties associated with the loan transfer or servicing contract.
The following table presents information about the unpaid principal balances of loans originated by us and subsequently transferred, but with which we have continuing involvement:
| | | | | | | | | | | | | | | | | | | | | | | |
| Personal Loans | | Student Loans | | Home Loans | | Total |
| December 31, 2023 | | | | | | | |
| | | | | | | |
| Loans in delinquency (30+ days past due) | $ | 52,813 | | | $ | 60,989 | | | $ | 24,193 | | | $ | 137,995 | |
| Total loans in delinquency | 90,582 | | | 137,243 | | | 24,193 | | | 252,018 | |
Total transferred loans serviced(1) | 2,223,785 | | | 6,148,800 | | | 5,592,793 | | | 13,965,378 | |
| December 31, 2022 | | | | | | | |
| | | | | | | |
| Loans in delinquency (30+ days past due) | $ | 64,654 | | | $ | 46,986 | | | $ | 16,510 | | | $ | 128,150 | |
| Total loans in delinquency | 108,991 | | | 115,818 | | | 16,510 | | | 241,319 | |
Total transferred loans serviced(1) | 2,995,601 | | | 7,586,031 | | | 5,134,306 | | | 15,715,938 | |
_____________________
SoFi Technologies, Inc.
SoFi Technologies, Inc.
Notes to Consolidated Financial Statements (continued)
(In Thousands, Unless Otherwise Stated and Except for Share and Per Share Data)
(1)Total transferred loans serviced includes loans in delinquency, as well as loans in repayment, loans in-school/grace period/deferment (related to student loans), and loans in forbearance. The vast majority of total transferred loans serviced represent loans in repayment as of the dates indicated.
The following table presents additional information about the servicing cash flows received and net charge-offs related to loans originated by us and subsequently transferred, but with which we have a continuing involvement:
| | | | | | | | | | | | | | | | | |
| Year Ended December 31, |
| 2023 | | 2022 | | 2021 |
| Personal loans | | | | | |
| Servicing fees collected from transferred loans | $ | 20,577 | | | $ | 33,051 | | | $ | 34,421 | |
| Charge-offs, net of recoveries, of transferred loans | 167,643 | | | 93,095 | | | 102,217 | |
| Student loans | | | | | |
| Servicing fees collected from transferred loans | 27,401 | | | 35,203 | | | 46,657 | |
| Charge-offs, net of recoveries, of transferred loans | 41,642 | | | 34,136 | | | 24,675 | |
| Home loans | | | | | |
| Servicing fees collected from transferred loans | 14,530 | | | 12,893 | | | 8,749 | |
| | | | | |
| Total | | | | | |
| Servicing fees collected from transferred loans | $ | 62,508 | | | $ | 81,147 | | | $ | 89,827 | |
| Charge-offs, net of recoveries, of transferred loans | 209,285 | | | 127,231 | | | 126,892 | |
Loans Measured at Amortized Cost
Loan Portfolio Composition and Aging
The following table presents the amortized cost basis of our credit card and commercial and consumer banking portfolios (excluding accrued interest and before the allowance for credit losses) by either current status or delinquency status:
| | | | | | | | | | | | | | | | | | | | | | | | | | | | | | | | | | | |
| | | Delinquent Loans | | |
| Current | | 30–59 Days | | 60–89 Days | | ≥ 90 Days(1) | | Total Delinquent Loans | | Total Loans(2) |
| December 31, 2023 | | | | | | | | | | | |
| Senior secured loans | $ | 445,733 | | | $ | — | | | $ | — | | | $ | — | | | $ | — | | | $ | 445,733 | |
| Credit card | 297,612 | | | 5,451 | | | 4,829 | | | 11,802 | | | 22,082 | | | 319,694 | |
| Commercial and consumer banking: | | | | | | | | | | | |
| Commercial real estate | 107,757 | | | — | | | — | | | — | | | — | | | 107,757 | |
| Commercial and industrial | 6,108 | | | 1 | | | — | | | 439 | | | 440 | | | 6,548 | |
Residential real estate and other consumer(3) | 4,658 | | | — | | | — | | | — | | | — | | | 4,658 | |
| Total commercial and consumer banking | 118,523 | | | 1 | | | — | | | 439 | | | 440 | | | 118,963 | |
| Total loans | $ | 861,868 | | | $ | 5,452 | | | $ | 4,829 | | | $ | 12,241 | | | $ | 22,522 | | | $ | 884,390 | |
| December 31, 2022 | | | | | | | | | | | |
| Credit card | $ | 225,165 | | | $ | 4,670 | | | $ | 3,626 | | | $ | 10,498 | | | $ | 18,794 | | | $ | 243,959 | |
| Commercial and consumer banking: | | | | | | | | | | | |
| Commercial real estate | 89,544 | | | — | | | — | | | — | | | — | | | 89,544 | |
| Commercial and industrial | 7,636 | | | — | | | 1 | | | — | | | 1 | | | 7,637 | |
Residential real estate and other consumer(3) | 2,966 | | | — | | | — | | | — | | | — | | | 2,966 | |
| Total commercial and consumer banking | 100,146 | | | — | | | 1 | | | — | | | 1 | | | 100,147 | |
| Total loans | $ | 325,311 | | | $ | 4,670 | | | $ | 3,627 | | | $ | 10,498 | | | $ | 18,795 | | | $ | 344,106 | |
_____________________(1)All of the credit cards ≥ 90 days past due continued to accrue interest. As of the dates indicated, there were no credit cards on nonaccrual status. As of the dates indicated, commercial and consumer banking loans on nonaccrual status were immaterial.
SoFi Technologies, Inc.
SoFi Technologies, Inc.
Notes to Consolidated Financial Statements (continued)
(In Thousands, Unless Otherwise Stated and Except for Share and Per Share Data)
(2)For credit card, the balance is presented before allowance for credit losses of $52,385 and $39,110 as of December 31, 2023 and December 31, 2022, respectively, and accrued interest of $5,288 and $4,315, respectively. For senior secured loans, the balance is presented before accrued interest of $730 as of December 31, 2023. For commercial and consumer banking, the balance is presented before allowance for credit losses of $2,310 and $1,678, as of December 31, 2023 and December 31, 2022, respectively, and accrued interest of $415 and $324, respectively.
(3)Includes residential real estate loans originated by Golden Pacific for which we did not elect the fair value option.
Servicing Rights
Each time we enter into a servicing agreement, either in connection with transfers of our financial assets or in connection with a referral fulfillment arrangement we entered into during 2021 in which we are a sub-servicer for financial assets that we do not legally own, we determine whether we should record a servicing asset servicing liability, or neither a servicing asset nor liability. We elected the fair value option to measure our servicing rights subsequent to initial recognition. We measure the initial and subsequent fair value of our servicing rights using a discounted cash flow methodology, which includeswhile also considering market data as it becomes available. The significant assumptions used in the valuation model include our contractual servicing fee, ancillary income, prepayment rate assumptions, default rate assumptions, a discount rate commensurate with the risk of the servicing asset or liability being valued, and an assumed market cost of servicing, which is based on active quotes from third-party servicers. The value of the servicing rights are dependent on the performance of the underlying loans. For servicing rights retained in connection with loan transfers that do not meet the requirements for sale accounting treatment, there is no recognition of a servicing asset or liability.
Servicing rights in connection with transfers of financial assets are initially measured at fair value and recognized as a component of the gain or loss from sales of loans and the initial capitalization is reported within noninterest income—loan origination, sales, and salessecuritizations in the consolidated statements of operations and comprehensive income (loss).loss. Servicing rights assumed from third parties for financial assets for which we are not the loan originator are initially measured at fair value and recognized within noninterest income—servicing in the consolidated statements of operations and comprehensive income (loss).loss. Servicing rights are measured at fair value at each subsequent reporting date and changes in fair value are reported in earnings in the period in which they occur. Subsequent measurement changes for all servicing rights, including servicing fee payments and fair value changes, are included within noninterest income—servicing in the consolidated statements of operations and comprehensive income (loss).loss. We elected the fair value option to measure our servicing rights to better align with the valuation of our transferred loans, which also tend to share a similar risk profile to the personal loan servicing we assume from third parties when we are not the loan originator. The loans are also impacted by similar factors, such as conditional prepayment rates and default rates. We consider the risk of the assets and the observability of inputs in determining the classes of servicing rights. We have 3three classes of servicing assets: personal loans, homestudent loans and studenthome loans. There is prepayment and delinquency risk inherent in our servicing rights, but we currently do not use any instruments to mitigate such risks.
See Note 915. Fair Value Measurements for the key inputs used in the fair value measurements of our classes of servicing rights.
SoFi Technologies, Inc.
SoFi Technologies, Inc.
Notes to Consolidated Financial Statements (continued)
(In Thousands, Unless Otherwise Stated and Except for Share and Per Share Data)
Investments in Debt Securities
The accounting and measurement framework for our investments in debt securities is determined based on the security classification. We do not hold investments in debt securities for trading purposes, nor do we have investments in debt securities that we have the intent and ability to hold to maturity. Therefore, we classify our investments in debt securities as available-for-sale.
We record investments in AFS debt securities at fair value in our consolidated balance sheets, with unrealized gains and losses recorded, net of tax, as a component of AOCI. See Note 15. Fair Value Measurements for additional information on our fair value estimates for investments in AFS debt securities. The amortized cost basis of our investments in AFS debt securities reflects the security’s acquisition cost, adjusted for amortization of premium or accretion of discount, and collection of cash and charge-offs, as applicable. For purposes of determining gross realized gains and losses on AFS debt securities, the cost of securities sold is based on specific identification. We elected to present accrued interest for AFS debt securities within investment securities in the consolidated balance sheets. Purchase discounts, premiums, and other basis adjustments for investments in AFS debt securities are generally amortized into interest income over the contractual life of the security using the effective interest method. However, premiums on certain callable debt securities are amortized to the earliest call date. Amortization of premiums and discounts and other basis adjustments for investments in AFS debt securities, as well as interest income earned on the investments, are recognized within interest income—other, and realized gains and losses on investments in AFS debt securities are recognized within noninterest income—other in the consolidated statements of operations and comprehensive loss.
An investment in AFS debt security is considered impaired if its fair value is less than its amortized cost. If we determine that we have the intent to sell the impaired investment in AFS debt security, or if it is more likely than not that we will be required to sell the impaired investment in AFS debt security before recovery of its amortized cost, we recognize the full impairment loss reflecting the difference between the amortized cost (net of any prior recognized allowance) and the fair value of the investment in AFS debt security within noninterest income—other in the consolidated statements of operations and comprehensive loss. If neither of the above conditions exists, we evaluate whether the impairment loss is attributable to credit-related or non-credit-related factors. Any impairment that is not credit-related is recognized within other comprehensive income (loss), net of taxes. See the section “Allowance for Credit Losses” in this Note for the factors we consider in identifying credit-related impairment and the treatment of credit losses.
See Note 6. Investment Securities for additional information on our investments in AFS debt securities.
Securitization Investments
In Company-sponsored securitization transactions that meet the applicable criteria to be accounted for as a sale, we retain certain residual interests and asset-backed bonds. We measure these investments at fair value on a recurring basis.basis and report them within investment securities in the consolidated balance sheets. Gains and losses related to our securitization investments are reported within noninterest income—loan origination, sales, and securitizations in the consolidated statements of operations and comprehensive income (loss).loss. We determine the fair value of our securitization investments using a discounted cash flow methodology, while also considering market data as it becomes available. We classify the residual investments as Level 3 due to the reliance on significant unobservable valuation inputs. We classify asset-backed bonds as Level 2 due to the use of quoted prices for similar assets in markets that are not active, as well as certain factors specific to us.
Our residual investments accrete interest income over the expected life using the effective yield method pursuant to ASC 325-40, Investments — Other,, which reflects a portion of the overall fair value adjustment recorded each period on our residual investments. On a quarterly basis, we reevaluate the cash flow estimates over the life of the residual investments to determine if a change to the accretable yield is required on a prospective basis. Additionally, we record interest income associated with asset-backed bonds over the term of the underlying bond using the effective interest method on unpaid bond amounts. Interest income on residual investments and asset-backed bonds is presented within interest income—loans and securitizations in the consolidated statements of operations and comprehensive loss.
See Note 15. Fair Value Measurements for the key inputs used in the fair value measurements of our residual investments and asset-backed bonds.
Investments in Equity Securities
Our investments in equity securities consist of investments for which fair values are not readily determinable, which we elect to measure using the alternative method of accounting, under which they are measured at cost less any impairment and
SoFi Technologies, Inc.
SoFi Technologies, Inc.
Notes to Consolidated Financial Statements (continued)
(In Thousands, Unless Otherwise Stated and Except for Share and Per Share Data)
amounts. Interest income on residualadjusted for changes resulting from observable price changes in orderly transactions for identical or similar investments and asset-backed bonds isof the same issuers. Our investments in equity securities are presented within interest income—securitizations other assetsin the consolidated statements of operations and comprehensive income (loss).
See Note 9 forbalance sheets. Adjustments to the key inputs used in the fair value measurementscarrying values of our residual investments in equity securities, such as impairments and asset-backed bonds.
Equity Method Investments
In August 2021, we finalized the purchase of a 5% interest in Lower Holding Company (“Lower”) for $20,000, upon obtaining certain regulatory approvals. This equity method investment expanded our home loan origination fulfillment capabilities. Upon the closing of the transaction, we were granted a seat on Lower’s board of directors. Based on accounting guidance in ASC 323-10, Investments — Equity Method and Joint Ventures, we concluded that we had significant influence over the investee because of our representation on its board of directors. However, we did not control the investee and, therefore, accounted for the investment under the equity method of accounting. The investment was not deemed to be significant under either Regulation S-X, Rule 3-09 or Rule 4-08(g).
We recorded our portion of Lower equity method earningsunrealized gains, are recognized within noninterest income—other in the consolidated statements of operations and comprehensive income (loss) and as an increase to the carrying value of our equity method investment in the consolidated balance sheets. We recognized equity method losses of $261 during the year ended December 31, 2021, which included basis difference amortization. The investment in Lower resulted in a basis difference of $1,769 that was attributable to the excess of the fair value of certain assets measured at amortized cost relative to book value, as well as definite-lived intangible assets. The basis difference is being amortized into income as an offset to equity method earnings over the weighted average life of the assets measured at amortized cost by Lower and the useful life of the separately-identified intangible assets. The amortization range is 1.3 to 5.0 years, and the weighted average amortization period is 3.3 years as of December 31, 2021. Our policy for amortizing separately-identified Lower assets was consistent with our policy for amortizing our assets of a similar type, and our basis for amortizing assets held by Lower at amortized cost was consistent with our experience with similar assets. We did not receive any distributions during the year ended December 31, 2021. We did not recognize any impairment related to our Lower investment during the year ended December 31, 2021.loss.
On January 25, 2022, we relinquished our seat on Lower’s board of directors. As such, we no longer have significant influence over the investee and we will cease recognizing Lower equity investment income subsequent to that date.
In December 2018, we purchased a 16.7% interest in Apex Clearing Holdings, LLC (“Apex”) for $100,000, which represented our only significant equity method investment at the time. We recorded our portion of Apex equity method earnings within noninterest income—other in the consolidated statements of operations and comprehensive income (loss) and as an increase to the carrying value of our equity method investment in the consolidated balance sheets. We recognized equity method earnings on our investment in Apex of $4,442 and $795 during the years ended December 31, 2020 and 2019, respectively, which included basis difference amortization. During the year ended December 31, 2020, we invested an additional $145 in Apex, which increased our equity method investment ownership to 16.8% as of that date.
The seller of the Apex interest had call rights over our initial equity interest in Apex (“Seller Call Option”) from April 14, 2020 to December 14, 2023, which rights were exercised in January 2021. Therefore, we ceased recognizing Apex equity investment income subsequent to the call date. As of December 31, 2020, we measured the carrying value of the Apex equity method investment equal to the call payment that we received in January 2021 of $107,534. There was no equity method investment balance as of December 31, 2021. We did not receive any distributions during the years ended December 31, 2020 and 2019.
We also had an equity method investment balance related to a residential mortgage origination joint venture, which was discontinued in the third quarter of 2020, at which point we received a closing distribution of $974 related to the investment and we recognized an immaterial loss on the dissolution date. For the years ended December 31, 2020 and 2019, the earnings related to this joint venture were immaterial.
Property, Equipment and Software
All property, equipment and software are initially recorded at cost;cost, while repairs and maintenance costs are expensed as incurred. Computer hardware, furniture and fixtures, software, buildings and finance lease right-of-use (“ROU”)ROU assets are depreciated or amortized on a straight-line basis over the estimated useful life of each class of depreciable or amortizable assets (ranging from
SoFi Technologies, Inc.
Notes to Consolidated Financial Statements (continued)
(In Thousands, Unless Otherwise Stated and Except for Share and Per Share Data)
2.5 to 7.030 years). Leasehold improvements are amortized over the shorter of the respective lease term or the estimated lives of the leasehold improvements.
Software includes both purchased and internally-developed software. Internally-developed software is capitalized when preliminary project efforts are successfully completed, and it is probable that both the project will be completed and the software will be used as intended. Capitalized costs consist of salaries and compensation costs (inclusive of share-based compensation) for employees, fees paid to third-party consultants who are directly involved in development efforts and costs incurred for upgrades and functionality enhancements.enhancements, and are amortized over a useful life ranging from 2.5 to 3 years. Other costs are expensed as incurred.
The table below presents our major classes of depreciableSee Note 9. Property, Equipment, Software and amortizable assets by function as of the dates indicated:
| | | | | | | | | | | | | | | | | |
| Gross
Balance | | Accumulated Depreciation/Amortization | | Carrying
Value |
| December 31, 2021 | | | | | |
| Computer hardware | $ | 16,864 | | | $ | (8,583) | | | $ | 8,281 | |
| Leasehold improvements | 39,726 | | | (12,233) | | | 27,493 | |
Furniture and fixtures(1) | 18,326 | | | (7,748) | | | 10,578 | |
Software(2) | 75,632 | | | (22,996) | | | 52,636 | |
Finance lease ROU assets(3) | 15,100 | | | (2,876) | | | 12,224 | |
Construction in progress(4) | 661 | | | — | | | 661 | |
| Total | $ | 166,309 | | | $ | (54,436) | | | $ | 111,873 | |
| December 31, 2020 | | | | | |
| Computer hardware | $ | 13,494 | | | $ | (6,037) | | | $ | 7,457 | |
| Leasehold improvements | 36,725 | | | (7,920) | | | 28,805 | |
Furniture and fixtures(1) | 12,361 | | | (5,251) | | | 7,110 | |
Software(2) | 42,323 | | | (18,587) | | | 23,736 | |
Finance lease ROU assets(3) | 15,100 | | | (719) | | | 14,381 | |
| Total | $ | 120,003 | | | $ | (38,514) | | | $ | 81,489 | |
_____________________
(1)LeasesFurniture and fixtures primarily include office equipment as well as other furniture and fixtures associated with SoFi Stadium.
(2)Software primarily includes internally-developed software related to significant developments and enhancements for our products. During the year ended December 31, 2021, we capitalized $7,776 of share-based compensation related to internally-developed software, and we recognized associated amortization expense of $792. We did not capitalize any share-based compensation during the years ended December 31, 2020 and 2019.
(3)Finance lease ROU assets include our rights to certain physical signage within SoFi Stadium. See Note 16 for additional information on our leases.
(4)Construction in progress as of December 31, 2021 relates to furniture and fixtures and computer hardware.
For the years ended December 31, 2021, 2020 and 2019, total depreciation and amortization expense associated with property, equipment and software, inclusive of the amortization of capitalized share-based compensation, was $31,061, $20,097 and $12,947, respectively.software.
We recognized property, equipment and software abandonment of $2,137 during the year ended December 31, 2019. There were no abandonments during the years ended December 31, 2021 and 2020. There were no impairments during any of the years presented. We had losses on computer hardware disposals of $164 during the year ended December 31, 2021.
Goodwill and Intangible Assets
Goodwill represents the fair value of an acquired business in excess of the fair value of the identified net assets acquired. Goodwill is tested for impairment at the reporting unit level annually or whenever indicators of impairment exist. We apply the provisions of ASU 2017-04, Simplifying the Test for Goodwill Impairment, to calculate goodwill impairment (if any) on at least an annual basis, which provides for an unconditional option to bypass the qualitative assessment.
SoFi Technologies, Inc.
Notes to Consolidated Financial Statements (continued)
(In Thousands, Unless Otherwise Stated and Except for Share and Per Share Data)
Impairment of goodwill is the condition that exists when the carrying amount of a reporting unit that includes goodwill exceeds its fair value. We may assess goodwill for impairment initially using a qualitative approach, referred to as “step zero”, to determine whether conditions exist to indicate that it is more likely than not that the fair value of a reporting unit is less than its carrying amount. If management concludes, based on its assessment of relevant events, facts and circumstances, that it is more likely than not that a reporting unit’s carrying value is greater than its fair value, then a quantitative analysis will be performed to determine if there is any impairment. We may alternatively elect to initially perform a quantitative assessment and bypass the qualitative assessment.
A goodwill impairment loss is recognized for the amount that the carrying amount of a reporting unit, including goodwill, exceeds its fair value, limited to the total amount of goodwill allocated to that reporting unit. Therefore, if the fair value of a reporting unit exceeds its carrying amount, goodwill of the reporting unit is not impaired. Our reporting units for our goodwill impairment analysis represent components of our business at one level below our operating segments. Our annual impairment testing date is October 1.
Intangible assets as of December 31, 2021 included developed technology; customer-related contracts; trade names, trademarks and domain names; core banking infrastructure; and broker-dealer license and trading rights. Definite-lived intangible assets are amortized on a straight-line amortizedbasis over their useful lives and reviewed for impairment annually and whenever events or circumstances indicate that the carrying amount of such assets may not be recoverable. We do not have any indefinite-lived intangible assets.Intangible assets include capitalized costs incurred in the development and enhancement of our software products to be sold, leased or marketed. These costs, consisting primarily of salaries and compensation costs (inclusive of share-based compensation) for employees, are expensed as incurred until technological feasibility has been established, after which the costs are capitalized until the product is available for general release to customers.
See Note 22. Business Combinations and Note 38. Goodwill and Intangible Assets for further discussion of goodwill and intangible assets, including those recognized in connection with recent business acquisitions.combinations.
Leases
In accordance with ASC 842, Leases, which we began applying as of January 1, 2019, weWe determine if an arrangement is or contains a lease at inception of the contract. A contract is or contains a lease if the contract conveys the right to control the use of identified property or equipment for a period of time in exchange for consideration. For our current office and non-office classes of operating leases, we elected the practical expedient to choose not to separate non-lease components from lease components and to, instead, to account for each separate lease component and the non-leasenon-
SoFi Technologies, Inc.
SoFi Technologies, Inc.
Notes to Consolidated Financial Statements (continued)
(In Thousands, Unless Otherwise Stated and Except for Share and Per Share Data)
lease components associated with that lease component as a single lease component. For our current classes of finance leases, we did not elect to apply this practical expedient and, instead, separately identify and measure the non-lease components of the contracts. As an accounting policy election, we apply the short-term lease exemption practical expedient to any lease that, at the commencement date, has a lease term of 12 months or less and does not include an option to purchase the underlying asset that we are reasonably certain to exercise.
Operating leases are presented within operating lease right-of-use assets and operating lease liabilities in the consolidated balance sheets. Finance lease ROU assets are presented within property, equipment and software and finance lease liabilities are presented within accounts payable, accruals and other liabilities in the consolidated balance sheets. Operating and finance lease ROU assets represent our right to use an underlying asset for the lease term and operating and finance lease liabilities represent our obligation to make lease payments arising from the lease. ROU assets and lease liabilities are recognized at the commencement date based on the present value of lease payments over the lease term. As our leases do not provide an implicit borrowing rate, we use our incremental borrowing rate based on the information available at commencement date or modification date, as appropriate, in determining the present value of lease payments.
The operating lease ROU assets are increased by any prepaid lease payments and are reduced by any unamortized lease incentives. Our lease terms may include options to extend or terminate the lease when it is reasonably certain that we will exercise that option. Base rent is typically subject to rent escalations on each annual anniversary from the lease commencement dates. Lease expense for lease payments, including any step rent provisions specified in the lease agreements, is recognized on a straight-line basis over the lease term and is allocated among the components of noninterest expense in the consolidated statements of operations and comprehensive income (loss).loss. The finance lease ROU assets are depreciated on a straight-line basis over the estimated useful life of seven years. Interest expense on finance leases is recognized for the difference between the present value of the lease liabilities and the scheduled lease payments within interest expense—other in the consolidated statements of operations and comprehensive income (loss).loss.
When a lease agreement is modified, we determine if the modification grants us the right to use an additional asset that is not included in the original lease contract and if the lease payments increase commensurate with the standalone price for the additional ROU asset. If both conditions are met, we account for the agreement as two separate contracts: (i) the original, unmodified contract and (ii) a separate contract for the additional ROU asset. If both conditions are not met, the modification is not evaluated as a separate contract. Instead, based on the nature of the modification, wewe: (i) reassess the lease classification on the modification date under the modified terms, and (ii) use the modified lease payments and discount rate to remeasure the lease liability and recognize any difference between the new lease liability and the old lease liability as an adjustment to the ROU asset.
SoFi Technologies, Inc.
Notes to Consolidated Financial Statements�� (continued)
(In Thousands, Unless Otherwise StatedNote 9. Property, Equipment, Software and Except for Share and Per Share Data)
See Note 16Leases for additional information on our leases.
Derivative Financial Instruments
We enter into derivative contracts to manage future loan sale execution risk. We did not elect hedge accounting, as management’s hedging intentions are to economically hedge the risk of unfavorable changes in the fair valuevalues of our studentpersonal loans, personalstudent loans and home loans. Our derivative instruments used to manage future loan sale execution risk as of the balance sheet dates included interest rate futures,include interest rate swaps, interest rate caps and home loan pipeline hedges. We also hadhave IRLCs, interest rate lock commitments (“IRLC”)swaps and interest rate caps that were not related to future loan sale execution risk. The interest rate futures and home loan pipeline hedges are measured at fair value and categorized as Level 1 fair value assets and liabilities, as all contracts held are traded in active markets for identical assets or liabilities and quoted prices are accessible by us at the measurement date. The interest rate swaps and interest rate caps are measured at fair value and categorized as Level 2 fair value assets and liabilities, as all contracts held are traded in active markets for similar assets or liabilities and other observable inputs are available at the measurement date. IRLCs are categorized as Level 3 fair value assets and liabilities, as the fair value is highly dependent on an assumed loan funding probability.
In the past, we have also entered into derivative contracts to hedge the market risk associated with some of our non-securitization investments. We did not elect hedge accounting.
In addition, in conjunction with a loan sale agreement we entered into during 2018, we are entitled to receive payments from the buyer of the loans underlying the agreement if the internal rate of return (as defined in the loan sale agreement) on such loans exceeds a specified hurdle, subject to a dollar cap. This provision is referred to as the “purchase price earn-out”. As the purchaser maintains control of the transferred assets and retains the risk of loss, and the assets remain legally isolated from us, the transfer qualified for true sale accounting. We determined that the purchase price earn-out is a derivative asset. Therefore, the purchase price earn-out is measured at fair value on a recurring basis and is categorized as a Level 3 fair value asset, as the fair value is highly dependent on underlying loan portfolio performance. Historically, the purchase price earn-out value was immaterial.
Changes in derivative instrument fair values are recognized in earnings as they occur. Depending on the measurement date position, derivative financial instruments are presented within other assets or accounts payable, accruals and other liabilities in the consolidated balance sheets. Our derivative instruments are reported within net cash provided by (used in)flows from operating activities in the consolidated statements of cash flows.
The following table presents the gains (losses) recognized on our derivative instruments during the years indicated:
| | | | | | | | | | | | | | | | | |
| Year Ended December 31, |
| 2021 | | 2020 | | 2019 |
Derivative contracts to manage future loan sale execution risk(1)(2) | $ | 49,090 | | | $ | (54,829) | | | $ | (24,803) | |
IRLCs(1) | (11,861) | | | 14,530 | | | 916 | |
Interest rate caps(1) | (193) | | | — | | | — | |
Purchase price earn-out(1) | 9,312 | | | — | | | — | |
Special payment(3) | (21,181) | | | — | | | — | |
Third party warrants(4) | 573 | | | — | | | — | |
Derivative contracts to manage market risk associated with non-securitization investments(5) | — | | | 996 | | | (1,151) | |
| Total | $ | 25,740 | | | $ | (39,303) | | | $ | (25,038) | |
_____________________
(1) Recorded within noninterest income—loan origination and sales in the consolidated statements of operations and comprehensive income (loss).
(2) The loss recognized during the year ended December 31, 2020 was inclusive of a $22,269 gain on credit default swaps that were opened and settled during the year.
(3) In conjunction with the Business Combination, the Amended Series 1 Agreement amended the original special payment provision to provide for a one-time special payment to Series 1 preferred stockholders, which was paid from the proceeds of the Business Combination and settled contemporaneously with the Business Combination. The special payment was recognized within noninterest expense—general and administrative in the consolidated statements of operations and comprehensive income (loss), as this feature was accounted for as an embedded derivative that was not clearly and closely
SoFi Technologies, Inc.
Notes to Consolidated Financial Statements (continued)
(In Thousands, Unless Otherwise Stated and Except for Share and Per Share Data)
related to the host contract, and will have no subsequent impact on our consolidated financial results. The Series 1 Redeemable Preferred Stock has no stated maturity.
(4) Includes $273 recorded within noninterest income—other, $132 recorded within noninterest expense—cost of operations and $168 recorded within noninterest expense—general and administrative in the consolidated statements of operations and comprehensive income (loss), the latter of which represents the amortization of a deferred liability recognized at the initial fair value of the third party warrants acquired of $964, as we are also a customer of the third party.
(5) Recorded within noninterest income—other in the consolidated statements of operations and comprehensive income (loss). We did not have any such derivative contracts to hedge our non-securitization investments during the year ended December 31, 2021.
Certain derivative instruments are subject to enforceable master netting arrangements. Accordingly, we present our net asset or liability position by counterparty in the consolidated balance sheets. Additionally, since our cash collateral balances do not approximate the fair value of the derivative position, we do not offset our right to reclaim cash collateral or obligation to return cash collateral against recognized derivative assets or liabilities. The following table presents information about derivative instruments subject to enforceable master netting arrangements as of the dates indicated:
| | | | | | | | | | | | | | | | | | | | | | | |
| December 31, 2021 | | December 31, 2020 |
| Gross Derivative Assets | | Gross Derivative Liabilities | | Gross Derivative Assets | | Gross Derivative Liabilities |
| Interest rate swaps | $ | 5,444 | | | $ | — | | | $ | — | | | $ | (947) | |
| Interest rate caps | — | | | (668) | | | — | | | — | |
| Home loan pipeline hedges | 117 | | | (313) | | | — | | | (1,872) | |
| Interest rate futures | — | | | — | | | — | | | (136) | |
| Total, gross | $ | 5,561 | | | $ | (981) | | | $ | — | | | $ | (2,955) | |
| Less: derivative netting | (117) | | | 117 | | | — | | | — | |
Total, net(1) | $ | 5,444 | | | $ | (864) | | | $ | — | | | $ | (2,955) | |
_____________________
(1)See As of December 31, 2021Note 14. Derivative Financial Instruments and 2020, we had a cash collateral requirement of $299 and $1,746, respectively, related to these instruments.
The following table presents the notional amount of derivative contracts outstanding as of the dates indicated: | | | | | | | | | | | |
| December 31, |
| 2021 | | 2020 |
| Derivative contracts to manage future loan sale execution risk: | | | |
| Interest rate swaps | $ | 4,210,000 | | | $ | 1,475,000 | |
| Home loan pipeline hedges | 421,000 | | | 371,000 | |
| Interest rate caps | 405,000 | | | — | |
| Interest rate futures | — | | | 3,400,000 | |
IRLCs(1) | 357,529 | | | 630,277 | |
Interest rate caps(2) | 405,000 | | | — | |
| Total | $ | 5,798,529 | | | $ | 5,876,277 | |
_____________________
(1) Amounts correspond with home loan funding commitments subject to IRLC agreements.
(2) Note 15. Fair Value MeasurementsWe sold an interest rate cap that was subject to master netting to offset an interest rate cap purchase made in conjunction with a contract to manage future loan sale execution risk.
While the notional amounts of derivative instruments give an indication of the volume of our derivative activity, they do not necessarily represent amounts exchanged by parties and are not a direct measure of our financial exposure.
See Note 9 for additional information on our derivative assets and liabilities.
SoFi Technologies, Inc.
SoFi Technologies, Inc.
Notes to Consolidated Financial Statements (continued)
(In Thousands, Unless Otherwise Stated and Except for Share and Per Share Data)
Residual Interests Classified as Debt
For residual interests related toWithin consolidated securitizations, the residual interests held by third parties are presented as residual interests classified as debt in the consolidated balance sheets. We measure residual interests classified as debt at fair
SoFi Technologies, Inc.
Notes to Consolidated Financial Statements (continued)
(In Thousands, Unless Otherwise Stated and Except for Share and Per Share Data)
value on a recurring basis. We record subsequent measurement changes in fair value in the period in which the change occurs within noninterest income—loan origination, sales, and securitizations in the consolidated statements of operations and comprehensive income (loss).loss. We determine the fair value of residual interests classified as debt using a discounted cash flow methodology, while also considering market data as it becomes available. We classify the residual interests classified as debt as Level 3 due to the reliance on significant unobservable valuation inputs.
We recognize interest expense related to residual interests classified as debt over the expected life using the effective yield method, which reflects a portion of the overall fair value adjustment recorded each period on our residual interests classified as debt. Interest expense related to residual interests classified as debt is presented within interest expense—securitizations and warehouses in the consolidated statements of operations and comprehensive income (loss).loss. On a quarterly basis, we reevaluate the cash flow estimates to determine if a change to the accretable yield is required on a prospective basis.
See Note 915. Fair Value Measurements for the key inputs used in the fair value measurements of residual interests classified as debt.
Fractional SharesSafeguarding Asset and Liability
Through 8 Limited,our SoFi Invest product (via our wholly-owned subsidiary, SoFi Digital Assets, LLC, a licensed money transmitter), our members were able to invest in digital assets. In the fourth quarter of 2023, we transferred the crypto services provided by SoFi Digital Assets, LLC, and began closing existing digital assets accounts. This process was completed in the first quarter of 2024. Certain accounts were eligible for transfer to a third party digital asset service provider who assumed responsibility for the transferred accounts on a go-forward basis, including the arrangement of custodial services for the transferred digital assets. We have no further ongoing responsibilities for the transferred digital assets subsequent to the executed transfer which is a Hong Kong-based subsidiary,took place in December 2023, and derecognized the corresponding digital assets safeguarding liability and safeguarding asset as of the date of the transfer.
For those digital assets that were not eligible to be transferred, we have a “stock bits” feature that allows members withengage third parties to provide custodial services for our digital assets offering, which include holding the cryptographic key information and working to protect the digital assets from loss or theft. The third-party custodians hold digital assets as custodial assets in an 8 Limited investment account to purchase fractional shares in various companies. 8 Limited maintains controlSoFi’s name for the benefit of our members. We maintain the internal recordkeeping of our members’ digital assets, including the amount and risk over the stock inventory and, as such, must recognize on its balance sheet both the fractiontype of a share retained by the company and the fraction of a sharedigital assets owned by each of our members in the member, with the latter also recorded as a payable to the member. The inventory is recorded at its fair value based on the closing price of the associated stock.custodial accounts. As of December 31, 2021,2023, we utilized one third-party custodian.
In accordance with Staff Accounting Bulletin No. 121 (“SAB 121”), we recognize a digital assets safeguarding liability within accounts payable, accruals and other liabilities in the aggregateconsolidated balance sheets reflecting our obligation to safeguard the digital assets held by third-party custodians for the benefit of our members. We also recognize a corresponding safeguarding asset within other assets in the consolidated balance sheets. The safeguarding liability and corresponding safeguarding asset are measured and recorded at the fair value of fractional shares ownedthe digital assets held by SoFi Hong Kong members was determinedthe custodians at each reporting date. Subsequent changes to the fair value measurement are reflected as equal and offsetting adjustments to the carrying values of the safeguarding liability and corresponding safeguarding asset. We evaluate any potential loss events, such as theft, loss or destruction of the cryptographic keys, that may affect the measurement of the safeguarding asset, which would be immaterial.reflected in our results of operations in the period the loss occurs. Measurement changes do not impact the consolidated statements of operations and comprehensive loss unless such a loss event is identified. As of both December 31, 2023 and 2022, we did not identify any loss events.
In our “stock bits” offering through our domestic SoFi Invest accounts, SoFi engages Apex asSee Note 15. Fair Value Measurements for additional information on the clearing brokerfair value measurement of the safeguarding liability and as such, does not retain control and risk over the stock inventory associated with fractional shares. Therefore, SoFi does not recognize the fractional shares owned by domestic SoFi Invest members on its consolidated balance sheets.corresponding safeguarding asset.
Borrowings and Financing Costs
We borrow from various financial institutions to finance our lending activities. Direct costs incurred in connection with financing, such as banker fees, origination fees and legal fees, are classified as deferred debt issuance costs. We capitalize these costs and report the amounts as a direct deduction from the carrying amount of the debt balance. Any difference between the stated principal amount of debt and the amount of cash proceeds received, net of debt issuance costs, is presented as a
SoFi Technologies, Inc.
SoFi Technologies, Inc.
Notes to Consolidated Financial Statements (continued)
(In Thousands, Unless Otherwise Stated and Except for Share and Per Share Data)
discount or premium. The capitalized debt issuance costs and the original issue discount/premium are amortized into interest expense over the expected life of the related financing agreements using the straight-line method for revolving facilities and the effective interest method for securitization debt and our senior convertible notes, which areas defined and further discussed below. Remaining unamortized fees are expensed immediately upon early extinguishment of the debt. In a debt modification for revolving debt, the initial issuance costs and any additional fees incurred as a result of the modification are deferred over the term of the new agreement, if the borrowing capacity of the revolving facility is increased. In the case that a modification results in a decrease in our borrowing capacity, any fees paid to the creditor and any third-party costs incurred are considered to be associated with the new arrangement and are, therefore, deferred and amortized over the term of the new arrangement. Unamortized deferred costs relating to the old arrangement at the time of the modification are expensed immediately in proportion to the decrease in borrowing capacity of the old arrangement. Any remaining unamortized deferred costs relating to the old arrangement are deferred and amortized over the term of the new arrangement.
The total accrued interest payable of $1,306We elected the fair value option to measure certain securitization debt, with the intent to mitigate the accounting divergence between debt liabilities measured at historical cost and $19,817 as of December 31, 2021the corresponding loans securing these financings, which are risk-managed on a fair value basis. For securitization debt carried at fair value on a recurring basis, we record the initial fair value measurement and 2020, respectively, was primarily related to interest associated with our borrowings and was presentedsubsequent measurement changes in fair value in the period in which the changes occur within accounts payable, accrualsnoninterest income—loan origination, sales, and other liabilitiessecuritizations in the consolidated balance sheets.statements of operations and comprehensive loss. We determined the fair value of the applicable securitization debt using a discounted cash flow methodology, while also considering market data as it becomes available. The key inputs to the calculation include the underlying contractual coupons, terms, discount rate and expectations for defaults and prepayments.
Convertible Senior Notes
In October 2021, we issued $1.2 billion aggregate principal amount of convertible senior notes due 2026 (the “Convertible Notes”“convertible notes”). The Convertible Notesconvertible notes will mature on October 15, 2026, unless earlier repurchased, redeemed or converted. We will settle conversions by paying or delivering, at our election, cash, shares of our common stock or a combination of cash and shares of our common stock, based on the applicable conversion rate(s). The Convertible Notesconvertible notes will also be redeemable, in whole or in part, at our option at any time, and from time to time, on or after October 15, 2024 through on or before the 30th scheduled trading day immediately before the maturity date, at a cash redemption price equal to the
SoFi Technologies, Inc.
Notes to Consolidated Financial Statements (continued)
(In Thousands, Unless Otherwise Stated and Except for Share and Per Share Data)
principal amount of the Convertible Notesconvertible notes to be redeemed, plus accrued interest, if any, thereon to, but excluding, the redemption date, but only if certain liquidity conditions described in the indenture are satisfied and certain conditions are met with respect to the last reported sale price per share of our common stock prior to conversion. In December 2023, we entered into repurchase agreements to repurchase $88.0 million aggregate principal amount of the convertible notes. See Note 1012. Debt for more detailed disclosure of thesethe term and features of the Convertible Notes.convertible notes.
We elected to evaluate each embedded feature of the arrangement individually. We concluded that each of the conversion rights, optional redemption rights, fundamental change make-whole provision and repurchase rights did not require bifurcation as derivative instruments, under ASC 815, Derivatives and Hedging (“ASC 815”), which we will reevaluate each reporting period. The additional interest and special interest that accrue on the notes in the event of our failure to comply with certain registration or reporting requirements are required to be bifurcated from the host contract, as the reporting requirement triggering event is not clearly and closely related to the host convertible debt contract, and therefore we measuredmeasure the contingent interest feature at fair value each reporting period. The value was determined to be immaterial; therefore, we accounted for the Convertible Notesconvertible notes wholly as debt, which was recognized on the settlement date. Accordingly, we allocated all debt issuance costs to the debt instrument on the basis of materiality.
In connection with the pricing of the Convertible Notes,convertible notes, we entered into privately negotiated capped call transactions with certain financial institutions, which areas defined and further discussed below.
Redeemable Preferred Stock
Immediately prior to the Business Combination, all shares of the Company’s outstanding shares of redeemable preferred stock, other than the Series 1 preferred stock, converted into shares of SoFi Technologies common stock. Series 1 preferred stockRedeemable Preferred Stock (as defined in Note 13. Equity) is classified in temporary equity, as it is not fully controlled by SoFi. See Note 13. Equity for additional information.
Foreign Currency Translation Adjustments
We revalue assets, liabilities, income and expense denominated in non-United States currencies into United States dollars using applicable exchange rates. For foreign subsidiaries in which the functional currency is the subsidiary’s local
SoFi Technologies, Inc.
SoFi Technologies, Inc.
Notes to Consolidated Financial Statements (continued)
(In Thousands, Unless Otherwise Stated and Except for Share and Per Share Data)
currency, gains and losses relating to foreign currency translation adjustments are included in accumulated other comprehensive lossincome (loss) in our consolidated balance sheets. For foreign subsidiaries in which the functional currency is the United States Dollar, gains and losses relating to foreign currency transaction adjustments are included within earnings in the consolidated statements of operations and comprehensive income (loss).
Accumulated Deficit
We purchase SoFi common stock from timeloss. Due to timethe highly inflationary economic environment in Argentina, we use the United States Dollar as the functional currency of our Argentinian operations. Our activities in Argentina are related to our Technology Platform segment and constructively retire the common stock. We record purchases of common stock as a reduction to accumulated deficitcommenced in the consolidated balance sheets.first quarter of 2022 with the Technisys Merger.
Capped Call Transactions
We entered into privately negotiated capped call transactions (the “Capped Call Transactions”) with certain financial institutions (the “Capped Call Counterparties”). The Capped Call Transactions initially cover, subject to customary anti-dilution adjustments, the number of shares of our common stock that initially underlie the Convertible Notes.convertible notes. The Capped Call Transactions are net purchased call options on our own common stock.
The Capped Call Transactions are separate transactions entered into by the Company with each of the Capped Call Counterparties, are not part of the terms of the Convertible Notes,convertible notes, and do not affect any holder’s rights under the Convertible Notes.convertible notes. Holders of the Convertibleconvertible notes do not have any rights with respect to the Capped Call Transactions.
As the Capped Call Transactions are legally detachable and separately exercisable from the Convertible Notes,convertible notes, they were evaluated as freestanding instruments under ASC 480, Distinguishing Liabilities from Equity (“ASC 480”).instruments. We concluded that the Capped Call Transactions meet the scope exceptions for derivative instruments, under ASC 815. Asand as such, the Capped Call Transactions meet the criteria for classification in equity and are included as a reduction to additional paid-in capital.
See Note 1013. Equity for additional information on the Capped Call Transactions.
SoFi Technologies, Inc.
Notes to Consolidated Financial Statements (continued)
(In Thousands, Unless Otherwise Stated and Except for Share and Per Share Data)
Interest Income
We record interest income associated with loans measured at fair value over the term of the underlying loans using the effective interest method on unpaid loan principal amounts, which is presented within interest income—loans and securitizations in the consolidated statements of operations and comprehensive income (loss).loss. We also record accrued interest income associated with loans measured at amortized cost within interest income—loans.loans and securitizations. We stop accruing interest and reverse all accrued but unpaid interest at the time a loan charges off. Loans are returned to accrual status if the loans are brought to nondelinquent status or have performed in accordance with the contractual terms for a reasonable period of time and, in management’s judgment, will continue to make scheduled periodic principal and interest payments.
We also have interest income associated with our investments in AFS debt securities. See “Investments in Debt Securities” in this Note 1 for additional information.
During the years ended December 31, 2021, 2020 and 2019, related party interest income primarily arose from a note receivable we issued to a stockholder in 2019 that was repaid during 2020 and lending activities with Apex, our former equity method investee, which were settled in February 2021. See Note 15 for additional information. Other interest income is primarily earned on our bank balances and on member deposits with our member bank holding companies that enable our SoFi Money product.balances.
Loan Origination and Sales Activities
We measure our student loans, home loans and personal loans at fair value and, therefore, all direct fees and costs related to the origination process are recognized in earnings as earned or incurred. Direct fees, which primarily relate to home loan originations, and direct loan origination costs are recorded within noninterest income—loan origination and sales and noninterest expense—cost of operations, respectively, in the consolidated statements of operations and comprehensive income (loss).
As part of our loan sale agreements, we may retain the rights to service sold loans. We calculate a gain or loss on the sale based on the sum of the proceeds from the sale and any servicing asset or liability recognized, less the carrying value of the loans sold. Our gain or loss calculation is also inclusive of repurchase liabilities recognized at the time of sale.
sale, and is recorded within For our credit card loans, direct noninterest income—loan origination, costs are deferred in other assets on the consolidated balance sheetssales, and amortized on a straight-line basis over the privilege period, which is 12 months, within interest income—loanssecuritizations in the consolidated statements of operations and comprehensive income (loss). During the year ended December 31, 2021, we amortized $1,451 of deferred costs into interest income and had a remaining balance of deferred costs of $3,422 within other assets as of December 31, 2021.loss.
Loan Commitments
We offer a program whereby applicants can lock in an interest rate on an in-school loan to be funded at a later time. Applicants can exit the loan origination process up until the loan funding date. SoFi is obligated to fund the loan at the committed terms on the disbursement date if the borrower does not cancel prior to the loan funding date. The student loan commitments meet the scope exception under ASC 815 for issuers of commitments to originate non-mortgage loans. As the writer of the commitments, we elected the fair value option to measure our unfunded student loan commitments to align with the measurement methodology of our originated student loans. As such, our student loan commitments are carried at fair value on a recurring basis. Depending on the measurement date position, student loan commitments are presented within other assets or accounts payable, accruals and other liabilities in the consolidated balance sheets. We record the initial fair value measurement and subsequent measurement changes in fair value in the period in which the changes occur within noninterest income—loan origination, sales, and salessecuritizations in the consolidated statements of operations and comprehensive income (loss). We classify student loan commitments as Level 3 because the valuations are highly dependent upon a loan funding probability, which is an unobservable input.loss.
Loan commitments also include IRLCs, whereby we commit to interest rate terms prior to completing the origination process for home loans. IRLCs are derivative instruments that are measured at fair value on a recurring basis. Given that a home loan origination is contingent on a plethora of factors, our IRLCs are inherently uncertain and unobservable. As such, we classify IRLCs as Level 3. See “Derivative Financial Instruments” Changes in this Note 1 for additional information on our derivative instruments.
See Note 9 for the key inputs used in the fair value measurements of our loan commitments.
SoFi Technologies, Inc.
SoFi Technologies, Inc.
Notes to Consolidated Financial Statements (continued)
(In Thousands, Unless Otherwise Stated and Except for Share and Per Share Data)
value are recognized within noninterest income—loan origination, sales, and securitizations in the consolidated statements of operations and comprehensive loss. See “Derivative Financial Instruments” in this Note for additional information on our derivative instruments.
See Note 15. Fair Value Measurements for the key inputs used in the fair value measurements of our loan commitments.
Revenue Recognition
In accordanceeach of our revenue arrangements, revenue is recognized when control of the promised goods or services is transferred to the customer in an amount that reflects our expected consideration in exchange for those goods or services. Our primary revenue streams for the periods presented include the following:
•Technology Products and Solutions: We earn fees for providing an integrated platform as a service for financial and non-financial institutions.
•Referrals: We earn specified referral fees in connection with referral activities we facilitate through our platform, such as referrals to third-party partners that offer services to end users who do not use one of our product offerings and referrals of pre-qualified borrowers to a third-party partner who separately contracts with a loan originator.
•Interchange: We earn interchange fees from debit and credit cardholder transactions conducted through payment networks.
•Brokerage: We earn fees in connection with facilitating investment-related transactions through our platform, such as brokerage transactions, share lending and exchange conversion.
See Note 3. Revenue for additional information on our revenue recognition policy within each revenue stream.
Advertising, Sales and Marketing
Advertising production costs and advertising communication costs, as well as amounts paid to various affiliates to market our products, are included within noninterest expense—sales and marketing in the consolidated statements of operations and comprehensive loss. Advertising costs are expensed either as incurred or when the advertising takes place, depending on the nature of the advertising activity. For the years ended December 31, 2023, 2022 and 2021, advertising totaled $284,176, $256,125 and $183,106, respectively.
Expenses incurred by us related to member acquisition, including brand development, business development and direct member marketing expenses, are also presented within noninterest expense—sales and marketing in the consolidated statements of operations and comprehensive loss.
Technology and Product Development
Expenses incurred by us related to technology, product design and implementation, which includes compensation and benefits, are classified as noninterest expense—technology and product development in the consolidated statements of operations and comprehensive loss.
Loss Contingencies
Loss contingencies, including claims and legal actions arising in the ordinary course of business, are recorded in accounts payable, accruals and other liabilities in the consolidated balance sheets. Such liabilities and associated expenses are recorded when the likelihood of loss is probable and an amount or range of loss can be reasonably estimated. Such estimates are based on the best information available at the time. As additional information becomes available, we reassess the potential liability and record an estimate in the period in which the adjustment is probable and an amount or range can be reasonably estimated. Due to the inherent uncertainties of loss contingencies, estimates may be different from the actual outcomes. With respect to legal proceedings, we recognize legal fees as they are incurred within noninterest expense—general and administrative in the consolidated statements of operations and comprehensive loss. See Note 18. Commitments, Guarantees, Concentrations and Contingencies for discussion of contingent matters.
SoFi Technologies, Inc.
SoFi Technologies, Inc.
Notes to Consolidated Financial Statements (continued)
(In Thousands, Unless Otherwise Stated and Except for Share and Per Share Data)
Restructuring
During the year ended December 31, 2023, we recognized restructuring charges of $12,749 within the following categories of expenses within noninterest expense: (i) technology and product development, (ii) sales and marketing, (iii) cost of operations, and (iv) general and administrative in the consolidated statements of operations and comprehensive loss associated with a reduction in headcount in the Technology Platform segment in the first quarter of 2023, as well as expenses in the fourth quarter of 2023 related to a reduction in headcount across the Financial Services, Lending and corporate functions, which primarily included employee-related wages, benefits and severance.
Compensation and Benefits
Total compensation and benefits, inclusive of share-based compensation expense, was $894,720, $830,298 and $608,505 for the years ended December 31, 2023, 2022 and 2021, respectively. Compensation and benefits expenses are presented within the following categories of expenses within noninterest expense: (i) technology and product development, (ii) sales and marketing, (iii) cost of operations, and (iv) general and administrative in the consolidated statements of operations and comprehensive loss.
Share-Based Compensation
Share-based compensation made to employees and non-employees, including stock options, RSUs and PSUs, is measured based on the grant date fair value of the awards and is recognized as compensation expense typically on a straight-line basis over the period during which the share-based award holder is required to perform services in exchange for the award (the vesting period) for stock options and RSUs and on an accelerated attribution basis for each vesting tranche over the respective derived service period for PSUs. Share-based compensation expense is allocated among the following categories of expenses within noninterest expense: (i) technology and product development, (ii) sales and marketing, (iii) cost of operations, and (iv) general and administrative in the consolidated statements of operations and comprehensive loss. We used the Black-Scholes Option Pricing Model (the “Black-Scholes Model”) to estimate the grant-date fair value of stock options. RSUs are measured based on the fair values of the underlying stock on the dates of grant. We use a Monte Carlo simulation model to estimate the grant-date fair value of PSUs. We recognize forfeitures as incurred and, therefore, reverse previously recognized share-based compensation expense at the time of forfeiture. See Note 16. Share-Based Compensation for further discussion of share-based compensation.
Income Taxes
We recognize deferred tax assets and liabilities for the expected future tax consequences of temporary differences between the financial reporting and tax basis of assets and liabilities, as well as for operating loss and tax credit carryforwards. Deferred tax assets and liabilities are measured using the tax rates that are expected to apply to taxable income for the years in which those tax assets and liabilities are expected to be realized or settled. In assessing the realizability of deferred tax assets, management reviews all available positive and negative evidence. Valuation allowances are recorded to reduce deferred tax assets to the amount we believe is more likely than not to be realized.
The tax effects from an uncertain tax position can be recognized in the financial statements only if the tax position would more likely than not be upheld on examination by the taxing authorities based on the merits of the tax position. Management is required to analyze all open tax years, as defined by the statute of limitations, for all jurisdictions. We accrue tax penalties and interest, if any, as incurred and recognize them within income tax (expense) benefit in the consolidated statements of operations and comprehensive loss.
Related Parties
We define related parties as members of our Board of Directors, entity affiliates, executive officers and principal owners of our outstanding stock and members of their immediate families. Related parties also include any other person or entity with significant influence over our management or operations.
SoFi Technologies, Inc.
SoFi Technologies, Inc.
Notes to Consolidated Financial Statements (continued)
(In Thousands, Unless Otherwise Stated and Except for Share and Per Share Data)
Recently Adopted Accounting Standards
Troubled Debt Restructurings and Vintage Disclosures
In March 2022, the FASB issued ASU 2022-02, Financial Instruments — Credit Losses (Topic 326): Troubled Debt Restructurings and Vintage Disclosures. The ASU addresses two topics: (i) TDR by creditors, and (ii) vintage disclosures for gross write offs. Under the TDR provisions, the ASU eliminates the recognition and measurement guidance under ASC 606,310-40, Receivables — Troubled Debt Restructurings by Creditors, and instead requires that an entity evaluate whether the modification represents a new loan or a continuation of an existing loan, consistent with the accounting for other loan modifications. Additionally, the ASU enhances existing disclosure requirements around TDRs and introduces new requirements related to certain modifications of receivables made to borrowers experiencing financial difficulty. Under the vintage disclosure provisions, the ASU requires the entity to disclose current period gross write offs by year of origination for financing receivables and net investments in leases within the scope of ASC 326-20, Financial Instruments — Credit Losses — Measured at Amortized Cost. The standard should be applied prospectively; however, for the TDR provisions, an entity has the option to apply a modified retrospective transition method. We adopted the standard effective January 1, 2023. The adoption of this standard did not have a material impact on our consolidated financial statements.
Recent Accounting Standards Issued, But Not Yet Adopted
Improvements to Reportable Segment Disclosures
In November 2023, the FASB issued ASU 2023-07, Segment Reporting (Topic 280) — Improvements to Reportable Segment Disclosures. The ASU improves reportable segment disclosure requirements, primarily through enhanced disclosures about significant segment expenses. The standard is effective for fiscal years beginning after December 15, 2023, and interim periods within fiscal years beginning after December 15, 2024. The standard should be applied retrospectively to all prior periods presented in the financial statements. We are currently evaluating the impact of this amendment on our consolidated financial statements.
Improvements to Income Tax Disclosures
In December 2023, the FASB issued ASU 2023-09, Income Taxes (Topic 740) — Improvements to Income Tax Disclosures. The ASU improves income tax disclosures primarily related to enhancements of the rate reconciliation and income taxes paid information. The standard is effective for annual periods beginning after December 15, 2024. The standard should be applied on a prospective basis with the option to apply the standard retrospectively. We are currently evaluating the impact of this amendment on our consolidated financial statements.
Note 2. Business Combinations
Merger with Social Capital Hedosophia Holdings Corp. V
On January 7, 2021, Social Finance entered into an agreement by and among Social Finance, SCH, a Cayman Islands exempted company limited by shares, and Plutus Merger Sub Inc., a Delaware corporation and a wholly owned subsidiary of SCH (“Merger Sub”), pursuant to which Merger Sub merged with and into Social Finance. Upon the Closing on May 28, 2021, the separate corporate existence of Merger Sub ceased and Social Finance survived the merger and became a wholly-owned subsidiary of SCH. On May 28, 2021, SCH also filed a notice of deregistration with the Cayman Islands Registrar of Companies, together with the necessary accompanying documents, and filed a certificate of incorporation and a certificate of corporate domestication with the Secretary of State of the State of Delaware, under which SCH was domesticated as a Delaware corporation, changing its name from “Social Capital Hedosophia Holdings Corp. V” to “SoFi Technologies, Inc.” These transactions are collectively referred to as the “Business Combination”.
The Business Combination was accounted for as a reverse recapitalization whereby SCH was determined to be the accounting acquiree and Social Finance to be the accounting acquirer. This accounting treatment was the equivalent of Social Finance issuing stock for the net assets of SCH, accompanied by a recapitalization whereby no goodwill or other intangible assets were recorded. Operations prior to the Business Combination are those of Social Finance. At the Closing, we received gross cash consideration of $764.8 million as a result of the reverse recapitalization, which was then reduced by: (i) a redemption of redeemable common stock (classified as temporary equity) of $150.0 million, (ii) a special payment made to our
SoFi Technologies, Inc.
SoFi Technologies, Inc.
Notes to Consolidated Financial Statements (continued)
(In Thousands, Unless Otherwise Stated and Except for Share and Per Share Data)
Series 1 preferred stockholders of $21.2 million (which was expensed as incurred), and (iii) our equity issuance costs of $27.5 million, consisting of advisory, legal, share registration and other professional fees, which were recorded within additional paid-in capital as a reduction of proceeds.
In connection with the Business Combination, SCH entered into subscription agreements with certain investors (the “Third Party PIPE Investors”), whereby it issued 122,500,000 shares of common stock at $10.00 per share (“PIPE Shares”) for an aggregate purchase price of $1.225 billion (“PIPE Investment”), which closed simultaneously with the consummation of the Business Combination. Upon the Closing, the PIPE Shares were automatically converted into shares of SoFi Technologies common stock on a one-for-one basis.
Upon the Closing, holders of Social Finance common stock received shares of SoFi Technologies common stock in an amount determined by application of the exchange ratio of 1.7428 (“Exchange Ratio”), which was based on Social Finance’s implied price per share prior to the Business Combination. Additionally, holders of Social Finance preferred stock (with the exception of the Series 1 preferred stockholders) received shares of SoFi Technologies common stock in amounts determined by application of either the Exchange Ratio or a multiplier of the Exchange Ratio, as provided by the Agreement.
Acquisition of Golden Pacific Bancorp, Inc.
On February 2, 2022, we acquired Golden Pacific, pursuant to an Agreement and Plan of Merger dated as of March 8, 2021 by and among the Company, a wholly-owned subsidiary of the Company, and Golden Pacific. In the business combination, we acquired all of the outstanding equity interests in Golden Pacific for total cash purchase consideration of $22.3 million (the “Bank Merger”). The acquisition was not determined to be a significant acquisition. After closing the Bank Merger, we became a bank holding company and Golden Pacific began operating as SoFi Bank. We are duly registered as a bank holding company with the Federal Reserve. SoFi Bank is a national banking association whose primary federal regulator is the OCC. Deposit accounts of SoFi Bank are insured by the FDIC through the Deposit Insurance Fund to the fullest extent permitted by law.
The closing of the Bank Merger was subject to regulatory approval. On January 18, 2022, we received approval from the Federal Reserve of our application to become a bank holding company under the Bank Holding Company Act, and we received conditional approval from the OCC to close the Bank Merger. The OCC also approved our application to change the composition of Golden Pacific’s assets in connection with the Bank Merger. The OCC conditional approval imposed a number of conditions, including that SoFi Bank have initial paid-in capital of no less than $750 million and adhere to an operating agreement. Golden Pacific’s community bank business continues to operate as a division of SoFi Bank.
A portion of the total cash purchase consideration ($0.6 million) was held back by the Company to satisfy any indemnification or certain other obligations (“Holdback Amount”), as certain legal proceedings with which Golden Pacific is involved as a plaintiff were not resolved at the time the Bank Merger closed. During 2022, we incurred costs associated with the litigation involving Golden Pacific as a plaintiff in excess of the Holdback Amount. Therefore, none of the Holdback Amount will be released to the Golden Pacific shareholders. Additionally, we held back a $3.3 million payable to a dissenting Golden Pacific shareholder pending resolution of the shareholder’s dissenter’s rights appraisal claim. During the fourth quarter of 2023, the appraisal claim was settled and payment was released.
Acquisition of Technisys S.A.
On March 3, 2022, we acquired Technisys S.A., a Luxembourg société anonyme, (“Technisys”), pursuant to an Agreement and Plan of Merger dated as of February 19, 2022 and amended as of March 3, 2022, by and among the Company, Technisys, Atom New Delaware, Inc., a Delaware corporation and a wholly owned subsidiary of Atom, and Atom Merger Sub Corporation, a Delaware corporation and wholly owned subsidiary of SoFi Technologies (the “Technisys Merger”). In the business combination, we acquired all of the outstanding equity interests in Technisys for a preliminary purchase consideration of $915.4 million. During the third quarter of 2022, we finalized the closing net working capital calculation specified in the merger agreement, which resulted in a reduction to the equity consideration of 155,794 shares, representing an adjustment to the total purchase consideration of $1,665, and a corresponding reduction to the carrying value of recognized goodwill. The remaining 442,274 shares that were held in escrow associated with the working capital calculation were released to the former Technisys shareholders. The finalized closing net working capital calculation did not impact the estimated fair values of the assets acquired and liabilities assumed in conjunction with the transaction.
SoFi Technologies, Inc.
SoFi Technologies, Inc.
Notes to Consolidated Financial Statements (continued)
(In Thousands, Unless Otherwise Stated and Except for Share and Per Share Data)
The following table presents the components of the total purchase consideration to acquire Technisys as of December 31, 2022:
| | | | | |
Fair value of common stock issued(1) | $ | 873,377 | |
| Amounts payable to settle vested employee performance awards | 37,297 | |
Fair value of awards assumed(2) | 2,855 | |
| Settlement of pre-combination transactions between acquirer and acquiree | 235 | |
| Total purchase consideration | $ | 913,764 | |
___________________
(1) Reflects the shares of SoFi common stock issued in the acquisition of 81,700,318, multiplied by the closing stock price of SoFi common stock on the closing date of the Technisys Merger. Additionally, these shares are inclusive of 6,305,595 shares that were held in escrow.
(2) We contemporaneously converted outstanding performance awards into RSUs to acquire common stock of SoFi (“Replacement Awards”). The fair value of awards assumed in the purchase consideration was based on the closing stock price of SoFi common stock on the closing date of the Technisys Merger.
We settled vested employee performance awards, which were a component of the purchase consideration above, with payments during the years ended December 31, 2023 and 2022 of $19,656 and $17,641, respectively. During the year ended December 31, 2023, we released 6,259,736 escrow shares during the second and fourth quarters of 2023. The remaining 45,859 shares continue to be held in escrow pending resolution of outstanding indemnification claims by SoFi.
The following unaudited supplemental pro forma financial information presents the Company’s consolidated results of operations as if the business combination had occurred on January 1, 2020:
| | | | | | | | | | | | | | | | |
| | Year Ended December 31, |
| | 2022 | | 2021 | | |
| Total net revenue | | $ | 1,584,439 | | | $ | 1,055,219 | | | |
| Net loss | | (311,512) | | | (512,785) | | | |
The unaudited supplemental pro forma financial information is presented for comparative purposes only and is not necessarily indicative of the actual results of operations that would have been achieved, nor is it indicative of future results of operations. The unaudited supplemental pro forma financial information reflects pro forma adjustments that give effect to applying the Company’s accounting policies and certain events the Company believes to be directly attributable to the acquisition. The pro forma adjustments primarily include:
•incremental straight-line amortization expense associated with acquired intangible assets;
•an adjustment to reflect post-combination share-based compensation expense associated with the Replacement Awards as if the conversion had occurred on January 1, 2020;
•an adjustment to reflect acquisition-related costs for both parties as if they were incurred during the earliest period presented; and
•the related income tax effects, at the statutory tax rate applicable for each period, of the pro forma adjustments noted above.
The unaudited supplemental pro forma financial information does not give effect to any anticipated cost savings, operating efficiencies or other synergies that may be associated with the acquisition, or any estimated costs that have been or will be incurred by the Company to integrate the assets and operations of Technisys.
Acquisition of Wyndham Capital Mortgage
On April 3, 2023, we acquired all of the outstanding equity interests in Wyndham for cash consideration. With the acquisition of Wyndham, a fintech mortgage lender, we broadened our suite of home loan products and now manage the technology for a digitized mortgage experience. The acquisition is being accounted for as a business combination. The purchase consideration is being allocated to the tangible and intangible assets acquired and liabilities assumed based on the estimated fair values as of the acquisition date. The excess of the total purchase consideration over the fair value of the net assets acquired is allocated to goodwill, which is expected to be deductible for tax purposes. The fair value estimates are subject to change for up
SoFi Technologies, Inc.
SoFi Technologies, Inc.
Notes to Consolidated Financial Statements (continued)
(In Thousands, Unless Otherwise Stated and Except for Share and Per Share Data)
to one year after the acquisition date as additional information becomes available. The acquisition was not determined to be a significant acquisition.
In each of our revenue arrangements, revenue is recognized when control of the promised goods or services is transferred to the customer in an amount that reflects our expected consideration in exchange for those goods or services.
Technology Platform FeesProducts and Solutions
Commencing in May 2020 with our acquisition of Galileo, weWe earn technology platform fees for providing an integrated platform-as-a-serviceplatform as a service for financial and non-financial institutions. Within our technology platformproducts and solutions fee arrangements, certain contracts contain a provision for a fixed, upfront implementation fee related to setup activities, which represents an advance payment for future technology platform services. Ourservices provided over the contract term. These implementation fees are recognized ratably over the contract life,life.
Commencing in March 2022 with the Technisys Merger, we earn subscription and service fees for providing software licenses and associated services, including implementation and maintenance. We charge a recurring subscription fee for the software license and related maintenance services. Other software-related services are billed on a periodic basis as the services are provided. Certain arrangements for software and related services contain a provision for a fixed upfront payment.
We recognize revenue related to software licenses at a point in time upon delivery of the license and the close of the user-acceptance testing period. When implementation services are distinct, we considerrecognize revenue over time during the implementation fee partially earned each month thatperiod. We recognize maintenance services ratably over the contractual maintenance term. If a fixed upfront payment provides a material right to the customer, we meetrecognize revenue associated with the material right over the period of benefit associated with the right to subscribe or renew a subscription, which is typically the product life.
We allocate fees charged for software and related services to our performance obligation overobligations on the lifebasis of the contract. We had deferred revenuesrelative standalone selling price. The standalone selling prices either represent the prices at which we separately sell each license or service or are estimated using available information, such as market conditions and internal pricing policies. The standalone selling price of $2,553the software license and $2,520 asmaintenance are determined based on the complexity and size of December 31, 2021 and 2020, respectively, which are presented within accounts payable, accruals and other liabilities in the consolidated balance sheets. During the years ended December 31, 2021 and 2020, we recognized revenue of $685 and $342, respectively, associated with deferred revenues within noninterest income—technology platform fees in the consolidated statements of operations and comprehensive income (loss).
Sales commissions: Capitalized sales commissions presented within other assets in the consolidated balance sheets, which are incurred in connection with obtaining a technology platform-as-a-service contract, were $678 and $527 as of December 31, 2021 and 2020, respectively. Additionally, we incur ongoing monthly commissions, which are expensed as incurred, as the benefit of such sales efforts are realized only in the period in which the commissions are earned. During the year ended December 31, 2021, commissions recorded within noninterest expense—sales and marketing in the consolidated statements of operations and comprehensive income (loss) were $3,302, of which $267 represented amortization of capitalized sales commissions. During the year ended December 31, 2020, commissions were $1,659, of which $185 represented amortization of capitalized sales commissions.license.
Payments to customers: Certain contracts include provisions for customerWe may provide incentives to our technology platform customers, which may be payable up front or applied to future or past technology platformproducts and solutions fees. PaymentsEvaluating whether such incentives are payments to customers reducea customer requires judgment. When we determine that an incentive is consideration payable to a customer, the gross transaction price,incentive is recorded as theya reduction of revenue. Incentives that represent consideration payable to a customer may also contain variable consideration. Therefore, such incentives are constraints on the revenuesrevenue expected to be realized. Upfront customer incentives are recorded as prepaid assets and presented within other assets in the consolidated balance sheets, and are applied against revenue in the period such incentives are earned by the customer. Customer incentives for future technology platform fees are applied ratably against future Technology Platform activity in accordance with the contract terms to the extent that cumulative revenues with the customer, net of incentives, are positive. Any incentive in excess of cumulative revenuesrevenue is expensed as a contract cost. Customer incentives for past technology
Referrals
We earn specified referral fees in connection with certain referral activities we facilitate through our platform. In one type of referral arrangement, we refer end users through our platform fees are recordedto third-party enterprise partners. Our referral fee is calculated as either a reduction to revenue in the period incurred, subject to the same cumulative revenue constraints.
Payment Network Fees
In customer arrangements separate from our technology platform fees, we earn payment network fees, which primarily constitute interchange fees, for satisfying our performance obligation to enable transactions throughfixed price per successful referral or a payment network as the sponsorpercentage of such transactions. Interchange fees, which are remitted by the merchant, are calculated by multiplying a set fee percentage (as stipulated by the debit card payment network) by the transaction volume processed through such network. Transaction volumebetween the enterprise partners and relatedreferred consumers. In another type of referral arrangement, we earn referral fulfillment fees payablefor providing pre-qualified borrower referrals to us for interchange and other networka third-party partner who separately contracts with a loan originator. Our referral fees are reportedbased on the referred loan amount, subject to us on a daily basis. Therefore, therereferral fulfillment fee penalty if a loan is no constrained variable consideration withindetermined to be ineligible and becomes a reporting period. Usingcharged-off loan as defined in the expectedcontract. We recognize revenue for each originated loan, less the estimated referral fulfillment fee penalty. The estimated referral fulfillment fee penalty was immaterial as of December 31, 2023 and 2022.
Interchange
We earn interchange fees from debit and credit cardholder transactions conducted through payment networks. Interchange fees from cardholder transactions represent a percentage of the underlying transaction value method, we assign a 100% probability to the transaction price as calculated using actual transaction volume processed through the payment network.
Our performance obligation is completely satisfied once we successfully fulfill a requested transaction. We measure our progress toward complete satisfaction of our performance obligation using the output method, with processed transaction volume representing the measure that faithfully depicts the transfer of our services. The value of our services is represented by the network fee rates, as stipulated by the applicable payment network.
In addition to payment network fees earned on our own branded cards, we also earn payment network fees for serving as a transaction card program manager for enterprise customers thatand are the program marketers for separate card programs. In these arrangements, we have 2 performance obligations: i) performing card program services, and ii) performing transactionrecognized
SoFi Technologies, Inc.
SoFi Technologies, Inc.
Notes to Consolidated Financial Statements (continued)
(In Thousands, Unless Otherwise Stated and Except for Share and Per Share Data)
card enablement services, for which we arrange for performance by the network associations and bank issuers to enable certain aspects ofdaily, concurrently with the transaction card process. The transaction price in these arrangements is largely dependent on network association guidelines and the program management economics are pooled, with the Company receiving a contractual share of payment network fees.
The payment network fees are determined based on the type and volume of monthly card program activity and, therefore, represent variable consideration, as such amounts are not known at contract inception. However, as payment network fees are settled on a monthly basis, the variable consideration within a reporting period is not constrained. We satisfy both performance obligations continuously throughout the contractual arrangements and our customers receive and consume the benefits simultaneously as we perform. Further, satisfaction of both performance obligations occurs within the same measurement period. As such, allocation of the transaction price between the performance obligations is not meaningful, as it would not impact the pattern of revenue recognition. Using the expected value method, we assign a 100% probabilityprocessing services provided to the transaction price as calculated using actual monthly card program activity.
Our program management performance obligations are completely satisfied once we successfully enable and process transaction card activity. We measure our progress toward complete satisfactioncardholder. Interchange is presented net of our performance obligations using the output method,cardholder rewards associated with card program activity representing the measure that faithfully depicts the transfer of program management services. The value of our services is represented by the transaction fee rates, as stipulated by the network association guidelines.
In our payment network fee transactions, we act in the capacity of an agent due to our lack of pricing power and because we are not primarily responsible for fulfilling the transaction enablement performance obligation, and ultimately lack control over fulfilling the performance obligations to the customer. Therefore, we recognize revenue net of fees paid to other parties within the payment networks.
Referrals
We earn specified referral fees in connection with referral activities we facilitate through our platform.
In one type of referral arrangement, the referral fee is paid to us by third-party partners that offer services to end users who do not use one of our product offerings, but who were referred to the partners through our platform. As such, the third-party enterprise partners are our customers in these referral arrangements.
Our single performance obligation is to present referral leads to our enterprise partner customers. In some instances, the referral fee is calculated by multiplying a set fee percentage by the dollar amount of a completed transaction between our partners and their customers. In other instances, the referral fee represents the price per referral multiplied by the number of referrals (referred units) as measured by a consummated transaction between our partners and their customers.
As the transaction volume or referred units are not known at contract inception, these arrangements contain variable consideration. However, as referral fees are billed to, and collected directly from, our partners on a monthly basis, the variable consideration within a reporting period is not constrained. We recognize revenue at the time of a referral-based transaction by applying the expected value method, wherein we assign 100% probability to the transaction price as calculated using actual transaction volume or referred units.
We satisfy our performance obligation continuously throughout the contractual arrangements with our partners and our partners receive and consume the benefits simultaneously as we perform. Our referral fee performance obligation is completely satisfied once we provide referrals to our partners and there is a consummated transaction. We measure our progress toward complete satisfaction of our performance obligation using the output method, with referred units or referred transaction volume representing the measure that faithfully depicts the transfer of referral services to our partners. The value of our services transferred to our partners is represented by the referral fee rate, as agreed upon at contract inception.
In this type of referral arrangement, we act in the capacity of a principal, as we are primarily responsible for fulfilling our referral promise to our enterprise customers, exhibit control, and have discretion in setting the price we charge to our enterprise customers. Therefore, we present our revenue on a gross basis.
Beginning in the third quarter of 2021, we entered into another type of referral arrangement whereby we earn referral fulfillment fees for providing pre-qualified borrower referrals to a third-party partner who separately contracts with a loan
SoFi Technologies, Inc.
Notes to Consolidated Financial Statements (continued)
(In Thousands, Unless Otherwise Stated and Except for Share and Per Share Data)
originator, which is our single performance obligation in the arrangement. Under the initial agreement, the referral fulfillment fee was determined as the lower of a fixed per-loan amount or the multiplication of a set fee percentage by the aggregate loan origination principal balance. Through amendments to the agreement executed during the fourth quarter of 2021, the referral fulfillment fee on each referred loan is determined as either of two fixed amounts based on the aggregate origination principal balance of the loan. In the event that a loan is determined to be ineligible and such loan becomes a charged-off loan, both as defined in the contract agreement (referred to as an “ineligible charged-off loan”), we must re-pay to the customer the outstanding principal amount plus all accrued but unpaid interest of the ineligible charged-off loan, as well as a pro rata amount of fees previously paid for the ineligible charged-off loan (referred to as the “referral fulfillment fee penalty”).
As the number and size of referred loans are not known at contract inception, this arrangement contains variable consideration that is constrained due to the potential reversal of referral fulfillment fees. We elected to estimate the amount of variable consideration using the expected value method, wherein we evaluate the conditional probability of ineligible loan charge-offs and, thereby, estimate referral fulfillment fee penalties. This method is appropriate for our arrangement, as we have meaningful experience through our lending business in evaluating expected ineligible referrals. The revenue recognized using the expected value method reflects our estimated net referral fulfillment fees after adjusting for the estimated referral fulfillment fee penalty. Referral fulfillment fees are presented within noninterest income—other in the consolidated statements of operations and comprehensive income (loss). We recognize a liability within accounts payable, accruals and other liabilities in the consolidated balance sheets for the estimated referral fulfillment fee penalty, which represents the amount of consideration received that we estimate will reverse. The liability was $118 as of December 31, 2021.
We satisfy our performance obligation continuously throughout the contractual arrangement with our customer and our customer receives and consumes the benefits simultaneously as we perform. We completely satisfy our performance obligation each time we provide a loan referral and our customer purchases the underlying loan from the third-party loan originator. We apply the right-to-invoice practical expedient to recognize referral fulfillment fees, as our right to consideration corresponds directly with the value of the service received, as measured using the expected value method and application of the referral fulfillment fee rate. In this arrangement, we act in the capacity of a principal, as we are primarily responsible for fulfilling our referral obligation to our customer, we have risk of loss if the loans that comprise our referral fulfillment services do not meet the contractual eligibility standards, and we have discretion in setting the price we charge to our customer. Therefore, we present our revenue on a gross basis.
Enterprise Services
We earn specified enterprise services fees in connection with services we provide to enterprise partners.
In one type of enterprise services arrangement, we earn fees in connection with services we provide to enterprise partners to facilitate transactions for the benefit of their employees, such as 529 plan contributions or student loan payments, which represents our single performance obligation in the arrangements. Similar to our referral services, we agree on a rate per transaction with each of our customers, which represents variable consideration at contract inception. However, as enterprise service fees are billed to, and collected directly from, our partners on a monthly basis, the variable consideration within a reporting period is not constrained.
We satisfy our performance obligation to provide enterprise services continuously throughout our contractual arrangements with our enterprise partners. Our enterprise partners receive and consume the benefits of our enterprise services simultaneously as we perform. Our enterprise service performance obligation is completely satisfied upon completion of a transaction on behalf of our enterprise partners. For instance, we may facilitate student loan payments made by enterprise partners on behalf of their employees by directing those payments to the appropriate student loan servicer. Once the student loan servicer recognizes the payment, the transaction and our performance obligation are simultaneously complete. We measure our progress toward complete satisfaction of our performance obligation using the output method, with completed transaction requests representing the measure that faithfully depicts the transfer of enterprise services. The value of our enterprise services is represented by a negotiated fee, as agreed upon at contract inception. Our revenue is reported on a gross basis, as we act in the capacity of a principal, demonstrate the requisite control over the service, and are primarily responsible for fulfilling the performance obligation to our enterprise service customer.
Beginning in the second quarter of 2021, we entered into another type of enterprise services arrangement whereby we earn fees for providing advisory services in connection with helping operating companies successfully complete the business combination process, inclusive of obtaining the required shareholder votes. The amount of revenue is recorded on a gross basis
SoFi Technologies, Inc.
Notes to Consolidated Financial Statements (continued)
(In Thousands, Unless Otherwise Stated and Except for Share and Per Share Data)
within noninterest income—other in the consolidated statements of operations and comprehensive income (loss), as we fully control the fulfillment of our performance obligation acting in the capacity of a principal. Out-of-pocket expenses associated with satisfying the performance obligation are recognized at the time the related revenue is recognized and presented as part of noninterest expense—general and administrative.
Equity Capital Markets Services
Beginning in the second quarter of 2021, we earned underwriting fees related to our membership in underwriting syndicates for initial public offerings (“IPOs”). The underwriting of securities is the only performance obligation in our underwriting agreements, and we recognize underwriting fees on the trade date. We are a principal in our underwriting agreements, because we demonstrate the requisite control over the satisfaction of the performance obligation through the assumption of underwriter liability for our designated share allotment. As such, we recognize revenue on a gross basis.
Beginning in the fourth quarter of 2021, we also earned dealer fees for providing dealer services in partnership with underwriting syndicates for IPOs. We are engaged to place IPO shares that are allocated to us by the underwriters with third-party investors for which we have received a confirmed order, which represents our only performance obligation in the arrangement. The amount of consideration to which we are entitled represents the selling concession (spread between our purchase price and the offer price, which are set by the underwriting syndicate), multiplied by the number of shares we placed in the IPO deal. The share allocation is ultimately determined by the underwriter. We recognize revenue on the trade date. We are an agent in this arrangement, as we do not share in any underwriting liability, do not bear risk of loss if shares remain unpurchased, and do not establish the price, which is set by the underwriting syndicate. As the amount of dealer fees recognized is reflective of the number of allocated shares we sold to third-party investors, we apply the right-to-invoice practical expedient.
We recognize equity capital markets services revenue, consisting of both underwriting fees and dealer fees, within noninterest income—other in the consolidated statements of operations and comprehensive income (loss).transactions.
Brokerage
We earn fees in connection with facilitating investment-related transactions through our platform, which constitutes our single performance obligation in the arrangements.we refer to as brokerage revenue. Our brokerage revenue performance obligation is determined bygenerally completely satisfied upon the specific service selected by the customer, such as brokerage transactions, share lending, digital assets transactions and exchange conversion.completion of an investment-related transaction. In certain brokerage transactions,general, we act as the agent in the capacity of a principal and earn negotiated fees based on the number and type of transactions requested by our customers. In our share lendingthese arrangements and pay for order flow arrangements,as we do not oversee the execution of the transactions and ultimately lack the requisite control, but benefit through a negotiated revenue sharing arrangement. Therefore, we act in the capacity of an agent and recognize revenue net of fees paid to satisfy the performance obligation. In our digital assets arrangements, our fee is calculated as a negotiated percentage of the transaction volume. In these arrangements, we act in the capacity of a principal and recognize revenue gross of the fees we pay to obtain the digital assets for access by our members. In our exchange conversion arrangements, we act in the capacity of a principal and earn fees for exchanging one currency for another.control.
As the investment-related transaction volume and type are not known at contract inception, these arrangements contain variable consideration. However, as our brokerage fees are settled on a monthly basis or sometimes daily basis, the variable consideration within a reporting period is not constrained. We recognize revenue at the time of an investment transaction by applying the expected value method, wherein we assign 100% probability to the transaction price as calculated using actual investment transaction activity.
Our brokerage performance obligation is completely satisfied upon completion of an investment-related transaction. We measure our progress toward complete satisfaction of our performance obligation using the output method, with investment transaction activity representing the measure that faithfully depicts the transfer of brokerage services. The value of our brokerage services is represented by the transaction fees, as determined at the point of transaction.
We incur costs for clearing and processing services that relate to satisfied performance obligations within our brokerage arrangements. In accordance with ASC 340-40, Other Assets and Deferred Costs — Contracts with Customers, we expense these costs as incurred. Although certain of our commission costs qualify for capitalization, their amortization period is less than one year. Therefore, utilizing the practical expedient related to incremental costs of obtaining a contract, we expense
SoFi Technologies, Inc.
Notes to Consolidated Financial Statements (continued)
(In Thousands, Unless Otherwise Stated and Except for Share and Per Share Data)
these costs as incurred. Additionally, we pay upfront account funding incentives to customers that are not tied to a contract period. Therefore, we expense these payments as incurred.
In the fourth quarter of 2021, we introduced a flat monthly platform fee that is charged to members associated with our 8 Limited business in Hong Kong. The fee is assessed at each month end on all members with at least one open 8 Limited brokerage account (with the exception of accounts for which the applicable fee exceeds the account’s net asset value at month end) regardless of the volume or frequency of trading activity during the month. The fee is deducted directly from the member’s primary brokerage account on the first day of the subsequent month. Our single performance obligation is to stand ready to provide the specific brokerage service selected by the member. As the number of members with open accounts that satisfy the net asset value threshold at any month end are not known at contract inception, this arrangement contains variable consideration. However, as the monthly platform fees are settled on a monthly basis, the variable consideration within a reporting period is not constrained. Our members simultaneously receive and consume the benefits of our platform throughout the month to which the fee applies. We apply the right-to-invoice practical expedient to recognize the monthly platform fee, as the amount to which we are entitled at month end corresponds to the value of our performance completed for the month.
Contract Assets
As of December 31, 2021 and 2020, accounts receivable, net associated with revenue from contracts with customers was $33,748 and $23,278, respectively, which were reported within other assets in the consolidated balance sheets.
Disaggregated RevenueTechnology and Product Development
For the periods accounted for in accordance with ASC 606, the table below presents revenue from contracts with customers disaggregatedExpenses incurred by type of service,us related to technology, product design and implementation, which best depicts how the revenueincludes compensation and cash flowsbenefits, are affected by economic factors, and by the reportable segment to which each revenue stream relates. Revenues from contracts with customers are presented withinclassified as noninterest income—expense—technology platform feesand noninterest income—otherproduct development in the consolidated statements of operations and comprehensive income (loss). Thereloss.
Loss Contingencies
Loss contingencies, including claims and legal actions arising in the ordinary course of business, are no revenuesrecorded in accounts payable, accruals and other liabilities in the consolidated balance sheets. Such liabilities and associated expenses are recorded when the likelihood of loss is probable and an amount or range of loss can be reasonably estimated. Such estimates are based on the best information available at the time. As additional information becomes available, we reassess the potential liability and record an estimate in the period in which the adjustment is probable and an amount or range can be reasonably estimated. Due to the inherent uncertainties of loss contingencies, estimates may be different from contracts with customers attributablethe actual outcomes. With respect to our Lending segmentlegal proceedings, we recognize legal fees as they are incurred within noninterest expense—general and administrative in the consolidated statements of operations and comprehensive loss. See Note 18. Commitments, Guarantees, Concentrations and Contingencies for anydiscussion of the years presented.
| | | | | | | | | | | | | | | | | |
| Year Ended December 31, |
| 2021 | | 2020 | | 2019 |
| Financial Services | | | | | |
| Referrals | $ | 15,750 | | | $ | 5,889 | | | $ | 3,652 | |
| Brokerage | 22,733 | | | 3,470 | | | 84 | |
| Payment network | 10,642 | | | 2,433 | | | 660 | |
| Equity capital markets services | 2,643 | | | — | | | — | |
| Enterprise services | 2,898 | | | 244 | | | 124 | |
| Total | $ | 54,666 | | | $ | 12,036 | | | $ | 4,520 | |
| Technology Platform | | | | | |
| Technology platform fees | $ | 191,847 | | | $ | 90,128 | | | $ | — | |
| Payment network | 1,205 | | | 1,167 | | | — | |
| Total | $ | 193,052 | | | $ | 91,295 | | | $ | — | |
| Total Revenue from Contracts with Customers | | | | | |
| Technology platform fees | $ | 191,847 | | | $ | 90,128 | | | $ | — | |
| Referrals | 15,750 | | | 5,889 | | | 3,652 | |
| Payment network | 11,847 | | | 3,600 | | | 660 | |
| Brokerage | 22,733 | | | 3,470 | | | 84 | |
| Equity capital markets services | 2,643 | | | — | | | — | |
| Enterprise services | 2,898 | | | 244 | | | 124 | |
| Total | $ | 247,718 | | | $ | 103,331 | | | $ | 4,520 | |
SoFi Technologies, Inc.
SoFi Technologies, Inc.
Notes to Consolidated Financial Statements (continued)
(In Thousands, Unless Otherwise Stated and Except for Share and Per Share Data)
Advertising, Sales and MarketingRestructuring
IncludedDuring the year ended December 31, 2023, we recognized restructuring charges of $12,749 within the following categories of expenses within noninterest expense—expense: (i) technology and product development, (ii) sales and marketing, (iii) cost of operations, and (iv) general and administrative in the consolidated statements of operations and comprehensive income (loss) are advertising production costs and advertising communication costs,loss associated with a reduction in headcount in the Technology Platform segment in the first quarter of 2023, as well as amounts paidexpenses in the fourth quarter of 2023 related to various affiliates to market our products. Fora reduction in headcount across the Financial Services, Lending and corporate functions, which primarily included employee-related wages, benefits and severance.
Compensation and Benefits
Total compensation and benefits, inclusive of share-based compensation expense, was $894,720, $830,298 and $608,505 for the years ended December 31, 2023, 2022 and 2021, 2020respectively. Compensation and 2019, advertising totaled $183,106, $138,888 and $169,942, respectively. Advertising costs are expensed either as incurred or when the advertising takes place, depending on the nature of the advertising activity.
Expenses incurred by us related to member acquisition, including brand development, business development and direct member marketingbenefits expenses are also presented within the following categories of expenses within noninterest expense—expense: (i) technology and product development, (ii) sales and marketing, (iii) cost of operations, and (iv) general and administrativein the consolidated statements of operations and comprehensive loss.
Share-Based Compensation
Share-based compensation made to employees and non-employees, including stock options, RSUs and PSUs, is measured based on the grant date fair value of the awards and is recognized as compensation expense typically on a straight-line basis over the period during which the share-based award holder is required to perform services in exchange for the award (the vesting period) for stock options and RSUs and on an accelerated attribution basis for each vesting tranche over the respective derived service period for PSUs. Share-based compensation expense is allocated among the following categories of expenses within noninterest expense: (i) technology and product development, (ii) sales and marketing, (iii) cost of operations, and (iv) general and administrative in the consolidated statements of operations and comprehensive loss. We used the Black-Scholes Option Pricing Model (the “Black-Scholes Model”) to estimate the grant-date fair value of stock options. RSUs are measured based on the fair values of the underlying stock on the dates of grant. We use a Monte Carlo simulation model to estimate the grant-date fair value of PSUs. We recognize forfeitures as incurred and, therefore, reverse previously recognized share-based compensation expense at the time of forfeiture. See Note 16. Share-Based Compensation for further discussion of share-based compensation.
Income Taxes
We recognize deferred tax assets and liabilities for the expected future tax consequences of temporary differences between the financial reporting and tax basis of assets and liabilities, as well as for operating loss and tax credit carryforwards. Deferred tax assets and liabilities are measured using the tax rates that are expected to apply to taxable income (loss).for the years in which those tax assets and liabilities are expected to be realized or settled. In assessing the realizability of deferred tax assets, management reviews all available positive and negative evidence. Valuation allowances are recorded to reduce deferred tax assets to the amount we believe is more likely than not to be realized.
The tax effects from an uncertain tax position can be recognized in the financial statements only if the tax position would more likely than not be upheld on examination by the taxing authorities based on the merits of the tax position. Management is required to analyze all open tax years, as defined by the statute of limitations, for all jurisdictions. We accrue tax penalties and interest, if any, as incurred and recognize them within income tax (expense) benefit in the consolidated statements of operations and comprehensive loss.
Related Parties
We define related parties as members of our Board of Directors, entity affiliates, executive officers and principal owners of our outstanding stock and members of their immediate families. Related parties also include any other person or entity with significant influence over our management or operations.
SoFi Technologies, Inc.
SoFi Technologies, Inc.
Notes to Consolidated Financial Statements (continued)
(In Thousands, Unless Otherwise Stated and Except for Share and Per Share Data)
Recently Adopted Accounting Standards
Troubled Debt Restructurings and Vintage Disclosures
In March 2022, the FASB issued ASU 2022-02, Financial Instruments — Credit Losses (Topic 326): Troubled Debt Restructurings and Vintage Disclosures. The ASU addresses two topics: (i) TDR by creditors, and (ii) vintage disclosures for gross write offs. Under the TDR provisions, the ASU eliminates the recognition and measurement guidance under ASC 310-40, Receivables — Troubled Debt Restructurings by Creditors, and instead requires that an entity evaluate whether the modification represents a new loan or a continuation of an existing loan, consistent with the accounting for other loan modifications. Additionally, the ASU enhances existing disclosure requirements around TDRs and introduces new requirements related to certain modifications of receivables made to borrowers experiencing financial difficulty. Under the vintage disclosure provisions, the ASU requires the entity to disclose current period gross write offs by year of origination for financing receivables and net investments in leases within the scope of ASC 326-20, Financial Instruments — Credit Losses — Measured at Amortized Cost. The standard should be applied prospectively; however, for the TDR provisions, an entity has the option to apply a modified retrospective transition method. We adopted the standard effective January 1, 2023. The adoption of this standard did not have a material impact on our consolidated financial statements.
Recent Accounting Standards Issued, But Not Yet Adopted
Improvements to Reportable Segment Disclosures
In November 2023, the FASB issued ASU 2023-07, Segment Reporting (Topic 280) — Improvements to Reportable Segment Disclosures. The ASU improves reportable segment disclosure requirements, primarily through enhanced disclosures about significant segment expenses. The standard is effective for fiscal years beginning after December 15, 2023, and interim periods within fiscal years beginning after December 15, 2024. The standard should be applied retrospectively to all prior periods presented in the financial statements. We are currently evaluating the impact of this amendment on our consolidated financial statements.
Improvements to Income Tax Disclosures
In December 2023, the FASB issued ASU 2023-09, Income Taxes (Topic 740) — Improvements to Income Tax Disclosures. The ASU improves income tax disclosures primarily related to enhancements of the rate reconciliation and income taxes paid information. The standard is effective for annual periods beginning after December 15, 2024. The standard should be applied on a prospective basis with the option to apply the standard retrospectively. We are currently evaluating the impact of this amendment on our consolidated financial statements.
Note 2. Business Combinations
Merger with Social Capital Hedosophia Holdings Corp. V
On January 7, 2021, Social Finance entered into an agreement by and among Social Finance, SCH, a Cayman Islands exempted company limited by shares, and Plutus Merger Sub Inc., a Delaware corporation and a wholly owned subsidiary of SCH (“Merger Sub”), pursuant to which Merger Sub merged with and into Social Finance. Upon the Closing on May 28, 2021, the separate corporate existence of Merger Sub ceased and Social Finance survived the merger and became a wholly-owned subsidiary of SCH. On May 28, 2021, SCH also filed a notice of deregistration with the Cayman Islands Registrar of Companies, together with the necessary accompanying documents, and filed a certificate of incorporation and a certificate of corporate domestication with the Secretary of State of the State of Delaware, under which SCH was domesticated as a Delaware corporation, changing its name from “Social Capital Hedosophia Holdings Corp. V” to “SoFi Technologies, Inc.” These transactions are collectively referred to as the “Business Combination”.
The Business Combination was accounted for as a reverse recapitalization whereby SCH was determined to be the accounting acquiree and Social Finance to be the accounting acquirer. This accounting treatment was the equivalent of Social Finance issuing stock for the net assets of SCH, accompanied by a recapitalization whereby no goodwill or other intangible assets were recorded. Operations prior to the Business Combination are those of Social Finance. At the Closing, we received gross cash consideration of $764.8 million as a result of the reverse recapitalization, which was then reduced by: (i) a redemption of redeemable common stock (classified as temporary equity) of $150.0 million, (ii) a special payment made to our
SoFi Technologies, Inc.
SoFi Technologies, Inc.
Notes to Consolidated Financial Statements (continued)
(In Thousands, Unless Otherwise Stated and Except for Share and Per Share Data)
Series 1 preferred stockholders of $21.2 million (which was expensed as incurred), and (iii) our equity issuance costs of $27.5 million, consisting of advisory, legal, share registration and other professional fees, which were recorded within additional paid-in capital as a reduction of proceeds.
In connection with the Business Combination, SCH entered into subscription agreements with certain investors (the “Third Party PIPE Investors”), whereby it issued 122,500,000 shares of common stock at $10.00 per share (“PIPE Shares”) for an aggregate purchase price of $1.225 billion (“PIPE Investment”), which closed simultaneously with the consummation of the Business Combination. Upon the Closing, the PIPE Shares were automatically converted into shares of SoFi Technologies common stock on a one-for-one basis.
Upon the Closing, holders of Social Finance common stock received shares of SoFi Technologies common stock in an amount determined by application of the exchange ratio of 1.7428 (“Exchange Ratio”), which was based on Social Finance’s implied price per share prior to the Business Combination. Additionally, holders of Social Finance preferred stock (with the exception of the Series 1 preferred stockholders) received shares of SoFi Technologies common stock in amounts determined by application of either the Exchange Ratio or a multiplier of the Exchange Ratio, as provided by the Agreement.
Acquisition of Golden Pacific Bancorp, Inc.
On February 2, 2022, we acquired Golden Pacific, pursuant to an Agreement and Plan of Merger dated as of March 8, 2021 by and among the Company, a wholly-owned subsidiary of the Company, and Golden Pacific. In the business combination, we acquired all of the outstanding equity interests in Golden Pacific for total cash purchase consideration of $22.3 million (the “Bank Merger”). The acquisition was not determined to be a significant acquisition. After closing the Bank Merger, we became a bank holding company and Golden Pacific began operating as SoFi Bank. We are duly registered as a bank holding company with the Federal Reserve. SoFi Bank is a national banking association whose primary federal regulator is the OCC. Deposit accounts of SoFi Bank are insured by the FDIC through the Deposit Insurance Fund to the fullest extent permitted by law.
The closing of the Bank Merger was subject to regulatory approval. On January 18, 2022, we received approval from the Federal Reserve of our application to become a bank holding company under the Bank Holding Company Act, and we received conditional approval from the OCC to close the Bank Merger. The OCC also approved our application to change the composition of Golden Pacific’s assets in connection with the Bank Merger. The OCC conditional approval imposed a number of conditions, including that SoFi Bank have initial paid-in capital of no less than $750 million and adhere to an operating agreement. Golden Pacific’s community bank business continues to operate as a division of SoFi Bank.
A portion of the total cash purchase consideration ($0.6 million) was held back by the Company to satisfy any indemnification or certain other obligations (“Holdback Amount”), as certain legal proceedings with which Golden Pacific is involved as a plaintiff were not resolved at the time the Bank Merger closed. During 2022, we incurred costs associated with the litigation involving Golden Pacific as a plaintiff in excess of the Holdback Amount. Therefore, none of the Holdback Amount will be released to the Golden Pacific shareholders. Additionally, we held back a $3.3 million payable to a dissenting Golden Pacific shareholder pending resolution of the shareholder’s dissenter’s rights appraisal claim. During the fourth quarter of 2023, the appraisal claim was settled and payment was released.
Acquisition of Technisys S.A.
On March 3, 2022, we acquired Technisys S.A., a Luxembourg société anonyme, (“Technisys”), pursuant to an Agreement and Plan of Merger dated as of February 19, 2022 and amended as of March 3, 2022, by and among the Company, Technisys, Atom New Delaware, Inc., a Delaware corporation and a wholly owned subsidiary of Atom, and Atom Merger Sub Corporation, a Delaware corporation and wholly owned subsidiary of SoFi Technologies (the “Technisys Merger”). In the business combination, we acquired all of the outstanding equity interests in Technisys for a preliminary purchase consideration of $915.4 million. During the third quarter of 2022, we finalized the closing net working capital calculation specified in the merger agreement, which resulted in a reduction to the equity consideration of 155,794 shares, representing an adjustment to the total purchase consideration of $1,665, and a corresponding reduction to the carrying value of recognized goodwill. The remaining 442,274 shares that were held in escrow associated with the working capital calculation were released to the former Technisys shareholders. The finalized closing net working capital calculation did not impact the estimated fair values of the assets acquired and liabilities assumed in conjunction with the transaction.
SoFi Technologies, Inc.
SoFi Technologies, Inc.
Notes to Consolidated Financial Statements (continued)
(In Thousands, Unless Otherwise Stated and Except for Share and Per Share Data)
The following table presents the components of the total purchase consideration to acquire Technisys as of December 31, 2022:
| | | | | |
Fair value of common stock issued(1) | $ | 873,377 | |
| Amounts payable to settle vested employee performance awards | 37,297 | |
Fair value of awards assumed(2) | 2,855 | |
| Settlement of pre-combination transactions between acquirer and acquiree | 235 | |
| Total purchase consideration | $ | 913,764 | |
___________________
(1) Reflects the shares of SoFi common stock issued in the acquisition of 81,700,318, multiplied by the closing stock price of SoFi common stock on the closing date of the Technisys Merger. Additionally, these shares are inclusive of 6,305,595 shares that were held in escrow.
(2) We contemporaneously converted outstanding performance awards into RSUs to acquire common stock of SoFi (“Replacement Awards”). The fair value of awards assumed in the purchase consideration was based on the closing stock price of SoFi common stock on the closing date of the Technisys Merger.
We settled vested employee performance awards, which were a component of the purchase consideration above, with payments during the years ended December 31, 2023 and 2022 of $19,656 and $17,641, respectively. During the year ended December 31, 2023, we released 6,259,736 escrow shares during the second and fourth quarters of 2023. The remaining 45,859 shares continue to be held in escrow pending resolution of outstanding indemnification claims by SoFi.
The following unaudited supplemental pro forma financial information presents the Company’s consolidated results of operations as if the business combination had occurred on January 1, 2020:
| | | | | | | | | | | | | | | | |
| | Year Ended December 31, |
| | 2022 | | 2021 | | |
| Total net revenue | | $ | 1,584,439 | | | $ | 1,055,219 | | | |
| Net loss | | (311,512) | | | (512,785) | | | |
The unaudited supplemental pro forma financial information is presented for comparative purposes only and is not necessarily indicative of the actual results of operations that would have been achieved, nor is it indicative of future results of operations. The unaudited supplemental pro forma financial information reflects pro forma adjustments that give effect to applying the Company’s accounting policies and certain events the Company believes to be directly attributable to the acquisition. The pro forma adjustments primarily include:
•incremental straight-line amortization expense associated with acquired intangible assets;
•an adjustment to reflect post-combination share-based compensation expense associated with the Replacement Awards as if the conversion had occurred on January 1, 2020;
•an adjustment to reflect acquisition-related costs for both parties as if they were incurred during the earliest period presented; and
•the related income tax effects, at the statutory tax rate applicable for each period, of the pro forma adjustments noted above.
The unaudited supplemental pro forma financial information does not give effect to any anticipated cost savings, operating efficiencies or other synergies that may be associated with the acquisition, or any estimated costs that have been or will be incurred by the Company to integrate the assets and operations of Technisys.
Acquisition of Wyndham Capital Mortgage
On April 3, 2023, we acquired all of the outstanding equity interests in Wyndham for cash consideration. With the acquisition of Wyndham, a fintech mortgage lender, we broadened our suite of home loan products and now manage the technology for a digitized mortgage experience. The acquisition is being accounted for as a business combination. The purchase consideration is being allocated to the tangible and intangible assets acquired and liabilities assumed based on the estimated fair values as of the acquisition date. The excess of the total purchase consideration over the fair value of the net assets acquired is allocated to goodwill, which is expected to be deductible for tax purposes. The fair value estimates are subject to change for up
SoFi Technologies, Inc.
SoFi Technologies, Inc.
Notes to Consolidated Financial Statements (continued)
(In Thousands, Unless Otherwise Stated and Except for Share and Per Share Data)
to one year after the acquisition date as additional information becomes available. The acquisition was not determined to be a significant acquisition.
In each of our revenue arrangements, revenue is recognized when control of the promised goods or services is transferred to the customer in an amount that reflects our expected consideration in exchange for those goods or services.
Technology Products and Solutions
We earn fees for providing an integrated platform as a service for financial and non-financial institutions. Within our technology products and solutions fee arrangements, certain contracts contain a provision for a fixed, upfront implementation fee related to setup activities, which represents an advance payment for future technology platform services provided over the contract term. These implementation fees are recognized ratably over the contract life.
Commencing in March 2022 with the Technisys Merger, we earn subscription and service fees for providing software licenses and associated services, including implementation and maintenance. We charge a recurring subscription fee for the software license and related maintenance services. Other software-related services are billed on a periodic basis as the services are provided. Certain arrangements for software and related services contain a provision for a fixed upfront payment.
We recognize revenue related to software licenses at a point in time upon delivery of the license and the close of the user-acceptance testing period. When implementation services are distinct, we recognize revenue over time during the implementation period. We recognize maintenance services ratably over the contractual maintenance term. If a fixed upfront payment provides a material right to the customer, we recognize revenue associated with the material right over the period of benefit associated with the right to subscribe or renew a subscription, which is typically the product life.
We allocate fees charged for software and related services to our performance obligations on the basis of the relative standalone selling price. The standalone selling prices either represent the prices at which we separately sell each license or service or are estimated using available information, such as market conditions and internal pricing policies. The standalone selling price of the software license and maintenance are determined based on the complexity and size of the license.
Payments to customers: We may provide incentives to our technology platform customers, which may be payable up front or applied to future or past technology products and solutions fees. Evaluating whether such incentives are payments to a customer requires judgment. When we determine that an incentive is consideration payable to a customer, the incentive is recorded as a reduction of revenue. Incentives that represent consideration payable to a customer may also contain variable consideration. Therefore, such incentives are constraints on the revenue expected to be realized. Upfront customer incentives are recorded as prepaid assets and presented within other assets in the consolidated balance sheets, and are applied against revenue in the period such incentives are earned by the customer. Any incentive in excess of cumulative revenue is expensed as a contract cost.
Referrals
We earn specified referral fees in connection with certain referral activities we facilitate through our platform. In one type of referral arrangement, we refer end users through our platform to third-party enterprise partners. Our referral fee is calculated as either a fixed price per successful referral or a percentage of the transaction volume between the enterprise partners and referred consumers. In another type of referral arrangement, we earn referral fulfillment fees for providing pre-qualified borrower referrals to a third-party partner who separately contracts with a loan originator. Our referral fees are based on the referred loan amount, subject to a referral fulfillment fee penalty if a loan is determined to be ineligible and becomes a charged-off loan as defined in the contract. We recognize revenue for each originated loan, less the estimated referral fulfillment fee penalty. The estimated referral fulfillment fee penalty was immaterial as of December 31, 2023 and 2022.
Interchange
We earn interchange fees from debit and credit cardholder transactions conducted through payment networks. Interchange fees from cardholder transactions represent a percentage of the underlying transaction value and are recognized
SoFi Technologies, Inc.
SoFi Technologies, Inc.
Notes to Consolidated Financial Statements (continued)
(In Thousands, Unless Otherwise Stated and Except for Share and Per Share Data)
daily, concurrently with the transaction processing services provided to the cardholder. Interchange is presented net of cardholder rewards associated with card transactions.
Brokerage
We earn fees in connection with facilitating investment-related transactions through our platform, which we refer to as brokerage revenue. Our brokerage revenue performance obligation is generally completely satisfied upon the completion of an investment-related transaction. In general, we act as the agent in these arrangements as we do not oversee the execution of the transactions and ultimately lack the requisite control.
TechnologyLoans Measured at Fair Value
We elected the fair value option to measure our personal loans, student loans and Product Development
Expenses incurredhome loans, as we believe that fair value best reflects the expected economic performance of the loans. Therefore, these loans are carried at fair value on a recurring basis. During the year ended December 31, 2023, we transferred home loans out of Level 3 and into Level 2 due to an update to pricing sources utilized by us related to technology, product designthird-party valuation specialists, as part of the integration of Wyndham. Other loans do not trade in an active market with readily observable prices and implementation, which includes compensation and benefits, are classified as Level 3. We determine the fair value of our loans using a discounted cash flow methodology, while also considering market data as it becomes available.
Direct fees, which primarily relate to personal and home loan originations, are recognized in earnings as earned and are recorded within noninterest expense—technologyincome—loan origination, sales, and product developmentsecuritizations in the consolidated statements of operations and comprehensive income (loss).
Loss Contingencies
Loss contingencies, including claimsloss. Direct loan origination costs are recognized in earnings as incurred and legal actions arising in the ordinary course of business, are recorded inwithin accounts payable, accruals and other liabilitiesnoninterest expense—cost of operations in the consolidated balance sheets. Such liabilitiesstatements of operations and associated expenses are recorded whencomprehensive loss. We record the likelihood of loss is probableinitial fair value measurement and an amount or range of loss can be reasonably estimated. Such estimates are based on the best information available at the time. As additional information becomes available, we reassess the potential liability and record an estimatesubsequent measurement changes in fair value in the period in which the adjustment is probable and an amount or range can be reasonably estimated. Due to the inherent uncertainties of loss contingencies, estimates may be different from the actual outcomes. With respect to legal proceedings, we recognize legal fees as they are incurredchanges occur within noninterest expense—generalincome—loan origination, sales, and administrative in our consolidated statements of operations and comprehensive income (loss). See Note 16 for discussion of contingent matters.
Share-Based Compensation
Share-based compensation made to employees and non-employees, including stock options, restricted stock units (“RSUs”) and performance stock units (“PSUs”), is measured based on the grant date fair value of the awards and is recognized as compensation expense typically on a straight-line basis over the period during which the share-based award holder is required to perform services in exchange for the award (the vesting period) for stock options and RSUs and on an accelerated attribution basis for each vesting tranche over the respective derived service period for PSUs. Share-based compensation expense is allocated among the components of noninterest expensesecuritizations in the consolidated statements of operations and comprehensive income (loss).loss. We userecord cash flows related to loans held for sale within cash flows from operating activities in the Black-Scholes Option Pricing Model (the “Black-Scholes Model”) to estimate theconsolidated statements of cash flows.
Securitized loans are assets held by consolidated SPEs as collateral for bonds issued, for which fair value changes are recorded within noninterest income—loan origination, sales, and securitizations in the consolidated statements of stock options. RSUsoperations and comprehensive loss. Gains or losses recognized upon deconsolidation of a VIE are measured basedalso recorded within noninterest income—loan origination, sales, and securitizations.
We consider a loan to be delinquent when the borrower has not made the scheduled payment amount within one day after the scheduled payment date, provided the borrower is not in school or in deferment, forbearance or within an agreed-upon grace period. Loan deferment is a provision within student loan contracts that permits the borrower to defer payments while enrolled at least half time in school. During the deferment period, interest accrues on the fair valuesloan balance and is capitalized to the loan when the loan enters repayment status, which begins when the student no longer qualifies for deferment.
Forbearance applies to student loans, personal loans and home loans. A borrower in repayment may generally request forbearance for reasons including a FEMA-declared disaster, unemployment, economic hardship or general economic uncertainty. Forbearance typically cannot exceed a total of 12 months over the life of the underlying stock onloan. If forbearance is granted, interest continues to accrue during the dates of grant. We use a Monte Carlo simulation model to estimate the fair value of PSUs. We recognize forfeitures as incurredforbearance period and therefore, reverse previously recognized share-based compensation expense at the time of forfeiture. See Note 13 for further discussion of share-based compensation.
Comprehensive Loss
Comprehensive loss consists of net loss, unrealized gains or losses on our investments in AFS debt securities and foreign currency translation adjustments.
Income Taxes
We recognize deferred tax assets and liabilities for the expected future tax consequences of temporary differences between the financial reporting and tax basis of assets and liabilities, as well as for operating loss and tax credit carryforwards. Deferred tax assets and liabilities are measured using the tax rates that are expected to apply to taxable income for the years in which those tax assets and liabilities are expected to be realized or settled. In assessing the realizability of deferred tax assets, management reviews all available positive and negative evidence. Valuation allowances are recorded to reduce deferred tax assetsis capitalized to the amount we believeloan when the borrower resumes making payments. At the conclusion of a forbearance period, the contractual monthly payment is more likely than not to be realized.recalculated and is generally higher as a result.
SoFi Technologies, Inc.
SoFi Technologies, Inc.
Notes to Consolidated Financial Statements (continued)
(In Thousands, Unless Otherwise Stated and Except for Share and Per Share Data)
We follow accounting guidanceFor personal loans and student loans, delinquent loans are charged off after 120 days of delinquency or on the date of confirmed loss. For home loans, delinquent loans are charged off after 180 days of delinquency or on the date of confirmed loss. For all loans, we stop accruing interest and reverse all accrued but unpaid interest on the date of charge-off. Additional information about our loans held for sale is included in ASC 740, Income TaxesNote 4. Loans, as it relates to uncertain tax positions, which provides informationNote 7. Securitization and procedures for financial statement recognitionVariable Interest Entities and measurement of tax positions taken, or expected to be taken, in tax returns. The tax effects from an uncertain tax position can be recognized inNote 15. Fair Value Measurements.
Loans Measured at Amortized Cost
For our senior secured and commercial and consumer banking loans, direct loan origination costs are deferred and amortized using the financial statements only ifeffective interest method over the tax position would more likely than not be upheld on examination by the taxing authorities based on the meritscontractual term of the tax position. Management is required to analyze all open tax years, as defined by the statute of limitations, for all jurisdictions. We accrue tax penalties and interest, if any, as incurred and recognize themloans within income tax (expense) benefitinterest income—loans and securitizations in ourthe consolidated statements of operations and comprehensive income (loss).loss. As of December 31, 2023, the remaining balance of deferred costs was immaterial.
Recently Adopted Accounting StandardsWe present accrued interest for loans measured at amortized cost within loans held for investment, at amortized cost in the consolidated balance sheets. The amortized cost of these loans is subject to our allowance for credit losses methodology described within “Allowance for Credit Losses” herein. We record cash flows related to loans held for investment within cash flows from investing activities in the consolidated statements of cash flows.
FacilitationCredit card receivables are reported at the amounts due from members, including accrued interest and fees, and unamortized net deferred loan origination fees and costs. Loan origination fees and direct loan origination costs are amortized on a straight-line basis over a 12-month period as adjustments to income through interest income—loans and securitizations in the consolidated statements of operations and comprehensive loss. Credit card balances are reported as delinquent when they become 30 or more days past due. Credit card balances are charged off after 180 days of delinquency or on the date of the Effectsconfirmed loss, at which time we stop accruing interest and fees and reverse all accrued but unpaid interest and fees through interest income as of Reference Rate Reformsuch date. When a credit card balance is charged off, we record a reduction to the allowance and the credit card balance. When recovery payments are received against charged off credit card balances, we record a direct reduction to the provision for credit losses. Credit card receivables associated with alleged or potential fraudulent transactions are charged off through noninterest expense—general and administrative in the consolidated statements of operations and comprehensive loss.
Commercial and consumer banking loans are reported as delinquent when they become 30 or more days past due. For all commercial and consumer banking loans, we stop accruing interest and reverse all accrued but unpaid interest after 90 days of delinquency. For consumer banking loans, delinquent loans are charged off after 120 days of delinquency or on the date of confirmed loss. For commercial loans, performance is monitored on an individual loan basis and delinquent loans are charged off when collectability of interest and principal on the loan is not reasonably assured.
Senior secured loans are term loan arrangements secured by underlying loans owned by the debtor. Senior secured loans are reported as delinquent when they become 30 or more days past due, and are charged off after 120 days of delinquency or on the date of confirmed loss.
Financial ReportingGuarantees
In March 2020, the FASB issued ASU 2020-04, Reference Rate Reform (Topic 848): Facilitation of the Effects of Reference Rate Reform on Financial Reporting. In January 2021, the FASB issued ASU 2021-01, Reference Rate Reform (Topic 848): Scope, which clarifies the scope of Topic 848 for certain derivative instruments that use an interest rate for margining, discounting or contract price alignment. The new standard provides for optional expedients and other guidance regarding the accountingWe entered into a credit default swap related to modificationsour student loans which meets the definition of contracts, hedging relationshipsa financial guarantee and other transactions affected by reference rate reform. ASU 2020-04 and ASU 2021-01 were both effective upon issuance and may be applied to contract modificationsis excluded from January 1, 2020 through December 31, 2022.
The Alternative Reference Rates Committee (“ARRC”), a group of private market participants, was convened in the United States by the Federal Reserve Board and the Federal Reserve Bank of New York in cooperation with other United States agencies to promote the successful transition from United States Dollar LIBOR (“USD LIBOR”). The ARRC has selected the Secured Overnight Financing Rate (“SOFR”) as their recommended alternative to USD LIBOR. After December 31, 2021, the ICE Benchmark Administration Limited, the administrator of LIBOR (the “IBA”), ceased publishing the one-week and two-month USD LIBOR tenors.derivative accounting treatment. We do not have any exposure to these tenors. The IBA expects to continue to publish all remaining USD LIBOR tenors through June 30, 2023, with the overnight and 12-month tenors ceasing immediately thereafter and the one-month, three-month and six-month tenors becoming non-representative from that date.
We adopted the provisions of the standard in the fourth quarter of 2021 using the prospective method of adoption. We established a cross-functional project team to execute our company-wide transition away from USD LIBOR. In the fourth quarter of 2021, we began to use SOFR as the pricing index on all new variable-rate loan originations, and on new warehouse facility agreements and other financial instruments. We also transitioned some existing warehouse facility lines to SOFR and elected to apply the optional expedients when all such terms were related toinsurance contract claim method by deferring the replacementfull estimated amount of premiums paid and payable at inception. The deferred premium is estimated using a discounted cash flow model considering the expected performance of the reference rate.portfolio and recorded within other assets and accounts payable, accruals and other liabilities in the consolidated balance sheets. Deferred premiums are amortized based on actual premiums due and recognized in noninterest expense—general and administrative in the consolidated statements of operations and comprehensive loss. We are continuingrecognize a receivable and related earnings when a loss event occurs, we have the right to review existing variable-rate loans, borrowings, Series 1 redeemable preferred stock dividendssubmit a claim, and derivative instruments that utilize USD LIBOR as the reference rate and expect to continue transitioning these instruments to SOFR or other representative alternative reference rates throughout 2022 in accordance with the provisions of the standard. We do not expect there to be a material impact on our consolidated financial statements as a result of adopting this standard.
Accounting for Convertible Instruments and Contracts in an Entity’s Own Equity
In August 2020, the FASB issued ASU 2020-06, Debt — Debt with Conversion and Other Options (Subtopic 470-20) and Derivatives and Hedging — Contracts in Entity’s Own Equity (Subtopic 815-40): Accounting for Convertible Instruments and Contracts in an Entity’s Own Equity. This ASU simplifies the accounting for certain convertible instruments, amends the guidance on derivative scope exceptions for contracts in an entity’s own equity, and modifies the guidance on diluted earnings per share calculations as a result of these changes. The standardrecovery is effective for fiscal years and interim periods beginning after December 15, 2023, with early adoption permitted. We early adopted the provisions of ASU 2020-06 effective January 1, 2021. The adoption of this standard did not have an impact on our consolidated financial statements, as we had no notes prior to an issuance in October 2021. The notes issued in October 2021 were accounted for in accordance with this standard.probable.
Allowance for Credit Losses
Note 2. Business Combinations
MergerWe primarily evaluate expected credit losses under the current expected credit loss model for the following financial assets: (i) cash equivalents and restricted cash equivalents, (ii) accounts receivable from contracts with Social Capital Hedosophia Holdings Corp. V
On January 7, 2021, Social Finance entered intocustomers, inclusive of servicing related receivables, (iii) loans measured at amortized cost, and (iv) investments in AFS debt securities. Our approaches to measuring the Agreement by and among Social Finance, SCH, a Cayman Islands exempted company limited by shares, and Plutus Merger Sub Inc., a Delaware corporation and a wholly owned subsidiary of SCH (“Merger Sub”). Pursuant toallowance for credit losses on the Agreement, Merger Sub merged with and into Social Finance. Upon the Closing on Mayapplicable financial assets are as follows:
SoFi Technologies, Inc.
SoFi Technologies, Inc.
Notes to Consolidated Financial Statements (continued)
(In Thousands, Unless Otherwise Stated and Except for Share and Per Share Data)
28, 2021,Cash equivalents and restricted cash equivalents: Our cash equivalents and restricted cash equivalents are short-term in nature and of high credit quality; therefore, we determined that our exposure to credit losses over the separate corporate existencelife of Merger Sub ceased and Social Finance survived the merger and became a wholly-owned subsidiary of SCH. On May 28, 2021, SCH also filed a notice of deregistrationthese instruments was immaterial.
Accounts receivable from contracts with the Cayman Islands Registrar of Companies, togethercustomers: Accounts receivable from contracts with the necessary accompanying documents, and filed a certificate of incorporation and a certificate of corporate domestication with the Secretary of Statecustomers as of the Statebalance sheet dates, all of Delaware, under which SCH was domesticatedare short-term in nature, are recorded at their original invoice amounts reduced by any allowance for credit losses. We assess the risk of loss for each individual customer, even when the risk is remote. Certain of our historical accounts receivable balances did not have any write-offs. We use the aging method and historical loss rates as a Delaware corporation, changing its namebasis for estimating the percentage of current and delinquent accounts receivable balances that will result in credit losses. We consider whether the conditions at the measurement date and reasonable and supportable forecasts about future conditions, such as customer creditworthiness, current economic conditions, customer location, expectations of near-term economic trends and changes in customer payment terms and collection trends, warrant an adjustment to our historical loss experience. Based on this analysis, we determined that our historical loss rates remained most indicative of our lifetime expected losses. We record the provision for credit losses on accounts receivable from “Social Capital Hedosophia Holdings Corp. V” to “SoFi Technologies, Inc.” These transactions are collectively referred to ascontracts with customers within noninterest expense—general and administrative in the “Business Combination”.
The Business Combination was accounted for as a reverse recapitalization whereby SCH was determined to be the accounting acquireeconsolidated statements of operations and Social Finance to be the accounting acquirer. This accounting treatment was the equivalent of Social Finance issuing stock for the net assets of SCH, accompanied by a recapitalization whereby no goodwill or other intangible assets were recorded. Operations prior to the Business Combination are those of Social Finance. At the Closing, we received gross cash consideration of $764.8 million as a result of the reverse recapitalization, which was then reduced by:
•A redemption of redeemable common stock (classified as temporary equity) of $150.0 million;comprehensive loss.
•A special payment (as discussed in Note 12), which was accounted for as an embedded derivative, and made to our Series 1 preferred stockholders of $21.2 million (which was expensed as incurred); and
•Our equity issuance costs.
In connection withWhen we determine that a receivable is not collectible, we write off the Business Combination, Social Finance incurred $27.5 million of equity issuance costs, consisting of advisory, legal, share registration and other professional fees, which were recorded within additional paid-in capitaluncollectible amount as a reduction of proceeds. We paid $0.6 millionto both the allowance and the gross asset balance. Recoveries are recorded when received and credited to the provision for credit losses. Any change in the assumptions used in analyzing a specific account receivable may result in an additional allowance for credit losses being recognized in the period in which the change occurs. See Note 5. Allowance for Credit Losses for a rollforward of the equity issuance costs during 2020.allowance for credit losses related to our accounts receivable.
In connection withSenior secured loans: We evaluate the Business Combination, SCH entered into subscription agreements with certain investors (the “Third Party PIPE Investors”),credit quality of our senior secured loan portfolio based on the fair value of underlying collateral, which are subject to the requirements of our loan underwriting process and risk models upon origination. This analysis is performed on a quarterly basis utilizing a third-party valuation specialist, whereby it issued 122,500,000 sharesthe fair value of common stock at $10.00 per share (“PIPE Shares”)underlying collateral is reassessed based on relevant information such as funded loan rates and historical loss experience, among other factors. An allowance for credit losses is required when there is an aggregate purchase price of $1.225 billion (“PIPE Investment”), which closed simultaneously withexpected credit loss after considering the consummationfair value of the Business Combination. Uponcollateral as well as any anticipated future changes in the Closing,underlying collateral. As of and for the PIPE Shares were automatically converted into sharesyear ended December 31, 2023, we determined that our expected exposure to credit losses was immaterial, and as such did not recognize an allowance for credit losses on senior secured loans.
Credit cards: We segment pools of SoFi Technologies common stockcredit cards based on a one-for-one basis.
Upon the Closing, holders of Social Finance common stock received shares of SoFi Technologies common stock in an amount determined by applicationconsumer credit score bands as measured using FICO scores, which are obtained at origination of the exchange ratioaccount and are refreshed monthly thereafter, and also by delinquency status, which may be adjusted using other risk-differentiating attributes to model charge-off probabilities and the average life over which expected credit losses may occur for the credit cards within each pool. The pools estimate the likelihood of 1.7428 (“Exchange Ratio”), which wasborrowers with similar FICO scores to pay credit obligations based on Social Finance’s implied price peraggregate credit performance data. When necessary, we apply separate credit loss assumptions to assets that have deteriorated in credit quality such that they no longer share priorsimilar risk characteristics with other assets in the same FICO score band. We either estimate the allowance for credit losses on such non-performing assets individually based on individual risk characteristics or as part of a distinct pool of assets that shares similar risk characteristics. We reassess our credit card pools periodically to confirm that all loans within each pool continue to share similar risk characteristics.
We establish an allowance within each pool of credit cards utilizing the risk model described above, which may then be adjusted for current conditions and reasonable and supportable forecasts of future conditions, including economic conditions. We apply the probability-of-default and loss-given-default assumptions to the Business Combination.drawn balance of credit cards within each pool to estimate the lifetime expected credit losses within each pool, which are then aggregated to determine the allowance for credit losses. We do not measure credit losses on the undrawn credit exposure, as such undrawn credit exposure is unconditionally cancellable by us. Additionally, holders of Social Finance preferred stock (withmanagement evaluates whether to include qualitative reserves to cover losses that are expected but may not be adequately represented in the exceptionquantitative methods or the economic assumptions. The qualitative reserves address possible limitations within the models, such as external conditions including regulatory requirements, emerging portfolio trends, the nature and size of the Series 1 preferred stockholders) received sharesportfolio, portfolio concentrations, the volume and severity of SoFi Technologies common stockpast due accounts, or management risk actions. We record the provision for credit losses on credit cards within noninterest expense—provision for credit losses in amounts determined by applicationthe consolidated statements of either the Exchange Ratio or a multiplier of the Exchange Ratio, as provided by the Agreement.
Acquisition of Golden Pacific Bancorp, Inc.
On February 2, 2022, we acquired Golden Pacific, pursuant to an Agreementoperations and Plan of Merger entered into by and among the Company, a wholly-owned subsidiary of the Company and Golden Pacific in March 2021, pursuant to which we acquired all of the outstanding equity interests in Golden Pacific and its wholly-owned subsidiary, Golden Pacific Bank, for total cash purchase consideration of $22.3 million using cash on hand. After closing the Bank Merger, we became a bank holding company and Golden Pacific Bank began operating as SoFi Bank, National Association (“SoFi Bank”). We are duly registered as a bank holding company with the Federal Reserve. SoFi Bank is a national banking association whose primary federal regulator is the OCC. Deposit accounts of SoFi Bank are insured by the FDIC through the Deposit Insurance Fund to the fullest extent permitted by law.
The closing of the Bank Merger was subject to regulatory approval. On January 18, 2022, we received approval from the Federal Reserve of our application to become a bank holding company under the Bank Holding Company Act, and we received conditional approval from the OCC to close the Bank Merger. The OCC also approved our application to change the composition of Golden Pacific Bank’s assets in connection with the Bank Merger. The OCC conditional approval imposed a number of conditions, including that SoFi Bank have initial paid-in capital of no less than $750 million and adhere to an operating agreement. Golden Pacific Bank’s community bank business will continue to operate as a division of SoFi Bank.
A portion of the total cash purchase consideration ($0.6 million) was held back by the Company to satisfy any indemnification or certain other obligations (“Holdback Amount”), as certain legal proceedings with which Golden Pacific is involved as a plaintiff were not resolved at the time the Bank Merger closed. The Holdback Amount will be used for further financing or costs incurred associated with the litigation and any remaining amount upon resolution of the litigation will becomprehensive loss.
SoFi Technologies, Inc.
SoFi Technologies, Inc.
Notes to Consolidated Financial Statements (continued)
(In Thousands, Unless Otherwise Stated and Except for Share and Per Share Data)
releasedWe elected to exclude interest on credit cards from the measurement of our allowance, as our policy allows for accrued interest to be reversed in a timely manner. Further, we elected the practical expedient to exclude the accrued interest component of our credit cards from the quantitative disclosures presented.
See Note 5. Allowance for Credit Losses for a rollforward of the allowance for credit losses related to our credit cards.
Commercial and consumer banking loans: We evaluate the credit quality of our commercial and consumer banking loan portfolio based on regulatory risk ratings. Loans are categorized into risk ratings based on relevant information about the ability of borrowers to service their debt, such as current financial information, historical payment experience, collateral adequacy, credit documentation, and current economic trends, among other factors. The allowance for credit losses is determined at a portfolio level and estimated based on weighted average remaining maturity and annualized loss rate according to the Golden Pacific shareholders. Additionally, we held backloan’s regulatory loan type, risk rating classification and historical loss rates in the industry. This analysis is performed on an ongoing basis as new information is obtained.
See Note 5. Allowance for Credit Losses for a $3.3 million payable to a dissenting Golden Pacific Bank shareholder pending resolutionrollforward of the shareholder’s appraisal claim, which could possibly resultallowance for credit losses related to our commercial and consumer banking loans.
Investments in AFS debt securities: Credit-related impairment is recognized as an allowance for credit losses in the consolidated balance sheets with a lowercorresponding adjustment to noninterest expense—provision for credit losses in the statements of operations and comprehensive loss. For certain securities that are guaranteed by the U.S. Treasury or higher amount paidgovernment agencies, or sovereign entities of high credit quality, we concluded that there is no risk of credit-related impairment due to the dissenting shareholder once a ruling is made regardingnature of the appraisal claim.
The Bank Merger is being accounted forcounterparties and history of no credit losses. For other investments in AFS debt securities, factors considered in evaluating credit losses include: (i) adverse conditions related to the macroeconomic environment or the industry, geographic area or financial condition of the issuer, (ii) other credit indicators of the security, such as a business combination. The resultsexternal credit ratings, and (iii) payment structure of operations of Golden Pacific are not included in SoFi’s consolidated financial statements as of and forthe security. For the year ended December 31, 2021. Additionally, given the proximity of the closing of the Bank Merger to the issuance2023, we did not recognize an allowance for credit losses on impaired investments in AFS debt securities.
Servicing Rights
Each time we enter into a servicing agreement, either in connection with transfers of our consolidated financial statementsassets or in connection with a referral fulfillment arrangement in which we are a sub-servicer for the year ended December 31, 2021, the initial accounting for the business combination is incomplete. The purchase consideration is being allocated to the tangible and intangiblefinancial assets acquired and liabilities assumed based on the estimated fair values as of the acquisition date, which are being measured in accordance with the principles outlined in ASC 820. The excess of the total purchase consideration overthat we do not legally own, we determine whether we should record a servicing asset or servicing liability. We elected the fair value option to measure our servicing rights subsequent to initial recognition. We measure the initial and subsequent fair value of our servicing rights using a discounted cash flow methodology, while also considering market data as it becomes available. The significant assumptions used in the valuation model include our contractual servicing fee, ancillary income, prepayment rate assumptions, default rate assumptions, a discount rate commensurate with the risk of the net assets acquired, if any, will be allocated to goodwill, noneservicing asset or liability being valued, and an assumed market cost of servicing, which is expected to be deductible for tax purposes. Asbased on active quotes from third-party servicers. The value of the acquisition was not determined to be a significant acquisition under ASC 805, weservicing rights are dependent on the performance of the underlying loans. For servicing rights retained in connection with loan transfers that do not intend to disclosemeet the pro forma impactrequirements for sale accounting treatment, there is no recognition of this acquisition toa servicing asset or liability.
Servicing rights in connection with transfers of financial assets are initially measured at fair value and recognized as a component of the resultsgain or loss from sales of operations in our interimloans and annual filings with the SEC.
We incurred acquisition-related costs of $2.2 million related to the Bank Merger for the year ended December 31, 2021, which were presentedinitial capitalization is reported within noninterest expense—generalincome—loan origination, sales, and administrativesecuritizations in the consolidated statements of operations and comprehensive loss. Servicing rights assumed from third parties for financial assets for which we are not the loan originator are initially measured at fair value and recognized within noninterest income—servicing in the consolidated statements of operations and comprehensive income (loss).
Acquisition of Technisys S.A.
On February 19, 2022, we entered into an Agreementloss. Servicing rights are measured at fair value at each subsequent reporting date and Plan of Merger by and among the Company, Technisys S.A., a Luxembourg société anonyme (“Technisys”), Atom New Delaware, Inc., a Delaware corporation and a wholly owned subsidiary of Atom, and Atom Merger Sub Corporation, a Delaware corporation and wholly owned subsidiary of SoFi Technologies, pursuant to which we will acquire all of the outstanding equity interestschanges in Technisys for total consideration,fair value are reported in earnings in the form of shares of SoFi common stock, of $1.1 billion (the “Technisys Merger”). The shares of SoFi common stock issuableperiod in connection with the acquisitionwhich they occur. Subsequent measurement changes for all servicing rights, including servicing fee payments and fair value changes, are determined using the 20-day volume-weighted average price of SoFi common stock as of February 15, 2022, and are subject to escrow requirements and other customary adjustments. The Technisys Merger will be accounted for as a business combination.
Technisys is a cloud-native digital and core banking platform with an existing footprint of established banks, digital banks and fintechs in Latin America. With the acquisition of Technisys, we can expand our technology platform services to a broader international market.
Through December 31, 2021, we incurred acquisition-related costs of $3.3 million related to the Technisys Merger, which were presentedincluded within noninterest expense—general and administrativeincome—servicing in the consolidated statements of operations and comprehensive income (loss).loss. We elected the fair value option to measure our servicing rights to better align with the valuation of our transferred loans, which also tend to share a similar risk profile to the personal loan servicing we assume from third parties when we are not the loan originator. The loans are also impacted by similar factors, such as conditional prepayment rates and default rates. We consider the risk of the assets and the observability of inputs in determining the classes of servicing rights. We have three classes of servicing assets: personal loans, student loans and home loans.
AcquisitionSee Note 15. Fair Value Measurements for the key inputs used in the fair value measurements of Galileo Financialour classes of servicing rights.
SoFi Technologies, Inc.
On May 14, 2020, we acquired Galileo Financial Technologies, Inc. and its subsidiaries (“Galileo”) by acquiring 100% of the outstanding Galileo stock as of that date for total consideration of $1.2 billion. Galileo primarily provides technology platform services to financial and non-financial institutions. Our acquisition of Galileo enabled us to diversify our business from primarily consumer based to also serve institutions that rely upon Galileo’s integrated platform as a service to serve their clients.
Upon the finalization of the closing net working capital calculation in April 2021, the total purchase price consideration was reduced by $743, which was settled through the return to SoFi of an equivalent value of 83,856 previously issued Series H-1 preferred stock, which were retired upon receipt. The adjustment similarly reduced the carrying value of
SoFi Technologies, Inc.
Notes to Consolidated Financial Statements (continued)
(In Thousands, Unless Otherwise Stated and Except for Share and Per Share Data)
Investments in Debt Securities
The accounting and measurement framework for our investments in debt securities is determined based on the security classification. We do not hold investments in debt securities for trading purposes, nor do we have investments in debt securities that we have the intent and ability to hold to maturity. Therefore, we classify our investments in debt securities as available-for-sale.
We record investments in AFS debt securities at fair value in our consolidated balance sheets, with unrealized gains and losses recorded, net of tax, as a component of AOCI. See Note 15. Fair Value Measurements for additional information on our fair value estimates for investments in AFS debt securities. The amortized cost basis of our investments in AFS debt securities reflects the security’s acquisition cost, adjusted for amortization of premium or accretion of discount, and collection of cash and charge-offs, as applicable. For purposes of determining gross realized gains and losses on AFS debt securities, the cost of securities sold is based on specific identification. We elected to present accrued interest for AFS debt securities within investment securities in the consolidated balance sheets. Purchase discounts, premiums, and other basis adjustments for investments in AFS debt securities are generally amortized into interest income over the contractual life of the security using the effective interest method. However, premiums on certain callable debt securities are amortized to the earliest call date. Amortization of premiums and discounts and other basis adjustments for investments in AFS debt securities, as well as interest income earned on the investments, are recognized goodwill,within interest income—other, and didrealized gains and losses on investments in AFS debt securities are recognized within noninterest income—other in the consolidated statements of operations and comprehensive loss.
An investment in AFS debt security is considered impaired if its fair value is less than its amortized cost. If we determine that we have the intent to sell the impaired investment in AFS debt security, or if it is more likely than not impactthat we will be required to sell the estimatedimpaired investment in AFS debt security before recovery of its amortized cost, we recognize the full impairment loss reflecting the difference between the amortized cost (net of any prior recognized allowance) and the fair value of the investment in AFS debt security within noninterest income—other in the consolidated statements of operations and comprehensive loss. If neither of the above conditions exists, we evaluate whether the impairment loss is attributable to credit-related or non-credit-related factors. Any impairment that is not credit-related is recognized within other comprehensive income (loss), net of taxes. See the section “Allowance for Credit Losses” in this Note for the factors we consider in identifying credit-related impairment and the treatment of credit losses.
See Note 6. Investment Securities for additional information on our investments in AFS debt securities.
Securitization Investments
In Company-sponsored securitization transactions that meet the applicable criteria to be accounted for as a sale, we retain certain residual interests and asset-backed bonds. We measure these investments at fair value on a recurring basis and report them within investment securities in the consolidated balance sheets. Gains and losses related to our securitization investments are reported within noninterest income—loan origination, sales, and securitizations in the consolidated statements of operations and comprehensive loss. We determine the fair value of our securitization investments using a discounted cash flow methodology, while also considering market data as it becomes available.
Our residual investments accrete interest income over the expected life using the effective yield method, which reflects a portion of the overall fair value adjustment recorded each period on our residual investments. On a quarterly basis, we reevaluate the cash flow estimates over the life of the residual investments to determine if a change to the accretable yield is required on a prospective basis. Additionally, we record interest income associated with asset-backed bonds over the term of the underlying bond using the effective interest method on unpaid bond amounts. Interest income on residual investments and asset-backed bonds is presented within interest income—loans and securitizations in the consolidated statements of operations and comprehensive loss.
See Note 15. Fair Value Measurements for the key inputs used in the fair value measurements of our residual investments and asset-backed bonds.
Investments in Equity Securities
Our investments in equity securities consist of investments for which fair values are not readily determinable, which we elect to measure using the alternative method of the assets acquiredaccounting, under which they are measured at cost less any impairment and liabilities assumed in conjunction with the transaction. There were no other adjustments to goodwill during the year ended December 31, 2021.
The following unaudited supplemental pro forma financial information presents the Company’s consolidated results of operations for the years ended December 31, 2020 and 2019 as if the business combination had occurred on January 1, 2019:
| | | | | | | | | | | |
| Year Ended December 31, |
| 2020 | | 2019 |
| Total net revenue | $ | 625,413 | | | $ | 483,921 | |
| Net loss | (304,219) | | | (209,770) | |
The unaudited supplemental pro forma financial information is presented for comparative purposes only and is not necessarily indicative of the actual results of operations that would have been achieved, nor is it indicative of future results of operations. The unaudited supplemental pro forma financial information reflects pro forma adjustments that give effect to applying the Company’s accounting policies and certain events the Company believes to be directly attributable to the acquisition. The pro forma adjustments primarily include:
•incremental straight-line amortization expense associated with acquired intangible assets;
•adjustments to depreciation expense resulting from accounting policy alignment between the acquirer and acquiree;
•adjustments to reflect interest expense on the seller note, including accretion of interest and incremental interest incurred after the interest-free period lapsed as if the interest was incurred during the earliest period presented;
•an adjustment to reflect post-combination share-based compensation expense associated with options to acquire common stock of Galileo that were converted into options to acquire common stock of SoFi as if the conversion occurred on January 1, 2019;
•a reversal of the Company’s previously-established deferred tax asset valuation allowance of $99,793 resulting from deferred tax liabilities acquired in connection with the acquisition as if it occurred during the earliest period presented;
•an adjustment to reflect $9,341 of acquisition-related costs as if they were incurred during the earliest period presented; and
•the related income tax effects, at the statutory tax rate applicable for each period, of the pro forma adjustments noted above.
The unaudited supplemental pro forma financial information does not give effect to any anticipated cost savings, operating efficiencies or other synergies that may be associated with the acquisition, or any estimated costs that have been or will be incurred by the Company to integrate the assets and operations of Galileo.
Other Acquisitions
On April 28, 2020, the Company acquired 100% of the outstanding stock of 8 Limited, a Hong Kong brokerage services firm, for total consideration of $16,126. Part of the consideration consisted of Social Finance common stock, of which a portion was contingent on the satisfaction of certain representations and warranties. During the fourth quarter of 2021, we issued 320,649 shares of SoFi Technologies, common stock in satisfaction of the contingent consideration.Inc.
SoFi Technologies, Inc.
Notes to Consolidated Financial Statements (continued)
(In Thousands, Unless Otherwise Stated and Except for Share and Per Share Data)
adjusted for changes resulting from observable price changes in orderly transactions for identical or similar investments of the same issuers. Our investments in equity securities are presented within other assets in the consolidated balance sheets. Adjustments to the carrying values of our investments in equity securities, such as impairments and unrealized gains, are recognized within noninterest income—other in the consolidated statements of operations and comprehensive loss.
Property, Equipment and Software
All property, equipment and software are initially recorded at cost, while repairs and maintenance costs are expensed as incurred. Computer hardware, furniture and fixtures, software, buildings and finance lease ROU assets are depreciated or amortized on a straight-line basis over the estimated useful life of each class of depreciable or amortizable assets (ranging from one to 30 years). Leasehold improvements are amortized over the shorter of the respective lease term or the estimated lives of the leasehold improvements.
Software includes both purchased and internally-developed software. Internally-developed software is capitalized when preliminary project efforts are successfully completed, and it is probable that both the project will be completed and the software will be used as intended. Capitalized costs consist of salaries and compensation costs (inclusive of share-based compensation) for employees, fees paid to third-party consultants who are directly involved in development efforts and costs incurred for upgrades and functionality enhancements, and are amortized over a useful life ranging from 2.5 to 3 years. Other costs are expensed as incurred.
See Note 3. 9. Property, Equipment, Software and Leases for additional information on our property, equipment and software.
Goodwill and Intangible Assets
A rollforwardGoodwill represents the fair value of our goodwill balance is presented below asan acquired business in excess of the dates indicated:
| | | | | | | | | | | | | |
| December 31, | | |
| 2021 | | 2020 | | |
| Beginning balance | $ | 899,270 | | | $ | 15,673 | | | |
| Less: accumulated impairment | — | | | — | | | |
| Beginning balance, net | 899,270 | | | 15,673 | | | |
Additional goodwill recognized(1) | — | | | 883,597 | | | |
Other adjustments(2) | (743) | | | — | | | |
Ending balance(3) | $ | 898,527 | | | $ | 899,270 | | | |
_____________________
(1) The additional goodwill recognized as of December 31, 2020 includes $873,358 related to the acquisition of Galileo and $10,239 related to the acquisition of 8 Limited. See Note 2 for additional information.
(2) As of December 31, 2021, includes an adjustment related to the finalizationfair value of the closingidentified net working capital calculation in April 2021assets acquired. Goodwill is tested for impairment at the acquisitionreporting unit level annually or whenever indicators of Galileo. See Note 2 for additional information.
(3) Asimpairment exist. Impairment of December 31, 2021, we had goodwill attributable tois the following reportable segments: $872,615 to Technology Platform and $25,912 to Financial Services. As of December 31, 2020, we had goodwill attributable to the following reportable segments: $873,358 to Technology Platform and $25,912 to Financial Services.
There were no goodwill impairment charges during the years ended December 31, 2021, 2020 and 2019.
The following is a summary ofcondition that exists when the carrying amount of a reporting unit that includes goodwill exceeds its fair value. We may assess goodwill for impairment initially using a qualitative approach, referred to as “step zero”, to determine whether conditions exist to indicate that it is more likely than not that the fair value of a reporting unit is less than its carrying amount. If management concludes, based on its assessment of relevant events, facts and estimatedcircumstances, that it is more likely than not that a reporting unit’s carrying value is greater than its fair value, then a quantitative analysis will be performed to determine if there is any impairment. We may alternatively elect to initially perform a quantitative assessment and bypass the qualitative assessment.
A goodwill impairment loss is recognized for the amount that the carrying amount of a reporting unit, including goodwill, exceeds its fair value, limited to the total amount of goodwill allocated to that reporting unit. Therefore, if the fair value of a reporting unit exceeds its carrying amount, goodwill of the reporting unit is not impaired. Our reporting units for our goodwill impairment analysis represent components of our business at one level below our operating segments. Our annual impairment testing date is October 1.
Definite-lived intangible assets are amortized on a straight-line basis over their useful lives and reviewed for impairment annually and whenever events or circumstances indicate that the carrying amount of such assets may not be recoverable. Intangible assets include capitalized costs incurred in the development and enhancement of our software products to be sold, leased or marketed. These costs, consisting primarily of salaries and compensation costs (inclusive of share-based compensation) for employees, are expensed as incurred until technological feasibility has been established, after which the costs are capitalized until the product is available for general release to customers.
See Note 2. Business Combinations and Note 8. Goodwill and Intangible Assets for further discussion of goodwill and intangible assets, by class asincluding those recognized in connection with recent business combinations.
Leases
We determine if an arrangement is or contains a lease at inception of the dates indicated:
| | | | | | | | | | | | | | | | | | | | | | | |
| Weighted Average Useful Life (Years) | | Gross Balance | | Accumulated Amortization | | Net Book Value |
| December 31, 2021 | | | | | | | |
| Developed technology | 8.5 | | $ | 257,438 | | | $ | (49,401) | | | $ | 208,037 | |
| Customer-related | 3.6 | | 125,350 | | | (57,083) | | | 68,267 | |
| Trade names, trademarks and domain names | 8.6 | | 10,000 | | | (1,901) | | | 8,099 | |
Core banking infrastructure(1) | n/a | | 17,100 | | | (17,100) | | | — | |
| Broker-dealer license and trading rights | 5.7 | | 250 | | | (74) | | | 176 | |
| Total | | | $ | 410,138 | | | $ | (125,559) | | | $ | 284,579 | |
| December 31, 2020 | | | | | | | |
Developed technology(2) | 8.5 | | $ | 257,438 | | | $ | (19,142) | | | $ | 238,296 | |
Customer-related(2) | 3.6 | | 125,350 | | | (22,102) | | | 103,248 | |
Trade names, trademarks and domain names(2) | 8.6 | | 10,000 | | | (736) | | | 9,264 | |
Core banking infrastructure(1)(2) | 1.0 | | 17,100 | | | (13,043) | | | 4,057 | |
Broker-dealer license and trading rights(2) | 5.7 | | 250 | | | (29) | | | 221 | |
| Total | | | $ | 410,138 | | | $ | (55,052) | | | $ | 355,086 | |
_____________________
(1) In connection withcontract. A contract is or contains a lease if the acquisitioncontract conveys the right to control the use of Galileo duringidentified property or equipment for a period of time in exchange for consideration. For our current office and non-office classes of operating leases, we elected the year ended December 31, 2020, we acceleratedpractical expedient to not separate non-lease components from lease components and to, instead, account for each separate lease component and the useful life of our existing core banking infrastructure to May 2021. Although the intangible asset was fully amortized as of December 31, 2021, it remains in use by the Company.
(2) During the year ended December 31, 2020, the Company acquired $253,000 in developed technology, $125,000 in customer-related intangible assets and $10,000 in trade names, trademarks and domain names related to the acquisition of Galileo. Other additions to developed technology, customer-related and broker-dealer license and trading rights intangible assets related to the acquisition of 8 Limited.
Amortization expense for the years ended December 31, 2021, 2020 and 2019 was $70,507, $49,735 and $3,008, respectively. There were no abandonments or impairments during any of the years presented. We accelerated amortization expense during 2019 related to certain partnership and other intangible assets because we determined that the costs of thesenon-
SoFi Technologies, Inc.
SoFi Technologies, Inc.
Notes to Consolidated Financial Statements (continued)
(In Thousands, Unless Otherwise Stated and Except for Share and Per Share Data)
lease components associated with that lease component as a single lease component. For our current classes of finance leases, we did not elect to apply this practical expedient and, instead, separately identify and measure the non-lease components of the contracts. As an accounting policy election, we apply the short-term lease exemption practical expedient to any lease that, at the commencement date, has a lease term of 12 months or less and does not include an option to purchase the underlying asset that we are reasonably certain to exercise.
Operating leases are presented within operating lease right-of-use assets and operating lease liabilities in the consolidated balance sheets. Finance lease ROU assets had already been recovered, which meant there was no expectedare presented within property, equipment and software and finance lease liabilities are presented within accounts payable, accruals and other liabilities in the consolidated balance sheets. Operating and finance lease ROU assets represent our right to use an underlying asset for the lease term and operating and finance lease liabilities represent our obligation to make lease payments arising from the lease. ROU assets and lease liabilities are recognized at the commencement date based on the present value of lease payments over the lease term. As our leases do not provide an implicit borrowing rate, we use our incremental borrowing rate based on the information available at commencement date or modification date, as appropriate, in determining the present value of lease payments.
The operating lease ROU assets are increased by any prepaid lease payments and are reduced by any unamortized lease incentives. Our lease terms may include options to extend or terminate the lease when it is reasonably certain that we will exercise that option. Base rent is typically subject to rent escalations on each annual anniversary from the lease commencement dates. Lease expense for lease payments, including any step rent provisions specified in the lease agreements, is recognized on a straight-line basis over the lease term and is allocated among the components of noninterest expense in the consolidated statements of operations and comprehensive loss. The finance lease ROU assets are depreciated on a straight-line basis over the estimated useful life of seven years. Interest expense on finance leases is recognized for the difference between the present value of the lease liabilities and the scheduled lease payments within interest expense—other in the consolidated statements of operations and comprehensive loss.
When a lease agreement is modified, we determine if the modification grants us the right to use an additional asset that is not included in the original lease contract and if the lease payments increase commensurate with the standalone price for the additional ROU asset. If both conditions are met, we account for the agreement as two separate contracts: (i) the original, unmodified contract and (ii) a separate contract for the additional ROU asset. If both conditions are not met, the modification is not evaluated as a separate contract. Instead, based on the nature of the modification, we: (i) reassess the lease classification on the modification date under the modified terms, and (ii) use the modified lease payments and discount rate to remeasure the lease liability and recognize any difference between the new lease liability and the old lease liability as an adjustment to the ROU asset.
See Note 9. Property, Equipment, Software and Leases for additional information on our leases.
Derivative Financial Instruments
We enter into derivative contracts to manage future benefit as of December 31, 2019. The acceleration of amortization expense had an immaterial impact during the period.
Estimated future amortization expense as of December 31, 2021 is as follows:
| | | | | |
| 2022 | $ | 66,449 | |
| 2023 | 64,753 | |
| 2024 | 31,468 | |
| 2025 | 31,468 | |
| 2026 | 30,641 | |
| Thereafter | 59,800 | |
| Total | $ | 284,579 | |
Note 4. Investments in AFS Debt Securities
In the third quarter of 2021, we began investing in debt securities. The following table presents our investments in AFS debt securities as of December 31, 2021.loan sale execution risk. We did not elect hedge accounting, as management’s hedging intentions are to economically hedge the risk of unfavorable changes in the fair values of our personal loans, student loans and home loans. Our derivative instruments used to manage future loan sale execution risk include interest rate swaps, interest rate caps and home loan pipeline hedges. We also have any investments in debt securities as of December 31, 2020.
| | | | | | | | | | | | | | | | | | | | | | | | | | | | | | | | |
| | December 31, 2021 |
| | Amortized Cost(1) | | Accrued Interest | | Gross Unrealized Gains | | Gross Unrealized Losses(2) | | Fair Value |
Investments in AFS debt securities(3): | | | | | | | | | | |
| U.S. Treasury securities | | $ | 103,014 | | | $ | 73 | | | $ | — | | | $ | (584) | | | $ | 102,503 | |
Multinational securities(4) | | 19,911 | | | 109 | | | — | | | (154) | | | 19,866 | |
| Corporate bonds | | 39,894 | | | 235 | | | — | | | (480) | | | 39,649 | |
| Agency TBA | | 7,457 | | | 13 | | | 4 | | | (8) | | | 7,466 | |
| Agency mortgage-backed securities | | 4,153 | | | 14 | | | — | | | (31) | | | 4,136 | |
| Other asset-backed securities | | 9,610 | | | 5 | | | — | | | (91) | | | 9,524 | |
| Commercial paper | | 9,939 | | | — | | | — | | | — | | | 9,939 | |
Other(5) | | 1,818 | | | 13 | | | — | | | (7) | | | 1,824 | |
| Total investments in AFS debt securities | | $ | 195,796 | | | $ | 462 | | | $ | 4 | | | $ | (1,355) | | | $ | 194,907 | |
_____________________(1) Amortized cost basis reflects the amortization of premium of $384 during the year ended December 31, 2021.
(2) As of December 31, 2021, we determinedIRLCs, interest rate swaps and interest rate caps that our unrealized loss positionswere not related to credit losses were immaterial.future loan sale execution risk.
Changes in derivative instrument fair values are recognized in earnings as they occur. Depending on the measurement date position, derivative financial instruments are presented within other assets or accounts payable, accruals and other liabilities in the consolidated balance sheets. Our derivative instruments are reported within cash flows from operating activities in the consolidated statements of cash flows.
Certain derivative instruments are subject to enforceable master netting arrangements. Accordingly, we present our net asset or liability position by counterparty in the consolidated balance sheets. Additionally, since our cash collateral balances do not approximate the fair value of the derivative position, we do not intendoffset our right to sell the securities in loss positions nor is it more likely than not that we will be requiredreclaim cash collateral or obligation to sell the securities prior to recovery of the amortized cost basis. return cash collateral against recognized derivative assets or liabilities.
See Note 114. Derivative Financial Instruments and Note 15. Fair Value Measurements for additional information. Additionally, no such investments have been in a continuous unrealized loss position for more than 12 months, as we made the investments during the third quarter of 2021.
(3) Investments in AFS debt securities are recorded at fair value.
(4) As of December 31, 2021, includes sovereign foreigninformation on our derivative assets and supranational bonds.
(5) As of December 31, 2021, includes state and city municipal bond securities.
SoFi Technologies, Inc.
SoFi Technologies, Inc.
Notes to Consolidated Financial Statements (continued)
(In Thousands, Unless Otherwise Stated and Except for Share and Per Share Data)
The following table presentsResidual Interests Classified as Debt
Within consolidated securitizations, the amortized cost andresidual interests held by third parties are presented as residual interests classified as debt in the consolidated balance sheets. We measure residual interests classified as debt at fair value of our investmentson a recurring basis. We record subsequent measurement changes in AFS debt securities as of December 31, 2021 by contractual maturity.
| | | | | | | | | | | | | | | | | | | | | | | | | | | | | | | | |
| | Due Within One Year | | Due After One Year Through Five Years | | Due After Five Years Through Ten Years | | Due After Ten Years | | Total |
| December 31, 2021 | | | | | | | | | | |
| Investments in AFS debt securities—Amortized cost: | | | | | | | | | | |
| U.S. Treasury securities | | $ | — | | | $ | 103,014 | | | $ | — | | | $ | — | | | $ | 103,014 | |
| Multinational securities | | — | | | 19,911 | | | — | | | — | | | 19,911 | |
| Corporate bonds | | — | | | 39,894 | | | — | | | — | | | 39,894 | |
| Agency TBA | | — | | | — | | | — | | | 7,457 | | | 7,457 | |
| Agency mortgage-backed securities | | — | | | — | | | — | | | 4,153 | | | 4,153 | |
| Other asset-backed securities | | — | | | 7,600 | | | 2,010 | | | — | | | 9,610 | |
| Commercial paper | | 9,939 | | | — | | | — | | | — | | | 9,939 | |
| Other | | 600 | | | 1,218 | | | — | | | — | | | 1,818 | |
| Total investments in AFS debt securities | | $ | 10,539 | | | $ | 171,637 | | | $ | 2,010 | | | $ | 11,610 | | | $ | 195,796 | |
| | | | | | | | | | |
Investments in AFS debt securities—Fair value(1): | | | | | | | | | | |
| U.S. Treasury securities | | $ | — | | | $ | 102,430 | | | $ | — | | | $ | — | | | $ | 102,430 | |
| Multinational securities | | — | | | 19,757 | | | — | | | — | | | 19,757 | |
| Corporate bonds | | — | | | 39,414 | | | — | | | — | | | 39,414 | |
| Agency TBA | | — | | | — | | | — | | | 7,453 | | | 7,453 | |
| Agency mortgage-backed securities | | — | | | — | | | — | | | 4,122 | | | 4,122 | |
| Other asset-backed securities | | — | | | 7,527 | | | 1,992 | | | — | | | 9,519 | |
| Commercial paper | | 9,939 | | | — | | | — | | | — | | | 9,939 | |
| Other | | 599 | | | 1,212 | | | — | | | — | | | 1,811 | |
| Total investments in AFS debt securities | | $ | 10,538 | | | $ | 170,340 | | | $ | 1,992 | | | $ | 11,575 | | | $ | 194,445 | |
_____________________
(1) Presentation of fair values of our investmentsvalue in AFS debt securities by contractual maturity excludes total accrued interest of $462 as of December 31, 2021.
The following table presents the proceeds and gross realized gains and losses from sales and maturities of our investmentsperiod in debt securities duringwhich the year ended December 31, 2021. Realized gains and losses are presentedchange occurs within noninterest income—otherloan origination, sales, and securitizations in the consolidated statements of operations and comprehensive income (loss). Thereloss. We determine the fair value of residual interests classified as debt using a discounted cash flow methodology, while also considering market data as it becomes available.
We recognize interest expense related to residual interests classified as debt over the expected life using the effective yield method, which reflects a portion of the overall fair value adjustment recorded each period on our residual interests classified as debt. Interest expense related to residual interests classified as debt is presented within interest expense—securitizations and warehouses in the consolidated statements of operations and comprehensive loss. On a quarterly basis, we reevaluate the cash flow estimates to determine if a change to the accretable yield is required on a prospective basis.
See Note 15. Fair Value Measurements for the key inputs used in the fair value measurements of residual interests classified as debt.
Safeguarding Asset and Liability
Through our SoFi Invest product (via our wholly-owned subsidiary, SoFi Digital Assets, LLC, a licensed money transmitter), our members were able to invest in digital assets. In the fourth quarter of 2023, we transferred the crypto services provided by SoFi Digital Assets, LLC, and began closing existing digital assets accounts. This process was completed in the first quarter of 2024. Certain accounts were eligible for transfer to a third party digital asset service provider who assumed responsibility for the transferred accounts on a go-forward basis, including the arrangement of custodial services for the transferred digital assets. We have no transfers between classificationsfurther ongoing responsibilities for the transferred digital assets subsequent to the executed transfer which took place in December 2023, and derecognized the corresponding digital assets safeguarding liability and safeguarding asset as of the date of the transfer.
For those digital assets that were not eligible to be transferred, we engage third parties to provide custodial services for our digital assets offering, which include holding the cryptographic key information and working to protect the digital assets from loss or theft. The third-party custodians hold digital assets as custodial assets in an account in SoFi’s name for the benefit of our investmentsmembers. We maintain the internal recordkeeping of our members’ digital assets, including the amount and type of digital assets owned by each of our members in AFS debt securities during the year presented.
| | | | | | | | |
| | Year Ended
December 31, 2021 |
Investments in AFS debt securities | | |
Gross realized gains included in earnings | | $ | 44 | |
Gross realized losses included in earnings | | (152) | |
Net realized losses | | $ | (108) | |
Gross proceeds from sales and maturities(1)
| | $ | 57,541 | |
_____________________
(1) Proceeds from maturitiescustodial accounts. As of investments in AFS debt securities during the year ended December 31, 2021 were $4,799.2023, we utilized one third-party custodian.
In accordance with Staff Accounting Bulletin No. 121 (“SAB 121”), we recognize a digital assets safeguarding liability within accounts payable, accruals and other liabilities in the consolidated balance sheets reflecting our obligation to safeguard the digital assets held by third-party custodians for the benefit of our members. We also recognize a corresponding safeguarding asset within other assets in the consolidated balance sheets. The safeguarding liability and corresponding safeguarding asset are measured and recorded at the fair value of the digital assets held by the custodians at each reporting date. Subsequent changes to the fair value measurement are reflected as equal and offsetting adjustments to the carrying values of the safeguarding liability and corresponding safeguarding asset. We evaluate any potential loss events, such as theft, loss or destruction of the cryptographic keys, that may affect the measurement of the safeguarding asset, which would be reflected in our results of operations in the period the loss occurs. Measurement changes do not impact the consolidated statements of operations and comprehensive loss unless such a loss event is identified. As of both December 31, 2023 and 2022, we did not identify any loss events.
See Note 15. Fair Value Measurements for additional information on the fair value measurement of the safeguarding liability and corresponding safeguarding asset.
Borrowings and Financing Costs
We borrow from various financial institutions to finance our lending activities. Direct costs incurred in connection with financing, such as banker fees, origination fees and legal fees, are classified as deferred debt issuance costs. We capitalize these costs and report the amounts as a direct deduction from the carrying amount of the debt balance. Any difference between the stated principal amount of debt and the amount of cash proceeds received, net of debt issuance costs, is presented as a
SoFi Technologies, Inc.
SoFi Technologies, Inc.
Notes to Consolidated Financial Statements (continued)
(In Thousands, Unless Otherwise Stated and Except for Share and Per Share Data)
discount or premium. The capitalized debt issuance costs and the original issue discount/premium are amortized into interest expense over the expected life of the related financing agreements using the straight-line method for revolving facilities and the effective interest method for securitization debt and our senior convertible notes, as defined and further discussed below. Remaining unamortized fees are expensed immediately upon early extinguishment of the debt. In a debt modification for revolving debt, the initial issuance costs and any additional fees incurred as a result of the modification are deferred over the term of the new agreement, if the borrowing capacity of the revolving facility is increased. In the case that a modification results in a decrease in our borrowing capacity, any fees paid to the creditor and any third-party costs incurred are considered to be associated with the new arrangement and are, therefore, deferred and amortized over the term of the new arrangement. Unamortized deferred costs relating to the old arrangement at the time of the modification are expensed immediately in proportion to the decrease in borrowing capacity of the old arrangement. Any remaining unamortized deferred costs relating to the old arrangement are deferred and amortized over the term of the new arrangement.
We elected the fair value option to measure certain securitization debt, with the intent to mitigate the accounting divergence between debt liabilities measured at historical cost and the corresponding loans securing these financings, which are risk-managed on a fair value basis. For securitization debt carried at fair value on a recurring basis, we record the initial fair value measurement and subsequent measurement changes in fair value in the period in which the changes occur within noninterest income—loan origination, sales, and securitizations in the consolidated statements of operations and comprehensive loss. We determined the fair value of the applicable securitization debt using a discounted cash flow methodology, while also considering market data as it becomes available. The key inputs to the calculation include the underlying contractual coupons, terms, discount rate and expectations for defaults and prepayments.
Convertible Senior Notes
In October 2021, we issued $1.2 billion aggregate principal amount of convertible senior notes due 2026 (the “convertible notes”). The convertible notes will mature on October 15, 2026, unless earlier repurchased, redeemed or converted. We will settle conversions by paying or delivering, at our election, cash, shares of our common stock or a combination of cash and shares of our common stock, based on the applicable conversion rate(s). The convertible notes will also be redeemable, in whole or in part, at our option at any time, and from time to time, on or after October 15, 2024 through the 30th scheduled trading day immediately before the maturity date, at a cash redemption price equal to the principal amount of the convertible notes to be redeemed, plus accrued interest, if any, thereon to, but excluding, the redemption date, but only if certain liquidity conditions described in the indenture are satisfied and certain conditions are met with respect to the last reported sale price per share of our common stock prior to conversion. In December 2023, we entered into repurchase agreements to repurchase $88.0 million aggregate principal amount of the convertible notes. See Note 1212. Debt for unrealizedmore detailed disclosure of the term and features of the convertible notes.
We elected to evaluate each embedded feature of the arrangement individually. We concluded that each of the conversion rights, optional redemption rights, fundamental change make-whole provision and repurchase rights did not require bifurcation as derivative instruments, which we reevaluate each reporting period. The additional interest and special interest that accrue on the notes in the event of our failure to comply with certain registration or reporting requirements are required to be bifurcated from the host contract, as the reporting requirement triggering event is not clearly and closely related to the host convertible debt contract, and therefore we measure the contingent interest feature at fair value each reporting period. The value was determined to be immaterial; therefore, we accounted for the convertible notes wholly as debt, which was recognized on the settlement date. Accordingly, we allocated all debt issuance costs to the debt instrument on the basis of materiality.
In connection with the pricing of the convertible notes, we entered into privately negotiated capped call transactions with certain financial institutions, as defined and further discussed below.
Redeemable Preferred Stock
Series 1 Redeemable Preferred Stock (as defined in Note 13. Equity) is classified in temporary equity, as it is not fully controlled by SoFi. See Note 13. Equity for additional information.
Foreign Currency Translation Adjustments
We revalue assets, liabilities, income and expense denominated in non-United States currencies into United States dollars using applicable exchange rates. For foreign subsidiaries in which the functional currency is the subsidiary’s local
SoFi Technologies, Inc.
SoFi Technologies, Inc.
Notes to Consolidated Financial Statements (continued)
(In Thousands, Unless Otherwise Stated and Except for Share and Per Share Data)
currency, gains and losses relating to foreign currency translation adjustments are included in accumulated other comprehensive income (loss) in our consolidated balance sheets. For foreign subsidiaries in which the functional currency is the United States Dollar, gains and losses relating to foreign currency transaction adjustments are included within earnings in the consolidated statements of operations and comprehensive loss. Due to the highly inflationary economic environment in Argentina, we use the United States Dollar as the functional currency of our Argentinian operations. Our activities in Argentina are related to our Technology Platform segment and commenced in the first quarter of 2022 with the Technisys Merger.
Capped Call Transactions
We entered into privately negotiated capped call transactions (the “Capped Call Transactions”) with certain financial institutions (the “Capped Call Counterparties”). The Capped Call Transactions initially cover, subject to customary anti-dilution adjustments, the number of shares of our common stock that initially underlie the convertible notes. The Capped Call Transactions are net purchased call options on our investmentsown common stock. The Capped Call Transactions are separate transactions entered into by the Company with each of the Capped Call Counterparties, are not part of the terms of the convertible notes, and do not affect any holder’s rights under the convertible notes. Holders of the convertible notes do not have any rights with respect to the Capped Call Transactions. As the Capped Call Transactions are legally detachable and separately exercisable from the convertible notes, they were evaluated as freestanding instruments. We concluded that the Capped Call Transactions meet the scope exceptions for derivative instruments, and as such, the Capped Call Transactions meet the criteria for classification in AFS debt securitiesequity and are included as a reduction to additional paid-in capital.
See Note 13. Equity for additional information on the Capped Call Transactions.
Interest Income
We record interest income associated with loans measured at fair value over the term of the underlying loans using the effective interest method on unpaid loan principal amounts, reclassified outwhich is presented within interest income—loans and securitizations in the consolidated statements of AOCI.operations and comprehensive loss. We also record accrued interest income associated with loans measured at amortized cost within interest income—loans and securitizations. We stop accruing interest and reverse all accrued but unpaid interest at the time a loan charges off. Loans are returned to accrual status if the loans are brought to nondelinquent status or have performed in accordance with the contractual terms for a reasonable period of time and, in management’s judgment, will continue to make scheduled periodic principal and interest payments.
Other interest income is primarily earned on our bank balances.
Note 5. LoansLoan Origination and Sales Activities
As part of December 31, 2021, our loan portfolio consistedsale agreements, we may retain the rights to service sold loans. We calculate a gain or loss on the sale based on the sum of personalthe proceeds from the sale and any servicing asset or liability recognized, less the carrying value of the loans sold. Our gain or loss calculation is also inclusive of repurchase liabilities recognized at the time of sale, and is recorded within noninterest income—loan origination, sales, and securitizations in the consolidated statements of operations and comprehensive loss.
Loan Commitments
We offer a program whereby applicants can lock in an interest rate on an in-school loan to be funded at a later time. Applicants can exit the loan origination process up until the loan funding date. SoFi is obligated to fund the loan at the committed terms on the disbursement date if the borrower does not cancel prior to the loan funding date. The student loansloan commitments meet the scope exception for issuers of commitments to originate non-mortgage loans. As the writer of the commitments, we elected the fair value option to measure our unfunded student loan commitments to align with the measurement methodology of our originated student loans. As such, our student loan commitments are carried at fair value on a recurring basis. Depending on the measurement date position, student loan commitments are presented within other assets or accounts payable, accruals and other liabilities in the consolidated balance sheets. We record the initial fair value measurement and subsequent measurement changes in fair value in the period in which the changes occur within noninterest income—loan origination, sales, and securitizations in the consolidated statements of operations and comprehensive loss.
Loan commitments also include IRLCs, whereby we commit to interest rate terms prior to completing the origination process for home loans, whichloans. IRLCs are derivative instruments that are measured at fair value and credit card loans, which are measured at amortized cost. Below ison a disaggregated presentation of our loans, inclusive ofrecurring basis. Changes in fair market value adjustments and accrued interest income, as applicable, as of the dates indicated:
| | | | | | | | | | | |
| December 31, |
| 2021 | | 2020 |
| Loans at fair value | | | |
| Securitized student loans | $ | 574,328 | | | $ | 908,427 | |
| Securitized personal loans | 234,576 | | | 559,743 | |
| Student loans | 2,876,509 | | | 1,958,032 | |
| Home loans | 212,709 | | | 179,689 | |
| Personal loans | 2,054,850 | | | 1,253,177 | |
| Total loans at fair value | 5,952,972 | | | 4,859,068 | |
Loans at amortized cost(1) | | | |
Credit card loans(2) | 115,912 | | | 3,723 | |
Commercial loan(3) | — | | | 16,512 | |
| Total loans at amortized cost | 115,912 | | | 20,235 | |
| Total loans | $ | 6,068,884 | | | $ | 4,879,303 | |
_____________________SoFi Technologies, Inc.
SoFi Technologies, Inc.
Notes to Consolidated Financial Statements (continued)
(In Thousands, Unless Otherwise Stated and Except for Share and Per Share Data)
value are recognized within noninterest income—loan origination, sales, and securitizations in the consolidated statements of operations and comprehensive loss. See “Derivative Financial Instruments” in this Note 1 for additional information on our loans at amortized cost as it pertainsderivative instruments.
See Note 15. Fair Value Measurements for the key inputs used in the fair value measurements of our loan commitments.
Revenue Recognition
In each of our revenue arrangements, revenue is recognized when control of the promised goods or services is transferred to the allowancecustomer in an amount that reflects our expected consideration in exchange for credit losses pursuant to ASC 326, those goods or services. Our primary revenue streams for the periods presented include the following:
•Financial Instruments—Credit Losses Technology Products and Solutions:(“ASC 326”). We earn fees for providing an integrated platform as a service for financial and non-financial institutions.
(2) •DuringReferrals: We earn specified referral fees in connection with referral activities we facilitate through our platform, such as referrals to third-party partners that offer services to end users who do not use one of our product offerings and referrals of pre-qualified borrowers to a third-party partner who separately contracts with a loan originator.
•Interchange: We earn interchange fees from debit and credit cardholder transactions conducted through payment networks.
•Brokerage: We earn fees in connection with facilitating investment-related transactions through our platform, such as brokerage transactions, share lending and exchange conversion.
See Note 3. Revenue for additional information on our revenue recognition policy within each revenue stream.
Advertising, Sales and Marketing
Advertising production costs and advertising communication costs, as well as amounts paid to various affiliates to market our products, are included within noninterest expense—sales and marketing in the yearconsolidated statements of operations and comprehensive loss. Advertising costs are expensed either as incurred or when the advertising takes place, depending on the nature of the advertising activity. For the years ended December 31, 2023, 2022 and 2021, we had originations of credit card loans of $380,979advertising totaled $284,176, $256,125 and gross repayments on credit card loans of $261,283, of which $474 were non-cash reductions to the loan balance through reward point redemptions. During the year ended December 31, 2020, we had originations of $6,957 and gross repayments of $3,017.$183,106, respectively.
(3)Expenses incurred by us related to member acquisition, including brand development, business development and direct member marketing expenses, are also presented within Duringnoninterest expense—sales and marketing in the third quarterconsolidated statements of 2021, we issued a commercial loan that had a principal balance of $10,000, all of which was repaid during the third quarter of 2021. During the fourth quarter of 2020, we issued a commercial loan that had a principal balance of $16,500operations and accumulated unpaid interest of $12 as of December 31, 2020, all of which was repaid during January 2021.comprehensive loss.
Loans Measured at Fair Value
We elected the fair value option to measure our personal loans, student loans and home loans, as we believe that fair value best reflects the expected economic performance of the loans. Therefore, these loans are carried at fair value on a recurring basis. During the year ended December 31, 2023, we transferred home loans out of Level 3 and into Level 2 due to an update to pricing sources utilized by third-party valuation specialists, as part of the integration of Wyndham. Other loans do not trade in an active market with readily observable prices and are classified as Level 3. We determine the fair value of our loans using a discounted cash flow methodology, while also considering market data as it becomes available.
Direct fees, which primarily relate to personal and home loan originations, are recognized in earnings as earned and are recorded within noninterest income—loan origination, sales, and securitizations in the consolidated statements of operations and comprehensive loss. Direct loan origination costs are recognized in earnings as incurred and are recorded within noninterest expense—cost of operations in the consolidated statements of operations and comprehensive loss. We record the initial fair value measurement and subsequent measurement changes in fair value in the period in which the changes occur within noninterest income—loan origination, sales, and securitizations in the consolidated statements of operations and comprehensive loss. We record cash flows related to loans held for sale within cash flows from operating activities in the consolidated statements of cash flows.
Securitized loans are assets held by consolidated SPEs as collateral for bonds issued, for which fair value changes are recorded within noninterest income—loan origination, sales, and securitizations in the consolidated statements of operations and comprehensive loss. Gains or losses recognized upon deconsolidation of a VIE are also recorded within noninterest income—loan origination, sales, and securitizations.
We consider a loan to be delinquent when the borrower has not made the scheduled payment amount within one day after the scheduled payment date, provided the borrower is not in school or in deferment, forbearance or within an agreed-upon grace period. Loan deferment is a provision within student loan contracts that permits the borrower to defer payments while enrolled at least half time in school. During the deferment period, interest accrues on the loan balance and is capitalized to the loan when the loan enters repayment status, which begins when the student no longer qualifies for deferment.
Forbearance applies to student loans, personal loans and home loans. A borrower in repayment may generally request forbearance for reasons including a FEMA-declared disaster, unemployment, economic hardship or general economic uncertainty. Forbearance typically cannot exceed a total of 12 months over the life of the loan. If forbearance is granted, interest continues to accrue during the forbearance period and is capitalized to the loan when the borrower resumes making payments. At the conclusion of a forbearance period, the contractual monthly payment is recalculated and is generally higher as a result.
SoFi Technologies, Inc.
SoFi Technologies, Inc.
Notes to Consolidated Financial Statements (continued)
(In Thousands, Unless Otherwise Stated and Except for Share and Per Share Data)
For personal loans and student loans, delinquent loans are charged off after 120 days of delinquency or on the date of confirmed loss. For home loans, delinquent loans are charged off after 180 days of delinquency or on the date of confirmed loss. For all loans, we stop accruing interest and reverse all accrued but unpaid interest on the date of charge-off. Additional information about our loans held for sale is included in Note 4. Loans, Note 7. Securitization and Variable Interest Entities and Note 15. Fair Value Measurements.
Loans Measured at Amortized Cost
For our senior secured and commercial and consumer banking loans, direct loan origination costs are deferred and amortized using the effective interest method over the contractual term of the loans within interest income—loans and securitizations in the consolidated statements of operations and comprehensive loss. As of December 31, 2023, the remaining balance of deferred costs was immaterial.
We present accrued interest for loans measured at amortized cost within loans held for investment, at amortized cost in the consolidated balance sheets. The amortized cost of these loans is subject to our allowance for credit losses methodology described within “Allowance for Credit Losses” herein. We record cash flows related to loans held for investment within cash flows from investing activities in the consolidated statements of cash flows.
Credit card receivables are reported at the amounts due from members, including accrued interest and fees, and unamortized net deferred loan origination fees and costs. Loan origination fees and direct loan origination costs are amortized on a straight-line basis over a 12-month period as adjustments to income through interest income—loans and securitizations in the consolidated statements of operations and comprehensive loss. Credit card balances are reported as delinquent when they become 30 or more days past due. Credit card balances are charged off after 180 days of delinquency or on the date of the confirmed loss, at which time we stop accruing interest and fees and reverse all accrued but unpaid interest and fees through interest income as of such date. When a credit card balance is charged off, we record a reduction to the allowance and the credit card balance. When recovery payments are received against charged off credit card balances, we record a direct reduction to the provision for credit losses. Credit card receivables associated with alleged or potential fraudulent transactions are charged off through noninterest expense—general and administrative in the consolidated statements of operations and comprehensive loss.
Commercial and consumer banking loans are reported as delinquent when they become 30 or more days past due. For all commercial and consumer banking loans, we stop accruing interest and reverse all accrued but unpaid interest after 90 days of delinquency. For consumer banking loans, delinquent loans are charged off after 120 days of delinquency or on the date of confirmed loss. For commercial loans, performance is monitored on an individual loan basis and delinquent loans are charged off when collectability of interest and principal on the loan is not reasonably assured.
Senior secured loans are term loan arrangements secured by underlying loans owned by the debtor. Senior secured loans are reported as delinquent when they become 30 or more days past due, and are charged off after 120 days of delinquency or on the date of confirmed loss.
Financial Guarantees
We entered into a credit default swap related to our student loans which meets the definition of a financial guarantee and is excluded from derivative accounting treatment. We apply the insurance contract claim method by deferring the full estimated amount of premiums paid and payable at inception. The deferred premium is estimated using a discounted cash flow model considering the expected performance of the reference portfolio and recorded within other assets and accounts payable, accruals and other liabilities in the consolidated balance sheets. Deferred premiums are amortized based on actual premiums due and recognized in noninterest expense—general and administrative in the consolidated statements of operations and comprehensive loss. We recognize a receivable and related earnings when a loss event occurs, we have the right to submit a claim, and recovery is probable.
Allowance for Credit Losses
We primarily evaluate expected credit losses under the current expected credit loss model for the following financial assets: (i) cash equivalents and restricted cash equivalents, (ii) accounts receivable from contracts with customers, inclusive of servicing related receivables, (iii) loans measured at amortized cost, and (iv) investments in AFS debt securities. Our approaches to measuring the allowance for credit losses on the applicable financial assets are as follows:
SoFi Technologies, Inc.
SoFi Technologies, Inc.
Notes to Consolidated Financial Statements (continued)
(In Thousands, Unless Otherwise Stated and Except for Share and Per Share Data)
Cash equivalents and restricted cash equivalents: Our cash equivalents and restricted cash equivalents are short-term in nature and of high credit quality; therefore, we determined that our exposure to credit losses over the life of these instruments was immaterial.
Accounts receivable from contracts with customers: Accounts receivable from contracts with customers as of the balance sheet dates, all of which are short-term in nature, are recorded at their original invoice amounts reduced by any allowance for credit losses. We assess the risk of loss for each individual customer, even when the risk is remote. Certain of our historical accounts receivable balances did not have any write-offs. We use the aging method and historical loss rates as a basis for estimating the percentage of current and delinquent accounts receivable balances that will result in credit losses. We consider whether the conditions at the measurement date and reasonable and supportable forecasts about future conditions, such as customer creditworthiness, current economic conditions, customer location, expectations of near-term economic trends and changes in customer payment terms and collection trends, warrant an adjustment to our historical loss experience. Based on this analysis, we determined that our historical loss rates remained most indicative of our lifetime expected losses. We record the provision for credit losses on accounts receivable from contracts with customers within noninterest expense—general and administrative in the consolidated statements of operations and comprehensive loss.
When we determine that a receivable is not collectible, we write off the uncollectible amount as a reduction to both the allowance and the gross asset balance. Recoveries are recorded when received and credited to the provision for credit losses. Any change in the assumptions used in analyzing a specific account receivable may result in an additional allowance for credit losses being recognized in the period in which the change occurs. See Note 5. Allowance for Credit Losses for a rollforward of the allowance for credit losses related to our accounts receivable.
Senior secured loans: We evaluate the credit quality of our senior secured loan portfolio based on the fair value of underlying collateral, which are subject to the requirements of our loan underwriting process and risk models upon origination. This analysis is performed on a quarterly basis utilizing a third-party valuation specialist, whereby the fair value of underlying collateral is reassessed based on relevant information such as funded loan rates and historical loss experience, among other factors. An allowance for credit losses is required when there is an expected credit loss after considering the fair value of the collateral as well as any anticipated future changes in the underlying collateral. As of and for the year ended December 31, 2023, we determined that our expected exposure to credit losses was immaterial, and as such did not recognize an allowance for credit losses on senior secured loans.
Credit cards: We segment pools of credit cards based on consumer credit score bands as measured using FICO scores, which are obtained at origination of the account and are refreshed monthly thereafter, and also by delinquency status, which may be adjusted using other risk-differentiating attributes to model charge-off probabilities and the average life over which expected credit losses may occur for the credit cards within each pool. The pools estimate the likelihood of borrowers with similar FICO scores to pay credit obligations based on aggregate credit performance data. When necessary, we apply separate credit loss assumptions to assets that have deteriorated in credit quality such that they no longer share similar risk characteristics with other assets in the same FICO score band. We either estimate the allowance for credit losses on such non-performing assets individually based on individual risk characteristics or as part of a distinct pool of assets that shares similar risk characteristics. We reassess our credit card pools periodically to confirm that all loans within each pool continue to share similar risk characteristics.
We establish an allowance within each pool of credit cards utilizing the risk model described above, which may then be adjusted for current conditions and reasonable and supportable forecasts of future conditions, including economic conditions. We apply the probability-of-default and loss-given-default assumptions to the drawn balance of credit cards within each pool to estimate the lifetime expected credit losses within each pool, which are then aggregated to determine the allowance for credit losses. We do not measure credit losses on the undrawn credit exposure, as such undrawn credit exposure is unconditionally cancellable by us. Additionally, management evaluates whether to include qualitative reserves to cover losses that are expected but may not be adequately represented in the quantitative methods or the economic assumptions. The qualitative reserves address possible limitations within the models, such as external conditions including regulatory requirements, emerging portfolio trends, the nature and size of the portfolio, portfolio concentrations, the volume and severity of past due accounts, or management risk actions. We record the provision for credit losses on credit cards within noninterest expense—provision for credit losses in the consolidated statements of operations and comprehensive loss.
SoFi Technologies, Inc.
SoFi Technologies, Inc.
Notes to Consolidated Financial Statements (continued)
(In Thousands, Unless Otherwise Stated and Except for Share and Per Share Data)
We elected to exclude interest on credit cards from the measurement of our allowance, as our policy allows for accrued interest to be reversed in a timely manner. Further, we elected the practical expedient to exclude the accrued interest component of our credit cards from the quantitative disclosures presented.
See Note 5. Allowance for Credit Losses for a rollforward of the allowance for credit losses related to our credit cards.
Commercial and consumer banking loans: We evaluate the credit quality of our commercial and consumer banking loan portfolio based on regulatory risk ratings. Loans are categorized into risk ratings based on relevant information about the ability of borrowers to service their debt, such as current financial information, historical payment experience, collateral adequacy, credit documentation, and current economic trends, among other factors. The allowance for credit losses is determined at a portfolio level and estimated based on weighted average remaining maturity and annualized loss rate according to the loan’s regulatory loan type, risk rating classification and historical loss rates in the industry. This analysis is performed on an ongoing basis as new information is obtained.
See Note 5. Allowance for Credit Losses for a rollforward of the allowance for credit losses related to our commercial and consumer banking loans.
Investments in AFS debt securities: Credit-related impairment is recognized as an allowance for credit losses in the consolidated balance sheets with a corresponding adjustment to noninterest expense—provision for credit losses in the statements of operations and comprehensive loss. For certain securities that are guaranteed by the U.S. Treasury or government agencies, or sovereign entities of high credit quality, we concluded that there is no risk of credit-related impairment due to the nature of the counterparties and history of no credit losses. For other investments in AFS debt securities, factors considered in evaluating credit losses include: (i) adverse conditions related to the macroeconomic environment or the industry, geographic area or financial condition of the issuer, (ii) other credit indicators of the security, such as external credit ratings, and (iii) payment structure of the security. For the year ended December 31, 2023, we did not recognize an allowance for credit losses on impaired investments in AFS debt securities.
Servicing Rights
Each time we enter into a servicing agreement, either in connection with transfers of our financial assets or in connection with a referral fulfillment arrangement in which we are a sub-servicer for financial assets that we do not legally own, we determine whether we should record a servicing asset or servicing liability. We elected the fair value option to measure our servicing rights subsequent to initial recognition. We measure the initial and subsequent fair value of our servicing rights using a discounted cash flow methodology, while also considering market data as it becomes available. The significant assumptions used in the valuation model include our contractual servicing fee, ancillary income, prepayment rate assumptions, default rate assumptions, a discount rate commensurate with the risk of the servicing asset or liability being valued, and an assumed market cost of servicing, which is based on active quotes from third-party servicers. The value of the servicing rights are dependent on the performance of the underlying loans. For servicing rights retained in connection with loan transfers that do not meet the requirements for sale accounting treatment, there is no recognition of a servicing asset or liability.
Servicing rights in connection with transfers of financial assets are initially measured at fair value and recognized as a component of the gain or loss from sales of loans and the initial capitalization is reported within noninterest income—loan origination, sales, and securitizations in the consolidated statements of operations and comprehensive loss. Servicing rights assumed from third parties for financial assets for which we are not the loan originator are initially measured at fair value and recognized within noninterest income—servicing in the consolidated statements of operations and comprehensive loss. Servicing rights are measured at fair value at each subsequent reporting date and changes in fair value are reported in earnings in the period in which they occur. Subsequent measurement changes for all servicing rights, including servicing fee payments and fair value changes, are included within noninterest income—servicing in the consolidated statements of operations and comprehensive loss. We elected the fair value option to measure our servicing rights to better align with the valuation of our transferred loans, which also tend to share a similar risk profile to the personal loan servicing we assume from third parties when we are not the loan originator. The loans are also impacted by similar factors, such as conditional prepayment rates and default rates. We consider the risk of the assets and the observability of inputs in determining the classes of servicing rights. We have three classes of servicing assets: personal loans, student loans and home loans.
See Note 15. Fair Value Measurements for the key inputs used in the fair value measurements of our classes of servicing rights.
SoFi Technologies, Inc.
SoFi Technologies, Inc.
Notes to Consolidated Financial Statements (continued)
(In Thousands, Unless Otherwise Stated and Except for Share and Per Share Data)
Investments in Debt Securities
The accounting and measurement framework for our investments in debt securities is determined based on the security classification. We do not hold investments in debt securities for trading purposes, nor do we have investments in debt securities that we have the intent and ability to hold to maturity. Therefore, we classify our investments in debt securities as available-for-sale.
We record investments in AFS debt securities at fair value in our consolidated balance sheets, with unrealized gains and losses recorded, net of tax, as a component of AOCI. See Note 15. Fair Value Measurements for additional information on our fair value estimates for investments in AFS debt securities. The amortized cost basis of our investments in AFS debt securities reflects the security’s acquisition cost, adjusted for amortization of premium or accretion of discount, and collection of cash and charge-offs, as applicable. For purposes of determining gross realized gains and losses on AFS debt securities, the cost of securities sold is based on specific identification. We elected to present accrued interest for AFS debt securities within investment securities in the consolidated balance sheets. Purchase discounts, premiums, and other basis adjustments for investments in AFS debt securities are generally amortized into interest income over the contractual life of the security using the effective interest method. However, premiums on certain callable debt securities are amortized to the earliest call date. Amortization of premiums and discounts and other basis adjustments for investments in AFS debt securities, as well as interest income earned on the investments, are recognized within interest income—other, and realized gains and losses on investments in AFS debt securities are recognized within noninterest income—other in the consolidated statements of operations and comprehensive loss.
An investment in AFS debt security is considered impaired if its fair value is less than its amortized cost. If we determine that we have the intent to sell the impaired investment in AFS debt security, or if it is more likely than not that we will be required to sell the impaired investment in AFS debt security before recovery of its amortized cost, we recognize the full impairment loss reflecting the difference between the amortized cost (net of any prior recognized allowance) and the fair value of the investment in AFS debt security within noninterest income—other in the consolidated statements of operations and comprehensive loss. If neither of the above conditions exists, we evaluate whether the impairment loss is attributable to credit-related or non-credit-related factors. Any impairment that is not credit-related is recognized within other comprehensive income (loss), net of taxes. See the section “Allowance for Credit Losses” in this Note for the factors we consider in identifying credit-related impairment and the treatment of credit losses.
See Note 6. Investment Securities for additional information on our investments in AFS debt securities.
Securitization Investments
In Company-sponsored securitization transactions that meet the applicable criteria to be accounted for as a sale, we retain certain residual interests and asset-backed bonds. We measure these investments at fair value on a recurring basis and report them within investment securities in the consolidated balance sheets. Gains and losses related to our securitization investments are reported within noninterest income—loan origination, sales, and securitizations in the consolidated statements of operations and comprehensive loss. We determine the fair value of our securitization investments using a discounted cash flow methodology, while also considering market data as it becomes available.
Our residual investments accrete interest income over the expected life using the effective yield method, which reflects a portion of the overall fair value adjustment recorded each period on our residual investments. On a quarterly basis, we reevaluate the cash flow estimates over the life of the residual investments to determine if a change to the accretable yield is required on a prospective basis. Additionally, we record interest income associated with asset-backed bonds over the term of the underlying bond using the effective interest method on unpaid bond amounts. Interest income on residual investments and asset-backed bonds is presented within interest income—loans and securitizations in the consolidated statements of operations and comprehensive loss.
See Note 15. Fair Value Measurements for the key inputs used in the fair value measurements of our residual investments and asset-backed bonds.
Investments in Equity Securities
Our investments in equity securities consist of investments for which fair values are not readily determinable, which we elect to measure using the alternative method of accounting, under which they are measured at cost less any impairment and
SoFi Technologies, Inc.
SoFi Technologies, Inc.
Notes to Consolidated Financial Statements (continued)
(In Thousands, Unless Otherwise Stated and Except for Share and Per Share Data)
adjusted for changes resulting from observable price changes in orderly transactions for identical or similar investments of the same issuers. Our investments in equity securities are presented within other assets in the consolidated balance sheets. Adjustments to the carrying values of our investments in equity securities, such as impairments and unrealized gains, are recognized within noninterest income—other in the consolidated statements of operations and comprehensive loss.
Property, Equipment and Software
All property, equipment and software are initially recorded at cost, while repairs and maintenance costs are expensed as incurred. Computer hardware, furniture and fixtures, software, buildings and finance lease ROU assets are depreciated or amortized on a straight-line basis over the estimated useful life of each class of depreciable or amortizable assets (ranging from one to 30 years). Leasehold improvements are amortized over the shorter of the respective lease term or the estimated lives of the leasehold improvements.
Software includes both purchased and internally-developed software. Internally-developed software is capitalized when preliminary project efforts are successfully completed, and it is probable that both the project will be completed and the software will be used as intended. Capitalized costs consist of salaries and compensation costs (inclusive of share-based compensation) for employees, fees paid to third-party consultants who are directly involved in development efforts and costs incurred for upgrades and functionality enhancements, and are amortized over a useful life ranging from 2.5 to 3 years. Other costs are expensed as incurred.
See Note 9. Property, Equipment, Software and Leases for additional information on our property, equipment and software.
Goodwill and Intangible Assets
Goodwill represents the fair value of an acquired business in excess of the fair value of the identified net assets acquired. Goodwill is tested for impairment at the reporting unit level annually or whenever indicators of impairment exist. Impairment of goodwill is the condition that exists when the carrying amount of a reporting unit that includes goodwill exceeds its fair value. We may assess goodwill for impairment initially using a qualitative approach, referred to as “step zero”, to determine whether conditions exist to indicate that it is more likely than not that the fair value of a reporting unit is less than its carrying amount. If management concludes, based on its assessment of relevant events, facts and circumstances, that it is more likely than not that a reporting unit’s carrying value is greater than its fair value, then a quantitative analysis will be performed to determine if there is any impairment. We may alternatively elect to initially perform a quantitative assessment and bypass the qualitative assessment.
A goodwill impairment loss is recognized for the amount that the carrying amount of a reporting unit, including goodwill, exceeds its fair value, limited to the total amount of goodwill allocated to that reporting unit. Therefore, if the fair value of a reporting unit exceeds its carrying amount, goodwill of the reporting unit is not impaired. Our reporting units for our goodwill impairment analysis represent components of our business at one level below our operating segments. Our annual impairment testing date is October 1.
Definite-lived intangible assets are amortized on a straight-line basis over their useful lives and reviewed for impairment annually and whenever events or circumstances indicate that the carrying amount of such assets may not be recoverable. Intangible assets include capitalized costs incurred in the development and enhancement of our software products to be sold, leased or marketed. These costs, consisting primarily of salaries and compensation costs (inclusive of share-based compensation) for employees, are expensed as incurred until technological feasibility has been established, after which the costs are capitalized until the product is available for general release to customers.
See Note 2. Business Combinations and Note 8. Goodwill and Intangible Assets for further discussion of goodwill and intangible assets, including those recognized in connection with recent business combinations.
Leases
We determine if an arrangement is or contains a lease at inception of the contract. A contract is or contains a lease if the contract conveys the right to control the use of identified property or equipment for a period of time in exchange for consideration. For our current office and non-office classes of operating leases, we elected the practical expedient to not separate non-lease components from lease components and to, instead, account for each separate lease component and the non-
SoFi Technologies, Inc.
SoFi Technologies, Inc.
Notes to Consolidated Financial Statements (continued)
(In Thousands, Unless Otherwise Stated and Except for Share and Per Share Data)
lease components associated with that lease component as a single lease component. For our current classes of finance leases, we did not elect to apply this practical expedient and, instead, separately identify and measure the non-lease components of the contracts. As an accounting policy election, we apply the short-term lease exemption practical expedient to any lease that, at the commencement date, has a lease term of 12 months or less and does not include an option to purchase the underlying asset that we are reasonably certain to exercise.
Operating leases are presented within operating lease right-of-use assets and operating lease liabilities in the consolidated balance sheets. Finance lease ROU assets are presented within property, equipment and software and finance lease liabilities are presented within accounts payable, accruals and other liabilities in the consolidated balance sheets. Operating and finance lease ROU assets represent our right to use an underlying asset for the lease term and operating and finance lease liabilities represent our obligation to make lease payments arising from the lease. ROU assets and lease liabilities are recognized at the commencement date based on the present value of lease payments over the lease term. As our leases do not provide an implicit borrowing rate, we use our incremental borrowing rate based on the information available at commencement date or modification date, as appropriate, in determining the present value of lease payments.
The operating lease ROU assets are increased by any prepaid lease payments and are reduced by any unamortized lease incentives. Our lease terms may include options to extend or terminate the lease when it is reasonably certain that we will exercise that option. Base rent is typically subject to rent escalations on each annual anniversary from the lease commencement dates. Lease expense for lease payments, including any step rent provisions specified in the lease agreements, is recognized on a straight-line basis over the lease term and is allocated among the components of noninterest expense in the consolidated statements of operations and comprehensive loss. The finance lease ROU assets are depreciated on a straight-line basis over the estimated useful life of seven years. Interest expense on finance leases is recognized for the difference between the present value of the lease liabilities and the scheduled lease payments within interest expense—other in the consolidated statements of operations and comprehensive loss.
When a lease agreement is modified, we determine if the modification grants us the right to use an additional asset that is not included in the original lease contract and if the lease payments increase commensurate with the standalone price for the additional ROU asset. If both conditions are met, we account for the agreement as two separate contracts: (i) the original, unmodified contract and (ii) a separate contract for the additional ROU asset. If both conditions are not met, the modification is not evaluated as a separate contract. Instead, based on the nature of the modification, we: (i) reassess the lease classification on the modification date under the modified terms, and (ii) use the modified lease payments and discount rate to remeasure the lease liability and recognize any difference between the new lease liability and the old lease liability as an adjustment to the ROU asset.
See Note 9. Property, Equipment, Software and Leases for additional information on our leases.
Derivative Financial Instruments
We enter into derivative contracts to manage future loan sale execution risk. We did not elect hedge accounting, as management’s hedging intentions are to economically hedge the risk of unfavorable changes in the fair values of our personal loans, student loans and home loans. Our derivative instruments used to manage future loan sale execution risk include interest rate swaps, interest rate caps and home loan pipeline hedges. We also have IRLCs, interest rate swaps and interest rate caps that were not related to future loan sale execution risk.
Changes in derivative instrument fair values are recognized in earnings as they occur. Depending on the measurement date position, derivative financial instruments are presented within other assets or accounts payable, accruals and other liabilities in the consolidated balance sheets. Our derivative instruments are reported within cash flows from operating activities in the consolidated statements of cash flows.
Certain derivative instruments are subject to enforceable master netting arrangements. Accordingly, we present our net asset or liability position by counterparty in the consolidated balance sheets. Additionally, since our cash collateral balances do not approximate the fair value of the derivative position, we do not offset our right to reclaim cash collateral or obligation to return cash collateral against recognized derivative assets or liabilities.
See Note 14. Derivative Financial Instruments and Note 15. Fair Value Measurements for additional information on our derivative assets and liabilities.
SoFi Technologies, Inc.
SoFi Technologies, Inc.
Notes to Consolidated Financial Statements (continued)
(In Thousands, Unless Otherwise Stated and Except for Share and Per Share Data)
Residual Interests Classified as Debt
Within consolidated securitizations, the residual interests held by third parties are presented as residual interests classified as debt in the consolidated balance sheets. We measure residual interests classified as debt at fair value on a recurring basis. We record subsequent measurement changes in fair value in the period in which the change occurs within noninterest income—loan origination, sales, and securitizations in the consolidated statements of operations and comprehensive loss. We determine the fair value of residual interests classified as debt using a discounted cash flow methodology, while also considering market data as it becomes available.
We recognize interest expense related to residual interests classified as debt over the expected life using the effective yield method, which reflects a portion of the overall fair value adjustment recorded each period on our residual interests classified as debt. Interest expense related to residual interests classified as debt is presented within interest expense—securitizations and warehouses in the consolidated statements of operations and comprehensive loss. On a quarterly basis, we reevaluate the cash flow estimates to determine if a change to the accretable yield is required on a prospective basis.
See Note 15. Fair Value Measurements for the key inputs used in the fair value measurements of residual interests classified as debt.
Safeguarding Asset and Liability
Through our SoFi Invest product (via our wholly-owned subsidiary, SoFi Digital Assets, LLC, a licensed money transmitter), our members were able to invest in digital assets. In the fourth quarter of 2023, we transferred the crypto services provided by SoFi Digital Assets, LLC, and began closing existing digital assets accounts. This process was completed in the first quarter of 2024. Certain accounts were eligible for transfer to a third party digital asset service provider who assumed responsibility for the transferred accounts on a go-forward basis, including the arrangement of custodial services for the transferred digital assets. We have no further ongoing responsibilities for the transferred digital assets subsequent to the executed transfer which took place in December 2023, and derecognized the corresponding digital assets safeguarding liability and safeguarding asset as of the date of the transfer.
For those digital assets that were not eligible to be transferred, we engage third parties to provide custodial services for our digital assets offering, which include holding the cryptographic key information and working to protect the digital assets from loss or theft. The third-party custodians hold digital assets as custodial assets in an account in SoFi’s name for the benefit of our members. We maintain the internal recordkeeping of our members’ digital assets, including the amount and type of digital assets owned by each of our members in the custodial accounts. As of December 31, 2023, we utilized one third-party custodian.
In accordance with Staff Accounting Bulletin No. 121 (“SAB 121”), we recognize a digital assets safeguarding liability within accounts payable, accruals and other liabilities in the consolidated balance sheets reflecting our obligation to safeguard the digital assets held by third-party custodians for the benefit of our members. We also recognize a corresponding safeguarding asset within other assets in the consolidated balance sheets. The safeguarding liability and corresponding safeguarding asset are measured and recorded at the fair value of the digital assets held by the custodians at each reporting date. Subsequent changes to the fair value measurement are reflected as equal and offsetting adjustments to the carrying values of the safeguarding liability and corresponding safeguarding asset. We evaluate any potential loss events, such as theft, loss or destruction of the cryptographic keys, that may affect the measurement of the safeguarding asset, which would be reflected in our results of operations in the period the loss occurs. Measurement changes do not impact the consolidated statements of operations and comprehensive loss unless such a loss event is identified. As of both December 31, 2023 and 2022, we did not identify any loss events.
See Note 15. Fair Value Measurements for additional information on the fair value measurement of the safeguarding liability and corresponding safeguarding asset.
Borrowings and Financing Costs
We borrow from various financial institutions to finance our lending activities. Direct costs incurred in connection with financing, such as banker fees, origination fees and legal fees, are classified as deferred debt issuance costs. We capitalize these costs and report the amounts as a direct deduction from the carrying amount of the debt balance. Any difference between the stated principal amount of debt and the amount of cash proceeds received, net of debt issuance costs, is presented as a
SoFi Technologies, Inc.
SoFi Technologies, Inc.
Notes to Consolidated Financial Statements (continued)
(In Thousands, Unless Otherwise Stated and Except for Share and Per Share Data)
discount or premium. The capitalized debt issuance costs and the original issue discount/premium are amortized into interest expense over the expected life of the related financing agreements using the straight-line method for revolving facilities and the effective interest method for securitization debt and our senior convertible notes, as defined and further discussed below. Remaining unamortized fees are expensed immediately upon early extinguishment of the debt. In a debt modification for revolving debt, the initial issuance costs and any additional fees incurred as a result of the modification are deferred over the term of the new agreement, if the borrowing capacity of the revolving facility is increased. In the case that a modification results in a decrease in our borrowing capacity, any fees paid to the creditor and any third-party costs incurred are considered to be associated with the new arrangement and are, therefore, deferred and amortized over the term of the new arrangement. Unamortized deferred costs relating to the old arrangement at the time of the modification are expensed immediately in proportion to the decrease in borrowing capacity of the old arrangement. Any remaining unamortized deferred costs relating to the old arrangement are deferred and amortized over the term of the new arrangement.
We elected the fair value option to measure certain securitization debt, with the intent to mitigate the accounting divergence between debt liabilities measured at historical cost and the corresponding loans securing these financings, which are risk-managed on a fair value basis. For securitization debt carried at fair value on a recurring basis, we record the initial fair value measurement and subsequent measurement changes in fair value in the period in which the changes occur within noninterest income—loan origination, sales, and securitizations in the consolidated statements of operations and comprehensive loss. We determined the fair value of the applicable securitization debt using a discounted cash flow methodology, while also considering market data as it becomes available. The key inputs to the calculation include the underlying contractual coupons, terms, discount rate and expectations for defaults and prepayments.
Convertible Senior Notes
In October 2021, we issued $1.2 billion aggregate principal amount of convertible senior notes due 2026 (the “convertible notes”). The convertible notes will mature on October 15, 2026, unless earlier repurchased, redeemed or converted. We will settle conversions by paying or delivering, at our election, cash, shares of our common stock or a combination of cash and shares of our common stock, based on the applicable conversion rate(s). The convertible notes will also be redeemable, in whole or in part, at our option at any time, and from time to time, on or after October 15, 2024 through the 30th scheduled trading day immediately before the maturity date, at a cash redemption price equal to the principal amount of the convertible notes to be redeemed, plus accrued interest, if any, thereon to, but excluding, the redemption date, but only if certain liquidity conditions described in the indenture are satisfied and certain conditions are met with respect to the last reported sale price per share of our common stock prior to conversion. In December 2023, we entered into repurchase agreements to repurchase $88.0 million aggregate principal amount of the convertible notes. See Note 12. Debt for more detailed disclosure of the term and features of the convertible notes.
We elected to evaluate each embedded feature of the arrangement individually. We concluded that each of the conversion rights, optional redemption rights, fundamental change make-whole provision and repurchase rights did not require bifurcation as derivative instruments, which we reevaluate each reporting period. The additional interest and special interest that accrue on the notes in the event of our failure to comply with certain registration or reporting requirements are required to be bifurcated from the host contract, as the reporting requirement triggering event is not clearly and closely related to the host convertible debt contract, and therefore we measure the contingent interest feature at fair value each reporting period. The value was determined to be immaterial; therefore, we accounted for the convertible notes wholly as debt, which was recognized on the settlement date. Accordingly, we allocated all debt issuance costs to the debt instrument on the basis of materiality.
In connection with the pricing of the convertible notes, we entered into privately negotiated capped call transactions with certain financial institutions, as defined and further discussed below.
Redeemable Preferred Stock
Series 1 Redeemable Preferred Stock (as defined in Note 13. Equity) is classified in temporary equity, as it is not fully controlled by SoFi. See Note 13. Equity for additional information.
Foreign Currency Translation Adjustments
We revalue assets, liabilities, income and expense denominated in non-United States currencies into United States dollars using applicable exchange rates. For foreign subsidiaries in which the functional currency is the subsidiary’s local
SoFi Technologies, Inc.
SoFi Technologies, Inc.
Notes to Consolidated Financial Statements (continued)
(In Thousands, Unless Otherwise Stated and Except for Share and Per Share Data)
currency, gains and losses relating to foreign currency translation adjustments are included in accumulated other comprehensive income (loss) in our consolidated balance sheets. For foreign subsidiaries in which the functional currency is the United States Dollar, gains and losses relating to foreign currency transaction adjustments are included within earnings in the consolidated statements of operations and comprehensive loss. Due to the highly inflationary economic environment in Argentina, we use the United States Dollar as the functional currency of our Argentinian operations. Our activities in Argentina are related to our Technology Platform segment and commenced in the first quarter of 2022 with the Technisys Merger.
Capped Call Transactions
We entered into privately negotiated capped call transactions (the “Capped Call Transactions”) with certain financial institutions (the “Capped Call Counterparties”). The Capped Call Transactions initially cover, subject to customary anti-dilution adjustments, the number of shares of our common stock that initially underlie the convertible notes. The Capped Call Transactions are net purchased call options on our own common stock. The Capped Call Transactions are separate transactions entered into by the Company with each of the Capped Call Counterparties, are not part of the terms of the convertible notes, and do not affect any holder’s rights under the convertible notes. Holders of the convertible notes do not have any rights with respect to the Capped Call Transactions. As the Capped Call Transactions are legally detachable and separately exercisable from the convertible notes, they were evaluated as freestanding instruments. We concluded that the Capped Call Transactions meet the scope exceptions for derivative instruments, and as such, the Capped Call Transactions meet the criteria for classification in equity and are included as a reduction to additional paid-in capital.
See Note 13. Equity for additional information on the Capped Call Transactions.
Interest Income
We record interest income associated with loans measured at fair value over the term of the underlying loans using the effective interest method on unpaid loan principal amounts, which is presented within interest income—loans and securitizations in the consolidated statements of operations and comprehensive loss. We also record accrued interest income associated with loans measured at amortized cost within interest income—loans and securitizations. We stop accruing interest and reverse all accrued but unpaid interest at the time a loan charges off. Loans are returned to accrual status if the loans are brought to nondelinquent status or have performed in accordance with the contractual terms for a reasonable period of time and, in management’s judgment, will continue to make scheduled periodic principal and interest payments.
Other interest income is primarily earned on our bank balances.
Loan Origination and Sales Activities
As part of our loan sale agreements, we may retain the rights to service sold loans. We calculate a gain or loss on the sale based on the sum of the proceeds from the sale and any servicing asset or liability recognized, less the carrying value of the loans sold. Our gain or loss calculation is also inclusive of repurchase liabilities recognized at the time of sale, and is recorded within noninterest income—loan origination, sales, and securitizations in the consolidated statements of operations and comprehensive loss.
Loan Commitments
We offer a program whereby applicants can lock in an interest rate on an in-school loan to be funded at a later time. Applicants can exit the loan origination process up until the loan funding date. SoFi is obligated to fund the loan at the committed terms on the disbursement date if the borrower does not cancel prior to the loan funding date. The student loan commitments meet the scope exception for issuers of commitments to originate non-mortgage loans. As the writer of the commitments, we elected the fair value option to measure our unfunded student loan commitments to align with the measurement methodology of our originated student loans. As such, our student loan commitments are carried at fair value on a recurring basis. Depending on the measurement date position, student loan commitments are presented within other assets or accounts payable, accruals and other liabilities in the consolidated balance sheets. We record the initial fair value measurement and subsequent measurement changes in fair value in the period in which the changes occur within noninterest income—loan origination, sales, and securitizations in the consolidated statements of operations and comprehensive loss.
Loan commitments also include IRLCs, whereby we commit to interest rate terms prior to completing the origination process for home loans. IRLCs are derivative instruments that are measured at fair value on a recurring basis. Changes in fair
SoFi Technologies, Inc.
SoFi Technologies, Inc.
Notes to Consolidated Financial Statements (continued)
(In Thousands, Unless Otherwise Stated and Except for Share and Per Share Data)
value are recognized within noninterest income—loan origination, sales, and securitizations in the consolidated statements of operations and comprehensive loss. See “Derivative Financial Instruments” in this Note for additional information on our derivative instruments.
See Note 15. Fair Value Measurements for the key inputs used in the fair value measurements of our loan commitments.
Revenue Recognition
In each of our revenue arrangements, revenue is recognized when control of the promised goods or services is transferred to the customer in an amount that reflects our expected consideration in exchange for those goods or services. Our primary revenue streams for the periods presented include the following:
•Technology Products and Solutions: We earn fees for providing an integrated platform as a service for financial and non-financial institutions.
•Referrals: We earn specified referral fees in connection with referral activities we facilitate through our platform, such as referrals to third-party partners that offer services to end users who do not use one of our product offerings and referrals of pre-qualified borrowers to a third-party partner who separately contracts with a loan originator.
•Interchange: We earn interchange fees from debit and credit cardholder transactions conducted through payment networks.
•Brokerage: We earn fees in connection with facilitating investment-related transactions through our platform, such as brokerage transactions, share lending and exchange conversion.
See Note 3. Revenue for additional information on our revenue recognition policy within each revenue stream.
Advertising, Sales and Marketing
Advertising production costs and advertising communication costs, as well as amounts paid to various affiliates to market our products, are included within noninterest expense—sales and marketing in the consolidated statements of operations and comprehensive loss. Advertising costs are expensed either as incurred or when the advertising takes place, depending on the nature of the advertising activity. For the years ended December 31, 2023, 2022 and 2021, advertising totaled $284,176, $256,125 and $183,106, respectively.
Expenses incurred by us related to member acquisition, including brand development, business development and direct member marketing expenses, are also presented within noninterest expense—sales and marketing in the consolidated statements of operations and comprehensive loss.
Technology and Product Development
Expenses incurred by us related to technology, product design and implementation, which includes compensation and benefits, are classified as noninterest expense—technology and product development in the consolidated statements of operations and comprehensive loss.
Loss Contingencies
Loss contingencies, including claims and legal actions arising in the ordinary course of business, are recorded in accounts payable, accruals and other liabilities in the consolidated balance sheets. Such liabilities and associated expenses are recorded when the likelihood of loss is probable and an amount or range of loss can be reasonably estimated. Such estimates are based on the best information available at the time. As additional information becomes available, we reassess the potential liability and record an estimate in the period in which the adjustment is probable and an amount or range can be reasonably estimated. Due to the inherent uncertainties of loss contingencies, estimates may be different from the actual outcomes. With respect to legal proceedings, we recognize legal fees as they are incurred within noninterest expense—general and administrative in the consolidated statements of operations and comprehensive loss. See Note 18. Commitments, Guarantees, Concentrations and Contingencies for discussion of contingent matters.
SoFi Technologies, Inc.
SoFi Technologies, Inc.
Notes to Consolidated Financial Statements (continued)
(In Thousands, Unless Otherwise Stated and Except for Share and Per Share Data)
Restructuring
During the year ended December 31, 2023, we recognized restructuring charges of $12,749 within the following categories of expenses within noninterest expense: (i) technology and product development, (ii) sales and marketing, (iii) cost of operations, and (iv) general and administrative in the consolidated statements of operations and comprehensive loss associated with a reduction in headcount in the Technology Platform segment in the first quarter of 2023, as well as expenses in the fourth quarter of 2023 related to a reduction in headcount across the Financial Services, Lending and corporate functions, which primarily included employee-related wages, benefits and severance.
Compensation and Benefits
Total compensation and benefits, inclusive of share-based compensation expense, was $894,720, $830,298 and $608,505 for the years ended December 31, 2023, 2022 and 2021, respectively. Compensation and benefits expenses are presented within the following categories of expenses within noninterest expense: (i) technology and product development, (ii) sales and marketing, (iii) cost of operations, and (iv) general and administrative in the consolidated statements of operations and comprehensive loss.
Share-Based Compensation
Share-based compensation made to employees and non-employees, including stock options, RSUs and PSUs, is measured based on the grant date fair value of the awards and is recognized as compensation expense typically on a straight-line basis over the period during which the share-based award holder is required to perform services in exchange for the award (the vesting period) for stock options and RSUs and on an accelerated attribution basis for each vesting tranche over the respective derived service period for PSUs. Share-based compensation expense is allocated among the following categories of expenses within noninterest expense: (i) technology and product development, (ii) sales and marketing, (iii) cost of operations, and (iv) general and administrative in the consolidated statements of operations and comprehensive loss. We used the Black-Scholes Option Pricing Model (the “Black-Scholes Model”) to estimate the grant-date fair value of stock options. RSUs are measured based on the fair values of the underlying stock on the dates of grant. We use a Monte Carlo simulation model to estimate the grant-date fair value of PSUs. We recognize forfeitures as incurred and, therefore, reverse previously recognized share-based compensation expense at the time of forfeiture. See Note 16. Share-Based Compensation for further discussion of share-based compensation.
Income Taxes
We recognize deferred tax assets and liabilities for the expected future tax consequences of temporary differences between the financial reporting and tax basis of assets and liabilities, as well as for operating loss and tax credit carryforwards. Deferred tax assets and liabilities are measured using the tax rates that are expected to apply to taxable income for the years in which those tax assets and liabilities are expected to be realized or settled. In assessing the realizability of deferred tax assets, management reviews all available positive and negative evidence. Valuation allowances are recorded to reduce deferred tax assets to the amount we believe is more likely than not to be realized.
The tax effects from an uncertain tax position can be recognized in the financial statements only if the tax position would more likely than not be upheld on examination by the taxing authorities based on the merits of the tax position. Management is required to analyze all open tax years, as defined by the statute of limitations, for all jurisdictions. We accrue tax penalties and interest, if any, as incurred and recognize them within income tax (expense) benefit in the consolidated statements of operations and comprehensive loss.
Related Parties
We define related parties as members of our Board of Directors, entity affiliates, executive officers and principal owners of our outstanding stock and members of their immediate families. Related parties also include any other person or entity with significant influence over our management or operations.
SoFi Technologies, Inc.
SoFi Technologies, Inc.
Notes to Consolidated Financial Statements (continued)
(In Thousands, Unless Otherwise Stated and Except for Share and Per Share Data)
Recently Adopted Accounting Standards
Troubled Debt Restructurings and Vintage Disclosures
In March 2022, the FASB issued ASU 2022-02, Financial Instruments — Credit Losses (Topic 326): Troubled Debt Restructurings and Vintage Disclosures. The ASU addresses two topics: (i) TDR by creditors, and (ii) vintage disclosures for gross write offs. Under the TDR provisions, the ASU eliminates the recognition and measurement guidance under ASC 310-40, Receivables — Troubled Debt Restructurings by Creditors, and instead requires that an entity evaluate whether the modification represents a new loan or a continuation of an existing loan, consistent with the accounting for other loan modifications. Additionally, the ASU enhances existing disclosure requirements around TDRs and introduces new requirements related to certain modifications of receivables made to borrowers experiencing financial difficulty. Under the vintage disclosure provisions, the ASU requires the entity to disclose current period gross write offs by year of origination for financing receivables and net investments in leases within the scope of ASC 326-20, Financial Instruments — Credit Losses — Measured at Amortized Cost. The standard should be applied prospectively; however, for the TDR provisions, an entity has the option to apply a modified retrospective transition method. We adopted the standard effective January 1, 2023. The adoption of this standard did not have a material impact on our consolidated financial statements.
Recent Accounting Standards Issued, But Not Yet Adopted
Improvements to Reportable Segment Disclosures
In November 2023, the FASB issued ASU 2023-07, Segment Reporting (Topic 280) — Improvements to Reportable Segment Disclosures. The ASU improves reportable segment disclosure requirements, primarily through enhanced disclosures about significant segment expenses. The standard is effective for fiscal years beginning after December 15, 2023, and interim periods within fiscal years beginning after December 15, 2024. The standard should be applied retrospectively to all prior periods presented in the financial statements. We are currently evaluating the impact of this amendment on our consolidated financial statements.
Improvements to Income Tax Disclosures
In December 2023, the FASB issued ASU 2023-09, Income Taxes (Topic 740) — Improvements to Income Tax Disclosures. The ASU improves income tax disclosures primarily related to enhancements of the rate reconciliation and income taxes paid information. The standard is effective for annual periods beginning after December 15, 2024. The standard should be applied on a prospective basis with the option to apply the standard retrospectively. We are currently evaluating the impact of this amendment on our consolidated financial statements.
Note 2. Business Combinations
Merger with Social Capital Hedosophia Holdings Corp. V
On January 7, 2021, Social Finance entered into an agreement by and among Social Finance, SCH, a Cayman Islands exempted company limited by shares, and Plutus Merger Sub Inc., a Delaware corporation and a wholly owned subsidiary of SCH (“Merger Sub”), pursuant to which Merger Sub merged with and into Social Finance. Upon the Closing on May 28, 2021, the separate corporate existence of Merger Sub ceased and Social Finance survived the merger and became a wholly-owned subsidiary of SCH. On May 28, 2021, SCH also filed a notice of deregistration with the Cayman Islands Registrar of Companies, together with the necessary accompanying documents, and filed a certificate of incorporation and a certificate of corporate domestication with the Secretary of State of the State of Delaware, under which SCH was domesticated as a Delaware corporation, changing its name from “Social Capital Hedosophia Holdings Corp. V” to “SoFi Technologies, Inc.” These transactions are collectively referred to as the “Business Combination”.
The Business Combination was accounted for as a reverse recapitalization whereby SCH was determined to be the accounting acquiree and Social Finance to be the accounting acquirer. This accounting treatment was the equivalent of Social Finance issuing stock for the net assets of SCH, accompanied by a recapitalization whereby no goodwill or other intangible assets were recorded. Operations prior to the Business Combination are those of Social Finance. At the Closing, we received gross cash consideration of $764.8 million as a result of the reverse recapitalization, which was then reduced by: (i) a redemption of redeemable common stock (classified as temporary equity) of $150.0 million, (ii) a special payment made to our
SoFi Technologies, Inc.
SoFi Technologies, Inc.
Notes to Consolidated Financial Statements (continued)
(In Thousands, Unless Otherwise Stated and Except for Share and Per Share Data)
Series 1 preferred stockholders of $21.2 million (which was expensed as incurred), and (iii) our equity issuance costs of $27.5 million, consisting of advisory, legal, share registration and other professional fees, which were recorded within additional paid-in capital as a reduction of proceeds.
In connection with the Business Combination, SCH entered into subscription agreements with certain investors (the “Third Party PIPE Investors”), whereby it issued 122,500,000 shares of common stock at $10.00 per share (“PIPE Shares”) for an aggregate purchase price of $1.225 billion (“PIPE Investment”), which closed simultaneously with the consummation of the Business Combination. Upon the Closing, the PIPE Shares were automatically converted into shares of SoFi Technologies common stock on a one-for-one basis.
Upon the Closing, holders of Social Finance common stock received shares of SoFi Technologies common stock in an amount determined by application of the exchange ratio of 1.7428 (“Exchange Ratio”), which was based on Social Finance’s implied price per share prior to the Business Combination. Additionally, holders of Social Finance preferred stock (with the exception of the Series 1 preferred stockholders) received shares of SoFi Technologies common stock in amounts determined by application of either the Exchange Ratio or a multiplier of the Exchange Ratio, as provided by the Agreement.
Acquisition of Golden Pacific Bancorp, Inc.
On February 2, 2022, we acquired Golden Pacific, pursuant to an Agreement and Plan of Merger dated as of March 8, 2021 by and among the Company, a wholly-owned subsidiary of the Company, and Golden Pacific. In the business combination, we acquired all of the outstanding equity interests in Golden Pacific for total cash purchase consideration of $22.3 million (the “Bank Merger”). The acquisition was not determined to be a significant acquisition. After closing the Bank Merger, we became a bank holding company and Golden Pacific began operating as SoFi Bank. We are duly registered as a bank holding company with the Federal Reserve. SoFi Bank is a national banking association whose primary federal regulator is the OCC. Deposit accounts of SoFi Bank are insured by the FDIC through the Deposit Insurance Fund to the fullest extent permitted by law.
The closing of the Bank Merger was subject to regulatory approval. On January 18, 2022, we received approval from the Federal Reserve of our application to become a bank holding company under the Bank Holding Company Act, and we received conditional approval from the OCC to close the Bank Merger. The OCC also approved our application to change the composition of Golden Pacific’s assets in connection with the Bank Merger. The OCC conditional approval imposed a number of conditions, including that SoFi Bank have initial paid-in capital of no less than $750 million and adhere to an operating agreement. Golden Pacific’s community bank business continues to operate as a division of SoFi Bank.
A portion of the total cash purchase consideration ($0.6 million) was held back by the Company to satisfy any indemnification or certain other obligations (“Holdback Amount”), as certain legal proceedings with which Golden Pacific is involved as a plaintiff were not resolved at the time the Bank Merger closed. During 2022, we incurred costs associated with the litigation involving Golden Pacific as a plaintiff in excess of the Holdback Amount. Therefore, none of the Holdback Amount will be released to the Golden Pacific shareholders. Additionally, we held back a $3.3 million payable to a dissenting Golden Pacific shareholder pending resolution of the shareholder’s dissenter’s rights appraisal claim. During the fourth quarter of 2023, the appraisal claim was settled and payment was released.
Acquisition of Technisys S.A.
On March 3, 2022, we acquired Technisys S.A., a Luxembourg société anonyme, (“Technisys”), pursuant to an Agreement and Plan of Merger dated as of February 19, 2022 and amended as of March 3, 2022, by and among the Company, Technisys, Atom New Delaware, Inc., a Delaware corporation and a wholly owned subsidiary of Atom, and Atom Merger Sub Corporation, a Delaware corporation and wholly owned subsidiary of SoFi Technologies (the “Technisys Merger”). In the business combination, we acquired all of the outstanding equity interests in Technisys for a preliminary purchase consideration of $915.4 million. During the third quarter of 2022, we finalized the closing net working capital calculation specified in the merger agreement, which resulted in a reduction to the equity consideration of 155,794 shares, representing an adjustment to the total purchase consideration of $1,665, and a corresponding reduction to the carrying value of recognized goodwill. The remaining 442,274 shares that were held in escrow associated with the working capital calculation were released to the former Technisys shareholders. The finalized closing net working capital calculation did not impact the estimated fair values of the assets acquired and liabilities assumed in conjunction with the transaction.
SoFi Technologies, Inc.
SoFi Technologies, Inc.
Notes to Consolidated Financial Statements (continued)
(In Thousands, Unless Otherwise Stated and Except for Share and Per Share Data)
The following table presents the components of the total purchase consideration to acquire Technisys as of December 31, 2022:
| | | | | |
Fair value of common stock issued(1) | $ | 873,377 | |
| Amounts payable to settle vested employee performance awards | 37,297 | |
Fair value of awards assumed(2) | 2,855 | |
| Settlement of pre-combination transactions between acquirer and acquiree | 235 | |
| Total purchase consideration | $ | 913,764 | |
___________________
(1) Reflects the shares of SoFi common stock issued in the acquisition of 81,700,318, multiplied by the closing stock price of SoFi common stock on the closing date of the Technisys Merger. Additionally, these shares are inclusive of 6,305,595 shares that were held in escrow.
(2) We contemporaneously converted outstanding performance awards into RSUs to acquire common stock of SoFi (“Replacement Awards”). The fair value of awards assumed in the purchase consideration was based on the closing stock price of SoFi common stock on the closing date of the Technisys Merger.
We settled vested employee performance awards, which were a component of the purchase consideration above, with payments during the years ended December 31, 2023 and 2022 of $19,656 and $17,641, respectively. During the year ended December 31, 2023, we released 6,259,736 escrow shares during the second and fourth quarters of 2023. The remaining 45,859 shares continue to be held in escrow pending resolution of outstanding indemnification claims by SoFi.
The following unaudited supplemental pro forma financial information presents the Company’s consolidated results of operations as if the business combination had occurred on January 1, 2020:
| | | | | | | | | | | | | | | | |
| | Year Ended December 31, |
| | 2022 | | 2021 | | |
| Total net revenue | | $ | 1,584,439 | | | $ | 1,055,219 | | | |
| Net loss | | (311,512) | | | (512,785) | | | |
The unaudited supplemental pro forma financial information is presented for comparative purposes only and is not necessarily indicative of the actual results of operations that would have been achieved, nor is it indicative of future results of operations. The unaudited supplemental pro forma financial information reflects pro forma adjustments that give effect to applying the Company’s accounting policies and certain events the Company believes to be directly attributable to the acquisition. The pro forma adjustments primarily include:
•incremental straight-line amortization expense associated with acquired intangible assets;
•an adjustment to reflect post-combination share-based compensation expense associated with the Replacement Awards as if the conversion had occurred on January 1, 2020;
•an adjustment to reflect acquisition-related costs for both parties as if they were incurred during the earliest period presented; and
•the related income tax effects, at the statutory tax rate applicable for each period, of the pro forma adjustments noted above.
The unaudited supplemental pro forma financial information does not give effect to any anticipated cost savings, operating efficiencies or other synergies that may be associated with the acquisition, or any estimated costs that have been or will be incurred by the Company to integrate the assets and operations of Technisys.
Acquisition of Wyndham Capital Mortgage
On April 3, 2023, we acquired all of the outstanding equity interests in Wyndham for cash consideration. With the acquisition of Wyndham, a fintech mortgage lender, we broadened our suite of home loan products and now manage the technology for a digitized mortgage experience. The acquisition is being accounted for as a business combination. The purchase consideration is being allocated to the tangible and intangible assets acquired and liabilities assumed based on the estimated fair values as of the acquisition date. The excess of the total purchase consideration over the fair value of the net assets acquired is allocated to goodwill, which is expected to be deductible for tax purposes. The fair value estimates are subject to change for up
SoFi Technologies, Inc.
SoFi Technologies, Inc.
Notes to Consolidated Financial Statements (continued)
(In Thousands, Unless Otherwise Stated and Except for Share and Per Share Data)
to one year after the acquisition date as additional information becomes available. The acquisition was not determined to be a significant acquisition.
In each of our revenue arrangements, revenue is recognized when control of the promised goods or services is transferred to the customer in an amount that reflects our expected consideration in exchange for those goods or services.
Technology Products and Solutions
We earn fees for providing an integrated platform as a service for financial and non-financial institutions. Within our technology products and solutions fee arrangements, certain contracts contain a provision for a fixed, upfront implementation fee related to setup activities, which represents an advance payment for future technology platform services provided over the contract term. These implementation fees are recognized ratably over the contract life.
Commencing in March 2022 with the Technisys Merger, we earn subscription and service fees for providing software licenses and associated services, including implementation and maintenance. We charge a recurring subscription fee for the software license and related maintenance services. Other software-related services are billed on a periodic basis as the services are provided. Certain arrangements for software and related services contain a provision for a fixed upfront payment.
We recognize revenue related to software licenses at a point in time upon delivery of the license and the close of the user-acceptance testing period. When implementation services are distinct, we recognize revenue over time during the implementation period. We recognize maintenance services ratably over the contractual maintenance term. If a fixed upfront payment provides a material right to the customer, we recognize revenue associated with the material right over the period of benefit associated with the right to subscribe or renew a subscription, which is typically the product life.
We allocate fees charged for software and related services to our performance obligations on the basis of the relative standalone selling price. The standalone selling prices either represent the prices at which we separately sell each license or service or are estimated using available information, such as market conditions and internal pricing policies. The standalone selling price of the software license and maintenance are determined based on the complexity and size of the license.
Payments to customers: We may provide incentives to our technology platform customers, which may be payable up front or applied to future or past technology products and solutions fees. Evaluating whether such incentives are payments to a customer requires judgment. When we determine that an incentive is consideration payable to a customer, the incentive is recorded as a reduction of revenue. Incentives that represent consideration payable to a customer may also contain variable consideration. Therefore, such incentives are constraints on the revenue expected to be realized. Upfront customer incentives are recorded as prepaid assets and presented within other assets in the consolidated balance sheets, and are applied against revenue in the period such incentives are earned by the customer. Any incentive in excess of cumulative revenue is expensed as a contract cost.
Referrals
We earn specified referral fees in connection with certain referral activities we facilitate through our platform. In one type of referral arrangement, we refer end users through our platform to third-party enterprise partners. Our referral fee is calculated as either a fixed price per successful referral or a percentage of the transaction volume between the enterprise partners and referred consumers. In another type of referral arrangement, we earn referral fulfillment fees for providing pre-qualified borrower referrals to a third-party partner who separately contracts with a loan originator. Our referral fees are based on the referred loan amount, subject to a referral fulfillment fee penalty if a loan is determined to be ineligible and becomes a charged-off loan as defined in the contract. We recognize revenue for each originated loan, less the estimated referral fulfillment fee penalty. The estimated referral fulfillment fee penalty was immaterial as of December 31, 2023 and 2022.
Interchange
We earn interchange fees from debit and credit cardholder transactions conducted through payment networks. Interchange fees from cardholder transactions represent a percentage of the underlying transaction value and are recognized
SoFi Technologies, Inc.
SoFi Technologies, Inc.
Notes to Consolidated Financial Statements (continued)
(In Thousands, Unless Otherwise Stated and Except for Share and Per Share Data)
daily, concurrently with the transaction processing services provided to the cardholder. Interchange is presented net of cardholder rewards associated with card transactions.
Brokerage
We earn fees in connection with facilitating investment-related transactions through our platform, which we refer to as brokerage revenue. Our brokerage revenue performance obligation is generally completely satisfied upon the completion of an investment-related transaction. In general, we act as the agent in these arrangements as we do not oversee the execution of the transactions and ultimately lack the requisite control.
Disaggregated Revenue
The table below presents revenue from contracts with customers disaggregated by type of service, which best depicts how the revenue and cash flows are affected by economic factors, and by the reportable segment to which each revenue stream relates, as well as a reconciliation of total revenue from contracts with customers to total noninterest income. Revenue from contracts with customers is presented within noninterest income—technology products and solutions and noninterest income—other in the consolidated statements of operations and comprehensive loss. There were no revenues from contracts with customers attributable to our Lending segment for any of the years presented.
| | | | | | | | | | | | | | | | | |
| Year Ended December 31, |
| 2023 | | 2022 | | 2021 |
| Financial Services | | | | | |
| Referrals | $ | 38,443 | | | $ | 36,052 | | | $ | 15,750 | |
| Interchange | 35,247 | | | 17,391 | | | 10,642 | |
| Brokerage | 21,127 | | | 15,446 | | | 22,733 | |
Other(1) | 2,647 | | | 2,245 | | | 5,541 | |
| Total financial services | $ | 97,464 | | | $ | 71,134 | | | $ | 54,666 | |
Technology Platform(2) | | | | | |
| Technology services | 319,845 | | | 299,379 | | | 191,847 | |
Other(1) | 4,145 | | | 6,583 | | | 1,205 | |
| Total technology platform | 323,990 | | | 305,962 | | | 193,052 | |
| Total revenue from contracts with customers | 421,454 | | | 377,096 | | | 247,718 | |
| Other Sources of Revenue | | | | | |
| | | | | |
| | | | | |
| Loan origination, sales, and securitizations | 371,812 | | | 565,372 | | | 482,764 | |
| Servicing | 37,328 | | | 43,547 | | | (2,281) | |
| Other | 30,455 | | | 3,424 | | | 4,427 | |
| Total other sources of revenue | $ | 439,595 | | | $ | 612,343 | | | $ | 484,910 | |
| Total noninterest income | $ | 861,049 | | | $ | 989,439 | | | $ | 732,628 | |
_____________________(1) Financial Services includes revenues from enterprise services and equity capital markets services. Technology Platform includes revenues from software licenses and associated services, and payment network fees for serving as a transaction card program manager for enterprise customers that are the program marketers for separate card programs.
(2) Related to these technology products and solutions arrangements, we had deferred revenue of $5,718 and $10,028 as of December 31, 2023 and 2022, respectively, which are presented within accounts payable, accruals and other liabilities in the consolidated balance sheets. During the years ended December 31, 2023, 2022 and 2021, we recognized revenue of $8,327, $7,773 and $685, respectively, associated with deferred revenue within noninterest income—technology products and solutions in the consolidated statements of operations and comprehensive loss.
Contract Balances
As of December 31, 2023 and 2022, accounts receivable, net associated with revenue from contracts with customers was $60,466 and $61,226, respectively, which were reported within other assets in the consolidated balance sheets.
SoFi Technologies, Inc.
SoFi Technologies, Inc.
Notes to Consolidated Financial Statements (continued)
(In Thousands, Unless Otherwise Stated and Except for Share and Per Share Data)
Note 4. Loans
As of December 31, 2023, our loan portfolio consisted of (i) loans held for sale, including personal loans and home loans, which are measured at fair value under the fair value option, (ii) loans held for investment, including student loans, which are measured at fair value under the fair value option, and (iii) loans held for investment, including senior secured loans, credit cards, and commercial and consumer banking loans, which are measured at amortized cost. Below is a disaggregated presentation of our loans, inclusive of fair market value adjustments and accrued interest income and net of the allowance for credit losses, as applicable:
| | | | | | | | | | | |
| December 31, |
| 2023 | | 2022 |
| Loans held for sale | | | |
Personal loans(1) | $ | 15,330,573 | | | $ | 8,610,434 | |
Student loans(2) | — | | | 4,877,177 | |
| Home loans | 66,198 | | | 69,463 | |
| Total loans held for sale, at fair value | 15,396,771 | | | 13,557,074 | |
Loans held for investment(3) | | | |
Student loans(4) | 6,725,484 | | | — | |
| Total loans held for investment, at fair value | 6,725,484 | | | — | |
| Senior secured loans | 446,463 | | | — | |
| Credit card | 272,628 | | | 209,164 | |
| Commercial and consumer banking: | | | |
| Commercial real estate | 106,326 | | | 88,652 | |
| Commercial and industrial | 6,075 | | | 7,179 | |
| Residential real estate and other consumer | 4,667 | | | 2,962 | |
| Total commercial and consumer banking | 117,068 | | | 98,793 | |
Total loans held for investment, at amortized cost(3) | 836,159 | | | 307,957 | |
| Total loans held for investment | 7,561,643 | | | 307,957 | |
| Total loans | $ | 22,958,414 | | | $ | 13,865,031 | |
_____________________
(1) Includes $502,757 and $663,004 of personal loans in consolidated VIEs as of December 31, 2023 and 2022, respectively.
(2) Includes $268,697 of student loans in consolidated VIEs as of December 31, 2022.
(3) See Note 1. Organization, Summary of Significant Accounting Policies and New Accounting Standards and Note 5. Allowance for Credit Losses for additional information on our loans at amortized cost as it pertains to the allowance for credit losses.
(4) As of December 31, 2023, includes $2,459,103 of student loans covered by financial guarantees, and $221,461 of student loans in consolidated VIEs.
SoFi Technologies, Inc.
SoFi Technologies, Inc.
Notes to Consolidated Financial Statements (continued)
(In Thousands, Unless Otherwise Stated and Except for Share and Per Share Data)
Loans Measured at Fair Value
The following table summarizes the aggregate fair value of our loans measured atfor which we elected the fair value on a recurring basis as ofoption. See Note 15. Fair Value Measurements for the dates indicated:assumptions used in our fair value model.
| | | | | | | | | | | | | | | | | | | | | | | |
| Student Loans | | Home Loans | | Personal Loans | | Total |
| December 31, 2021 | | | | | | | |
Unpaid principal(1) | $ | 3,356,344 | | | $ | 210,111 | | | $ | 2,188,773 | | | $ | 5,755,228 | |
| Accumulated interest | 9,990 | | | 190 | | | 12,310 | | | 22,490 | |
Cumulative fair value adjustments(1) | 84,503 | | | 2,408 | | | 88,343 | | | 175,254 | |
| Total fair value of loans | $ | 3,450,837 | | | $ | 212,709 | | | $ | 2,289,426 | | | $ | 5,952,972 | |
| December 31, 2020 | | | | | | | |
Unpaid principal(1) | $ | 2,774,511 | | | $ | 171,967 | | | $ | 1,780,246 | | | $ | 4,726,724 | |
| Accumulated interest | 9,472 | | | 141 | | | 11,558 | | | 21,171 | |
Cumulative fair value adjustments(1) | 82,476 | | | 7,581 | | | 21,116 | | | 111,173 | |
| Total fair value of loans | $ | 2,866,459 | | | $ | 179,689 | | | $ | 1,812,920 | | | $ | 4,859,068 | |
| | | | | | | | | | | | | | | | | | | | | | | |
| Personal Loans | | Student Loans | | Home Loans | | Total |
| December 31, 2023 | | | | | | | |
| Unpaid principal | $ | 14,498,629 | | | $ | 6,445,586 | | | $ | 67,406 | | | $ | 21,011,621 | |
| Accumulated interest | 114,541 | | | 34,357 | | | 92 | | | 148,990 | |
| Cumulative fair value adjustments | 717,403 | | | 245,541 | | | (1,300) | | | 961,644 | |
Total fair value of loans(1) | $ | 15,330,573 | | | $ | 6,725,484 | | | $ | 66,198 | | | $ | 22,122,255 | |
| December 31, 2022 | | | | | | | |
| Unpaid principal | $ | 8,283,400 | | | $ | 4,794,517 | | | $ | 77,705 | | | $ | 13,155,622 | |
| Accumulated interest | 55,673 | | | 19,433 | | | 151 | | | 75,257 | |
| Cumulative fair value adjustments | 271,361 | | | 63,227 | | | (8,393) | | | 326,195 | |
Total fair value of loans(1) | $ | 8,610,434 | | | $ | 4,877,177 | | | $ | 69,463 | | | $ | 13,557,074 | |
_____________________(1) These items areEach component of the fair value of loans is impacted by charge-offs during the period. Our fair value assumption for annual default rate incorporates fair value markdowns on loans beginning when they are 10 days or more delinquent, with additional markdowns at 30, 60 and 90 days past due.
The following table summarizes the aggregate fair value of loans 90 days or more delinquent. As delinquent personal loans and student loans are charged off after 120 days of delinquency, amounts presented below represent the fair value of loans that are 90 to 120 days delinquent.
| | | | | | | | | | | | | | | | | | | | | | | |
| Personal Loans | | Student Loans | | Home Loans | | Total |
| December 31, 2023 | | | | | | | |
| Unpaid principal balance | $ | 81,591 | | | $ | 8,446 | | | $ | 495 | | | $ | 90,532 | |
| Accumulated interest | 4,023 | | | 187 | | | 6 | | | 4,216 | |
Cumulative fair value adjustments(1) | (70,191) | | | (5,021) | | | (248) | | | (75,460) | |
| Fair value of loans 90 days or more delinquent | $ | 15,423 | | | $ | 3,612 | | | $ | 253 | | | $ | 19,288 | |
| December 31, 2022 | | | | | | | |
| Unpaid principal balance | $ | 27,989 | | | $ | 6,435 | | | $ | — | | | $ | 34,424 | |
| Accumulated interest | 1,207 | | | 304 | | | — | | | 1,511 | |
Cumulative fair value adjustments(1) | (25,022) | | | (3,332) | | | — | | | (28,354) | |
| Fair value of loans 90 days or more delinquent | $ | 4,174 | | | $ | 3,407 | | | $ | — | | | $ | 7,581 | |
__________________
(1) Our fair value assumption for annual default rate incorporates fair value markdowns on loans beginning when they are 10 days or more delinquent, with additional markdowns at 30, 60 and 90 days past due.
Transfers of Financial Assets
We regularly transfer financial assets and account for such transfers as either sales or secured borrowings depending on the facts and circumstances of the transfer. When a transfer of financial assets qualifies as a sale, in many instances we have continuing involvement as the servicer of those financial assets. As we expect the benefits of servicing to be more than just adequate, we recognize a servicing asset. Further, in the case of securitization-related transfers that qualify as sales, we have additional continuing involvement as an investor, albeit at insignificant levels relative to the expected gains and losses of the securitization. In instances where a transfer is accounted for as a secured borrowing, we perform servicing (but we do not recognize a servicing asset) and typically maintain a significant investment relative to the expected gains and losses of the securitization. In whole loan sales, we do not have a residual financial interest in the loans, nor do we have any other power over the loans that would constrain us from recognizing a sale. Additionally, we generally have no repurchase requirements related to transfers of personal loans, student loans and non-GSE home loans other than standard origination representations and warranties, for which we record a liability based on expected repurchase obligations. For GSE home loans, we have customary
SoFi Technologies, Inc.
SoFi Technologies, Inc.
Notes to Consolidated Financial Statements (continued)
(In Thousands, Unless Otherwise Stated and Except for Share and Per Share Data)
GSE repurchase requirements, which do not constrain sale treatment but result in a liability for the expected repurchase requirement.
The following table summarizes our personal loan and student loan securitization transfers qualifying for sale accounting treatment. There were no loan securitization transfers qualifying for sale accounting treatment during the year ended December 31, 2022.
| | | | | | | | | | | | | |
| Year Ended December 31, |
| 2023 | | | | 2021 |
| Personal loans | | | | | |
| Fair value of consideration received: | | | | | |
| Cash | $ | 359,927 | | | | | $ | 1,050,062 | |
| Securitization investments | 18,985 | | | | | 55,491 | |
| | | | | |
| Servicing assets recognized | 15,975 | | | | | 6,003 | |
| Repurchase liabilities recognized | (113) | | | | | — | |
| Total consideration | 394,774 | | | | | 1,111,556 | |
| Aggregate unpaid principal balance and accrued interest of loans sold | 375,770 | | | | | 1,054,171 | |
| Gain from loan sales | $ | 19,004 | | | | | $ | 57,385 | |
| Student loans | | | | | |
| Fair value of consideration received: | | | | | |
| Cash | $ | — | | | | | $ | 1,187,714 | |
| Securitization investments | — | | | | | 62,783 | |
| | | | | |
| Servicing assets recognized | — | | | | | 36,948 | |
| Total consideration | — | | | | | 1,287,445 | |
| Aggregate unpaid principal balance and accrued interest of loans sold | — | | | | | 1,227,379 | |
| Gain from loan sales | $ | — | | | | | $ | 60,066 | |
Deconsolidation of debt reflects the impacts of previously consolidated VIEs that became deconsolidated during the period because we no longer hold a significant financial interest in the underlying securitization entity, which can fluctuate from period to period. Gains and losses on deconsolidations are presented within noninterest income—loan origination, sales, and securitizations in the consolidatedstatements of operations and comprehensive loss. During the year ended December 31, 2023, we had deconsolidation of debt on student loans of $100.3 million. During the year ended December 31, 2022, we had deconsolidation of debt on personal loans of $70.6 million and on student loans of $126.0 million. For all periods, the impact on earnings from these deconsolidations was immaterial.
SoFi Technologies, Inc.
SoFi Technologies, Inc.
Notes to Consolidated Financial Statements (continued)
(In Thousands, Unless Otherwise Stated and Except for Share and Per Share Data)
The following table summarizes the aggregate fair value of loans 90 days or more delinquent as of the dates indicated. As delinquent personal loans and student loans are charged off after 120 days of delinquency, amounts presented below represent the fair value ofour whole loan sales:
| | | | | | | | | | | | | | | | | |
| Year Ended December 31, |
| 2023 | | 2022 | | 2021 |
| Personal loans | | | | | |
| Fair value of consideration received: | | | | | |
| Cash | $ | 567,904 | | | $ | 3,016,740 | | | $ | 3,373,655 | |
| Servicing assets recognized | 30,168 | | | 21,925 | | | 21,811 | |
| Repurchase liabilities recognized | (2,069) | | | (7,351) | | | (8,168) | |
| Total consideration received | 596,003 | | | 3,031,314 | | | 3,387,298 | |
| Aggregate unpaid principal balance and accrued interest of loans sold | 567,003 | | | 2,924,567 | | | 3,253,645 | |
| Realized gain | $ | 29,000 | | | $ | 106,747 | | | $ | 133,653 | |
| Student loans | | | | | |
| Fair value of consideration received: | | | | | |
| Cash | $ | 98,624 | | | $ | 883,859 | | | $ | 1,676,892 | |
| Servicing assets recognized | 2,792 | | | 9,275 | | | 15,526 | |
| Repurchase liabilities recognized | (16) | | | (134) | | | (300) | |
| Total consideration | 101,400 | | | 893,000 | | | 1,692,118 | |
| Aggregate unpaid principal balance and accrued interest of loans sold | 99,916 | | | 881,922 | | | 1,635,280 | |
| Realized gain | $ | 1,484 | | | $ | 11,078 | | | $ | 56,838 | |
| Home loans | | | | | |
| Fair value of consideration received: | | | | | |
| Cash | $ | 1,022,600 | | | $ | 1,057,596 | | | $ | 2,989,813 | |
| Servicing assets recognized | 10,184 | | | 13,926 | | | 31,294 | |
| Repurchase liabilities recognized | (1,765) | | | (1,158) | | | (3,288) | |
| Total consideration | 1,031,019 | | | 1,070,364 | | | 3,017,819 | |
| Aggregate unpaid principal balance and accrued interest of loans sold | 1,029,623 | | | 1,095,882 | | | 2,935,343 | |
| Realized gain (loss) | $ | 1,396 | | | $ | (25,518) | | | $ | 82,476 | |
For certain transferred loans that qualified for sale accounting and are, 90therefore, off-balance sheet, we have continuing involvement through our servicing agreements. For such loans, our exposure to 120 days delinquent. There were no home loans that were 90 daysloss is generally limited to the extent we would be required to repurchase such a loan due to a breach of representations and warranties associated with the loan transfer or more delinquent as of the dates presented.
| | | | | | | | | | | | | | | | | | | |
| Student Loans | | | | Personal Loans | | Total |
| December 31, 2021 | | | | | | | |
| Unpaid principal | $ | 1,589 | | | | | $ | 4,765 | | | $ | 6,354 | |
| Accumulated interest | 32 | | | | | 149 | | | 181 | |
| Cumulative fair value adjustments | (865) | | | | | (4,189) | | | (5,054) | |
| Fair value of loans 90 days or more delinquent | $ | 756 | | | | | $ | 725 | | | $ | 1,481 | |
| December 31, 2020 | | | | | | | |
| Unpaid principal | $ | 1,046 | | | | | $ | 4,199 | | | $ | 5,245 | |
| Accumulated interest | 37 | | | | | 210 | | | 247 | |
| Cumulative fair value adjustments | (442) | | | | | (3,872) | | | (4,314) | |
| Fair value of loans 90 days or more delinquent | $ | 641 | | | | | $ | 537 | | | $ | 1,178 | |
The following table presents information about the changes in our loans measured at fair value on a recurring basis:
| | | | | | | | | | | | | | | | | | | | | | | |
| Student Loans | | Home Loans | | Personal Loans | | Total |
| Fair value as of January 1, 2020 | $ | 3,185,233 | | | $ | 91,695 | | | $ | 2,111,030 | | | $ | 5,387,958 | |
| Origination of loans | 4,928,880 | | | 2,183,521 | | | 2,580,757 | | | 9,693,158 | |
| Principal payments | (883,761) | | | (2,748) | | | (1,015,046) | | | (1,901,555) | |
| Sales of loans | (4,534,286) | | | (2,102,101) | | | (1,531,058) | | | (8,167,445) | |
| Deconsolidation of securitizations | (495,507) | | | — | | | (406,687) | | | (902,194) | |
Purchases(1) | 648,153 | | | 2,070 | | | 39,975 | | | 690,198 | |
| Change in accumulated interest | 1,286 | | | 21 | | | (2,379) | | | (1,072) | |
Change in fair value(2) | 16,461 | | | 7,231 | | | 36,328 | | | 60,020 | |
| Fair value as of December 31, 2020 | $ | 2,866,459 | | | $ | 179,689 | | | $ | 1,812,920 | | | $ | 4,859,068 | |
| Origination of loans | 4,293,526 | | | 2,978,222 | | | 5,386,934 | | | 12,658,682 | |
| Principal payments | (892,989) | | | (6,184) | | | (1,054,077) | | | (1,953,250) | |
| Sales of loans | (2,854,778) | | | (2,935,038) | | | (4,290,424) | | | (10,080,240) | |
Purchases(1) | 44,850 | | | 1,144 | | | 405,051 | | | 451,045 | |
| Change in accumulated interest | 518 | | | 49 | | | 752 | | | 1,319 | |
Change in fair value(2) | (6,749) | | | (5,173) | | | 28,270 | | | 16,348 | |
| Fair value as of December 31, 2021 | $ | 3,450,837 | | | $ | 212,709 | | | $ | 2,289,426 | | | $ | 5,952,972 | |
_____________________
(1) Purchases reflect unpaid principal balance and relate to previously transferred loans. Purchase activity during the years ended December 31, 2021 and 2020 included securitization clean-up calls (purchases we elect to make when the risk retention period has sunset) of $425,302 and $76,044, respectively. Additionally, during the years ended December 31, 2021 and 2020, the Company elected to purchase $17,596 and $606,264, respectively, of previously sold loans. The Company was not required to buy back these loans. The remaining purchases during the years presented related to standard representations and warranties pursuant to our various loan sale agreements.
(2) Changes in fair valuebalances of loans are recorded in the consolidated statements of operationsoriginated by us and comprehensive income (loss) within subsequently transferred, but with which we have continuing involvement:
| | | | | | | | | | | | | | | | | | | | | | | |
| Personal Loans | | Student Loans | | Home Loans | | Total |
| December 31, 2023 | | | | | | | |
| | | | | | | |
| Loans in delinquency (30+ days past due) | $ | 52,813 | | | $ | 60,989 | | | $ | 24,193 | | | $ | 137,995 | |
| Total loans in delinquency | 90,582 | | | 137,243 | | | 24,193 | | | 252,018 | |
Total transferred loans serviced(1) | 2,223,785 | | | 6,148,800 | | | 5,592,793 | | | 13,965,378 | |
| December 31, 2022 | | | | | | | |
| | | | | | | |
| Loans in delinquency (30+ days past due) | $ | 64,654 | | | $ | 46,986 | | | $ | 16,510 | | | $ | 128,150 | |
| Total loans in delinquency | 108,991 | | | 115,818 | | | 16,510 | | | 241,319 | |
Total transferred loans serviced(1) | 2,995,601 | | | 7,586,031 | | | 5,134,306 | | | 15,715,938 | |
noninterest income—loan origination and sales for loans held on the balance sheet prior to transfer to a third party through a sale or to a VIE and within noninterest income—securitizations for loans in a consolidated VIE. Changes in fair value are impacted by valuation assumption changes, as well as sales price execution and amount of time the loans are held prior to sale. The estimated amount of gains included in earnings attributable to changes in instrument-specific credit risk were $4,143, $13,896 and $9,501 during the years ended December 31, 2021, 2020 and 2019, respectively. The gains attributable to instrument-specific credit risk were estimated by incorporating our current default and loss severity assumptions for the loans. These assumptions are based on historical performance, market trends and performance expectations over the term of the underlying instrument._____________________
SoFi Technologies, Inc.
SoFi Technologies, Inc.
Notes to Consolidated Financial Statements (continued)
(In Thousands, Unless Otherwise Stated and Except for Share and Per Share Data)
(1)Total transferred loans serviced includes loans in delinquency, as well as loans in repayment, loans in-school/grace period/deferment (related to student loans), and loans in forbearance. The vast majority of total transferred loans serviced represent loans in repayment as of the dates indicated.
The following table presents additional information about the servicing cash flows received and net charge-offs related to loans originated by us and subsequently transferred, but with which we have a continuing involvement:
| | | | | | | | | | | | | | | | | |
| Year Ended December 31, |
| 2023 | | 2022 | | 2021 |
| Personal loans | | | | | |
| Servicing fees collected from transferred loans | $ | 20,577 | | | $ | 33,051 | | | $ | 34,421 | |
| Charge-offs, net of recoveries, of transferred loans | 167,643 | | | 93,095 | | | 102,217 | |
| Student loans | | | | | |
| Servicing fees collected from transferred loans | 27,401 | | | 35,203 | | | 46,657 | |
| Charge-offs, net of recoveries, of transferred loans | 41,642 | | | 34,136 | | | 24,675 | |
| Home loans | | | | | |
| Servicing fees collected from transferred loans | 14,530 | | | 12,893 | | | 8,749 | |
| | | | | |
| Total | | | | | |
| Servicing fees collected from transferred loans | $ | 62,508 | | | $ | 81,147 | | | $ | 89,827 | |
| Charge-offs, net of recoveries, of transferred loans | 209,285 | | | 127,231 | | | 126,892 | |
Loans Measured at Amortized Cost
Loan Portfolio Composition and Aging
The following table presents the amortized cost basis of our credit card and commercial and consumer banking portfolios (excluding accrued interest and before the allowance for credit losses) by either current status or delinquency status:
| | | | | | | | | | | | | | | | | | | | | | | | | | | | | | | | | | | |
| | | Delinquent Loans | | |
| Current | | 30–59 Days | | 60–89 Days | | ≥ 90 Days(1) | | Total Delinquent Loans | | Total Loans(2) |
| December 31, 2023 | | | | | | | | | | | |
| Senior secured loans | $ | 445,733 | | | $ | — | | | $ | — | | | $ | — | | | $ | — | | | $ | 445,733 | |
| Credit card | 297,612 | | | 5,451 | | | 4,829 | | | 11,802 | | | 22,082 | | | 319,694 | |
| Commercial and consumer banking: | | | | | | | | | | | |
| Commercial real estate | 107,757 | | | — | | | — | | | — | | | — | | | 107,757 | |
| Commercial and industrial | 6,108 | | | 1 | | | — | | | 439 | | | 440 | | | 6,548 | |
Residential real estate and other consumer(3) | 4,658 | | | — | | | — | | | — | | | — | | | 4,658 | |
| Total commercial and consumer banking | 118,523 | | | 1 | | | — | | | 439 | | | 440 | | | 118,963 | |
| Total loans | $ | 861,868 | | | $ | 5,452 | | | $ | 4,829 | | | $ | 12,241 | | | $ | 22,522 | | | $ | 884,390 | |
| December 31, 2022 | | | | | | | | | | | |
| Credit card | $ | 225,165 | | | $ | 4,670 | | | $ | 3,626 | | | $ | 10,498 | | | $ | 18,794 | | | $ | 243,959 | |
| Commercial and consumer banking: | | | | | | | | | | | |
| Commercial real estate | 89,544 | | | — | | | — | | | — | | | — | | | 89,544 | |
| Commercial and industrial | 7,636 | | | — | | | 1 | | | — | | | 1 | | | 7,637 | |
Residential real estate and other consumer(3) | 2,966 | | | — | | | — | | | — | | | — | | | 2,966 | |
| Total commercial and consumer banking | 100,146 | | | — | | | 1 | | | — | | | 1 | | | 100,147 | |
| Total loans | $ | 325,311 | | | $ | 4,670 | | | $ | 3,627 | | | $ | 10,498 | | | $ | 18,795 | | | $ | 344,106 | |
_____________________(1)All of the credit cards ≥ 90 days past due continued to accrue interest. As of the dates indicated, there were no credit cards on nonaccrual status. As of the dates indicated, commercial and consumer banking loans on nonaccrual status were immaterial.
SoFi Technologies, Inc.
SoFi Technologies, Inc.
Notes to Consolidated Financial Statements (continued)
(In Thousands, Unless Otherwise Stated and Except for Share and Per Share Data)
(2)For credit card, the balance is presented before allowance for credit losses of $52,385 and $39,110 as of December 31, 2023 and December 31, 2022, respectively, and accrued interest of $5,288 and $4,315, respectively. For senior secured loans, the balance is presented before accrued interest of $730 as of December 31, 2023. For commercial and consumer banking, the balance is presented before allowance for credit losses of $2,310 and $1,678, as of December 31, 2023 and December 31, 2022, respectively, and accrued interest of $415 and $324, respectively.
(3)Includes residential real estate loans originated by Golden Pacific for which we did not elect the fair value option.
Credit Quality Indicators
Credit Card
The following table presents the amortized cost basis of our credit card portfolio (excluding accrued interest and before the allowance for credit losses) based on FICO scores, which are obtained at origination of the account and are refreshed monthly thereafter. The pools estimate the likelihood of borrowers with similar FICO scores to pay credit obligations based on aggregate credit performance data.
| | | | | | | | | | | | | | |
| | December 31, |
| FICO | | 2023 | | 2022 |
| ≥ 800 | | $ | 29,269 | | | $ | 14,421 | |
| 780 – 799 | | 19,350 | | | 11,327 | |
| 760 – 779 | | 20,740 | | | 12,179 | |
| 740 – 759 | | 23,361 | | | 14,501 | |
| 720 – 739 | | 28,621 | | | 19,343 | |
| 700 – 719 | | 35,528 | | | 26,239 | |
| 680 – 699 | | 38,289 | | | 31,543 | |
| 660 – 679 | | 35,443 | | | 31,958 | |
| 640 – 659 | | 25,836 | | | 25,959 | |
| 620 – 639 | | 15,569 | | | 15,566 | |
| 600 – 619 | | 10,063 | | | 8,968 | |
| ≤ 599 | | 37,625 | | | 31,955 | |
| Total credit card | | $ | 319,694 | | | $ | 243,959 | |
Commercial and Consumer Banking
We analyze loans in our commercial and consumer banking portfolio by classification based on their associated credit risk, and perform an analysis on an ongoing basis as new information is obtained. Risk rating classifications are further described below. Loans with a lower expectation of credit losses are classified as Pass, while loans with a higher expectation of credit losses are classified as Substandard.
•Pass — Loans that management believes will fully repay in accordance with the contractual loan terms.
•Watch — Loans that management believes will fully repay in accordance with the contractual loan terms, but for which certain credit attributes have changed from origination and warrant further monitoring.
•Special mention — Loans with a potential weakness or weaknesses that deserves management’s close attention. If left uncorrected, the potential weaknesses may result in deterioration of the repayment prospects for the loan or our credit position at some future date.
•Substandard — Loans that are inadequately protected by the current net worth and paying capacity of the obligor or of the collateral pledged, if any. Loans so classified have a well-defined weakness or weaknesses that jeopardize the full repayment. They are characterized by the distinct possibility that we will sustain some loss if the deficiencies are not corrected.
SoFi Technologies, Inc.
SoFi Technologies, Inc.
Notes to Consolidated Financial Statements (continued)
(In Thousands, Unless Otherwise Stated and Except for Share and Per Share Data)
The following table presents the amortized cost basis of our commercial and consumer banking portfolio (excluding accrued interest and before the allowance for credit losses) by origination year and credit quality indicator:
| | | | | | | | | | | | | | | | | | | | | | | | | | | | | | | | | | | | | | | | | | | | | | | | | | |
| | Term Loans by Origination Year | | |
| December 31, 2023 | | 2023 | | 2022 | | 2021 | | 2020 | | 2019 | | Prior | | Total Term Loans | | Revolving Loans |
Commercial real estate | | | | | | | | | | | | | | | | |
| Pass | | $ | 23,200 | | | $ | 29,761 | | | $ | 5,636 | | | $ | 4,550 | | | $ | 9,332 | | | $ | 17,316 | | | $ | 89,795 | | | $ | 186 | |
| Watch | | 1,234 | | | 8,691 | | | 1,648 | | | — | | | 215 | | | 2,749 | | | 14,537 | | | — | |
| Special mention | | — | | | — | | | — | | | — | | | — | | | 1,703 | | | 1,703 | | | — | |
| Substandard | | — | | | — | | | — | | | — | | | — | | | 1,536 | | | 1,536 | | | — | |
| Total commercial real estate | | $ | 24,434 | | | $ | 38,452 | | | $ | 7,284 | | | $ | 4,550 | | | $ | 9,547 | | | $ | 23,304 | | | $ | 107,571 | | | $ | 186 | |
| Commercial and industrial | | | | | | | | | | | | | | | | |
| Pass | | $ | 54 | | | $ | — | | | $ | — | | | $ | 63 | | | $ | 96 | | | $ | 4,941 | | | $ | 5,154 | | | $ | 299 | |
| Watch | | 46 | | | — | | | — | | | — | | | 16 | | | 3 | | | 65 | | | — | |
| Substandard | | — | | | — | | | — | | | — | | | — | | | 1,030 | | | 1,030 | | | — | |
| Total commercial and industrial | | $ | 100 | | | $ | — | | | $ | — | | | $ | 63 | | | $ | 112 | | | $ | 5,974 | | | $ | 6,249 | | | $ | 299 | |
| Residential real estate and other consumer | | | | | | | | | | | | | | | | |
| Pass | | $ | 1,845 | | | $ | — | | | $ | — | | | $ | — | | | $ | — | | | $ | 2,585 | | | $ | 4,430 | | | $ | 188 | |
| Watch | | — | | | — | | | — | | | — | | | — | | | 40 | | | 40 | | | — | |
| Total residential real estate and other consumer | | $ | 1,845 | | | $ | — | | | $ | — | | | $ | — | | | $ | — | | | $ | 2,625 | | | $ | 4,470 | | | $ | 188 | |
Total commercial and consumer banking | | $ | 26,379 | | | $ | 38,452 | | | $ | 7,284 | | | $ | 4,613 | | | $ | 9,659 | | | $ | 31,903 | | | $ | 118,290 | | | $ | 673 | |
Note 5. Allowance for Credit Losses Our allowance for credit losses represents our current estimate of expected credit losses over the remaining contractual life of certain financial assets, including credit cards as well as commercial and consumer banking loans acquired in the Bank Merger, which relate to our Financial Services segment, and accounts receivables primarily related to our Technology Platform segment. Given our methods of collecting funds on servicing receivables, our historical experience of infrequent write offs, and that we have not observed meaningful changes in our counterparties’ abilities to pay, we determined that the future exposure to credit losses on servicing related receivables was immaterial.
In estimating expected credit losses for credit cards, we segment loans based on credit quality indicators and reassess our pools periodically to confirm that all loans within each pool continue to share similar risk characteristics. We establish an allowance within each pool utilizing a proprietary risk model that relies on assumptions such as average annual percentage rate, payment rate, utilization, delinquency status and default probability. The model may then be adjusted for current conditions and reasonable and supportable forecasts of future conditions, including economic conditions. We apply the aforementioned assumptions to the drawn balance of credit cards within each pool to estimate the lifetime expected credit losses within each pool, which are then aggregated to determine the allowance for credit losses.
We evaluate whether to include qualitative reserves to cover losses that are expected but may not be adequately represented in the quantitative methods or the economic assumptions. The qualitative reserves address possible limitations within the models, such as external conditions including regulatory requirements, emerging portfolio trends, the nature and size of the portfolio, portfolio concentrations, the volume and severity of past due accounts, or management risk actions. When a credit card balance is charged off, we record a reduction to the allowance and the credit card balance.
SoFi Technologies, Inc.
SoFi Technologies, Inc.
Notes to Consolidated Financial Statements (continued)
(In Thousands, Unless Otherwise Stated and Except for Share and Per Share Data)
The following table presents changes in our allowance for credit losses:
| | | | | | | | | | | | | | | | | |
| Credit Card(1) | | Commercial and Consumer Banking(1) | | Accounts Receivable(1) |
| Balance at January 1, 2022 | $ | 7,037 | | | $ | — | | | $ | 2,292 | |
Provision for credit losses(2) | 53,030 | | | 1,302 | | | 586 | |
Allowance for PCD loans(3) | — | | | 382 | | | — | |
| Write-offs charged against the allowance | (20,957) | | | (6) | | | (93) | |
| Balance at December 31, 2022 | $ | 39,110 | | | $ | 1,678 | | | $ | 2,785 | |
Provision for credit losses(2) | 54,267 | | | 678 | | | 773 | |
| Write-offs charged against the allowance | (40,992) | | | (46) | | | (1,721) | |
| Balance at December 31, 2023 | $ | 52,385 | | | $ | 2,310 | | | $ | 1,837 | |
_____________________(1)Credit cards and commercial and consumer banking loans measured at amortized cost, net of allowance for credit losses, are presented within loans held for investment in the consolidated balance sheets. Accounts receivable balances, net of allowance for credit losses, are presented within other assets in the consolidated balance sheets.
(2)The provision for credit losses on credit cards and commercial and consumer banking loans is presented within noninterest expense—provision for credit losses in the consolidated statements of operations and comprehensive loss. During the year ended December 31, 2023, recoveries of amounts previously reserved related to credit cards were $2,895, and immaterial during the year ended December 31, 2022. There were immaterial recoveries of amounts previously reserved related to commercial and consumer banking loans during the years ended December 31, 2023 and 2022. The provision for credit losses on accounts receivable is presented within noninterest expense—general and administrative in the consolidated statements of operations and comprehensive loss. During the years ended December 31, 2023 and 2022, recoveries of amounts previously reserved related to accounts receivable were $1,252 and $2,912, respectively.
(3)In connection with the Bank Merger, we obtained PCD loans, for which we measured an allowance, with a corresponding increase to the amortized cost basis as of the acquisition date. Therefore, recognition of the initial allowance for credit losses did not impact earnings.
Credit card: Accrued interest receivables written off by reversing interest income were $9.2 million and $4.7 million during the years ended December 31, 2023 and 2022, respectively.
SoFi Technologies, Inc.
SoFi Technologies, Inc.
Notes to Consolidated Financial Statements (continued)
(In Thousands, Unless Otherwise Stated and Except for Share and Per Share Data)
Note 6. Investment Securities Investments in AFS Debt Securities
The following table presents our investments in AFS debt securities:
| | | | | | | | | | | | | | | | | | | | | | | | | | | | | | | | |
| | Amortized Cost | | Accrued Interest | | Gross Unrealized Gains | | Gross Unrealized Losses(1) | | Fair Value |
| December 31, 2023 | | | | | | | | | | |
| U.S. Treasury securities | | $ | 518,673 | | | $ | 206 | | | $ | 978 | | | $ | (780) | | | $ | 519,077 | |
Multinational securities(2) | | 8,548 | | | 103 | | | — | | | (17) | | | 8,634 | |
| Corporate bonds | | 32,609 | | | 207 | | | — | | | (1,092) | | | 31,724 | |
| Agency mortgage-backed securities | | 28,714 | | | 111 | | | 33 | | | (1,016) | | | 27,842 | |
| Other asset-backed securities | | 7,272 | | | 4 | | | — | | | (154) | | | 7,122 | |
Other(3) | | 941 | | | 8 | | | — | | | (161) | | | 788 | |
| Total investments in AFS debt securities | | $ | 596,757 | | | $ | 639 | | | $ | 1,011 | | | $ | (3,220) | | | $ | 595,187 | |
| December 31, 2022 | | | | | | | | | | |
| U.S. Treasury securities | | $ | 121,282 | | | $ | 217 | | | $ | — | | | $ | (3,510) | | | $ | 117,989 | |
Multinational securities(2) | | 19,658 | | | 109 | | | — | | | (724) | | | 19,043 | |
| Corporate bonds | | 41,890 | | | 257 | | | — | | | (2,644) | | | 39,503 | |
| Agency mortgage-backed securities | | 8,899 | | | 22 | | | — | | | (991) | | | 7,930 | |
| Other asset-backed securities | | 9,556 | | | 5 | | | — | | | (514) | | | 9,047 | |
Other(3) | | 2,133 | | | 21 | | | — | | | (228) | | | 1,926 | |
| Total investments in AFS debt securities | | $ | 203,418 | | | $ | 631 | | | $ | — | | | $ | (8,611) | | | $ | 195,438 | |
_____________________(1) As of December 31, 2023 and December 31, 2022, we concluded that there was no credit loss attributable to securities in unrealized loss positions, as (i) 92% and 67% of the amortized cost basis of our investments as of December 31, 2023 and December 31, 2022, respectively, was composed of U.S. Treasury securities, agency mortgage-backed securities and sovereign foreign bonds, which are of high credit quality and have no risk of credit-related impairment due to the nature of the counterparties and history of no credit losses, and (ii) we have not identified factors indicating credit-related impairment for the remaining investments and expect that the contractual principal and interest payments will be received. Additionally, we do not intend to sell the securities in loss positions nor is it more likely than not that we will be required to sell the securities prior to recovery of the amortized cost basis.
(2) Includes supranational and sovereign foreign bonds.
(3) Includes state and city municipal bond securities.
SoFi Technologies, Inc.
SoFi Technologies, Inc.
Notes to Consolidated Financial Statements (continued)
(In Thousands, Unless Otherwise Stated and Except for Share and Per Share Data)
The following table presents information about our investments in AFS debt securities with gross unrealized losses and the length of time that individual securities have been in a continuous unrealized loss position as of December 31, 2023 and December 31, 2022.
| | | | | | | | | | | | | | | | | | | | | | | | | | | | | | | | | | | | | | |
| | Less than 12 Months | | 12 Months or Longer | | Total |
| | Fair Value | | Gross Unrealized Losses | | Fair Value | | Gross Unrealized Losses | | Fair Value | | Gross Unrealized Losses |
| December 31, 2023 | | | | | | | | | | | | |
| U.S. Treasury securities | | $ | 480,012 | | | $ | (58) | | | $ | 39,065 | | | $ | (722) | | | $ | 519,077 | | | $ | (780) | |
| Multinational securities | | — | | | — | | | 8,634 | | | (17) | | | 8,634 | | | (17) | |
| Corporate bonds | | — | | | — | | | 31,724 | | | (1,092) | | | 31,724 | | | (1,092) | |
| Agency mortgage-backed securities | | 20,930 | | | (157) | | | 6,912 | | | (859) | | | 27,842 | | | (1,016) | |
| Other asset-backed securities | | — | | | — | | | 7,122 | | | (154) | | | 7,122 | | | (154) | |
| Other | | — | | | — | | | 788 | | | (161) | | | 788 | | | (161) | |
| Total investments in AFS debt securities | | $ | 500,942 | | | $ | (215) | | | $ | 94,245 | | | $ | (3,005) | | | $ | 595,187 | | | $ | (3,220) | |
| December 31, 2022 | | | | | | | | | | | | |
| U.S. Treasury securities | | $ | 27,759 | | | $ | (1,171) | | | $ | 90,230 | | | $ | (2,339) | | | $ | 117,989 | | | $ | (3,510) | |
| Multinational securities | | — | | | — | | | 19,043 | | | (724) | | | 19,043 | | | (724) | |
| Corporate bonds | | 4,480 | | | (313) | | | 35,023 | | | (2,331) | | | 39,503 | | | (2,644) | |
| Agency mortgage-backed securities | | 6,448 | | | (814) | | | 1,482 | | | (177) | | | 7,930 | | | (991) | |
| Other asset-backed securities | | — | | | — | | | 9,047 | | | (514) | | | 9,047 | | | (514) | |
| Other | | 745 | | | (200) | | | 1,181 | | | (28) | | | 1,926 | | | (228) | |
| Total investments in AFS debt securities | | $ | 39,432 | | | $ | (2,498) | | | $ | 156,006 | | | $ | (6,113) | | | $ | 195,438 | | | $ | (8,611) | |
The following table presents the amortized cost and fair value of our investments in AFS debt securities by contractual maturity:
| | | | | | | | | | | | | | | | | | | | | | | | | | | | | | | | |
| | Due Within One Year | | Due After One Year Through Five Years | | Due After Five Years Through Ten Years | | Due After Ten Years | | Total |
| December 31, 2023 | | | | | | | | | | |
| Investments in AFS debt securities—Amortized cost: | | | | | | | | | | |
| U.S. Treasury securities | | $ | 513,281 | | | $ | 5,392 | | | $ | — | | | $ | — | | | $ | 518,673 | |
| Multinational securities | | 8,548 | | | — | | | — | | | — | | | 8,548 | |
| Corporate bonds | | 18,122 | | | 11,181 | | | 3,306 | | | — | | | 32,609 | |
| Agency mortgage-backed securities | | — | | | 135 | | | 684 | | | 27,895 | | | 28,714 | |
| Other asset-backed securities | | 87 | | | 5,283 | | | 1,902 | | | — | | | 7,272 | |
| Other | | — | | | — | | | — | | | 941 | | | 941 | |
| Total investments in AFS debt securities | | $ | 540,038 | | | $ | 21,991 | | | $ | 5,892 | | | $ | 28,836 | | | $ | 596,757 | |
Weighted average yield for investments in AFS debt securities(1) | | 4.79 | % | | 0.99 | % | | 2.98 | % | | 3.13 | % | | 4.55 | % |
SoFi Technologies, Inc.
SoFi Technologies, Inc.
Notes to Consolidated Financial Statements (continued)
(In Thousands, Unless Otherwise Stated and Except for Share and Per Share Data)
| | | | | | | | | | | | | | | | | | | | | | | | | | | | | | | | |
| | Due Within One Year | | Due After One Year Through Five Years | | Due After Five Years Through Ten Years | | Due After Ten Years | | Total |
Investments in AFS debt securities—Fair value(2): | | | | | | | | | | |
| U.S. Treasury securities | | $ | 513,710 | | | $ | 5,161 | | | $ | — | | | $ | — | | | $ | 518,871 | |
| Multinational securities | | 8,531 | | | — | | | — | | | — | | | 8,531 | |
| Corporate bonds | | 17,785 | | | 10,733 | | | 2,999 | | | — | | | 31,517 | |
| Agency mortgage-backed securities | | — | | | 128 | | | 633 | | | 26,970 | | | 27,731 | |
| Other asset-backed securities | | 87 | | | 5,133 | | | 1,898 | | | — | | | 7,118 | |
| Other | | — | | | — | | | — | | | 780 | | | 780 | |
| Total investments in AFS debt securities | | $ | 540,113 | | | $ | 21,155 | | | $ | 5,530 | | | $ | 27,750 | | | $ | 594,548 | |
_____________________(1) The weighted average yield represents the effective yield for the investment securities owned at the end of the period and is computed based on the amortized cost of each security.
(2) Presentation of fair values of our investments in AFS debt securities by contractual maturity excludes total accrued interest of $639 and $631 as of December 31, 2023 and December 31, 2022, respectively.
Gross realized gains and losses on our investments in AFS debt securities were $3,356 and $509, respectively, during the year ended December 31, 2023, and were immaterial during the years ended December 31, 2022 and 2021. During the years ended December 31, 2023, 2022, and 2021 there were no transfers between classifications of our investments in AFS debt securities. See Note 13. Equity for unrealized gains and losses on our investments in AFS debt securities and amounts reclassified out of AOCI.
Securitization Investments
The following table presents the aggregate outstanding value of asset-backed bonds and residual interests owned by the Company in nonconsolidated VIEs, which are presented within investment securities in the consolidated balance sheets:
| | | | | | | | | | | |
| December 31, |
| 2023 | | 2022 |
| Personal loans | $ | 27,247 | | | $ | 20,172 | |
| Student loans | 79,501 | | | 181,159 | |
| Securitization investments | $ | 106,748 | | | $ | 201,331 | |
Note 7. Securitization and Variable Interest Entities Consolidated VIEsServicing Rights
The Company consolidates certain securitization trustsEach time we enter into a servicing agreement, either in connection with transfers of our financial assets or in connection with a referral fulfillment arrangement in which we haveare a variable interestsub-servicer for financial assets that we do not legally own, we determine whether we should record a servicing asset or servicing liability. We elected the fair value option to measure our servicing rights subsequent to initial recognition. We measure the initial and are deemed to besubsequent fair value of our servicing rights using a discounted cash flow methodology, while also considering market data as it becomes available. The significant assumptions used in the primary beneficiary. Our consolidation policy is further discussed in Note 1.
The VIEs are SPEsvaluation model include our contractual servicing fee, ancillary income, prepayment rate assumptions, default rate assumptions, a discount rate commensurate with portfolio loans securing debt obligations. The SPEs were created and designed to transfer credit and interest ratethe risk associated with consumer loans through the issuance of collateralized notes and trust certificates. The Company makes standard representations and warranties to repurchase or replace qualified portfolio loans. Aside from these representations, the holders of the asset-backed debt obligations have no recourse to the Company if the cash flowsservicing asset or liability being valued, and an assumed market cost of servicing, which is based on active quotes from the underlying portfolio loans securing such debt obligations are not sufficient to pay all principal and interest on the asset-backed debt obligations. We hold a significant interest in these financing transactions through our ownership of a portionthird-party servicers. The value of the residual interest in certain VIEs. In addition, in some cases, we invest inservicing rights are dependent on the debt obligations issued by the VIE. Our investments in consolidated VIEs eliminate in consolidation. The residual interest is the first VIE interest to absorb losses should the loans securing the debt obligations not provide adequate cash flows to satisfy more senior claims and is, by design, the interest that we expect to absorb the expected gains and losses of the VIE. The Company’s exposure to credit risk in sponsoring SPEs is limited to our investment in the VIE. VIE creditors have no recourse against our general credit.
The following table presents the assets and liabilities of consolidated VIEs that were included in our consolidated balance sheets. The assets in the below table may only be used to settle obligations of consolidated VIEs and were in excess of those obligations as of the dates presented. Additionally, the assets and liabilities in the table below exclude intercompany balances, which eliminate upon consolidation.
| | | | | | | | | | | |
| December 31, |
| 2021 | | 2020 |
| Assets: | | | |
| Restricted cash and restricted cash equivalents | $ | 53,161 | | | $ | 76,973 | |
| Loans | 808,904 | | | 1,468,170 | |
| Total assets | $ | 862,065 | | | $ | 1,545,143 | |
| Liabilities: | | | |
| Accounts payable, accruals and other liabilities | $ | 388 | | | $ | 759 | |
Debt(1) | 660,419 | | | 1,248,822 | |
| Residual interests classified as debt | 93,682 | | | 118,298 | |
| Total liabilities | $ | 754,489 | | | $ | 1,367,879 | |
_____________________
(1)Debt is presented net of debt issuance costs and debt premiums (discounts).
Nonconsolidated VIEs
We have created and designed personal loan and student loan trusts to transfer associated credit and interest rate risk associated with the loans through the issuance of collateralized notes and residual certificates. We have a variable interest in the nonconsolidated loan trusts, as we own collateralized notes and residual certificates in the loan trusts that absorb variability. We also have continuing, non-controlling involvement with the trusts as the servicer. As servicer, we have the power to perform the activities which most impact the economic performance of the VIE, but since we hold an insignificantunderlying loans. For servicing rights retained in connection with loan transfers that do not meet the requirements for sale accounting treatment, there is no recognition of a servicing asset or liability.
Servicing rights in connection with transfers of financial interest assets are initially measured at fair value and recognized as a component of the gain or loss from sales of loans and the initial capitalization is reported within noninterest income—loan origination, sales, and securitizations in the trusts,consolidated statements of operations and comprehensive loss. Servicing rights assumed from third parties for financial assets for which we are not the primary beneficiary. We define an insignificant financial interest as less than 10% of the expected gainsloan originator are initially measured at fair value and losses of the VIE. This financial interest represents the equity ownership interestrecognized within noninterest income—servicing in the loan trusts, wherein there is an obligation to absorb lossesconsolidated statements of operations and comprehensive loss. Servicing rights are measured at fair value at each subsequent reporting date and changes in fair value are reported in earnings in the right to receive benefits from residual certificate ownership. The maximum exposure to loss as a resultperiod in which they occur. Subsequent measurement changes for all servicing rights, including servicing fee payments and fair value changes, are included within noninterest income—servicing in the consolidated statements of our involvement with the nonconsolidated VIE is limited to our investment. There are no liquidity arrangements, guarantees or other commitments by third parties that may affectoperations and comprehensive loss. We elected the fair value oroption to measure our servicing rights to better align with the valuation of our transferred loans, which also tend to share a similar risk profile to the personal loan servicing we assume from third parties when we are not the loan originator. The loans are also impacted by similar factors, such as conditional prepayment rates and default rates. We consider the risk of the assets and the observability of inputs in determining the classes of servicing rights. We have three classes of servicing assets: personal loans, student loans and home loans.
See Note 15. Fair Value Measurements for the key inputs used in the fair value measurements of our variable interests in nonconsolidated VIEs.classes of servicing rights.
SoFi Technologies, Inc.
SoFi Technologies, Inc.
Notes to Consolidated Financial Statements (continued)
(In Thousands, Unless Otherwise Stated and Except for Share and Per Share Data)
Personal LoansInvestments in Debt Securities
The accounting and measurement framework for our investments in debt securities is determined based on the security classification. We do not hold investments in debt securities for trading purposes, nor do we have investments in debt securities that we have the intent and ability to hold to maturity. Therefore, we classify our investments in debt securities as available-for-sale.
We record investments in AFS debt securities at fair value in our consolidated balance sheets, with unrealized gains and losses recorded, net of tax, as a component of AOCI. See Note 15. Fair Value Measurements for additional information on our fair value estimates for investments in AFS debt securities. The amortized cost basis of our investments in AFS debt securities reflects the security’s acquisition cost, adjusted for amortization of premium or accretion of discount, and collection of cash and charge-offs, as applicable. For purposes of determining gross realized gains and losses on AFS debt securities, the cost of securities sold is based on specific identification. We elected to present accrued interest for AFS debt securities within investment securities in the consolidated balance sheets. Purchase discounts, premiums, and other basis adjustments for investments in AFS debt securities are generally amortized into interest income over the contractual life of the security using the effective interest method. However, premiums on certain callable debt securities are amortized to the earliest call date. Amortization of premiums and discounts and other basis adjustments for investments in AFS debt securities, as well as interest income earned on the investments, are recognized within interest income—other, and realized gains and losses on investments in AFS debt securities are recognized within noninterest income—other in the consolidated statements of operations and comprehensive loss.
An investment in AFS debt security is considered impaired if its fair value is less than its amortized cost. If we determine that we have the intent to sell the impaired investment in AFS debt security, or if it is more likely than not that we will be required to sell the impaired investment in AFS debt security before recovery of its amortized cost, we recognize the full impairment loss reflecting the difference between the amortized cost (net of any prior recognized allowance) and the fair value of the investment in AFS debt security within noninterest income—other in the consolidated statements of operations and comprehensive loss. If neither of the above conditions exists, we evaluate whether the impairment loss is attributable to credit-related or non-credit-related factors. Any impairment that is not credit-related is recognized within other comprehensive income (loss), net of taxes. See the section “Allowance for Credit Losses” in this Note for the factors we consider in identifying credit-related impairment and the treatment of credit losses.
See Note 6. Investment Securities for additional information on our investments in AFS debt securities.
Securitization Investments
In Company-sponsored securitization transactions that meet the applicable criteria to be accounted for as a sale, we retain certain residual interests and asset-backed bonds. We measure these investments at fair value on a recurring basis and report them within investment securities in the consolidated balance sheets. Gains and losses related to our securitization investments are reported within noninterest income—loan origination, sales, and securitizations in the consolidated statements of operations and comprehensive loss. We determine the fair value of our securitization investments using a discounted cash flow methodology, while also considering market data as it becomes available.
Our residual investments accrete interest income over the expected life using the effective yield method, which reflects a portion of the overall fair value adjustment recorded each period on our residual investments. On a quarterly basis, we reevaluate the cash flow estimates over the life of the residual investments to determine if a change to the accretable yield is required on a prospective basis. Additionally, we record interest income associated with asset-backed bonds over the term of the underlying bond using the effective interest method on unpaid bond amounts. Interest income on residual investments and asset-backed bonds is presented within interest income—loans and securitizations in the consolidated statements of operations and comprehensive loss.
See Note 15. Fair Value Measurements for the key inputs used in the fair value measurements of our residual investments and asset-backed bonds.
Investments in Equity Securities
Our investments in equity securities consist of investments for which fair values are not readily determinable, which we elect to measure using the alternative method of accounting, under which they are measured at cost less any impairment and
SoFi Technologies, Inc.
SoFi Technologies, Inc.
Notes to Consolidated Financial Statements (continued)
(In Thousands, Unless Otherwise Stated and Except for Share and Per Share Data)
adjusted for changes resulting from observable price changes in orderly transactions for identical or similar investments of the same issuers. Our investments in equity securities are presented within other assets in the consolidated balance sheets. Adjustments to the carrying values of our investments in equity securities, such as impairments and unrealized gains, are recognized within noninterest income—other in the consolidated statements of operations and comprehensive loss.
Property, Equipment and Software
All property, equipment and software are initially recorded at cost, while repairs and maintenance costs are expensed as incurred. Computer hardware, furniture and fixtures, software, buildings and finance lease ROU assets are depreciated or amortized on a straight-line basis over the estimated useful life of each class of depreciable or amortizable assets (ranging from one to 30 years). Leasehold improvements are amortized over the shorter of the respective lease term or the estimated lives of the leasehold improvements.
Software includes both purchased and internally-developed software. Internally-developed software is capitalized when preliminary project efforts are successfully completed, and it is probable that both the project will be completed and the software will be used as intended. Capitalized costs consist of salaries and compensation costs (inclusive of share-based compensation) for employees, fees paid to third-party consultants who are directly involved in development efforts and costs incurred for upgrades and functionality enhancements, and are amortized over a useful life ranging from 2.5 to 3 years. Other costs are expensed as incurred.
See Note 9. Property, Equipment, Software and Leases for additional information on our property, equipment and software.
Goodwill and Intangible Assets
Goodwill represents the fair value of an acquired business in excess of the fair value of the identified net assets acquired. Goodwill is tested for impairment at the reporting unit level annually or whenever indicators of impairment exist. Impairment of goodwill is the condition that exists when the carrying amount of a reporting unit that includes goodwill exceeds its fair value. We may assess goodwill for impairment initially using a qualitative approach, referred to as “step zero”, to determine whether conditions exist to indicate that it is more likely than not that the fair value of a reporting unit is less than its carrying amount. If management concludes, based on its assessment of relevant events, facts and circumstances, that it is more likely than not that a reporting unit’s carrying value is greater than its fair value, then a quantitative analysis will be performed to determine if there is any impairment. We may alternatively elect to initially perform a quantitative assessment and bypass the qualitative assessment.
A goodwill impairment loss is recognized for the amount that the carrying amount of a reporting unit, including goodwill, exceeds its fair value, limited to the total amount of goodwill allocated to that reporting unit. Therefore, if the fair value of a reporting unit exceeds its carrying amount, goodwill of the reporting unit is not impaired. Our reporting units for our goodwill impairment analysis represent components of our business at one level below our operating segments. Our annual impairment testing date is October 1.
Definite-lived intangible assets are amortized on a straight-line basis over their useful lives and reviewed for impairment annually and whenever events or circumstances indicate that the carrying amount of such assets may not be recoverable. Intangible assets include capitalized costs incurred in the development and enhancement of our software products to be sold, leased or marketed. These costs, consisting primarily of salaries and compensation costs (inclusive of share-based compensation) for employees, are expensed as incurred until technological feasibility has been established, after which the costs are capitalized until the product is available for general release to customers.
See Note 2. Business Combinations and Note 8. Goodwill and Intangible Assets for further discussion of goodwill and intangible assets, including those recognized in connection with recent business combinations.
Leases
We established 4determine if an arrangement is or contains a lease at inception of the contract. A contract is or contains a lease if the contract conveys the right to control the use of identified property or equipment for a period of time in exchange for consideration. For our current office and non-office classes of operating leases, we elected the practical expedient to not separate non-lease components from lease components and to, instead, account for each separate lease component and the non-
SoFi Technologies, Inc.
SoFi Technologies, Inc.
Notes to Consolidated Financial Statements (continued)
(In Thousands, Unless Otherwise Stated and Except for Share and Per Share Data)
lease components associated with that lease component as a single lease component. For our current classes of finance leases, we did not elect to apply this practical expedient and, instead, separately identify and measure the non-lease components of the contracts. As an accounting policy election, we apply the short-term lease exemption practical expedient to any lease that, at the commencement date, has a lease term of 12 months or less and does not include an option to purchase the underlying asset that we are reasonably certain to exercise.
Operating leases are presented within operating lease right-of-use assets and operating lease liabilities in the consolidated balance sheets. Finance lease ROU assets are presented within property, equipment and software and finance lease liabilities are presented within accounts payable, accruals and other liabilities in the consolidated balance sheets. Operating and finance lease ROU assets represent our right to use an underlying asset for the lease term and operating and finance lease liabilities represent our obligation to make lease payments arising from the lease. ROU assets and lease liabilities are recognized at the commencement date based on the present value of lease payments over the lease term. As our leases do not provide an implicit borrowing rate, we use our incremental borrowing rate based on the information available at commencement date or modification date, as appropriate, in determining the present value of lease payments.
The operating lease ROU assets are increased by any prepaid lease payments and are reduced by any unamortized lease incentives. Our lease terms may include options to extend or terminate the lease when it is reasonably certain that we will exercise that option. Base rent is typically subject to rent escalations on each annual anniversary from the lease commencement dates. Lease expense for lease payments, including any step rent provisions specified in the lease agreements, is recognized on a straight-line basis over the lease term and is allocated among the components of noninterest expense in the consolidated statements of operations and comprehensive loss. The finance lease ROU assets are depreciated on a straight-line basis over the estimated useful life of seven years. Interest expense on finance leases is recognized for the difference between the present value of the lease liabilities and the scheduled lease payments within interest expense—other in the consolidated statements of operations and comprehensive loss.
When a lease agreement is modified, we determine if the modification grants us the right to use an additional asset that is not included in the original lease contract and if the lease payments increase commensurate with the standalone price for the additional ROU asset. If both conditions are met, we account for the agreement as two separate contracts: (i) the original, unmodified contract and (ii) a separate contract for the additional ROU asset. If both conditions are not met, the modification is not evaluated as a separate contract. Instead, based on the nature of the modification, we: (i) reassess the lease classification on the modification date under the modified terms, and (ii) use the modified lease payments and discount rate to remeasure the lease liability and recognize any difference between the new lease liability and the old lease liability as an adjustment to the ROU asset.
See Note 9. Property, Equipment, Software and Leases for additional information on our leases.
Derivative Financial Instruments
We enter into derivative contracts to manage future loan sale execution risk. We did not elect hedge accounting, as management’s hedging intentions are to economically hedge the risk of unfavorable changes in the fair values of our personal loans, student loans and home loans. Our derivative instruments used to manage future loan sale execution risk include interest rate swaps, interest rate caps and home loan pipeline hedges. We also have IRLCs, interest rate swaps and interest rate caps that were not related to future loan sale execution risk.
Changes in derivative instrument fair values are recognized in earnings as they occur. Depending on the measurement date position, derivative financial instruments are presented within other assets or accounts payable, accruals and other liabilities in the consolidated balance sheets. Our derivative instruments are reported within cash flows from operating activities in the consolidated statements of cash flows.
Certain derivative instruments are subject to enforceable master netting arrangements. Accordingly, we present our net asset or liability position by counterparty in the consolidated balance sheets. Additionally, since our cash collateral balances do not approximate the fair value of the derivative position, we do not offset our right to reclaim cash collateral or obligation to return cash collateral against recognized derivative assets or liabilities.
See Note 14. Derivative Financial Instruments and Note 15. Fair Value Measurements for additional information on our derivative assets and liabilities.
SoFi Technologies, Inc.
SoFi Technologies, Inc.
Notes to Consolidated Financial Statements (continued)
(In Thousands, Unless Otherwise Stated and Except for Share and Per Share Data)
Residual Interests Classified as Debt
Within consolidated securitizations, the residual interests held by third parties are presented as residual interests classified as debt in the consolidated balance sheets. We measure residual interests classified as debt at fair value on a recurring basis. We record subsequent measurement changes in fair value in the period in which the change occurs within noninterest income—loan origination, sales, and securitizations in the consolidated statements of operations and comprehensive loss. We determine the fair value of residual interests classified as debt using a discounted cash flow methodology, while also considering market data as it becomes available.
We recognize interest expense related to residual interests classified as debt over the expected life using the effective yield method, which reflects a portion of the overall fair value adjustment recorded each period on our residual interests classified as debt. Interest expense related to residual interests classified as debt is presented within interest expense—securitizations and warehouses in the consolidated statements of operations and comprehensive loss. On a quarterly basis, we reevaluate the cash flow estimates to determine if a change to the accretable yield is required on a prospective basis.
See Note 15. Fair Value Measurements for the key inputs used in the fair value measurements of residual interests classified as debt.
Safeguarding Asset and Liability
Through our SoFi Invest product (via our wholly-owned subsidiary, SoFi Digital Assets, LLC, a licensed money transmitter), our members were able to invest in digital assets. In the fourth quarter of 2023, we transferred the crypto services provided by SoFi Digital Assets, LLC, and began closing existing digital assets accounts. This process was completed in the first quarter of 2024. Certain accounts were eligible for transfer to a third party digital asset service provider who assumed responsibility for the transferred accounts on a go-forward basis, including the arrangement of custodial services for the transferred digital assets. We have no further ongoing responsibilities for the transferred digital assets subsequent to the executed transfer which took place in December 2023, and derecognized the corresponding digital assets safeguarding liability and safeguarding asset as of the date of the transfer.
For those digital assets that were not eligible to be transferred, we engage third parties to provide custodial services for our digital assets offering, which include holding the cryptographic key information and working to protect the digital assets from loss or theft. The third-party custodians hold digital assets as custodial assets in an account in SoFi’s name for the benefit of our members. We maintain the internal recordkeeping of our members’ digital assets, including the amount and type of digital assets owned by each of our members in the custodial accounts. As of December 31, 2023, we utilized one third-party custodian.
In accordance with Staff Accounting Bulletin No. 121 (“SAB 121”), we recognize a digital assets safeguarding liability within accounts payable, accruals and other liabilities in the consolidated balance sheets reflecting our obligation to safeguard the digital assets held by third-party custodians for the benefit of our members. We also recognize a corresponding safeguarding asset within other assets in the consolidated balance sheets. The safeguarding liability and corresponding safeguarding asset are measured and recorded at the fair value of the digital assets held by the custodians at each reporting date. Subsequent changes to the fair value measurement are reflected as equal and offsetting adjustments to the carrying values of the safeguarding liability and corresponding safeguarding asset. We evaluate any potential loss events, such as theft, loss or destruction of the cryptographic keys, that may affect the measurement of the safeguarding asset, which would be reflected in our results of operations in the period the loss occurs. Measurement changes do not impact the consolidated statements of operations and comprehensive loss unless such a loss event is identified. As of both December 31, 2023 and 2022, we did not identify any loss events.
See Note 15. Fair Value Measurements for additional information on the fair value measurement of the safeguarding liability and corresponding safeguarding asset.
Borrowings and Financing Costs
We borrow from various financial institutions to finance our lending activities. Direct costs incurred in connection with financing, such as banker fees, origination fees and legal fees, are classified as deferred debt issuance costs. We capitalize these costs and report the amounts as a direct deduction from the carrying amount of the debt balance. Any difference between the stated principal amount of debt and the amount of cash proceeds received, net of debt issuance costs, is presented as a
SoFi Technologies, Inc.
SoFi Technologies, Inc.
Notes to Consolidated Financial Statements (continued)
(In Thousands, Unless Otherwise Stated and Except for Share and Per Share Data)
discount or premium. The capitalized debt issuance costs and the original issue discount/premium are amortized into interest expense over the expected life of the related financing agreements using the straight-line method for revolving facilities and the effective interest method for securitization debt and our senior convertible notes, as defined and further discussed below. Remaining unamortized fees are expensed immediately upon early extinguishment of the debt. In a debt modification for revolving debt, the initial issuance costs and any additional fees incurred as a result of the modification are deferred over the term of the new agreement, if the borrowing capacity of the revolving facility is increased. In the case that a modification results in a decrease in our borrowing capacity, any fees paid to the creditor and any third-party costs incurred are considered to be associated with the new arrangement and are, therefore, deferred and amortized over the term of the new arrangement. Unamortized deferred costs relating to the old arrangement at the time of the modification are expensed immediately in proportion to the decrease in borrowing capacity of the old arrangement. Any remaining unamortized deferred costs relating to the old arrangement are deferred and amortized over the term of the new arrangement.
We elected the fair value option to measure certain securitization debt, with the intent to mitigate the accounting divergence between debt liabilities measured at historical cost and the corresponding loans securing these financings, which are risk-managed on a fair value basis. For securitization debt carried at fair value on a recurring basis, we record the initial fair value measurement and subsequent measurement changes in fair value in the period in which the changes occur within noninterest income—loan origination, sales, and securitizations in the consolidated statements of operations and comprehensive loss. We determined the fair value of the applicable securitization debt using a discounted cash flow methodology, while also considering market data as it becomes available. The key inputs to the calculation include the underlying contractual coupons, terms, discount rate and expectations for defaults and prepayments.
Convertible Senior Notes
In October 2021, we issued $1.2 billion aggregate principal amount of convertible senior notes due 2026 (the “convertible notes”). The convertible notes will mature on October 15, 2026, unless earlier repurchased, redeemed or converted. We will settle conversions by paying or delivering, at our election, cash, shares of our common stock or a combination of cash and shares of our common stock, based on the applicable conversion rate(s). The convertible notes will also be redeemable, in whole or in part, at our option at any time, and from time to time, on or after October 15, 2024 through the 30th scheduled trading day immediately before the maturity date, at a cash redemption price equal to the principal amount of the convertible notes to be redeemed, plus accrued interest, if any, thereon to, but excluding, the redemption date, but only if certain liquidity conditions described in the indenture are satisfied and certain conditions are met with respect to the last reported sale price per share of our common stock prior to conversion. In December 2023, we entered into repurchase agreements to repurchase $88.0 million aggregate principal amount of the convertible notes. See Note 12. Debt for more detailed disclosure of the term and features of the convertible notes.
We elected to evaluate each embedded feature of the arrangement individually. We concluded that each of the conversion rights, optional redemption rights, fundamental change make-whole provision and repurchase rights did not require bifurcation as derivative instruments, which we reevaluate each reporting period. The additional interest and special interest that accrue on the notes in the event of our failure to comply with certain registration or reporting requirements are required to be bifurcated from the host contract, as the reporting requirement triggering event is not clearly and closely related to the host convertible debt contract, and therefore we measure the contingent interest feature at fair value each reporting period. The value was determined to be immaterial; therefore, we accounted for the convertible notes wholly as debt, which was recognized on the settlement date. Accordingly, we allocated all debt issuance costs to the debt instrument on the basis of materiality.
In connection with the pricing of the convertible notes, we entered into privately negotiated capped call transactions with certain financial institutions, as defined and further discussed below.
Redeemable Preferred Stock
Series 1 personalRedeemable Preferred Stock (as defined in Note 13. Equity) is classified in temporary equity, as it is not fully controlled by SoFi. See Note 13. Equity for additional information.
Foreign Currency Translation Adjustments
We revalue assets, liabilities, income and expense denominated in non-United States currencies into United States dollars using applicable exchange rates. For foreign subsidiaries in which the functional currency is the subsidiary’s local
SoFi Technologies, Inc.
SoFi Technologies, Inc.
Notes to Consolidated Financial Statements (continued)
(In Thousands, Unless Otherwise Stated and Except for Share and Per Share Data)
currency, gains and losses relating to foreign currency translation adjustments are included in accumulated other comprehensive income (loss) in our consolidated balance sheets. For foreign subsidiaries in which the functional currency is the United States Dollar, gains and losses relating to foreign currency transaction adjustments are included within earnings in the consolidated statements of operations and comprehensive loss. Due to the highly inflationary economic environment in Argentina, we use the United States Dollar as the functional currency of our Argentinian operations. Our activities in Argentina are related to our Technology Platform segment and commenced in the first quarter of 2022 with the Technisys Merger.
Capped Call Transactions
We entered into privately negotiated capped call transactions (the “Capped Call Transactions”) with certain financial institutions (the “Capped Call Counterparties”). The Capped Call Transactions initially cover, subject to customary anti-dilution adjustments, the number of shares of our common stock that initially underlie the convertible notes. The Capped Call Transactions are net purchased call options on our own common stock. The Capped Call Transactions are separate transactions entered into by the Company with each of the Capped Call Counterparties, are not part of the terms of the convertible notes, and do not affect any holder’s rights under the convertible notes. Holders of the convertible notes do not have any rights with respect to the Capped Call Transactions. As the Capped Call Transactions are legally detachable and separately exercisable from the convertible notes, they were evaluated as freestanding instruments. We concluded that the Capped Call Transactions meet the scope exceptions for derivative instruments, and as such, the Capped Call Transactions meet the criteria for classification in equity and are included as a reduction to additional paid-in capital.
See Note 13. Equity for additional information on the Capped Call Transactions.
Interest Income
We record interest income associated with loans measured at fair value over the term of the underlying loans using the effective interest method on unpaid loan trustsprincipal amounts, which is presented within interest income—loans and securitizations in the consolidated statements of operations and comprehensive loss. We also record accrued interest income associated with loans measured at amortized cost within interest income—loans and securitizations. We stop accruing interest and reverse all accrued but unpaid interest at the time a loan charges off. Loans are returned to accrual status if the loans are brought to nondelinquent status or have performed in accordance with the contractual terms for a reasonable period of time and, in management’s judgment, will continue to make scheduled periodic principal and interest payments.
Other interest income is primarily earned on our bank balances.
Loan Origination and Sales Activities
As part of our loan sale agreements, we may retain the rights to service sold loans. We calculate a gain or loss on the sale based on the sum of the proceeds from the sale and any servicing asset or liability recognized, less the carrying value of the loans sold. Our gain or loss calculation is also inclusive of repurchase liabilities recognized at the time of sale, and is recorded within noninterest income—loan origination, sales, and securitizations in the consolidated statements of operations and comprehensive loss.
Loan Commitments
We offer a program whereby applicants can lock in an interest rate on an in-school loan to be funded at a later time. Applicants can exit the loan origination process up until the loan funding date. SoFi is obligated to fund the loan at the committed terms on the disbursement date if the borrower does not cancel prior to the loan funding date. The student loan commitments meet the scope exception for issuers of commitments to originate non-mortgage loans. As the writer of the commitments, we elected the fair value option to measure our unfunded student loan commitments to align with the measurement methodology of our originated student loans. As such, our student loan commitments are carried at fair value on a recurring basis. Depending on the measurement date position, student loan commitments are presented within other assets or accounts payable, accruals and other liabilities in the consolidated balance sheets. We record the initial fair value measurement and subsequent measurement changes in fair value in the period in which the changes occur within noninterest income—loan origination, sales, and securitizations in the consolidated statements of operations and comprehensive loss.
Loan commitments also include IRLCs, whereby we commit to interest rate terms prior to completing the origination process for home loans. IRLCs are derivative instruments that are measured at fair value on a recurring basis. Changes in fair
SoFi Technologies, Inc.
SoFi Technologies, Inc.
Notes to Consolidated Financial Statements (continued)
(In Thousands, Unless Otherwise Stated and Except for Share and Per Share Data)
value are recognized within noninterest income—loan origination, sales, and securitizations in the consolidated statements of operations and comprehensive loss. See “Derivative Financial Instruments” in this Note for additional information on our derivative instruments.
See Note 15. Fair Value Measurements for the key inputs used in the fair value measurements of our loan commitments.
Revenue Recognition
In each of our revenue arrangements, revenue is recognized when control of the promised goods or services is transferred to the customer in an amount that reflects our expected consideration in exchange for those goods or services. Our primary revenue streams for the periods presented include the following:
•Technology Products and Solutions: We earn fees for providing an integrated platform as a service for financial and non-financial institutions.
•Referrals: We earn specified referral fees in connection with referral activities we facilitate through our platform, such as referrals to third-party partners that offer services to end users who do not use one of our product offerings and referrals of pre-qualified borrowers to a third-party partner who separately contracts with a loan originator.
•Interchange: We earn interchange fees from debit and credit cardholder transactions conducted through payment networks.
•Brokerage: We earn fees in connection with facilitating investment-related transactions through our platform, such as brokerage transactions, share lending and exchange conversion.
See Note 3. Revenue for additional information on our revenue recognition policy within each revenue stream.
Advertising, Sales and Marketing
Advertising production costs and advertising communication costs, as well as amounts paid to various affiliates to market our products, are included within noninterest expense—sales and marketing in the consolidated statements of operations and comprehensive loss. Advertising costs are expensed either as incurred or when the advertising takes place, depending on the nature of the advertising activity. For the years ended December 31, 2023, 2022 and 2021, advertising totaled $284,176, $256,125 and $183,106, respectively.
Expenses incurred by us related to member acquisition, including brand development, business development and direct member marketing expenses, are also presented within noninterest expense—sales and marketing in the consolidated statements of operations and comprehensive loss.
Technology and Product Development
Expenses incurred by us related to technology, product design and implementation, which includes compensation and benefits, are classified as noninterest expense—technology and product development in the consolidated statements of operations and comprehensive loss.
Loss Contingencies
Loss contingencies, including claims and legal actions arising in the ordinary course of business, are recorded in accounts payable, accruals and other liabilities in the consolidated balance sheets. Such liabilities and associated expenses are recorded when the likelihood of loss is probable and an amount or range of loss can be reasonably estimated. Such estimates are based on the best information available at the time. As additional information becomes available, we reassess the potential liability and record an estimate in the period in which the adjustment is probable and an amount or range can be reasonably estimated. Due to the inherent uncertainties of loss contingencies, estimates may be different from the actual outcomes. With respect to legal proceedings, we recognize legal fees as they are incurred within noninterest expense—general and administrative in the consolidated statements of operations and comprehensive loss. See Note 18. Commitments, Guarantees, Concentrations and Contingencies for discussion of contingent matters.
SoFi Technologies, Inc.
SoFi Technologies, Inc.
Notes to Consolidated Financial Statements (continued)
(In Thousands, Unless Otherwise Stated and Except for Share and Per Share Data)
Restructuring
During the year ended December 31, 2023, we recognized restructuring charges of $12,749 within the following categories of expenses within noninterest expense: (i) technology and product development, (ii) sales and marketing, (iii) cost of operations, and (iv) general and administrative in the consolidated statements of operations and comprehensive loss associated with a reduction in headcount in the Technology Platform segment in the first quarter of 2023, as well as expenses in the fourth quarter of 2023 related to a reduction in headcount across the Financial Services, Lending and corporate functions, which primarily included employee-related wages, benefits and severance.
Compensation and Benefits
Total compensation and benefits, inclusive of share-based compensation expense, was $894,720, $830,298 and $608,505 for the years ended December 31, 2023, 2022 and 2021, respectively. Compensation and benefits expenses are presented within the following categories of expenses within noninterest expense: (i) technology and product development, (ii) sales and marketing, (iii) cost of operations, and (iv) general and administrative in the consolidated statements of operations and comprehensive loss.
Share-Based Compensation
Share-based compensation made to employees and non-employees, including stock options, RSUs and PSUs, is measured based on the grant date fair value of the awards and is recognized as compensation expense typically on a straight-line basis over the period during which the share-based award holder is required to perform services in exchange for the award (the vesting period) for stock options and RSUs and on an accelerated attribution basis for each vesting tranche over the respective derived service period for PSUs. Share-based compensation expense is allocated among the following categories of expenses within noninterest expense: (i) technology and product development, (ii) sales and marketing, (iii) cost of operations, and (iv) general and administrative in the consolidated statements of operations and comprehensive loss. We used the Black-Scholes Option Pricing Model (the “Black-Scholes Model”) to estimate the grant-date fair value of stock options. RSUs are measured based on the fair values of the underlying stock on the dates of grant. We use a Monte Carlo simulation model to estimate the grant-date fair value of PSUs. We recognize forfeitures as incurred and, therefore, reverse previously recognized share-based compensation expense at the time of forfeiture. See Note 16. Share-Based Compensation for further discussion of share-based compensation.
Income Taxes
We recognize deferred tax assets and liabilities for the expected future tax consequences of temporary differences between the financial reporting and tax basis of assets and liabilities, as well as for operating loss and tax credit carryforwards. Deferred tax assets and liabilities are measured using the tax rates that are expected to apply to taxable income for the years in which those tax assets and liabilities are expected to be realized or settled. In assessing the realizability of deferred tax assets, management reviews all available positive and negative evidence. Valuation allowances are recorded to reduce deferred tax assets to the amount we believe is more likely than not to be realized.
The tax effects from an uncertain tax position can be recognized in the financial statements only if the tax position would more likely than not be upheld on examination by the taxing authorities based on the merits of the tax position. Management is required to analyze all open tax years, as defined by the statute of limitations, for all jurisdictions. We accrue tax penalties and interest, if any, as incurred and recognize them within income tax (expense) benefit in the consolidated statements of operations and comprehensive loss.
Related Parties
We define related parties as members of our Board of Directors, entity affiliates, executive officers and principal owners of our outstanding stock and members of their immediate families. Related parties also include any other person or entity with significant influence over our management or operations.
SoFi Technologies, Inc.
SoFi Technologies, Inc.
Notes to Consolidated Financial Statements (continued)
(In Thousands, Unless Otherwise Stated and Except for Share and Per Share Data)
Recently Adopted Accounting Standards
Troubled Debt Restructurings and Vintage Disclosures
In March 2022, the FASB issued ASU 2022-02, Financial Instruments — Credit Losses (Topic 326): Troubled Debt Restructurings and Vintage Disclosures. The ASU addresses two topics: (i) TDR by creditors, and (ii) vintage disclosures for gross write offs. Under the TDR provisions, the ASU eliminates the recognition and measurement guidance under ASC 310-40, Receivables — Troubled Debt Restructurings by Creditors, and instead requires that an entity evaluate whether the modification represents a new loan or a continuation of an existing loan, consistent with the accounting for other loan modifications. Additionally, the ASU enhances existing disclosure requirements around TDRs and introduces new requirements related to certain modifications of receivables made to borrowers experiencing financial difficulty. Under the vintage disclosure provisions, the ASU requires the entity to disclose current period gross write offs by year of origination for financing receivables and net investments in leases within the scope of ASC 326-20, Financial Instruments — Credit Losses — Measured at Amortized Cost. The standard should be applied prospectively; however, for the TDR provisions, an entity has the option to apply a modified retrospective transition method. We adopted the standard effective January 1, 2023. The adoption of this standard did not have a material impact on our consolidated financial statements.
Recent Accounting Standards Issued, But Not Yet Adopted
Improvements to Reportable Segment Disclosures
In November 2023, the FASB issued ASU 2023-07, Segment Reporting (Topic 280) — Improvements to Reportable Segment Disclosures. The ASU improves reportable segment disclosure requirements, primarily through enhanced disclosures about significant segment expenses. The standard is effective for fiscal years beginning after December 15, 2023, and interim periods within fiscal years beginning after December 15, 2024. The standard should be applied retrospectively to all prior periods presented in the financial statements. We are currently evaluating the impact of this amendment on our consolidated financial statements.
Improvements to Income Tax Disclosures
In December 2023, the FASB issued ASU 2023-09, Income Taxes (Topic 740) — Improvements to Income Tax Disclosures. The ASU improves income tax disclosures primarily related to enhancements of the rate reconciliation and income taxes paid information. The standard is effective for annual periods beginning after December 15, 2024. The standard should be applied on a prospective basis with the option to apply the standard retrospectively. We are currently evaluating the impact of this amendment on our consolidated financial statements.
Note 2. Business Combinations
Merger with Social Capital Hedosophia Holdings Corp. V
On January 7, 2021, Social Finance entered into an agreement by and among Social Finance, SCH, a Cayman Islands exempted company limited by shares, and Plutus Merger Sub Inc., a Delaware corporation and a wholly owned subsidiary of SCH (“Merger Sub”), pursuant to which Merger Sub merged with and into Social Finance. Upon the Closing on May 28, 2021, the separate corporate existence of Merger Sub ceased and Social Finance survived the merger and became a wholly-owned subsidiary of SCH. On May 28, 2021, SCH also filed a notice of deregistration with the Cayman Islands Registrar of Companies, together with the necessary accompanying documents, and filed a certificate of incorporation and a certificate of corporate domestication with the Secretary of State of the State of Delaware, under which SCH was domesticated as a Delaware corporation, changing its name from “Social Capital Hedosophia Holdings Corp. V” to “SoFi Technologies, Inc.” These transactions are collectively referred to as the “Business Combination”.
The Business Combination was accounted for as a reverse recapitalization whereby SCH was determined to be the accounting acquiree and Social Finance to be the accounting acquirer. This accounting treatment was the equivalent of Social Finance issuing stock for the net assets of SCH, accompanied by a recapitalization whereby no goodwill or other intangible assets were recorded. Operations prior to the Business Combination are those of Social Finance. At the Closing, we received gross cash consideration of $764.8 million as a result of the reverse recapitalization, which was then reduced by: (i) a redemption of redeemable common stock (classified as temporary equity) of $150.0 million, (ii) a special payment made to our
SoFi Technologies, Inc.
SoFi Technologies, Inc.
Notes to Consolidated Financial Statements (continued)
(In Thousands, Unless Otherwise Stated and Except for Share and Per Share Data)
Series 1 preferred stockholders of $21.2 million (which was expensed as incurred), and (iii) our equity issuance costs of $27.5 million, consisting of advisory, legal, share registration and other professional fees, which were recorded within additional paid-in capital as a reduction of proceeds.
In connection with the Business Combination, SCH entered into subscription agreements with certain investors (the “Third Party PIPE Investors”), whereby it issued 122,500,000 shares of common stock at $10.00 per share (“PIPE Shares”) for an aggregate purchase price of $1.225 billion (“PIPE Investment”), which closed simultaneously with the consummation of the Business Combination. Upon the Closing, the PIPE Shares were automatically converted into shares of SoFi Technologies common stock on a one-for-one basis.
Upon the Closing, holders of Social Finance common stock received shares of SoFi Technologies common stock in an amount determined by application of the exchange ratio of 1.7428 (“Exchange Ratio”), which was based on Social Finance’s implied price per share prior to the Business Combination. Additionally, holders of Social Finance preferred stock (with the exception of the Series 1 preferred stockholders) received shares of SoFi Technologies common stock in amounts determined by application of either the Exchange Ratio or a multiplier of the Exchange Ratio, as provided by the Agreement.
Acquisition of Golden Pacific Bancorp, Inc.
On February 2, 2022, we acquired Golden Pacific, pursuant to an Agreement and Plan of Merger dated as of March 8, 2021 by and among the Company, a wholly-owned subsidiary of the Company, and Golden Pacific. In the business combination, we acquired all of the outstanding equity interests in Golden Pacific for total cash purchase consideration of $22.3 million (the “Bank Merger”). The acquisition was not determined to be a significant acquisition. After closing the Bank Merger, we became a bank holding company and Golden Pacific began operating as SoFi Bank. We are duly registered as a bank holding company with the Federal Reserve. SoFi Bank is a national banking association whose primary federal regulator is the OCC. Deposit accounts of SoFi Bank are insured by the FDIC through the Deposit Insurance Fund to the fullest extent permitted by law.
The closing of the Bank Merger was subject to regulatory approval. On January 18, 2022, we received approval from the Federal Reserve of our application to become a bank holding company under the Bank Holding Company Act, and we received conditional approval from the OCC to close the Bank Merger. The OCC also approved our application to change the composition of Golden Pacific’s assets in connection with the Bank Merger. The OCC conditional approval imposed a number of conditions, including that SoFi Bank have initial paid-in capital of no less than $750 million and adhere to an operating agreement. Golden Pacific’s community bank business continues to operate as a division of SoFi Bank.
A portion of the total cash purchase consideration ($0.6 million) was held back by the Company to satisfy any indemnification or certain other obligations (“Holdback Amount”), as certain legal proceedings with which Golden Pacific is involved as a plaintiff were not resolved at the time the Bank Merger closed. During 2022, we incurred costs associated with the litigation involving Golden Pacific as a plaintiff in excess of the Holdback Amount. Therefore, none of the Holdback Amount will be released to the Golden Pacific shareholders. Additionally, we held back a $3.3 million payable to a dissenting Golden Pacific shareholder pending resolution of the shareholder’s dissenter’s rights appraisal claim. During the fourth quarter of 2023, the appraisal claim was settled and payment was released.
Acquisition of Technisys S.A.
On March 3, 2022, we acquired Technisys S.A., a Luxembourg société anonyme, (“Technisys”), pursuant to an Agreement and Plan of Merger dated as of February 19, 2022 and amended as of March 3, 2022, by and among the Company, Technisys, Atom New Delaware, Inc., a Delaware corporation and a wholly owned subsidiary of Atom, and Atom Merger Sub Corporation, a Delaware corporation and wholly owned subsidiary of SoFi Technologies (the “Technisys Merger”). In the business combination, we acquired all of the outstanding equity interests in Technisys for a preliminary purchase consideration of $915.4 million. During the third quarter of 2022, we finalized the closing net working capital calculation specified in the merger agreement, which resulted in a reduction to the equity consideration of 155,794 shares, representing an adjustment to the total purchase consideration of $1,665, and a corresponding reduction to the carrying value of recognized goodwill. The remaining 442,274 shares that were held in escrow associated with the working capital calculation were released to the former Technisys shareholders. The finalized closing net working capital calculation did not impact the estimated fair values of the assets acquired and liabilities assumed in conjunction with the transaction.
SoFi Technologies, Inc.
SoFi Technologies, Inc.
Notes to Consolidated Financial Statements (continued)
(In Thousands, Unless Otherwise Stated and Except for Share and Per Share Data)
The following table presents the components of the total purchase consideration to acquire Technisys as of December 31, 2022:
| | | | | |
Fair value of common stock issued(1) | $ | 873,377 | |
| Amounts payable to settle vested employee performance awards | 37,297 | |
Fair value of awards assumed(2) | 2,855 | |
| Settlement of pre-combination transactions between acquirer and acquiree | 235 | |
| Total purchase consideration | $ | 913,764 | |
___________________
(1) Reflects the shares of SoFi common stock issued in the acquisition of 81,700,318, multiplied by the closing stock price of SoFi common stock on the closing date of the Technisys Merger. Additionally, these shares are inclusive of 6,305,595 shares that were held in escrow.
(2) We contemporaneously converted outstanding performance awards into RSUs to acquire common stock of SoFi (“Replacement Awards”). The fair value of awards assumed in the purchase consideration was based on the closing stock price of SoFi common stock on the closing date of the Technisys Merger.
We settled vested employee performance awards, which were a component of the purchase consideration above, with payments during the years ended December 31, 20212023 and 2020, respectively, that were not consolidated as2022 of the corresponding balance sheet dates. As of December 31, 2021$19,656 and 2020, we had investments in 9 and 9 nonconsolidated personal loan VIEs,$17,641, respectively.
We did not provide financial support to any personal loan trusts beyond our initial equity investment during the years presented. We did not deconsolidate any personal loan VIEs during During the year ended December 31, 2021. We deconsolidated 3 VIEs2023, we released 6,259,736 escrow shares during the second and fourth quarters of 2023. The remaining 45,859 shares continue to be held in escrow pending resolution of outstanding indemnification claims by SoFi.
The following unaudited supplemental pro forma financial information presents the Company’s consolidated results of operations as if the business combination had occurred on January 1, 2020:
| | | | | | | | | | | | | | | | |
| | Year Ended December 31, |
| | 2022 | | 2021 | | |
| Total net revenue | | $ | 1,584,439 | | | $ | 1,055,219 | | | |
| Net loss | | (311,512) | | | (512,785) | | | |
The unaudited supplemental pro forma financial information is presented for comparative purposes only and is not necessarily indicative of the actual results of operations that would have been achieved, nor is it indicative of future results of operations. The unaudited supplemental pro forma financial information reflects pro forma adjustments that give effect to applying the Company’s accounting policies and certain events the Company believes to be directly attributable to the acquisition. The pro forma adjustments primarily include:
•incremental straight-line amortization expense associated with acquired intangible assets;
•an adjustment to reflect post-combination share-based compensation expense associated with the Replacement Awards as if the conversion had occurred on January 1, 2020;
•an adjustment to reflect acquisition-related costs for both parties as if they were incurred during the earliest period presented; and
•the related income tax effects, at the statutory tax rate applicable for each period, of the pro forma adjustments noted above.
The unaudited supplemental pro forma financial information does not give effect to any anticipated cost savings, operating efficiencies or other synergies that may be associated with the acquisition, or any estimated costs that have been or will be incurred by the Company to integrate the assets and operations of Technisys.
Acquisition of Wyndham Capital Mortgage
On April 3, 2023, we acquired all of the outstanding equity interests in Wyndham for cash consideration. With the acquisition of Wyndham, a fintech mortgage lender, we broadened our suite of home loan products and now manage the technology for a digitized mortgage experience. The acquisition is being accounted for as a business combination. The purchase consideration is being allocated to the tangible and intangible assets acquired and liabilities assumed based on the estimated fair values as of the acquisition date. The excess of the total purchase consideration over the fair value of the net assets acquired is allocated to goodwill, which is expected to be deductible for tax purposes. The fair value estimates are subject to change for up
SoFi Technologies, Inc.
SoFi Technologies, Inc.
Notes to Consolidated Financial Statements (continued)
(In Thousands, Unless Otherwise Stated and Except for Share and Per Share Data)
to one year endedafter the acquisition date as additional information becomes available. The acquisition was not determined to be a significant acquisition.
In each of our revenue arrangements, revenue is recognized when control of the promised goods or services is transferred to the customer in an amount that reflects our expected consideration in exchange for those goods or services.
Technology Products and Solutions
We earn fees for providing an integrated platform as a service for financial and non-financial institutions. Within our technology products and solutions fee arrangements, certain contracts contain a provision for a fixed, upfront implementation fee related to setup activities, which represents an advance payment for future technology platform services provided over the contract term. These implementation fees are recognized ratably over the contract life.
Commencing in March 2022 with the Technisys Merger, we earn subscription and service fees for providing software licenses and associated services, including implementation and maintenance. We charge a recurring subscription fee for the software license and related maintenance services. Other software-related services are billed on a periodic basis as the services are provided. Certain arrangements for software and related services contain a provision for a fixed upfront payment.
We recognize revenue related to software licenses at a point in time upon delivery of the license and the close of the user-acceptance testing period. When implementation services are distinct, we recognize revenue over time during the implementation period. We recognize maintenance services ratably over the contractual maintenance term. If a fixed upfront payment provides a material right to the customer, we recognize revenue associated with the material right over the period of benefit associated with the right to subscribe or renew a subscription, which is typically the product life.
We allocate fees charged for software and related services to our performance obligations on the basis of the relative standalone selling price. The standalone selling prices either represent the prices at which we separately sell each license or service or are estimated using available information, such as market conditions and internal pricing policies. The standalone selling price of the software license and maintenance are determined based on the complexity and size of the license.
Payments to customers: We may provide incentives to our technology platform customers, which may be payable up front or applied to future or past technology products and solutions fees. Evaluating whether such incentives are payments to a customer requires judgment. When we determine that an incentive is consideration payable to a customer, the incentive is recorded as a reduction of revenue. Incentives that represent consideration payable to a customer may also contain variable consideration. Therefore, such incentives are constraints on the revenue expected to be realized. Upfront customer incentives are recorded as prepaid assets and presented within other assets in the consolidated balance sheets, and are applied against revenue in the period such incentives are earned by the customer. Any incentive in excess of cumulative revenue is expensed as a contract cost.
Referrals
We earn specified referral fees in connection with certain referral activities we facilitate through our platform. In one type of referral arrangement, we refer end users through our platform to third-party enterprise partners. Our referral fee is calculated as either a fixed price per successful referral or a percentage of the transaction volume between the enterprise partners and referred consumers. In another type of referral arrangement, we earn referral fulfillment fees for providing pre-qualified borrower referrals to a third-party partner who separately contracts with a loan originator. Our referral fees are based on the referred loan amount, subject to a referral fulfillment fee penalty if a loan is determined to be ineligible and becomes a charged-off loan as defined in the contract. We recognize revenue for each originated loan, less the estimated referral fulfillment fee penalty. The estimated referral fulfillment fee penalty was immaterial as of December 31, 2020, which were originally consolidated in 2017.2023 and 2022.
Student LoansInterchange
We established 4earn interchange fees from debit and 4 student loan trusts duringcredit cardholder transactions conducted through payment networks. Interchange fees from cardholder transactions represent a percentage of the underlying transaction value and are recognized
SoFi Technologies, Inc.
SoFi Technologies, Inc.
Notes to Consolidated Financial Statements (continued)
(In Thousands, Unless Otherwise Stated and Except for Share and Per Share Data)
daily, concurrently with the transaction processing services provided to the cardholder. Interchange is presented net of cardholder rewards associated with card transactions.
Brokerage
We earn fees in connection with facilitating investment-related transactions through our platform, which we refer to as brokerage revenue. Our brokerage revenue performance obligation is generally completely satisfied upon the completion of an investment-related transaction. In general, we act as the agent in these arrangements as we do not oversee the execution of the transactions and ultimately lack the requisite control.
Disaggregated Revenue
The table below presents revenue from contracts with customers disaggregated by type of service, which best depicts how the revenue and cash flows are affected by economic factors, and by the reportable segment to which each revenue stream relates, as well as a reconciliation of total revenue from contracts with customers to total noninterest income. Revenue from contracts with customers is presented within noninterest income—technology products and solutions and noninterest income—other in the consolidated statements of operations and comprehensive loss. There were no revenues from contracts with customers attributable to our Lending segment for any of the years presented.
| | | | | | | | | | | | | | | | | |
| Year Ended December 31, |
| 2023 | | 2022 | | 2021 |
| Financial Services | | | | | |
| Referrals | $ | 38,443 | | | $ | 36,052 | | | $ | 15,750 | |
| Interchange | 35,247 | | | 17,391 | | | 10,642 | |
| Brokerage | 21,127 | | | 15,446 | | | 22,733 | |
Other(1) | 2,647 | | | 2,245 | | | 5,541 | |
| Total financial services | $ | 97,464 | | | $ | 71,134 | | | $ | 54,666 | |
Technology Platform(2) | | | | | |
| Technology services | 319,845 | | | 299,379 | | | 191,847 | |
Other(1) | 4,145 | | | 6,583 | | | 1,205 | |
| Total technology platform | 323,990 | | | 305,962 | | | 193,052 | |
| Total revenue from contracts with customers | 421,454 | | | 377,096 | | | 247,718 | |
| Other Sources of Revenue | | | | | |
| | | | | |
| | | | | |
| Loan origination, sales, and securitizations | 371,812 | | | 565,372 | | | 482,764 | |
| Servicing | 37,328 | | | 43,547 | | | (2,281) | |
| Other | 30,455 | | | 3,424 | | | 4,427 | |
| Total other sources of revenue | $ | 439,595 | | | $ | 612,343 | | | $ | 484,910 | |
| Total noninterest income | $ | 861,049 | | | $ | 989,439 | | | $ | 732,628 | |
_____________________(1) Financial Services includes revenues from enterprise services and equity capital markets services. Technology Platform includes revenues from software licenses and associated services, and payment network fees for serving as a transaction card program manager for enterprise customers that are the program marketers for separate card programs.
(2) Related to these technology products and solutions arrangements, we had deferred revenue of $5,718 and $10,028 as of December 31, 2023 and 2022, respectively, which are presented within accounts payable, accruals and other liabilities in the consolidated balance sheets. During the years ended December 31, 2023, 2022 and 2021, we recognized revenue of $8,327, $7,773 and 2020,$685, respectively, that were notassociated with deferred revenue within noninterest income—technology products and solutions in the consolidated asstatements of the corresponding balance sheet dates. operations and comprehensive loss.
Contract Balances
As of December 31, 20212023 and 2020,2022, accounts receivable, net associated with revenue from contracts with customers was $60,466 and $61,226, respectively, which were reported within other assets in the consolidated balance sheets.
SoFi Technologies, Inc.
SoFi Technologies, Inc.
Notes to Consolidated Financial Statements (continued)
(In Thousands, Unless Otherwise Stated and Except for Share and Per Share Data)
Note 4. Loans
As of December 31, 2023, our loan portfolio consisted of (i) loans held for sale, including personal loans and home loans, which are measured at fair value under the fair value option, (ii) loans held for investment, including student loans, which are measured at fair value under the fair value option, and (iii) loans held for investment, including senior secured loans, credit cards, and commercial and consumer banking loans, which are measured at amortized cost. Below is a disaggregated presentation of our loans, inclusive of fair market value adjustments and accrued interest income and net of the allowance for credit losses, as applicable:
| | | | | | | | | | | |
| December 31, |
| 2023 | | 2022 |
| Loans held for sale | | | |
Personal loans(1) | $ | 15,330,573 | | | $ | 8,610,434 | |
Student loans(2) | — | | | 4,877,177 | |
| Home loans | 66,198 | | | 69,463 | |
| Total loans held for sale, at fair value | 15,396,771 | | | 13,557,074 | |
Loans held for investment(3) | | | |
Student loans(4) | 6,725,484 | | | — | |
| Total loans held for investment, at fair value | 6,725,484 | | | — | |
| Senior secured loans | 446,463 | | | — | |
| Credit card | 272,628 | | | 209,164 | |
| Commercial and consumer banking: | | | |
| Commercial real estate | 106,326 | | | 88,652 | |
| Commercial and industrial | 6,075 | | | 7,179 | |
| Residential real estate and other consumer | 4,667 | | | 2,962 | |
| Total commercial and consumer banking | 117,068 | | | 98,793 | |
Total loans held for investment, at amortized cost(3) | 836,159 | | | 307,957 | |
| Total loans held for investment | 7,561,643 | | | 307,957 | |
| Total loans | $ | 22,958,414 | | | $ | 13,865,031 | |
_____________________
(1) Includes $502,757 and $663,004 of personal loans in consolidated VIEs as of December 31, 2023 and 2022, respectively.
(2) Includes $268,697 of student loans in consolidated VIEs as of December 31, 2022.
(3) See Note 1. Organization, Summary of Significant Accounting Policies and New Accounting Standards and Note 5. Allowance for Credit Losses for additional information on our loans at amortized cost as it pertains to the allowance for credit losses.
(4) As of December 31, 2023, includes $2,459,103 of student loans covered by financial guarantees, and $221,461 of student loans in consolidated VIEs.
SoFi Technologies, Inc.
SoFi Technologies, Inc.
Notes to Consolidated Financial Statements (continued)
(In Thousands, Unless Otherwise Stated and Except for Share and Per Share Data)
Loans Measured at Fair Value
The following table summarizes the aggregate fair value of our loans for which we had investmentselected the fair value option. See Note 15. Fair Value Measurements for the assumptions used in 24 and 20 nonconsolidated student loan VIEs, respectively.our fair value model.
We did not provide financial support to any student loan trusts beyond our initial equity investment | | | | | | | | | | | | | | | | | | | | | | | |
| Personal Loans | | Student Loans | | Home Loans | | Total |
| December 31, 2023 | | | | | | | |
| Unpaid principal | $ | 14,498,629 | | | $ | 6,445,586 | | | $ | 67,406 | | | $ | 21,011,621 | |
| Accumulated interest | 114,541 | | | 34,357 | | | 92 | | | 148,990 | |
| Cumulative fair value adjustments | 717,403 | | | 245,541 | | | (1,300) | | | 961,644 | |
Total fair value of loans(1) | $ | 15,330,573 | | | $ | 6,725,484 | | | $ | 66,198 | | | $ | 22,122,255 | |
| December 31, 2022 | | | | | | | |
| Unpaid principal | $ | 8,283,400 | | | $ | 4,794,517 | | | $ | 77,705 | | | $ | 13,155,622 | |
| Accumulated interest | 55,673 | | | 19,433 | | | 151 | | | 75,257 | |
| Cumulative fair value adjustments | 271,361 | | | 63,227 | | | (8,393) | | | 326,195 | |
Total fair value of loans(1) | $ | 8,610,434 | | | $ | 4,877,177 | | | $ | 69,463 | | | $ | 13,557,074 | |
_____________________(1) Each component of the fair value of loans is impacted by charge-offs during the years presented. We did not deconsolidate any student loan VIEs during the year ended December 31, 2021. We consolidated 1 VIE during the year ended December 31, 2020 that was also deconsolidated during the year.period. Our fair value assumption for annual default rate incorporates fair value markdowns on loans beginning when they are 10 days or more delinquent, with additional markdowns at 30, 60 and 90 days past due.
The following table presentssummarizes the aggregate outstandingfair value of asset-backed bondsloans 90 days or more delinquent. As delinquent personal loans and residual interests owned bystudent loans are charged off after 120 days of delinquency, amounts presented below represent the Company in nonconsolidated VIEs, which were included in our consolidated balance sheets.fair value of loans that are 90 to 120 days delinquent.
| | | | | | | | | | | |
| December 31, |
| 2021 | | 2020 |
| Personal loans | $ | 62,925 | | | $ | 71,115 | |
| Student loans | 311,763 | | | 425,820 | |
| Securitization investments | $ | 374,688 | | | $ | 496,935 | |
| | | | | | | | | | | | | | | | | | | | | | | |
| Personal Loans | | Student Loans | | Home Loans | | Total |
| December 31, 2023 | | | | | | | |
| Unpaid principal balance | $ | 81,591 | | | $ | 8,446 | | | $ | 495 | | | $ | 90,532 | |
| Accumulated interest | 4,023 | | | 187 | | | 6 | | | 4,216 | |
Cumulative fair value adjustments(1) | (70,191) | | | (5,021) | | | (248) | | | (75,460) | |
| Fair value of loans 90 days or more delinquent | $ | 15,423 | | | $ | 3,612 | | | $ | 253 | | | $ | 19,288 | |
| December 31, 2022 | | | | | | | |
| Unpaid principal balance | $ | 27,989 | | | $ | 6,435 | | | $ | — | | | $ | 34,424 | |
| Accumulated interest | 1,207 | | | 304 | | | — | | | 1,511 | |
Cumulative fair value adjustments(1) | (25,022) | | | (3,332) | | | — | | | (28,354) | |
| Fair value of loans 90 days or more delinquent | $ | 4,174 | | | $ | 3,407 | | | $ | — | | | $ | 7,581 | |
__________________
Note 7. Transfers of Financial Assets
We regularly transfer financial assets and account for such transfers as either sales or secured borrowings depending on the facts and circumstances.circumstances of the transfer. When a transfer of financial assets qualifies as a sale, in many instances we have continuedcontinuing involvement as the servicer of those financial assets. As we expect the benefits of servicing to be more than just adequate, we recognize a servicing asset. Further, in the case of securitization-related transfers that qualify as sales, we have additional continuedcontinuing involvement as an investor, albeit at insignificant levels relative to the expected gains and losses of the securitization. In instances where a transfer is accounted for as a secured borrowing, we perform servicing (but we do not recognize a servicing asset) and typically maintain a significant investment relative to the expected gains and losses of the securitization. In whole loan sales, we do not have a residual financial interest in the loans, nor do we have any other power over the loans that would constrain us from recognizing a sale. Additionally, we generally have no repurchase requirements related to transfers of personal loans, student loans and non-FNMAnon-GSE home loans other than standard origination representations and warranties, for which we record a liability based on expected repurchase obligations. For FNMAGSE home loans, we have customary FNMA
SoFi Technologies, Inc.
SoFi Technologies, Inc.
Notes to Consolidated Financial Statements (continued)
(In Thousands, Unless Otherwise Stated and Except for Share and Per Share Data)
GSE repurchase requirements, which do not constrain sale treatment but result in a liability for the expected repurchase requirement.
The following table summarizes our personal loan and student loan securitization transfers qualifying for sale accounting treatment. There were no loan securitization transfers qualifying for sale accounting treatment during the year ended December 31, 2022.
| | | | | | | | | | | | | |
| Year Ended December 31, |
| 2023 | | | | 2021 |
| Personal loans | | | | | |
| Fair value of consideration received: | | | | | |
| Cash | $ | 359,927 | | | | | $ | 1,050,062 | |
| Securitization investments | 18,985 | | | | | 55,491 | |
| | | | | |
| Servicing assets recognized | 15,975 | | | | | 6,003 | |
| Repurchase liabilities recognized | (113) | | | | | — | |
| Total consideration | 394,774 | | | | | 1,111,556 | |
| Aggregate unpaid principal balance and accrued interest of loans sold | 375,770 | | | | | 1,054,171 | |
| Gain from loan sales | $ | 19,004 | | | | | $ | 57,385 | |
| Student loans | | | | | |
| Fair value of consideration received: | | | | | |
| Cash | $ | — | | | | | $ | 1,187,714 | |
| Securitization investments | — | | | | | 62,783 | |
| | | | | |
| Servicing assets recognized | — | | | | | 36,948 | |
| Total consideration | — | | | | | 1,287,445 | |
| Aggregate unpaid principal balance and accrued interest of loans sold | — | | | | | 1,227,379 | |
| Gain from loan sales | $ | — | | | | | $ | 60,066 | |
Deconsolidation of debt reflects the impacts of previously consolidated VIEs that became deconsolidated during the period because we no longer hold a significant financial interest in the underlying securitization entity, which can fluctuate from period to period. Gains and losses on deconsolidations are presented within noninterest income—loan origination, sales, and securitizations in the consolidatedstatements of operations and comprehensive loss. During the year ended December 31, 2023, we had deconsolidation of debt on student loans of $100.3 million. During the year ended December 31, 2022, we had deconsolidation of debt on personal loans of $70.6 million and on student loans of $126.0 million. For all periods, the impact on earnings from these deconsolidations was immaterial.
SoFi Technologies, Inc.
SoFi Technologies, Inc.
Notes to Consolidated Financial Statements (continued)
(In Thousands, Unless Otherwise Stated and Except for Share and Per Share Data)
The following table summarizes theour whole loan securitization transfers qualifyingsales:
| | | | | | | | | | | | | | | | | |
| Year Ended December 31, |
| 2023 | | 2022 | | 2021 |
| Personal loans | | | | | |
| Fair value of consideration received: | | | | | |
| Cash | $ | 567,904 | | | $ | 3,016,740 | | | $ | 3,373,655 | |
| Servicing assets recognized | 30,168 | | | 21,925 | | | 21,811 | |
| Repurchase liabilities recognized | (2,069) | | | (7,351) | | | (8,168) | |
| Total consideration received | 596,003 | | | 3,031,314 | | | 3,387,298 | |
| Aggregate unpaid principal balance and accrued interest of loans sold | 567,003 | | | 2,924,567 | | | 3,253,645 | |
| Realized gain | $ | 29,000 | | | $ | 106,747 | | | $ | 133,653 | |
| Student loans | | | | | |
| Fair value of consideration received: | | | | | |
| Cash | $ | 98,624 | | | $ | 883,859 | | | $ | 1,676,892 | |
| Servicing assets recognized | 2,792 | | | 9,275 | | | 15,526 | |
| Repurchase liabilities recognized | (16) | | | (134) | | | (300) | |
| Total consideration | 101,400 | | | 893,000 | | | 1,692,118 | |
| Aggregate unpaid principal balance and accrued interest of loans sold | 99,916 | | | 881,922 | | | 1,635,280 | |
| Realized gain | $ | 1,484 | | | $ | 11,078 | | | $ | 56,838 | |
| Home loans | | | | | |
| Fair value of consideration received: | | | | | |
| Cash | $ | 1,022,600 | | | $ | 1,057,596 | | | $ | 2,989,813 | |
| Servicing assets recognized | 10,184 | | | 13,926 | | | 31,294 | |
| Repurchase liabilities recognized | (1,765) | | | (1,158) | | | (3,288) | |
| Total consideration | 1,031,019 | | | 1,070,364 | | | 3,017,819 | |
| Aggregate unpaid principal balance and accrued interest of loans sold | 1,029,623 | | | 1,095,882 | | | 2,935,343 | |
| Realized gain (loss) | $ | 1,396 | | | $ | (25,518) | | | $ | 82,476 | |
For certain transferred loans that qualified for sale accounting treatment forand are, therefore, off-balance sheet, we have continuing involvement through our servicing agreements. For such loans, our exposure to loss is generally limited to the years indicated. There were no homeextent we would be required to repurchase such a loan securitization transfers qualifying for sale accounting treatment during anydue to a breach of representations and warranties associated with the years presented.loan transfer or servicing contract.
| | | | | | | | | | | | | | | | | |
| Year Ended December 31, |
| 2021 | | 2020 | | 2019 |
| Student loans | | | | | |
| Fair value of consideration received and obligations settled: | | | | | |
| Cash | $ | 1,187,714 | | | $ | 2,015,357 | | | $ | 4,542,431 | |
| Securitization investments | 62,783 | | | 130,807 | | | 239,698 | |
Deconsolidation of debt(1) | — | | | 458,375 | | | — | |
| Servicing assets recognized | 36,948 | | | 19,903 | | | 42,826 | |
| Total consideration | 1,287,445 | | | 2,624,442 | | | 4,824,955 | |
| Aggregate unpaid principal balance and accrued interest of loans sold | 1,227,379 | | | 2,540,052 | | | 4,677,471 | |
Gain from loan sales(1) | $ | 60,066 | | | $ | 84,390 | | | $ | 147,484 | |
| | | | | |
| | | | | |
| | | | | |
| | | | | |
| | | | | |
| | | | | |
| | | | | |
| | | | | |
| Personal loans | | | | | |
| Fair value of consideration received and obligations settled: | | | | | |
| Cash | $ | 1,050,062 | | | $ | 316,503 | | | $ | 397,962 | |
| Securitization investments | 55,491 | | | 20,961 | | | 111,556 | |
Deconsolidation of debt(1) | — | | | 414,261 | | | 1,464,920 | |
| Servicing assets recognized | 6,003 | | | 2,086 | | | 11,229 | |
| Total consideration | 1,111,556 | | | 753,811 | | | 1,985,667 | |
| Aggregate unpaid principal balance and accrued interest of loans sold | 1,054,171 | | | 708,346 | | | 1,906,757 | |
Gain from loan sales(1) | $ | 57,385 | | | $ | 45,465 | | | $ | 78,910 | |
| | | | | | | | | | | | | | | | | | | | | | | |
| Personal Loans | | Student Loans | | Home Loans | | Total |
| December 31, 2023 | | | | | | | |
| | | | | | | |
| Loans in delinquency (30+ days past due) | $ | 52,813 | | | $ | 60,989 | | | $ | 24,193 | | | $ | 137,995 | |
| Total loans in delinquency | 90,582 | | | 137,243 | | | 24,193 | | | 252,018 | |
Total transferred loans serviced(1) | 2,223,785 | | | 6,148,800 | | | 5,592,793 | | | 13,965,378 | |
| December 31, 2022 | | | | | | | |
| | | | | | | |
| Loans in delinquency (30+ days past due) | $ | 64,654 | | | $ | 46,986 | | | $ | 16,510 | | | $ | 128,150 | |
| Total loans in delinquency | 108,991 | | | 115,818 | | | 16,510 | | | 241,319 | |
Total transferred loans serviced(1) | 2,995,601 | | | 7,586,031 | | | 5,134,306 | | | 15,715,938 | |
_____________________(1)Deconsolidation of debt reflects the impacts of previously consolidated VIEs that became deconsolidated during the year because we no longer held a significant financial interest in the underlying securitization entity, which can fluctuate from period to period. See Note 6 for further discussion of deconsolidations. For the year ended December 31, 2020, the gains from sales excluded losses from deconsolidations on student loans and personal loans of $8,601 and $6,098, respectively. For the year ended December 31, 2019, the gains from sales excluded losses from deconsolidations on personal loans of $38,741. Losses on deconsolidations are presented within noninterest income—securitizations in the consolidated statements of operations and comprehensive income (loss).
SoFi Technologies, Inc.
SoFi Technologies, Inc.
Notes to Consolidated Financial Statements (continued)
(In Thousands, Unless Otherwise Stated and Except for Share and Per Share Data)
(1)Total transferred loans serviced includes loans in delinquency, as well as loans in repayment, loans in-school/grace period/deferment (related to student loans), and loans in forbearance. The following table summarizesvast majority of total transferred loans serviced represent loans in repayment as of the whole loan sales for the years indicated:
| | | | | | | | | | | | | | | | | |
| Year Ended December 31, |
| 2021 | | 2020 | | 2019 |
| Student loans | | | | | |
| Fair value of consideration received: | | | | | |
| Cash | $ | 1,676,892 | | | $ | 2,596,719 | | | $ | 1,399,921 | |
| Servicing assets recognized | 15,526 | | | 25,734 | | | 21,145 | |
| Repurchase liabilities recognized | (300) | | | (510) | | | (314) | |
| Total consideration | 1,692,118 | | | 2,621,943 | | | 1,420,752 | |
| Aggregate unpaid principal balance and accrued interest of loans sold | 1,635,280 | | | 2,503,821 | | | 1,389,986 | |
| Gain from loan sales | $ | 56,838 | | | $ | 118,122 | | | $ | 30,766 | |
| Home loans | | | | | |
| Fair value of consideration received: | | | | | |
| Cash | $ | 2,989,813 | | | $ | 2,173,709 | | | $ | 733,860 | |
| Servicing assets recognized | 31,294 | | | 20,440 | | | 5,724 | |
| Repurchase liabilities recognized | (3,288) | | | (3,034) | | | (1,720) | |
| Total consideration | 3,017,819 | | | 2,191,115 | | | 737,864 | |
| Aggregate unpaid principal balance and accrued interest of loans sold | 2,935,343 | | | 2,101,895 | | | 726,379 | |
| Gain from loan sales | $ | 82,476 | | | $ | 89,220 | | | $ | 11,485 | |
| Personal loans | | | | | |
| Fair value of consideration received: | | | | | |
| Cash | $ | 3,373,655 | | | $ | 1,285,689 | | | $ | 2,316,771 | |
| Servicing assets recognized | 21,811 | | | 8,429 | | | 31,138 | |
| Repurchase liabilities recognized | (8,168) | | | (3,535) | | | (2,948) | |
| Total consideration received | 3,387,298 | | | 1,290,583 | | | 2,344,961 | |
| Aggregate unpaid principal balance and accrued interest of loans sold | 3,253,645 | | | 1,238,474 | | | 2,257,223 | |
| Gain from loan sales | $ | 133,653 | | | $ | 52,109 | | | $ | 87,738 | |
The following table presents additional information as of the dates indicated about the unpaid principal balances ofservicing cash flows received and net charge-offs related to loans originated by us and subsequently transferred, loans that are not recorded in our consolidated balance sheets, but with which we have a continuing involvement throughinvolvement:
| | | | | | | | | | | | | | | | | |
| Year Ended December 31, |
| 2023 | | 2022 | | 2021 |
| Personal loans | | | | | |
| Servicing fees collected from transferred loans | $ | 20,577 | | | $ | 33,051 | | | $ | 34,421 | |
| Charge-offs, net of recoveries, of transferred loans | 167,643 | | | 93,095 | | | 102,217 | |
| Student loans | | | | | |
| Servicing fees collected from transferred loans | 27,401 | | | 35,203 | | | 46,657 | |
| Charge-offs, net of recoveries, of transferred loans | 41,642 | | | 34,136 | | | 24,675 | |
| Home loans | | | | | |
| Servicing fees collected from transferred loans | 14,530 | | | 12,893 | | | 8,749 | |
| | | | | |
| Total | | | | | |
| Servicing fees collected from transferred loans | $ | 62,508 | | | $ | 81,147 | | | $ | 89,827 | |
| Charge-offs, net of recoveries, of transferred loans | 209,285 | | | 127,231 | | | 126,892 | |
Loans Measured at Amortized Cost
Loan Portfolio Composition and Aging
The following table presents the amortized cost basis of our servicing agreements:credit card and commercial and consumer banking portfolios (excluding accrued interest and before the allowance for credit losses) by either current status or delinquency status:
| | | | | | | | | | | | | | | | | | | | | | | |
| Student Loans | | Home Loans | | Personal Loans | | Total |
| December 31, 2021 | | | | | | | |
| Loans in repayment | $ | 9,852,957 | | | $ | 4,575,001 | | | $ | 5,138,299 | | | $ | 19,566,257 | |
| Loans in-school/grace/deferment | 37,949 | | | — | | | — | | | 37,949 | |
| Loans in forbearance | 44,833 | | | 40,353 | | | 1,120 | | | 86,306 | |
| Loans in delinquency | 112,885 | | | 7,465 | | | 75,275 | | | 195,625 | |
| Total loans serviced | $ | 10,048,624 | | | $ | 4,622,819 | | | $ | 5,214,694 | | | $ | 19,886,137 | |
| December 31, 2020 | | | | | | | |
| Loans in repayment | $ | 12,059,702 | | | $ | 2,629,015 | | | $ | 4,796,404 | | | $ | 19,485,121 | |
| Loans in-school/grace/deferment | 26,158 | | | — | | | — | | | 26,158 | |
| Loans in forbearance | 275,659 | | | 46,357 | | | 35,677 | | | 357,693 | |
| Loans in delinquency | 91,424 | | | 8,493 | | | 110,640 | | | 210,557 | |
| Total loans serviced | $ | 12,452,943 | | | $ | 2,683,865 | | | $ | 4,942,721 | | | $ | 20,079,529 | |
| | | | | | | | | | | | | | | | | | | | | | | | | | | | | | | | | | | |
| | | Delinquent Loans | | |
| Current | | 30–59 Days | | 60–89 Days | | ≥ 90 Days(1) | | Total Delinquent Loans | | Total Loans(2) |
| December 31, 2023 | | | | | | | | | | | |
| Senior secured loans | $ | 445,733 | | | $ | — | | | $ | — | | | $ | — | | | $ | — | | | $ | 445,733 | |
| Credit card | 297,612 | | | 5,451 | | | 4,829 | | | 11,802 | | | 22,082 | | | 319,694 | |
| Commercial and consumer banking: | | | | | | | | | | | |
| Commercial real estate | 107,757 | | | — | | | — | | | — | | | — | | | 107,757 | |
| Commercial and industrial | 6,108 | | | 1 | | | — | | | 439 | | | 440 | | | 6,548 | |
Residential real estate and other consumer(3) | 4,658 | | | — | | | — | | | — | | | — | | | 4,658 | |
| Total commercial and consumer banking | 118,523 | | | 1 | | | — | | | 439 | | | 440 | | | 118,963 | |
| Total loans | $ | 861,868 | | | $ | 5,452 | | | $ | 4,829 | | | $ | 12,241 | | | $ | 22,522 | | | $ | 884,390 | |
| December 31, 2022 | | | | | | | | | | | |
| Credit card | $ | 225,165 | | | $ | 4,670 | | | $ | 3,626 | | | $ | 10,498 | | | $ | 18,794 | | | $ | 243,959 | |
| Commercial and consumer banking: | | | | | | | | | | | |
| Commercial real estate | 89,544 | | | — | | | — | | | — | | | — | | | 89,544 | |
| Commercial and industrial | 7,636 | | | — | | | 1 | | | — | | | 1 | | | 7,637 | |
Residential real estate and other consumer(3) | 2,966 | | | — | | | — | | | — | | | — | | | 2,966 | |
| Total commercial and consumer banking | 100,146 | | | — | | | 1 | | | — | | | 1 | | | 100,147 | |
| Total loans | $ | 325,311 | | | $ | 4,670 | | | $ | 3,627 | | | $ | 10,498 | | | $ | 18,795 | | | $ | 344,106 | |
_____________________(1)All of the credit cards ≥ 90 days past due continued to accrue interest. As of the dates indicated, there were no credit cards on nonaccrual status. As of the dates indicated, commercial and consumer banking loans on nonaccrual status were immaterial.
SoFi Technologies, Inc.
SoFi Technologies, Inc.
Notes to Consolidated Financial Statements (continued)
(In Thousands, Unless Otherwise Stated and Except for Share and Per Share Data)
(2)For credit card, the balance is presented before allowance for credit losses of $52,385 and $39,110 as of December 31, 2023 and December 31, 2022, respectively, and accrued interest of $5,288 and $4,315, respectively. For senior secured loans, the balance is presented before accrued interest of $730 as of December 31, 2023. For commercial and consumer banking, the balance is presented before allowance for credit losses of $2,310 and $1,678, as of December 31, 2023 and December 31, 2022, respectively, and accrued interest of $415 and $324, respectively.
(3)Includes residential real estate loans originated by Golden Pacific for which we did not elect the fair value option.
Credit Quality Indicators
Credit Card
The following table presents the amortized cost basis of our credit card portfolio (excluding accrued interest and before the allowance for credit losses) based on FICO scores, which are obtained at origination of the account and are refreshed monthly thereafter. The pools estimate the likelihood of borrowers with similar FICO scores to pay credit obligations based on aggregate credit performance data.
| | | | | | | | | | | | | | |
| | December 31, |
| FICO | | 2023 | | 2022 |
| ≥ 800 | | $ | 29,269 | | | $ | 14,421 | |
| 780 – 799 | | 19,350 | | | 11,327 | |
| 760 – 779 | | 20,740 | | | 12,179 | |
| 740 – 759 | | 23,361 | | | 14,501 | |
| 720 – 739 | | 28,621 | | | 19,343 | |
| 700 – 719 | | 35,528 | | | 26,239 | |
| 680 – 699 | | 38,289 | | | 31,543 | |
| 660 – 679 | | 35,443 | | | 31,958 | |
| 640 – 659 | | 25,836 | | | 25,959 | |
| 620 – 639 | | 15,569 | | | 15,566 | |
| 600 – 619 | | 10,063 | | | 8,968 | |
| ≤ 599 | | 37,625 | | | 31,955 | |
| Total credit card | | $ | 319,694 | | | $ | 243,959 | |
Commercial and Consumer Banking
We analyze loans in our commercial and consumer banking portfolio by classification based on their associated credit risk, and perform an analysis on an ongoing basis as new information is obtained. Risk rating classifications are further described below. Loans with a lower expectation of credit losses are classified as Pass, while loans with a higher expectation of credit losses are classified as Substandard.
•Pass — Loans that management believes will fully repay in accordance with the contractual loan terms.
•Watch — Loans that management believes will fully repay in accordance with the contractual loan terms, but for which certain credit attributes have changed from origination and warrant further monitoring.
•Special mention — Loans with a potential weakness or weaknesses that deserves management’s close attention. If left uncorrected, the potential weaknesses may result in deterioration of the repayment prospects for the loan or our credit position at some future date.
•Substandard — Loans that are inadequately protected by the current net worth and paying capacity of the obligor or of the collateral pledged, if any. Loans so classified have a well-defined weakness or weaknesses that jeopardize the full repayment. They are characterized by the distinct possibility that we will sustain some loss if the deficiencies are not corrected.
SoFi Technologies, Inc.
SoFi Technologies, Inc.
Notes to Consolidated Financial Statements (continued)
(In Thousands, Unless Otherwise Stated and Except for Share and Per Share Data)
The following table presents additional information about the servicing cash flows received and net charge-offs related to transferred loans with which we have a continuing involvement during the years indicated:
| | | | | | | | | | | | | | | | | |
| Year Ended December 31, |
| 2021 | | 2020 | | 2019 |
| Student loans | | | | | |
| Servicing fees collected | $ | 46,657 | | | $ | 50,794 | | | $ | 47,038 | |
Charge-offs, net of recoveries(1) | $ | 24,675 | | | $ | 16,999 | | | $ | 27,740 | |
| Home Loans | | | | | |
| Servicing fees collected | 8,749 | | | 4,499 | | | 2,635 | |
| Charge-offs, net of recoveries | — | | | — | | | — | |
| Personal Loans | | | | | |
| Servicing fees collected | 34,421 | | | 45,574 | | | 31,268 | |
Charge-offs, net of recoveries(1) | 102,276 | | | 197,927 | | | 233,628 | |
| Total | | | | | |
| Servicing fees collected | $ | 89,827 | | | $ | 100,867 | | | $ | 80,941 | |
Charge-offs, net of recoveries(1) | $ | 126,951 | | | $ | 214,926 | | | $ | 261,368 | |
_____________________
(1)Student loan and personal loan charge-offs, net of recoveries, are impacted by the timing of charge-off sales performed on behalf of the purchasersamortized cost basis of our loans, which lowercommercial and consumer banking portfolio (excluding accrued interest and before the net amount disclosed. For both loan products, charge-off sales were meaningfully higher in 2020 relative to 2021.allowance for credit losses) by origination year and credit quality indicator:
| | | | | | | | | | | | | | | | | | | | | | | | | | | | | | | | | | | | | | | | | | | | | | | | | | |
| | Term Loans by Origination Year | | |
| December 31, 2023 | | 2023 | | 2022 | | 2021 | | 2020 | | 2019 | | Prior | | Total Term Loans | | Revolving Loans |
Commercial real estate | | | | | | | | | | | | | | | | |
| Pass | | $ | 23,200 | | | $ | 29,761 | | | $ | 5,636 | | | $ | 4,550 | | | $ | 9,332 | | | $ | 17,316 | | | $ | 89,795 | | | $ | 186 | |
| Watch | | 1,234 | | | 8,691 | | | 1,648 | | | — | | | 215 | | | 2,749 | | | 14,537 | | | — | |
| Special mention | | — | | | — | | | — | | | — | | | — | | | 1,703 | | | 1,703 | | | — | |
| Substandard | | — | | | — | | | — | | | — | | | — | | | 1,536 | | | 1,536 | | | — | |
| Total commercial real estate | | $ | 24,434 | | | $ | 38,452 | | | $ | 7,284 | | | $ | 4,550 | | | $ | 9,547 | | | $ | 23,304 | | | $ | 107,571 | | | $ | 186 | |
| Commercial and industrial | | | | | | | | | | | | | | | | |
| Pass | | $ | 54 | | | $ | — | | | $ | — | | | $ | 63 | | | $ | 96 | | | $ | 4,941 | | | $ | 5,154 | | | $ | 299 | |
| Watch | | 46 | | | — | | | — | | | — | | | 16 | | | 3 | | | 65 | | | — | |
| Substandard | | — | | | — | | | — | | | — | | | — | | | 1,030 | | | 1,030 | | | — | |
| Total commercial and industrial | | $ | 100 | | | $ | — | | | $ | — | | | $ | 63 | | | $ | 112 | | | $ | 5,974 | | | $ | 6,249 | | | $ | 299 | |
| Residential real estate and other consumer | | | | | | | | | | | | | | | | |
| Pass | | $ | 1,845 | | | $ | — | | | $ | — | | | $ | — | | | $ | — | | | $ | 2,585 | | | $ | 4,430 | | | $ | 188 | |
| Watch | | — | | | — | | | — | | | — | | | — | | | 40 | | | 40 | | | — | |
| Total residential real estate and other consumer | | $ | 1,845 | | | $ | — | | | $ | — | | | $ | — | | | $ | — | | | $ | 2,625 | | | $ | 4,470 | | | $ | 188 | |
Total commercial and consumer banking | | $ | 26,379 | | | $ | 38,452 | | | $ | 7,284 | | | $ | 4,613 | | | $ | 9,659 | | | $ | 31,903 | | | $ | 118,290 | | | $ | 673 | |
Note 8.5. Allowance for Credit Losses We measure ourOur allowance for credit losses on accounts receivable, which primarily relates to Galileo, and on loans measured at amortized cost,represents our current estimate of expected credit losses over the remaining contractual life of certain financial assets, including credit cardcards as well as commercial and consumer banking loans under ASC 326.acquired in the Bank Merger, which relate to our Financial Services segment, and accounts receivables primarily related to our Technology Platform segment. Given our methods of collecting funds on servicing receivables, our historical experience of infrequent write offs, and that we have not observed meaningful changes in our counterparties’ abilities to pay, we determined that the future exposure to credit losses on servicing related receivables was immaterial.
In estimating expected credit losses for credit cards, we segment loans based on credit quality indicators and reassess our pools periodically to confirm that all loans within each pool continue to share similar risk characteristics. We establish an allowance within each pool utilizing a proprietary risk model that relies on assumptions such as average annual percentage rate, payment rate, utilization, delinquency status and default probability. The following table summarizesmodel may then be adjusted for current conditions and reasonable and supportable forecasts of future conditions, including economic conditions. We apply the activity inaforementioned assumptions to the drawn balance of credit cards within each pool to estimate the lifetime expected credit losses within each pool, which are then aggregated to determine the allowance for credit losses.
We evaluate whether to include qualitative reserves to cover losses onthat are expected but may not be adequately represented in the quantitative methods or the economic assumptions. The qualitative reserves address possible limitations within the models, such as external conditions including regulatory requirements, emerging portfolio trends, the nature and size of the portfolio, portfolio concentrations, the volume and severity of past due accounts, receivable andor management risk actions. When a credit card loans duringbalance is charged off, we record a reduction to the years indicated:
| | | | | | | | | | | | | |
| Accounts Receivable(1) | | Credit Card Loans(2) | | |
| Balance at January 1, 2020 | $ | — | | | $ | — | | | |
Provision for credit losses(3) | 766 | | | 219 | | | |
| Write-offs charged against the allowance | (204) | | | — | | | |
| Balance at December 31, 2020 | $ | 562 | | | $ | 219 | | | |
Provision for credit losses(3) | 3,043 | | | 7,573 | | | |
Write-offs charged against the allowance(4) | (1,313) | | | (755) | | | |
| Balance at December 31, 2021 | $ | 2,292 | | | $ | 7,037 | | | |
_____________________(1)Accounts receivable balances, net of allowance for credit losses, are presented within other assets inand the consolidated balance sheets. We established an allowance for credit losses on accounts receivable subsequent to our acquisition of Galileo in the second quarter of 2020. Certain of our historical accounts receivable balances did not have any write-offs.
(2)Credit card loans measured at amortized cost, net of allowance for credit losses, are presented within loans in the consolidated balance sheets. We launched the SoFi Credit Card in the third quarter of 2020, which was expanded to a broader market in the fourth quarter of 2020.
(3)Provision for credit losses on accounts receivable and credit card loans are presented within noninterest expense—general and administrative and noninterest expense—provision for credit losses, respectively, in the consolidated statements of operations and comprehensive income (loss). There were no recoveries of credit card losses during the years ended December 31, 2021 and 2020.
(4)The increase in accounts receivable write-offs charged against the allowance during the year ended December 31, 2021 was primarily attributable to three accounts that were deemed uncollectible.balance.
SoFi Technologies, Inc.
SoFi Technologies, Inc.
Notes to Consolidated Financial Statements (continued)
(In Thousands, Unless Otherwise Stated and Except for Share and Per Share Data)
Note 9. Fair Value Measurements
The following tables summarize, by level within the fair value hierarchy, the carrying amountstable presents changes in our allowance for credit losses:
| | | | | | | | | | | | | | | | | |
| Credit Card(1) | | Commercial and Consumer Banking(1) | | Accounts Receivable(1) |
| Balance at January 1, 2022 | $ | 7,037 | | | $ | — | | | $ | 2,292 | |
Provision for credit losses(2) | 53,030 | | | 1,302 | | | 586 | |
Allowance for PCD loans(3) | — | | | 382 | | | — | |
| Write-offs charged against the allowance | (20,957) | | | (6) | | | (93) | |
| Balance at December 31, 2022 | $ | 39,110 | | | $ | 1,678 | | | $ | 2,785 | |
Provision for credit losses(2) | 54,267 | | | 678 | | | 773 | |
| Write-offs charged against the allowance | (40,992) | | | (46) | | | (1,721) | |
| Balance at December 31, 2023 | $ | 52,385 | | | $ | 2,310 | | | $ | 1,837 | |
_____________________(1)Credit cards and estimated fair values of our assetscommercial and liabilities (i)consumer banking loans measured at fair value on a recurring basis, (ii) measured at fair value on a nonrecurring basis, or (iii) disclosed but not carried at fair value amortized cost, net of allowance for credit losses, are presented within loans held for investment in the consolidated balance sheetssheets. Accounts receivable balances, net of allowance for credit losses, are presented within other assets in the consolidated balance sheets.
(2)The provision for credit losses on credit cards and commercial and consumer banking loans is presented within noninterest expense—provision for credit losses in the consolidated statements of operations and comprehensive loss. During the year ended December 31, 2023, recoveries of amounts previously reserved related to credit cards were $2,895, and immaterial during the year ended December 31, 2022. There were immaterial recoveries of amounts previously reserved related to commercial and consumer banking loans during the years ended December 31, 2023 and 2022. The provision for credit losses on accounts receivable is presented within noninterest expense—general and administrative in the consolidated statements of operations and comprehensive loss. During the years ended December 31, 2023 and 2022, recoveries of amounts previously reserved related to accounts receivable were $1,252 and $2,912, respectively.
(3)In connection with the Bank Merger, we obtained PCD loans, for which we measured an allowance, with a corresponding increase to the amortized cost basis as of the dates presented.
| | | | | | | | | | | | | | | | | | | | | | | | | | | | | |
| December 31, 2021 |
| | | Fair Value |
| Carrying Value | | Level 1 | | Level 2 | | Level 3 | | Total |
| Assets | | | | | | | | | |
Cash and cash equivalents(1) | $ | 494,711 | | | $ | 494,711 | | | $ | — | | | $ | — | | | $ | 494,711 | |
Restricted cash and restricted cash equivalents(1) | 273,726 | | | 273,726 | | | — | | | — | | | 273,726 | |
Investments in AFS debt securities(2)(4) | 194,907 | | | 129,835 | | | 65,072 | | | — | | | 194,907 | |
Student loans(2) | 3,450,837 | | | — | | | — | | | 3,450,837 | | | 3,450,837 | |
Home loans(2) | 212,709 | | | — | | | — | | | 212,709 | | | 212,709 | |
Personal loans(2) | 2,289,426 | | | — | | | — | | | 2,289,426 | | | 2,289,426 | |
Credit card loans(1) | 115,912 | | | — | | | — | | | 118,412 | | | 118,412 | |
| | | | | | | | | |
Servicing rights(2) | 168,259 | | | — | | | — | | | 168,259 | | | 168,259 | |
Asset-backed bonds(2)(5) | 253,669 | | | — | | | 253,669 | | | — | | | 253,669 | |
Residual investments(2)(5) | 121,019 | | | — | | | — | | | 121,019 | | | 121,019 | |
Non-securitization investments – ETFs(2)(6) | 1,486 | | | 1,486 | | | — | | | — | | | 1,486 | |
Non-securitization investments – other(3) | 6,054 | | | — | | | — | | | 6,054 | | | 6,054 | |
Third party warrants(2)(7) | 1,369 | | | — | | | — | | | 1,369 | | | 1,369 | |
Derivative assets(2)(8)(9) | 5,444 | | | — | | | 5,444 | | | — | | | 5,444 | |
Purchase price earn-out(2)(10) | 4,272 | | | — | | | — | | | 4,272 | | | 4,272 | |
Interest rate lock commitments(2)(11) | 3,759 | | | — | | | — | | | 3,759 | | | 3,759 | |
Student loan commitments(2)(11) | 2,220 | | | — | | | — | | | 2,220 | | | 2,220 | |
Interest rate caps(2)(9) | 493 | | | — | | | 493 | | | — | | | 493 | |
| Total assets | $ | 7,600,272 | | | $ | 899,758 | | | $ | 324,678 | | | $ | 6,378,336 | | | $ | 7,602,772 | |
| Liabilities | | | | | | | | | |
Debt(1) | $ | 3,947,983 | | | $ | 1,240,560 | | | $ | 2,807,253 | | | $ | — | | | $ | 4,047,813 | |
Residual interests classified as debt(2) | 93,682 | | | — | | | — | | | 93,682 | | | 93,682 | |
Derivative liabilities(2)(8)(9) | 864 | | | 196 | | | 668 | | | — | | | 864 | |
| | | | | | | | | |
| Total liabilities | $ | 4,042,529 | | | $ | 1,240,756 | | | $ | 2,807,921 | | | $ | 93,682 | | | $ | 4,142,359 | |
SoFi Technologies, Inc.
SoFi Technologies, Inc.
Notes to Consolidated Financial Statements (continued)
(In Thousands, Unless Otherwise Stated and Except for Share and Per Share Data)
| | | | | | | | | | | | | | | | | | | | | | | | | | | | | |
| December 31, 2020 |
| | | Fair Value |
| Carrying Value | | Level 1 | | Level 2 | | Level 3 | | Total |
| Assets | | | | | | | | | |
Cash and cash equivalents(1) | $ | 872,582 | | | $ | 872,582 | | | $ | — | | | $ | — | | | $ | 872,582 | |
Restricted cash and restricted cash equivalents(1) | 450,846 | | | 450,846 | | | — | | | — | | | 450,846 | |
Student loans(2) | 2,866,459 | | | — | | | — | | | 2,866,459 | | | 2,866,459 | |
Home loans(2) | 179,689 | | | — | | | — | | | 179,689 | | | 179,689 | |
Personal loans(2) | 1,812,920 | | | — | | | — | | | 1,812,920 | | | 1,812,920 | |
Credit card loans(1) | 3,723 | | | — | | | — | | | 3,723 | | | 3,723 | |
Commercial loan(1) | 16,512 | | | — | | | — | | | 16,512 | | | 16,512 | |
Servicing rights(2) | 149,597 | | | — | | | — | | | 149,597 | | | 149,597 | |
Asset-backed bonds(2)(5) | 357,411 | | | — | | | 357,411 | | | — | | | 357,411 | |
Residual investments(2)(5) | 139,524 | | | — | | | — | | | 139,524 | | | 139,524 | |
Non-securitization investments – ETFs(2)(6) | 6,850 | | | 6,850 | | | — | | | — | | | 6,850 | |
Non-securitization investments – other(3) | 1,147 | | | — | | | — | | | 1,147 | | | 1,147 | |
Interest rate lock commitments(2)(11) | 15,620 | | | — | | | — | | | 15,620 | | | 15,620 | |
| Total assets | $ | 6,872,880 | | | $ | 1,330,278 | | | $ | 357,411 | | | $ | 5,185,191 | | | $ | 6,872,880 | |
| Liabilities | | | | | | | | | |
Debt(1) | $ | 4,798,925 | | | $ | — | | | $ | 4,851,658 | | | $ | — | | | $ | 4,851,658 | |
Residual interests classified as debt(2) | 118,298 | | | — | | | — | | | 118,298 | | | 118,298 | |
Warrant liabilities – Series H warrants(2)(12) | 39,959 | | | — | | | — | | | 39,959 | | | 39,959 | |
Derivative liabilities(2)(8)(9) | 2,955 | | | 2,008 | | | 947 | | | — | | | 2,955 | |
ETF short positions(2)(6) | 5,241 | | | 5,241 | | | — | | | — | | | 5,241 | |
| Total liabilities | $ | 4,965,378 | | | $ | 7,249 | | | $ | 4,852,605 | | | $ | 158,257 | | | $ | 5,018,111 | |
Note 6. Investment Securities Investments in AFS Debt Securities
The following table presents our investments in AFS debt securities:
| | | | | | | | | | | | | | | | | | | | | | | | | | | | | | | | |
| | Amortized Cost | | Accrued Interest | | Gross Unrealized Gains | | Gross Unrealized Losses(1) | | Fair Value |
| December 31, 2023 | | | | | | | | | | |
| U.S. Treasury securities | | $ | 518,673 | | | $ | 206 | | | $ | 978 | | | $ | (780) | | | $ | 519,077 | |
Multinational securities(2) | | 8,548 | | | 103 | | | — | | | (17) | | | 8,634 | |
| Corporate bonds | | 32,609 | | | 207 | | | — | | | (1,092) | | | 31,724 | |
| Agency mortgage-backed securities | | 28,714 | | | 111 | | | 33 | | | (1,016) | | | 27,842 | |
| Other asset-backed securities | | 7,272 | | | 4 | | | — | | | (154) | | | 7,122 | |
Other(3) | | 941 | | | 8 | | | — | | | (161) | | | 788 | |
| Total investments in AFS debt securities | | $ | 596,757 | | | $ | 639 | | | $ | 1,011 | | | $ | (3,220) | | | $ | 595,187 | |
| December 31, 2022 | | | | | | | | | | |
| U.S. Treasury securities | | $ | 121,282 | | | $ | 217 | | | $ | — | | | $ | (3,510) | | | $ | 117,989 | |
Multinational securities(2) | | 19,658 | | | 109 | | | — | | | (724) | | | 19,043 | |
| Corporate bonds | | 41,890 | | | 257 | | | — | | | (2,644) | | | 39,503 | |
| Agency mortgage-backed securities | | 8,899 | | | 22 | | | — | | | (991) | | | 7,930 | |
| Other asset-backed securities | | 9,556 | | | 5 | | | — | | | (514) | | | 9,047 | |
Other(3) | | 2,133 | | | 21 | | | — | | | (228) | | | 1,926 | |
| Total investments in AFS debt securities | | $ | 203,418 | | | $ | 631 | | | $ | — | | | $ | (8,611) | | | $ | 195,438 | |
_____________________(1)Disclosed but not carried at fair value. The carrying valueAs of December 31, 2023 and December 31, 2022, we concluded that there was no credit loss attributable to securities in unrealized loss positions, as (i) 92% and 67% of the amortized cost basis of our debt is net of unamortized discounts and debt issuance costs. The fair value of our convertible notes issued in October 2021 was classified as Level 1, as it was based on an observable market quote. The fair values of our warehouse facility debt, revolving credit facility debt, financing arrangements assumed in the Galileo acquisition and credit card loans were based on market factors and credit factors specific to these financial instruments. The fair value of our securitization debt was valued using a discounted cash flow model, with key inputs relating to the underlying contractual coupons, terms, discount rate and expectations for defaults and prepayments. The carrying amounts of our cash and cash equivalents and restricted cash and restricted cash equivalents approximate their fair values due to the short-term maturities and highly liquid nature of these accounts. The fair value of our single commercial loaninvestments as of December 31, 2020 was also determined to approximate its carrying value, as the loan was issued in the fourth quarter of 2020, was short-term in nature,2023 and was repaid in full in January 2021.
(2)Measured at fair value on a recurring basis.
(3)Measured at fair value on a nonrecurring basis.
(4)Investments in AFS debt securities as of December 31, 2021 were classified as Level 1 or Level 2. The Level 12022, respectively, was composed of U.S. Treasury securities, agency mortgage-backed securities and sovereign foreign bonds, which are of high credit quality and have no risk of credit-related impairment due to the nature of the counterparties and history of no credit losses, and (ii) we have not identified factors indicating credit-related impairment for the remaining investments utilize quoted prices in actively traded markets. The Level 2 investments rely upon observable inputs other than quoted prices, dealer quotes in marketsand expect that are not activethe contractual principal and implied pricing derived from new issuances of similar securities. See Note 1 and Note 4 for additional information.
(5)These assets represent the carrying value of our holdings in VIEs wherein we were not deemed the primary beneficiary. Asinterest payments will be received. Additionally, we do not provide financial support beyond our initial equity investment, our maximum exposureintend to sell the securities in loss as a resultpositions nor is it more likely than not that we will be required to sell the securities prior to recovery of our involvement with nonconsolidated VIEs is limited to the investment amount. See Note 6 for additional information.amortized cost basis.
(6)(2) ETFsIncludes supranational and ETF short positions classified as Level 1 are based on utilizing quoted prices in actively traded markets. The short positions serve as an economic hedge to our non-securitization investments in ETFs.sovereign foreign bonds.
(7)(3) Third party warrants were recorded during the fourth quarter of 2021,Includes state and there were no subsequent adjustments from their initial value. The key unobservable assumption used in the fair value measurement of the third party warrants is the price of the stock underlying the warrants. The fair value is measured as the difference between the stock price and the strike price of the warrants. As the strike price is insignificant, we concluded that the impact of time value on the fair value measure was immaterial.
(8)For certain derivative instruments for which an enforceable master netting agreement exists, we elected to net derivative assets and derivative liabilities by counterparty. See Note 1 for additional information.
(9)Derivative liabilities classified as Level 1 are based on broker quotes in active markets and represent economic hedges of loan fair values. Interest rate swaps and interest rate caps are classified as Level 2, because these financial instruments do not trade in active markets with observable prices, but rely oncity municipal bond securities.
SoFi Technologies, Inc.
SoFi Technologies, Inc.
Notes to Consolidated Financial Statements (continued)
(In Thousands, Unless Otherwise Stated and Except for Share and Per Share Data)
observable inputs other than quoted prices. Interest rate swaps are valued using the three-month LIBOR swap yield curve and interest rate caps are valued using a SOFR rate curveThe following table presents information about our investments in AFS debt securities with gross unrealized losses and the implied volatilities suggested bylength of time that individual securities have been in a continuous unrealized loss position as of December 31, 2023 and December 31, 2022.
| | | | | | | | | | | | | | | | | | | | | | | | | | | | | | | | | | | | | | |
| | Less than 12 Months | | 12 Months or Longer | | Total |
| | Fair Value | | Gross Unrealized Losses | | Fair Value | | Gross Unrealized Losses | | Fair Value | | Gross Unrealized Losses |
| December 31, 2023 | | | | | | | | | | | | |
| U.S. Treasury securities | | $ | 480,012 | | | $ | (58) | | | $ | 39,065 | | | $ | (722) | | | $ | 519,077 | | | $ | (780) | |
| Multinational securities | | — | | | — | | | 8,634 | | | (17) | | | 8,634 | | | (17) | |
| Corporate bonds | | — | | | — | | | 31,724 | | | (1,092) | | | 31,724 | | | (1,092) | |
| Agency mortgage-backed securities | | 20,930 | | | (157) | | | 6,912 | | | (859) | | | 27,842 | | | (1,016) | |
| Other asset-backed securities | | — | | | — | | | 7,122 | | | (154) | | | 7,122 | | | (154) | |
| Other | | — | | | — | | | 788 | | | (161) | | | 788 | | | (161) | |
| Total investments in AFS debt securities | | $ | 500,942 | | | $ | (215) | | | $ | 94,245 | | | $ | (3,005) | | | $ | 595,187 | | | $ | (3,220) | |
| December 31, 2022 | | | | | | | | | | | | |
| U.S. Treasury securities | | $ | 27,759 | | | $ | (1,171) | | | $ | 90,230 | | | $ | (2,339) | | | $ | 117,989 | | | $ | (3,510) | |
| Multinational securities | | — | | | — | | | 19,043 | | | (724) | | | 19,043 | | | (724) | |
| Corporate bonds | | 4,480 | | | (313) | | | 35,023 | | | (2,331) | | | 39,503 | | | (2,644) | |
| Agency mortgage-backed securities | | 6,448 | | | (814) | | | 1,482 | | | (177) | | | 7,930 | | | (991) | |
| Other asset-backed securities | | — | | | — | | | 9,047 | | | (514) | | | 9,047 | | | (514) | |
| Other | | 745 | | | (200) | | | 1,181 | | | (28) | | | 1,926 | | | (228) | |
| Total investments in AFS debt securities | | $ | 39,432 | | | $ | (2,498) | | | $ | 156,006 | | | $ | (6,113) | | | $ | 195,438 | | | $ | (8,611) | |
The following table presents the SOFR rate curve, which are all observable inputs from active markets.
(10)The purchase price earn-out provision is classified as Level 3 because of our reliance on unobservable inputs, such as conditional prepayment rates, annual default ratesamortized cost and discount rates.
(11)IRLCs and student loan commitments are classified as Level 3 because of our reliance on assumed loan funding probabilities. The assumed probabilities are based on our internal historical experience with home loans and student loans similar to those in the funding pipelines on the measurement date.
(12)In conjunction with the Closing of the Business Combination, we measured the final fair value of the Series H warrantsour investments in AFS debt securities by contractual maturity:
| | | | | | | | | | | | | | | | | | | | | | | | | | | | | | | | |
| | Due Within One Year | | Due After One Year Through Five Years | | Due After Five Years Through Ten Years | | Due After Ten Years | | Total |
| December 31, 2023 | | | | | | | | | | |
| Investments in AFS debt securities—Amortized cost: | | | | | | | | | | |
| U.S. Treasury securities | | $ | 513,281 | | | $ | 5,392 | | | $ | — | | | $ | — | | | $ | 518,673 | |
| Multinational securities | | 8,548 | | | — | | | — | | | — | | | 8,548 | |
| Corporate bonds | | 18,122 | | | 11,181 | | | 3,306 | | | — | | | 32,609 | |
| Agency mortgage-backed securities | | — | | | 135 | | | 684 | | | 27,895 | | | 28,714 | |
| Other asset-backed securities | | 87 | | | 5,283 | | | 1,902 | | | — | | | 7,272 | |
| Other | | — | | | — | | | — | | | 941 | | | 941 | |
| Total investments in AFS debt securities | | $ | 540,038 | | | $ | 21,991 | | | $ | 5,892 | | | $ | 28,836 | | | $ | 596,757 | |
Weighted average yield for investments in AFS debt securities(1) | | 4.79 | % | | 0.99 | % | | 2.98 | % | | 3.13 | % | | 4.55 | % |
SoFi Technologies, Inc.
SoFi Technologies, Inc.
Notes to Consolidated Financial Statements (continued)
(In Thousands, Unless Otherwise Stated and subsequently reclassified them into permanent equity. Therefore, we did not measure the Series H warrants at fair value on an ongoing basis, subsequent to May 28, 2021. See Note 11Except for additional information on our historical Series H warrant liabilities, including inputs to the valuation.Share and Per Share Data)
| | | | | | | | | | | | | | | | | | | | | | | | | | | | | | | | |
| | Due Within One Year | | Due After One Year Through Five Years | | Due After Five Years Through Ten Years | | Due After Ten Years | | Total |
Investments in AFS debt securities—Fair value(2): | | | | | | | | | | |
| U.S. Treasury securities | | $ | 513,710 | | | $ | 5,161 | | | $ | — | | | $ | — | | | $ | 518,871 | |
| Multinational securities | | 8,531 | | | — | | | — | | | — | | | 8,531 | |
| Corporate bonds | | 17,785 | | | 10,733 | | | 2,999 | | | — | | | 31,517 | |
| Agency mortgage-backed securities | | — | | | 128 | | | 633 | | | 26,970 | | | 27,731 | |
| Other asset-backed securities | | 87 | | | 5,133 | | | 1,898 | | | — | | | 7,118 | |
| Other | | — | | | — | | | — | | | 780 | | | 780 | |
| Total investments in AFS debt securities | | $ | 540,113 | | | $ | 21,155 | | | $ | 5,530 | | | $ | 27,750 | | | $ | 594,548 | |
_____________________Loans
The following key unobservable assumptions were used in the fair value measurement of our loans as of the dates indicated:
| | | | | | | | | | | | | | | | | | | | | | | |
| December 31, 2021 | | December 31, 2020 |
| Range | | Weighted Average | | Range | | Weighted Average |
| Student loans | | | | | | | |
| Conditional prepayment rate | 16.5% – 26.3% | | 19.2% | | 15.8% – 33.3% | | 18.4% |
| Annual default rate | 0.2% – 4.2% | | 0.4% | | 0.2% – 4.9% | | 0.4% |
| Discount rate | 1.9% – 7.1% | | 2.9% | | 1.1% – 7.1% | | 3.3% |
| Home loans | | | | | | | |
| Conditional prepayment rate | 4.8% – 16.4% | | 12.4% | | 4.4% – 17.6% | | 14.9% |
| Annual default rate | 0.1% – 0.2% | | 0.1% | | 0.1% – 4.9% | | 0.1% |
| Discount rate | 2.5% ��� 13.0% | | 2.6% | | 1.3% – 10.0% | | 1.6% |
| Personal loans | | | | | | | |
| Conditional prepayment rate | 18.4% – 37.7% | | 20.5% | | 14.5% – 23.2% | | 18.1% |
| Annual default rate | 4.2% – 30.0% | | 4.4% | | 3.3% – 33.8% | | 4.2% |
| Discount rate | 3.9% – 7.0% | | 4.0% | | 5.0% – 10.7% | | 6.0% |
The key assumptions included in the above table are defined as follows:
•(1) Conditional prepayment rate — The monthly annualized proportion of the principal of a pool of loans that is assumed to be paid off prematurely in each period. An increase in the conditional prepayment rate, in isolation, would result in a decrease in a fair value measurement. The weighted average assumption was weightedyield represents the effective yield for the investment securities owned at the end of the period and is computed based on relative fair value.the amortized cost of each security.
•(2) Annual default ratePresentation of fair values of our investments in AFS debt securities by contractual maturity excludes total accrued interest of $639 and $631 as of December 31, 2023 and December 31, 2022, respectively.
Gross realized gains and losses on our investments in AFS debt securities were $3,356 and $509, respectively, during the year ended December 31, 2023, and were immaterial during the years ended December 31, 2022 and 2021. During the years ended December 31, 2023, 2022, and 2021 there were no transfers between classifications of our investments in AFS debt securities. See — Note 13. Equity for unrealized gains and losses on our investments in AFS debt securities and amounts reclassified out of AOCI.
Securitization Investments
The annualized ratefollowing table presents the aggregate outstanding value of borrowers who do not make loan payments on time. An increaseasset-backed bonds and residual interests owned by the Company in nonconsolidated VIEs, which are presented within investment securities in the annual default rate, in isolation, would result in a decrease in a fair value measurement. The weighted average assumption was weighted based on relative fair value.consolidated balance sheets:
•Discount rate — The weighted average rate at which the expected cash flows are discounted to arrive at the net present value of the loans. An increase in the discount rate, in isolation, would result in a decrease in a fair value measurement. The weighted average assumption was weighted based on relative fair value. | | | | | | | | | | | |
| December 31, |
| 2023 | | 2022 |
| Personal loans | $ | 27,247 | | | $ | 20,172 | |
| Student loans | 79,501 | | | 181,159 | |
| Securitization investments | $ | 106,748 | | | $ | 201,331 | |
See
Note 5 for additional loan fair value disclosures.7. Securitization and Variable Interest Entities Servicing Rights
Servicing rightsEach time we enter into a servicing agreement, either in connection with transfers of our financial assets or in connection with a referral fulfillment arrangement in which we are a sub-servicer for student loans and personal loansfinancial assets that we do not trade in an active market with readily observable prices. Similarly, home loanlegally own, we determine whether we should record a servicing rights infrequently trade in an active market. At the time of the underlying loan saleasset or the assumption of servicing rights,liability. We elected the fair value ofoption to measure our servicing rights is determinedsubsequent to initial recognition. We measure the initial and subsequent fair value of our servicing rights using a discounted cash flow methodology, while also considering market data as it becomes available. The significant assumptions used in the valuation model include our contractual servicing fee, ancillary income, prepayment rate assumptions, default rate assumptions, a discount rate commensurate with the risk of the servicing asset or liability being valued, and an assumed market cost of servicing, which is based on observable and unobservable inputs. Management classifiesactive quotes from third-party servicers. The value of the servicing rights are dependent on the performance of the underlying loans. For servicing rights retained in connection with loan transfers that do not meet the requirements for sale accounting treatment, there is no recognition of a servicing asset or liability.
Servicing rights in connection with transfers of financial assets are initially measured at fair value and recognized as Level 3 duea component of the gain or loss from sales of loans and the initial capitalization is reported within noninterest income—loan origination, sales, and securitizations in the consolidated statements of operations and comprehensive loss. Servicing rights assumed from third parties for financial assets for which we are not the loan originator are initially measured at fair value and recognized within noninterest income—servicing in the consolidated statements of operations and comprehensive loss. Servicing rights are measured at fair value at each subsequent reporting date and changes in fair value are reported in earnings in the period in which they occur. Subsequent measurement changes for all servicing rights, including servicing fee payments and fair value changes, are included within noninterest income—servicing in the consolidated statements of operations and comprehensive loss. We elected the fair value option to measure our servicing rights to better align with the valuation of our transferred loans, which also tend to share a similar risk profile to the usepersonal loan servicing we assume from third parties when we are not the loan originator. The loans are also impacted by similar factors, such as conditional prepayment rates and default rates. We consider the risk of significant unobservablethe assets and the observability of inputs in determining the classes of servicing rights. We have three classes of servicing assets: personal loans, student loans and home loans.
See Note 15. Fair Value Measurements for the key inputs used in the fair value measurement.measurements of our classes of servicing rights.
SoFi Technologies, Inc.
SoFi Technologies, Inc.
Notes to Consolidated Financial Statements (continued)
(In Thousands, Unless Otherwise Stated and Except for Share and Per Share Data)
Investments in Debt Securities
The following key unobservable inputs were usedaccounting and measurement framework for our investments in debt securities is determined based on the security classification. We do not hold investments in debt securities for trading purposes, nor do we have investments in debt securities that we have the intent and ability to hold to maturity. Therefore, we classify our investments in debt securities as available-for-sale.
We record investments in AFS debt securities at fair value in our consolidated balance sheets, with unrealized gains and losses recorded, net of tax, as a component of AOCI. See Note 15. Fair Value Measurements for additional information on our fair value estimates for investments in AFS debt securities. The amortized cost basis of our investments in AFS debt securities reflects the security’s acquisition cost, adjusted for amortization of premium or accretion of discount, and collection of cash and charge-offs, as applicable. For purposes of determining gross realized gains and losses on AFS debt securities, the cost of securities sold is based on specific identification. We elected to present accrued interest for AFS debt securities within investment securities in the consolidated balance sheets. Purchase discounts, premiums, and other basis adjustments for investments in AFS debt securities are generally amortized into interest income over the contractual life of the security using the effective interest method. However, premiums on certain callable debt securities are amortized to the earliest call date. Amortization of premiums and discounts and other basis adjustments for investments in AFS debt securities, as well as interest income earned on the investments, are recognized within interest income—other, and realized gains and losses on investments in AFS debt securities are recognized within noninterest income—other in the consolidated statements of operations and comprehensive loss.
An investment in AFS debt security is considered impaired if its fair value measurementis less than its amortized cost. If we determine that we have the intent to sell the impaired investment in AFS debt security, or if it is more likely than not that we will be required to sell the impaired investment in AFS debt security before recovery of our classesits amortized cost, we recognize the full impairment loss reflecting the difference between the amortized cost (net of servicing rights as of the dates presented:
| | | | | | | | | | | | | | | | | | | | | | | |
| December 31, 2021 | | December 31, 2020 |
| Range | | Weighted Average | | Range | | Weighted Average |
| Student loans | | | | | | | |
| Market servicing costs | 0.1% – 0.2% | | 0.1% | | 0.1% – 0.2% | | 0.1% |
| Conditional prepayment rate | 15.2% – 25.6% | | 20.4% | | 13.8% – 24.7% | | 18.7% |
| Annual default rate | 0.2% – 4.3% | | 0.4% | | 0.2% – 4.8% | | 0.4% |
| Discount rate | 7.3% – 7.3% | | 7.3% | | 7.3% – 7.3% | | 7.3% |
| Home loans | | | | | | | |
| Market servicing costs | 0.1% – 0.1% | | 0.1% | | 0.1% – 0.1% | | 0.1% |
| Conditional prepayment rate | 10.0% – 16.4% | | 11.5% | | 13.9% – 20.3% | | 16.5% |
| Annual default rate | 0.1% – 0.2% | | 0.1% | | 0.1% – 0.1% | | 0.1% |
| Discount rate | 7.5% – 7.5% | | 7.5% | | 10.0% – 10.0% | | 10.0% |
| Personal loans | | | | | | | |
| Market servicing costs | 0.2% – 1.1% | | 0.2% | | 0.2% – 0.7% | | 0.3% |
| Conditional prepayment rate | 22.5% – 41.4% | | 26.0% | | 16.2% – 26.1% | | 19.1% |
| Annual default rate | 3.2% – 7.0% | | 4.4% | | 3.1% – 7.5% | | 5.5% |
| Discount rate | 7.3% – 7.3% | | 7.3% | | 7.3% – 7.3% | | 7.3% |
The key assumptions included in the above table are defined as follows:
•Market servicing costs — The fee a willing market participant, which we validate through actual third-party bids for our servicing, would require for the servicing of student loans, home loansany prior recognized allowance) and personal loans with similar characteristics as those in our serviced portfolio. An increase in the market servicing cost, in isolation, would result in a decrease in a fair value measurement. The weighted average assumption was weighted based on relative fair value.
•Conditional prepayment rate — The monthly annualized proportion of the principal of a pool of loans that is assumed to be paid off prematurely in each period. An increase in the conditional prepayment rate, in isolation, would result in a decrease in a fair value measurement. The weighted average assumption was weighted based on relative fair value.
•Annual default rate — The annualized rate of default within the total serviced loan balance. An increase in the annual default rate, in isolation, would result in a decrease in a fair value measurement. The weighted average assumption was weighted based on relative fair value.
•Discount rate — The weighted average rate at which the expected cash flows are discounted to arrive at the net present value of the servicing rights. An increase in the discount rate, in isolation, would result in a decrease in a fair value measurement. The weighted average assumption was weighted based on relative fair value.
SoFi Technologies, Inc.
Notes to Consolidated Financial Statements (continued)
(In Thousands, Unless Otherwise Stated and Except for Share and Per Share Data)
The following table presents the estimated decrease to the fair value of our servicing rights asthe investment in AFS debt security within noninterest income—other in the consolidated statements of operations and comprehensive loss. If neither of the dates indicated ifabove conditions exists, we evaluate whether the key assumptions had eachimpairment loss is attributable to credit-related or non-credit-related factors. Any impairment that is not credit-related is recognized within other comprehensive income (loss), net of taxes. See the below adverse changes:section “Allowance for Credit Losses” in this Note for the factors we consider in identifying credit-related impairment and the treatment of credit losses.
| | | | | | | | | | | |
| December 31, |
| 2021 | | 2020 |
| Market servicing costs | | | |
| 2.5 basis points increase | $ | (10,822) | | | $ | (10,472) | |
| 5.0 basis points increase | (21,644) | | | (20,944) | |
| Conditional prepayment rate | | | |
| 10% increase | $ | (6,260) | | | $ | (5,430) | |
| 20% increase | (12,031) | | | (10,230) | |
| Annual default rate | | | |
| 10% increase | $ | (205) | | | $ | (336) | |
| 20% increase | (408) | | | (681) | |
| Discount rate | | | |
| 100 basis points increase | $ | (3,782) | | | $ | (2,986) | |
| 200 basis points increase | (7,349) | | | (5,820) | |
The sensitivity calculations above are hypothetical and should not be consideredSecuritization Investments
In Company-sponsored securitization transactions that meet the applicable criteria to be predictive of future performance. The effect on fair value ofaccounted for as a variation in assumptions generally cannot be determined because the relationship of the change in assumptions to the fair value may not be linear. Additionally, the effect of an adverse variation in a particular assumption on the fair value of our servicing rights is calculated while holding the other assumptions constant. In reality, changes in one factor may lead to changes in other factors, which could impact the above hypothetical effects.
The following table presents the changes in the Company’s servicing rights, which are measuredsale, we retain certain residual interests and asset-backed bonds. We measure these investments at fair value on a recurring basis:
| | | | | | | | | | | | | | | | | | | | | | | |
| Student Loans | | Home Loans | | Personal Loans | | Total |
| Fair value as of December 31, 2019 | $ | 138,582 | | | $ | 13,181 | | | $ | 49,855 | | | $ | 201,618 | |
| Recognition of servicing from transfers of financial assets | 45,637 | | | 20,440 | | | 10,515 | | | 76,592 | |
| Derecognition of servicing via loan purchases | (12,924) | | | — | | | (934) | | | (13,858) | |
| Change in valuation inputs or other assumptions | (20,168) | | | (5,056) | | | 7,765 | | | (17,459) | |
| Realization of expected cash flows and other changes | (50,490) | | | (4,651) | | | (42,155) | | | (97,296) | |
| Fair value as of December 31, 2020 | $ | 100,637 | | | $ | 23,914 | | | $ | 25,046 | | | $ | 149,597 | |
| Recognition of servicing from transfers of financial assets | 52,474 | | | 31,294 | | | 27,814 | | | 111,582 | |
| Servicing rights assumed from third parties | — | | | — | | | 370 | | | 370 | |
| Derecognition of servicing via loan purchases | (392) | | | — | | | (660) | | | (1,052) | |
| Change in valuation inputs or other assumptions | (16,197) | | | 4,300 | | | 9,246 | | | (2,651) | |
| Realization of expected cash flows and other changes | (46,519) | | | (8,975) | | | (34,093) | | | (89,587) | |
| Fair value as of December 31, 2021 | $ | 90,003 | | | $ | 50,533 | | | $ | 27,723 | | | $ | 168,259 | |
SoFi Technologies, Inc.
Notes in the consolidated balance sheets. Gains and losses related to Consolidated Financial Statements (continued)
(In Thousands, Unless Otherwise Statedour securitization investments are reported within noninterest income—loan origination, sales, and Except for Sharesecuritizations in the consolidated statements of operations and Per Share Data)
Asset-Backed Bonds
Thecomprehensive loss. We determine the fair value of asset-backed bonds is determinedour securitization investments using a discounted cash flow methodology. Management classifiesmethodology, while also considering market data as it becomes available.
Our residual investments accrete interest income over the expected life using the effective yield method, which reflects a portion of the overall fair value adjustment recorded each period on our residual investments. On a quarterly basis, we reevaluate the cash flow estimates over the life of the residual investments to determine if a change to the accretable yield is required on a prospective basis. Additionally, we record interest income associated with asset-backed bonds as Level 2 due toover the use of quoted prices for similar assets in markets that are not active, as well as certain factors specific to us. The following key inputs were used in the fair value measurement of our asset-backed bonds asterm of the dates indicated:
| | | | | | | | | | | |
| December 31, |
| 2021 | | 2020 |
| Discount rate (range) | 0.6% – 3.7% | | 0.8% – 4.0% |
| Conditional prepayment rate (range) | 19.5% – 32.2% | | 18.8% – 21.9% |
As ofunderlying bond using the dates indicated, the fair value of our asset-backed bonds was not materially impacted by default assumptionseffective interest method on the underlying securitization loans, as the subordinate residual interests, by design, are expected to absorb all estimated losses basedunpaid bond amounts. Interest income on our default assumptions for the respective periods.
Residual Investments and Residual Interests Classified as Debt
Residual investments and residual interests classified as debt do not trade in active markets with readily observable prices, and there is limited observable market data for reference. The fair values of residual investments and residual interests classified as debt are determined using a discounted cash flow methodology. Management classifies residual investmentsasset-backed bonds is presented within interest income—loans and residual interests classified as debt as Level 3 due to the use of significant unobservable inputs securitizations in the fair value measurements.consolidated statements of operations and comprehensive loss.
The followingSee Note 15. Fair Value Measurements for the key unobservable inputs were used in the fair value measurements of our residual investments and residual interests classified as debt asasset-backed bonds.
Investments in Equity Securities
Our investments in equity securities consist of investments for which fair values are not readily determinable, which we elect to measure using the dates indicated:
| | | | | | | | | | | | | | | | | | | | | | | |
| December 31, 2021 | | December 31, 2020 |
| Range | | Weighted Average | | Range | | Weighted Average |
| Residual investments | | | | | | | |
| Conditional prepayment rate | 19.5% – 33.6% | | 23.0% | | 18.8% – 22.3% | | 20.2% |
| Annual default rate | 0.3% – 5.7% | | 0.9% | | 0.3% – 6.2% | | 0.7% |
| Discount rate | 2.6% – 10.5% | | 4.4% | | 3.0% – 18.5% | | 6.2% |
| Residual interests classified as debt | | | | | | | |
| Conditional prepayment rate | 20.0% – 41.8% | | 31.5% | | 19.5% – 24.8% | | 21.4% |
| Annual default rate | 0.5% – 5.6% | | 3.2% | | 0.4% – 6.4% | | 3.1% |
| Discount rate | 5.0% – 9.5% | | 5.7% | | 8.5% – 18.0% | | 10.8% |
The key assumptions included in the above tablealternative method of accounting, under which they are defined as follows:
•Conditional prepayment rate — The monthly annualized proportion of the principal of a pool of loans that is assumed to be paid off prematurely in each period for the pool of loans in the securitization. An increase in the conditional prepayment rate, in isolation, would result in a decrease in a fair value measurement. The weighted average assumption was weighted based on relative fair value.
•Annual default rate — The annualized rate of borrowers who fail to remain current on their loans for the pool of loans in the securitization. An increase in the annual default rate, in isolation, would result in a decrease in a fair value measurement. The weighted average assumption was weighted based on relative fair value.
•Discount rate — The weighted average rate at which the expected cash flows are discounted to arrive at the net present value of the residual investments and residual interests classified as debt. An increase in the discount rate, in isolation, would result in a decrease in a fair value measurement. The weighted average assumption was weighted based on relative fair value.
The following table presents the changes in the residual investments and residual interests classified as debt, which are both measured at fair value on a recurring basis. We record changes in fair value within noninterest income—securitizations incost less any impairment and
SoFi Technologies, Inc.
SoFi Technologies, Inc.
Notes to Consolidated Financial Statements (continued)
(In Thousands, Unless Otherwise Stated and Except for Share and Per Share Data)
adjusted for changes resulting from observable price changes in orderly transactions for identical or similar investments of the same issuers. Our investments in equity securities are presented within other assets in the consolidated balance sheets. Adjustments to the carrying values of our investments in equity securities, such as impairments and unrealized gains, are recognized within noninterest income—other in the consolidated statements of operations and comprehensive income (loss)loss.
Property, Equipment and Software
All property, equipment and software are initially recorded at cost, while repairs and maintenance costs are expensed as incurred. Computer hardware, furniture and fixtures, software, buildings and finance lease ROU assets are depreciated or amortized on a straight-line basis over the estimated useful life of each class of depreciable or amortizable assets (ranging from one to 30 years). Leasehold improvements are amortized over the shorter of the respective lease term or the estimated lives of the leasehold improvements.
Software includes both purchased and internally-developed software. Internally-developed software is capitalized when preliminary project efforts are successfully completed, and it is probable that both the project will be completed and the software will be used as intended. Capitalized costs consist of salaries and compensation costs (inclusive of share-based compensation) for employees, fees paid to third-party consultants who are directly involved in development efforts and costs incurred for upgrades and functionality enhancements, and are amortized over a useful life ranging from 2.5 to 3 years. Other costs are expensed as incurred.
See Note 9. Property, Equipment, Software and Leases for additional information on our property, equipment and software.
Goodwill and Intangible Assets
Goodwill represents the fair value of an acquired business in excess of the fair value of the identified net assets acquired. Goodwill is tested for impairment at the reporting unit level annually or whenever indicators of impairment exist. Impairment of goodwill is the condition that exists when the carrying amount of a reporting unit that includes goodwill exceeds its fair value. We may assess goodwill for impairment initially using a qualitative approach, referred to as “step zero”, to determine whether conditions exist to indicate that it is more likely than not that the fair value of a portionreporting unit is less than its carrying amount. If management concludes, based on its assessment of relevant events, facts and circumstances, that it is more likely than not that a reporting unit’s carrying value is greater than its fair value, then a quantitative analysis will be performed to determine if there is any impairment. We may alternatively elect to initially perform a quantitative assessment and bypass the qualitative assessment.
A goodwill impairment loss is recognized for the amount that the carrying amount of a reporting unit, including goodwill, exceeds its fair value, limited to the total amount of goodwill allocated to that reporting unit. Therefore, if the fair value of a reporting unit exceeds its carrying amount, goodwill of the reporting unit is not impaired. Our reporting units for our goodwill impairment analysis represent components of our business at one level below our operating segments. Our annual impairment testing date is October 1.
Definite-lived intangible assets are amortized on a straight-line basis over their useful lives and reviewed for impairment annually and whenever events or circumstances indicate that the carrying amount of such assets may not be recoverable. Intangible assets include capitalized costs incurred in the development and enhancement of our software products to be sold, leased or marketed. These costs, consisting primarily of salaries and compensation costs (inclusive of share-based compensation) for employees, are expensed as incurred until technological feasibility has been established, after which the costs are capitalized until the product is subsequently reclassifiedavailable for general release to customers.
See Note 2. Business Combinations and Note 8. Goodwill and Intangible Assets for further discussion of goodwill and intangible assets, including those recognized in connection with recent business combinations.
Leases
We determine if an arrangement is or contains a lease at inception of the contract. A contract is or contains a lease if the contract conveys the right to control the use of identified property or equipment for a period of time in exchange for consideration. For our current office and non-office classes of operating leases, we elected the practical expedient to not separate non-lease components from lease components and to, instead, account for each separate lease component and the non-
SoFi Technologies, Inc.
SoFi Technologies, Inc.
Notes to Consolidated Financial Statements (continued)
(In Thousands, Unless Otherwise Stated and Except for Share and Per Share Data)
lease components associated with that lease component as a single lease component. For our current classes of finance leases, we did not elect to apply this practical expedient and, instead, separately identify and measure the non-lease components of the contracts. As an accounting policy election, we apply the short-term lease exemption practical expedient to any lease that, at the commencement date, has a lease term of 12 months or less and does not include an option to purchase the underlying asset that we are reasonably certain to exercise.
Operating leases are presented within operating lease right-of-use assets and operating lease liabilities in the consolidated balance sheets. Finance lease ROU assets are presented within property, equipment and software and finance lease liabilities are presented within accounts payable, accruals and other liabilities in the consolidated balance sheets. Operating and finance lease ROU assets represent our right to use an underlying asset for the lease term and operating and finance lease liabilities represent our obligation to make lease payments arising from the lease. ROU assets and lease liabilities are recognized at the commencement date based on the present value of lease payments over the lease term. As our leases do not provide an implicit borrowing rate, we use our incremental borrowing rate based on the information available at commencement date or modification date, as appropriate, in determining the present value of lease payments.
The operating lease ROU assets are increased by any prepaid lease payments and are reduced by any unamortized lease incentives. Our lease terms may include options to extend or terminate the lease when it is reasonably certain that we will exercise that option. Base rent is typically subject to rent escalations on each annual anniversary from the lease commencement dates. Lease expense for lease payments, including any step rent provisions specified in the lease agreements, is recognized on a straight-line basis over the lease term and is allocated among the components of noninterest expense in the consolidated statements of operations and comprehensive loss. The finance lease ROU assets are depreciated on a straight-line basis over the estimated useful life of seven years. Interest expense on finance leases is recognized for the difference between the present value of the lease liabilities and the scheduled lease payments within interest expense—other in the consolidated statements of operations and comprehensive loss.
When a lease agreement is modified, we determine if the modification grants us the right to use an additional asset that is not included in the original lease contract and if the lease payments increase commensurate with the standalone price for the additional ROU asset. If both conditions are met, we account for the agreement as two separate contracts: (i) the original, unmodified contract and (ii) a separate contract for the additional ROU asset. If both conditions are not met, the modification is not evaluated as a separate contract. Instead, based on the nature of the modification, we: (i) reassess the lease classification on the modification date under the modified terms, and (ii) use the modified lease payments and discount rate to remeasure the lease liability and recognize any difference between the new lease liability and the old lease liability as an adjustment to the ROU asset.
See Note 9. Property, Equipment, Software and Leases for additional information on our leases.
Derivative Financial Instruments
We enter into derivative contracts to manage future loan sale execution risk. We did not elect hedge accounting, as management’s hedging intentions are to economically hedge the risk of unfavorable changes in the fair values of our personal loans, student loans and home loans. Our derivative instruments used to manage future loan sale execution risk include interest rate swaps, interest rate caps and home loan pipeline hedges. We also have IRLCs, interest rate swaps and interest rate caps that were not related to future loan sale execution risk.
Changes in derivative instrument fair values are recognized in earnings as they occur. Depending on the measurement date position, derivative financial instruments are presented within other assets or accounts payable, accruals and other liabilities in the consolidated balance sheets. Our derivative instruments are reported within cash flows from operating activities in the consolidated statements of cash flows.
Certain derivative instruments are subject to enforceable master netting arrangements. Accordingly, we present our net asset or liability position by counterparty in the consolidated balance sheets. Additionally, since our cash collateral balances do not approximate the fair value of the derivative position, we do not offset our right to reclaim cash collateral or obligation to return cash collateral against recognized derivative assets or liabilities.
See Note 14. Derivative Financial Instruments and Note 15. Fair Value Measurements for additional information on our derivative assets and liabilities.
SoFi Technologies, Inc.
SoFi Technologies, Inc.
Notes to Consolidated Financial Statements (continued)
(In Thousands, Unless Otherwise Stated and Except for Share and Per Share Data)
Residual Interests Classified as Debt
Within consolidated securitizations, and warehousesthe residual interests held by third parties are presented as forresidual interests classified as debt in the consolidated balance sheets. We measure residual interests classified as debt at fair value on a recurring basis. We record subsequent measurement changes in fair value in the period in which the change occurs within noninterest income—loan origination, sales, and securitizations in the consolidated statements of operations and comprehensive loss. We determine the fair value of residual interests classified as debt using a discounted cash flow methodology, while also considering market data as it becomes available.
We recognize interest expense related to residual interests classified as debt over the expected life using the effective yield method, which reflects a portion of the overall fair value adjustment recorded each period on our residual interests classified as debt. Interest expense related to residual interests classified as debt is presented withininterest income—expense—securitizations and warehouses in the consolidated statements of operations and comprehensive loss. On a quarterly basis, we reevaluate the cash flow estimates to determine if a change to the accretable yield is required on a prospective basis.
See Note 15. Fair Value Measurements for the key inputs used in the fair value measurements of residual investments, but doesinterests classified as debt.
Safeguarding Asset and Liability
Through our SoFi Invest product (via our wholly-owned subsidiary, SoFi Digital Assets, LLC, a licensed money transmitter), our members were able to invest in digital assets. In the fourth quarter of 2023, we transferred the crypto services provided by SoFi Digital Assets, LLC, and began closing existing digital assets accounts. This process was completed in the first quarter of 2024. Certain accounts were eligible for transfer to a third party digital asset service provider who assumed responsibility for the transferred accounts on a go-forward basis, including the arrangement of custodial services for the transferred digital assets. We have no further ongoing responsibilities for the transferred digital assets subsequent to the executed transfer which took place in December 2023, and derecognized the corresponding digital assets safeguarding liability and safeguarding asset as of the date of the transfer.
For those digital assets that were not eligible to be transferred, we engage third parties to provide custodial services for our digital assets offering, which include holding the cryptographic key information and working to protect the digital assets from loss or theft. The third-party custodians hold digital assets as custodial assets in an account in SoFi’s name for the benefit of our members. We maintain the internal recordkeeping of our members’ digital assets, including the amount and type of digital assets owned by each of our members in the custodial accounts. As of December 31, 2023, we utilized one third-party custodian.
In accordance with Staff Accounting Bulletin No. 121 (“SAB 121”), we recognize a digital assets safeguarding liability within accounts payable, accruals and other liabilities in the consolidated balance sheets reflecting our obligation to safeguard the digital assets held by third-party custodians for the benefit of our members. We also recognize a corresponding safeguarding asset within other assets in the consolidated balance sheets. The safeguarding liability and corresponding safeguarding asset are measured and recorded at the fair value of the digital assets held by the custodians at each reporting date. Subsequent changes to the fair value measurement are reflected as equal and offsetting adjustments to the carrying values of the safeguarding liability and corresponding safeguarding asset. We evaluate any potential loss events, such as theft, loss or destruction of the cryptographic keys, that may affect the measurement of the safeguarding asset, which would be reflected in our results of operations in the period the loss occurs. Measurement changes do not impact the liability or asset balance, respectively.consolidated statements of operations and comprehensive loss unless such a loss event is identified. As of both December 31, 2023 and 2022, we did not identify any loss events.
| | | | | | | | | | | |
| Residual Investments | | Residual Interests Classified as Debt |
| Fair value as of December 31, 2019 | $ | 262,880 | | | $ | 271,778 | |
| Additions | 10,708 | | | — | |
Change in valuation inputs or other assumptions(1) | 9,702 | | | 38,216 | |
Payments(2) | (96,505) | | | (89,978) | |
Transfers(3) | (47,261) | | | — | |
| Derecognition upon achieving true sale accounting treatment | — | | | (101,718) | |
| Fair value as of December 31, 2020 | $ | 139,524 | | | $ | 118,298 | |
| Additions | 49,317 | | | 2,170 | |
Change in valuation inputs or other assumptions(1) | 10,603 | | | 22,802 | |
Payments(2) | (78,425) | | | (49,588) | |
| | | |
| | | |
| Fair value as of December 31, 2021 | $ | 121,019 | | | $ | 93,682 | |
_____________________Borrowings and Financing Costs
(1)For residual investments,We borrow from various financial institutions to finance our lending activities. Direct costs incurred in connection with financing, such as banker fees, origination fees and legal fees, are classified as deferred debt issuance costs. We capitalize these costs and report the estimatedamounts as a direct deduction from the carrying amount of the debt balance. Any difference between the stated principal amount of debt and the amount of cash proceeds received, net of debt issuance costs, is presented as a
SoFi Technologies, Inc.
SoFi Technologies, Inc.
Notes to Consolidated Financial Statements (continued)
(In Thousands, Unless Otherwise Stated and Except for Share and Per Share Data)
discount or premium. The capitalized debt issuance costs and the original issue discount/premium are amortized into interest expense over the expected life of the related financing agreements using the straight-line method for revolving facilities and the effective interest method for securitization debt and our senior convertible notes, as defined and further discussed below. Remaining unamortized fees are expensed immediately upon early extinguishment of the debt. In a debt modification for revolving debt, the initial issuance costs and any additional fees incurred as a result of the modification are deferred over the term of the new agreement, if the borrowing capacity of the revolving facility is increased. In the case that a modification results in a decrease in our borrowing capacity, any fees paid to the creditor and any third-party costs incurred are considered to be associated with the new arrangement and are, therefore, deferred and amortized over the term of the new arrangement. Unamortized deferred costs relating to the old arrangement at the time of the modification are expensed immediately in proportion to the decrease in borrowing capacity of the old arrangement. Any remaining unamortized deferred costs relating to the old arrangement are deferred and amortized over the term of the new arrangement.
We elected the fair value option to measure certain securitization debt, with the intent to mitigate the accounting divergence between debt liabilities measured at historical cost and the corresponding loans securing these financings, which are risk-managed on a fair value basis. For securitization debt carried at fair value on a recurring basis, we record the initial fair value measurement and subsequent measurement changes in fair value in the period in which the changes occur within noninterest income—loan origination, sales, and securitizations in the consolidated statements of operations and comprehensive loss. We determined the fair value of the applicable securitization debt using a discounted cash flow methodology, while also considering market data as it becomes available. The key inputs to the calculation include the underlying contractual coupons, terms, discount rate and expectations for defaults and prepayments.
Convertible Senior Notes
In October 2021, we issued $1.2 billion aggregate principal amount of convertible senior notes due 2026 (the “convertible notes”). The convertible notes will mature on October 15, 2026, unless earlier repurchased, redeemed or converted. We will settle conversions by paying or delivering, at our election, cash, shares of our common stock or a combination of cash and shares of our common stock, based on the applicable conversion rate(s). The convertible notes will also be redeemable, in whole or in part, at our option at any time, and from time to time, on or after October 15, 2024 through the 30th scheduled trading day immediately before the maturity date, at a cash redemption price equal to the principal amount of the convertible notes to be redeemed, plus accrued interest, if any, thereon to, but excluding, the redemption date, but only if certain liquidity conditions described in the indenture are satisfied and certain conditions are met with respect to the last reported sale price per share of our common stock prior to conversion. In December 2023, we entered into repurchase agreements to repurchase $88.0 million aggregate principal amount of the convertible notes. See Note 12. Debt for more detailed disclosure of the term and features of the convertible notes.
We elected to evaluate each embedded feature of the arrangement individually. We concluded that each of the conversion rights, optional redemption rights, fundamental change make-whole provision and repurchase rights did not require bifurcation as derivative instruments, which we reevaluate each reporting period. The additional interest and special interest that accrue on the notes in the event of our failure to comply with certain registration or reporting requirements are required to be bifurcated from the host contract, as the reporting requirement triggering event is not clearly and closely related to the host convertible debt contract, and therefore we measure the contingent interest feature at fair value each reporting period. The value was determined to be immaterial; therefore, we accounted for the convertible notes wholly as debt, which was recognized on the settlement date. Accordingly, we allocated all debt issuance costs to the debt instrument on the basis of materiality.
In connection with the pricing of the convertible notes, we entered into privately negotiated capped call transactions with certain financial institutions, as defined and further discussed below.
Redeemable Preferred Stock
Series 1 Redeemable Preferred Stock (as defined in Note 13. Equity) is classified in temporary equity, as it is not fully controlled by SoFi. See Note 13. Equity for additional information.
Foreign Currency Translation Adjustments
We revalue assets, liabilities, income and expense denominated in non-United States currencies into United States dollars using applicable exchange rates. For foreign subsidiaries in which the functional currency is the subsidiary’s local
SoFi Technologies, Inc.
SoFi Technologies, Inc.
Notes to Consolidated Financial Statements (continued)
(In Thousands, Unless Otherwise Stated and Except for Share and Per Share Data)
currency, gains (losses)and losses relating to foreign currency translation adjustments are included in accumulated other comprehensive income (loss) in our consolidated balance sheets. For foreign subsidiaries in which the functional currency is the United States Dollar, gains and losses relating to foreign currency transaction adjustments are included within earnings attributablein the consolidated statements of operations and comprehensive loss. Due to changesthe highly inflationary economic environment in instrument-specific credit riskArgentina, we use the United States Dollar as the functional currency of our Argentinian operations. Our activities in Argentina are related to our Technology Platform segment and commenced in the first quarter of 2022 with the Technisys Merger.
Capped Call Transactions
We entered into privately negotiated capped call transactions (the “Capped Call Transactions”) with certain financial institutions (the “Capped Call Counterparties”). The Capped Call Transactions initially cover, subject to customary anti-dilution adjustments, the number of shares of our common stock that initially underlie the convertible notes. The Capped Call Transactions are net purchased call options on our own common stock. The Capped Call Transactions are separate transactions entered into by the Company with each of the Capped Call Counterparties, are not part of the terms of the convertible notes, and do not affect any holder’s rights under the convertible notes. Holders of the convertible notes do not have any rights with respect to the Capped Call Transactions. As the Capped Call Transactions are legally detachable and separately exercisable from the convertible notes, they were $(230), $(1,252)evaluated as freestanding instruments. We concluded that the Capped Call Transactions meet the scope exceptions for derivative instruments, and $569 duringas such, the years ended December 31, 2021, 2020Capped Call Transactions meet the criteria for classification in equity and 2019, respectively. The gains (losses) attributableare included as a reduction to instrument-specific credit risk were estimated by incorporating our current default and loss severity assumptionsadditional paid-in capital.
See Note 13. Equity for additional information on the residual investments. These assumptions are based on historical performance, market trends and performance expectationsCapped Call Transactions.
Interest Income
We record interest income associated with loans measured at fair value over the term of the underlying instrument.
(2)loans using the effective interest method on unpaid loan principal amounts, which is presented withinPayments interest income—loans and securitizations in the consolidated statements of residual investments included residual investment sales of $4,291operations and $8,342 during the years ended December 31, 2021 and 2020, respectively.
(3)The year ended December 31, 2020 includes a transfer from residual investments (Level 3) to asset-backed bonds (Level 2)comprehensive loss. We also record accrued interest income associated with loans measured at amortized cost within interest income—loans and securitizations. We stop accruing interest and reverse all accrued but unpaid interest at the time a repackaged securitization transactionloan charges off. Loans are returned to accrual status if the loans are brought to nondelinquent status or have performed in which we formedaccordance with the contractual terms for a new VIEreasonable period of time and, in management’s judgment, will continue to make scheduled periodic principal and interest payments.
Other interest income is primarily earned on our bank balances.
Loan Origination and Sales Activities
As part of our loan sale agreements, we may retain the process, exchanged our residual interest for an asset-backed bond interest.rights to service sold loans. We calculate a gain or loss on the sale based on the sum of the proceeds from the sale and any servicing asset or liability recognized, less the carrying value of the loans sold. Our gain or loss calculation is also inclusive of repurchase liabilities recognized at the time of sale, and is recorded within noninterest income—loan origination, sales, and securitizations in the consolidated statements of operations and comprehensive loss.
Loan Commitments
We classifyoffer a program whereby applicants can lock in an interest rate on an in-school loan to be funded at a later time. Applicants can exit the loan origination process up until the loan funding date. SoFi is obligated to fund the loan at the committed terms on the disbursement date if the borrower does not cancel prior to the loan funding date. The student loan commitments as Level 3 becausemeet the assets do not trade in an active market with readily observable prices and, as such, our valuations utilize significant unobservable inputs. Additionally,scope exception for issuers of commitments to originate non-mortgage loans. As the writer of the commitments, we classify IRLCs as Level 3, as our IRLCs are inherently uncertain and unobservable given that a home loan origination is contingent on a plethora of factors. The following key unobservable inputs were used inelected the fair value measurements ofoption to measure our IRLCs andunfunded student loan commitments asto align with the measurement methodology of the dates indicated:
| | | | | | | | | | | | | | | | | | | | | | | |
| December 31, 2021 | | December 31, 2020 |
| Range | | Weighted Average | | Range | | Weighted Average |
| IRLCs | | | | | | | |
Loan funding probability(1) | 75.0% – 75.0% | | 75.0% | | 54.5% – 54.5% | | 54.5% |
| Student loan commitments | | | | | | | |
Loan funding probability(1) | 95.0% – 95.0% | | 95.0% | | n/a | | n/a |
_____________________(1)The probability of honoring IRLCs andour originated student loans. As such, our student loan commitments which reflects the percentage likelihood that an approved loan application will close basedare carried at fair value on historical experience. A significant difference between the actual funded rate and the assumed funded rate ata recurring basis. Depending on the measurement date could result position, student loan commitments are presented within other assets or accounts payable, accruals and other liabilities in a significantly higher or lowerthe consolidated balance sheets. We record the initial fair value measurement of our IRLCs and student loan commitments. The aggregate amount of student loans we committed to fund was $53,189 as of December 31, 2021. See Note 1 under “Derivative Financial Instruments” for the aggregate notional amount associated with IRLCs.
The key assumption includedsubsequent measurement changes in fair value in the above table is defined as follows:
•period in which the changes occur within Loan funding probabilitynoninterest income—loan origination, sales, and securitizations — Our expectation of the percentage of IRLCs or student loan commitments which will become funded loans. An increase in the loan funding probabilities, in isolation, would result in an increase in aconsolidated statements of operations and comprehensive loss.
Loan commitments also include IRLCs, whereby we commit to interest rate terms prior to completing the origination process for home loans. IRLCs are derivative instruments that are measured at fair value measurement. The weighted average assumptions were weighted based on relativea recurring basis. Changes in fair values.
SoFi Technologies, Inc.
SoFi Technologies, Inc.
Notes to Consolidated Financial Statements (continued)
(In Thousands, Unless Otherwise Stated and Except for Share and Per Share Data)
The following table presents the changes in our IRLCs and student loan commitments, whichvalue are measured at fair value on a recurring basis. Changes in the fair values of IRLCs and student loan commitments are recordedrecognized within noninterest income—loan origination, sales, and salessecuritizations in the consolidated statements of operations and comprehensive income (loss).
| | | | | | | | | | | |
| IRLCs | | Student Loan Commitments |
| Fair value as of December 31, 2019 | $ | 1,090 | | | $ | — | |
| Revaluation adjustments | 62,528 | | | — | |
Funded loans(1) | (27,321) | | | — | |
Unfunded loans(1) | (20,677) | | | — | |
| Fair value as of December 31, 2020 | $ | 15,620 | | | $ | — | |
| Revaluation adjustments | 23,211 | | | 6,410 | |
Funded loans(1) | (24,330) | | | (2,384) | |
Unfunded loans(1) | (10,742) | | | (1,806) | |
| Fair value as of December 31, 2021 | $ | 3,759 | | | $ | 2,220 | |
loss. See _____________________“Derivative Financial Instruments” in this Note for additional information on our derivative instruments.
(1)See For each quarter withinNote 15. Fair Value Measurements for the years presented, funded and unfunded loankey inputs used in the fair value adjustments represent the unpaid principal balancemeasurements of funded and unfunded loans, respectively, during the quarter multiplied by the IRLC or studentour loan commitment price in effect at the beginningcommitments.
Revenue Recognition
In each of our revenue arrangements, revenue is recognized when control of the quarter. The amountspromised goods or services is transferred to the customer in an amount that reflects our expected consideration in exchange for those goods or services. Our primary revenue streams for the periods presented oninclude the following:
•Technology Products and Solutions: We earn fees for providing an integrated platform as a year-to-date basis represent the summation of the per-quarter effects.
Non-Securitization Investments
Non-securitization investments — ETFs of $1,486service for financial and $6,850 as of December 31, 2021 and 2020, respectively, include investments in exchange-traded funds (“ETF”), which have targeted investment strategies. Our investment as of December 31, 2021 included an ETF with investment grade and high-yield fixed income securities. Our investment as of December 31, 2020 also included an ETF with equity securities seeking long-term capital appreciation and an ETF with widely held U.S. stocks by SoFi members, both of which were sold during the 2021 period. Non-securitization investments—ETFs are measured at fair value on a recurring basis using the net asset value expedient in accordance with ASC 820 and are presented within other assets in the consolidated balance sheets.non-financial institutions.
Non-securitization investments — Other•Referrals: of $6,054 and $1,147 as of December 31, 2021 and 2020, respectively, include investments for which fair values are not readily determinable, whichWe earn specified referral fees in connection with referral activities we elect to measure using the measurement alternative method of accounting. Under the measurement alternative method, we measure the investments at cost, less any impairment and adjusted for changes resulting from observable price changes in orderly transactions for identical or similar investments of the same issuers. The carrying values of the investments are presented within other assets in the consolidated balance sheets. Adjustments to the carrying value,facilitate through our platform, such as impairmentsreferrals to third-party partners that offer services to end users who do not use one of our product offerings and unrealized gains,referrals of pre-qualified borrowers to a third-party partner who separately contracts with a loan originator.
•Interchange: We earn interchange fees from debit and credit cardholder transactions conducted through payment networks.
•Brokerage: We earn fees in connection with facilitating investment-related transactions through our platform, such as brokerage transactions, share lending and exchange conversion.
See Note 3. Revenue for additional information on our revenue recognition policy within each revenue stream.
Advertising, Sales and Marketing
Advertising production costs and advertising communication costs, as well as amounts paid to various affiliates to market our products, are recognizedincluded within noninterest income—otherexpense—sales and marketing in the consolidated statements of operations and comprehensive income (loss). The fair value measurementsloss. Advertising costs are classified within Level 3expensed either as incurred or when the advertising takes place, depending on the nature of the fair value hierarchy due toadvertising activity. For the uses of unobservable inputs in the fair value measurements.
For 1 such investment with a fair value of $1,886 and $1,147 as of December 31, 2021 and 2020, respectively, we recorded an impairment charge of $803 in the second quarter of 2020 and adjusted the carrying value of the investment accordingly, which was based on a discounted cash flow analysis, wherein we weighted different valuation scenarios with different assumed internal rates of return and time to liquidity events. In performing a qualitative impairment assessment, we determined that the carrying amount of the investment exceeded its fair value due to a significant decline in investee operating results relative to expectations, primarily as a result of the COVID-19 pandemic. During the fourth quarter of 2021, we recorded an upward adjustment of $739 and adjusted the carrying value of the investment accordingly, because a new investor agreed to purchase the underlying company, of which the purchase price consideration was a significant input relied upon for our fair value measurement.
For an additional investment with a fair value of $2,168 as of December 31, 2021, we recognized a gain of $3,967 during the yearyears ended December 31, 2023, 2022 and 2021, advertising totaled $284,176, $256,125 and $183,106, respectively.
Expenses incurred by us related to member acquisition, including brand development, business development and direct member marketing expenses, are also presented within noninterest expense—sales and marketing in the consolidated statements of operations and comprehensive loss.
Technology and Product Development
Expenses incurred by us related to technology, product design and implementation, which also represents our cumulative adjustment on this securityincludes compensation and which we valuedbenefits, are classified as noninterest expense—technology and product development in the consolidated statements of operations and comprehensive loss.
Loss Contingencies
Loss contingencies, including claims and legal actions arising in the ordinary course of business, are recorded in accounts payable, accruals and other liabilities in the consolidated balance sheets. Such liabilities and associated expenses are recorded when the likelihood of loss is probable and an amount or range of loss can be reasonably estimated. Such estimates are based on the investee’s latest roundbest information available at the time. As additional information becomes available, we reassess the potential liability and record an estimate in the period in which the adjustment is probable and an amount or range can be reasonably estimated. Due to the inherent uncertainties of financing duringloss contingencies, estimates may be different from the second quarteractual outcomes. With respect to legal proceedings, we recognize legal fees as they are incurred within noninterest expense—general and administrative in the consolidated statements of 2021. We considered this recent equity transaction to be an orderly transaction in an issuance similar to our investment holding. Additionally, we sold a portionoperations and comprehensive loss. See Note 18. Commitments, Guarantees, Concentrations and Contingencies for discussion of ourcontingent matters.
SoFi Technologies, Inc.
SoFi Technologies, Inc.
Notes to Consolidated Financial Statements (continued)
(In Thousands, Unless Otherwise Stated and Except for Share and Per Share Data)
investment duringRestructuring
During the year ended December 31, 2021 for $2,000 at2023, we recognized restructuring charges of $12,749 within the same valuation, contemporaneous with the investee’s latest roundfollowing categories of financing.
During the fourth quarter of 2021, we made an additional non-securitization investment of $2,000. We did not make any adjustments to the investment value through December 31, 2021.
Non-securitization investments measured at fair value exclude our equity method investments, which are discussed further in Note 1.
Purchase Price Earn-Out
As of December 31, 2021, we had a derivative for a purchase price earn-out in conjunction with a loan sale agreement we entered into during 2018, as further discussed in Note 1. We receive a capped contractual payout based on the respective loan pool internal rate of return over a certain hurdle rate, which is adjusted for the loan purchaser’s expenses which are generally immaterial. Prior to 2021, the purchase price earn-out value was immaterial. The fair value of the purchase price earn-out is determined using a discounted cash flow methodology. Management classifies the purchase price earn-out as Level 3 due to the use of significant unobservable inputs in the fair value measurement. A significant difference between the expected performance of the loans included in the loan sale agreement and the actual results as of the measurement date could result in a higher or lower fair value measurement. Our key valuation inputs were as follows as of the date indicated:
| | | | | | | | | | | | | | |
| | December 31, 2021 |
Purchase Price Earn-Out | | Range | | Weighted Average |
Conditional prepayment rate | | 22.9% – 22.9% | | 22.9% |
Annual default rate | | 30.0% – 30.0% | | 30.0% |
Discount rate | | 25.0% – 25.0% | | 25.0% |
The key assumptions included in the above table are defined as follows:
•Conditional prepayment rate — The monthly annualized proportion of the principal of the pool of loans included in the loan sale agreement that is assumed to be paid off prematurely. An increase in the conditional prepayment rate, in isolation, would result in a decrease in a fair value measurement. The weighted average assumption was weighted based on relative fair value.
•Annual default rate — The annualized rate of borrowers who fail to remain current on their loans for the pool of loans included in the loan sale agreement. An increase in the annual default rate, in isolation, would result in a decrease in a fair value measurement. The weighted average assumption was weighted based on relative fair value.
•Discount rate — The weighted average rate at which the expected cash flows are discounted to arrive at the net present value of the purchase price earn-out derivative. An increase in the discount rate, in isolation, would result in a decrease in a fair value measurement. The weighted average assumption was weighted based on relative fair value.
The following table presents the changes in our purchase price earn-out, which is measured at fair value on a recurring basis. Changes in the fair value are recorded within noninterest income—otherexpense: (i) technology and product development, (ii) sales and marketing, (iii) cost of operations, and (iv) general and administrative in the consolidated statements of operations and comprehensive income (loss).loss associated with a reduction in headcount in the Technology Platform segment in the first quarter of 2023, as well as expenses in the fourth quarter of 2023 related to a reduction in headcount across the Financial Services, Lending and corporate functions, which primarily included employee-related wages, benefits and severance.
| | | | | |
| Purchase Price Earn-Out |
Fair value as of January 1, 2021 | $ | — | |
Initial recognition(1)
| 7,165 | |
Payments | (5,040) | |
Changes in valuation inputs or assumptions | 2,147 | |
Fair value as of December 31, 2021 | $ | 4,272 | |
_____________________Compensation and Benefits
(1)The estimated amountTotal compensation and benefits, inclusive of losses included in earnings attributable to changes in instrument-specific credit risk were $286 duringshare-based compensation expense, was $894,720, $830,298 and $608,505 for the yearyears ended December 31, 2021. The losses attributable2023, 2022 and 2021, respectively. Compensation and benefits expenses are presented within the following categories of expenses within noninterest expense: (i) technology and product development, (ii) sales and marketing, (iii) cost of operations, and (iv) general and administrative in the consolidated statements of operations and comprehensive loss.
Share-Based Compensation
Share-based compensation made to instrument-specific credit risk were estimated by incorporating our current defaultemployees and loss severity assumptionsnon-employees, including stock options, RSUs and PSUs, is measured based on the grant date fair value of the awards and is recognized as compensation expense typically on a straight-line basis over the period during which the share-based award holder is required to perform services in exchange for the purchase price earn-out. These assumptionsaward (the vesting period) for stock options and RSUs and on an accelerated attribution basis for each vesting tranche over the respective derived service period for PSUs. Share-based compensation expense is allocated among the following categories of expenses within noninterest expense: (i) technology and product development, (ii) sales and marketing, (iii) cost of operations, and (iv) general and administrative in the consolidated statements of operations and comprehensive loss. We used the Black-Scholes Option Pricing Model (the “Black-Scholes Model”) to estimate the grant-date fair value of stock options. RSUs are measured based on historical performance and performance expectations over the termfair values of the underlying instrument.stock on the dates of grant. We use a Monte Carlo simulation model to estimate the grant-date fair value of PSUs. We recognize forfeitures as incurred and, therefore, reverse previously recognized share-based compensation expense at the time of forfeiture. See Note 16. Share-Based Compensation for further discussion of share-based compensation.
Income Taxes
We recognize deferred tax assets and liabilities for the expected future tax consequences of temporary differences between the financial reporting and tax basis of assets and liabilities, as well as for operating loss and tax credit carryforwards. Deferred tax assets and liabilities are measured using the tax rates that are expected to apply to taxable income for the years in which those tax assets and liabilities are expected to be realized or settled. In assessing the realizability of deferred tax assets, management reviews all available positive and negative evidence. Valuation allowances are recorded to reduce deferred tax assets to the amount we believe is more likely than not to be realized.
The tax effects from an uncertain tax position can be recognized in the financial statements only if the tax position would more likely than not be upheld on examination by the taxing authorities based on the merits of the tax position. Management is required to analyze all open tax years, as defined by the statute of limitations, for all jurisdictions. We accrue tax penalties and interest, if any, as incurred and recognize them within income tax (expense) benefit in the consolidated statements of operations and comprehensive loss.
Related Parties
We define related parties as members of our Board of Directors, entity affiliates, executive officers and principal owners of our outstanding stock and members of their immediate families. Related parties also include any other person or entity with significant influence over our management or operations.
SoFi Technologies, Inc.
SoFi Technologies, Inc.
Notes to Consolidated Financial Statements (continued)
(In Thousands, Unless Otherwise Stated and Except for Share and Per Share Data)
Warrant Liabilities – SoFiRecently Adopted Accounting Standards
Troubled Debt Restructurings and Vintage Disclosures
In March 2022, the FASB issued ASU 2022-02, Financial Instruments — Credit Losses (Topic 326): Troubled Debt Restructurings and Vintage Disclosures. The ASU addresses two topics: (i) TDR by creditors, and (ii) vintage disclosures for gross write offs. Under the TDR provisions, the ASU eliminates the recognition and measurement guidance under ASC 310-40, Receivables — Troubled Debt Restructurings by Creditors, and instead requires that an entity evaluate whether the modification represents a new loan or a continuation of an existing loan, consistent with the accounting for other loan modifications. Additionally, the ASU enhances existing disclosure requirements around TDRs and introduces new requirements related to certain modifications of receivables made to borrowers experiencing financial difficulty. Under the vintage disclosure provisions, the ASU requires the entity to disclose current period gross write offs by year of origination for financing receivables and net investments in leases within the scope of ASC 326-20, Financial Instruments — Credit Losses — Measured at Amortized Cost. The standard should be applied prospectively; however, for the TDR provisions, an entity has the option to apply a modified retrospective transition method. We adopted the standard effective January 1, 2023. The adoption of this standard did not have a material impact on our consolidated financial statements.
Recent Accounting Standards Issued, But Not Yet Adopted
Improvements to Reportable Segment Disclosures
In November 2023, the FASB issued ASU 2023-07, Segment Reporting (Topic 280) — Improvements to Reportable Segment Disclosures. The ASU improves reportable segment disclosure requirements, primarily through enhanced disclosures about significant segment expenses. The standard is effective for fiscal years beginning after December 15, 2023, and interim periods within fiscal years beginning after December 15, 2024. The standard should be applied retrospectively to all prior periods presented in the financial statements. We are currently evaluating the impact of this amendment on our consolidated financial statements.
Improvements to Income Tax Disclosures
In December 2023, the FASB issued ASU 2023-09, Income Taxes (Topic 740) — Improvements to Income Tax Disclosures. The ASU improves income tax disclosures primarily related to enhancements of the rate reconciliation and income taxes paid information. The standard is effective for annual periods beginning after December 15, 2024. The standard should be applied on a prospective basis with the option to apply the standard retrospectively. We are currently evaluating the impact of this amendment on our consolidated financial statements.
Note 2. Business Combinations
Merger with Social Capital Hedosophia Holdings Corp. V
On January 7, 2021, Social Finance entered into an agreement by and among Social Finance, SCH, a Cayman Islands exempted company limited by shares, and Plutus Merger Sub Inc., a Delaware corporation and a wholly owned subsidiary of SCH (“Merger Sub”), pursuant to which Merger Sub merged with and into Social Finance. Upon the Closing on May 28, 2021, the separate corporate existence of Merger Sub ceased and Social Finance survived the merger and became a wholly-owned subsidiary of SCH. On May 28, 2021, SCH also filed a notice of deregistration with the Cayman Islands Registrar of Companies, together with the necessary accompanying documents, and filed a certificate of incorporation and a certificate of corporate domestication with the Secretary of State of the State of Delaware, under which SCH was domesticated as a Delaware corporation, changing its name from “Social Capital Hedosophia Holdings Corp. V” to “SoFi Technologies, WarrantsInc.” These transactions are collectively referred to as the “Business Combination”.
PriorThe Business Combination was accounted for as a reverse recapitalization whereby SCH was determined to be the accounting acquiree and Social Finance to be the accounting acquirer. This accounting treatment was the equivalent of Social Finance issuing stock for the net assets of SCH, accompanied by a recapitalization whereby no goodwill or other intangible assets were recorded. Operations prior to the Business Combination SCH issued 8,000,000 private placement warrants to SCH Sponsor V LLC (the “Sponsor”) and 20,125,000 public warrants (collectively, “SoFi Technologies warrants”). Uponare those of Social Finance. At the Closing, we received gross cash consideration of the Business Combination, the Company assumed the SoFi Technologies warrants. Each whole warrant entitles the holder to purchase 1 share of Class A common stock, subject to adjustment, for an exercise price of $11.50 per share. The SoFi Technologies warrants became exercisable on October 14, 2021, except$764.8 million as described herein.
Once the SoFi Technologies warrants became exercisable, the Company could redeem the outstanding warrants, in whole, upon a minimum 30 days’ prior written notice of redemption (“Redemption Period”) under one of two potential scenarios. For purposes of the redemption scenarios, the “Reference Value” represented the last reported sale price of SoFi Technologies common stock for any 20 trading days within a 30-trading day period ending on the third trading day prior to the date on which we send the notice of redemption.
Prior to the Business Combination, SCH evaluated the public warrants and private placement warrants under ASC 815-40, Derivatives and Hedging – Contracts in Entity’s Own Equity, and concluded that they did not meet the criteria to be classified in permanent equity. Specifically, the settlement feature for the private placement warrants precluded them from being considered indexed to SCH’s own stock, given that a change in the holder of the private placement warrants may have altered the settlement of the private placement warrants. Since the holder of the instrument was not an input to a standard option pricing model (a consideration with respect to the indexation guidance), the fact that a change in the holder may impact the value of the private placement warrants meant the private placement warrants were not indexed to the SCH’s own stock. Further, a provision in the warrant agreement related to certain tender or exchange offers precluded the public warrants and private placement warrants from being accounted for as components of permanent equity. Since the public warrants and private placement warrants met the definition of a derivative under ASC 815, SCH recorded these warrants as liabilities on the balance sheet at fair value, with subsequent changes in their respective fair values recognized in earnings in accordance with ASC 820.
As the accounting acquirer in the Business Combination, and because there were no changes to the terms and conditions of the warrant agreement, SoFi Technologies warrants continued to be classified as derivative liabilities subsequent to the Business Combination, subject to recurring fair value measurement under ASC 820, with changes in fair value recognized in the consolidated statements of operations and comprehensive income (loss) in the period of change.
Following the Business Combination, 28,125,000 shares of common stock were issuable upon the exercise of the SoFi Technologies warrants, which were initially valued at $200,250.
On November 4, 2021, we announced that we would redeem all outstanding SoFi Technologies warrants that remained outstanding at 5:00 p.m. New York City time on December 6, 2021 (the “Redemption Date”) for a redemption price of $0.10 per warrant. The Warrants were exercisable by the holders thereof until 5:00 p.m. New York City time on the Redemption Date to purchase fully paid and non-assessable shares of common stock underlying such warrants. Payment upon exercise of the warrants was made either (i) in cash, at an exercise price of $11.50 per share of common stock, or (ii) on a “cashless basis” in which the exercising holder received a number of shares of common stock determined in accordance with the terms of the warrant agreement and based on the Redemption Date and the volume weighted average price (the “fair market value”) of the common stock during the 10 trading days immediately following November 4, 2021, which the Company provided holders no later than one business day after the 10-trading day period ended. In no event did the number of shares of common stock issued in connection with an exercise on a cashless basis exceed 0.361 shares of common stock per warrant.
Any warrants that remained unexercised on the Redemption Date were void and no longer exercisable, and the holders of those warrants received the redemption price of $0.10 per warrant, which represented an immaterial cash payment by the Company. Following the Redemption Date, the Company had no SoFi Technologies warrants outstanding. In connection with the redemption, the SoFi Technologies Warrants ceased trading on the Nasdaq Global Select Market and were delisted, with the trading halt announced after close of market on December 6, 2021.
As a result of warrant exercises and redemptions, we issued 15,193,668 sharesthe reverse recapitalization, which was then reduced by: (i) a redemption of redeemable common stock and received cash proceeds(classified as temporary equity) of $95,047, as well as reclassified $185,762 from liabilities$150.0 million, (ii) a special payment made to equity. The Company measured the fair value of the warrant liabilities on a daily basis determined as the opening number of warrants outstanding multiplied by the closing price of SOFIW and adjusted for any warrant exercises, with fair value changes recorded within noninterest expense—general andour
SoFi Technologies, Inc.
SoFi Technologies, Inc.
Notes to Consolidated Financial Statements (continued)
(In Thousands, Unless Otherwise Stated and Except for Share and Per Share Data)
administrativeSeries 1 preferred stockholders of $21.2 million (which was expensed as incurred), and (iii) our equity issuance costs of $27.5 million, consisting of advisory, legal, share registration and other professional fees, which were recorded within additional paid-in capital as a reduction of proceeds.
In connection with the Business Combination, SCH entered into subscription agreements with certain investors (the “Third Party PIPE Investors”), whereby it issued 122,500,000 shares of common stock at $10.00 per share (“PIPE Shares”) for an aggregate purchase price of $1.225 billion (“PIPE Investment”), which closed simultaneously with the consummation of the Business Combination. Upon the Closing, the PIPE Shares were automatically converted into shares of SoFi Technologies common stock on a one-for-one basis.
Upon the Closing, holders of Social Finance common stock received shares of SoFi Technologies common stock in an amount determined by application of the exchange ratio of 1.7428 (“Exchange Ratio”), which was based on Social Finance’s implied price per share prior to the Business Combination. Additionally, holders of Social Finance preferred stock (with the exception of the Series 1 preferred stockholders) received shares of SoFi Technologies common stock in amounts determined by application of either the Exchange Ratio or a multiplier of the Exchange Ratio, as provided by the Agreement.
Acquisition of Golden Pacific Bancorp, Inc.
On February 2, 2022, we acquired Golden Pacific, pursuant to an Agreement and Plan of Merger dated as of March 8, 2021 by and among the Company, a wholly-owned subsidiary of the Company, and Golden Pacific. In the business combination, we acquired all of the outstanding equity interests in Golden Pacific for total cash purchase consideration of $22.3 million (the “Bank Merger”). The acquisition was not determined to be a significant acquisition. After closing the Bank Merger, we became a bank holding company and Golden Pacific began operating as SoFi Bank. We are duly registered as a bank holding company with the Federal Reserve. SoFi Bank is a national banking association whose primary federal regulator is the OCC. Deposit accounts of SoFi Bank are insured by the FDIC through the Deposit Insurance Fund to the fullest extent permitted by law.
The closing of the Bank Merger was subject to regulatory approval. On January 18, 2022, we received approval from the Federal Reserve of our application to become a bank holding company under the Bank Holding Company Act, and we received conditional approval from the OCC to close the Bank Merger. The OCC also approved our application to change the composition of Golden Pacific’s assets in connection with the Bank Merger. The OCC conditional approval imposed a number of conditions, including that SoFi Bank have initial paid-in capital of no less than $750 million and adhere to an operating agreement. Golden Pacific’s community bank business continues to operate as a division of SoFi Bank.
A portion of the total cash purchase consideration ($0.6 million) was held back by the Company to satisfy any indemnification or certain other obligations (“Holdback Amount”), as certain legal proceedings with which Golden Pacific is involved as a plaintiff were not resolved at the time the Bank Merger closed. During 2022, we incurred costs associated with the litigation involving Golden Pacific as a plaintiff in excess of the Holdback Amount. Therefore, none of the Holdback Amount will be released to the Golden Pacific shareholders. Additionally, we held back a $3.3 million payable to a dissenting Golden Pacific shareholder pending resolution of the shareholder’s dissenter’s rights appraisal claim. During the fourth quarter of 2023, the appraisal claim was settled and payment was released.
Acquisition of Technisys S.A.
On March 3, 2022, we acquired Technisys S.A., a Luxembourg société anonyme, (“Technisys”), pursuant to an Agreement and Plan of Merger dated as of February 19, 2022 and amended as of March 3, 2022, by and among the Company, Technisys, Atom New Delaware, Inc., a Delaware corporation and a wholly owned subsidiary of Atom, and Atom Merger Sub Corporation, a Delaware corporation and wholly owned subsidiary of SoFi Technologies (the “Technisys Merger”). In the business combination, we acquired all of the outstanding equity interests in Technisys for a preliminary purchase consideration of $915.4 million. During the third quarter of 2022, we finalized the closing net working capital calculation specified in the consolidated statementsmerger agreement, which resulted in a reduction to the equity consideration of operations155,794 shares, representing an adjustment to the total purchase consideration of $1,665, and comprehensive income (loss). Duringa corresponding reduction to the year ended December 31, 2021, we recordedcarrying value of recognized goodwill. The remaining 442,274 shares that were held in escrow associated with the working capital calculation were released to the former Technisys shareholders. The finalized closing net working capital calculation did not impact the estimated fair value gains of $14,488.
Note 10. Debt
The following table summarizes the Company’s principal outstanding debt, unamortized debt discounts/premiums and unamortized debt issuance costs asvalues of the dates indicated:
| | | | | | | | | | | | | | | | | | | | | | | | | | | | | | | | | | | | | | |
| | | | | | | | | | Outstanding as of |
| Borrowing Description | | Collateral Balances(1) | | Interest Rate(2) | | Termination/ Maturity(3) | | Total Capacity(4) | | December 31, 2021(5) | | December 31, 2020 |
| Student Loan Warehouse Facilities | | | | | | | | | | | | |
| SoFi Funding I | | $ | — | | | 1ML + 125 bps | | April 2022 | | $ | 200,000 | | | $ | — | | | $ | 374,575 | |
SoFi Funding III(6) | | 4,440 | | | PR – 134 bps | | September 2024 | | 75,000 | | | 3,930 | | | 30,170 | |
SoFi Funding V(7) | | — | | | 1ML + 135 bps | | May 2023 | | 350,000 | | | — | | | — | |
| SoFi Funding VI | | 60,614 | | | 3ML + 125 bps | | March 2024 | | 600,000 | | | 56,709 | | | 432,437 | |
| SoFi Funding VII | | 313,726 | | | SOFR + 85 bps | | September 2024 | | 500,000 | | | 284,475 | | | 276,910 | |
| SoFi Funding VIII | | 269,254 | | | 1ML + 90 bps | | May 2022 | | 300,000 | | | 245,723 | | | 221,342 | |
SoFi Funding IX(8) | | 10,417 | | | SOFR+ 210 bps and CP + 87.5 bps | | May 2025 | | 500,000 | | | 9,816 | | | 70,780 | |
SoFi Funding X(9) | | 33,423 | | | CP + 125 bps | | April 2024 | | 400,000 | | | 29,647 | | | 44,136 | |
SoFi Funding XI(10) | | — | | | CP + 115 bps | | November 2023 | | 500,000 | | | — | | | 87,404 | |
SoFi Funding XII(11) | | 25,087 | | | CP + 115 bps | | November 2024 | | 200,000 | | | 20,267 | | | — | |
| SoFi Funding XIII | | 481,731 | | | SOFR + 55 bps | | April 2024 | | 450,000 | | | 424,348 | | | — | |
| Total, before unamortized debt issuance costs | | $ | 1,198,692 | | | | | | | $ | 4,075,000 | | | $ | 1,074,915 | | | $ | 1,537,754 | |
| Unamortized debt issuance costs | | | | | | | | | | $ | (7,540) | | | $ | (7,940) | |
| Weighted average effective interest rate | | | | | | | | | | 1.45 | % | | 2.29 | % |
| | | | | | | | | | | | |
| Personal Loan Warehouse Facilities | | | | | | | | | | | | |
SoFi Funding PL I(12) | | $ | 14,516 | | | CP + 137.5 bps | | September 2023 | | $ | 250,000 | | | $ | 11,911 | | | $ | — | |
| SoFi Funding PL II | | — | | | 3ML + 225 bps | | July 2023 | | 400,000 | | | — | | | 137,420 | |
| SoFi Funding PL III | | — | | | 1ML + 175 bps | | May 2023 | | 250,000 | | | — | | | 2,793 | |
SoFi Funding PL IV(13) | | — | | | CP + 170 bps | | November 2023 | | 500,000 | | | — | | | 132,416 | |
SoFi Funding PL VI(14) | | — | | | CP + 170 bps | | September 2024 | | 50,000 | | | — | | | 107,595 | |
| SoFi Funding PL VII | | 88,976 | | | 1ML + 115 bps | | June 2022 | | 250,000 | | | 71,572 | | | 15,610 | |
| SoFi Funding PL X | | — | | | 1ML + 142.5 bps | | February 2023 | | 200,000 | | | — | | | 3,004 | |
| SoFi Funding PL XI | | — | | | 1ML + 170 bps | | January 2022 | | 200,000 | | | — | | | 112,478 | |
| SoFi Funding PL XII | | — | | | 1ML + (225-315 bps) | | June 2021 | | — | | | — | | | 127,724 | |
| SoFi Funding PL XIII | | — | | | 1ML + 175 bps | | January 2030 | | 300,000 | | | — | | | 219,362 | |
SoFi Funding PL XIV(15) | | 168,624 | | | 1ML + 90 bps | | October 2024 | | 300,000 | | | 144,662 | | | — | |
| Total, before unamortized debt issuance costs | | $ | 272,116 | | | | | | | $ | 2,700,000 | | | $ | 228,145 | | | $ | 858,402 | |
| Unamortized debt issuance costs | | | | | | | | | | $ | (3,898) | | | $ | (6,692) | |
| Weighted average effective interest rate | | | | | | | | | | 2.08 | % | | 3.63 | % |
| | | | | | | | | | | | |
| Home Loan Warehouse Facilities | | | | | | | | | | | | |
| Mortgage Warehouse VI | | $ | — | | | SOFR + 200 bps | | October 2022 | | $ | 1,000 | | | $ | — | | | $ | — | |
| Total, before unamortized debt issuance costs | | $ | — | | | | | | | $ | 1,000 | | | $ | — | | | $ | — | |
| | | | | | | | | | | | |
| Weighted average effective interest rate | | | | | | | | | | — | % | | — | % |
| | | | | | | | | | | | |
| Credit Card Warehouse Facilities | | | | | | | | | | | | |
SoFi Funding CC I LLC(16) | | $ | 14,471 | | | CP + 175 bps | | October 2022 | | $ | 100,000 | | | $ | 11,810 | | | $ | — | |
| Total, before unamortized debt issuance costs | | $ | 14,471 | | | | | | | $ | 100,000 | | | $ | 11,810 | | | $ | — | |
| Unamortized debt issuance costs | | | | | | | | | | $ | (312) | | | $ | — | |
| Weighted average effective interest rate | | | | | | | | | | 6.39 | % | | — | % |
| | | | | | | | | | | | |
SoFi Technologies, Inc.
SoFi Technologies, Inc.
Notes to Consolidated Financial Statements (continued)
(In Thousands, Unless Otherwise Stated and Except for Share and Per Share Data)
| | | | | | | | | | | | | | | | | | | | | | | | | | | | | | | | | | | | | | |
| | | | | | | | | | Outstanding as of |
| Borrowing Description | | Collateral Balances(1) | | Interest Rate(2) | | Termination/ Maturity(3) | | Total Capacity(4) | | December 31, 2021(5) | | December 31, 2020 |
Risk Retention Warehouse Facilities(17) | | | | | | | | | | | | |
| SoFi RR Funding I | | $ | 28,407 | | | 3ML + 200 bps | | January 2024 | | $ | 100,000 | | | $ | 22,608 | | | $ | 54,304 | |
| SoFi RR Repo | | 84,240 | | | 3ML + 185 bps | | June 2023 | | 192,141 | | | 69,843 | | | 75,863 | |
| SoFi C RR Repo | | — | | | 3ML + (180-185 bps) | | December 2021 | | | | — | | | 42,757 | |
| SoFi RR Funding II | | 109,204 | | | 1ML + 125 bps | | November 2024 | | | | 98,031 | | | 160,199 | |
| SoFi RR Funding III | | 43,334 | | | 1ML + 125 bps | | November 2024 | | | | 39,158 | | | 60,786 | |
SoFi RR Funding IV(7) | | 81,797 | | | 1ML + 150 bps | | October 2027 | | 100,000 | | | 66,555 | | | 37,334 | |
| SoFi RR Funding V | | 54,791 | | | 298 bps | | December 2025 | | | | 29,453 | | | — | |
| Total, before unamortized debt issuance costs | | $ | 401,773 | | | | | | | | | $ | 325,648 | | | $ | 431,243 | |
| Unamortized debt issuance costs | | | | | | | | | | $ | (2,086) | | | $ | (2,052) | |
| Weighted average effective interest rate | | | | | | | | | | 2.00 | % | | 2.24 | % |
| | | | | | | | | | | | |
| Revolving Credit Facility | | | | | | | | | | | | |
SoFi Corporate Revolver(18)(19) | | n/a | | 1ML + 100 bps | | September 2023 | | $ | 560,000 | | | $ | 486,000 | | | $ | 486,000 | |
| Total, before unamortized debt issuance costs | | | | | | | | $ | 560,000 | | | $ | 486,000 | | | $ | 486,000 | |
| Unamortized debt issuance costs | | | | | | | | | | $ | (626) | | | $ | (987) | |
| Weighted average effective interest rate | | | | | | | | | | 1.18 | % | | 1.26 | % |
| | | | | | | | | | | | |
Convertible senior notes(20) | | n/a | | 0.00% | | October 2026 | | | | $ | 1,200,000 | | | $ | — | |
| Total, before unamortized debt issuance costs and discount | | | | | | | | | | $ | 1,200,000 | | | $ | — | |
| Unamortized debt issuance costs | | | | | | | | | | $ | (1,634) | | | $ | — | |
| Unamortized discount | | | | | | | | | | (22,858) | | | — | |
| Weighted average effective interest rate | | | | | | | | | | 0.43 | % | | — | % |
| | | | | | | | | | | | |
Seller note(21) | | n/a | | 1000 bps | | February 2021 | | | | $ | — | | | $ | 250,000 | |
| Total | | | | | | | | | | $ | — | | | $ | 250,000 | |
| | | | | | | | | | | | |
| Weighted average effective interest rate | | | | | | | | | | 10.00 | % | | 10.00 | % |
| | | | | | | | | | | | |
Other financing – various notes(21) | | n/a | | 331 – 547 bps | | July 2021 | | | | $ | — | | | $ | 4,375 | |
| Total | | | | | | | | | | $ | — | | | $ | 4,375 | |
| | | | | | | | | | | | |
| Weighted average effective interest rate | | | | | | | | | | 3.58 | % | | 3.64 | % |
| | | | | | | | | | | | |
| Student Loan Securitizations | | | | | | | | | | | | |
| SoFi PLP 2016-B LLC | | $ | 48,821 | | | 1ML + (120-380 bps) | | April 2037 | | | | $ | 43,186 | | | $ | 69,448 | |
| SoFi PLP 2016-C LLC | | 55,662 | | | 1ML + (110-335 bps) | | May 2037 | | | | 49,685 | | | 81,115 | |
| SoFi PLP 2016-D LLC | | 69,636 | | | 1ML + (95-323 bps) | | January 2039 | | | | 61,760 | | | 93,942 | |
| SoFi PLP 2016-E LLC | | 81,975 | | | 1ML + (85-443 bps) | | October 2041 | | | | 74,242 | | | 117,800 | |
| SoFi PLP 2017-A LLC | | 102,677 | | | 1ML + (70-443 bps) | | March 2040 | | | | 92,972 | | | 146,064 | |
| SoFi PLP 2017-B LLC | | 86,686 | | | 274 – 444 bps | | May 2040 | | | | 78,811 | | | 129,873 | |
| SoFi PLP 2017-C LLC | | 113,022 | | | 1ML + (60-421 bps) | | July 2040 | | | | 102,814 | | | 161,897 | |
| Total, before unamortized debt issuance costs and discount | | $ | 558,479 | | | | | | | | | $ | 503,470 | | | $ | 800,139 | |
| Unamortized debt issuance costs | | | | | | | | | | $ | (3,851) | | | $ | (5,958) | |
| Unamortized discount | | | | | | | | | | (1,094) | | | (1,654) | |
| Weighted average effective interest rate | | | | | | | | | | 3.30 | % | | 3.22 | % |
| | | | | | | | | | | | |
| | | | | |
Fair value of common stock issued(1) | $ | 873,377 | |
| Amounts payable to settle vested employee performance awards | 37,297 | |
Fair value of awards assumed(2) | 2,855 | |
| Settlement of pre-combination transactions between acquirer and acquiree | 235 | |
| Total purchase consideration | $ | 913,764 | |
___________________
(1) Reflects the shares of SoFi common stock issued in the acquisition of 81,700,318, multiplied by the closing stock price of SoFi common stock on the closing date of the Technisys Merger. Additionally, these shares are inclusive of 6,305,595 shares that were held in escrow.
(2) We contemporaneously converted outstanding performance awards into RSUs to acquire common stock of SoFi (“Replacement Awards”). The fair value of awards assumed in the purchase consideration was based on the closing stock price of SoFi common stock on the closing date of the Technisys Merger.
We settled vested employee performance awards, which were a component of the purchase consideration above, with payments during the years ended December 31, 2023 and 2022 of $19,656 and $17,641, respectively. During the year ended December 31, 2023, we released 6,259,736 escrow shares during the second and fourth quarters of 2023. The remaining 45,859 shares continue to be held in escrow pending resolution of outstanding indemnification claims by SoFi.
The following unaudited supplemental pro forma financial information presents the Company’s consolidated results of operations as if the business combination had occurred on January 1, 2020:
| | | | | | | | | | | | | | | | |
| | Year Ended December 31, |
| | 2022 | | 2021 | | |
| Total net revenue | | $ | 1,584,439 | | | $ | 1,055,219 | | | |
| Net loss | | (311,512) | | | (512,785) | | | |
The unaudited supplemental pro forma financial information is presented for comparative purposes only and is not necessarily indicative of the actual results of operations that would have been achieved, nor is it indicative of future results of operations. The unaudited supplemental pro forma financial information reflects pro forma adjustments that give effect to applying the Company’s accounting policies and certain events the Company believes to be directly attributable to the acquisition. The pro forma adjustments primarily include:
•incremental straight-line amortization expense associated with acquired intangible assets;
•an adjustment to reflect post-combination share-based compensation expense associated with the Replacement Awards as if the conversion had occurred on January 1, 2020;
•an adjustment to reflect acquisition-related costs for both parties as if they were incurred during the earliest period presented; and
•the related income tax effects, at the statutory tax rate applicable for each period, of the pro forma adjustments noted above.
The unaudited supplemental pro forma financial information does not give effect to any anticipated cost savings, operating efficiencies or other synergies that may be associated with the acquisition, or any estimated costs that have been or will be incurred by the Company to integrate the assets and operations of Technisys.
Acquisition of Wyndham Capital Mortgage
On April 3, 2023, we acquired all of the outstanding equity interests in Wyndham for cash consideration. With the acquisition of Wyndham, a fintech mortgage lender, we broadened our suite of home loan products and now manage the technology for a digitized mortgage experience. The acquisition is being accounted for as a business combination. The purchase consideration is being allocated to the tangible and intangible assets acquired and liabilities assumed based on the estimated fair values as of the acquisition date. The excess of the total purchase consideration over the fair value of the net assets acquired is allocated to goodwill, which is expected to be deductible for tax purposes. The fair value estimates are subject to change for up
SoFi Technologies, Inc.
SoFi Technologies, Inc.
Notes to Consolidated Financial Statements (continued)
(In Thousands, Unless Otherwise Stated and Except for Share and Per Share Data)
| | | | | | | | | | | | | | | | | | | | | | | | | | | | | | | | | | | | | | |
| | | | | | | | | | Outstanding as of |
| Borrowing Description | | Collateral Balances(1) | | Interest Rate(2) | | Termination/ Maturity(3) | | Total Capacity(4) | | December 31, 2021(5) | | December 31, 2020 |
| Personal Loan Securitizations | | | | | | | | | | | | |
| SoFi CLP 2016-1 LLC | | $ | — | | | 326 bps | | December 2021 | | | | $ | — | | | $ | 36,546 | |
| SoFi CLP 2016-2 LLC | | — | | | 477 bps | | December 2021 | | | | — | | | 37,973 | |
| SoFi CLP 2016-3 LLC | | — | | | 449 bps | | September 2021 | | | | — | | | 30,780 | |
| SoFi CLP 2018-3 LLC | | 82,550 | | | 402 – 467 bps | | August 2027 | | | | 76,535 | | | 163,784 | |
| SoFi CLP 2018-4 LLC | | 93,564 | | | 417 – 476 bps | | November 2027 | | | | 86,835 | | | 184,831 | |
| SoFi CLP 2018-3 Repack LLC | | — | | | 200 bps | | March 2021 | | | | — | | | 2,457 | |
| SoFi CLP 2018-4 Repack LLC | | — | | | 200 bps | | June 2021 | | | | — | | | 5,853 | |
| Total, before unamortized debt issuance costs, premiums and discount | | $ | 176,114 | | | | | | | | | $ | 163,370 | | | $ | 462,224 | |
| Unamortized debt issuance costs | | | | | | | | | | $ | (1,683) | | | $ | (3,057) | |
| Unamortized premium (discount) | | | | | | | | | | 207 | | | (2,872) | |
| Weighted average effective interest rate | | | | | | | | | | 4.58 | % | | 4.47 | % |
| | | | | | | | | | | | |
| Total, before unamortized debt issuance costs, premiums and discounts | | | | | | | | | | $ | 3,993,358 | | | $ | 4,830,137 | |
| Less: unamortized debt issuance costs, premiums and discounts | | | | | | | | | | (45,375) | | | (31,212) | |
| Total reported debt | | | | | | | | | | $ | 3,947,983 | | | $ | 4,798,925 | |
In each of our revenue arrangements, revenue is recognized when control of the promised goods or services is transferred to the customer in an amount that reflects our expected consideration in exchange for those goods or services.
Technology Products and Solutions
We earn fees for providing an integrated platform as a service for financial and non-financial institutions. Within our technology products and solutions fee arrangements, certain contracts contain a provision for a fixed, upfront implementation fee related to setup activities, which represents an advance payment for future technology platform services provided over the contract term. These implementation fees are recognized ratably over the contract life.
Commencing in March 2022 with the Technisys Merger, we earn subscription and service fees for providing software licenses and associated services, including implementation and maintenance. We charge a recurring subscription fee for the software license and related maintenance services. Other software-related services are billed on a periodic basis as the services are provided. Certain arrangements for software and related services contain a provision for a fixed upfront payment.
We recognize revenue related to software licenses at a point in time upon delivery of the license and the close of the user-acceptance testing period. When implementation services are distinct, we recognize revenue over time during the implementation period. We recognize maintenance services ratably over the contractual maintenance term. If a fixed upfront payment provides a material right to the customer, we recognize revenue associated with the material right over the period of benefit associated with the right to subscribe or renew a subscription, which is typically the product life.
We allocate fees charged for software and related services to our performance obligations on the basis of the relative standalone selling price. The standalone selling prices either represent the prices at which we separately sell each license or service or are estimated using available information, such as market conditions and internal pricing policies. The standalone selling price of the software license and maintenance are determined based on the complexity and size of the license.
Payments to customers: We may provide incentives to our technology platform customers, which may be payable up front or applied to future or past technology products and solutions fees. Evaluating whether such incentives are payments to a customer requires judgment. When we determine that an incentive is consideration payable to a customer, the incentive is recorded as a reduction of revenue. Incentives that represent consideration payable to a customer may also contain variable consideration. Therefore, such incentives are constraints on the revenue expected to be realized. Upfront customer incentives are recorded as prepaid assets and presented within other assets in the consolidated balance sheets, and are applied against revenue in the period such incentives are earned by the customer. Any incentive in excess of cumulative revenue is expensed as a contract cost.
Referrals
We earn specified referral fees in connection with certain referral activities we facilitate through our platform. In one type of referral arrangement, we refer end users through our platform to third-party enterprise partners. Our referral fee is calculated as either a fixed price per successful referral or a percentage of the transaction volume between the enterprise partners and referred consumers. In another type of referral arrangement, we earn referral fulfillment fees for providing pre-qualified borrower referrals to a third-party partner who separately contracts with a loan originator. Our referral fees are based on the referred loan amount, subject to a referral fulfillment fee penalty if a loan is determined to be ineligible and becomes a charged-off loan as defined in the contract. We recognize revenue for each originated loan, less the estimated referral fulfillment fee penalty. The estimated referral fulfillment fee penalty was immaterial as of December 31, 2023 and 2022.
Interchange
We earn interchange fees from debit and credit cardholder transactions conducted through payment networks. Interchange fees from cardholder transactions represent a percentage of the underlying transaction value and are recognized
SoFi Technologies, Inc.
SoFi Technologies, Inc.
Notes to Consolidated Financial Statements (continued)
(In Thousands, Unless Otherwise Stated and Except for Share and Per Share Data)
daily, concurrently with the transaction processing services provided to the cardholder. Interchange is presented net of cardholder rewards associated with card transactions.
Brokerage
We earn fees in connection with facilitating investment-related transactions through our platform, which we refer to as brokerage revenue. Our brokerage revenue performance obligation is generally completely satisfied upon the completion of an investment-related transaction. In general, we act as the agent in these arrangements as we do not oversee the execution of the transactions and ultimately lack the requisite control.
Disaggregated Revenue
The table below presents revenue from contracts with customers disaggregated by type of service, which best depicts how the revenue and cash flows are affected by economic factors, and by the reportable segment to which each revenue stream relates, as well as a reconciliation of total revenue from contracts with customers to total noninterest income. Revenue from contracts with customers is presented within noninterest income—technology products and solutions and noninterest income—other in the consolidated statements of operations and comprehensive loss. There were no revenues from contracts with customers attributable to our Lending segment for any of the years presented.
| | | | | | | | | | | | | | | | | |
| Year Ended December 31, |
| 2023 | | 2022 | | 2021 |
| Financial Services | | | | | |
| Referrals | $ | 38,443 | | | $ | 36,052 | | | $ | 15,750 | |
| Interchange | 35,247 | | | 17,391 | | | 10,642 | |
| Brokerage | 21,127 | | | 15,446 | | | 22,733 | |
Other(1) | 2,647 | | | 2,245 | | | 5,541 | |
| Total financial services | $ | 97,464 | | | $ | 71,134 | | | $ | 54,666 | |
Technology Platform(2) | | | | | |
| Technology services | 319,845 | | | 299,379 | | | 191,847 | |
Other(1) | 4,145 | | | 6,583 | | | 1,205 | |
| Total technology platform | 323,990 | | | 305,962 | | | 193,052 | |
| Total revenue from contracts with customers | 421,454 | | | 377,096 | | | 247,718 | |
| Other Sources of Revenue | | | | | |
| | | | | |
| | | | | |
| Loan origination, sales, and securitizations | 371,812 | | | 565,372 | | | 482,764 | |
| Servicing | 37,328 | | | 43,547 | | | (2,281) | |
| Other | 30,455 | | | 3,424 | | | 4,427 | |
| Total other sources of revenue | $ | 439,595 | | | $ | 612,343 | | | $ | 484,910 | |
| Total noninterest income | $ | 861,049 | | | $ | 989,439 | | | $ | 732,628 | |
_____________________(1) Financial Services includes revenues from enterprise services and equity capital markets services. Technology Platform includes revenues from software licenses and associated services, and payment network fees for serving as a transaction card program manager for enterprise customers that are the program marketers for separate card programs.
(2) Related to these technology products and solutions arrangements, we had deferred revenue of $5,718 and $10,028 as of December 31, 2023 and 2022, respectively, which are presented within accounts payable, accruals and other liabilities in the consolidated balance sheets. During the years ended December 31, 2023, 2022 and 2021, we recognized revenue of $8,327, $7,773 and $685, respectively, associated with deferred revenue within noninterest income—technology products and solutions in the consolidated statements of operations and comprehensive loss.
Contract Balances
As of December 31, 2023 and 2022, accounts receivable, net associated with revenue from contracts with customers was $60,466 and $61,226, respectively, which were reported within other assets in the consolidated balance sheets.
SoFi Technologies, Inc.
SoFi Technologies, Inc.
Notes to Consolidated Financial Statements (continued)
(In Thousands, Unless Otherwise Stated and Except for Share and Per Share Data)
Note 4. Loans
As of December 31, 2023, our loan portfolio consisted of (i) loans held for sale, including personal loans and home loans, which are measured at fair value under the fair value option, (ii) loans held for investment, including student loans, which are measured at fair value under the fair value option, and (iii) loans held for investment, including senior secured loans, credit cards, and commercial and consumer banking loans, which are measured at amortized cost. Below is a disaggregated presentation of our loans, inclusive of fair market value adjustments and accrued interest income and net of the allowance for credit losses, as applicable:
| | | | | | | | | | | |
| December 31, |
| 2023 | | 2022 |
| Loans held for sale | | | |
Personal loans(1) | $ | 15,330,573 | | | $ | 8,610,434 | |
Student loans(2) | — | | | 4,877,177 | |
| Home loans | 66,198 | | | 69,463 | |
| Total loans held for sale, at fair value | 15,396,771 | | | 13,557,074 | |
Loans held for investment(3) | | | |
Student loans(4) | 6,725,484 | | | — | |
| Total loans held for investment, at fair value | 6,725,484 | | | — | |
| Senior secured loans | 446,463 | | | — | |
| Credit card | 272,628 | | | 209,164 | |
| Commercial and consumer banking: | | | |
| Commercial real estate | 106,326 | | | 88,652 | |
| Commercial and industrial | 6,075 | | | 7,179 | |
| Residential real estate and other consumer | 4,667 | | | 2,962 | |
| Total commercial and consumer banking | 117,068 | | | 98,793 | |
Total loans held for investment, at amortized cost(3) | 836,159 | | | 307,957 | |
| Total loans held for investment | 7,561,643 | | | 307,957 | |
| Total loans | $ | 22,958,414 | | | $ | 13,865,031 | |
_____________________
(1) Includes $502,757 and $663,004 of personal loans in consolidated VIEs as of December 31, 2023 and 2022, respectively.
(2) Includes $268,697 of student loans in consolidated VIEs as of December 31, 2022.
(3) See Note 1. Organization, Summary of Significant Accounting Policies and New Accounting Standards and Note 5. Allowance for Credit Losses for additional information on our loans at amortized cost as it pertains to the allowance for credit losses.
(4) As of December 31, 2023, includes $2,459,103 of student loans covered by financial guarantees, and $221,461 of student loans in consolidated VIEs.
SoFi Technologies, Inc.
SoFi Technologies, Inc.
Notes to Consolidated Financial Statements (continued)
(In Thousands, Unless Otherwise Stated and Except for Share and Per Share Data)
Loans Measured at Fair Value
The following table summarizes the aggregate fair value of our loans for which we elected the fair value option. See Note 15. Fair Value Measurements for the assumptions used in our fair value model.
| | | | | | | | | | | | | | | | | | | | | | | |
| Personal Loans | | Student Loans | | Home Loans | | Total |
| December 31, 2023 | | | | | | | |
| Unpaid principal | $ | 14,498,629 | | | $ | 6,445,586 | | | $ | 67,406 | | | $ | 21,011,621 | |
| Accumulated interest | 114,541 | | | 34,357 | | | 92 | | | 148,990 | |
| Cumulative fair value adjustments | 717,403 | | | 245,541 | | | (1,300) | | | 961,644 | |
Total fair value of loans(1) | $ | 15,330,573 | | | $ | 6,725,484 | | | $ | 66,198 | | | $ | 22,122,255 | |
| December 31, 2022 | | | | | | | |
| Unpaid principal | $ | 8,283,400 | | | $ | 4,794,517 | | | $ | 77,705 | | | $ | 13,155,622 | |
| Accumulated interest | 55,673 | | | 19,433 | | | 151 | | | 75,257 | |
| Cumulative fair value adjustments | 271,361 | | | 63,227 | | | (8,393) | | | 326,195 | |
Total fair value of loans(1) | $ | 8,610,434 | | | $ | 4,877,177 | | | $ | 69,463 | | | $ | 13,557,074 | |
_____________________(1) Each component of the fair value of loans is impacted by charge-offs during the period. Our fair value assumption for annual default rate incorporates fair value markdowns on loans beginning when they are 10 days or more delinquent, with additional markdowns at 30, 60 and 90 days past due.
The following table summarizes the aggregate fair value of loans 90 days or more delinquent. As delinquent personal loans and student loans are charged off after 120 days of delinquency, amounts presented below represent the fair value of loans that are 90 to 120 days delinquent.
| | | | | | | | | | | | | | | | | | | | | | | |
| Personal Loans | | Student Loans | | Home Loans | | Total |
| December 31, 2023 | | | | | | | |
| Unpaid principal balance | $ | 81,591 | | | $ | 8,446 | | | $ | 495 | | | $ | 90,532 | |
| Accumulated interest | 4,023 | | | 187 | | | 6 | | | 4,216 | |
Cumulative fair value adjustments(1) | (70,191) | | | (5,021) | | | (248) | | | (75,460) | |
| Fair value of loans 90 days or more delinquent | $ | 15,423 | | | $ | 3,612 | | | $ | 253 | | | $ | 19,288 | |
| December 31, 2022 | | | | | | | |
| Unpaid principal balance | $ | 27,989 | | | $ | 6,435 | | | $ | — | | | $ | 34,424 | |
| Accumulated interest | 1,207 | | | 304 | | | — | | | 1,511 | |
Cumulative fair value adjustments(1) | (25,022) | | | (3,332) | | | — | | | (28,354) | |
| Fair value of loans 90 days or more delinquent | $ | 4,174 | | | $ | 3,407 | | | $ | — | | | $ | 7,581 | |
__________________
(1) Our fair value assumption for annual default rate incorporates fair value markdowns on loans beginning when they are 10 days or more delinquent, with additional markdowns at 30, 60 and 90 days past due.
Transfers of Financial Assets
We regularly transfer financial assets and account for such transfers as either sales or secured borrowings depending on the facts and circumstances of the transfer. When a transfer of financial assets qualifies as a sale, in many instances we have continuing involvement as the servicer of those financial assets. As we expect the benefits of servicing to be more than just adequate, we recognize a servicing asset. Further, in the case of securitization-related transfers that qualify as sales, we have additional continuing involvement as an investor, albeit at insignificant levels relative to the expected gains and losses of the securitization. In instances where a transfer is accounted for as a secured borrowing, we perform servicing (but we do not recognize a servicing asset) and typically maintain a significant investment relative to the expected gains and losses of the securitization. In whole loan sales, we do not have a residual financial interest in the loans, nor do we have any other power over the loans that would constrain us from recognizing a sale. Additionally, we generally have no repurchase requirements related to transfers of personal loans, student loans and non-GSE home loans other than standard origination representations and warranties, for which we record a liability based on expected repurchase obligations. For GSE home loans, we have customary
SoFi Technologies, Inc.
SoFi Technologies, Inc.
Notes to Consolidated Financial Statements (continued)
(In Thousands, Unless Otherwise Stated and Except for Share and Per Share Data)
GSE repurchase requirements, which do not constrain sale treatment but result in a liability for the expected repurchase requirement.
The following table summarizes our personal loan and student loan securitization transfers qualifying for sale accounting treatment. There were no loan securitization transfers qualifying for sale accounting treatment during the year ended December 31, 2022.
| | | | | | | | | | | | | |
| Year Ended December 31, |
| 2023 | | | | 2021 |
| Personal loans | | | | | |
| Fair value of consideration received: | | | | | |
| Cash | $ | 359,927 | | | | | $ | 1,050,062 | |
| Securitization investments | 18,985 | | | | | 55,491 | |
| | | | | |
| Servicing assets recognized | 15,975 | | | | | 6,003 | |
| Repurchase liabilities recognized | (113) | | | | | — | |
| Total consideration | 394,774 | | | | | 1,111,556 | |
| Aggregate unpaid principal balance and accrued interest of loans sold | 375,770 | | | | | 1,054,171 | |
| Gain from loan sales | $ | 19,004 | | | | | $ | 57,385 | |
| Student loans | | | | | |
| Fair value of consideration received: | | | | | |
| Cash | $ | — | | | | | $ | 1,187,714 | |
| Securitization investments | — | | | | | 62,783 | |
| | | | | |
| Servicing assets recognized | — | | | | | 36,948 | |
| Total consideration | — | | | | | 1,287,445 | |
| Aggregate unpaid principal balance and accrued interest of loans sold | — | | | | | 1,227,379 | |
| Gain from loan sales | $ | — | | | | | $ | 60,066 | |
Deconsolidation of debt reflects the impacts of previously consolidated VIEs that became deconsolidated during the period because we no longer hold a significant financial interest in the underlying securitization entity, which can fluctuate from period to period. Gains and losses on deconsolidations are presented within noninterest income—loan origination, sales, and securitizations in the consolidatedstatements of operations and comprehensive loss. During the year ended December 31, 2023, we had deconsolidation of debt on student loans of $100.3 million. During the year ended December 31, 2022, we had deconsolidation of debt on personal loans of $70.6 million and on student loans of $126.0 million. For all periods, the impact on earnings from these deconsolidations was immaterial.
SoFi Technologies, Inc.
SoFi Technologies, Inc.
Notes to Consolidated Financial Statements (continued)
(In Thousands, Unless Otherwise Stated and Except for Share and Per Share Data)
The following table summarizes our whole loan sales:
| | | | | | | | | | | | | | | | | |
| Year Ended December 31, |
| 2023 | | 2022 | | 2021 |
| Personal loans | | | | | |
| Fair value of consideration received: | | | | | |
| Cash | $ | 567,904 | | | $ | 3,016,740 | | | $ | 3,373,655 | |
| Servicing assets recognized | 30,168 | | | 21,925 | | | 21,811 | |
| Repurchase liabilities recognized | (2,069) | | | (7,351) | | | (8,168) | |
| Total consideration received | 596,003 | | | 3,031,314 | | | 3,387,298 | |
| Aggregate unpaid principal balance and accrued interest of loans sold | 567,003 | | | 2,924,567 | | | 3,253,645 | |
| Realized gain | $ | 29,000 | | | $ | 106,747 | | | $ | 133,653 | |
| Student loans | | | | | |
| Fair value of consideration received: | | | | | |
| Cash | $ | 98,624 | | | $ | 883,859 | | | $ | 1,676,892 | |
| Servicing assets recognized | 2,792 | | | 9,275 | | | 15,526 | |
| Repurchase liabilities recognized | (16) | | | (134) | | | (300) | |
| Total consideration | 101,400 | | | 893,000 | | | 1,692,118 | |
| Aggregate unpaid principal balance and accrued interest of loans sold | 99,916 | | | 881,922 | | | 1,635,280 | |
| Realized gain | $ | 1,484 | | | $ | 11,078 | | | $ | 56,838 | |
| Home loans | | | | | |
| Fair value of consideration received: | | | | | |
| Cash | $ | 1,022,600 | | | $ | 1,057,596 | | | $ | 2,989,813 | |
| Servicing assets recognized | 10,184 | | | 13,926 | | | 31,294 | |
| Repurchase liabilities recognized | (1,765) | | | (1,158) | | | (3,288) | |
| Total consideration | 1,031,019 | | | 1,070,364 | | | 3,017,819 | |
| Aggregate unpaid principal balance and accrued interest of loans sold | 1,029,623 | | | 1,095,882 | | | 2,935,343 | |
| Realized gain (loss) | $ | 1,396 | | | $ | (25,518) | | | $ | 82,476 | |
For certain transferred loans that qualified for sale accounting and are, therefore, off-balance sheet, we have continuing involvement through our servicing agreements. For such loans, our exposure to loss is generally limited to the extent we would be required to repurchase such a loan due to a breach of representations and warranties associated with the loan transfer or servicing contract.
The following table presents information about the unpaid principal balances of loans originated by us and subsequently transferred, but with which we have continuing involvement:
| | | | | | | | | | | | | | | | | | | | | | | |
| Personal Loans | | Student Loans | | Home Loans | | Total |
| December 31, 2023 | | | | | | | |
| | | | | | | |
| Loans in delinquency (30+ days past due) | $ | 52,813 | | | $ | 60,989 | | | $ | 24,193 | | | $ | 137,995 | |
| Total loans in delinquency | 90,582 | | | 137,243 | | | 24,193 | | | 252,018 | |
Total transferred loans serviced(1) | 2,223,785 | | | 6,148,800 | | | 5,592,793 | | | 13,965,378 | |
| December 31, 2022 | | | | | | | |
| | | | | | | |
| Loans in delinquency (30+ days past due) | $ | 64,654 | | | $ | 46,986 | | | $ | 16,510 | | | $ | 128,150 | |
| Total loans in delinquency | 108,991 | | | 115,818 | | | 16,510 | | | 241,319 | |
Total transferred loans serviced(1) | 2,995,601 | | | 7,586,031 | | | 5,134,306 | | | 15,715,938 | |
_____________________
SoFi Technologies, Inc.
SoFi Technologies, Inc.
Notes to Consolidated Financial Statements (continued)
(In Thousands, Unless Otherwise Stated and Except for Share and Per Share Data)
(1)Total transferred loans serviced includes loans in delinquency, as well as loans in repayment, loans in-school/grace period/deferment (related to student loans), and loans in forbearance. The vast majority of total transferred loans serviced represent loans in repayment as of the dates indicated.
The following table presents additional information about the servicing cash flows received and net charge-offs related to loans originated by us and subsequently transferred, but with which we have a continuing involvement:
| | | | | | | | | | | | | | | | | |
| Year Ended December 31, |
| 2023 | | 2022 | | 2021 |
| Personal loans | | | | | |
| Servicing fees collected from transferred loans | $ | 20,577 | | | $ | 33,051 | | | $ | 34,421 | |
| Charge-offs, net of recoveries, of transferred loans | 167,643 | | | 93,095 | | | 102,217 | |
| Student loans | | | | | |
| Servicing fees collected from transferred loans | 27,401 | | | 35,203 | | | 46,657 | |
| Charge-offs, net of recoveries, of transferred loans | 41,642 | | | 34,136 | | | 24,675 | |
| Home loans | | | | | |
| Servicing fees collected from transferred loans | 14,530 | | | 12,893 | | | 8,749 | |
| | | | | |
| Total | | | | | |
| Servicing fees collected from transferred loans | $ | 62,508 | | | $ | 81,147 | | | $ | 89,827 | |
| Charge-offs, net of recoveries, of transferred loans | 209,285 | | | 127,231 | | | 126,892 | |
Loans Measured at Amortized Cost
Loan Portfolio Composition and Aging
The following table presents the amortized cost basis of our credit card and commercial and consumer banking portfolios (excluding accrued interest and before the allowance for credit losses) by either current status or delinquency status:
| | | | | | | | | | | | | | | | | | | | | | | | | | | | | | | | | | | |
| | | Delinquent Loans | | |
| Current | | 30–59 Days | | 60–89 Days | | ≥ 90 Days(1) | | Total Delinquent Loans | | Total Loans(2) |
| December 31, 2023 | | | | | | | | | | | |
| Senior secured loans | $ | 445,733 | | | $ | — | | | $ | — | | | $ | — | | | $ | — | | | $ | 445,733 | |
| Credit card | 297,612 | | | 5,451 | | | 4,829 | | | 11,802 | | | 22,082 | | | 319,694 | |
| Commercial and consumer banking: | | | | | | | | | | | |
| Commercial real estate | 107,757 | | | — | | | — | | | — | | | — | | | 107,757 | |
| Commercial and industrial | 6,108 | | | 1 | | | — | | | 439 | | | 440 | | | 6,548 | |
Residential real estate and other consumer(3) | 4,658 | | | — | | | — | | | — | | | — | | | 4,658 | |
| Total commercial and consumer banking | 118,523 | | | 1 | | | — | | | 439 | | | 440 | | | 118,963 | |
| Total loans | $ | 861,868 | | | $ | 5,452 | | | $ | 4,829 | | | $ | 12,241 | | | $ | 22,522 | | | $ | 884,390 | |
| December 31, 2022 | | | | | | | | | | | |
| Credit card | $ | 225,165 | | | $ | 4,670 | | | $ | 3,626 | | | $ | 10,498 | | | $ | 18,794 | | | $ | 243,959 | |
| Commercial and consumer banking: | | | | | | | | | | | |
| Commercial real estate | 89,544 | | | — | | | — | | | — | | | — | | | 89,544 | |
| Commercial and industrial | 7,636 | | | — | | | 1 | | | — | | | 1 | | | 7,637 | |
Residential real estate and other consumer(3) | 2,966 | | | — | | | — | | | — | | | — | | | 2,966 | |
| Total commercial and consumer banking | 100,146 | | | — | | | 1 | | | — | | | 1 | | | 100,147 | |
| Total loans | $ | 325,311 | | | $ | 4,670 | | | $ | 3,627 | | | $ | 10,498 | | | $ | 18,795 | | | $ | 344,106 | |
_____________________(1)All of the credit cards ≥ 90 days past due continued to accrue interest. As of the dates indicated, there were no credit cards on nonaccrual status. As of the dates indicated, commercial and consumer banking loans on nonaccrual status were immaterial.
SoFi Technologies, Inc.
SoFi Technologies, Inc.
Notes to Consolidated Financial Statements (continued)
(In Thousands, Unless Otherwise Stated and Except for Share and Per Share Data)
(2)For credit card, the balance is presented before allowance for credit losses of $52,385 and $39,110 as of December 31, 2023 and December 31, 2022, respectively, and accrued interest of $5,288 and $4,315, respectively. For senior secured loans, the balance is presented before accrued interest of $730 as of December 31, 2023. For commercial and consumer banking, the balance is presented before allowance for credit losses of $2,310 and $1,678, as of December 31, 2023 and December 31, 2022, respectively, and accrued interest of $415 and $324, respectively.
(3)Includes residential real estate loans originated by Golden Pacific for which we did not elect the fair value option.
Credit Quality Indicators
Credit Card
The following table presents the amortized cost basis of our credit card portfolio (excluding accrued interest and before the allowance for credit losses) based on FICO scores, which are obtained at origination of the account and are refreshed monthly thereafter. The pools estimate the likelihood of borrowers with similar FICO scores to pay credit obligations based on aggregate credit performance data.
| | | | | | | | | | | | | | |
| | December 31, |
| FICO | | 2023 | | 2022 |
| ≥ 800 | | $ | 29,269 | | | $ | 14,421 | |
| 780 – 799 | | 19,350 | | | 11,327 | |
| 760 – 779 | | 20,740 | | | 12,179 | |
| 740 – 759 | | 23,361 | | | 14,501 | |
| 720 – 739 | | 28,621 | | | 19,343 | |
| 700 – 719 | | 35,528 | | | 26,239 | |
| 680 – 699 | | 38,289 | | | 31,543 | |
| 660 – 679 | | 35,443 | | | 31,958 | |
| 640 – 659 | | 25,836 | | | 25,959 | |
| 620 – 639 | | 15,569 | | | 15,566 | |
| 600 – 619 | | 10,063 | | | 8,968 | |
| ≤ 599 | | 37,625 | | | 31,955 | |
| Total credit card | | $ | 319,694 | | | $ | 243,959 | |
Commercial and Consumer Banking
We analyze loans in our commercial and consumer banking portfolio by classification based on their associated credit risk, and perform an analysis on an ongoing basis as new information is obtained. Risk rating classifications are further described below. Loans with a lower expectation of credit losses are classified as Pass, while loans with a higher expectation of credit losses are classified as Substandard.
•Pass — Loans that management believes will fully repay in accordance with the contractual loan terms.
•Watch — Loans that management believes will fully repay in accordance with the contractual loan terms, but for which certain credit attributes have changed from origination and warrant further monitoring.
•Special mention — Loans with a potential weakness or weaknesses that deserves management’s close attention. If left uncorrected, the potential weaknesses may result in deterioration of the repayment prospects for the loan or our credit position at some future date.
•Substandard — Loans that are inadequately protected by the current net worth and paying capacity of the obligor or of the collateral pledged, if any. Loans so classified have a well-defined weakness or weaknesses that jeopardize the full repayment. They are characterized by the distinct possibility that we will sustain some loss if the deficiencies are not corrected.
SoFi Technologies, Inc.
SoFi Technologies, Inc.
Notes to Consolidated Financial Statements (continued)
(In Thousands, Unless Otherwise Stated and Except for Share and Per Share Data)
The following table presents the amortized cost basis of our commercial and consumer banking portfolio (excluding accrued interest and before the allowance for credit losses) by origination year and credit quality indicator:
| | | | | | | | | | | | | | | | | | | | | | | | | | | | | | | | | | | | | | | | | | | | | | | | | | |
| | Term Loans by Origination Year | | |
| December 31, 2023 | | 2023 | | 2022 | | 2021 | | 2020 | | 2019 | | Prior | | Total Term Loans | | Revolving Loans |
Commercial real estate | | | | | | | | | | | | | | | | |
| Pass | | $ | 23,200 | | | $ | 29,761 | | | $ | 5,636 | | | $ | 4,550 | | | $ | 9,332 | | | $ | 17,316 | | | $ | 89,795 | | | $ | 186 | |
| Watch | | 1,234 | | | 8,691 | | | 1,648 | | | — | | | 215 | | | 2,749 | | | 14,537 | | | — | |
| Special mention | | — | | | — | | | — | | | — | | | — | | | 1,703 | | | 1,703 | | | — | |
| Substandard | | — | | | — | | | — | | | — | | | — | | | 1,536 | | | 1,536 | | | — | |
| Total commercial real estate | | $ | 24,434 | | | $ | 38,452 | | | $ | 7,284 | | | $ | 4,550 | | | $ | 9,547 | | | $ | 23,304 | | | $ | 107,571 | | | $ | 186 | |
| Commercial and industrial | | | | | | | | | | | | | | | | |
| Pass | | $ | 54 | | | $ | — | | | $ | — | | | $ | 63 | | | $ | 96 | | | $ | 4,941 | | | $ | 5,154 | | | $ | 299 | |
| Watch | | 46 | | | — | | | — | | | — | | | 16 | | | 3 | | | 65 | | | — | |
| Substandard | | — | | | — | | | — | | | — | | | — | | | 1,030 | | | 1,030 | | | — | |
| Total commercial and industrial | | $ | 100 | | | $ | — | | | $ | — | | | $ | 63 | | | $ | 112 | | | $ | 5,974 | | | $ | 6,249 | | | $ | 299 | |
| Residential real estate and other consumer | | | | | | | | | | | | | | | | |
| Pass | | $ | 1,845 | | | $ | — | | | $ | — | | | $ | — | | | $ | — | | | $ | 2,585 | | | $ | 4,430 | | | $ | 188 | |
| Watch | | — | | | — | | | — | | | — | | | — | | | 40 | | | 40 | | | — | |
| Total residential real estate and other consumer | | $ | 1,845 | | | $ | — | | | $ | — | | | $ | — | | | $ | — | | | $ | 2,625 | | | $ | 4,470 | | | $ | 188 | |
Total commercial and consumer banking | | $ | 26,379 | | | $ | 38,452 | | | $ | 7,284 | | | $ | 4,613 | | | $ | 9,659 | | | $ | 31,903 | | | $ | 118,290 | | | $ | 673 | |
Note 5. Allowance for Credit Losses Our allowance for credit losses represents our current estimate of expected credit losses over the remaining contractual life of certain financial assets, including credit cards as well as commercial and consumer banking loans acquired in the Bank Merger, which relate to our Financial Services segment, and accounts receivables primarily related to our Technology Platform segment. Given our methods of collecting funds on servicing receivables, our historical experience of infrequent write offs, and that we have not observed meaningful changes in our counterparties’ abilities to pay, we determined that the future exposure to credit losses on servicing related receivables was immaterial.
In estimating expected credit losses for credit cards, we segment loans based on credit quality indicators and reassess our pools periodically to confirm that all loans within each pool continue to share similar risk characteristics. We establish an allowance within each pool utilizing a proprietary risk model that relies on assumptions such as average annual percentage rate, payment rate, utilization, delinquency status and default probability. The model may then be adjusted for current conditions and reasonable and supportable forecasts of future conditions, including economic conditions. We apply the aforementioned assumptions to the drawn balance of credit cards within each pool to estimate the lifetime expected credit losses within each pool, which are then aggregated to determine the allowance for credit losses.
We evaluate whether to include qualitative reserves to cover losses that are expected but may not be adequately represented in the quantitative methods or the economic assumptions. The qualitative reserves address possible limitations within the models, such as external conditions including regulatory requirements, emerging portfolio trends, the nature and size of the portfolio, portfolio concentrations, the volume and severity of past due accounts, or management risk actions. When a credit card balance is charged off, we record a reduction to the allowance and the credit card balance.
SoFi Technologies, Inc.
SoFi Technologies, Inc.
Notes to Consolidated Financial Statements (continued)
(In Thousands, Unless Otherwise Stated and Except for Share and Per Share Data)
The following table presents changes in our allowance for credit losses:
| | | | | | | | | | | | | | | | | |
| Credit Card(1) | | Commercial and Consumer Banking(1) | | Accounts Receivable(1) |
| Balance at January 1, 2022 | $ | 7,037 | | | $ | — | | | $ | 2,292 | |
Provision for credit losses(2) | 53,030 | | | 1,302 | | | 586 | |
Allowance for PCD loans(3) | — | | | 382 | | | — | |
| Write-offs charged against the allowance | (20,957) | | | (6) | | | (93) | |
| Balance at December 31, 2022 | $ | 39,110 | | | $ | 1,678 | | | $ | 2,785 | |
Provision for credit losses(2) | 54,267 | | | 678 | | | 773 | |
| Write-offs charged against the allowance | (40,992) | | | (46) | | | (1,721) | |
| Balance at December 31, 2023 | $ | 52,385 | | | $ | 2,310 | | | $ | 1,837 | |
_____________________(1)Credit cards and commercial and consumer banking loans measured at amortized cost, net of allowance for credit losses, are presented within loans held for investment in the consolidated balance sheets. Accounts receivable balances, net of allowance for credit losses, are presented within other assets in the consolidated balance sheets.
(2)The provision for credit losses on credit cards and commercial and consumer banking loans is presented within noninterest expense—provision for credit losses in the consolidated statements of operations and comprehensive loss. During the year ended December 31, 2023, recoveries of amounts previously reserved related to credit cards were $2,895, and immaterial during the year ended December 31, 2022. There were immaterial recoveries of amounts previously reserved related to commercial and consumer banking loans during the years ended December 31, 2023 and 2022. The provision for credit losses on accounts receivable is presented within noninterest expense—general and administrative in the consolidated statements of operations and comprehensive loss. During the years ended December 31, 2023 and 2022, recoveries of amounts previously reserved related to accounts receivable were $1,252 and $2,912, respectively.
(3)In connection with the Bank Merger, we obtained PCD loans, for which we measured an allowance, with a corresponding increase to the amortized cost basis as of the acquisition date. Therefore, recognition of the initial allowance for credit losses did not impact earnings.
Credit card: Accrued interest receivables written off by reversing interest income were $9.2 million and $4.7 million during the years ended December 31, 2023 and 2022, respectively.
SoFi Technologies, Inc.
SoFi Technologies, Inc.
Notes to Consolidated Financial Statements (continued)
(In Thousands, Unless Otherwise Stated and Except for Share and Per Share Data)
Note 6. Investment Securities Investments in AFS Debt Securities
The following table presents our investments in AFS debt securities:
| | | | | | | | | | | | | | | | | | | | | | | | | | | | | | | | |
| | Amortized Cost | | Accrued Interest | | Gross Unrealized Gains | | Gross Unrealized Losses(1) | | Fair Value |
| December 31, 2023 | | | | | | | | | | |
| U.S. Treasury securities | | $ | 518,673 | | | $ | 206 | | | $ | 978 | | | $ | (780) | | | $ | 519,077 | |
Multinational securities(2) | | 8,548 | | | 103 | | | — | | | (17) | | | 8,634 | |
| Corporate bonds | | 32,609 | | | 207 | | | — | | | (1,092) | | | 31,724 | |
| Agency mortgage-backed securities | | 28,714 | | | 111 | | | 33 | | | (1,016) | | | 27,842 | |
| Other asset-backed securities | | 7,272 | | | 4 | | | — | | | (154) | | | 7,122 | |
Other(3) | | 941 | | | 8 | | | — | | | (161) | | | 788 | |
| Total investments in AFS debt securities | | $ | 596,757 | | | $ | 639 | | | $ | 1,011 | | | $ | (3,220) | | | $ | 595,187 | |
| December 31, 2022 | | | | | | | | | | |
| U.S. Treasury securities | | $ | 121,282 | | | $ | 217 | | | $ | — | | | $ | (3,510) | | | $ | 117,989 | |
Multinational securities(2) | | 19,658 | | | 109 | | | — | | | (724) | | | 19,043 | |
| Corporate bonds | | 41,890 | | | 257 | | | — | | | (2,644) | | | 39,503 | |
| Agency mortgage-backed securities | | 8,899 | | | 22 | | | — | | | (991) | | | 7,930 | |
| Other asset-backed securities | | 9,556 | | | 5 | | | — | | | (514) | | | 9,047 | |
Other(3) | | 2,133 | | | 21 | | | — | | | (228) | | | 1,926 | |
| Total investments in AFS debt securities | | $ | 203,418 | | | $ | 631 | | | $ | — | | | $ | (8,611) | | | $ | 195,438 | |
_____________________(1) As of December 31, 2023 and December 31, 2022, we concluded that there was no credit loss attributable to securities in unrealized loss positions, as (i) 92% and 67% of the amortized cost basis of our investments as of December 31, 2023 and December 31, 2022, respectively, was composed of U.S. Treasury securities, agency mortgage-backed securities and sovereign foreign bonds, which are of high credit quality and have no risk of credit-related impairment due to the nature of the counterparties and history of no credit losses, and (ii) we have not identified factors indicating credit-related impairment for the remaining investments and expect that the contractual principal and interest payments will be received. Additionally, we do not intend to sell the securities in loss positions nor is it more likely than not that we will be required to sell the securities prior to recovery of the amortized cost basis.
(2) Includes supranational and sovereign foreign bonds.
(3) Includes state and city municipal bond securities.
SoFi Technologies, Inc.
SoFi Technologies, Inc.
Notes to Consolidated Financial Statements (continued)
(In Thousands, Unless Otherwise Stated and Except for Share and Per Share Data)
The following table presents information about our investments in AFS debt securities with gross unrealized losses and the length of time that individual securities have been in a continuous unrealized loss position as of December 31, 2023 and December 31, 2022.
| | | | | | | | | | | | | | | | | | | | | | | | | | | | | | | | | | | | | | |
| | Less than 12 Months | | 12 Months or Longer | | Total |
| | Fair Value | | Gross Unrealized Losses | | Fair Value | | Gross Unrealized Losses | | Fair Value | | Gross Unrealized Losses |
| December 31, 2023 | | | | | | | | | | | | |
| U.S. Treasury securities | | $ | 480,012 | | | $ | (58) | | | $ | 39,065 | | | $ | (722) | | | $ | 519,077 | | | $ | (780) | |
| Multinational securities | | — | | | — | | | 8,634 | | | (17) | | | 8,634 | | | (17) | |
| Corporate bonds | | — | | | — | | | 31,724 | | | (1,092) | | | 31,724 | | | (1,092) | |
| Agency mortgage-backed securities | | 20,930 | | | (157) | | | 6,912 | | | (859) | | | 27,842 | | | (1,016) | |
| Other asset-backed securities | | — | | | — | | | 7,122 | | | (154) | | | 7,122 | | | (154) | |
| Other | | — | | | — | | | 788 | | | (161) | | | 788 | | | (161) | |
| Total investments in AFS debt securities | | $ | 500,942 | | | $ | (215) | | | $ | 94,245 | | | $ | (3,005) | | | $ | 595,187 | | | $ | (3,220) | |
| December 31, 2022 | | | | | | | | | | | | |
| U.S. Treasury securities | | $ | 27,759 | | | $ | (1,171) | | | $ | 90,230 | | | $ | (2,339) | | | $ | 117,989 | | | $ | (3,510) | |
| Multinational securities | | — | | | — | | | 19,043 | | | (724) | | | 19,043 | | | (724) | |
| Corporate bonds | | 4,480 | | | (313) | | | 35,023 | | | (2,331) | | | 39,503 | | | (2,644) | |
| Agency mortgage-backed securities | | 6,448 | | | (814) | | | 1,482 | | | (177) | | | 7,930 | | | (991) | |
| Other asset-backed securities | | — | | | — | | | 9,047 | | | (514) | | | 9,047 | | | (514) | |
| Other | | 745 | | | (200) | | | 1,181 | | | (28) | | | 1,926 | | | (228) | |
| Total investments in AFS debt securities | | $ | 39,432 | | | $ | (2,498) | | | $ | 156,006 | | | $ | (6,113) | | | $ | 195,438 | | | $ | (8,611) | |
The following table presents the amortized cost and fair value of our investments in AFS debt securities by contractual maturity:
| | | | | | | | | | | | | | | | | | | | | | | | | | | | | | | | |
| | Due Within One Year | | Due After One Year Through Five Years | | Due After Five Years Through Ten Years | | Due After Ten Years | | Total |
| December 31, 2023 | | | | | | | | | | |
| Investments in AFS debt securities—Amortized cost: | | | | | | | | | | |
| U.S. Treasury securities | | $ | 513,281 | | | $ | 5,392 | | | $ | — | | | $ | — | | | $ | 518,673 | |
| Multinational securities | | 8,548 | | | — | | | — | | | — | | | 8,548 | |
| Corporate bonds | | 18,122 | | | 11,181 | | | 3,306 | | | — | | | 32,609 | |
| Agency mortgage-backed securities | | — | | | 135 | | | 684 | | | 27,895 | | | 28,714 | |
| Other asset-backed securities | | 87 | | | 5,283 | | | 1,902 | | | — | | | 7,272 | |
| Other | | — | | | — | | | — | | | 941 | | | 941 | |
| Total investments in AFS debt securities | | $ | 540,038 | | | $ | 21,991 | | | $ | 5,892 | | | $ | 28,836 | | | $ | 596,757 | |
Weighted average yield for investments in AFS debt securities(1) | | 4.79 | % | | 0.99 | % | | 2.98 | % | | 3.13 | % | | 4.55 | % |
SoFi Technologies, Inc.
SoFi Technologies, Inc.
Notes to Consolidated Financial Statements (continued)
(In Thousands, Unless Otherwise Stated and Except for Share and Per Share Data)
| | | | | | | | | | | | | | | | | | | | | | | | | | | | | | | | |
| | Due Within One Year | | Due After One Year Through Five Years | | Due After Five Years Through Ten Years | | Due After Ten Years | | Total |
Investments in AFS debt securities—Fair value(2): | | | | | | | | | | |
| U.S. Treasury securities | | $ | 513,710 | | | $ | 5,161 | | | $ | — | | | $ | — | | | $ | 518,871 | |
| Multinational securities | | 8,531 | | | — | | | — | | | — | | | 8,531 | |
| Corporate bonds | | 17,785 | | | 10,733 | | | 2,999 | | | — | | | 31,517 | |
| Agency mortgage-backed securities | | — | | | 128 | | | 633 | | | 26,970 | | | 27,731 | |
| Other asset-backed securities | | 87 | | | 5,133 | | | 1,898 | | | — | | | 7,118 | |
| Other | | — | | | — | | | — | | | 780 | | | 780 | |
| Total investments in AFS debt securities | | $ | 540,113 | | | $ | 21,155 | | | $ | 5,530 | | | $ | 27,750 | | | $ | 594,548 | |
_____________________(1) The weighted average yield represents the effective yield for the investment securities owned at the end of the period and is computed based on the amortized cost of each security.
(2) Presentation of fair values of our investments in AFS debt securities by contractual maturity excludes total accrued interest of $639 and $631 as of December 31, 2023 and December 31, 2022, respectively.
Gross realized gains and losses on our investments in AFS debt securities were $3,356 and $509, respectively, during the year ended December 31, 2023, and were immaterial during the years ended December 31, 2022 and 2021. During the years ended December 31, 2023, 2022, and 2021 there were no transfers between classifications of our investments in AFS debt securities. See Note 13. Equity for unrealized gains and losses on our investments in AFS debt securities and amounts reclassified out of AOCI.
Securitization Investments
The following table presents the aggregate outstanding value of asset-backed bonds and residual interests owned by the Company in nonconsolidated VIEs, which are presented within investment securities in the consolidated balance sheets:
| | | | | | | | | | | |
| December 31, |
| 2023 | | 2022 |
| Personal loans | $ | 27,247 | | | $ | 20,172 | |
| Student loans | 79,501 | | | 181,159 | |
| Securitization investments | $ | 106,748 | | | $ | 201,331 | |
Note 7. Securitization and Variable Interest Entities Consolidated VIEs
We consolidate certain securitization trusts in which we have a variable interest and are deemed to be the primary beneficiary. Our consolidation policy is further discussed in Note 1. Organization, Summary of Significant Accounting Policies and New Accounting Standards.
The VIEs are SPEs with portfolio loans securing debt obligations. The SPEs were created and designed to transfer credit and interest rate risk associated with consumer loans through the issuance of collateralized notes and trust certificates. We make standard representations and warranties to repurchase or replace qualified portfolio loans. Aside from these representations, the holders of the asset-backed debt obligations have no recourse to the Company if the cash flows from the underlying portfolio loans securing such debt obligations are not sufficient to pay all principal and interest on the asset-backed debt obligations. We hold a significant interest in these financing transactions through our ownership of a portion of the residual interest in certain VIEs. In addition, in some cases, we invest in the debt obligations issued by the VIE. Our investments in consolidated VIEs eliminate in consolidation. The residual interest is the first VIE interest to absorb losses should the loans securing the debt obligations not provide adequate cash flows to satisfy more senior claims and is the interest that we expect to absorb the expected gains and losses of the VIE. Our exposure to credit risk in sponsoring SPEs is limited to our investment in the VIE. VIE creditors have no recourse against our general credit.
SoFi Technologies, Inc.
SoFi Technologies, Inc.
Notes to Consolidated Financial Statements (continued)
(In Thousands, Unless Otherwise Stated and Except for Share and Per Share Data)
As of December 31, 2023 and December 31, 2022, we had six consolidated VIEs, respectively, on our consolidated balance sheets. During the year ended December 31, 2023, we established one consolidated VIE and consolidated one previously nonconsolidated VIE, and exercised securitization clean up calls related to two consolidated VIEs. The assets of consolidated VIEs that were included in our consolidated balance sheets may only be used to settle obligations of consolidated VIEs and were in excess of those obligations as of December 31, 2023 and December 31, 2022. Intercompany balances are eliminated upon consolidation.
Nonconsolidated VIEs
We have created and designed personal loan and student loan trusts to transfer associated credit and interest rate risk associated with the loans through the issuance of collateralized notes and residual certificates. We have a variable interest in the nonconsolidated loan trusts, as we own collateralized notes and residual certificates in the loan trusts that absorb variability. We also have continuing, non-controlling involvement with the trusts as the servicer. As servicer, we may have the power to perform the activities which most impact the economic performance of the VIE, but since either we hold an insignificant financial interest in the trusts or rights held by other variable interest holders convey power, we are not the primary beneficiary. This financial interest represents the equity ownership interest in the loan trusts, wherein there is an obligation to absorb losses and the right to receive benefits from residual certificate ownership. The maximum exposure to loss as a result of our involvement with the nonconsolidated VIEs is limited to our investment. We did not provide financial support to any nonconsolidated VIEs beyond our initial equity investment. There are no liquidity arrangements, guarantees or other commitments by third parties that may affect the fair value or risk of our variable interests in nonconsolidated VIEs.
As of December 31, 2023 and December 31, 2022, we had investments in 22 and 23 nonconsolidated VIEs, respectively. During the year ended December 31, 2023, we established one nonconsolidated trust, exercised a securitization clean up call on one nonconsolidated VIE and collapsed the associated trust, as well as consolidated one previously nonconsolidated VIE.
Note 8. Goodwill and Intangible Assets Goodwill
A rollforward of our goodwill balance is presented below:
| | | | | | | | | | | | | |
| Year Ended December 31, | | |
| 2023 | | 2022 | | |
| Beginning balance | $ | 1,622,991 | | | $ | 898,527 | | | |
| Less: accumulated impairment | — | | | — | | | |
| Beginning balance, net | 1,622,991 | | | 898,527 | | | |
Additional goodwill recognized(1) | 17,688 | | | 724,464 | | | |
Goodwill impairment(2) | (247,174) | | | — | | | |
Ending balance(3) | $ | 1,393,505 | | | $ | 1,622,991 | | | |
_____________________
(1) For the year ended December 31, 2023, related to the acquisition of Wyndham, which is attributable to our Lending reportable segment. For the year ended December 31, 2022, includes $713,217 related to the Technisys Merger and $11,247 related to the Bank Merger.
(2) During the year ended December 31, 2023, we recognized goodwill impairment losses related to our Technology Platform reportable segment, which were reported within noninterest expense—goodwill impairment in the consolidated statements of operations and comprehensive loss. These goodwill impairment losses represent non-cash charges and did not affect our liquidity position or regulatory capital ratios.
(3) As of December 31, 2023, goodwill attributable to the Lending, Technology Platform and Financial services reportable segments was $17,688, $1,338,658 and $37,159, respectively. As of December 31, 2022, goodwill attributable to the Technology Platform and Financial services reportable segments was $1,585,832 and $37,159, respectively.
SoFi Technologies, Inc.
SoFi Technologies, Inc.
Notes to Consolidated Financial Statements (continued)
(In Thousands, Unless Otherwise Stated and Except for Share and Per Share Data)
Intangible Assets
The following is a summary of the carrying amount and estimated useful lives of our intangible assets by class:
| | | | | | | | | | | | | | | | | | | | | | | |
| Weighted Average Useful Life (Years) | | Gross Balance | | Accumulated Amortization | | Net Book Value |
| December 31, 2023 | | | | | | | |
Developed technology(1) | 8.5 | | $ | 461,438 | | | $ | (151,823) | | | $ | 309,615 | |
| Customer-related | 3.9 | | 167,350 | | | (141,248) | | | 26,102 | |
| Trade names, trademarks and domain names | 5.9 | | 20,060 | | | (8,436) | | | 11,624 | |
Core banking infrastructure(2) | n/a | | 17,100 | | | (17,100) | | | — | |
Capitalized software development costs(3) | 4.0 | | 20,344 | | | (4,461) | | | 15,883 | |
| Core deposits | 7.3 | | 1,000 | | | (264) | | | 736 | |
| Broker-dealer license and trading rights | 5.7 | | 250 | | | (162) | | | 88 | |
| Total | |
| $ | 687,542 | |
| $ | (323,494) | |
| $ | 364,048 | |
| December 31, 2022 | | | | | | | |
| Developed technology | 8.7 | | $ | 444,438 | | | $ | (97,202) | | | $ | 347,236 | |
| Customer-related | 3.9 | | 167,350 | | | (99,264) | | | 68,086 | |
| Trade names, trademarks and domain names | 8.7 | | 20,060 | | | (4,028) | | | 16,032 | |
Core banking infrastructure(2) | n/a | | 17,100 | | | (17,100) | | | — | |
Capitalized software development costs(3) | 4.0 | | 10,532 | | | (737) | | | 9,795 | |
| Core deposits | 7.3 | | 1,000 | | | (126) | | | 874 | |
| Broker-dealer license and trading rights | 5.7 | | 250 | | | (118) | | | 132 | |
| Total | |
| $ | 660,730 | |
| $ | (218,575) | | | $ | 442,155 | |
_____________________
(1) During the year ended December 31, 2023, the Company acquired $17,000 in developed technology related to the acquisition of Wyndham.
(2) Although the core banking infrastructure intangible asset was fully amortized as of December 31, 2023, it remains in use by the Company.
(3) Includes capitalized costs related to software products to be sold, leased or marketed within our technology products and solutions arrangements. During the year ended December 31, 2023, the increase in capitalized software development costs relates to increased Technology Platform activity. During the year ended December 31, 2023, total amortization expense related to capitalized software was $4,246, and capitalized share-based compensation related to capitalized software development costs was immaterial.
For the years ended December 31, 2023, 2022 and 2021, amortization expense associated with intangible assets was $104,919, $93,016 and $70,507, respectively. There were no abandonments or impairments during any of the years presented.
Estimated future amortization expense associated with intangible assets as of December 31, 2023 is as follows:
| | | | | |
| 2024 | $ | 74,717 | |
| 2025 | 72,766 | |
| 2026 | 69,988 | |
| 2027 | 53,662 | |
| 2028 | 50,474 | |
| Thereafter | 42,441 | |
| Total | $ | 364,048 | |
SoFi Technologies, Inc.
SoFi Technologies, Inc.
Notes to Consolidated Financial Statements (continued)
(In Thousands, Unless Otherwise Stated and Except for Share and Per Share Data)
Note 9. Property, Equipment, Software and Leases Property, Equipment and Software
The table below presents our major classes of depreciable and amortizable assets by function:
| | | | | | | | | | | | | | | | | |
| Gross
Balance | | Accumulated Depreciation/Amortization | | Carrying
Value |
| December 31, 2023 | | | | | |
Software(1) | $ | 292,445 | | | $ | (117,003) | | | $ | 175,442 | |
| Leasehold improvements | 39,046 | | | (20,467) | | | 18,579 | |
| Computer hardware | 24,899 | | | (19,000) | | | 5,899 | |
| Furniture and fixtures | 16,825 | | | (10,797) | | | 6,028 | |
Finance lease ROU assets(2) | 15,100 | | | (7,191) | | | 7,909 | |
| Building and land | 3,192 | | | (141) | | | 3,051 | |
| Total | $ | 391,507 | | | $ | (174,599) | | | $ | 216,908 | |
| December 31, 2022 | | | | | |
Software(1) | $ | 172,101 | | | $ | (54,516) | | | $ | 117,585 | |
| Leasehold improvements | 40,257 | | | (17,145) | | | 23,112 | |
| Computer hardware | 21,265 | | | (13,736) | | | 7,529 | |
| Furniture and fixtures | 18,808 | | | (10,122) | | | 8,686 | |
Finance lease ROU assets(2) | 15,100 | | | (5,033) | | | 10,067 | |
| Building and land | 3,192 | | | (67) | | | 3,125 | |
| Total | $ | 270,723 | | | $ | (100,619) | | | $ | 170,104 | |
_____________________
(1)Software primarily includes internally-developed software related to significant developments and enhancements for our products. During the years ended December 31, 2023, 2022 and 2021, we capitalized $31,126, $22,577 and $7,776, respectively, of share-based compensation related to internally-developed software, and recognized associated amortization expense of $16,074, $6,223 and $792 , respectively.
(2)Finance lease ROU assets include our rights to certain physical signage within SoFi Stadium. See below for additional information on our leases.
For the years ended December 31, 2023, 2022 and 2021, total depreciation and amortization expense associated with property, equipment and software, inclusive of the amortization of capitalized share-based compensation, was $96,497, $59,081 and $31,061, respectively.
For the years ended December 31, 2023, 2022 and 2021, we recognized no property, equipment and software abandonment and no impairments, and had immaterial losses on disposals.
Leases and Occupancy
Leases
We primarily lease our office premises under multi-year, non-cancelable operating leases. Our operating leases have terms expiring from 2024 to 2040, exclusive of renewal option periods. Our office leases contain renewal option periods ranging from three to ten years from the expiration dates. These options were not recognized as part of our ROU assets and operating lease liabilities, as we did not conclude at the commencement date of the leases that we were reasonably certain to exercise these options. However, in our normal course of business, we expect our office leases to be renewed, amended or replaced by other leases. Our finance leases expire in 2040.
Our operating and finance leases include leases from our September 2019 agreements associated with being the named sponsor of SoFi Stadium, which includes the stadium itself, a performance venue and a future shopping district. Operating leases that commenced in September 2020 included our rights to use two multi-purpose stadium suites, for which we elected the practical expedient to not bifurcate the lease component from the non-lease components, and our rights to certain event space
SoFi Technologies, Inc.
SoFi Technologies, Inc.
Notes to Consolidated Financial Statements (continued)
(In Thousands, Unless Otherwise Stated and Except for Share and Per Share Data)
within the stadium and performance venue on a rent-free basis, for which we applied the short-term lease exemption practical expedient. Finance leases that commenced in September 2020 included our rights to certain physical signage within the stadium. The agreement associated with the shopping district commenced in 2023. We bifurcated lease components from non-lease components of certain of the arrangements, the latter of which represent sponsorship and advertising opportunities rather than the rights to physical assets that we control. We recognize the non-lease components within noninterest expense—sales and marketing in the consolidated statements of operations and comprehensive loss.
The components of lease expense and supplemental cash flow and non-cash information related to our leases were as follows.
| | | | | | | | | | | | | | | | | |
| Year Ended December 31, |
| 2023 | | 2022 | | 2021 |
| Operating lease cost | $ | 21,905 | | | $ | 20,805 | | | $ | 20,188 | |
| Finance lease cost – amortization of ROU assets | 2,157 | | | 2,157 | | | 2,157 | |
| Finance lease cost – interest expense on lease liabilities | 452 | | | 469 | | | 485 | |
| Short-term lease cost | 1,718 | | | 2,031 | | | 1,335 | |
Variable lease cost(1) | 3,509 | | | 3,483 | | | 3,979 | |
| Sublease income | (1,034) | | | — | | | (717) | |
| Total lease cost | $ | 28,707 | | | $ | 28,945 | | | $ | 27,427 | |
| Cash paid for amounts included in the measurement of lease liabilities | | | | | |
| Operating cash outflows from operating leases | $ | 26,997 | | | $ | 21,682 | | | $ | 19,811 | |
| Operating cash outflows from finance leases | 452 | | | 469 | | | 488 | |
| Financing cash outflows from finance leases | 509 | | | 488 | | | 516 | |
| Supplemental non-cash information | | | | | |
Non-cash operating lease ROU assets obtained in exchange for lease liabilities(2) | $ | 8,553 | | | $ | (3,885) | | | $ | 12,734 | |
| | | | | |
_____________________
(1)Variable lease cost includes non-lease components classified as lease costs, such as common area maintenance fees, property taxes and utilities, that vary in amount for reasons other than the passage of time. We elected the practical expedient to not bifurcate the lease component from the non-lease components.
(2)For the years ended December 31, 2023 and 2022, includes $6,995 and $764, respectively, of operating lease ROU assets obtained through acquisitions. Also includes impacts from lease modifications.
Supplemental balance sheet information related to our leases was as follows:
| | | | | | | | | | | |
| December 31, |
| 2023 | | 2022 |
| Operating Leases | | | |
| ROU assets | $ | 89,635 | | | $ | 97,135 | |
| Operating lease liabilities | 108,649 | | | 117,758 | |
| Weighted average remaining lease term (in years) | 6.9 | | 7.5 |
| Weighted average discount rate | 5.7 | % | | 5.2 | % |
| Finance Leases | | | |
ROU assets(1) | $ | 7,909 | | | $ | 10,067 | |
Finance lease liabilities(2) | 13,172 | | | 13,683 | |
| Weighted average remaining lease term (in years) | 16.3 | | 17.3 |
| Weighted average discount rate | 3.4 | % | | 3.4 | % |
_____________________
(1)Finance lease ROU assets are presented within property, equipment and software in the consolidated balance sheets.
(2)Finance lease liabilities are presented within accounts payable, accruals and other liabilities in the consolidated balance sheets.
SoFi Technologies, Inc.
SoFi Technologies, Inc.
Notes to Consolidated Financial Statements (continued)
(In Thousands, Unless Otherwise Stated and Except for Share and Per Share Data)
As of December 31, 2023, future maturities of lease liabilities and a reconciliation of the total undiscounted cash flows to the lease liabilities in the consolidated balance sheets were as follows:
| | | | | | | | | | | |
| Operating Leases | | Finance Leases |
| 2024 | $ | 24,536 | | | $ | 968 | |
| 2025 | 23,150 | | | 1,038 | |
| 2026 | 21,513 | | | 1,060 | |
| 2027 | 15,773 | | | 1,061 | |
| 2028 | 15,211 | | | 1,061 | |
| Thereafter | 33,296 | | | 11,931 | |
| Total | 133,479 | | | 17,119 | |
| Less: imputed interest | (24,830) | | | (3,947) | |
| Lease liabilities | $ | 108,649 | | | $ | 13,172 | |
Occupancy
Occupancy-related costs, which primarily relate to the operations of our leased office spaces, were $31,946, $33,170, and $28,949 for the years ended December 31, 2023, 2022 and 2021, respectively. Occupancy-related expenses are presented within the following categories of expenses within noninterest expense: (i) technology and product development, (ii) sales and marketing, (iii) cost of operations, and (iv) general and administrative in the consolidated statements of operations and comprehensive loss.
Note 10. Other Assets and Other Liabilities The following table presents the components of other assets:
| | | | | | | | | | | |
| December 31, |
| 2023 | | 2022 |
Accounts receivable, net(1) | $ | 169,852 | | | $ | 127,050 | |
Prepaid expenses and capitalized contract costs(2) | 112,748 | | | 73,429 | |
Credit default swap(3) | 103,204 | | | — | |
Restricted investments(4) | 83,551 | | | 28,651 | |
Investments in equity securities(5) | 22,920 | | | 22,825 | |
Digital assets safeguarding asset(6) | 9,292 | | | 106,826 | |
Derivative financial instruments(7) | 6,916 | | | 34,610 | |
| Other | 45,883 | | | 23,943 | |
| Other assets | $ | 554,366 | | | $ | 417,334 | |
_____________________(1) Includes accounts receivable, net of allowance for credit losses, associated with revenue from contracts with customers, deposit-related receivables and other receivables. See Note 5. Allowance for Credit Losses for information on the allowance for credit losses on accounts receivable.
(2) Includes capitalized incremental costs of obtaining certain contracts of $60,729 as of December 31, 2023 which are amortized over the life of the account through noninterest expense—sales and marketing on the consolidated statements of operations and comprehensive loss.
(3) We entered into a credit default swap related to our student loans which meets the definition of a financial guarantee and is excluded from derivative accounting treatment. We apply the insurance contract claim method by deferring the full estimated amount of premiums paid and payable at inception.
(4) Includes investments in FRB stock and FHLB stock, which are restricted investment securities that are not marketable. These investments are carried at cost and assessed for impairment.
(5) As of December 31, 2023, primarily included an investment that was entered into in 2021 and recorded as an equity method investment until January 2022 in conjunction with relinquishing our seat on the investee’s board of directors. Our equity method investment income for the year ended December 31, 2023 was immaterial and we did not receive any distributions.
(6) See Note 1. Organization, Summary of Significant Accounting Policies and New Accounting Standards and Note 15. Fair Value Measurements for additional information on the digital assets safeguarding asset.
SoFi Technologies, Inc.
SoFi Technologies, Inc.
Notes to Consolidated Financial Statements (continued)
(In Thousands, Unless Otherwise Stated and Except for Share and Per Share Data)
(7) See Note 14. Derivative Financial Instruments and Note 15. Fair Value Measurements for additional information on derivative financial instruments.
The following table presents the components of accounts payable, accruals and other liabilities:
| | | | | | | | | | | |
| December 31, |
| 2023 | | 2022 |
Accrued expenses(1) | $ | 202,259 | | | $ | 145,971 | |
Credit default swap(2) | 103,204 | | | — | |
| Accounts payable | 93,301 | | | 126,875 | |
| Accrued interest | 66,614 | | | 17,700 | |
Deferred tax liabilities, net(3) | 40,229 | | | 56,482 | |
Finance lease liability(4) | 13,172 | | | 13,683 | |
Digital assets safeguarding liability(5) | 9,292 | | | 106,826 | |
Deferred revenue(6) | 5,718 | | | 10,028 | |
Derivative financial instruments(7) | 4,604 | | | 9,251 | |
| Other | 11,355 | | | 29,399 | |
| Accounts payable, accruals and other liabilities | $ | 549,748 | | | $ | 516,215 | |
_____________________(1) Includes accrued compensation and compensation-related expenses, accrued taxes and other accrued expenses.
(2) See footnote (3) to the table above.
(3) See Note 17. Income Taxes for additional information on income taxes.
(4) See Note 9. Property, Equipment, Software and Leases for additional information on finance leases.
(5) See Note 1. Organization, Summary of Significant Accounting Policies and New Accounting Standards and Note 15. Fair Value Measurements for additional information on the digital assets safeguarding liability.
(6) See Note 3. Revenue for additional information on deferred revenue.
(7) See Note 14. Derivative Financial Instruments and Note 15. Fair Value Measurements for additional information on derivative financial instruments.
We offer deposit accounts (referred to as “checking and savings” accounts within SoFi Money) to our members through SoFi Bank, which include interest-bearing deposits and noninterest-bearing deposits.
The following table presents a detail of interest-bearing deposits:
| | | | | | | | | | | | | | |
| | December 31, |
| | 2023 | | 2022 |
| Savings deposits | | $ | 12,902,033 | | | $ | 4,383,953 | |
Demand deposits(1) | | 2,663,335 | | | 1,912,452 | |
Time deposits(1)(2) | | 3,003,625 | | | 969,387 | |
| Total interest-bearing deposits | | $ | 18,568,993 | | | $ | 7,265,792 | |
_____________________(1) As of December 31, 2023 and December 31, 2022, includes brokered deposits of $3,160,414 and $1,026,400, respectively, of which $2,971,462 and $940,000, respectively, are time deposits and $188,952 and $86,400, respectively, are demand deposits.
(2) As of December 31, 2023 and December 31, 2022, the amount of time deposits that exceeded the insured limit (referred to as “uninsured deposits”) totaled $21,268 and $20,842, respectively.
SoFi Technologies, Inc.
SoFi Technologies, Inc.
Notes to Consolidated Financial Statements (continued)
(In Thousands, Unless Otherwise Stated and Except for Share and Per Share Data)
As of December 31, 2023, future maturities of our total time deposits were as follows:
| | | | | |
| 2024 | $ | 2,578,881 | |
| 2025 | 424,198 | |
| 2026 | 296 | |
| |
| 2028 | 250 | |
| |
| Total | $ | 3,003,625 | |
The following table summarizes the components of our debt:
| | | | | | | | | | | | | | | | | | | | | | | | | | | | | | | | | | | | | | | | | | | | |
| | December 31, 2023 | | December 31, 2022 |
| Borrowing Description | | Total Collateral(1) | | Stated Interest Rate(2) | | Weighted Average Effective Interest Rate(3) | | Termination/Maturity(4) | | Total Capacity | | Total Outstanding(5) | | Total Outstanding |
| Debt Facilities | | |
| |
| | | |
| |
| |
| |
| Personal loan warehouse facilities | | $ | 1,271,233 | |
| 5.61% – 7.30% |
| 6.20% | | January 2024 – January 2032 |
| $ | 4,925,000 | |
| $ | 1,077,444 | |
| $ | 1,452,085 | |
| Student loan warehouse facilities | | 2,530,122 | |
| 6.13% – 7.16% |
| 6.72% | | April 2024 – December 2026 |
| 3,945,000 | |
| 2,095,046 | |
| 1,504,926 | |
| Credit card warehouse facility | | — | |
| 6.68% |
| —% | | June 2025 |
| 100,000 | |
| — | |
| — | |
Risk retention warehouse facilities(6) | | 74,043 | |
| 5.47% – 8.72% |
| 7.03% | | January 2024 – October 2027 |
| 200,000 | |
| 67,038 | |
| 101,964 | |
Revolving credit facility(7) | | |
| 6.95% |
| 7.07% | | April 2028 |
| 645,000 | |
| 486,000 | |
| 486,000 | |
| Other Debt | |
|
|
|
| | |
|
|
|
|
|
|
|
Convertible senior notes(8) | |
|
| —% |
| 0.43% | | October 2026 |
| |
| 1,111,972 | |
| 1,200,000 | |
Other financing(9) | | 186,556 | |
| |
| | | |
| 216,525 | |
| — | |
| — | |
| Securitizations | | |
| |
| | | |
| |
|
|
| |
| Personal loan securitizations | | 494,643 | |
| 1.30% – 6.21% |
| 5.94% | | September 2030 – May 2031 |
| |
| 239,340 | |
| 529,132 | |
| Student loan securitizations | | 212,140 | |
| 3.09% – 4.44% |
| 3.83% | | May 2040 – August 2048 |
| |
| 182,744 | |
| 246,856 | |
| Total, before unamortized debt issuance costs, premiums and discounts | | |
| |
| | | |
| |
| $ | 5,259,584 | |
| $ | 5,520,963 | |
| Less: unamortized debt issuance costs, premiums and discounts | | |
| |
| | | |
| |
| (26,168) | |
| (35,081) | |
| Total debt | | |
| |
| | | |
| |
| $ | 5,233,416 | |
| $ | 5,485,882 | |
_____________________
(1)As of December 31, 2021,2023, represents the total of the unpaid principal balances within each debt category, with the exception of the risk retention warehouse facilities, which include securitization-related investments carried at fair value. In addition, certain securitization interests that eliminate in consolidation are pledged to risk retention warehouse facilities. Collateral balances relative to debt balances as presented may vary period to period due to the timing of the next scheduled payment to the warehouse facility.
(2)For variable-rate debt, the ranges of stated interest rates are based on the interest rates in effect as of December 31, 2023. The interest on our variable-rate debt is typically designed as a reference rate plus a spread. Reference rates as of December 31, 2023 included overnight SOFR, one-month SOFR, three-month SOFR, prime rate and commercial paper rates determined by the facility lenders. As debt arrangements are renewed, the reference rate and/or spread are subject to change. Unused commitment fees ranging from 0 to 75 basis points (“bps”)65 bps on our various warehouse facilities are recognized aswithin noninterest expense—general and administrative in our consolidated statements of operations and comprehensive income (loss). “ML” stands for “Month LIBOR”. Asloss.
(3)Weighted average effective interest rates are calculated based on the interest rates in effect as of December 31, 2021, 1ML2023 and 3ML was 0.10% and 0.21%, respectively. Asinclude the amortization of December 31, 2020, 1ML and 3ML was 0.14% and 0.24%, respectively. “SOFR” stands for “Secured Overnight Financing Rate”. As of December 31, 2021, SOFR was 0.05%. “PR” stands for “Prime Rate”. As of December 31, 2021 and 2020, PR was 3.25% and 3.25%, respectively.debt issuance costs.
(3)(4)For securitization debt, the maturity of the notes issued by the various trusts occurs upon either the maturity of the loan collateral or full payment of the loan collateral held in the trusts. Our maturity date represents the legal maturity of the last class of maturing notes. Securitization debt matures as loan collateral payments are made.
(4)Represents total capacity as of December 31, 2021.
(5)There was awere no debt discount of $24,000 associated with the Convertible Notes discussed below and a debt premium of $335discounts or premiums issued during the year ended December 31, 2021. We paid $1,600 during 2021 related to debt issuance costs accrued in 2020.2023.
(6)Warehouse facility has a prime rate floor of 309 bps.
(7)WarehouseFor risk retention warehouse facilities, have a 1ML floor of 25 bps.
(8)Warehouse facility incurs different interest rates on its two types of asset classes. One such class incurs interest based on a commercial paper (“CP”) rate, which is determined by the facility lender. As of December 31, 2021 and 2020, the CP rate for this facility was 0.19% and 0.25%, respectively.
(9)Warehouse facility incurs interest based on a CP rate, which is determined by the facility lender. As of December 31, 2021 and 2020, the CP rate for this facility was 0.24% and 0.28%, respectively.
(10)Warehouse facility incurs interest based on a CP rate, which is determined by the facility lender. As of December 31, 2021 and 2020, the CP rate for this facility was 0.19% and 0.25%, respectively.
(11)Warehouse facility incurs interest based on a CP rate, which is determined by the facility lender. As of December 31, 2021, the CP rate for this facility was 0.19%. Under certain conditions, warehouse facility could incur an interest rate spread of 215 bps.
(12)Warehouse facility incurs interest based on a CP rate, which is determined by the facility lender. As of December 31, 2021, the CP rate for this facility was 0.18%. As of December 31, 2020, this facility incurred interest based on 1ML.
(13)Warehouse facility incurs interest based on a CP rate, which is determined by the facility lender. As of December 31, 2021 and 2020, the CP rate for this facility was 0.16% and 0.25%, respectively.
(14)Warehouse facility incurs interest based on a CP rate, which is determined by the facility lender. As of December 31, 2021, the CP rate for this facility was 0.16%. As of December 31, 2020, this facility incurred interest based on 3ML.
(15)Warehouse facility expected to be subject to SOFR + 11.5 bps upon benchmark replacement.
(16)Warehouse facility incurs interest at a spread (as indicated in the table) plus the lower of (a) 3ML plus 35 bps or (b) the CP rate for this facility, which is determined by the facility lender. As of December 31, 2021, the CP rate for this facility was 0.24%.
(17)Financing was obtained for both asset-backed bonds and residual investments in various personal loan and student loan securitizations, and the underlying collateral are the underlying asset-backed bonds and residual investments. Wewe only state capacity amounts in this table for risk retention facilities wherein we can pledge additional asset-backed bonds and residual investments as of the balance sheet date.
(7)As of December 31, 2021.2023, $13.1 million of the revolving credit facility total capacity was not available for general borrowing purposes because it was utilized to secure letters of credit. Refer to our letter of credit disclosures in Note 18. Commitments, Guarantees, Concentrations and Contingencies for more details. Additionally, the interest rate presented is the interest rate on standard withdrawals on our revolving credit facility, while same-day withdrawals incur interest based on the prime rate.
SoFi Technologies, Inc.
SoFi Technologies, Inc.
Notes to Consolidated Financial Statements (continued)
(In Thousands, Unless Otherwise Stated and Except for Share and Per Share Data)
(18)(8)The original issue discount and debt issuance costs related to the convertible senior notes are amortized into interest expense—corporate borrowings in the consolidated statements of operations and comprehensive loss using the effective interest method over the contractual term of the notes. For the years ended December 31, 2023, 2022 and 2021, total interest expense on the convertible notes was $5.1 million, $5.1 million and $1.2 million, respectively, and the effective interest rate was 0.43%, 0.42% and 0.43%, respectively, related to amortization of debt discount and issuance costs. As of December 31, 2021, $6.02023 and December 31, 2022, unamortized debt discount and issuance costs were $13.3 million and $19.4 million, respectively, and the net carrying amount was $1.10 billion and $1.18 billion, respectively.
(9)Includes $54.8 million of loans and $131.7 million of investment securities pledged as collateral to secure $166.5 million of available borrowing capacity with the revolving credit facility total capacityFHLB, of which $27.2 million was not available for general borrowing purposes becauseas it was utilized to secure a letterletters of credit. Refer to our letter of credit disclosures in Note 1618. Commitments, Guarantees, Concentrations and Contingencies for more details. Also includes unsecured available borrowing capacity of $50.0 million with correspondent banks.
(19)The total accrued interest payable on borrowings of $11,189 and $13,538 as of December 31, 2023 and 2022, respectively, was presented within Interest rate presented is the interest rate on standard withdrawals on our revolving credit facility, while same-day withdrawals incur interest based on PR.
(20)accounts payable, accruals and other liabilitiesIn the fourth quarter of 2021, we issued and sold convertible senior notes. See related section below for additional information.
(21)Part of our consideration to acquire Galileo was in the form of a seller note financing arrangement, which we paid off in February 2021. See Note 2 for additional information. We also assumed certain other financing arrangements resulting from our acquisition of Galileo, which we paid off during the third quarter of 2021.consolidated balance sheets.
Convertible Senior Notes
In October 2021, we issued $1.2 billion aggregate principal amount of Convertible Notesconvertible notes due 2026, pursuant to an indenture, dated October 4, 2021, between the Company and U.S. Bank National Association, as trustee. The Convertible Notesconvertible notes are unsecured, unsubordinated obligations. The Convertible Notesconvertible notes do not bear regular interest. The Convertible Notesconvertible notes will mature on October 15, 2026, unless earlier repurchased, redeemed or converted.
The net proceeds from the offering were $1.176 billion, after deducting the 2% initial purchasers’ discount of $24 million, and before the cost of the capped call transactions,Capped Call Transactions, as described below, and offering expenses payable by the Company. The debt issuance costs of $1.7 million included third-party legal and accounting fees. The original issue discount and debt issuance costs are amortized into interest expense—corporate borrowings in the consolidated statements of operations and comprehensive income (loss)loss using the effective interest method over the contractual term of the Convertible Notes. Forconvertible notes.
In December 2023, the Company entered into separate, privately negotiated repurchase agreements with a limited number of holders of the convertible notes to repurchase $88.0 million aggregate principal amount of the convertible notes, which were settled through the issuance of 9,490,000 shares of common stock. Following these repurchases, $1.1 billion aggregate principal amount of the convertible notes remain outstanding.
These transactions were determined to be an extinguishment of debt. The difference between the consideration used to repurchase the convertible notes and the carrying value of the convertible notes, less retirement of discount and issuance costs, resulted in a gain on extinguishment of $14.6 million recorded within noninterest income—other in the consolidated statements of operations and comprehensive loss for the year ended December 31, 2021, total interest expense on the Convertible Notes was $1.2 million, related to amortization of debt discount and issuance costs.2023.
We used a portion of the net proceeds from the October 2021 offering to fund the cost of entering into the capped call transactions,Capped Call Transactions, as described in Note 12.13. Equity. The remainder of the net proceeds from the offering were used to pay related expenses and were allocated for general corporate purposes. All of these transactions are expected to remain in effect notwithstanding the December 2023 repurchases.
Conversion
The Convertible Notesconvertible notes are convertible by the noteholders prior to the close of business on the business day immediately preceding April 15, 2026 if certain conditions related to the Company’s share price are met, there are certain corporate events or distributions of the Company’s stock, or the Company calls the notes for redemption, each as set forth in the indenture. On and after April 15, 2026 until the close of business on the second scheduled trading day immediately preceding the maturity date, the Convertible Notesconvertible notes are freely convertible by the noteholders. The conversion rate is 44.6150 shares of our common stock per $1,000 principal amount of Convertible Notes,convertible notes, which represents an initial conversion price of approximately $22.41 per share of our common stock. As of December 31, 2021,2023, the Convertible Notesconvertible notes are potentially convertible into 53,538,00049,610,631 shares of common stock.
Settlement
We will settle conversions by paying or delivering, at our election, cash, shares of our common stock or a combination of cash and shares of our common stock, based on the applicable conversion rate(s). If we elect to deliver cash or a combination of cash and shares of our common stock, then the consideration due upon conversion will be determined over an observation period consisting of 30 “VWAP Trading Days” (as defined in the indenture). The conversion rate and conversion price will be
SoFi Technologies, Inc.
SoFi Technologies, Inc.
Notes to Consolidated Financial Statements (continued)
(In Thousands, Unless Otherwise Stated and Except for Share and Per Share Data)
subject to customary adjustments upon the occurrence of certain events. In addition, if certain corporate events that constitute a “Make-Whole Fundamental Change” (as defined in the indenture) occur, then the conversion rate will, in certain circumstances, be increased for a specified period of time.
Redemption
The Convertible Notesconvertible notes will also be redeemable, in whole or in part, at our option at any time, and from time to time, on or after October 15, 2024 through on or before the 30th scheduled trading day immediately before the maturity date, at a cash redemption price equal to the principal amount of the Convertible Notesconvertible notes to be redeemed, plus accrued interest, if any, thereon to, but excluding, the redemption date, but only if certain liquidity conditions described in the indenture are satisfied and certain conditions are met with respect to the last reported sale price per share of our common stock prior to conversion. In addition, calling any note for redemption will also constitute a Make-Whole Fundamental Change with respect to that note, in which case the conversion rate applicable to the conversion of that note will be increased in certain circumstances if it is converted after it is called for redemption.
SoFi Technologies, Inc.
Notes to Consolidated Financial Statements (continued)
(In Thousands, Unless Otherwise StatedNote 1. Organization, Summary of Significant Accounting Policies and Except for Share and Per Share Data)
See Note 1New Accounting Standards for our accounting policy as it relates to the Convertible Notes.convertible notes.
Material Changes to Debt Arrangements
On April 28, 2023, we entered into an Amended and Restated Revolving Credit Agreement (“Amended and Restated Credit Agreement”), which amended and restated the Revolving Credit Agreement (“Original Credit Agreement”), dated as of September 27, 2018, among Social Finance, Inc., the lenders party thereto, the issuing banks party thereto and Goldman Sachs Bank USA, as administrative agent. The Amended and Restated Credit Agreement amended and restated the Original Credit Agreement to, among other things, (i) increase the initial aggregate commitment to $645 million, (ii) extend the maturity date of the revolving credit facility to the date that is five years after the closing date, (iii) change the borrower entity under the revolving credit facility to SoFi Technologies, Inc., (iv) replace LIBOR as the term benchmark rate applicable to revolving loans denominated in U.S. dollars with a benchmark rate equal to Term SOFR plus a credit spread adjustment of 0.10%, and (v) effect certain other changes. The Amended and Restated Credit Agreement also contains financial covenants that require the Company to maintain a certain amount of unrestricted cash and cash equivalents and to meet certain risk-based capital ratios and a leverage ratio.
During the year ended December 31, 2021, we:
•issued Convertible Notes, as discussed above;
•paid off the seller note issued in 2020 for a total payment2023, we opened two personal loan warehouse facilities with an aggregate maximum available capacity of $269,864, consisting of outstanding principal of $250,000 and accrued interest of $19,864, and paid off the other financing arrangements assumed in connection with the acquisition of Galileo;
•opened 2$1.0 billion, two student loan warehouse facilities with an aggregate maximum available capacity of $650,000;
•opened 1 personal loan warehouse facility with a maximum available capacity of $300,000$550.0 million and closed 1 personal loan warehouse facility that had a maximum available capacity of $250,000;
•had 1 home loan warehouse facility mature that had a maximum available capacity of $150,000;
•opened 1 credit card warehouse facility with a maximum available capacity of $100,000; and
•opened 1one risk retention warehouse facility.
Our warehouse and securitization debt is secured by a continuing lien and security interest in the loans financed by the proceeds. Within each of our debt facilities, we must comply with certain operating and financial covenants. These financial covenants include, but are not limited to, maintaining: (i) a certain minimum tangible net worth, (ii) minimum unrestricted cash and cash equivalents, and (iii) a maximum leverage ratio of total debt to tangible net worth.worth, and (iv) minimum risk-based capital and leverage ratios. Our debt covenants can lead to restricted cash classifications in our consolidated balance sheets. Our subsidiaries are restricted in the amount that can be distributed to the parent company only to the extent that such distributions would cause the financial covenants to not be met. We were in compliance with all financial covenants.
We act as a guarantor for our wholly-owned subsidiaries in several arrangements in the case of default. As of December 31, 2021,2023, we have not identified any risks of nonpayment by our wholly-owned subsidiaries.
SoFi Technologies, Inc.
SoFi Technologies, Inc.
Notes to Consolidated Financial Statements (continued)
(In Thousands, Unless Otherwise Stated and Except for Share and Per Share Data)
Maturities of Borrowings
As of December 31, 2021, futureFuture maturities of our outstanding debt with scheduled payments, which included our revolving credit facility and convertible notes, were as follows:
| | 2022 | $ | — | |
| 2023 | 486,000 | |
| December 31, 2023 | | | December 31, 2023 |
| 2024 | 2024 | — | |
| 2025 | 2025 | — | |
| 2026 | 2026 | 1,200,000 | |
| 2027 | |
| 2028 | |
| Thereafter | Thereafter | — | |
| Total | Total | $ | 1,686,000 | |
Temporary Equity
Pursuant to SoFi Technologies’ Certificate of Incorporation dated May 28, 2021, the Company is authorized to issue 100,000,000 shares of preferred stock having a par value of $0.0001 per share (“SoFi Technologies Preferred Stock”) and 100,000,000 shares of redeemable preferred stock having a par value of $0.0000025 per share (“SoFi Technologies Redeemable Preferred Stock”). The Company’s Board of Directors has the authority to issue SoFi Technologies Preferred Stock and SoFi Technologies Redeemable Preferred Stock and to determine the rights, preferences, privileges and restrictions, including voting rights, of those shares. The authorized shares of SoFi Technologies Redeemable Preferred Stock is inclusive of 4,500,000 shares of Series 1 redeemable preferred stock (“Series 1 Redeemable Preferred Stock”), which reflect the conversion on a one-for-one basis of shares of Social Finance Series 1 preferred stock in conjunction with the Business Combination. Shares of SoFi Technologies Series 1 Redeemable Preferred Stock that are redeemed, purchased or otherwise acquired by the Company will be
SoFi Technologies, Inc.
Notes to Consolidated Financial Statements (continued)
(In Thousands, Unless Otherwise Stated and Except for Share and Per Share Data)
canceled and may not be reissued by the Company. The Series 1 Redeemable Preferred Stock remains classified as temporary equity because the Series 1 Redeemable Preferred Stock is not fully controlled by the issuer, SoFi Technologies. See “Series 1 Preference and Rights” for additional provisions of the SoFi Technologies Series 1 Redeemable Preferred Stock.
In addition to the Series 1 preferred stock, prior to the Business Combination, the Company had outstanding shares of Series A, Series B, Series C, Series D, Series E, Series F, Series G, Series H and Series H-1 preferred stock (collectively, “Preferred Stock”). Immediately prior to the Business Combination, all shares of the Company’s outstanding Preferred Stock, other than the Series 1 preferred stock, converted into a total of 465,832,666 shares of SoFi Technologies common stock on the following basis (15,000,000 of which were classified as redeemable common stock and immediately redeemed subsequent to the Business Combination):
•each share of Social Finance Series A, Series B, Series C, Series D, Series E and Series H-1 preferred stock was converted into the right to receive shares of SoFi Technologies common stock equal to the Exchange Ratio (as discussed in Note 2);
•each share of Social Finance Series F preferred stock was converted into the right to receive shares of SoFi Technologies common stock equal to 1.1102 multiplied by the Exchange Ratio;
•each share of Social Finance Series G preferred stock was converted into the right to receive shares of SoFi Technologies common stock equal to 1.2093 multiplied by the Exchange Ratio; and
•each share of Social Finance Series H preferred stock was converted into the right to receive shares of SoFi Technologies common stock equal to 1.0863 multiplied by the Exchange Ratio (except for shares of Series H preferred stock held by our Chief Executive Officer, which were converted into the right to receive shares of SoFi Technologies common stock equal to the Exchange Ratio).
As of December 31, 2021, there were no shares of SoFi Technologies Preferred Stock issued and outstanding and2023, there were 3,234,000 shares of SoFi Technologies Series 1 Redeemable Preferred Stock issued and outstanding, which had an original issuance price of $100.00.
Recent Issuances and Redemptions
In conjunction with the Business Combination, we redeemed and canceled 15,000,000 shares of redeemable SoFi Technologies common stock for a purchase price of $150.0 million.
During December 2020, we exercised a call and redeemed certain shares of redeemable preferred stock, which were retired upon receipt and for which the cash payment was made in January 2021. See Note 15 for additional information.
Series 1 Preference and Rights
On January 7, 2021, the Company and (i) entities affiliated with Silver Lake, which is affiliated with Michael Bingle, one of the directors of SoFi, (ii) entities affiliated with the Qatar Investment Authority (“QIA”),QIA, which is affiliated with Ahmed Al-Hammadi, one of the directors of SoFi, and (iii) Mr. Noto, the Chief Executive Officer and one of the directors of SoFi, entered into the Amended and Restated Series 1 Preferred Stock Investors’ Agreement (the “Amended Series 1 Agreement”), which amended the Series 1 Preferred Stock Investors’ Agreement dated May 29, 2019 (the “Original Series 1 Agreement”). Under the Original Series 1 Agreement, the Series 1 preferred stock had limited price protection in the instance that the Company liquidated, finalized an initial public offering, or sold control of the Company to a third party, which events would have triggered a special payment provision. In conjunction with the Business Combination, the Amended Series 1 Agreement amended the original special payment provision under the original agreement to provide for a one-time special payment of $21.2 million to the holders of Series 1 preferred stockholders,Redeemable Preferred Stock, which was paid from the proceeds of the Business Combination and settled contemporaneously with the Business Combination. The special payment was recognized within noninterest expense—general and administrative in the consolidated statements of operations and comprehensive income (loss),loss, as this feature was accounted for as an embedded derivative that was not clearly and closely
SoFi Technologies, Inc.
SoFi Technologies, Inc.
Notes to Consolidated Financial Statements (continued)
(In Thousands, Unless Otherwise Stated and Except for Share and Per Share Data)
related to the host contract, and willdid not have noa subsequent impact on our consolidated financial results. The Series 1 Redeemable Preferred Stock has no stated maturity.
In addition, in connection with the Business Combination, the Series 1 preferred stockholders entered into the Series 1 Registration Rights Agreement upon request by QIA, which provides Series 1 preferred stockholders with certain registration rights, provides for certain shelf registration filing obligations by SoFi and limits the future registration rights that SoFi may grant other parties.
SoFi Technologies, Inc.
Notes to Consolidated Financial Statements (continued)
(In Thousands, Unless Otherwise Stated and Except for Share and Per Share Data)
Dividends
Prior to the Business Combination, no dividends were declared or paid subject to the preferred stock dividend provisions. Subsequent to the Business Combination, the dividend provisions were no longer in effect.
Pursuant to the SoFi Technologies Certificate of Incorporation, the SoFi Technologies Series 1 preferred stock are entitled to receive cumulative cash dividends from and including the date of issuance of such shares at a fixed rate equal to $12.50 per annum per share, or 12.5% per annum, of the SoFi Technologies Series 1 Redeemable Preferred Stock share price of $100.00 (“Series 1 Dividend Rate”). The Series 1 Dividend Rate resets to a new fixed rate on the fifth anniversary of May 29, 2019, the original Series 1 preferred stock issue date (“Series 1 Original Issue Date”) and on every subsequent one-year anniversary of the Series 1 Original Issue Date (“Dividend Reset Date”), equal to six-month LIBORthe term benchmark rate applicable to revolving loans denominated in U.S. dollars in our revolving credit facility, i.e. a benchmark rate equal to Term SOFR plus a credit spread adjustment of 0.10% as in effect on the second London banking day prior to such Dividend Reset Datedividend determination date plus a spread of 9.94% per annum. Series 1 preferred stockholders prior to the Business Combination who received shares of SoFi Technologies Series 1 Redeemable Preferred Stock at the effective time of the Merger remained entitled to receive dividends accrued but unpaid as of the date of the Agreement in respect of such shares of Series 1 Redeemable Preferred Stock.
During the years ended December 31, 2021, 20202023, 2022 and 2019,2021, the Series 1 preferred stockholders were entitled to dividends of $40,426, $40,536$40,425, $40,425 and $23,923,$40,426, respectively. There were no dividends payable as of December 31, 2021 and 2020.2023.
Dividends are payable semiannually in arrears on the 30th day of June and 31st day of December of each year, when and as authorized by the Board of Directors. The Company may defer any scheduled dividend payment for up to three semiannual dividend periods, subject to such deferred dividend accumulating and compounding at the applicable Series 1 Dividend Rate. If the Company defers any single scheduled dividend payment on the Series 1 Redeemable Preferred Stock for four or more semiannual dividend periods, the Series 1 Dividend Rate applicable toto: (i) the compounding following the date of such default on all then-deferred dividend payments (whether or not deferred for four or more semiannual dividend periods) is applied on a go-forward basis and not retroactively, and (ii) new dividends declared following the date of such default and the compounding on such dividends if such new dividends are deferred shall be equal to the otherwise applicable Series 1 Dividend Rate plus 400 basis points. This default-related increase shall continue to apply until the Company pays all deferred dividends and related compounding. Once the Company is current on all such dividends, it may again commence deferral of any pre-scheduled dividend payment for up to three semiannual dividend periods, following the same procedure as outlined in the foregoing. There were no dividend deferrals during the years ended December 31, 2021 and 2020.
Conversion
Subsequent to the Business Combination, the conversion provisions in respect of each series of preferred stock were no longer in effect, other than the Series 1 Redeemable Preferred Stock, which did not have any rights of conversion. Pursuant to the SoFi Technologies Certificate of Incorporation, the Series 1 Redeemable Preferred Stock continue not to have any rights to convert into shares of any other class or series of securities of the Company.
Liquidation
Subsequent to the Business Combination, the liquidation provisions in respect of every series of preferred stock, other than Series 1 Redeemable Preferred Stock, were no longer in effect. Pursuant to the SoFi Technologies Certificate of Incorporation, with respect to rights to the distribution of assets upon the Company’s liquidation, dissolution or winding up, the Series 1 Redeemable Preferred Stock is senior to all classes or series of common stock, non-voting common stock, SoFi Technologies Preferred Stock and any other class or series of capital stock of the Company now or hereafter authorized, issued or outstanding that, by its terms, does not expressly provide that it ranks senior to or pari passu with the Series 1 Redeemable Preferred Stock.
SoFi Technologies, Inc.
SoFi Technologies, Inc.
Notes to Consolidated Financial Statements (continued)
(In Thousands, Unless Otherwise Stated and Except for Share and Per Share Data)
Settlement Rights
Pursuant to the SoFi Technologies Certificate of Incorporation, the Series 1 Redeemable Preferred Stock is redeemable at SoFi’s option in certain circumstances. SoFi may, at any time but no more than three times, at its option, settle the Series 1 Redeemable Preferred Stock, in whole or in part, but if in part, in an amount no less thanthan: (i) one-third of the total amount of Series 1 Redeemable Preferred Stock outstanding as of May 28, 2021 or (ii) the remainder of Series 1 Redeemable Preferred Stock outstanding (the “Minimum Redemption Amount”). In addition, SoFi may, at its option, settle for cash the Series 1 Redeemable Preferred Stock in whole, but not in part, within 120 days of the occurrence of a Change of Control (as that term is
SoFi Technologies, Inc.
Notes to Consolidated Financial Statements (continued)
(In Thousands, Unless Otherwise Stated and Except for Share and Per Share Data)
defined in the SoFi Technologies Certificate of Incorporation), which would result in a payment of the initial purchase price of the Series 1 preferred stock of $323.4 million plus any unpaid dividends on such stock (whether deferred or otherwise) (the “Series 1 Redemption Price”). Such settlement is determined at the discretion of the Board of Directors. If any such optional redemption by the Company occurs eithereither: (i) prior to the fifth anniversary of the Series 1 Original Issue Date or (ii) after the fifth anniversary of the Series 1 Original Issue Date and not on a Dividend Reset Date, the Series 1 Redeemable Preferred Stock is entitled to receive an amount in cash equal to any such dividends that would have otherwise been payable to the holder on its redeemed shares of Series 1 Redeemable Preferred Stock for all dividend periods following the applicable optional redemption date up to and including the Dividend Reset Date immediately following such optional redemption date.
If the Series 1 Redeemable Preferred Stock is not earlier redeemed by the Company, each holder of Series 1 Redeemable Preferred Stock has the right to require SoFi to settle for cash some or all of their Series 1 Redeemable Preferred Stock, in each case at the Series 1 Redemption Price, in the following circumstances: (i) within 120 days of the occurrence of a Change of Control, or (ii) during the six-month period following (a) a default in payment of any dividend on the Series 1 Redeemable Preferred Stock, or (b) the cure period for any covenant default under the SoFi Technologies Certificate of Incorporation. The Series 1 preferred stock had similar redemption provisions under the Original Series 1 Agreement. Pursuant to the Amended Series 1 Agreement, in January 2021, the Series 1 preferred stockholders waived their rights in the event of a liquidation, including the right to immediately receive the Series 1 proceeds. Therefore, the Series 1 preferred stock redemption value remained at $323.4 million subsequent to the Business Combination. The Series 1 Redeemable Preferred Stock remains in temporary equity following the Business Combination because the Series 1 Redeemable Preferred Stock is not fully controlled by SoFi.
Voting Rights
Subsequent to the Business Combination, the liquidation provisions in respect of every series of preferred stock, other than Series 1 Redeemable Preferred Stock, were no longer in effect. Pursuant to the SoFi Technologies Certificate of Incorporation, the Series 1 preferred stockholders do not have explicit board of director rights.
Warrants
In connection with the Series 1 and Series H preferred stock issuances during the year ended December 31, 2019, we also issued 12,170,990 Series H warrants, which were initially accounted for as liabilities, in accordance with ASC 480, and were included within accounts payable, accruals and other liabilities in the consolidated balance sheets. At inception, we allocated $22.3 million of the $539.0 million of proceeds we received from the Series 1 and Series H preferred stock issuances to the Series H warrants (which was reduced by $2.4 million of direct costs), with such valuation determined using the Black-Scholes Model, in order to establish an initial fair value for the Series H warrants. The remaining proceeds were allocated to the Series 1 and Series H preferred stock balances based on their initial relative fair values. This resulted in an initial allocation of $193.9 million and $320.4 million to the Series H and Series 1 preferred stock, respectively. The Series H preferred stock was converted into shares of SoFi Technologies common stock in conjunction with the Business Combination.
SubsequentPrior to the initial measurement and until the Business Combination, the Series H warrants were measured at fair value on a recurring basis and classified as Level 3 because of our reliance on unobservable assumptions, with fair value changes recognized within noninterest expense—general and administrative in the consolidated statements of operations and comprehensive income (loss).loss. On May 28, 2021, in conjunction with the Closing of the Business Combination, we measured the final fair value of our Series H warrants. Subsequently, we reclassified the Series H warrant liability of $161,775 into permanent equity, as the terms of the Series H instrument no longer necessitated liability accounting. Therefore, we did not measure the warrants at fair value subsequent to May 28, 2021.
SoFi Technologies, Inc.
SoFi Technologies, Inc.
Notes to Consolidated Financial Statements (continued)
(In Thousands, Unless Otherwise Stated and Except for Share and Per Share Data)
The key inputs into our Black-Scholes Model valuation as of December 31, 2020 and as of May 28, 2021, the final measurement date, were as follows:
| | | | | | | | | | | | | | |
| Input | | May 28, 2021 | | December 31, 2020 |
| Risk-free interest rate | | 0.3 | % | | 0.2 | % |
| Expected term (years) | | 2.9 | | 3.4 |
| Expected volatility | | 33.9 | % | | 32.6 | % |
| Dividend yield | | — | % | | — | % |
| Exercise price | | $ | 8.86 | | | $ | 8.86 | |
| Fair value of Series H preferred stock | | $ | 21.89 | | | $ | 9.74 | |
| | | | | | | | |
| Input | | May 28, 2021 |
| Risk-free interest rate | | 0.3 | % |
| Expected term (years) | | 2.9 |
| Expected volatility | | 33.9 | % |
| Dividend yield | | — | |
| Exercise price | | $ | 8.86 | |
| Fair value of Series H preferred stock | | $ | 21.89 | |
The Company’s use of the Black-Scholes Model required the use of subjective assumptions:
•The risk-freeRisk-free interest rate assumption was initially based — Based on the five-year U.S. Treasury rate, which was commensurate with the expected term of the warrants. At inception, we assumed that the term would be five years, given by design the warrants were only expected to extend for greater than five years if the Company was still not publicly traded by that point in time. The expected term assumption used reflects the five-year term less time elapsed since initial measurement. An increase in the expected term, in isolation, would typically correlate to a higher risk-free interest rate and result in an increase in the fair value measurement of the warrant liabilities and vice versa. See below for a development in connection with the Business Combination.
•Our expectedExpected volatility assumptions reflected — Reflected the expectation that the Series H warrants would convert into common stock upon consummation of the Business Combination, and the Series H preference would be of no further effect, in which case the Series H preference would not have a material impact on the stock volatility measure. As such, the expected volatility assumptions reflect our common stock volatilities as of May 28, 2021 and December 31, 2020.2021. An increase in the expected volatility, in isolation, would result in an increase in the fair value measurement of the warrant liabilities and vice versa.
•The fairFair value measurement of the Series H preferred stock — Determined as of December 31, 2020May 28, 2021, which was informed from a common stock transaction during December 2020 at a price of $10.57 per common share. We determined that this common stock transaction was a reasonable proxy for the valuation of the Series H preferred stock as of December 31, 2020May 28, 2021 due to the proximity to an expected Business Combination; therefore, other than adjusting for the Series H exchange ratio, no further adjustments were made for the Series H concluded price per share. As of May 28, 2021, the fair value measurement of the Series H redeemable preferred stock was determined based on the observable closing price of SCH stock (ticker symbol “IPOE”) on the measurement date multiplied by the weighted average exchange ratio of the Series H preferred stock.
•Dividend yield — We assumed no dividend yield because we have historically not paid out dividends to our preferred stockholders, other than to the Series 1 preferred stockholders, which is considered a special circumstance.
The following table presents the changes in the fair value of the Series H warrant liabilities during the periodsyear ended December 31, 2021, prior to the Closing of the Business Combination.
| | | | | |
| Warrant Liabilities |
Fair value as of January 1, 2020 | $ | 19,434 | |
Change in valuation inputs or other assumptions(1)
| 20,525 | |
Fair value as of December 31, 20202021 | $ | 39,959 | |
Change in valuation inputs or other assumptions(1) | 121,816 | |
Reclassification to permanent equity in conjunction with the Business Combination(2) | (161,775) | |
| Fair value as of December 31, 2021 | $ | — | |
_____________________
(1)Changes in valuation inputs or other assumptions are recognized within noninterest expense—general and administrative in the consolidated statements of operations and comprehensive income (loss).loss.
SoFi Technologies, Inc.
Notes to Consolidated Financial Statements (continued)
(In Thousands, Unless Otherwise Stated and Except for Share and Per Share Data)
(2)Upon the Closing of the Business Combination, Social Finance Series H warrants were converted into SoFi Technologies common stock warrants and reclassified to permanent equity, as the warrants no longer had features requiring liability based accounting and, therefore, represented a non-cash activity.
SoFi Technologies, Inc.
SoFi Technologies, Inc.
Notes to Consolidated Financial Statements (continued)
(In Thousands, Unless Otherwise Stated and Except for Share and Per Share Data)
Permanent Equity
On June 1, 2021, the Company’s common stock and warrants began trading on the Nasdaq Global Select Market under the ticker symbolssymbol “SOFI” and “SOFIW”, respectively.. Pursuant to SoFi Technologies’ Certificate of Incorporation, the Company is authorized to issue 3,000,000,000 shares of common stock, with a par value of $0.0001 per share, and 100,000,000 shares of non-voting common stock, with a par value of $0.0001 per share. As of December 31, 2021,2023, the Company had 828,154,462975,861,793 shares of common stock and no shares of non-voting common stock issued and outstanding. See Note 11 for additional information on Social Finance preferred stock that was converted into SoFi Technologies common stock in conjunction with the Business Combination.
During December 2020, we issued 34,973,294 shares of common stock for gross proceeds received of $369.8 million, which was offset by direct legal costs of $56 (the “Common Stock Issuance”). The number of shares issued in the Common Stock Issuance was subject to upward adjustment if we consummated the Business Combination described in Note 2, with the amount of the adjustment based on the implied per-share consideration in the Business Combination and the number of shares of our capital stock issued in certain dilutive issuances prior to the Closing of the Business Combination. The adjustment resulted in the issuance of an additional 1,281,132 shares at the time of the Closing of the Business Combination.
The Company reserved the following common stock for future issuance as of the dates indicated:issuance:
| | | | | | | | | | | |
| December 31, |
| 2021 | | 2020 |
| Outstanding stock options, RSUs and PSUs | 92,829,067 | | | 74,549,561 | |
| Outstanding common stock warrants | 12,170,990 | | | — | |
Conversion of Convertible Notes(1) | 53,538,000 | | | — | |
| Possible future issuance under stock plans | 32,470,481 | | | 33,422,273 | |
| Conversion of outstanding redeemable preferred stock | — | | | 465,916,522 | |
| Unissued redeemable preferred stock reserved for issued warrants | — | | | 12,170,990 | |
| Unissued redeemable preferred stock | — | | | 86,925,094 | |
| Contingent common stock | — | | | 320,649 | |
| Total common stock reserved for future issuance | 191,008,538 | | | 673,305,089 | |
| | | | | | | | | | | |
| December 31, |
| 2023 | | 2022 |
| Outstanding stock options, restricted stock units and performance stock units | 99,016,409 | | | 107,851,565 | |
| Outstanding common stock warrants | 12,170,990 | | | 12,170,990 | |
Conversion of convertible notes(1) | 49,610,631 | | | 53,538,000 | |
| Possible future issuance under stock plans | 45,384,011 | | | 26,434,957 | |
| Total common stock reserved for future issuance | 206,182,041 | | | 199,995,512 | |
_____________________
(1)As of December 31, 2021, representedRepresents the number of common stock issuable upon conversion of all Convertible Notesconvertible notes at the conversion rate in effect at the balance sheet date, in accordance with ASU 2020-06. See Note 1 and Note 10 for additional information.date.
Dividends
Common stockholders and non-voting common stockholders are entitled to dividends when and if declared by the Board of Directors and subject to government regulation over banks and bank holding companies, as discussed further in Note 21. Regulatory Capital. There were no dividends declared or paid to common stockholders during the years ended December 31, 20212023, 2022 and 2020.2021.
Voting Rights
Each holder of common stock has the right to one vote per share of common stock and is entitled to notice of any stockholder meeting. Non-voting common stock does not have any voting rights or other powers.
Capped Call Transactions
During 2021, we entered into privately negotiated Capped Call Transactions for a total cost of $113.8 million. The Capped Call Transactions initially cover, subject to customary anti-dilution adjustments, the number of shares of our common stock that initially underlie the Convertible Notes.convertible notes. The Capped Call Transactions are expected generally to reduce the potential dilutive effect on the common stock upon any conversion of Convertible Notesconvertible notes and/or offset any potential cash payments we
SoFi Technologies, Inc.
Notes to Consolidated Financial Statements (continued)
(In Thousands, Unless Otherwise Stated and Except for Share and Per Share Data)
are required to make in excess of the principal amount of converted Convertible Notes,convertible notes, as the case may be, with such reduction and/or offset subject to a cap, subject to certain adjustments under the terms of the Capped Call Transactions. The Capped Call Transactions allow the Company to purchase shares of our common stock at a strike price equal to the initial conversion price of approximately $22.41 per share, and are subject to a cap of $32.02 per share, subject to certain adjustments under the terms of the Capped Call Transactions. Capped Call Transactions are subject to automatic exercise if they are in-the-money as of certain expiration dates during September and October 2026. Settlement is subject to acceleration pursuant to the occurrence of certain corporate events, as well as postponement no later than January 12, 2027.
See Note 11. Organization, Summary of Significant Accounting Policies and New Accounting Standards for our accounting policy as it relates to the Capped Call Transactions.
SoFi Technologies, Inc.
SoFi Technologies, Inc.
Notes to Consolidated Financial Statements (continued)
(In Thousands, Unless Otherwise Stated and Except for Share and Per Share Data)
Accumulated Other Comprehensive Income (Loss)
Accumulated other comprehensive income (loss) (“AOCI”)AOCI primarily consists of accumulated net unrealized gains or losses associated with our investments in AFS debt securities which commenced during the third quarter of 2021, and foreign currency translation adjustments, which historically have been immaterial.
adjustments. The following table presents the rollforward of AOCI, inclusive of the changes in the components of other comprehensive income (loss) for the years indicated.:
| | | | | | | | | | | | | | | | | |
| AFS Debt Securities | | Foreign Currency Translation Adjustments | | Total |
| Year Ended December 31, 2021 | | | | | |
| AOCI, beginning balance | $ | — | | | $ | (166) | | | $ | (166) | |
Other comprehensive income (loss) before reclassifications(1) | (1,459) | | | 46 | | | (1,413) | |
| Amounts reclassified from AOCI into earnings | 108 | | | — | | | 108 | |
Net current-period other comprehensive income (loss)(2) | (1,351) | | | 46 | | | (1,305) | |
| AOCI, ending balance | $ | (1,351) | | | $ | (120) | | | $ | (1,471) | |
| | | | | |
| Year Ended December 31, 2020 | | | | | |
| AOCI, beginning balance | $ | — | | | $ | (21) | | | $ | (21) | |
Other comprehensive loss before reclassifications(1) | — | | | (145) | | | (145) | |
| | | | | |
Net current-period other comprehensive loss(2) | — | | | (145) | | | (145) | |
| AOCI, ending balance | $ | — | | | $ | (166) | | | $ | (166) | |
| | | | | | | | | | | | | | | | | |
| AFS Debt Securities | | Foreign Currency Translation Adjustments | | Total |
| Balance at January 1, 2021 | $ | — | | | $ | (166) | | | $ | (166) | |
Other comprehensive income (loss) before reclassifications(1) | (1,459) | | | 46 | | | (1,413) | |
| Amounts reclassified from AOCI into earnings | 108 | | | — | | | 108 | |
Net current-period other comprehensive income (loss)(2) | (1,351) | | | 46 | | | (1,305) | |
| Balance at December 31, 2021 | $ | (1,351) | | | $ | (120) | | | $ | (1,471) | |
Other comprehensive income (loss) before reclassifications(1) | (7,545) | | | 435 | | | (7,110) | |
| Amounts reclassified from AOCI into earnings | 285 | | | — | | | 285 | |
Net current-period other comprehensive income (loss)(2) | (7,260) | | | 435 | | | (6,825) | |
| Balance at December 31, 2022 | $ | (8,611) | | | $ | 315 | | | $ | (8,296) | |
Other comprehensive income before reclassifications(1) | 6,238 | | | 677 | | | 6,915 | |
| Amounts reclassified from AOCI into earnings | 172 | | | — | | | 172 | |
Net current-period other comprehensive income(2) | 6,410 | | | 677 | | | 7,087 | |
| Balance at December 31, 2023 | $ | (2,201) | | | $ | 992 | | | $ | (1,209) | |
_____________________(1)Gross realized gains and losses from sales of our investments in AFS debt securities that were reclassified from AOCI to earnings are recorded within noninterest income—other in the consolidated statements of operations and comprehensive income (loss). We did not have investments in AFS debt securities during the year ended December 31, 2020. Additionally, thereloss. There were no reclassifications related to foreign currency translation adjustments during the years ended December 31, 20212023, 2022 and 2020.2021.
(2)There were no material tax impacts during any of the years presented due to reserves against deferred tax assets in jurisdictions where other comprehensive incomeloss activity was generated.
The following table presents the gains (losses) recognized on our derivative instruments:
| | | | | | | | | | | | | | | | | |
| Year Ended December 31, |
| 2023 | | 2022 | | 2021 |
Interest rate swaps(1) | $ | (8,782) | | | $ | 302,002 | | | $ | 42,741 | |
Interest rate caps(1) | (5,910) | | | 8,680 | | | (125) | |
Home loan pipeline hedges(1) | 2,558 | | | 44,152 | | | 6,474 | |
| | | | | |
| Derivative contracts to manage future loan sale execution risk | (12,134) | | | 354,834 | | | 49,090 | |
Interest rate swaps(2) | 876 | | | 15,064 | | | — | |
IRLCs(1) | 1,576 | | | (3,543) | | | (11,861) | |
Interest rate caps(1) | 5,975 | | | (8,583) | | | (193) | |
Purchase price earn-out(1)(3) | 9 | | | 1,094 | | | 9,312 | |
Third party warrants(4) | 78 | | | (21) | | | 573 | |
Special payment(5) | — | | | — | | | (21,181) | |
| Total | $ | (3,620) | | | $ | 358,845 | | | $ | 25,740 | |
_____________________For gross(1) Recorded within noninterest income—loan origination, sales, and securitizations in the consolidated statements of operations and comprehensive loss.
(2) Represents derivative contracts to manage securitization investment interest rate risk, which are recorded within noninterest income—loan origination, sales, and securitizations in the consolidated statements of operations and comprehensive loss.
SoFi Technologies, Inc.
SoFi Technologies, Inc.
Notes to Consolidated Financial Statements (continued)
(In Thousands, Unless Otherwise Stated and Except for Share and Per Share Data)
(3) In conjunction with a loan sale agreement, we are entitled to receive payments from the buyer of the loans underlying the agreement if the internal rate of return (as defined in the loan sale agreement) on such loans exceeds a specified hurdle, subject to a dollar cap.
(4) Includes amounts recorded within noninterest income—other,noninterest expense—cost of operations and noninterest expense—general and administrative in the consolidated statements of operations and comprehensive loss, the latter of which represents the amortization of a deferred liability recognized at the initial fair value of the third party warrants acquired, as we are also a customer of the third party.
(5) In conjunction with the Business Combination, we made a one-time special payment to the holders of Series 1 Redeemable Preferred Stock, which was paid from the proceeds of the Business Combination and settled contemporaneously with the Business Combination. The special payment was recognized within noninterest expense—general and administrative in the consolidated statements of operations and comprehensive loss, as this feature was accounted for as an embedded derivative that was not clearly and closely related to the host contract, and will not have a subsequent impact on our consolidated financial results. The Series 1 Redeemable Preferred Stock has no stated maturity.
The following table presents information about derivative instruments subject to enforceable master netting arrangements:
| | | | | | | | | | | | | | | | | | | | | | | |
| December 31, 2023 | | December 31, 2022 |
| Gross Derivative Assets | | Gross Derivative Liabilities | | Gross Derivative Assets | | Gross Derivative Liabilities |
| Interest rate swaps | $ | 2,208 | | | $ | (1,347) | | | $ | 23,128 | | | $ | — | |
| Interest rate caps | — | | | (3,276) | | | — | | | (9,251) | |
| Home loan pipeline hedges | 1 | | | (1,328) | | | 1,484 | | | (80) | |
| Total, gross | $ | 2,209 | | | $ | (5,951) | | | $ | 24,612 | | | $ | (9,331) | |
| Derivative netting | (1,347) | | | 1,347 | | | (80) | | | 80 | |
Total, net(1) | $ | 862 | | | $ | (4,604) | | | $ | 24,532 | | | $ | (9,251) | |
_____________________
(1) We did not have a cash collateral requirement related to these instruments as of December 31, 2023 and December 31, 2022.
The following table presents the notional amount of derivative contracts outstanding:
| | | | | | | | | | | |
| December 31, |
| 2023 | | 2022 |
| Derivative contracts to manage future loan sale execution risk: | | | |
| Interest rate swaps | $ | 12,491,000 | | | $ | 5,638,177 | |
| Interest rate caps | 405,000 | | | 405,000 | |
| Home loan pipeline hedges | 226,000 | | | 126,000 | |
Interest rate caps(1) | 405,000 | | | 405,000 | |
Interest rate swaps(2) | 84,000 | | | 171,823 | |
IRLCs(3) | 126,388 | | | 82,335 | |
| Total | $ | 13,737,388 | | | $ | 6,828,335 | |
_____________________(1) We sold an interest rate cap that was subject to master netting to offset an interest rate cap purchase made in conjunction with a contract to manage future loan sale execution risk.
(2) Represents interest rate swaps utilized to manage interest rate risk associated with certain of our securitization investments.
(3) Amounts correspond with home loan funding commitments subject to IRLC agreements.
While the notional amounts of realized gainsderivative instruments give an indication of the volume of our derivative activity, they do not necessarily represent amounts exchanged by parties and lossesare not a direct measure of our financial exposure. See Note 1. Organization, Summary of Significant Accounting Policies and New Accounting Standards and Note 15. Fair Value Measurements for additional information on our derivative assets and liabilities.
SoFi Technologies, Inc.
SoFi Technologies, Inc.
Notes to Consolidated Financial Statements (continued)
(In Thousands, Unless Otherwise Stated and Except for Share and Per Share Data)
Note 15. Fair Value Measurements Recurring Fair Value Measurements
The following table summarizes, by level within the fair value hierarchy, the estimated fair values of our assets and liabilities measured at fair value on a recurring basis in the consolidated balance sheets:
| | | | | | | | | | | | | | | | | | | | | | | | | | | | | | | | | | | | | | | | | | | | | | | |
| December 31, 2023 | | December 31, 2022 |
| Fair Value | | Fair Value |
| Level 1 | | Level 2 | | Level 3 | | Total | | Level 1 | | Level 2 | | Level 3 | | Total |
| Assets | | | | | | | | | | | | | | | |
Investments in AFS debt securities(1)(2) | $ | 527,711 | | | $ | 67,476 | | | $ | — | | | $ | 595,187 | | | $ | 137,032 | | | $ | 58,406 | | | $ | — | | | $ | 195,438 | |
Asset-backed bonds(2)(3) | — | | | 70,828 | | | — | | | 70,828 | | | — | | | 155,093 | | | — | | | 155,093 | |
Residual investments(2)(3) | — | | | — | | | 35,920 | | | 35,920 | | | — | | | — | | | 46,238 | | | 46,238 | |
Loans at fair value(4) | — | | | 66,198 | | | 22,056,057 | | | 22,122,255 | | | — | | | — | | | 13,557,074 | | | 13,557,074 | |
| Servicing rights | — | | | — | | | 180,469 | | | 180,469 | | | — | | | — | | | 149,854 | | | 149,854 | |
| | | | | | | | | | | | | | | |
Third party warrants(5)(6) | — | | | — | | | 630 | | | 630 | | | — | | | — | | | 630 | | | 630 | |
Derivative assets(5)(7)(8) | — | | | 2,209 | | | — | | | 2,209 | | | — | | | 24,612 | | | — | | | 24,612 | |
Purchase price earn-out(5)(9) | — | | | — | | | — | | | — | | | — | | | — | | | 54 | | | 54 | |
IRLCs(5)(10) | — | | | — | | | 2,155 | | | 2,155 | | | — | | | — | | | 216 | | | 216 | |
Student loan commitments(5)(10) | — | | | — | | | 5,465 | | | 5,465 | | | — | | | — | | | — | | | — | |
Interest rate caps(5)(8) | — | | | 3,269 | | | — | | | 3,269 | | | — | | | 9,178 | | | — | | | 9,178 | |
Digital assets safeguarding asset(5)(11) | — | | | 9,292 | | | — | | | 9,292 | | | — | | | 106,826 | | | — | | | 106,826 | |
| Total assets | $ | 527,711 | | | $ | 219,272 | | | $ | 22,280,696 | | | $ | 23,027,679 | | | $ | 137,032 | | | $ | 354,115 | | | $ | 13,754,066 | | | $ | 14,245,213 | |
| Liabilities | | | | | | | | | | | | | | | |
Debt(12) | $ | — | | | $ | 119,641 | | | $ | — | | | $ | 119,641 | | | $ | — | | | $ | 89,142 | | | $ | — | | | $ | 89,142 | |
| Residual interests classified as debt | — | | | — | | | 7,396 | | | 7,396 | | | — | | | — | | | 17,048 | | | 17,048 | |
Derivative liabilities(5)(7)(8) | — | | | 5,951 | | | — | | | 5,951 | | | — | | | 9,331 | | | — | | | 9,331 | |
Student loan commitments(5)(10) | — | | | — | | | — | | | — | | | — | | | — | | | 236 | | | 236 | |
Digital assets safeguarding liability(5)(11) | — | | | 9,292 | | | — | | | 9,292 | | | — | | | 106,826 | | | — | | | 106,826 | |
| Total liabilities | $ | — | | | $ | 134,884 | | | $ | 7,396 | | | $ | 142,280 | | | $ | — | | | $ | 205,299 | | | $ | 17,284 | | | $ | 222,583 | |
_____________________(1)The investments in AFS debt securities see that were classified as Level 2 rely upon observable inputs other than quoted prices, dealer quotes in markets that are not active and implied pricing derived from new issuances of similar securities. See Note 4. Interest income associated with our investments in AFS debt securities recognized6. Investment Securities for additional information.
(2)These assets are presented within investment securities in the consolidated balance sheets.
(3)These assets represent the carrying value of our holdings in VIEs wherein we were not deemed the primary beneficiary. See Note 7. Securitization and Variable Interest Entities for additional information. We classify asset-backed bonds as Level 2 due to the use of quoted prices for similar assets in markets that are not active, as well as certain factors specific to us. The key inputs used to value the asset-backed bonds include the discount rate and conditional prepayment rate. The fair value of our asset-backed bonds was not materially impacted by default assumptions on the underlying securitization loans, as the subordinate residual interests are expected to absorb all estimated losses based on our default assumptions for the period. We classify the residual investments as Level 3 due to the reliance on significant unobservable valuation inputs.
(4)During the year ended December 31, 2023, we transferred $66,198 out of Level 3 into Level 2 relating to home loans due to an update to pricing sources utilized by third-party valuation specialists, as part of the integration of Wyndham. Personal loans and student loans classified as Level 3 do not trade in an active market with readily observable prices. Personal loans and home loans are presented within loans held for sale, at fair value. As of December 31, 2023 and December 31, 2022, student loans are presented within loans held for investment, at fair value and loans held for sale, at fair value, respectively.
(5)These assets and liabilities are presented within other assets and accounts payable, accruals and other liabilities, respectively, in the consolidated balance sheets.
(6)The key unobservable assumption used in the fair value measurement of the third party warrants was the price of the stock underlying the warrants. The fair value was measured as the difference between the stock price and the strike price of the warrants. As the strike price was insignificant, we concluded that the impact of time value on the fair value measure was immaterial.
(7)For certain derivative instruments for which an enforceable master netting agreement exists, we elected to net derivative assets and derivative liabilities by counterparty. These instruments are presented on a gross basis herein. See Note 1. Organization, Summary of Significant Accounting Policies and New Accounting Standards and Note 14. Derivative Financial Instruments for additional information.
(8)Home loan pipeline hedges represent TBAs used as economic hedges of loan fair values and are classified as Level 2, as we rely on quoted market prices from similar loan pools that transact in the marketplace. Interest rate swaps and interest income—rate caps are classified as Level 2, because these financial
SoFi Technologies, Inc.
SoFi Technologies, Inc.
Notes to Consolidated Financial Statements (continued)
(In Thousands, Unless Otherwise Stated and Except for Share and Per Share Data)
instruments do not trade in active markets with observable prices, but rely on observable inputs other than quoted prices. As of December 31, 2023 and December 31, 2022, interest rate swaps and interest rate caps were valued using the overnight SOFR curve and the implied volatilities suggested by the SOFR rate curve. These were determined to be observable inputs from active markets.
(9)The purchase price earn-out provision is classified as Level 3 because of our reliance on unobservable inputs related to the underlying loan portfolio performance, such as conditional prepayment rates, annual default rates and discount rates.
(10)IRLCs and student loan commitments are classified as Level 3 because of our reliance on assumed loan funding probabilities. The assumed probabilities are based on our internal historical experience with home loans and student loans similar to those in the funding pipelines on the measurement date.
(11)The digital assets safeguarding liability and corresponding safeguarding asset are classified as Level 2, because they do not trade in active markets, and are valued using quoted prices on an active exchange that has been identified as the principal market for the underlying digital assets that are being held by our third-party custodians for the benefit of our members. Refer to Note 1. Organization, Summary of Significant Accounting Policies and New Accounting Standards for additional information about our digital assets activities.
(12)The fair value of our securitization debt was classified as Level 2 and valued using a discounted cash flow model, with key inputs relating to the underlying contractual coupons, terms, discount rate and expectations for defaults and prepayments. As of December 31, 2023 and December 31, 2022, the unpaid principal related to debt measured at fair value was $128,619 and $98,868, respectively. For the years ended December 31, 2023 and 2022, losses from changes in fair value were $2,969 and $586, respectively. The estimated amounts of gains (losses) included in earnings attributable to changes in instrument-specific credit risk, which were derived principally from observable changes in credit spread as observed in the bond market, were immaterial for the years ended December 31, 2023 and 2022.
Level 3 Recurring Fair Value Rollforward
The following tables present the changes in our assets and liabilities measured at fair value on a recurring basis using significant unobservable inputs (Level 3). During the year ended December 31, 2023, we had transfers out of Level 3 of $66,198 and no transfers into Level 3. During the year ended December 31, 2022, we did not have any transfers into or out of Level 3.
| | | | | | | | | | | | | | | | | | | | | | | | | | | | | |
| Fair Value at | | | | | | | | Fair Value at |
| January 1,
2023 | Impact on Earnings | Purchases | Sales | Issuances | Settlements | Other Changes | Transfers Out of Level 3 | December 31,
2023 |
| Assets | | | | | | | | | |
| Personal loans | $ | 8,610,434 | | $ | (5,045) | | $ | 61,951 | | $ | (938,403) | | $ | 13,801,065 | | $ | (6,197,997) | | $ | (1,432) | | $ | — | | $ | 15,330,573 | |
| Student loans | 4,877,177 | | 174,005 | | 111,923 | | (96,678) | | 2,630,040 | | (970,690) | | (293) | | — | | 6,725,484 | |
| Home loans | 69,463 | | 6,694 | | 24,783 | | (1,029,214) | | 997,492 | | (3,359) | | 339 | | (66,198) | | — | |
Loans at fair value(1) | 13,557,074 | | 175,654 | | 198,657 | | (2,064,295) | | 17,428,597 | | (7,172,046) | | (1,386) | | (66,198) | | 22,056,057 | |
Servicing rights(2) | 149,854 | | 34,700 | | 2,464 | | (1,259) | | 59,119 | | (64,409) | | — | | — | | 180,469 | |
Residual investments(3) | 46,238 | | 1,375 | | 3,235 | | (807) | | — | | (14,121) | | — | | — | | 35,920 | |
IRLCs(4) | 216 | | 5,323 | | 363 | | — | | — | | (3,747) | | — | | — | | 2,155 | |
Student loan commitments(4) | (236) | | 7,480 | | — | | — | | — | | (1,779) | | — | | — | | 5,465 | |
Third party warrants(5) | 630 | | — | | — | | — | | — | | — | | — | | — | | 630 | |
Purchase price earn out(6) | 54 | | 9 | | — | | — | | — | | (63) | | — | | — | | — | |
| Liabilities | | | | | | | | | |
Residual interests classified as debt(3) | (17,048) | | (425) | | (1,203) | | — | | — | | 11,280 | | — | | — | | (7,396) | |
| | | | | | | | | |
| | | | | | | | | |
| Net impact on earnings | | $ | 224,116 | | | | | | | | |
SoFi Technologies, Inc.
SoFi Technologies, Inc.
Notes to Consolidated Financial Statements (continued)
(In Thousands, Unless Otherwise Stated and Except for Share and Per Share Data)
| | | | | | | | | | | | | | | | | | | | | | | | | | |
| Fair Value at | | | | | | | Fair Value at |
| January 1, 2022 | Impact on Earnings | Purchases | Sales | Issuances | Settlements | Other Changes | December 31, 2022 |
| Assets | | | | | | | | |
| Personal loans | $ | 2,289,426 | | $ | 129,132 | | $ | 1,677,682 | | $ | (2,911,491) | | $ | 9,773,705 | | $ | (2,322,634) | | $ | (25,386) | | $ | 8,610,434 | |
| Student loans | 3,450,837 | | 15,786 | | 817,864 | | (877,920) | | 2,245,499 | | (734,937) | | (39,952) | | 4,877,177 | |
| Home loans | 212,709 | | (10,840) | | 2,901 | | (1,094,981) | | 966,177 | | (6,503) | | — | | 69,463 | |
Loans at fair value(1) | 5,952,972 | | 134,078 | | 2,498,447 | | (4,884,392) | | 12,985,381 | | (3,064,074) | | (65,338) | | 13,557,074 | |
Servicing rights(2) | 168,259 | | 39,651 | | 3,712 | | (22,020) | | 45,126 | | (84,874) | | — | | 149,854 | |
Residual investments(3) | 121,019 | | 2,240 | | — | | (36,732) | | — | | (40,289) | | — | | 46,238 | |
IRLCs(4) | 3,759 | | (2,630) | | — | | — | | — | | (913) | | — | | 216 | |
| | | | | | | | |
Third party warrants(5) | 1,369 | | (739) | | — | | — | | — | | — | | — | | 630 | |
Purchase price earn out(6) | 4,272 | | 1,094 | | — | | — | | — | | (5,312) | | — | | 54 | |
| Liabilities | | | | | | | | |
Residual interests classified as debt(3) | (93,682) | | (6,608) | | — | | — | | — | | 83,242 | | — | | (17,048) | |
| | | | | | | | |
Student loan commitments(4) | 2,220 | | (1,876) | | — | | — | | — | | (580) | | — | | (236) | |
| Net impact on earnings | | $ | 165,210 | | | | | | | |
_____________________(1)For loans at fair value, purchases reflect unpaid principal balance and relate to previously transferred loans. Purchase activity included securitization clean-up calls of $39,936 during the year ended December 31, 2021 was immaterial.2023, and $518,659 during the year ended December 31, 2022. The remaining purchases during the periods presented related to standard representations and warranties pursuant to our various loan sale agreements. Issuances represent the principal balance of loans originated during the period. Settlements represent principal payments made on loans during the period. Other changes represent fair value adjustments that impact the balance sheet primarily associated with whole loan strategic repurchases, clean up calls and consolidated securitizations. During the year ended December 31, 2023, we had $66,198 of transfers out of Level 3 related to our home loans related to an update to pricing sources utilized by third-party valuation specialists. Impacts on earnings for loans at fair value are recorded within interest income—loans and securitizations, within noninterest income—loan origination, sales, and securitizations, and within noninterest expense—general and administrative in the consolidatedstatements of operations and comprehensive loss.
(2)For servicing rights, impacts on earnings are recorded within noninterest income—loan origination, sales, and securitizations in the consolidatedstatements of operations and comprehensive loss.
(3)For residual investments, sales include the derecognition of investments associated with securitization clean up calls. The estimated amounts of gains and losses for residual investments included in earnings attributable to changes in instrument-specific credit risk were immaterial during the periods presented. For residual investments and residual interests classified as debt, impacts on earnings are recorded within noninterest income—loan origination, sales, and securitizations in the consolidated statements of operations and comprehensive loss, a portion of which is subsequently reclassified to interest expense—securitizations and warehouses for residual interests classified as debt and to interest income—loans and securitizations for residual investments, but does not impact the liability or asset balance, respectively.
(4)For IRLCs and student loan commitments, settlements reflect funded and unfunded adjustments representing the unpaid principal balance of funded and unfunded loans during the quarter multiplied by the IRLC or student loan commitment price in effect at the beginning of the quarter. Purchases of IRLCs during the year ended December 31, 2023 were associated with our acquisition of Wyndham. For year-to-date periods, amounts represent the summation of the per-quarter effects. For IRLCs and student loan commitments, impacts on earnings are recorded within noninterest income—loan origination, sales, and securitizations in the consolidated statements of operations and comprehensive loss.
(5)For purchase price earn out, impacts on earnings are recorded within noninterest income—loan origination, sales, and securitizations in the consolidated statements of operations and comprehensive loss.
(6)For third party warrants, impacts on earnings are recorded within noninterest income—other in the consolidated statements of operations and comprehensive loss.
Loans at Fair Value
Gains and losses recognized in earnings include changes in accumulated interest and fair value adjustments on loans originated during the period and on loans held at the balance sheet date, as well as loan charge-offs. Changes in fair value are primarily impacted by valuation assumption changes as well as sales price execution. The estimated amount of gains (losses) included in earnings attributable to changes in instrument-specific credit risk was $(26,625), $(49,453) and $4,143 during the years ended December 31, 2023, 2022 and 2021, respectively. The gains (losses) attributable to instrument-specific credit risk were estimated by incorporating our current default and loss severity assumptions for the loans. These assumptions are based on historical performance, market trends and performance expectations over the term of the underlying instrument.
SoFi Technologies, Inc.
SoFi Technologies, Inc.
Notes to Consolidated Financial Statements (continued)
(In Thousands, Unless Otherwise Stated and Except for Share and Per Share Data)
Level 3 Significant Inputs
Loans
Fair value is defined as the price that would be received for an asset or paid to transfer a liability (an exit price) in the principal or most advantageous market for the asset or liability in an orderly transaction between market participants on the measurement date. Level 3 fair value measurements include unobservable inputs for assets or liabilities for which there is little or no market data, which requires us to develop our own assumptions. These unobservable assumptions reflect estimates of inputs that market participants would use in pricing the asset or liability. Valuation techniques include the use of option pricing models, discounted cash flow models, or similar techniques, which incorporate management’s own estimates of assumptions that market participants would use in pricing the asset or liability.
Loans
The following key unobservable assumptions were used in the fair value measurement of our loans:
| | | | | | | | | | | | | | | | | | | | | | | |
| December 31, 2023 | | December 31, 2022 |
| Range | | Weighted Average | | Range | | Weighted Average |
| Personal loans | | | | | | | |
| Conditional prepayment rate | 17.5% – 29.5% | | 23.2% | | 17.3% – 25.5% | | 19.1% |
| Annual default rate | 4.5% – 50.4% | | 4.8% | | 3.8% – 37.7% | | 4.4% |
| Discount rate | 5.5% – 8.1% | | 5.5% | | 5.4% – 8.3% | | 6.1% |
| Student loans | | | | | | | |
| Conditional prepayment rate | 8.4% – 12.6% | | 10.5% | | 16.3% – 21.8% | | 20.4% |
| Annual default rate | 0.4% – 6.4% | | 0.6% | | 0.2% – 4.5% | | 0.5% |
| Discount rate | 4.1% – 8.1% | | 4.3% | | 3.6% – 8.7% | | 4.0% |
Home loans(1) | | | | | | | |
| Conditional prepayment rate | n/m | | n/m | | 2.0% – 10.2% | | 7.0% |
| Annual default rate | n/m | | n/m | | 0.1% – 1.3% | | 0.1% |
| Discount rate | n/m | | n/m | | 5.7% – 14.1% | | 5.9% |
_____________________
(1)As of December 31, 2023, we had no Level 3 home loans.
The key assumptions are defined as follows:
•Conditional prepayment rate — The monthly annualized proportion of the principal of a pool of loans that is assumed to be paid off prematurely in each period. An increase in the conditional prepayment rate, in isolation, would result in a decrease in a fair value measurement. The weighted average assumption was weighted based on relative fair value.
•Annual default rate — The annualized rate of borrowers who do not make loan payments on time. An increase in the annual default rate, in isolation, would result in a decrease in a fair value measurement. The weighted average assumption was weighted based on relative fair value.
•Discount rate — The weighted average rate at which the expected cash flows are discounted to arrive at the net present value of the loans. The discount rate is primarily determined based on an underlying benchmark rate, curve and spread(s), the latter of which is determined based on factors including, but not limited to, weighted average coupon rate, prepayment rate, default rate and resulting expected duration of the assets. An increase in the discount rate, in isolation, would result in a decrease in a fair value measurement. The weighted average assumption was weighted based on relative fair value.
See Note 13.4. Loans for additional loan fair value disclosures.
SoFi Technologies, Inc.
SoFi Technologies, Inc.
Notes to Consolidated Financial Statements (continued)
(In Thousands, Unless Otherwise Stated and Except for Share and Per Share Data)
Servicing Rights
Servicing rights for personal loans and student loans do not trade in an active market with readily observable prices. Similarly, home loan servicing rights infrequently trade in an active market. At the time of the underlying loan sale or the assumption of servicing rights, the fair value of servicing rights is determined using a discounted cash flow methodology based on observable and unobservable inputs. Management classifies servicing rights as Level 3 due to the use of significant unobservable inputs in the fair value measurement.
The following key unobservable inputs were used in the fair value measurement of our classes of servicing rights:
| | | | | | | | | | | | | | | | | | | | | | | |
| December 31, 2023 | | December 31, 2022 |
| Range | | Weighted Average | | Range | | Weighted Average |
| Personal loans | | | | | | | |
| Market servicing costs | 0.1% – 1.8% | | 0.2% | | 0.2% – 0.5% | | 0.3% |
| Conditional prepayment rate | 17.9% – 35.5% | | 22.4% | | 17.9% – 31.3% | | 22.7% |
| Annual default rate | 3.3% – 22.5% | | 4.7% | | 3.4% – 7.9% | | 4.9% |
| Discount rate | 8.8% – 8.8% | | 8.8% | | 7.8% – 7.8% | | 7.8% |
| Student loans | | | | | | | |
| Market servicing costs | 0.1% – 0.2% | | 0.1% | | 0.1% – 0.2% | | 0.1% |
| Conditional prepayment rate | 10.9% – 15.3% | | 12.2% | | 15.4% – 21.9% | | 17.8% |
| Annual default rate | 0.3% – 3.7% | | 0.6% | | 0.3% – 4.3% | | 0.4% |
| Discount rate | 8.8% – 8.8% | | 8.8% | | 7.8% – 7.8% | | 7.8% |
| Home loans | | | | | | | |
| Market servicing costs | 0.1% – 0.2% | | 0.2% | | 0.1% – 0.1% | | 0.1% |
| Conditional prepayment rate | 5.6% – 24.0% | | 8.1% | | 4.9% – 11.0% | | 5.2% |
| Annual default rate | 0.1% – 0.1% | | 0.1% | | 0.1% – 0.1% | | 0.1% |
| Discount rate | 9.2% – 10.0% | | 9.3% | | 9.0% – 9.0% | | 9.0% |
The key assumptions are defined as follows:
•Market servicing costs — The fee a willing market participant, which we validate through actual third-party bids for our servicing, would require for the servicing of personal loans, student loans and home loans with similar characteristics as those in our serviced portfolio. An increase in the market servicing cost, in isolation, would result in a decrease in a fair value measurement. The weighted average assumption was weighted based on relative fair value.
•Conditional prepayment rate — The monthly annualized proportion of the principal of a pool of loans that is assumed to be paid off prematurely in each period. An increase in the conditional prepayment rate, in isolation, would result in a decrease in a fair value measurement. The weighted average assumption was weighted based on relative fair value.
•Annual default rate — The annualized rate of default within the total serviced loan balance. An increase in the annual default rate, in isolation, would result in a decrease in a fair value measurement. The weighted average assumption was weighted based on relative fair value.
•Discount rate — The weighted average rate at which the expected cash flows are discounted to arrive at the net present value of the servicing rights. An increase in the discount rate, in isolation, would result in a decrease in a fair value measurement. The weighted average assumption was weighted based on relative fair value.
SoFi Technologies, Inc.
SoFi Technologies, Inc.
Notes to Consolidated Financial Statements (continued)
(In Thousands, Unless Otherwise Stated and Except for Share and Per Share Data)
The following table presents the estimated decrease to the fair value of our servicing rights if the key assumptions had each of the below adverse changes:
| | | | | | | | | | | |
| December 31, |
| 2023 | | 2022 |
| Market servicing costs | | | |
| 2.5 basis points increase | $ | (6,176) | | | $ | (10,395) | |
| 5.0 basis points increase | (12,351) | | | (20,807) | |
| Conditional prepayment rate | | | |
| 10% increase | $ | (5,189) | | | $ | (4,036) | |
| 20% increase | (10,098) | | | (7,833) | |
| Annual default rate | | | |
| 10% increase | $ | (480) | | | $ | (166) | |
| 20% increase | (921) | | | (331) | |
| Discount rate | | | |
| 100 basis points increase | $ | (4,674) | | | $ | (3,905) | |
| 200 basis points increase | (9,054) | | | (7,562) | |
The sensitivity calculations above are hypothetical and should not be considered to be predictive of future performance. The effect on fair value of a variation in assumptions generally cannot be determined because the relationship of the change in assumptions to the fair value may not be linear. Additionally, the effect of an adverse variation in a particular assumption on the fair value of our servicing rights is calculated while holding the other assumptions constant. In reality, changes in one factor may lead to changes in other factors, which could impact the above hypothetical effects.
Residual Investments and Residual Interests Classified as Debt
Residual investments and residual interests classified as debt do not trade in active markets with readily observable prices, and there is limited observable market data for reference. The fair values of residual investments and residual interests classified as debt are determined using a discounted cash flow methodology. Management classifies residual investments and residual interests classified as debt as Level 3 due to the use of significant unobservable inputs in the fair value measurements.
The following key unobservable inputs were used in the fair value measurements of our residual investments and residual interests classified as debt:
| | | | | | | | | | | | | | | | | | | | | | | |
| December 31, 2023 | | December 31, 2022 |
| Range | | Weighted Average | | Range | | Weighted Average |
| Residual investments | | | | | | | |
| Conditional prepayment rate | 12.2% – 28.3% | | 14.8% | | 17.9% – 32.0% | | 19.9% |
| Annual default rate | 0.5% – 6.9% | | 1.4% | | 0.4% – 5.4% | | 1.1% |
| Discount rate | 5.8% – 15.5% | | 8.7% | | 4.8% – 10.5% | | 6.7% |
| Residual interests classified as debt | | | | | | | |
| Conditional prepayment rate | 12.3% – 12.6% | | 12.4% | | 17.2% – 18.1% | | 17.8% |
| Annual default rate | 0.7% – 0.7% | | 0.7% | | 0.6% – 0.8% | | 0.7% |
| Discount rate | 10.0% – 10.3% | | 10.0% | | 7.5% – 7.5% | | 7.5% |
The key assumptions are defined as follows:
•Conditional prepayment rate — The monthly annualized proportion of the principal of a pool of loans that is assumed to be paid off prematurely in each period for the pool of loans in the securitization. An increase in the conditional prepayment rate, in isolation, would result in a decrease in a fair value measurement. The weighted average assumption was weighted based on relative fair value.
SoFi Technologies, Inc.
SoFi Technologies, Inc.
Notes to Consolidated Financial Statements (continued)
(In Thousands, Unless Otherwise Stated and Except for Share and Per Share Data)
•Annual default rate — The annualized rate of borrowers who fail to remain current on their loans for the pool of loans in the securitization. An increase in the annual default rate, in isolation, would result in a decrease in a fair value measurement. The weighted average assumption was weighted based on relative fair value.
•Discount rate — The weighted average rate at which the expected cash flows are discounted to arrive at the net present value of the residual investments and residual interests classified as debt. An increase in the discount rate, in isolation, would result in a decrease in a fair value measurement. The weighted average assumption was weighted based on relative fair value.
Loan Commitments
We classify student loan commitments as Level 3 because the assets do not trade in an active market with readily observable prices and, as such, our valuations utilize significant unobservable inputs. Additionally, we classify IRLCs as Level 3, as our IRLCs are inherently uncertain and unobservable given that a home loan origination is contingent on a plethora of factors. The following key unobservable inputs were used in the fair value measurements of our IRLCs and student loan commitments:
| | | | | | | | | | | | | | | | | | | | | | | |
| December 31, 2023 | | December 31, 2022 |
| Range | | Weighted Average | | Range | | Weighted Average |
| IRLCs | | | | | | | |
Loan funding probability(1) | 71.9% – 77.2% | | 76.3% | | 11.1% – 58.6% | | 46.3% |
| Student loan commitments | | | | | | | |
Loan funding probability(1) | 95.0% – 95.0% | | 95.0% | | 95.0% - 95.0% | | 95.0% |
_____________________(1)The aggregate amount of student loans we committed to fund was $89,369 as of December 31, 2023. The higher assumptions in the 2023 period reflect the home loan funding pipeline associated with our acquisition of Wyndham. See Note 14. Derivative Financial Instruments for the aggregate notional amount associated with IRLCs.
The key assumption is defined as follows:
•Loan funding probability — Our expectation of the percentage of IRLCs or student loan commitments which will become funded loans. A significant difference between the actual funded rate and the assumed funded rate at the measurement date could result in a significantly higher or lower fair value measurement of our IRLCs and student loan commitments. An increase in the loan funding probabilities, in isolation, would result in an increase in a fair value measurement. The weighted average assumptions were weighted based on relative fair values.
Safeguarding Assets and Liabilities
The following table presents the significant digital assets held by our third-party custodians on behalf of our members:
| | | | | | | | | | | |
| December 31, 2023 | | December 31, 2022 |
| Bitcoin (BTC) | $ | 5,425 | | | $ | 44,346 | |
| Ethereum (ETH) | 3,304 | | | 37,826 | |
| Ethereum Classic (ETC) | 294 | | | 2,333 | |
| Litecoin (LTC) | 198 | | | 2,492 | |
| Dogecoin (DOGE) | 8 | | | 4,784 | |
Cardano (ADA)(1) | — | | | 5,217 | |
Solana (SOL)(1) | — | | | 1,588 | |
All other(1)(2) | 63 | | | 8,240 | |
Digital assets safeguarding liability and corresponding safeguarding asset(3) | $ | 9,292 | | | $ | 106,826 | |
___________________(1)Effective June 9, 2023, we ended support of these digital assets, as well as several others included in the “all other” category.
(2)Includes 17 and 23 digital assets as of December 31, 2023 and December 31, 2022, respectively, none of which were determined to be individually significant.
SoFi Technologies, Inc.
SoFi Technologies, Inc.
Notes to Consolidated Financial Statements (continued)
(In Thousands, Unless Otherwise Stated and Except for Share and Per Share Data)
(3)Refer to Note 1. Organization, Summary of Significant Accounting Policies and New Accounting Standards for additional information about our digital assets activities.
Financial Instruments Not Measured at Fair Value
The following table summarizes the carrying values and estimated fair values, by level within the fair value hierarchy, of our assets and liabilities that are not measured at fair value on a recurring basis in the consolidated balance sheets:
| | | | | | | | | | | | | | | | | | | | | | | | | | | | | |
| | | Fair Value |
| Carrying Value | | Level 1 | | Level 2 | | Level 3 | | Total |
| December 31, 2023 | | | | | | | | | |
| Assets | | | | | | | | | |
Cash and cash equivalents(1) | $ | 3,085,020 | | | $ | 3,085,020 | | | $ | — | | | $ | — | | | $ | 3,085,020 | |
Restricted cash and restricted cash equivalents(1) | 530,558 | | | 530,558 | | | — | | | — | | | 530,558 | |
Loans at amortized cost(2) | 836,159 | | | — | | | — | | | 864,312 | | | 864,312 | |
Other investments(3) | 83,551 | | | — | | | 83,551 | | | — | | | 83,551 | |
| Total assets | $ | 4,535,288 | | | $ | 3,615,578 | | | $ | 83,551 | | | $ | 864,312 | | | $ | 4,563,441 | |
| Liabilities | | | | | | | | | |
Deposits(4) | $ | 18,620,663 | | | $ | — | | | $ | 18,612,822 | | | $ | — | | | $ | 18,612,822 | |
Debt(5) | 5,113,775 | | | 955,306 | | | 4,024,516 | | | — | | | 4,979,822 | |
| Total liabilities | $ | 23,734,438 | | | $ | 955,306 | | | $ | 22,637,338 | | | $ | — | | | $ | 23,592,644 | |
| December 31, 2022 | | | | | | | | | |
| Assets | | | | | | | | | |
Cash and cash equivalents(1) | $ | 1,421,907 | | | $ | 1,421,907 | | | $ | — | | | $ | — | | | $ | 1,421,907 | |
Restricted cash and restricted cash equivalents(1) | 424,395 | | | 424,395 | | | — | | | — | | | 424,395 | |
Loans at amortized cost(2) | 307,957 | | | — | | | — | | | 328,775 | | | 328,775 | |
Other investments(3) | 28,651 | | | — | | | 28,651 | | | — | | | 28,651 | |
| Total assets | $ | 2,182,910 | | | $ | 1,846,302 | | | $ | 28,651 | | | $ | 328,775 | | | $ | 2,203,728 | |
| Liabilities | | | | | | | | | |
Deposits(4) | $ | 7,342,296 | | | $ | — | | | $ | 7,340,160 | | | $ | — | | | $ | 7,340,160 | |
Debt(5) | 5,396,740 | | | 826,242 | | | 4,219,574 | | | — | | | 5,045,816 | |
| Total liabilities | $ | 12,739,036 | | | $ | 826,242 | | | $ | 11,559,734 | | | $ | — | | | $ | 12,385,976 | |
_____________________(1)The carrying amounts of our cash and cash equivalents and restricted cash and restricted cash equivalents approximate their fair values due to the short-term maturities and highly liquid nature of these accounts.
(2)The fair value of our credit cards was determined using a discounted cash flow model with key inputs relating to weighted average lives, expected lifetime loss rates and discount rate. The fair value of our commercial and consumer banking and senior secured loans was determined using a discounted cash flow model with key inputs relating to the underlying contractual coupons, terms, discount rate and expectations for defaults.
(3)Other investments include FRB stock and FHLB stock, which are presented within other assets in the consolidatedbalance sheets.
(4)The fair values of our deposits without contractually defined maturities (such as demand and savings deposits) and our noninterest-bearing deposits approximate their carrying values. The fair value of our time-based deposits was determined using a discounted cash flow model based on rates currently offered for deposits of similar remaining maturities.
(5)The carrying value of our debt is net of unamortized discounts and debt issuance costs. The fair value of our convertible notes was classified as Level 1, as it was based on an observable market quote. The fair values of our warehouse facility debt and revolving credit facility debt were classified as Level 2 based on market factors and credit factors specific to these financial instruments. The fair value of our securitization debt was classified as Level 2 and valued using a discounted cash flow model, with key inputs relating to the underlying contractual coupons, terms, discount rate and expectations for defaults and prepayments.
Nonrecurring Fair Value Measurements
Investments in equity securities of $22,920 and $22,825 as of December 31, 2023 and 2022, respectively, which are presented within other assets in the consolidated balance sheets, include investments for which fair values are not readily determinable, which we elect to measure using the measurement alternative method of accounting. The fair value measurements are classified within Level 3 of the fair value hierarchy due to the use of unobservable inputs in the fair value measurements. The balances were primarily composed of a $19,739 investment valued under the measurement alternative method during 2022 that was a former equity method investment.
SoFi Technologies, Inc.
SoFi Technologies, Inc.
Notes to Consolidated Financial Statements (continued)
(In Thousands, Unless Otherwise Stated and Except for Share and Per Share Data)
Note 16. Share-Based Compensation 2011 Stock Option Plan
Prior to the Business Combination, the Company’s Amended and Restated 2011 Stock Option Plan (the “2011 Plan”) allowed the Company to grant shares of common stock to employees, non-employee directors and non-employee third parties. As of December 31, 2021,2023, outstanding awards to non-employee third parties under the 2011 Plan were not material. The Company also had shares authorized under a stock plan assumed in a 2020 business combination, , which were assumed by the 2011 Plan. Upon the Closing, the remaining unallocated share reserve under the 2011 Plan was cancelled and no new awards
SoFi Technologies, Inc.
Notes to Consolidated Financial Statements (continued)
(In Thousands, Unless Otherwise Stated and Except for Share and Per Share Data)
may be granted under such plan. Awards outstanding under the 2011 Plan were assumed by SoFi Technologies upon the Closing and continue to be governed by the terms of the 2011 Plan.
2021 Stock Option and Incentive Plan
In connection with the Closing of the Business Combination, the Company adopted the 2021 Stock Option and Incentive Plan (the “2021 Plan”), which authorized for issuance 63,575,425 shares of common stock in connection with the Business Combination. Under the 2021 Plan, effective January 1, 2022, our Board of Directors authorized the issuance of an additional 8,937,242 shares. In the third quarter of 2022, the Company’s stockholders approved the amendment and restatement of the 2021 Stock Option and Incentive Plan (the “Amended and Restated 2021 Plan”), including a modification to the evergreen provision and an increase in the number of shares of common stock available for issuance under the plan. As of December 31, 2023, the Amended and Restated 2021 Plan includes an aggregate of 151,677,954 shares of common stock authorized for issuance of awards. The Amended and Restated 2021 Plan allows for the number of authorized shares willto increase on the first day of each fiscal year beginning with SoFi Technologies’ 2022 fiscalon January 1, 2023 and ending on and including January 1, 2030 equal to the lesser of (a) five percent of the aggregate number of shares of common stock outstanding on the final day of the immediately preceding calendar year, and (b) such smaller number of shares of common stock as prescribed indetermined by the 2021 Plan.Board of Directors. The Amended and Restated 2021 Plan allows for the issuance of stock options, stock appreciation rights, restricted stock, restricted stock unitsRSUs (including performance stock units)PSUs), dividend equivalents and other stock or cash based awards for issuance to its employees, non-employee directors and non-employee third parties. Shares associated with option exercises and RSU vesting are issued from the authorized pool.
DuringEffective January 1, 2023, we approved a plan to allow our non-employee directors to elect, on an annual basis, to defer their cash retainers into equity awards, and/or to defer their RSU grants, which vest in accordance with the years ended December 31, 2021, 2020 and 2019, we incurred cash outflowsgrant terms (collectively referred to as DSUs). DSUs are equity awards that entitle the holder to shares of $42,644, $31,259 and $21,411, respectively, relatedour common stock when the awards vest. Directors may choose to receive their deferred stock distributions in a lump sum or in installments over different time periods. DSUs are measured based on the paymentfair value of withholding taxes for vested RSUs. These cash outflows areour common stock on the date of grant. DSU activity is presented within net cash (used in) provided by financing activitieswith RSUs in the consolidated statements of cash flows.disclosures below.
Share-based compensation expense related to stock options, RSUs and PSUs is presented within the following line items in the consolidated statements of operations and comprehensive income (loss) for the years indicated:loss:
| | | | | | | | | | | | | | | | | |
| Year Ended December 31, |
| 2021 | | 2020 | | 2019 |
| Technology and product development | $ | 61,431 | | | $ | 28,271 | | | $ | 16,107 | |
| Sales and marketing | 16,140 | | | 8,045 | | | 4,192 | |
| Cost of operations | 11,743 | | | 6,067 | | | 1,678 | |
| General and administrative | 149,697 | | | 57,487 | | | 38,959 | |
| Total | $ | 239,011 | | | $ | 99,870 | | | $ | 60,936 | |
During the year ended December 31, 2021, we issued 18,058 shares of common stock to non-employees, which were valued on the grant date based on the closing price of SOFI. During the year ended December 31, 2020, we had equity-based payments to non-employees associated with our acquisition of Galileo. | | | | | | | | | | | | | | | | | |
| Year Ended December 31, |
| 2023 | | 2022 | | 2021 |
| Technology and product development | $ | 91,400 | | | $ | 77,674 | | | $ | 61,431 | |
| Sales and marketing | 26,783 | | | 24,176 | | | 16,140 | |
| Cost of operations | 10,662 | | | 17,837 | | | 11,743 | |
| General and administrative | 142,371 | | | 186,307 | | | 149,697 | |
| Total | $ | 271,216 | | | $ | 305,994 | | | $ | 239,011 | |
Common Stock Valuations
PriorSubsequent to us contemplating a public market transaction,the Business Combination, we establisheddetermine the fair value of our common stock by using the option pricing model (Black-Scholes Model based) via the backsolve method and through placing weight on previously redeemable preferred stock transactions, such as our Series H redeemable preferred stock transactions during 2019, Series H-1 redeemable preferred stock transaction during 2020 and a secondary market transaction involving our Series F preferred stock during 2020, transactions in our common stock during the period and a guideline public company multiples analysis. Our use of the Black-Scholes Model required the use of subjective assumptions, including the risk-free interest rate, expected term, expected stock price volatility and dividend yield. The risk-free interest rate assumption was based upon observed interest rates for constant maturity U.S. Treasury securities consistent with the expected term of our stock options. The expected term represented the period of time the stock options were expected to be outstanding and was based on the simplified method. Under the simplified method, the expected termobservable daily closing price of aSoFi’s stock option is presumed to be the midpoint between the vesting date and the end of the contractual term. Management used the simplified method due to the lack of sufficient historical exercise data to provide a reasonable basis upon which to otherwise estimate the expected term of the stock options. Expected volatility was based on historical volatility for publicly traded stock of comparable companies over the estimated expected life of the stock options. In identifying comparable companies, we considered factors such as industry, stage of life cycle and size. The valuations also applied discounts for lack of marketability to reflect the fact that there was no market mechanism to sell our common stock and, as such, the common stock option and RSU holders would need to wait for a liquidity event to facilitate the sale of their equity awards. In addition, there were contractual transfer restrictions placed on common stock in the event that we remained a private company.
During the third quarter of 2020, once we made intentional progress toward pursuing a public market transaction, we began applying the probability-weighted expected return method to determine the fair value of our common stock. The(ticker symbol “SOFI”).
SoFi Technologies, Inc.
SoFi Technologies, Inc.
Notes to Consolidated Financial Statements (continued)
(In Thousands, Unless Otherwise Stated and Except for Share and Per Share Data)
probability weightings assigned to certain potential exit scenarios were based on management’s expected near-term and long-term funding requirements and assessment of the most attractive liquidation possibilities at the time of the valuation. During this process, we assigned probability weightings to “go public” event scenarios and a “stay private” scenario, wherein the enterprise valuation was based on either estimated exit valuations determined from conversations held with external parties or was based on public company comparable net book value multiples at the time of our valuation, respectively. In addition, our “stay private” scenario valuation approach continued to rely on a guideline public company multiples analysis with an option pricing model to determine the amount of aggregate equity value allocated to our common stock.
During the fourth quarter of 2020, we valued our common stock on a monthly basis. A common stock transaction that closed in December 2020 at a price of $10.57 per common share, which was of substantial size and in close proximity to the Business Combination, served as the key input for the fair value of our common stock for grants made during the fourth quarter of 2020. We decreased the assumed discount for lack of marketability throughout the fourth quarter of 2020, corresponding with our decreased time to liquidity assumption throughout the quarter, as we became more certain over time about the possibility of entering into the Business Combination. We continued to use a share price of $10.57 to value our common stock for transactions in January until the date on which we executed the Agreement.
Subsequent to executing the Agreement on January 7, 2021 and through the Business Combination, we determined the value of our common stock based on the observable daily closing price of SCH’s stock (ticker symbol “IPOE”) multiplied by the exchange ratio in effect for such transaction date. Subsequent to the Business Combination, we determined the value of our common stock based on the observable daily closing price of SoFi’s stock (ticker symbol “SOFI”).
Stock Options
The terms of the stock option grants, including the exercise price per share and vesting periods, are determined by our Board of Directors. At the discretion and determination of our Board of Directors, the 2021 Amended and Restated Plan allows for stock options to be granted that may be exercised before the stock options have vested. The 2011 Plan, which continues to govern awards outstanding under that plan that were assumed by SoFi Technologies upon the Closing, had a similar provision.
Stock options arewere typically granted at exercise prices equal to the fair value of our common stock at the date of grant. Our stock options typically vest at a rate of 25% after one year from the vesting commencement date and then monthly over an additional three-year period. While the vesting schedule noted is typical, stock options have been issued under other vesting schedules. These alternative schedules include, but are not limited to (i) vesting at a rate of 20% after one year from vesting commencement date and then monthly over an additional four years, (ii) monthly vesting beginning on the vesting commencement date for a period of four years, and (iii) monthly vesting beginning on the vesting commencement date for a period of two years. Our stock options typically expire ten years from the grant date or within 90 days of employee termination.
The following is a summary of stock option activity for the year ended December 31, 2021:activity:
| | | | | | | | | | | | | | | | | |
| Number of
Stock Options | | Weighted Average
Exercise Price | | Weighted Average
Remaining
Contractual Term
(in years) |
| Outstanding as of January 1, 2021 | 17,183,828 | | | $ | 9.92 | | | 6.6 |
| Retroactive conversion of stock options due to Business Combination | 12,764,147 | | | (4.23) | | | |
| Outstanding as of January 1, 2021, as converted | 29,947,975 | | | 5.69 | | | 6.6 |
| Granted | — | | | n/a | | |
| Exercised | (8,523,468) | | | 2.95 | | | |
| Forfeited | (110,179) | | | 1.63 | | | |
| Expired | (143,181) | | | 6.35 | | | |
| Outstanding as of December 31, 2021 | 21,171,147 | | | $ | 6.81 | | | 5.8 |
| Exercisable as of December 31, 2021 | 20,902,650 | | | $ | 6.83 | | | 5.8 |
| | | | | | | | | | | | | | | | | |
| Number of
Stock Options | | Weighted Average
Exercise Price | | Weighted Average
Remaining
Contractual Term
(in years) |
| Outstanding as of January 1, 2023 | 18,749,679 | | | $ | 7.43 | | | 4.7 |
| | | | | |
| Exercised | (796,883) | | | 1.44 | | | |
| | | | | |
| Expired | (56,064) | | | 6.67 | | | |
| Outstanding as of December 31, 2023 | 17,896,732 | | | $ | 7.70 | | | 3.8 |
| Exercisable as of December 31, 2023 | 17,896,732 | | | $ | 7.70 | | | 3.8 |
The following table summarizes the inputs used for estimating the fairaggregate intrinsic value of stock options granted during the year ended December 31, 2020. There were no stock options grantedexercised during the years ended December 31, 2023, 2022 and 2021 was $5.6 million, $15.0 million and 2019. During
SoFi Technologies, Inc.
Notes to Consolidated Financial Statements (continued)
(In Thousands, Unless Otherwise Stated and Except for Share and Per Share Data)
the year ended$131.2 million, respectively. As of December 31, 2020,2023, the inputs disclosed below exclude those associated with certain replacement options granted in connection with our acquisition of Galileo in 2020.
| | | | | | | | | | |
| | Year Ended
December 31, 2020 | | |
Input | | | |
Risk-free interest rate | | 0.3% – 1.4% | | |
Expected term (years) | | 5.5 – 6.0 | | |
Expected volatility | | 36.5% – 42.5% | | |
Fair value of common stock | | $6.43 – $6.95 | | |
Dividend yield | | —% | | |
The weighted average grant date fairaggregate intrinsic value of stock options granted during the year ended December 31, 2020outstanding and stock options exercisable was $2.44. $40.3 million and $40.3 million, respectively.
Total compensation cost related to unvested stock options not yet recognized as of December 31, 20212023 was $5.8 million, and will be recognized over a weighted average period of approximately 1.2 years. The aggregate intrinsic value of stock options exercised during the years ended December 31, 2021, 2020 and 2019 was $131.2 million, $13.6 million and $13.4 million, respectively. As of December 31, 2021, the aggregate intrinsic value of stock options outstanding and stock options exercisable was $190.5 million and $187.6 million, respectively.immaterial.
Restricted Stock Units
The Company began issuing RSUs, to its employees in 2017. RSUsinclusive of DSUs, are equity awards granted to employees that entitle the holder to shares of our common stock when the awards vest. RSUs grantedFor employees hired during 2023, new hire RSU grants typically vest between 12.5% to newly25% on the first vesting date, which occurs approximately six months after the date of grant, and ratably each quarter of the ensuing 6- to 14-quarter period. For employees hired during 2022, new hire RSU grants typically vest 12.5% on the first vesting date, which occurs approximately six months after the date of grant, and ratably each quarter of the ensuing 14-quarter period. For employees hired before January 1, 2022, new hire RSU grants typically vest 25% on the first vesting date, which occurs approximately one year after the date of grant, and ratably each quarter of the ensuing 12-quarter period. RSUs have been issued under other vesting schedules. These alternative schedules, include, but are not limited to, (i) vesting at a rate of 20% after one year from vesting commencement date and then monthly over an additional four years, (ii) vesting at a rate of 25% after one year and then monthly over an additional three years, and (iii) other vesting schedules ranging in total duration from one to four years. During the year ended December 31, 2020, we also made RSUincluding grants to certain executive officers in which vesting commences approximately two years after the date of grant and then quarterly over an additional two years.existing employees. RSUs are measured based on the fair value of our common stock on the date of grant.
The weighted average fair value of our common stock was $18.02, $7.67, and $6.47 during the years ended December 31, 2021, 2020 and 2019, respectively.
The following table summarizes RSU activity for the year ended December 31, 2021:activity:
| | | | | | | | | | | |
| Number of
RSUs | | Weighted Average Grant Date Fair Value |
| | | |
| | | |
| | | |
| | | |
| Outstanding as of January 1, 2021 | 25,591,913 | | $ | 13.06 | |
| Retroactive conversion of RSUs due to Business Combination | 19,009,673 | | (5.57) | |
| Outstanding as of January 1, 2021, as converted | 44,601,586 | | 7.49 | |
| Granted | 27,481,638 | | 16.92 | |
| | | |
Vested(1) | (16,427,162) | | 8.50 | |
| Forfeited | (6,968,538) | | 9.25 | |
Outstanding as of December 31, 2021(2) | 48,687,524 | | $ | 12.23 | |
| | | | | | | | | | | |
| Number of
RSUs | | Weighted Average Grant Date Fair Value |
| Outstanding as of January 1, 2023 | 69,538,139 | | | $ | 9.07 | |
| Granted | 38,399,214 | | | 6.51 | |
Vested(1) | (33,564,543) | | | 8.42 | |
| Forfeited | (9,493,314) | | | 8.86 | |
| Outstanding as of December 31, 2023 | 64,879,496 | | | $ | 7.95 | |
_____________________
(1)The total fair value, based on grant date fair value, of RSUs that vested during the years ended December 31, 2023, 2022 and 2021 2020 and 2019 was $139.6$282.6 million, $76.3$249.9 million, and $50.4$139.6 million, respectively.
(2)Includes 178,021 RSUs that were granted in 2020 with an original vest date in June 2021 to earn the first tranche of compensation for the 2020 plan period. However, upon determining that the original performance-based vesting condition would not be satisfied, the Company modified the awards to extend the vesting date by 12 months. We concluded that the facts and circumstances aligned with an improbable-to-probable modification (Type III) and the vesting condition of the modified awards is a service-based condition. As a result, we reversed previously recognized share-based compensation expense of $1,237 in June 2021. For the modified awards, we will record total share-based compensation expense of $3,884 determined based on the number of awards expected to vest and the modification-date fair value over the 12-month service period, of which $2,132 was recorded during the year ended December 31, 2021.
SoFi Technologies, Inc.
SoFi Technologies, Inc.
Notes to Consolidated Financial Statements (continued)
(In Thousands, Unless Otherwise Stated and Except for Share and Per Share Data)
The weighted average grant date fair value of RSUs issued during the years ended December 31, 20202022 and 2019 was $7.792021was $7.32 and $6.47,$16.92, respectively. As of December 31, 2021,2023, there was $540.6$473.4 million of unrecognized compensation cost related to unvested RSUs, inclusive of DSUs, which will be recognized over a weighted average period of approximately 3.12.0 years.
Performance Stock Units
PSUs are equity awards granted to employees that, upon vesting, entitle the holder to shares of our common stock. Under theDuring 2021 Plan,and 2023, we granted PSUs that will vest, if at all, on a graded basis during the four-year period commencing on May 28, 2022, subject to the achievement of specified performance goals, such as the volume-weighted average closing price of our stock over a 90-trading day period (“Target Hurdles”) and, now that we are a bank holding company, maintaining certain minimum standards applicable to bank holding companies. All PSUs are subject to continued employment on the date of vesting. In the event of a Sale Event (as defined in the 2021 Amended and Restated Plan), the awards may automatically vest subject to the satisfaction of the Target Hurdles by reference to the sale price, without regard to any other vesting conditions.
The following table summarizes PSU activity for the year ended December 31, 2021:activity:
| | | | | | | | | | | |
| Number of
PSUs | | Weighted Average Grant Date Fair Value |
| Outstanding as of January 1, 2021 | — | | n/a |
| Granted | 23,141,462 | | $ | 9.50 | |
| Vested | — | | n/a |
| Forfeited | (171,066) | | 7.50 |
| Outstanding as of December 31, 2021 | 22,970,396 | | $ | 9.52 | |
| | | | | | | | | | | |
| Number of
PSUs | | Weighted Average Grant Date Fair Value |
| Outstanding as of January 1, 2023 | 19,563,747 | | $ | 9.84 | |
| Granted | 97,752 | | 3.36 | |
| | | |
| Forfeited | (3,421,318) | | 7.52 | |
| Outstanding as of December 31, 2023 | 16,240,181 | | $ | 10.29 | |
Compensation cost associated with PSUs is recognized using the accelerated attribution method for each of the three vesting tranches over the respective derived service period.
We determinedetermined the grant-date fair valuesvalue of PSUs utilizing a Monte Carlo simulation model. The following table summarizes the inputs used for estimating the fair valuesvalue of PSUs granted during the year indicated:granted:
| | | | | | | | |
| | Year Ended |
Input | | December 31, 2021 |
Risk-free interest rate | | 0.8% – 0.8% |
Expected volatility | | 34.9% – 35.9% |
Fair value of common stock | | $16.99 – $23.21 |
Dividend yield | | 0% – 0% |
| | | | | | | | | | | | | | | | | | | | |
| Input | | Year Ended December 31, 2023 | | Year Ended December 31, 2022 | | Year Ended December 31, 2021 |
| Risk-free interest rate | | 1.6% | | 1.6% | | 0.8% – 0.8% |
| Expected volatility | | 37.7% | | 37.7% | | 34.9% – 35.9% |
| Fair value of common stock | | $12.06 | | $12.06 | | $16.99 – $23.21 |
| Dividend yield | | —% | | —% | | —% |
Our use of a Monte Carlo simulation model requires the use of subjective assumptions:
•The risk-freeRisk-free interest rate assumptions were based — Based on the U.S. Treasury rate at the time of grant commensurate with the remaining term of the PSUs.
•The expectedExpected volatility assumptions were based — Based on the implied volatility of our common stock from a set of comparable publicly-traded companies.
•The fair valuesFair value of our common stock were based — Based on the closing stock price on the datesdate of grant.
•Dividend yield — We assumed no dividend yield because we have historically not paid out dividends to common stockholders.
The weighted average grant date fair value of PSUs issued during the years ended December 31, 2022 and 2021 was $3.71 and $9.50, respectively.
As of December 31, 2021,2023, there was $164.1$6.5 million of unrecognized compensation cost related to unvested PSUs, which will be recognized over a weighted average period of approximately 1.70.8 years.
SoFi Technologies, Inc.
SoFi Technologies, Inc.
Notes to Consolidated Financial Statements (continued)
(In Thousands, Unless Otherwise Stated and Except for Share and Per Share Data)
Loss before income taxes consisted of the followingfollowing:
| | | | | | | | | | | | | | | | | |
| Year Ended December 31, |
| 2023 | | 2022 | | 2021 |
| Domestic | $ | (131,899) | | | $ | (299,751) | | | $ | (461,023) | |
Foreign(1) | (169,259) | | | (18,970) | | | (20,154) | |
| Loss before income taxes | $ | (301,158) | | | $ | (318,721) | | | $ | (481,177) | |
_________________
(1)Foreign loss before income taxes for the years presented:
| | | | | | | | | | | | | | | | | |
| Year Ended December 31, |
| 2021 | | 2020 | | 2019 |
| Domestic | $ | (461,023) | | | $ | (316,252) | | | $ | (238,533) | |
| Foreign | (20,154) | | | (12,269) | | | (1,066) | |
| Loss before income taxes | $ | (481,177) | | | $ | (328,521) | | | $ | (239,599) | |
Income tax expense (benefit) consisted of the following for the years presented:following:
| | | Year Ended December 31, | | Year Ended December 31, |
| | 2021 | | 2020 | | 2019 | | 2023 | | 2022 | | 2021 |
| Current tax expense: | Current tax expense: | | | | | | Current tax expense: | | | | | |
| U.S. federal | U.S. federal | $ | — | | | $ | — | | | $ | — | |
| U.S. state and local | U.S. state and local | 1,481 | | | 23 | | | 17 | |
| Foreign | Foreign | 75 | | | 13 | | | 29 | |
| Total current tax expense | Total current tax expense | 1,556 | | | 36 | | | 46 | |
| Deferred tax expense (benefit): | Deferred tax expense (benefit): | | | | | |
| U.S. federal | — | | | (70,692) | | | (34) | |
| | U.S. state and local | |
| | U.S. state and local | |
| | U.S. state and local | U.S. state and local | 1,222 | | | (33,823) | | | 94 | |
| Foreign | Foreign | (18) | | | 11 | | | (8) | |
| Total deferred tax expense (benefit) | Total deferred tax expense (benefit) | 1,204 | | | (104,504) | | | 52 | |
| Income tax expense (benefit) | Income tax expense (benefit) | $ | 2,760 | | | $ | (104,468) | | | $ | 98 | |
Income taxes for the year ended December 31, 2021Our income tax benefit position in 2023 was primarily attributable to income tax benefits from foreign losses in jurisdictions with net deferred tax liabilities related to Technisys. These benefits were primarily due tooffset by income tax expense associated with the profitability of SoFi Lending Corp., which incurs income tax expenseBank in some state jurisdictions where separate company filings are required. The significant change inrequired, as well as federal taxes where our income tax positionscredits and loss carryforwards may be limited. See Note 2. Business Combinations and Note 8. Goodwill and Intangible Assets for the years ended December 31, 2021 and 2019 relative to 2020 was primarily due to a partial release of our valuation allowance in the second quarter of 2020 in connection with deferred tax liabilities resulting from intangible assets acquired from Galileo in May 2020.
A reconciliation of the expected income tax benefit at the statutory federal income tax rate to the income tax expense (benefit) at the effective income tax rate was as follows for the years presented:
| | | | | | | | | | | | | | | | | |
| Year Ended December 31, |
| 2021 | | 2020 | | 2019 |
| Expected income tax benefit at federal statutory rate | $ | (101,047) | | | $ | (68,921) | | | $ | (50,316) | |
| Valuation allowance for deferred tax assets | 92,197 | | | (9,445) | | | 53,431 | |
| State and local income taxes, net of federal benefit | 2,096 | | | (26,681) | | | 52 | |
| Research and development tax credits | (7,067) | | | (6,883) | | | (5,469) | |
| Change in fair value of warrants | 22,539 | | | 4,310 | | | (595) | |
Non-deductible compensation expense(1) | 23,838 | | | — | | | — | |
Share-based compensation(2) | (33,950) | | | (939) | | | (66) | |
Other(2) | 4,154 | | | 4,091 | | | 3,061 | |
| Income tax expense (benefit) | $ | 2,760 | | | $ | (104,468) | | | $ | 98 | |
| Effective tax rate | (0.57) | % | | 31.80 | % | | (0.04) | % |
SoFi Technologies, Inc.
SoFi Technologies, Inc.
Notes to Consolidated Financial Statements (continued)
(In Thousands, Unless Otherwise Stated and Except for Share and Per Share Data)
_____________________The table below presents a reconciliation of the expected income tax benefit at the statutory federal income tax rate to the income tax expense (benefit) at the effective income tax rate:
| | | | | | | | | | | | | | | | | |
| Year Ended December 31, |
| 2023 | | 2022 | | 2021 |
| Expected income tax benefit at federal statutory rate | $ | (63,243) | | | $ | (66,944) | | | $ | (101,047) | |
| Goodwill impairment | 51,907 | | | — | | | — | |
| Valuation allowance for deferred tax assets | 14,461 | | | 27,101 | | | 92,197 | |
Non-deductible compensation expense(1) | 15,579 | | | 23,100 | | | 23,838 | |
| State and local income taxes, net of federal benefit | 6,725 | | | 4,591 | | | 2,096 | |
| Share-based compensation | 554 | | | 19,811 | | | (33,950) | |
| Research and development tax credits | (22,249) | | | (12,496) | | | (7,067) | |
| Change in fair value of warrants | — | | | — | | | 22,539 | |
| Other | (4,150) | | | 6,523 | | | 4,154 | |
| Income tax expense (benefit) | $ | (416) | | | $ | 1,686 | | | $ | 2,760 | |
| Effective tax rate | 0.14 | % | | (0.53) | % | | (0.57) | % |
_________________
(1)Reflects the impact of applying Section 162(m), which prohibits deduction of certain excess employee compensation to certain “covered employees”.
(2)We modified the presentation in the current period to separately present the share-based compensation component of non-deductible expenses. The remaining non-deductible expenses are included within “other”. We reclassified amounts for the prior periods to conform to the current period presentation.
Atable below presents a reconciliation of unrecognized tax benefits:
| | | | | | | | | | | | | | | | | |
| Year Ended December 31, |
| 2023 | | 2022 | | 2021 |
| Unrecognized tax benefits at beginning of year | $ | 23,730 | | | $ | 6,972 | | | $ | 5,117 | |
Gross increases – tax positions in prior period(1) | 493 | | | 10,944 | | | 582 | |
| Gross decreases – tax positions in prior period | (27) | | | (98) | | | — | |
| Gross increases – tax positions in current period | 5,491 | | | 6,236 | | | 1,273 | |
| Lapse of statute of limitations | — | | | (324) | | | — | |
| Unrecognized tax benefits at end of year | $ | 29,687 | | | $ | 23,730 | | | $ | 6,972 | |
_________________
(1)Increases to our unrecognized tax benefits was as follows forin 2022 were primarily related to the years presented:recognition of historical tax reserves that existed at the time of the Technisys Merger and were primarily recorded through goodwill.
| | | | | | | | | | | | | | | | | |
| Year Ended December 31, |
| 2021 | | 2020 | | 2019 |
| Unrecognized tax benefits at beginning of year | $ | 5,117 | | | $ | 4,307 | | | $ | 1,928 | |
| Gross increases – tax positions in prior period | 582 | | | 55 | | | 1,306 | |
| Gross decreases – tax positions in prior period | — | | | (331) | | | (11) | |
| Gross increases – tax positions in current period | 1,273 | | | 1,086 | | | 1,084 | |
| Unrecognized tax benefits at end of year | $ | 6,972 | | | $ | 5,117 | | | $ | 4,307 | |
NoneAs of December 31, 2023 and 2022 unrecognized tax benefits of $7,525 and $6,812, respectively, if recognized, would affect our effective tax rate in a future period. As of December 31, 2021, none of the unrecognized tax benefits, as of the end of each annual period presented, if recognized, would affect our effective tax rate in a future period, as the tax benefit would increase a deferred tax asset, which is offset with a full valuation allowance. We expect to continue to accrue unrecognized tax benefits for certain recurring tax positions; however, we do not expect any other significant increases or decreases to unrecognized tax benefits within the next twelve months. The Company’s policy is to recognize interest
Interest and penalties related to unrecognized tax benefits as a component of income tax expense (benefit).recorded during the year ended December 31, 2023 and 2022 were immaterial. No interest and penalties were recorded during the yearsyear ended December 31, 2021, 2020, and 2019. As of December 31, 2021 and 2020, no accrued interest and penalties were recorded.
The significant components of the Company’s net deferred tax liabilities were as follows as of the dates indicated:
| | | | | | | | | | | |
| December 31, |
| 2021 | | 2020 |
| Deferred tax assets: | | | |
| Net operating loss carryforwards | $ | 336,444 | | | $ | 230,866 | |
| Operating lease liabilities | 29,206 | | | 29,340 | |
| Share-based compensation | 19,473 | | | 16,876 | |
| Research and development credits | 35,416 | | | 25,538 | |
| Accruals and other | 18,610 | | | 15,347 | |
| Gross deferred tax assets | 439,149 | | | 317,967 | |
| Valuation allowance | (266,448) | | | (141,101) | |
| Total deferred tax assets | $ | 172,701 | | | $ | 176,866 | |
| Deferred tax liabilities: | | | |
| Depreciation | $ | (3,555) | | | $ | (4,951) | |
| Amortization | (86,081) | | | (95,819) | |
| Operating lease ROU assets | (25,546) | | | (26,121) | |
| Servicing rights | (47,585) | | | (41,556) | |
| Securitization investments | (9,323) | | | (7,268) | |
| Other | (2,398) | | | (1,734) | |
| Total deferred tax liabilities | (174,488) | | | (177,449) | |
| Net deferred tax liabilities | $ | (1,787) | | | $ | (583) | |
SoFi Technologies, Inc.
SoFi Technologies, Inc.
Notes to Consolidated Financial Statements (continued)
(In Thousands, Unless Otherwise Stated and Except for Share and Per Share Data)
The following table below presents the significant components of the Company’s net deferred tax liabilities:
| | | | | | | | | | | |
| December 31, |
| 2023 | | 2022 |
| Deferred tax assets: | | | |
| Net operating loss carryforwards | $ | 236,492 | | | $ | 287,473 | |
| Operating lease liabilities | 21,554 | | | 24,009 | |
| Share-based compensation | 24,730 | | | 27,571 | |
| Research and development credits | 77,395 | | | 56,811 | |
| Accruals and other | 59,364 | | | 32,130 | |
| Gross deferred tax assets | 419,535 | | | 427,994 | |
| Valuation allowance | (345,611) | | | (318,410) | |
| Total deferred tax assets | $ | 73,924 | | | $ | 109,584 | |
| Deferred tax liabilities: | | | |
| Amortization | $ | (42,261) | | | $ | (101,971) | |
| Operating lease ROU assets | (18,790) | | | (20,597) | |
| Servicing rights | (49,202) | | | (41,168) | |
| Other | (3,900) | | | (2,330) | |
| Total deferred tax liabilities | (114,153) | | | (166,066) | |
| Deferred tax liabilities, net | $ | (40,229) | | | $ | (56,482) | |
The table below details the activity of the deferred tax asset valuation allowance during the years indicated:allowance:
| | | | | | | | | | | | | | | | | | | | | | | | | | | | | |
| Balance at Beginning of Period | | Additions | | Deductions(2) | | Balance at End of Period |
| Charged to Costs and Expenses | | Charged to Other Accounts(1) |
| Year Ended December 31, 2019 | | | | | | | | | |
| Deferred tax asset valuation allowance | $ | 77,644 | | | $ | 70,782 | | | $ | — | | | $ | — | | | $ | 148,426 | |
| Year Ended December 31, 2020 | | | | | | | | | |
| Deferred tax asset valuation allowance | 148,426 | | | 87,552 | | | 4,916 | | | (99,793) | | | 141,101 | |
| Year Ended December 31, 2021 | | | | | | | | | |
| Deferred tax asset valuation allowance | 141,101 | | | 125,347 | | | — | | | — | | | 266,448 | |
_____________________
(1)Additions charged to other accounts for the year ended December 31, 2020 related to the increase in our valuation allowance in connection with net deferred tax assets acquired in our acquisition of 8 Limited in April 2020.
(2)Deductions for the year ended December 31, 2020 related to the release of our valuation allowance in connection with deferred tax liabilities acquired in our acquisition of Galileo in May 2020.
In assessing the realizability of deferred tax assets, management reviews all available positive and negative evidence. | | | | | | | | | | | | | | | | | | | | | | | | | | | | | |
| Balance at Beginning of Period | | Additions | | Deductions | | Balance at End of Period |
| Charged to Costs and Expenses | | Charged to Other Accounts |
| Year Ended December 31, 2021 | | | | | | | | | |
| Deferred tax asset valuation allowance | $ | 141,101 | | | $ | 125,347 | | | $ | — | | | $ | — | | | $ | 266,448 | |
| Year Ended December 31, 2022 | | | | | | | | | |
| Deferred tax asset valuation allowance | 266,448 | | | 37,536 | | | 14,426 | | | — | | | 318,410 | |
| Year Ended December 31, 2023 | | | | | | | | | |
| Deferred tax asset valuation allowance | 318,410 | | | 27,201 | | | — | | | — | | | 345,611 | |
During the years ended December 31, 2021, 2020,2023, 2022, and 2019,2021, we maintained a full valuation allowance against our net deferred tax assets, which was established in 2018, in applicable jurisdictions, increasing our valuation allowance by $27,201, $37,536 and $125,347, $87,552 and $70,782, respectively.
Additionally, in 2020, we increased our valuation allowance by $4,916 in connection with the acquisition of net operating loss deferred tax assets from 8 Limited, and decreased our valuation allowance by $99,793 due to deferred tax liabilities resulting from intangible assets acquired from Galileo. The deferred tax liabilities arising from our acquisition of intangible assets from Galileo provided for additional sources of income whereby the valuation allowance against pre-combination deferred tax assets could be reduced, which resulted in a tax benefit recognized for the year.
In certain foreign and state jurisdictions where sufficient deferred tax liabilities exist, no valuation allowance is recognized. Management reviews all available positive and negative evidence in assessing the realizability of deferred tax assets. We will continue to recognize a full valuation allowance until there is sufficient positive evidence to support its release.
The following table below provides information about the Company’sour net operating loss carryforwards by jurisdiction as of the date indicated:jurisdiction:
| | | | | | | | | | | | | |
| December 31, 20212023 | | Expiration | | |
U.S. federal(1) | $ | 209,56447,943 | | | 20312036 – 2037 | | |
| 945,177633,125 | | | Indefinite | | |
U.S. state(2) | 1,029,763879,425 | | | 20222024 – 20412042 | | |
| 206,33385,254 | | | Indefinite | | |
| Foreign | 59,20635,411 | | | 2024 – 2043 | | |
| 80,417 | | | Indefinite | | |
SoFi Technologies, Inc.
SoFi Technologies, Inc.
Notes to Consolidated Financial Statements (continued)
(In Thousands, Unless Otherwise Stated and Except for Share and Per Share Data)
_____________________
(1)Federal net operating loss carryforwards generated in periods after December 31, 2017 are subject to an 80% limitation when used in future tax periods as a result of the Tax Cuts and Jobs Act (“TCJA”)TCJA passed in 2017. The CARES Act provided for the temporary elimination of the 80% limitation for any net operating loss utilization prior to January 1, 2021.
(2)State conformity to either TCJA or the Coronavirus Aid, Relief, and Economic SecurityCARES Act, (the “CARES Act”), which was signed into law in March 2020, is established by each state’s local statutes and conformity to one act does not require conformity to both acts.
Federal and state research and development tax credits were $42,462of $95,211 as of December 31, 2021, and, if not utilized,2023 will expire at various dates beginning in 2031.2031, if not utilized.
The Company files a federal income tax return in the United States and also files in various state and foreign jurisdictions. AsThe following are the major tax jurisdictions in which the Company operates and the earliest tax year subject to examination:
| | | | | | | | |
| Jurisdiction | | Tax year |
| United States | | 2011 |
| California | | 2012 |
| New York State and City | | 2016 |
| Argentina | | 2018 |
A portion of our foreign operations benefit from tax holidays in two jurisdictions. However, due to loss carryforwards, tax holidays do not result in cash tax benefits for any period presented. First, we qualify for a tax holiday in Argentina by fulfilling certain requirements of the “Regime for the Promotion of the Knowledge Economy (Law 27,506)”. The regime is in effect from January 1, 2020, through December 31, 2021, all federal2029. An annual application process is required for approval and state tax returns of the Company remain subject to examination by the
SoFi Technologies, Inc.
Notescontinue to Consolidated Financial Statements (continued)
(In Thousands, Unless Otherwise Stated and Except for Share and Per Share Data)
respective taxing authorities since its inception in 2011, with the exception of the Company’s New York tax returnsqualify for the years 2013 through 2015.holiday. The regime reduces the statutory federal income tax rate from 35% to 24%. Second, we are operating under a 100% tax holiday in Uruguay due to our software-related services. There is no current expiration date for this holiday.
The Company defines related parties as members of our Board of Directors, entity affiliates, executive officers and principal owners of the Company’s outstanding stock and members of their immediate families. Related parties also include any other person or entity with significant influence over the Company’s management or operations.
Stockholder Note
In 2019, we entered into a $58,000 note receivable agreement with a stockholder (“Note Receivable Stockholder”), which was collateralized by the Note Receivable Stockholder’s common stock and redeemable preferred stock. Related to this collateralization, the Company obtained call rights to purchase the collateral at $5.05 per share (“Call Option Rights”). As of December 31, 2020, there was no remaining receivable associated with this related party note; however, our Call Option Rights remained outstanding post settlement, per the terms of our Note Receivable Stockholder agreement. During the year ended December 31, 2020, we recognized related party income of $1,764. In December 2020, we exercised our Call Option Rights to acquire the Note Receivable Stockholder collateral, which included 104,132 shares of common stock and 26,941,263 shares of redeemable preferred stock. The Call Option Rights shares were retired upon receipt. The option exercise payable of $133,385 remained outstanding as of December 31, 2020 and the reserved funds were presented within restricted cash and restricted cash equivalents in the consolidated balance sheets. The full payment was subsequently made in January 2021.
Apex Loan
In November 2019, we lent $9,050 to Apex at an interest rate of 12.5% per annum. We recognized related party interest income of $124 during the year ended December 31, 2019. In August 2020, we extended the maturity date to August 31, 2021 and modified the interest rate to 5.0% per annum, which we determined to be below the market rate of interest. In accordance with ASC 835-30, Interest — Imputation of Interest, during the year ended December 31, 2020, we recognized a loss of $319 within noninterest income—other in the consolidated statements of operations and comprehensive income (loss) representing the discounted fair value of the loan receivable relative to its stated value at the market rate of interest, which is accreted into interest income over the remaining term of the loan. During 2020, we lent an additional $7,643 to Apex. We had an interest income receivable of $1,443 as of December 31, 2020. In February 2021, Apex paid us $18,304 in settlement of all of their outstanding obligations to us, which consisted of outstanding principal balances of $16,693 and accrued interest of $1,611.
During the year ended December 31, 2021, we recognized interest income of $211 within interest income—related party notes, and we reversed the remainder of the loss for the discount to fair value that had not yet been accreted of $169 within noninterest income—other in the consolidated statements of operations and comprehensive income (loss). During the year ended December 31, 2020, we recognized interest income of $1,425, which included interest related to the principal balances of $1,319 and interest related to the discount accretion of $106.
SoFi Technologies, Inc.
Notes to Consolidated Financial Statements (continued)
(In Thousands, Unless Otherwise Stated and Except for Share and Per Share Data)
Equity Method Investments
Our interest in Apex was deemed significant under Rule 4-08(g). The seller of the Apex interest had a Seller Call Option over our equity interest in Apex, which the seller exercised during January 2021. In 2021, we also entered into an equity method investment arrangement with Lower, which was not deemed to be significant. See Note 1 under “Equity Method Investments” for additional information. We also had an equity method investment in a residential mortgage origination joint venture that we exited in the third quarter of 2020, which was not deemed significant for the relevant periods. The following tables present summarized financial information for the entities in which we have equity method investments on an aggregated basis since the dates of acquisition:
| | | | | | | | | | | |
| As of December 31, |
| 2021(1) | | 2020(2) |
| Total assets | $ | 659,341 | | | $ | 10,254,902 | |
| Total liabilities | 540,642 | | | 10,032,736 | |
_____________________
(1)Reflects amounts related to our investment in Lower.
(2)Reflects amounts related to our investment in Apex.
| | | | | | | | | | | | | | | | | |
| Year Ended December 31, |
| 2021(1) | | 2020(2) | | 2019 |
| Total revenues | $ | 127,490 | | | $ | 276,968 | | | $ | 149,922 | |
| Net income | 768 | | | 58,426 | | | 22,255 | |
_____________________
(1)For Lower, reflects amounts subsequent to the date on which we entered into the equity method arrangement.
(2)For the residential mortgage origination joint venture, reflects amounts through the third quarter of 2020, when we exited the arrangement.
Note 16.18. Commitments, Guarantees, Concentrations and Contingencies
We primarily lease our office premisesAs of December 31, 2023, we had $670.3 million in financial commitments outstanding related to sponsorship, advertising, and cloud computing agreements under multi-year, non-cancelable operating leases. Our operating leases have terms expiring from 2022 through 2040, exclusivewhich we are required to make payments over the life of renewal option periods. Our office leases contain renewal option periodsthe agreements ranging from one to ten years from the expiration dates. These options were not recognized as part of our ROU assets and operating lease liabilities, as we did not conclude at the commencement date of the leases that we were reasonably certain to exercise these options. However, in our normal course of business, we expect our office leases to be renewed, amended or replaced by other leases. Our finance leases expire in 2040.17 years.
Our operating and finance leases as of December 31, 2021 and 2020 include leases from our September 2019 agreements associated with being the named sponsor of the LA Stadium and Entertainment District at Hollywood Park in Inglewood, California (“SoFi Stadium”), which includes the stadium itself, a performance venue and a future shopping district. Operating leases that commenced in September 2020 included our rights to use two multi-purpose stadium suites, for which we elected the practical expedient to not bifurcate the lease component from the non-lease components, and our rights to certain event space within the stadium and performance venue on a rent-free basis, for which we applied the short-term lease exemption practical expedient. Finance leases that commenced in September 2020 included our rights to certain physical signage within the stadium. The agreement associated with the shopping district did not commence as of December 31, 2021 and is currently expected to commence during 2022. We do not expect the agreement to contain a material lease component, although the evaluation remains ongoing. We bifurcated lease components from non-lease components of certain of the arrangements, the latter of which represent sponsorship and advertising opportunities rather than the rights to physical assets that we control. We began recognizing the non-lease components in the third quarter of 2020 within noninterest expense—sales and marketing in the consolidated statements of operations and comprehensive income (loss).
SoFi Technologies, Inc.
Notes to Consolidated Financial Statements (continued)
(In Thousands, Unless Otherwise Stated and Except for Share and Per Share Data)
The components of lease expense and supplemental cash flow and non-cash informationmade payments related to our leases for the years ended December 31, 2021, 2020these commitments totaling $67,277, $50,829 and 2019 were as follows. For our office leases, we net sublease income against other lease costs shown in the below table. Furthermore, cash flow information is presented net of sublease income.
| | | | | | | | | | | | | | | | | |
| Year Ended December 31, |
| 2021 | | 2020 | | 2019 |
| Operating lease cost | $ | 20,188 | | | $ | 17,371 | | | $ | 16,380 | |
| Finance lease cost – amortization of ROU assets | 2,157 | | | 719 | | | — | |
| Finance lease cost – interest expense on lease liabilities | 485 | | | 167 | | | — | |
| Short-term lease cost | 1,335 | | | 463 | | | 323 | |
Variable lease cost(1) | 3,979 | | | 2,382 | | | 880 | |
Sublease income(2) | (717) | | | (820) | | | (512) | |
| Total lease cost | $ | 27,427 | | | $ | 20,282 | | | $ | 17,071 | |
| Cash paid for amounts included in the measurement of lease liabilities | | | | | |
| Operating cash outflows from operating leases | $ | 19,811 | | | $ | 17,444 | | | $ | 12,446 | |
| Operating cash outflows from finance leases | 488 | | | 85 | | | — | |
| Financing cash outflows from finance leases | 516 | | | 489 | | | — | |
| Supplemental non-cash information | | | | | |
Non-cash operating lease ROU assets obtained in exchange for new lease liabilities(3) | $ | 12,774 | | | $ | 26,417 | | | $ | 24,715 | |
| Non-cash increase (decrease) in operating lease ROU assets due to lease modifications | (40) | | | 79 | | | (5,407) | |
Non-cash finance lease ROU assets obtained in exchange for new finance lease liabilities(4) | — | | | 15,100 | | | — | |
_____________________
(1)Variable lease cost includes non-lease components classified as lease costs, such as common area maintenance fees, property taxes and utilities, that vary in amount for reasons other than the passage of time. We elected the practical expedient to not bifurcate the lease component from the non-lease components.
(2)We entered into a sublease arrangement in July 2019, through which we earn sublease income, which offsets our lease cost related to the underlying premises. During the year ended December 31, 2020, we offered the sublessee a partial rent abatement as a result of the COVID-19 pandemic. The sublease arrangement terminated in August 2021.
(3)For the year ended December 31, 2020, includes $5,640 of operating lease ROU assets obtained through acquisitions.
(4)We did not have any finance leases prior to 2020.
Supplemental balance sheet information related to our leases was as follows as of the dates presented:
| | | | | | | | | | | |
| December 31, |
| 2021 | | 2020 |
| Operating Leases | | | |
| ROU assets | $ | 115,191 | | | $ | 116,858 | |
| Operating lease liabilities | $ | 138,794 | | | $ | 139,796 | |
| Weighted average remaining lease term (in years) | 8.6 | | 9.5 |
| Weighted average discount rate | 4.5 | % | | 4.7 | % |
| Finance Leases | | | |
ROU assets(1) | $ | 12,224 | | | $ | 14,381 | |
Lease liabilities(2) | $ | 14,174 | | | $ | 14,693 | |
| Weighted average remaining lease term (in years) | 18.3 | | 19.2 |
| Weighted average discount rate | 3.4 | % | | 3.4 | % |
_____________________
(1)Finance lease ROU assets were presented within property, equipment and software in the consolidated balance sheets.
(2)Finance lease liabilities were presented within accounts payable, accruals and other liabilities in the consolidated balance sheets.
SoFi Technologies, Inc.
Notes to Consolidated Financial Statements (continued)
(In Thousands, Unless Otherwise Stated and Except for Share and Per Share Data)
For the periods presented, maturities of lease liabilities as of the date indicated and a reconciliation of the total undiscounted cash flows to the lease liabilities in the consolidated balance sheets were as follows:
| | | | | | | | | | | |
| Operating Leases | | Finance Leases |
| As of December 31, 2021 | | | |
| 2022 | $ | 22,287 | | | $ | 959 | |
| 2023 | 22,537 | | | 964 | |
| 2024 | 21,749 | | | 968 | |
| 2025 | 20,494 | | | 1,038 | |
| 2026 | 19,380 | | | 1,060 | |
| Thereafter | 60,948 | | | 14,053 | |
| Total | 167,395 | | | 19,042 | |
| Less: imputed interest | (28,601) | | | (4,868) | |
| Lease liabilities | $ | 138,794 | | | $ | 14,174 | |
Lease Concession
The lessor for one of our operating leases allowed us to defer payments on the lease beginning in April 2020 as a result of our inability to use the leased premises during the COVID-19 pandemic. We elected to not account for this concession as a lease modification, as the concession did not result in a substantial change to the enforceable rights and obligations of the parties under the lease contract. During the concession period, we did not recognize operating lease cost and we did not remeasure the right-of-use asset or lease liability. We regained access to the leased premises in September 2021 and resumed lease amortization at that time, which represents the straight-line recognition of the remaining total operating lease cost over an extended lease term. In the absence of this concession, we would have recognized additional operating lease cost of $1,509 and $1,698$22,017 during the years ended December 31, 2023, 2022 and 2021, and 2020, respectively.
Other Commitments
In September 2019, we entered into a 20-year partnership with LA Stadium and Entertainment District at Hollywood Park in Inglewood, California that granted us the exclusive naming rights to SoFi Stadium and official partnerships with the Los Angeles Chargers and Los Angeles Rams, as well as rights with the performance venue and surrounding entertainment district (���Naming and Sponsorship Agreement”). Contractual payments under the Naming and Sponsorship Agreement total $625.0 million, which began in 2020 and end in 2040 and include operating lease obligations, finance lease obligations and sponsorship and advertising opportunities at the complex.
In October 2021, we entered into a four-year arrangement for cloud computing services with a total commitment of $80 million to be incurred through the term. During the year ended December 31, 2021, we incurred costs associated with this arrangement of $3.6 million, which is recorded within noninterest expense—technology and product development in the consolidated statements of operations and comprehensive income (loss).
Amounts payable in future periods are as follows:
| | As of December 31, 2021 |
| 2022 | $ | 45,015 | |
| 2023 | 45,121 | |
| December 31, 2023 | | | December 31, 2023 |
| 2024 | 2024 | 45,230 | |
| 2025 | 2025 | 45,773 | |
| 2026 | 2026 | 30,526 | |
| 2027 | |
| 2028 | |
| Thereafter | Thereafter | 448,515 | |
| Total | Total | $ | 660,180 | |
SoFi Technologies, Inc.
Notes to Consolidated Financial Statements (continued)
(In Thousands, Unless Otherwise Stated and Except for Share and Per Share Data)
We made payments totaling $22,017 during the year ended December 31, 2021. See “Contingencies — SoFi Stadium” below for discussion of an associated contingent matter, which could result in an additional payment related to the initial contract year and which are excluded from the table above. We made payments totaling $6,533 during the year ended December 31, 2020.
We also have commitments to fund home loans and student loans that are only cancellable at the option of the borrower. The commitments are measured at fair value on a recurring basis. See Note 915. Fair Value Measurements for additional information.
As part of our community reinvestment initiatives, we have a commitment to fund a line of credit to be used to finance housing and stimulate economic development in low- to moderate-income communities. As of December 31, 2023, we funded
SoFi Technologies, Inc.
SoFi Technologies, Inc.
Notes to Consolidated Financial Statements (continued)
(In Thousands, Unless Otherwise Stated and Except for Share and Per Share Data)
$1.2 million of loans, which are presented within loans held for investment in the consolidated balance sheets, and had $18.8 million of the total $20.0 million commitment outstanding.
For information on our leases, see Note 9. Property, Equipment, Software and Leases.
Concentrations
Financial instruments that potentially subject us to significant concentrations of credit risk consist principally of cash and cash equivalents, restricted cash and restricted cash equivalents, residual investments and loans. We hold cash and cash equivalents and restricted cash and restricted cash equivalents in accounts at regulated domestic financial institutions in amounts that may exceed FDIC insured amounts. We believe these institutions are of high credit quality and have not experienced any related losses to date.quality.
We are dependent on third-party funding sources and deposit balances to originate loans. Additionally, we sell loans to various third parties. During the years ended December 31, 2021 and 2020, the two largestWe have historically sold loans to a limited pool of third-party buyers accounted for a combined 42% and 49%, respectively, of our loan sales volume. During the year ended December 31, 2019, approximately 10% of our loan sales volume was concentrated in the largest third-party buyer.buyers. No individual third-party buyer accounted for 10% or more of consolidated total net revenues for anythe periods presented.
Within our Technology Platform segment, we have a relatively smaller number of clients compared to our lending and financial services businesses. As such, the loss of one or a few of our top clients could be significant to that portion of our business. No individual client accounted for 10% or more of consolidated total net revenues for the periods presented.
The Company is exposed to default risk on borrower loans originated and financed by us. There is no single borrower or group of borrowers that comprise a significant concentration of the Company’s loan portfolio. Likewise, the Company is not overly concentrated within a group of channel partners or other customers, with the exception of our distribution of personal loan residual interests in our sponsored personal loan securitizations, which we market to third parties, and the aforementioned whole loan buyers. Given we have a limited number of prospective buyers for our personal loan securitization residual interests, this might result in us utilizing a significant amount of deposits or our own capital to fund future residual interests in personal loan securitizations, or impact the execution of future securitizations if we are limited in our own ability to invest in the residual interest portion of future securitizations, or find willing buyers for securitization residual interests.
See Note 18 for a discussion of concentrations in revenues from contracts with customers.
Contingencies
Legal Proceedings
In limited instances,the ordinary course of business, the Company may be subject to a variety of claimspending legal proceedings. While we are unable to predict the ultimate outcome of these actions, we believe that any ultimate liability arising from any of these actions will not have a material adverse effect on our consolidated financial position, results of operations or cash flows. However, many of these matters are in various stages of proceedings and lawsuitsfurther developments could cause management to revise its assessment of these matters. Our assessments are based on our knowledge and historical experience, as well as the specific facts and circumstances asserted, but the ultimate outcome of any matter could require payment substantially in excess of the ordinary course of business.amount that we have accrued and/or disclosed. Regardless of the final outcome, defending lawsuits, claims, government and self-regulatory organization investigations, and proceedings in which we are involved is costly and can impose a significant burden on management and employees, and there can be no assurances that we will receive favorable final outcomes.
Galileo. Galileo was a defendant in a putative class action filed in the United States District Court for the Northern District of California in October 2019, captioned as Richards, et. al v. Chime Financial, Inc., Galileo Financial Technologies and The Bancorp, Inc., Civil Action No. 4:19-cv-6864-HSG (N.D. Cal.). Plaintiff asserted various claims against the defendants arising from an intermittent disruption in service experienced by certain holders of Chime Financial, Inc. (“Chime”) deposit accounts preventing them from accessing or using account funds for portions of time between October 16, 2019 and October 19, 2019. The parties entered into a class action settlement agreement to resolve the claims in the action, which the district finally approved by order dated May 24, 2021. In June 2021, a pro se putative class member filed an appeal from that final order approving the settlement agreement, and the appeal was dismissed for lack of prosecution by order of the United States Court of Appeals for the Ninth Circuit on September 1, 2021. The agreed-upon class has now been implemented and finalized, and we derecognized our associated liability and insurance recovery asset.
SoFi Stadium. In September 2019, we established a 20-year partnership with LA Stadium and Entertainment District at Hollywood Park in Inglewood, California (“StadCo”), through a naming and sponsorship agreement, which, among other things, provides SoFi with exclusive naming rights of SoFi Stadium and an official partnership with the Los Angeles Chargers and Los Angeles Rams and with the performance venue, which shares a roof with the stadium, and the surrounding planned
SoFi Technologies, Inc.
Notes to Consolidated Financial Statements (continued)
(In Thousands, Unless Otherwise Stated and Except for Share and Per Share Data)
entertainment district, which is anticipated to include office space, retail space and hotel and dining options. In September 2020, we discussed certain provisions of the naming and sponsorship agreement with StadCo in light of the COVID-19 pandemic. Based on these discussions, SoFi paid sponsorship fees for the initial contract year (July 1, 2020 to March 31, 2021) of $9.8 million, of which $6.5 million was paid during 2020 and $3.3 million was paid in January 2021.
The parties are revisiting the sponsorship fees to determine the ultimate amount payable for the initial contract year and have agreed to seek to engage a third party with expertise in the valuation of sports media rights and sports sponsorship or promotional rights (“Valuation Expert”) to perform an evaluation of the delivered value during the initial contract year. The evaluation has not begun as of the date of this Annual Report on Form 10-K. Therefore, the Company is exposed to additional potential sales and marketing expense of up to $12.7 million, which reflects the difference between the actual sponsorship fees paid during the initial contract year and the commitment for the initial contract year made under the Naming and Sponsorship Agreement. As of December 31, 2021, we are unable to estimate the amount of reasonably possible additional costs we may incur with respect to this contingency. Moreover, we have not determined that the likelihood of additional cost is probable. Therefore, as of December 31, 2021, we have not recorded additional expense related to this contingency.
Juarez et al v. SoFi Lending Corp. SoFi Lending Corp. and SoFi (collectively, the “SoFi Defendants”) are defendants in a putative class action, captioned as Juarez v. Social Finance, Inc. et al., Civil Action No. 4:20-cv-03386-HSG (N.D. Cal.), filed against them in the United States District Court for the Northern District of California in May 2020. Plaintiffs, who are conditional permanent residents or Deferred Access for Childhood Arrival (“DACA”) holders, allege that the SoFi Defendants engaged in unlawful lending discrimination in violation of 42 U.S.C. § 1981 and California Civil Code, § 51, et seq., through policies and practices by making such categories of applicants ineligible for loans or eligible only with a co-signer who is a United States citizen or lawful permanent resident. Plaintiffs further allege that the SoFi Defendants violated the Fair Credit Reporting Act, by accessing the credit reports of non-United States citizen loan applicants who hold green cards with a validity period of less than two years without a permissible purpose. As relief, Plaintiffs seek, on behalf of themselves and a purported class of similarly-situated non-United States citizen loan applicants, a declaratory judgment that the challenged policies and practices violate federal and state law, an injunction against future violations, actual and statutory damages, exemplary and punitive damages, and attorneys’ fees. The SoFi Defendants filed a motion to, among other things, dismiss Plaintiffs’ claims for failure to state a claim, and/or compel arbitration. By order dated April 12, 2021, the court dismissed Plaintiffs’ California Civil Code, § 51 claim without prejudice, and denied the SoFi Defendants’ motion to dismiss the remaining counts. Plaintiffs filed an amended complaint with two additional named plaintiffs, including claims under the Unruh Act. The SoFi Defendants filed a motion to compel arbitration as to one of the new plaintiffs, which was granted in part and denied in part on August 24, 2021. On November 1, 2021, the parties agreed to a stay of discovery while they pursued settlement negotiations. On January 27, 2022, the parties advised the court that they had reached agreement on nearly all material terms of the settlement, were in the process of documenting the settlement and accompanying class action settlement notice and claim form, and that plaintiffs expected to file a motion for preliminary approval of the settlement on or before March 28, 2022. The proposed class settlement, which contemplates an aggregate payment by the SoFi Defendants in an immaterial amount, remains subject to court review and approval.
In re Renren Inc. Derivative Litigation. On March 22, 2021, Social Finance was named as a newly added defendant in an Amended and Supplemental Consolidated Stockholder Derivative Complaint (the “Amended Complaint”) filed in an ongoing action pending in the Supreme Court of New York, captioned In re Renren, Inc. Derivative Litigation, Index No. 653564/2018. The plaintiffs, Hen Ren Silk Road Investments LLC, Oasis Investments II Master Fund Ltd., and Jodi Arama, allege that the Chairman and Chief Executive Officer of Renren, Inc. (“Renren”), Joseph Chen, and others, breached their fiduciary duties to Renren’s shareholders in connection with a transaction in which Renren spun off its holdings of Social Finance shares (as well as stock in other entities) to Oak Pacific Investments (“OPI”), an entity allegedly controlled by Mr. Chen. The Amended Complaint contains only one count against Social Finance. Specifically, the plaintiffs claim that Social Finance’s receipt of approximately 17 million of its own securities from OPI pursuant to a call option transfer during the pendency of the lawsuit constituted a fraudulent conveyance pursuant to D.C.L. Section 276 (as in effect in March 2019) that should be voided and set aside pursuant to D.C.L. Sections 278 and 279 (as effective in 2019), as well as unspecified compensatory damages. The Amended Complaint seeks, among other things, an order to impose a constructive trust over the SoFi shares transferred from Renren or the proceeds thereof, voiding and setting aside the call option transfer of approximately 17 million Social Finance shares as a fraudulent conveyance, and requiring Social Finance to pay over the value of the call option transfer. On October 7, 2021, the parties agreed to a stipulation of settlement under which the claims against Social Finance will be dismissed with prejudice with no payment by Social Finance. By order dated December 10, 2021, the Court denied the plaintiffs’ motion for approval of the settlement agreement, ruling that investors who purchased shares in Renren
SoFi Technologies, Inc.
Notes to Consolidated Financial Statements (continued)
(In Thousands, Unless Otherwise Stated and Except for Share and Per Share Data)
after April 29, 2018, the date the spin transaction was announced (the “Record Date”) or who increased their positions in Renren during the pendency of the lawsuit, were not entitled to any recovery. The plaintiffs filed a notice of appeal of this decision on December 15, 2021. On December 29, 2021, the Court issued a further order giving defendants leave to file an order to show cause seeking dismissal as it relates to plaintiffs who purchased shares after the Record Date or who increased their position during the pendency of the lawsuit (the “New Plaintiffs”), on or before January 14, 2022. The defendants have moved to dismiss the complaint as against the New Plaintiffs and the Court has now adjourned all dates on the calendar for at least 45 days for the parties to attempt to come up with a resolution as to the claims of the New Plaintiffs. We do not expect these orders ultimately to affect the plaintiffs’ agreement to dismiss the claims against Social Finance with prejudice.
The shares reported herein are consistent with the Amended Complaint and are not adjusted for the effect of the Business Combination.
Guarantees
We have 3three types of repurchase obligations that we account for as financial guarantees pursuant to ASC 460.guarantees. First, we issue financial guarantees to FNMAGSEs on loans that we sell to FNMA,GSEs, which manifest as repurchase requirements if it is later discovered that loans sold to FNMAa GSE do not meet FNMAtheir guidelines. We have a three-year repurchase obligation from the time of origination to buy back originated loans that do not meet FNMAGSE guidelines, and we are required to pay the full initial purchase price back to FNMA.the GSE. We recognize a liability for the full amount of expected loan repurchases, which we estimate based on historical experience.repurchase activity for similar types of loans and assess whether adjustments to our historical loss experience are required based on current conditions and forecasts of future conditions, as appropriate, as our exposure under the guarantee is typically short-term in nature. The liability we record is equal to what we expect to buy back and, therefore, approximates fair value. Second, we make standard representations and warranties related to other loan transfers, breaches of which would require us to repurchase the transferred loans. Finally, we have limited repurchase obligations for certain loan transfers associated with credit-related events, such as early prepayment or events of default within 90 days after origination. Estimated losses associated with credit-related repurchases are evaluated pursuant to ASC 326. In the event of a repurchase, we are typically required to pay the purchase price of the loans transferred.
SoFi Technologies, Inc.
SoFi Technologies, Inc.
Notes to Consolidated Financial Statements (continued)
(In Thousands, Unless Otherwise Stated and Except for Share and Per Share Data)
As of December 31, 20212023 and 2020, the Company2022, we accrued liabilities within accounts payable, accruals and other liabilities in the consolidated balance sheets of $7,441$5.9 million and $5,196,$1.4 million, respectively, related to our estimated repurchase obligation, with the former of which includes liabilities assumed in our acquisition of Wyndham. The corresponding charges for changes in the estimated obligation are recorded within noninterest income—loan origination, sales, and salessecuritizations in the consolidated statements of operations and comprehensive income (loss).loss. As of December 31, 20212023 and 2020,2022, the amountamounts associated with loans sold that were subject to the terms and conditions of our repurchase obligations totaled $6.5$6.7 billion and $3.9$5.1 billion, respectively.
As of December 31, 20212023 and 2020, the Company2022, we had a total of $9.1$6.4 million and $9.3$9.1 million, respectively, in letters of credit outstanding with financial institutions. These outstanding letters of creditinstitutions, which were issued for the purpose of securing certain of the Company’sour operating lease obligations. A portion of the letters of credit was collateralized by $1.3 million and $3.1 million and $3.3 million of the Company’sour cash as of December 31, 20212023 and 2020,2022, respectively, which is included within restricted cash and restricted cash equivalents in the consolidated balance sheets.
As of December 31, 2023 and 2022, we had a total of $27.2 million and $11.7 million, respectively, in letters of credit outstanding with the FHLB, which serve as collateral for public deposits and were collateralized by loans.
Mortgage Banking Regulatory Mandates
The Company isWe are subject to certain state-imposed minimum net worth requirements for the states in which the Company iswe are engaged in the business of a residential mortgage lender. Noncompliance with these requirements on an annual basis could result in potential fines or penalties imposed by the applicable state. Future events or changes in mandates may affect the Company’sour ability to meet mortgage banking regulatory requirements. As of December 31, 20212023 and 2020, the Company was2022, we were in compliance with all minimum net worth requirements and, therefore, hashave not accrued any liabilities related to fines or penalties.
Retirement Plans
The Company hasWe have a 401(k) plan that covers all employees meeting certain eligibility requirements. The 401(k) plan is designed to provide tax-deferred retirement benefits in accordance with the provisions of Section 401(k) of the Internal Revenue Code. Eligible employees may defer up to 100% of eligible compensation up to the annual maximum as determined by the Internal Revenue Service. The Company’sIRS. Our contributions to the plan are discretionary. The Company hasWe have not made any contributions to the plan to date.
SoFi Technologies, Inc.
Notes to Consolidated Financial Statements (continued)
(In Thousands, Unless Otherwise Stated and Except for Share and Per Share Data)
Note
17.19. Loss Per Share
We computePrior to the Business Combination, our participating interests included all series of our preferred stock, and we computed loss per share attributable to common stock using the two-class method required for participating interests. Prior to the Business Combination, our participating interests included all series of our preferred stock. Series 1 preferred stock has preferential cumulative dividend rights. Pursuant to ASC 260, Earnings Per Share, for each period presented, we increased net loss by the contractual amount of dividends payable to Series 1 preferred stock before allocating any remaining undistributed earnings to all participating interests.
Prior to the Business Combination, all other classes of preferred stock, except for Series C, had stated dividend rights, which had priority over undistributed earnings. The remaining losses were shared pro-rata among the preferred stock (with the exception of Series 1 preferred stock) and common stock outstanding during the measurement period, as if all of the losses for the period had been distributed. While our calculation of loss per share accounted for a loss allocation to all participating shares, we only presented loss per share below for our common stock.
Subsequent to the Business Combination, we did not have any participating interests. Series 1 Redeemable Preferred Stock has preferential cumulative dividend rights. For each period presented, we increased net loss by the contractual amount of dividends payable to holders of Series 1 Redeemable Preferred Stock.
Basic loss per share of common stock wasis computed by dividing net loss, adjusted for the impact of Series 1 preferred stockRedeemable Preferred Stock dividends, and loss allocated to other participating interests, as applicable, by the weighted average number of shares of common stock outstanding during the period. Because
Diluted earnings (loss) per share of common stock is computed by dividing net income, adjusted for the amount available to distribute to all participating interests after adjusting for redeemable preferredimpact of Series 1 Redeemable Preferred Stock dividends, by the weighted average number of shares of common stock dividends was negative in all periods presented, we did not allocate any loss to participating interests in determiningoutstanding during the numeratorperiod plus amounts representing the dilutive effect of contingently issuable shares including PSU awards which require future service as a condition of delivery of the basicunderlying common stock, RSUs, outstanding options, outstanding warrants and diluted loss per share computation, asdilution resulting from the allocationconversion of loss would have been anti-dilutive. Further, weconvertible notes, if applicable. The adjustment for convertible notes reflects the conversion price at the end of the reporting period. We excluded the effect of all potentially dilutive common stock elements from the denominator in the computation of diluted lossearnings (loss) per share asin the periods where their inclusion would have been anti-dilutive.
The calculation of basic and diluted loss per share was as follows for the years indicated:
| | | | | | | | | | | | | | | | | |
| Year Ended December 31, |
| 2021 | | 2020 | | 2019 |
| Numerator: | | | | | |
| Net loss | $ | (483,937) | | | $ | (224,053) | | | $ | (239,697) | |
| Less: Redeemable preferred stock dividends | (40,426) | | | (40,536) | | | (23,923) | |
Less: preferred stock redemptions, net(1) | — | | | (52,658) | | | — | |
| | | | | |
| Net loss attributable to common stockholders – basic | $ | (524,363) | | | $ | (317,247) | | | $ | (263,620) | |
| Denominator: | | | | | |
| Weighted average common stock outstanding – basic | 526,730,261 | | | 73,851,108 | | | 65,619,361 | |
| | | | | |
| Weighted average common stock outstanding – diluted | 526,730,261 | | | 73,851,108 | | | 65,619,361 | |
| Loss per share – basic | $ | (1.00) | | | $ | (4.30) | | | $ | (4.02) | |
| Loss per share – diluted | $ | (1.00) | | | $ | (4.30) | | | $ | (4.02) | |
___________________
(1)In December 2020, we exercised a call and redeemed certain redeemable preferred stock, as further discussed in Note 15. We considered the premium paid on redemption of $52,658 to be akin to a dividend to the redeemable preferred stockholder. As such, the premium, which represented the amount paid upon redemption over the carrying value of the preferred stock (such carrying value being reduced for preferred stock issuance costs), was deducted from net loss to determine the loss available to common stockholders.
SoFi Technologies, Inc.
SoFi Technologies, Inc.
Notes to Consolidated Financial Statements (continued)
(In Thousands, Unless Otherwise Stated and Except for Share and Per Share Data)
The calculations of basic and diluted loss per share were as follows:
| | | | | | | | | | | | | | | | | |
| Year Ended December 31, |
| 2023 | | 2022 | | 2021 |
| Numerator: | | | | | |
| Net loss | $ | (300,742) | | | $ | (320,407) | | | $ | (483,937) | |
| Less: Redeemable preferred stock dividends | (40,425) | | | (40,425) | | | (40,426) | |
| Net loss attributable to common stockholders – basic and diluted | $ | (341,167) | | | $ | (360,832) | | | $ | (524,363) | |
| Denominator: | | | | | |
| Weighted average common stock outstanding – basic | 945,024,160 | | | 900,886,113 | | | 526,730,261 | |
| Weighted average common stock outstanding – diluted | 945,024,160 | | | 900,886,113 | | | 526,730,261 | |
| Loss per share – basic | $ | (0.36) | | | $ | (0.40) | | | $ | (1.00) | |
| Loss per share – diluted | $ | (0.36) | | | $ | (0.40) | | | $ | (1.00) | |
We excluded the effect of the below elements from our calculation of diluted loss per share, as their inclusion would have been anti-dilutive, as there were no earnings attributable to common stockholders. These amounts represent the number of instruments outstanding at the end of each respectivethe year.
| | | | | | | | | | | | | | | | | |
| Year Ended December 31, |
| 2021 | | 2020 | | 2019 |
| Common stock options | 21,171,147 | | | 29,947,975 | | | 30,743,931 | |
| Common stock warrants | 12,170,990 | | | — | | | — | |
| Unvested RSUs | 48,687,524 | | | 44,601,586 | | | 25,293,061 | |
| Unvested PSUs | 22,970,396 | | | — | | | — | |
Convertible Notes(1) | 53,538,000 | | | — | | | — | |
| Redeemable preferred stock exchangeable for common stock | — | | | 465,916,522 | | | 400,936,765 | |
| Redeemable preferred stock warrants exchangeable for common stock | — | | | 12,170,990 | | | 12,170,990 | |
Contingent common stock(2) | — | | | 320,649 | | | — | |
| | | | | | | | | | | | | | | | | |
| Year Ended December 31, |
| 2023 | | 2022 | | 2021 |
| Common stock options | 17,896,732 | | | 18,749,679 | | | 21,171,147 | |
| Common stock warrants | 12,170,990 | | | 12,170,990 | | | 12,170,990 | |
Unvested RSUs(1) | 64,879,496 | | | 69,538,139 | | | 48,687,524 | |
| Unvested PSUs | 16,240,181 | | | 19,563,747 | | | 22,970,396 | |
Convertible notes(2) | 49,610,631 | | | 53,538,000 | | | 53,538,000 | |
Contingent common stock(3) | 45,859 | | | 6,305,595 | | | — | |
____________________
(1)For the year endedAs of December 31, 2021, represented2023, includes DSUs granted to non-employee directors. See Note 16. Share-Based Compensation for additional information.
(2)Represents the numbershares of common stock issuable upon conversion of all Convertible Notesconvertible notes at the conversion rate in effect at the balance sheet date in accordance with ASU 2020-06.indicated. See Note 11. Organization, Summary of Significant Accounting Policies and New Accounting Standards and Note 1012. Debt for additional information.
(2)(3)For the year endedAs of December 31, 2020, included2023 and December 31, 2022, includes contingently issuablereturnable common stock in connection with our acquisitionthe Technisys Merger during 2022, which consists of 8 Limited, which was subsequentlyshares held in escrow pending resolution of outstanding indemnification claims by SoFi. These shares were issued in 2021.2022 and partially released in 2023. See Note 22. Business Combinations for additional information.
Note 18.20. Business Segment and Geographic Information Segment Organization and Reporting Framework
We have three reportable segments: Lending, Technology Platform and Financial Services. Each of our reportable segments is a strategic business unit that serves specific needs of our members based on the products and services provided. The segments are based on the manner in which management views the financial performance of the business. The reportable segments also reflect our organizational structure. Each segment has a segment manager who reports directly to the CODM. The CODM has ultimate authority and responsibility over resource allocation decisions and performance assessment.
The operations of acquired businesses have been integrated into, or managed as part of, our existing reportable segments. Activities that are not part of a reportable segment, such as management of our corporate investment portfolio and asset/liability management by our centralized treasury function (as further discussed below), are included in the Corporate/Other non-reportable segment.
Contribution profit (loss) is the primary measure of segment profit and loss reviewed by the Chief Operating Decision Maker (“CODM”)CODM and is intended to measure the direct profitability of each segment.segment in the manner in which management evaluates performance and makes
SoFi Technologies, Inc.
SoFi Technologies, Inc.
Notes to Consolidated Financial Statements (continued)
(In Thousands, Unless Otherwise Stated and Except for Share and Per Share Data)
decisions about funding our operations and allocating resources. Contribution profit (loss) is defined as total net revenue for each reportable segment less:
•fair value changes in servicing rights and residual interests classified as debt that are attributable to assumption changes, which impact the contribution profit within the Lending segment. These fair value changes are non-cash in nature and are not realized in the period; therefore, they do not impact the amounts available to fund our operations; and
•expenses directly attributable to the corresponding reportable segment. Directly attributable expenses primarily include compensation and benefits and sales and marketing, and vary based on the amount of activity within each segment. Directly attributable expenses also include loan origination and servicing expenses, professional services, product fulfillment, lead generation and occupancy-related costs. Expenses are attributed to the reportable segments using either direct costs of the segment or labor costs that can be attributed based upon the allocation of employee time for individual products.
During the first quarter of 2022, we implemented an FTP framework to attribute net interest income to our business segments based on their usage and/or provision of funding. The primary objective of the FTP framework is to transfer interest rate risk from the business segments by providing matched duration of funding of assets and liabilities to allocate interest income and interest expense to each segment. Therefore, the financial impact, management and reporting of interest rate risk is centralized in Corporate/Other, where it is monitored and managed. Under the FTP framework, treasury provides a funds credit for sources of funds, such as deposits, and a funds charge for the use of funds, such as loan originations and credit card. The process for determining FTP credits and charges is based on a number of factors and assumptions, including prevailing market interest rates, the expected duration of interest-earning and interest-bearing assets and liabilities, contingent risks and behaviors, and our broader funding profile. As the durations of assets and liabilities are typically not perfectly matched, the residual impact of the FTP framework is reflected within Corporate/Other. We regularly assess the assumptions, methodologies and reporting classifications used for segment reporting, which may result in further refinements or changes to the framework in future periods. The application of the FTP framework impacts the measure of net interest income and, thereby, total net revenue and contribution profit (loss) for our reportable segments, also reflectas well as the Company’s organizational structure. Eachtotal net revenue of Corporate/Other, but has no impact on our consolidated results of operations.
Prior to implementing the FTP framework, the presentation of our Lending and Financial Services segments’ net interest income reflected the difference between interest income earned on our loans and the actual interest expense incurred on any loans that were financed. Under the FTP framework, such interest expense is incurred by treasury within Corporate/Other and replaced by an FTP charge. Application of our current FTP framework during the comparative year ended December 31, 2021 would not have had a material impact on Lending or Financial Services segment has a segment manager who reports directly to the CODM. The CODM has ultimate authority and responsibility over resource allocation decisions and performance assessment.net interest income.
The Company has 3accounting policies of our reportable segments: Lending, Technology Platformsegments are consistent with those described in Note 1. Organization, Summary of Significant Accounting Policies and Financial Services. New Accounting Standards, except for the application of the FTP framework and the allocations of consolidated income and consolidated expenses. Assets are not allocated to reportable segments, as our CODM does not evaluate reportable segments using discrete asset information.
Segment Information
Lending. The Lending segment includes our personal loan, student loan and home loan products and the related servicing activities and, when applicable, commercial loans. We originate loans in each of the aforementioned channels with the objective of either selling whole loans or securitizing a pool of originated loans for transfer to third-party purchasers.activities. Revenues in the Lending segment are driven by changes in the fair value of our whole loans and securitization interests (inclusive of our economic hedging activities), gains or losses recognized on transfers that meet the true sale requirements, under ASC 860, Transfers and Servicing, and our servicing-related activities, which mainly consist of servicing fees and the changes in our servicing assets over time. WeIn our Lending segment, we also earn the difference between interest income earned on our loans and interest expense on any loans that are financed. Interest expense primarily impactsas determined using the FTP framework for the year ended December 31, 2023 and the majority of the year ended December 31, 2022, and from our Lending segment, and we present interest income net of interest expense, as ourwarehouse financing for the year ended December 31, 2021. Our CODM considers net interest income in addition to contribution profit in evaluating the performance of theour Lending segment and making resource allocation decisions. Finally,Therefore, we present interest income net of interest expense.
Technology Platform. The Technology Platform segment includes: (i) technology products and solutions revenue, which is primarily related to our platform as a service through Galileo, which provides the infrastructure to facilitate core client-facing and back-end capabilities, such as account setup, account funding, direct deposit, authorizations and processing, payments functionality and check account balance features, (ii) beginning in March 2022, revenue earned by Technisys, which
SoFi Technologies, Inc.
SoFi Technologies, Inc.
Notes to Consolidated Financial Statements (continued)
(In Thousands, Unless Otherwise Stated and Except for Share and Per Share Data)
expanded our segment to include a cloud-native digital and core banking platform offering and which results in the sale of software licenses and the provision of related technology solutions, and (iii) beginning in the third quarter of 2021, our Lending2023, interest income earned on segment revenue also includes earnings or losses from an equity method investment,cash balances, for which is further discussed in prior period amounts were determined to be immaterial. See Note 1.
The Technology Platform segment includes our technology platform fees, which commenced with our acquisition of Galileo in May 2020, and, in the 2020 periods, our equity method investment in Apex, which represented our portion of net earnings on clearing brokerage activity on the Apex platform. Apex was the Company’s only material equity method investment as of December 31, 2020. During January 2021, the seller of our Apex interest exercised the Seller Call Option, and as such we do not recognize Apex equity investment income subsequent to the call date. Due to the additional investment we made during 2020, we will maintain an immaterial investment in Apex, but will no longer qualify for equity method accounting. See Note 22. Business Combinations for additional information on the acquisition of Galileo, and Note 1 for additional information on our Apex equity method investment.Technisys Merger.
Financial Services. The Financial Services segment primarily includes our SoFi Money product (primarily inclusive of checking and savings accounts, as well as cash management accounts), SoFi Invest product, SoFi Credit Card product, (which we launched in the third quarter of 2020), SoFi Relay personal finance management product and other financial services, such as equity capital markets and advisory services, lead generation and content for other financial services institutions and our members. Checking and savings provides members a digital banking experience that offers no account fees, 2-day early paycheck and a competitive annual percentage yield. SoFi Money cash management provides members a digital cash management experience, interest income and the ability to separate money balances into various subcategories.experience. SoFi Invest provides investment features and financial planning services that we offer to our members. Revenues in the Financial Services segment include payment networkinterest income earned and interest expense incurred under the FTP framework, interchange fees on our member debit and credit transactions, and fees related to pay for order flow digital assets transaction fees and share lending arrangements in SoFi Invest. Additionally, we earn fees associated with equity capital markets services we began providing in the second quarter of 2021 and further expanded in the fourth quarter of 2021. We also earn referral fees in connection with referral activity we facilitate through our platform. The referral fee is paid
Our CODM considers net interest income in addition to us by third-party partners that offer services to end users who do not use onecontribution profit (loss) in evaluating the performance of our product offerings, but who were referredFinancial Services segment and making resource allocation decisions. Under the FTP framework, the Financial Services segment earns interest income that is reflective of an FTP credit for deposits provided to the partners through our platform. Beginning inoverall business, as well as incurs interest expense that is reflective of an FTP charge related to the third quarteruse of 2021, referral fees also include referral fulfillment fees earnedfunding for providing pre-qualified borrower referrals to a third-party partner who separately contracts with a loan originator.SoFi Credit Card.
Corporate/Other. Non-segment operations are classified as Corporate/Other, which includes net revenues associated with corporate functions that are not directly related to a reportable segment. Beginning in the first quarter of 2022, net interest income (expense) within Corporate/Other reflects the residual impact from FTP charges and FTP credits allocated to our reportable segments under our FTP framework. These non-segment net revenuesrevenue (loss) also include interest income earned on corporate cash balances, nonrecurring income on certain investments from available cash on hand, such as our investments in AFS debt securities (which investments are not interconnected with our core business lines and, thereby, reportable segments), noninterest income related to gains and losses on extinguishment of corporate borrowings including our convertible notes, and interest expense on other corporate borrowings, such as our revolving credit facility the seller note issued in connection with our acquisition of Galileo, and the amortization of debt issuance costs and original issue discount on our Convertible Notes. During the year ended December 31, 2021, net revenues within Other also included $211 of interest income and $169 of reversal of loss on discount to fair value in connection with related party transactions. During the years ended December 31, 2020 and 2019, net revenues within Other included $3,189 and $3,338, respectively, of interest income earned in connection with related party transactions. Refer to Note 15 for further discussion of our related party transactions.
The accounting policies of the segments are consistent with those described in Note 1, except for the accounting policies in relation to the allocations of consolidated income and consolidated expenses, as described below.
The following tables present financial information, including the measure of contribution profit (loss), for each reportable segment for the years indicated. The information is derived from our internal financial reporting used for corporate management purposes. Assets are not allocated to reportable segments, as the Company’s CODM does not evaluate reportable segments using discrete asset information.convertible notes.
SoFi Technologies, Inc.
SoFi Technologies, Inc.
Notes to Consolidated Financial Statements (continued)
(In Thousands, Unless Otherwise Stated and Except for Share and Per Share Data)
| | | | | | | | | | | | | | | | | | | | | | | | | | | | | | | | | | | | | | |
| Year Ended December 31, 2021 | | Lending(1) | | Technology Platform(2)(3)(4) | | Financial Services(4) | | Reportable Segments Total | | Other(4) | | Total |
| Net revenue | | | | | | | | | | | | |
| Net interest income (loss) | | $ | 258,102 | | | $ | (29) | | | $ | 3,765 | | | $ | 261,838 | | | $ | (9,594) | | | $ | 252,244 | |
| Noninterest income | | 480,221 | | | 194,915 | | | 54,313 | | | 729,449 | | | 3,179 | | | 732,628 | |
Total net revenue (loss) | | $ | 738,323 | | | $ | 194,886 | | | $ | 58,078 | | | $ | 991,287 | | | $ | (6,415) | | | $ | 984,872 | |
Servicing rights – change in valuation inputs or assumptions(5) | | 2,651 | | | — | | | — | | | 2,651 | | | | | |
Residual interests classified as debt – change in valuation inputs or assumptions(6) | | 22,802 | | | — | | | — | | | 22,802 | | | | | |
| Directly attributable expenses | | (364,169) | | | (130,439) | | | (192,996) | | | (687,604) | | | | | |
Contribution profit (loss) | | $ | 399,607 | | | $ | 64,447 | | | $ | (134,918) | | | $ | 329,136 | | | | | |
| | | | | | | | | | | | |
| Year Ended December 31, 2020 | | Lending | | Technology Platform(2)(4) | | Financial Services(4) | | Reportable Segments Total | | Other(4) | | Total |
| Net revenue | | | | | | | | | | | | |
| Net interest income (loss) | | $ | 199,345 | | | $ | (107) | | | $ | 484 | | | $ | 199,722 | | | $ | (21,791) | | | $ | 177,931 | |
| Noninterest income (loss) | | 281,521 | | | 96,423 | | | 11,386 | | | 389,330 | | | (1,729) | | | 387,601 | |
Total net revenue (loss) | | $ | 480,866 | | | $ | 96,316 | | | $ | 11,870 | | | $ | 589,052 | | | $ | (23,520) | | | $ | 565,532 | |
Servicing rights – change in valuation inputs or assumptions(5) | | 17,459 | | | — | | | — | | | 17,459 | | | | | |
Residual interests classified as debt – change in valuation inputs or assumptions(6) | | 38,216 | | | — | | | — | | | 38,216 | | | | | |
| Directly attributable expenses | | (294,812) | | | (42,427) | | | (143,966) | | | (481,205) | | | | | |
Contribution profit (loss) | | $ | 241,729 | | | $ | 53,889 | | | $ | (132,096) | | | $ | 163,522 | | | | | |
| | | | | | | | | | | | |
| Year Ended December 31, 2019 | | Lending | | Technology Platform(2) | | Financial Services | | Reportable Segments Total | | Other | | Total |
| Net revenue | | | | | | | | | | | | |
| Net interest income | | $ | 325,589 | | | $ | — | | | $ | 614 | | | $ | 326,203 | | | $ | 3,631 | | | $ | 329,834 | |
| Noninterest income | | 108,712 | | | 795 | | | 3,318 | | | 112,825 | | | — | | | 112,825 | |
Total net revenue | | $ | 434,301 | | | $ | 795 | | | $ | 3,932 | | | $ | 439,028 | | | $ | 3,631 | | | $ | 442,659 | |
Servicing rights – change in valuation inputs or assumptions(5) | | (8,487) | | | — | | | — | | | (8,487) | | | | | |
Residual interests classified as debt – change in valuation inputs or assumptions(6) | | 17,157 | | | — | | | — | | | 17,157 | | | | | |
| Directly attributable expenses | | (350,511) | | | — | | | (122,732) | | | (473,243) | | | | | |
| Contribution profit (loss) | | $ | 92,460 | | | $ | 795 | | | $ | (118,800) | | | $ | (25,545) | | | | | |
_____________________The following tables present financial information, including the measure of contribution profit (loss), for each reportable segment:
(1)Noninterest income within the Lending segment for the year ended December 31, 2021 included $261 of losses from our equity method investment in Lower. See Note 1 under “Equity Method Investments” for additional information.
(2)Noninterest income within the Technology Platform segment for the year ended December 31, 2020 included $4,442 of earnings from our equity method investment in Apex, net of an impairment charge in the fourth quarter of 2020. Noninterest income within this segment consisted entirely of earnings from our equity method investment in Apex during the year ended December 31, 2019. Therefore, there were no directly attributable expenses to this reportable segment in that period. See Note 1 under “Equity Method Investments” for additional information.
(3)During the year ended December 31, 2021, the five largest clients in the Technology Platform segment contributed 63% of the total net revenue within the segment, which represented 13% of our consolidated total net revenue. | | | | | | | | | | | | | | | | | | | | | | | | | | | | | | | | | | | | | | |
| Year Ended December 31, 2023 | | Lending | | Technology Platform(1) | | Financial Services(1) | | Reportable Segments Total | | Corporate/Other(1) | | Total |
| Net revenue | | | | | | | | | | | | |
| Net interest income (expense) | | $ | 960,773 | | | $ | 1,514 | | | $ | 334,847 | | | $ | 1,297,134 | | | $ | (35,394) | | | $ | 1,261,740 | |
Noninterest income (expense)(2) | | 409,848 | | | 350,826 | | | 101,668 | | | 862,342 | | | (1,293) | | | 861,049 | |
| Total net revenue (loss) | | $ | 1,370,621 | | | $ | 352,340 | | | $ | 436,515 | | | $ | 2,159,476 | | | $ | (36,687) | | | $ | 2,122,789 | |
Servicing rights – change in valuation inputs or assumptions(3) | | (34,700) | | | — | | | — | | | (34,700) | | | | | |
Residual interests classified as debt – change in valuation inputs or assumptions(4) | | 425 | | | — | | | — | | | 425 | | | | | |
| Directly attributable expenses | | (513,073) | | | (257,554) | | | (436,777) | | | (1,207,404) | | | | | |
| Contribution profit (loss) | | $ | 823,273 | | | $ | 94,786 | | | $ | (262) | | | $ | 917,797 | | | | | |
| | | | | | | | | | | | |
| Year Ended December 31, 2022 | | Lending | | Technology Platform(1) | | Financial Services(1) | | Reportable Segments Total | | Corporate/Other(1) | | Total |
| Net revenue | | | | | | | | | | | | |
| Net interest income (expense) | | $ | 531,480 | | | $ | — | | | $ | 92,574 | | | $ | 624,054 | | | $ | (39,958) | | | $ | 584,096 | |
Noninterest income (expense)(2) | | 608,511 | | | 315,133 | | | 75,102 | | | 998,746 | | | (9,307) | | | 989,439 | |
| Total net revenue (loss) | | $ | 1,139,991 | | | $ | 315,133 | | | $ | 167,676 | | | $ | 1,622,800 | | | $ | (49,265) | | | $ | 1,573,535 | |
Servicing rights – change in valuation inputs or assumptions(3) | | (39,651) | | | — | | | — | | | (39,651) | | | | | |
Residual interests classified as debt – change in valuation inputs or assumptions(4) | | 6,608 | | | — | | | — | | | 6,608 | | | | | |
| Directly attributable expenses | | (442,945) | | | (238,620) | | | (367,102) | | | (1,048,667) | | | | | |
| Contribution profit (loss) | | $ | 664,003 | | | $ | 76,513 | | | $ | (199,426) | | | $ | 541,090 | | | | | |
| | | | | | | | | | | | |
| Year Ended December 31, 2021 | | Lending | | Technology Platform(1) | | Financial Services(1) | | Reportable Segments Total | | Corporate/Other(1) | | Total |
| Net revenue | | | | | | | | | | | | |
| Net interest income (expense) | | $ | 258,102 | | | $ | (29) | | | $ | 3,765 | | | $ | 261,838 | | | $ | (9,594) | | | $ | 252,244 | |
Noninterest income(2) | | 480,221 | | | 194,915 | | | 54,313 | | | 729,449 | | | 3,179 | | | 732,628 | |
| Total net revenue (loss) | | $ | 738,323 | | | $ | 194,886 | | | $ | 58,078 | | | $ | 991,287 | | | $ | (6,415) | | | $ | 984,872 | |
Servicing rights – change in valuation inputs or assumptions(3) | | 2,651 | | | — | | | — | | | 2,651 | | | | | |
Residual interests classified as debt – change in valuation inputs or assumptions(4) | | 22,802 | | | — | | | — | | | 22,802 | | | | | |
| Directly attributable expenses | | (364,169) | | | (130,439) | | | (192,996) | | | (687,604) | | | | | |
| Contribution profit (loss) | | $ | 399,607 | | | $ | 64,447 | | | $ | (134,918) | | | $ | 329,136 | | | | | |
SoFi Technologies, Inc.
SoFi Technologies, Inc.
Notes to Consolidated Financial Statements (continued)
(In Thousands, Unless Otherwise Stated and Except for Share and Per Share Data)
_____________________
(4)(1)During the year ended December 31, 2021, total net revenue forWithin the Technology Platform segment, includedintercompany fees were $22,199, $7,604 and $1,863 of intercompany technology platform fees earned by Galileo from SoFi, which is a Galileo client. There is anfor the years ended December 31, 2023, 2022 and 2021, respectively. The equal and offsetting expenseintercompany expenses are reflected within the Financial Services segmentall three segments’ directly attributable expenses, representing the intercompany technology platform fees incurredas well as within expenses not allocated to Galileo.segments. The intercompany revenuerevenues and expenseexpenses are eliminated in consolidation. The revenue isrevenues are eliminated within “Other”Corporate/Other and the expense isexpenses are adjusted in our reconciliation of directly attributable expenses below. We recast the year ended December 31, 2020
(2)Refer to conform to the current year presentation, which resulted in the following: (i) an increase to the Technology Platform segment total net revenue and contribution profit of $686, (ii)Note 3. Revenue for a corresponding decrease to “Other” total net revenue for the elimination, (iii) a corresponding increase to Financial Services directly attributable expenses, and (iv) a corresponding adjustment in the reconciliation of directly attributable expenses.revenue from contracts with customers to total noninterest income (expense).
(5)(3)Reflects changes in fair value inputs and assumptions, including market servicing costs, conditional prepayment, and default rates and discount rates. This non-cash change, which is recorded withinnoninterest income in the consolidated statements of operations and comprehensive income (loss)loss, is unrealized during the period and, therefore, has no impact on our cash flows from operations. As such, the changes in fair value attributable to assumption changes are adjusted to provide management and financial users with better visibility into the cash flows available to finance our operations.
(6)(4)Reflects changes in fair value inputs and assumptions, including conditional prepayment, and default rates and discount rates. When third parties finance our consolidated VIEs through purchasing residual interests, we receive proceeds at the time of the securitization close and, thereafter, pass along contractual cash flows to the residual interest owner. These obligations are measured at fair value on a recurring basis, with fair value changes recorded within noninterest income in the consolidated statements of operations and comprehensive income (loss).loss. The fair value change attributable to assumption changes has no impact on our initial financing proceeds, our future obligations to the residual interest owner (because future residual interest claims are limited to securitization collateral cash flows), or the general operations of our business. As such, this non-cash change in fair value during the period is adjusted to provide management and financial users with better visibility into the cash flows available to finance our operations.
The following table reconciles reportable segments total contribution profit (loss) to loss before income taxes for the years presented.taxes. Expenses not allocated to reportable segments represent items that are not considered by our CODM in evaluating segment performance or allocating resources.
| | Year Ended December 31, |
| 2021 | | 2020 | | 2019 |
| Reportable segments total contribution profit (loss) | | $ | 329,136 | | | $ | 163,522 | | | $ | (25,545) | |
| Other total net revenue (loss) | | (6,415) | | | (23,520) | | | 3,631 | |
| Intercompany technology platform expenses | | 1,863 | | | 686 | | | — | |
| | Year Ended December 31, | | | | Year Ended December 31, |
| | 2023 | | | | 2023 | | 2022 | | 2021 |
| Reportable segments total contribution profit | |
| Corporate/Other total net loss | |
| Intercompany expenses | |
| Servicing rights – change in valuation inputs or assumptions | Servicing rights – change in valuation inputs or assumptions | | (2,651) | | | (17,459) | | | 8,487 | |
| Residual interests classified as debt – change in valuation inputs or assumptions | Residual interests classified as debt – change in valuation inputs or assumptions | | (22,802) | | | (38,216) | | | (17,157) | |
| Expenses not allocated to segments: | Expenses not allocated to segments: | |
| Share-based compensation expense | Share-based compensation expense | | (239,011) | | | (99,870) | | | (60,936) | |
| Share-based compensation expense | |
| Share-based compensation expense | |
Employee-related costs(1) | |
| Depreciation and amortization expense | Depreciation and amortization expense | | (101,568) | | | (69,832) | | | (15,955) | |
| Goodwill impairment expense | |
| Fair value change of warrant liabilities | Fair value change of warrant liabilities | | (107,328) | | | (20,525) | | | 2,834 | |
Employee-related costs(1) | | (143,847) | | | (114,599) | | | (53,080) | |
Special payment(2) | Special payment(2) | | (21,181) | | | — | | | — | |
Other corporate and unallocated expenses(3) | Other corporate and unallocated expenses(3) | | (167,373) | | | (108,708) | | | (81,878) | |
| Loss before income taxes | Loss before income taxes | | $ | (481,177) | | | $ | (328,521) | | | $ | (239,599) | |
(1)Includes compensation, benefits, restructuring charges, recruiting, certain occupancy-related costs and various travel costs of executive management, certain technology groups and general and administrative functions that are not directly attributable to the reportable segments.
(2)Represents a special payment to the Series 1 preferred stockholders in connection with the Business Combination. See Note 11 for additional information.
(3)Represents corporate overhead costs that are not allocated to reportable segments, which primarily includes corporate marketing and advertising costs, tools and subscription costs, professional services costs, corporate and corporateFDIC insurance expense, as well as equity-based payments to non-employees.costs, foreign currency translation adjustments and transaction-related expenses.
As we did not have material operations outside ofGeographic Information
The following tables present total net revenue from external customers and total assets attributed to the United States and to all foreign countries in total in which we did not makeoperate. We attribute total net revenue and total assets based on the geographic disclosures pursuant to ASC 280, Segment Reporting.country of domicile of the legal entity. No single customer accounted for more than 10% of our consolidated revenues forindividual foreign country had material total net revenue during any of the periodsyears presented.
Note 19. Subsequent Events
Management of the Company performed an evaluation of subsequent events that occurred after the balance sheet date through the date of this Annual Report on Form 10-K. Our
SoFi Technologies, Inc.
SoFi Technologies, Inc.
Notes to Consolidated Financial Statements (continued)
(In Thousands, Unless Otherwise Stated and Except for Share and Per Share Data)
On January 18, 2022, we received approval fromlong-lived assets as of the Federal Reservedates indicated were not considered by management to be significant relative to total assets. The majority of our application to becomelong-lived assets were located in the United States as of the dates indicated.
| | | | | | | | | | | | | | | | | | | | |
| | Year Ended December 31, |
| | 2023 | | 2022 | | 2021 |
| United States | | $ | 2,028,112 | | | $ | 1,504,680 | | | $ | 981,705 | |
| All foreign countries | | 94,677 | | | 68,855 | | | 3,167 | |
| Total net revenue | | $ | 2,122,789 | | | $ | 1,573,535 | | | $ | 984,872 | |
| | | | | | | | | | | | | | |
| | December 31, |
| | 2023 | | 2022 |
| United States | | $ | 29,133,417 | | | $ | 17,921,296 | |
| All foreign countries | | 941,441 | | | 1,086,379 | |
| Total assets | | $ | 30,074,858 | | | $ | 19,007,675 | |
Note 21. Regulatory Capital SoFi Technologies, a bank holding company, and we received conditional approval fromSoFi Bank, a nationally chartered association, are required to comply with regulatory capital rules issued by the Federal Reserve and other U.S. banking regulators, including the OCC and FDIC. From time to completetime, we may contribute capital to SoFi Bank. We are required to manage our capital position to maintain sufficient capital to satisfy these regulatory rules and support our business activities, including the requirement to maintain minimum regulatory capital ratios in accordance with the Basel Committee on Banking Supervision standardized approach for U.S. banking organizations (U.S. Basel III). If the Federal Reserve finds that we are not “well-capitalized” or “well-managed”, we would be required to take remedial action, which may contain additional limitations or conditions relating to our activities.
The Federal Reserve and the OCC have authority to prohibit bank holding companies and banks, respectively, from paying dividends if, in their opinion, the payment of dividends would constitute an unsafe or unsound practice. Under the National Bank Act, SoFi Bank generally may, without prior approval of the OCC, declare a dividend so long as the total amount of all dividends (common and preferred), including the proposed dividend, in the current year do not exceed net income for the current year to date plus retained net income for the prior two years. However, taking into account a wide range of factors, the OCC may object and therefore prevent SoFi Bank from paying dividends to the Company. As such, as of December 31, 2023, the Bank Merger. On February 2, 2022,would not have any funds free of restrictions that are available for dividend payments. Restrictions on the ability of SoFi Bank to pay dividends to the parent company could also impact the Company’s ability to pay dividends to common stockholders.
Additionally, under the Federal Reserve’s capital rules, our bank holding company’s ability to pay dividends is restricted if we closeddo not maintain capital above the Bank Merger by acquiring allcapital conservation buffer, as discussed below. Further, a policy statement of the outstanding equity interestsFederal Reserve provides that, among other things, a bank holding company generally should not pay dividends on regulatory capital instruments if its net income for the past year is not sufficient to cover both the cash dividends and a rate of earnings retention that is consistent with the company’s capital needs, asset quality, and overall financial condition. Based on this Federal Reserve policy, as of December 31, 2023, the Company generally would not have any funds free of restrictions available for dividend payments on regulatory capital instruments.
These requirements establish required minimum ratios for CET1 risk-based capital, Tier 1 risk-based capital, total risk-based capital and a Tier 1 leverage ratio; set risk-weighting for assets and certain other items for purposes of the risk-based capital ratios; and define what qualifies as capital for purposes of meeting the capital requirements. Additionally, regulatory capital rules include a capital conservation buffer of 2.5% that is added on top of each of the minimum risk-based capital ratios in Golden Pacificorder to avoid restrictions on capital distributions and began operating Golden Pacific Bank as discretionary bonuses. In addition, the Federal Reserve and the OCC have authority to require banking organizations subject to their supervision to hold additional amounts of capital in excess of the minimum risk-based capital ratios.
SoFi Bank. Technologies, Inc.
SoFi Technologies, Inc.
Notes to Consolidated Financial Statements (continued)
(In Thousands, Unless Otherwise Stated and Except for Share and Per Share Data)
The Bank Mergerrisk- and leverage-based capital ratios and amounts are presented below:
| | | | | | | | | | | | | | | | | | | | | | | | | | | | | | | | | | | | | | |
| | December 31, 2023 | | December 31, 2022 | | | | |
| ($ in thousands) | | Amount | | Ratio | | Amount | | Ratio | | Required Minimum(1) | | Well-Capitalized Minimum(2) |
| SoFi Bank | | | | | | | | | | | | |
| CET1 risk-based capital | | $ | 3,331,616 | | | 17.3 | % | | $ | 1,162,024 | | | 14.6 | % | | 7.0 | % | | 6.5 | % |
| Tier 1 risk-based capital | | 3,331,616 | | | 17.3 | % | | 1,162,024 | | | 14.6 | % | | 8.5 | % | | 8.0 | % |
| Total risk-based capital | | 3,386,105 | | | 17.6 | % | | 1,202,429 | | | 15.1 | % | | 10.5 | % | | 10.0 | % |
| Tier 1 leverage | | 3,331,616 | | | 15.0 | % | | 1,162,024 | | | 15.3 | % | | 4.0 | % | | 5.0 | % |
| Risk-weighted assets | | 19,244,841 | | | | | 7,972,956 | | | | | | | |
| Quarterly adjusted average assets | | 22,273,285 | | | | | 7,615,481 | | | | | | | |
| SoFi Technologies | | | | | | | | | | | | |
| CET1 risk-based capital | | $ | 3,439,969 | | | 15.0 | % | | $ | 3,188,341 | | | 20.3 | % | | 7.0 | % | | n/a |
| Tier 1 risk-based capital | | 3,439,969 | | | 15.0 | % | | 3,188,341 | | | 20.3 | % | | 8.5 | % | | n/a |
| Total risk-based capital | | 3,494,458 | | | 15.3 | % | | 3,228,746 | | | 20.6 | % | | 10.5 | % | | n/a |
| Tier 1 leverage | | 3,439,969 | | | 12.8 | % | | 3,188,341 | | | 21.8 | % | | 4.0 | % | | n/a |
| Risk-weighted assets | | 22,883,185 | | | | | 15,695,217 | | | | | | | |
| Quarterly adjusted average assets | | 26,782,318 | | | | | 14,592,551 | | | | | | | |
___________________(1)Required minimums presented for risk-based capital ratios include the required capital conservation buffer.
(2)The well-capitalized minimum measure is accounted forapplicable at the bank level only.
As of December 31, 2023 and December 31, 2022, our regulatory capital ratios exceeded the thresholds required to be regarded as a business combination. See well-capitalized institution, and meet all capital adequacy requirements to which we are subject. There have been no events or conditions since December 31, 2023 that management believes would change the categorization.
Note 222. Parent Company Condensed Financial Information The following parent company condensed financial statements are prepared in accordance with Regulation S-X of the SEC, which require such disclosures when the restricted net assets of consolidated subsidiaries exceed 25% of consolidated net assets. The condensed balance sheets as of December 31, 2023 and 2022 reflect balances at SoFi Technologies, Inc. The condensed statement of operations and comprehensive loss and condensed statement of cash flows reflect the activity of Social Finance, Inc. from January 1, 2021 through the close of the Business Combination in May 2021, and reflect the activity of SoFi Technologies, Inc. subsequent to the close of the Business Combination. Refer to Note 2. Business Combinations for additional information on the regulatory approvalsBusiness Combination.
SoFi Technologies, Inc.
SoFi Technologies, Inc.
Notes to Consolidated Financial Statements (continued)
(In Thousands, Unless Otherwise Stated and Except for Share and Per Share Data)
SoFi Technologies, Inc.
Condensed Balance Sheets
(Parent Company Only)
(In Thousands, Except for Share Data)
| | | | | | | | | | | |
| December 31, |
| 2023 | | 2022 |
| Assets | | | |
| Cash and cash equivalents | $ | 201 | | | $ | 201 | |
| | | |
| Intercompany receivables | 9,245 | | | — | |
| Investments in subsidiaries | 6,407,596 | | | 5,802,861 | |
| | | |
| | | |
| Goodwill | 590,539 | | | 713,217 | |
| Intangible assets | 180,240 | | | 213,328 | |
| Other assets | 250 | | | 471 | |
| Total assets | $ | 7,188,071 | | | $ | 6,730,078 | |
| Liabilities, temporary equity and permanent equity | | | |
| Liabilities: | | | |
| Accounts payable, accruals and other liabilities | $ | 50,296 | | | $ | 21,019 | |
| Debt | 1,582,789 | | | 1,180,583 | |
| Total liabilities | 1,633,085 | | | 1,201,602 | |
Temporary equity(1): | | | |
| Redeemable preferred stock, $0.00 par value: 100,000,000 and 100,000,000 shares authorized; 3,234,000 and 3,234,000 shares issued and outstanding as of December 31, 2023 and 2022, respectively | 320,374 | | | 320,374 | |
| Permanent equity: | | | |
Common stock, $0.00 par value: 3,100,000,000 and 3,100,000,000 shares authorized; 975,861,793 and 933,896,120 shares issued and outstanding as of December 31, 2023 and 2022, respectively(2) | 97 | | | 93 | |
| Additional paid-in capital | 7,039,987 | | | 6,719,826 | |
| Accumulated other comprehensive loss | (1,209) | | | (8,296) | |
| Accumulated deficit | (1,804,263) | | | (1,503,521) | |
| Total permanent equity | 5,234,612 | | | 5,208,102 | |
| Total liabilities, temporary equity and permanent equity | $ | 7,188,071 | | | $ | 6,730,078 | |
_______________(1)Redemption amount is $323,400 as of December 31, 2023 and 2022.
(2)Includes 100,000,000 non-voting common shares authorized and no non-voting common shares issued and outstanding as of December 31, 2023 and December 31, 2022.
SoFi Technologies, Inc.
SoFi Technologies, Inc.
Notes to Consolidated Financial Statements (continued)
(In Thousands, Unless Otherwise Stated and Except for Share and Per Share Data)
SoFi Technologies, Inc.
Condensed Statements of Operations and Comprehensive Loss
(Parent Company Only)
(In Thousands)
| | | | | | | | | | | | | | | | | |
| Year Ended December 31, |
| 2023 | | 2022 | | 2021 |
| | | | | |
| | | | | |
| | | | | |
| | | | | |
| | | | | |
| | | | | |
| Interest income | $ | — | | | $ | — | | | $ | 6,279 | |
| | | | | |
| | | | | |
| | | | | |
| Interest expense | 28,258 | | | 5,075 | | | 14,926 | |
| Net interest expense | (28,258) | | | (5,075) | | | (8,647) | |
| | | | | |
| | | | | |
| | | | | |
| Noninterest income | 14,832 | | | — | | | 2,617 | |
| Total net revenue (loss) | (13,426) | | | (5,075) | | | (6,030) | |
| | | | | |
| | | | | |
| | | | | |
| | | | | |
| | | | | |
| Noninterest expense | 169,971 | | | 42,114 | | | 278,697 | |
| Loss before income taxes | (183,397) | | | (47,189) | | | (284,727) | |
| Income tax benefit | 10,696 | | | — | | | 5,294 | |
| Loss before equity in loss of subsidiaries | (172,701) | | | (47,189) | | | (279,433) | |
| Equity in loss of subsidiaries | (128,041) | | | (273,218) | | | (204,504) | |
| Net loss | $ | (300,742) | | | $ | (320,407) | | | $ | (483,937) | |
| Other comprehensive income (loss) | | | | | |
| Unrealized gains (losses) on available-for-sale debt securities, net | 6,410 | | | (7,260) | | | (1,351) | |
| Foreign currency translation adjustments, net | 677 | | | 435 | | | 46 | |
| Total other comprehensive income (loss) | 7,087 | | | (6,825) | | | (1,305) | |
| Comprehensive loss | $ | (293,655) | | | $ | (327,232) | | | $ | (485,242) | |
SoFi Technologies, Inc.
SoFi Technologies, Inc.
Notes to Consolidated Financial Statements (continued)
(In Thousands, Unless Otherwise Stated and Except for Share and Per Share Data)
SoFi Technologies, Inc.
Condensed Statements of Cash Flows
(Parent Company Only)
(In Thousands)
| | | | | | | | | | | | | | | | | |
| Year Ended December 31, |
| 2023 | | 2022 | | 2021 |
| Operating activities | | | | | |
| Net cash (used in) provided by operating activities | $ | (42,618) | | | $ | 290,298 | | | $ | (136,134) | |
| Investing activities | | | | | |
| Changes in investments in subsidiaries | $ | 79,185 | | | $ | (284,295) | | | $ | (3,231,314) | |
| Issuances of notes to subsidiaries | — | | | — | | | (312) | |
| | | | | |
| Proceeds from securitization investments | — | | | — | | | 106,994 | |
| Proceeds from non-securitization investments | — | | | — | | | 107,534 | |
| | | | | |
| Other investing activities | — | | | — | | | 13,122 | |
| Net cash provided by (used in) investing activities | $ | 79,185 | | | $ | (284,295) | | | $ | (3,003,976) | |
| Financing activities | | | | | |
| Net change in debt facilities | $ | — | | | $ | — | | | $ | 144,339 | |
| Proceeds from other debt issuances | — | | | — | | | 1,010,728 | |
| Repayment of other debt | — | | | — | | | (250,000) | |
| Taxes paid related to net share settlement of share-based awards | (15,300) | | | (8,983) | | | (42,644) | |
| Payment of redeemable preferred stock dividends | (20,213) | | | — | | | — | |
| Redemptions of redeemable common and preferred stock | — | | | — | | | (282,859) | |
| Proceeds from Business Combination and PIPE Investment | — | | | — | | | 1,989,851 | |
| Proceeds from warrant exercises | — | | | — | | | 95,047 | |
| Purchase of capped calls | — | | | — | | | (113,760) | |
| | | | | |
| | | | | |
| Other financing activities | (1,054) | | | 2,610 | | | (4,605) | |
| Net cash (used in) provided by financing activities | $ | (36,567) | | | $ | (6,373) | | | $ | 2,546,097 | |
| Effect of exchange rates on cash and cash equivalents | — | | | 571 | | | 46 | |
| Net increase (decrease) in cash, cash equivalents, restricted cash and restricted cash equivalents | $ | — | | | $ | 201 | | | $ | (593,967) | |
| Cash, cash equivalents, restricted cash and restricted cash equivalents at beginning of period | 201 | | | — | | | 593,967 | |
| Cash, cash equivalents, restricted cash and restricted cash equivalents at end of period | $ | 201 | | | $ | 201 | | | $ | — | |
| | | | | |
| | | | | |
| | | | | |
Notes to Parent Company Condensed Financial Information
Note 1. Debt
In October 2021, SoFi Technologies, Inc. issued $1.2 billion aggregate principal amount of convertible notes due 2026. In December 2023, SoFi Technologies, Inc. repurchased $88.0 million aggregate principal amount of the Bank Merger.convertible notes, which were settled through the issuance of 9,490,000 shares of common stock.
On February 19, 2022, weIn April 2023, SoFi Technologies, Inc. entered into the Technisys MergerAmended and Restated Credit Agreement, which amended and restated the Original Credit Agreement entered into by Social Finance, Inc. in September 2018 to, acquire all ofamong other things, change the outstanding equity interests in Technisys. The Technisys Merger will be accounted for as a business combination. borrower entity under the revolving credit facility to SoFi Technologies, Inc.
See Note 212. Debt for additional information on these debt arrangements.
Note 2. Temporary Equity
See Note 13. Equity for information on the Technisys Merger.redeemable preferred stock held at SoFi Technologies, Inc.
SoFi Technologies, Inc.
SoFi Technologies, Inc.
Notes to Consolidated Financial Statements (continued)
(In Thousands, Unless Otherwise Stated and Except for Share and Per Share Data)
Note 23. Subsequent Events Management of the Company performed an evaluation of subsequent events that occurred after the balance sheet date through the date of this Annual Report on Form 10-K, and determined that there were no subsequent events to report.
Item 9. Changes in and Disagreements With Accountants on Accounting and Financial Disclosure
None.
Item 9A. Controls and Procedures
Evaluation of Disclosure Controls and Procedures
Our management, with the participation of our Chief Executive Officer and Chief Financial Officer, has evaluated the effectiveness of our disclosure controls and procedures (as defined in Rules 13a-15(e) and 15d-15(e) under the Securities Exchange Act of 1934, as amended (the “Exchange Act”)) as of the end of the period covered by this Annual Report on Form 10-K. Based on that evaluation, our Chief Executive Officer and Chief Financial Officer concluded that such disclosure controls and procedures were effective as of the end of the period covered by this Annual Report on Form 10-K and designed to ensure that information required to be disclosed in our reports filed or submitted under the Exchange Act is recorded, processed, summarized and reported within the requisite time periods specified in the applicable rules and forms, and that it is accumulated and communicated to our management, including our Chief Executive Officer and Chief Financial Officer, as appropriate, to allow timely decisions regarding required disclosure. Management recognizes that any controls and procedures, no matter how well designed and operated, can provide only reasonable assurance of achieving their objectives and management necessarily applies its judgment in evaluating the cost-benefit relationship of possible controls and procedures.
Management’s Annual Report on Internal Control over Financial Reporting
As discussed elsewhereThe management of SoFi Technologies, Inc. (the “Company” or “SoFi”) is responsible for establishing and maintaining adequate internal control over financial reporting, as such term is defined in this Annual Report on Form 10-K, we completedRule 13a-15(f) under the Business Combination on May 28, 2021. PriorExchange Act. SoFi’s internal control over financial reporting is designed to provide reasonable assurance regarding the reliability of financial reporting and the preparation of the financial statements for external purposes in accordance with U.S. generally accepted accounting principles (“U.S. GAAP”).
The internal control over financial reporting includes those policies and procedures that:
•Pertain to the Business Combination, we were a special purpose acquisition company formed formaintenance of records that, in reasonable detail, accurately and fairly reflect the purposetransactions and dispositions of effecting a merger, share exchange, asset acquisition, share purchase, reorganization or similar business combination with one or more businesses and were not requiredthe assets of the Company;
•Provide reasonable assurance that transactions are recorded as necessary to maintain an effective systempermit preparation of internal controls.
Infinancial statements in accordance with the considerations pursuant to Section 215.02U.S. GAAP and that receipts and expenditures are being made only in accordance with authorizations of the SEC DivisionCompany’s management and directors; and
•Provide reasonable assurance regarding prevention or timely detection of Corporation Finance’s Regulation S-K Compliance & Disclosure Interpretations,unauthorized acquisition, use or disposition of Company assets that could have a material effect on the Company is excluding management’s report onCompany’s financial statements.
Because of its inherent limitations, internal control over financial reporting may not prevent or detect misstatements. Also, projections of any evaluation of effectiveness to future periods are subject to the risk that controls may become inadequate because of changes in conditions, or that the degree of compliance with the policies or procedures may deteriorate.
Management conducted an assessment of the effectiveness of the Company’s internal control over financial reporting as of December 31, 20212023, based on the framework in “Internal Control—Integrated Framework (2013)” issued by the Committee of Sponsoring Organizations of the Treadway Commission, commonly referred to as the “2013 Framework”. Based on this assessment, as noted below, management, with the participation of our Chief Executive Officer and Chief Financial Officer, concluded that the Company’s internal control over financial reporting was effective as of December 31, 2023.
The effectiveness of the Company’s internal control over financial reporting as of December 31, 2023, has been audited by Deloitte & Touche LLP, an attestation report from our independent registered public accounting firm.firm, as stated in their report, which appears in this Form 10-K.
Attestation
Our independent registered public accounting firm has issued an attestation report on the effectiveness of the Company’s internal control over financial reporting included herein.
Changes in Internal Control over Financial Reporting
There have not been any changes in our internal control over financial reporting (as defined in Rules 13a-15(f) and 15d-15(f) under the Exchange Act) during the quarter ended December 31, 2021,2023, that have materially affected, or are reasonably likely to materially affect, our internal control over financial reporting.
REPORT OF INDEPENDENT REGISTERED PUBLIC ACCOUNTING FIRM
To the shareholders and the Board of Directors of SoFi Technologies, Inc.
Opinion on Internal Control over Financial Reporting
We have audited the internal control over financial reporting of SoFi Technologies, Inc. and subsidiaries (the “Company”) as of December 31, 2023, based on criteria established in Internal Control — Integrated Framework (2013) issued by the Committee of Sponsoring Organizations of the Treadway Commission (COSO). In our opinion, the Company maintained, in all material respects, effective internal control over financial reporting as of December 31, 2023, based on criteria established in Internal Control — Integrated Framework (2013) issued by COSO.
We have also audited, in accordance with the standards of the Public Company Accounting Oversight Board (United States) (PCAOB), the consolidated financial statements as of and for the year ended December 31, 2023, of the Company and our report dated February 27, 2024, expressed an unqualified opinion on those financial statements.
Basis for Opinion
The Company’s management is responsible for maintaining effective internal control over financial reporting and for its assessment of the effectiveness of internal control over financial reporting, included in the accompanying Management’s Annual Report on Internal Control over Financial Reporting. Our responsibility is to express an opinion on the Company’s internal control over financial reporting based on our audit. We are a public accounting firm registered with the PCAOB and are required to be independent with respect to the Company in accordance with the U.S. federal securities laws and the applicable rules and regulations of the Securities and Exchange Commission and the PCAOB.
We conducted our audit in accordance with the standards of the PCAOB. Those standards require that we plan and perform the audit to obtain reasonable assurance about whether effective internal control over financial reporting was maintained in all material respects. Our audit included obtaining an understanding of internal control over financial reporting, assessing the risk that a material weakness exists, testing and evaluating the design and operating effectiveness of internal control based on the assessed risk, and performing such other procedures as we considered necessary in the circumstances. We believe that our audit provides a reasonable basis for our opinion.
Definition and Limitations of Internal Control over Financial Reporting
A company’s internal control over financial reporting is a process designed to provide reasonable assurance regarding the reliability of financial reporting and the preparation of financial statements for external purposes in accordance with generally accepted accounting principles. A company’s internal control over financial reporting includes those policies and procedures that (1) pertain to the maintenance of records that, in reasonable detail, accurately and fairly reflect the transactions and dispositions of the assets of the company; (2) provide reasonable assurance that transactions are recorded as necessary to permit preparation of financial statements in accordance with generally accepted accounting principles, and that receipts and expenditures of the company are being made only in accordance with authorizations of management and directors of the company; and (3) provide reasonable assurance regarding prevention or timely detection of unauthorized acquisition, use, or disposition of the company’s assets that could have a material effect on the financial statements.
Because of its inherent limitations, internal control over financial reporting may not prevent or detect misstatements. Also, projections of any evaluation of effectiveness to future periods are subject to the risk that controls may become inadequate because of changes in conditions, or that the degree of compliance with the policies or procedures may deteriorate.
| | | | | | | | |
| /s/ | Deloitte & Touche LLP | |
| San Francisco, California | |
| February 27, 2024 | |
Item 9B. Other Information
None.
Item 9C. Disclosure Regarding Foreign Jurisdictions that Prevent Inspections
None.
Part III
Item 10. Directors, Executive Officers and Corporate Governance
The information required by Item 10 is incorporated herein by reference from the Company’s definitive proxy statement for our 20222024 Annual Meeting of Stockholders (the “Proxy Statement”), which will be filed with the SEC pursuant to Regulation 14A within 120 days of the end of our 20212023 fiscal year.
The Registrant has a code of business conduct and ethics that applies to all of its employees, officers and directors. The code of business conduct and ethics is available on the Registrant’s website at www.sofi.com and the Registrant will post any amendments to, or waivers from, the code of business conduct and ethics on that website.
Item 11. Executive Compensation
The information required by Item 11 is incorporated herein by reference from the Company’s Proxy Statement, which will be filed with the SEC pursuant to Regulation 14A within 120 days of the end of our 20212023 fiscal year.
Item 12. Security Ownership of Certain Beneficial Owners and Management and Related Stockholder Matters
The information required by Item 12 is incorporated herein by reference from the Company’s Proxy Statement, which will be filed with the SEC pursuant to Regulation 14A within 120 days of the end of our 20212023 fiscal year.
Item 13. Certain Relationships and Related Transactions, and Director Independence
The information required by Item 13 is incorporated herein by reference from the Company’s Proxy Statement, which will be filed with the SEC pursuant to Regulation 14A within 120 days of the end of our 20212023 fiscal year.
Item 14. Principal Accounting Fees and Services
The information required by Item 14 is incorporated herein by reference from the Company’s Proxy Statement, which will be filed with the SEC pursuant to Regulation 14A within 120 days of the end of our 20212023 fiscal year.
Part IV
Item 15. Exhibits, Financial Statement Schedules
The following documents are filed as part of this report:
(1) Financial Statements:
(2) Financial Statement Schedules:
None.Separate financial statement schedules have been omitted either because they are not applicable or because the required information is included in the consolidated financial statements.
(3) Index to Exhibits:
The following exhibits are filed herewith, or were previously filed and are hereby incorporated by reference.
| | | | | | | | | | | | | | | | | | | | |
| Exhibit No. | | Description | Form | File Number | Date of Filing | Exhibit/Annex Number Reference |
| | | | | | |
| | | S-4 | 333-252009 | January 11, 2021 | Annex A |
| | | 8-K | 001-39606 | March 16, 2021 | 2.1 |
| | | S-1 | 333-257092 | June 14, 2021 | 2.3 |
| | | 8-K | 001-39606 | February 24, 2022 | 2.1 |
| | | 8-K | 001-39606 | June 4, 2021 | 3.1 |
| | | 8-K | 001-39606 | June 4, 2021 | 3.2 |
| | | S-4/A | 333-252009 | February 10, 2021 | 4.6 |
| | | S-4 | 333-252009 | January 11, 2021 | Annex M |
| | | 8-K | 001-39606 | October 4, 2021 | 4.1 |
| | | 8-K | 001-39606 | October 4, 2021 | 4.2 |
| | | | | | |
| | | 8-K | 001-39606 | October 4, 2021 | 10.1 |
| | | | | | | | | | | | | | | | | | | | |
| Exhibit No. | | Description | Form | File Number | Date of Filing | Exhibit/Annex Number Reference |
| | | | | | |
| | | 8-K | 001-39606 | June 4, 2021 | 10.2 |
| | | S-4 | 333-252009 | January 11, 2021 | Annex D |
| | | 8-K | 001-39606 | June 4, 2021 | 10.4 |
| | | S-4 | 333-252009 | January 11, 2021 | Annex H |
| | | 8-K | 001-39606 | June 4, 2021 | 10.5 |
| | | 8-K | 001-39606 | June 4, 2021 | 10.6 |
| | | S-4 | 333-252009 | January 11, 2021 | 10.17 |
| | | S-1 | 333-257092 | June 14, 2021 | 10.12 |
| | Revolving Credit Agreement, dated as of September 27, 2018, among Social Finance, Inc., as the Borrower, the Lenders party thereto, the Issuing Banks party thereto, Goldman Sachs Bank USA, as the Administrative Agent, and Citibank, N.A. and Goldman Sachs Bank USA, as Joint Lead Arrangers and Joint Bookrunners | S-1 | 333-257092 | June 14, 2021 | 10.13 |
| | | S-1 | 333-257092 | June 14, 2021 | 10.14 |
| | | S-1 | 333-257092 | June 14, 2021 | 10.15 |
| | | S-1 | 333-257092 | June 14, 2021 | 10.16 |
| | | S-1 | 333-257092 | June 14, 2021 | 10.17 |
| | | S-1 | 333-257092 | June 14, 2021 | 10.18 |
| | | S-1 | 333-257092 | June 14, 2021 | 10.19 |
| | | S-1 | 333-257092 | June 14, 2021 | 10.20 |
| | | S-1 | 333-257092 | June 14, 2021 | 10.21 |
| | | S-1 | 333-257092 | June 14, 2021 | 10.23 |
| | | 8-K | 001-39606 | June 4, 2021 | 10.1 |
| | | 8-K | 001-39606 | February 24, 2022 | 10.1 |
| | | 8-K | 001-39606 | February 24, 2022 | 10.2 |
| | | | | | |
| | | | | | |
| | | | | | |
| | | | | | |
| | | | | | | | | | | | | | | | | | | | |
| Exhibit No. | | Description | Form | File Number | Date of Filing | Exhibit/Annex Number Reference |
| | | | | | |
| | | | | | |
| | | | | | |
101.INS*S-4 | 333-252009 | Inline XBRL Instance Document - the instance document does not appear in the interactive data file because its XBRL tags are embedded within the Inline XBRL documentJanuary 11, 2021 | | | | |
101.SCH*Annex A | | Inline XBRL Taxonomy Extension Schema Document | | | | |
101.CAL* | | Inline XBRL Taxonomy Extension Calculation Linkbase Document | | | | |
101.LAB* | | Inline XBRL Taxonomy Extension Label Linkbase Document | | | | |
101.PRE* | | Inline XBRL Taxonomy Extension Presentation Linkbase Document | | | | |
101.DEF* | | Inline XBRL Taxonomy Extension Definition Linkbase Document | | | | |
104* | | Cover Page Interactive Data File (formatted as inline XBRL and contained in Exhibit 101) | | | | |
| | | | | | | | | | | | | | | | | | | | |
| Exhibit No. | | Description | Form | File Number | Date of Filing | Exhibit/Annex Number Reference |
| | | | | | |
| | | 8-K | 001-39606 | March 16, 2021 | 2.1 |
| | | S-1 | 333-257092 | June 14, 2021 | 2.3 |
| | | 8-K | 001-39606 | February 24, 2022 | 2.1 |
| | | 8-K | 001-39606 | June 4, 2021 | 3.1 |
| | | 8-K | 001-39606 | June 4, 2021 | 3.2 |
| | | S-4/A | 333-252009 | February 10, 2021 | 4.6 |
| | | S-4 | 333-252009 | January 11, 2021 | Annex M |
| | | 8-K | 001-39606 | October 4, 2021 | 4.1 |
| | | 8-K | 001-39606 | October 4, 2021 | 4.2 |
| | | 10-K | 001-39606 | March 1, 2022 | 4.5 |
| | | 8-K | 001-39606 | October 4, 2021 | 10.1 |
| | | 10-Q | 001-39606 | November 9, 2022 | 10.1 |
| | | S-4 | 333-252009 | January 11, 2021 | Annex D |
| | | 8-K | 001-39606 | June 4, 2021 | 10.4 |
| | | S-4 | 333-252009 | January 11, 2021 | Annex H |
| | | 8-K | 001-39606 | June 4, 2021 | 10.5 |
| | | 8-K | 001-39606 | June 4, 2021 | 10.6 |
| | | S-4 | 333-252009 | January 11, 2021 | 10.17 |
| | | 10-Q | 001-39606 | May 10, 2023 | 10.1 |
| | | S-1 | 333-257092 | June 14, 2021 | 10.12 |
| | | 10-Q | 001-39606 | November 9, 2022 | 10.2 |
| | | 10-Q | 001-39606 | May 10, 2023 | 10.2 |
| | | | | | | | | | | | | | | | | | | | |
| Exhibit No. | | Description | Form | File Number | Date of Filing | Exhibit/Annex Number Reference |
| | | | | | |
| | | S-1 | 333-257092 | June 14, 2021 | 10.14 |
| | | S-1 | 333-257092 | June 14, 2021 | 10.15 |
| | | S-1 | 333-257092 | June 14, 2021 | 10.16 |
| | | S-1 | 333-257092 | June 14, 2021 | 10.17 |
| | | S-1 | 333-257092 | June 14, 2021 | 10.18 |
| | | 10-Q | 001-39606 | May 10, 2023 | 10.3 |
| | | 10-Q | 001-39606 | May 10, 2023 | 10.4 |
| | | 10-Q | 001-39606 | May 10, 2023 | 10.5 |
| | | 8-K | 001-39606 | June 4, 2021 | 10.1 |
| | | | | | |
| | | | | | |
| | | | | | |
| | | | | | |
| | | | | | |
| | | | | | |
| | | | | | |
| 101.INS* | | Inline XBRL Instance Document - the instance document does not appear in the interactive data file because its XBRL tags are embedded within the Inline XBRL document | | | | |
| 101.SCH* | | Inline XBRL Taxonomy Extension Schema Document | | | | |
| 101.CAL* | | Inline XBRL Taxonomy Extension Calculation Linkbase Document | | | | |
| 101.LAB* | | Inline XBRL Taxonomy Extension Label Linkbase Document | | | | |
| 101.PRE* | | Inline XBRL Taxonomy Extension Presentation Linkbase Document | | | | |
| 101.DEF* | | Inline XBRL Taxonomy Extension Definition Linkbase Document | | | | |
| 104* | | Cover Page Interactive Data File (formatted as inline XBRL and contained in Exhibit 101) | | | | |
__________________* Filed herewith.
+ Schedules and exhibits have been omitted pursuant to Item 601(a)(5) or 601(b)(2) of Regulation S-K. The Registrant agrees to furnish supplementally a copy of any omitted schedule or exhibit to the SEC upon request.
† Certain confidential portions (indicated by brackets and asterisks) have been omitted from this exhibit.
Item 16. Form 10-K Summary.Summary
None.
SIGNATURES
Pursuant to the requirements of Section 13 or 15(d) of the Securities Exchange Act of 1934, the registrant has duly caused this report to be signed on its behalf by the undersigned, thereunto duly authorized.
| | | | | | | | | | | |
| | SoFi Technologies, Inc. |
| | | |
| Date: | March 1, 2022February 27, 2024 | | By:/s/ Anthony Noto |
| | | Anthony Noto |
| | | Chief Executive Officer |
Pursuant to the requirements of the Securities Exchange Act of 1934, this report has been signed below by the following persons on behalf of the registrant and in the capacities indicated as of March 1, 2022.February 27, 2024.
| | | | | | | | | | |
| Signatures | | Title | | |
| /s/ Anthony Noto | | Chief Executive Officer | | |
| Anthony Noto | | Principal Executive Officer and Director | | |
| | | | |
| /s/ Christopher Lapointe | | Chief Financial Officer | | |
| Christopher Lapointe | | Principal Financial Officer and Principal Accounting Officer | | |
| | | | |
| /s/ Tom Hutton | | Chairman of the Board of Directors | | |
| Tom Hutton | | | | |
| | | | |
| /s/ Steven Freiberg | | Vice Chairman of the Board of Directors | | |
| Steven Freiberg | | | | |
| | | | |
/s/ Ahmed Al-Hammadi | | Director | | |
Ahmed Al-Hammadi | | | | |
| | | | |
/s/ Ruzwana Bashir | | Director | | |
Ruzwana Bashir | | | | |
| | | | |
| /s/ Michael Bingle | | Director | | |
| Michael Bingle | | | | |
| | | | |
/s/ Michel CombesDana Green | | Director | | |
Michel CombesDana Green | | | | |
| | | | |
/s/ Richard CostoloJohn Hele | | Director | | |
Richard CostoloJohn Hele | | | | |
| | | | |
| /s/ Clara Liang | | Director | | |
| Clara Liang | | | | |
| | | | |
/s/ Carlos Medeiros | | Director | | |
Carlos Medeiros | | | | |
| | | | |
| /s/ Harvey Schwartz | | Director | | |
| Harvey Schwartz | | | | |
| | | | |
/s/ Clay Wilkes | | Director | | |
Clay Wilkes | | | | |
| | | | |
| /s/ Magdalena Yeşil | | Director | | |
| Magdalena Yeşil | | |
| | |
| | |
| | |
| | |