

| Delaware | ||||||||
| 83-1092072 | ||||||||
| (State or other jurisdiction of incorporation or organization) | (I.R.S. Employer Identification No.) | |||||||
| 100 Centerview Drive, Suite 300 | Nashville | Tennessee | 37214 | ||||||||
| (Address of Principal Executive Offices) | (Zip Code) |
(615) 320-9800
(Registrant’s telephone number, including area code)
Securities registered pursuant to Section 12(b) of the Act:
| Title of each class | Trading Symbol | Name of each exchange on which registered | ||||||||||||
| Common stock, par value $0.001 per share | HRT | |||||||||||||
Indicate by check mark if the registrant is a well-known seasoned issuer, as defined in Rule 405 of the Securities Act. Yes ☐ No ☒
Indicate by check mark if the registrant is not required to file reports pursuant to Section 13 or Section 15(d) of the Act. Yes ☐ No ☒
Indicate by check mark whether the Registrant (1) has filed all reports required to be filed by Section 13 or 15(d) of the Securities Exchange Act of 1934 during the preceding 12 months (or for such shorter period that the Registrant was required to file such reports), and (2) has been subject to such filing requirements for the past 90 days. Yes ☒ No ☐
Indicate by check mark whether the Registrant has submitted electronically every Interactive Data File required to be submitted pursuant to Rule 405 of Regulation S-T (§232.405 of this chapter) during the preceding 12 months (or for such shorter period that the Registrant was required to submit such files). Yes ☒ No ☐
Indicate by check mark whether the registrant is a large accelerated filer, an accelerated filer, a non-accelerated filer, a smaller reporting company or an emerging growth company. See the definitions of “large accelerated filer,” “accelerated filer,” “smaller reporting company” and “emerging growth company” in Rule 12b-2 of the Exchange Act.
Large accelerated filer☐ Accelerated filer☒ Non-accelerated filer☐ Smaller reporting company☐ Emerging growth company☒
If an emerging growth company, indicate by check mark if the registrant has elected not to use the extended transition period for complying with any new or revised financial accounting standards provided pursuant to Section 13(a) of the Exchange Act. ☐
Indicate by check mark whether the registrant has filed a report on and attestation to its management’s assessment of the effectiveness of its internal control over financial reporting under Section 404(b) of the Sarbanes-Oxley Act (15 U.S.C.7262(b)) by the registered public accounting firm that prepared or issued its audit report. ☐
If securities are registered pursuant to Section 12(b) of the Act, indicate by check mark whether the financial statements of the registrant included in the filing reflect the correction of an error to previously issued financial statements. ☐
Indicate by check mark whether any of those error corrections are restatements that required a recovery analysis of incentive-based compensation received by any of the registrant’s executive officers during the relevant recovery period pursuant to §240.10D-1(b). ☐
Indicate by check mark whether the registrant is a shell company (as defined in Rule 12b-2 of the Act): Yes ☐ No ☒
The registrant had outstanding 77,046,08667,352,961 shares of common stock as of March 2, 2023.20, 2024.
The aggregate market value of the common stock held by non-affiliates of the registrant as of the last business day of the Registrant’s most recently completed second fiscal quarter was approximately $444.9$223.2 million, based on the closing sale price as reported on the New York Stock Exchange on June 30, 2022.2023.
DOCUMENTS INCORPORATED BY REFERENCE
None.
EXPLANATORY NOTE
HireRight Holdings Corporation (“HireRight,” the “Company,” “we,” “us,” or “our”) is filing this Amendment No. 1 on Form 10-K/A (this “Amendment”) to Part III ofamend our Annual Report on Form 10-K (Items 10, 11, 12, 13 and 14) is hereby incorporated by reference to portions of the Registrant’s Proxy Statement for the Annual Meeting of Stockholders to be held in 2023. The Proxy Statement will befiscal year ended December 31, 2023, originally filed by the Registrant with the Securities and Exchange Commission no later than(the “SEC”) on March 12, 2024 (the “Original Filing”),to include Items 10, 11, 12, 13 and 14 of Part III of Form 10-K. Pursuant to General Instruction G(3) to Form 10-K, we incorporated the above-referenced items in our Form 10-K by reference to our definitive proxy statement, expecting to file such statement within 120 days after our fiscal year-end. We are filing this Amendment to provide the information required in Part III of Form 10-K because we have now determined that we will not file a definitive proxy statement containing that information within 120 days after the end of the Registrant’s fiscal year endedcovered by our Original Filing. This Amendment No. 1 also updates certain of the information included in Item 15 and the Exhibit Index of the 2023 Annual Report previously filed and the related hyperlinks in the originally filed Form 10-K to reflect the additions of the following exhibits: (i) Exhibit 10.24 Employment Agreement by and between Brian Copple and HireRight Holdings Corporation, dated October 28, 2021; (ii) Exhibit 10.25 Amendment to MOIC Options by and between Brian Copple and HireRight Holdings Corporation, dated March 19, 2022; (iii) Exhibit 10.26 Stock Option Grant Notice under the HireRight Holdings Corporation 2021 Omnibus Incentive Plan, dated March 23, 2022, for Brian Copple; (iv) Exhibit 10.27 Restricted Stock Unit Grant Notice under the HireRight Holdings Corporation 2021 Omnibus Incentive Plan, dated March 23, 2022, for Brian Copple; (v) Exhibit 10.28 MOIC Option Agreement by and between Guy Abramo and HireRight GIS Group Holdings LLC, dated December 31, 2022.3, 2018; (vi) Exhibit 10.29 Special MOIC Option Agreement by and between Guy Abramo and HireRight GIS Group Holdings LLC, dated December 3, 2018; (vii) Exhibit 10.30 MOIC Option Agreement by and between Thomas Spaeth and HireRight GIS Group Holdings LLC, dated December 3, 2018; (viii) Exhibit 10.31 MOIC Option Agreement by and between Brian Copple and HireRight GIS Group Holdings LLC, dated December 3, 2018; (ix) Exhibit 10.32 Restricted Stock Unit Grant Notice under the HireRight Holdings Corporation 2021 Omnibus Incentive Plan, dated March 20, 2023, for Guy Abramo; (x) Exhibit 10.33 Restricted Stock Unit Grant Notice under the HireRight Holdings Corporation 2021 Omnibus Incentive Plan, dated March 20, 2023, for Thomas Spaeth; (xi) Exhibit 10.34 Restricted Stock Unit Grant Notice under the HireRight Holdings Corporation 2021 Omnibus Incentive Plan, dated March 20, 2023, for Brian Copple; (xii) Exhibit 10.35 TSR Based Restricted Stock Unit Grant Notice under the HireRight Holdings Corporation 2021 Omnibus Incentive Plan, dated March 20, 2023, for Guy Abramo; (xiii) Exhibit 10.36 TSR Based Restricted Stock Unit Grant Notice under the HireRight Holdings Corporation 2021 Omnibus Incentive Plan, dated March 20, 2023, for Thomas Spaeth; (xiv) Exhibit 10.37 TSR Based Restricted Stock Unit Grant Notice under the HireRight Holdings Corporation 2021 Omnibus Incentive Plan, dated March 20, 2023, for Brian Copple; (xv) Exhibit 10.38 AEBITDA Based Retention Award Grant Notice, dated March 20, 2023, for Guy Abramo; (xvi) Exhibit 10.39 AEBITDA Based Retention Award Grant Notice, dated March 20, 2023, for Thomas Spaeth; (xvii) Exhibit 10.40 AEBITDA Based Retention Award Grant Notice, dated March 20, 2023, for Brian Copple; and (xviii) Exhibit 19.1 Insider Trading Policy.
In addition, as required by Rule 12b-15 under the Exchange Act, new certifications by our principal executive officer and principal financial officer are filed as exhibits to this Annual Report on Form 10-K/A.
FORWARD LOOKING STATEMENTS AND ADDITIONAL INFORMATION
Cautionary Note
This Amendment contains “forward-looking statements” within the United States Private Securities Litigation Reform Act of 1995 regarding the transactions contemplated by the Company contain forward-looking statements withinMerger Agreement among HireRight, Hearts Parent, LLC (“Parent”), and Hearts Merger Sub, Inc. (“Merger Sub”) (the “Proposed Transaction”), including the meaningsatisfaction of conditions to, and expected time period to consummate, the federal securities laws. You can often identifyProposed Transaction. All such forward-looking statements by their nature address matters that are uncertain and are based upon current plans, estimates, and expectations that are subject to risks, uncertainties and assumptions, many of which are beyond the factcontrol of HireRight, that they do not relate strictlycould cause actual results to historical or current facts, or by their use of wordsdiffer materially from those expressed in such as “anticipate,” “estimate,” “expect,” “project,” “forecast,” “plan,” “intend,” “believe,” “seek,” “could,” “targets,” “potential,” “may,” “will,” “should,” “can have,” “likely,” “continue,” and other terms of similar meaning in connection with any discussion of the timing or nature of future operating or financial performance or other events. Forward-looking statements mayforward-looking statements. Key factors that could cause actual results to differ materially include, but are not limited to, statements concerning our anticipated financial performance,the expected timing and likelihood of completion of the Proposed Transaction, including without limitation, revenue, profitability, net income (loss), adjusted EBITDA, adjusted EBITDA margin, adjusted net income, earnings per share, adjusted diluted earnings per share,the timing, receipt and cash flow; strategic objectives; investments in our business, including developmentterms and conditions of our technologyany required governmental and introductionregulatory approvals of new offerings; sales growth and customer relationships; our competitive differentiation; our market share and leadership position in the industry; market conditions, trends, and opportunities; future operational performance; pendingProposed Transaction; the occurrence of any event, change or threatened claims or regulatory proceedings; and factorsother circumstances that could affect these and other aspects of our business. Forward-looking statements are not guarantees. They reflect our current expectations and projections with respectgive rise to future events and are based on assumptions and estimates and subject to known and unknown risks, uncertainties and other factors, including those described in this Annual Report on Form 10-K under the headings “Risk Factors” and “Management’s Discussion and Analysis,” that may cause our actual results, performance or achievements to be materially different from expectations or results projected or implied by forward-looking statements. Following is a summary of these risk factors:
Additional Information and Where to Find It
In connection with the Proposed Transaction, HireRight has filed with the SEC a preliminary proxy statement on Schedule 14A (the “Preliminary Proxy Statement”). The definitive version of the proxy statement (the “Definitive Proxy Statement”) will be sent to the stockholders of HireRight seeking their approval of the Proposed Transaction and other related matters. HireRight and its affiliates have jointly filed a transaction statement on Schedule 13E-3 (the “Schedule 13E-3”). HireRight may also file other documents with the SEC regarding the Proposed Transaction. This communication is not a substitute for the Definitive Proxy Statement, the Schedule 13E-3 or willany other document which HireRight may file with the SecuritiesSEC.
INVESTORS AND SECURITY HOLDERS ARE URGED TO READ THE PRELIMINARY PROXY STATEMENT, THE SCHEDULE 13E-3 AND THE DEFINITIVE PROXY STATEMENT (ONCE AVAILABLE), AS WELL AS ANY OTHER RELEVANT DOCUMENTS FILED WITH THE SEC IN CONNECTION WITH THE PROPOSED TRANSACTION OR INCORPORATED BY REFERENCE THEREIN AND ANY AMENDMENTS OR SUPPLEMENTS TO THESE DOCUMENTS, BECAUSE THEY WILL CONTAIN IMPORTANT INFORMATION REGARDING HIRERIGHT, THE PROPOSED TRANSACTION AND RELATED MATTERS.
Investors and Exchange Commission (the “SEC”) completelysecurity holders may obtain free copies of these documents, including the Preliminary Proxy Statement, the Schedule 13E-3, the Definitive Proxy Statement (once available) and other documents filed with the understanding that our actual future results maySEC by HireRight through the website maintained by the SEC at http://www.sec.gov. Copies of documents filed with the SEC by HireRight will be materially different from what we expect. We qualify allmade available free of our forward-looking statementscharge by these cautionary statements.accessing HireRight’s website at https://www.hireright.com or by contacting HireRight by submitting a message at investor.relations@hireright.com.
HIRERIGHT HOLDINGS CORPORATION
AMENDMENT NO. 1 ON FORM 10-K/A
For the Fiscal Year Ended December 31, 2023
Set forth below is the name, age, position and a description of the business experience of each of our executive officers and each of our directors as of December 31, 2023:
Directors
Guy Abramo
| Age: | 63 | |||
| Director Since: | 2018 | |||
| Committees: | None | |||
| Principal Occupation | President and Chief Executive Officer | |||
| Current Term Expires: | 2025 (Class I) | |||
| Experience: | Mr. Abramo has served as member of the Board of Directors, Chief Executive Officer and President since July 2018. He joined the Company’s predecessor, HireRight GIS Group Holdings, LLC (“HGGH”), as chief executive officer n January 2018 after serving as president of Experian Consumer Services Division for seven years, overseeing the group’s strategy, direction and operation. Prior to joining Experian, Mr. Abramo served as president of Tallan, Inc., a nationwide professional services firm specializing in internet media design, business intelligence and custom software solutions. Before joining Tallan, he served for seven years as executive vice president, worldwide and chief strategy and information officer at Ingram Micro. Preceding Ingram Micro, Mr. Abramo served three years as a managing director at KPMG Consulting and the leader of the marketing intelligence consulting practice. While at KPMG, he was a member of the firms’ Technology Leadership Council and co-founder of the Center for Data Insight data mining and marketing automation lab at Northern Arizona University. Mr. Abramo is also a 12-year veteran of the Exxon Mobil Corporation. At Exxon, he held a number of positions across both operating and headquarters divisions. Mr. Abramo began his Exxon career in research and development and achieved five patents for innovative fuels and fuel additives technologies. He later served in a number of positions of increasing responsibility in the Americas Marketing and Refining Division including manager of marketing services, assistant gasoline business manager of the U.S. Division and manager of administration and controls for a major Northeastern marketing unit. Mr. Abramo earned a BS in chemical engineering from the New Jersey Institute of Technology and an MBA from Georgetown University. As the Company’s Chief Executive Officer, Mr. Abramo is a valuable member of our Board of Directors because he has a direct connection to senior management and the benefit of management’s perspective on the Company’s business and immediate strategic goals. He provides leadership, extensive knowledge of the Company, and insight on the day-to-day operation of the business. |
Venkat Bhamidipati
| Age: | 57 | |||
| Director Since: | 2023 | |||
| Committees: | Audit Committee | |||
| Principal Occupation | Founder and Principal at The Principia Group LLC | |||
| Current Term Expires: | 2024 (Class III) | |||
| Experience: | Mr. Bhamidipati has served as a member of our Board since 2023. Mr. Bhamidipati is the founder and principal at The Principia Group LLC which provides strategic consulting and advisory services. Previously he held the role of executive vice president and chief financial officer at McAfee Corp. until its acquisition in 2022. At McAfee he oversaw the finance, IT, and security operations strategy and teams that supported McAfee’s business worldwide. Before McAfee, Mr. Bhamidipati was executive vice president and chief financial officer at Providence, a healthcare company with approximately $25 billion in annual revenues, from 2017 to 2020. At Providence, he led finance and most corporate functions, including information technology, growth and corporate development, supply chain, and real estate. Before Providence, he spent 13 years at Microsoft, where he served as CFO of the Worldwide Operations Group, CFO of the Enterprise Group, and Managing Director of Business Development and Strategy. He began his career in public accounting and held finance roles at Hitachi Data Systems and Exodus Communications. Mr. Bhamidipati holds an MBA in Finance and Marketing from the Kelley School of Business at Indiana University. He is also a member of the board of directors and audit committee of Cross Country Healthcare, Inc., a leading tech-enabled workforce solutions and advisory firm serving healthcare clients and homecare, education and clinical and non-clinical healthcare professionals. Mr. Bhamidipati is a valuable member of the Board of Directors because of his deep background in executive management roles with large complex organizations, his financial management expertise and his experience in corporate development and strategy. |
James Carey
| Age: | 57 | |||
| Director Since: | 2018 | |||
| Committees: | Nominating and Governance Committee | |||
| Principal Occupation | President of Stone Point Capital (“Stone Point”) | |||
| Current Term Expires: | 2026 (Class II) | |||
| Experience: | Mr. Carey has served as a member of the Board of Directors since 2018. Mr. Carey is President of Stone Point and has been with Stone Point or its predecessor entities since 1997. Mr. Carey currently serves on the board of directors of several other Trident Fund portfolio companies, including Enstar Group Limited. Mr. Carey holds a BS from Boston College, a JD from Boston College Law School and an MBA from Duke University, Fuqua School of Business. Mr. Carey was nominated to the Board of Directors by Stone Point pursuant to the Company’s stockholder’s agreement and predecessor governance arrangements, and is a valuable member of the Board of Directors because of his private equity experience and his experience as a director of numerous private and public companies. |
Mark Dzialga
| Age: | 59 | |||
| Director Since: | 2018 | |||
| Committees: | Audit Committee | |||
| Principal Occupation | Managing Partner of Brighton Park Capital | |||
| Current Term Expires: | 2026 (Class II) | |||
| Experience: | Mr. Dzialga has served as a member of the Board of Directors since 2018 and served as Board Chair from 2018 to 2023. Mr. Dzialga is the Managing Partner of Brighton Park Capital and is a member of its Investment Committee. Prior to starting Brighton Park Capital, he was a Managing Director at General Atlantic for more than 20 years and had been a member of the firm’s Executive Committee, Portfolio Committee, and Human Resources Committee through September of 2018. He was also a member of the Investment Committee at General Atlantic from 2003 to 2018 and chaired the Investment Committee from 2007 until the end of 2017. Before joining General Atlantic in 1998, Mr. Dzialga was co-head of the High Technology Merger Group at Goldman Sachs, where he advised many of the firm’s technology clients on mergers, acquisitions and restructurings. Mr. Dzialga received an MBA from the Columbia University School of Business and a BS in Accounting from Canisius College. Mr. Dzialga is a valuable member of the Board of Directors because of his private equity experience, human resources expertise, and experience as a director of numerous public and private companies. |
Josh Feldman
| Age: | 33 | |||
| Director Since: | 2020 | |||
| Committees: | Compensation Committee and Privacy and Cybersecurity Committee | |||
| Principal Occupation | Vice President, General Atlantic | |||
| Current Term Expires: | 2025 (Class I) | |||
| Experience: | Mr. Feldman has served as a member of the Board of Directors since 2020. Mr. Feldman is a Vice President at General Atlantic and focuses on investments in the technology sector. Prior to joining General Atlantic in 2014, he was an investment banker with Goldman Sachs in the Financial Institutions Group from 2012 to 2014. Mr. Feldman serves on the board of Quizlet, a leading online learning platform. Mr. Feldman received his undergraduate degree from University of California at Berkeley and an MBA from Stanford Graduate School of Business. Mr. Feldman was nominated to the Board of Directors by General Atlantic pursuant to the Company’s stockholder’s agreement and predecessor governance arrangements, and is a valuable member of the Board of Directors because of his private equity experience and expertise evaluating potential investments in the technology sector. |
Rene Kern
| Age: | 60 | |||
| Director Since: | 2022 | |||
| Committees: | Compensation Committee and Nominating and Governance Committee | |||
| Principal Occupation | Senior Advisor to General Atlantic | |||
| Current Term Expires: | 2024 (Class III) | |||
| Experience: | Mr. Kern has served as a member of the Board of Directors since 2022. Mr. Kern is a Senior Advisor to General Atlantic. He also serves as a Director of Tory Burch, LLC, and as the Vice-Chairman of the Board of Governors of the Joseph H. Lauder Institute at the University of Pennsylvania. He is a Member of the Wharton Executive Education board, and serves on the UC Berkeley Foundation Board. Mr. Kern was Managing Director at General Atlantic from 1996 to 2021 specializing in the firm’s European and Latin American business, as well as its financial services investment activities. Prior to his work for General Atlantic, he was an investment banker at Morgan Stanley and a management consultant at Bain & Company. Mr. Kern received his undergraduate degree in business administration from the University of California, Berkeley, and an MBA from the University of Pennsylvania’s Wharton School. Mr. Kern was nominated to the Board of Directors by General Atlantic pursuant to the Company’s stockholder’s agreement, and is a valuable member of the Board of Directors because of his substantial financial and business expertise, international investment experience, and experience as a director and advisor of a diverse group of companies. |
Larry Kutscher
| Age: | 59 | |||
| Director Since: | 2023 | |||
| Committees: | Nominating and Governance Committee, Chair & Board Chair | |||
| Principal Occupation | Chief Executive Officer of A Place For Mom, Inc. | |||
| Current Term Expires: | 2026 (Class II) | |||
| Experience: | Mr. Kutscher has served as a member of the Board of Directors since 2023 and was appointed to serve as Chairman of our Board of Directors in April 2023. Mr. Kutscher is currently the Chief Executive Officer of A Place For Mom, Inc., the leading technology-driven senior living referral platform and advisory service. Mr. Kutscher was previously the Chief Executive Officer of TravelClick, a cloud-based software solution for the hospitality industry. Mr. Kutscher also served as Chief Executive Officer of Register.com, General Manager of the Small Business Group at Dun & Bradstreet, and Managing Director with Goldman Sachs Wealth Management, after beginning his career with several leadership positions at American Express. Mr. Kutscher currently serves on the Board of Directors of A Place For Mom and Wish, one of the world’s largest mobile e-commerce platforms, serving as an independent director and a member of the audit committee. He previously served on the Boards of Thayer Ventures Acquisition Corporation (now Inspirato Incorporated) and ReachLocal. Mr. Kutscher earned a bachelor’s degree in political science from Brown University and an MBA from Columbia Business School. Mr. Kutscher was nominated to the Board of Directors by General Atlantic pursuant to the Company’s stockholder’s agreement, and is a valuable member of the Board of Directors because of his substantial executive leadership experience driving transformational growth for data and technology companies. |
James LaPlaine
| Age: | 52 | |||
| Director Since: | 2021 | |||
| Committees: | Privacy and Cybersecurity Committee, Chair | |||
| Principal Occupation | Consultant | |||
| Current Term Expires: | 2026 (Class II) | |||
| Experience: | Mr. LaPlaine has served as a member of the Board of Directors since 2021. From January 2018 to July 2021, Mr. LaPlaine was EVP and Chief Technology Officer of Red Ventures, LLC, a portfolio of digital companies that use an online marketplace to connect consumers and brands, where he was responsible for all technology choices and engineering staff including information technology operations, security data and software development. Mr. LaPlaine continued as a Strategic Advisor to Red Ventures, LLC from July 2021 through September 2022. Before joining Red Ventures, LLC, he held various management and executive-level positions at AOL over a period of sixteen years, including Chief Information Officer & SVP, Technology Operations from August 2015 to August 2017. As CIO and SVP, Mr. LaPlaine was responsible for all data center infrastructure and cloud usage, IT systems, consumer identity systems, and back office platforms. While at AOL, Mr. LaPlaine also served as Executive Director at Technology Business Management Council from November 2014 to November 2019. Mr. LaPlaine has been a Senior Advisor to Brighton Park Capital since July 2021. Mr. LaPlaine holds a degree in Computer Science from State University of New York at Oswego. Mr. LaPlaine is a valuable member of the Board of Directors because of his experience in cybersecurity and technology services. |
James Matthews
| Age: | 57 | |||
| Director Since: | 2018 | |||
| Committees: | Compensation Committee, Chair and Privacy and Cybersecurity Committee | |||
| Principal Occupation | Managing Director, Stone Point | |||
| Current Term Expires: | 2024 (Class III) | |||
| Experience: | Mr. Matthews has served as a member of the Board of Directors since 2018. Mr. Matthews is a Managing Director of Stone Point. He joined Stone Point in 2011 from Evercore Inc., where he was a Senior Managing Director and Co-Head of Private Equity. From 2000 to 2007, Mr. Matthews was with Welsh, Carson, Anderson & Stowe, where he was a General Partner and focused on investments in the information services and business services sectors. Previously, Mr. Matthews was a General Partner of J. H. Whitney & Co. and started his career as an Analyst in the mergers and acquisitions group of Salomon Brothers Inc. Mr. Matthews currently serves on the Board of Directors of several other Trident Fund portfolio companies, including Eagle Point Credit Company, Inc. and Eagle Point Income Company, Inc. He holds a BS from Boston College and an MBA from Harvard Business School. Mr. Matthews was nominated to the Board of Directors by Stone Point pursuant to the Company’s stockholder’s agreement and predecessor governance arrangements, and is a valuable member of the Board of Directors because of his experiences in private equity and in leadership roles of other companies. |
Jill Smart
| Age: | 64 | |||
| Director Since: | 2018 | |||
| Committees: | Compensation Committee | |||
| Principal Occupation | Consultant | |||
| Current Term Expires: | 2024 (Class III) | |||
| Experience: | Ms. Smart has served as a member of the Board of Directors since 2018. From 2015-2023, Ms. Smart served as President of the National Academy of Human Resources (NAHR), an organization that recognizes individuals and institutions for professional achievement in human resources by election as a Fellow of the National Academy of Human Resources. Previously, Ms. Smart spent more than 33 years at Accenture, a global professional services company, before retiring in 2014. For 10 years, she served as Accenture’s Chief Human Resources Officer. Ms. Smart has served as a non-employee director of EPAM’s board since July 2016. She is the founder and CEO of JBSmart Consulting, LLC., a member of the Cerity Partners Advisory Board, and serves on the Boards of Directors of AlixPartners, a financial advisory and global consulting firm and World Kinect Corporation, a publicly traded global energy management company. Ms. Smart received an MBA from the University of Chicago and a BS in business administration from the University of Illinois. Ms. Smart is a valuable member of the Board of Directors because of her human resources and business services expertise. |
Lisa Troe
| Age: | 62 | |||
| Director Since: | 2021 | |||
| Committees: | Audit Committee, Chair and Privacy and Cybersecurity Committee | |||
| Principal Occupation | Director | |||
| Current Term Expires: | 2025 (Class I) | |||
| Experience: | Ms. Troe has served as a member of the Board of Directors since 2021. From 2014 through 2021, she was a Senior Managing Director of Athena Advisors LLC, an independent advisory firm she co-founded to provide forensic and litigation, financial disclosure, and business strategy consulting services. From 2005 through 2013, Ms. Troe was a Senior Managing Director at business advisory firm, FTI Consulting, Inc. From 1995 through 2005, Ms. Troe held positions of increasing responsibility at the Pacific regional office of the U.S. SEC Division of Enforcement, including six years as Regional Chief Enforcement Accountant. Previously, she held accounting positions in public and private companies and was a senior auditor at Deloitte. Ms. Troe has served on the board of Expro Group Holdings N.V., an oilfield services company (since 2021) and served on the boards of Magnite, Inc., a digital advertising technology company (2014-2023); and Stem, Inc., a clean energy solutions company (2021-2023). Ms. Troe is NACD Directorship Certified and a CPA. She received a BS in business administration from University of Colorado. Ms. Troe brings to the Board of Directors an extensive background in public company governance and oversight, enterprise risk management, and public company accounting, financial reporting and disclosure. She has diverse experience with a wide range of industries, allowing her to bring additional perspective to a board. |
Executive Officers
The table below sets forth biographical information for each of our executive officers not discussed above, as of the filing date hereof:
Guy Abramo
| Age: | 63 | |||
| Principal Occupation | President and Chief Executive Officer | |||
| Experience: | ||||
For the biography of Guy Abramo, please see “Item 10. Directors, Executive Officers and Corporate Governance—Directors.” |
Tom Spaeth
| Age: | 56 | |||
| Principal Occupation | Chief Financial Officer | |||
| Experience: | Mr. Spaeth has served as the Company’s Chief Financial Officer since December 2014. Mr. Spaeth has more than 20 years of experience in corporate finance, accounting, investment banking, operations, and business development in the technology, consumer, and banking industries. Mr. Spaeth was an executive officer of HireRight, Inc., which filed a bankruptcy petition as an affiliated debtor of Altegrity, Inc., in February 2015. Prior to HireRight, Mr. Spaeth served as Chief Financial Officer at UBM Technology, where he oversaw accounting, finance, sales operations, client delivery, and IT. Mr. Spaeth also has experience with corporate finance, consulting, and investment roles at Motorola, Ernst & Young, and Deutsche Bank. Mr. Spaeth holds a BS in business administration and finance from the University of Wisconsin and an MBA from the Kellogg Graduate School of Management, Northwestern University. |
Stephen Spears
| Age: | 55 | |||
| Principal Occupation | Chief Revenue Officer | |||
| Experience: | Mr. Spears has served as the Company’s Chief Revenue Officer since 2023. Mr. Spears has more than 20 years of extensive go-to-market and leadership experience, including overseeing the strategy, performance, and alignment of revenue operations across multiple organizations at scale and managing initiatives to support customers and partners. He is an experienced Chief Revenue Officer, having held that position at SAP SuccessFactors from 2017 to 2020 and most recently at Avaya from 2020 to 2023. Mr. Spears spent most of his career at SAP, where he held various executive management roles including Senior Vice President of the HANA Enterprise Cloud, Senior Vice President of ITM and Middleware and other various senior-level executive positions. Mr. Spears also brings a global mindset to the role having lived and worked in both Europe and Asia. Mr. Spears received his Bachelor of Arts degree from Brigham Young University. |
Jeff Mullins
| Age: | 51 | |||
| Principal Occupation | Chief Technology Officer | |||
| Experience: | Mr. Mullins has served as the Company’s Chief Technology Officer since 2024. Mr. Mullins brings over 25 years of experience in technology leadership to the role. His career has been marked by a commitment to service excellence and innovation, with a focus on developing solutions that significantly enhance business capabilities and guiding organizations through the complexities of digital transformation. With a background that spans consulting and corporate leadership roles, Mr. Mullins has a proven track record of partnering with customers and business leaders to craft strategies and implement effective technology, process and organizational changes. Mr. Mullins’ expertise is further underscored by his tenure in executive roles at companies such as ADP, where he served as Vice President of Enterprise Applications and Hosting Operations from 2004 to 2014, Microsoft as a technology strategist from 2014 to 2017, Blue Chip Consulting Group from 2017 to 2018, and at AlixPartners, where he served as a management consultant from 2018 to 2024, focusing on optimizing operating models and driving operational improvements. |
Laurie Blanton
| Age: | 71 | |||
| Principal Occupation | Chief Accounting Officer | |||
| Experience: | Ms. Blanton has served as the Company’s Chief Accounting Officer since 2021; previously she served as the Company’s Vice President and Global Controller from April 2020. Before joining the Company, Ms. Blanton was Senior Vice President of Accounting at FabFitFun, Inc., from September 2019 to March 2020, and before FabFitFun she was the Vice President and Corporate Controller at Crocs, Inc. from September 2016 to September 2019. Ms. Blanton served as the Vice President and Global Corporate Controller at Quiksilver, Inc., from February 2014 to August 2016. Prior to her tenure at Quiksilver, she held various leadership and finance positions at other public companies. She began her career in public accounting at Arthur Young and Company (which merged with Ernst & Whinney in 1989 to create Ernst & Young LLP), from 1984 to 1989. Ms. Blanton is a California Certified Public Accountant and holds a Bachelor of Business Administration degree in accounting from the University of Michigan. |
Brian Copple
| Age: | 63 | |||
| Principal Occupation | General Counsel and Secretary | |||
| Experience: | Mr. Copple has served as the Company’s General Counsel since 2018. From July 2013 to July 2018, Mr. Copple was General Counsel for The Rubicon Project, Inc., now called Magnite, a publicly-traded company that automates the purchase and sale of digital media advertising. Previously, Mr. Copple served as General Counsel for Eclipsys Corporation, a publicly-traded enterprise provider of electronic medical record software and related services for hospitals, and for Exult, Inc. a publicly-traded provider of human resources business process outsourcing and related finance and administration services to Global 500 companies. Mr. Copple started his career with Gibson, Dunn & Crutcher LLP, where he practiced for eleven years, including three years as a partner, and where he had a broad transactional and corporate practice, representing public and private companies in various industries. Mr. Copple earned his JD and MBA degrees at UCLA, and his undergraduate degree from Stanford University. |
Julie Romero
| Age: | 49 | |||
| Principal Occupation | Chief Human Resources Officer | |||
| Experience: | Ms. Romero has served as the Company’s Chief Human Resources Officer since 2022 and is responsible for leading the global Human Resources function, including supporting business transformation and modernization. Prior to joining the Company, Ms. Romero served as Global Succession & Development lead at WPP from 2019 to 2022. She also made an impact at Navigant between 2015 and 2019, where she led Human Capital for their Healthcare segment; Accenture, where she worked in human resources as a global Talent Strategist; Accenture Consulting as a Talent & Organization Performance Manager; and at Disney as an Organization Development internal consultant. Ms. Romero holds a Master’s Degree in Organization Development from Bowling Green State University and a Bachelor of Arts degree in Psychology from Ohio University. |
Jim Daxner
| Age: | 57 | |||
| Principal Occupation | EVP, Global Head of Product | |||
| Experience: | Mr. Daxner has served as the Company’s Executive Vice President, Global Head of Product since 2023, with responsibility for driving revenue and providing strategic vision for the organization around HireRight eCommerce solutions and data acquisition partnerships. He joined HireRight’s predecessor GIS in 2018 as Chief Product Officer and has also served HireRight as Chief Digital Officer from 2020 to 2024. Prior to HireRight, Mr. Daxner served as Senior Sales Vice President, Americas at Survey Sampling International from 2015 to 2017. There, Mr. Daxner led the $285 million Americas sales team and oversaw business development, sales and account management for 3,500+ clients. Prior to that role, Mr. Daxner was the executive vice president of membership at Affinion, where he held a variety of leadership positions including senior vice president of sales and account management, and vice president of credit card marketing, and held full responsibility for sales, account management, product and marketing in North America and Canada. Mr. Daxner graduated summa cum laude from DeVry University with a Bachelor of Science in business management. |
Mary O’Loughlin
| Age: | 51 | |||
| Principal Occupation | EVP Americas | |||
| Experience: | Ms. O’Loughlin has served as the Company’s Executive Vice President, Americas since 2023. Ms. O’Loughlin has broad experience in the healthcare and background screening industries and, since joining HireRight in 2009, has also led the Strategic Alliances and Product Management teams. Ms. O’Loughlin’s focus has always been on improving the candidate experience and, under her leadership, HireRight has won numerous awards for its unparalleled candidate experience. Ms. O’Loughlin has also expanded the depth and breadth of HireRight’s Applicant Tracking System integrations. Previously, Ms. O’Loughlin spent over 10 years in the healthcare industry in a variety of companies and roles ranging from Vice President at UnitedHealth Group to the co-founder of a Webby Award-winning healthcare start-up. While at UnitedHealth Group, she launched the Secure Horizons partnership with Wal-Mart and was Chief of Staff for the AARP relationship. Ms. O’Loughlin holds a Master of Business Administration degree from the Wharton School, University of Pennsylvania, and a bachelor’s degree from Bowdoin College. |
Mike Ensor
| Age: | 45 | |||
| Principal Occupation | SVP, Global Head of Operations | |||
| Experience: | Mr. Ensor has served as the Company’s Senior Vice President, Global Head of Operations since 2023. In this role, Mr. Ensor has the ultimate responsibility for building and driving the organization's operational functions to meet customer requirements, while implementing continuous improvement processes to encourage sustainable growth and scalability. Mr. Ensor joined HireRight in 2020, originally overseeing operational activities for the Americas with concerted efforts on aligning organizational structure and future global footprint. Before HireRight, Mr. Ensor had a 20+ year career spanning various operational leadership roles in both the background screening and medical device industries, at organizations including Sterling Check, Scott Fetzer Co. and St. Jude Medical. Mike earned a Bachelor of Science in Biomedical Engineering from Tulane University and an MBA from the Coles College of Business at Kennesaw State University. |
Family Relationships and Arrangements
There are no family relationships between any director, executive officer, or person nominated or chosen to be a director or officer and, to the best of our knowledge, none of our directors or executive officers has, during the past ten years, been involved in any legal proceedings which are required to be disclosed pursuant to the rules and regulations of the SEC, except as stated above. In connection with our Initial Public Offering in 2021, the Company entered into a Stockholders Agreement which gave investment funds managed by each of General Atlantic and Stone Point Capital (together, “Principal Stockholders”) the right to designate nominees for election to the Board of Directors until such time as any Principal Stockholder, directly or indirectly, ceased to beneficially own at least 10% of the Company’s Common Stock then outstanding. The Principal Shareholders each beneficially own more than 10% of the Common Stock of the Company. As a result, Josh Feldman and Rene Kern are nominee directors of General Atlantic, and Jim Matthews and Jim Carey are nominee directors of Stone Point. Other than the foregoing, there are no arrangements or understandings between a director and any other person pursuant to which such person was elected as director.
Section 16(a) Reports
Section 16(a) of the Exchange Act requires our directors, executive officers and greater than 10% stockholders to file reports of holdings and transactions in our shares with the SEC. For the fiscal year ended December 31, 2023, to our knowledge and based solely on a review of copies of reports furnished to us, or written representations, we believe that the applicable reporting requirements of Section 16(a) have been satisfied.
Corporate Governance
Controlled Company
The Company’s Common Stock is listed on the New York Stock Exchange (“NYSE”). Because the Principal Stockholders control more than 50% of our combined voting power, the Company is considered a “controlled company” for the purposes of NYSE’s rules and corporate governance standards. As a “controlled company,” the Company is exempt from certain corporate governance requirements, including (1) those that would otherwise require the Board of Directors to have a majority of “independent directors” as such term is defined by applicable NYSE rules, (2) those that would require that the Company establish a compensation committee composed entirely of “independent directors” with a written charter addressing the committee’s purpose and responsibilities and (3) those that would require that the Company have a nominating and governance committee consisting entirely of “independent directors” with a written charter addressing the committee’s purpose and responsibilities. Although we are not currently relying and do not currently intend to rely upon these exemptions, we may decide to rely upon any or all of these exemptions in the future as long as the Company remains a controlled company.
Board of Directors Leadership Structure and Board of Directors’ Role in Risk Oversight
The Board of Directors has an oversight role, as a whole and at the committee level, in overseeing management of the Company’s risks. The Board of Directors regularly reviews information regarding the Company’s credit, liquidity and operations, as well as the risks associated with each. The Compensation Committee is responsible for overseeing the management of risks relating to employee compensation plans and arrangements and the Nominating and Governance Committee oversees risks associated with the Company’s governance. The Privacy and Cybersecurity Committee oversees the management of information security and certain operational compliance risks, including those related to the Company’s operation as a consumer reporting agency. The Audit Committee provides general oversight for the Company’s enterprise risk management framework and the Company’s policies on risk assessment and risk management and oversees the management of financial risks. While each committee is responsible for evaluating certain risks and overseeing the management of such risks, the entire Board of Directors will be regularly informed through committee reports about such risks.
The Chair of the Board of Directors and our Chief Executive Officer are currently separate. The Board of Directors does not currently have a policy as to whether the role of Chair of the Board of Directors and the Chief Executive Officer should be separate. The Board of Directors believes that the Company and its stockholders are best served by maintaining the flexibility to determine whether the Chair and Chief Executive Officer positions should be separated or combined at a given point in time in order to provide appropriate leadership for the Company at that time. Pursuant to the Company’s Governance Guidelines, if the Chair is not an independent director and the Company ceases to be a controlled entity, the Board shall appoint a Lead Independent Director who must be independent.
The Board of Directors understands that no single approach to board leadership is universally accepted and that the appropriate leadership structure may vary based on several factors, such as a company’s size, industry, operations, history and culture. Accordingly, the Board of Directors, with the assistance of the Nominating and Governance Committee, determines its leadership structure as deemed appropriate in light of these factors and the current environment.
Board and Committee Meetings
Following the announcement on November 17, 2023 by the Principal Stockholders of their intention to work together to explore a potential strategic transaction between the Principal Stockholders and the Company, the four members of the Board who are affiliated with the Principal Stockholders (“Sponsor-Affiliated Directors”) were recused from subsequent Board meetings in order to avoid potential influence over the Board process related to the Proposed Transaction by these four members of the Board. In fiscal 2023, excluding Board meetings from which the Sponsor-Affiliated Directors were recused, the Board of Directors held three Board meetings and 23 Committee meetings. Each of our directors other than Sponsor-Affiliated Directors attended over 75% of the aggregate of the total number of meetings of the Board of Directors and the total number of meetings of all committees of the Board on which the director served, and each Sponsor-Affiliated Director attended over 75% of the aggregate number of meetings of the Board of Directors from which the director was not recused and the total number of meetings held by all committees of the Board on which the director served. For more information about the Proposed Transaction see CERTAIN RELATIONSHIPS AND RELATED TRANSACTIONS, AND DIRECTOR INDEPENDENCE - Take-Private Merger Agreement.
The Board of Directors has four committees:
| • | Audit; |
| • | Compensation; |
| • | Nominating and Governance; and |
| • | Privacy and Cybersecurity |
The Audit, Compensation, Nominating and Governance, and Privacy and Cybersecurity committees operate under written charters which are available at the Company’s website at https://ir.hireright.com/corporate-governance/governance-documents. Committee charters are also available in print upon the written request of any stockholder. The current committee membership of our Board of Directors is as set forth below.
| | Director | | Audit Committee | | | Compensation Committee | | | Nominating and Governance Committee | | | Privacy and Cybersecurity Committee | |
| | Guy Abramo | | | | | | | | | ||||
| | Venkat Bhamidipati | | X | | | | | | | | |||
| | James Carey | | | | | | X | | | | |||
| | Mark Dzialga | | X | | | | | | | | |||
| | Josh Feldman | | | | X | | | | | X | | ||
| | Rene Kern | | | | X | | | X | | | | ||
| | Larry Kutscher, Chair | | | | | | C | | | | |||
| | James LaPlaine | | | | | | | | C | | |||
| | James Matthews | | | | C | | | | | X | | ||
| | Jill Smart | | | | X | | | | | | |||
| | Lisa Troe | | C | | | | | | | X | |
C = Chair
Audit Committee
The Audit Committee held a total of eight meetings in 2023. Our Audit Committee consists of Lisa Troe, as chair, Venkat Bhamidipati, and Mark Dzialga. The Board of Directors has determined that each member of the Audit Committee meets the independence requirements of Rule 10A-3 under the Exchange Act and the applicable listing standards of the NYSE and that each member of the Audit Committee is an “audit committee financial expert” as defined in Item 407(d)(5)(ii) of Regulation S-K promulgated under the Securities Act of 1933, as amended (the “Securities Act”). The designation of “audit committee financial expert” does not impose any duties, obligations or liabilities that are greater than are generally imposed on non-expert members of our Audit Committee and the Board of Directors.
Our Audit Committee’s principal responsibilities include:
appointing, approving the compensation of, and assessing the qualifications, performance and independence of our independent registered public accounting firm;
pre-approving audit and permissible non-audit services, and the terms of such services, to be provided by our independent registered public accounting firm;
reviewing our policies on risk assessment and risk management;
reviewing and discussing with management our annual audited and quarterly unaudited financial statements and related disclosures as well as critical accounting policies and practices used by us;
reviewing the adequacy of our internal control over financial reporting and our internal audit function;
establishing policies and procedures for the receipt and retention of accounting-related complaints and concerns;
recommending to the Board of Directors whether our audited financial statements shall be included in thisour Annual Report on Form 10-K,10-K;
overseeing and discussing with management the implementation, compliance and effectiveness of the Company’s compliance and ethics programs;
reviewing the Company’s enterprise risk management framework;
overseeing the Company’s procedures to handle whistleblower complaints;
preparing the Audit Committee report required by the rules of the SEC to be included in our annual proxy statement;
reviewing all related party transactions for potential conflict of interest situations and approving all such transactions (other than if a Special Committee is appointed to review the related party transaction);
reviewing and discussing with management our earnings releases and scripts generally; and
annually reviewing and reassessing the adequacy of the committee charter in its compliance with the listing requirements of the New York Stock Exchange.
Compensation Committee
The Compensation Committee held seven meetings in 2023. Our Compensation Committee consists of James Matthews, as chair, Josh Feldman, Rene Kern and Jill Smart. The principal responsibilities of the Compensation Committee include:
overseeing the Company’s overall compensation philosophy policies and programs;
periodically reviewing and approving corporate goals and objectives relevant to the compensation of our chief executive officer and other senior management personnel, as appropriate;
evaluating the performance of our chief executive officer in light of such corporate goals and objectives and determining and approving the compensation of our chief executive officer and other senior management personnel, as appropriate;
approving any employment and severance arrangements for the chief executive officer and other senior management personnel as the Board of Directors or the Compensation Committee may determine from time to time;
reviewing and discussing with management the compensation discussion and analysis to be included in our annual proxy statement or Annual Report on Form 10-K;
overseeing and administering our compensation, benefit and similar plans;
overseeing and discussing with management the Company’s organization design and workforce development programs;
appointing, compensating and overseeing the work of any compensation consultant, legal counsel or other advisor retained by the Compensation Committee;
conducting the independence assessment outlined in rules with respect to any compensation consultant, legal counsel or other advisor retained by the Compensation Committee; and
annually reviewing and reassessing the adequacy of the committee charter in its compliance with the listing requirements of the New York Stock Exchange.
Nominating and Governance Committee
The Nominating and Governance Committee held four meetings in 2023. Our Nominating and Governance Committee consists of Larry Kutscher, as chair, James Carey, and Rene Kern. The principal responsibilities of the Nominating and Governance Committee include:
developing and recommending to the Board of Directors criteria for board and committee membership;
identifying and recommending to the Board of Directors the persons to be nominated for election as directors and to each of the Board of Directors’ committees;
reviewing director independence and any conflicts of interest;
overseeing and reviewing annually the adequacy of the Company’s corporate policies and guidelines regarding corporate governance, corporation communications, insider trading, stockholder communications, political activities, participation in trade organizations, outside board service by employees and compliance therewith;
overseeing management succession planning;
overseeing the Company’s policies and practice on corporate social responsibility, environmental matters;
reviewing and recommending to the Board of Directors the functions, duties and compositions of the committees of the Board of Directors;
reviewing and recommending Board of Directors process matters;
developing orientation programs for new director and continuing education programs;
reviewing and discussing with management, as appropriate, the Company’s disclosure relating to the above matters; and
annually reviewing and reassessing the adequacy of the committee charter in its compliance with the listing requirements of the New York Stock Exchange.
Privacy and Cybersecurity Committee
The Privacy and Cybersecurity Committee held four meetings in 2023. The Privacy and Cybersecurity Committee consists of James LaPlaine, as chair, Josh Feldman, James Matthews and Lisa Troe. The Privacy and Cybersecurity Committee’s responsibilities are as follows:
overseeing the Company’s compliance with global data privacy and security laws applicable to the data the Company receives and uses;
reviewing the Company’s policies and controls for identifying, assessing and mitigating information and cybersecurity risks;
reviewing and discussing with management the Company’s policies and plans related to disaster recovery, business continuity and cybersecurity insurance policies;
overseeing and reviewing management’s response to material cybersecurity and privacy incidents or breaches;
overseeing and reviewing management’s response to material cybersecurity and privacy incidents or breaches;
reviewing and discussing with management the Company’s plans for adoption and application of industry standards related to cybersecurity and privacy; and
annually reviewing and reassessing the adequacy of the committee charter.
Compensation Committee Interlocks and Insider Participation
During fiscal year 2023, the members of the Compensation Committee included Mr. Feldman, Mr. Kern, Mr. Matthews, and Ms. Smart none of whom was an officer or employee of the Company. Ms. Smart joined the Compensation Committee in February 2022 and Mr. Kern joined the Compensation Committee in August 2022. Josh Feldman joined the Compensation Committee in April 2023.
None of our executive officers currently serves, or in the past fiscal year has served, as a member of a board of directors or as a member of a compensation or similar committee of any entity that has one or more executive officers who also served on the Company’s Board of Directors or Compensation Committee. Except as described in the section entitled “Certain Relationships and Related Person Transactions” below, none of the members of the Compensation Committee had or has any relationships with the Company that are required to be disclosed under Item 404 of Regulation S-K.
Identifying and Evaluating Candidates for the Board of Directors
The Nominating and Governance Committee is responsible for oversight of the composition of the Board of Directors and the recommendation of director candidates to the full Board, to be appointed by the Board of Directors or nominated by the Board of Directors for election by the Company’s stockholders, as the case may be. The Nominating and Governance Committee may rely upon personal contacts and professional search firms as well as stockholder recommendations to identify appropriate candidates for service on the Board of Directors. Candidates are evaluated through personal interviews with members of the Board and management as well as personal and professional reference checks.
Subject to contractual nomination rights of the Company’s stockholders as set forth in the Company’s Stockholders Agreement, all nominees for directorship will be evaluated by the Nominating and Governance Committee or the Board of Directors in accordance with the following criteria and any other criteria that may be identified by the Board of Directors or a Board Committee, if appropriate, and in accordance with the procedures set forth in the Nominating and Governance Committee’s charter.
Background. The Board seeks members whose professional and personal backgrounds and experience contribute meaningfully to a diverse and robust aggregated set of skills and perspectives across the Board. The Board uses self-assessment processes and the Board Composition Matrix reproduced below to help evaluate the effectiveness of Board recruitment in meeting these objectives.
Simultaneous Service. The Board recognizes the benefit of having members with experience serving on the boards of other companies, as well as the importance of all members dedicating sufficient time to their service on the Company’s Board. The Board’s view is that the appropriate number of directorships varies depending upon each individual’s personal situation, the demands of the various boards, and other circumstances. Therefore, the Board evaluates these matters and establishes limits as appropriate on a case-by-case basis for each individual director or candidate, and before appointing or endorsing a new director, the Board must conclude that such person’s other time commitments will not interfere with effective service as a director of the Company. In general, subject to exceptions as determined by the Board with the recommendation of the Nominating and Governance Committee:
No director should serve on more than three other public company boards.
No director who is the Chief Executive Officer of another public company should serve on more than one other public company board, aside from the board of his/her own company.
Before accepting a position on another public company board or audit committee, a director must notify the Nominating and Governance Committee, which will consider whether the acceptance of that position would compromise the director’s ability to perform in accordance with his or her responsibilities as a director of the Company.
Financial Literacy. Directors should know how to read and understand fundamental financial statements and how to use them in evaluating the financial performance of the Company.
Character. Directors should possess all of the following personal characteristics:
| • | Integrity: Directors should demonstrate high ethical standards and integrity in their personal and professional dealings; |
| • | Experience: Directors should have broad training and experience at the policy-making or strategic level, and expertise that is useful to the Company and complementary to the background and experience of other Board members, so that a useful balance of members on the Board can be achieved and maintained; |
| • | Judgment: Directors should possess the ability to provide wise and thoughtful counsel on a broad range of issues; and |
| • | High Performance Standards: Directors should have a history of achievements which reflects high standards for themselves and others. |
Stockholder Recommendations. Stockholders may recommend director candidates for consideration by the Nominating and Governance Committee. To have a candidate considered by the Nominating and Governance Committee, a stockholder must submit the recommendation in writing and must include the following information:
The name and address of the stockholder, as they appear on the Company’s books and records, and evidence of the stockholder’s ownership of Company stock, including the class or series and number of shares owned and the length of time of ownership;
A description of all arrangements or understandings between the stockholder and each candidate pursuant to which the nomination is being made;
The name of the candidate, the candidate’s resume or a listing of his or her qualifications to be a director of the Company and the person’s consent to be named as a director if nominated by the Board of Directors; and
Such other information regarding each proposed candidate required under the bylaws of the Company and as would be required to be included in a proxy statement under the rules of the SEC if such candidate had been nominated by the Board of Directors.
Board Composition Matrix
The Board understands the importance of maintaining a membership with a variety of skills, experience and perspectives that creates an effective forum to provide oversight and strategic counsel to the Company’s management. The following matrix summarizes areas of knowledge, experience, and attributes as self-reported by the members of the Board as well as each member’s tenure and independence classification. Although not required, the Board and management believe that including the matrix will enhance investors’ understanding of the Company’s board composition. The matrix is not intended to be an exhaustive list of all skills and experiences of the Board members but is intended to illustrate the diversity and depth of the collective experiences and skills of our Board.
| | | Abramo | | | Carey | | | Dzialga | | | Feldman | | | Kern | | | LaPlaine | | | Matthews | | | Smart | | | Troe | | | Kutscher | | | Bhamidipati | |
Skills, Experience, and Attributes | ||||||||||||||||||||||||||||||||||
| Industry Experience | | | | | | | | | | | | | | | | | | | | | | | |||||||||||
| Background Screening | | | x | | | | | | | | | | | | | | | x | | | | | | | |||||||||
| Recruiting/Staffing | | | | | | | | | | | | | | | | | x | | | | | | | ||||||||||
| Credit Bureau | | | x | | | | | | | | | | | | | | | | | | | x | | | |||||||||
| HR Services | | | | | | | x | | | | | | | | | | | x | | | | | | | |||||||||
| Technology | | | x | | | | | | | x | | | x | | | x | | | | | x | | | x | | | | | x | ||||
| Technology Enabled Services | | | x | | | x | | | x | | | | | x | | | x | | | x | | | x | | | x | | | x | | | x | |
| Consumer | | | x | | | x | | | x | | | | | x | | | | | | | | | | | x | | | x | |||||
| Academia | | | | | | | | | | | | | | | | | x | | | | | | | ||||||||||
| Business Experience and Skills | ||||||||||||||||||||||||||||||||||
| C-Suite Executive | x | x | x | x | x | |||||||||||||||||||||||||||||
| Public Company Board | x | x | x | x | x | x | x | x | x | |||||||||||||||||||||||||
| International | x | x | x | x | x | x | ||||||||||||||||||||||||||||
| Business Operations | x | x | x | x | ||||||||||||||||||||||||||||||
| Strategic Planning | x | x | x | x | x | x | x | x | ||||||||||||||||||||||||||
| Governmental/Regulatory | x | x | x | |||||||||||||||||||||||||||||||
| Human Capital/Personnel Management | x | x | ||||||||||||||||||||||||||||||||
| Legal | x | |||||||||||||||||||||||||||||||||
| Corporate Governance, Compliance, Ethics | x | x | x | x |
| Investor Relations Experience | | | x | | | | | x | | | | | x | | | | | x | | | x | | | x | | | x | | | x | |||
| Risk Management | | | x | | | x | | | | | | | | | | | x | | | | | x | | | | | x | ||||||
| Marketing | | | x | | | | | | | | | | | x | | | | | x | | | | | x | | | |||||||
| Financial Literacy | | | x | | | x | | | x | | | x | | | x | | | | | x | | | x | | | x | | | x | | | x | |
| Financial Accounting (e.g. Audit Cte Fin Expert) | | | | | | | | | | | x | | | | | x | | | | | x | | | x | | | x | ||||||
| M&A | | | | | x | | | x | | | x | | | x | | | x | | | x | | | | | | | x | | | ||||
| Capital Markets | | | | | x | | | x | | | x | | | x | | | | | x | | | | | | | | | ||||||
| | | | | | | | | | | | | | | | | | | | | | | ||||||||||||
| Demographics | | | | | | | | | | | | | | | | | | | | | | | |||||||||||
| Asian (other than Indian/South Asian) | | | | | | | | | | | | | | | | | | | | | | | |||||||||||
| Black/African American | | | | | | | | | | | | | | | | | | | | | | | |||||||||||
| Hispanic/Latin American | | | | | | | | | | | | | | | | | | | | | | | |||||||||||
| Indian/South Asian | | | | | | | | | | | | | | | | | | | | | | | x | ||||||||||
| Middle Eastern/North African | | | | | | | | | | | | | | | | | | | | | | | |||||||||||
| Native American/Alaskan Native | | | | | | | | | | | | | | | | | | | | | | | |||||||||||
| Native Hawaiian/Other Pacific Islander | | | | | | | | | | | | | | | | | | | | | | | |||||||||||
| White/Caucasian | | | x | | | x | | | x | | | x | | | x | | | x | | | x | | | x | | | x | | | x | | | |
| Male | | | x | | | x | | | x | | | x | | | x | | | x | | | x | | | | | | | x | | | x | ||
| Female | x | x | ||||||||||||||||||||||||||||||||
| Non-binary | ||||||||||||||||||||||||||||||||||
Independence3 | x | x | x | x | x | x | x | x | x | x | ||||||||||||||||||||||||
| Tenure (in years) | 6 | 6 | 6 | 4 | 2 | 3 | 6 | 6 | 3 | 1 | 1 |
Code of Business Conduct and Ethics and Corporate Governance Guidelines
The Board of Directors has adopted a Code of Business Conduct and Ethics that applies to all of the Company’s directors, officers and employees and is intended to comply with the relevant listing requirements for a code of business conduct as well as qualify as a “code of ethics” as defined by the rules of the SEC. The Code of Business Conduct and Ethics contains general guidelines for conducting the Company’s business consistent with the highest standards of business ethics. The Company intends to disclose future amendments to certain provisions of its Code of Business Conduct and Ethics, or waivers of such provisions applicable to any principal executive officer, principal financial officer, principal accounting officer and controller, or persons performing similar functions, and its directors. The current Code of Business Conduct and Ethics and any amendments are available on our website at https://ir.hireright.com/corporate-governance/governance-documents.
The Board of Directors has also adopted Corporate Governance Guidelines that address significant issues of corporate governance and set forth procedures by which the Company’s officers and Board of Directors carry out their respective responsibilities. These guidelines are available for viewing on the Company’s website at https://ir.hireright.com/corporate-governance/governance-documents. The Company will also provide the Corporate Governance Guidelines, free of charge, to stockholders who request them. Such requests should be directed to the Office of the Corporate Secretary, at HireRight Holdings Corporation, 100 Centerview Drive, Suite 300, Nashville, TN 37214.
Insider Policy and Policy on Hedging Transactions
The Board has adopted an Insider Trading Policy that, among other things, prohibits directors, officers and employees of the Company, and their designees, from purchasing any financial instruments (including prepaid variable forward contracts, equity swaps, collars and exchange funds) or otherwise engaging in transactions that are designed to or have the effect of hedging or offsetting any decrease in the market value of the Company’s equity securities, whether they are (1) granted by the Company as part of compensation; or (2) otherwise held, directly or indirectly. The policy also prohibits purchasing securities of the Company on margin or pledge, or otherwise granting a security interest in, securities of the Company; selling Company securities short (i.e., selling stock not owned and borrowing the shares to make delivery); buying or selling puts, calls, options or other derivatives in respect of securities of the Company.
Executive Sessions of Non-Management Directors
The non-management directors of the Company meet in executive sessions without management on a regular basis.
Principal Stockholder Approval of Certain Matters
As long as funds managed by General Atlantic and Stone Point beneficially own a majority of the Company’s outstanding Common Stock, General Atlantic and Stone Point will be able to control all matters requiring stockholder approval, including the election of directors, amendment of our certificate of incorporation, and certain corporate transactions. See “Certain Relationships and Related Transactions.”
Communications with the Board of Directors
Stockholders and other interested parties desiring to communicate directly with the full Board of Directors, the Audit Committee, the non-management directors as a group or with any individual director or directors may do so by sending such communication in writing, addressed to the attention of the intended recipient(s), HireRight Holdings Corporation, c/o Mr. Brian Copple, Secretary, 100 Centerview Drive, Suite 300, Nashville, TN 37214. Interested parties may communicate anonymously and/or confidentially if they desire. All communications received that relate to accounting, internal accounting controls or auditing matters will be referred to the chairman of the Audit Committee unless the contextcommunication is otherwise requires, referencesaddressed. All other communications received will be forwarded to “we,” “us,” “our,” the “Company,” and similar references refer: (1) following the consummationappropriate director or directors.
Introduction
This section provides an overview of our conversionexecutive compensation program, including a narrative description of the material factors necessary to understand the information disclosed in the Summary Compensation Table below. For fiscal year 2023, our named executive officers are:
Guy Abramo, our President and Chief Executive Officer
Thomas Spaeth, our Chief Financial Officer
Brian Copple, our General Counsel and Secretary
The compensation program for our named executive officers consists principally of the following elements: base salary; performance-based cash bonus; and equity-based incentive compensation. We also provide general employee benefits, as well as severance benefits.
Summary Compensation Table
The following table shows the compensation earned by our named executive officers for the fiscal years ended December 31, 2023, and 2022.
| Name and Principal Position | Year | Salary($) | Stock Awards($)(1) | Option Awards($)(2) | Non-Equity Incentive Plan Compensation($)(3) | All Other Compensation($)(4) | Total ($) | ||||||||||||||||||
Guy Abramo President &Chief Executive Officer | 2023 | 700,000 | 9,077,000 | — | 700,000 | 57,502 | 10,534,502 | ||||||||||||||||||
| 2022 | 615,769 | 3,885,000 | 1,749,999 | 678,332 | 55,301 | 6,984,401 | |||||||||||||||||||
| |||||||||||||||||||||||||
Thomas Spaeth Chief Financial Officer | 2023 | 475,000 | 4,200,000 | — | 285,000 | 13,200 | 4,973,200 | ||||||||||||||||||
| 2022 | 475,000 | 1,664,987 | 749,996 | 313,500 | 12,200 | 3,215683 | |||||||||||||||||||
| |||||||||||||||||||||||||
Brian Copple General Counsel & Secretary | 2023 | 390,000 | 2,775,000 | — | 234,000 | 13,200 | 3,412,200 | ||||||||||||||||||
| 2022 | 390,000 | 1,387,489 | 624,997 | 258,000 | 12,200 | 2,672,686 | |||||||||||||||||||
| (1) | Represents the aggregate grant date fair value of performance and service-based restricted stock units (“RSUs”) granted in 2023 and 2022 under our 2021 Omnibus Equity Incentive Plan (the “Omnibus Incentive Plan”) computed in accordance with Financial Accounting Standards Board (“FASB”) Accounting Standards Codification (“ASC”) Topic 718, Compensation—Stock Compensation. Assumptions used in calculating these amounts are described in Note 20 of our audited financial statements for the fiscal year ended December 31, 2023, included in our fiscal 2023 Annual Report on Form 10-K. The 2023 value shown for each of the named executive officers relates to annual equity compensation awards and special long-term retention equity awards. Half of the Dollar-denominated value of the annual awards was granted as service-based RSUs vesting annually over four years, and the other half of the Dollar-denominated value of the annual awards was granted as performance-based restricted stock units (“PSUs”) vesting based upon attainment of target levels of total stockholder return (“TSR”) as of the third-anniversary of the grant date. The special long-term retention awards were granted as PSUs that (i) qualified for vesting based 50% upon attainment of 2023 target levels of in-year adjusted earnings before interest, taxes, depreciation and amortization (“AEBITDA”) and 50% upon attainment of target levels of run-rate AEBITDA giving effect to margin-improvement initiatives implemented in 2023 but not yet fully reflected in actual in-year AEBITDA results; and (ii) as to the PSUs that qualified for vesting, actually vest in equal 50% installments on the first and second anniversaries of the qualification determination date, subject to continued service. The special long-term retention awards qualified with respect to 97.25% of the underlying shares, which are now subject to service-based vesting as described above. The entire 2022 values shown for Messrs. Abramo, Spaeth and Copple relate to PSUs that would have qualified for service-based vesting 50% in March 2024 and 50% March 2025 based upon attainment of specified levels of 2022 AEBITDA. The minimum threshold level of 2022 AEBITDA required for these performance stock awards to qualify for vesting was not attained, and accordingly these performance stock units lapsed in their entirety and were canceled with no vesting. |
| (2) | Represents the aggregate grant date fair value of performance and service-based stock options granted in 2022 computed in accordance with FASB ASC Topic 718. Assumptions used in calculating these amounts are described in Note 19 of our audited financial statements for the fiscal year ended December 31, 2022, included in our fiscal 2022 Annual Report on Form 10-K. The 2022 values shown for Messrs. Abramo, Spaeth and Copple relate to options that would have qualified for service-based vesting 50% in March 2024 and 50% March 2025 based upon attainment of specified levels of 2022 AEBITDA. The minimum threshold level of 2022 AEBITDA required for these performance stock option awards to qualify for vesting was not attained, and accordingly these performance stock options lapsed in their entirety and were canceled with no vesting. There were no options granted to the named executive officers for fiscal year 2023. |
| (3) | Represents the cash incentive payments earned by the named executive officers under our 2023 Annual Incentive Plan. For additional information please see the section entitled “—Non-Equity Incentive Plan Performance and Payments.” |
| (4) | Amounts set forth in the “All Other Compensation” column for 2023 reflect the amounts shown in the table below. |
401(k) Matching Contributions($) | Housing Allowance($) | Car Allowance($) | Total ($) | |||||||||||||
| Guy Abramo | 13,200 | 24,052 | 20,250 | 57,502 | ||||||||||||
| Thomas Spaeth | 13,200 | — | — | 13,200 | ||||||||||||
| Brian Copple | 13,200 | — | — | 13,200 | ||||||||||||
Employment Agreements with our Named Executive Officers
We have employment agreements with our named executive officers, the material terms of which are as follows:
| • | Term. The term of each employment agreement began on October 28, 2021 and will end on the earliest of (a) the executive’s death or termination by the Company due to “disability,” (b) termination by the Company for or without “cause” or (c) resignation by the executive for or without “good reason” (as such terms are defined in each employment agreement). |
| • | Location. The named executive officer is based at our principal office in Nashville, Tennessee or any mutually agreed location. |
| • | Reporting. Mr. Abramo’s duties and responsibility are determined and assigned to Mr. Abramo by our Board of Directors. The other named executive officers report directly to Mr. Abramo. |
| • | Compensation. The agreements provide for base salaries and target annual bonuses as follows: Mr. Abramo’s agreement provides for a base salary of $700,000 and a target annual bonus equal to 100% of his base salary; Mr. Spaeth’s agreement provides for a base salary of $475,000 and a target annual bonus of 60% of base salary; and Mr. Copple’s agreement provides for a base salary of $390,000 and a target annual bonus of 60% of base salary. For each executive, the actual amount of the annual bonus will be determined based on achievement of Company and/or individual performance criteria, subject to the executive’s employment through the date of payment. |
| • | Restrictive Covenants. Each employment agreement also includes covenants relating to non-competition and non-solicitation of employees and customers (which apply for one year after termination of employment), perpetual confidentiality and assignment of intellectual property. The restrictive covenants expire on the date of a “change in control termination” (see definition below under “Potential Payments Upon Termination of Employment or Change in Control”). |
| • | Benefit Participation. Our named executive officers are entitled to participate in all of the employee benefit and fringe benefit plans and arrangements that are generally available to senior executives of the Company and receive reimbursement for reasonable business-related expenses. |
| • | Severance Benefits. Each employment agreement provides for severance benefits if the executive officer’s employment ceases as a result of termination by the Company without cause or resignation by the executive officer for good reason. See “Potential Payments Upon Termination of Employment or Change in Control” below. |
Base Salary and Target Non-equity Incentive Compensation
We pay base salaries to attract, recruit and retain qualified employees. The base salaries received by our named executive officers in 2023 are shown in the “Salary” column of the Summary Compensation Table above. In addition to base salary, each of our named executive officers was eligible to earn non-equity incentive compensation (i.e. a cash bonus) for 2023 under our Annual Incentive Plan in a target amount equal to a Delaware corporationpercentage of the executive’s base salary for the year. These target amounts were 100% for Mr. Abramo, 60% for Mr. Spaeth, and 60% for Mr. Copple. Base salaries and target non-equity incentive compensation for our named executive officers are set by the Compensation Committee by reference to similar amounts paid by a group of publicly-traded peer companies assembled with the advice of the Compensation Committee’s independent compensation consultant for benchmarking purposes. Our Compensation Committee increased base salaries for our named executive officers as follows effective as of April 1, 2024: $721,000 for Mr. Abramo, $489,000 for Mr. Spaeth, and $402,000 for Mr. Copple. Target percentages for non-equity incentive compensation did not change. Current total cash compensation, comprising base salary and target non-equity incentive compensation is consistent with the median range for the peer group.
Non-Equity Incentive Plan Performance and Payments
Funding for 2023 non-equity incentive compensation for the named executive officers and other management-level participants in the Company’s 2023 Annual Incentive Plan was based 70% on October 15, 2021financial performance metrics and 30% on individual or strategic measures and board discretion. The financial metrics portion was based 50% upon attainment of 2023 target levels of in-year adjusted earnings before interest, taxes, depreciation and amortization (“AEBITDA”) , and 50% upon attainment of target levels of run-rate adjusted AEBITDA giving effect to margin-improvement initiatives implemented in connection with2023 but not yet fully reflected in actual AEBITDA results. The portion based upon in-year AEBITDA provided for plan funding at 50% of the aggregate target of incentive payments for all participants in the plan if the Company had 2023 in-year AEBITDA at a minimum threshold of $175,000,000 after bonus expense, 100% of target if the Company had 2023 in-year AEBITDA at a target level of $180,000,000 after bonus expense, and 175% of target if the Company had 2023 in-year AEBITDA at a maximum threshold of $200,000,000 before bonus expense. The portion based upon run-rate AEBITDA provided for plan funding at 50% of the aggregate target of incentive payments for all participants in the plan if the Company had 2023 run-rate AEBITDA at a minimum threshold of $185,000,000 after bonus expense, 100% of target if the Company had 2023 run-rate AEBITDA at a target level of $195,000,000 after bonus expense, and 175% of target if the Company had 2023 run-rate AEBITDA at a maximum threshold of $210,000,000 before bonus expense. In each case funding between threshold and target levels was determined using straight-line interpolation. The plan did not provide for funding at in-year or run-rate AEBITDA below the applicable minimum threshold, and the plan did not provide for funding in excess of 175% of target even if in-year or run-rate AEBITDA exceeded the applicable maximum threshold.
The bonus funding is an aggregate pool for all participants. The actual bonus paid to each participant could be lower or higher (up to 175% of the participant’s target amount) based on the participant’s individual performance. Actual AEBITDA achievement for 2023 was $180,358,000 after bonus expense, resulting in bonus funding at 100% of the aggregate target amount for all participants in the Annual Incentive Plan. Based on this achieved funding and individual performance, the Compensation Committee authorized payment of non-equity incentive compensation for 2023 for each of our named executive officers in an amount equal to 100% of the executive’s target amount. The amounts of these payments are shown in the “Non-Equity Incentive Plan Compensation” column of the Summary Compensation Table above.
Equity Incentive Compensation
We provide equity-based incentive compensation to our named executive officers because it links our long-term results achieved for our stockholders and the rewards provided to named executive officers, thereby ensuring that the officers have a continuing stake in our long-term success.
Pre-IPO Equity Awards
Before the Company’s initial public offering to HireRight Holdings Corporation, and (2) prioron October 28, 2021, equity awards were issued pursuant to the completion of such conversion, to HireRight GIS Group Holdings LLC. See LLC Equity Incentive Plan (the “EIP“Item 8. Financial Statements and Supplementary Data - Note 1 — Organization, Basis of Presentation and Consolidation, and Significant Accounting Policies” in this Annual Report on Form 10-K for further information.
Company’s predecessor HireRight GIS Group Holdings LLC (“HGGH”HGGH”),. In connection with the initial public offering, the Company implemented its Omnibus Incentive Plan. Beginning October 28, 2021, all equity awards have been made only under the Omnibus Plan; the EIP continues only for purposes of governing awards made before the initial public offering and still outstanding.
In 2018, each of our named executive officers received an option to purchase units of HGGH under the EIP, with 50% of each option vesting over four years based on continued service, and the remaining 50% vesting based on achievement by the Company’s private equity investors of specified cash returns on their investment in the Company (the multiple of invested capital or “MOIC Options”). Mr. Abramo also received an additional MOIC Option that was formedto vest 100% based on achievement of the specified cash return goals. These 2018 option awards were the only equity awards made to the named executive officers before the Company’s initial public offering on October 28, 2021.
IPO Equity Awards
In connection with the IPO, these awards under the EIP were converted into options to purchase shares of the Company’s common stock. In March 2022 the private equity investors had sold none of their shares in July 2018the Company and none of the MOIC Options had vested. At that time, the Compensation Committee approved modifying the MOIC Options to vest based upon continued service through the end of 2024. The goal of the modification was to increase the retention value of the MOIC Options, and adding three years of service-based vesting effectively extended their vesting period to more than seven years.
Further in connection with the initial public offering, each of the named executive officers received equity awards denominated in Dollars as follows: Mr. Abramo, $6,125,000; Mr. Spaeth, $1,900,000; and Mr. Copple, $1,525,000. Half of the Dollar amount for each recipient was issued in the form of options to purchase shares of our common stock, and the other half of the Dollar amount for each recipient was issued in the form of RSUs covering shares of our common stock. The actual number of options and RSUs issued to each recipient was determined by dividing the Dollar amount of such awards by their grant date fair value accounting cost, resulting in the following awards: Mr. Abramo, 161,184 RSUs and an option to purchase 524,808 shares of common stock; Mr. Spaeth, 50,000 RSUs and an option to purchase 162,797 shares of common stock; and Mr. Copple, 40,131 RSUs and an option to purchase 130,666 shares of common stock. The exercise price of the options was $19.00 per share, equaling the initial public offering price. The options and RSUs vest over four years from the grant date based on continued service, subject to acceleration of vesting under certain circumstances including as described under “Severance Benefits” below. At termination of a recipient’s employment, all options that have not vested and do not vest as part of severance benefits will terminate and all vested but unexercised options will terminate if not exercised within 90 days, provided that if, on the last day of such 90-day period, the exercise price per share of the option is less than the fair market value of a share of our common stock and trading in our common stock is prohibited under our insider-trading policy, this 90-day period will be extended until the 30th day following the expiration of such prohibition. In any event, to the extent not exercised or earlier terminated, the options will expire on the tenth anniversary of their grant date.
Annual Equity Awards and Special Long-Term Equity Awards
In March 2023 each named executive officer received two annual performance-based equity awards, and one special long-term equity award. The annual awards consisted of time-based RSUs vesting over four years subject to continued service, and performance-based PSUs vesting on the third anniversary of grant based on the achievement of certain specified levels of Total Shareholder Return ("TSR”) -- a market condition related to the achievement of stock price targets of the Company's common stock. The TSR PSUs vest with respect to 75% of the underlying shares if the ending share value (based on a 30-day trailing average) is at least $19.08, 100% of the underlying shares if the ending share value is $21.80, and 125% of the underlying shares if the ending share value is $24.53, vesting between those points based upon linear interpolation. The Dollar-denominated values of the annual awards were as follows, with each amount split evenly between the RSUs and the TSR PSUs: Mr. Abramo, $3,827,000; Mr. Spaeth, $1,200,000; and Mr. Copple, $900,000. The number of shares underlying each award was calculated by dividing the Dollar-denominated value for the award by the accounting cost per share for the award. The AEBITDA PSUs had a grant-date fair value of $10.90 per unit and the TSR PSUs had a grant-date fair value of $5.67 per unit based on a Monte Carlo valuation model. These values translated to the following awards: Mr. Abramo, 337,477 shares underlying the TSR PSUs and 175,550 shares underlying the RSUs; Mr. Spaeth, 105,820 shares underlying the TSR PSUs and 55,045 shares underlying the RSUs; and Mr. Copple, 79,365 shares underlying the TSR PSUs and 41,284 shares underlying the RSUs.
The special long-term equity awards consisted of PSUs that (i) qualified for vesting based 50% upon attainment of 2023 target levels of actual in-year AEBITDA and 50% upon attainment of target levels of run-rate AEBITDA giving effect to margin-improvement initiatives implemented in 2023 but not yet fully reflected in actual in-year AEBITDA results; and (ii) as to the PSUs that qualified for vesting, actually vest in equal 50% installments on the first and second anniversaries of the qualification determination date, subject to continued service. The Dollar-denominated values of the special long-term equity awards were as follows: Mr. Abramo, $5,250,000; Mr. Spaeth, $3,000,000; and Mr. Copple, $1,875,000. The number of shares underlying each award was calculated by dividing the Dollar-denominated value for the award by the accounting cost per share of $10.90 for the award. These values translated to the following awards: Mr. Abramo, 481,651 shares; Mr. Spaeth, 275,229 shares; and Mr. Copple, 172,018 shares. The special long-term retention awards qualified with respect to 97.25% of the underlying shares based upon actual levels of in-year and run-rate AEBITDA achievement, and those qualified shares are now subject to service-based vesting as described above.
The goals of these awards were to (i) align the interests of the named executive officers with stockholders by rewarding the named executive officers for direct increases in stock price and for attainment of AEBITDA results that were expected to contribute to increased value of the Company’s stock; and (ii) to provide three years of retention.
For more information about the equity awards described above, see the Outstanding Equity Awards at Fiscal Year-End 2023 table below.
Retirement Benefits
We sponsor a 401(k) plan, which is a qualified retirement plan offered to all eligible employees, including our named executive officers, and which permits eligible employees to elect to defer a portion of their compensation on a pre-tax basis. Under the 401(k) plan, we provide a company match of 100% of the first 4% of eligible compensation contributed by each employee. We do not maintain any defined benefit pension plans or any nonqualified deferred compensation plans.
Employee Stock Purchase Plan
The Company maintains an Employee Stock Purchase Plan (the “ESPP”) under which participants make after-tax contributions to the ESPP during each six-month offering period, and those accumulated contributions are applied at the end of each offering period to purchase shares of the Company’s common stock at an amount equal to 85% of the fair market value of a share on (i) the purchase date or (ii) the offering date, whichever amount is lower. The named executive officers are eligible to participate in the ESPP on the same terms as other employees.
Employee Benefits
Our named executive officers participate in the employee benefit programs generally available to other Company employees, including group term life insurance premium coverage of one-times salary up to $250,000. Other than payment of housing and car allowances for Mr. Abramo, the Company does not provide special executive benefits to our named executive officers.
Outstanding Equity Awards at Fiscal 2023 Year End
The following table provides information about the outstanding equity awards held by our named executive officers as of December 31, 2023.
| Option Awards | Stock Awards | |||||||||||||||||
| Name | Grant Date | Number of Securities Underlying Unexercised Options Exercisable (#) | Number of Securities Underlying Unexercised Options Unexercisable (#) | Option Exercise Price ($) | Option Expiration Date | Number of Shares or Units of Stock That Have Not Vested (#)(1) | Market Value of Shares or Units of Stock That Have Not Vested ($)(2) | Equity Incentive Plan Awards: Number of Unearned Shares That Have Not Vested (#)(3) | Equity Incentive Plan Awards: Market or Payout Value of Unearned Shares That Have Not Vested ($)(2) | |||||||||
| Guy Abramo | 03/20/2023 | — | — | — | — | 175,550 | 2,361,148 | |||||||||||
| 03/20/2023 | — | — | — | — | — | — | 337,477 | 4,539,066 | ||||||||||
| 03/20/2023 | — | — | — | — | — | — | 468,405 | 6,300,047 | ||||||||||
| | 10/28/2021(4) | | 262,404 | | 262,404 | | 19.00 | | 10/28/2031 | | — | | — | | — | | — | |
| | 10/28/2021 | | — | | — | | — | | — | | 80,592 | | 1,083,962 | | — | | — | |
| | 12/3/2018(5) | | 190,560 | | 95,281 | | 15.97 | | 7/12/2028 | | — | | — | | — | | — | |
| | 12/3/2018(5) | | 381,121 | | 190,561 | | 15.97 | | 1/15/2028 | | — | | — | | — | | — | |
| | 12/3/2018(6) | | 571,683 | | — | | 15.97 | | 1/15/2028 | | — | | — | | — | | — | |
| Thomas Spaeth | 03/20/2023 | — | — | — | — | — | — | 267,660 | 3,600,029 | |||||||||
| 03/20/2023 | — | — | — | — | — | — | 105,820 | 1,423,279 | ||||||||||
| 03/20/2023 | — | — | — | — | 55,045 | 740,355 | — | — | ||||||||||
| | 10/28/2021(4) | | 81,398 | | 81,398 | | 19.00 | | 10/28/2031 | | — | | — | | — | | — | |
| | 10/28/2021 | | — | | — | | — | | — | | 25,000 | | 336,250 | | — | | — | |
| | 12/3/2018(5) | | 76,224 | | 38,112 | | 15.97 | | 7/12/2028 | | — | | — | | — | | — | |
| | 12/3/2018(6) | | 114,336 | | — | | 15.97 | | 7/12/2028 | | — | | — | | — | | — | |
| Brian Copple | 03/20/2023 | — | — | — | — | — | — | 167,287 | 2,250,010 | |||||||||
| 03/20/2023 | — | — | — | — | — | — | 79,365 | 1,067,459 | ||||||||||
| 03/20/2023 | — | — | — | — | 41,284 | 555,270 | — | — | ||||||||||
| | 10/28/2021(4) | | 65,334 | | 65,334 | | 19.00 | | 10/28/2031 | | — | | — | | — | | — | |
| | 10/28/2021 | | — | | — | | — | | — | | 20,066 | | 269,888 | | — | | — | |
| | 12/3/2018(5) | | 57,168 | | 28,584 | | 15.97 | | 7/12/2028 | | — | | — | | — | | — | |
| | 12/3/2018(6) | | 85,752 | | — | | 15.97 | | 7/12/2028 | | — | | — | | — | | — | |
| (1) | The restricted stock units listed in this column and granted on 10/28/21 were issued in connection with the Company's initial public offering with a four-year service-based vesting schedule. They vested with respect to 25% of the underlying shares on each of November 20, 2022 and November 20, 2023, and are scheduled to vest with respect to the remaining 50% of the underlying shares in two equal installments on November 20 of each of 2024, and 2025, subject generally to continued employment through each vesting date. The restricted stock units listed in this column and granted on 3/20/23 were issued as part of annual equity compensation and vest in four equal installments on May 20 of each of 2024, 2025, 2026 and 2027, subject generally to continued service through each vesting date. |
| (2) | Represents the fair market value of the shares underlying the RSU or PSUs as of December 31, 2023, based on the closing price of Common Stock, as reported on the NYSE, of $13.45 on December 29, 2023. |
| (3) | The awards listed in this column in the amounts of 337,477 for Mr. Abramo, 105,820 for Mr. Spaeth, and 79,365 for Mr. Copple are annual awards in the form of PSUs that would vest based upon attainment of target levels of total stockholder return as of the third-anniversary of the grant date. The awards listed in this column in the amounts of 468,405 for Mr. Abramo, 267,660 for Mr. Spaeth, and 167,287 for Mr. Copple are long-term incentive awards that (i) qualify for vesting based 50% upon attainment of 2023 target levels of in-year AEBITDA and 50% upon attainment of target levels of run-rate AEBITDA giving effect to margin-improvement initiatives implemented in 2023 but not yet fully reflected in actual in-year AEBITDA results; and (ii) as to the PSUs that qualify for vesting, actually vest in equal 50% installments on the first and second anniversaries of the qualification determination date, subject to continued service through each vesting date. The long-term retention awards qualified with respect to 97.25% of the underlying shares, which are now subject to service-based vesting as described above. |
| (4) | These stock options were issued in connection with the Company’s initial public offering with a four-year service-based vesting schedule. They vested with respect to 25% of the underlying shares on the first anniversary of their grant date, and are scheduled to vest with respect to the remaining 75% of the underlying shares in 12 equal quarterly installments ending on the fourth anniversary of their grant date, subject generally to continued employment through each vesting date. |
| (5) | These options were originally issued following the combination of HireRight and GIS to vest as a function of attainment by the Company’s private equity investors of specified levels of cash-on-cash return on their investments in the Company. In March 2022 the private equity investors had sold none of their shares in the Company and none of these options had vested. At that time, the Compensation Committee approved modifying them to vest based upon continued service over the ensuing three years in 12 equal quarterly installments ending on December 31, 2024. |
| (6) | These are service-based options issued following the combination of HireRight and GIS. The options issued to Mr. Abramo were fully vested as of January 15, 2022, the fourth anniversary of commencement of his service as Chief Executive Officer of GIS. The options issued to Messrs. Spaeth and Copple were fully vested as of July 12, 2022, the fourth anniversary of the combination of HireRight and GIS. |
Potential Payments Upon Termination of Employment or Change in Control
Severance Benefits
Mr. Abramo is eligible for severance benefits under his employment agreement, and Messrs. Spaeth and Copple are eligible for severance benefits under the U.S. Executive Severance Plan (the “Severance Plan”), which covers our full-time regular U.S. employees with a title of vice president or above. These severance benefits are contingent upon the executive’s execution of a release of claims in the Company’s favor and continued compliance with certain conditions.
These arrangements provide for enhanced severance benefits on a “change in control termination”—i.e., termination of employment by the Company without “cause” or resignation by the executive for “good reason” during the “change in control period,” which is the period beginning three months (for Mr. Abramo) or 91 days (for Messrs. Spaeth and Copple) prior to a “change in control” (as defined in the Omnibus Incentive Plan) and ending 18 months following the change in control.
Mr. Abramo
Under the terms of Mr. Abramo’s employment agreement, on termination of his employment by the Company without cause or his resignation for good reason other than during a change in control period, Mr. Abramo is entitled to (a) a severance payment in an amount equal to 1.5 times his base salary plus 1.5 times his target bonus, payable in equal installments over a period of 18 months; (b) a prorated portion of his earned bonus for the year in which his employment terminates, based on the portion of the year employed and payable in a lump sum after the earned bonus is determined; (c) 12 months’ accelerated vesting of service-based equity awards outstanding at the end of 2023; and (d) payment of COBRA premiums for continued coverage under the Company’s group health plans for 18 months.
On a change in control termination, Mr. Abramo is entitled to (a) a lump-sum severance payment in an amount equal to two times his base salary plus two times his target bonus; (b) a prorated portion of his target bonus for the year in which his employment terminates, based on the portion of the year employed; (c) full vesting of all service-based equity awards outstanding; and (d) payment of COBRA premiums for continued coverage under the Company’s or its successor’s group health plans for 18 months.
Messrs. Spaeth and Copple
Under the Severance Plan, on termination of employment by the Company without cause or resignation for good reason other than during a change in control period, each of Messrs. Spaeth and Copple is entitled to (a) continued payment of his base salary for 12 months; (b) a prorated portion of his earned bonus for the year in which his employment terminates, based on the portion of the year employed and payable in a lump sum after the earned bonus is determined; and (c) payment of COBRA premiums for continued coverage under the Company’s group health plans for 12 months.
On a change in control termination, each of Messrs. Spaeth and Copple is entitled to (a) a lump-sum severance payment in an amount equal to his base salary plus his target bonus; (b) a prorated portion of his target bonus for the year in which his employment terminates, based upon the portion of the year employed; (c) full vesting of all service-based equity awards outstanding; and (d) payment of COBRA premiums for continued coverage under the Company’s or successor’s group health plans for 12 months.
Equity Incentive Awards
Termination of Employment
As noted above, on termination of his employment by the Company without cause or his resignation for good reason other than during the change in control period, Mr. Abramo is entitled to 12 months’ accelerated vesting of service-based equity awards, and on a change in control termination, each of our named executive officers is entitled full vesting of all service-based equity awards outstanding.
With respect to the RSUs granted to each of Messrs. Spaeth and Copple in connection with the IPO, under the terms of the award agreement, on termination of employment by the Company without cause other than during the change in control period, a prorated portion of the RSUs that was scheduled to vest on the next annual vesting date will vest.
Except as described above, on termination of employment for any reason, the unvested portion of each of the equity awards held by our named executive officers will be canceled, and the vested portion of each option generally will remain exercisable for 90 days (or one year, in the case of death or disability, or, if the vested options are in-the-money, until the earlier of the tenth anniversary of the option grant date or 30 days following expiration of any trading restriction under the Company’s insider trading policy that is in effect at the time of termination of employment). However, if the termination is by the Company for cause, the entire option (including the vested portion) will be canceled.
Our Board under the EIP, or our Compensation Committee under the Omnibus Incentive Plan, has the authority to make various adjustments with respect to awards outstanding under the applicable plan in connection with a change in control or specified other significant events involving the Company, including (among others): (a) continuing or assuming the awards by the Company (if it is the surviving corporation) or by the surviving corporation or its parent; (b) substituting awards by the surviving corporation or its parent; (c) accelerating exercisability, vesting and/or lapse of restrictions applicable to the awards; (d) adjusting performance criteria applicable to the awards or deeming the criteria met at target; or (e) canceling the awards in consideration of a payment in cash or other consideration to the holders of the awards, in each case in an amount equal to the intrinsic value of the award (which may be equal to but not less than zero).
Compensation of our Directors
Under our non-employee director compensation program, each of our non-employee directors is compensated for service on the Board of Directors through a combination of two groupscash fees and equity awards, as described below.
Cash Fees
Cash retainer fees payable to our non-employee directors are as follows:
| Description/Recipient | Dollar Amount per Annum ($) | |||
| Basic retainer for each non-employee director | 70,000 | |||
| Audit Committee chair | 27,500 | |||
| Audit Committee member other than chair | 12,500 | |||
| Compensation Committee chair | 20,000 | |||
| Compensation Committee member other than chair | 10,000 | |||
| Nominating and Governance Committee chair | 20,000 | |||
| Nominating and Governance Committee member other than chair | 10,000 | |||
| Privacy and Cybersecurity Committee chair | 20,000 | |||
| Privacy and Cybersecurity Committee member other than chair | 10,000 | |||
| Non-executive chair, if any | 85,000 | |||
| Lead Independent Director, if any | 25,000 | |||
There is no separate consideration for attendance at or participation in board meetings or discussions or other activities undertaken in the course of companies:Board service. Consideration for service on special committees, if any, is determined by the HireRight GroupBoard on a case-by-case basis. On November 28, 2023, the Board appointed a Special Committee of independent directors to represent the independent shareholders in the take-private initiative commenced by General Atlantic and Stone Point as described in their respective Schedule 13D/A filings on November 17, 2023 and preliminary proxy statement filed on March 21, 2024. Ms. Troe chairs the Special Committee on which Ms. Smart and Mr. Bhamidipati also serve. Ms. Troe receives compensation of $9,166 per month for her service as chair of the Special Committee and each of Ms. Smart and Mr. Bhamidipati receive compensation in the amount of $8,333 per month for their service as members of the Special Committee.
Cash compensation is payable in four equal quarterly installments in arrears, with prorated payments made for partial quarters of service, including to (a) a new director joining the Board as a non-employee director, for the quarter in which the director joins the Board; (b) a director who becomes a non-employee director during board service, for the quarter in which non-employee director status is attained; (c) new committee chairs and members for the quarter in which they are appointed; and (d) for a director leaving the Board in mid-quarter.
Equity Awards
Our non-employee directors also receive equity-based compensation in the form of RSUs granted pursuant to and governed by the Omnibus Incentive Plan.
Each person who is elected as a non-employee director at a regular annual meeting of stockholders of the Company, or who is a continuing non-employee director immediately after the annual meeting because the class in which the director sits was not up for election, receives an award of RSUs with a grant date total value of $165,000, with the number of underlying shares of Common Stock equal to the quotient obtained by dividing (a) $165,000, by (b) the fair market value per share of the Common Stock on the date the RSUs are issued.
In addition, each person appointed as a non-employee director or who attains non-employee director status between annual meetings receives a prorated award of RSUs, with the number of underlying shares of Common Stock equal to the quotient obtained by dividing (a) the product of $13,750 and the General Information Services (“GIS”) Group, each of which includes a number of wholly-owned subsidiariesfull 30-day periods from the date of election or appointment to the Board or attainment of non-employee director status until the scheduled or anticipated date of the next annual meeting (if the next annual meeting has not yet been scheduled, assuming the next annual meeting is scheduled to be held on the same month and day as the immediately preceding annual meeting), by (b) the fair market value per share of the Common Stock on the date the RSUs are issued. The annual equity awards generally are issued on the date of each annual meeting, and the prorated equity awards generally are issued on the date the director commences board service or attains non-employee director status unless that conduct the Company’s business in the United States, as well as other countries. Since July 2018, the combined group of companies and their subsidiaries have operated as a unified operating company providing screening and compliance services, predominantly under the HireRight brand.
Annual equity awards, subject to continued service, vest on workforce risk management and compliance solutions. Employment background screening is a critical, highly complex employer need and is a core component of this overall market.
If a 2021 U.S. Bureau of Labor Statistics survey,director ceases service as a result of inability to discharge his or her duties due to death or disability before vesting in full of the pandemic, 34.5%director’s equity awards, or upon the occurrence of establishments increased teleworka change in control, then the awards will immediately vest in full. Under all other circumstances, vesting of equity awards will cease, and unvested equity awards will lapse, on cessation of a director’s service for someany reason.
Expenses
We reimburse our non-employee directors for expenses incurred in connection with attending Board and committee meetings and provide our non-employee directors with business travel accident insurance.
The following table sets forth compensation earned by our non-employee directors during the fiscal year ended December 31, 2023.
| Name | Fees Earned or Paid in Cash($)(1) | Stock Awards($)(2) | Option Awards ($)(3) | Total ($) | ||||||||||||
Venkat Bhamidipati(4) | 70,361 | 28,970 | — | 99,331 | ||||||||||||
James Carey(5) | 80,000 | 165,000 | — | 245,000 | ||||||||||||
| Mark Dzialga | 188,019 | 165,000 | — | 353,019 | ||||||||||||
Josh Feldman(5) | 87,445 | 165,000 | — | 252,445 | ||||||||||||
Rene Kern(5) | 93,194 | 165,000 | — | 258,194 | ||||||||||||
Larry Kutscher(4) | 141,172 | 45,614 | — | 186,786 | ||||||||||||
| James LaPlaine | 90,000 | 165,000 | — | 255,000 | ||||||||||||
James Matthews(5) | 100,000 | 165,000 | — | 265,000 | ||||||||||||
| Jill Smart | 92,360 | 165,000 | — | 257,360 | ||||||||||||
| Lisa Troe | 117,746 | 165,000 | — | 282,746 | ||||||||||||
| (1) | Amounts set forth in this column represent the aggregate dollar amount of all fees earned or paid in cash for services as a director, including basic retainer fees and committee and/or chair fees. |
| (2) | Amounts set forth in this column represent the aggregate grant date fair value of the RSU awards granted to the non-employee directors in 2023 computed in accordance with FASB ASC Topic 718. In fiscal year 2023, each of our non-employee received a grant of 16,369 RSUs on May 25, 2023, and those RSUs were outstanding at the end of 2023. Messrs. Kutscher and Bhamidipati were appointed to our Board of Directors effective as of February 13, 2023 and April 4, 2023 respectively and, as a result, they received prorated grants of 3,939 and 2,733 RSUs respectively for the period from joining the Board until May 25, 2023. Their prorated grants vested on May 25, 2023. |
| (3) | The Company’s predecessor HireRight GIS Group Holdings LLC (“HGGH”), issued options to non-employee directors, but beginning with the Company’s initial public offering on October 28, 2021, all equity compensation provided to non-employee directors has been in the form of service-based restricted stock units. |
| (4) | Messrs. Kutscher and Bhamidipati were appointed to our Board of Directors effective as of February 13, 2023 and April 4, 2023 respectively and, as a result the compensation for their services was prorated. |
| (5) | All fees earned by Mr. Carey and Mr. Matthews are paid directly to Stone Point, and all fees earned by Mr. Feldman and Mr. Kern are paid directly to General Atlantic. The RSUs granted to Mr. Carey and Mr. Matthews are held solely for the benefit of Stone Point, and the RSUs granted to Mr. Feldman and Mr. Kern are held solely for the benefit of General Atlantic Service Company, L.P. ("General Atlantic Service Company"). |
Compensation Committee Interlocks and Insider Participation
During fiscal year 2023 (and from April 2023 for Mr. Feldman), the members of the Compensation Committee included Messrs. Feldman, Kern, Matthews and Ms. Smart, none of whom was an officer or employee of the Company during fiscal 2023, or formerly an officer of the Company.
None of our executive officers currently serves, or in the past fiscal year served, as a member of a board of directors or as a member of a compensation or similar committee of any entity that has one or more executive officers who also served on the Company’s Board of Directors or Compensation Committee.
Except as described in Item 13 below, none of the members of the Compensation Committee had or has any relationships with the Company that are required to be disclosed under Item 404 of Regulation S-K.
| ITEM 12. | SECURITY OWNERSHIP OF CERTAIN BENEFICIAL OWNERS AND MANAGEMENT AND RELATED STOCKHOLDER MATTERS |
The following table shows certain information with respect to all of their employees. Furthermore, the numberour equity compensation plans in effect as of people primarily working from home increased from 9 million in 2019December 31, 2023:
Equity Compensation Plan Information
| Plan category | Number of Securities to be Issued Upon Exercise of Outstanding Options, Warrants and Rights Column (a) | Weighted-Average Exercise Price of Outstanding Options, Warrants and Rights($)(1) Column (b) | Number of Securities Remaining Available for Future Issuance Under Equity Compensation Plans(2) Column (c) | |||||||||
Equity compensation plans approved by security holders(3) | -- | -- | ||||||||||
| 2021 Omnibus Incentive Plan | 1,596,780 | 18.34 | 8,126,785 | |||||||||
| 2021 Employee Stock Purchase Plan | -- | -- | 2,942,783 | |||||||||
Equity compensation plans not approved by security holders(4) | 2,896,018 | 16.19 | -- | |||||||||
| Total | 4,492,798 | 16.96 | 11,069,568 | |||||||||
| (1) | Weighted average exercise price relates solely to outstanding stock option shares, as shares subject to RSUs or PSUs have no exercise price. |
| (2) | As of December 31, 2023, (i) 8.1 million shares remained available for future issuance under our 2021 Plan and (ii) 2.9 million shares remained available for future issuance under our ESPP. No shares remained available for future issuance under the 2018 Plan as of December 31, 2023. Our 2021 Plan has an evergreen provision that allows for an annual increase in the number of shares available for issuance under the 2021 Plan to be added on the first day of each fiscal year, starting with fiscal year 2022, in an amount equal to 4% of the number of shares of our common stock outstanding on the immediately preceding December 31 or such lesser amount determined by our board of directors or the compensation committee of our board of directors. |
| (3) | These plans consist of our 2021 Omnibus Incentive Plan and 2021 Employee Stock Purchase Plan. |
| (4) | This plan consists of our 2018 Equity Incentive Plan that was in place prior to Company’s registration with the SEC. |
Security Ownership of Certain Beneficial Owners and Management
The following table sets forth, as of March 18, 2024, information regarding beneficial ownership of our common stock by:
each person, or group of affiliated persons, known by us to 27.6 million in 2021, according tobeneficially own more than 5% of our common stock;
each of our named executive officers;
each of our directors; and
all of our executive officers and directors as a 2021 American Community Survey estimate released in September 2022 by the Census Bureau. These developments create new challenges for employers and require new approaches to background screening, monitoring, and overall workforce risk management and compliance.group.
The percentage of ownership is based on 67,352,961 shares of common stock outstanding as of March 18, 2024. Beneficial ownership is determined according to the U.S. Bureau of Labor Statistics. A key driver of this trend are younger “Millennial” employees, who have a median tenure at a single organization of less than 3 years. Increased velocity of job changes drives greater need for our services.
Unless otherwise noted below, the address for each beneficial owner listed in the table below is c/o HireRight Holdings Corporation, 100 Centerview Drive, Suite 300, Nashville, Tennessee 37214.
| Name of beneficial owner | Number of Outstanding Shares Beneficially Owned | Number of Shares Exercisable Within 60 days | Number of Shares Beneficially Owned | Percentage of Beneficial Ownership | ||||||||||||
| 5% and greater stockholders: | ||||||||||||||||
General Atlantic(1) | 32,137,852 | — | 32,137,852 | 47.72 | % | |||||||||||
Stone Point Capital(2) | 18,493,863 | — | 18,493,863 | 27.46 | % | |||||||||||
| Named executive officers and directors: | ||||||||||||||||
Guy Abramo(3) | 43,438 | 1,542,830 | 1,586,268 | 2.35 | % | |||||||||||
Thomas Spaeth(4) | 14,850 | 301,836 | 316,686 | * | ||||||||||||
Brian Copple(5) | 14,784 | 231,732 | 246,516 | * | ||||||||||||
| Venkat Bhamidipati | 2,733 | — | 2,733 | * | ||||||||||||
James Carey(6) | 15,233 | — | 15,233 | * | ||||||||||||
| Mark Dzialga | 42,805 | — | 42,805 | * | ||||||||||||
Josh Feldman(7) | 15,233 | — | 15,233 | * | ||||||||||||
Rene Kern(8) | 8,379 | — | 8,379 | * | ||||||||||||
| Larry Kutscher | 3,939 | — | 3,939 | * | ||||||||||||
| James LaPlaine | 11,073 | — | 11,073 | * | ||||||||||||
| James Matthews | 15,233 | — | 15,233 | * | ||||||||||||
Jill Smart(9) | 15,233 | 53,858 | 69,091 | * | ||||||||||||
Lisa Troe(10) | 11,421 | 32,315 | 43,736 | * | ||||||||||||
All current directors and executive officers as a group (19 persons) | 264,196 | 2,475,325 | 2,739,521 | 4.07 | % | |||||||||||
| * | Indicates beneficial ownership of less than 1% of the total outstanding common stock. |
| (1) | Represents 2,390,000 shares of Company Common Stock held by GAP HRG II, 20,438,147 shares of Company Common Stock held by GA HRG Collections, 857,318 shares of Company Common Stock held by GAPCO GS, 4,885,582 shares of Company Common Stock held by GA AIV-B GS, 3,538,851 shares of Company Common Stock held by GA AIV-A GS, 15,233 shares of the Company Common Stock held by Josh Feldman solely for the benefit of General Atlantic Service Company, 8,379 shares of Company Common Stock held by Rene Kern solely for the benefit of General Atlantic Service Company and 4,342 shares of Company Common Stock held by Peter Munzig solely for the benefit of General Atlantic Service Company.The limited partners of GA HRG Collections that share beneficial ownership of the shares held by GA HRG Collections, at the time of this proxy statement, are the following General Atlantic investment funds: GAP 100, GAPCO CDA, GAPCO III, GAPCO IV and GAPCO V. The limited partners of GA HRG II that share beneficial ownership of the shares held by GA HRG II, at the time of this proxy statement, are the following General Atlantic investment funds: GAPCO CDA, GAPCO III, GAPCO IV, GAPCO V, GAP Lux, GAP Bermuda IV and GAP Bermuda EU. The limited partners of GAPCO GS that share beneficial ownership of the shares held by GAPCO GS, at the time of this proxy statement, are the following General Atlantic investment funds: GAPCO AIV Holdings, GAPCO CDA, GAPCO III, GAPCO IV and GAPCO V. The limited partners that share beneficial ownership of the shares held by GA AIV-A GS and GA AIV-B GS, at the time of this proxy statement, are the following General Atlantic investment funds: in the case of GA AIV-A GS, GAP AIV-1 A and in the case of GA AIV-B GS, GAP AIV-1 B and GA AIV-1 B Interholdco. The general partner of HRG II is GA SPV Bermuda. The general partner of GAP Lux is GA GenPar Lux and the general partner of GA GenPar Lux is GA Lux Sarl. GA GenPar Bermuda is the sole shareholder of GA Lux Sarl, the sole member of GA SPV Bermuda, the general partner of GAP Bermuda IV and the general partner of GAP Bermuda EU. The general partner of GAP Bermuda. GA LP is the sole member of GA SPV, the managing member of GAPCO III, GAPCO IV and GAPCO V, and the general partner of GAPCO CDA and GA GenPar. GA SPV is the general partner of GA HRG Collections, GAPCO GS, GAPCO AIV Holdings, GA AIV-A GS and GA AIV-B GS. GA LP and GAP Bermuda are controlled by the Partnership Committee of GASC MGP, LLC (the “Partnership Committee”**). GA GenPar is the general partner of AIV-1 A, GAP AIV-1 B, GAP 100 and GA AIV-1 B Interholdco. There are Five members of the Partnership Committee. Each of the members of the Partnership Committee disclaims ownership of the Shares of Common Stock reported herein except to the extent he has a pecuniary interest therein. The address of each of GAP Bermuda, GA GenPar Bermuda, GAP Bermuda IV, GAP Bermuda EU, GAP HRG II and GA SPV Bermuda is c/o Conyers Client Services (Bermuda) Limited, Clarendon House, 2 Church Street, Hamilton HM 11, Bermuda. The address of each of GA Lux Sarl, GA GenPar Lux and GAP Lux is 412F, Route d’Esch, L-1471 Luxembourg. The address of each of GAPCO III, GAPCO IV, GAPCO V, GAPCO CDA, GA SPV, GA HRG Collections, GAP AIV-1 A, GAP AIV-1 B, GA AIV-1 B Interholdco, GA AIV-B GS, GA AIV-A GS, GAPCO GS, GAPCO AIV Holdings, GAP 100, GA GenPar and GA LP is c/o General Atlantic Service Company, L.P., 55 East 52nd Street, 33rd Floor, New York, NY 10055. **The Partnership Committee is formerly the Management Committee, with composition effective pending applicable regulatory approvals. |
| (2) | Represents 11,959,030 shares of Company Common Stock held by Trident VII, L.P., 5,814,235 shares of Company Common Stock held by Trident VII Parallel Fund, L.P., 100,067 shares of Company Common Stock held by Trident VII DE Parallel Fund, L.P. and 590,065 shares of Company Common Stock held by Trident VII Professionals Fund, L.P. (the “Trident VII Partnerships”). Trident VII GP is the general partner of Trident VII, L.P., Trident VII Parallel Fund, L.P. and Trident VII DE Parallel Fund, L.P., and Trident VII Professionals GP is the general partner of Trident VII Professionals Fund, L.P. Pursuant to certain management agreements, Stone Point Capital LLC, the investment manager of the Trident VII Partnerships, has received delegated authority by Trident VII GP relating to the Trident VII Partnerships, provided that the delegated discretion to exercise voting rights may not be exercised on behalf of any of the Trident VII Partnerships without first receiving direction from the Investment Committee of the Trident VII GP or a majority of the general partners of the Trident VII GP. Each of the directors appointed by the Trident VII Partnerships disclaims any beneficial ownership of any shares held by the Trident VII Partnerships except to the extent of his ultimate pecuniary interest. |
| (3) | Consists of (a) 43,438 shares of Company Common Stock held directly and (b) 1,542,830 shares of Company Common Stock that may be acquired pursuant to the exercise of Company Options within 60 days of March 18, 2024. |
| (4) | Consists of (a) 14,850 shares of Company Common Stock held directly and (b) 301,836 shares of Company Common Stock that may be acquired pursuant to the exercise of Company Options within 60 days of March 18, 2024. |
| (5) | Consists of (a) 14,784 shares of Company Common Stock held directly and (b) 231,732 shares of Company Common Stock that may be acquired pursuant to the exercise of Company Options within 60 days of March 18, 2024. |
| (6) | Includes 15,233 shares of Company Common Stock held by Mr. Carey solely for the benefit of Stone Point, of which Mr. Carey is President, and for which Mr. Carey disclaims beneficial ownership except to the extent of his pecuniary interest therein, if any. |
| (7) | Includes 15,233 shares of Company Common Stock held by Mr. Feldman solely for the benefit of General Atlantic Service Company. Mr. Feldman disclaims beneficial ownership of these shares of Company Common Stock. |
| (8) | Includes 8,379 shares of Company Common Stock held by Mr. Kern solely for the benefit of General Atlantic Service Company. Mr. Kern disclaims beneficial ownership of these shares of Company Common Stock. |
| (9) | Consists of (a) 15,233 shares of Company Common Stock held directly and (b) 53,858 shares of Company Common Stock that may be acquired pursuant to the exercise of Company Options within 60 days of March 18, 2024. |
| (10) | Consists of (a) 11,421 shares of Company Common Stock held directly and (b) 32,315 shares of Company Common Stock that may be acquired pursuant to the exercise of Company Options within 60 days of March 18, 2024. |
Other than compensation arrangements for the Company’s named executive officers and directors as described in “Executive Compensation” and the transactions and arrangements discussed below, there were no transactions since the beginning of the Company’s 2022 fiscal year, and there are no currently proposed transactions, to which the Company was a party or will be a party, in which:
the amounts involved exceeded or will exceed $120,000; and
any of the Company’s directors, executive officers or holders of more than 5% of its capital stock, or any member of the immediate family of the foregoing persons, had or will have a direct or indirect material interest.
Policies and Procedures for Related Party Transactions
The Board of Directors adopted a written Related Person Transaction Policy (the “policy”), which is overseen by the Audit Committee and sets forth the Company’s policy with respect to the review and approval by the Audit Committee and disclosure of all related person transactions.
For purposes of the policy, a “related person transaction” is a transaction, arrangement or relationship (or any series of similar transactions, arrangements or relationships) in which we were, are or will be a participant and the amount involved exceeded, exceeds or will exceed $120,000 and in which any related person (as defined in the policy) had, has or will have a direct or indirect material interest. A “related person transaction” does not include these activities:any employment relationship or transaction involving an executive officer and any related compensation resulting solely from that employment relationship that has been reviewed and approved by the Board of Directors, Compensation Committee or group of independent directors of the Company.
The policy requires that notice of a document and matching itproposed related person transaction be provided to our legal department prior to entry into such transaction. If the Company’s legal department determines that such transaction is a related person transaction, the proposed transaction will be submitted to the applicant’s details.Audit Committee for consideration. Under the policy, the Audit Committee may approve only those related person transactions that are in, or not inconsistent with, the Company’s best interests and the best interests of its stockholders. In the event that the Company becomes aware of a related person transaction that has not been previously reviewed, approved or ratified under the policy and that is ongoing or is completed, the transaction will be submitted to the Audit Committee so that it may determine whether to ratify, rescind or terminate the related person transaction.
Take-Private Merger Agreement
On December 11, 2023, the Company announced the receipt of any civil actions filed by or against individuals or corporations that can be conducted at a county/federal or country level, including suits, liens,non-binding proposal from General Atlantic, L.P. and judgments.Stone Point Capital LLC and their respective affiliated funds (collectively, the “Principal Stockholders
On February 15, 2024, the Company entered into an Agreement and Plan of an incorporated entity.Merger (the “Merger Agreement
”) with Hearts Parent, LLC, a Delaware limited liability company (“•ParentCredit: Retrieval”) and aggregationHearts Merger Sub, Inc., a Delaware corporation and wholly owned subsidiary of an individual’s credit history by searching multiple sources at locations corresponding to applicants’ past addresses.
The unified global platform includes several key systems that play specific roles in the procurement and delivery process. Customers’ requests for services can be submitted through multiple points of interaction with our unified global platform, including HireRight’s Screening Manager or backgroundchecks.com interfaces or via a direct integration with their HCM system of choice. Any required information submission from or communication with an applicant or worker is processed by wayConsummation of the HireRight Applicant Center. Requests and applicant submissions are collected via the HireRight Connect API, which assesses the scope of the customer request and performs subsequent workflow generation, data aggregation and processing algorithms required for fulfillment of the requested services, leveraging our internal databases and external databases sources. Completed reports containing the details of the services performed are then delivered backMerger is subject to our customers via the same systems from which they initiated their request. A more detailed description of our systems and their role in our unified global platform is presented below:
Stockholders Agreement
On October 28, 2021, the Company entered into a Stockholders Agreement with the Principal Stockholders that provides the Principal Stockholders each the right to those reports pursuantdesignate nominees for election to Section 13(a) or 15(d)the Board of Directors. The Principal Stockholders may also assign their designation rights under the Stockholders Agreement to an affiliate.
The Stockholders Agreement provides (x) investment funds managed by General Atlantic the right to designate: (i) a majority of the Securities Exchange Act of 1934 (the “Exchange Act”). These reports are available free of charge on our corporate website (www.hireright.com) as soon as reasonably practicable after they are electronically filed with or furnishednominees for election to the SEC. CopiesBoard of any materials we file withDirectors for so long as such funds beneficially own over 40% of the SEC can be obtained freevoting power of charge at www.sec.gov. The foregoing website addresses are provided as inactive textual references only. The information contained on, or that can be accessed through, our website is not partthe then outstanding shares of this report and is not incorporated by reference as part of this Annual Report on Form 10-K.
Until such time as any Principal Stockholder, directly or indirectly, ceases to beneficially own at least 10% of the Common Stock then outstanding, such Principal Stockholder will remain an emerging growth companyhave the right to designate at least one member of each committee of the Board of Directors; provided, that any such designee shall be a director and shall be eligible to serve on the applicable committee under applicable law or stock exchange listing standards, including any applicable independence requirements. In addition, the Principal Stockholders shall be entitled to designate the replacement for any of their board designees whose board service terminates prior to the end of the director’s term regardless of the applicable Principal Stockholder’s beneficial ownership at such time.
As long as the investment funds managed by General Atlantic beneficially own at least 25% of the Common Stock then outstanding, the prior written consent of such funds will be required prior to taking the following actions:
| (a) | any acquisition or disposition in which aggregate consideration is greater than $250,000,000 in a single transaction or series of related transactions; |
| (b) | any transaction in which any person or group acquires more than 50% of the Company’s then outstanding capital stock or the power to elect a majority of the members of the Board of Directors; |
| (c) | any incurrence or refinancing of indebtedness of the Company and its subsidiaries to the extent such incurrence or refinancing would result in the Company and its Subsidiaries having indebtedness in excess of $750,000,000 principal amount in the aggregate; |
| (d) | hiring or termination of the Company’s chief executive officer; |
| (e) | any increase or decrease in the size of the Board of Directors; |
| (f) | any reorganization, recapitalization, voluntary bankruptcy, liquidation, dissolution or winding-up; |
| (g) | any repurchase or redemption of capital stock of the Company (other than (i) on a pro rata basis, (ii) pursuant to an open market plan approved by the Board of Directors or (iii) accepting shares from recipients of awards under the Company’s equity incentive plan in satisfaction of the obligation of such recipients to pay the exercise price of options or reimburse the Company for income tax withholding deposits paid by the Company on behalf of such recipients, or repurchase from employees following their departure); |
| (h) | any payment or declaration of dividends on capital stock of the Company; |
| (i) | any entry into a joint venture involving amounts in excess of $50,000,000; or |
| (j) | adoption of a poison pill or similar rights plan. |
As long as the investment funds managed by General Atlantic beneficially own any shares of the Common Stock, the prior written consent of such funds will be required prior to any amendment to the governing documents of the Company if such change is adverse to the rights of General Atlantic (including, for the avoidance of doubt, the advance waiver of corporate opportunities).
Additionally, until the earlier of (1) the last day of our fiscal year following November 2, 2026, (2) the last day of our fiscal year in which we have total annual gross revenue ofsuch time as (i) Stone Point ceases to hold at least $1.235 billion, (3)75% of the date on which we are deemed to be a large accelerated filer (this means the market value of our common stock that isCommon Stock held by non-affiliates exceeds $700.0 millionStone Point as of the endinitial public offering or (ii) General Atlantic ceases to hold at least 25% of the second quarter of that fiscal year), or (4) the date on which we have issued more than $1.0 billion in non-convertible debt securities duringCommon Stock then outstanding, the prior three-year period.written consent of Stone Point will be required prior to taking the following actions:
| (a) | any acquisition or disposition in which aggregate consideration is greater than $250,000,000 in any single transaction or series or related transactions; |
| (b) | any reorganization, recapitalization, voluntary bankruptcy, liquidation, dissolution or winding-up (other than a sale of the Company, however structured); |
| (c) | any repurchase or redemption of capital stock of the Company from General Atlantic or any of its affiliates (other than (i) on a pro rata basis or (ii) pursuant to an open market plan approved by the Board of Directors); or |
| (d) | the entry into, or amendment of, any agreement or arrangement with General Atlantic or any of its affiliates (excluding ordinary course, arm’s length commercial transactions). |
As long as the investment funds managed by Stone Point beneficially own any shares of reduced reporting requirements thatthe Common Stock, the prior written consent of such funds will be required prior to any amendment to the governing documents of the Company if such change is disproportionately adverse to the rights of Stone Point as compared to General Atlantic (including, for the avoidance of doubt, the advance waiver of corporate opportunities).
Under the Stockholders Agreement, the Company is obligated to (i) indemnify its Principal Stockholders and their affiliates from any claims and related losses (as defined in the Stockholders Agreement) arising out of (a) their ownership of Common Stock and (b) any litigation to which they are otherwise applicablemade a party in their respective capacities as stockholders or current or prior owners of the Company’s securities, subject to public companies. These provisions include, but are not limited to:customary carve-outs; and (ii) reimburse the Principal Stockholders for reasonable out-of-pocket expenses incurred in connection with monitoring their investment in the Company.
The Board and Committee designation rights and prior approval rights of the Principal Stockholders under the Stockholders Agreement will terminate with respect to complya Principal Stockholder at such time as such Principal Stockholder owns less than 5% of the Common Stock then outstanding.
Registration Rights Agreement
On October 28, 2021, the Company entered into a registration rights agreement with the auditor attestation requirements of Section 404 ofPrincipal Stockholders, pursuant to which the Sarbanes-Oxley Act of 2002, as amended (the “Sarbanes-Oxley Act”);
On October 28, 2021, the risk of assumed known and unknown liabilities, and we may fail to identify all of the problems, liabilities or other shortcomings or challenges of an acquired company, technology, or solution, including issues related to intellectual property, solution quality or architecture, income tax and other regulatory compliance practices, revenue recognition or other accounting practices, or employee or customer issues. Such issues could expose us to liabilities or remedial costs for which indemnities, escrow arrangements or insurance may not be available or may not be sufficient to provide coverage.
We expect to be able to utilize the Pre-IPO Tax Benefits. We expect that the Pre-IPO Tax Benefits will reduce the amount of tax that the Company and not obligationsits subsidiaries would otherwise be required to pay in the future.
For purposes of any of our subsidiaries. The actualthe TRA, cash savings in income tax will be computed by reference to the reduction in the liability for income taxes resulting from the utilization of the Pre-IPO Tax Benefits as well assubject to the TRA. The term of the TRA commenced upon consummation of the IPO and will continue until all relevant Pre-IPO Tax Benefits have been utilized, accelerated or expired.
While the actual amount and timing of any payments under the TRA will vary depending upon a number of factors, including the amount character and timing of our and our subsidiaries’the taxable income the Company and its subsidiaries generate in the future.
Payments under the TRA will beare based on the tax reporting positions that we determine,the Company determines, and the Internal Revenue Service (the “IRS”),IRS, or another tax authority may challenge all or part of ourits net operating losses, existing tax basis or other tax attributes or benefits we claim,it claims, as well as other related tax positions we take,the Company takes, and a court could sustain such challenge. Although we arethe Company is not aware of any issue that would cause the IRS to challenge ourits net operating losses, existing tax basis or other tax attributes or benefits for which payments are made under the TRA, if the outcome of any such challenge would reasonably be expected to materially affect a recipient’s payments under the TRA, then wethe Company will not be permitted to settle thatsuch challenge without the consent (not to be unreasonably withheld or delayed) of ourthe pre-IPO equityholders (or their transferees or assignees) that are party to the TRA.. The interests of ourthe pre-IPO equityholders (or their transferees or assignees) in any such challenge may differ from or conflict with ourthe Company’s interests and theits then-current stockholders’ interests, of our then-current stockholders, and ourthe pre-IPO equityholders (or their transferees or assignees) may exercise their consent rights relating to any such challenge in a manner adverse to ourthe Company’s interests and the interests of our then-current stockholders. Weyour interests. The Company will not be reimbursed for any cash payments previously made to our pre-IPO equityholders (or their transferees or assignees) under the TRA in the event that any tax benefits initially claimed by usthe Company and for which payment has been made to our pre-IPO equityholders (or their transferees or assignees) are subsequently challenged by a taxing authority and are ultimately disallowed. Instead, any excess cash payments made by usthe Company to our pre-IPO equityholders (or their transferees or assignees) will be netted against any future cash payments that wethe Company might otherwise be required to make to ourits pre-IPO equityholders (or their transferees or assignees) under the terms of the TRA. However, wethe Company might not determine that we haveit has effectively made an excess cash payment to ourits pre-IPO equityholders (or their transferees or assignees) for a number of years following the initial time of such payment and, if any of ourthe Company’s tax reporting positions are challenged by a taxing
authority, weit will not be permitted to reduce any future cash payments under the TRA until any such challenge is finally settled or determined. Moreover, the excess cash payments wethe Company previously made under the TRA could be greater than the amount of future cash payments against which weit would otherwise be permitted to net such excess. The applicable U.S. federal state and local income tax rules for determining applicable tax benefits wethe Company may claim are complex and factual in nature, and there can be no assurance that the IRS, any other taxing authority or a court will not disagree with ourits tax reporting positions. As a result, payments could be made under the TRA significantly in excess of any tax savings that we realizethe Company realizes in respect of the tax attributes with respect to its pre-IPO equityholders (or their transferees or assignees) that are the subject of the TRA.
In certain cases, payments underaddition, the TRA to our pre-IPO equityholders (or their transferees or assignees) may be accelerated or significantly exceed any actual benefits we realize in respect of the tax attributes subject to the TRA.
Decisions the TRA may also result in situations in which our pre-IPO equityholders (or their transferees or assignees) have interests that differ from or are in addition to those of our other stockholders. Similarly, decisions we makeCompany makes in the course of running ourits business, such as with respect to mergers, asset sales, other forms of business combinations or other changes in control, may influence the timing and amount of payments made under the TRA. For example, an earlier disposition of assets resulting in an accelerated use of existing basis or available net operating losses may accelerate payments under the TRA and increase the present value of such payments. Such effects may result in differences or conflicts of interest between the interests of the Company’s pre-IPO equityholders (or their transferees or assignees) and the interests of other stockholders.
Finally, because the Company is a holding company with no operations of its own, its ability to make payments under the TRA is dependent on the ability of its subsidiaries to make distributions to the Company. Although existing credit agreements generally restrict distributions from its subsidiaries to the Company, they contain provisions which allow certain distributions which the Company believes will be ablesufficient to generate sufficient cash flow to meet ourcover its payment obligations under the Amended First Lien Term Loan Facility and TRA andTRA. However, the Company may choose to utilize certain permitted distribution flexibility contained in its credit agreements for other purposes, in which case its subsidiaries may be forcedrestricted from making distributions to take other actions to satisfy our obligations, including refinancing indebtedness,it, which may not be successful.
“Pre-IPO Tax Benefits” means the tax benefits arising as a result those acquisition opportunities may not be availableof: (i) all depreciation and amortization deductions, and any offset to us. In addition, the Principal Stockholders may have an interest in pursuing acquisitions, divestiturestaxable income and other transactions that, in its judgment, could enhance its investment in our common stock, even though such transactions might involve risksgain or increase to other stockholders.
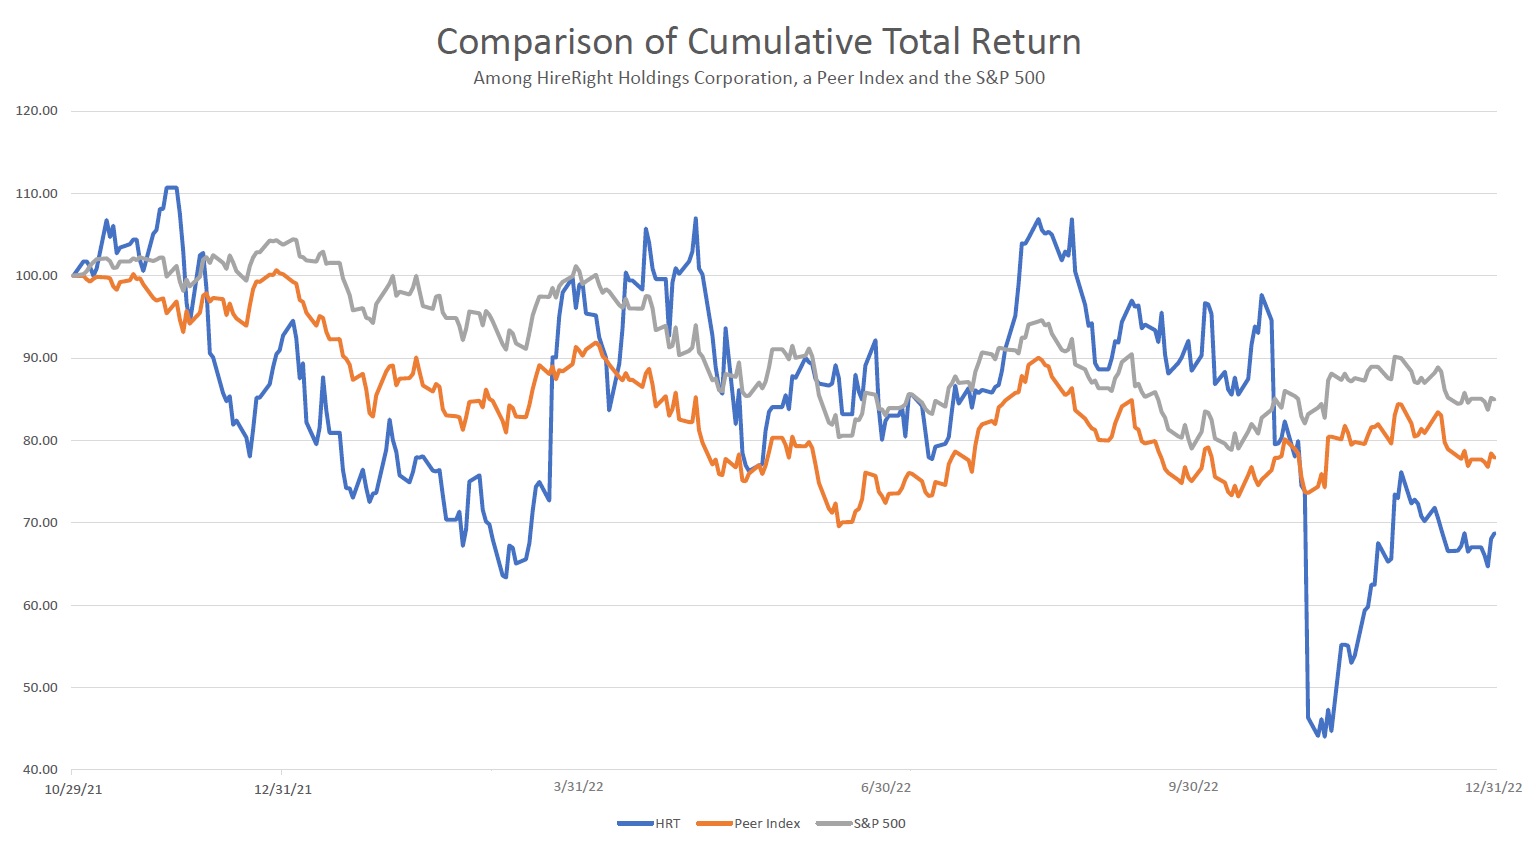
| Period | Total number of shares purchased | Average price paid per share | Total number of shares purchased as part of publicly announced plans or programs (1) | Approximate dollar value of shares that may yet be purchased under the plans or programs | |||||||||||||||||||
| (in millions) | |||||||||||||||||||||||
| October 1 — October 31, 2022 | — | $ | — | — | $ | — | |||||||||||||||||
| November 1 — November 30, 2022 | 791,780 | 10.39 | 791,780 | 91.8 | |||||||||||||||||||
| December 1 — December 31, 2022 | 737,049 | 11.67 | 737,049 | 83.2 | |||||||||||||||||||
| Total | 1,528,829 | $ | 11.01 | 1,528,829 | $ | 83.2 | |||||||||||||||||
| Year Ended December 31, | |||||||||||||||||||||||||||||||||||||||||||||||
| 2022 | 2021 | 2020 | |||||||||||||||||||||||||||||||||||||||||||||
| (in thousands, except percent of revenues) | |||||||||||||||||||||||||||||||||||||||||||||||
| Revenues | $ | 806,668 | 100.0 | % | $ | 730,056 | 100.0 | % | $ | 540,224 | 100.0 | % | |||||||||||||||||||||||||||||||||||
| Expenses | |||||||||||||||||||||||||||||||||||||||||||||||
| Cost of services (exclusive of depreciation and amortization below) | 435,740 | 54.0 | % | 406,671 | 55.7 | % | 301,845 | 55.9 | % | ||||||||||||||||||||||||||||||||||||||
| Selling, general and administrative | 200,853 | 24.9 | % | 188,298 | 25.8 | % | 173,579 | 32.1 | % | ||||||||||||||||||||||||||||||||||||||
| Depreciation and amortization | 71,959 | 8.9 | % | 78,357 | 10.7 | % | 76,932 | 14.2 | % | ||||||||||||||||||||||||||||||||||||||
| Total expenses | 708,552 | 87.8 | % | 673,326 | 92.2 | % | 552,356 | 102.2 | % | ||||||||||||||||||||||||||||||||||||||
| Operating income (loss) | 98,116 | 12.2 | % | 56,730 | 7.8 | % | (12,132) | (2.2) | % | ||||||||||||||||||||||||||||||||||||||
| Other expenses | |||||||||||||||||||||||||||||||||||||||||||||||
| Interest expense | 32,122 | 4.0 | % | 74,815 | 10.2 | % | 75,118 | 13.9 | % | ||||||||||||||||||||||||||||||||||||||
| Other expense, net | 472 | 0.1 | % | 532 | 0.1 | % | 889 | 0.2 | % | ||||||||||||||||||||||||||||||||||||||
| Total other expense, net | 32,594 | 4.0 | % | 75,347 | 10.3 | % | 76,007 | 14.1 | % | ||||||||||||||||||||||||||||||||||||||
| Income (loss) before income taxes | 65,522 | 8.1 | % | (18,617) | (2.6) | % | (88,139) | (16.3) | % | ||||||||||||||||||||||||||||||||||||||
| Income tax (benefit) expense | (79,052) | (9.8) | % | 2,686 | 0.4 | % | 3,938 | 0.7 | % | ||||||||||||||||||||||||||||||||||||||
| Net income (loss) | $ | 144,574 | 17.9 | % | $ | (21,303) | (2.9) | % | $ | (92,077) | (17.0) | % | |||||||||||||||||||||||||||||||||||
| Year Ended December 31, | |||||||||||||||||
| 2022 | 2021 | 2020 | |||||||||||||||
| (in thousands, except percents) | |||||||||||||||||
| Net income (loss) | $ | 144,574 | $ | (21,303) | $ | (92,077) | |||||||||||
Income tax (benefit) expense (1) | (79,052) | 2,686 | 3,938 | ||||||||||||||
| Interest expense | 32,122 | 74,815 | 75,118 | ||||||||||||||
| Depreciation and amortization | 71,959 | 78,357 | 76,932 | ||||||||||||||
| EBITDA | 169,603 | 134,555 | 63,911 | ||||||||||||||
| Stock-based compensation | 11,474 | 4,528 | 3,218 | ||||||||||||||
| Realized and unrealized loss on foreign exchange | 323 | 424 | 889 | ||||||||||||||
Merger integration expenses (2) | 205 | 551 | 10,055 | ||||||||||||||
Technology investments (3) | 563 | 3,567 | — | ||||||||||||||
Amortization of cloud computing software costs (4) | 2,690 | 21 | — | ||||||||||||||
Other items (5) | 3,452 | 16,572 | 14,855 | ||||||||||||||
| Adjusted EBITDA | $ | 188,310 | $ | 160,218 | $ | 92,928 | |||||||||||
Net income (loss) margin (6) | 17.9 | % | 2.9 | % | 17.0 | % | |||||||||||
| Adjusted EBITDA margin | 23.3 | % | 21.9 | % | 17.2 | % | |||||||||||
| Year Ended December 31, | |||||||||||||||||
| 2022 | 2021 | 2020 | |||||||||||||||
| (in thousands) | |||||||||||||||||
| Net income (loss) | $ | 144,574 | $ | (21,303) | $ | (92,077) | |||||||||||
Income tax (benefit) expense (1) | (79,052) | 2,686 | 3,938 | ||||||||||||||
| Income (loss) before income taxes | 65,522 | (18,617) | (88,139) | ||||||||||||||
| Amortization of acquired intangible assets | 61,682 | 63,059 | 62,094 | ||||||||||||||
Loss on extinguishment of debt (2) | — | 5,170 | — | ||||||||||||||
Interest expense swap adjustments (3) | (12,634) | — | — | ||||||||||||||
Interest expense discounts (4) | 3,345 | 4,080 | 4,036 | ||||||||||||||
| Stock-based compensation | 11,474 | 4,528 | 3,218 | ||||||||||||||
| Realized and unrealized loss on foreign exchange | 323 | 424 | 889 | ||||||||||||||
Merger integration expenses (5) | 205 | 551 | 10,055 | ||||||||||||||
Technology investments (6) | 563 | 3,567 | — | ||||||||||||||
Amortization of cloud computing software costs (7) | 2,690 | 21 | — | ||||||||||||||
Other items (8) | 3,452 | 17,029 | 14,855 | ||||||||||||||
| Adjusted income before income taxes | 136,622 | 79,812 | 7,008 | ||||||||||||||
Adjusted income taxes (9) | (57,040) | 1,610 | 4,977 | ||||||||||||||
| Adjusted Net Income | $ | 193,662 | $ | 78,202 | $ | 2,031 | |||||||||||
| Year Ended December 31, | |||||||||||||||||
| 2022 | 2021 | 2020 | |||||||||||||||
| Diluted net income (loss) per share | $ | 1.82 | $ | (0.35) | $ | (1.61) | |||||||||||
Income tax (benefit) expense (1) | (1.00) | 0.04 | 0.07 | ||||||||||||||
| Amortization of acquired intangible assets | 0.78 | 1.04 | 1.08 | ||||||||||||||
Loss on extinguishment of debt (2) | — | 0.09 | — | ||||||||||||||
Interest expense swap adjustments (3) | (0.16) | — | — | ||||||||||||||
Interest expense discounts (4) | 0.04 | 0.07 | 0.07 | ||||||||||||||
| Stock-based compensation | 0.15 | 0.07 | 0.06 | ||||||||||||||
| Realized and unrealized loss on foreign exchange | — | 0.01 | 0.02 | ||||||||||||||
Merger integration expenses (5) | — | 0.01 | 0.17 | ||||||||||||||
Technology investments (6) | 0.01 | 0.06 | — | ||||||||||||||
Amortization of cloud computing software costs (7) | 0.04 | — | — | ||||||||||||||
Other items (8) | 0.04 | 0.28 | 0.26 | ||||||||||||||
Adjusted income taxes (9) | 0.72 | (0.03) | (0.08) | ||||||||||||||
| Adjusted Diluted Earnings Per Share | $ | 2.44 | $ | 1.29 | $ | 0.04 | |||||||||||
| Weighted average number of shares outstanding - diluted | 79,443,263 | 60,821,472 | 57,168,291 | ||||||||||||||
| Year Ended December 31, | |||||||||||||||||
| 2022 | 2021 | 2020 | |||||||||||||||
| (in thousands) | |||||||||||||||||
| Net cash provided by operating activities | $ | 107,728 | $ | 47,474 | $ | 16,426 | |||||||||||
| Net cash used in investing activities | (16,931) | (14,037) | (12,206) | ||||||||||||||
| Net cash provided by (used in) financing activities | (41,921) | 59,987 | (984) | ||||||||||||||
| Net increase in cash, cash equivalents and restricted cash | $ | 48,876 | $ | 93,424 | $ | 3,236 | |||||||||||
| December 31, | |||||||||||
| 2022 | 2021 | ||||||||||
| (in thousands, except share, and per share data) | |||||||||||
| Assets | |||||||||||
| Current assets | |||||||||||
| Cash and cash equivalents | $ | 162,092 | $ | 111,032 | |||||||
| Restricted cash | 1,310 | 5,182 | |||||||||
| Accounts receivable, net of allowance for doubtful accounts of $5,812 and $4,284 at December 31, 2022 and 2021, respectively | 136,656 | 142,473 | |||||||||
| Prepaid expenses and other current assets | 18,745 | 18,583 | |||||||||
| Total current assets | 318,803 | 277,270 | |||||||||
| Property and equipment, net | 9,045 | 11,127 | |||||||||
| Right-of-use assets, net | 8,423 | — | |||||||||
| Intangible assets, net | 331,598 | 389,483 | |||||||||
| Goodwill | 809,463 | 819,538 | |||||||||
| Cloud computing software, net | 35,230 | 8,133 | |||||||||
| Deferred tax assets | 74,236 | — | |||||||||
| Other non-current assets | 18,949 | 18,211 | |||||||||
| Total assets | $ | 1,605,747 | $ | 1,523,762 | |||||||
| Liabilities and Stockholders’ Equity | |||||||||||
| Current liabilities | |||||||||||
| Accounts payable | $ | 11,571 | $ | 13,688 | |||||||
| Accrued expenses and other current liabilities | 75,208 | 75,294 | |||||||||
| Accrued salaries and payroll | 31,075 | 29,280 | |||||||||
| Derivative instruments, short-term | — | 16,662 | |||||||||
| Debt, current portion | 8,350 | 8,350 | |||||||||
| Total current liabilities | 126,204 | 143,274 | |||||||||
| Debt, long-term portion | 683,206 | 688,683 | |||||||||
| Derivative instruments, long-term | — | 11,444 | |||||||||
| Tax receivable agreement liability | 210,543 | 210,639 | |||||||||
| Deferred taxes liabilities | 5,748 | 14,765 | |||||||||
| Operating lease liabilities, long- term | 10,055 | — | |||||||||
| Other non-current liabilities | 1,673 | 9,240 | |||||||||
| Total liabilities | 1,037,429 | 1,078,045 | |||||||||
| Commitments and contingent liabilities (Note 14) | |||||||||||
| Preferred stock, $0.001 par value, authorized 100,000,000 shares; none issued and outstanding as of December 31, 2022 and 2021 | — | — | |||||||||
| Common stock, $0.001 par value, authorized 1,000,000,000 shares; 79,660,397 and 79,392,937 shares issued, and 78,131,568 and 79,392,937 shares outstanding as of December 31, 2022 and 2021, respectively | 80 | 79 | |||||||||
| Additional paid-in capital | 805,799 | 793,382 | |||||||||
| Treasury stock, at cost; 1,528,829 shares and no shares repurchased at December 31, 2022 and 2021, respectively | (16,827) | — | |||||||||
| Accumulated deficit | (215,790) | (360,364) | |||||||||
| Accumulated other comprehensive income (loss) | (4,944) | 12,620 | |||||||||
| Total stockholders’ equity | 568,318 | 445,717 | |||||||||
| Total liabilities and stockholders’ equity | $ | 1,605,747 | $ | 1,523,762 | |||||||
| Year Ended December 31, | |||||||||||||||||
| 2022 | 2021 | 2020 | |||||||||||||||
| (in thousands, except share and per share data) | |||||||||||||||||
Revenues | $ | 806,668 | $ | 730,056 | $ | 540,224 | |||||||||||
| Expenses | |||||||||||||||||
| Cost of services (exclusive of depreciation and amortization below) | 435,740 | 406,671 | 301,845 | ||||||||||||||
| Selling, general and administrative | 200,853 | 188,298 | 173,579 | ||||||||||||||
| Depreciation and amortization | 71,959 | 78,357 | 76,932 | ||||||||||||||
| Total expenses | 708,552 | 673,326 | 552,356 | ||||||||||||||
| Operating income (loss) | 98,116 | 56,730 | (12,132) | ||||||||||||||
| Other expenses | |||||||||||||||||
| Interest expense | 32,122 | 74,815 | 75,118 | ||||||||||||||
| Other expense, net | 472 | 532 | 889 | ||||||||||||||
| Total other expenses | 32,594 | 75,347 | 76,007 | ||||||||||||||
| Income (loss) before income taxes | 65,522 | (18,617) | (88,139) | ||||||||||||||
| Income tax (benefit) expense | (79,052) | 2,686 | 3,938 | ||||||||||||||
| Net income (loss) | $ | 144,574 | $ | (21,303) | $ | (92,077) | |||||||||||
| Net income (loss) per share: | |||||||||||||||||
| Basic | $ | 1.82 | $ | (0.35) | $ | (1.61) | |||||||||||
| Diluted | $ | 1.82 | $ | (0.35) | $ | (1.61) | |||||||||||
| Weighted average shares outstanding: | |||||||||||||||||
| Basic | 79,344,547 | 60,821,472 | 57,168,291 | ||||||||||||||
| Diluted | 79,443,263 | 60,821,472 | 57,168,291 | ||||||||||||||
| Year Ended December 31, | |||||||||||||||||
| 2022 | 2021 | 2020 | |||||||||||||||
| (in thousands) | |||||||||||||||||
Net income (loss) | $ | 144,574 | $ | (21,303) | $ | (92,077) | |||||||||||
| Other comprehensive income (loss), net of tax | |||||||||||||||||
| Unrealized gain (loss) on derivatives qualified for hedge accounting: | |||||||||||||||||
| Unrealized gain (loss) on interest rate swaps | 7,981 | 5,746 | (36,609) | ||||||||||||||
Reclassification adjustments included in earnings (1) | (10,955) | 19,723 | 16,017 | ||||||||||||||
| Total unrealized gain (loss) | (2,974) | 25,469 | (20,592) | ||||||||||||||
| Currency translation adjustment, net of tax benefit (expense) of $(175), $(2) and $90 for the years ended December 31, 2022, 2021 and 2020, respectively | (14,590) | (2,726) | 5,230 | ||||||||||||||
| Other comprehensive income (loss) | (17,564) | 22,743 | (15,362) | ||||||||||||||
| Comprehensive income (loss) | $ | 127,010 | $ | 1,440 | $ | (107,439) | |||||||||||
| Class A Member Units | Common Stock | Treasury Stock | |||||||||||||||||||||||||||||||||||||||||||||||||||||||||
| Units | Amount | Shares | Amount | Shares | Amount | Additional Paid in Capital | Accumulated Deficit | Accumulated Other Comprehensive (Loss) Income | Total Stockholders’ Equity | ||||||||||||||||||||||||||||||||||||||||||||||||||
| (in thousands, except unit and share data) | |||||||||||||||||||||||||||||||||||||||||||||||||||||||||||
| Balances at December 31, 2019 | 57,168,291 | $ | 590,711 | — | $ | — | — | $ | — | $ | 12,142 | $ | (246,984) | $ | 5,239 | $ | 361,108 | ||||||||||||||||||||||||||||||||||||||||||
| Net loss | — | — | — | — | — | — | — | (92,077) | — | (92,077) | |||||||||||||||||||||||||||||||||||||||||||||||||
| Stock-based compensation | — | — | — | — | — | — | 3,218 | — | — | 3,218 | |||||||||||||||||||||||||||||||||||||||||||||||||
| Other comprehensive loss | — | — | — | — | — | — | — | — | (15,362) | (15,362) | |||||||||||||||||||||||||||||||||||||||||||||||||
| Balances at December 31, 2020 | 57,168,291 | 590,711 | — | — | — | — | 15,360 | (339,061) | (10,123) | $ | 256,887 | ||||||||||||||||||||||||||||||||||||||||||||||||
| Corporate Conversion of Class A member Units to common stock | (57,168,291) | (590,711) | 57,168,291 | 57 | — | — | 590,654 | — | — | — | |||||||||||||||||||||||||||||||||||||||||||||||||
| Issuance of common stock in connection with initial public offering, net of offering costs, underwriting discounts and commissions | — | — | 22,224,646 | 22 | — | — | 393,479 | — | — | 393,501 | |||||||||||||||||||||||||||||||||||||||||||||||||
| Net loss | — | — | — | — | — | — | — | (21,303) | — | (21,303) | |||||||||||||||||||||||||||||||||||||||||||||||||
| Stock-based compensation | — | — | — | — | — | — | 4,528 | — | — | 4,528 | |||||||||||||||||||||||||||||||||||||||||||||||||
| Tax receivable agreement | — | — | — | — | — | — | (210,639) | — | — | (210,639) | |||||||||||||||||||||||||||||||||||||||||||||||||
| Other comprehensive income | — | — | — | — | — | — | — | — | 22,743 | 22,743 | |||||||||||||||||||||||||||||||||||||||||||||||||
| Balances at December 31, 2021 | — | — | 79,392,937 | 79 | — | — | 793,382 | (360,364) | 12,620 | 445,717 | |||||||||||||||||||||||||||||||||||||||||||||||||
| Issuance of common stock under stock-based compensation plans, net of shares withheld for employee taxes | — | — | 267,460 | 1 | — | — | 943 | — | — | 944 | |||||||||||||||||||||||||||||||||||||||||||||||||
| Net income | — | — | — | — | — | — | — | 144,574 | — | 144,574 | |||||||||||||||||||||||||||||||||||||||||||||||||
| Stock-based compensation | — | — | — | — | — | — | 11,474 | — | — | 11,474 | |||||||||||||||||||||||||||||||||||||||||||||||||
| Repurchase of common stock | — | — | (1,528,829) | — | 1,528,829 | (16,827) | — | — | — | (16,827) | |||||||||||||||||||||||||||||||||||||||||||||||||
| Other comprehensive loss | — | — | — | — | — | — | — | — | (17,564) | (17,564) | |||||||||||||||||||||||||||||||||||||||||||||||||
| Balances at December 31, 2022 | — | $ | — | 78,131,568 | $ | 80 | 1,528,829 | $ | (16,827) | $ | 805,799 | $ | (215,790) | $ | (4,944) | $ | 568,318 | ||||||||||||||||||||||||||||||||||||||||||
| Year Ended December 31, | |||||||||||||||||
| 2022 | 2021 | 2020 | |||||||||||||||
| (in thousands) | |||||||||||||||||
| Cash flows from operating activities | |||||||||||||||||
| Net income (loss) | $ | 144,574 | $ | (21,303) | $ | (92,077) | |||||||||||
| Adjustments to reconcile net income (loss) to net cash provided by operating activities: | |||||||||||||||||
| Depreciation and amortization | 71,959 | 78,357 | 76,932 | ||||||||||||||
| Deferred income taxes | (82,658) | 1,485 | 2,903 | ||||||||||||||
| Amortization of debt issuance costs | 3,345 | 4,080 | 4,036 | ||||||||||||||
| Amortization of contract assets | 4,505 | 3,796 | 2,984 | ||||||||||||||
| Amortization of right-of-use assets | 2,973 | — | — | ||||||||||||||
| Amortization of unrealized gains on terminated interest rate swap agreements | (12,634) | — | — | ||||||||||||||
| Amortization of cloud computing software costs | 2,690 | 21 | — | ||||||||||||||
| Stock-based compensation | 11,474 | 4,528 | 3,218 | ||||||||||||||
| Change in tax receivable agreement liability | (96) | — | — | ||||||||||||||
| Loss on extinguishment of debt | — | 5,006 | — | ||||||||||||||
| Other non-cash charges, net | 2,927 | (311) | 1,731 | ||||||||||||||
| Changes in operating assets and liabilities: | |||||||||||||||||
| Accounts receivable | 3,887 | (35,745) | (10,245) | ||||||||||||||
| Prepaid expenses and other current assets | (160) | 240 | 1,408 | ||||||||||||||
| Cloud computing software | (29,788) | (8,154) | — | ||||||||||||||
| Other non-current assets | (5,309) | (5,242) | (4,181) | ||||||||||||||
| Accounts payable | (4,953) | (10,994) | 7,767 | ||||||||||||||
| Accrued expenses and other current liabilities | (567) | 18,487 | 12,020 | ||||||||||||||
| Accrued salaries and payroll | 1,678 | 6,156 | 9,518 | ||||||||||||||
| Operating lease liabilities, net | (4,659) | — | — | ||||||||||||||
| Other non-current liabilities | (1,460) | 7,067 | 412 | ||||||||||||||
| Net cash provided by operating activities | 107,728 | 47,474 | 16,426 | ||||||||||||||
| Cash flows from investing activities | |||||||||||||||||
| Purchases of property and equipment | (4,456) | (6,228) | (5,707) | ||||||||||||||
| Capitalized software development | (12,475) | (7,809) | (6,403) | ||||||||||||||
| Cash paid for acquisitions, net of cash acquired | — | — | (96) | ||||||||||||||
| Net cash used in investing activities | (16,931) | (14,037) | (12,206) | ||||||||||||||
| Cash flows from financing activities | |||||||||||||||||
| Proceeds from issuance of common stock in initial public offering, net of underwriting discounts and commissions | — | 399,044 | — | ||||||||||||||
| Payment of initial public offering issuance costs | — | (5,543) | — | ||||||||||||||
| Repayments of debt | (8,350) | (323,350) | (8,350) | ||||||||||||||
| Borrowings on line of credit | — | 30,000 | 50,000 | ||||||||||||||
| Repayments on line of credit | — | (40,000) | (40,000) | ||||||||||||||
| Payment of contingent consideration and holdbacks | — | — | (2,188) | ||||||||||||||
| Payments for termination of interest rate swap agreements | (18,445) | — | — | ||||||||||||||
| Repurchase of common stock | (15,671) | — | — | ||||||||||||||
| Proceeds from issuance of common stock in connection with stock-based compensation plans | 1,506 | — | — | ||||||||||||||
| Taxes paid related to net share settlement of equity awards | (562) | — | — | ||||||||||||||
| Other financing | (399) | (164) | (446) | ||||||||||||||
| Net cash provided by (used in) financing activities | (41,921) | 59,987 | (984) | ||||||||||||||
| Net increase in cash, cash equivalents and restricted cash | 48,876 | 93,424 | 3,236 | ||||||||||||||
| Effect of exchange rates | (1,688) | (1,269) | (357) | ||||||||||||||
| Cash, cash equivalents and restricted cash | |||||||||||||||||
| Beginning of year | 116,214 | 24,059 | 21,180 | ||||||||||||||
| End of year | $ | 163,402 | $ | 116,214 | $ | 24,059 | |||||||||||
| Cash paid for | |||||||||||||||||
| Interest | $ | 41,142 | $ | 65,530 | $ | 71,043 | |||||||||||
| Income taxes | $ | 4,395 | $ | 1,019 | $ | 1,131 | |||||||||||
| Supplemental schedule of non-cash activities | |||||||||||||||||
| Recognition of liability under tax receivable agreement | $ | — | $ | 210,639 | $ | — | |||||||||||
| Unpaid property and equipment and capitalized software purchases | $ | 740 | $ | 1,526 | $ | 1,216 | |||||||||||
| December 31, | |||||||||||
| 2022 | 2021 | ||||||||||
| (in thousands) | |||||||||||
| Prepaid software licenses, maintenance and insurance | $ | 9,237 | $ | 11,668 | |||||||
| Other prepaid expenses and current assets | 9,508 | 6,915 | |||||||||
| Total prepaid expenses and other current assets | $ | 18,745 | $ | 18,583 | |||||||
| December 31, | |||||||||||
| 2022 | 2021 | ||||||||||
| (in thousands) | |||||||||||
| Contract implementation costs | $ | 17,983 | $ | 17,242 | |||||||
| Other non-current assets | 966 | 969 | |||||||||
| Total other non-current assets | $ | 18,949 | $ | 18,211 | |||||||
| December 31, | |||||||||||
| 2022 | 2021 | ||||||||||
| (in thousands) | |||||||||||
| Computer equipment and purchased software | $ | 28,616 | $ | 59,326 | |||||||
| Equipment | 723 | 3,301 | |||||||||
| Furniture and fixtures | 2,207 | 6,089 | |||||||||
| Leasehold improvements | 3,421 | 7,800 | |||||||||
| Construction in progress | 445 | 711 | |||||||||
| Total | 35,412 | 77,227 | |||||||||
| Less: Accumulated depreciation and amortization | (26,367) | (66,100) | |||||||||
| Total property and equipment, net | $ | 9,045 | $ | 11,127 | |||||||
December 31, 2022 | |||||
December 31, 2022 | |||||
December 31, 2022 | |||||
| Year Ended December 31, | |||||
| (in thousands) | |||||
| 2023 | $ | 6,251 | |||
| 2024 | 3,821 | ||||
| 2025 | 2,327 | ||||
| 2026 | 1,393 | ||||
| 2027 | 1,065 | ||||
| Thereafter | 2,327 | ||||
| Total lease payments | 17,184 | ||||
| Less amount representing interest | (1,620) | ||||
| Total | $ | 15,564 | |||
| Year Ended December 31, | |||||
| (in thousands) | |||||
| 2022 | $ | 6,757 | |||
| 2023 | 6,782 | ||||
| 2024 | 4,030 | ||||
| 2025 | 2,934 | ||||
| 2026 | 2,190 | ||||
| Thereafter | 4,117 | ||||
| Total | $ | 26,810 | |||
| December 31, 2022 | |||||||||||||||||
| Gross | Accumulated Amortization | Net | |||||||||||||||
| (in thousands) | |||||||||||||||||
| Customer relationships | $ | 427,033 | $ | (213,243) | $ | 213,790 | |||||||||||
| Trade names | 105,401 | (31,620) | 73,781 | ||||||||||||||
| Developed software - for internal use | 92,907 | (50,224) | 42,683 | ||||||||||||||
| Databases | 3,876 | (2,532) | 1,344 | ||||||||||||||
| Total intangible assets, net | $ | 629,217 | $ | (297,619) | $ | 331,598 | |||||||||||
| December 31, 2021 | |||||||||||||||||
| Gross | Accumulated Amortization | Net | |||||||||||||||
| (in thousands) | |||||||||||||||||
| Customer relationships | $ | 432,606 | $ | (167,885) | $ | 264,721 | |||||||||||
| Trade names | 105,401 | (24,594) | 80,807 | ||||||||||||||
| Developed software - for internal use | 80,854 | (38,480) | 42,374 | ||||||||||||||
| Databases | 3,392 | (1,811) | 1,581 | ||||||||||||||
| Favorable contracts | 1,497 | (1,497) | — | ||||||||||||||
| Total intangible assets, net | $ | 623,750 | $ | (234,267) | $ | 389,483 | |||||||||||
| Year Ended December 31, | |||||
| (in thousands) | |||||
| 2023 | $ | 66,772 | |||
| 2024 | 66,603 | ||||
| 2025 | 63,023 | ||||
| 2026 | 56,361 | ||||
| 2027 | 30,483 | ||||
| Thereafter | 48,356 | ||||
| Total amortization | $ | 331,598 | |||
| December 31, | |||||||||||
| 2022 | 2021 | ||||||||||
| (in thousands) | |||||||||||
| Accrued data costs | $ | 34,080 | $ | 34,632 | |||||||
Other (1) | 41,128 | 40,662 | |||||||||
| Total accrued expenses and other current liabilities | $ | 75,208 | $ | 75,294 | |||||||
| December 31, | |||||||||||
| 2022 | 2021 | ||||||||||
| (in thousands) | |||||||||||
| Wages, benefits and taxes | $ | 15,198 | $ | 12,017 | |||||||
| Accrued bonus | 15,877 | 17,263 | |||||||||
| Total accrued salaries and payroll | $ | 31,075 | $ | 29,280 | |||||||
| December 31, | |||||||||||
| 2022 | 2021 | ||||||||||
| (in thousands) | |||||||||||
| Amended First Lien Term Loan Facility | $ | 699,513 | $ | 707,863 | |||||||
| Amended Revolving Credit Facility | — | — | |||||||||
| Total debt | 699,513 | 707,863 | |||||||||
| Less: Original issue discount | (1,464) | (1,993) | |||||||||
| Less: Unamortized debt issuance costs | (6,493) | (8,837) | |||||||||
| Less: Current portion of long-term debt | (8,350) | (8,350) | |||||||||
| Long-term debt, less current portion | $ | 683,206 | $ | 688,683 | |||||||
Other Transactions with Affiliates
| Year Ended December 31, | ||||||||||||||||||||
| 2022 | 2021 | 2020 | ||||||||||||||||||
| (in thousands) | ||||||||||||||||||||
| Debt discount amortization | $ | 529 | $ | 571 | $ | 552 | ||||||||||||||
| Debt issuance costs amortization | 2,344 | 2,588 | 2,525 | |||||||||||||||||
| Total debt discount and issuance costs | $ | 2,873 | $ | 3,159 | $ | 3,077 | ||||||||||||||
| Year Ended December 31, | |||||
| (in thousands) | |||||
| 2023 | $ | 8,350 | |||
| 2024 | 8,350 | ||||
| 2025 | 682,812 | ||||
| 2026 | — | ||||
| 2027 | — | ||||
| Thereafter | — | ||||
| $ | 699,512 | ||||
| December 31, 2022 | December 31, 2021 | ||||||||||||||||||||||
| Carrying Value | Fair Value | Carrying Value | Fair Value | ||||||||||||||||||||
| (in thousands) | |||||||||||||||||||||||
| Amended First Lien Term Loan Facility | $ | 698,049 | $ | 673,617 | $ | 705,870 | $ | 704,550 | |||||||||||||||
| Amended Revolving Credit Facility | — | — | — | — | |||||||||||||||||||
| Total | $ | 698,049 | $ | 673,617 | $ | 705,870 | $ | 704,550 | |||||||||||||||
| Year Ended December 31, | |||||||||||||||||
| 2022 | 2021 | 2020 | |||||||||||||||
| (in thousands) | |||||||||||||||||
| Reclassification of the effective portion of the gain on the Interest Rate Swap Agreements into interest expense | $ | 1,679 | $ | 19,723 | $ | 16,017 | |||||||||||
| Reclassification of unrealized gains related to terminated Interest Rate Swap Agreements into interest expense | (12,634) | — | — | ||||||||||||||
| Total reclassification adjustments included in earnings | $ | (10,955) | $ | 19,723 | $ | 16,017 | |||||||||||
| December 31, 2021 | |||||||||||||||||||||||
| (in thousands) | |||||||||||||||||||||||
| Markets for Identical Assets (Level 1) | Observable Inputs (Level 2) | Unobservable Inputs (Level 3) | Total | ||||||||||||||||||||
| Derivative instruments, short-term | $ | — | $ | 16,662 | $ | — | $ | 16,662 | |||||||||||||||
| Derivative instruments, long-term | — | 11,444 | — | 11,444 | |||||||||||||||||||
| Total liabilities measured at fair value | $ | — | $ | 28,106 | $ | — | $ | 28,106 | |||||||||||||||
| Derivative Instruments | Currency Translation Adjustment | Total | |||||||||||||||||||||
| (in thousands) | |||||||||||||||||||||||
Balance at December 31, 2020 | $ | (13,646) | $ | 3,523 | $ | (10,123) | |||||||||||||||||
| Other comprehensive income (loss) | 25,469 | (2,726) | 22,743 | ||||||||||||||||||||
Balance at December 31, 2021 | $ | 11,823 | $ | 797 | $ | 12,620 | |||||||||||||||||
| Other comprehensive loss | (2,974) | (14,590) | (17,564) | ||||||||||||||||||||
| Balance at December 31, 2022 | $ | 8,849 | $ | (13,793) | $ | (4,944) | |||||||||||||||||
| Year Ended December 31, | |||||||||||||||||||||||||||||||||||
| 2022 | 2021 | 2020 | |||||||||||||||||||||||||||||||||
| (in thousands, except percent) | |||||||||||||||||||||||||||||||||||
| Revenues | |||||||||||||||||||||||||||||||||||
| United States | $ | 744,216 | 92.3 | % | $ | 675,073 | 92.5 | % | $ | 504,950 | 93.5 | % | |||||||||||||||||||||||
| International | 62,452 | 7.7 | % | 54,983 | 7.5 | % | 35,274 | 6.5 | % | ||||||||||||||||||||||||||
| Total revenue | $ | 806,668 | 100.0 | % | $ | 730,056 | 100.0 | % | $ | 540,224 | 100.0 | % | |||||||||||||||||||||||
| December 31, | |||||||||||
| 2022 | 2021 | ||||||||||
| (in thousands) | |||||||||||
| Long-lived assets: | |||||||||||
| United States | $ | 10,811 | $ | 7,154 | |||||||
| International | 6,657 | 3,973 | |||||||||
| Total long-lived assets | $ | 17,468 | $ | 11,127 | |||||||
| Year Ended December 31, | |||||||||||||||||
| 2022 | 2021 | 2020 | |||||||||||||||
| (in thousands) | |||||||||||||||||
| Revenues | |||||||||||||||||
| Service revenues | $ | 577,796 | $ | 541,458 | $ | 404,812 | |||||||||||
| Surcharge revenues | 228,872 | 188,598 | 135,412 | ||||||||||||||
| Total revenues | $ | 806,668 | $ | 730,056 | $ | 540,224 | |||||||||||
| Balance Beginning of Period | Charged to Expense | Deductions | Balance End of Period | ||||||||||||||||||||
| (in thousands) | |||||||||||||||||||||||
| Year ended December 31, 2022 | $ | 4,284 | $ | 1,929 | $ | (401) | $ | 5,812 | |||||||||||||||
| Year ended December 31, 2021 | $ | 3,919 | $ | 1,073 | $ | (708) | $ | 4,284 | |||||||||||||||
| Year ended December 31, 2020 | $ | 3,499 | $ | 930 | $ | (510) | $ | 3,919 | |||||||||||||||
| Year Ended December 31, | ||||||||||||||||||||
| 2022 | 2021 | 2020 | ||||||||||||||||||
| (in thousands) | ||||||||||||||||||||
| Income (loss) before income taxes: | ||||||||||||||||||||
| U.S. | $ | 65,786 | $ | (11,100) | $ | (85,223) | ||||||||||||||
| Foreign | (264) | (7,517) | (2,916) | |||||||||||||||||
| Income (loss) before income taxes | $ | 65,522 | $ | (18,617) | $ | (88,139) | ||||||||||||||
| Income tax expense (benefit): | ||||||||||||||||||||
| Current income taxes: | ||||||||||||||||||||
| U.S. federal | $ | — | $ | — | $ | (85) | ||||||||||||||
| U.S. state | 1,769 | 445 | 672 | |||||||||||||||||
| Foreign | 1,837 | 756 | 448 | |||||||||||||||||
| Total current income tax expense | 3,606 | 1,201 | 1,035 | |||||||||||||||||
| Deferred income taxes: | ||||||||||||||||||||
| U.S. federal | (56,754) | 545 | 1,669 | |||||||||||||||||
| U.S. state | (24,780) | 1,653 | 1,901 | |||||||||||||||||
| Foreign | (1,124) | (713) | (667) | |||||||||||||||||
| Total deferred income tax (benefit) expense | (82,658) | 1,485 | 2,903 | |||||||||||||||||
| Total income tax (benefit) expense | $ | (79,052) | $ | 2,686 | $ | 3,938 | ||||||||||||||
| Year Ended December 31, | ||||||||||||||||||||
| 2022 | 2021 | 2020 | ||||||||||||||||||
| Income tax expense (benefit) and rate attributable to: | % | % | % | |||||||||||||||||
| U.S. federal income tax | 21.0 | % | (21.0) | % | (21.0) | % | ||||||||||||||
| U.S. state income tax, net of federal benefit | 4.9 | % | 2.3 | % | (1.5) | % | ||||||||||||||
| Change in valuation allowances | (147.5) | % | (0.4) | % | 25.5 | % | ||||||||||||||
| U.S. tax on foreign operations | 0.2 | % | 19.4 | % | 0.8 | % | ||||||||||||||
| Change in tax rates | — | % | 6.6 | % | 0.8 | % | ||||||||||||||
| Non-deductible IPO costs | — | % | 5.6 | % | — | % | ||||||||||||||
| Non-deductible stock compensation | 3.1 | % | — | % | — | % | ||||||||||||||
| Research and development tax credits | (1.3) | % | — | % | — | % | ||||||||||||||
| Recognition of stranded deferred tax balances | (1.3) | % | — | % | — | % | ||||||||||||||
| Other | 0.3 | % | 1.9 | % | (0.1) | % | ||||||||||||||
| Effective income tax rate | (120.6) | % | 14.4 | % | 4.5 | % | ||||||||||||||
| December 31, | |||||||||||
| 2022 | 2021 | ||||||||||
| (in thousands) | |||||||||||
| Deferred tax assets: | |||||||||||
| Income tax loss carryforwards | $ | 66,135 | $ | 83,342 | |||||||
| Accrued expenses and other liabilities | 5,485 | 7,500 | |||||||||
| Interest expense carryovers | 38,449 | 38,444 | |||||||||
| Interest rate swap | — | 2,188 | |||||||||
| Stock-based compensation | 3,497 | 3,270 | |||||||||
| Other | 1,225 | 581 | |||||||||
| Total deferred tax assets | 114,791 | 135,325 | |||||||||
| Valuation allowances | (1,455) | (100,339) | |||||||||
| Net deferred tax assets | 113,336 | 34,986 | |||||||||
| Deferred tax liabilities: | |||||||||||
| Property and equipment | (2,073) | (5,120) | |||||||||
| Capitalized expenses | (4,618) | (4,414) | |||||||||
| Intangible assets | (38,157) | (40,217) | |||||||||
| Total deferred tax liabilities | (44,848) | (49,751) | |||||||||
| Net deferred tax assets (liabilities) | $ | 68,488 | $ | (14,765) | |||||||
Certain transactions betweenwith various entities owned by the Company and its affiliated entitiesCompany’s Principal Stockholders are considered related party transactions. The Company’s affiliates include various entities owned by the same pre-IPO equityholders who hold ownership in the Company.
Director Independence
The Board of Directors has determined that Venkat Bhamidipati, James Carey, Mark Dzialga, Josh Feldman, Rene Kern, Larry Kutscher, James LaPlaine, James Matthews, Jill Smart and Lisa Troe are independent directors, as such term is defined by the issuanceapplicable rules and regulations of the NYSE. Three of the foregoing individuals, Venkat Bhamidipati, Mark Dzialga and Lisa Troe, make up to 4,573,463the Company’s Audit Committee. The Board of its Class A Units (“Units”) pursuant to awards made under the Equity Plan toDirectors determined that all members of the board of managers, officers and employees as determined byAudit Committee meet the Company’s compensation committee. Following the adoption of the Omnibus Incentive Plan (as defined below), the Company did not grant further awards under the Equity Plan. However, any outstanding awards granted under the Equity Plan remain subject to the Equity Plan and applicable award agreement. In connection with the Corporate Conversion, each option to purchase units of HireRight GIS Group Holdings LLC was converted into an option to purchase shares of common stock of HireRight Holdings Corporation.
| December 31, | ||||||||||||||||||||
| 2022 | 2021 | 2020 | ||||||||||||||||||
| (in thousands) | ||||||||||||||||||||
| Selling, general and administrative | $ | 10,739 | $ | 4,528 | $ | 3,218 | ||||||||||||||
| Cost of services (exclusive of depreciation and amortization) | 735 | — | — | |||||||||||||||||
| Total stock-based compensation expense | $ | 11,474 | $ | 4,528 | $ | 3,218 | ||||||||||||||
| Year Ended December 31, | |||||||||||
| 2021 | 2020 | ||||||||||
| Dividend yield | NA | NA | |||||||||
| Expected term | 5 Years | 5 Years | |||||||||
| Risk-free interest rate | 0.5 | % | 2.1 | % | |||||||
| Expected volatility | 43.3 | % | 42.5 | % | |||||||
| Number of Options | Weighted Average Exercise Price | Weighted- Average Remaining Contractual Term (in years) | Aggregate Intrinsic Value | ||||||||||||||||||||
| Stock options | |||||||||||||||||||||||
| Options outstanding at December 31, 2021 | 3,760,319 | $ | 16.32 | ||||||||||||||||||||
| Options granted | — | — | |||||||||||||||||||||
| Options exercised | (50,291) | 15.97 | |||||||||||||||||||||
| Options cancelled/forfeited | (81,510) | 16.10 | |||||||||||||||||||||
| Options outstanding at December 31, 2022 | 3,628,518 | $ | 16.33 | 6.01 | $ | — | |||||||||||||||||
| Options vested and exercisable at December 31, 2022 | 2,180,758 | $ | 16.24 | 5.87 | $ | — | |||||||||||||||||
Options vested and expected to vest | 3,628,518 | $ | 16.33 | 6.01 | $ | — | |||||||||||||||||
| Year Ended December 31, | |||||||||||
| 2022 | 2021 | ||||||||||
| Dividend yield | — | — | |||||||||
| Expected term | 5.5 - 6.11 Years | 6.11 Years | |||||||||
| Risk-free interest rate | 1.74% - 4.35% | 1.30 | % | ||||||||
| Expected volatility | 28.67% - 30.83% | 28.79 | % | ||||||||
| Number of Options | Weighted Average Exercise Price | Weighted- Average Remaining Contractual Term (in years) | Aggregate Intrinsic Value | ||||||||||||||||||||
| Stock options | |||||||||||||||||||||||
| Options outstanding at December 31, 2021 | 1,889,313 | $ | 19.00 | ||||||||||||||||||||
| Options granted | 1,197,596 | 15.40 | |||||||||||||||||||||
| Options exercised | — | — | |||||||||||||||||||||
| Options cancelled/forfeited | (45,836) | 19.00 | |||||||||||||||||||||
| Options outstanding at December 31, 2022 | 3,041,073 | $ | 17.58 | 9.15 | $ | 129,187 | |||||||||||||||||
| Options vested and exercisable at December 31, 2022 | 461,236 | $ | 19.00 | 8.81 | $ | — | |||||||||||||||||
Options vested and expected to vest | 3,041,073 | $ | 17.58 | 9.15 | $ | 129,187 | |||||||||||||||||
| Number of Shares | Weighted Average Grant Date Fair Value | ||||||||||
| Unvested as of December 31, 2021 | 710,735 | $ | 18.97 | ||||||||
| Granted | 1,974,670 | 12.03 | |||||||||
| Vested | (192,978) | 18.83 | |||||||||
| Cancelled/forfeited | (78,896) | 16.13 | |||||||||
| Unvested as of December 31, 2022 | 2,413,531 | $ | 13.40 | ||||||||
| Year Ended December 31, | |||||||||||||||||
| 2022 | 2021 | 2020 | |||||||||||||||
| (in thousands, except per share data) | |||||||||||||||||
| Numerator: | |||||||||||||||||
| Net income (loss) | $ | 144,574 | $ | (21,303) | $ | (92,077) | |||||||||||
| Denominator: | |||||||||||||||||
| Weighted average shares outstanding - basic | 79,344,547 | 60,821,472 | 57,168,291 | ||||||||||||||
| Effect of dilutive equity awards | 98,716 | — | — | ||||||||||||||
| Weighted average shares outstanding - diluted | 79,443,263 | 60,821,472 | 57,168,291 | ||||||||||||||
| Net income (loss) per share: | |||||||||||||||||
| Basic | $ | 1.82 | $ | (0.35) | $ | (1.61) | |||||||||||
| Diluted | $ | 1.82 | $ | (0.35) | $ | (1.61) | |||||||||||
| ITEM 14. | PRINCIPAL ACCOUNTANT FEES AND SERVICES |
Fees paid or accrued for professional services provided by our independent auditors, PricewaterhouseCoopers LLP (Nashville, Tennessee, PCAOB ID 238), in each of the categories listed are as of December 31, 2022. Based onfollows for the evaluation, our Chief Executive Officer and Chief Financial Officer concluded that our disclosure controls and procedures were effective at the reasonable assurance level as of December 31, 2022.
| Years Ending December 31 | |||||||
| Fee Category | 2023 | 2022 | ||||||
| Audit Fees | $ | 2,694,329 | $ | 3,217,436 | ||||
| Audit-Related Fees | $ | — | $ | — | ||||
| Tax Fees | $ | 51,250 | $ | 133,644 | ||||
| All Other Fees | $ | 7,215 | $ | 27,140 | ||||
| Total | $ | 2,752,794 | $ | 3,378,220 | ||||
Audit Fees— primarily represent amounts for services related to the maintenanceaudit of records that, in reasonable detail, accurately and fairly reflect the transactions and dispositions of the assets of our Company; (2) provide reasonable assurance that transactions are recorded as necessary to permit preparation of consolidated financial statements, in accordance with GAAP, and that receipts and expendituresreviews of our Company are being made only in accordance with authorizations of our management and directors; and (3) provide reasonable assurance regarding prevention or timely detection of the unauthorized acquisition, use or disposition of our Company’s assets that could have a material effect on theinterim condensed consolidated financial statements.statements, services provided in connection with statutory or regulatory filings or engagements and the issuance of consents and comfort letters for other periodic reports or documents filed with the SEC.
All Other Fees— consist of all fees for services other than those in the above categories and primarily consist of annual licensing fees, including our Chief Executive Officerfees for subscription to PricewaterhouseCoopers’ online research tools.
Pre-Approval Policies
The Audit Committee has adopted a pre-approval policy that provides guidelines for the audit, audit-related, tax, and Chief Financial Officer, assessed the effectiveness of our internal control over financial reporting as of December 31, 2022. In making this assessment, our management used the criteria established in Internal Control-Integrated Framework (2013) issuedother permissible non-audit services that may be provided by the Committee of Sponsoring Organizations ofindependent auditors. Under the Treadway Commission (COSO). Our management has concluded, based on its assessment, that our internal control over financial reporting was effective as of December 31, 2022.
| ITEM 15. | EXHIBITS AND FINANCIAL STATEMENT SCHEDULES |
Exhibit Number | Exhibit Description | |||||||
| 3.1# | ||||||||
| 3.2# | ||||||||
| 4.2# | ||||||||
| 10.1# | ||||||||
| 10.4#+ | ||||||||
| 10.5#+ | ||||||||
| 10.6#+ | ||||||||
| 10.7#+ | ||||||||
| 10.8#+ | ||||||||
| 10.9#+ | ||||||||
| 10.10**+ | ||||||||
| 10.22 | ||
| 10.23 | ||
| 10.24*+ | ||
| 10.25*+ | ||
| 10.26*+ | ||
| 10.30*+ | ||
| 10.31*+ | ||
| 10.32*+ | ||
| 10.34*+ | ||
| 10.35*+ | ||
| 10.36*+ | ||
| 10.37*+ | ||
| 10.38*+ | ||
| 10.39*+ | ||
| 10.40*+ | ||
| 14.1** | ||
| 21.1^ | ||
| 31.4* | ||
| 32.1^ | ||
| 32.2* | ||
| 97.1^ |
| * | ||||||||
Filed herewith. | ||||||||
| # | Incorporated by reference to the same titled exhibit to the Registrant’s Registration Statement on Form S-1 filed with the Securities and Exchange Commission on October 6, 2021. | |||
| ## | Incorporated by reference to the same titled exhibit to the Registrant’s Registration Statement on Form S-1 filed with the Securities and Exchange Commission on October 20, 2021. |
| ** | Incorporated by reference to the same titled exhibit to the Registrant’s Annual Report on Form 10-K filed with the Securities and Exchange Commission on March 21, | |||
| + | Indicates a management contract or compensatory plan or agreement. | |||
| ^ | Incorporated by reference to the same titled exhibit to the Registrant’s Annual Report on Form 10-K filed with the Securities and Exchange Commission on March 12, 2024. |
Pursuant to the requirements of Section 13 or 15(d) of the Securities Exchange Act of 1933,1934, the registrant has duly caused this Registration Statementreport to be signed on its behalf by the undersigned, thereunto duly authorized, in the City of Nashville, State of Tennessee, Tennessee.
on March 9, 2023.April 16, 2024.
| By: | |||||
| /s/ Guy P. Abramo | |||||
| Name: | Guy P. Abramo | ||||
| Title: | President and Chief Executive Officer | ||||
***
Pursuant to the requirements of the Securities Exchange Act of 1934, this report has been signed below by the following persons on behalf of the registrant and in the capacities and on the dates indicated. Each of the directors of the registrant whose signature appears below hereby appoints Guy P. Abramo, Brian W. Copple and Thomas M. Spaeth, and each of them severally, as his or her attorney-in-fact to sign in his or her name and behalf, in any and all capacities stated below, and to file with the Securities and Exchange Commission any and all amendments to this report, making such changes in this report as appropriate, and generally to do all such things on their behalf in their capacities as directors and/or officers to enable the registrant to comply with the provisions of the Securities Exchange Act of 1934, and all requirements of the Securities and Exchange Commission.
| Signature | Title | Date | ||||||||||||
| /s/ Guy P. Abramo | President and Chief Executive Officer | April 16, 2024 | ||||||||||||
| Guy P. Abramo | (Principal Executive Officer) | |||||||||||||
| /s/ Thomas M. Spaeth | Chief Financial Officer | April 16, 2024 | ||||||||||||
| Thomas M. Spaeth | (Principal Financial Officer) | |||||||||||||
| /s/ Laurie Blanton | Chief Accounting Officer | April 16, 2024 | ||||||||||||
| Laurie Blanton | (Principal Accounting Officer) | |||||||||||||