UNITED STATES
SECURITIES AND EXCHANGE COMMISSION
Washington, D.C. 20549
FORM 10-K
(Mark One)
| | | | | |
| ☒ | ANNUAL REPORT PURSUANT TO SECTION 13 OR 15(d) OF THE SECURITIES EXCHANGE ACT OF 1934 |
For the fiscal year ended December 31, 20222023
OR
| | | | | |
| ☐ | TRANSITION REPORT PURSUANT TO SECTION 13 OR 15(d) OF THE SECURITIES EXCHANGE ACT OF 1934 |
For transition period from to
Commission File Number 001-41132
Crescent Energy Company
(Exact name of registrant as specified in its charter)
| | | | | | | | |
| Delaware | | 87-1133610 |
(State or other jurisdiction of incorporation or organization) | | (I.R.S. Employer Identification Number) |
600 Travis Street, Suite 7200
Houston, Texas 77002
(713) 337-4600
(Address, including zip code, and telephone number, including area code, of registrant’s principal executive offices)
Securities registered pursuant to Section 12(b) of the Act:
| | | | | | | | | | | | | | |
| Title of each class | | Trading Symbol | | Name of each exchange on which registered |
| Class A Common Stock, par value $0.0001 | | CRGY | | New York Stock Exchange |
Indicate by check mark if the registrant is a well-known seasoned issuer, as defined in Rule 405 of the Securities Act. Yes ☐☒ No ☒☐
Indicate by check mark if the registrant is not required to file reports pursuant to Section 13 or Section 15(d) of the Act Yes ☐ No ☒
Indicate by check mark whether the Registrant (1) has filed all reports required to be filed by Section 13 or 15(d) of the Securities Exchange Act of 1934 during the preceding 12 months (or for such shorter period that the Registrant was required to file such reports), and (2) has been subject to such filing requirements for the past 90 days. Yes ☒ No ☐
Indicate by check mark whether the Registrant has submitted electronically every Interactive Data File required to be submitted pursuant to Rule 405 of Regulation S-T (§232.405 of this chapter) during the preceding 12 months (or for such shorter period that the Registrant was required to submit such files). Yes ☒ No ☐
Indicate by check mark whether the registrant is a large accelerated filer, an accelerated filer, a non-accelerated filer, a smaller reporting company or an emerging growth company. See the definitions of “large accelerated filer,” “accelerated filer,” “smaller reporting company” and “emerging growth company” in Rule 12b-2 of the Exchange Act.
| | | | | | | | | | | |
| Large accelerated filer | ☐ | Accelerated filer | ☒ |
| Non-accelerated filer | ☐ | Smaller reporting company | ☐ |
| | Emerging growth company | ☐ |
If an emerging growth company, indicate by check mark if the registrant has elected not to use the extended transition period for complying with any new or revised financial accounting standards provided pursuant to Section 7(a)(2)(B) of the Securities Act. ☐
Indicate by check mark whether the registrant has filed a report on and attestation to its management’s assessment of the effectiveness of its internal control over financial reporting under Section 404(b) of the Sarbanes-Oxley Act (15 U.S.C. 7262(b)) by the registered public accounting firm that prepared or issued its audit report. ☒
Indicate by check mark whether the registrant is a shell company (as defined in Rule 12b-2 of the Exchange Act): Yes ☐ No ☒
If securities are registered pursuant to Section 12(b) of the Act, indicate by check mark whether the financial statements of the registrant included in the filing reflect the correction of an error to previously issued financial statements. ☐
Indicate by check mark whether any of those error corrections are restatements that required a recovery analysis of incentive-based compensation received by any of the registrant’s executive officers during the relevant recovery period pursuant to §240.10D-1(b). ☐
Indicate by check mark whether the registrant is a shell company (as defined in Rule 12b-2 of the Exchange Act): Yes ☐ No ☒
The aggregate market value of Class A common stock outstanding held by non-affiliates of the registrant on June 30, 2022,2023, based on the closing price of $12.48$10.42 for shares of the registrant’s Class A common stock as reported by the New York Stock Exchange, was approximately $402.3$395.0 million.
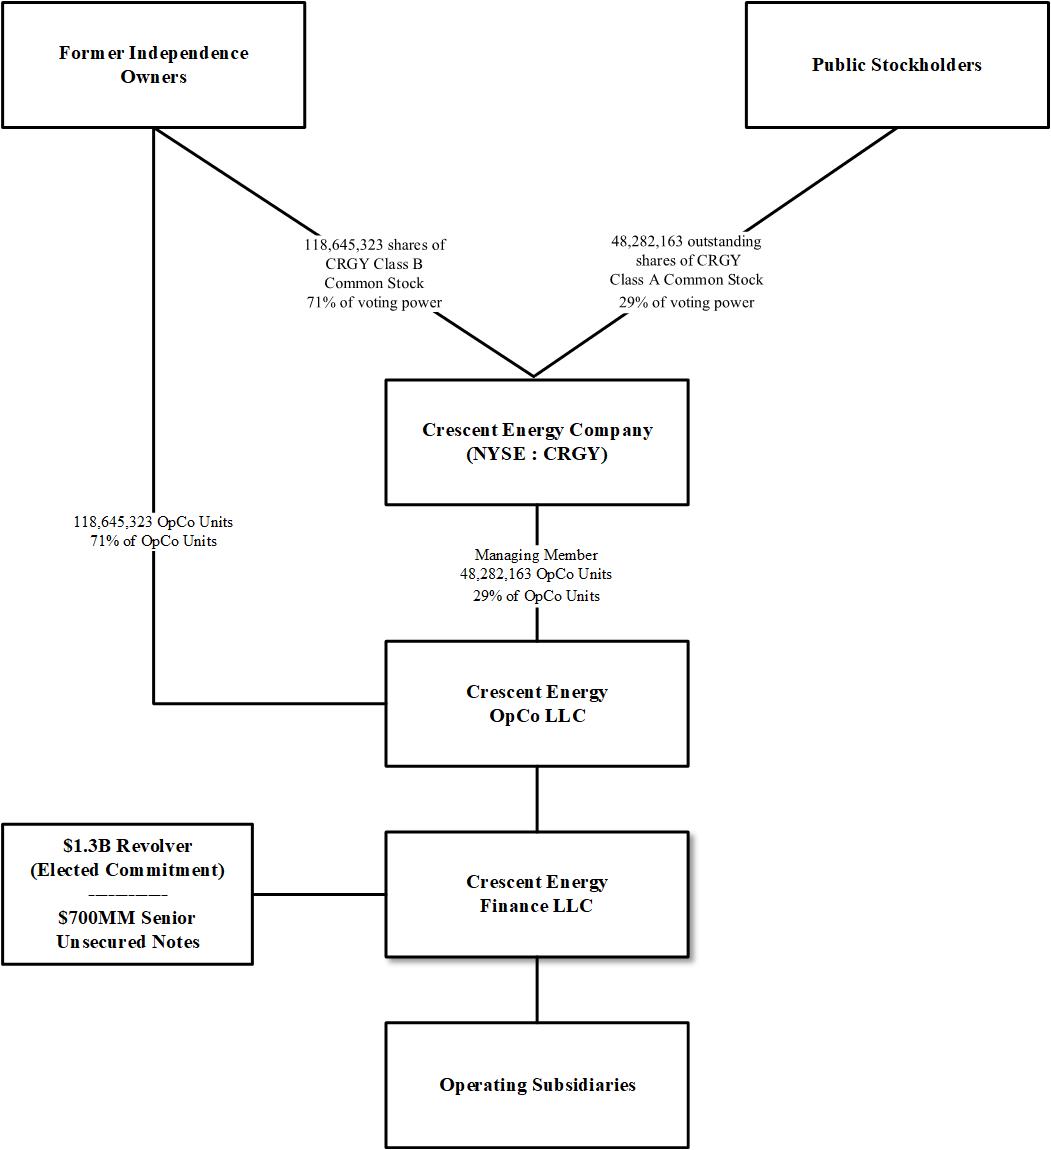
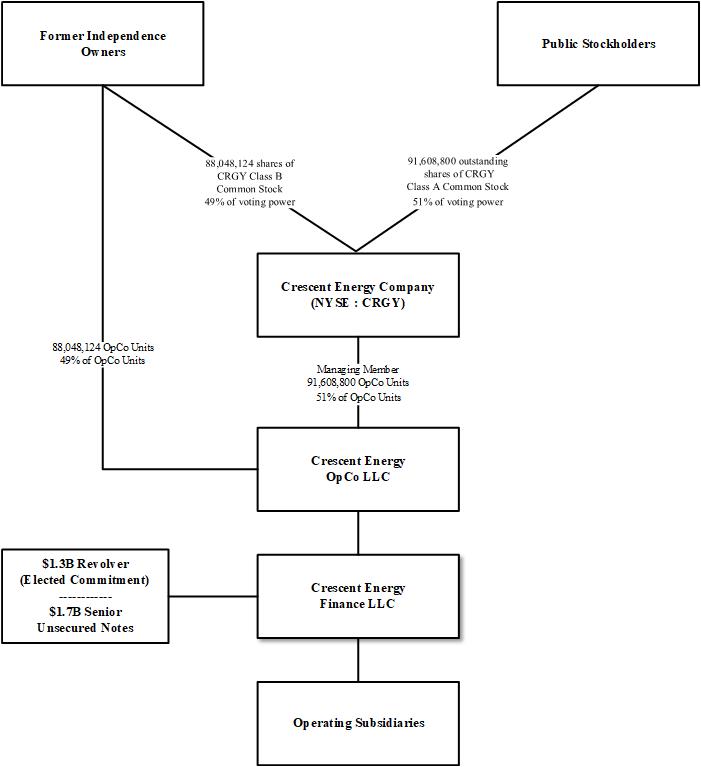
As of February 28, 2023,29, 2024, there were approximately 48,282,16391,608,800 and 118,645,32388,048,124 shares of the registrant's Class A and Class B common stock outstanding, respectively.
Where You Can Find More Information
Crescent Energy Company ("we," "us," or the "Company") files annual, quarterly and current reports with the SEC. The SEC maintains an Internetinternet site at www.sec.gov that contains reports, proxy and information statements and other information regarding issuers that file electronically with the SEC, including the Company.
Investors can also access financial and other information via our website at www.crescentenergyco.com. The Company makes available, free of charge through the website, copies of Annual Reports on Form 10-K, Quarterly Reports on Form 10-Q, Current Reports on Form 8-K and any amendments to such reports, our environmental, social, and governance (“ESG”)sustainability reports and all reports filed by executive officers and directors under Section 16 of the Exchange Act reporting transactions in the Company's securities. Access to these reports is provided as soon as reasonably practical after such reports are electronically filed with the SEC. In addition to its reports filed or furnished with the SEC, the Company publicly discloses material information from time to time in its press releases, in publicly accessible conferences and investor presentations, and through its website. Information contained on or connected to our website which is not directly incorporated by reference into this Annual Report on Form 10-K (this "Annual Report") should not be considered part of this report or any other filing made with the SEC.
Crescent Energy Company's website also can be used to access copies of charters for its board committees, including the Nominating & Governance Committee, Compensation Committee and Audit Committee, and governance documents, including our Corporate Governance Guidelines and our Code of Business Conduct and Ethics, free of charge. Additionally, we intendInformation contained on or connected to make futureour website which is not directly incorporated by reference into this Annual Reports, Quarterly ReportsReport on Form 10-Q, Current Reports on Form 8-K and amendments to those reports as soon as reasonably practical after the filing of such reports available on our website. Our website is maintained at www.crescentenergyco.com. While the Company recommends that you view Crescent Energy Company's website, the information available on our website is10-K (this "Annual Report") should not be considered part of this report and is not incorporated herein by reference.or any other filing made with the SEC.
You may request a copy of filings other than an exhibit to a filing unless that exhibit is specifically incorporated by reference into that filing, at no cost by writing or calling Crescent Energy Company, 600 Travis Street, Suite 7200, Houston, TX 77002 (telephone number: 713-337-4600).
Table of Contents
Cautionary Statement Regarding Forward-Looking Statements
The information in this Annual Report contains or incorporates by reference information that includes or is based upon "forward-looking statements" within the meaning of Section 27A of the Securities Act, , and Section 21E of the Exchange Act. All statements, other than statements of historical facts, included herein concerning, among other things, planned capital expenditures, increases in oil, natural gas and natural gas liquids (“NGL”) production, the number of anticipated wells to be drilled or completed after the date hereof, future cash flows and borrowings, pursuit of potential acquisition opportunities, our financial position, business strategy and other plans and objectives for future operations, are forward-looking statements. These forward-looking statements are identified by their use of terms and phrases such as “may,” “expect,” “estimate,” “project,” “plan,” “believe,” “intend,” “achievable,” “anticipate,” “will,” “continue,” “potential,” “should,” “could,” and similar terms and phrases. Although we believe that the expectations reflected in these forward-looking statements are reasonable, they do involve certain assumptions, risks and uncertainties. Our results could differ materially from those anticipated in these forward-looking statements as a result of certain factors, including, among others:
•commodity price volatility;
•our business strategy;
•our ability to identify and select possible additional acquisition and disposition opportunities;
•capital requirements and uncertainty of obtaining additional funding on terms acceptable to us;
•risks and restrictions related to our debt agreements and the level of our indebtedness;
•our reliance on KKR Energy Assets Manager LLC as our external manager;
•our hedging strategy and results;
•realized oil, natural gas and NGL prices;
•political and economic conditions and events in the U.S. and in foreign oil, natural gas and NGL producing countries, including embargoes, upcoming elections and associated political volatility, continued hostilities in the Middle East, including the Israel-Hamas conflict, and other sustained military campaigns, the armed conflict in Ukraine and associated economic sanctions on Russia, conditions in South America, Central America and China and acts of terrorism or sabotage;
•general economic conditions, including the impact of continued inflation, elevated interest rates and associated changes in monetary policy;
•the length, scope,impact of central bank policy actions and disruptions in the banking industry and capital markets;
•the severity and duration of the ongoing coronavirus disease 2019 (“COVID-19”) pandemic, including the effects of related public health concernscrises and theany resultant impact of continuedon governmental actions, taken by governmental authorities and other third parties in response to the pandemic and its impact on commodity prices, supply and demand considerations, and storage capacity;
•timing and amount of our future production of oil, natural gas and NGLs;
•a decline in oil, natural gas and NGL production, and the impact of general economic conditions on the demand for oil, natural gas and NGLs and the availability of capital;
•unsuccessful drilling and completion (“D&C”) activities and the possibility of resulting write downs;
•our ability to meet our proposed drilling schedule and to successfully drill wells that produce oil, natural gas and NGLs in commercially viable quantities;
•shortages of equipment, supplies, services and qualified personnel and increased costs for such equipment, supplies, services and personnel;personnel, including any delays and/or supply chain disruptions due to increased hostilities in the Middle East;
•adverse variations from estimates of reserves, production, prices and expenditure requirements, and our inability to replace our reserves through exploration and development activities;
•incorrect estimates associated with properties we acquire relating to estimated proved reserves, the presence or recoverability of estimated oil, natural gas and NGL reserves and the actual future production rates and associated costs of such acquired properties;
•hazardous, risky drilling operations, including those associated with the employment of horizontal drilling techniques, and adverse weather and environmental conditions;
•limited control over non-operated properties;
•title defects to our properties and inability to retain our leases;
•our ability to successfully develop our large inventory of undeveloped acreage;
•our ability to retain key members of our senior management and key technical employees;
•risks relating to managing our growth, particularly in connection with the integration of significant acquisitions; including the Western Eagle Ford Assets;
•risks related to the Western Eagle Ford Acquisitions (as defined herein), including the risk that we may fail to realize the expected benefits of the Western Eagle Ford Acquisitions;
•our ability to successfully execute our growth strategies;
•impact of environmental, occupational health and safety, and other governmental regulations, and of current or pending legislation including as a resultthat may negatively impact the future production of oil and natural gas or drive the recent change in presidential administrations;substitution of renewable forms of energy for oil and natural gas;
•federal and state regulations and laws, including the IRAInflation Reduction Act of 2022 (as defined herein)(the "IRA 2022");
•our ability to predict and manage the effects of actions of the OPEC and agreements to set and maintain production levels;levels, including as a result of recent production cuts by OPEC, which may be exacerbated by the increased hostilities in the Middle East;
•information technology failures or cyberattacks;
•changes in tax laws;
•effects of competition; and
•seasonal weather conditions.
We caution you that these forward-looking statements are subject to all of the risks and uncertainties incident to the development, production, gathering and sale of oil, natural gas and NGLs, most of which are difficult to predict and many of which are beyond our control. These risks include, but are not limited to, commodity price volatility, inflation, lack of availability and cost of drilling and production equipment and services, project construction delays, environmental risks, drilling and other operating risks, lack of availability or capacity of midstream gathering and transportation infrastructure, regulatory changes, the uncertainty inherent in estimating reserves and in projecting future rates of production, cash flow and access to capital, including restrictions due to elevated interest rates, the timing of development expenditures and the other risks described under “Risk Factors.”
Reserve engineering is a process of estimating underground accumulations of hydrocarbons that cannot be measured in an exact way. The accuracy of any reserve estimates depends on the quality of available data, the interpretation of such data and price and cost assumptions made by reserve engineers. In addition, the results of drilling, testing and production activities may justify revisions of estimates that were made previously. If significant, such revisions would change the schedule of any further production and development program. Accordingly, reserve estimates may differ significantly from the quantities of oil, natural gas and NGLs that are ultimately recovered.
Should one or more of the risks or uncertainties described in this Annual Report occur, or should underlying assumptions prove incorrect, our actual results and plans could differ materially from those expressed in any forward-looking statements. All forward-looking statements, expressed or implied, included in this Annual Report are expressly qualified in their entirety by this cautionary statement. This cautionary statement should also be considered in connection with any subsequent written or oral forward-looking statements that we or persons acting on our behalf may issue. Except as otherwise required by applicable law, we disclaim any duty to update any forward-looking statements, all of which are expressly qualified by the statements in this section, to reflect events or circumstances after the date of this Annual Report.
Risk Factors Summary
The following is a summary of the principal risks that could adversely affect our business, operations and financial results. Please refer to "Part I., Item 1A. Risk Factors" of this Annual Report below for additional discussion of the risks summarized in this Risk Factors Summary.
Risks related to the oil and natural gas industry and our operations
•Oil, natural gas and NGL prices are volatile. A sustained decline in prices could adversely affect our business, financial condition and results of operations, liquidity and our ability to meet our financial commitments or cause us to delay planned capital expenditures.
•Reserve estimates depend on many assumptions that may turn out to be inaccurate. Any material inaccuracies in reserve estimates or underlying assumptions will materially affect the quantities and present value of our reserves.
•Continuing or worsening inflationary issues and associated changes in monetary policy have resulted in and may result in additional increases to the cost of our goods, services and personnel, which in turn could cause our capital expenditures and operating costs to rise.
•The unavailability or high cost of equipment, supplies, personnel and oilfield services, due to commodity price volatility or supply constraints as a result of the conflict in Ukraine, the COVID-19 pandemic, risingHamas' attack against Israel, elevated interest rates and associated policies of the Federal Reserve or otherwise could adversely affect our ability to execute development and exploitation plans on a timely basis and within budget, and consequently could materially and adversely affect our anticipated cash flow.
•We are not the operator on all of our acreage or drilling locations, and, therefore, we will not be able to control the timing of exploration or development efforts, associated costs, or the rate of production of any non-operated assets and
could be liable for certain financial obligations of the operators or any of their contractors to the extent such operators or contractors are unable to satisfy such obligations.
•We have consolidated our business over time through acquisitions, including the Uinta Transaction, and there are risks associated with integration of all of these assets, operations and our ability to manage those risks. In addition, we may be unable to make attractive acquisitions or successfully integrate acquired businesses, assets or properties, and any inability to do so may disrupt its business and hinder its ability to grow.
•Through the Management Agreement, we depend on the Manager and its personnel to manage and operate our business, the loss of any of whom would materially and adversely affect future operations. Additionally, operational risks affecting the Manager, and our ability to work collaboratively with the Manager, including with respect to the
allocation of corporate opportunities and other conflicts of interest, may impact our business and have a material effect on our business, financial results and prospects.
•Events beyond our control, including the recent COVID-19 pandemic or any other future global or domestic health crisis, may result in unexpected adverse operating and financial results.
Risks related to regulatory matters
•The Inflation Reduction Act ofIRA 2022 could accelerate the transition to a low carbon economy and will impose new costs on our operations.
•Our operations are substantially dependent on the availability of water. Restrictions on our ability to obtain water may have a material and adverse effect on its financial condition, results of operations and cash flows.
•Our ability to pursue our business strategies may be adversely affected if we incur costs and liabilities due to a failure to comply with environmental laws or regulations or a release of hazardous substances or other wastes into the environment.
•Unless we replace our reserves with new reserves and develop those reserves, our reserves and production will decline, which may adversely affect our future cash flows.
•Our operations are subject to a series of risks arising from climate change.
•Federal, state and local legislative and regulatory initiatives relating to hydraulic fracturing as well as governmental reviews of such activities could result in increased costs and additional operating restrictions or delays in the completion of oil and natural gas wells and adversely affect our production.
Risks related to our indebtedness
•We are partially dependent on our Revolving Credit Facility and continued access to capital markets to successfully execute our operating strategies.
•We have incurred significant additional indebtedness during recent periods, which may impair our ability to raise further capital or impact our ability to service our debt.
Risks related to our common stock
•Future sales of our Class A Common Stock in the public market, or the perception that such sales may occur, could reduce the price of our Class A Common Stock, and any additional capital raised by the Company through the sale of equity or convertible securities may dilute your ownership in Crescent.
Risks related to our financial condition
•Our hedging activities could result in financial losses or could reduce our net income.
•Certain employees of our operating subsidiaries have profits interests that may require substantial payouts and result in substantial accounting charges.
•Our only principal asset is our interest in OpCo; accordingly, we will depend on distributions and other payments from OpCo to pay taxes, make payments under the Management Agreement and cover our corporate and other overhead expenses.
Risks related to our governance structure
•Our Preferred Stockholder’s significant voting power limits the ability of holders of our common stock to influence our business.
•The Preferred Stockholder’s controlling ownership position may have the effect of delaying or preventing changes in control or changes in management and may adversely affect the trading price of our Class A Common Stock to the extent investors perceive a disadvantage in owning stock of a company with a controlling shareholder.
•Our Certificate of Incorporation designates the Court of Chancery of the State of Delaware as the sole and exclusive forum for certain types of actions and proceedings that may be initiated by stockholders, which could limit our stockholders’ ability to obtain a favorable judicial forum for disputes with us or itsour directors, officers, employees or agents.
•Our Certificate of Incorporation provides that the Preferred Stockholder is, to the fullest extent permitted by law, under no obligation to consider the separate interests of the other stockholders and will contain provisions limiting the liability of the Preferred Stockholder.
Tax risks
•If OpCo were to become a publicly traded partnership taxable as a corporation for U.S. federal income tax purposes, we and OpCo might be subject to potentially significant tax inefficiencies.
•Changes to applicable tax laws and regulations mayor exposure to additional income tax liabilities could adversely affect our business, results of operations, financial condition and cash flow.flows.
Glossary of Terms
"April 2021 Exchange” means the redemption by certain of Independence’s consolidated subsidiaries of the noncontrolling equity interests held in such subsidiaries by certain third-party investors in exchange for membership interests in Independence in April 2021.
“ARO” means an asset retirement obligation.
“Bbl” means 42 U.S. gallons liquid volume per stock tank barrel.
“BLM” means the federal Bureau of Land Management.
"Board" means the Board of Directors of Crescent Energy Company.
“Boe” means barrels of oil equivalent.
“Btu” means British thermal unit, which is the heat required to raise the temperature of a one-pound mass of water one degree Fahrenheit.
“CAA” means the federal Clean Air Act, as amended, and the rules and regulations promulgated thereunder.
“CARB” means the California Air Resources Board.
“CERCLA” means the federal Comprehensive Environmental Response, Compensation, and Liability Act, as amended, and the rules and regulations promulgated thereunder.
“CFTC” means the Commodity Futures Trading Commission.
“Class A Common Stock” means the shares of Class A common stock, par value $0.0001 per share, of the Company.
“Class B Common Stock” means the shares of Class B common stock, par value $0.0001 per share, of the Company.
“Code” means the Internal Revenue Code of 1986, as amended.
“Company Group” means the Company and each of its subsidiaries (other than OpCo and its subsidiaries).
"Contango" means Contango Oil & Gas Company, a Texas corporation.
"Contango Incentive Plan" means the Contango Oil & Gas Company Third Amended and Restated 2009 Incentive Compensation Plan.
“Contango Merger” means the merger of IE C Merger Sub Inc., a Delaware corporation, with and into Contango, with Contango surviving the merger as a direct wholly owned corporate subsidiary of the Company.
"Contango PSU Award" means each award of performance stock units (whether vested or unvested) granted under the Contango Incentive Plan that were outstanding immediately prior to the effective time of the Contango Merger.
“CWA” means the Federal Water Pollution Control Act, as amended, and the rules and regulations promulgated thereunder.
“Decontrol Act” means the Natural Gas Wellhead Decontrol Act, effective January 1, 1993.
“DJ” means Denver Julesburg.
“Dodd-Frank” means the Dodd-Frank Wall Street Reform and Consumer Protection Act.
“DOI” means the U.S. Department of the Interior.
“DOT” means the U.S. Department of Transportation.
“EHS” means Environment, Health and Safety.
“EIGF II” means Energy Income and Growth Fund II, formed in 2018 as a KKR energy investment fund.
“EPA” means the U.S. Environmental Protection Agency.
“Equity Incentive Plan” means the Crescent Energy Company 2021 Equity Incentive Plan.
“ESA” means the federal Endangered Species Act, as amended, and the rules and regulations promulgated thereunder.
“ESG” means Environmental, Social and Governance.
“Exchange Act” means the Securities Exchange Act of 1934, as amended, and the rules and regulations promulgated thereunder.
“FERC” means the Federal Energy Regulatory Commission.
“FRA” means the Federal Railroad Administration.
“FTC” means the Federal Trade Commission.
“FWS” means the U.S. Fish and Wildlife Service.
“GAAP” means U.S. generally accepted accounting principles.
“GHGs” means greenhouse gases.
“ICA” means the Interstate Commerce Act of 1887 and the rules and regulations promulgated thereunder.
“Independence” means Independence Energy LLC, a Delaware limited liability company.
“IRS” means the United States Internal Revenue Service.
“IT” means Information Technology.
“KKR” means the Manager and its affiliates, which includes the Preferred Stockholder and EIGF II.
“KKR Funds” means EIGF II and/or other KKR funds.
“KKR Group” means KKR & Co. Inc and its subsidiaries.
“LCFS” means low carbon fuel standard.
“M" means in thousands.
"MM" means in millions.
“Management Agreement” means the management agreement, dated as of December 7, 2021, by and between the Company and the Manager, whereby the Manager manages the business and operations of the Company and its subsidiaries and provides the executive management team for the benefit of the Company and its subsidiaries.
“Manager” means KKR Energy Assets Manager LLC, a Delaware limited liability company.
"Manager Incentive Plan” means the Crescent Energy Company 2021 Manager Incentive Plan.
“MBTA” means the Migratory Bird Treaty Act, as amended, and the rules and regulations promulgated thereunder.
“MBbls” means thousand barrels of oil or NGL.
“MBoe” means thousand Boe.
“Mcf” means thousand cubic feet of natural gas.
"Merger Transactions" means the transactions contemplated by the Transaction Agreement, which include the merger of Independence with and into OpCo, the Contango Merger, the subsequent merger of Contango with and into IE L Merger Sub LLC, with L Merger Sub surviving the merger as a wholly owned subsidiary of the Company, which we describe as the “Merger”, and the subsequent contribution of such surviving subsidiary by the Company to OpCo.
“MMBoe” means million Boe.
“MMBtu” means million British thermal units.
“MMcf” means million cubic feet of natural gas.
“NAAQS” means National Ambient Air Quality Standard.
“NEPA” means the National Environmental Policy Act, as amended, and the rules and regulations promulgated thereunder.
"Non-Economic Series I Preferred Stock” means the 1,000 shares of the Company's Preferred Stock that are designated as “Series I Preferred Stock,” which have no economic rights.
“NGA” means the Natural Gas Act of 1938 and the rules and regulations promulgated thereunder.
“NGFS” means the Network for Greening the Financial System.
“NGPA” means the Natural Gas Policy Act of 1978, as amended, and the rules and regulations promulgated thereunder.
“Noncontrolling Interest Carve-out” means the redemption in May 2021 of certain noncontrolling equity interests in exchange for a third-party investor’s proportionate share of the underlying oil and natural gas interests held by its consolidated subsidiaries. In August 2020, in connection with the Independence Reorganization, certain interests in our consolidated subsidiaries owned by a third-party investor were not contributed to the Predecessor. These interests were reclassified from members’ equity to noncontrolling interest as of the date of the Independence Reorganization and all income and loss attributable to these interests is recorded as net income (loss) attributable to noncontrolling interests from the date of the Independence Reorganization. In May 2021, these noncontrolling equity interests were redeemed in exchange for the third-party investor’s proportionate share of the underlying oil and natural gas interests held by its consolidated subsidiaries.
“NWPR” means the Navigable Waters Protection Rule, as amended.
“NYMEX” means the New York Mercantile Exchange.
“Henry Hub Index” means the major exchange for pricing natural gas futures on the New York Mercantile Exchange.
“NYSE” means the New York Stock Exchange.
“oil equivalent” means natural gas is converted to a crude oil equivalent at the ratio of six Mcf of natural gas to one Boe.
“OPA” means the federal Oil Pollution Act of 1990, as amended, and the rules and regulations promulgated thereunder.
“OpCo” means Crescent Energy OpCo LLC (f/k/a IE OpCo LLC), a Delaware limited liability company.
“OpCo LLC Agreement” means the Amended and Restated Limited Liability Company Agreement of OpCo.
“OpCo Units” means the units representing economic limited liability company interests in OpCo.
“OPEC” means the Organization of Petroleum Exporting Countries.
“OSHA” means the federal Occupational Safety and Health Act, as amended, and the rules and regulations promulgated thereunder.
“PDP” means proved developed producing.
“PHMSA” means the Pipeline and Hazardous Materials Safety Administration.
“Preferred Stockholder” means Independence Energy Aggregator LP, the initial holder of the Non-Economic Series I Preferred Stock, and, as applicable, any successor thereto.
“PT Independence” means PT Independence Energy Holdings, LLC, a Delaware limited liability company.
“PUD” means proved undeveloped reserve.
“PV-0 value” means the present value of estimated future oil and gas revenues, net of estimated direct expenses, discounted at an annual discount rate of 0% used to estimate the present value of proved oil and natural gas reserves.
“PV-10 value” means the present value of estimated future oil and gas revenues, net of estimated direct expenses, discounted at an annual discount rate of 10% used to estimate the present value of proved oil and natural gas reserves.
“RCRA” means the federal Resource Conservation and Recovery Act, as amended, and the rules and regulations promulgated thereunder.
“Redemption Right” means the right of a holder of OpCo Units (other than a member of the Company Group) pursuant to the OpCo LLC Agreement to cause OpCo to redeem all or a portion of its OpCo Units for, at the election of OpCo, (a) shares of Class A Common Stock at a redemption ratio of one share of Class A Common Stock for each OpCo Unit redeemed, or (b) an approximately equivalent amount of cash as determined pursuant to the terms of the OpCo LLC Agreement. In connection with such redemption, a corresponding number of shares of Class B Common Stock will be cancelled.
“Revolving Credit Facility” means the credit agreement, by and between Independence Energy Finance LLC (n/k/a Crescent Energy Finance LLC), Wells Fargo Bank, N.A., as administrative agent, the guarantor parties thereto and the lender parties thereto.
“SASB” means the Sustainability Accounting Standards Board.
“SDWA” means the federal Safe Drinking Water Act, as amended, and the rules and regulations promulgated thereunder.
“SEC” means the United States Securities and Exchange Commission.
“SEC Pricing” means the unweighted average first-day-of-the-month commodity price for crude oil or natural gas for the period beginning January 1, 20222023 and ending December 1, 2022,2023, adjusted by lease for market differentials (quality, transportation, fees, energy content, and regional price differentials). The SEC provides a complete definition of prices in “Modernization of Oil and Gas Reporting” (Final Rule, Release Nos. 33-8995; 34-59192).
“Securities Act” means the Securities Act of 1933, as amended, and the rules and regulations promulgated thereunder.
"Standardized Measure" means the standardized measure of discounted future net cash flows developed utilizing procedures prescribed by the Financial Accounting Standards Board's Accounting Standards Codification Topic 932, Extractive Industries – Oil and Gas, and based on crude oil, natural gas, and NGL reserves and production volumes estimated by our engineering staff.
“Titan” means Titan Energy Holdings, LLC (f/k/a Liberty Energy LLC).
“Titan Acquisition” means the acquisition by Independence (n/k/a Crescent) of Titan.
“Transaction Agreement” means that certain Transaction Agreement, dated as of June 7, 2021, by and among Contango, Independence, the Company, OpCo, IE C Merger Sub Inc., a Delaware corporation, and IE L Merger Sub LLC, a Delaware limited liability company.
“TRC” means the Texas Railroad Commission.
“UIC” means the Underground Injection Control program administered by the SDWA.
“WTI” or “West Texas Intermediate” means a light crude oil produced in the United States with an American Petroleum Institute gravity of approximately 38 to 40 and the sulfur content is approximately 0.3%.
Part I
Except as noted in this Annual Report, we refer to Crescent Energy Company as "Crescent", "we", "us", "our", or the "Company." This Annual Report includes certain terms commonly used in the oil and natural gas industry, which are defined above in the "Glossary of Terms."
Items 1 and 2. Business and Properties
Business Overview
We are a well-capitalizeddifferentiated U.S. independent energy company withcommitted to delivering value for shareholders through a disciplined growth through acquisition strategy and consistent return of capital. Our portfolio of low-decline, cash-flow oriented assets comprises both mid-cycle unconventional and conventional assets with a long reserve life and deep inventory of low-risk, high-return development locations in proven regions across the lower 48 states that generate substantial cash flow supported by a predictable baseEagle Ford and Uinta basins.
Our leadership is an experienced team of production. Our core leadership team is a group of experienced investment, financial and industry professionals who continue to execute on the strategy we have employed since 2011. Our mission is to invest in energy assets and deliver better returns through strong operations and stewardship. We seek to deliver attractive risk-adjusted investment returns and predictable cash flows across cycles by employing our differentiated approach to investing in the oil and gas industry. Our approach employs a unique business model that combines an investor mindsetproven investment and deep operational expertise to pursueoperating expertise. For more than a cash flow-based investment mandatedecade, Crescent and its predecessors have executed on a consistent growth through acquisition strategy focused on operated working interests with an activecash flow, risk management strategy.and returns. Our Class A Common Stock trades on the NYSE under the symbol “CRGY.”
We pursue our strategy through the production, development and acquisition of oil, natural gas and NGL reserves. Our free cash flow-focused portfolio includes a balanced set of oil and natural gas assets in proven onshore U.S. basins with substantial existing production, a low decline rate and an acreage position that is 96% held by production as of December 31, 2022.2023. As a result of this overall low decline profile, we require relatively minimal capital expenditures to maintain our production and cash flows. We have a robust inventory of attractive operated undeveloped locations, providing for optimal flexibility to maintain or grow our production base. While many operators in our industry have historically focused on the capital intensive pursuit of high production growth rates, our management team has a track record of selectively acquiring cash flow oriented assets, operating them more profitably and making disciplined, returns focused reinvestment decisions to drive free cash flow generation. Our portfolio is enhanced and complemented by our additional interests in mineral acreage and midstream infrastructure, which provide operational benefits and enhance our cash flow margins.
We have built a substantial portfolio of reserves, production, and cash flows and reinvestment opportunities. Our portfolio of assets:
•at December 31, 20222023 consisted of 572.8548.2 net MMBoe of proved reserves, of which approximately 56%64% were liquids, reflecting $9.1$5.3 billion in Standardized Measure and $9.6$5.6 billion and $7.1$4.4 billion, respectively, in net proved and net proved developed ("PD") present value discounted at a 10% discount rate;
•during the year ended December 31, 20222023 produced 138149 net MBoe/d; and
•during the year ended December 31, 2022,2023, generated $480.6$322.0 million of net income, $1,217.2$935.8 million of net cash provided by operating activities, $1,022.7 million of Adjusted EBITDAX and $484.0$310.2 million of levered free cash flow;
See “—Non-GAAP financial measures” and "—Results of Operations" in "Part II., Item 7. Management's Discussion and Analysis of Financial Condition and Results of Operations" for definitions of Adjusted EBITDAX and levered free cash flowLevered Free Cash Flow and reconciliations to the nearest comparable GAAP metric.metrics.
The following diagram displays our simplified ownership structure as of December 31, 2023:
The following diagram displays our simplified ownership structure:
Free cash flow-focused portfolio
Our asset base, which is primarily located in Texas and the Rockies, includes oil and natural gas assets in key proven onshore U.S. basins, such as the Eagle Ford, Rockies, Barnett, Permian, and Mid-Con, is composed of producing properties with substantial production and hedged cash flow that are complemented by an extensive inventory of reinvestment opportunities across our undeveloped acreage. While many of our peers have historically outspent their cash flows in pursuit of production growth and left themselves particularly vulnerable to declines in commodity prices, we have an average reinvestment rate of approximately 40%45% of Adjusted EBITDAX since 2018.2019.
Low-decline production base
Our PDP reserves as of December 31, 20222023 have estimated average five-year and ten-year annual decline rates of approximately 13% and 10%12%, respectively, and an estimated 20232024 PDP decline rate of 22%19%, based on forecasts used in our reserve reports. As a result of this low decline profile, we require relatively minimal capital expenditures to maintain our production and cash flows. Our properties located in the Eagle Ford Rockies, and BarnettRockies represent approximately 84%76% of our proved reserves as of December 31, 2022,2023, and provide us with diversification from both a regional location and commodity price perspective, which provides us certain downside protection as it relates to commodity-specific pressures, isolated infrastructure constraints or severe weather events. Our Standardized Measure totaled $9.1$5.3 billion as of December 31, 2022.2023. The table below illustrates the aggregate leasehold acreage positions, reserve volumes and weighted average decline profiles associated with our proved assets as of December 31, 2022.2023.
| | | Net Acres | |
| | Net Acres | |
| | Net Acres | | | Net Proved Reserves (1) | | % Oil & Liquids (1) | | Net PD Reserves (1) | | | | 2023 Total Net Production | | Net Proved PV-10 (1)(2) | | Net PD PV-10 (1)(2) |
| Operating Area | |
| | (M) | |
| | (M) | |
| | (M) | | | (MMBoe) | | | | (MMBoe) | | | | | | (MBoe) | | (MM) |
| Eagle Ford | |
| Rockies | |
| | | Net Acreage | | Net Proved Reserves (1) | | % Oil & Liquids (1) | | Net PD Reserves (1) | | | 2022 Total Net Production | | Net Proved PV-10 (1)(2) | | Net PD PV-10 (1)(2) |
| Operating Area | | | |
| | | (M) | | (MMBoe) | | | | (MMBoe) | | | (MBoe) | | (MM) | | (MM) |
| Eagle Ford | | 144 | | 147 | | 81 | % | | 79 | | | 10,450 | | | $ | 3,452 | | | $ | 1,907 | |
Rockies (3) | | 422 | | 222 | | 53 | % | | 192 | | | 22,438 | | | 3,564 | | | 2,902 | |
| Barnett | | 126 | | 111 | | 20 | % | | 111 | | | 7,409 | | | 911 | | | 911 | |
| Other | |
| Other (4) | | 494 | | 93 | | 67 | % | | 78 | | | 10,090 | | | 1,675 | | | 1,412 | |
| Other | |
| | Other | |
| Total | Total | | 1,186 | | 573 | | 56 | % | | 460 | | | 50,387 | | | $ | 9,602 | | | $ | 7,132 | |
(1)Our reserves and present value (discounted at ten percent, or PV-10) were determined using average first-day-of-the-month prices for the prior 12 months in accordance with SEC guidance. For oil and NGL volumes, the average WTI posted price of $93.67$78.22 per barrel as of December 31, 2022,2023, was adjusted for items such as gravity, quality, local conditions, gathering, transportation fees and distance from market. For natural gas volumes, the average Henry Hub Index spot price of $6.36$2.64 per MMBtu as of December 31, 2022,2023, was similarly adjusted for items such as quality, local conditions, gathering, transportation fees and distance from market. All prices are held constant throughout the lives of the properties. The average adjusted product prices over the remaining lives of the properties are $89.87$74.71 per barrel of oil, $5.80$2.36 per Mcf of natural gas and $37.98$27.33 per barrel of NGLs.
(2)Reflects the Net Proved and Net PD present values reflected in our proved reserve estimates as of December 31, 2022.2023. PV-10 is not a financial measure prepared in accordance with GAAP because isit does not include the effects of income taxes on future revenues. Our Standardized Measure was $9,135 million$5.3 billion as of December 31, 2022.2023. See “Oil, natural gas and NGL reserve data” for additional discussion.
(3)We have a contractual right to participate in 73 thousand gross acres in the DJ Basin through an agreement with a large operator and will be entitled to receive our proportionate share of acreage in the future based on our participation in proposed wells.
(4)Includes working interest properties located in Mid-Con, California and Permian, as well as diversified minerals.
Our Relationship with the KKR Group
We are a party to a Management Agreement with the Manager, that engages the Manager to provide certain management and investment advisory services to us and our subsidiaries. Our management team provides services to us pursuant to the Management Agreement.
The Manager is an indirect subsidiary of the KKR Group. The KKR Group is a leading global investment firm that offers alternative asset management as well as capital markets and insurance solutions.
Pursuant to the Management Agreement, the Manager has agreed to provide us with management services, including our full executive and corporate management teams, and other assistance, including with respect to strategic planning, risk management, identifying and screening potential acquisitions, identifying and analyzing ESGsustainability-related issues and providing such other assistance as we may require.
Through our integration with the KKR Group’s global platform, we believe that we benefit from: the power of the “KKR Brand;” KKR Capstone, which creates value by assisting with due diligence and identifying and delivering sustainable operational performance improvements within the KKR Group’s portfolio companies; KKR Global Macro and Asset Allocation, which assists with assessing the impact of macroeconomic factors on potential investments and helps identify market opportunities; KKR Capital Markets LLC ("KCM"), which assists with optimizing the capital structure of investments and underwrites and arranges debt, equity and other forms of financing for both KKR portfolio companies and independent clients, and KKR Public Affairs, which, together with the KKR Global Institute, provides insight into ESG,sustainability, regulatory, geopolitical, and reputational issues, including experience working with key stakeholders, such as labor unions, industry and trade associations and non-governmental organizations.
For additional information regarding our Management Agreement and our relationship with the KKR Group, see "Item 1A. Risk Factors, Risks related to the oil and natural gas industry and our operations—Through the Management Agreement, we depend on the Manager and KKR Group personnel to manage and operate our business, the loss of any of whom would materially and adversely affect future operations. Additionally, operational risks affecting the Manager, and our ability to work collaboratively with the Manager, including with respect to the allocation of corporate opportunities and other conflicts of interest, may impact our business and have a material effect on our business, financial results and prospects."
Management Agreement
We are a party to a Management Agreement pursuant to which we have engaged the Manager to manage the strategy, assets and day-to-day business and affairs of us and our subsidiaries, subject at all times to applicable law, the further terms and
conditions set forth in the Management Agreement and to the supervision of our Board. Pursuant to the Management Agreement, the Manager will provide us with our executive management team and will manage our day-to-day operations. Additionally, pursuant to the Management Agreement:
•As all available investment capital within EIGF II has been fully deployed, theThe Manager shall ensure that at least 70% of any such investment amounts related to upstream oil and gas opportunities are allocated to us. Follow-on investment amounts will be generally allocated between us and EIGF II in proportion to the relative amount such vehicle initially invested in the applicable investment.
•From time to time, investment opportunities outside of upstream oil and gas assets may arise that are suitable for investment by us, on the one hand, and by and EIGF II (and any successor fund) or other KKR Funds, on the other that are (A) engaged in an investment strategy that is materially different from us (such as distressed debt or special situations investment vehicles) and (B) have pre-existing defined allocation rights pursuant to KKR’s allocation policies or contractual undertakings agreed with the investors in such other KKR Funds. In such cases, we may elect to co-invest alongside EIGF II and/or such other KKR Funds in such investments, in which case KKR will allocate such investment opportunities among us, on the one hand, and EIGF II and/or such other KKR Funds, on the other hand, in a manner consistent with the priority investment rights of such KKR Funds, taking into account such factors as KKR deems appropriate. We shall have no obligation to make any such co-investment.
•As consideration for the services rendered pursuant to the Management Agreement and the Manager’s overhead, including compensation of the executive management team, as of the closing date of the Merger Transactions, the Manager is entitled to receive:
(i) compensation from us equal to $15.4$28.3 million per annum (calculated based on our pro rata portion of $53.3an annual $55.5 million fee (the “Management Compensation”) based on our relative ownership of OpCo), which is included in General and administrative expenses on our combined and consolidated statements of operations. As our business and assets expand, the Management Compensation will increase by an amount equal to 1.5% per annum of the net proceeds from all future issuances of primary equity securities by us (including in connection with acquisitions) and increased by $2.2 million during the year ended December 31, 2023 in certain instances, OpCo; however,conjunction with our Equity Issuance (as defined below). However, incremental management feesManagement Compensation will not apply to secondary share offerings or the issuance of shares of our Class A Common Stockshares upon the redemption or exchange of OpCo Units.
We expect our ownership percentage of OpCo will increase over time through the exchange of OpCo Units into shares of our Class A Common Stock or the issuance of additional shares of Class A Common Stock. As this occurs, the portion of the Management Compensation borne by us will increase from $15.4$28.3 million up to, in the situation in which we own all of the interests in OpCo, the total Management Compensation. While only the portion borne by us impacts our combined and consolidated statements of operations, we include the full Management Compensation in the calculation of Adjusted EBITDAX and Levered Free Cash Flow (the delta between the Management Compensation and the amount borne by us is represented by “Certain-redeemable noncontrolling interest distributions made by OpCo related to the management fee”).
(ii) a performance-based incentive grant pursuant to which the Manager is targeted to receive up to 10% of outstanding Class A Common Stock based on the achievement of certain performance-based measures (the "Incentive Compensation."). The Incentive Compensation consists of five tranches that may become earned during successive performance periods and will be settled over a five year period beginning after the end of the first performance period in 2024, and each tranche relates to a target number of shares of Class A Common Stock equal to 2% of the outstanding Class A Common Stock as of the time such tranche is settled. Performance goals are evaluated on absolute stock price performance and relative stock price performance versus a set of our peers and there is no vesting based solely on time. Based on the level of achievement with respect to the performance goals applicable to such tranche, the Manager is entitled to settlement of such tranche with respect to a number of shares of Class A Common Stock ranging from 0% to 4.8% of the outstanding Class A Common Stock at the time each tranche is settled so long as the Manager continuously provides services to us until the end of the performance period applicable to a tranche.
(iii) reimbursement for the Manager's pro rata share (based on percentage of public ownership of us) of any documented costs or expenses incurred by the Manager on behalf of us (other than normal overhead expenses relating to the business or operations of the Manager). These costs and expenses include, among other things, costs of outside counsel, accountants and auditors, taxes, fees related to regulatory compliance, costs related to IT services and other costs related to identifying, evaluating and structuring investments.
•The Management Agreement has an initial three-year term (ending December 7, 2024), with automatic three-year renewals thereafter.
•Upon the written notice to the Manager at least 180 days prior to the expiration of the initial term or any automatic renewal term, we may, without cause, decline to renew the Management Agreement upon the affirmative determination by at least two-thirds of our independent directors reasonably and in good faith that (1) there has been unsatisfactory long-term performance by the Manager that is materially detrimental to us and our subsidiaries taken as a whole or (2) the fees payable to the Manager, in the aggregate, are materially unfair and excessive compared to those that would be charged by a comparable asset manager managing assets comparable to our assets, subject to the Manager’s right to renegotiate the fees. In the event of such a termination, we shall pay the Manager a termination fee equal to three (3) times the sum of (i) the average annual Management Compensation and (ii) the average of the Incentive Compensation (but only with respect to the fully vested portion thereof as of the termination date), in each case earned by the Manager during the 24-month period immediately preceding the most recently completed calendar quarter prior to the termination.
Properties
Summary of our assets
Leasehold acreage
Our portfolio includes low-decline oil and natural gas assets in proven regions across the United States, including in the Eagle Ford Rockies, and Barnett.Rockies. In addition to this geographic diversity, we believe that our portfolio of leasehold acreage is enhanced and complemented by our additional interests in mineral acreage and midstream infrastructure. We had leasehold interests in an aggregate 1.2of 1.3 million net acres as of December 31, 2022, 1.02023, 1.1 million of which we were designated as operator. We are responsible for our pro rata share of capital expenditures and lease operating expenses for the operated and non-operated working interests within our leasehold acreage based on our percentage working interest and we are entitled to revenues derived from such interest based on our net revenue interest, which generally equals our working interest in such property less any royalties and production payments and any overriding royalty and net profits interests burdening the property.
Mineral and royalty interests
In addition to our leasehold acreage, we own mineral and royalty interests. As of December 31, 2022,2023, we owned mineral interests in 174175 thousand gross acres and an overriding royalty interest in 125126 thousand gross acres, both operated by large, well-capitalized oil and natural gas companies primarily in the Eagle Ford, Marcellus, Utica and Rockies. On our mineral acreage, all of which we have leased to other operators, we have typically retained a royalty interest, which is a cost-free percentage of production revenue that expires upon termination of the lease, at which time the entire mineral interest reverts to us. These interests entitle us to receive a royalty and overriding royalty interest on all production from such acreage with no additional future capital or operating costs required.
Midstream infrastructure
We own and operate a variety of midstream assets, which provide services to our upstream assets and other customers. These include:
•a 12.0% interest in the Springfield Gathering System in the Eagle Ford Shale in Dimmit, La Salle and Webb Counties of southeast Texas, which is operated by Western Midstream Partners, LP (NYSE: WES) and includes both oil and gas gathering systems.
•the Howell Pipeline, a 125-mile, 16-inch carbon dioxide pipeline that stretches across central Wyoming, which provides CO2CO2 supply to support enhanced oil recovery operations on our acreage located in the Salt Creek and Monell Fields, in addition to serving third-party customers in the area.
•a 50.0% interest in a centralized production facility, referred to as the DJ Basin Erie Hub Gathering System, which is located just east of Erie, Colorado, and provides a single site for processing equipment for portions of our DJ asset.
•a 65.0% equity method investment in the Lost Creek Gathering System, a 158-mile, 20-inch natural gas pipeline in Wyoming and a 77-mile, 2- to 8-inch FERC-jurisdictional crude oil pipeline in Wyoming. We also own interests in and operate three gas processing plants and several other pipelines in Wyoming.
•a 66.7% interest and operatein the Cherokee Water Gathering System, an approximately 200-mile produced water pipeline in Oklahoma.
Our operating areas
Our operating areas include the Eagle Ford Rockies, and Barnett.Rockies. The below table describes the net acreage, net PDPproductive wells, production and proved reserve amounts for each of our geographic areas for the year ended and as of December 31, 2022:2023:
| | | | | | | | | | | | | | | | | | | | | | | | | | |
| Geographic Area | | Net Acreage | | Net PDP Wells | | 2022 Production | | Proved Reserves |
| | (M) | | | | (MBoe) | | (MBoe) |
| Eagle Ford | | 144 | | | 684 | | | 10,450 | | | 146,596 | |
Rockies (1) | | 422 | | | 2,224 | | | 22,438 | | | 221,828 | |
| Barnett | | 126 | | | 828 | | | 7,409 | | | 110,604 | |
| | | | | | | | |
| | | | | | | | |
Other Basins (2) | | 494 | | | 1,637 | | | 10,090 | | | 93,765 | |
| | | | | | | | | | | | | | | | | | | | | | | | | | |
| Geographic Area | | Net Acres | | Net Productive Wells | | 2023 Production | | Proved Reserves |
| | (M) | | | | (MBoe) | | (MBoe) |
| Eagle Ford | | 231 | | | 1,620 | | | 16,191 | | | 261,920 | |
| Rockies | | 434 | | | 1,640 | | | 23,051 | | | 152,563 | |
| | | | | | | | |
| | | | | | | | |
| | | | | | | | |
| Other Basins | | 661 | | | 3,598 | | | 15,291 | | | 133,683 | |
(1)Includes working interest properties located in the Uinta basin as well as other working interest properties, minerals and royalty interests in the Rockies.
(2)Includes working interest properties located in Mid-Con, California and Permian, as well as our minerals and royalty interests.
Oil, natural gas and NGL reserve data
The following table summarizes our estimated net proved reserves as of December 31, 20222023 based on an evaluation prepared in accordance with SEC Pricing, including the provisions of the SEC rule regarding reserve estimation regarding a historical twelve month pricing average applied prospectively.
| | As of December 31, |
| 2022 (1) | | 2021 (1) |
| | As of December 31, | | | | As of December 31, |
| | 2023 (1) | | | | 2023 (1) | | 2022 (1) |
| Net Proved Reserves: | Net Proved Reserves: | | | | |
| Oil (MBbls) | |
| Oil (MBbls) | |
| Oil (MBbls) | Oil (MBbls) | | 243,082 | | | 210,160 | |
| Natural gas (MMcf) | Natural gas (MMcf) | | 1,506,535 | | | 1,469,953 | |
| NGLs (MBbls) | NGLs (MBbls) | | 78,621 | | | 76,493 | |
| Total Proved Reserves (MBoe) | Total Proved Reserves (MBoe) | | 572,793 | | | 531,645 | |
Standardized Measure (millions) (2) | Standardized Measure (millions) (2) | | $ | 9,135 | | | $ | 4,958 | |
PV-0 (millions) (2) | PV-0 (millions) (2) | | $ | 17,170 | | | $ | 9,391 | |
PV-10 (millions) (2) | PV-10 (millions) (2) | | $ | 9,602 | | | $ | 5,159 | |
| Net Proved Developed Reserves: | Net Proved Developed Reserves: | |
| Oil (MBbls) | Oil (MBbls) | | 160,113 | | | 158,091 | |
| Oil (MBbls) | |
| Oil (MBbls) | |
| Natural gas (MMcf) | Natural gas (MMcf) | | 1,398,770 | | | 1,404,570 | |
| NGLs (MBbls) | NGLs (MBbls) | | 66,803 | | | 66,402 | |
| Total Proved Developed Reserves (MBoe) | Total Proved Developed Reserves (MBoe) | | 460,046 | | | 458,588 | |
PV-0 (millions) (2) | PV-0 (millions) (2) | | $ | 12,330 | | | $ | 7,495 | |
PV-10 (millions) (2) | PV-10 (millions) (2) | | $ | 7,132 | | | $ | 4,305 | |
| Net Proved Undeveloped Reserves: | Net Proved Undeveloped Reserves: | |
| Oil (MBbls) | Oil (MBbls) | | 82,969 | | | 52,069 | |
| Oil (MBbls) | |
| Oil (MBbls) | |
| Natural gas (MMcf) | Natural gas (MMcf) | | 107,765 | | | 65,383 | |
| NGLs (MBbls) | NGLs (MBbls) | | 11,818 | | | 10,091 | |
| Total Proved Undeveloped Reserves (MBoe) | Total Proved Undeveloped Reserves (MBoe) | | 112,747 | | | 73,057 | |
PV-0 (millions) (2) | PV-0 (millions) (2) | | $ | 4,840 | | | $ | 1,896 | |
PV-10 (millions) (2) | PV-10 (millions) (2) | | $ | 2,470 | | | $ | 854 | |
(1)Our reserves and present value (discounted at ten percent, or PV-10) were determined using average first-day-of-the-month prices for the prior 12 months in accordance with SEC guidance. For oil and NGL volumes, the average WTI posted price
of $93.67$78.22 per barrel and $66.56$93.67 per barrel as of December 31, 20222023 and 2021,2022, was adjusted for items such as gravity, quality, local conditions, gathering, transportation fees and distance from market. For natural gas volumes, the average Henry Hub Index spot price of $6.36$2.64 per MMBtu and $3.60$6.36 per MMBtu as of December 31, 20222023 and 2021,2022, was similarly adjusted for items such as quality, local conditions, gathering, transportation fees and distance from market. All prices are held constant throughout the lives of the properties. The average adjusted product prices over the remaining lives of the properties are $74.71 per barrel of oil, $2.36 per Mcf of natural gas and $27.33 per barrel of NGLs as of December 31, 2023. The average adjusted product prices over the remaining lives of the properties were $89.87 per barrel of oil, $5.80 per Mcf of natural gas and $37.98 per barrel of NGLs as of December 31, 2022. The average adjusted product prices over the remaining lives of the properties were $64.84 per barrel of oil, $3.46 per Mcf of natural gas and $27.21 per barrel of NGLs as of December 31, 2021.
(2)Present value (discounted at PV-0 and PV-10) is not a financial measure calculated in accordance with GAAP because it does not include the effects of income taxes on future net revenues. None of PV-0, PV-10 and Standardized Measure represent an estimate of the fair market value of our oil and natural gas properties. Our PV-0 measurement does not provide
a discount rate to estimated future cash flows. PV-0 therefore does not reflect the risk associated with future cash flow projections like PV-10 does. PV-0 should therefore only be evaluated in connection with an evaluation of our PV-10 and Standardized Measure. We believe that the presentation of PV-0 and PV-10 is relevant and useful to its investors as supplemental disclosure to the Standardized Measure because they present future net cash flows attributable to our reserves prior to taking into account future income taxes and our current tax structure. The PV-0 and PV-10 income tax amounts included in the Standardized Measure but not included in PV-0 and PV-10 were $773.5$410.7 million and $467.3$276.8 million, respectively. We and others in our industry use PV-0 and PV-10 as a measure to compare the relative size and value of proved reserves held by companies without regard to the specific tax characteristics of such entities. Investors should be cautioned that none of PV-0, PV-10 and Standardized Measure represent an estimate of the fair market value of our proved reserves.
Preparation of reserve estimates
Our reserve estimates as of December 31, 20222023 are primarily based on evaluations prepared by Ryder Scott Company, L.P., with respect to 98% of our total proved reserves, with the remaining 2% prepared by our internal technical staff. Our reserve estimates prepared as of December 31, 2021 were based on a combination of evaluations prepared or audited, as applicable, by the independent petroleum engineering firms of (a) Haas Petroleum Engineering Services, Inc., with respect to 34% of our total net proved reserves, (b) William M. Cobb and Associates, with respect to 24% of our total net proved reserves (c) Cawley, Gillespie & Associates, Inc. with respect to 23% of our total net proved reserves, and (d) Netherland, Sewell & Associates, Inc. with respect to 19% of our total net proved reserves, (together with Ryder Scott Company, L.P., the “Independent Reserve Engineers”), in each case in accordance with the "Standards Pertaining to the Estimating and Auditing of Oil and Gas Reserves Information" (June 2019) promulgated by the Society of Petroleum Evaluation Engineers and definitions and guidelines established by the SEC. Our Independent Reserve Engineers were selected for their historical experience and geographic expertise in engineering similar resources. Our reserve estimation process is a collaborative effort coordinated by the lead reservoir engineersreserve leads at each of our operating subsidiaries, who are petroleum engineersreserve experts with an average of 1819 years of reservoir and operations experience per person. This process is overseen by our Director of Corporate Reserves, who has over 1617 years of experience in the estimation and evaluation of petroleum reserves. Our technical staff uses historical information for our properties such as ownership interest, oil and natural gas production, well test data, commodity prices and operating and development costs to formulate our reserves estimates. The preparation of our proved reserve estimates is completed in accordance with our internal control procedures. These procedures, which are intended to ensure reliability of reserve estimations, include the following:
•review and verification of historical production, cost and capital expenditures data;
•verification of property ownership by our land department;
•preparation of reserves estimates by our lead reservoir engineers;
•review by our management, including our Chief Executive Officer and Chief Financial Officer, of all significant reserve changes and all new PUD additions; and
•no employee’s compensation is tied to the amount of reserves booked.
The technical person responsible for preparing our reserves estimates at December 31, 20222023 from Ryder Scott Company, L.P. has over 4425 years of industry experience. The technical persons responsible for preparing our reserve estimates at December 31, 2021 and their respective years of experience at that time were; (a) Haas Petroleum Engineering & Associates, Inc. had over 20 years of industry experience; (b) William M. Cobb and Associates had over 40 years of experience in the estimation and evaluation of reserves; (c) Cawley, Gillespie & Associates, Inc. had over 29 years of experience in the estimation and
evaluation of petroleum reserves; and (d) Netherland, Sewell & Associates, Inc. had over 20 years of experience in the estimation and evaluation of petroleum reserves.
Proved reserves are reserves which, by analysis of geoscience and engineering data, can be estimated with reasonable certainty to be economically producible from a given date forward, from known reservoirs, and under existing economic conditions, operating methods and government regulations prior to the time at which contracts providing the right to operate expire, unless evidence indicates that renewal is reasonably certain, regardless of whether deterministic or probabilistic methods are used for the estimation. The project to extract the hydrocarbons must have commenced or the operator must be reasonably certain that it will commence the project within a reasonable time. The term “reasonable certainty” implies a high degree of confidence that the quantities of oil or natural gas actually recovered will equal or exceed the estimate. To achieve reasonable certainty, we and the Independent Reserve Engineers employed technologies that have been demonstrated to yield results with consistency and repeatability. The technologies and economic data used in the estimation of our proved reserves include, but are not limited to, well logs, geologic maps and available downhole and production data and well-test data.
Reserve engineering is and must be recognized as a subjective process of estimating volumes of economically recoverable natural gas that cannot be measured in an exact manner. The accuracy of any reserve estimate is a function of the quality of available data and of engineering and geological interpretation. As a result, the estimates of different engineers often vary. In addition, the results of drilling, testing and production may justify revisions of such estimates. Accordingly, reserve estimates often differ from the quantities of oil and natural gas that are ultimately recovered. Estimates of economically recoverable oil and natural gas and of future net cash flows are based on a number of variables and assumptions, all of which may vary from actual results, including geologic interpretation, prices and future production rates and costs. See "Item 1A. Risk Factors" appearing elsewhere in this Annual Report.
With respect to the Independent Reserve Engineers that performed an audit of a portion of our reserves as of December 31, 2021, we provided to such Independent Reserve Engineers our public and internal engineering and geoscience technical data and analyses. Such Independent Reserve Engineers accepted without independently verifying the accuracy and completeness of the historical information and data furnished by us with respect to ownership interest, oil and natural gas production, well test data, commodity prices, operating and development costs and any agreements relating to current and future operations of the properties and sales of production. However, if in the course of its evaluations something came to their attention that brought into question the validity or sufficiency of any such information or data, the Independent Reserve Engineers did not rely on such information or data until they had satisfactorily resolved their questions relating thereto or had independently verified such information or data. In the course of their evaluations, the Independent Reserve Engineers prepared, for all of the audited properties, their own estimates of our reserves. The Independent Reserve Engineers reviewed their audit differences with us, and, as necessary, held meetings with us to review additional reserves work performed by our technical teams and any updated performance data related to the reserve differences. Such data was incorporated, as appropriate, by both parties into the reserve estimates. The Independent Reserve Engineers’ estimates, including any adjustments resulting from additional data, of those reserves and did not differ from our estimates by more than 10% in the aggregate. When such differences did not exceed 10% in the aggregate and the Independent Reserve Engineers was satisfied that the reserves were reasonable and that its audit objectives had been met, the Independent Reserve Engineers issued an unqualified audit opinion.
Proved undeveloped reserves (PUDs)
Our PUDs will be converted from undeveloped to developed as the applicable wells have been drilled or completed and have minimal capital remaining to bring the well onto production. The changes to our PUDs that occurred during the year are summarized in the table below:
| | | | | |
| 20222023 |
| (MBoe) |
Balance at December 31, 2021 | 73,057 | |
Purchases of reserves in place | 26,031 | |
Extensions and discoveries | 48,509 | |
Revisions of previous estimates | (14,164) | |
Sales of reserves in place | (3,059) | |
Transfers to proved developed | (17,627) | |
| Balance at December 31, 2022 | 112,747 | |
| Purchases of reserves in place | 31,727 | |
| Extensions and discoveries | — | |
| Revisions of previous estimates | (6,393) | |
| Sales of reserves in place | (5,295) | |
| Transfers to proved developed | (20,578) | |
| Balance at December 31, 2023 | 112,208 | |
Purchases of reserves in place of 26.031.7 MMBoe during the year ended December 31, 20222023 primarily relate to PUD locations added as part of the Uinta Acquisition. Extensions and discoveries of 48.5 MMBoe primarily relate to extensions on ourWestern Eagle Ford asset.Acquisitions. Revisions of previous estimates during the year ended December 31, 20222023 were primarily due to increased expected future costs driven by inflationchanges in the drill plan largely attributed to the removal of 7 MMBoe of certain Permian basin PUD locations in Pecos County from our five-year development plan. As a result of Crescent’s recent acquisitions in both the Eagle Ford and a higher commodity price environment.the Uinta basins, we anticipate the go forward capital program will be largely focused in these two regions. Additionally, during the year ended December 31, 2022,2023, we spent $209.0$301.8 million to convert 17.620.6 MMBoe to proved developed reserves.
All of such PUD reserves are scheduled to be developed within five years from the date such locations were initially disclosed astheir booking date. The PUD reserves.reserves are spread across multiple assets in Texas, Utah and Wyoming. Our PUD reserves represent only reserves that are scheduled, based on such plan, to be developed within five years from the date such locations were initially disclosed as PUDs; however, our five-year development plan may not contemplate aan uniform (i.e., 20% per year) conversion of PUD reserves. At December 31, 2022,2023, we estimate that our future development costs relating to the development of PUD reserves are $451 million in 2023, $389$494 million in 2024, and $382$530 million in 2025 $245and $548 million in 2026, and $181$148 million in 2027.2027 and $67 million in 2028. We believe cash flow from operations and availability under the Revolving Credit Facility will be sufficient to cover these estimated future development costs.
Oil, natural gas and NGL production prices and operating costs
Production and price history
The following table sets forth production, price and cost data for the years ended December 31, 2023, 2022, 2021, and 2020.2021.
| | | | | | | | | | | | | | | | | |
| Year Ended December 31, |
| 2022 | | 2021 | | 2020 |
| Net Production: | |
| Eagle Ford: | | | | | |
| Oil (MBbls) | 6,212 | | | 5,107 | | | 6,964 | |
| Natural gas (MMcf) | 15,154 | | | 14,871 | | | 15,556 | |
| NGLs (MBbls) | 1,712 | | | 1,818 | | | 2,309 | |
| Total (MBoe) | 10,450 | | | 9,404 | | | 11,866 | |
| Average daily production (MBoe/d) | 29 | | | 26 | | | 32 | |
| Rockies: | | | | | |
| Oil (MBbls) | 11,650 | | | 6,088 | | | 4,959 | |
| Natural gas (MMcf) | 53,509 | | | 17,560 | | | 7,513 | |
| NGLs (MBbls) | 1,870 | | | 1,968 | | | 764 | |
| Total (MBoe) | 22,438 | | | 10,982 | | | 6,975 | |
| Average daily production (MBoe/d) | 61 | | | 30 | | | 19 | |
| Barnett: | | | | | |
| Oil (MBbls) | 14 | | | 11 | | | 16 | |
| Natural gas (MMcf) | 36,643 | | | 40,823 | | | 47,032 | |
| NGLs (MBbls) | 1,288 | | | 1,350 | | | 1,565 | |
| Total (MBoe) | 7,409 | | | 8,165 | | | 9,419 | |
| Average daily production (MBoe/d) | 20 | | | 22 | | | 26 | |
| Total: | | | | | |
| Oil (MBbls) | 21,865 | | | 13,237 | | | 13,132 | |
| Natural gas (MMcf) | 128,470 | | | 89,455 | | | 78,541 | |
| NGLs (MBbls) | 7,110 | | | 6,099 | | | 5,078 | |
| Total (MBoe) | 50,387 | | | 34,245 | | | 31,300 | |
| Average daily production (MBoe/d) | 138 | | | 94 | | | 86 | |
| Average Realized Prices (before effects of derivatives): | | | | | |
| Eagle Ford: | | | | | |
| Oil (per Bbl) | $ | 94.87 | | | $ | 65.93 | | | $ | 35.92 | |
| Natural gas (per Mcf) | $ | 6.30 | | | $ | 5.35 | | | $ | 2.11 | |
| NGLs (per Bbl) | $ | 39.42 | | | $ | 32.01 | | | $ | 15.15 | |
| Rockies: | | | | | |
| Oil (per Bbl) | $ | 85.85 | | | $ | 66.91 | | | $ | 39.12 | |
| Natural gas (per Mcf) | $ | 5.75 | | | $ | 4.44 | | | $ | 3.11 | |
| NGLs (per Bbl) | $ | 41.03 | | | $ | 33.20 | | | $ | 17.03 | |
| Barnett: | | | | | |
| Oil (per Bbl) | $ | 76.70 | | | $ | 61.86 | | | $ | 33.99 | |
| Natural gas (per Mcf) | $ | 6.22 | | | $ | 3.47 | | | $ | 1.70 | |
| NGLs (per Bbl) | $ | 29.74 | | | $ | 24.00 | | | $ | 9.79 | |
| Total: | | | | | |
| Oil (per Bbl) | $ | 90.06 | | | $ | 66.71 | | | $ | 37.45 | |
| Natural gas (per Mcf) | $ | 5.97 | | | $ | 3.96 | | | $ | 1.90 | |
| NGLs (per Bbl) | $ | 37.72 | | | $ | 30.42 | | | $ | 13.77 | |
| Average Production Costs per Boe: | | | | | |
| Eagle Ford | $ | 19.81 | | | $ | 18.79 | | | $ | 16.55 | |
| Rockies | $ | 19.61 | | | $ | 23.98 | | | $ | 23.99 | |
| Barnett | $ | 13.32 | | | $ | 10.17 | | | $ | 8.46 | |
| Total | $ | 19.84 | | | $ | 17.41 | | | $ | 15.39 | |
| | | | | | | | | | | | | | | | | |
| Year Ended December 31, |
| 2023 | | 2022 | | 2021 |
| Net Production: | |
| Eagle Ford: | | | | | |
| Oil (MBbls) | 8,924 | | | 6,212 | | | 5,107 | |
| Natural gas (MMcf) | 23,464 | | | 15,154 | | | 14,871 | |
| NGLs (MBbls) | 3,356 | | | 1,712 | | | 1,818 | |
| Total (MBoe) | 16,191 | | | 10,450 | | | 9,404 | |
| Average daily production (MBoe/d) | 44 | | | 29 | | | 26 | |
| Rockies: | | | | | |
| Oil (MBbls) | 12,270 | | | 11,650 | | | 6,088 | |
| Natural gas (MMcf) | 53,691 | | | 53,509 | | | 17,560 | |
| NGLs (MBbls) | 1,832 | | | 1,870 | | | 1,968 | |
| Total (MBoe) | 23,051 | | | 22,438 | | | 10,982 | |
| Average daily production (MBoe/d) | 63 | | | 61 | | | 30 | |
| | | | | |
| | | | | |
| | | | | |
| | | | | |
| | | | | |
| | | | | |
| Total: | | | | | |
| Oil (MBbls) | 24,287 | | | 21,865 | | | 13,237 | |
| Natural gas (MMcf) | 130,629 | | | 128,470 | | | 89,455 | |
| NGLs (MBbls) | 8,475 | | | 7,110 | | | 6,099 | |
| Total (MBoe) | 54,533 | | | 50,387 | | | 34,245 | |
| Average daily production (MBoe/d) | 149 | | | 138 | | | 94 | |
| Average Realized Prices (before effects of derivatives): | | | | | |
| Eagle Ford: | | | | | |
| Oil (per Bbl) | $ | 75.03 | | | $ | 94.87 | | | $ | 65.93 | |
| Natural gas (per Mcf) | $ | 2.27 | | | $ | 6.30 | | | $ | 5.35 | |
| NGLs (per Bbl) | $ | 25.75 | | | $ | 39.42 | | | $ | 32.01 | |
| Rockies: | | | | | |
| Oil (per Bbl) | $ | 68.91 | | | $ | 85.85 | | | $ | 66.91 | |
| Natural gas (per Mcf) | $ | 3.68 | | | $ | 5.75 | | | $ | 4.44 | |
| NGLs (per Bbl) | $ | 24.02 | | | $ | 41.03 | | | $ | 33.20 | |
| | | | | |
| | | | | |
| | | | | |
| | | | | |
| Total: | | | | | |
| Oil (per Bbl) | $ | 72.09 | | | $ | 90.06 | | | $ | 66.71 | |
| Natural gas (per Mcf) | $ | 2.84 | | | $ | 5.97 | | | $ | 3.96 | |
| NGLs (per Bbl) | $ | 22.76 | | | $ | 37.72 | | | $ | 30.42 | |
| Average Production Costs per Boe: | | | | | |
| Eagle Ford | $ | 18.76 | | | $ | 19.81 | | | $ | 18.79 | |
| Rockies | $ | 19.58 | | | $ | 19.61 | | | $ | 23.98 | |
| | | | | |
| Total | $ | 19.04 | | | $ | 19.84 | | | $ | 17.41 | |
Wells
The following table sets forth information regarding our PDPproductive wells as of December 31, 2022:2023:
| | Working Interest Assets | | Mineral and Royalty Interests |
| Gross | | Net | | Average Working Interest | | Gross | | Net | | Average Net Revenue Interest |
| Working Interest Assets | | | Working Interest Assets | | Mineral and Royalty Interests |
| Gross | | | Gross | | Net | | Average Working Interest | | Gross | | Net | | Average Net Revenue Interest |
| Natural gas | Natural gas | 2,877 | | | 1,336 | | | 46 | % | | 1,475 | | | 16 | | | 1 | % | Natural gas | 3,554 | | | 2,085.0 | | 2,085.0 | | | 59 | | 59 | % | | 1,256 | | | 23.4 | | 23.4 | | | 2 | | 2 | % |
| Oil | Oil | 7,711 | | | 3,989 | | | 52 | % | | 2,247 | | | 19 | | | 1 | % | Oil | 9,073 | | | 4,720.4 | | 4,720.4 | | | 52 | | 52 | % | | 3,084 | | | 29.0 | | 29.0 | | | 1 | | 1 | % |
| Total | Total | 10,588 | | | 5,325 | | | 50 | % | | 3,722 | | | 35 | | | 1 | % | Total | 12,627 | | | 6,805.4 | | 6,805.4 | | | 54 | | 54 | % | | 4,340 | | | 52.4 | | 52.4 | | | 1 | | 1 | % |
Leasehold acreage
The following table sets forth certain information regarding the total developed and undeveloped acreage in which we owned an interest as of December 31, 2022.2023.
| | | | | | | | | | | |
| Gross | | Net |
| Developed Acres | 2,029,933 | | | 1,053,667 | |
| Undeveloped Acres | 256,431 | | | 132,026 | |
Total Acres (1) | 2,286,364 | | | 1,185,693 | |
| | | |
Mineral Acres (2) | 173,630 | | | 57,516 | |
(1)We have a contractual right to participate in 73 thousand gross acres in the DJ Basin through an agreement with a large operator and will be entitled to receive our proportionate share of acreage in the future based on our participation in proposed wells.
(2)Excludes an additional overriding royalty interest in 125 thousand gross acres. | | | | | | | | | | | |
| Gross | | Net |
| Developed Acres | 2,301,623 | | | 1,255,583 | |
| Undeveloped Acres | 110,218 | | | 70,077 | |
| Total Net Acres | 2,411,841 | | | 1,325,660 | |
| | | |
| Mineral Acres | 174,743 | | | 55,126 | |
Undeveloped acreage expirations
The following table sets forth the number of total net undeveloped acres as of December 31, 20222023 that will expire in 2023, 2024, 2025, 2026 and 20262027 unless production is established within the spacing units covering the acreage prior to the expiration dates or unless such leasehold rights are extended or renewed.
| | | | | | | | | | | | | | | | | | | | | | | |
| 2023 | | 2024 | | 2025 | | 2026 |
| Net undeveloped acres | 12,907 | | | 3,245 | | | 5,116 | | | 7,982 | |
| | | | | | | | | | | | | | | | | | | | | | | |
| 2024 | | 2025 | | 2026 | | 2027 |
| Net undeveloped acres | 6,813 | | | 7,649 | | | 3,068 | | | 876 | |
The leases comprising the acreage that is subject to expiration as set forth in the table above will generally expire at the end of their respective primary terms unless production from the leasehold acreage has been established prior to such date, in which case the lease will remain in effect until the cessation of production. Upon expiration of the primary term, we will lose our interests in the associated acreage unless fully held by production, maintained through our delivery of a lease extension payment or, in the case of many of our leases, we utilize the “continuous development clause” that permits us to continue to hold such acreage if we initiate additional development activities within 120-180 days after the completion of the last well drilled on such lease. Thereafter, the lease remains held under the continuous development clause so long as we undertake additional development activities every 120 to 180 days or until the entire lease is held by production. There can be no assurances as to our ability to maintain such acreage. For more information, see "Item 1A. Risk Factors" appearing elsewhere in this Annual Report.
Drilling and other exploration and development activities
The table below sets forth the results of our operated drilling activities for the periods indicated. The information should not be considered indicative of future performance, nor should it be assumed that there is necessarily any correlation among the number of productive wells drilled, quantities of reserves found or economic value. Productive wells are those that produce, or
are capable of producing, commercial quantities of hydrocarbons, regardless of whether they produce a reasonable rate of return. Dry wells are those that prove to be incapable of producing hydrocarbons in sufficient quantities to justify completion.
| | Year Ended December 31, |
| 2022 | | 2021 | | 2020 |
| Gross | | Net | | Gross | | Net | | Gross | | Net |
| Year Ended December 31, | | | Year Ended December 31, |
| 2023 | | | 2023 | | 2022 | | 2021 |
| Gross | | | Gross | | Net | | Gross | | Net | | Gross | | Net |
| Operated Development Wells: | Operated Development Wells: | | | | | | | | | | | |
Productive (1) | |
Productive (1) | |
Productive (1) | Productive (1) | 51 | | | 48 | | | 2 | | | 1.9 | | | 23 | | | 15.3 | |
| Dry holes | Dry holes | — | | | — | | | — | | | — | | | — | | | — | |
| Total Development | Total Development | 51 | | | 48 | | | 2 | | | 1.9 | | | 23 | | | 15.3 | |
| Operated Exploratory Wells: | Operated Exploratory Wells: | | | | | | | | | | | |
| Productive | Productive | — | | | — | | | — | | | — | | | — | | | — | |
| Productive | |
| Productive | |
| Dry holes | Dry holes | — | | | — | | | — | | | — | | | — | | | — | |
| Total Exploratory | Total Exploratory | — | | | — | | | — | | | — | | | — | | | — | |
| Total Operated Wells: | Total Operated Wells: | | | | | | | | | | | |
| Productive | Productive | 51 | | | 48 | | | 2 | | | 1.9 | | | 23 | | | 15.3 | |
| Dry holes | — | | | — | | | — | | | — | | | — | | | — | |
| Total | 51 | | | 48 | | | 2 | | | 1.9 | | | 23 | | | 15.3 | |
| Productive | |
| Productive | |
| | | | | | | | | | | | | | | | | | | | | | | | | | | | | | | | | | | |
| Year Ended December 31, |
| 2023 | | 2022 | | 2021 |
| Gross | | Net | | Gross | | Net | | Gross | | Net |
| Dry holes | — | | | — | | | — | | | — | | | — | | | — | |
| Total | 69 | | | 57.7 | | | 51 | | | 47.8 | | | 2 | | | 1.9 | |
(1)For properties acquired during the year ended December 31, 2022,2023, the amounts presented only include wells that were completed after the closing date of the acquisition.
As of December 31, 2022,2023, we were not a party to any long-term drilling rig contracts. The following table provides our wells in progress, as well as the various stages of such progress, at December 31, 2022.2023.
| | Gross | | Net |
| Gross | | | Gross | | Net |
| Well Status: | Well Status: | | | |
| Drilling | |
| Drilling | |
| Drilling | Drilling | 7 | | 4 |
| Waiting on completion | Waiting on completion | 48 | | 28 |
| Being completed, not producing | Being completed, not producing | 11 | | 5 |
Delivery commitments
We are party to various long-term agreements that require us to physically deliver crude oil and natural gas. These delivery commitments require us to deliver 4.48,938 MMBoe in 20232024 and 7.06,219 MMBoe thereafter. These commitments are contracted marketing and gathering arrangements that require delivery of a fixed and determinable quantity of crude oil, natural gas, or NGLs in the future. We believe that our current production and reserves are sufficient to satisfy the majority of these commitments and alternatively we could purchase sufficient volumes of oil, natural gas and NGL in the market at prevailing index-related prices to satisfy the commitments, if needed. We incurred shortfalls related to some of our gathering and transportation commitments and as a result paid $15.6 million, $4.5 million and $5.8 million and $14.5 million (including the termination of a midstream contract) for the years ended December 31, 2023, 2022 2021 and 2020,2021, respectively.
Marketing and customers
Production from our oil and natural gas properties is marketed using methods that are consistent with industry practices. Sales prices for oil and natural gas production, including natural gas with recoverable NGLs, are negotiated based on factors normally considered in the industry, such as an index or spot price, price regulations, distance from the well to the pipeline, commodity quality and prevailing supply and demand conditions. In areas where there is no practical or commercial access to pipelines, oil is transported to storage facilities by truck. Our marketing of oil and natural gas can be affected by factors beyond our control, the effects of which cannot be accurately predicted.
During the years ended December 31, 2023, 2022 2021 and 2020,2021, we sold oil and natural gas production representing 10% or more of total revenues to the following purchasers:
| | Year Ended December 31, |
| 2022 | | 2021 | | 2020 |
| SN EF Maverick, LLC | * | | * | | 15.5% |
| Eighty Eight Oil | * | | * | | 11.7% |
| Year Ended December 31, | | | Year Ended December 31, |
| 2023 | | | 2023 | | 2022 | | 2021 |
| Shell Trading US Company | Shell Trading US Company | 20.8% | | 18.3% | | 10.4% | Shell Trading US Company | 18.3% | | 20.8% | | 18.3% |
| | ConocoPhillips | ConocoPhillips | 15.1% | | * | | * |
| | ConocoPhillips | |
| | ConocoPhillips | | * | | 15.1% | | * |
*Purchaser did not account for greater than 10% of revenue for the year.
While the loss of a significant purchaser could result in a temporary interruption in sales of, or a lower price for, our production, we believe that the loss of any such purchasers would not have a material adverse effect on our operations because there are other purchasers in our producing regions.
We have entered into certain oil and natural gas transportation and gathering agreements with various pipeline carriers. Under these agreements, we are obligated to ship minimum daily quantities or pay for any deficiencies at a specified rate. We are also obligated under certain of these arrangements to pay a demand charge for firm capacity rights on pipeline systems regardless of
the amount of pipeline capacity that we utilize. If we do not utilize the capacity, we can release it to others, thus reducing our potential liability.
Competition
The oil and natural gas industry is intensely competitive, and we compete with other companies that have greater resources. Many of these companies not only explore for and produce oil or natural gas, but also carry on midstream and refining operations and market petroleum and other products on a regional, national or worldwide basis. These companies may be able to pay more for productive oil and natural gas properties or to define, evaluate, bid for and purchase a greater number of properties and prospects than our financial or human resources permit. In addition, these companies may have a greater ability to continue exploration activities during periods of low oil and natural gas market prices. Our ability to acquire additional properties and to discover reserves in the future will be dependent upon our ability to evaluate and select suitable properties and to consummate transactions in a highly competitive environment. In addition, because we have fewer financial and human resources than many companies in our industry, we may be at a disadvantage in evaluating and bidding for oil and natural gas properties.
There is also competition between oil and natural gas producers and other industries producing energy and fuel. Furthermore, competitive conditions may be substantially affected by various forms of energy legislation and/or regulation considered from time to time by the governments of the United States and the jurisdictions in which we operate. It is not possible to predict the nature of any such legislation or regulation which may ultimately be adopted or its effects upon our future operations. Such laws and regulations may substantially increase the costs of developing oil or natural gas and may prevent or delay the commencement or continuation of a given operation. Our larger or more integrated competitors may be able to absorb the burden of existing, and any changes to, federal, state and local laws and regulations more easily than we can, which would adversely affect our competitive position.
Seasonality of business
Generally, demand for oil, natural gas and NGL decreases during the spring and fall months and increases during the summer and winter months. However, certain natural gas and NGL markets utilize storage facilities and purchase some of their anticipated winter requirements during the summer, which can lessen seasonal demand fluctuations. In addition, seasonal anomalies such as mild winters or mild summers can have a significant impact on prices. These seasonal anomalies can increase competition for equipment, supplies and personnel during the spring and summer months, which could lead to shortages, increased costs or delay operations.
Title to properties
As is customary in the oil and natural gas industry, we initially conduct only a cursory review of the title to our properties in connection with acquisition of leasehold acreage. At such time as we determine to conduct drilling operations on those properties, we conduct a thorough title examination and perform curative work with respect to significant defects prior to commencement of drilling operations. To the extent title opinions or other investigations reflect title defects on those properties, we are typically responsible for curing any title defects at our expense. We generally will not commence drilling operations on a property until we have cured any material title defects on such property. We have obtained title opinions on substantially all of our producing properties and believe that we have satisfactory title to our producing properties in accordance with standards generally accepted in the oil and natural gas industry.
Prior to completing an acquisition of producing leases, we perform title reviews on the most significant leases and, depending on the materiality of properties, we may obtain a title opinion, obtain an updated title review or opinion or review previously obtained title opinions. Our oil and natural gas properties are subject to customary royalty and other interests, liens for current taxes and other burdens which we believe do not materially interfere with the use of or affect our carrying value of the properties.
We believe that we have satisfactory title to all of our material assets. Although title to these properties is subject to encumbrances in some cases, such as customary interests generally retained in connection with the acquisition of real property, customary royalty interests and contract terms and restrictions, liens under operating agreements, liens related to environmental liabilities associated with historical operations, liens for current taxes and other burdens, easements, restrictions and minor encumbrances customary in the oil and natural gas industry, we believe that none of these liens, restrictions, easements, burdens and encumbrances will materially detract from the value of these properties or from our interest in these properties or materially interfere with our use of these properties in the operation of our business. In addition, we believe that we have obtained
sufficient rights-of-way grants and permits from public authorities and private parties for us to operate our business in all material respects as described in this Annual Report.
Human Capital Measures
Employees
We manage our operations through (i) management and corporate-level services provided by the Manager and (ii) asset-level services and operations provided by our approximately 870904 employees that dedicate all or substantially all of their time to our business. We hire independent contractors on an as-needed basis. We have no collective bargaining agreements with our employees. We believe that our employee relationships are satisfactory.
Safety
Our executive leadership team meets regularly with each subsidiary to provide guidance and resources, empowering operational leaders to create value and improve EHS performance. Workplace safety procedures and programs include but not limited to confined space entry, emergency response, fall protection, hearing conservation, hot work, hydrogen sulfide, incident reporting and investigation, personal protective equipment and spill prevention. Safety performance is tracked on a monthly basis across operations and trends guide safety program improvements.
Recruitment, development and training
We foster an entrepreneurial culture where open communication is encouraged, the views of our employees are heard and the results of their efforts are recognized. We implement an inclusive and dynamic recruiting process that utilizes online recruiting platforms, referrals and professional recruiters. We foster the growth and professional development of our employees through the use of a robust performance review process, which includes the creation of performance development goals and plans to achieve those goals in order to help our employees reach their full potential.
Health and welfare benefits
We retain employees by offering competitive wages and generous benefits that are designed to meet the varied and evolving needs of a diverse workforce. We provide employees with the ability to participate in health and welfare plans, including medical, dental, life and short-term and long-term disability insurance plans. In response to the COVID–19 pandemic, we increased safety measures and protocols for those employees choosing to report to the office.
Community & social engagement
We are committed to supporting and giving back to the communities in which we operate and live. We recognize the link between local communities, the success of our employees and, ultimately, the success of our business.
Legislative and regulatory environment
Our oil, natural gas and NGL exploration, development, production, gathering, transportation, sales and related operations and activities are subject to extensive federal, state and local laws, rules and regulations. Failure to comply with such rules and regulations can result in administrative, civil or criminal penalties, compulsory remediation and imposition of natural resource damages or other liabilities. Because such rules and regulations are frequently amended or reinterpreted, we are unable to predict the future cost or impact of complying with such requirements. Although the regulatory burden on the oil and natural gas industry increases our cost of doing business and, consequently, affects our profitability, we believe these obligations generally do not impact us differently or to any greater or lesser extent than they affect other operators in the oil and natural gas industry with similar operations and types, quantities and locations of production.
Regulation of production
In many states oil and natural gas companies are generally required to obtain permits for drilling operations, provide drilling bonds, file reports concerning operations and meet other requirements related to the exploration, development and production of oil, natural gas and NGL. Such states also have statutes and regulations addressing conservation matters, including provisions for unitization or pooling of oil and natural gas interests, rights and properties, the surface use and restoration of properties upon which wells are drilled and disposal of water produced or used in the D&C process. These regulations include the establishment of maximum rates of production from oil and natural gas wells, rules as to the spacing, plugging and abandoning of such wells, restrictions on venting or flaring oil and natural gas and requirements regarding the ratability of production, as well as rules governing the surface use and restoration of properties upon which wells are drilled.
These laws and regulations may limit the amount of oil, natural gas and NGL that can be produced from wells in which we own an interest and may limit the number of wells, the locations in which wells can be drilled or the method of drilling wells. Additionally, the procedures that must be followed under these laws and regulations may result in delays in obtaining permits and approvals necessary for our operations and therefore our expected timing of drilling, completion and production may be negatively impacted. These regulations apply to us directly as the operator of our leasehold. The failure to comply with these rules and regulations can result in substantial penalties.
Regulation of sales and transportation of liquids
Sales of condensate and NGLs are not currently regulated and are made at negotiated prices. Nevertheless, the U.S. Congress could reenact price controls in the future.
Our sales of NGLs are affected by the availability, terms and cost of transportation. The transportation of NGLs in common carrier pipelines is also subject to rate and access regulation. FERC regulates interstate oil, NGL and other liquid pipeline transportation rates under the ICA. In general, interstate liquids pipeline rates must be cost-based, although settlement rates agreed to by all shippers are permitted and market-based rates may be permitted in certain circumstances.
Intrastate liquids pipeline transportation rates are subject to regulation by state regulatory commissions. The basis for intrastate liquids pipeline regulation, and the degree of regulatory oversight and scrutiny given to intrastate liquids pipeline rates, varies from state to state. Insofar as effective interstate and intrastate rates and regulations regarding access are equally applicable to all comparable shippers, we believe that the regulation of liquids transportation will not affect our operations in any way that is of material difference from those of our competitors who are similarly situated.
Regulation of transportation and sales of oil and natural gas
Historically, the transportation and sale for resale of oil and natural gas in interstate commerce have been regulated by agencies of the U.S. federal government, primarily FERC. In the past, the federal government has regulated the prices at which natural gas could be sold. While sales by producers of natural gas can currently be made at uncontrolled market prices, the U.S. Congress could reenact price controls in the future. Deregulation of wellhead natural gas sales began with the enactment of the NGPA, and culminated in adoption of the Decontrol Act which removed controls affecting wellhead sales of natural gas effective January 1, 1993. The transportation and sale for resale of natural gas in interstate commerce is regulated primarily under the NGA, and by regulations and orders promulgated under the NGA by FERC. In certain limited circumstances,
intrastate transportation and wholesale sales of natural gas may also be affected directly or indirectly by laws enacted by the U.S. Congress and by FERC regulations.
The EP Act of 2005 is a comprehensive compilation of tax incentives, authorized appropriations for grants and guaranteed loans, and significant changes to the statutory policy that affects all segments of the energy industry. Among other matters, the EP Act of 2005 amends the NGA to add an anti-market manipulation provision which makes it unlawful for any entity to engage in prohibited behavior to be prescribed by FERC. The EP Act of 2005 also provided FERC with the power to assess civil penalties of up to $1,000,000 per day for violations of the NGA and increased FERC’s civil penalty authority under the NGPA from $5,000 per violation per day to $1,000,000 per violation per day. In January 2023,2024, the maximum penalty increased to $1,496,035$1,544,521 per violation per day to account for inflation. The civil penalty provisions are applicable to entities that engage in the sale and transportation of natural gas for resale in interstate commerce.
On January 19, 2006, FERC issued Order No. 670, a rule implementing the anti-market manipulation provision of the EP Act of 2005, and subsequently denied rehearing. The rules make it unlawful: (i) in connection with the purchase or sale of natural gas subject to the jurisdiction of FERC, or the purchase or sale of transportation services subject to the jurisdiction of FERC, for any entity, directly or indirectly, to use or employ any device, scheme or artifice to defraud; (ii) to make any untrue statement of material fact or omit to make any such statement necessary to make the statements made not misleading; or (iii) to engage in any act or practice that operates as a fraud or deceit upon any person. The anti-market manipulation rule does not apply to activities that relate only to intrastate or other non-jurisdictional sales or gathering, but does apply to activities of gas pipelines and storage companies that provide interstate services, as well as otherwise non-jurisdictional entities to the extent the activities are conducted “in connection with” gas sales, purchases or transportation subject to FERC jurisdiction, which now includes the annual reporting requirements under Order No. 704, described below. The anti-market manipulation rule and enhanced civil penalty authority reflect an expansion of FERC’s NGA enforcement authority.
On December 26, 2007, FERC issued Order No. 704, a final rule on the annual natural gas transaction reporting requirements, as amended by subsequent orders on rehearing. Under Order No. 704, wholesale buyers and sellers of more than 2.2 million
MMBtus of physical natural gas in the previous calendar year, including natural gas producers, gatherers and marketers, are now required to report, on May 1 of each year, aggregate volumes of natural gas purchased or sold at wholesale in the prior calendar year to the extent such transactions utilize, contribute to, or may contribute to the formation of price indices. It is the responsibility of the reporting entity to determine which individual transactions should be reported based on the guidance of Order No. 704. Order No. 704 also requires market participants to indicate whether they report prices to any index publishers, and if so, whether their reporting complies with FERC’s policy statement on price reporting.
Gathering service, which occurs upstream of jurisdictional transportation services, is regulated by the states onshore and in state waters. Section 1(b) of the NGA exempts natural gas gathering facilities from regulation by FERC as a natural gas company under the NGA. Although FERC has set forth a general test for determining whether facilities perform a non-jurisdictional gathering function or a jurisdictional transportation function, FERC’s determinations as to the classification of facilities are done on a case-by-case basis. To the extent that FERC issues an order that reclassifies certain jurisdictional transportation facilities as non-jurisdictional gathering facilities, and depending on the scope of that decision, our costs of getting gas to point of sale locations may increase. We believe that the natural gas pipelines in our gathering systems meet the traditional tests FERC has used to establish a pipeline’s status as a gatherer not subject to regulation as a natural gas company. However, the distinction between FERC-regulated transportation services and federally unregulated gathering services could be the subject of ongoing litigation, so the classification and regulation of our gathering facilities could be subject to change based on future determinations by FERC, the courts or the U.S. Congress. State regulation of natural gas gathering facilities generally includes various occupational safety, environmental and, in some circumstances, nondiscriminatory-take requirements. Although such regulation has not generally been affirmatively applied by state agencies, natural gas gathering may receive greater regulatory scrutiny in the future.
Contango Resources, LLC hasWe own an interstate liquids pipeline through a consolidated subsidiary that is considered a common carrier pipeline subject to regulation by FERC under the ICA. Unless we obtain a waiver of the applicable provisions, the ICA requires that we maintain tariffs on file with FERC for interstate movements of liquids on our pipelines. Those tariffs set forth the rates we charge for providing transportation services as well as the rules and regulations governing these services. The ICA requires that tariff rates for liquids pipelines, which include both crude oil pipelines and refined products pipelines, be just and reasonable and non-discriminatory. Many FERC-regulated liquids pipelines, including Contango Resources, LLC,ours, use the FERC indexing methodology to change its rates. FERC, however, retained cost-of-service ratemaking, market-based rates and settlement rates as alternatives to the indexing approach that may be used in certain specified circumstances. For those pipelines that use the FERC indexing methodology, FERC reviews the index formula every five years to determine whether a change in the methodology is required or, if not, to determine the appropriate index for the subsequent five-year period. On January 20, 2022, FERC issued an order on rehearing of its December 17, 2020 Order Establishing Index Level in which the FERC reduced the oil pricing index factor
for oil pipelines to use for the current five-year period. As a result, the ceiling levels computed for July 1, 2021 to June 30, 2022, as well as the ceiling levels for the period July 1, 2022, to June 30, 2023, and the resulting rates currently in effect for our pipelines, were recomputed to account for the appropriate index factor. FERC denied rehearing of the January 20 order on May 6, 2022. Certain parties have now appealed the January 20 and May 6 FERC orders, and the appeals remain pending before the DC Circuit.
From time to time, we might enter into arrangements to transport liquids on an affiliated ICA-jurisdictional pipeline, and FERC may more heavily scrutinize agreements between ICA jurisdictional pipelines and their affiliates. On December 15, 2022, FERC issued a Proposed Policy Statement on Oil Pipeline Affiliate Committed Service seeking comments on a new framework for FERC to analyze agreements between an ICA-jurisdictional pipeline and an affiliated shipper. Under the Proposed Policy Statement, if following an open season, the only shipper agreeing to the noticed service is an affiliate of the pipeline, then FERC would presume the contract is unduly discriminatory and not just and reasonable and require the affiliates to rebut that presumption with additional evidence supporting the justness and reasonableness of the agreement. Comments on the Proposed Policy Statement are due in the spring of 2023. Notices of proposed policy statements are not final rules and FERC’s determination regarding changes to current practices are not required to be completed within a specific timeframe or at all. Additionally, on December 16, 2022, FERC issued an order in FERC Docket No. OR17-2-001 that clarified FERC’s rules and practices enforcing the ICA’s prohibition on certain transactions on ICA jurisdictional pipelines and affiliated shippers. Under FERC’s recent clarification of the ICA, FERC also will scrutinize transactions between jurisdictional pipelines and affiliated shippers to ensure a common parent company is not subsidizing transportation service on the pipeline. FERC’s treatment of contracts between affiliates on ICA jurisdictional pipelines has been changing in recent years, and it is difficult to predict the level and type of scrutiny that will be applied in the future and the extent to which affiliate contracts may be limited.
The price at which we sell natural gas is not currently subject to federal rate regulation and, for the most part, is not subject to state regulation. However, with regard to our physical and financial sales of these energy commodities, we are required to observe anti-market manipulation laws and related regulations enforced by FERC under the EP Act of 2005 and under the Commodity Exchange Act (“CEA”), and regulations promulgated thereunder enforced by the CFTC. The CEA prohibits any
person from manipulating or attempting to manipulate the price of any commodity in interstate commerce or futures on such commodity. The CEA also prohibits knowingly delivering or causing to be delivered false or misleading or knowingly inaccurate reports concerning market information or conditions that affect or tend to affect the price of a commodity as well as certain disruptive trading practices. The CFTC also has statutory authority to seek civil penalties of up to the greater of approximately $1,404,520$1,450,040 (adjusted annually for inflation) or triple the monetary gain to the violator for violations of the anti-market manipulation sections of the CEA. Should we violate the anti-market manipulation laws and regulations, we could also be subject to related third-party damage claims by, among others, sellers, royalty owners and taxing authorities.
Further, the FTC has the authority under the Federal Trade Commission Act (“FTCA”) and the Energy Independence and Security Act of 2007 (“EISA”) to regulate wholesale petroleum markets. The FTC has adopted anti-market manipulation rules, including prohibiting fraud and deceit in connection with the purchase or sale of certain petroleum products, and prohibiting omissions of material information which distort or are likely to distort market conditions for such products. In addition to other enforcement powers it has under the FTCA, the FTC can sue violators under EISA and request that a court impose fines of approximately $1,426,319$1,472,546 (adjusted annually for inflation) per violation per day.
Intrastate natural gas transportation is also subject to regulation by state regulatory agencies. The basis for intrastate regulation of natural gas transportation and the degree of regulatory oversight and scrutiny given to intrastate natural gas pipeline rates and services varies from state to state. As such regulation within a particular state will generally affect all intrastate natural gas shippers within the state on a comparable basis, we believe that the regulation of similarly situated intrastate natural gas transportation in any states in which we operate and ship natural gas on an intrastate basis will not affect our operations in any way that is of material difference from those of our competitors. Like the regulation of interstate transportation rates, the regulation of intrastate transportation rates affects the marketing of natural gas that we produce, as well as the revenues we receive for sales of our natural gas.
Changes in law and to FERC or state policies and regulations may adversely affect the availability and reliability of firm and/or interruptible transportation service on interstate and intrastate pipelines, and we cannot predict what future action FERC or state regulatory bodies will take. We do not believe, however, that any regulatory changes will affect us in a way that materially differs from the way they will affect other natural gas producers and marketers with which we compete.
Regulation of environmental and occupational safety and health matters general
Our operations are subject to numerous stringent federal, regional, state and local statutes and regulations governing environmental protection, occupational safety and health, and the release, discharge or disposal of materials into the environment, some of which carry substantial administrative, civil and criminal penalties for failure to comply. Applicable U.S. federal environmental laws include, but are not limited to, RCRA, CERCLA, OPA, the CWA, the CAA, the SDWA, the ESA, and the MBTA. In addition, state and local laws and regulations set forth specific standards for drilling wells, the maintenance of bonding requirements in order to drill or operate wells, the spacing and location of wells, the method of drilling and casing wells, the surface use and restoration of properties upon which wells are drilled, the plugging and abandoning of wells, the prevention and cleanup of pollutants, and other matters. These laws and regulations may, among other things, require the acquisition of permits to conduct exploration, drilling, and production operations; restrict the types, quantities and concentrations of various substances that can be released into the environment in connection with drilling, production and transporting through pipelines; govern the sourcing and disposal of water used in the D&C process; limit or prohibit construction or drilling activities in sensitive areas such as wilderness, wetlands, critical habitat of protected species, frontier and other protected areas; require investigatory or remedial actions to prevent or mitigate pollution conditions caused by our operations; impose obligations to reclaim and abandon well sites and pits; establish specific safety and health criteria addressing worker protection; and impose substantial liabilities for pollution resulting from operations or failure to comply with regulatory filings. Additionally, the U.S. Congress and federal and state agencies frequently revise environmental laws and regulations, and any changes that result in delay or more stringent and costly permitting, waste handling, disposal and clean-up requirements for the oil and gas industry could have a significant impact on our operating costs. Although environmental obligations have not historically had a material adverse impact on the results of our operations or financial condition, there can be no assurance that future developments, such as increasingly stringent environmental laws or enforcement thereof, will not cause us to incur material environmental liabilities or costs.
Failure to comply with these laws and regulations may result in the assessment of administrative, civil and criminal fines and penalties, loss of permits or leases, the imposition of investigatory or remedial obligations and the issuance of orders enjoining some or all of our operations in affected areas. These laws and regulations may also restrict the rate of oil and natural gas production below the rate that would otherwise be possible. The regulatory burden on the oil and gas industry increases the cost of doing business in the industry and consequently affects profitability. It is possible that, over time, environmental regulation
could evolve to place more restrictions and limitations on activities that may affect the environment, and thus, any changes in environmental laws and regulations or reinterpretation of enforcement policies that result in more stringent and costly well drilling, construction, completion or water management activities or waste handling, storage, transport, disposal, or remediation requirements could require us to make significant expenditures to attain and maintain compliance and may otherwise have a material adverse effect on our results of operations and financial position. We may be unable to pass on such increased compliance costs to our customers. Moreover, accidental releases or spills may occur in the course of our operations, and we cannot be sure that we will not incur significant costs and liabilities as a result of such releases or spills, including any third-party claims for damage to property, natural resources or persons. Although we believe that we are in substantial compliance with applicable environmental laws and regulations and that continued compliance with existing requirements will not have a material adverse impact on our business, there can be no assurance that this will continue in the future.
The following is a summary of the more significant existing environmental and occupational health and safety laws and regulations, as amended from time to time, to which our business operations are subject and for which compliance may have a material adverse impact on its capital expenditures, results of operations or financial position.
Hazardous substances and wastes
CERCLA, also known as the “Superfund” law, and comparable state laws, impose liability without regard to fault or the legality of the original conduct, on certain classes of persons with respect to the release of a “hazardous substance” into the environment. These classes of persons, or, as termed in CERCLA, potentially responsible parties, include the current and past owners or operators of a disposal site or site where the release occurred and anyone who disposed or arranged for the disposal of the hazardous substances found at such sites. Under CERCLA, such persons may be subject to joint and several, strict liability for the costs of cleaning up the hazardous substances that have been released into the environment and for damages to natural resources. It is not uncommon for neighboring landowners and other third parties to file claims for personal injury and property damage allegedly caused by hazardous substances released into the environment. We are able to control directly the operation of only those wells with respect to which we act as operator. Notwithstanding our lack of direct control over wells operated by others, the failure of an operator other than us to comply with applicable environmental regulations may, in certain circumstances, be attributed to us. We generate materials in the course of our operations that may be regulated as hazardous substances under CERCLA and other environmental laws but we are unaware of any liabilities for which we may be held responsible that would materially and adversely affect our business operations. While petroleum and crude oil fractions are
generally not considered hazardous substances under CERCLA and its analogues because of the so-called “petroleum exclusion,” adulterated petroleum products containing other hazardous substances have been treated as hazardous substances in the past.
We also generate solid and hazardous wastes that may be subject to the requirements of the RCRA, and analogous state laws. RCRA regulates the generation, handling, storage, treatment, transport and disposal of nonhazardous and hazardous solid wastes. RCRA specifically excludes “drilling fluids, produced waters and other wastes associated with the development or production of oil, natural gas or geothermal energy” from regulation as hazardous wastes. With the approval of the EPA, individual states can administer some or all of the provisions of RCRA and some states have adopted their own, more stringent requirements. However, legislation has been proposed from time to time and various environmental groups have filed lawsuits that, if successful, could result in the reclassification of certain oil and natural gas exploration and production wastes as “hazardous wastes,” which would make such wastes subject to much more stringent handling, disposal and clean-up requirements. Any future loss of the RCRA exclusion for drilling fluids, produced waters and related wastes could result in an increase in our costs to manage and dispose of generated wastes, which could have a material adverse effect on our results of operations and financial position. In addition, in the course of our operations, we generate some amounts of ordinary industrial wastes, such as paint wastes, waste solvents, laboratory wastes and waste compressor oils that may be regulated as hazardous wastes if such wastes are determined to have hazardous characteristics. Although the costs of managing hazardous waste may be significant, we do not believe that our costs in this regard are materially more burdensome than those for similarly situated companies.
We currently own, lease or operate numerous properties that may have been used by prior owners or operators for oil and natural gas development and production activities for many years. Although we believe that we have utilized operating and waste disposal practices that were standard in the industry at the time, hazardous substances, wastes or petroleum hydrocarbons may have been released on, under or from the properties owned or leased by us, or on, under or from other locations, including off-site locations where such substances have been taken for recycling or disposal. In addition, some of our properties may have been operated by third parties or by previous owners or operators whose treatment and disposal of hazardous substances, wastes or petroleum hydrocarbons was not under our control. These properties and the substances disposed or released on, under or from them may be subject to CERCLA, RCRA and/or analogous state laws. Under such laws, we could be required to
undertake response or corrective measures, which could include removal of previously disposed substances and wastes, cleanup of contaminated property or performance of remedial plugging or pit closure operations to prevent future contamination.
Water discharges
The CWA and comparable state laws impose restrictions and strict controls regarding the discharge of pollutants, including spills and leaks of oil and other natural gas wastes, into or near waters of the United States or state waters. The discharge of pollutants into regulated waters is prohibited, except in accordance with the terms of a permit issued by the EPA or an analogous state agency. The discharge of dredge and fill material into regulated waters, including wetlands, is also prohibited, unless authorized by a permit issued by the U.S. Army Corps of Engineers (the “Corps”). The scope of these regulated waters has been subject to controversy in recent years. In September 2015, the EPA and the Corps issued new rules revising the definition of “waters of the United States” (the “Clean Water Rule”), but in April 2020, the EPA and the Corps replaced the Clean Water Rule with the NWPR, which narrows the definition of “waters of the United States” to four categories of jurisdictional waters and includes 12 categories of exclusions, including groundwater. However, district courts for the U.S. Districts of Arizona and New Mexico have vacated the NWPR, and the Biden Administration has announced its intention to develop its own definition for “waters of the United States. In January 2023, the agencies published a final rule defining “waters of the United States” according to the broader pre-2015 standards, with updates to incorporate existing Supreme Court decisions and agency guidance. However, this rule was subsequently enjoined in 27 states. Additionally, the Supreme Court of the United States heard arguments onreleased their opinion in Sackett v. EPA, which adopted the “continuous surface connection” test to determine if wetlands are water of the United States. The Agencies published a case regardingSeptember 2023 rule to incorporate this decision, but did not define the scopeterm “continuous surface connection.” Due to the injunction, implementation of the rule is currently split by jurisdiction. In the 27 states subject to the injunction, the agencies are interpreting “waters of the United States” in October 2022, aconsistent with the pre-2015 regulatory regime and the changes made by the Sackett decision. In the remaining 23 states, the agencies are implementing the September 2023 rule. However, it is currently unclear how broadly the September 2023 rule and the Sackett decision on which is expected in 2023, which could impactwill be interpreted by the regulatory definition or its implementation.agencies. To the extent any judicial ruling or administrative rulemaking or other action further expands the scope of the CWA’s jurisdiction, we could face increased costs and delays with respect to obtaining permits, including for dredge and fill activities in wetland areas.
The process for obtaining permits also has the potential to delay our operations. Additionally, spill prevention, control and countermeasure plans, also referred to as “SPCC plans,” are required by federal law in connection with on-site storage of significant quantities of oil. Compliance may require appropriate containment berms and similar structures to help prevent the contamination of navigable waters by a petroleum hydrocarbon tank spill, rupture or leak.
Safe Drinking Water Act
The SDWA grants the EPA broad authority to take action to protect public health when an underground source of drinking water is threatened with pollution that presents an imminent and substantial endangerment to humans. The SDWA also regulates saltwater disposal wells under the UIC program. The EP Act of 2005 amended the UIC provisions of the SDWA to expressly exclude certain hydraulic fracturing from the definition of “underground injection,” but disposal of hydraulic fracturing fluids and produced water or their injection for enhanced oil recovery is not excluded. In 2014, the EPA issued permitting guidance governing hydraulic fracturing with diesel fuels. While we do not currently use diesel fuels in our hydraulic fracturing fluids, we may become subject to federal permitting under SDWA if our fracturing formula changes. Additionally, we may incur significant costs to comply with disposal requirements for hydraulic fracturing fluids and produced water. For more information, see "Item 1A. Risk Factors."
Air emissions
The CAA and comparable state laws restrict the emission of air pollutants from many sources, including compressor stations, through the issuance of permits and other requirements. These laws and regulations may require us to obtain pre-approval for the construction or modification of certain projects or facilities expected to produce or significantly increase air emissions, obtain and strictly comply with stringent air permit requirements or utilize specific equipment or technologies to control emissions of certain pollutants. The need to obtain permits has the potential to delay the development of oil and natural gas projects. Over the next several years, we may be required to incur certain capital expenditures for air pollution control equipment or other air emissions related issues. For example, in October 2015, the EPA lowered the NAAQS for ozone from 75 to 70 parts per billion and completed attainment/non-attainment designations in 2018. In December 2020, the EPA announced its intention to leave the ozone NAAQS unchanged at 70 parts per billion; however, this decision has been subject to legal challenges, and the Biden Administration has formally announced that it would reconsider the 2020 decision. To the extent more stringent standards are implemented, we could be required to incur further costs for pollution control equipment or other compliance measures. Further, in June 2016, the EPA also finalized rules regarding criteria for aggregating multiple small surface sites into a single source for air-quality permitting purposes applicable to the oil and gas industry. These rules could cause small facilities, on an aggregate basis, to be deemed a major source, thereby triggering more stringent air permitting processes and requirements.
State implementation of the revised NAAQS could result in stricter permitting requirements, delay or prohibit our ability to obtain such permits, and result in increased expenditures for pollution control equipment, the costs of which could be
significant. In addition, the EPA has adopted new rules under the CAA that require the reduction of volatile organic compound (“VOC”) and methane emissions from certain fractured and refractured natural gas wells for which well completion operations are conducted and further require that most wells use reduced emission completions, also known as “green completions.” These regulations also establish specific new requirements regarding emissions from production-related wet seal and reciprocating compressors, and from pneumatic controllers and storage vessels. In addition, the regulations place new requirements to detect and repair VOC and methane at certain well sites and compressor stations. However, in September 2020, the EPA finalized a rule removing transmission and storage activities from the purview of the rules, thereby rescinding the VOC and methane emissions limits applicable to such activities and rescinding the methane specific limits for other activities but maintaining emissions limits for VOCs. However, subsequently, the U.S. Congress approved, and President Biden signed into law, a resolution under the Congressional Review Act to repeal the September 2020 rulemaking, effectively reinstating the prior standards. Additionally, in November 2021,December 2023, the EPA issued a proposedfinal rule that if finalized, would establishestablished OOOOb as a more stringent new source and OOOOc as first-time existing source standards of performance for methane and VOC emissions for the crude oil and natural gas source category. OwnersUnder the final rule, owners or operators of affected emission units or processes wouldwill have two years to comply with specificprepare and submit their plans to impose methane emission controls on existing sources. The presumptive standards of performance that may includeunder the final rule are generally the same for both new and existing sources, including enhanced leak detectingdetection using optical gas imaging and subsequent repair requirements, reduction of regulated emissions through capture and control systems, zero-emission requirements for certain equipment or processes, operations and maintenance requirements and requirements for “green well” completions. In November 2022, the EPA published a supplemental methane proposal, which, among other items, sets forth specific revisions strengthening the first nationwide emission guidelines for states to limit methane emissions from existing crude oil and natural gas facilities. The proposalfinal rule also revises requirements for fugitive emissions monitoring and repair as well as equipment leaks and the frequency of monitoring surveys, establishes a “super-emitter” response program to timely mitigate emissions events as detected by governmental agencies or qualified third parties, triggering certain investigation and repair requirements, and provides additional options for the use of advanced monitoring to encourage the deployment of innovative technologies to detect and reduce methane emissions. The proposal is currently subject to public comment and is expected to be finalized in 2023; however,However, it is likely that these requirements will be subject to legal challenges. Failure to comply with these new methane rules may result in substantial fines and penalties for non-compliance, as well as injunctive relief. Separately, in August 2022, the IRA 2022 was signed into law, which amends the CAA to establish the first ever federal fee on methane emissions from sources required to report their GHG emissions to the EPA, including certain oil and gas operations. The methane emissions charge will start in calendar year 2024 at $900 per ton of methane, increase to $1,200 in 2025, and be set at $1,500 for 2026 and subsequent years. Calculation of the methane fee is based on certain thresholds
established in the IRA 2022. Compliance with these and other air pollution control and permitting requirements has the potential to delay the development of natural gas projects and increase our costs of development, which costs could be significant.
Climate change
Climate change continues to attract considerable public and scientific attention. As a result, our operations as well as the operations of our operatorsin which we have a working interest but are not the operator are subject to a series of regulatory, political, litigation, and financial risks associated with the production and processing of fossil fuels and emission of GHG. At the federal level, no comprehensive climate change law or regulation has been implemented to date, though recently passed laws such as the IRA 2022 advance numerous climate-related objectives. For example, the IRA 2022, in addition to the methane fee discussed above, appropriates significant federal funding for renewable energy initiatives. The EPA has also adopted regulations that, among other things, establish construction and operating permit reviews for GHG emissions from certain large stationary sources, and together with DOT, implement GHG emissions limits on vehicles manufactured for operation in the United States. The federal regulation of methane emissions from oil and gas facilities has been subject to controversy in recent years. For more information, see “Part I., Items 1 and 2. Business and Properties—Legislative and regulatory environment—Air emissions.”
Additionally, various states and groups of states have adopted or are considering adopting legislation, regulations or other regulatory initiatives that are focused on such areas as GHG cap and trade programs, carbon taxes, reporting and tracking programs, and restriction of GHG emissions. For example, California, through CARB has implemented a cap and trade program for GHG emissions that sets a statewide maximum limit on covered GHG emissions, and this cap declines annually to reach 40% below 1990 levels by 2030. Covered entities must either reduce their GHG emissions or purchase allowances to account for such emissions. Separately, California has implemented LCFS and associated tradable credits that require a progressively lower carbon intensity of the state’s fuel supply than baseline gasoline and diesel fuels. Such programs work alongside increased regulation by California seeking to reduce both the supply and demand for fossil fuels in the state, to include, for example, the phasing out of the sale of vehicles with internal combustion engines. CARB has also promulgated regulations regarding monitoring, leak detection, repair and reporting of methane emissions from both existing and new oil and gas production facilities. Similar regulations applicable to oil and gas facilities have been promulgated in Colorado. Colorado has begun to increasingly regulate oil and gas operations with consideration towards GHG emissions and cumulative impacts. In January 2024, the Colorado Energy and Carbon Management Commission (formerly the Colorado Oil and Gas Conversation Commission) released draft rules that, if finalized as proposed, would require regulators to consider cumulative impacts of oil and gas operations in permitting decisions and increase scrutiny on the project’s proximity to other industrial sites, residential and school areas, “disproportionately impacted communities,” and “cumulatively impacted communities.” The draft rules would also set GHG emissions intensity targets for oil and gas operators and require regulators to consider such targets in their cumulative impacts analysis, as well as the potential to restrict operations during the summer in Ozone Nonattainment Areas.
Internationally, the United Nations-sponsored “Paris Agreement”Paris Agreement requires member states to individually determine and submit non-binding emission reduction targets every five years after 2020. Although the United States had withdrawn from the agreement,Paris Agreement, President Biden has signed executive orders recommitting the United States to the agreement and, in April 2021, announced a target of reducing the United States’ emissions by 50-52% below 2005 levels by 2030. In November 2021, the international community gathered again in Glasgow at the 26th Conference to the Parties on the UN Framework Convention on Climate Change (“COP26”), during which multiple announcements were made, including a call for parties to eliminate certain fossil fuel subsidies and pursue further action on non-CO2 GHGs. At the 27th Conference to the Parties on the UN Framework Convention on Climate Change ("COP27") in Sharm El-Sheik in November 2022, countries reiterated the agreements from COP26 and were called upon to accelerate efforts toward the phase out of inefficient fossil fuel subsidies. The US also announced, in conjunction with the European Union and other partner countries, that it would develop standards for monitoring and reporting methane emissions to help create a market for low methane-intensity natural gas. At the 28th Conference of the Parties (“COP28”), the parties entered into an agreement to transition away from fossil fuels in energy systems and increase renewable energy capacity, though no timeline for doing so was set. While non-binding, the agreements coming out of COP28 could result in increased pressure among financial institutions and various stakeholders to reduce or otherwise impose more stringent limitations on funding for and increase potential opposition to the production and use of fossil fuels. Although no firm commitment or timeline to phase out or phase down all fossil fuels was made at COP27 or COP28, there can be no guarantees that countries will not seek to implement such a phase out in the future. Relatedly, the United States and European Union jointly announced the launch of the “Global Methane Pledge,” which aims to cut global methane pollution at least 30% by 2030 relative to 2020 levels, including “all feasible reductions” in the energy sector. The impacts of these orders, pledges, agreements and any legislation or regulation promulgated to fulfill the United States’ commitments under the Paris Agreement, COP26, or other international conventions cannot be predicted at this time.
Governmental, scientific, and public concern over the threat of climate change arising from GHG emissions has resulted in increasing political risks in the United States, including climate change related pledges made by the recently elected administration. These have included promises to limit emissions and curtail the production of oil and gas on federal lands, such as through the cessation of leasing public land for hydrocarbon development. For example, President Biden has issued several executive orders focused on addressing climate change, including items that may impact our costs to produce, or demand for, oil and gas. Additionally, in November 2021, the Biden Administration released “The Long-Term Strategy of the United States: Pathways to Net-Zero Greenhouse Gas Emissions by 2050,” which establishes a roadmap to net zero emissions in the United States by 2050 through, among other things, improving energy efficiency; decarbonizing energy sources via electricity, hydrogen, and sustainable biofuels; and reducing non-CO2 GHG emissions, such as methane and nitrous oxide. The Biden Administration is also considering revisions to the leasing and permitting programs for oil and gas development on federal lands. Other actions that could be pursued by the Biden Administration may include the imposition of more restrictive requirements for the establishment of pipeline infrastructure or the permitting of LNG export facilities, as well as more
restrictive GHG emission limitations for oil and gas facilities. For example, on January 26, 2024, President Biden announced a temporary pause on pending decisions on new exports of LNG to countries that the United States does not have free trade agreements with, pending Department of Energy review of the underlying analyses for authorizations. The pause is intended to provide time to integrate certain considerations, including potential energy cost increases for consumers and manufacturers and the latest assessment of the impact of GHG emissions, to ensure adequate guards against health risks are in place. Litigation risks are also increasing, as a number of parties have sought to bring suit against oil and natural gas companies in state or federal court, alleging, among other things, that such companies created public nuisances by producing fuels that contributed climate change or alleging that companies have been aware of the adverse effects of climate change for some time but defrauded their investors or customers by failing to adequately disclose those impacts.
There are also increasing financial risks for fossil fuel producers as shareholders currently invested in fossil-fuel energy companies may elect in the future to shift some or all of their investments into non-fossil fuel related sectors. Institutional lenders who provide financing to fossil-fuel energy companies also have become more attentive to sustainable lending practices and some of them may elect not to provide funding for fossil fuel energy companies. For example, at COP26, the Glasgow Financial Alliance for Net Zero (“GFANZ”) announced that commitments from over 450 firms across 45 countries had resulted in over $130 trillion in capital committed to net zero goals. The various sub-alliances of GFANZ generally require participants to set short-term, sector-specific targets to transition their financing, investing, and/or underwriting activities to net zero emissions by 2050. There is also a risk that financial institutions will be required to adopt policies that have the effect of reducing the funding provided to the fossil fuel sector. President Biden signed an executive order calling for the development of a “climate finance plan” and, separately, in late 2020, the Federal Reserve announced that it had joined the NGFS, a consortium of financial regulators focused on addressing climate-related risks in the financial sector. In September 2022, the Federal Reserve announced that six of the U.S.’ largest banks would participate in a pilot climate scenario analysis to enhance the ability of firms and supervisors to measure and manage climate-related risk. Released in JanuaryTaking place throughout 2023, the pilot exercise is designed to analyze the impact of both physical and transition risks related to climate change on specific assets of the banks’ portfolios. Limitation of investments in and financings for fossil fuel energy companies could result in the restriction, delay or cancellation of drilling programs or development or production activities. Additionally, the SEC has proposed rules requiring
climate disclosures from registrants, including data on Scope 1 and 2 GHG emissions and, in some cases, Scope 3, as well as a registrant’s climate-related business strategy. A final rule is expected to be released in the second quarter of 2023.2024. Although the form and substance of these requirements is not yet known, this may result in additional costs to comply with any such disclosure requirements. Similarly, in October 2023, the Governor of California signed the Climate Corporate Data Accountability Act (“CCDAA”) and Climate-Related Financial Risk Act (“CRFRA”) into law. The CCDAA requires both public and private U.S. companies that are “doing business in California” and that have a total annual revenue of $1 billion to publicly disclose and verify, on an annual basis, Scope 1, 2 and 3 GHG emissions. Both laws are vague and potentially overbroad with respect to their applicability, appearing to require only minimal contacts with California. The CRFRA requires the disclosure of a climate-related financial risk report (in line with the Task Force on the Climate-related Financial Disclosures (“TCFD”) recommendations or equivalent disclosure requirements under the International Sustainability Standards Board’s (“ISSB”) climate-relate disclosure standards) every other year for public and private companies that are “doing business in California” and have total annual revenue of $500 million. Reporting under both laws would begin in 2026. California also recently passed the Voluntary Carbon Market Disclosures Act, which places disclosure obligations on companies that purchase or use voluntary carbon offsets and make “net zero”, “carbonneutral”, or similar claims. This law took effect at the beginning of 2024, but does not specify when a company’s first disclosures are required, though the bill’s sponsor has stated that the intent is for the law to be enforced beginning January 1, 2025. Currently, the ultimate impact of these laws on our business is uncertain—the Governor of California has directed further consideration of the implementation deadlines for the CCDAA and CRFRA, and there is potential for legal challenges to be filed with respect to the scope of the laws—but, absent clarification or revisions to the law, alongside the SEC proposed rule, finalization and implementation may result in additional costs to comply with these disclosure requirements as well as increased costs of and restrictions on access to capital. Separately, enhanced climate related disclosure requirements could lead to reputational or other harm with customers, regulators, investors or other stakeholders and could also increase our litigation risks relating to alleged climate-related damages resulting from our operations, statements alleged to have been made by us or others in our industry regarding climate change risks, or in connection with any future disclosures we may make regarding reported emissions, particularly given the inherent uncertainties and estimations with respect to calculating and reporting GHG emissions.
The adoption and implementation of new or more stringent international, federal or state legislation, regulations or other regulatory initiatives that impose more stringent standards for GHG emissions from oil and natural gas producers, such as ourselves or our operators, or otherwise restrict the areas in which we may produce oil and natural gas or generate GHG emissions could result in increased costs of compliance or costs of consuming, and thereby reduce demand for or erode value for, the oil and natural gas that we produce. Additionally, political, litigation, and financial risks may result in our restricting or canceling oil and natural gas production activities, incurring liability for infrastructure damages as a result of climatic changes, or impairing our ability to continue to operate in an economic manner. Moreover, climate change may also result in various physical risks, such as the increased frequency or intensity of extreme weather events (including storms, wildfires, and other natural disasters) or changes in meteorological and hydrological patterns, that could adversely impact our operations, as well as those of our operators and their supply chains. Such physical risks may result in damage to our facilities or otherwise adversely impact our operations, such as if we become subject to water use curtailments in response to drought, or demand for our products, such as to the extent warmer winters reduce the demand for energy for heating purposes. Such physical risks may also impact our supply chain or infrastructure on which we rely to produce or transport our products. One or more of these developments could have a material adverse effect on our business, financial condition and results of operation.
Hydraulic fracturing
Hydraulic fracturing is a common practice that is used to stimulate production of oil and/or natural gas from low permeability subsurface rock formations and is important to our business. The hydraulic fracturing process involves the injection of water, proppants and chemicals under pressure into targeted subsurface formations to fracture the hydrocarbon-bearing rock formation and stimulate production of hydrocarbons. We regularly use hydraulic fracturing as part of our operations. Presently, hydraulic fracturing is primarily regulated at the state level, typically by state oil and natural gas commissions, but the practice has become increasingly controversial in certain parts of the country, resulting in increased scrutiny and regulation. For example, the EPA finalized rules under the CWA in June 2016 that prohibit the discharge of wastewater from hydraulic fracturing operations to publicly owned wastewater treatment plants.
In addition, there have been heightened concerns by the public about hydraulic fracturing causing damage to aquifers and there is potential for future regulation to address those concerns. In December 2016, the EPA released its final report on the potential impacts of hydraulic fracturing on drinking water resources. The final report concluded that certain activities associated with hydraulic fracturing may impact drinking water resources under certain limited circumstances. Additionally, BLM finalized rules in March 2015 that impose new or more stringent standards for performing hydraulic fracturing on federal and American Indian lands. While this rule was subsequently rescinded in December 2017, which rescission was upheld by the District Court
of Northern California, the Biden Administration may seek to revisit these regulations. For example, the EPA finalized rules
under the CWA in June 2016 that prohibit the discharge of wastewater from hydraulic fracturing operations to publicly owned wastewater treatment plants.
Separately, the Biden Administration may also pursue further restriction of hydraulic fracturing and other oil and gas development on federal lands. For example, on January 27, 2021, President Biden issued an executive order that suspended the issuance of new leases for oil and gas development on public lands, but not on existing operations under valid leases or on tribal lands that the federal government merely holds in trust, pending completion of a comprehensive review and reconsideration of the federal oil and natural gas permitting and leasing practices. In response to this, in November 2021, the DOI released a report on the federal oil and gas leasing program that included several recommendations for how to reform the program. IRA 2022 responded to one of the report’s recommendations and increased royalty rates, to include onshore royalty rates to 16 ⅔%. Several of the other recommendations, however, require further Congressional action and include, among other items, revising bidding practices to avoid leasing of low potential lands; and performing more meaningful public and tribal consultations regarding the leasing and permitting processes. Provisions of these reforms have been subject to litigation, and the leasing suspension was ultimately halted by a permanent injunction in August 2022. A portion of our net acreage and total proved reserves are on federal land. Although permit consideration has resumed, we cannot guarantee that further action will not be taken to curtail oil and gas development on federal lands. In July 2023, the BLM proposed a rule to update the fiscal terms of federal oil and gas leases, which would increase fees, rents, royalties, and bonding requirements. The rule would also add new criteria for BLM to consider when determining whether to lease nominated land, including the presence of important habitats or wetlands, the presence of historical properties or sacred sites, and recreational use of the land. BLM anticipates a final action on the proposal in Spring 2024. To the extent we are unable to obtain the leases, permits, or other authorizations required for our operations or business strategy, our business performance and results of operations may be adversely affected.
Separately, in March 2016, the U.S. Occupational Safety and Health Administration issued a final rule to impose stricter standards for worker exposure to silica, which went into effect on June 23, 2021 for hydraulic fracturing employers. We may be required to incur additional costs associated with compliance with these standards.
At the state level, several states, including Texas, have adopted or are considering legal requirements that require oil and natural gas operators to disclose chemical ingredients and water volumes used to hydraulically fracture wells, in addition to more stringent well construction and monitoring requirements. For example, Colorado has adopted more stringent setbacks for oil and gas development. In California, Senate Bill No. 1137 was signed into law on September 16, 2022, which establishes 3,200 feet as the minimum distance between new oil and gas production wells and certain sensitive receptors such as homes, schools or parks effective January 1, 2023. However, on February 3, 2023, the Secretary of State of California certified a requisite number of signatures collected by proponents of a voter referendum, thereby qualifying the Bill for the November 2024 ballot. Accordingly, Senate Bill No. 1137 is stayed until it is put to a vote. However, Colorado has begun to increasingly regulate oil and gas operations generally with consideration towards GHG emissions and their cumulative impacts, including releasing draft rules in 2024 that would apply increased scrutiny to a project’s location within or within 2,000 feet of impacted communities and other developments. Local governments may also adopt ordinances within their jurisdictions regulating the time, place and manner of drilling activities in general or hydraulic fracturing activities in particular. For example, in January 2023, the Board of Supervisors of Los Angeles County in California adopted an ordinance prohibiting new oil wells and production facilities in all zones, designating existing oil wells and production facilities as nonconforming uses in all zones and establishing regulations for existing oil wells and production facilities, to include the phasing out of existing operations. Moreover, existing oil and gas facilities within the setback zone in Los Angeles County will be impacted if Senate Bill No. 1137 is voted into law in November 2024. If new or more stringent federal, state, or local legal restrictions relating to the hydraulic fracturing process are adopted in areas where we operate, we could incur potentially significant added costs to comply with such requirements, experience delays or curtailment in the pursuit of exploration, development, or production activities, and perhaps even be precluded from drilling wells.
If new or more stringent federal, state or local legal restrictions relating to the hydraulic fracturing process are adopted in areas where we operate, our fracturing activities could become subject to additional permitting and financial assurance requirements, more stringent construction specifications, increased monitoring, reporting and recordkeeping obligations, plugging and abandonment requirements and attendant permitting delays and potential increases in costs. Such changes could cause us to incur substantial compliance costs, and compliance or the consequences of any failure to comply by us could have a material adverse effect on our financial condition and results of operations. At this time, it is not possible to estimate the impact on our business of newly enacted or potential legislation or regulation governing hydraulic fracturing, and any of the above risks could impair our ability to manage our business and have a material adverse effect on our operations, cash flows and financial position.
Oil Pollution Act
The OPA establishes strict liability for owners and operators of facilities that are the source of a release of oil into waters of the U.S. The OPA and its associated regulations impose a variety of requirements on responsible parties, including owners and operators of certain facilities from which oil is released, related to the prevention of oil spills and liability for damages resulting from such spills. While liability limits apply in some circumstances, a party cannot take advantage of liability limits if the spill was caused by gross negligence or willful misconduct, resulted from violation of a federal safety, construction or operating
regulation, or if the party fails to report a spill or to cooperate fully in the cleanup. Few defenses exist to the liability imposed by the OPA. The OPA imposes ongoing requirements on a responsible party, including the preparation of oil spill response plans and proof of financial responsibility to cover environmental cleanup and restoration costs that could be incurred in connection with an oil spill.
National Environmental Policy Act
Oil and natural gas exploration and production activities on federal lands are subject to the NEPA. NEPA requires federal agencies to evaluate major agency actions having the potential to significantly impact the environment. The process involves the preparation of an environmental assessment and, if necessary, an environmental impact statement depending on whether the specific circumstances surrounding the proposed federal action have the potential to significantly impact the environment. The NEPA process involves public input through comments which can alter the nature of a proposed project either by limiting the scope of the project or requiring resource-specific mitigation. NEPA decisions can be appealed through the court system by process participants. This process may result in delaying the permitting and development of projects, may increase the costs of permitting and developing some facilities and could result in certain instances in the cancellation of existing leases. In July 2020, the White House Council on Environmental Quality ("CEQ") finalized changes to NEPA regulations that, among other things, narrows the definition of “effects” to exclude the terms “direct,” “indirect,” and “cumulative” and redefines the term to be “reasonably foreseeable” and having “a reasonably close causal relationship to the proposed action or alternatives.” However, these regulations are subject to ongoing legal challenges. The CEQ, now under the Biden Administration, issued a final rule in April 2022 retreating from several of these changes, one of which focused on ensuring that agency analysis captures the direct, indirect and cumulative effects of major federal actions.The Biden Administration considered these initial changes to be only “Phase 1” of its two-phased approach to modifying the NEPA regulations, although no details are yet public as to “Phase 2.” Additionally, in January 2023, the CEQ released guidance, effective immediately, to assist federal agencies in assessing the GHG emissions and climate change effects of their proposed actions under the NEPA.
Endangered Species Act and Migratory Bird Treaty Act
The ESA restricts activities that may affect endangered or threatened species or their habitat. Similar protections are offered to migratory birds under the MBTA. We may conduct operations on natural gas leases in areas where certain species that are or could be listed as threatened or endangered are known to exist. For example, a 12-month review is currently pending to determine whether the dunes sagebrush lizard should be listed, a decision on which is expected in June 2023,remains pending, and, in November 2022, the FWS listed two distinct population segments of the lesser prairie-chicken under the ESA. In August 2020, the FWS and the National Marine Fisheries Service issued three rules amending the implementation of the ESA regulations, among other things revising the process for listing species and designating critical habitat. However, in July 2022, FWS and NMFS rescinded two rules related to the definition of “critical habitat,” and the Biden Administration has stated that it is reviewing several other Trump-era ESA rules. In June 2023, a notice of proposed rulemaking was issued proposing to revise the 2019 final rule relating to listing and reclassification of species and designation of critical habitat, reinstating prior language within the rule.
The DOI also issued an opinion in December 2017 that would narrow certain protections afforded to migratory birds pursuant to the MBTA. In August 2020, the U.S. District Court for the Southern District of New York vacated this opinion as contrary to law. While the FWS subsequently finalized a rule incorporating the DOI opinion, the rule was revoked on October 4, 2021, and FWS returned to pre-2017 implementation of the MBTA, including the ability to enforce the MBTA against accidental harm or death to birds (known as “incidental take”). FWS has published an advanced notice of proposed rulemaking to codify a general prohibition on incidental take while also establishing a process to regulate or permit exceptions to such a prohibition. A notice of proposed rulemaking is scheduled for release toward the end of the first quarter of 2023. . The identification or designation of previously unprotected species, such as the dunes sagebrush lizard, lesser prairie chicken, and greater sage grouse, as threatened or endangered, or the redesignation of a species from threatened to endangered, in areas where underlying property operations are conducted could cause us to incur increased costs arising from species protection measures or could result in limitations on our development activities that could have an adverse impact on our ability to develop and produce reserves. If we were to have a portion of our leases designated as critical or suitable habitat, it could adversely impact the value of our leases.
Related permits, authorizations and considerations
Many environmental laws require us to obtain permits or other authorizations from state and/or federal agencies before initiating certain drilling, construction, production, operation or other oil and natural gas activities, and to maintain these permits and compliance with their requirements for on-going operations. These permits are generally subject to protest, appeal or litigation, which can in certain cases delay or halt projects and cease production or operation of wells, pipelines and other
operations. In particular, certain areas within California have been subject to significant permitting uncertainty in the past several years, resulting in the delay of receipt of drilling permits.
Worker health and safety
We are subject to a number of federal and state laws and regulations, including the federal OSHA, and comparable state statutes, whose purpose is to protect the health and safety of workers. For example, the OSHA hazard communication standard, the Emergency Planning and Community Right-to-Know Act and comparable state statutes and any implementing regulations require that we maintain, organize and/or disclose information about hazardous materials used or produced in our operations and that this information be provided to employees, state and local governmental authorities and citizens. Other OSHA standards regulate specific worker safety aspects of our operations. Failure to comply with OSHA requirements can lead to the imposition of penalties.
Related insurance
We maintain insurance against some contamination risks associated with our development activities. However, this insurance is limited to activities at the well site and there can be no assurance that this insurance will continue to be commercially available or that this insurance will be available at premium levels that justify its purchase by us. The occurrence of a significant event that is not fully insured or indemnified against could have a material and adverse effect on our financial condition and operations. Further, we have no coverage for gradual, long-term pollution events.
Item 1A. Risk Factors
Described below are certain risks that we believe are applicable to our business and the oil and gas industry in which we operate. Investors should read carefully the following factors as well as the cautionary statements referred to in "Cautionary Statement Regarding Forward-Looking Statements" herein. If any of the risks and uncertainties described below or elsewhere in this Annual Report actually occur, the Company's business, financial condition or results of operations could be materially adversely affected.
Risks related to the oil and natural gas industry and our operations
Oil, natural gas and NGL prices are volatile. A sustained decline in prices could adversely affect our business, financial condition and results of operations, liquidity and our ability to meet our financial commitments or cause us to delay our planned capital expenditures.
Our revenues, operating results, profitability, liquidity and ability to grow depend primarily upon the prices we receive for the oil, natural gas and NGL we sell. We require substantial expenditures to replace our oil, natural gas and NGL reserves, sustain production and fund our business plans, including our development plan. Low oil, natural gas and NGL prices resulting from reduced demand caused by the conflictconflicts in Ukraine, Israel and the Gaza Strip, accelerated substitution of renewable forms of energy for oil and gas, the continued impact of the COVID-19 pandemic, actions of OPEC and other factors materially affected our revenues, particularly before the effects of commodity derivatives, operating results and cash flows in 2023 and 2022. While oil, natural gas and NGL prices have returned to pre-pandemic levels, the continued impact of the COVID-19 pandemic and the associated global oil, natural gas and NGL demand may negatively affect the amount of cash available for capital expenditures and debt repayment, our ability to borrow money or raise additional capital and, as a result, could have a material adverse effect on our business, prospects, financial condition, results of operations and cash flows. In addition, low prices may reduce the quantities of oil, natural gas and NGL reserves that may be economically produced and result in an impairment of our oil and natural gas properties.
Historically, the markets for oil, natural gas and NGL have been volatile, and they are likely to continue to be volatile. For
example, the conflictrespective conflicts between Russia and Ukraine hasand Israel and Hamas have contributed to significant increases and volatility in the price for oil and natural gas. Wide fluctuations in oil, natural gas and NGL prices may result from relatively minor changes in the supply of or demand for oil, natural gas and NGL market uncertainty and other factors that are beyond our control, including:
•worldwide and regional economic conditions, including risinga global recession, elevated interest rates and associated policies of the Federal Reserve, impacting the supply and demand for oil, natural gas and NGLs, including uncertainty regarding the timing, pace and extent of an economic recovery in the United States;
•changes in seasonal temperatures, including the number of heating degree days during winter months and cooling degree days during summer months;
•the level of oil, natural gas and NGL exploration, development and production;
•the level of oil, natural gas and NGL inventories;
•the level of U.S. LNG exports;
•prevailing prices, and expectations regarding future prices, on local price indexes in the areas in which we operate;
•the proximity, capacity, cost and availability of gathering and transportation facilities;
•localized and global supply and demand fundamentals and transportation availability;
•the cost of exploring for, developing, producing and transporting reserves;
•the spot price of LNG on world markets;
•weather conditions and natural disasters;
•technological advances affecting energy consumption;
•the price and availability of alternative fuels, including the potential acceleration of the development of alternative fuels as a result of the IRA 2022 or otherwise;
•speculative trading in oil and natural gas derivative contracts;
•increased end-user conservation;
•political and economic conditions, such as the conflictconflicts in Ukraine and the Middle East, in or affecting other producing regions or countries, including the Middle East, Africa, South America and Russia;
•political and economic conditions in or affecting major LNG consumption regions or countries, particularly Asia and Europe;
•political and economic conditions relating to the extraordinary market environment2024 U.S. presidential election, including potential controversy and effects, including any economic repercussions or operational challenges, of the COVID-19 pandemic, including any resultant declinea potential change in demand for oil, natural gas and NGLs;presidential administration;
•actions of OPEC, including the ability and willingness of the members of OPEC and other exporting nations to agree to and maintain oil price and production controls, including the anticipated increases in supply from Russia and OPEC, particularly Saudi Arabia;
•U.S. trade policies and their effect on U.S. oil and natural gas exports;
•expectations about future commodity prices;
•the possibility of terrorist or cyberattacks and the consequences of any such attacks; and
•U.S. federal, state and local and non-U.S. governmental regulation and taxes.
We have been negatively affected and may in the future be negatively affected by a drop in commodity prices.
Lower commodity prices may reduce our operating margins, cash flow and borrowing ability. If we are unable to obtain needed capital or financing on satisfactory terms, our ability to develop future reserves or make acquisitions could be adversely
affected. Also, using lower prices in estimating proved reserves may result in a reduction in proved reserve volumes due to economic limits. While the ongoing effects of the COVID-19 pandemic on our operations have decreased lately, any continuing or worsening impact of the COVID-19 pandemicAny drop in commodity prices may adversely affect our drilling economics, cash flow and our ability to raise capital, which may require us to re-evaluate and postpone or substantially restrict our development program, and result in the reduction of some of our PUD reserves and related PV-0 and PV-10. As a result, a substantial or extended decline in commodity prices, such as what occurred in early 2020, may materially and adversely affect our future business, financial
condition, results of operations, liquidity and ability to meet our financial commitments or cause us to delay our planned capital expenditures.
We have consolidated our business over time through acquisitions, including through the Merger Transactions, and the Uinta Transaction, and the Western Eagle Ford Acquisitions and there are risks associated with integration of all of these assets, operations and our ability to manage those risks. In addition, we may be unable to make attractive acquisitions or successfully integrate acquired businesses, assets or properties, and any inability to do so may disrupt our business and hinder our ability to grow.
We intend to pursue a strategy focused on both reinvestment and future acquisitions, which is designed to obtain the optimal risk adjusted returns through commodity cycles. Accordingly, in the future we may make acquisitions of businesses, assets or properties that we expect to complement or expand our current assets. For example, Crescent Energy Company was created through the Merger Transactions in December 2021, and in March 2022, we acquired certain exploration and production assets in the state of Utah pursuant to the Uinta Transaction (as defined herein).Transaction. In 2023, we also acquired certain exploration and production assets in the state of Texas pursuant to the Western Eagle Ford Acquisitions. However, we may not be able to identify attractive acquisition opportunities in the future. Even if we do identify attractive acquisition opportunities, we may not be able to complete the acquisition or do so on commercially acceptable terms. No assurance can be given that we will be able to identify additional suitable acquisition opportunities, negotiate acceptable terms, obtain financing for acquisitions on acceptable terms or successfully acquire identified targets.
The success of any completed acquisition, including the Uinta Transaction,Western Eagle Ford Acquisitions, will depend on our ability to integrate effectively the acquired business, asset or property into our existing operations. The process of integrating acquired businesses, assets and properties may involve unforeseen difficulties and may require a disproportionate amount of our managerial and financial resources. For example, as with other operators in the area, certain potential midstream constraints may create operational challenges for us in the Uinta Basin. The integration of acquisitions is a complex, costly and time-consuming process, and our management may face significant challenges in such process. Some of the factors affecting integration will be outside of our control, and any one of them could result in increased costs and diversion of management’s time and energy, as well as decreases in the amount of expected revenue.
Our failure to achieve consolidation savings, to incorporate the acquired businesses, assets and properties into our existing operations successfully or to minimize any unforeseen operational difficulties could have a material and adverse effect on our financial condition and results of operations.
Reserve estimates depend on many assumptions that may turn out to be inaccurate. Any material inaccuracies in reserve estimates or underlying assumptions will materially affect the quantities and present value of our reserves.
Numerous uncertainties are inherent in estimating quantities of oil and natural gas reserves. Our estimates of our SEC reserves are based upon average commodity prices over the prior 12 months, which may not reflect actual prices received for our production. For example, our reserve volumes and PV-10 as disclosed in this Annual Report are based on assumed commodity prices of $93.67$78.22 per Bbl of oil and $6.36$2.64 per MMBtu of natural gas as of December 31, 2022,2023, which, in the case of oil, are substantially higher than the five yearfive-year NYMEX forward curve range of $62.76$61.53 to $80.50$72.13 per Bbl of oil and, $3.80 to $5.30 per Mcfin the case of natural gas.gas, within the five-year NYMEX forward curve range of $2.30 to $4.71 per Mcf. Accordingly, you are cautioned not to place undue weight on our reserve volumes or PV-10 based on such pricing when evaluating our financial condition or an investment in our securities. The process of estimating oil and natural gas reserves is complex and requires significant decisions and assumptions in the evaluation of available geological, engineering and economic data for each reservoir. The reports rely upon various assumptions, including assumptions regarding future oil and natural gas prices, our drilling program, production levels, and operating and development costs. In addition, the reserves that we present herein are aggregated from several reports, which were prepared by several engineering firms and therefore may be based on slightly different assumptions and preparation and review procedures. Our ability to develop any identified drilling location is subject to various limitations and any drilling activities we are able to conduct may not be successful. As a result, our actual drilling activities may materially differ from those presently identified and could result in downward revisions of estimated proved reserves. In addition, loss of production and leasehold rights due to mechanical failure or depletion of wells and our inability to re-establish their production may occur in certain cases. Production from wellbores may be affected by nearby fracturing activities by offset operators or us, resulting in reserve revisions.
As a result, estimated quantities of proved reserves and projections of future production rates and the timing of development expenditures may prove to be inaccurate. Over time, we may make material changes to reserve estimates taking into account the results of actual drilling and production. Any significant variance in our assumptions and actual results could greatly affect our estimates of reserves, the economically recoverable quantities of oil and natural gas attributable to any particular group of properties, the classifications of reserves based on risk of recovery, and estimates of the future net cash flows. Specifically, future prices received for production and costs may vary, perhaps significantly, from the prices and costs assumed for purposes of these estimates. Sustained lower prices will cause the 12-month weighted average price to decrease over time as the lower
prices are reflected in the average price, which may result in the estimated quantities and present values of our reserves being reduced.
Any material inaccuracies in our reserves estimates could also materially affect our borrowing base and liquidity under the Revolving Credit Facility. If the borrowing base under the Revolving Credit Facility decreases as a result of any reductions in our reserve estimates, we may have limited ability to obtain the capital necessary to sustain our operations at current and anticipated future levels. If additional capital is needed, we may not be able to obtain debt or equity financing on terms acceptable to us, if at all.
The present value of future net revenues from our proved reserves, as reflected in our Standardized Measure, PV-0 value and PV-10 value, will not necessarily be the same as the current market value of our estimated proved oil and natural gas reserves.
You should not assume that the present value of future net revenues from our proved reserves, as reflected in our Standardized Measure, PV-0 value and PV-10 value, is the current market value of our estimated oil and natural gas reserves. We currently base the estimated discounted future net revenues from our proved reserves on the 12-month unweighted arithmetic average of the first-day-of-the-month price for the preceding 12 months. For example, our reserve volumes, PV-0 and PV-10 as disclosed in this Annual Report are based on assumed commodity prices of $93.67$78.22 per Bbl of oil and $6.36$2.64 per MMBtu of natural gas as of December 31, 2022,2023, which, are substantiallyin the case of oil, is higher than five yearthe five-year NYMEX forward curve range of $62.76$61.53 to $80.50$72.13 per Bbl of oil and, $3.80 to $5.30 per Mcfin the case of natural gas.gas, within the five-year NYMEX forward curve range of $2.30 to $4.71 per Mcf. Accordingly, you are cautioned not to place undue weight on our reserve volumes, PV-0 or PV-10 based on such pricing when evaluating our financial condition or an investment in our securities. Actual future net revenues from our oil and natural gas properties will be affected by factors such as:
•actual prices we receive for crude oil, natural gas and NGLs;
•actual cost of development and production expenditures;
•the amount and timing of actual production;
•transportation and processing; and
•changes in governmental regulations or taxation.
The timing of both our production and our incurrence of expenses in connection with the development and production of, and investment in, our oil and natural gas properties will affect the timing and amount of actual future net revenues from proved reserves, and thus their actual present value. In addition, the 10% discount factor we use when calculating discounted future net revenues at PV-10 may not be the most appropriate discount factor based on interest rates in effect from time to time and risks associated with us or the oil and natural gas industry in general. Actual future prices and costs may differ materially from those used in the present value estimates.
Unless we replace our reserves with new reserves and develop those reserves, our reserves and production will decline, which may adversely affect our future cash flows and results of operations.
In general, the volume of production from oil and natural gas properties declines as reserves are depleted, with the rate of decline depending on each reservoir’s characteristics. Except to the extent that we conduct successful exploration, exploitation, development or reinvestment activities or acquire properties containing proved reserves, our proved reserves will decline as reserves are produced. Our future oil and natural gas production is, therefore, highly dependent on our level of success in finding or acquiring additional reserves as well as the pace of D&C of new wells. Additionally, the business of exploring for, exploiting, developing or acquiring reserves is capital intensive. Recovery of our reserves, particularly undeveloped reserves, will require significant additional capital expenditures and successful drilling operations. To the extent cash flow from
operations is reduced and external sources of capital become limited, unavailable or on terms deemed unacceptable by us, our ability to make the necessary capital investment to maintain or expand our asset base of oil and natural gas reserves or to return capital to our investors would be impaired.
As part of our exploration and development operations, we have expanded, and expect to further expand, the application of horizontal drilling and multi-stage hydraulic fracture stimulation techniques as well as enhanced recovery operations. The utilization of these techniques requires substantially greater capital expenditures as compared to the completion cost of a vertical well or a horizontal well utilizing less advanced techniques and therefore may result in fewer wells being completed or
recompleted in any given year. The incremental capital expenditures are generally the result of greater measured depths, additional hydraulic fracture stages in horizontal wellbores and increased volumes of water, CO2 and proppant.
The unavailability or high cost of equipment, supplies, personnel and oilfield services, due to commodity price volatility or supply constraints as a result of the conflictconflicts in Ukraine and the COVID-19 pandemic, risingMiddle East, elevated, interest rates and associated policies of the Federal Reserve or otherwise could adversely affect our ability to execute development and exploitation plans on a timely basis and within budget, and consequently could materially and adversely affect our anticipated cash flow.
We utilize third-party services to maximize the efficiency of our operation. The cost of oilfield services typically fluctuates based on demand for those services, and the increase in commodity prices and supply constraints due to the conflictconflicts in Ukraine and the COVID-19 pandemic, risingMiddle East, elevated interest rates and associated policies of the Federal Reserve or otherwise has increased the cost of oilfield services. While we currently have excellent relationships with oilfield service companies, there is no assurance that we will be able to contract for such services on a timely basis or that the cost of such services will remain at a satisfactory or affordable level. Shortages or the high cost of equipment, supplies or personnel could delay or adversely affect our development and exploitation operations, which could have a material and adverse effect on our business, financial condition or results of operations.
Continuing or worsening inflationary issues and associated changes in monetary policy have resulted in and may result in additional increases to the cost of our goods, services and personnel, which in turn cause our capital expenditures and operating costs to rise.
The U.S. inflation rate has been steadilybegan increasing sincein 2021 and intoremained elevated throughout 2023. These inflationary pressures have resulted in and may result in additional increases to the costs of our oilfield goods, services and personnel, which in turn cause our capital expenditures and operating costs to rise. Sustained levels of high inflation have likewise caused the U.S. Federal Reserve and other central banks to increase interest rates multiple times, in 2022 and although the U.S. Federal Reserve has indicated its intention to continue to raiseit may reduce benchmark interest rates throughout the remainder of 2023 in an effort2024, to curb inflationary pressure on the costs of goods and services across the U.S., which could have the effects of raising the cost of capital and depressing economic growth, either of which—or the combination thereof—could hurt the financial and operating results of our business. To the extent such rates remain elevated, inflation remains, we may experience further cost increases for our operations, including oilfield services, labor costs and equipment if our drilling activity increases.
Higher oil and natural gas prices may cause the costs of materials and services to continue to rise. We cannot predict any future trends in the rate of inflation and a significant increase in inflation, to the extent we are unable to recover higher costs through higher oil and natural gas prices and revenues, would negatively impact our business, financial condition and results of operations.
Our development projects require substantial capital expenditures. We may be unable to obtain required capital or financing on satisfactory terms or at all, which could lead to a decline in our reserves and cash flows.
The oil and natural gas industry is capital intensive. We have made and expect to continue to make substantial capital expenditures in our business for the development of, and reinvestment in, oil and natural gas reserves. We have historically funded development and operating activities primarily through the sale of our oil, natural gas and NGL production. If necessary, we may also access capital through proceeds from asset dispositions, borrowings under the Revolving Credit Facility and capital markets offerings from time to time. Our cash flow from operations and access to capital are subject to a number of variables, including:
•the amount of oil and natural gas we produce from existing wells;
•the prices at which we sell our production;
•take-away capacity;
•the estimated quantities of our oil and natural gas reserves; and
•our ability to acquire, locate and produce new reserves.
If our revenues or the borrowing base under the Revolving Credit Facility decrease as a result of lower commodity prices, operating difficulties, production cost increases, declines in reserves or for any other reason, we may have limited ability to obtain the capital necessary to conduct our operations at expected levels. The Revolving Credit Facility and the documents
governing our other indebtedness may restrict our ability to obtain new debt financing. If additional capital is required, we may not be able to obtain debt and/or equity financing on terms favorable to us, or at all due to risingelevated interest rates and associated policies of the Federal Reserve or otherwise, which could result in a curtailment of our operations relating to development of our prospects, which in turn could lead to a decline in our reserves, production and cash flows, and could adversely affect our business, results of operation, financial conditions and ability to make payments on our outstanding indebtedness.
The development of our estimated PUD reserves may take longer and may require higher levels of capital expenditures than we currently anticipate. Therefore, our estimated PUD reserves may not be ultimately developed or produced.
Recovery of PUDs requires significant capital expenditures and successful drilling operations. At December 31, 20222023, approximately 112.7112.2 MMBoe of our total estimated proved reserves were undeveloped. The reserve data included in our reserve reports assumes that substantial capital expenditures will be made to develop non-producing reserves. The calculation of our estimated net proved reserves as of December 31, 20222023 assumes that we will spend $1.7$1.8 billion to develop our estimated PUDs. Although cost and reserve estimates attributable to our oil and natural gas reserves have been prepared in accordance with industry standards, we cannot be sure that the estimated costs are accurate. We may need to raise additional capital in order to develop our estimated PUDs, and we cannot be certain that additional financing will be available to us on acceptable terms, if at all. Additionally, extended declines in commodity prices will reduce the future net revenues of our estimated PUDs and may result in some projects becoming uneconomical. Further, our drilling efforts may be delayed or unsuccessful and actual reserves may prove to be less than current reserve estimates, which could have a material and adverse effect on our financial condition, results of operations and future cash flows.
Our development opportunities are scheduled to be developed over many years, making them susceptible to uncertainties that could materially alter the occurrence or timing of such development. In addition, we may not be able to raise the substantial amount of capital that would be necessary to drill such locations.
As of December 31, 2022,2023, we have undrilled locations, including both PUD drilling locations and unproved drilling locations. These drilling locations represent a meaningful part of our future development strategy. Our ability to drill and develop these drilling locations depends on a number of uncertainties, including oil and natural gas prices, the availability and cost of capital, drilling and production costs, availability of drilling services and equipment, drilling results, lease expirations, gathering system, marketing and transportation constraints, regulatory approvals, labor, takeaway capacity and other factors. Because of these uncertain factors, we do not know if the drilling locations will ever be developed or if we will be able to produce oil or natural gas from these drilling locations at anticipated levels or at all. In addition, unless production is established within the spacing units covering the undeveloped acreage on which some of the locations are located, the leases for such acreage will expire. Therefore, our actual development activities may materially differ from those presently contemplated.
Drilling for and producing oil and natural gas are high-risk activities with many uncertainties that could adversely affect our business, financial condition or results of operations.
Drilling oil and natural gas wells, including development wells, involves numerous risks, including the risk that we may not encounter commercially productive oil and natural gas reserves (including “dry holes”). We must incur significant expenditures to drill and complete wells, the costs of which are often uncertain. It is possible that we will make substantial expenditures on drilling and not discover reserves in commercially viable quantities.
Specifically, we often are uncertain as to the future cost or timing of drilling, completing and operating wells, and our drilling operations and those of our third-party operators may be curtailed, delayed or canceled. The cost of our drilling, completion and well operations may increase and/or our results of operations and cash flows from such operations may be impacted, as a result of a variety of factors, including:
•unexpected drilling conditions;
•title problems;
•pressure or irregularities in formations;
•equipment failures or accidents;
•adverse weather conditions, such as winter storms, fires, flooding and hurricanes, and changes in weather patterns;
•compliance with, or changes in, environmental laws and regulations, including the IRA 2022, relating to air emissions, hydraulic fracturing and disposal of produced water, drilling fluids and other wastes, laws and regulations imposing conditions and restrictions on D&C operations and other laws and regulations, such as tax laws and regulations;
•the availability and timely issuance of required governmental permits and licenses; and
•the availability of, costs associated with and terms of contractual arrangements for properties, including mineral licenses and leases, pipelines, rail cars, crude oil hauling trucks and qualified drivers and related facilities and equipment to gather, process, compress, transport and market oil, natural gas, NGLs and related commodities.
Our failure to recover our investment in wells, increases in the costs of our drilling operations or those of our third-party operators, and/or curtailments, delays or cancellations of our drilling operations or those of our third-party operators in each case due to any of the above factors or other factors, may materially and adversely affect our business, financial condition and results of operations.
We may experience difficulty in achieving and managing future growth.
Future growth may place strains on our resources and cause us to rely more on project partners and independent contractors, possibly negatively affecting our financial condition and results of operations. Our ability to grow will depend on a number of factors, including:
•the results of our drilling program;
•hydrocarbon prices;
•our ability to develop existing prospects;
•our ability to continue to retain and attract skilled personnel;
•our ability to maintain or enter into new relationships with project partners and independent contracts; and
•our access to capital.
We may also be unable to make attractive acquisitions or asset exchanges, which could inhibit our ability to grow, or could experience difficulty integrating any acquired assets and operations. It may be difficult to identify attractive acquisition opportunities and, even if such opportunities are identified, our debt agreements (including the indentures that govern the 2026 Notes (as defined herein) and the 2028 Notes (as defined herein)herein; together with the 2026 Notes, the "Senior Notes")) contain limitations on our ability to enter into certain transactions, which could limit our future growth.
Our operations are dependent on third-party service providers.
We contract with third-party service providers to support our operations. These contracted services are generally provided pursuant to master services agreements entered into between the third-party service providers and our operating subsidiaries. Although we have our own employees, our ability to conduct operations and generate revenues is dependent on the availability and performance of those third-party service providers and their compliance with the terms of their respective master service agreements (as further described under "Part III., Item 13. Certain Relationships and Related Party Transactions and Director Independence—KKR Funds"). We cannot guarantee that we will be successful in either retaining the services of our current third-party service providers or contracting with alternative service providers in the event that our current contractors discontinue providing services to us or fail to meet their obligations under their respective master services agreements. Any failure to retain the services of our current service providers or locate alternatives will negatively affect our ability to generate revenues and continue and expand our operations. Please see "Part I., Items 1 and 2. Business and Properties—Employees" for more information.
Through the Management Agreement, we depend on the Manager and its personnel to manage and operate our business, the loss of any of whom would materially and adversely affect future operations. Additionally, operational risks affecting the
Manager, and our ability to work collaboratively with the Manager, including with respect to the allocation of corporate
opportunities and other conflicts of interest, may impact our business and have a material effect on our business, financial results and prospects.
Pursuant to our Management Agreement with the Manager, the Manager provides us with its executive management team and provides certain other management services. However, in each case such resources are not fully dedicated to our assets and operations, and the allocation of such resources is generally within the Manager’s discretion. See "Part III., Item 13. Certain Relationships and Related Party Transactions and Director Independence—Agreements Related to the Merger Transactions—Management Agreements.Agreement.” Accordingly, our success depends on the efforts, experience, diligence, skill and network of business contacts of the Manager’s personnel. We can offer no assurance that the Manager will continue to provide services to us or that we will continue to have access to the Manager’s personnel. The Management Agreement has an initial three-year term, expiring December 7, 2024, with automatic three-year renewals thereafter. Upon the written notice to the Manager at least 180 days prior to the expiration of the initial term or any automatic renewal term, we may, without cause, decline to renew the Management Agreement upon the affirmative determination of at least two-thirds of its independent directors reasonably and in good faith, that (1) there has been unsatisfactory long-term performance by the Manager that is materially detrimental to us and our subsidiaries taken as a whole or (2) the fees payable to the Manager, in the aggregate, are materially unfair and excessive compared to those that would be charged by a comparable asset manager managing assets comparable to our assets, subject to Manager’s right to renegotiate the fees. If the Management Agreement is terminated and no suitable replacement is found to provide management and operating services for our oil and natural gas assets, we may not be able to execute our business plan, and our financial condition and results of operation may be materially and adversely affected.
Further, our relationship with the Manager presents certain challenges relating to our ability to work collaboratively with the Manager’s broader business. For example, the Manager will source investment opportunities both for our benefit and for the benefit of other KKR investment vehicles. Pursuant to the Management Agreement, given all available investment capital within EIGF II has been fully deployed,the manager shall ensure that at least 70% of any investment opportunities inamounts related to upstream oil and gas assets will beopportunities are allocated to us. Follow-on investment amounts will be generally allocated between us and EIGF II in proportion to the relative amount such vehicle initially invested in the applicable investment. In addition, from time to time, investment opportunities outside of upstream oil and gas assets may arise that are suitable for investment by us, on the one hand, and by EIGF II (and any successor fund) or other KKR Group funds, on the other, that are (A) engaged in an investment strategy that is materially different from our investment strategy (such as distressed debt or special situations investment vehicles) and (B) have pre-existing defined allocation rights pursuant to the KKR Group’s allocation policies or contractual undertakings agreed with the investors in such other KKR Group funds. In such cases, we may elect to co-invest alongside EIGF II and/or such other KKR Group funds in such investments, in which case the Manager will allocate such investment opportunities among us, on the one hand, and EIGF II and/or such other KKR Group funds, on the other hand, in a manner consistent with the priority investment rights of such KKR Group funds, taking into account such factors as the Manager deems appropriate. We shall have no obligation to make any such co-investment.
In addition, other conflicts of interest may arise from time to time in connection with the investment and other activities of us and other members of the KKR Group. With respect to conflicts involving investment opportunities, the Manager will endeavor to resolve any such conflicts of interest in a fair and equitable manner in accordance with the investment allocation policy described above and its prevailing policies and procedures with respect to conflicts resolution among other members of the KKR Group. However, the Manager may have a fiduciary duty to make decisions in the best interests of the Manager's affiliates, including KKR Funds, which may be contrary to our interests. In addition, other conflicts of interest may arise between us, on the one hand, and the Manager or any other member of the KKR Group and their affiliates, including KKR Funds, on the other hand, which may not be resolved in our favor. Further, the Management Agreement provides that nothing shall prevent the Manager from taking certain actions for the sole benefit of the Manager and/or its affiliates. To the fullest extent permitted by law, the Manager and its affiliates, including but not limited to their respective directors, officers, employees, agents, managers, trustees, control persons, partners, stockholders, and equityholders, will not be liable to us or any subsidiary or any of their respective directors, officers, employees, agents, managers, trustees, control persons, partners, stockholders, and equityholders, for any acts or omissions by the Manager or its affiliates, including by their respective directors, officers, employees, agents, managers, trustees, control persons, partners, stockholders, and equityholders, performed in accordance with and pursuant to the Management Agreement, except in cases of bad faith, fraud, willful misconduct or gross negligence. The Management Agreement requires us to reimburse, indemnify and hold harmless the Manager, its affiliates, and their respective directors, officers, employees, managers, trustees, control persons, partners, stockholders, and equityholders, and directors, officers, employees, agents, managers, trustees, control persons, partners, stockholders and equityholders of the foregoing from any and all Losses (as defined in the Management Agreement) arising from any proceeding related to us or acts or omissions of the Manager or its affiliates in connection with the Management Agreement, subject to certain exceptions. However, with the exception of the Manager, no other member of the KKR Group assumes any responsibility to render services to us or to consider our interests and our stakeholders in making any investment or other decisions.
Our certificate of incorporation contains a provision that, to the maximum extent permitted under the law of the State of Delaware, we renounce any interest or expectancy in, or in being offered an opportunity to participate in, business opportunities that are from time to time presented to our officers, directors, the Preferred Stockholder or any partner, manager, member, director, officer, stockholder, employee or agent or affiliate of any such holder. We believe that this provision, which is intended to provide that certain business opportunities are not subject to the “corporate opportunity” doctrine, is appropriate, as the Preferred Stockholder and its affiliates invest in a wide array of companies, including companies with businesses similar to us. As a result of this provision, we may be not be offered certain corporate opportunities which could be beneficial to us and our stockholders.
Properties we have recently acquired or may acquire in the future may not produce as projected, and we may be unable to determine reserve potential, identify liabilities associated with such properties or obtain protection from sellers against such liabilities.
Acquiring oil and natural gas properties requires us to assess reservoir and infrastructure characteristics, including recoverable reserves, future oil and gas prices and their applicable differentials, development and operating costs, and potential liabilities, including environmental liabilities. In connection with these assessments, we perform a review of the subject properties that we believe to be generally consistent with industry practices. Such assessments are inexact and inherently uncertain. In connection with the assessments, we perform a review of the subject properties, but such a review may not reveal all existing or potential problems. In the course of due diligence, we may not review every well, pipeline or associated facility. We cannot necessarily observe structural and environmental problems, such as pipe corrosion or groundwater contamination, when a review is performed. We may be unable to obtain contractual indemnities from the seller for liabilities created prior to our purchase of the property. We may be required to assume the risk of the physical condition of the properties in addition to the risk that the properties may not perform in accordance with its expectations. For these reasons, the properties we will acquire in connection with any future acquisitions may not produce as expected, which could have a material and adverse effect on our financial condition and results of operations.
Events beyond our control, including the COVID-19 pandemic or any other future global or domestic health crisis, may result in unexpected adverse operating and financial results.
The continuing or worsening impact of the COVID-19 pandemic or future outbreaks of disease may materially and adversely affect our business, operating and financial results and liquidity, due to governmental restrictions, associated repercussions and operational challenges to supply and demand for oil and natural gas and the economy generally. The continued impact of the COVID-19 pandemic is uncertain and hard to predict.
While the ongoing effects of the COVID-19 pandemic and recovery on our operations have decreased, recently. this pandemic has had a material negative impact on our financial results. Although there has been economic recovery and higher oil prices in 2022 and gradual declines in commodity prices through the year ended December 31, 2022,2023, such negative impact may continue well beyond the containment of the pandemic. While we
have seen oilfield activity improve considerably and global inventories rapidly normalize with continued demand growth
since the low point experienced in 2020, considerable uncertainty remains. Anan extended period of global supply chain and
economic disruption, as well as significantly decreased demand for oil and gas, due to the COVID-19 pandemic, any future outbreak of diseases or otherwise, could materially affect our business, results of operations, access to sources of liquidity and financial condition.
Future commodity price declines may result in write-downs of our asset carrying values.
We follow the successful efforts method of accounting for our oil and gas operations. Under this method, all property acquisition cost and cost of exploratory and development wells are capitalized when incurred, pending determination of whether proved reserves have been discovered. If proved reserves are not discovered with an exploratory well, the costcosts of drilling the well are expensed. The capitalized costs of our oil and natural gas properties, on a depletion pool basis, cannot exceed the estimated undiscounted future net cash flows of that depletion pool. If net capitalized costs exceed undiscounted future net revenues, we generally must write down the costs of each depletion pool to the estimated fair value (discounted future net cash flows of that depletion pool). Any such charge will not affect our cash flow from operating activities or liquidity, but will reduce our earnings and investors’ equity.
We may also at times record reporting unit goodwill in connection with a business combination. Goodwill has an indefinite useful life but is tested by us for impairment annually, or more frequently if there are changes in future commodity prices, amongst other factors, that may indicate that the fair value of the reporting unit may have been reduced below its carrying value. If the carrying value of the reporting unit exceeds the fair value, we generally must write down goodwill to the estimated
fair value of that reporting unit. Any such charge will not affect our cash flow from operating activities or liquidity but will reduce our earnings and investors’ equity.
A decline in future oil or natural gas prices, or other factors, could cause an impairment write-down of capitalized costs including goodwill, and a non-cash charge against future earnings. For example, during the year ended December 31, 2023, we recorded an impairment expense of $153.5 million, including $149.6 million related to Oil and natural gas properties that were determined not to be recoverable and $3.9 million related to Investments in equity affiliates, and during the year ended December 31, 2022, in connection with our annual goodwill impairment test, we recorded impairment charges of $142.9 million, including $77.7 million related to Goodwill and $65.2 million related to Oil and natural gas properties that were determined to not be recoverable, for the year endedrecoverable. Additionally, as of December 31, 2022. Further, because2023, certain of declinesour conventional assets in Wyoming had limited cushion between their carrying value and estimated undiscounted cash flows. As a result, a further decline of future commodity prices we recorded an impairment chargeor a decrease in estimates of $247.2 million to Oiloil and natural gas propertiesreserves for the year ended December 31, 2020.these assets would likely result in an impairment charge. Once incurred, a write-down of our assets cannot be reversed at a later date, even if oil or natural gas prices increase.
Our business is subject to operational risks that will not be fully insured. If any of the operational risks materialize our financial condition or results of operations could be materially and adversely affected.
Our business activities are subject to operational risks, including, but not limited to:
•damages to equipment caused by natural disasters such as earthquakes, and adverse weather conditions, including tornadoes, hurricanes, extreme weather events and flooding;
•facility or equipment malfunctions;
•pipeline ruptures or spills;
•surface fluid spills, produced water contamination and salt water, surface or groundwater contamination resulting from petroleum constituents or hydraulic fracturing chemical additions;
•fires, blowouts, craterings and explosions; and
•uncontrollable flows of oil, natural gas or well fluids.
Any of these events could adversely affect our ability to conduct operations or cause substantial losses, including personal injury or loss of life, damage to or destruction of property, natural resources and equipment, pollution or other environmental contamination, loss of wells, regulatory penalties, suspension or termination of operations, and attorney’s fees and other expenses incurred in the prosecution or defense of litigation.
As is customary in the industry, we maintain insurance against some but not all of these risks. Additionally, we may elect not to obtain insurance if we believe that the cost of available insurance is excessive relative to the perceived risks presented. Losses could therefore occur for uninsurable or uninsured risks or in amounts in excess of existing insurance coverage. The occurrence of an event that is not fully covered by insurance could have a material and adverse effect on our business, financial condition and results of operations.
We may be unable to compete effectively with larger companies, which may adversely affect our ability to generate sufficient revenues.
The oil and natural gas industry is intensely competitive, and we compete with other companies that have greater resources than us, particularly following recent consolidation within the industry. Our ability to acquire additional properties and to discover reserves in the future will be dependent upon our ability to evaluate and select suitable properties to consummate transactions in a highly competitive market. Many of our larger competitors not only drill for and produce oil and natural gas, but they also engage in refining operations and market petroleum and other products on a regional, national or worldwide basis. Our competitors may be able to pay more for oil and natural gas properties, and evaluate, bid for and purchase a greater number of properties than our financial or human resources permit. In addition, these companies may have a greater ability to continue drilling activities during periods of low oil and natural gas prices, to contract for drilling equipment, to secure trained personnel, and to absorb the burden of present and future federal, state, local and other laws and regulations. The oil and natural gas industry has periodically experienced shortages of drilling rigs, equipment, pipelines and personnel, which has delayed development drilling and other exploitation activities and has caused significant price increases. Competition has been strong in hiring experienced personnel, particularly in the engineering and technical, accounting and financial reporting, tax and land departments. In addition, competition is strong for attractive oil and natural gas properties, oil and natural gas companies, and drilling rights. Our inability to compete effectively with our competitors could have a material and adverse impact on our business activities, financial condition and results of operations.
Deficiencies of title to our leased interests could materially and adversely affect our financial condition.
If an examination of the title history of a property reveals that an oil or natural gas lease or other developed rights has been purchased in error from a person who is not the owner of the mineral interest desired, our interest would substantially decline in value. In such cases, the amount paid for such oil or natural gas lease or leases or other developed rights would be lost. It is management’s practice, in acquiring oil and natural gas leases or undivided interests in oil and natural gas leases or other developed rights, not to incur the expense of retaining lawyers to examine the title to the mineral interest to be acquired. Rather, we rely upon the judgment of oil and natural gas lease brokers or landmen who perform the fieldwork in examining records in the appropriate governmental or county clerk’s office before attempting to acquire a lease or other developed rights in a specific mineral interest.
Prior to drilling an oil or natural gas well, however, it is the normal practice in the oil and natural gas industry for the person or company acting as the operator of the well to obtain a preliminary title review of the spacing unit within which the proposed oil or natural gas well is to be drilled to ensure there are no obvious deficiencies in title to the leasehold. Frequently, as a result of such examinations, certain curative work must be done to correct deficiencies in the marketability of the title, such as obtaining affidavits of heirship or causing an estate to be administered. Such curative work entails expense, and it may happen, from time to time, that the operator may elect to proceed with a well despite defects to the title identified in the preliminary title opinion. Our failure to obtain perfect title to our leaseholds may adversely impact our ability in the future to increase production and reserves.
Certain of our properties are subject to land use restrictions, which could limit the manner in which we conduct our business.
Certain of our properties are subject to land use restrictions, including city ordinances, which could limit the manner in which we conduct our business. Such restrictions could affect, among other things, our access to and the permissible uses of our properties as well as the manner in which we produce oil and natural gas and may restrict or prohibit drilling in general. The costs we incur to comply with such restrictions may be significant and our development and production activities may be delayed, curtailed or precluded by such restrictions.
Part of our business strategy will involve using some of the latest available horizontal D&C techniques, which involve risks and uncertainties in their application.
Our operations will involve utilizing some of the latest D&C techniques as developed by us and our service providers. The difficulties we may face drilling horizontal wells include:
•landing our wellbore in the desired drilling zone;
•staying in the desired drilling zone while drilling horizontally through the formation;
•running our casing through the entire length of the wellbore; and
•being able to run tools and other equipment consistently through the horizontal wellbore.
The difficulties that we will likely face while completing wells include the following:
•the ability to fracture stimulate the planned number of stages;
•the ability to run tools the entire length of the wellbore during completion operations; and
•the ability to successfully clean out the wellbore after completion of the final fracture stimulation stage.
Use of new technologies may not prove successful and could result in significant cost overruns or delays or reductions in production, and, in extreme cases, the abandonment of a well. In addition, certain of the new techniques we adopt may cause irregularities or interruptions in production due to offset wells being shut in and the time required to drill and complete multiple wells before any such wells begin producing. Furthermore, the results of drilling in new or emerging formations are more uncertain initially than drilling results in areas that are more developed and have a longer history of established production. Newer and emerging formations and areas have limited or no production history and, consequently, we will be more limited in assessing future drilling results in these areas. If its drilling results are less than anticipated, the return on investment for a
particular project may not be as attractive as anticipated, and we could incur material write-downs of unevaluated properties and the value of undeveloped acreage could decline in the future.
We may encounter obstacles to marketing our oil and natural gas, which could materially and adversely affect our revenues.
The marketability of our production depends in part upon the availability and capacity of oil and natural gas gathering systems, pipelines and other transportation facilities owned by third parties. Transportation space on the gathering systems and pipelines we utilize is occasionally limited or unavailable due to repairs or improvements to facilities, weather-related operational issues, or due to space being utilized by other companies that have priority transportation agreements. Additionally, new fields may require the construction of gathering systems and other transportation facilities. These facilities may require us to spend significant capital that would otherwise be spent on drilling. The availability of markets is beyond our control. If market factors dramatically change, the impact on our revenues could be substantial and could adversely affect our ability to produce and market oil and natural gas. Our access to transportation options can also be affected by U.S. federal and state regulation of oil and natural gas production and transportation, general economic conditions and changes in supply and demand.
In addition, the amount of oil and natural gas that can be produced and sold may be subject to curtailment in certain other circumstances outside of our or our operators’ control, such as pipeline interruptions due to maintenance, excessive pressure, inability of downstream processing facilities to accept unprocessed gas, physical damage to the gathering system or transportation system or lack of contracted capacity on such systems. The curtailments arising from these and similar circumstances may last from a few days to several months. In many cases, we and our operators are provided with limited notice, if any, as to when these curtailments will arise and the duration of such curtailments. Any such shut in or curtailment, or an inability to obtain favorable terms for delivery of the oil and natural gas produced from our acreage, could materially and adversely affect our financial condition, results of operations and cash available for distribution.
We depend upon twoone significant purchaserspurchaser for the sale of a substantial portion of our oil and natural gas production. The loss of these purchasersthis purchaser or other third parties on which we rely could, among other factors adversely affect our revenues.
We depend upon twoone significant purchaserspurchaser for the sale of a substantial portion of our oil and natural gas production, and our contracts with these customersthis customer are on a month-to-month basis. For example, for the year ended December 31, 2022,2023, Shell Trading US Company and ConocoPhillips represented approximately 21% and 15%18%, respectively, of our consolidated revenues. The loss of these customersthis customer could materially and adversely affect our revenues and have a material and adverse effect on our financial condition and results of operations.
We are not the operator on all of our acreage or drilling locations, and, therefore, we will not be able to control the timing of exploration or development efforts, associated costs, or the rate of production of any non-operated assets and could be liable for certain financial obligations of the operators or any of our contractors to the extent such operator or contractor is unable to satisfy such obligations.
Some of the properties in which we have an interest are operated by other companies and involve third-party working interest owners. We do not operate 100% of the total net undrilled locations, and there is no assurance that we will operate all of our other future drilling locations. As a result, we have limited ability to influence or control the operation or future development of certain of these properties, including compliance with environmental, safety and other regulations, or the amount of capital expenditures that we will be required to fund with respect to such properties, subject to certain of our election rights. Moreover, we are dependent on the other working interest owners of such projects to fund their contractual share of the capital expenditures of such projects. In addition, a third-party operator could also decide to shut-in or curtail production from wells, or plug and abandon marginal wells, on properties in which we own an interest during periods of lower crude oil or natural gas prices. Furthermore, the success and timing of development activities operated by our partners will depend on a number of factors that will be largely outside of our control, including:
•the timing and amount of capital expenditures;
•the operator’s expertise and financial resources;
•the approval of other participants in drilling wells;
•the selection of technology; and
•the rate of production of reserves, if any.
This limited ability to exercise control over the operations and associated costs of some of our drilling locations could prevent the realization of targeted returns on capital in development or acquisition activities. Further, we may be liable for certain financial obligations of the operator of a well in which we own a working interest to the extent such operator becomes insolvent and cannot satisfy such obligations. Similarly, we may be liable for certain obligations of contractors to the extent such contractor becomes insolvent and cannot satisfy their obligations. The satisfaction of such obligations could have a material and adverse effect on our financial condition. For more information, see "Items 1 and 2. Business and Properties" and "Part II., Item 7. Management’s Discussion and Analysis of Financial Condition and Results of Operations."
Risks related to regulatory matters
The Inflation Reduction Act of 2022 could accelerate the transition to a low carbon economy and will impose new costs on our operations.
On August 16, 2022, President Biden signed the Inflation Reduction Act of 2022 (“IRA 2022”) into law pursuant to the budget reconciliation process. The IRA 2022 contains hundreds of billions of dollars in incentives for the development of renewable energy, clean hydrogen, clean fuels, electric vehicles and supporting infrastructure and carbon capture and sequestration, amongst other provisions. These incentives could further accelerate the transition of the U.S. economy away from the use of fossil fuels towards lower- or zero-carbon emissions alternatives, which could decrease demand for the oil and gas we produce and consequently materially and adversely affect our business and results of operations. In addition, the IRA 2022 imposes the first ever federal fee on the emission of GHGs through a methane emissions charge. The IRA 2022 amends the federal
CAA to impose a fee on the emission of methane from sources required to report their GHG emissions to the EPA, including those sources in the onshore petroleum and natural gas production and gathering and boosting source categories. The methane emissions charge will startis expected to be collected in 2025 based on the calendar year 2024 at $900 per ton of methane, increase to $1,200 in 2025,emissions and be set at $1,500 for 2026 and each year thereafter. Calculation of the fee is based on certain thresholds established in the IRA 2022. The methane emissions charge could increase our operating costs and adversely affect our business and results of operations.
Our drilling and production programs may not be able to obtain access on commercially reasonable terms or otherwise to truck transportation, pipelines, transmission, storage and processing facilities to market our production, and our initiatives to expand our access to midstream and operational infrastructure may be unsuccessful.
The marketing of oil and natural gas production depends in large part on the availability, proximity and capacity of pipelines and storage facilities, gathering systems and other transportation, processing, fractionation, refining and export facilities, as well as the existence of adequate markets. Transportation space on the gathering systems and pipelines we utilize is occasionally limited or unavailable due to repairs or improvements to facilities or due to space being utilized by other companies that have priority transportation agreements. Additionally, new fields may require the construction of gathering systems and other transportation facilities. These facilities may require us to spend significant capital that would otherwise be spent on drilling. We rely, and expect to rely in the future, on facilities developed and owned by third parties in order to store, process, transmit and sell our production. Our plans to develop and sell our reserves could be materially and adversely affected by the inability or unwillingness of third parties to provide sufficient facilities and services to us on commercially reasonable terms or otherwise. If these facilities are unavailable to us on commercially reasonable terms or otherwise, we could be forced to shut in some production or delay or discontinue drilling plans and commercial production following a discovery of hydrocarbons. The availability of markets is beyond our control. If market factors dramatically change, the impact on our revenues could be substantial and could materially and adversely affect our ability to produce and market oil and natural gas.
Our access to transportation options can also be affected by U.S. federal and state regulation of oil and natural gas production and transportation, general economic conditions and changes in supply and demand. The interstate transportation and sale for resale of natural gas are subject to federal regulation, including regulation of the terms, conditions and rates for interstate transportation, storage and various other matters, primarily by FERC. Federal and state regulations govern the price and terms for access to natural gas pipeline transportation. FERC’s regulations for interstate natural gas transmission in some circumstances may also affect the intrastate transportation of natural gas. FERC regulates the rates, terms and conditions applicable to the interstate transportation of natural gas by pipelines under the NGA as well as under Section 311 of the NGPA. Since 1985, FERC has implemented regulations intended to increase competition within the natural gas industry by making natural gas transportation more accessible to natural gas buyers and sellers on an open-access, nondiscriminatory basis.
Our sales of oil and NGLs are also affected by the availability, terms and costs of transportation. The rates, terms, and conditions applicable to the interstate transportation of oil and NGLs by pipelines are regulated by FERC under the Interstate Commerce Act. FERC has implemented a simplified and generally applicable ratemaking methodology for interstate oil and NGL pipelines to fulfill the requirements of Title XVIII of the Energy Policy Act of 1992 comprised of an indexing system to
establish ceilings on interstate oil and NGL pipeline rates. Intrastate oil pipeline transportation rates are subject to regulation by state regulatory commissions. The basis for intrastate oil pipeline regulation, and the degree of regulatory oversight and scrutiny given to intrastate oil pipeline rates, varies from state to state. Insofar as effective interstate and intrastate rates are equally applicable to all comparable shippers, we believe that the regulation of oil transportation rates will not affect our operations in any materially different way than such regulation will affect the operations of our competitors.
Further, interstate and intrastate common carrier oil pipelines must provide service on a non-discriminatory basis. Under this open access standard, common carriers must offer service to all shippers requesting service on the same terms and under the same rates. When oil pipelines operate at full capacity, access is governed by prorationing provisions set forth in the pipelines’ published tariffs. Accordingly, we believe that access to oil pipeline transportation services generally will be available to us to the same extent as to our competitors.
As an alternative to pipeline transportation, any transportation of our crude oil and NGLs by rail will also be subject to regulation by the PHMSA and the FRA of the DOT under the Hazardous Materials Regulations at 49 CFR Parts 171-180, including Emergency Orders by the FRA and new regulations being proposed by the PHMSA, arising due to the consequences of train accidents and the increase in the rail transportation of flammable liquids.
Our operations are substantially dependent on the availability of water. Restrictions on our ability to obtain water may have a material and adverse effect on our financial condition, results of operations and cash flows.
Water is an essential component of both the drilling and hydraulic fracturing processes. Historically, we have been able to purchase water from local land owners and other sources for use in our operations. Some areas in which we have operations have experienced drought conditions that could result in restrictions on water use. If we are unable to obtain water to use in our operations from local sources, we may be unable to economically produce oil and natural gas in the affected areas, which could have a material and adverse effect on our financial condition, results of operations and cash flows.
We may face unanticipated water and other waste disposal costs.
We may be subject to regulation that restricts our ability to discharge water produced as part of our production operations. Productive zones frequently contain water that must be removed in order for the oil and natural gas to produce, and our ability to remove and dispose of sufficient quantities of water from the various zones will determine whether we can produce oil and natural gas in commercial quantities. The produced water must be transported from the leasehold and/or injected into disposal wells. The availability of disposal wells with sufficient capacity to receive all of the water produced from our wells may affect our ability to produce our wells. Also, the cost to transport and dispose of that water, including the cost of complying with regulations concerning water disposal, may reduce our profitability. Where water produced from our projects fails to meet the quality requirements of applicable regulatory agencies, our wells produce water in excess of the applicable volumetric permit limits, the disposal wells fail to meet the requirements of all applicable regulatory agencies, or we are unable to secure access to disposal wells with sufficient capacity to accept all of the produced water, we may have to shut in wells, reduce drilling activities, or upgrade facilities for water handling or treatment. The costs to dispose of this produced water may increase if any of the following occur:
•we cannot obtain future permits from applicable regulatory agencies;
•water of lesser quality or requiring additional treatment is produced;
•our wells produce excess water;
•new laws and regulations require water to be disposed in a different manner; or
•costs to transport the produced water to the disposal wells increase.
The disposal of fluids gathered from oil and natural gas producing operations in underground disposal wells has been pointed to by some groups and regulators as a potential cause of increased induced seismic events in certain areas of the country, particularly in Oklahoma, Texas, Colorado, Kansas, New Mexico and Arkansas. Several states have adopted or are considering adopting laws and regulations that may restrict or otherwise prohibit oilfield fluid disposal in certain areas or underground disposal wells, and state agencies implementing those requirements may issue orders directing certain wells in areas where seismic incidents have occurred to restrict or suspend disposal well operations or impose standards related to disposal well construction and monitoring. For example, in September 2021 the TRC issued a notice to operators in the Midland area to reduce daily injection volumes following multiple earthquakes above a 3.5 magnitude over an 18 month period. The notice also
required disposal well operators to provide injection data to TRC staff to further analyze seismicity in the area. Subsequently, the TRC ordered the indefinite suspension of all deep oil and gas produced water injection wells in the area, effective December 31, 2021. The response area has since been expanded to cover an additional 17 wells, following another earthquake in December 2022. Relatedly, in March 2022, the TRC began implementation of its Northern Culberson-Reeves Response Area
Plan to address injection-induced seismicity with the goal to eliminate 3.5 magnitude or greater earthquakes no later than
December 31, 2023. 23 deep disposal well permits were suspended in this Response Area in December 2023. Similarly, in Oklahoma, the Oklahoma Corporation Commission has at times limited drilling or ordered wells to be shut down in response to seismic activity. In November 2021, New Mexico implemented protocols requiring operators to take various actions within a specified proximity of certain seismic activity, including a requirement to limit
injection rates if a seismic event is of a certain magnitude. While we cannot predict the ultimate outcome of these actions, any action that temporarily or permanently restricts the availability of disposal capacity for produced water or other oilfield fluids may increase our costs or have other adverse impacts on our operations.
A change in the jurisdictional characterization of some of our assets by federal, state or local regulatory agencies or a change in policy by those agencies may result in increased regulation of our assets, which may cause our revenues to decline and operating expenses to increase.
Section 1(b) of the NGA exempts natural gas gathering facilities from regulation by FERC as a natural gas company as defined under that statute. We believe that the Springfield Gathering System, Lost Creek Gathering System, and DJ Basin Erie Hub Gathering System in which we own interests meet the traditional tests FERC has used to establish a pipeline’s status as a gathering pipeline not subject to regulation by FERC. However, the distinction between FERC-regulated transmission services and federally unregulated gathering services is fact intensive and the subject of ongoing litigation, so the classification and regulation of our gathering facilities may be subject to change based on future determinations by FERC, the courts or the U.S. Congress. If FERC were to consider the status of the gathering system and determine that it is subject to FERC regulation, the rates for, and terms and conditions of, services provided by that gathering system would be subject to modification by FERC under the NGA or the NGPA. Such regulation could decrease revenue, increase operating costs, and adversely affect our business, financial condition, and results of operations.
Our natural gas gathering operations may be subject to certain FERC reporting and posting requirements in a given year. Gathering service, which occurs on pipeline facilities located upstream of FERC-jurisdictional interstate transmission services, is regulated by the states onshore and in state waters. Depending on changes in the function performed by particular pipeline facilities, FERC has in the past reclassified certain FERC-jurisdictional transportation facilities as non-jurisdictional gathering facilities, and FERC has reclassified certain non-jurisdictional gathering facilities as FERC-jurisdictional transportation facilities. Any such changes could result in an increase to our costs. Other FERC regulations may indirectly affect our businesses and the markets for products derived from these businesses. FERC’s policies and practices across the range of its natural gas and liquids regulatory activities, including, for example, its policies on open access transportation, natural gas quality, ratemaking, capacity release and market center promotion, may indirectly affect the intrastate natural gas and liquids markets. In recent years, FERC has pursued pro-competitive policies in its regulation of interstate natural gas and liquids pipelines. However, we cannot assure you that FERC will continue this approach as it considers matters such as pipeline rates and rules and policies that may affect rights of access to transportation capacity.
We have an interstate liquids pipeline that is considered a common carrier pipeline subject to regulation by FERC under the ICA. Unless we obtain a waiver of the applicable provisions, the ICA requires that we maintain tariffs on file with FERC for interstate movements of liquids on our pipelines. Those tariffs set forth the rates we charge for providing transportation services as well as the rules and regulations governing these services. The ICA requires, among other things, that rates on interstate common carrier pipelines be “just and reasonable” and non-discriminatory. Further, FERC’s scrutiny of transportation service agreements between an ICA jurisdictional pipeline and affiliated shippers or marketers under the just and reasonable and non-discriminatory standard is evolving. The ICA permits interested persons to challenge proposed new or changed rates or rules, and authorizes FERC to investigate such changes and to suspend their effectiveness for a period of up to seven months. Upon completion of such an investigation, FERC may require refunds of amounts collected above what it finds to be a just and reasonable level, together with interest. FERC may also investigate, upon complaint or on its own motion, rates and related rules that are already in effect, and may order a carrier to change them prospectively. Upon an appropriate showing, a shipper may obtain reparations (including interest) for damages sustained for a period of up to two years prior to the filing of its complaint. Changes in FERC’s methodologies for approving rates and the treatment of agreements with affiliated shippers could adversely affect us. Further, challenges to our regulated rates could be filed with FERC and future decisions by FERC regarding our regulated rates and agreements with affiliated shippers could adversely affect our cash flows. We cannot predict the rates we will be allowed to charge in the future for transportation services by such pipelines. For more information, see “Items 1 and 2. Business and Properties—Legislative and regulatory environment.”
The classification of some of our gathering facilities, transportation pipelines, and purchase and sale transactions as FERC-jurisdictional or non-jurisdictional may be subject to change based on future determinations by FERC, the courts or Congress, in which case, our operating costs could increase and we could be subject to enforcement actions under the EP Act of 2005.
In addition, the pipelines used to gather and transport natural gas being produced by us are also subject to regulation by the DOT through PHMSA. PHMSA has established a risk-based approach to determine which gathering pipelines are subject to regulation and what safety standards regulated gathering pipelines must meet. These standards may be revised by PHMSA over time. For example, in October 2019, PHMSA published three final rules that create or expand reporting, inspection, maintenance, and other pipeline safety obligations. As part of the Consolidated Appropriations Act of 2021, the U.S. Congress reauthorized PHMSA through 2023 and directed the agency to move forward with several regulatory actions, including but not limited to the issuance of final regulations to require operators of non-rural gas gathering lines and new and existing transmission and distribution pipeline facilities to conduct certain leak detection and repair programs and to require facility inspection and maintenance plans to align with those regulations. A rule to address certain of these requirements was issued in November 2021, which modified pipeline repair criteria, increased monitoring and reporting obligations, and expanded regulatory safety requirements to certain gathering lines in rural areas. An additional rule was finalized in August 2022, which adjusted repair criteria and strengthened integrity management assessment requirements, among other items. In 2023, PHMSA published a notice of proposed rulemaking to address the management of methane emissions through more stringent leak detection and repair requirements, among other matters, for which PHMSA is in the process of analyzing comments. PHMSA is continuing to work on developing additional regulations related to safety oversight of gas gathering pipelines, and additional future regulatory action expanding PHMSA’s jurisdiction and imposing stricter integrity management requirements is possible. The adoption of laws or regulations that apply more comprehensive or stringent safety standards could require us to install new or modified safety controls, pursue new capital projects, or conduct maintenance programs on an accelerated basis, all of which could require us to incur increased operating costs that could be significant. In addition, should we fail to comply with PHMSA or comparable state regulations, we could be subject to substantial fines and penalties. As of March 21, 2022,December 28, 2023, the maximum civil penalties PHMSA can impose are $239,142$266,015 per violation per day, with a maximum of $2,391,412$2,660,135 for a related series of violations.
Should we fail to comply with all applicable FERC administered statutes, rules, regulations and orders, we could be subject to substantial penalties and fines.
Under the Domenici-Barton Energy Policy Act of 2005 ("EPAct 2005"), FERC has civil penalty authority under the NGA and the NGPA to impose penalties for current violations of up to $1,496,035$1,544,521 per day (adjusted annually for inflation) for each violation and disgorgement of profits associated with any violation. While our operations have not been regulated by FERC as a natural gas company under the NGA, FERC has adopted regulations that may subject certain of our otherwise non-FERC jurisdictional operations to FERC annual reporting and posting requirements. We also must comply with the anti-market manipulation rules enforced by FERC. The EPAct 2005 also authorized FERC to impose civil penalties for violations of the ICA and FERC regulations thereunder, up to a maximum amount that is adjusted annual for inflation, which for 20232024 equals $15,662$16,170 per day, per violation. Additional rules and legislation pertaining to those and other matters may be considered or adopted by FERC from time to time. Failure to comply with those regulations in the future could subject us to civil penalty liability, as described in “Items 1 and 2. Business and Properties – Legislative and regulatory environment.”
Our sales of oil and natural gas, and any hedging activities related to such energy commodities, expose us to potential regulatory risks.
Sales of oil natural gas and NGLs are not currently regulated and are made at negotiated prices. However, the federal government historically has been active in the area of oil and natural gas sales regulation. We cannot predict whether new legislation to regulate oil and natural gas sales might be proposed, what proposals, if any, might actually be enacted by the U.S. Congress or the various state legislatures, and what effect, if any, the proposals might have on our operations.
Additionally, FERC, the FTC and the CFTC hold statutory authority to monitor certain segments of the physical and futures energy commodities markets relevant to our business. These agencies have imposed broad regulations prohibiting fraud and manipulation of such markets. With regard to our physical sales of oil and natural gas, and any hedging activities related to these energy commodities, we are required to observe the market-related regulations enforced by these agencies, which hold substantial enforcement authority. These agencies have substantial enforcement authority, including the ability to impose penalties for current violations of $1,496,035$1,544,521 per day (adjusted annually for inflation) by FERC, $1,404,520$1,450,040 (adjusted annually for inflation) by the CFTC, and $1,426,319$1,472,546 (adjusted annually for inflation) by the FTC, for each violation. The FERC has also imposed requirements related to reporting of natural gas sales volumes that may impact the formation of prices indices. Additional rules and legislation pertaining to these and other matters may be considered or adopted from time to time. Our failure to comply with these or other laws and regulations administered by these agencies could subject us to criminal and civil
penalties, as described in "Items 1 and 2. Business and Properties—Legislative and regulatory environment." Failure to comply
with such regulations, as interpreted and enforced, could materially and adversely affect our financial condition or results of operations.
The adoption of derivatives legislation and regulations by the U.S. Congress related to derivative contracts could have a material and adverse effect on our ability to hedge risks associated with our business.
Title VII of Dodd-Frank establishes federal oversight and regulation of over-the-counter (“OTC”) derivatives and requires the CFTC and the SEC to enact further regulations affecting derivative contracts, including the derivative contracts we use to hedge our exposure to price volatility through the OTC market. Although the CFTC and the SEC have issued final regulations in certain areas, final rules in other areas and the scope of relevant definitions and/or exemptions still remain to be finalized.
In one of its rulemaking proceedings still pending under Dodd-Frank, the CFTC issued on January 30, 2020, a re-proposed rule imposing position limits for certain futures and option contracts in various commodities (including oil and natural gas) and for swaps that are their economic equivalents. Under the proposed rules on position limits, certain types of hedging transactions are exempt from these limits on the size of positions that may be held, provided that such hedging transactions satisfy the CFTC’s requirements for certain enumerated “bona fide hedging” transactions or positions. A final rule has not yet been issued.
The CFTC has also adopted final rules regarding aggregation of positions, under which a party that controls the trading of, or owns 10% or more of the equity interests in, another party will have to aggregate the positions of the controlled or owned party with its own positions for purposes of determining compliance with position limits unless an exemption applies. The CFTC’s aggregation rules are now in effect, though CFTC staff have granted relief—until August 12, 2025—from various conditions and requirements in the final aggregation rules. With the implementation of the final aggregation rules and upon the adoption and effectiveness of final CFTC position limits rules, our ability to execute our hedging strategies described above could be limited. It is uncertain at this time whether, when and in what form the CFTC’s proposed new position limits rules may become final and effective.
The CFTC issued a final rule on the amount of capital certain swap dealers and major swap participants are required to set aside with respect to their swap business on July 22, 2020. This rule may require our swap dealer counterparties to post additional capital as a result of entering into uncleared financial derivatives with us, which could increase the costs to us of future financial derivatives transactions.
The CFTC issued a final rule on margin requirements for uncleared swap transactions on January 6, 2016, which includes an exemption from any requirement to post margin to secure uncleared swap transactions entered into by commercial end-users to hedge commercial risks affecting their business. In addition, the CFTC has issued a final rule authorizing an exemption from the otherwise applicable mandatory obligation to clear certain types of swap transactions through a derivatives clearing organization and to trade such swaps on a regulated exchange, which exemption applies to swap transactions entered into by commercial end-users to hedge commercial risks affecting their business. The mandatory clearing requirement currently applies only to certain interest rate swaps and credit default swaps, but the CFTC could act to impose mandatory clearing requirements for other types of swap transactions. Dodd-Frank also imposes recordkeeping and reporting obligations on counterparties to swap transactions and other regulatory compliance obligations.
All of the above regulations could increase the costs to us of entering into financial derivative transactions to hedge or mitigate our exposure to commodity price volatility and other commercial risks affecting our business. The Volcker Rule provisions of Dodd-Frank may also require our current bank counterparties that engage in financial derivative transactions to spin off some of their derivatives activities to separate entities, which separate entities may not be as creditworthy as the current bank counterparties. Under such rules, other bank counterparties may cease their current business as hedge providers. These changes could reduce the liquidity of the financial derivatives markets thereby reducing the ability of entities like us, as commercial end-users, to have access to financial derivatives to hedge or mitigate our exposure to commodity price volatility.
As a result, Dodd-Frank and any new regulations issued thereunder could significantly increase the cost of derivative contracts (including through requirements to post cash collateral), which could adversely affect our capital available for other commercial operations purposes, materially alter the terms of future swaps relative to the terms of our existing bilaterally negotiated financial derivative contracts and reduce the availability of derivatives to protect against commercial risks we encounter.
If we reduce our use of derivative contracts as a result of the new requirements, our results of operations may become more volatile and cash flows less predictable, which could adversely affect our ability to plan for and fund capital expenditures. Finally, the legislation was intended, in part, to reduce the volatility of oil, natural gas and NGL prices, which some legislators attributed to speculative trading in derivatives and commodity instruments related to oil, natural gas and NGL. Our revenues could therefore be adversely affected if a consequence of the legislation and regulations is to lower commodity prices. Any of
these consequences could have a material and adverse effect on our consolidated financial condition, results of operations or cash flows.
Our ability to pursue our business strategies may be adversely affected if we incur costs and liabilities due to a failure to comply with environmental laws or regulations or a release of hazardous substances or other wastes into the environment.
We may incur significant costs and liabilities as a result of environmental requirements applicable to the operation of our wells, gathering systems and other facilities. These costs and liabilities could arise under a wide range of federal, state and local environmental laws and regulations, including, for example, the following federal laws and their state counterparts, as amended from time to time:
•the CAA, which restricts the emission of air pollutants from many sources, imposes various pre-construction, monitoring and reporting requirements and is relied upon by the EPA as authority for adopting climate change regulatory initiatives relating to GHG emissions;
•the CWA, which regulates discharges of pollutants from facilities to state and federal waters and establish the extent to which waterways are subject to federal jurisdiction and rulemaking as protected waters of the United States;
•the OPA, which imposes liabilities for removal costs and damages arising from an oil spill into waters of the United States;
•the SDWA, which protects the quality of the nations’ public drinking water through adoption of drinking water standards and control over the subsurface injection of fluids into belowground formations;
•the RCRA, which imposes requirements for the generation, treatment, storage, transport disposal and cleanup of non-hazardous and hazardous wastes;
•the CERCLA, which imposes liability without regard for fault on generators, transporters and arrangers of hazardous substances at sites where hazardous substance releases have occurred or are threatening to occur, as well as on present and certain past owners and operators of sites were hazardous substance releases have occurred or are threatening to occur;
•the Emergency Planning and Community Right-to-Know Act, which requires facilities to implement a safety hazard communication program and disseminate information to employees, local emergency planning committees and response departments about toxic chemical uses and inventories; and
•the ESA, which restricts activities that may affect federally identified endangered and threatened species or their habitats through the implementation of operating limitations or restrictions or a temporary, seasonal or permanent ban on operations in affected areas. Similar protections are afforded to migratory birds under the MBTA.
These U.S. laws and their implementing regulations, as well as state counterparts, generally restrict the level of pollutants emitted to ambient air, discharges to surface water, and disposals or other releases to surface and below-ground soils and ground water. Failure to comply with these laws and regulations may result in the assessment of sanctions, including administrative, civil and criminal penalties, the imposition of investigatory, remedial and corrective actions obligations, the incurrence of capital expenditures, the occurrence of delays in the permitting, development or expansion of projects and the issuance of orders enjoining some or all of our future operations in a particular area. Compliance with more stringent standards and other environmental regulations could restrict our ability to obtain permits for operations or require us to install additional pollution control equipment, the costs of which could be significant. Certain environmental laws and analogous state laws and regulations impose strict joint and several liability, without regard to fault or legality of conduct, for costs required to clean up and restore sites where hazardous substances or other wastes have been disposed of or otherwise released. Moreover, it is not uncommon for neighboring landowners and other third parties to file claims for personal injury and property damage allegedly caused by the release of hazardous substances, wastes or other materials into the environment. In addition, these laws and regulations may restrict the rate of oil or natural gas production. Historically, our environmental compliance costs have not had a material and adverse effect on our results of operations; however, there can be no assurance that such costs will not be material in the future or that such future compliance will not have a material and adverse effect on our business and operating results.
Moreover, public interest in the protection of the environment has increased dramatically in recent years. The trend of more expansive and stringent environmental legislation and regulations applied to the oil and natural gas industry could continue,
resulting in increased costs of doing business and consequently affecting profitability. To the extent laws are enacted or other governmental action is taken that restricts drilling or imposes more stringent and costly operating, waste handling, disposal and cleanup requirements, our business, prospects, financial condition or results of operations could be materially and adversely affected. See "Items 1 and 2. Business and Properties—Legislative and regulatory environment."
We are subject to complex federal, state, local and other laws and regulations that could materially and adversely affect the cost, manner or feasibility of conducting our operations.
Our oil and natural gas operations are subject to complex and stringent laws and regulations. In order to conduct our operations in compliance with these laws and regulations, we must obtain and maintain numerous permits, approvals and certificates from various federal, state and local governmental authorities. Failure or delay in obtaining regulatory approvals or drilling permits could have a material and adverse effect on our ability to develop our properties, and receipt of drilling permits with onerous conditions could increase our compliance costs. In addition, regulations regarding conservation practices and the protection of correlative rights affect our operations by limiting the quantity of oil and natural gas we may produce and sell.
We are subject to federal, state and local laws and regulations as interpreted and enforced by governmental authorities possessing jurisdiction over various aspects of the exploration, production and transportation of oil and natural gas. The possibility exists that new laws, regulations or enforcement policies could be more stringent and significantly increase our compliance costs. If we are not able to recover the resulting costs through insurance or increased revenues, our financial condition could be materially and adversely affected.
For example, the TRC has adopted rules and regulations implementing legislation mandating certain clean-up activities for inactive wells and additional requirements related to the approval of plugging extensions. Failure to comply can result in administrative penalties and the loss of an operator’s ability to conduct operations in Texas. A major component of the law is Rule 15, which requires a well operator to comply with certain inactive well clean-up activities, including the disconnection of electricity, purging of all production fluids from inactive lines and tanks and removal of surface equipment for wells that have not produced oil or gas during the preceding year. Noncompliance with Rule 15 could result in administrative penalties of up to $10,000 per violation per day and the loss of an operator’s ability to conduct operations in Texas.
Our access to transportation options can also be affected by U.S. federal and state regulation of oil and natural gas production and transportation, general economic conditions and changes in supply and demand. Various proposals and proceedings that might affect the petroleum industry are pending before the U.S. Congress, FERC, various state legislatures and the courts. The industry historically has been heavily regulated and we cannot provide assurance that the less stringent regulatory approach recently pursued by FERC and the U.S. Congress will continue nor can we predict what effect such proposals or proceedings may have on our operations.
Fuel conservation measures, alternative fuel requirements, increasing consumer demand for alternatives to oil and natural gas, technological advances in fuel economy and energy generation devices, and passage of incentives or funding for renewable energy projects such as those contained in IRA 2022 could reduce demand for oil and natural gas. The impact of the changing demand for oil and natural gas may have a material and adverse effect on our business, financial condition, results of operations and cash flows.
Our operations are subject to a series of risks arising from climate change.
Climate change continues to attract considerable public and scientific attention. As a result, our operations as well as the operations of our non-operated assets are subject to a series of regulatory, political, litigation, and financial risks associated with the production and processing of fossil fuels and emission of GHG. At the federal level, no comprehensive climate change law or regulation has been implemented to date, though the IRA 2022 advances numerous climate related objectives. The EPA has, however, adopted regulations that, among other things, establish construction and operating permit reviews for GHG emissions from certain large stationary sources, and together with DOT, implement GHG emissions limits on vehicles manufactured for operation in the United States. The federal regulation of methane emissions from oil and gas facilities has been subject to controversy in recent years. For more information, see "Items 1 and 2. Business and Properties—Legislative and regulatory environment—Air emissions."
Additionally, various states and groups of states have adopted or are considering adopting legislation, regulations or other regulatory initiatives that are focused on such areas as GHG cap and trade programs, carbon taxes, reporting and tracking programs, and restriction of GHG emissions. For example, California, through CARB, has implemented a cap and trade program for GHG emissions that sets a statewide maximum limit on covered GHG emissions, and this cap declines annually to reach 40% below 1990 levels by 2030. Covered entities must either reduce their GHG emissions or purchase allowances to
account for such emissions. Separately, California has implemented LCFS and associated tradable credits that require a progressively lower carbon intensity of the state’s fuel supply than baseline gasoline and diesel fuels. Such programs work
alongside increased regulation by California seeking to reduce both the supply and demand for fossil fuels in the state, to
include, for example, the phasing out of the sale of vehicles with internal combustion engines. CARB has also promulgated regulations regarding monitoring, leak detection, repair and reporting of methane emissions from both existing and new oil and gas production facilities. Similar regulations applicable to oil and gas facilities have been promulgated in Colorado. Colorado has begun to increasingly regulate oil and gas operations with consideration towards GHG emissions and cumulative impacts. In January 2024, the Colorado Energy and Carbon Management Commission released draft rules that, if finalized as proposed, would require regulators to consider cumulative impacts of oil and gas operations in permitting decisions and increase scrutiny on the project’s proximity to other industrial sites, residential and school areas, “disproportionately impacted communities,” and “cumulatively impacted communities.” The draft rules would also set GHG emissions intensity targets for oil and gas operators and require regulators to consider such targets in their cumulative impacts analysis, as well as the potential to restrict operations during the summer in Ozone Nonattainment Areas.
Furthermore, we have been and could be impacted in the future by the effects of winter weather and the weatherization of our facility equipment and the equipment of counterparties in anticipation of future climactic events. For example, in the winter of 2022, certain of our surface facilities in South Texas were impacted by abnormal winter conditions that temporarily adversely affected our production. In addition, in response to Winter Storm Uri, the TRC was directed to adopt rules requiring certain natural gas processing, storage, and pipeline facility operators experiencing major or repeated weather-related forced interruptions of service to, among other things, engage an independent party to assess the operator’s weatherization plans, procedures and operations, and submit the assessment to the TRC. In August 2022, the TRC adopted the Weather Emergency Preparedness Standards Rule, which requires critical gas facilities on the state’s Electricity Supply Chain, including natural gas processing, storage, and pipeline facilities, to (i) weatherize to help ensure sustained operations during a weather emergency; (ii) correct known issues that caused weather-related forced stoppages; and (iii) contact the TRC if a facility sustains a weather-related forced stoppage during a weather emergency. In addition, weather-related forced stoppages at processing, storage and pipeline facilities operated by counterparties with which we contract for services may also adversely affect our operations and financial results.
Internationally, the United Nations-sponsored “Paris Agreement” requires member states to individually determine and submit non-binding emission reduction targets every five years after 2020. Although the United States had withdrawn from the agreement, President Biden has signed executive orders recommitting the United States to the agreement and, in April 2021, announced a target of reducing the United States’ emissions by 50-52% below 2005 levels by 2030. In November 2021, the international community gathered again in Glasgow at the COP26, during which multiple announcements were made, including a call for parties to eliminate certain fossil fuel subsidies and pursue further action on non-CO2non-CO2 GHGs. Relatedly, the United States and European Union jointly announced the launch of the “Global Methane Pledge,” which aims to cut global methane pollution at least 30% by 2030 relative to 2020 levels, including “all feasible reductions” in the energy sector. At COP27 in November 2022, countries reiterated the agreements from COP26 and were called upon to accelerate efforts toward the phase out of inefficient fossil fuel subsidies. The United States also announced, in conjunction with the European Union and other partner countries, that it would develop standards for monitoring and reporting methane emissions to help create a market for low methane-intensity natural gas. At COP28, the parties entered into an agreement to transition away from fossil fuels in energy systems and increase renewable capacity. Although no firm commitment or timeline to phase out or phase down all fossil fuels was made at COP27 or COP28, there can be no guarantees that countries will not seek to implement such a phase out in the future. However, these agreements could result in increased pressure among financial institutions and various stakeholders to reduce or otherwise impose more stringent limitations on funding for and increase opposition to production and use of fossil fuels. The impacts of these orders, pledges, agreements any legislation or regulation promulgated to fulfill the United States’ commitments under the Paris Agreement, COP26, COP27 or other international conventions cannot be predicted at this time.
Governmental, scientific, and public concern over the threat of climate change arising from GHG emissions has resulted in increasing political risks in the United States, including climate change related pledges made by the recently elected administration. These have included promises to limit emissions and curtail the production of oil and gas on federal lands, such as through the cessation of leasing public land for hydrocarbon development. For example, President Biden has issued several executive orders focused on addressing climate change, including items that may impact our costs to produce, or demand for, oil and gas. Additionally, in November 2021, the Biden Administration released “The Long-Term Strategy of the United States: Pathways to Net-Zero Greenhouse Gas Emissions by 2050,” which establishes a roadmap to net zero emissions in the United States by 2050 through, among other things, improving energy efficiency; decarbonizing energy sources via electricity, hydrogen, and sustainable biofuels; and reducing non-CO2non-CO2 GHG emissions, such as methane and nitrous oxide. The Biden Administration is also considering revisions to the leasing and permitting programs for oil and gas development on federal lands. For more information, see our regulatory disclosure in "Items 1 and 2. Business and Properties—Legislative and
regulatory environment—Hydraulic fracturing. Other actions that could be pursued by the Biden Administration may include the imposition of more restrictive requirements for the establishment of pipeline infrastructure or the permitting of LNG export facilities, as well as more restrictive GHG emission limitations for oil and gas facilities. For example, the Biden Administration has recently temporarily paused pending decisions on new exports of LNG to countries that the United States does not have free trade agreements with. Litigation risks are also increasing, as a number of parties have sought to bring suit against oil and natural gas companies in state or federal court, alleging, among other things, that such companies created public nuisances by producing fuels that contributed climate change or alleging that companies have been aware of the adverse effects of climate change for some time but defrauded their investors or customers by failing to adequately disclose those impacts.
There are also increasing financial risks for fossil fuel producers as shareholders currently invested in fossil-fuel energy companies may elect in the future to shift some or all of their investments into non-fossil fuel related sectors. Institutional lenders who provide financing to fossil-fuel energy companies also have become more attentive to sustainable lending practices
and some of them may elect not to provide funding for fossil fuel energy companies. For example, at COP26, the GFANZ announced that commitments from over 450 firms across 45 countries had resulted in over $130 trillion in capital committed to net zero goals. The various sub-alliances of GFANZ generally require participants to set short-term, sector-specific targets to transition their financing, investing, and/or underwriting activities to net zero emissions by 2050. There is also a risk that financial institutions will be required to adopt policies that have the effect of reducing the funding provided to the fossil fuel sector. Recently, President Biden signed an executive order calling for the development of a “climate finance plan” and, separately, in late 2020, the Federal Reserve announced that it had joined the NGFS, a consortium of financial regulators focused on addressing climate-related risks in the financial sector. In September 2022, the Federal Reserve announced that six of the U.S.’ largest banks would participate in a pilot climate scenario analysis exercise, to enhance the ability of firms and supervisors to measure and manage climate-related financial risk. Released in JanuaryTaking place throughout 2023, the pilot exercise is designed to analyze the impact of both physical and transition risks related to climate change on specific assets of the banks' portfolio. Limitation of investments in and financings for fossil fuel energy companies could result in the restriction, delay or cancellation of drilling programs or development or production activities. Additionally, the SEC published a proposed rule requiring climate-related disclosures from registrants, including data on Scope 1 and 2 GHG emissions and, in some cases, Scope 3 emissions, as well as any set climate-related targets and goals. A final rule is expected to be released in the second quarter of 2023.2024. Although the final form and substance of these requirements is not yet known, this may result in additional costs to comply with any such disclosure requirements. We also cannot predict how such disclosures may be considered by financial institutions and investors when making investments decisions, and it is possible that we could face increased costs or restrictions on our access to capital.
The adoption and implementation of new or more stringent international, federal or state legislation, regulations or other regulatory initiatives that impose more stringent standards for GHG emissions from oil and natural gas producers, such as ourselves or our operators, or otherwise restrict the areas in which we may produce oil and natural gas or generate GHG emissions could result in increased costs of compliance or costs of consuming, and thereby reduce demand for or erode value for, the oil and natural gas that we produce. Additionally, political, litigation, and financial risks may result in our restricting or canceling oil and natural gas production activities, incurring liability for infrastructure damages as a result of climatic changes, or impairing our ability to continue to operate in an economic manner. Moreover, climate change may also result in various physical risks, such as the increased frequency or intensity of extreme weather events (including storms, wildfires, and other natural disasters) or changes in meteorological and hydrological patterns, that could adversely impact our operations, as well as those of our operators and their supply chains. Such physical risks may result in damage to our facilities or otherwise adversely impact our operations, such as if we become subject to water use curtailments in response to drought, or demand for our products, such as to the extent warmer winters reduce the demand for energy for heating purposes. Such physical risks may also impact our supply chain or infrastructure on which we rely to produce or transport our products. One or more of these developments could have a material adverse effect on our business, financial condition and results of operation.
Federal, state and local legislative and regulatory initiatives relating to hydraulic fracturing as well as governmental reviews of such activities could result in increased costs and additional operating restrictions or delays in the completion of oil and natural gas wells and adversely affect our production.
Hydraulic fracturing is an important and common practice that is used to stimulate production of oil, natural gas and NGLs from dense subsurface rock formations. We and the operators of our properties regularly use hydraulic fracturing as part of our operations. Hydraulic fracturing involves the injection of water, sand or alternative proppant and chemicals under pressure into targeted geological formations to fracture the surrounding rock and stimulate production. The U.S. Congress from time to time has considered legislation to amend the SDWA to remove the exemption currently available to hydraulic fracturing, which would place additional regulatory burdens upon hydraulic fracturing operations including requirements to obtain a permit prior to commencing operations adhering to certain construction requirements, to establish financial assurance, and to require reporting and disclosure of the chemicals used in those operations. This legislation has not passed.
Hydraulic fracturing (other than that using diesel) is currently generally exempt from regulation under the SDWA’s UIC program and is typically regulated by state oil and natural gas commissions or similar agencies. However, several federal agencies have asserted regulatory authority or pursued investigations over certain aspects of the process. For example, in June 2016, the EPA published an effluent limitations guideline final rule prohibiting the discharge of wastewater from onshore unconventional oil and natural gas extraction facilities to publicly owned wastewater treatment plants.
Also, in December 2016, the EPA released its final report on the potential impacts of hydraulic fracturing on drinking water resources, concluding that “water cycle” activities associated with hydraulic fracturing may impact drinking water resources under certain limited circumstances. To date, EPA has taken no further action in response to the December 2016 report.
In addition, the BLM finalized a rule in March 2015 for hydraulic fracturing activities on federal and Tribal lands that requires public disclosure of chemicals used in hydraulic fracturing, confirmation that the wells used in fracturing operations meet proper construction standards and development of plans for managing related flowback water. While the BLM rescinded these regulations in 2017, which rescission was upheld, these regulations may be reconsidered by the Biden Administration. The BLM is also currently considering revisions to the fiscal terms of oil and gas leases on federal lands and the criteria BLM considers when determining whether to lease nominated land. The Biden Administration may also pursue further restriction of hydraulic fracturing and other oil and gas development on federal lands; for more information, see our regulatory disclosure in "Items 1 and 2. Business and Properties—Legislative and regulatory environment—Hydraulic fracturing."
In addition, some states, including Texas, have adopted, and other states are considering adopting, regulations that restrict or could restrict hydraulic fracturing in certain circumstances and that require the disclosure of the chemicals used in hydraulic fracturing operations. Further, state and local governmental entities have exercised the regulatory powers to regulate, curtail or in some cases prohibit hydraulic fracturing. For example, Colorado has adopted more stringent setbacks for oil and gas development. In California, Senate Bill No. 1137 was signed into law on September 16, 2022, which establishes 3,200 feet as the minimum distance between new oil and gas production wells and certain sensitive receptors such as home, schools or parks effective January 1, 2023. However, on February 3, 2023, the Secretary of State of California certified a requisite number of signatures collected by proponents of a voter referendum, thereby qualifying the Bill for the November 2024 ballot. Accordingly, Senate Bill No. 1137 is stayed until it is put to a vote. However, Colorado has begun to increasingly regulate oil and gas operations generally with consideration towards GHG emissions and their cumulative impacts, including releasing draft rules in 2024 that would apply increased scrutiny to a project’s location within 2,000 feet of impacted communities and other developments. New laws or regulations that impose new obligations on, or significantly restrict hydraulic fracturing, could make it more difficult or costly for us to perform hydraulic fracturing activities and thereby affect our determination of whether a well is commercially viable and increase our cost of doing business. Such increased costs and any delays or curtailments in our production activities could have a material and adverse effect on our business, prospects, financial condition, results of operations and liquidity.
Restrictions on drilling activities intended to protect certain species of wildlife may adversely affect our ability to conduct drilling activities in some of the areas where we operate.
Oil and natural gas operations in our operating areas can be adversely affected by seasonal or permanent restrictions on drilling activities designed to protect various wildlife, such as those restrictions imposed under the federal ESA and MBTA. Seasonal restrictions may limit our ability to operate in protected areas and can intensify competition for drilling rigs, oilfield equipment, services, supplies and qualified personnel, which may lead to periodic shortages when drilling is allowed. These constraints and the resulting shortages or high costs could delay our operations and materially increase our operating and capital costs. Permanent restrictions imposed to protect endangered species could prohibit drilling in certain areas or require the implementation of expensive mitigation measures. We may conduct operations on oil and natural gas leases in areas where certain species that are listed as threatened or endangered are known to exist and where other species, such as the dunes sagebrush lizard, lesser prairie chicken, and greater sage grouse, that potentially could be listed as threatened or endangered under the ESA may exist. A review is currently pending to determine whether the dunes sagebrush lizard should be listed and, in November 2022, the FWS listed two distinct population segments of the lesser prairie-chicken under the ESA. Additionally, the Biden Administration has taken action to broaden enforcement under the ESA, including expanding the definition of “critical habitat.” The designation of previously unprotected species in areas where we operate as threatened or endangered, a recategorization of a species from threatened to endangered, or an expansion of areas designated as “critical habitat” could cause us to incur increased costs arising from species protection measures or could result in limitations on our exploration, development and production activities that could have an adverse impact on our ability to develop and produce our reserves. To the extent species are listed or critical habitats are designated under the ESA or similar laws, or previously unprotected species are designated as threatened or endangered in areas where our properties are located, operations on those properties could incur increased costs arising from species protection measures and face delays or limitations with respect to production activities thereon.
Increased attention to ESGsustainability-related matters and conservation measures may adversely impact our business.
Increasing attention to climate change, societal expectations on companies to address climate change, investor and societal expectations regarding voluntary ESGsustainability disclosures, and consumer demand for alternative forms of energy may result in increased costs, reduced demand for our products, reduced profits, increased investigations and litigation, and negative impacts on our stock price and access to capital markets. Increasing attention to climate change and environmental conservation, for example, may result in demand shifts for oil and natural gas products and additional governmental investigations and private litigation against us or our operators. To the extent that societal pressures or political or other factors are involved, it is possible that such liability could be imposed without regard to our causation of or contribution to the asserted damage, or to other mitigating factors.
Moreover, while we may create and publish voluntary disclosures regarding ESGsustainability-related matters from time to time, many of the statements in those voluntary disclosures are based on hypothetical expectations and assumptions that may or may not be representative of current or actual risks or events or forecasts of expected risks or events, including the costs associated
therewith. Such expectations and assumptions are necessarily uncertain and may be prone to error or subject to misinterpretation given the long timelines involved and the lack of an established single approach to identifying, measuring and reporting on many ESGsustainability-related matters. We may also announce participation in, or certification under, various third-party ESGsustainability or climate-related frameworks in an attempt to improve our ESGsustainability profile, but such participation or certification may be costly and may not achieve the desired results. Additionally, while we may announce various voluntary ESGclimate or sustainability-related targets, such targets are aspirational. We may not be able to meet such targets in the manner or on such a timeline as initially contemplated, including but not limited to as a result of unforeseen costs or technical difficulties associated with achieving such results. To the extent we meet such targets, it may be achieved through various contractual arrangements, including the purchase of various credits or offsets that may be deemed to mitigate our ESGenvironmental impact instead of actual changes in our ESGenvironmental performance. However, we cannot guarantee that there will be sufficient offsets available for purchase given the increased demand from numerous businesses implementing net
zero goals, or that offsets we do purchase will successfully achieve the emissions reductions they represent. Also, despite these aspirational goals and any other actions taken, we may receive pressure from investors, lenders, or other groups to adopt more aggressive climate or other ESG-relatedsustainability-related goals, but we cannot guarantee that we will be able to implement such goals because of potential costs or technical or operational obstacles.
In addition, organizations that provide information to investors on corporate governance and related matters have developed ratings processes for evaluating companies on their approach to ESG matters. Such ratings are used by some investors to inform their investment and voting decisions. Unfavorable ESG ratings and recent activism directed at shifting funding away from companies with energy-related assets could lead to increased negative investor sentiment toward us and our industry and to the diversion of investment to other industries, which could have a negative impact on our access to and costs of capital. Also, institutional lenders may decide not to provide funding for fossil fuel energy companies based on climate change related concerns, which could affect our access to capital for potential growth projects. Additionally, to the extent ESGsustainability-related matters
negatively impact our reputation, we may not be able to compete as effectively to recruit or retain employees, which may adversely affect our operations. ESGsustainability-related matters may also impact our suppliers and customers, which may ultimately have adverse impacts on our operations.
Furthermore, public statements with respect to ESGsustainability matters, such as emissions reduction goals, other environmental targets, or other commitments addressing certain social issues, are becoming increasingly subject to heightened scrutiny from public and governmental authorities related to the risk of potential “greenwashing,” i.e., misleading information or false claims overstating potential ESG benefits. For example, in March 2021, the SEC established the Climate and ESG Task Force in the Division of Enforcement to identify and address potential ESG-related misconduct, including greenwashing. Certain non-governmental organizations and other private actors have also filed lawsuits under various securities and consumer protection laws alleging that certain ESG-statements, goals or standards were misleading, false or otherwise deceptive. As a result, we may face increased litigation risk from private parties and governmental authorities related to our ESGsustainability-related efforts. In addition, any alleged claims of greenwashing against us or others in our industry may lead to further negative sentiment and diversion of investments. In addition, certain institutions have also undertaken anti-ESG initiatives focused around their view of the politicization of ESG issues. We could face increasing costs as we attempt to comply with and navigate further regulatory ESG-relatedsustainability-related focus and scrutiny.
Risks related to our indebtedness
We are partially dependent on our Revolving Credit Facility and continued access to capital markets to successfully execute our operating strategies.
If we are unable to make capital expenditures or acquisitions because we are unable to obtain capital or financing on satisfactory terms, we may experience a decline in our oil and gas production rates and reserves. We are partially dependent on external capital sources to provide financing for certain projects. The availability and cost of these capital sources is cyclical, and these capital sources may not remain available, or we may not be able to obtain financing at a reasonable cost in the future. For example, due to the high levels of inflation in the U.S., the Federal Reserve and other central banks increased interest rates multiple times in 2022 and 2023 and have indicated that such increases will continue.2023. Such increasedelevated interest rates may increase the cost of capital and prevent us from being able to obtain debt financing at favorable rates, or at all, which would materially impact our operations. In addition, conditions in the global capital markets have been volatile due to the conflictconflicts in Ukraine, Israel and the Gaza Strip, the COVID-19 pandemic and recovery or otherwise, making terms for certain types of financing difficult to predict, and in certain cases, resulting in certain types of financing being unavailable. If our revenues decline as a result of lower oil, gas or NGL prices, operating difficulties, declines in production or for any other reason, we may have limited ability to obtain the capital necessary to sustain our operations at current levels. Our failure to obtain additional financing could result in a curtailment of our operations or not make acquisitions, which in turn could lead to a possible reduction in our oil or gas production, reserves and revenues, not having sufficient liquidity to meet future financial obligations and could negatively impact our results of operations.
We have incurred significant additional indebtedness during recent periods, which may impair our ability to raise further capital or impact our ability to service our debt.
We have incurred significant additional indebtedness during recent periods. Our additional indebtedness may impair our ability to raise further capital, including to expand our business, pursue strategic investments, and take advantage of financing or other opportunities that we believe to be in the best interests of the Company and our shareholders.
Our ability to make scheduled payments of the principal of, to pay interest on or to refinance our indebtedness depends on our future performance, which is subject to economic, financial, competitive and other factors beyond our control. Our business may not continue to generate cash flow from operations in the future sufficient to service our debt and make necessary capital expenditures. If we are unable to generate such cash flow, we may be required to adopt one or more alternatives, such as selling assets, curtailing spending, restructuring debt, or obtaining additional equity capital on terms that may be onerous or highly dilutive. Our ability to refinance our indebtedness will depend on the capital markets and our financial condition at such time. Our additional indebtedness may also impact our ability to service our debt and to comply with financial covenants and the other terms of our relevant credit arrangements, in which case our lenders might pursue available remedies up to and including terminating our credit arrangements and foreclosing on available collateral.
A reduction in the borrowing base under our Revolving Credit Facility as a result of periodic borrowing base redeterminations or otherwise may negatively impact our ability to fund our operations.
Our primary sources of liquidity are borrowings under our Revolving Credit Facility, and cash from operations.operations and proceeds from equity and debt offerings. The borrowing base under our Revolving Credit Facility is subject to semi-annual redeterminations which occur on or about April 1 and Oct 1 of each year. During a borrowing base redetermination, the lenders can unilaterally adjust the borrowing base and the borrowings permitted to be outstanding under our Revolving Credit Facility. The borrowing base depends on, among other things, projected revenues from, and asset values of, the oil and natural gas properties securing our loan, many of which factors are beyond our control.
If we experience liquidity concerns, we could face a downgrade in our debt ratings which could restrict our access to, and negatively impact the terms of, current or future financings or trade credit.
Our ability to obtain financings and trade credit and the terms of any financings or trade credit is, in part, dependent on the credit ratings assigned to our debt by independent credit rating agencies. We cannot provide assurance that any of our current ratings will remain in effect for any given period of time or that a rating will not be lowered or withdrawn entirely by a rating agency if, in its judgment, circumstances so warrant. Factors that may impact our credit ratings include debt levels, planned asset purchases or sales and near-term and long-term production growth opportunities, liquidity, asset quality, cost structure, product mix and commodity pricing levels. A ratings downgrade could adversely impact our ability to access financings or trade credit and increase our borrowing costs.
The borrowings under our Revolving Credit Facility expose us to interest rate risk.
We are exposed to interest rate risk associated with borrowings under our Revolving Credit Facility. Borrowings under the Revolving Credit Facility bear interest at either a U.S. dollar alternative base rate (based on the prime rate, the federal funds effective rate or an adjusted SOFR(as defined below)), plus an applicable margin or SOFR, plus an applicable margin, at the
election of the borrowers. As a result of our variable interest debt, our results of operations could be adversely affected by increases in interest rates.
Risks related to our common stock
If we fail to maintain an effective system of internal controls, we may not be able to accurately report our financial results or prevent fraud. As a result, stockholders could lose confidence in our financial reporting, which would harm our business and the trading price of our Class A Common Stock.
Effective internal controls are necessary for us to provide reliable financial reports, prevent fraud and operate successfully as a public company. If we cannot provide reliable financial reports or prevent fraud, our reputation and operating results would be harmed. We cannot be certain that our efforts to maintain internal controls will be successful, that we will be able to maintain adequate controls over our financial processes and reporting in the future or that we will be able to comply with our obligations under Section 404 of the Sarbanes-Oxley Act of 2002. Any failure to maintain effective internal controls, or difficulties encountered in implementing or improving internal controls, could harm our operating results or cause us to fail to meet our
reporting obligations. Ineffective internal controls could also cause investors to lose confidence in our reported financial information, which would likely have a negative effect on the trading price of our Class A Common Stock.
An active, liquid and orderly trading market for our Class A Common Stock may not be maintained.
Our Class A Common Stock trades on the NYSE under the ticker "CRGY." However, an active, liquid and orderly trading market for our Class A Common Stock may not be maintained. Active, liquid and orderly trading markets usually result in less price volatility and more efficiency in carrying out investors’ purchase and sale orders. Consequently, you may not be able to sell shares of our Class A Common Stock at prices equal to or greater than the assumed price attributable to such shares. The stock markets in general have experienced extreme volatility that has often been unrelated or disproportionate to the operating performance of particular companies. These broad market fluctuations may adversely affect the trading price of our Class A Common Stock. Securities class action litigation has often been instituted against companies following periods of volatility in the overall market and in the market price of a company’s securities. Such litigation, if instituted against us could result in very substantial costs, divert management’s attention and resources and harm our business, operating results and financial condition.
Future sales of our Class A Common Stock in the public market, or the perception that such sales may occur, could reduce the price of our Class A Common Stock, and any additional capital raised by us through the sale of equity or convertible securities may dilute your ownership in us.
We may sell additional shares of our Class A Common Stock in subsequent offerings. In addition, subject to certain limitations and exceptions, OpCo Unit Holders may redeem their OpCo Units (together with a corresponding number of shares of our Class B Common Stock) for shares of our Class A Common Stock (on a one-for-one basis, subject to conversion rate adjustments for stock splits, stock dividends and reclassification and other similar transactions) and then sell those shares of our Class A Common Stock. At December 31, 2022,2023, we have 48,282,16391,608,800 outstanding shares of Class A Common Stock and 118,645,32388,048,124 outstanding shares of Class B Common Stock. Independence’s former owners own all of the outstanding shares of our Class B Common Stock, representing approximately 71%49% of our total outstanding common stock. All such shares may be sold into the market in the future.
For example, we recentlyIn January 2023, the Company registered the offer and sale of up to an aggregate of $700 million of our securities and the resale of 128,927,826 shares of our Class A Common Stock (including shares of Class A Common Stock to be issued upon redemption of a corresponding number of Class B Common Stock) by certain selling stockholders.stockholders, including Independence's former owners, pursuant to the Registration Rights Agreement. In addition to sales pursuant to such registration by selling stockholders, certain of our significant stockholders, including such selling stockholders, may distributehave distributed shares of our securities that they hold to their investors who themselves may then sell into the public market. Any sales of such securities may depress the price of our shares. Furthermore, we filed a registration statementstatements with the SEC on Form S-8 providing for the registration of 947,4833,672,404 shares of our Class A Common Stock issued or reserved for issuance under the Equity Incentive Plan. Subject to the satisfaction of vesting conditions, the expiration of lock-up agreements and the requirements of Rule 144 under the Securities Act of 1933, as amended, shares registered under the registration statement on Form S-8 have been made available for resale immediately in the public market without restriction.
We cannot predict the size of future issuances of our Class A Common Stock or securities convertible into Class A Common Stock or the effect, if any, that future issuances and sales of shares of our Class A Common Stock will have on the market price of our Class A Common Stock. Sales of substantial amounts of our Class A Common Stock (including shares issued in connection with an acquisition), or the perception that such sales could occur, may adversely affect prevailing market prices of our Class A Common Stock.
If securities or industry analysts do not continue to publish research or reports about our business, if they adversely change their recommendations regarding our Class A Common Stock or if our operating results do not meet their expectations, the trading price of our Class A Common Stock could decline.
The trading market for our Class A Common Stock will be influenced by the research and reports that industry or securities analysts publish about us or our business. If one or more of these analysts cease coverage of us or fail to publish reports on us regularly, we could lose visibility in the financial markets, which in turn could cause our stock price or trading volume to decline. Moreover, if one or more of the analysts who cover us downgrades our Class A Common Stock or if our operating results do not meet their expectations, the trading price of our Class A Common Stock could decline.
Risks related to our financial condition
Our hedging activities could result in financial losses or could reduce our net income.
We enter into derivative instrument contracts for a significant portion of our existing production. We plan to continue the practice of entering into hedging arrangements to reduce near-term exposure to commodity prices, protect cash flow and returns and maintain our liquidity.
Our hedging contracts may result in substantial gains or losses. For example, we had realized commodity derivative losses of $779.3$153.7 million in 2022;2023; however, there can be no assurance that we will not realize additional future losses due to our hedging activities. In addition, if we enter into any hedging contracts and experience a sustained material interruption in our production, we might be forced to satisfy all or a portion of our hedging obligations without the benefit of the cash flows from our sale of the underlying physical commodity, resulting in a substantial diminution of our liquidity.
Our ability to use hedging transactions to protect us from future oil and natural gas price declines will be dependent upon oil and natural gas prices at the time we enter into future hedging transactions and our future levels of hedging and, as a result, our future net cash flows may be more sensitive to commodity price changes. In the future, we may be unable to hedge anticipated production volumes on attractive terms or at all, which would subject us to further potential commodity price uncertainty and could adversely affect our net cash provided by operating activities, financial condition and results of operations.
Our price hedging strategy and future hedging transactions will be determined at our discretion. The prices at which we hedge our production in the future will be dependent upon commodities prices at the time we enter into these transactions, which may be substantially higher or lower than current prices. Accordingly, our price hedging strategy may not protect us from significant declines in prices received for our future production. Conversely, our hedging strategy may limit our ability to realize cash flows from commodity price increases. It is also possible that a substantially larger percentage of our future production will not be hedged as compared with the next few years, which would result in our oil and natural gas revenues becoming more sensitive to commodity price fluctuations.
Our hedging transactions could expose us to counterparty credit risk.
Our hedging transactions expose us to risk of financial loss if a counterparty fails to perform under a derivative contract. This risk of counterparty non-performance is of particular concern given the historical disruptions that have occurred in the financial markets and the significant decline in oil and natural gas prices which could lead to sudden changes in a counterparty’s liquidity, and impair their ability to perform under the terms of the derivative contract. We are unable to predict sudden changes in a counterparty’s creditworthiness or ability to perform. Even if we do accurately predict sudden changes, our ability to negate the risk may be limited depending upon market conditions. Furthermore, the bankruptcy of one or more of our hedge providers or some other similar proceeding or liquidity constraint, might make it unlikely that we would be able to collect all or a significant portion of amounts owed to us by the distressed entity or entities.
During periods of falling commodity prices, our hedge receivable positions increase, which increases our exposure. If the creditworthiness of our counterparties deteriorates and results in their nonperformance, we could incur a significant loss.
Our cash flow will be entirely dependent upon the ability of our operating subsidiaries to make cash distributions to us, the amount of which will depend on various factors.
We currently anticipate that the only source of our earnings will be cash distributions from our operating subsidiaries. The amount of cash that our operating subsidiaries can distribute each quarter to their owners principally depends upon the amount of cash they generate from their operations, which will fluctuate from quarter to quarter based on, among other things:
•the amount of oil and natural gas our operating subsidiaries produce from existing wells;
•market prices of oil, natural gas and NGLs;
•any restrictions on the payment of distributions contained in covenants in the Revolving Credit Facility;
•our operating subsidiaries’ ability to fund their drilling and development plans;
•the levels of investments in each of our operating subsidiaries, which may be limited and disparate;
•the levels of operating expenses, maintenance expenses and general and administrative expenses;
•regulatory action affecting: (i) the supply of, or demand for, oil, natural gas, and NGLs, and (ii) operating costs and operating flexibility;
•prevailing economic conditions; and
•adverse weather conditions and natural disasters.
In addition, we do not wholly own all of our operating subsidiaries. As a result, if such operating subsidiaries make distributions, including tax distributions, they will also have to make distributions to their noncontrolling interest owners.
Certain employees of our operating subsidiaries have profits interests that may require substantial payouts and result in substantial accounting charges.
Certain employees of our operating subsidiaries have profits interests that may require substantial payouts, particularly upon liquidation of any such operating subsidiary or a disposition of assets, and may result in substantial accounting charges. Such payouts are linked to the achievement of certain return thresholds and would be paid in the event of such liquidation or disposition in a proportionate amount to the amount of cash received in respect of such liquidation or disposition. For additional information, please read "Part II., Item 7. Management's Discussion and Analysis of Financial Condition and Results of Operations—Liquidity and Capital Resources—General and Administrative Expense" and NOTE 13 – IncentiveEquity-Based Compensation ArrangementsAwards in the notes to our audited financial statements for the year ended December 31, 20222023 included herein.
Our only principal asset is our interest in OpCo; accordingly, we will depend on distributions and other payments from OpCo to pay taxes, make payments under the Management Agreement and cover our corporate and other overhead expenses.
We are a holding company and have no material assets other than our ownership interest in OpCo. We will have no independent means of generating revenue or cash flow. To the extent OpCo has available cash and subject to the terms of any current or future indebtedness agreements, we intend to cause OpCo (i) to make pro rata cash distributions to holders of OpCo Units, including us, in an amount sufficient to allow us to pay our taxes and to make payments under the Management Agreement and (ii) to make payments to us to reimburse us for our corporate and other overhead expenses. We generally expect OpCo to fund such distributions and payments out of available cash. When OpCo makes distributions, the holders of OpCo Units will be entitled to receive proportionate distributions based on their interests in OpCo at the time of such distribution. To the extent that we need funds and OpCo or its subsidiaries are restricted from making such distributions or payments under applicable law or regulation or under the terms of any current or future indebtedness agreements, or are otherwise unable to provide such funds, our liquidity and financial condition could be materially adversely affected.
Moreover, because we have no independent means of generating revenue, our ability to make tax payments and payments under the Management Agreement is dependent on the ability of OpCo to make distributions to us in an amount sufficient to cover our tax obligations and obligations under the Management Agreement. This ability, in turn, may depend on the ability of OpCo’s subsidiaries to make distributions to it. The ability of OpCo, its subsidiaries and other entities in which it directly or indirectly holds an equity interest to make such distributions will be subject to, among other things, (i) the applicable provisions of Delaware law (or other applicable jurisdiction) that may limit the amount of funds available for distribution and (ii) restrictions in relevant debt instruments issued by OpCo or its subsidiaries and other entities in which it directly or indirectly holds an equity interest.
Risks related to our governance structure
We are a “controlled company” within the meaning of NYSE rules and, as a result, qualify for and rely on exemptions from certain corporate governance requirements.
Because the Preferred Stockholder is the sole owner of our Non-Economic Series I Preferred Stock and accordingly has the exclusive right to appoint our Board of Directors, we are a controlled company under the Sarbanes-Oxley Act and NYSE rules. A controlled company does not need its board of directors to have a majority of independent directors or to form an independent compensation or nominating and corporate governance committee. As a controlled company, we will remain subject to rules of the Sarbanes-Oxley Act and the NYSE that require us to have an audit committee composed entirely of independent directors.
If at any time we cease to be a controlled company, we will take all action necessary to comply with the Sarbanes-Oxley Act and NYSE rules, including by appointingensuring that our Board of Directors has a majority of independent directors to the our Board of Directors and ensuring we have a compensation committeethat our Compensation Committee and a nominating and corporate governance committee,Nominating & Governance Committee are each composed entirely of independent directors, subject to a permitted “phase-in” period.
Our Certificate of Incorporation designates the Court of Chancery of the State of Delaware as the sole and exclusive forum for certain types of actions and proceedings that may be initiated by stockholders, which could limit our stockholders’ ability to obtain a favorable judicial forum for disputes with us or itsour directors, officers, employees or agents.
Our Certificate of Incorporation provides that, unless we consent in writing to the selection of an alternative forum, the Court of Chancery of the State of Delaware will, to the fullest extent permitted by applicable law, be the sole and exclusive forum for (i) any derivative action or proceeding brought on our behalf, (ii) any action asserting a claim of breach of a fiduciary duty owed by any of our directors, officers, employees or agents to us or our stockholders, (iii) any action asserting a claim arising pursuant to any provision of the Delaware General Corporation Law, our Certificate of Incorporation or our Bylaws, or (iv) any action asserting a claim against us that is governed by the internal affairs doctrine, in each such case subject to such Court of Chancery having personal jurisdiction over the indispensable parties named as defendants therein. Any person or entity purchasing or otherwise acquiring any interest in shares of our capital stock will be deemed to have notice of, and consented to, the provisions of our restated Certificate of Incorporation described in the preceding sentence. This choice of forum provision may limit a stockholder’s ability to bring a claim in a judicial forum that it finds favorable for disputes with us or our directors, officers, employees or agents, which may discourage such lawsuits against us and such persons. Alternatively, if a court were to find these provisions of our certificate of incorporation inapplicable to, or unenforceable in respect of, one or more of the specified types of actions or proceedings, we may incur additional costs associated with resolving such matters in other jurisdictions, which could adversely affect our business, financial condition or results of operations.
Our Preferred Stockholder’s significant voting power limits the ability of holders of our common stock to influence our business.
Our Preferred Stockholder is the sole holder of our Non-Economic Series I Preferred Stock and is expected to retain its ownership of our Non-Economic Series I Preferred Stock until such time as it ceases to own a number ofmore than 14,369,367 shares of our common stock equal to or greater than 50% of the shares of our Class A Common Stock, and our Class B Common Stock it owns, subject to certain exceptions. Our Non-Economic Series I Preferred Stock entitles the holder thereof to appoint our entire Board of Directors and to certain other to approval rights with respect to certain fundamental corporate actions, including debt incurrence in excess of 10% of then outstanding indebtedness, significant equity raises, preferred equity issuances, adoption of a shareholder rights plan, amendments of our certificate of incorporation and certain sections of its bylaws, a sale of all or substantially all of our assets, mergers involving us, removals of our Chief Executive Officer and the liquidation or dissolution of us. Unlike common equity in traditional corporate structures, holders of our common stock will not vote for the election of directors. As a result, holders of our common stock will have less ability to influence our business than would the holders of common equity in a traditional corporate structure.
The Preferred Stockholder’s controlling ownership position may have the effect of delaying or preventing changes in control or changes in management and may adversely affect the trading price of our Class A Common Stock to the extent investors perceive a disadvantage in owning stock of a company with a controlling shareholder.
Given its ownership of the our Non-Economic Series I Preferred Stock, the Preferred Stockholder would have to approve any potential acquisition of us. The existence of a controlling shareholder may have the effect of deterring hostile takeovers, delaying or preventing changes in control or changes in management, or limiting the ability of our other shareholders to approve transactions that they may deem to be in our best interests. Moreover, the Preferred Stockholder’s controlling ownership position may adversely affect the trading price of our Class A Common Stock to the extent investors perceive a disadvantage in owning stock of a company with a controlling shareholder, whether due to a decreased likelihood of a sale of us at a premium to the then-existing trading price of our Class A Common Stock or otherwise.
Our Certificate of Incorporation provides that the Preferred Stockholder is, to the fullest extent permitted by law, under no obligation to consider the separate interests of the other stockholders and will contain provisions limiting the liability of the Preferred Stockholder.
To the fullest extent permitted by applicable law, our Certificate of Incorporation contains provisions limiting the duties owed by the Preferred Stockholder and contain provisions allowing the Preferred Stockholder to favor its own interests and the interests of its controlling persons over us and the holders of our common stock. Our Certificate of Incorporation contains provisions stating that the Preferred Stockholder is under no obligation to consider the separate interests of the other
stockholders (including the tax consequences to such stockholders) in deciding whether or not to authorize us to take (or decline to authorize us to take) any action as well as provisions stating that the Preferred Stockholder shall not be liable to the other stockholders for damages or equitable relief for any losses, liabilities or benefits not derived by such stockholders in connection with such decisions.
Our Certificate of Incorporation contains a provision renouncing our interest and expectancy in certain corporate opportunities that may prevent us from receiving the benefit of certain corporate opportunities.
The “corporate opportunity” doctrine provides that corporate fiduciaries, as part of their duty of loyalty to the corporation and its stockholders, may not take for themselves an opportunity that in fairness should belong to the corporation. As such, a corporate fiduciary may generally not pursue a business opportunity which the corporation is financially able to undertake and which, by its nature, falls into the line of the corporation’s business and is of practical advantage to it, or in which the corporation has an actual or expectant interest, unless the opportunity is disclosed to the corporation and the corporation determines that it is not going to pursue such opportunity. Section 122(17) of the DGCL, however, expressly permits a Delaware corporation to renounce in its certificate of incorporation any interest or expectancy of the corporation in, or in being offered an opportunity to participate in, specified business opportunities or specified classes or categories of business opportunities that are presented to the corporation or its officers, directors or stockholders.
Our Certificate of Incorporation contains a provision that, to the maximum extent permitted under the law of the State of Delaware, we renounce any interest or expectancy in, or in being offered an opportunity to participate in, business opportunities that are from time to time presented to its officers, directors, the Preferred Stockholder or any partner, manager, member, director, officer, stockholder, employee or agent or affiliate of any such holder. We believe that this provision, which is intended to provide that certain business opportunities are not subject to the “corporate opportunity” doctrine, is appropriate, as the Preferred Stockholder and its affiliates invest in a wide array of companies, including companies with businesses similar to us. As a result of this provision, we may be not be offered certain corporate opportunities which could be beneficial to us and our stockholders.
Tax risks
If OpCo were to become a publicly traded partnership taxable as a corporation for U.S. federal income tax purposes, we and OpCo might be subject to potentially significant tax inefficiencies.
We intend to operate such that OpCo does not become a publicly traded partnership taxable as a corporation for U.S. federal income tax purposes. A “publicly traded partnership” is a partnership the interests of which are traded on an established securities market or are readily tradable on a secondary market or the substantial equivalent thereof. Under certain circumstances, redemptions of OpCo Units pursuant to the Redemption Right or other transfers of OpCo Units could cause OpCo to be treated as a publicly traded partnership. Applicable U.S. Treasury regulations provide for certain safe harbors from treatment as a publicly traded partnership, and we intend to operate such that redemptions or other transfers of OpCo Units qualify for one or more such safe harbors. For example, we intend to limit the number of holders of OpCo Units, and the OpCo LLC Agreement, provides for limitations on the ability of holders of OpCo Units to transfer their OpCo Units and provides us, as the managing member of OpCo, with the right to impose restrictions (in addition to those already in place) on the ability of holders of OpCo Units to redeem their OpCo Units pursuant to the Redemption Right to the extent we believe it is necessary to ensure that OpCo will continue to be treated as a partnership for U.S. federal income tax purposes.
If OpCo were to become a publicly traded partnership taxable as a corporation for U.S. federal income tax purposes, significant tax inefficiencies might result for us and OpCo, including as a result of our inability to file a consolidated U.S. federal income tax return with OpCo.
Changes to applicable tax laws and regulations mayor exposure to additional income tax liabilities could adversely affect our business, results of operations, financial condition and cash flow.flows.
We are subject to various complex evolving U.S. federal, state and local tax laws. U.S. federal, state and non-U.S.local tax laws, policies, statutes, rules, regulations or ordinances could be interpreted, changed, modified or applied adversely to us, in each case, possibly with retroactive effect, and may have an adverse effect on our business, results of operations, financial condition and cash flows.effect. In the past, legislation has been proposed that, if enacted into law, would make significant changes to U.S. federal and state income tax laws affecting the oil and natural gas industry, including (i) eliminating the immediate deduction for intangible drilling and development costs, (ii) the repeal of the percentage depletion allowance for oil and natural gas properties; and (iii) an extension of the amortization period for certain geological and geophysical expenditures. No accurate prediction can be made as to whether any such legislative changes will be proposed or enacted in the future or, if enacted, what the specific provisions or the effective date of any such legislation would be. These
proposedAny changes in the U.S. tax law, if adopted,laws, any significant variance in our interpretation of current tax laws or other similar changes that would imposea successful challenge of one or more of our positions by any taxing authority could result in additional taxtaxes on our activities, or reduce or eliminate deductions currently available with respect to natural gas and oil exploration, development or similar activities,which could adversely affect our business, results of operations, financial condition and cash flow.
A change of control could limit our use of net operating losses.
As of December 31, 2022, we had a net operating loss, or NOL, carry forward of approximately $121 million for federal and state income tax purposes, most of which is already limited by Section 382 of the Code. If we were to experience a further “ownership change,” as determined under Section 382 of the Code, our ability to offset taxable income arising after the ownership change with NOLs generated prior to the ownership change would be limited, possibly substantially. In general, an ownership change would establish an annual limitation on the amount of our pre-change NOLs that we could utilize to offset our taxable income in any future taxable year to an amount generally equal to the value of our stock immediately prior to the ownership change multiplied by an interest rate periodically promulgated by the IRS referred to as the long-term tax-exempt rate. In general, an ownership change will occur if there is a cumulative increase in the ownership of our stock totaling more than 50 percentage points by one or more “5% shareholders” (as defined in the Code) at any time during a rolling three-year period.flows.
General risks
Loss, failure or disruption of our and our operators’ information and computer systems could adversely affect our business.
We are heavily dependent on our information systems and computer based programs, including with respect to our well operations information, seismic data, electronic data processing and accounting data, and the availability and integrity of these programs and systems are essential for us to conduct our business and operations. If any of such programs or systems were to be subject to a cyberattack, to fail or to create erroneous information in our hardware or software network infrastructure, whether due to telecommunications failures, human error, natural disaster, fire, sabotage, hardware or software malfunction or defects, computer viruses, intentional acts of vandalism or terrorism or similar acts or occurrences, possible consequences include our loss of communication links, inability to find, produce, process and sell oil and natural gas and inability to automatically process commercial transactions or engage in similar automated or computerized business activities. Any such consequence could have a material and adverse effect on our business.
A terrorist attack or armed conflict or associated economic sanctions resulting therefrom could harm our business.
Terrorist activities, anti-terrorist efforts and other armed conflicts involving the United States or other countries may adversely affect the United States and global economies and could prevent us from meeting our financial and other obligations. If any of these events occur, the resulting political instability and societal disruption could reduce overall demand for oil and natural gas, potentially putting downward pressure on demand for our services and causing a reduction in our revenues. For example, on October 7, 2023, Hamas, a U.S. designated terrorist organization, launched a series of coordinated attacks from the Gaza Strip onto Israel. On October 8, 2023, Israel formally declared war on Hamas, and the armed conflict is ongoing as of the date of this filing. Oil and natural gas related facilities could be direct targets of terrorist attacks, and our operations could be adversely impacted if infrastructure integral to our customers’ operations is destroyed or damaged. Furthermore, beginning in February 2022, the United States and other countries began imposing meaningful sanctions targeting Russia as a result of actions taken by Russia in Ukraine. These sanctions and actions by Russia in response thereto may cause disruptions in international supply chains, financial activities and operations, the full costs, burdens, and limitations of which are currently unknown and may become significant. Costs for insurance and other security may increase as a result of these threats, and some insurance coverage may become more difficult to obtain, if available at all.
Our business could be negatively affected by security threats, including cyber security threats, and other disruptions and is subject to complex and evolving laws and regulations regarding privacy and data protection.
We face various security threats, including cyber security threats to gain unauthorized access to sensitive information or to render data or systems unusable; threats to the security of our facilities and infrastructure or third-party facilities and infrastructure, such as processing plants and pipelines, and threats from terrorist or criminal actors. The potential for such security threats has subjected our operations to increased risks that could have a material and adverse effect on our business. In particular, our implementation of various procedures and controls to monitor and mitigate security threats and to increase security for our information, facilities and infrastructure may result in increased capital and operating costs. Moreover, there can be no assurance that such procedures and controls will be sufficient to prevent security breaches from occurring, particularly given the unpredictability of the timing, nature, and scope of IT breaches, attacks, disruptions and other incidents. If any of these incidents were to occur, they could lead to losses of sensitive information, critical infrastructure or capabilities essential to our operations and could have a material adverse effect on our reputation, financial position, results of operations or cash flows. Cyber security attacks in particular are becoming more sophisticated and include, but are not limited to, installation
of malicious software, attempts to gain unauthorized access to data and systems, and other electronic security breaches that could lead to disruptions in critical systems, unauthorized release of confidential or otherwise protected information and
corruption of data. For example, in May 2021, Colonial Pipeline's digital systems were infected by a ransomware attack that caused the shutdown of the pipeline for several days and the payment of an approximate $4.4 million ransom. The U.S. government also has issued public warnings that indicate that energy assets might be specific targets of cybersecurity threats. These events could damage our reputation and lead to financial losses from remedial actions, loss of business or potential liability. While we maintain insurance that covers certain security and privacy breaches, we may not carry appropriate insurance or maintain sufficient coverage to compensate for all potential liability, and such insurance may not continue to be available to us on reasonable terms, if at all.
The regulatory environment surrounding data privacy and protection is constantly evolving and can be subject to significant change. New laws and regulations governing data privacy and the unauthorized disclosure of personal or confidential information pose increasingly complex compliance challenges and could potentially elevate our costs. Any failure to comply with these laws and regulations could result in significant penalties and legal liability. We continue to monitor and assess the impact of these laws, which in addition to penalties and legal liability, could impose significant costs for investigations and compliance, require us to change our business practices and carry significant potential liability for our business should we fail to comply with any such applicable laws.
We may be unable to protect our intellectual property rights or be subject to litigation if another party claims that we have infringed upon its intellectual property rights.
We rely on certain intellectual property rights in the operation of our business. The market success of our operations will depend, in part, on our ability to obtain and enforce our proprietary rights in certain technologies, to preserve rights in our trade secret and non-public information, and to operate without infringing the proprietary rights of others. We may not be able to successfully preserve these intellectual property rights in the future and these rights could be invalidated, circumvented, or challenged. If any of our intellectual property rights are determined to be invalid or unenforceable, our competitive advantages could be significantly reduced, allowing competition for our customer base to increase. The failure of our Company to protect our proprietary information and any successful intellectual property challenges or infringement proceedings against us could adversely affect our competitive position. The tools, techniques, methodologies, programs, and components we use in the operation of our business may infringe, or be alleged to infringe, upon the intellectual property rights of others. Infringement claims generally result in significant legal and other costs, and may distract management from running our core business. Royalty payments under a license from third parties, if available, or an obligation to redesign our operations, would increase our costs. Any of these developments could have a material adverse effect on our business, financial condition, and results of operations.
From time to time, we may be involved in legal proceedings that could result in substantial liabilities.
Similar to many oil and natural gas companies, we are from time to time involved in various legal and other proceedings, such as title, royalty or contractual disputes, regulatory compliance matters and personal injury or property damage matters, in the ordinary course of our business. Such legal proceedings are inherently uncertain and their results cannot be predicted. Regardless of the outcome, such proceedings could have a material and adverse impact on us because of legal costs, diversion of management and other personnel and other factors. In addition, resolution of one or more such proceedings could result in liability, loss of contractual or other rights, penalties or sanctions, as well as judgments, consent decrees or orders requiring a change in our business practices. Accruals for such liability, penalties or sanctions may be insufficient, and judgments and estimates to determine accruals or range of losses related to legal and other proceedings could change from one period to the next, and such changes could be material.
The inability of one or more of our customers to meet their obligations may materially and adversely affect our financial results.
We are subject to risk of loss resulting from nonpayment or nonperformance by our customers. Substantially all of our accounts receivable result from our oil and natural gas sales to a small number of third parties in the energy industry. This concentration of customers may affect our overall credit risk in that these entities may be similarly affected by changes in economic and other conditions. Furthermore, some of our customers may be highly leveraged and subject to their own operating and regulatory risks. If any of our key customers default on their obligations to us, our financial results could be materially and adversely affected.
We may be unable to dispose of non-strategic assets on attractive terms and may be required to retain liabilities for certain matters.
We regularly review our asset base to assess the market value versus holding value of existing assets with a view to optimizing returns on deployed capital. Our ability to dispose of assets could be affected by various factors, including the availability of buyers willing to purchase assets at prices acceptable to us. Sellers typically retain certain liabilities or agree to indemnify buyers for certain matters. The magnitude of any such retained liability or indemnification obligation may be difficult to quantify at the time of the transaction and ultimately may be material. Also, as is typical in divestiture transactions, third parties may be unwilling to release us from guarantees or other credit support provided prior to the sale of the divested assets. As a result, after a sale, we may remain secondarily liable for the obligations guaranteed or supported to the extent that the buyer of the assets fails to perform these obligations.
Our operations are subject to catastrophic losses, operational hazards and unforeseen interruptions and other disruptive risks for which we may not be adequately insured.
Our operations are subject to catastrophic losses, operational hazards, unforeseen interruptions and other disruptive risks such as natural disasters, adverse weather, accidents, maritime disasters (including those involving marine vessels/terminals), fires, explosions, hazardous materials releases, terror or cyberattacks, domestic vandalism, power failures, mechanical failures and other events beyond our control. These events could result in an injury, loss of life, property damage or destruction, as well as a curtailment or an interruption in our operations and may affect our ability to meet marketing commitments.
Item 1B. Unresolved Staff Comments
None.
Item 1C. Cybersecurity
Risk management and strategy
Our business is dependent upon our computer systems, devices and networks (including both operational and information technology) to collect, process and store the data necessary to conduct almost all aspects of our business, including the operation of our oil and natural gas assets and the recording and reporting of commercial and financial information. We recognize the importance of developing, implementing, and maintaining effective cybersecurity measures to safeguard our information systems and protect the confidentiality, integrity, and availability of our data. We maintain a cyber risk management program to identify, assess, manage, mitigate, and respond to cybersecurity threats.
Managing material risks and integrated overall risk management
Our cybersecurity risk management program incorporates various mechanisms to detect and monitor unusual network activity, as well as containment and incident response tools. We monitor issues that are internally discovered or externally reported that may affect our business, and have processes to assess those issues for potential cybersecurity impact or risk. We also leverage information from industry groups for benchmarking and awareness of best practices.
We have integrated our cybersecurity risk management program into our broader enterprise risk management framework. This integration is designed to make cybersecurity considerations an integral part of our decision-making processes at every level and we believe that this integration allows cybersecurity risks to be evaluated and addressed in alignment with our business objectives and operational needs.
We maintain an information security policy that applies to all employees and is intended to define best practices and safe behaviors for cybersecurity protection. We also use enterprise-wide tools and services to promote endpoint cybersecurity, data protection, password and login procedures, training and testing. We aim to train our employees at least quarterly on cybersecurity practices, including security awareness training and simulated phishing exercises.
In the event of an incident, we intend to follow our incident response plan, which outlines the steps to be followed from incident detection to mitigation, recovery and notification, including notifying functional areas (e.g., legal), as well as senior leadership and the Board of Directors, as appropriate.
The underlying controls of the cyber risk management program are based on the National Institute of Standards and Technology ("NIST") Cybersecurity Framework ("CSF") and the International Organization Standardization ("ISO") 27001 Information Security Management System Requirements. We have engaged a third-party cybersecurity vendor that reports directly to our corporate risk management committee, which is comprised of senior and management-level finance, accounting, legal and IT
employees. This third-party vendor performs an annual assessment of our cybersecurity risk management program against the NIST CSF. We assess third-party cybersecurity controls through a cybersecurity questionnaire and include security and privacy addendums to our contracts where applicable. We have a supply chain risk management program for the identification and remediation of our critical IT vendors.
Risks from cybersecurity threats
We face risks from cybersecurity threats that could have a material adverse effect on our business, financial condition, results of operations, cash flows, or reputation. As of the date of this report, though our service providers may have experienced certain cybersecurity incidents, we are not aware of any previous cybersecurity threats that have materially affected or are reasonably likely to materially affect the Company, including our business, financial condition, results of operations or cash flows. See "Part I., Item 1A. Risk Factors" for additional information about the risks to our business associated with a breach or compromise to our IT systems.
Board of Directors' oversight and management's role
The Audit Committee of the Board of Directors oversees our cybersecurity risk exposures and the steps taken by management to monitor and mitigate cybersecurity risks. Assessments of cybersecurity risks are communicated, not less than quarterly, with management by our corporate risk management committee, which holds responsibility for prioritizing the remediation of cybersecurity risk, evaluating the effectiveness of compensating controls, and evaluating the effectiveness of our control environment. Management briefs the Audit Committee on the effectiveness of our cybersecurity risk management program, typically on a quarterly basis. In addition, cybersecurity risks are reviewed by our Board of Directors, at least annually, as part of our corporate risk mapping exercise.
Item 2. Unregistered Sales of Equity Securities, Use of Proceeds, and Issuer Purchases of Equity Securities
Purchase of Equity Securities by the Issuer and Affiliated Purchasers
Our Board of Directors authorized a stock repurchase program on March 4, 2024 with an approved limit of $150.0 million and a two-year term. Repurchases may be of our Class A Common Stock or of OpCo Units (with the cancellation of a corresponding number of shares of our Class B Common Stock). Such repurchase may be made by Crescent or by OpCo, as applicable, and may be made from time to time in the open market, in a privately negotiated transaction, through purchases made in accordance with the Rule 10b5-1 of the Exchange Act or by such other means as will comply with applicable state and federal securities laws. The timing of any repurchases under the share repurchase program will depend on market conditions, contractual limitations and other considerations. The program may be extended, modified, suspended or discontinued at any time, and does not obligate us to repurchase any dollar amount or number of shares.
Item 3. Legal Proceedings
The CompanyWe may, from time to time, be involved in litigation and claims arising out of its operations in the normal course of business. We are currently unaware of any proceedings that, in the opinion of management, will individually or in the aggregate have a material adverse effect on our financial position, results of operations or cash flows.
The Company, asAs an owner and operator of oil and gas properties, iswe are subject to various federal, state and local laws and regulations relating to discharge of materials into, and protection of, the environment. These laws and regulations may, among other things, impose liability on the lessee under an oil and gas lease for the cost of pollution cleanup resulting from operations and subject the lessee to liability for pollution damages. In some instances, the Companywe may be directed to suspend or cease operations in the affected area. The Company maintainsWe maintain insurance coverage that is customary in the industry, although the Company iswe are not fully insured against all environmental risks.
On February 14, 2022, the New Mexico Energy, Minerals and Natural Resources Department’s Oil Conservation Division (“OCD”) issued a Notice of Violation to Contango for failure to file form C-115 according to required deadlines and having too many inactive wells. OCD proposed a civil penalty of $0.9 million, the plugging and abandonment of certain inactive wells, and the imposition of certain other restrictions on our operations. The parties discussed a resolution to the matter and on November 16, 2022, the OCD entered into a Stipulated Final Order (the “Order”) with Contango pursuant to which we agreed to pay a civil penalty of $0.1 million, the OCD withdrew the allegation of exceeding the number of inactive wells permitted and Contango separately agreed to pay a penalty of $500 for each day for each late or missing C-115 report from May 1, 2022 to April 30, 2023.
Item 4. Mine Safety Disclosures
Not applicable
Part II
Part II
Item 5. Market for Registrant's Common Equity, Related Stockholder Matters and Issuer Purchases of Equity Securities
Our Class A Common Stock is listed and traded on the NYSE under the ticker symbol "CRGY." As of January 31, 2022,February 29, 2024, we had 101171 Class A common stock shareholders of record and two Class B common stock shareholders of record. Our future dividends depend on our level of earnings, financial requirements and other factors and will be subject to approval by our Board of Directors, applicable law and the terms of our existing debt documents, including the Revolving Credit Facility and the indentures governing the 2026 Notes (as defined below) and the 2028 Notes (as defined below; together with the 2026 Notes, the "Senior Notes").Senior Notes.
Purchases of Equity Securities by the Issuer and Affiliated Purchasers
The following table sets forth information with respect to our repurchases of shares of Class A common stock during the quarter ended December 31, 2022.2023.
| | | | | | | | | | | | | | |
| Period | Total number of shares purchased (1) | Average price paid per share | Total number of shares purchased as part of publicly announced plans or programs | Approximate dollar value of shares that may yet be purchased under the plans or programs. |
10/1/20222023 - 10/31/20222023 | — | — | — | — |
11/1/20222023 - 11/30/20222023 | — | — | — | — |
12/1/20222023 - 12/31/20222023 | — | — | — | — |
| | | | |
Recent Sales of Unregistered Equity Securities
We had no sales of unregistered equity securities during the period covered by this Annual Report that were not previously reported in a Current Report on Form 8-K or Quarterly Report on Form 10-Q.
Item 6. Reserved
Item 7. Management's Discussion and Analysis of Financial Condition and Results of Operations
Management's Discussion and Analysis of Financial Condition and Results of Operations is intended to provide the reader of the financial statements with a narrative from the perspective of management on the financial condition, results of operations, liquidity and certain other factors that may affect the Company's operating results. The following discussion and analysis should be read in conjunction with the Combined and Consolidated Financial Statements and related Notes included in "Item 8. Financial Statements and Supplementary Data" of this Annual Report and also with "Part I., Item 1A. Risk Factors" of this Annual Report. The following information updates the discussion of our financial condition provided in our previous filings, and analyzes the changes in the results of operations between the years ended December 31, 20222023 and 2021.2022. Refer to our 20212022 Annual Report filed March 10, 20227, 2023 for discussion and analysis of the changes in results of operations between the years ended December 31, 20212022 and 2020.2021. The following discussion contains forward-looking statements that reflect our future plans, estimates, beliefs and expected performance. The forward-looking statements are dependent upon events, risks and uncertainties that may be outside our control. Our actual results could differ materially from those discussed in these forward- looking statements. Factors that could cause or contribute to such differences include, but are not limited to, commodity price volatility, capital requirements and uncertainty of obtaining additional funding on terms acceptable to the Company, realized oil, natural gas and NGL prices, the timing and amount of future production of oil, natural gas and NGLs, shortages of equipment, supplies, services and qualified personnel, as well as those factors discussed below and elsewhere in this Annual Report , particularly under “Risk Factors” and “Cautionary Statement Regarding Forward Looking statements,” all of which are difficult to predict. In light of these risks, uncertainties and assumptions, the forward-looking events discussed may not occur. We do not undertake any obligation to publicly update any forward-looking statements except as otherwise required by applicable law.
Business overview
We are a well-capitalizeddifferentiated U.S. independent energy company withcommitted to delivering value for shareholders through a disciplined growth through acquisition strategy and consistent return of capital. Our portfolio of low-decline, cash-flow oriented assets in key proven regions across the lower 48 states, focused in Texas and the Rockies.
both mid-cycle unconventional and conventional assets with a long reserve life and deep inventory of low-risk, high-return development locations in the Eagle Ford and Uinta basins.
Our approach employs a unique business modelleadership is an experienced team of investment, financial and industry professionals that combines an investor mindsetproven investment and deep operational expertise to pursueoperating expertise. For more than a cash flow-based investment mandatedecade, Crescent and its predecessors have executed on a consistent growth through acquisition strategy focused on operated working interests with an activecash flow, risk management strategy. We pursue our strategy throughand returns. Our Class A Common Stock trades on the production, development and acquisition of oil, natural gas and NGL reserves.NYSE under the symbol “CRGY.”
Geopolitical developments and economic environment
During the last several years, prices of crude oil, natural gas and NGLs have experienced periodic downturns and sustained volatility. In particular, the global spread of the COVID-19 virus during 2020 and 2021 had a negative impact on the global demand for oil and natural gas and caused significant commodity market volatility. While the increase in domestic vaccination programs and reduced spread of the COVID-19 virus has contributed to an improvement in the economy and higher realized prices for commodities, the current price environment remains uncertain as responses tovolatility, impacted by the COVID-19 pandemic and newly emerging variants of the virus continue to evolve. Given the dynamic nature of these events, we cannot reasonably estimate the period of time that the COVID-19 pandemic and related market conditions will persist. While we use derivative instruments to partially mitigate the impact of commodity price volatility, our revenues and operating results depend significantly upon the prevailing prices for oil and natural gas.
In addition, in February 2022, Russia launched a large-scalerecovery, Russia’s invasion of Ukraine that has led to significant armed hostilities. As a result, the United States, the United Kingdom, the member states of the European Union and other public and private actors have levied severe sanctions on Russian financial institutions, businesses and individuals. This conflict, and the resultingrelated sanctions have contributed to significant increasesimposed on Russia, Hamas' attack against Israel and volatilitythe ensuing conflict in the price for oilMiddle East, supply chain constraints and natural gas, with the posted price for WTI reaching a highrising interest rates and costs of over $120 per barrel in 2022. Such volatility may lead to a more difficult investing and planning environment for us and our customers. While the near-term impact of these events resulted in higher oil and gas prices in 2022, the geopolitical and macroeconomic consequences of this invasion and associated sanctions cannot be predicted, and such events, or any further hostilities in Ukraine or elsewhere, could severely impact the world economy and may adversely affect our financial condition.capital. Furthermore, the United States has experienced a significant inflationary environment in 2022 that, along with international geopolitical risks, has contributed to concerns of a potential recession that has caused oil and gas prices to retreat from their earlier highs in 2022 and has created further volatility. In 2023, OPEC announced production cuts to reduce the global oil supply. The actions of OPEC with respect to oil production levels and announcements of potential changes in such levels, including agreement on and compliance with production cuts, may result in further volatility in commodity prices and the oil and natural gas industry generally. Such volatility may lead to a more difficult investing and planning environment for us and our customers. While we use derivative instruments to partially mitigate the impact of commodity price volatility, our revenues and operating results depend significantly upon the prevailing prices for oil and natural gas.
In 2023, market concern regarding the health of the global banking sector, in which two U.S. bank failures occurred and large national and international banks experienced significant declines in market value, and any resultant recessionary effects contributed, among other factors, to a significant decline in the price for oil and natural gas, with the posted price for WTI reaching a low of $66.61 in March 2023, a level not seen since December 2021. Uncertainty regarding the going concern of certain banks, including the inability of banking and other financial services firms to access liquidity, resulted in significant disruptions to global markets, lower commodity prices and volatility thereof and negatively impacted our financial condition.
Due to the cyclical nature of the oil and gas industry, fluctuating demand for oilfield goods and services can put pressure on the pricing structure within our industry. As commodity prices rise, the cost of oilfield goods and services generally also increase, while during periods of commodity price declines, oilfield costs typically lag and do not adjust downward as fast as oil prices do. The U.S. inflation rate has been steadilybegan increasing since 2021.in 2021, peaked in the middle of 2022 and began to gradually decline in the second half of 2022 and into 2023. These inflationary pressures have resulted in and may result in additional increases to the costs of our oilfield goods, services and personnel, which in turn cause our capital expenditures and operating costs to rise. Sustained levels of high inflation have likewise caused the U.S. Federal Reserve and other central banks to increase interest rates, and to the extent elevated inflation remains, we may experience further cost increases for our operations, including oilfield services, labor costs and equipment if our drilling activity increases. Higher oil and natural gas prices may cause the costs of materials and services to continue to rise. We cannot predict any future trends in the rate of inflation and a significant increase in inflation, to the extent we are unable to recover higher costs through higher oil and natural gas prices and revenues, would negatively impact our business, financial condition and results of operations. See "Part I., Item 1A. Risk Factors—Risks related to the oil and natural gas industry and our operations—Continuing or worsening inflationary issues and associated changes in monetary policy have resulted in and may result in additional increases to the cost of our goods, services and personnel, which in turn cause our capital expenditures and operating costs to rise."
In August 2022, the IRA 2022 was signed into law. The IRA 2022 contains hundreds of billions of dollars in incentives for the development of renewable energy, clean hydrogen, clean fuels, electric vehicles and supporting infrastructure and carbon capture and sequestration, amongst other provisions. These incentives could further accelerate the transition of the U.S. economy away from the use of fossil fuels towards lower- or zero-carbon emissions alternatives, which could decrease demand for the oil and gas we produce and consequently materially and adversely affect our business and results of operations. In addition, the IRA 2022 imposes a federal fee on the emission of GHGsgreenhouse gases through a methane emissions charge, including onshore petroleum and natural gas production. The methane emissions charge will startis expected to be collected in 2025 based on calendar year 2024 emissions and the fee is based on certain thresholds established in the IRA 2022. The methane emissions charge could increase our operating costs and adversely affect our business and results of operations. See "Part I., Item 1A. Risk Factors" for additional information. Finally, the IRA 2022 includes a new corporate alternative minimum tax of 15% on the adjusted financial statement income ("AFSI") of corporations with average AFSI exceeding $1.0 billion over a three-year period. While we are evaluatingWe do not believe that the impact of the new corporate alternative minimum tax will have, we do not believe that it will have a material impact on our near-term taxes.
Equity transactions
In September 2022, Independence Energy Aggregator L.P. ("Aggregator"),
Equity transactions
2023 Class A Conversions
During 2023, an affiliate of KKR redeemed approximately 30.6 million OpCo Units in the entity through which certain affiliated entities hold their interests in us, exchanged 6.3 million units representing membership interests in OpCo (together withaggregate (and we cancelled a corresponding number of shares of our Class B Common Stock) for an equivalent number of shares of our Class A Common Stock and agreed to sell 5.75 million shares of our Class A Common Stock (the "Offering""2023 Class A Conversions"). Approximately 27.6 million of those shares of Class A Common Stock were distributed to certain of its legacy investors in privately-managed funds and accounts. The remaining 3.0 million shares of Class A Common Stock were sold at a price per share of $10.90, pursuant to Rule 144, through a broker-dealer. We did not receive any proceeds or incur any material expenses associated with the Class A Conversions.
September 2023 Underwritten Public Offering
In September 2023, we conducted an underwritten public offering of 12.7 million shares of Class A Common Stock at a price to the public of $15.00$12.25 per share or a net price of $14.10 per share after deducting the underwriters'(not including underwriter discounts and commissions. We did not receive any cash proceeds from the Offering. Concurrent with the closing of the Offering, we repurchased an aggregate of approximately 2.6 million OpCo Units from PT Independence for $36.2 million and cancelled a corresponding number of shares of our Class B Common Stock (the "Concurrent OpCo Unit Purchase," and, together with the Offering, the "Equity Transactions")commissions). As a result of the Equity Transactions, the total number of shares of our Class A Common Stock increased by 6.3 million shares, including 0.6This included 1.7 million shares of our Class A Common Stock that were not included as partissued upon the underwriters exercise of their 30-day option to purchase additional shares to cover over-allotments pursuant to the Offering but rather issued in exchange for sharesrelated underwriting agreement. We received net proceeds of Class B Common Stock and distributed in-kind by Aggregator. to affiliates, and the number of shares of our Class B Common Stock decreased by approximately 8.9 million. After$145.7 million from the Equity Transactions, shares of our Class A Common Stock represent approximately 29% of the outstanding shares of Class A Common StockIssuance, after deducting underwriting fees and Class B Common Stock, taken together, and we own approximately 29% of the outstanding OpCo Units. Redeemable noncontrolling interests decreased by $158.1 million while APIC increased by $121.8 million as a result of the Equity Transactions and to reflect the new ownership of OpCo.expenses.
Other transactions2023 Senior Notes Offerings
InOn February 1, 2023, we issued $400.0 million aggregate principal amount of 9.250% senior notes due 2028 (the "Original 2028 Notes") at par. In July 2023, we issued an additional $300.0 million aggregate principal amount of 9.250% senior notes due 2028 at 98.000% of par (the "July 2028 Notes"); in September 2023, we issued an additional $150.0 million aggregate principal amount of 9.250% senior notes due 2028 at 101.125% of par (the "September 2028 Notes"); and in December 2023, we issued an additional $150.0 million aggregate principal amount of 9.250% senior notes due 2028 at 102.125% of par (the "December 2028 Notes," and together with the Original 2028 Notes, the July 2028 Notes and the September 2028 Notes, the "2028 Notes"). The estimated proceedsThese four issuances of the offering were $391.3 million, after deducting2028 Notes are treated as a single series of securities under the initial purchasers' discountindenture governing the Original 2028 Notes, will vote together as a single class, and offering expenses. We usedhave substantially identical terms, other than the proceeds to repay a portionissue date and the issue price. The 2028 Notes interest is payable on February 15 and August 15 of outstanding borrowings under our revolving credit facility.each year and mature on February 15, 2028.
Acquisitions, divestitures and related reorganization
Acquisitions and related reorganization
In October 2023, we consummated the unrelated acquisition contemplated by the Purchase and Sale Agreement, dated as of August 22, 2023, between our subsidiary and an unaffiliated third party, pursuant to which we agreed to acquire certain incremental working interests in oil and natural gas properties (the "October Western Eagle Ford Acquisition," and together with the July Western Eagle Ford Acquisition, the "Western Eagle Ford Acquisitions") in certain of our existing Western Eagle Ford assets from the seller for aggregate cash consideration of approximately $235.1 million, including certain customary purchase price adjustments.
In July 2023, we consummated the acquisition contemplated by the Purchase and Sale Agreement, dated as of May 2, 2023, between our subsidiary and Comanche Holdings, LLC ("Comanche Holdings") and SN EF Maverick, LLC ("SN EF Maverick," and together with Comanche Holdings, the "Seller"), pursuant to which we agreed to acquire operatorship and incremental working interests (the "July Western Eagle Ford Acquisition") in certain of our existing Western Eagle Ford assets from the Seller for aggregate cash consideration of approximately $592.7 million, including capitalized transaction costs and certain final purchase price adjustments.
In March 2022, we consummated the acquisition contemplated by the Membership Interest Purchase Agreement dated February 15, 2022 (the “Purchase Agreement” and the transactions contemplated therein, the “Uinta Transaction”) between certain of our subsidiaries, including OpCo, and Verdun Oil Company II LLC, a Delaware limited liability company, pursuant to which we purchased all of the issued and outstanding membership interests of Uinta AssetCo, LLC, a Texas limited liability company that holds all development and production assets of, and certain obligations formerly held by EP Energy E&P Company, L.P. located in the State of Utah. Upon closing of the Uinta Transaction, we paid $621.3 million in cash consideration and
transaction fees and assumed certain commodity derivatives. The Uinta Transaction was funded with cash on hand and borrowings under our Revolving Credit Facility (as defined below). In connection with the closing of the Uinta Transaction, we entered into an amendment to our Revolving Credit Facility to, among other things, increase the borrowing base to $1.8 billion and the elected commitment amount to $1.3 billion (see NOTE 8 – Debt). We incurred financing costs of $13.4 million associated with this amendment, which are recorded as debt issuance costs within Other assets on the consolidated balance sheets.
Subsequent to the closing of the Uinta Transaction, we settled certain acquired oil commodity derivative positions and entered into new commodity derivative contracts for 2022 with a swap price of $75 per barrel for a net cost of $54.1 million, including restructuring fees, during the three months ended March 31, 2022.
In December 2021, we completed a series of transactions, pursuant to which the business of Contango and the business of Independence combined under a new publicly traded holding company named "Crescent Energy Company." Our Class A common stock, par value $0.0001 per share (“Class A Common Stock") is listed on the NYSE under the symbol “CRGY.” The combined company is structured as an “Up-C,” with all of our assets and operations (including those of Contango) indirectly held by our operating subsidiary, OpCo. Crescent Energy Company is a holding company, the sole material asset of which consists of OpCo Units, and is responsible for all operational, management and administrative decisions related to OpCo’s business. We are the sole managing member of OpCo. Crescent consolidates the financial results of OpCo and its subsidiaries. Former Contango shareholders own shares of Class A Common Stock, which have both voting and economic rights. The former owners of our predecessor, Independence Energy LLC, own economic, non-voting OpCo Units and corresponding shares of Class B common stock, par value $0.0001 per share ("Class B Common Stock," together with Class A Common Stock, the "Common Stock"), which shares of Class B Common Stock have voting (but no economic) rights. OpCo Units may be redeemed or exchanged for Class A Common Stock or, at our election, cash on the terms and conditions set forth in the Amended and Restated Limited Liability Company Agreement of OpCo.
In connection with the Merger Transactions, we underwent a reorganization (the “Crescent Reorganization”), whereby Independence merged with and into OpCo (the “Isla Merger”). The financial statements include the accounts of Independence
from the date of the Isla Merger, which is the date the Company obtained a controlling financial interest in Independence on a consolidated basis. Because the Isla Merger resulted in a change in the reporting entity, and in order to furnish comparative financial information prior to the Isla Merger, our financial statements have been retrospectively recast to reflect the historical accounts of Independence, our accounting predecessor (the "Predecessor"), on a combined basis.
In December 2021, we also acquired from an unrelated third-party certain operated producing oil and natural gas properties predominately located in the Central Basin Platform in Texas and New Mexico, with additional properties in the southwestern Permian and Powder River Basins, for total cash consideration of $60.4 million, including customary purchase price adjustments (the "Central Basin Platform Acquisition"). The purchase price was funded using cash on hand and borrowings under our Revolving Credit Facility (as defined in NOTE 8 – Debt).
In May 2021, certain of our consolidated subsidiaries redeemed the noncontrolling equity interests held in such subsidiaries by a third-party investor in exchange for the third-party investor’s proportionate share of the underlying oil and natural gas interests held by its consolidated subsidiaries (the "Noncontrolling Interest Carve-out"). Additionally, the third-party investor contributed cash of approximately $35.5 million to repay its proportionate share of the underlying debt outstanding under the revolving credit facilities of certain of our subsidiaries (the "Prior Credit Agreements") and other liabilities. The percentage ownership of these certain consolidated subsidiaries owned by the third-party investor ranges from 2.21% to 7.38%.
In April 2021, certain minority investors exchanged 100% of their interests in our Barnett basin natural gas assets for 9,508 of Class A units of our Predecessor, representing 0.77% of our consolidated ownership pursuant to the April 2021 Exchange. Since we already consolidate the results of these assets, this transaction was accounted for as an equity transaction and reflected as a reclassification from noncontrolling interests to members’ equity with no gain or loss recognized on the April 2021 Exchange.
In March 2021, we acquired a portfolio of oil and natural gas mineral assets located in the DJ Basin from an unrelated third-party operator for total consideration of $60.8 million (the "DJ Basin Acquisition"). The DJ Basin Acquisition was funded using cash on hand and borrowings under our Prior Credit Agreements. We accounted for the DJ Basin Acquisition as an asset acquisition.
In August 2020, we consummated the Titan Acquisition, pursuant to which we acquired of all of the outstanding membership interests in Liberty Energy LLC (and the oil and natural gas assets owned thereby) pursuant to the Contribution Agreement, dated as of July 19, 2020, by and among Independence Energy LLC, Liberty Energy Holdings, LLC (“Liberty Holdco”) and the other parties thereto, in consideration for the issuance of certain membership interests in Independence to an entity substantially owned by Liberty Holdco. Subsequent to the Titan Acquisition, we changed the name of Liberty Energy, LLC to Titan. Titan owns certain working interests in non-operated producing and non-producing oil and natural gas properties in the Permian, DJ and Eagle Ford Basins, which includes a 50% interest in the DJ Basin Erie Hub Gathering System. As a part of the Titan Acquisition, during the year ended December 31, 2020, we transferred $455.1 million of equity consideration in the form of 0.4 million Class A units of our Predecessor.
Divestitures
In November 2022, we entered into a definitive purchase and sale agreement with an unaffiliated third party to sell certain of our non-core producing properties and related oil and natural gas leases in Ector County in the Permian Basin in exchange for cash consideration, subject to customary purchase price adjustments, of $80.0 million. We closed the divestiture in December 2022 and recorded a loss of $0.9 million during the year ended December 31, 2022.
In April 2022, our equity method investment, Exaro Energy III, LLC ("Exaro"), entered into a purchase and sale agreement to sell its operations in the Jonah Field in Wyoming. During the year ended December 31, 2022, we received a distribution of $6.8 million primarily as a result of the sale.
In February 2022, we contributed all of the assets and prospects in the Gulf of Mexico formerly owned by Contango to Chama Energy LLC ("Chama") in exchange for a 9.4% interest in Chama, which interest was valued at $3.8 million. As a result, we derecognized the assets and liabilities that were contributed to Chama from our consolidated balance sheets and recorded an equity method investment for our interest in Chama, as well as a $4.5 million gain related to the deconsolidation of these assets and liabilities. John Goff, the Chairman of our Board of Directors, holds an approximate interest of 17.5% in Chama, and the remaining interests are held by other investors. Pursuant to the Limited Liability Company Agreement of Chama, we may be required to fund certain workover costs, and we will be required to fund plugging and abandonment costs related to the producing assets we contributed to Chama.
In December 2021, we entered into a purchase and sale agreement with an unaffiliated third-party that encompassed the sale of certain producing properties and oil and natural gas leases in Claiborne Parish, Louisiana in exchange for cash consideration, net of closing adjustments, of $4.3 million.
In May 2021, we executed a purchase and sale agreement with an unaffiliated third-party that encompassed the sale of certain producing properties and oil and natural gas leases in the Arkoma Basin in exchange for cash consideration, net of closing adjustments, of $22.1 million. We recognized a $8.8 million gain on sale of assets in our combined and consolidated statements of operations for the year ended December 31, 2021, as a result of the transaction.
StewardshipSustainability
We striveseek to be good stewards of others’ assets: our investors’ capital, the environmentstrategically improve assets we own and the communities in which we operate.acquire to deliver enhanced financial returns, operations and stewardship. We believe that this stewardship,being a responsible operator will produce better outcome, creating a net benefit for society and the environment, while delivering attractive returns for our success, requires an alignment with the interests of our stakeholders including our employees, investors, customers, suppliers and society at large.investors. We view exceptional sustainability performance as an opportunity to differentiate Crescent from its peers, mitigate risks and strengthen operational performance as well as benefit our stakeholders and the communities in which we operate. In September 2022, we released our 2021 ESG report. The report included benchmarks for measuring future performance, consistent with Crescent's commitment to aligning with the SASB and Task Force on Climate-related Financial Disclosures frameworks, noted the progress of our key ESG priorities and detailed our goals to reduce GHG emissions in support of an economy-wide transition to a net-zero world.
We are working to reduce Scope 1 GHG and methane emissions by implementing ambitious targets and eliminating routine flaring, among other initiatives. In February 2022, we joinedmembers of the Oil & Gas Methane Partnership ("OGMP") 2.0 Initiative, or OGMP 2.0, and received Gold Standard pathway ratings in 2022 and 2023 for our credible plan to enhance reporting ofmore accurately measure our methane emissions. Our inaugural OGMP 2.0 submission was ratedis the highest-level, "Gold Standard."United Nations Environment Programme's flagship oil and gas reporting and mitigation program and the leading industry standard for methane emissions reporting. We also established an ESGa Sustainability Advisory Council, an outside council comprising leading exports across key sustainability topics, to advise management and our Board of Directors on ESG-relatedsustainability-related issues. In November 2023, we released our third Sustainability Report which is available on Crescent’s website at https://www.crescentenergyco.com/#sustainability. However, please note that the contents of this Sustainability Report, and other materials on our website, are not incorporated into this Annual Report by reference.
How we evaluate our operations
We use a variety of financial and operational metrics to assess the performance of our oil, natural gas and NGL operations, including:
•Production volumes sold;
•Commodity prices and differentials;
•Operating expenses;
•Adjusted EBITDAX (non-GAAP); and
•Levered Free Cash Flow (non-GAAP)
Development program and capital budget
Our development program is designed to prioritize the generation of attractive risk-adjusted returns and meaningful free cash flow and is inherently flexible, with the ability to modify our capital program as necessary to react to the current market environment.
We expect to incur approximately $575 million to $650$550 - $625 million, excluding acquisitions, for our 20232024 capital program. The majority of our program is allocated to D&C, which approximately 85%90% is allocated to our operated assets primarily in the Eagle Ford and Uinta basins. We expect to fund our 20232024 capital program through cash flow from operations. Due to the flexible nature of our capital program and the fact that majority of our acreage is held by production, we could choose to defer a portion or all of these planned capital expenditures depending on a variety of factors, including, but not limited to, the success of our drilling activities, prevailing and anticipated prices for oil, gas and NGLs and resulting well economics, the availability of necessary equipment, infrastructure and capital, the receipt and timing of required regulatory permits and approvals, seasonal conditions, drilling and acquisition costs and the level of participation by other interest owners.
Sources of revenues
Our revenues are primarily derived from the sale of our oil, natural gas and NGL production and are influenced by production volumes and realized prices, excluding the effect of our commodity derivative contracts. Pricing of commodities are subject to
supply and demand as well as seasonal, political and other conditions that we generally cannot control. Our revenues may vary significantly from period to period as a result of changes in volumes of production sold or changes in commodity prices. The following table illustrates our production revenue mix for each of the periods presented:
| | Year Ended December 31, |
| 2022 | | 2021 | | 2020 |
| Year Ended December 31, | | | Year Ended December 31, |
| 2023 | | | 2023 | | 2022 | | 2021 |
| Oil | Oil | 66 | % | | 62 | % | | 69 | % | Oil | 76 | % | | 66 | % | | 62 | % |
| Natural gas | Natural gas | 25 | % | | 25 | % | | 21 | % | Natural gas | 16 | % | | 25 | % | | 25 | % |
| NGLs | NGLs | 9 | % | | 13 | % | | 10 | % | NGLs | 8 | % | | 9 | % | | 13 | % |
In addition, revenue from our midstream assets is supported by commercial agreements that have established minimum volume commitments. These midstream revenues comprise the majority of our midstream and other revenue. Midstream and other revenue accounts for 6%4% or less of our total revenues for each of the years ended December 31, 2023, 2022 2021 and 2020.2021.
Production volumes sold
The following table presents historical sales volumes for our properties:
| | Year Ended December 31, |
| 2022 | | 2021 | | 2020 |
| Year Ended December 31, | | | Year Ended December 31, |
| 2023 | | | 2023 | | 2022 | | 2021 |
| Oil (MBbls) | Oil (MBbls) | 21,865 | | | 13,237 | | | 13,132 | |
| Natural gas (MMcf) | Natural gas (MMcf) | 128,470 | | | 89,455 | | | 78,541 | |
| NGLs (MBbls) | NGLs (MBbls) | 7,110 | | | 6,099 | | | 5,078 | |
| Total (MBoe) | Total (MBoe) | 50,387 | | | 34,245 | | | 31,300 | |
| Daily average (MBoe/d) | Daily average (MBoe/d) | 138 | | | 94 | | | 86 | |
Total sales volume increased 16,1424,146 MBoe during the year ended December 31, 20222023 compared to 2021.2022. The increase is primarily due to the Merger Transactions, DJ Basin Acquisition and Central Basin Platform Acquisition (collectively, the "2021 Acquisitions")our Western Eagle Ford Acquisitions and our Uinta Transaction, which contributed an additional 10,777 MBoe and 7,740 MBoe, respectively. Sales volumes from our other assets decreased by 2,375 during the year ended December 31, 2022 compared to 2021, primarily as a result of the natural decline from our existing asset base, partially offset by new operated Eagle Ford well completions in 2022.Transaction.
Commodity prices and differentials
Our results of operations depend upon many factors, particularly the price of commodities and our ability to market our production effectively.
The oil and natural gas industry is cyclical and commodity prices can be highly volatile. In recent years, commodity prices have been subject to significant fluctuations. The outbreak offluctuations, impacted by the COVID-19 virus followed by certainpandemic and recovery, Russia’s invasion of Ukraine and the associated sanctions imposed on Russia, the Israel-Hamas conflict, actions taken by OPEC, caused crude oil prices to decline significantly beginning in the first halfinflation and increased U.S.
drilling activity. Uncertainty persists regarding OPEC’s actions, increased U.S. drilling, the continued effect from the COVID-19 pandemic, inflation and the armed conflictconflicts in Ukraine.Ukraine and Israel. Additionally, natural gas prices have declined in 2023 due in part to relatively mild winter and extended downtime at a liquified natural gas export facility, which has caused high levels of U.S. gas storage compared with historical averages. Finally, growing market concern regarding the health of the global banking sector and any resultant recessionary effects have contributed, among other factors, to a significant decline in the price for oil and natural gas in 2023 as compared to the prior period.
In order to reduce the impact of fluctuations in oil and natural gas prices on revenues, we regularly enter into derivative contracts with respect to a portion of the estimated oil, natural gas and NGL production through various transactions that fix the future prices received. We plan to continue the practice of entering into economic hedging arrangements to reduce near-term exposure to commodity prices, protect cash flow and corporate returns and maintain our liquidity.
The following table presents the percentages of our production that was economically hedged through the use of derivative contracts:
| | Year Ended December 31, |
| 2022 | | 2021 | | 2020 |
| Year Ended December 31, | | | Year Ended December 31, |
| 2023 | | | 2023 | | 2022 | | 2021 |
| Oil | Oil | 64 | % | | 81 | % | | 81 | % | Oil | 65 | % | | 64 | % | | 81 | % |
| Natural gas | Natural gas | 66 | % | | 83 | % | | 76 | % | Natural gas | 57 | % | | 66 | % | | 83 | % |
| NGLs | NGLs | 46 | % | | 67 | % | | 60 | % | NGLs | 16 | % | | 46 | % | | 67 | % |
The following table sets forth the average NYMEX oil and natural gas prices and our average realized prices for the periods presented:
| | Year Ended December 31, |
| 2022 | | 2021 | | 2020 |
| Year Ended December 31, | | | Year Ended December 31, |
| 2023 | | | 2023 | | 2022 | | 2021 |
| Oil (Bbl): | Oil (Bbl): | | | | | |
| Average NYMEX | |
| Average NYMEX | |
| Average NYMEX | Average NYMEX | $ | 94.23 | | | $ | 68.04 | | | $ | 39.40 | |
| Realized price (excluding derivative settlements) | Realized price (excluding derivative settlements) | 90.06 | | | 66.71 | | | 37.45 | |
Realized price (including derivative settlements) (1) | Realized price (including derivative settlements) (1) | 71.98 | | | 53.07 | | | 48.85 | |
| Natural Gas (Mcf): | Natural Gas (Mcf): | |
| Average NYMEX | Average NYMEX | $ | 6.64 | | | $ | 3.91 | | | $ | 2.08 | |
| Average NYMEX | |
| Average NYMEX | |
| Realized price (excluding derivative settlements) | Realized price (excluding derivative settlements) | 5.97 | | | 3.96 | | | 1.90 | |
| Realized price (including derivative settlements) | Realized price (including derivative settlements) | 3.42 | | | 3.06 | | | 2.32 | |
| NGLs (Bbl): | NGLs (Bbl): | |
| Realized price (excluding derivative settlements) | Realized price (excluding derivative settlements) | $ | 37.72 | | | $ | 30.42 | | | $ | 13.77 | |
| Realized price (excluding derivative settlements) | |
| Realized price (excluding derivative settlements) | |
| Realized price (including derivative settlements) | Realized price (including derivative settlements) | 29.70 | | | 19.15 | | | 16.61 | |
(1)For the years ended December 31, 2023 and 2022, the realized price excludes $61.5 million and $49.9 million impact from the settlement of acquired derivative contracts, respectively. For the year ended December 31, 2021, the realized price excludes the impact of the settlement of certain of our outstanding derivative oil commodity contracts associated with calendar years 2022 and 2023 for $198.7 million in June 2021. Subsequent to the settlement, we entered into new commodity derivative contracts at prevailing market prices.
Results of operations:
Year ended December 31, 20222023 compared to year ended December 31, 20212022
Revenues
The following table provides the components of our revenues, respective average realized prices and net sales volumes for the periods indicated:
| | Year Ended December 31, | |
| 2022 | | 2021 | | $ Change | | % Change |
| Year Ended December 31, | |
| 2023 | |
| 2023 | |
| 2023 | | | 2022 | | $ Change | | % Change |
| Revenues (in thousands): | Revenues (in thousands): | | | | | | | |
| Oil | |
| Oil | |
| Oil | Oil | $ | 1,969,070 | | | $ | 883,087 | | | $ | 1,085,983 | | | 123 | % | $ | 1,750,961 | | | $ | | $ | 1,969,070 | | | $ | | $ | (218,109) | | | (11 | | (11 | %) |
| Natural gas | Natural gas | 766,962 | | | 354,298 | | | 412,664 | | | 116 | % | Natural gas | 371,066 | | | 766,962 | | 766,962 | | | (395,896) | | (395,896) | | | (52 | | (52 | %) |
| Natural gas liquids | Natural gas liquids | 268,192 | | | 185,530 | | | 82,662 | | | 45 | % | Natural gas liquids | 192,870 | | | 268,192 | | 268,192 | | | (75,322) | | (75,322) | | | (28 | | (28 | %) |
| Midstream and other | Midstream and other | 52,841 | | | 54,062 | | | (1,221) | | | (2 | %) | Midstream and other | 67,705 | | | 52,841 | | 52,841 | | | 14,864 | | 14,864 | | | 28 | | 28 | % |
| Total revenues | Total revenues | $ | 3,057,065 | | | $ | 1,476,977 | | | $ | 1,580,088 | | | 107 | % | Total revenues | $ | 2,382,602 | | | $ | | $ | 3,057,065 | | | $ | | $ | (674,463) | | | (22 | | (22 | %) |
| Average realized prices, before effects of derivative settlements: | Average realized prices, before effects of derivative settlements: | | | | | | |
| Oil ($/Bbl) | Oil ($/Bbl) | $ | 90.06 | | | $ | 66.71 | | | $ | 23.35 | | | 35 | % |
| Oil ($/Bbl) | |
| Oil ($/Bbl) | | $ | 72.09 | | | $ | 90.06 | | | $ | (17.97) | | | (20 | %) |
| Natural gas ($/Mcf) | Natural gas ($/Mcf) | $ | 5.97 | | | $ | 3.96 | | | $ | 2.01 | | | 51 | % | Natural gas ($/Mcf) | $ | 2.84 | | | $ | | $ | 5.97 | | | $ | | $ | (3.13) | | | (52 | | (52 | %) |
| NGLs ($/Bbl) | NGLs ($/Bbl) | $ | 37.72 | | | $ | 30.42 | | | $ | 7.30 | | | 24 | % | NGLs ($/Bbl) | $ | 22.76 | | | $ | | $ | 37.72 | | | $ | | $ | (14.96) | | | (40 | | (40 | %) |
| Total ($/Boe) | Total ($/Boe) | $ | 59.62 | | | $ | 41.55 | | | $ | 18.07 | | | 43 | % | Total ($/Boe) | $ | 42.45 | | | $ | | $ | 59.62 | | | $ | | $ | (17.17) | | | (29 | | (29 | %) |
| Net sales volumes: | Net sales volumes: | |
| Oil (MBbls) | |
| Oil (MBbls) | |
| Oil (MBbls) | Oil (MBbls) | 21,865 | | | 13,237 | | | 8,628 | | | 65 | % | 24,287 | | | 21,865 | | 21,865 | | | 2,422 | | 2,422 | | | 11 | | 11 | % |
| Natural gas (MMcf) | Natural gas (MMcf) | 128,470 | | | 89,455 | | | 39,015 | | | 44 | % | Natural gas (MMcf) | 130,629 | | | 128,470 | | 128,470 | | | 2,159 | | 2,159 | | | 2 | | 2 | % |
| NGLs (MBbls) | NGLs (MBbls) | 7,110 | | | 6,099 | | | 1,011 | | | 17 | % | NGLs (MBbls) | 8,475 | | | 7,110 | | 7,110 | | | 1,365 | | 1,365 | | | 19 | | 19 | % |
| Total (MBoe) | Total (MBoe) | 50,387 | | | 34,245 | | | 16,142 | | | 47 | % | Total (MBoe) | 54,533 | | | 50,387 | | 50,387 | | | 4,146 | | 4,146 | | | 8 | | 8 | % |
| Average daily net sales volumes: | Average daily net sales volumes: | |
| Oil (MBbls/d) | Oil (MBbls/d) | 60 | | | 36 | | | 24 | | | 67 | % |
| Oil (MBbls/d) | |
| Oil (MBbls/d) | | 67 | | | 60 | | | 7 | | | 12 | % |
| Natural gas (MMcf/d) | Natural gas (MMcf/d) | 352 | | | 245 | | | 107 | | | 44 | % | Natural gas (MMcf/d) | 358 | | | 352 | | 352 | | | 6 | | 6 | | | 2 | | 2 | % |
| NGLs (MBbls/d) | NGLs (MBbls/d) | 19 | | | 17 | | | 2 | | | 12 | % | NGLs (MBbls/d) | 23 | | | 19 | | 19 | | | 4 | | 4 | | | 21 | | 21 | % |
| Total (MBoe/d) | Total (MBoe/d) | 138 | | | 94 | | | 44 | | | 47 | % | Total (MBoe/d) | 149 | | | 138 | | 138 | | | 11 | | 11 | | | 8 | | 8 | % |
Oil revenue. Oil revenue increased $1,086.0decreased $218.1 million, or 123%11%, in 20222023 compared to 2021.2022. This increasedecrease was driven by higherlower realized oil prices that resulted in an increasea decrease of $510.4$436.2 million (an increase(a decline of 35%20% per Bbl) and partially offset by a $575.6$218.1 million increase from higher sales volumes (24(7 MBbl/d, or 67%12%). The increase in sales volumes was primarily related todriven by our 2021Western Eagle Ford Acquisitions and our Uinta Transaction, which contributed an additional 3,569 MBbls and 5,371 MBbls, respectively, partially offset by the natural decline from our existing asset base of 312 MBbls.Transaction.
Natural gas revenue. Natural gas revenue increased $412.7decreased $395.9 million, or 116%52%, in 20222023 compared to 2021.2022. This increasedecrease was driven by higherlower realized natural gas prices that resulted in an increasea decrease of $258.2$408.8 million (an increase(a decline of 51%52% per Mcf) and a $154.5$12.9 million increase from higher sales volumes (107(6 MMcf/d, or 44%2%). The increase in sales volumes was primarily relateddue to our 2021Western Eagle Ford Acquisitions and our Uinta Transaction which contributed an additional 34,497 MMcf and 14,201 MMcf, respectively,but these increases were partially offset by the natural decline from our existing asset base of 9,683 MMcf.and downtime at a natural gas processing plant in 2023.
NGL revenue. NGL revenue increased $82.7decreased $75.3 million, or 45%28%, in 20222023 compared to 2021.2022. This increasedecrease was driven by higherlower realized NGL prices that resulted in an increasea decrease of $51.9$126.8 million (an increase(a decline of 24%40% per Bbl) and a $30.8$51.5 million increase from higher sales volumes (2(4 MBbl/d, or 12%21%). The increase in sales volumes was primarily related todriven by our 2021 Acquisitions which contributed an additional 1,458 MBbls, partially offset by the natural decline from our existing asset base of 447 MBbls.Western Eagle Ford Acquisitions.
Midstream and other revenue. Midstream and other revenue decreased $1.2increased $14.9 million, or 2%28%, in 20222023 compared to 2021, driven primarily by the production decline from some of our legacy asset areas.2022, due to additional oil blending revenue in 2023.
Expenses
The following table summarizes our expenses for the periods indicated and includes a presentation on a per Boe basis, as we use this information to evaluate our performance relative to our peers and to identify and measure trends we believe may require additional analysis:
| | Year Ended December 31, | |
| 2022 | | 2021 | | $ Change | | % Change |
| Year Ended December 31, | |
| 2023 | |
| 2023 | |
| 2023 | | | 2022 | | $ Change | | % Change |
| Expenses (in thousands): | Expenses (in thousands): | | | | | | | |
| Operating expense | |
| Operating expense | |
| Operating expense | Operating expense | $ | 1,013,298 | | | $ | 609,722 | | | $ | 403,576 | | | 66 | % | $ | 1,078,339 | | | $ | | $ | 1,013,298 | | | $ | | $ | 65,041 | | | 6 | | 6 | % |
| Depreciation, depletion and amortization | Depreciation, depletion and amortization | 532,926 | | | 312,787 | | | 220,139 | | | 70 | % | Depreciation, depletion and amortization | 675,782 | | | 532,926 | | 532,926 | | | 142,856 | | 142,856 | | | 27 | | 27 | % |
| Impairment expense | Impairment expense | 142,902 | | | — | | | 142,902 | | | NM* | Impairment expense | 153,495 | | | 142,902 | | 142,902 | | | 10,593 | | 10,593 | | | NM* | | NM* |
| General and administrative expense | General and administrative expense | 84,990 | | | 78,342 | | | 6,648 | | | 8 | % | General and administrative expense | 140,918 | | | 84,990 | | 84,990 | | | 55,928 | | 55,928 | | | 66 | | 66 | % |
| Other operating costs | Other operating costs | (1,216) | | | (7,613) | | | 6,397 | | | (84 | %) | Other operating costs | 9,328 | | | (1,216) | | (1,216) | | | 10,544 | | 10,544 | | | (867 | | (867 | %) |
| Total expenses | Total expenses | $ | 1,772,900 | | | $ | 993,238 | | | $ | 779,662 | | | 78 | % | Total expenses | $ | 2,057,862 | | | $ | | $ | 1,772,900 | | | $ | | $ | 284,962 | | | 16 | | 16 | % |
| Selected expenses per Boe: | Selected expenses per Boe: | | | | | | |
| Operating expense, excluding production and other taxes | $ | 15.38 | | | $ | 14.62 | | | $ | 0.76 | | | 5 | % |
| Production and other taxes | 4.73 | | | 3.18 | | | 1.55 | | | 49 | % |
| Operating expense | |
| Operating expense | |
| Operating expense | | $ | 19.77 | | | $ | 20.11 | | | $ | (0.34) | | | (2) | % |
| | Depreciation, depletion and amortization | |
| | Depreciation, depletion and amortization | |
| | Depreciation, depletion and amortization | Depreciation, depletion and amortization | 10.58 | | | 9.13 | | | 1.45 | | | 16 | % | 12.39 | | | 10.58 | | 10.58 | | | 1.81 | | 1.81 | | | 17 | | 17 | % |
|
*NM = Not meaningful.
Operating expense. Total operating expense increased $403.6$65.0 million, or 66%6%, in 20222023 compared to 2021,2022, driven primarily by the following factors:
(i)Lease and asset operating expenses increased $228.0$64.5 million, or 79%12%, in 20222023 compared to 2021.2022. Additionally, lease and asset operating expense per Boe increased $1.82$0.40 per Boe from $8.45$10.27 per Boe to $10.27$10.67 per Boe. This $228.0$64.5 million increase was driven primarily by (i) higher production in 2022 compared to 2021, due in part to (i) the 2021from our Western Eagle Ford Acquisitions and our Uinta Transaction which contributed $151.4 million and $28.5 million to the increase, respectively, (ii) general inflationary costs across our assets and (iii) certain costs that move in tandem with oil prices, such as CO2 purchase costshigher-cost residue gas purchases related to our CO2 flood assetincreased natural gas prices in Wyoming. These contractually commodity indexed operating expenses move in tandem with oil commodity prices, and as oil prices increase, higher contractually commodity-linked operating costs arethe west coast pricing market. Higher cost residue gas was more than offset by higher realizations.realized pricing.
(ii)Gathering, transportation and marketing expense decreased $10.0increased $58.1 million, or 5%33%, in 20222023 compared to 2021.2022. Additionally, gathering, transportation and marketing expense per Boe decreased $1.95increased $0.80 per Boe from $5.46$3.51 per Boe to $3.51$4.31 per Boe. This increase was driven primarily by our Western Eagle Ford Acquisitions and our Uinta Transaction.
(iii)Production and other taxes decreased $75.4 million, or 32%, in 2023 compared to 2022 and decreased $1.74 per Boe, or 37%, to $2.99 per Boe. This decrease was driven primarily by lower sulfur processing and transportation expenses.
(iii)Production and other taxes increased $129.4 million, or 119%, in 2022 compared to 2021 and increased 1.55 per Boe, or 49%, to $4.73 per Boe. This increase was driven primarily by higher oil and natural gas revenues, which increaseddecreased the tax base upon which our production and other taxes are calculated.
(iv)Workover expense increased $56.0decreased $8.4 million in 20222023 compared to 2021,2022, and increased $1.01decreased $0.26 per Boe from $0.32$1.33 per Boe to $1.33$1.07 per Boe. This increasedecrease was driven primarily caused by (i) higher well workover activities that meet our internal return thresholds due to the higherlower commodity price environment, (ii) general inflationary costs across our assets and (iii) additional costs from our 2021 Acquisitions and Uinta Transaction, which contributed $29.8 million and $9.4 million to the increase, respectively. The 2021 Acquisitions increase includes additional costs related to a standard turnaround at our natural gas processing plant in Wyoming.activity.
(v)Midstream operating expense increased $0.1$26.3 million, or 1%195%, in 20222023 compared to 2021,2022, primarily due to increased crude oil blending expense. The additional crude oil blending expense is more than offset by additional oil blending revenue included as part of our Midstream and other revenue.
Depreciation, depletion and amortization. Depreciation, depletion and amortization increased $220.1$142.9 million, or 70%27%, in 20222023 compared to 2021,2022, driven primarily by $104.7 million and $119.5 million of additional depreciation, depletion and amortization due toincreased production from our 2021Western Eagle Ford Acquisitions and Uinta Transaction.Transaction and increased production from new well completions.
Impairment expense. During the yearyears ended December 31, 2023 and 2022, we evaluated our Goodwill and Oil and natural gas properties, Goodwill and Investments in equity affiliates and determined that certain amounts were impaired. WeAs a result of our evaluations, we recorded impairment charges totaling $153.5 million in 2023, including $149.6 million related to Oil and natural gas properties and $3.9 million related to Investments in equity affiliates, and $142.9 million as a result of our evaluations,in 2022, including $77.7 million related to Goodwill and $65.2 million related to Oil and natural gas properties. We did not record an impairment expense during the year ended December 31, 2021.
General and administrative expense. General and administrative expense ("G&A") increased $6.6$55.9 million, or 8%66%, in 20222023 compared to 2021,2022, driven primarily by $14.3(i) an increase in non-cash equity-based compensation expense of $44.9 million related(includes additional catch up expense of $30.4 million due to change in estimate) and (ii) higher expense payable under the Management Agreement with KKR Energy Assets Manager LLC, which is the pro-rata portion of the Manager Compensation borne by us. The Management Agreement was entered intoincrease in connection withManager Compensation and our non-cash equity-based compensation expense is due to an increase in public ownership of Class A Common Stock as a result of (i) our Equity Issuance, which also increased the Merger Transactionsannual Manager Compensation by $2.2 million to $55.5 million annually, and we incurred expense(ii) share redemptions for our Class A Common Stock completed in 2021 only for the period from December 7, 2021 through December 31, 2021.second and fourth quarters of 2023 and the second half of 2022, which did not increase the overall Manager Compensation, but does increase the portion of the Manager Compensation borne by us. While only the portion of the Manager Compensation borne by us impacts our consolidated statements of operations, we include the full Manager Compensation in the calculation of Adjusted EBITDAX and Levered Free Cash Flow (the difference between the Manager Compensation and the amount presented in G&A is represented by “Certain-redeemable noncontrolling interest distributions made by OpCo related to Manager Compensation”). This increase wasThese increases were partially offset by $16.0$2.0 million in lower transaction and nonrecurring expenses.
| | Year Ended December 31, | |
| 2022 | | 2021 | | $ Change | | % Change |
| Year Ended December 31, | |
| 2023 | |
| 2023 | |
| 2023 | | | 2022 | | $ Change | | % Change |
| General and administrative expense (in thousands) | General and administrative expense (in thousands) | | | | | |
| Recurring general and administrative expense | |
| Recurring general and administrative expense | |
| Recurring general and administrative expense | |
| Recurring general and administrative expense | |
| Recurring general and administrative expense | |
| Recurring general and administrative expense | |
| Recurring general and administrative expense | |
| Recurring general and administrative expense | |
| Recurring general and administrative expense | Recurring general and administrative expense | $ | 38,863 | | | $ | 14,359 | | | $ | 24,504 | | | 171 | % | $ | 51,949 | | | $ | | $ | 38,863 | | | $ | | $ | 13,086 | | | 34 | | 34 | % |
| Transaction and nonrecurring expenses | Transaction and nonrecurring expenses | 8,064 | | | 24,064 | | | (16,000) | | | (66 | %) | Transaction and nonrecurring expenses | 6,033 | | | 8,064 | | 8,064 | | | (2,031) | | (2,031) | | | (25 | | (25 | %) |
| Equity-based compensation | Equity-based compensation | 38,063 | | | 39,919 | | | (1,856) | | | (5 | %) | Equity-based compensation | 82,936 | | | 38,063 | | 38,063 | | | 44,873 | | 44,873 | | | 118 | | 118 | % |
| Total general and administrative expense | Total general and administrative expense | $ | 84,990 | | | $ | 78,342 | | | $ | 6,648 | | | 8 | % | Total general and administrative expense | $ | 140,918 | | | $ | | $ | 84,990 | | | $ | | $ | 55,928 | | | 66 | | 66 | % |
| General and administrative expense per Boe: | General and administrative expense per Boe: | | | | | | |
| Recurring general and administrative expense | Recurring general and administrative expense | $ | 0.77 | | | $ | 0.42 | | | $ | 0.35 | | | 83 | % |
| Recurring general and administrative expense | |
| Recurring general and administrative expense | | $ | 0.95 | | | $ | 0.77 | | | $ | 0.18 | | | 23 | % |
| Transaction and nonrecurring expenses | Transaction and nonrecurring expenses | 0.16 | | | 0.70 | | | (0.54) | | | (77 | %) | Transaction and nonrecurring expenses | 0.11 | | | 0.16 | | 0.16 | | | (0.05) | | (0.05) | | | (31 | | (31 | %) |
| Equity-based compensation | Equity-based compensation | 0.76 | | | 1.17 | | | (0.41) | | | (35 | %) | Equity-based compensation | 1.52 | | | 0.76 | | 0.76 | | | 0.76 | | 0.76 | | | 100 | | 100 | % |
Other operating costs. Other operating costs include exploration expense and gain on sale of assets. Other operating costs were negative in the years ended December 31,increased by $10.5 million compared to 2022, and 2021 asprimary driven by a result of gains$4.6 million lower gain on asset sales. Other operating costs reduced our 2022 and 2021 expenses by $1.2 million and $7.6 million, respectively. For the year ended December 31, 2022 we had gains from salessale of assets of $4.6recognized in 2023, and $5.9 million offset by $3.4 million of exploration expense. For the year ended December 31, 2021 we had gains from sales of assets of $8.8 million offset by $1.2 million ofin higher exploration expenses.
Interest expense. In 2022,2023, we incurred interest expense of $95.9$145.8 million, as compared to $50.7$95.9 million in 2021,2022, a 89%52% increase. The increase was primarily driven by higher average debt balances driven by the Western Eagle Ford Acquisitions and higher interest rates associated with the issuance of the 20262028 Notes and an increase in our weighted average debt outstanding during the period.Revolving Credit Facility.
Gain (loss) on derivatives
We have entered into derivative contracts to manage our exposure to commodity price risks that impact our revenues and interest rate risks on our variable interest rate debt. The following table presents our total unrealized and realized gain (loss) on derivatives for the periods presented:
| | Year Ended December 31, | |
| 2022 | | 2021 | | $ Change | | % Change |
| Year Ended December 31, | |
| 2023 | |
| 2023 | |
| 2023 | | | 2022 | | $ Change | | % Change |
| Gain (loss) on derivatives (in thousands) | Gain (loss) on derivatives (in thousands) | | | | | |
| Gain (loss) on commodity derivatives | Gain (loss) on commodity derivatives | $ | (676,902) | | | $ | (865,994) | | | $ | 189,092 | | | (22 | %) |
| Gain (loss) on interest rate derivatives | — | | | (26) | | | 26 | | | (100 | %) |
| Gain (loss) on commodity derivatives | |
| Gain (loss) on commodity derivatives | |
| Gain (loss) on commodity derivatives | |
| Gain (loss) on commodity derivatives | |
| Gain (loss) on commodity derivatives | |
| Gain (loss) on commodity derivatives | |
| Gain (loss) on commodity derivatives | |
| Gain (loss) on commodity derivatives | | $ | 166,980 | | | $ | (676,902) | | | $ | 843,882 | | | (125 | %) |
| | Gain (loss) on derivatives | Gain (loss) on derivatives | $ | (676,902) | | | $ | (866,020) | | | $ | 189,118 | | | (22 | %) |
| Gain (loss) on derivatives | |
| Gain (loss) on derivatives | | $ | 166,980 | | | $ | (676,902) | | | $ | 843,882 | | | (125 | %) |
Our lossgain on commodity derivatives in 2022, decreased $189.1during 2023, changed by $843.9 million, or 22%125%, compared to 2021from a loss during 2022 primarily due to changes in commodity prices relative to our strike price. In addition, in June 2021, we incurred additional losses on derivatives from the settlement of certain derivative oil contracts for $198.7 million.
Income from equity affiliates
Our income from equity method investments was $0.4 million in 2023 and $4.6 million in 20222022. The decrease was primarily due to a gain on sale of substantially all of the oil and gas assets held by Exaro.Exaro in 2022.
Income tax benefit (expense)
For the majority of the year ended December 31, 2021, we were organized as a limited liability company and treated as a flow-through entity for U.S. federal income tax purposes. As a result, the tax provision for the year ended December 31, 2021 was minimal. Subsequent to the Merger Transactions, we are a corporation that is subject to U.S. federal and state income tax on our allocable share of any taxable income from OpCo. For the years ended December 31, 20222023 and 20212022 we recognized income tax expense of $36.3$23.2 million and a income tax benefit of $0.3$36.3 million, respectively, for an effective tax rate of 7%6.7% and less than 1%7.0%, respectively. Our effective tax rate is lower than the U.S. federal statutory income tax rate of 21% primarily due to effects of removing income and losses related to our noncontrolling interests and redeemable noncontrolling interests. Our effective tax rate decreased in 2023 due to additional permanent items and an increased valuation allowance in 2022 offset by the increase to our ownership of OpCo in 2023.
Adjusted EBITDAX (non-GAAP) and Levered Free Cash Flow (non-GAAP)
Adjusted EBITDAX and Levered Free Cash Flow are supplemental non-GAAP financial measures used by our management to assess our operating results.results and liquidity. See “—Non-GAAP financial measures” section below for their definitions and application.
The following table presents a reconciliationtables present reconciliations of Adjusted EBITDAX (non-GAAP) and Levered Free Cash Flow (non-GAAP) to net income (loss), and Levered Free Cash Flow (non-GAAP) to Net cash provided by operating activities, the most directly comparable financial measuremeasures calculated in accordance with GAAP:
| | Year Ended December 31, | |
| 2022 | | 2021 | | $ Change | | % Change |
| Year Ended December 31, | |
| 2023 | |
| 2023 | |
| 2023 | | | 2022 | | $ Change | | % Change |
| (in thousands) | (in thousands) | | | |
| Net income (loss) | |
| Net income (loss) | |
| Net income (loss) | |
| Net income (loss) | |
| Net income (loss) | |
| Net income (loss) | |
| Net income (loss) | |
| Net income (loss) | |
| Net income (loss) | |
| Net income (loss) | |
| Net income (loss) | |
| Net income (loss) | |
| Net income (loss) | |
| Net income (loss) | |
| Net income (loss) | Net income (loss) | $ | 480,600 | | | $ | (432,227) | | | $ | 912,827 | | | NM* | $ | 321,991 | | | $ | | $ | 480,600 | | | $ | | $ | (158,609) | | | (33) | | (33) | % |
| Adjustments to reconcile to Adjusted EBITDAX: | Adjustments to reconcile to Adjusted EBITDAX: | |
| Interest expense | Interest expense | 95,937 | | | 50,740 | | |
| Realized (gain) loss on interest rate derivatives | — | | | 7,373 | | |
| Interest expense | |
| Interest expense | |
| | Income tax expense (benefit) | |
| | Income tax expense (benefit) | |
| | Income tax expense (benefit) | Income tax expense (benefit) | 36,291 | | | (306) | | |
| Depreciation, depletion and amortization | Depreciation, depletion and amortization | 532,926 | | | 312,787 | | |
| Depreciation, depletion and amortization | |
| Depreciation, depletion and amortization | |
| Exploration expense | |
| Exploration expense | |
| Exploration expense | Exploration expense | 3,425 | | | 1,180 | | |
| Non-cash (gain) loss on derivatives | Non-cash (gain) loss on derivatives | (102,358) | | | 330,368 | | |
| Non-cash (gain) loss on derivatives | |
| Non-cash (gain) loss on derivatives | |
| Impairment expense | |
| Impairment expense | |
| Impairment expense | Impairment expense | 142,902 | | | — | | |
| Non-cash equity-based compensation expense | Non-cash equity-based compensation expense | 38,063 | | | 39,919 | | |
| Non-cash equity-based compensation expense | |
| Non-cash equity-based compensation expense | |
| Gain on sale of assets | |
| Gain on sale of assets | |
| Gain on sale of assets | Gain on sale of assets | (4,641) | | | (8,794) | | |
| Other (income) expense | Other (income) expense | (949) | | | (120) | | |
| Other (income) expense | |
| Other (income) expense | |
| Certain redeemable noncontrolling interest distributions made by OpCo related to Manager Compensation | |
| Certain redeemable noncontrolling interest distributions made by OpCo related to Manager Compensation | |
| Certain redeemable noncontrolling interest distributions made by OpCo related to Manager Compensation | Certain redeemable noncontrolling interest distributions made by OpCo related to Manager Compensation | (39,070) | | | (2,706) | | |
Transaction and nonrecurring expenses (1) | Transaction and nonrecurring expenses (1) | 34,051 | | | 23,149 | | |
Early settlement of derivative contracts (2) | — | | | 198,688 | | |
Transaction and nonrecurring expenses (1) | |
Transaction and nonrecurring expenses (1) | |
| | Settlement of acquired derivative contracts | |
| | Settlement of acquired derivative contracts | |
| | Settlement of acquired derivative contracts | |
| Adjusted EBITDAX (non-GAAP) | |
| Adjusted EBITDAX (non-GAAP) | |
| Adjusted EBITDAX (non-GAAP) | Adjusted EBITDAX (non-GAAP) | $ | 1,217,177 | | | $ | 520,051 | | | $ | 697,126 | | | 134 | % | $ | 1,022,748 | | | $ | | $ | 1,167,248 | | | $ | | $ | (144,500) | | | (12) | | (12) | % |
| Adjustments to reconcile to Levered Free Cash Flow: | Adjustments to reconcile to Levered Free Cash Flow: | |
| Interest expense, excluding non-cash deferred financing cost amortization | Interest expense, excluding non-cash deferred financing cost amortization | (87,043) | | | (40,551) | | |
| Realized (gain) loss on interest rate derivatives | — | | | (7,373) | | |
| Interest expense, excluding non-cash deferred financing cost amortization | |
| Interest expense, excluding non-cash deferred financing cost amortization | |
| | Current income tax benefit (expense) | |
| | Current income tax benefit (expense) | |
| | Current income tax benefit (expense) | Current income tax benefit (expense) | (3,113) | | | (629) | | |
| Tax-related redeemable noncontrolling interest distributions made by OpCo | Tax-related redeemable noncontrolling interest distributions made by OpCo | (18,160) | | | — | | |
| Tax-related redeemable noncontrolling interest distributions made by OpCo | |
| Tax-related redeemable noncontrolling interest distributions made by OpCo | |
| Development of oil and natural gas properties | |
| Development of oil and natural gas properties | |
| Development of oil and natural gas properties | Development of oil and natural gas properties | (624,880) | | | (194,828) | | |
| Levered Free Cash Flow (non-GAAP) | Levered Free Cash Flow (non-GAAP) | $ | 483,981 | | | $ | 276,670 | | | $ | 207,311 | | | 75 | % |
| Levered Free Cash Flow (non-GAAP) | |
| Levered Free Cash Flow (non-GAAP) | | $ | 310,204 | | | $ | 434,052 | | | $ | (123,848) | | | (29 | %) |
*NM = Not meaningful.
(1)Transaction and nonrecurring expenses of $22.6 million during the year ended December 31, 2023 were primarily related to the Western Eagle Ford Acquisitions and the Merger Transactions. Transaction and nonrecurring expenses of $34.1 million duringfor the year ended December 31, 2022 were primarily related to (i) legal, consulting, transition service agreement costs, related restructuring of acquired derivative contracts and other fees incurred for the Uinta Transaction and Merger Transactions, (ii) severance costs subsequent to the Merger Transactions, (iii) merger integration costs and (iv) acquisition and debt transaction related costs. Transaction and nonrecurring expenses of $23.1 million for the year ended December 31, 2021 were primarily related to legal, consulting
and other fees incurred for (i) the Noncontrolling Interest Carve-out, (ii) the April 2021 Exchange and (iii) the Merger Transactions.
(2)Represents the settlement in June 2021 of certain outstanding derivative oil commodity contracts for open positions associated with calendar years 2022 and 2023. Subsequent to the settlement, we entered into new commodity derivative contracts at prevailing market prices. | | | | | | | | | | | | | | | | | | | | | | | |
| Year Ended December 31, | | | | |
| 2023 | | 2022 | | $ Change | | % Change |
| (in thousands) | | | | | | | |
| Net cash provided by operating activities | $ | 935,769 | | | $ | 1,012,372 | | | $ | (76,603) | | | (8) | % |
| Changes in operating assets and liabilities | (72,380) | | | 8,258 | | | | | |
| Restructuring of acquired derivative contracts | — | | | 51,994 | | | | | |
| Certain redeemable noncontrolling interest distributions made by OpCo related to Manager Compensation | (30,563) | | | (39,070) | | | | | |
| Tax-related redeemable noncontrolling interest contributions (distributions) made by OpCo | (753) | | | (18,160) | | | | | |
| Transaction and nonrecurring expenses | 22,632 | | | 34,051 | | | | | |
| Other adjustments and operating activities | 33,815 | | | 9,487 | | | | | |
| | | | | | | |
| Development of oil and natural gas properties | (578,316) | | | (624,880) | | | | | |
| Levered Free Cash Flow (non-GAAP) | $ | 310,204 | | | $ | 434,052 | | | $ | (123,848) | | | (29) | % |
Adjusted EBITDAX increaseddecreased by $697.1$144.5 million or 134%12% in 2022,2023, compared to 2021,2022, driven primarily by higher revenue associated with our oil, natural gas and NGL production as a result of (i)lower realized prices, and (ii) sales volume driven by our 2021 Acquisitions, our Uinta Transaction and increased completions activity in the Eagle Ford. This increase was partially offset by a corresponding increase in operating costs due to higheradditional production volumes and commodity prices, as well as higher realized losses on our commodity derivatives in 2022 compared to 2021.Adjusted EBITDAX generated by the Western Eagle Ford Acquisitions and the Uinta Transaction.
Levered Free Cash Flow increaseddecreased by $207.3$123.8 million or 75%29% in 20222023 compared to 2021,2022, driven primarily by increaseddecreased Adjusted EBITDAX of $697.1$144.5 million, partially offset by $430.1$46.6 million of increaseddecreased capital expenditures relatedexpenditures. Our reinvestment rate was 65% in 2023 compared to 2022 development activities following the increase in commodity prices.a reinvestment rate of 59% during 2022.
Liquidity and capital resources
Our primary sources of liquidity are cash flow from operations, proceeds from equity and debt offerings and borrowings under a senior secured reserve-based revolving credit agreement (as amended, restated, amended and restated or otherwise modified to date, the Revolving“Revolving Credit Facility.Facility") with Wells Fargo Bank, N.A., as administrative agent for the lenders and letter of credit issuer, and the lenders from time to time party thereto. Our primary useexpected uses of capital isare for dividends to shareholders, our share repurchase program, debt repayment, development of our existing assets share repurchases and opportunistic acquisitions.
Our development program is designed to prioritize the generation of meaningful free cash flow and attractive risk-adjusted returns, and is inherently flexible, with the ability to scale our capital program as necessary to react to the existing market environment and ongoing asset performance. See “—Development program and capital budget” above for additional discussion of our capital program.
We plan to continue our practice of entering into economic hedging arrangements to reduce the impact of the near-term volatility of commodity prices and the resulting impact on our cash flow from operations. A key tenet of our focused risk management effort is an active economic hedge strategy to mitigate near-term price volatility while maintaining long-term exposure to underlying commodity prices. Our commodity derivative program focuses on entering into forward commodity contracts when investment decisions regarding reinvestment in existing assets or new acquisitions are finalized, targeting economic hedges for a portion of expected production generated by the capital investment as well as adding incremental derivatives to our production base over time. Our active derivative program allows us to preserve capital and protect margins and corporate returns through commodity cycles. For information regarding risks related to our derivative program, see "Part I., Item 1A. Risk Factors".
The following table presents our cash balances and outstanding borrowings at the end of each period presented:
| | At December 31, |
| At December 31, | | | At December 31, |
| (in thousands) | (in thousands) | 2022 | | 2021 | (in thousands) | 2023 | | 2022 |
| Cash and cash equivalents | Cash and cash equivalents | $ | — | | | $ | 128,578 | |
| Long-term debt | Long-term debt | 1,247,558 | | | 1,030,406 | |
Based on our planned capital spending, our forecasted cash flows and projected levels of indebtedness, we expect to maintain compliance with the covenants under our debt agreements. Further, based on current market indications, we expect to meet in the ordinary course of business other contractual cash commitments to third parties pursuant to the various agreements subsequently described under the heading “Contractual obligations,” recognizing we may be required to meet such commitments even if our business plan assumptions were to change.
Cash flows
The following table summarizes our cash flows for the periods indicated:
| | Year Ended December 31, |
| Year Ended December 31, | |
| Year Ended December 31, | |
| Year Ended December 31, | |
| (in thousands) | |
| (in thousands) | |
| (in thousands) | (in thousands) | 2022 | | 2021 | | 2020 | |
| Net cash provided by operating activities | Net cash provided by operating activities | $ | 1,012,372 | | | $ | 233,147 | | | $ | 411,028 | | |
| Net cash provided by operating activities | |
| Net cash provided by operating activities | |
| Net cash used in investing activities | |
| Net cash used in investing activities | |
| Net cash used in investing activities | Net cash used in investing activities | (1,124,344) | | | (244,595) | | | (124,940) | | |
| Net cash (used in) provided by financing activities | Net cash (used in) provided by financing activities | (7,841) | | | 105,145 | | | (272,089) | | |
| Net cash (used in) provided by financing activities | |
| Net cash (used in) provided by financing activities | |
Net cash provided by operating activities. Net cash provided by operating activities for the year ended December 31, 2022 increased2023 decreased by $779.2$76.6 million, or 334%8%, compared to 2021,2022, primarily due to higher Adjusted EBITDAX and the restructuring of certain derivative contracts in 2021,lower realized pricing partially offset by working capital changes. In addition, net cash provided by operating activity for the year ended December 31, 2022, was impacted by a $52.0 million restructuring of certain oil commodity derivative contracts acquired in connection with the Uinta Transaction.
Net cash used in investing activities. Net cash used in investing activities for the year ended December 31, 20222023 increased by $879.7$274.5 million, or 360%24%, compared to 2021,2022. Our Acquisitions of oil and gas properties of $849.3 million in 2023 was driven primarily dueby our Western Eagle Ford Acquisitions while the 2022 acquisitions of $626.6 million was driven by the Uinta Transaction. Our cash expenditures related to $511.5 million of additional acquisitionsthe Development of oil and natural gas properties in 2022, drivendecreased by the Uinta Transaction,$11.4 million, and an additional $437.1we had $64.3 million of cash development capital expenditures as we have resumed reinvestment activity in light of higher commodity prices. The increase from our acquisitions and capital expenditures was partially offset by $67.5 million of higherlower proceeds from our 2022 assets sales.the sale of oil and natural gas properties.
Net cash provided by (used in) financing activities. Net cash used inprovided by financing activities for the year ended December 31, 20222023 was $7.8$456.5 million, as compared to $105.1an increase of $464.3 million, net cash provideddriven by financing activitiesadditional debt borrowings in 2021. This decrease was primarily due to cash outflows for $27.52023 of $233.4 million, of dividends to$145.7 million from our Class A shareholdersEquity Issuance and $129.2$53.5 million of distributions to our redeemable noncontrolling interests in 2022. In addition we had ahigher cash outflow of $36.2 millionin 2022 related to the Concurrent OpCo Unit Purchase. These net cash inflows in 2022 were partially offset by cash inflows from our debt transactions of $195.2 million.redeemable NCI repurchases and tax distributions.
Debt agreements
Senior Notes
On February 1, 2023, we issued $400.0 million aggregate principal amount of the Original 2028 Notes. The estimated proceedsNotes at par. In July 2023 we issued an additional $300.0 million aggregate principal amount of the offering were $391.3July 2028 Notes at 98.000% of par, in September 2023 we issued an additional $150.0 million after deductingaggregate principal amount of the initial purchasers' discountSeptember 2028 Notes at 101.125% of par, and offering expenses. We usedin December 2023 we issued an additional $150.0 million aggregate principal amount of the proceeds to repayDecember 2028 Notes at 102.125% of par. These four issuances of the 2028 Notes are treated as a portionsingle series of our outstanding credit facility balance.securities under the indenture governing the Original 2028 Notes, will vote together as a single class, and have substantially identical terms, other than the issue date and the issue price. The 2028 Notes bear interest at an annual rate of 9.250%, which is payable on February 15 and August 15 of each year and mature on February 15, 2028.
We may, at our option, redeem all or a portion of the 2028 Notes at any time on or after February 15, 2025 at certain redemption prices. We may also redeem up to 40% of the aggregate principal amount of the 2028 Notes before February 15, 2025 with an amount of cash not greater than the net proceeds that we raise in certain equity offerings at a redemption price equal to 109.250% of the principal amount of the 2028 Notes being redeemed, plus accrued and unpaid interest, if any, to, but excluding the redemption date. In addition, prior to February 15, 2025, we may redeem some or all of the 2028 Notes at a price equal to 100% of the principal amount thereof, plus a “make-whole” premium, plus accrued and unpaid interest, if any, to, but excluding the redemption date.
On May 6, 2021, Crescent Energy Finance LLC ("Crescent Finance")we issued $500.0 million aggregate principal amount of senior notes due 2026 at par (the "Original 2026 Notes"). In February 2022, Crescent Financewe issued an additional $200.0 million aggregate principal amount of our senior notes due 2026 at 101% of par (the "Additional 2026 Notes" and, together with the Original 2026 Notes, the "2026 Notes"). Both issuances of the 2026 Notes are treated as a single series and vote together as a single class, and have identical terms and conditions, other than the issue date, the issue price and the first interest payment. The 2026 Notes bear interest at an annual rate of 7.250%, which is payable on May 1 and November 1 of each year and mature on May 1, 2026.
We may, at our option, redeem all or a portion of the 2026 Notes at any time on or after May 1, 2023 at certain redemption prices. We may also redeem up to 40% of the aggregate principal amount of the 2026 Notes before May 1, 2023 with an amount of cash not greater than the net proceeds that we raise in certain equity offerings at a redemption price equal to 107.250% of the principal amount of the 2026 Notes being redeemed, plus accrued and unpaid interest, if any, to, but excluding the redemption date. In addition, prior to May 1, 2023, we may redeem some or all of the 2026 Notes at a price equal to 100% of the principal amount thereof, plus a “make-whole” premium, plus accrued and unpaid interest, if any, to, but excluding the redemption date.
The Senior Notes are our senior unsecured obligations and the notesSenior Notes and the related guarantees issued in connection with the issuance of the Senior Notes rank equally in right of payment with the borrowings under the Revolving Credit Facility and allany of itsour other future senior indebtedness and senior to any of itsour future subordinated indebtedness. The Senior Notes are guaranteed on a senior unsecured basis by each of our existing and future subsidiaries that will guarantee the Revolving Credit Facility. The Senior Notes and the guarantees are effectively subordinated to all of our secured indebtedness (including all borrowings and other obligations under the Revolving Credit Facility) to the extent of the value of the collateral securing such indebtedness, and structurally subordinated in right of payment to all existing and future indebtedness and other liabilities (including trade payables) of any future subsidiaries that do not guarantee the Senior Notes.
The indentures governing the Senior Notes contain covenants that, among other things, limit the ability of our restricted subsidiaries to: (i) incur or guarantee additional indebtedness or issue certain types of preferred stock; (ii) pay dividends or distributions in respect of its equity or redeem, repurchase or retire its equity or subordinated indebtedness; (iii) transfer or sell assets; (iv) make investments; (v) create certain liens; (vi) enter into agreements that restrict dividends or other payments from any non-Guarantor restricted subsidiary to it; (vii) consolidate, merge or transfer all or substantially all of its assets; (viii) engage in transactions with affiliates; and (ix) create unrestricted subsidiaries.
If we experience certain kinds of changes of control accompanied by a ratings decline, holders of the Senior Notes may require us to repurchase all or a portion of their notes at certain redemption prices. The Senior Notes are not listed, and we do not intend to list the Senior Notes in the future, on any securities exchange, and currently there is no public market for the Senior Notes.
Revolving Credit Facility
In connection with the issuance of the 2026 Notes in May 2021, Crescent Finance entered into the Revolving Credit Facility. The Revolving Credit Facility matures on September 23, 2027. At December 31, 2022,2023, we had $559.4$23.5 million of outstanding borrowings under the Revolving Credit Facility and $9.8$14.4 million in outstanding letters of credit. Ourcredit, our elected commitment amount was $1.3 billion, and we had $730.8$1,262.1 million of available borrowings under the Revolving Credit Facility as of December 31, 2022.borrowings.
Borrowings under the Revolving Credit Facility bear interest at either a (i) U.S. dollar alternative base rate (based on the prime rate, the federal funds effective rate or an adjusted secured overnight financing rate ("SOFR"), plus an applicable margin or (ii) SOFR, plus an applicable margin, at the election of the borrowers. The applicable margin varies based upon our borrowing base utilization then in effect. The fee payable for the unused revolving commitments is 0.50% per year. Our weighted average interest rate on loan amounts outstanding as of December 31, 2023 and 2022 was 9.75% and 6.98%., respectively.
The borrowing base under the Revolving Credit Facility was $2.0 billion as of December 31, 2022.2023. The borrowing base is subject to semi-annual scheduled redeterminations on or about April 1 and October 1 of each year, as well as (i) elective borrowing base interim redeterminations at our request not more than twice during any consecutive 12-month period or the required lenders not more than once during any consecutive 12-month period and (ii) elective borrowing base interim redeterminations at our request following any acquisition of oil and natural gas properties with a purchase price in the aggregate of at least 5.0% of the then effective borrowing base. The borrowing base will be automatically reduced upon (a) the issuance of certain permitted junior lien debt and other permitted additional debt, (b) the sale or other disposition of borrowing base properties if the aggregate net present value, discounted at 9% per annum (“PV-9”) of such properties sold or disposed of is in excess of 5.0% of the borrowing base then in effect and (c) early termination or set-off of swap agreements (x) the administrative agent relied on in determining the borrowing base or (y) if the value of such swap agreements so terminated is in excess of 5.0% of the borrowing base then in effect.
The obligations under the Revolving Credit Facility remain secured by first priority liens on substantially all of our and the guarantors’ tangible and intangible assets, including without limitation, oil and natural gas properties and associated assets and equity interests owned by us and such guarantors. In connection with each redetermination of the borrowing base, we must maintain mortgages on at least 85% of the PV-9 of the oil and gas properties that constitute borrowing base properties. Our domestic direct and indirect subsidiaries are required to be guarantors under the Revolving Credit Facility, subject to certain exceptions.
The Revolving Credit Facility contains certain covenants that restrict the payment of cash dividends, certain borrowings, sales of assets, loans to others, investments, merger activity, commodity swap agreements, liens and other transactions without the adherence to certain financial covenants or the prior consent of our lenders. We are subject to (i) maximum leverage ratio and (ii) current ratio financial covenants calculated as of the last day of each fiscal quarter. The Revolving Credit Facility also contains representations, warranties, indemnifications and affirmative and negative covenants, including events of default relating to nonpayment of principal, interest or fees, inaccuracy of representations or warranties in any material respect when made or when deemed made, violation of covenants, bankruptcy and insolvency events, certain unsatisfied judgments and a change of control. If an event of default occurs and we are unable to cure such default, the lenders will be able to accelerate maturity and exercise other rights and remedies. We expect to remain in compliance with these covenants for the foreseeable future.
Capital expenditures
Our acquisition and development expenditures consist of acquisitions of proved and unproved property, expenditures associated with the development of our oil and natural gas properties and other asset additions. Cash expenditures for drilling, completion and recompletion activities are presented as "development of oil and natural gas properties" in investing activities on our combined and consolidated statements of cash flows.
We expect to fund our 20232024 capital program, excluding acquisitions through cash flow from operations. The amount and timing of capital expenditures on development of oil and natural gas properties is substantially within our control due to the held-by-production nature of our assets. We regularly review our capital expenditures throughout the year and could choose to adjust our investments based on a variety of factors, including but not limited to the success of our drilling activities, prevailing and anticipated prices for oil, natural gas and NGLs, the availability of necessary equipment, infrastructure and capital, the receipt and timing of required regulatory permits and approvals, seasonal conditions, drilling and acquisition costs and the level of participation by other interest owners. Any postponement or elimination of our development drilling program could result in a reduction of proved reserve volumes and related Standardized Measure. These risks could materially affect our business, financial condition and results of operations.
The table below presents our capital expenditures and related metrics that we use to evaluate our business for the periods presented:
| | Year Ended December 31, |
| Year Ended December 31, | |
| Year Ended December 31, | |
| Year Ended December 31, | |
| (in thousands) | (in thousands) | 2022 | | 2021 | | 2020 |
| Total development of oil and natural gas properties | Total development of oil and natural gas properties | $ | 624,880 | | | $ | 194,828 | | | $ | 110,126 | |
| Total development of oil and natural gas properties | |
| Total development of oil and natural gas properties | |
| Change in accruals and other non-cash adjustments | |
| Change in accruals and other non-cash adjustments | |
| Change in accruals and other non-cash adjustments | Change in accruals and other non-cash adjustments | (32,173) | | | (39,221) | | | 16,038 | |
| Cash used in development of oil and natural gas properties | Cash used in development of oil and natural gas properties | 592,707 | | | 155,607 | | | 126,164 | |
| Cash used in development of oil and natural gas properties | |
| Cash used in development of oil and natural gas properties | |
| Cash used in acquisition of oil and natural gas properties | |
| Cash used in acquisition of oil and natural gas properties | |
| Cash used in acquisition of oil and natural gas properties | Cash used in acquisition of oil and natural gas properties | 626,620 | | | 115,076 | | | — | |
| Non-cash acquisition of oil and natural gas properties | Non-cash acquisition of oil and natural gas properties | — | | | 647,579 | | | 454,599 | |
| Non-cash acquisition of oil and natural gas properties | |
| Non-cash acquisition of oil and natural gas properties | |
| Total expenditure on acquisition and development of oil and natural gas properties | Total expenditure on acquisition and development of oil and natural gas properties | $ | 1,219,327 | | | $ | 918,262 | | | $ | 580,763 | |
| Total expenditure on acquisition and development of oil and natural gas properties | |
| Total expenditure on acquisition and development of oil and natural gas properties | |
OurThe decrease in our development of oil and natural gas properties was higher during the year ended December 31, 2022, comparedcosts in 2023 is primarily related to the year ended December 31, 2021. Due to the low commodity price environment experienced throughout 2020 resulting from the COVID-19 pandemic and the actions from OPEC, we significantly reducedtiming of our development capital expenditures starting in the second quarter of 2020 but resumed development activities in the second half of 2021 as commodity prices recovered to pre-pandemic levels. During the year ended December 31, 2022, commodity prices remained at or above levels prior to the COVID-19 pandemic. Accordingly, in conjunction with the higher price environment we increased our capital expenditures in 2022.
operations. We used cash of $626.6$849.3 million in 20222023 for the acquisitionacquisitions of oil and natural gas properties, primarily related to the Uinta Transaction,Western Eagle Ford Acquisitions, as compared to $115.1$626.6 million in 2021 which2022, primarily related to the DJ Basin and Central Basin Acquisitions. We had non-cash acquisitions of $647.6 million in 2021 relatedUinta Transaction. See “Notes to the Merger Transactions and the Titan Acquisition (see Our Combined and Consolidated Financial Statements—Statements—NOTE 3 - Acquisitions and Divestitures). in "Part II., Item 8. Financial Statements and Supplementary Data" of this Annual Report.
Contractual obligations
The following table presents our material contractual obligations at December 31, 2022:2023:
| | | | | | | | | | | | | | | | | |
(in thousands) | Due within
one year | | Due after
one year | | Total |
Long-term debt – principal (1) | $ | — | | | $ | 1,259,449 | | | $ | 1,259,449 | |
| Derivative liabilities | 312,975 | | | 63,737 | | | 376,712 | |
Asset retirement obligations (2) | 18,746 | | | 346,868 | | | 365,614 | |
Oil and natural gas transportation and gathering agreements (3) | 13,542 | | | 27,377 | | | 40,919 | |
| Total | $ | 345,263 | | | $ | 1,697,431 | | | $ | 2,042,694 | |
| | | | | | | | | | | | | | | | | |
(in thousands) | Due within
one year | | Due after
one year | | Total |
Long-term debt – principal (1) | $ | — | | | $ | 1,723,500 | | | $ | 1,723,500 | |
Fixed rate long-term debt – interest (2) | 143,250 | | | 399,875 | | | 543,125 | |
| Derivative liabilities | 42,051 | | | — | | | 42,051 | |
Asset retirement obligations (3) | 26,741 | | | 418,319 | | | 445,060 | |
Oil and natural gas transportation and gathering agreements (4) | 70,986 | | | 304,298 | | | 375,284 | |
| Total | $ | 283,028 | | | $ | 2,845,992 | | | $ | 3,129,020 | |
(1)Long-term debt represents our outstanding borrowings as of December 31, 20222023 consisting of our 2026 Notes (maturingSenior Notes; maturing on May 1, 2026)2026 and February 15, 2028) and borrowings under our Revolving Credit Facility (maturing on September 23, 2027).
Table of Contents(2)Excludes variable rate debt interest payments and commitment fees related to the Company's Revolving Credit Facility.
(2)(3)Amounts represent estimated discounted costs for future dismantlement and abandonment of our oil and natural gas properties. See “Notes"Notes to the combinedCombined and consolidated financial statements—Consolidated Financial Statements—NOTE 9 - Asset Retirement Obligation” Obligation"in "Part II., Item 8. Financial Statements and Supplementary Data" of this Annual Report for additional discussion of our asset retirement obligations.
(3)(4)Amounts include payments which will become due under long-term agreements to purchase goods and services used in the normal course of business to secure transportation of our oil and natural gas production to market, as well as, pipeline, processing and storage capacity.
General and Administrative Expense
Our general and administrative expense includes corporate overhead costs, professional service fees, insurance, software applications, fees for transaction expenses, expenses payable under the Management Agreement with KKR Energy Assets Manager LLC, incentive compensation award agreements granting profits interests, restricted stock units, performance stock units and other incentive awards granted to our employees and non-employee directors.
The incentive compensation portion relates to certain equity-classified and liability-classified profits interests awards issued by our subsidiaries (collectively, “Profits Awards”). These Profits Awards contain different vesting conditions ranging from performance-based conditions that vest upon the achievement of certain return thresholds to time-based service requirements ranging from one year to four years. Compensation cost for these awards is presented within generalGeneral and administrative expense on our combined and consolidated statements of operations. As of December 31, 2022,2023, (i) unrecognized compensation cost related to unvested equity-classified profits interest awards was $67.5$63.1 million, and (ii) we carried $10.1$5.8 million in Other long term liabilities on the consolidated balance sheet and had unrecognized compensation of $3.7$3.8 million related to unvested liability-classified profits interest awards. Actual amounts paid towards equity-classified profits interests awards in the future will be shown as distributions to non-controlling interests in our consolidated financial statements, and may differ from the amounts shown for unrecognized compensation cost related to unvested equity-classified profits interest awards.
For additional information, see "Notes to Combined and Consolidated Financial Statements—NOTE 13 – IncentiveEquity-Based Compensation ArrangementsAwards" in the notes to our audited financial statements for the year ended December 31, 2022 included herein."Part II., Item 8. Financial Statements and Supplementary Data" of this Annual Report
Dividends
Our future dividends depend on our level of earnings, financial requirements and other factors and will be subject to approval by our Board of Directors, applicable law and the terms of our existing debt documents, including the indentures governing the Senior Notes.
We paid cash dividends of $0.63$0.53 per share of our Class A Common Stock to shareholders during the year ended December 31, 2022.2023.
On March 7, 2023,4, 2024, the Board of Directors approved a quarterly cash dividend of $0.17$0.12 per share, or $0.68$0.48 per share on an annualized basis, to be paid to shareholders of our Class A Common Stock with respect to the fourth quarter of 2022.2023. The quarterly dividend is payable on March 31, 202328, 2024 to shareholders of record as of the close of business on March 20, 2023.15, 2024. OpCo unitholders will also receive a distribution based on their pro rata ownership of OpCo Units.
The payment of quarterly cash dividends is subject to management’s evaluation of our financial condition, results of operations and cash flows in connection with such payments and approval by our Board of Directors. In light of current economic conditions, management will evaluate any future increases in cash dividend on a quarterly basis.
Stock Repurchase Program
Our Board of Directors authorized a stock repurchase program on March 4, 2024 with an approved limit of $150.0 million and a two-year term. Repurchases may be of our Class A Common Stock or of OpCo Units (with the cancellation of a corresponding number of shares of our Class B Common Stock). Such repurchase may be made by Crescent or by OpCo, as applicable, and may be made from time to time in the open market, in a privately negotiated transaction, through purchases made in accordance with the Rule 10b5-1 of the Exchange Act or by such other means as will comply with applicable state and federal securities laws. The timing of any repurchases under the share repurchase program will depend on market conditions, contractual limitations and other considerations. The program may be extended, modified, suspended or discontinued at any time, and does not obligate us to repurchase any dollar amount or number of shares.
The IRA 2022 provides for, among other things, the imposition of a 1% U.S. federal excise tax on certain repurchases of stock by publicly traded U.S. corporations, such as Crescent, after December 31, 2022. Accordingly, this excise tax will apply to our stock repurchase program. The Biden Administration has proposed increasing the amount of the excise tax from 1% to 4%; however, it is unclear whether such a change in the amount of the excise tax will be enacted and, if enacted, how soon any such change could take effect.
Critical accounting estimates
Our significant accounting policies are described in "Notes to Combined and Consolidated Financial Statements—NOTE 2 – Summary of Significant Accounting Policies" in "Part II., in "ItemItem 8. Financial Statements and Supplementary Data" of this Annual Report. The Company's combined and consolidated financial statements are prepared in accordance with GAAP. The preparation of combined and consolidated financial statements requires management to make assumptions and estimates that affect the reported results of operations and financial position. The following is a discussion of the accounting policies, estimates and judgments that management believes are most significant in the application of GAAP used in the preparation of our combined and consolidated financial statements. These accounting policies, among others, may involve a high degree of complexity and judgment on the part of management. Further, these estimates and other factors, including those outside of our control could have significant adverse impact to our financial condition, results of operations and cash flows.
Crude oil, natural gas and NGL reserves
One of the most significant estimates the Company makes is the estimate of proved crude oil, natural gas and NGL reserves. Reserve engineering is a subjective process of estimating volumes of economically recoverable oil and natural gas that cannot be measured in an exact manner. Our crude oil and natural gas reserves are based on a combination of proved reserves and risk-weighted probable reserves and require significant judgment. Technologies used in our reserves estimation includes decline curve analysis, statistical analysis of production performance, pressure and rate transient analysis, pressure gradient analysis, reservoir simulation and volumetric analysis. The accuracy of any reserve estimate is a function of the quality of available data and of engineering and geological interpretation. In addition, periodic revisions of our estimated reserves and future cash flows may be necessary as a result of a number of factors, including reservoir performance, crude oil and natural gas prices, changes in costs, capital funding and drilling plans (including our five-year development plan), technological advances, new geological or geophysical data, or other economic factors. Accordingly, reserve estimates often differ from the quantities of crude oil and natural gas that are ultimately recovered. We cannot predict the amounts or timing of future reserve revisions.
When determining the December 31, 20222023 proved reserves for each property, the benchmark prices issued by the SEC were adjusted using price differentials that account for property-specific quality and location differences. If the future average crude oil prices are below the average prices used to determine proved reserves at December 31, 2022,2023, it could have an adverse effect on our estimates of proved reserve volumes and the value of our business. It is difficult to estimate the magnitude of any potential price change and the effect on proved reserves, due to numerous factors (including future crude oil price and performance revisions). For further discussion of risks associated with our estimation of proved reserves, see "Part I., Item 1A. Risk Factors."
Estimates of proved reserves are key components of our most significant financial estimates including the computation of depreciation, depletion and amortization ("DD&A") and impairment of proved oil and natural gas properties.
Oil and natural gas properties
Oil and natural gas producing activities are accounted for under the successful efforts method of accounting. See “Notes"Notes to our Combined and Consolidated Financial Statements—NOTE 2 – Summary of Significant Accounting Policies”" in "Item"Part II., Item 8. Financial Statements and Supplementary Data" of thethis Annual Report for further discussion of the accounting policies applicable to the successful efforts method of accounting.
The successful efforts method inherently relies on the estimation of proved crude oil, natural gas and NGL reserves. The amount of estimated proved reserve volumes affect, among other things, whether certain costs are capitalized or expensed, the amount and timing of costs depreciated, depleted or amortized into net income and the presentation of supplemental information on oil and gas producing activities. In addition, the expected future cash flows to be generated by producing properties used for testing impairment, also in part, rely on estimates of quantities of net reserves.
Depreciation, depletion and amortization
DD&A of oil and natural gas producing properties is determined on a field-by-field basis using the units-of-production method. During the years ended December 31, 2023, 2022, 2021, and 2020,2021, we recognized DD&A expense of $675.8 million, $532.9 million, $312.8 million, and $372.3$312.8 million, respectively.
While revisions of previous reserve estimates have not historically been significant to the depreciation and depletion rates, any reduction in proved reserves, could result in an acceleration of future DD&A expense. Holding all other factors constant, if proved reserves are revised downward, the rate at which we record DD&A expense would increase, reducing net income. Conversely, if proved reserves are revised upward, the rate at which we record DD&A expense would decrease. However, a sensitivity analysis is not practicable, given the numerous assumptions required to calculate proved reserves. In addition, any unfavorable adjustments to some of the above listed assumptions (e.g. commodity prices) would likely be offset by favorable adjustments in other assumptions (e.g. lower costs) as we have historically seen in our industry.
Impairment of oil and natural gas properties
Proved and unproved oil and natural gas properties are reviewed for impairment when events and circumstances indicate a possible decline in the recoverability of the carrying amount of such property. When a triggering event is identified, we compare the carrying amount of our oil and natural gas properties to the estimated undiscounted cash flows our oil and natural gas properties will generate to determine if the carrying amount is recoverable. If the carrying amount exceeds the estimated
undiscounted cash flows, we will write-down the carrying amount of the oil and natural gas properties to fair value. The factors used to determine fair value include:
•Estimates of oil and natural gas reserves and expected timing of production. Our oil and natural gas reserves are based on a combination of proved reserves and risk-weighted probable reserves and require significant judgment. Reserve engineering is a subjective process, which requires assumptions associated with the underground accumulations of oil and natural gas, development costs, future commodity prices and the future regulatory and political environment. Any significant variance in these assumptions could materially affect the estimated quantity and value of the reserves, which would affect the fair value of our oil and natural gas properties. The estimates of our reserves help to inform our expectation of future oil and natural gas production, which will likely vary from our actual production.
•Future commodity prices, which are based on publicly available forward commodity prices for a period of time and then escalated at 2.5% thereafter. A decrease in estimated future commodity prices will decrease the fair value of our oil and natural gas properties.
•Future capital requirements, which are based on our internal forecasts and supported by the underlying cash flows generated from our oil and natural gas assets.
•Discount rate commensurate with the risk associated with realizing projected cash flows, which is based on a variety of factors, including market and economic conditions, as well as operational and regulatory risk.
During the years ended December 31, 2023 and 2022, we determined that there was awere triggering eventevents requiring an evaluation of whether the carrying value of our oil and natural gas properties was recoverable as a result of our annual goodwill impairment test.recoverable. Following an assessment of our oil and natural gas properties, during the years ended December 31, 2023 and 2022, we recorded impairment expense of $149.6 million and $65.2 million, respectively. We did not incur any impairment expense during the year ended December 31, 2022. In March 2020, crude oil demand experienced significant declines due to2021. As of December 31, 2023, the COVID-19 pandemic and resulting governmental led shut-downscarrying value of certain of our conventional assets in economic activity. During the second quarter of 2020, as it become apparent that the pandemic would continue with sustained significant declineWyoming in crude oil prices, we assessed ourproved oil and natural gas properties was $214.5 million. At the current forward commodity price curve, these assets have limited cushion between their carrying value and estimated undiscounted cash flows. A further decline of future commodity prices or a decrease in estimates
of oil and natural gas reserves for these assets would likely result in an impairment charge. The actual amount of impairment incurred, if any, for these properties will depend on a variety of factors including, but not limited to, subsequent forward price curve changes, weighted-average cost of capital, operating cost estimates and recorded impairment expense of $247.2 million during the year ended December 31, 2020.future capital expenditures estimates. An estimate of the sensitivity to changes in assumptions in our fair value calculations is not practicable, given the numerous assumptions (e.g. reserves, pace and timing of development plans, commodity prices, capital expenditures, operating costs, drilling and development costs, inflation and discount rates) that can materially affect our estimates. Unfavorable adjustments to some of the above listed assumptions would likely be offset by favorable adjustments in other assumptions. For example, the impact of sustained reduced commodity prices would likely be partially offset by lower costs.
We did not incur any impairment expense during the year ended December 31, 2021.
Properties acquired in business combinations
When sufficient market data is not available, we determine the fair values of proved and unproved oil and natural gas properties acquired in transactions accounted for as business combinations by preparing estimates of cash flows from the production of crude oil, natural gas and NGL reserves. We estimate future prices to apply to the estimated reserves quantities acquired, and estimates future operating and development costs, to arrive at estimates of future net cash flows. For the fair value assigned to proved reserves, future net cash flows are discounted using a market-based weighted average cost of capital rate determined appropriate at the time of the business combination. When estimating and valuing unproved reserves, discounted future net cash flows of probable and possible reserves are reduced by additional risk-weighting factors. For other assets acquired in business combinations, we use a combination of available cost and market data and/or estimated cash flows to determine the fair values.
Significant reductions in the proved reserves used to determine the fair value of the acquired properties could result in future impairments of the properties. See the discussion above under "Depreciation, depletion and amortization: on the practicability of a sensitivity analysis due to changes in our fair value calculations.
Income taxes
Prior to the Merger Transactions, we were organized as Delaware limited liability companies and Delaware limited partnerships and were treated as flow-through entities for U.S. federal income tax purposes. As a result, our tax provision for the yearsyear ended December 31, 2021 and 2020 werewas minimal. Subsequent to the Merger Transactions, we are subject to U.S. federal income and state tax on our allocable share of any taxable income of OpCo. The amount of income taxes recorded by the Company requires interpretations of complex rules and regulations of various tax jurisdictions throughout the United States. We have recognized deferred tax assets and liabilities for temporary differences, operating losses and tax credit carryforwards. We routinely assess the realizability of our deferred tax assets and reduce such assets by a valuation allowance if it is more likely than not that some portion or all of the deferred tax assets will not be realized. We routinely assess potential uncertain tax positions and, if
required, establish accruals for such amounts. The accruals for deferred tax assets and liabilities, including deferred state income tax assets and liabilities, are subject to significant judgment and are reviewed and adjusted routinely based on changes in facts and circumstances. Although we consider our tax accruals adequate, material changes in these accruals may occur in the future, based on the impact of tax audits, changes in legislation and resolution of pending or future tax matters. Refer to "Notes to Combined and Consolidated Financial Statements—NOTE 11 – Income Taxes" in "Part II., Item 8. Financial Statements and Supplementary Data" of this Annual Report for more information.
New and revised accounting standards
See “Notes to the combinedCombined and consolidated financial statements—Consolidated Financial Statements—NOTE 2-Summary2 – Summary of Significant Accounting Policies.” in Part II., Item 8. Financial Statements and Supplementary Data" of this Annual Report.
Non-GAAP financial measures
Our “Management’s Discussion and Analysis of Financial Condition and Results of Operations” includes financial and liquidity measures that have not been calculated in accordance with U.S. GAAP. These non-GAAP measures include the following:
•Adjusted EBITDAX; and
•Levered Free Cash FlowFlow.
These are supplemental non-GAAP financial and liquidity measures used by our management to assess our operating results and assist us make our investment decisions. We believe that the presentation of these non-GAAP financial measures provides investors with greater transparency with respect to our results of operations, as well as liquidity and capital resources, and that these measures are useful for period-to-period comparison of results.
We define Adjusted EBITDAX as net income (loss) before interest expense, realized (gain) loss on interest rate derivatives, income tax expense (benefit), depreciation, depletion and amortization, exploration expense, non-cash gain (loss) on derivative contracts,derivatives, impairment expense, non-cash equity-based compensation, (gain) loss on sale of assets, other (income) expense and transaction and nonrecurring expenses. Additionally, we further subtract certain redeemable noncontrolling interest distributions made by OpCo related to Manager Compensation transaction and nonrecurring expenses and early settlement of acquired derivative contracts.
Adjusted EBITDAX is not a measure of performance as determined by GAAP. We believe Adjusted EBITDAX is a useful performance measure because it allows for an effective evaluation of our operating performance when compared against our peers, without regard to our financing methods, corporate form or capital structure. We exclude the items listed above from net income (loss) in arriving at Adjusted EBITDAX because these amounts can vary substantially within our industry depending upon accounting methods and book values of assets, capital structures and the method by which the assets were acquired. Adjusted EBITDAX should not be considered as an alternative to, or more meaningful than, net income (loss) as determined in accordance with GAAP, of which such measure is the most comparable GAAP measure. Certain items excluded from Adjusted EBITDAX are significant components in understanding and assessing a company’s financial performance, such as a company’s cost of capital and tax burden, as well as the historic costs of depreciable assets, none of which are reflected in Adjusted EBITDAX. Our presentation of Adjusted EBITDAX should not be construed as an inference that our results will be unaffected by unusual or nonrecurring items. Our computations of Adjusted EBITDAX may not be identical to other similarly titled measures of other companies. In addition, the Revolving Credit Facility and Senior Notes include a calculation of Adjusted EBITDAX for purposes of covenant compliance.
We define Levered Free Cash Flow as Adjusted EBITDAX less interest expense, excluding non-cash deferred financing cost amortization, realized gain (loss) on interest rate derivatives, current income tax benefit (expense), tax-related redeemable noncontrolling interest distributions made by OpCo and development of oil and natural gas properties. Levered Free Cash Flow does not take into account amounts incurred on acquisitions or proceeds received from asset sales. acquisitions.
Levered Free Cash Flow is not a measure of performanceliquidity as determined by GAAP. Levered Free Cash Flow is a supplemental non-GAAP performanceliquidity measure that is used by our management and external users of our financial statements, such as industry analysts, investors, lenders and rating agencies. We believe Levered Free Cash Flow is a useful performanceliquidity measure because it allows for an effective evaluation of our operating and financial performance and the ability of our operations to generate cash flow that is available to reduce leverage or distribute to our equity holders. Levered Free Cash Flow should not be considered as an alternative to, or more meaningful than, net income (loss)Net cash flow provided by operating activities as determined in accordance with GAAP, of which such measure is the most comparable GAAP measure, or as an indicator of actual liquidity, operating performance or investing activities. Our computations of Levered Free Cash Flow may not be comparable to other similarly titled measures of other companies.
Adjusted EBITDAX and Levered Free Cash Flow should be read in conjunction with the information contained in our combined and consolidated financial statements prepared in accordance with GAAP. For a reconciliation of these non-GAAP measures to the nearest comparable GAAP measures, see “—Results of Operations—Adjusted EBITDAX (non-GAAP) and Levered Free Cash Flow (non-GAAP)” above.
Item 7A. Quantitative and Qualitative Disclosures About Market Risk
We are exposed to market risk, including the effects of adverse changes in commodity prices and interest rates as described below. The primary objective of the following information is to provide quantitative and qualitative information about our potential exposure to market risks. The term “market risk” refers to the risk of loss arising from adverse changes in commodity prices and interest rates. The disclosures are not meant to be precise indicators of expected future losses but rather indicators of reasonably possible losses.
Commodity price risk
Our major market risk exposure is in the pricing that we receive for our oil, natural gas and NGLs production.
Pricing for oil, natural gas and NGLs has been volatile and unpredictable for several years, and we expect this volatility to continue in the future. The prices we receive for our production depend on many factors outside of our control, such as the strength of the global economy and global supply and demand for the commodities we produce.
To reduce the impact of fluctuations in oil, natural gas and NGLs prices on our cash flows, we regularly enter into commodity derivative contracts with respect to certain of our oil, natural gas and NGL production through various transactions that limit the risks of fluctuations of future prices. A key tenet of our focused risk management effort is an active economic hedge strategy to mitigate near-term price volatility while maintaining long-term exposure to underlying commodity prices. Our hedging program allows us to preserve capital, protect margins and corporate returns through commodity cycles and return capital to investors. Future transactions may include price swaps whereby we will receive a fixed price for our production and pay a variable market price to the contract counterparty. Additionally, we may enter into collars, whereby we receive the excess, if any, of the fixed
floor over the floating rate or pay the excess, if any, of the floating rate over the fixed ceiling. These economic hedging activities are intended to limit our near-term exposure to product price volatility and to maintain stable cash flows, a strong balance sheet and attractive corporate returns.
As of December 31, 2022,2023, our derivative portfolio had an aggregate notional value of approximately $1.4$1.7 billion, and the fair market value of our commodity derivative contracts was a net liabilityasset of $0.4 billion.$20.3 million. We determine the fair value of our oil and natural gas commodity derivatives using valuation techniques that utilize market quotes and pricing analysis. Inputs include publicly available prices and forward price curves generated from a compilation of data gathered from third parties.
Based upon our open commodity derivative positions at December 31, 2022,2023, a hypothetical 10% increase or decrease in the NYMEX WTI, Brent price, Henry Hub Index price, NGL prices and basis prices would change our net commodity derivative position. If prices increased by 10%, our derivative position would change by approximately $165.5$130.4 million. If prices decreased by 10%, our derivative position would change by approximately $165.2$124.7 million. The hypothetical change in fair value could be a gain or a loss depending on whether commodity prices decrease or increase.
Derivative assets and liabilities are classified on the consolidated balance sheets as risk management assets and liabilities. We use derivative instruments and enter into swap contracts which are governed by International Swaps and Derivatives Association (“ISDA”) master agreements. Amounts not offset on the consolidated balance sheets represent positions that do not meet all of the conditions to be netted on such balance sheet, such as the legally enforceable right of offset or the execution of a master netting arrangement. See "Notes to the Combined and Consolidated Financial Statements, NOTE 5 – Derivatives"Derivatives" in "Part II., Item 8. Financial Statements and Supplementary Data" of this Annual Report for additional discussion.
Counterparty and customer credit risk
Our cash and cash equivalents are exposed to concentrations of credit risk. We manage and control this risk by investing these funds with major financial institutions. We often have balances in excess of the federally insured limits.
We sell oil, natural gas and NGLs to various types of customers. Credit is extended based on an evaluation of our customer’s financial conditions and historical payment record. The future availability of a ready market for oil, natural gas and NGLs depends on numerous factors outside of our control, none of which can be predicted with certainty.
For the years ended December 31, 2023, 2022 2021 and 2020,2021, we had certain major customers that exceeded 10% of total revenues. See "Part I., Items 1 and 2. Business and Properties—Marketing and customers.” We do not believe the loss of any single
customer would materially impact its operating results because oil, natural gas and NGLs are fungible products with well-established markets and numerous purchasers.
To minimize the credit risk in derivative instruments, it is our policy to enter into derivative contracts only with counterparties that are creditworthy financial institutions deemed by our management as competent and competitive market makers. Additionally, our ISDAs allow us to net positions with the same counterparty to minimize credit risk exposure. The creditworthiness of our counterparties is subject to periodic review.
Interest rate risk
At December 31, 2022,2023, we had $559.4$23.5 million of variable rate debt outstanding. Assuming no change in the amount outstanding, the impact on interest expense of each 1% (or 100 basis point) increase or decrease in the average interest rate would result in an approximately $5.6$0.2 million increase or decrease in interest expense per year on our variable rate debt outstanding at December 31, 2022.2023.
Item 8. Financial Statements and Supplementary Data
INDEX TO FINANCIAL STATEMENTS
CRESCENT ENERGY COMPANY
| | | | | |
| Page |
| Report of Independent Registered Public Accounting Firm | |
| Combined and Consolidated Financial Statements: | |
Consolidated Balance Sheets as of December 31, 20222023 and 20212022 | |
Combined and Consolidated Statements of Operations for the Years Ended December 31, 2023,2022 2021 and 20202021 | |
Combined and Consolidated Statements of Changes in Equity for the Years Ended December 31, 2023, 2022 2021 and 20202021 | |
Combined and Consolidated Statements of Cash Flows for the Years Ended December 31, 2023, 2022 2021 and 20202021 | |
| Notes to Combined and Consolidated Financial Statements | |
| Financial Statement Schedules: | |
| Schedule I - Condensed Financial Information of Registrant | |
REPORT OF INDEPENDENT REGISTERED PUBLIC ACCOUNTING FIRM
To the shareholders and the Board of Directors of Crescent Energy Company
Opinion on the Financial Statements
We have audited the accompanying consolidated balance sheets of Crescent Energy Company and subsidiaries (the "Company") as of December 31, 20222023 and 2021,2022, the related combined and consolidated statements of operations, changes in equity, and cash flows, for each of the three years in the period ended December 31, 2022,2023, and the related notes and schedule listed in the Index at Item 8 (collectively referred to as the "financial statements"). In our opinion, the financial statements present fairly, in all material respects, the financial position of the Company as of December 31, 20222023 and 2021,2022, and the results of its operations and its cash flows for each of the three years in the period ended December 31, 2022,2023, in conformity with accounting principles generally accepted in the United States of America.
We have also audited, in accordance with the standards of the Public Company Accounting Oversight Board (United States) (PCAOB), the Company's internal control over financial reporting as of December 31, 2022,2023, based on criteria established in Internal Control — Integrated Framework (2013) issued by the Committee of Sponsoring Organizations of the Treadway Commission and our report dated March 7, 2023,4, 2024, expressed an unqualified opinion on the Company's internal control over financial reporting.
Basis for Opinion
These financial statements are the responsibility of the Company's management. Our responsibility is to express an opinion on the Company's financial statements based on our audits. We are a public accounting firm registered with the PCAOB and are required to be independent with respect to the Company in accordance with the U.S. federal securities laws and the applicable rules and regulations of the Securities and Exchange Commission and the PCAOB.
We conducted our audits in accordance with the standards of the PCAOB. Those standards require that we plan and perform the audit to obtain reasonable assurance about whether the financial statements are free of material misstatement, whether due to error or fraud. Our audits included performing procedures to assess the risks of material misstatement of the financial statements, whether due to error or fraud, and performing procedures that respond to those risks. Such procedures included examining, on a test basis, evidence regarding the amounts and disclosures in the financial statements. Our audits also included evaluating the accounting principles used and significant estimates made by management, as well as evaluating the overall presentation of the financial statements. We believe that our audits provide a reasonable basis for our opinion.
Critical Audit Matters
The critical audit matters communicated below are matters arising from the current-period audit of the financial statements that were communicated or required to be communicated to the audit committee and that (1) relates to accounts or disclosures that are material to the financial statements and (2) involved our especially challenging, subjective, or complex judgments. The communication of critical audit matters does not alter in any way our opinion on the financial statements, taken as a whole, and we are not, by communicating the critical audit matters below, providing separate opinions on the critical audit matters or on the accounts or disclosures to which they relate.
Proved Oil and Natural Gas Properties – Oil and Natural Gas Reserves Quantities – Refer to Notes 2 and 4 to the financial statements
Critical Audit Matter Description
The Company’s proved oil and natural gas properties are depleted on a field-by-field basis using the units-of-production method and reviewed for impairment when events and circumstances indicate a possible decline in the recoverability of the carrying amount may have occurred, by comparing the carrying amount of the proved oil and natural gas properties to the estimated undiscounted future net cash flows, derived in part from the underlying proved oil and natural gas reserves. The development of the Company’s proved oil and natural gas reserves and the related future net cash flows used to evaluate proved oil and natural gas properties for impairment requires management to make significant estimates and assumptions, including calculating the best estimate of future production and the Company’s ability to convert proved undeveloped reserves to producing oil and natural gas properties within five years of their initial proved reserves bookings.
The Company engaged an independent reserve engineer to independently engineer their proved oil and natural gas reserves in accordance with Securities and Exchange Commission Regulation S-X and other sources of accounting principles generally accepted in the United States of America. Changes in these estimates, assumptions or engineering data could have a significant impact on the depletion calculations and the proved oil and natural properties impairment evaluations. As of December 31, 2022, 20% of the estimated proved oil and natural gas reserves were attributable to proved undeveloped reserves. The proved oil and natural gas properties balance was $5.0 billion as of December 31, 2022, net of accumulated depletion and impairment.
Depletion expense and impairment expense for proved oil and natural gas properties were $498.3 million and $65.2 million, respectively, for the year then ended.
Given the significant judgments made by management, performing audit procedures to evaluate the Company’s proved oil and natural gas reserves and the related estimated undiscounted future net cash flows, including management’s estimates and assumptions related to the
best estimate of future production and converting proved undeveloped reserves to producing oil and natural gas properties within five years, required a high degree of auditor judgment and an increased extent of effort.
How the Critical Audit Matter Was Addressed in the Audit
Our audit procedures related to management’s significant judgments and assumptions related to oil and natural gas reserves and estimates of the future net cash flows, included the following, among others:
•We tested the operating effectiveness of controls related to the Company’s estimation of proved oil and natural gas reserves and the related expected undiscounted future net cash flows.
•We evaluated the Company’s best estimate of future production by:
◦Comparing the Company’s best estimate of future production to historical production volumes.
◦Assessing the reasonableness of the production volume decline curves by comparing to historical decline curve estimates.
•We evaluated the reasonableness of management’s estimates and assumptions related to converting proved undeveloped reserves to producing oil and natural gas properties within five years, by performing the following:
◦Comparing historical conversions of proved undeveloped reserves into proved developed reserves to management’s forecasts of conversions.
◦Comparing management’s forecasts to the Company’s drilling plan and the availability of capital relative to the drilling plan.
◦Evaluating whether the forecasted date of development for the proved undeveloped locations are within five years of their original booking date.
◦Reviewing internal communications to management and the Board of Directors.
•We evaluated the experience, qualifications and objectivity of management’s expert, an independent reserve engineering firm.
Proved Oil and Natural Gas Properties – Impairment Expense – Refer to Notes 2 and 6 to the financial statements
Critical Audit Matter Description
The Company compares the estimated undiscounted future net cash flows of its proved oil and natural gas reserves to the carrying amount of the proved oil and natural gas properties on a field-by-field basis to determine if the carrying amount is recoverable. If the carrying amount of the proved oil and natural gas properties exceeds the undiscounted future net cash flows, the Company will impair the carrying value to fair value. The fair value is estimated by using the income valuation technique which involves calculating the present value of future net cash flows.
During the year ended December 31, 2022,2023, certain of the Company's proved oil and natural gas properties with a carrying value of $183.2 million were reduced to atheir fair value, of $118.0 million, resulting in an impairment of $65.2 millionto their carrying values which was included in impairment expense within the combined and consolidated statement of operations. Management estimated the fair value of the proved oil and natural gas properties using the income valuation technique which incorporates the application of a discount rate commensurate with the risk and current market conditions associated with realizing the projected cash flows.
Given the significant judgments made by management, including the development of oil and natural gas reserves estimates using management’s experts as defined in the previous Critical Audit Matter and in developing an estimate of an appropriate discount rate, performing audit procedures over these management estimates required a higher degree of auditor judgment and an increased extent of effort, including the use of professionals with specialized skill and knowledge.
How the Critical Audit Matter Was Addressed in the Audit
In addition to the procedures specified in the previous Critical Audit Matter, our audit procedures related to the selection of the discount rate applied to estimated future net cash flows from proved oil and natural gas properties, included the following, among others:
•We tested the operating effectiveness of controls related to the Company’s estimation of an appropriate discount raterate.
•With the assistance of our fair value specialist, we evaluated the appropriateness of the discount rate by:
◦Evaluating the appropriateness of the mathematical model used to develop the discount rate.
◦Evaluating the guideline public companies selected by management and used in the selection of the discount rate considering the comparability of operations to the Company.
◦Comparing the selected discount rate to published discount rate estimates for the industry.
◦Developing a range of independent estimates of the discount rate by independently obtaining information to estimate components of the discount rate, including the cost of debt capital, the cost of equity capital, and debt-to-equity ratio.
◦Comparing the discount rate selected by management with the range of independent estimates.
◦Recomputing the mathematical accuracy of the calculation of the discount rate.
/s/ Deloitte & Touche LLP
Houston, Texas
March 7, 20234, 2024
We have served as the Company’s auditor since 2021.
| | CRESCENT ENERGY COMPANY | CRESCENT ENERGY COMPANY | CRESCENT ENERGY COMPANY |
| CONSOLIDATED BALANCE SHEETS | CONSOLIDATED BALANCE SHEETS | CONSOLIDATED BALANCE SHEETS |
| | December 31,
2022 | | December 31,
2021 |
| (in thousands, except share and unit data) |
| December 31,
2023 | |
| December 31,
2023 | |
| December 31,
2023 | | | December 31,
2022 |
| (in thousands, except share and unit data) | | | (in thousands, except share and unit data) |
| ASSETS | ASSETS | |
| Current assets: | Current assets: | |
| Current assets: | |
| Current assets: | |
| Cash and cash equivalents | |
| Cash and cash equivalents | |
| Cash and cash equivalents | Cash and cash equivalents | $ | — | | | $ | 128,578 | |
| Accounts receivable, net | Accounts receivable, net | 457,071 | | | 321,855 | |
| Accounts receivable – affiliates | Accounts receivable – affiliates | 2,681 | | | 20,341 | |
| Derivative assets – current | Derivative assets – current | 14,878 | | | — | |
| Drilling advances | 14,655 | | | 200 | |
| Prepaid and other current assets | 27,454 | | | 8,644 | |
| Prepaid expenses | |
| | Other current assets | |
| Other current assets | |
| Other current assets | |
| Total current assets | Total current assets | 516,739 | | | 479,618 | |
| Property, plant and equipment: | Property, plant and equipment: | |
| Oil and natural gas properties at cost, successful efforts method | Oil and natural gas properties at cost, successful efforts method | |
| Oil and natural gas properties at cost, successful efforts method | |
| Oil and natural gas properties at cost, successful efforts method | |
| Proved | |
| Proved | |
| Proved | Proved | 7,113,819 | | | 6,043,602 | |
| Unproved | Unproved | 314,255 | | | 308,721 | |
| Oil and natural gas properties at cost, successful efforts method | Oil and natural gas properties at cost, successful efforts method | 7,428,074 | | | 6,352,323 | |
| Field and other property and equipment, at cost | Field and other property and equipment, at cost | 176,831 | | | 144,318 | |
| Total property, plant and equipment | Total property, plant and equipment | 7,604,905 | | | 6,496,641 | |
| Less: accumulated depreciation, depletion, amortization and impairment | Less: accumulated depreciation, depletion, amortization and impairment | (2,167,135) | | | (1,941,528) | |
| Property, plant and equipment, net | Property, plant and equipment, net | 5,437,770 | | | 4,555,113 | |
| Goodwill | — | | | 76,564 | |
| | Derivative assets – noncurrent | Derivative assets – noncurrent | — | | | 579 | |
| Investment in equity affiliates | 15,038 | | | 15,415 | |
| Derivative assets – noncurrent | |
| Derivative assets – noncurrent | |
| Investments in equity affiliates | |
| Other assets | Other assets | 50,302 | | | 30,173 | |
| TOTAL ASSETS | TOTAL ASSETS | $ | 6,019,849 | | | $ | 5,157,462 | |
| The accompanying notes to financial statements are an integral part of these combined and consolidated financial statements | | | | The accompanying notes to financial statements are an integral part of these combined and consolidated financial statements | |
| | The accompanying notes to financial statements are an integral part of these combined and consolidated financial statements | |
|
| | CRESCENT ENERGY COMPANY | CRESCENT ENERGY COMPANY | CRESCENT ENERGY COMPANY |
| CONSOLIDATED BALANCE SHEETS | CONSOLIDATED BALANCE SHEETS | CONSOLIDATED BALANCE SHEETS |
| | December 31,
2022 | | December 31,
2021 |
| (in thousands, except share and unit data) |
| December 31,
2023 | |
| December 31,
2023 | |
| December 31,
2023 | | | December 31,
2022 |
| (in thousands, except share and unit data) | | | (in thousands, except share and unit data) |
| LIABILITIES, REDEEMABLE NONCONTROLLING INTERESTS AND EQUITY | LIABILITIES, REDEEMABLE NONCONTROLLING INTERESTS AND EQUITY | |
| Current liabilities: | Current liabilities: | |
| Current liabilities: | |
| Current liabilities: | |
| Accounts payable and accrued liabilities | |
| Accounts payable and accrued liabilities | |
| Accounts payable and accrued liabilities | Accounts payable and accrued liabilities | $ | 524,690 | | | $ | 337,881 | |
| Accounts payable – affiliates | Accounts payable – affiliates | 27,652 | | | 8,675 | |
| Derivative liabilities – current | Derivative liabilities – current | 312,975 | | | 253,525 | |
| Financing lease obligations – current | Financing lease obligations – current | 3,341 | | | 1,606 | |
| Other current liabilities | Other current liabilities | 25,091 | | | 14,438 | |
| Total current liabilities | Total current liabilities | 893,749 | | | 616,125 | |
| Long-term debt | Long-term debt | 1,247,558 | | | 1,030,406 | |
| Derivative liabilities – noncurrent | Derivative liabilities – noncurrent | 63,737 | | | 133,471 | |
| Asset retirement obligations | Asset retirement obligations | 346,868 | | | 258,102 | |
| Deferred tax liability | Deferred tax liability | 147,348 | | | 82,537 | |
| Financing lease obligations – noncurrent | Financing lease obligations – noncurrent | 7,412 | | | 3,512 | |
| Other liabilities | Other liabilities | 14,183 | | | 13,652 | |
| Total liabilities | Total liabilities | 2,720,855 | | | 2,137,805 | |
| Commitments and contingencies (Note 12) | Commitments and contingencies (Note 12) | | Commitments and contingencies (Note 12) | | | |
| Redeemable noncontrolling interests | Redeemable noncontrolling interests | 2,436,703 | | | 2,325,013 | |
| Equity: | Equity: | |
| | Class A common stock, $0.0001 par value; 1,000,000,000 shares authorized, 49,433,154 and 43,105,376 shares issued, and 48,282,163 and 41,954,385 shares outstanding as of December 31, 2022 and 2021, respectively | 5 | | | 4 | |
| Class B common stock, $0.0001 par value; 500,000,000 shares authorized and 118,645,323 and 127,536,463 shares issued and outstanding as of December 31, 2022 and 2021, respectively | 12 | | | 13 | |
| Preferred stock, $0.0001 par value; 500,000,000 shares authorized and 1,000 Series I preferred shares issued and outstanding as of December 31, 2022 and 2021 | — | | | — | |
| Treasury stock, at cost; 1,150,991 shares of Class A common stock as of December 31, 2022 and 2021 | (18,448) | | | (18,448) | |
| Class A common stock, $0.0001 par value; 1,000,000,000 shares authorized, 92,680,353 and 49,433,154 shares issued, and 91,608,800 and 48,282,163 shares outstanding as of December 31, 2023 and 2022, respectively | |
| | Class A common stock, $0.0001 par value; 1,000,000,000 shares authorized, 92,680,353 and 49,433,154 shares issued, and 91,608,800 and 48,282,163 shares outstanding as of December 31, 2023 and 2022, respectively | |
| | Class A common stock, $0.0001 par value; 1,000,000,000 shares authorized, 92,680,353 and 49,433,154 shares issued, and 91,608,800 and 48,282,163 shares outstanding as of December 31, 2023 and 2022, respectively | |
| Class B common stock, $0.0001 par value; 500,000,000 shares authorized and 88,048,124 and 118,645,323 shares issued and outstanding as of December 31, 2023 and 2022, respectively | |
| Preferred stock, $0.0001 par value; 500,000,000 shares authorized and 1,000 Series I preferred shares issued and outstanding as of December 31, 2023 and 2022 | |
| Treasury stock, at cost; 1,071,553 and 1,150,991 shares of Class A common stock as of December 31, 2023 and 2022, respectively | |
| Additional paid-in capital | Additional paid-in capital | 804,587 | | | 720,016 | |
| Retained earnings (accumulated deficit) | 61,957 | | | (19,376) | |
| Retained earnings | |
| Noncontrolling interests | Noncontrolling interests | 14,178 | | | 12,435 | |
| Total equity | Total equity | 862,291 | | | 694,644 | |
| TOTAL LIABILITIES, REDEEMABLE NONCONTROLLING INTERESTS AND EQUITY | TOTAL LIABILITIES, REDEEMABLE NONCONTROLLING INTERESTS AND EQUITY | $ | 6,019,849 | | | $ | 5,157,462 | |
The accompanying notes to financial statements are an integral part of these combined and consolidated financial statements
CRESCENT ENERGY COMPANY
COMBINED AND CONSOLIDATED STATEMENTS OF OPERATIONS
| | | | | | | | | | | | | | | | | |
| Year Ended December 31, |
| 2023 | | 2022 | | 2021 |
| (in thousands, except per share amounts) |
| Revenues: | | | | | |
| Oil | $ | 1,750,961 | | | $ | 1,969,070 | | | $ | 883,087 | |
| Natural gas | 371,066 | | | 766,962 | | | 354,298 | |
| Natural gas liquids | 192,870 | | | 268,192 | | | 185,530 | |
| Midstream and other | 67,705 | | | 52,841 | | | 54,062 | |
| Total revenues | 2,382,602 | | | 3,057,065 | | | 1,476,977 | |
| Expenses: | | | | | |
| Lease operating expense | 495,380 | | | 438,753 | | | 243,501 | |
| Workover expense | 58,441 | | | 66,864 | | | 10,842 | |
| Asset operating expense | 86,593 | | | 78,709 | | | 45,940 | |
| Gathering, transportation and marketing | 235,153 | | | 177,078 | | | 187,059 | |
| Production and other taxes | 162,963 | | | 238,381 | | | 108,992 | |
| Depreciation, depletion and amortization | 675,782 | | | 532,926 | | | 312,787 | |
| Impairment expense | 153,495 | | | 142,902 | | | — | |
| Exploration expense | 9,328 | | | 3,425 | | | 1,180 | |
| Midstream operating expense | 39,809 | | | 13,513 | | | 13,389 | |
| General and administrative expense | 140,918 | | | 84,990 | | | 78,342 | |
| Gain on sale of assets | — | | | (4,641) | | | (8,794) | |
| Total expenses | 2,057,862 | | | 1,772,900 | | | 993,238 | |
| Income (loss) from operations | 324,740 | | | 1,284,165 | | | 483,739 | |
| Other income (expense): | | | | | |
| Gain (loss) on derivatives | 166,980 | | | (676,902) | | | (866,020) | |
| Interest expense | (145,807) | | | (95,937) | | | (50,740) | |
| Other income (expense) | (282) | | | 949 | | | 120 | |
| Income from equity affiliates | (413) | | | 4,616 | | | 368 | |
| Total other income (expense) | 20,478 | | | (767,274) | | | (916,272) | |
| Income (loss) before taxes | 345,218 | | | 516,891 | | | (432,533) | |
| Income tax benefit (expense) | (23,227) | | | (36,291) | | | 306 | |
| Net income (loss) | 321,991 | | | 480,600 | | | (432,227) | |
| Less: net (income) loss attributable to Predecessor | — | | | — | | 339,168 | |
| Less: net (income) loss attributable to noncontrolling interests | (472) | | | (2,669) | | | 14,922 | |
| Less: net (income) loss attributable to redeemable noncontrolling interests | (253,909) | | | (381,257) | | | 58,761 | |
| Net income (loss) attributable to Crescent Energy | $ | 67,610 | | | $ | 96,674 | | | $ | (19,376) | |
| Net income (loss) per share: | | | | | |
| Class A – basic | $ | 1.02 | | | $ | 2.20 | | | $ | (0.46) | |
| Class A – diluted | $ | 1.02 | | | $ | 2.20 | | | $ | (0.46) | |
| Class B – basic and diluted | $ | — | | | $ | — | | | $ | — | |
| Weighted average shares outstanding: | | | | | |
| Class A – basic | 66,598 | | | 43,865 | | | 41,954 | |
| Class A – diluted | 67,402 | | | 44,112 | | | 41,954 | |
| Class B – basic and diluted | 104,271 | | | 124,857 | | | 127,536 | |
The accompanying notes to financial statements are an integral part of these combined and consolidated financial statements
CRESCENT ENERGY COMPANY
COMBINED AND CONSOLIDATED STATEMENTS OF OPERATIONS
| | | | | | | | | | | | | | | | | |
| Year Ended December 31, |
| 2022 | | 2021 | | 2020 |
| (in thousands, except per share amounts) |
| Revenues: | | | | | |
| Oil | $ | 1,969,070 | | | $ | 883,087 | | | $ | 491,780 | |
| Natural gas | 766,962 | | | 354,298 | | | 149,317 | |
| Natural gas liquids | 268,192 | | | 185,530 | | | 69,902 | |
| Midstream and other | 52,841 | | | 54,062 | | | 43,222 | |
| Total revenues | 3,057,065 | | | 1,476,977 | | | 754,221 | |
| Expenses: | | | | | |
| Lease operating expense | 438,753 | | | 243,501 | | | 202,180 | |
| Workover expense | 66,864 | | | 10,842 | | | 6,385 | |
| Asset operating expense | 78,709 | | | 45,940 | | | 39,023 | |
| Gathering, transportation and marketing | 177,078 | | | 187,059 | | | 173,122 | |
| Production and other taxes | 238,381 | | | 108,992 | | | 61,124 | |
| Depreciation, depletion and amortization | 532,926 | | | 312,787 | | | 372,300 | |
| Impairment expense | 142,902 | | | — | | | 247,215 | |
| Exploration expense | 3,425 | | | 1,180 | | | 486 | |
| Midstream operating expense | 13,513 | | | 13,389 | | | 9,472 | |
| General and administrative expense | 84,990 | | | 78,342 | | | 16,542 | |
| Gain on sale of assets | (4,641) | | | (8,794) | | | — | |
| Total expenses | 1,772,900 | | | 993,238 | | | 1,127,849 | |
| Income (loss) from operations | 1,284,165 | | | 483,739 | | | (373,628) | |
| Other income (expense): | | | | | |
| Gain (loss) on derivatives | (676,902) | | | (866,020) | | | 195,284 | |
| Interest expense | (95,937) | | | (50,740) | | | (38,107) | |
| Other income (expense) | 949 | | | 120 | | | 341 | |
| Income from equity affiliates | 4,616 | | | 368 | | | — | |
| Total other income (expense) | (767,274) | | | (916,272) | | | 157,518 | |
| Income (loss) before taxes | 516,891 | | | (432,533) | | | (216,110) | |
| Income tax benefit (expense) | (36,291) | | | 306 | | | (14) | |
| Net income (loss) | 480,600 | | | (432,227) | | | (216,124) | |
| Less: net (income) loss attributable to Predecessor | — | | | 339,168 | | 118,649 | |
| Less: net (income) loss attributable to noncontrolling interests | (2,669) | | | 14,922 | | | 97,475 | |
| Less: net (income) loss attributable to redeemable noncontrolling interests | (381,257) | | | 58,761 | | — | |
| Net income (loss) attributable to Crescent Energy | $ | 96,674 | | | $ | (19,376) | | | $ | — | |
| Net income (loss) per Share: | | | | | |
| Class A - basic | $ | 2.20 | | | $ | (0.46) | | | |
| Class A - diluted | $ | 2.20 | | | $ | (0.46) | | | |
| Class B - basic and diluted | $ | — | | | $ | — | | | |
| Weighted Average Shares Outstanding: | | | | | |
| Class A - basic | 43,865 | | | 41,954 | | | |
| Class A - diluted | 44,112 | | | 41,954 | | | |
| Class B - basic and diluted | 124,857 | | | 127,536 | | | |
The accompanying notes to financial statements are an integral part of these combined and consolidated financial statements
CRESCENT ENERGY COMPANY
COMBINED AND CONSOLIDATED STATEMENTS OF CHANGES IN EQUITY
(in thousands)
| | Predecessor | |
| Class A Units | |
| Class A Units | |
| Class A Units | | | Members'
Equity | | Class A Common Stock | | Class B Common Stock | | Series I Preferred Stock | | Treasury Stock | | Additional Paid-in Capital | | Retained Earnings (Accumulated Deficit) | | Noncontrolling Interest | | Total |
| | | Shares | |
| | | Predecessor | | Crescent Energy Company | |
| | Class A Units | | Members'
Equity | | Class A Common Stock | | Class B Common Stock | | Series I Preferred Stock | | Treasury Stock | | Additional Paid-in Capital | | Retained Earnings (Accumulated Deficit) | | Noncontrolling Interest | | Total |
| | Shares | | Amount | | Shares | | Amount | | Shares | | Amount | | Shares | | Amount | |
| | Balance at January 1, 2020 | — | | | 1,881,733 | | | — | | | — | | | — | | | — | | | — | | | — | | | — | | | — | | | — | | | — | | | 830,333 | | | 2,712,066 | |
| Net loss | — | | | (118,649) | | | — | | | — | | | — | | | — | | | — | | | — | | | — | | | — | | | — | | | — | | | (97,475) | | | (216,124) | |
| Contributions | — | | | 4,704 | | | — | | | — | | | — | | | — | | | — | | | — | | | — | | | — | | | — | | | — | | | — | | | 4,704 | |
| Distributions | — | | | (61,421) | | | — | | | — | | | — | | | — | | | — | | | — | | | — | | | — | | | — | | | — | | | (1,146) | | | (62,567) | |
| Issuance of Class A Units in exchange for the Contributed Entities | 620 | | | — | | | — | | | — | | | — | | | — | | | — | | | — | | | — | | | — | | | — | | | — | | | — | | | — | |
| Reclassification of noncontrolling interests | — | | | (101,926) | | | — | | | — | | | — | | | — | | | — | | | — | | | — | | | — | | | — | | | — | | | 101,926 | | | — | |
| Issuance of Class A Units in exchange for the acquisition of Titan Energy | 380 | | | 455,081 | | | — | | | — | | | — | | | — | | | — | | | — | | | — | | | — | | | — | | | — | | | — | | | 455,081 | |
| December 2020 Exchange | 220 | | | 657,370 | | | — | | | — | | | — | | | — | | | — | | | — | | | — | | | — | | | — | | | — | | | (657,370) | | | — | |
| | Balance at December 31, 2020 | |
| | Balance at December 31, 2020 | |
| | Balance at December 31, 2020 | Balance at December 31, 2020 | 1,220 | | | 2,716,892 | | | — | | | — | | | — | | | — | | | — | | | — | | | — | | | — | | | — | | | — | | | 176,268 | | | 2,893,160 | |
| Net loss attributable to Predecessor | Net loss attributable to Predecessor | — | | | (339,168) | | | — | | | — | | | — | | | — | | | — | | | — | | | — | | | — | | | — | | | — | | | — | | | (339,168) | |
| Contributions | Contributions | — | | | 7,275 | | | — | | | — | | | — | | | — | | | — | | | — | | | — | | | — | | | — | | | — | | | 35,460 | | | 42,735 | |
| Distributions | Distributions | — | | | (35,331) | | | — | | | — | | | — | | | — | | | — | | | — | | | — | | | — | | | — | | | — | | | (1,175) | | | (36,506) | |
| Noncontrolling Interest Carve-out | Noncontrolling Interest Carve-out | — | | | — | | | — | | | — | | | — | | | — | | | — | | | — | | | — | | | — | | | — | | | — | | | (121,872) | | | (121,872) | |
| April 2021 exchange | April 2021 exchange | 10 | | | 62,051 | | | — | | | — | | | — | | | — | | | — | | | — | | | — | | | — | | | — | | | — | | | (62,051) | | | — | |
| Repurchase of noncontrolling interest | Repurchase of noncontrolling interest | — | | | — | | | — | | | — | | | — | | | — | | | — | | | — | | | — | | | — | | | — | | | — | | | (2,462) | | | (2,462) | |
| Merger Transactions | Merger Transactions | (1,230) | | | (2,411,719) | | | 43,105 | | | 4 | | | 127,536 | | | 13 | | | 1 | | | — | | | — | | | — | | | 712,341 | | | — | | | — | | | (1,699,361) | |
| Net loss | Net loss | — | | | — | | | — | | | — | | | — | | | — | | | — | | | — | | | — | | | — | | | — | | | (19,376) | | | (14,922) | | | (34,298) | |
| Equity-based compensation, net of withholding taxes | Equity-based compensation, net of withholding taxes | — | | | — | | | (1,151) | | | — | | | — | | | — | | | — | | | — | | | 1,151 | | | (18,448) | | | 23,987 | | | — | | | 3,189 | | | 8,728 | |
| Cancellation of OpCo Units associated with repurchase of treasury stock | Cancellation of OpCo Units associated with repurchase of treasury stock | — | | | — | | | — | | | — | | | — | | | — | | | — | | | — | | | — | | | — | | | (16,091) | | | — | | | — | | | (16,091) | |
| Change in deferred taxes attributable to change in OpCo ownership | Change in deferred taxes attributable to change in OpCo ownership | — | | | — | | | — | | | — | | | — | | | — | | | — | | | — | | | — | | | — | | | (221) | | | — | | | — | | | (221) | |
| Balance at December 31, 2021 | Balance at December 31, 2021 | — | | | $ | — | | | 41,954 | | | $ | 4 | | | 127,536 | | | $ | 13 | | | 1 | | | $ | — | | | 1,151 | | | $ | (18,448) | | | $ | 720,016 | | | $ | (19,376) | | | $ | 12,435 | | | $ | 694,644 | |
The accompanying notes to financial statements are an integral part of these combined and consolidated financial statements
CRESCENT ENERGY COMPANY
COMBINED AND CONSOLIDATED STATEMENTS OF CHANGES IN EQUITY
(in thousands)
| | | Crescent Energy Company | |
| | Class A Common Stock | | Class B Common Stock | | Series I Preferred Stock | | Treasury Stock | | Additional Paid-in Capital | | Retained Earnings (Accumulated Deficit) | | Noncontrolling Interest | | Total |
| | Shares | | Amount | | Shares | | Amount | | Shares | | Amount | | Shares | | Amount | | Noncontrolling Interest |
| | | Crescent Energy Company | |
| | | Crescent Energy Company | |
| | | Crescent Energy Company | |
| | | | | Class A Common Stock | |
| | | | | Class A Common Stock | |
| | | | | Class A Common Stock | |
| | | Shares | |
| | | Shares | |
| | | Shares | |
| Balance at December 31, 2021 | |
| Balance at December 31, 2021 | |
| Balance at December 31, 2021 | Balance at December 31, 2021 | | 41,954 | | | $ | 4 | | | 127,536 | | | $ | 13 | | | 1 | | | $ | — | | | 1,151 | | | $ | (18,448) | | | $ | 720,016 | | | $ | (19,376) | | | $ | 12,435 | | | $ | 694,644 | |
| Net income (loss) | Net income (loss) | | — | | | — | | | — | | | — | | | — | | | — | | | — | | | — | | | — | | | 96,674 | | | 2,669 | | | 99,343 | |
| Net income (loss) | |
| Net income (loss) | |
| Contributions | |
| Contributions | |
| Contributions | Contributions | | — | | | — | | | — | | | — | | | — | | | — | | | — | | | — | | | — | | | — | | | 1,533 | | | 1,533 | |
| Distributions | Distributions | | — | | | — | | | — | | | — | | | — | | | — | | | — | | | — | | | — | | | — | | | (7,884) | | | (7,884) | |
| Distributions | |
| Distributions | |
| Repurchase of noncontrolling interest | |
| Repurchase of noncontrolling interest | |
| Repurchase of noncontrolling interest | Repurchase of noncontrolling interest | | — | | | — | | | — | | | — | | | — | | | — | | | — | | | — | | | — | | | — | | | (4,060) | | | (4,060) | |
| Dividend to Class A common stock | Dividend to Class A common stock | | — | | | — | | | — | | | — | | | — | | | — | | | — | | | — | | | (12,168) | | | (15,341) | | | — | | | (27,509) | |
| Dividend to Class A common stock | |
| Dividend to Class A common stock | |
| Equity based compensation | Equity based compensation | | — | | | — | | | — | | | — | | | — | | | — | | | — | | | — | | | 6,899 | | | — | | | 9,485 | | | 16,384 | |
| Equity based compensation | |
| Equity based compensation | |
| Change in deferred taxes related to basis in OpCo | |
| Change in deferred taxes related to basis in OpCo | |
| Change in deferred taxes related to basis in OpCo | Change in deferred taxes related to basis in OpCo | | — | | | — | | | — | | | — | | | — | | | — | | | — | | | — | | | (26,351) | | | — | | | — | | | (26,351) | |
| | Change in deferred taxes related to basis differences associated with the Equity Transactions | Change in deferred taxes related to basis differences associated with the Equity Transactions | | — | | | — | | | — | | | — | | | — | | | — | | | — | | | — | | | (5,599) | | | — | | | — | | | (5,599) | |
| | Change in deferred taxes related to basis differences associated with the Equity Transactions | |
| | Change in deferred taxes related to basis differences associated with the Equity Transactions | |
| Change in equity associated with the Equity Transactions | |
| Change in equity associated with the Equity Transactions | |
| Change in equity associated with the Equity Transactions | Change in equity associated with the Equity Transactions | | 6,328 | | | 1 | | | (8,891) | | | (1) | | | — | | | — | | | — | | | — | | | 121,790 | | | — | | | — | | | 121,790 | |
| Balance at December 31, 2022 | Balance at December 31, 2022 | | 48,282 | | | $ | 5 | | | 118,645 | | | $ | 12 | | | 1 | | | $ | — | | | 1,151 | | | $ | (18,448) | | | $ | 804,587 | | | $ | 61,957 | | | $ | 14,178 | | | $ | 862,291 | |
| Balance at December 31, 2022 | |
| Balance at December 31, 2022 | |
| Net income (loss) | |
| Net income (loss) | |
| Net income (loss) | |
| Contributions | |
| Contributions | |
| Contributions | |
| Distributions | |
| Distributions | |
| Distributions | |
| | Dividend to Class A common stock | |
| | Dividend to Class A common stock | |
| | Dividend to Class A common stock | |
| Equity based compensation | |
| Equity based compensation | |
| Equity based compensation | |
| | Change in deferred taxes related to basis differences associated with the Class A Conversions | |
| | Change in deferred taxes related to basis differences associated with the Class A Conversions | |
| | Change in deferred taxes related to basis differences associated with the Class A Conversions | |
| Change in equity associated with the Class A Conversions | |
| Change in equity associated with the Class A Conversions | |
| Change in equity associated with the Class A Conversions | |
| Change in deferred taxes related to basis differences associated with the Equity Issuance | |
| Change in deferred taxes related to basis differences associated with the Equity Issuance | |
| Change in deferred taxes related to basis differences associated with the Equity Issuance | |
| Change in equity associated with the Equity Issuance | |
| Change in equity associated with the Equity Issuance | |
| Change in equity associated with the Equity Issuance | |
| Balance at December 31, 2023 | |
| Balance at December 31, 2023 | |
| Balance at December 31, 2023 | |
The accompanying notes to financial statements are an integral part of these combined and consolidated financial statements
| | | | | | | | | | | | | | | | | |
| CRESCENT ENERGY COMPANY |
| COMBINED AND CONSOLIDATED STATEMENTS OF CASH FLOWS |
| | | | | |
| Year Ended December 31, |
| 2023 | | 2022 | | 2021 |
| Cash flows from operating activities: | (in thousands) |
| Net income (loss) | $ | 321,991 | | | $ | 480,600 | | | $ | (432,227) | |
| Adjustments to reconcile net income (loss) to net cash provided by operating activities: | | | | | |
| Depreciation, depletion and amortization | 675,782 | | | 532,926 | | | 312,787 | |
| | | | | |
| Impairment expense | 153,495 | | | 142,902 | | | — | |
| Deferred income tax expense (benefit) | 22,733 | | | 33,178 | | | (935) | |
| Gain on sale of oil and natural gas properties | — | | | (4,641) | | | (8,794) | |
| (Gain) loss on derivatives | (166,980) | | | 676,902 | | | 866,020 | |
| Net cash (paid) received on settlement of derivatives | (153,734) | | | (779,260) | | | (535,269) | |
| Non-cash equity-based compensation expense | 82,936 | | | 38,063 | | | 39,919 | |
| Amortization of debt issuance costs and discount | 12,826 | | | 8,894 | | | 7,647 | |
| Write-off of debt issuance costs | — | | | — | | | 2,541 | |
| Restructuring of acquired derivative contracts | — | | | (51,994) | | | — | |
| Settlement of acquired derivative contracts | (61,455) | | | (49,929) | | | — | |
| Other | (24,205) | | | (7,011) | | | (928) | |
| Changes in operating assets and liabilities: | | | | | |
| Accounts receivable | (42,091) | | | (128,820) | | | (71,301) | |
| Accounts receivable – affiliates | 573 | | | 18,360 | | | (20,333) | |
| Prepaid and other current assets | (6,523) | | | (24,932) | | | 39,986 | |
| Accounts payable and accrued liabilities | 91,822 | | | 127,620 | | | 31,110 | |
| Accounts payable – affiliates | 20,773 | | | 12,044 | | | (358) | |
| Other | 7,826 | | | (12,530) | | | 3,282 | |
| Net cash provided by operating activities | 935,769 | | | 1,012,372 | | | 233,147 | |
| Cash flows from investing activities: | | | | | |
| Development of oil and natural gas properties | (581,350) | | | (592,707) | | | (155,607) | |
| Acquisitions of oil and natural gas properties, net of cash acquired | (849,254) | | | (626,620) | | | (115,076) | |
| Proceeds from the sale of oil and natural gas properties | 28,946 | | | 93,203 | | | 25,723 | |
| Purchases of restricted investment securities – HTM | (12,428) | | | (8,956) | | | (8,537) | |
| Maturities of restricted investment securities – HTM | 12,522 | | | 7,200 | | | 11,703 | |
| Other | 2,764 | | | 3,536 | | | (2,801) | |
| Net cash used in investing activities | $ | (1,398,800) | | | $ | (1,124,344) | | | $ | (244,595) | |
| | | | | |
| | | | | |
| | | | | |
| | | | | |
| | | | | |
| | | | | |
| | | | | |
| | | | | |
| | | | | |
| | | | | |
| | | | | |
| The accompanying notes to financial statements are an integral part of these combined and consolidated financial statements |
| | | | | |
| | | | | | | | | | | | | | | | | |
| CRESCENT ENERGY COMPANY |
| COMBINED AND CONSOLIDATED STATEMENTS OF CASH FLOWS |
| | | | | |
| Year Ended December 31, |
| 2023 | | 2022 | | 2021 |
| Cash flows from financing activities: | | | | | |
| Proceeds from the issuance of Senior Notes, after premium, discount and underwriting fees | $ | 984,625 | | | $ | 199,250 | | | $ | 490,625 | |
| Revolving Credit Facility borrowings | 2,283,800 | | | 1,385,000 | | | 702,000 | |
| Revolving Credit Facility repayments | (2,819,748) | | | (1,369,000) | | | (159,000) | |
| Payment of debt issuance costs | (7,241) | | | (20,051) | | | (14,611) | |
| Prior Credit Agreement borrowings | — | | | — | | | 53,900 | |
| Prior Credit Agreement repayments | — | | | — | | | (804,975) | |
| Proceeds from the Equity Issuance after underwriting fees | 145,665 | | | — | | | — | |
| Payment of Equity Issuance costs | (2,340) | | | — | | | — | |
| Redeemable noncontrolling interest contributions | 1,238 | | | 5,985 | | | — | |
| Redeemable noncontrolling interest distributions | (417) | | | (213) | | | — | |
| Repayments of debt acquired in Merger Transactions | — | | | — | | | (140,000) | |
| Dividend to Class A common stock | (34,120) | | | (27,509) | | | — | |
| Distributions to redeemable noncontrolling interests related to Class A common stock dividend | (56,259) | | | (78,855) | | | — | |
| Distributions to redeemable noncontrolling interests related to Manager Compensation | (33,236) | | | (32,250) | | | — | |
| Distributions to redeemable noncontrolling interests related to income taxes | (798) | | | (18,118) | | | — | |
| Repurchase of redeemable noncontrolling interests related to Equity Transactions | — | | | (36,220) | | | — | |
| Noncontrolling interest contributions | 1,771 | | | 55 | | | 35,460 | |
| Repurchase of noncontrolling interest | — | | | (4,060) | | | (2,462) | |
| Member distributions | — | | | — | | | (35,331) | |
| Noncontrolling interest distributions | (2,500) | | | (6,477) | | | (1,695) | |
| Cash paid for treasury stock acquired for equity-based compensation tax withholding | (72) | | | — | | | (18,448) | |
| Other and member contributions | (3,912) | | | (5,378) | | | (318) | |
| Net cash provided by (used in) financing activities | 456,456 | | | (7,841) | | | 105,145 | |
| Net change in cash, cash equivalents and restricted cash | (6,575) | | | (119,813) | | | 93,697 | |
| Cash, cash equivalents and restricted cash, beginning of period | 15,304 | | | 135,117 | | | 41,420 | |
| Cash, cash equivalents, and restricted cash, end of period | $ | 8,729 | | | $ | 15,304 | | | $ | 135,117 | |
The accompanying notes to financial statements are an integral part of these combined and consolidated financial statements
| | | | | | | | | | | | | | | | | |
| CRESCENT ENERGY COMPANY |
| COMBINED AND CONSOLIDATED STATEMENTS OF CASH FLOWS |
| | | | | |
| Year Ended December 31, |
| 2022 | | 2021 | | 2020 |
| Cash flows from operating activities: | (in thousands) |
| Net income (loss) | $ | 480,600 | | | $ | (432,227) | | | $ | (216,124) | |
| Adjustments to reconcile net income (loss) to net cash provided by operating activities: | | | | | |
| Depreciation, depletion and amortization | 532,926 | | | 312,787 | | | 372,300 | |
| | | | | |
| Impairment expense | 142,902 | | | — | | | 247,215 | |
| Deferred income tax expense (benefit) | 33,178 | | | (935) | | | — | |
| Gain on sale of oil and natural gas properties | (4,641) | | | (8,794) | | | — | |
| (Gain) loss on derivatives | 676,902 | | | 866,020 | | | (195,284) | |
| Net cash (paid) received on settlement of derivatives | (779,260) | | | (535,269) | | | 186,495 | |
| Non-cash equity-based compensation expense | 38,063 | | | 39,919 | | | (797) | |
| Amortization of debt issuance costs and discount | 8,894 | | | 7,647 | | | 4,941 | |
| Write-off of debt issuance costs | — | | | 2,541 | | | — | |
| Restructuring of acquired derivative contracts | (51,994) | | | — | | | — | |
| Settlement of acquired derivative contracts | (49,929) | | | — | | | — | |
| Other | (7,011) | | | (928) | | | (29) | |
| Changes in operating assets and liabilities: | | | | | |
| Accounts receivable | (128,820) | | | (71,301) | | | 14,652 | |
| Accounts receivable – affiliates | 18,360 | | | (20,333) | | | — | |
| Prepaid and other current assets | (24,932) | | | 39,986 | | | 17,886 | |
| Accounts payable and accrued liabilities | 127,620 | | | 31,110 | | | (15,138) | |
| Accounts payable – affiliates | 12,044 | | | (358) | | | 657 | |
| Other | (12,530) | | | 3,282 | | | (5,746) | |
| Net cash provided by operating activities | 1,012,372 | | | 233,147 | | | 411,028 | |
| Cash flows from investing activities: | | | | | |
| Development of oil and natural gas properties | (592,707) | | | (155,607) | | | (126,164) | |
| Acquisitions of oil and natural gas properties, net of cash acquired | (626,620) | | | (115,076) | | | — | |
| Proceeds from the sale of oil and natural gas properties | 93,203 | | | 25,723 | | | 9,362 | |
| Purchases of restricted investment securities – HTM | (8,956) | | | (8,537) | | | (9,071) | |
| Maturities of restricted investment securities – HTM | 7,200 | | | 11,703 | | | 9,052 | |
| Other | 3,536 | | | (2,801) | | | (8,119) | |
| Net cash used in investing activities | $ | (1,124,344) | | | $ | (244,595) | | | $ | (124,940) | |
| | | | | |
| | | | | |
| | | | | |
| | | | | |
| | | | | |
| | | | | |
| | | | | |
| | | | | |
| | | | | |
| | | | | |
| | | | | |
| The accompanying notes to financial statements are an integral part of these combined and consolidated financial statements |
| | | | | |
| | | | | | | | | | | | | | | | | |
| CRESCENT ENERGY COMPANY |
| COMBINED AND CONSOLIDATED STATEMENTS OF CASH FLOWS |
| | | | | |
| Year Ended December 31, |
| 2022 | | 2021 | | 2020 |
| Cash flows from financing activities: | | | | | |
| Proceeds from issuance of the 2026 Notes, net of discount | $ | 199,250 | | | $ | 490,625 | | | $ | — | |
| Revolving Credit Facility borrowings | 1,385,000 | | | 702,000 | | | — | |
| Revolving Credit Facility repayments | (1,369,000) | | | (159,000) | | | — | |
| Payment of debt issuance costs | (20,051) | | | (14,611) | | | (3,333) | |
| Prior Credit Agreement borrowings | — | | | 53,900 | | | 275,850 | |
| Prior Credit Agreement repayments | — | | | (804,975) | | | (496,875) | |
| Redeemable noncontrolling interest contributions | 5,985 | | | — | | | — | |
| Redeemable noncontrolling interest distributions | (213) | | | — | | | — | |
| Repayments of debt acquired in Merger Transactions | — | | | (140,000) | | | — | |
| Dividend to Class A common stock | (27,509) | | | — | | | — | |
| Distributions to redeemable noncontrolling interests related to Class A common stock dividend | (78,855) | | | — | | | — | |
| Distributions to redeemable noncontrolling interests related to Manager Compensation | (32,250) | | | — | | | — | |
| Distributions to redeemable noncontrolling interests related to income taxes | (18,118) | | | — | | | — | |
| Repurchase of redeemable noncontrolling interests related to Equity Transactions | (36,220) | | | — | | | — | |
| Noncontrolling interest contributions | 55 | | | 35,460 | | | — | |
| Repurchase of noncontrolling interest | (4,060) | | | (2,462) | | | — | |
| Member distributions | — | | | (35,331) | | | (61,422) | |
| Noncontrolling interest distributions | (6,477) | | | (1,695) | | | (1,145) | |
| Cash paid for treasury stock acquired for equity-based compensation tax withholding | — | | | (18,448) | | | — | |
| Other and member contributions | (5,378) | | | (318) | | | 14,836 | |
| Net cash provided by (used in) financing activities | (7,841) | | | 105,145 | | | (272,089) | |
| Net change in cash, cash equivalents and restricted cash | (119,813) | | | 93,697 | | | 13,999 | |
| Cash, cash equivalents and restricted cash, beginning of period | 135,117 | | | 41,420 | | | 27,421 | |
| Cash, cash equivalents, and restricted cash, end of period | $ | 15,304 | | | $ | 135,117 | | | $ | 41,420 | |
The accompanying notes to financial statements are an integral part of these combined and consolidated financial statements
CRESCENT ENERGY COMPANY
NOTES TO COMBINED AND CONSOLIDATED FINANCIAL STATEMENTS
(Except as noted within the context of each footnote disclosure, the dollar amounts presented in the tabular data within these footnote disclosures are stated in thousands of dollars.)
Unless otherwise stated or the context otherwise indicates, all references to “we,” “us,” “our,” "Crescent," "Independence" and the “Company” or similar expressions for time periods prior to the Merger Transactions refer to Independence Energy LLC and its subsidiaries, our predecessor for accounting purposes. For time periods subsequent to the Merger Transactions, these terms refer to Crescent Energy Company and its subsidiaries.
NOTE 1 – Organization and Basis of Presentation
Organization
We are a well-capitalizeddifferentiated U.S. independent energy company withcommitted to delivering value for shareholders through a disciplined growth through acquisition strategy and consistent return of capital. Our portfolio of low-decline, cash-flow oriented assets in proven regions across the lower 48 states that generate substantial cash flow supported bycomprises both mid-cycle unconventional and conventional assets with a predictable baselong reserve life and deep inventory of production. We seek to deliver attractive risk-adjusted investment returns and predictable cash flows across cycles by employing our differentiated approach to investinglow-risk, high-return development locations in the oilEagle Ford and natural gas industry. Our approach employs a unique business model that combines an investor mindset and deep operational expertise to pursue a cash flow-based investment mandate focused on operated working interests with an active risk management strategy. We pursue our strategy through the production, development and acquisition of crude oil, natural gas and natural gas liquids ("NGLs") reserves. We maintain a diverse portfolio of assets in key proven regions across the United States, focused in Texas and the Rockies.Uinta basins.
We have evaluated how we are organized and managed and have identified only one reportable segment, which is the exploration and production of crude oil, natural gas and NGLs. We consider our gathering, processing and marketing functions as ancillary to our oil and gas producing activities. All of our operations and assets are located in the United States, and our revenues are attributable to United States customers.
Corporate Structure
Our Class A Common Stock is listed on the New York Stock Exchange under the symbol “CRGY.” We are structured as an “Up-C,” with substantially all of our assets and operations held by Crescent Energy OpCo LLC ("OpCo"). Crescent is a holding company, the sole material assetassets of which consists ofare units of OpCo ("OpCo Units"). The assets and liabilities of OpCo represent substantially all of our consolidated assets and liabilities with the exception of certain current and deferred taxes and certain liabilities under the Management Agreement, as defined within NOTE 14 - Related Party Transactions. Certain restrictions and covenants related to the transfer of assets from OpCo are discussed further in NOTE 8 - Debt. Shares of Crescent Class A common stock, par value $0.0001 per share ("Class A Common Stock") have both voting and economic rights with respect to Crescent. Holders of Crescent Class B common stock, par value $0.0001 per share ("Class B Common Stock"), which shares of Class B Common Stock have voting (but no economic) rights with respect to Crescent, hold a corresponding amount of economic, non-voting OpCo Units. OpCo Units may be redeemed or exchanged for Class A Common Stock or, at our election, cash on the terms and conditions set forth in the Amended and Restated Limited Liability Company Agreement of OpCo (“OpCo LLC Agreement”). Additionally, an affiliate KKR & Co. Inc. (together with its subsidiaries, the "KKR Group") is the sole holder of Crescent's non-economic Series I preferred stock, $0.0001 par value per share, which entitles the holder thereof to appoint the Board of Directors of Crescent and to certain other approval rights.
Basis of Presentation
Our combined and consolidated financial statements (the “financial statements”) include the accounts of the Company and its subsidiaries after the elimination of intercompany transactions and balances and are presented in accordance with U.S. general accepted accounting principles (“GAAP”). We have no elements of other comprehensive income for the periods presented.
In August 2020, through a series of transactions, we underwent a reorganization (the “Independence Reorganization”) in connection with the Titan Acquisition (as defined in NOTE 3 – Acquisitions and Divestitures), carried out under the direction of our Managing Member (as defined in our Amended and Restated Limited Liability Company Agreement, dated August 18, 2020), whereby certain entities (the “Contributed Entities”) previously owned and under the common control of affiliates of the KKR Group were contributed to us. The financial statements include the accounts of the Contributed Entities from the date of the Independence Reorganization, which is the date the Company obtained a controlling financial interest in the Contributed Entities on a consolidated basis. As required by GAAP, the contributions of the Contributed Entities in connection with the
Independence Reorganization were accounted for as a reorganization of entities under common control, in a manner similar to a pooling of interests, with all assets and liabilities transferred to us at their carrying amounts. In connection with the series of transactions completed on December 7, 2021 (the "Merger Transactions"), Independence Energy LLC ("Independence") merged with and into OpCo in a common control transaction that is referred to herein as the "Crescent Reorganization." BecauseThe contribution of the assets and liabilities of Independence in connection with the Crescent Reorganization andwas accounted for as a reorganization of entities under common control, in a manner similar to a pooling of interests. Because the Crescent Reorganization resulted in changes in the reporting entity, and in order to furnish comparative financial information prior to the Independence Reorganization and the Crescent Reorganization, our financial statements have been retrospectively recast to reflect the historical accounts of the Contributed Entities and Independence, our accounting predecessor (the "Predecessor"), on a combined basis.
Crescent is a holding company that conducts substantially all of its business through its consolidated subsidiaries, including (i) OpCo, which, as of December 31, 2023 and 2022, respectively, is owned approximately 51% and 29% by Crescent and approximately 49% and 71% by holders of our redeemable noncontrolling interests representing former owners of
Independence, and (ii) Crescent Energy Finance LLC, OpCo's wholly owned subsidiary. Crescent and OpCo have no operations, or material cash flows, assets or liabilities other than their investment in Crescent Energy Finance LLC. As the sole managing member of OpCo, Crescent is responsible for all operational, management and administrative decisions related to OpCo’s business. Because the unit holders of OpCo lack the characteristics of a controlling financial interest, OpCo was determined to be a variable interest entity. Crescent is considered the primary beneficiary of OpCo as it has both the power to direct OpCo and the right to receive benefits from OpCo. As a result, Crescent consolidates the financial results of OpCo and its subsidiaries, including Crescent Energy Finance LLC. See “— Corporate Structure” above for more information regarding our corporate structure.
The financial statements include undivided interests in oil and natural gas properties. We account for our share of oil and natural gas properties by reporting our proportionate share of assets, liabilities, revenues, costs, and cash flows within the accompanying consolidated balance sheets, combined and consolidated statements of operations, and combined and consolidated statements of cash flows.
NOTE 2 – Summary of Significant Accounting Policies
Use of Estimates
The preparation of financial statements in conformity with GAAP requires management to make use of estimates and assumptions that affect the reported amount of assets and liabilities and disclosure of contingent assets and liabilities at the date of the financial statements and the reported amounts of revenues and expenses during the reporting period. We use historical experience and various other assumptions and information that are believed to be reasonable under the circumstances in developing our estimates and judgments. Estimates and assumptions about future events and their effects cannot be predicted with certainty and, accordingly, these estimates may change as new events occur, as more experience is acquired, as additional information is obtained and as our operating environment changes. While we believe that the estimates and assumptions used in the preparation of the financial statements are appropriate, actual results may differ from these estimates. Our significant estimates include the fair value of acquired assets and liabilities, oil and natural gas reserves, impairment of proved and unproved oil and natural gas properties, impairment of goodwill, and valuation of derivative instruments.instruments and income taxes.
Cash and Cash Equivalents
Cash and cash equivalents consist of cash deposited in commercial bank accounts and highly liquid investments purchased with an original maturity of three months or less at the date of purchase. Cash and cash equivalents are maintained with major financial institutions in the U.S. Deposits with these financial institutions may exceed the amount of insurance provided on such deposits; however, the financial stability of the financial institutions is regularly monitored, and we believe that we do not have exposure to any significant default risk.
Restricted Cash
Restricted cash consists of funds earmarked for a special purpose and therefore not available for immediate and general use. The majority of our restricted cash is comprised of cash that is contractually required to be restricted to pay for the future abandonment of certain wells in California. Restricted cash is included in otherOther current assets and Other assets on our consolidated balance sheets.
The following table provides a reconciliation of cash and restricted cash presented on our consolidated balance sheets to amounts shown in our combined and consolidated statements of cash flows:
| | | | | | | | | | | | | | | | | |
| As of December 31, |
| 2023 | | 2022 | | 2021 |
| (in thousands) |
| Cash and cash equivalents | $ | 2,974 | | | $ | — | | | $ | 128,578 | |
| Restricted cash – current | 261 | | | 8,000 | | | — | |
| Restricted cash – noncurrent | 5,494 | | | 7,304 | | | 6,539 | |
| Total cash, cash equivalents and restricted cash | $ | 8,729 | | | $ | 15,304 | | | $ | 135,117 | |
Accounts Receivable
| | | | | | | | | | | | | | | | | |
| As of December 31, |
| 2022 | | 2021 | | 2020 |
| (in thousands) |
| Cash and cash equivalents | $ | — | | | $ | 128,578 | | | $ | 36,861 | |
| Restricted cash – current | 8,000 | | | — | | | — | |
| Restricted cash – noncurrent | 7,304 | | | 6,539 | | | 4,559 | |
| Total cash, cash equivalents and restricted cash | $ | 15,304 | | | $ | 135,117 | | | $ | 41,420 | |
Accounts Receivable
We routinely assess the recoverability of our accounts receivable, which primarily comprise amounts due from (i) purchasers of our oil, natural gas and NGL production and (ii) joint interest owners on properties that we operate. We monitor our exposure to credit risk primarily by reviewing credit ratings, financial statements and payment history. We extend credit terms based on our evaluation of each counterparty’s creditworthiness. Generally, our oil and natural gas receivables are collected within 45 to 60 days of production. Our joint interest billings are collected within the month after they are billed, and we have the ability to withhold future revenue distributions to recover any nonpayment of our joint interest billings.
We establish allowances for credit losses equal to the estimable portions of accounts receivable for which failure to collect is expected to occur primarily based on a historical loss rate analysis. We estimate uncollectible amounts based on the length of time that the accounts receivables have been outstanding, historical collection experience and current and future economic and market conditions. We consider forecasts of future economic conditions in the estimate of our expected credit losses, in particular whether there is an increase in the probability that our counterparties will be unable to pay their obligations when due, and adjust our allowance for expected credit losses, when necessary. Our allowances for expected credit losses were immaterial as of December 31, 20222023 and 2021.2022. We did not incur credit loss expense or bad debt expense related to our accounts receivable during the years ended December 31, 2023, 2022, 2021, and 2020.2021. We do not have any off-balance sheet credit exposure related to our customers.
Restricted Investment Securities
We hold U.S. Treasury securities, which are contractually required to be set aside to pay for the future abandonment of certain wells in California. Due to this restriction, we report these investment securities as noncurrent and include them within otherOther assets on our consolidated balance sheets.
We classify our investment in these debt securities at the acquisition date and re-evaluate the classification at each balance sheet date. We classify debt securities purchased with the positive intent and ability to hold until their maturity date as held-to-maturity investments (“HTM”) and carry these investments at amortized cost. Premiums and discounts on purchases are amortized over the remaining time to maturity of the security and the amortization is recorded as an adjustment to interest income. At each of December 31, 20222023 and 2021,2022, we had restricted investment securities – HTM with a carrying value of
$7.1 million and $5.3 million, respectively. $7.1 million.
Oil and Natural Gas Properties
Oil and natural gas producing activities are accounted for under the successful efforts method of accounting. Under this method, exploration costs, other than the costs of drilling exploratory wells, are charged to expense as incurred. Costs that are associated with the drilling of successful exploration wells are capitalized if proved reserves are found. Capitalized costs attributed to the properties are charged as an operating expense through depreciation, depletion and amortization (“DD&A”). Dry hole costs associated with developing proved fields are capitalized. Costs associated with the drilling of exploratory wells that do not find proved reserves, geological and geophysical costs and costs of certain nonproducingnon-producing leasehold costs are expensed once evaluated and determined to be a dry hole. We incurred exploration expense of $9.3 million, $3.4 million, $1.2 million, and $0.5$1.2 million for the years ended December 31, 2023, 2022 2021 and 2020,2021, respectively.
Delay and surface rentals are charged to expense as incurred. The costs to acquire mineral interests in oil and natural gas properties and lease acquisition costs are capitalized when incurred. If proved reserves are found on an undeveloped property, leasehold costs are transferred to proved properties.
The capitalized costs of producing oil and natural gas properties are depleted on a field-by-field basis using the units-of-production method based on the ratio of current production to estimated total net proved oil, natural gas and NGL reserves.
Proved developed reserves are used in computing depletion rates for drilling and development costs and total proved reserves are used for depletion rates of leasehold costs.
Upon the sale of a complete or partial unit of a proved property or pipeline and related facilities, the cost and related accumulated DD&A are removed from the property accounts and any gain or loss is recognized.
Estimated dismantlement and abandonment costs for oil and natural gas properties are capitalized at their estimated net present value and amortized on a unit-of-production basis over the remaining life of the related proved developed reserves. Refer to Asset Retirement Obligations below for additional discussion.
During the years ended December 31, 2023, 2022 2021 and 2020,2021, we recognized depletion expense of $626.6 million, $498.3 million and $300.0 million, and $364.7 million, respectively.
Other Property, Plant and Equipment
We have other property, plant, and equipment that consists principally of gathering and processing facilities, vehicles, computer hardware and software, office furniture and equipment, buildings and leasehold improvements. Other property, plant, and equipment is recorded at cost and depreciated on a straight-line basis over the estimated useful lives of the respective assets which range from three to thirty years. Leasehold improvements are amortized over the shorter of their economic lives or the lease term. The cost of maintenance and repairs are expensed in the period incurred. Expenditures that extend the life or improve existing property and equipment are capitalized.
Impairment of Oil and Natural Gas Properties
Proved and unproved oil and natural gas properties are reviewed for impairment when events and circumstances indicate a possible decline in the recoverability of the carrying amount of such property. When a triggering event is identified, we compare the carrying amount of our oil and natural gas properties to the estimated undiscounted cash flows our oil and natural gas properties will generate to determine if the carrying amount is recoverable. We perform this analysis on a field-by-field basis. If the carrying amount exceeds the estimated undiscounted cash flows, we will write-down the carrying amount of the oil and natural gas properties to fair value. The factors used to determine fair value include, but are not limited to, estimates of reserves, future commodity prices, future production estimates, and discount rates commensurate with the risk associated with realizing the projected cash flows.
As a result of our annual goodwill impairment test,During the years ended December 31, 2023 and 2022, we determined that there was awere triggering eventevents requiring the evaluation of the recoverability of certain of our oil and natural gas properties. Based on an assessment of our oil and natural gas properties, we recorded impairment expense of $149.6 million and $65.2 million, respectively, during the yearyears ended December 31, 2023 and 2022. We did not incur any impairment expense related to our oil and natural gas properties during the year ended December 31, 2021. In March 2020, crude oil demand experienced significant declines due to the coronavirus disease 2019 (COVID-19) global pandemic and resulting governmental led shut-downs in economic activity. During the second quarter of 2020, as it became apparent that the pandemic would continue indefinitely with sustained significant decline in crude oil prices, we assessed our oil and natural gas properties for impairment and recorded impairment expense of $247.2 million during the year ended December 31, 2020.
Drilling Advances
We pay advances for certain drilling and completion ("D&C") costs on our non-operated properties, as required by our joint operating agreements. At December 31, 20222023 and 2021,2022, we had $14.7$1.0 million and $0.2$14.7 million, respectively, of outstanding advances on our consolidated balance sheets.
InvestmentInvestments in Equity Affiliates
If an entity is organized as a limited partnership or limited liability company and maintains separate ownership accounts, we generally account for our investment using the equity method if our ownership interest is between 3% and 50%, unless our interest is so minor that we have virtually no influence over the investee’s operating and financial policies. For all other types of investments, we generally apply the equity method of accounting if our ownership interest is between 20% and 50% and we exercise significant influence over the investee’s operating and financial policies. We eliminate our proportionate share of profits and losses from transactions with equity affiliates to the extent such amounts remain on our consolidated balance sheets (or those of our equity affiliates).
Under the equity method, our proportionate share of each investees' net income increases the balance of our investment, while a net loss or receipt of dividends decreases the balance of our investment. Our proportionate share of net income from our equity affiliates are reported as a single line item within income (loss) from equity affiliates in our combined and consolidated statements of operations.
Subsequent to the Merger Transactions, we had significant influence, but not control, over Exaro Energy III, LLC ("Exaro") andWe have a 65% ownership interest in Lost Creek Gathering LLC ("Lost Creek"). At December 31, 2021, we had a 37% ownership interest in Exaro and a 65% ownership interest in Lost Creek,, but we do not control this entity as our partner has substantive participating rights. Asrights, and a result, our investments9.4% ownership interest in Exaro of $4.7 million and Lost Creek of $10.7 million were accounted for using the equity method within investment in equity affiliates in our consolidated balance sheet asChama Energy LLC ("Chama").As of December 31, 2021.
2023 and 2022, our equity investment in Lost Creek was $6.1 million and $10.9 million, respectively. At December 31, 2022 we had an equity investment in Chama of $4.2 million. During the year ended December 31, 2022,2023, we reduced our investment in equity affiliates following Exaro's sale of assets and increased our investment in equity affiliates as a resultidentified an indicator that the carrying value of our contributionequity method investment was not recoverable and thus recorded an other-than-temporary impairment charge of assets into Chama Energy LLC ("Chama"). SeeNOTE 3 – Acquisitions and Divestitures for additional information. At December 31, 2022, our investment in equity affiliates was primarily comprised of our investments in Lost Creek ($10.9 million) and Chama ($4.2 million).$3.9 million.
Revolving Credit Facility Debt Issuance Costs
We capitalize costs incurred in connection with obtaining financing associated with our revolving credit facilities and the 2026 Notes and 2028 Notes (collectively, the "Senior Notes") and amortize such costs as additional interest expense over the life of the underlying indebtedness. These costs include fees paid to financial institutions and legal fees andfees. Debt issuance costs associated with our revolving credit facility are included in otherOther assets in our consolidated balance sheets. Debt issuance costs associated with our Senior Notes are included as a contra-liability in Long-term debt in our consolidated balance sheets.
Revenue Recognition
Oil, Gas and NGL Revenues
We hold operated and non-operated working interests and mineral and royalty interests in producing assets that function as follows:
Operated working interests: We are responsible for the day-to-day management and operation of the field as well as negotiations required for post-production transportation, gathering, processing and marketing; we remit proceeds from sales of resulting hydrocarbons to third parties back to non-operators less costs as agreed in the applicable joint operating agreement.
Non-operated working interests: An operator of these assets is responsible for the day-to-day management and operation of the field as well as negotiations required for post-production transportation, gathering, processing, and marketing; the operator then remits proceeds from sales of resulting hydrocarbons to third parties back to non-operators less costs as agreed in the applicable joint operating agreement.
Mineral and royalty interests: Ownership of a percentage of production or production revenues produced from leased acreage. The owner of this share of production does not bear any of the cost of exploration, drilling, producing, operating or any other expense associated with drilling and producing an oil and gas well. Mineral and royalty interests may be burdened by some or all of the post-production costs related to gathering, processing and marketing.
We sell oil production at the lease and collect an agreed-upon index price, net of pricing differentials.
Under our natural gas contracts, we deliver natural gas to a midstream processor at a contractually specified delivery point. The midstream processor gathers and processes the natural gas and then markets and remits proceeds to us for the resulting sale of the residue gas and NGLs.
Our non-operated production is marketed by operators, after which the operators remit net proceeds from the sale of our share of production to us. Proceeds reflect post-production expenses such as gathering, processing and other expenses incurred in marketing of that production.
Performance Obligations
Under product sales contracts, each unit of product generally represents a separate performance obligation. We record revenue for our product sales contracts at the point-in-time control of a commodity is transferred to the customer. However, settlement statements from non-operated working interests may not be received for 30 to 60 days after the date production is delivered, and as a result, we are required to estimate the amount of production delivered to the customer and the net commodity price that will be received for the sale of these commodity products.
At the end of the reporting period, we did not have any unsatisfied performance obligations. Our contracts with customers typically include variable consideration based on monthly pricing tied to local indices and volumes delivered in the current month. The nature of our contracts with customers does not require us to constrain variable consideration for accounting purposes.
Revenue is recognized to the extent it is determined that it is probable that a significant reversal will not occur. We record the differences between our revenue estimates and the actual amounts received in the month that payment is received from the operator.
IncentiveEquity-Based Compensation ArrangementsAwards
IncentiveEquity-based compensation includesawards include share-based payment awards and incentive cash bonus planspayments that are issued to employees, directors and non-employees in exchange for services provided to us. Equity-classified share-based payment awards are recognized at fair value on the grant date, and amortized over the life of the award. Liability-classified share-based payment awards are remeasured at fair value until settlement. For awards with service-based vesting conditions only, we recognize compensation cost using straight-line
attribution. For awards that contain market or performance conditions we use accelerated attribution. Our policy is to recognize forfeitures as they occur. Certain of our consolidated subsidiaries have also issued incentive awards that are accounted for similar to cash bonus plans, whereby compensation cost is measured based on the present value of probable expected benefits to be paid and recognized over the period services are provided. Incentive awards similar to cash bonus plans may also have market-based or time-based vesting conditions and are included in accounts payable and accrued liabilities on our consolidated balance sheets.
IncentiveEquity-based compensation cost is presented as generalGeneral and administrative expense on our combined and consolidated statements of operations. See NOTE 13 – IncentiveEquity-Based Compensation ArrangementsAwards for additional discussion.
Defined Contribution Plan
We offer our employees a defined contribution 401(k) Plan (the “401(k) Plan”) which allows eligible employees to make tax-deferred contributions, not to exceed annual limits established by the Internal Revenue Service. The Company matchesWe match 100% of employee contributions up to a certain threshold of compensation with immediate vesting for existing employees. The CompanyWe did not make any contributions to the 401(k) Plan for the yearsyear ended December 31, 2021 and 2020 since the plan's inception began in January 2022 in conjunction with the start of the benefit plan year. During the year ended December 31, 2023 and 2022, the Companywe made contributions of $4.2 million and $4.7 million to the plan.
Business Combinations
We recognize the identifiable assets acquired and liabilities assumed at the estimated acquisition date fair values. Fair value is the price that would be received to sell an asset or would be paid to transfer a liability in an orderly transaction between market participants at the measurement date. The fair value measurement is based on the assumptions of market participants and not those of the reporting entity. Therefore, entity-specific intentions do not impact the measurement of fair value. These fair values are accounted for at the date of acquisition and included in our consolidated balance sheets as of December 31, 20222023 and 2021.2022. The results of operations of an acquired business are included in our combined and consolidated statements of operations from the date of the acquisition.
Credit and Concentration Risk
We sell a significant amount of our oil, natural gas and NGL production to a limited number of purchasers. This concentration has the potential to impact our overall exposure to credit risk, either positively or negatively, in that our purchasers may be similarly affected by changes in economic, industry or other conditions. If these counterparties were to fail to pay amounts due to us, our financial position and results of operations could be materially affected.
The below purchasers represented greater than 10% of our revenues during the years ended December 31, 2023, 2022 2021 and 2020:2021:
| | 2022 | | 2021 | | 2020 |
| SN EF Maverick, LLC | * | | * | | 15.5 | % |
| Eighty Eight Oil | * | | * | | 11.7 | % |
| 2023 | | | 2023 | | 2022 | | 2021 |
| Shell Trading US Company | Shell Trading US Company | 20.8 | % | | 18.3 | % | | 10.4 | % | Shell Trading US Company | 18.3% | | 20.8% | | 18.3% |
| ConocoPhillips | ConocoPhillips | 15.1 | % | | * | | * | ConocoPhillips | * | | 15.1% | | * |
*Purchaser did not account for greater than 10% of revenue for the year
We believe that the loss of any of our purchasers would not result in a material adverse effect on our ability to market future oil and natural gas production.
Risks and Uncertainties
Our future financial condition, results of operations and cash flows are dependent on the demand and prices received for oil, natural gas and NGL production. These prices historically have been volatile, and we expect such volatility to continue in the future, as they are subject to wide fluctuation in response to relatively minor changes in the supply of and demand for oil, natural gas and NGL, market uncertainty and a variety of additional factors beyond our control. These factors include weather conditions, government regulations and taxes, the price and availability of alternative fuels and overall economic conditions. A decline in oil, natural gas or NGL prices may adversely affect our financial position, cash flows and results of operations. Lower oil, natural gas or NGL prices also may reduce the amount of oil, natural gas and NGL that can be produced economically.
Our revenues are derived principally from uncollateralized sales to numerous companies in the oil and natural gas industry; therefore, our customers may be similarly affected by changes in economic and other conditions within the industry.
Risk Management
We periodically enter into derivative contracts to manage our exposure to commodity price and interest rate changes. These derivative contracts may take the form of forward contracts, futures contracts, swaps, swaptions, collars or other options. We do not use derivative contracts for speculative purposes and have not designated any derivative instruments as hedging instruments for accounting purposes. As such, unrealized gains and losses from changes in the valuation of our unsettled derivative contracts, as well as realized gains and losses on the settlement of derivative contracts, are reported in gainGain (loss) on derivatives in our combined and consolidated statements of operations.
Such derivative instruments are initially recorded at fair value on the date on which a derivative contract is entered into and are subsequently remeasured at fair value at each reporting date. Derivatives are carried as assets when the fair value is positive or as liabilities when the fair value is negative and are classified as current and long term based on the delivery periods of the financial instruments. If the right of offset exists and certain other criteria are met, derivative assets and liabilities with the same counterparty are netted on our consolidated balance sheets.
See NOTE 6 – Fair Value Measurements for additional discussion.
Contingencies
Certain conditions may exist as of the date our financial statements are issued, which may result in a loss to us but which will only be resolved when one or more future events occur or fail to occur. In the preparation of our financial statements, management assesses the need for accounting recognition or disclosure of these contingencies, if any, and such assessment inherently involves an exercise in judgment. In assessing loss contingencies related to legal proceedings that are pending against us or unasserted claims that may result in such proceedings, our management and legal counsel evaluate the perceived merits of any legal proceedings or unasserted claims as well as the perceived merits of the amount of relief sought or expected to be sought therein.
When applicable, we will accrue an undiscounted liability for contingencies where the incurrence of a loss is probable and the amount can be reasonably estimated. If a range of amounts can be reasonably estimated and no amount within the range is a better estimate than any other amount, then the minimum amount within the range is accrued. We do not record a contingent
liability when the likelihood of loss is probable but the amount cannot be reasonably estimated or when it is believed to be only reasonably possible or remote.
For contingencies where an unfavorable outcome is reasonably possible and the impact would be material, we disclose the nature of the contingency and, if feasible, an estimate of the possible loss or range of loss. Loss contingencies considered remote are generally not disclosed. See NOTE 12 – Commitments and Contingencies.
Income Taxes
Crescent is a holding company, of which ourthe sole material assets of which are OpCo Units. OpCo is a partnership and is generally not subject to U.S. federal and certain state taxes. Crescent is subject to U.S. federal and certain state taxes on our allocable share of any taxable income of OpCo. Taxable income or loss generated by OpCo is generally allocated and passed through to the holders of OpCo Units, including Crescent, at ourbased on their proportionate share of OpCo unitUnit ownership, except for activity related to itemsproperty contributed to OpCo by Contango with a pre-contribution gain which are allocated solely to Crescent.
The amount of income taxes we record requires interpretations of complex rules and regulations of various tax jurisdictions throughout the United States. We recognize deferred tax assets and liabilities for temporary differences, operating losses and tax credit carryforwards. Temporary differences arise when there are differences between the financial statement carrying amount and the tax basis of existing assets and liabilities as these differences create taxable or tax-deductible amounts for future periods. Deferred income tax assets and liabilities are based on enacted tax rates applicable to the future period when those temporary differences are expected to be recovered or settled. The effect of a change in tax rates on deferred tax assets and liabilities is recognized in income in the period the rate change is enacted. A valuation allowance is provided for deferred tax assets when it is more likely than not the deferred tax assets will not be realized. For additional information regarding income taxes, see NOTE 11 – Income Taxes.
ASC Topic 740, Income Taxes, specifies the accounting for uncertainty in income taxes by prescribing a minimum recognition threshold for a tax position to be reflected in the financial statements. If recognized, the tax benefit is measured as the largest amount of tax benefit that is more likely than not to be realized upon ultimate settlement. Management has considered the amounts and the probabilities of the outcomes that could be realized upon ultimate settlement and believes that it is more likely
than not that the Company's recorded income tax benefits will be fully realized, or recognizes a valuation allowance against deferred tax assets in cases where we do not forecast sufficient future income to recognize the deferred tax asset.
Leases
We record a net operating lease right-of-use ("ROU") asset and operating lease liability on the consolidated balance sheets for all operating leases with a lease term in excess of 12 months.
We enter into contractual lease arrangements to rent buildings, compressors, drilling rigs, office and rental equipment and vehicles from third-party lessors. ROU assets represent our right to use an underlying asset for the lease term and lease liabilities represent our obligation to make future lease payments arising from the lease. Operating lease ROU assets and liabilities are recorded at commencement date based on the present value of lease payments over the lease term. Leases with an initial term of 12 months or less are not recorded on the consolidated balance sheets. The Company recognizes lease expense for these short-term leases on a straight-line basis over the lease term. We use our incremental borrowing rate based on the information available at commencement date of the contract in determining the present value of future lease payments. The incremental borrowing rate is calculated using our collateralized incremental borrowing rate based on our debt structure. The operating lease ROU asset also includes any lease incentives received in the recognition of the present value of future lease payments. Certain of our leases may also include escalation clauses or options to extend or terminate the lease. These options are included in the present value recorded for the leases when it is reasonably certain that we will exercise that option. Lease expense for lease payments is recognized on a straight-line basis over the lease term.
If an arrangement is determined to be a lease, we record the resulting ROU asset on the consolidated balance sheets with offsetting liabilities at the commencement date. We recognize a lease in the financial statements when the arrangement either explicitly or implicitly involves property, plant or equipment ("PP&E"), the contract terms are dependent on the use of the PP&E, and we have the ability or right to control the PP&E or to direct others to control the PP&E and receive the majority of the economic benefits of the assets.
Table As of ContentsDecember 31, 2023 and 2022, we had financing right-of-use asset of $18.5 million and $13.1 million in field and other property and equipment, at cost and operating right-of-use asset of $24.2 million and $5.0 million in Other assets.
Goodwill
Goodwill represents the excess of the consideration transferred for business combinations over the fair value of the identifiable net assets acquired. We test goodwill for impairment annually or more frequently if events or changes in circumstances indicate that the asset might be impaired.
The Company performed its annual goodwill impairment test as of November 30, 2022. The impairment test indicated that the fair value of certain of our reporting units with allocated goodwill were less than their carrying amount, and further that there was no remaining implied fair value attributable to goodwill. Based on these results, we recorded a non-cash impairment charge to reduce the carrying value of goodwill to zero.
| | Year Ended December 31, |
| 2022 | | 2021 |
| (in thousands) |
| Year Ended December 31, | | | Year Ended December 31, |
| 2023 | | | 2023 | | 2022 |
| (in thousands) | | | (in thousands) |
| Balance at beginning of period | Balance at beginning of period | $ | 76,564 | | | $ | — | |
| Additions | Additions | — | | | 76,564 | |
| Measurement period adjustments | Measurement period adjustments | 1,125 | | | — | |
| Impairment | Impairment | (77,689) | | | — | |
| Balance at end of period | Balance at end of period | $ | — | | | $ | 76,564 | |
Asset Retirement Obligations
An ARO represents the legal obligation associated with the future abandonment of tangible assets, such as wells, service assets, pipelines, and other facilities. We record an ARO liability and capitalize the asset retirement cost in oil and natural gas properties in the period in which the ARO liability is incurred based upon the estimated fair value of the obligation to perform site reclamation, dismantle facilities or plug and abandon wells. After recording these amounts, the ARO liability is accreted to its future estimated value using an estimated credited-adjusted risk-free rate and the capitalized asset retirement cost is depleted on a unit-of-production basis. Both the accretion expense and the depletion expense are included in Depreciation, depletion and amortization expense on our combined and consolidated statements of operations.
Measuring the future ARO liability requires management to make estimates, assumptions and judgments inherent in the present value calculation including the ultimate costs, inflation factors, credit adjusted discount rates, timing of settlement and changes in the legal, regulatory, environmental and political environments. To the extent future revisions to these assumptions impact the present value of the existing ARO liability, a corresponding adjustment is made to the related asset. If the ARO liability is settled for an amount other than the recorded amount, a gain or loss is recognized at settlement and included in Depreciation, depletion and amortization expense on our combined and consolidated statements of operations.
See NOTE 9 – Asset Retirement Obligations.
Environmental Expenditures
In addition to our ARO liability, management also reviews our estimates of the cleanup costs of various sites on an annual basis. When it is probable that obligations have been incurred, and where a reasonable estimate of the cost of compliance or remediation can be determined, the applicable amount is accrued. For other potential liabilities, the timing of accruals coincides with the related ongoing site assessments. We do not discount any of these liabilities. Recoveries for environmental remediation costs from third parties, which are probable of realization, are separately recorded and are not offset against the related environmental liability. As of December 31, 20222023 and 2021,2022, we did not have any significant probable environmental remediation costs.
Supplemental Cash Flow Disclosures
The following are our supplemental cash flow disclosures for the years ended December 31, 2023, 2022 2021 and 2020:2021:
| | Year Ended December 31, |
| 2022 | | 2021 | | 2020 |
| (in thousands) |
| Year Ended December 31, | | | Year Ended December 31, |
| 2023 | | | 2023 | | 2022 | | 2021 |
| (in thousands) | | | (in thousands) |
| Supplemental cash flow disclosures: | Supplemental cash flow disclosures: | |
| Interest paid, net of amounts capitalized | Interest paid, net of amounts capitalized | $ | 81,920 | | | $ | 35,055 | | | $ | 33,902 | |
| Income taxes paid | 8,164 | | | 562 | | | 14 | |
| Interest paid, net of amounts capitalized | |
| Interest paid, net of amounts capitalized | |
| Income tax (refunds) payments | |
| Non-cash investing and financing activities: | Non-cash investing and financing activities: | |
| Capital expenditures included in accounts payable and accrued liabilities | |
| Capital expenditures included in accounts payable and accrued liabilities | |
| Capital expenditures included in accounts payable and accrued liabilities | Capital expenditures included in accounts payable and accrued liabilities | 92,518 | | | 47,173 | | | 12,267 | |
| Equity consideration for acquisitions, net of cash acquired | Equity consideration for acquisitions, net of cash acquired | — | | | 647,579 | | | 454,599 | |
| Right-of-use assets obtained in exchange for leases | Right-of-use assets obtained in exchange for leases | 13,343 | | | 8,573 | | | — | |
| April 2021 Exchange and December 2020 Exchange | April 2021 Exchange and December 2020 Exchange | — | | | 62,051 | | | 657,370 | |
| Noncontrolling Interest Carve-out | Noncontrolling Interest Carve-out | — | | | (121,872) | | | — | |
| Capitalized non-cash equity-based compensation | Capitalized non-cash equity-based compensation | — | | | 3,373 | | | — | |
Recent Accounting Standards
In March 2020, the FASB issued ASU 2020-04, Reference Rate Reform (Topic 848) - Facilitation of the Effects of Reference Rate Reform on Financial Reporting (“ASU 2020-04”). ASU 2020-04 provides optional guidance, for a limited period of time, to ease the potential burden in accounting for (or recognizing the effects of) reference rate reform on financial reporting. The amendments in ASU 2020-04 provide optional expedients and exceptions for applying GAAP to contracts, hedging relationships and other transactions affected by reference rate reform if certain criteria are met. The amendments in this ASU apply only to contracts, hedging relationships and other transactions that reference LIBOR, or another reference rate, expected to be discontinued because of reference rate reform. The guidance was effective beginning March 12, 2020 and can be applied prospectively through December 31, 2022. In January 2021, the FASB issued ASU 2021-01, Reference Rate Reform - Scope, which clarified the scope and application of the original guidance. In December 2022, the FASB issued ASU 2022-06, Reference Rate Reform (Topic 848) - Deferral of the Sunset Date of Topic 848, which extends the sunset date for relief under ASU 2020-04 from December 31, 2022 to December 31, 2024. The Company does not expect a material impact on its consolidated financial statements as a result of applying the optional guidance provided by ASU 2020-04.
In December 2023, the FASB issued ASU 2023-09, Income Taxes (Topic 740): Improvements to Income Tax Disclosures, which requires public entities, on an annual basis, to provide disclosure of specific categories in the rate reconciliation, as well as disclosure of income taxes paid disaggregated by jurisdiction. ASU 2023-09 is effective for fiscal years beginning after
December 15, 2024, with early adoption permitted. The Company is currently evaluating the impact of adopting ASU 2023-09 but does not expect a material impact.
In November 2023, the FASB issued ASU 2023-07, Segment Reporting (Topic 280): Improvements to Reportable Segment Disclosures, which requires public entities, on an annual and interim basis, to provide enhanced disclosures about significant segment expenses, including entities that have a single reportable segment. ASU 2023-07 is effective for fiscal years beginning after December 15, 2023, and interim periods within fiscal years beginning after December 15, 2024, with early adoption permitted. The Company is currently evaluating the impact of adopting ASU 2023-07 but does not expect a material impact.
NOTE 3 – Acquisitions and Divestitures
During the three years ended December 31, 2022,2023, we completed the following acquisitions and divestitures:
Acquisitions
Western Eagle Ford Acquisitions
In July 2023, we consummated the acquisition contemplated by the Purchase and Sale Agreement, dated as of May 2, 2023, between our subsidiary and Comanche Holdings, LLC ("Comanche Holdings") and SN EF Maverick, LLC ("SN EF Maverick," and together with Comanche Holdings, the "Seller"), pursuant to which we agreed to acquire operatorship and incremental working interests (the "July Western Eagle Ford Acquisition") in certain of our existing Western Eagle Ford assets from the Seller for aggregate cash consideration of approximately $592.7 million, including capitalized transaction costs and certain final purchase price adjustments.
In October 2023, we consummated the unrelated acquisition contemplated by the Purchase and Sale Agreement, dated as of August 22, 2023, between our subsidiary and an unaffiliated third party, pursuant to which we agreed to acquire certain incremental working interests in oil and natural gas properties (the "October Western Eagle Ford Acquisition," and together with the July Western Eagle Ford Acquisition, the "Western Eagle Ford Acquisitions") in certain of our existing Western Eagle Ford assets from the seller for aggregate cash consideration of approximately $235.1 million, including certain customary purchase price adjustments.
Uinta Transaction
In March 2022, we consummated the acquisition contemplated by the Membership Interest Purchase Agreement dated February 15, 2022 (the “Purchase Agreement” and the transactions contemplated therein, the “Uinta Transaction”) between certain of our subsidiaries, including OpCo, and Verdun Oil Company II LLC, a Delaware limited liability company, pursuant to which we purchased all of the issued and outstanding membership interests of Uinta AssetCo, LLC, a Texas limited liability company that holds all development and production assets of, and certain obligations formerly held by EP Energy E&P Company, L.P. located in the State of Utah. Upon closing of the Uinta Transaction, we paid $621.3 million in cash consideration and transaction fees and assumed certain commodity derivatives. The Uinta Transaction was funded with cash on hand and borrowings under our Revolving Credit Facility (as defined in NOTE 8 - Debt). In addition, subsequent to the closing date but during the year ended December 31, 2022, we recorded $11.1 million in customary purchase price adjustments that increased our total purchase price to $632.4 million. We accounted for the Uinta Transaction as an asset acquisition and recorded $863.6 million of property, plant and equipment, net of acquired commodity derivative liabilities of $179.7 million, accounts payable of $14.3 million and asset retirement liability of $37.2 million, after purchase price adjustments. In connection with the closing of the Uinta Transaction, we entered into an amendment to our Revolving Credit Facility to, among other things, increase the borrowing base to $1.8 billion and the elected commitment amount to $1.3 billion (see NOTE 8 – Debt). We incurred financing costs of $13.4 million associated with this amendment, which are recorded as debt issuance costs within Other assets on the consolidated balance sheets.
Subsequent to the closing of the Uinta Transaction in 2022, we settled certain acquired oil commodity derivative positions and entered into new commodity derivative contracts for 2022 with a swap price of $75 per barrel for a net cost of $54.1 million, including restructuring fees,fees.
Contango Merger
In December 2021, we acquired all of Contango's outstanding common stock through the issuance of 39,834,461 shares of Crescent Class A Common Stock and settled Contango's equity-based compensation plans through the issuance of 3,270,915 shares of Crescent Class A Common Stock, of which 1,150,991 shares of treasury stock were withheld to meet employee payroll tax withholding obligations. Contango's properties are primarily located in Oklahoma, Texas, Wyoming and Louisiana. We accounted for the Contango Merger as a business combination using the acquisition method under GAAP. The fair value of consideration transferred totaled $654.6 million based on the closing share price of Contango's common stock on the date of the
Merger Transactions as shares of Crescent Class A common stock were not yet publicly traded. During the year ended December 31, 2022, we recognized measurement period adjustments for the Contango Merger that increased Accounts receivable, net by $5.6 million, reduced Oil and natural gas properties - proved by $0.2 million, and increased Accounts payable and accrued liabilities by $6.5 million, with offsetting adjustments to Goodwill on our consolidated balance sheets. As a result of the acquisition, and after our measurement period adjustments, we recognized $77.7 million of goodwill that is primarily attributable to deferred tax liabilities associated with the transaction and expected synergies from our combined operations. During the year ended December 31, 2022, we performed our annual impairment test and fully impaired the carrying value of goodwill related to the Contango Merger.
From the date of the Contango Merger through December 31, 2021, revenues and net income associated with the operations acquired through the acquisition were $36.4 million and $5.6 million, respectively. We recognized transaction related expenses of $12.9 million for the year ended December 31, 2021.
The following table summarizes our unaudited pro forma financial information for the year ended December 31, 2021 as if the Contango acquisition occurred on January 1, 2020 (unaudited):
| | | | | | | |
| |
| | | |
| (in thousands) | | |
| Revenues | $ | 1,943,741 | | |
| Net loss | $ | (432,328) | | |
| | | |
| | | |
| | | |
| | | |
| | | |
The unaudited pro forma information is presented for illustration purposes only and is not necessarily indicative of the operating results that would have occurred had the acquisition been completed on January 1, 2020, nor is it necessarily indicative of future operating results of the combined entity.
Central Basin Platform Acquisition
In December 2021, we acquired from an unrelated third-party certain operated producing oil and natural gas properties predominately located in the Central Basin Platform in Texas and New Mexico, with additional properties in the southwestern Permian and Powder River Basins, for total cash consideration of $60.4 million, including customary purchase price adjustments. The purchase price was funded using cash on hand and borrowings under our Revolving Credit Facility (as defined in NOTE 8 – Debt).
DJ Basin Acquisition
In March 2021, we acquired a portfolio of oil and natural gas mineral assets located in the DJ Basin from an unrelated third-party operator for total consideration of $60.8 million (the "DJ Basin Acquisition"). The DJ Basin Acquisition was funded using cash on hand and borrowings under our Prior Credit Agreements. In conjunction with the DJ Basin Acquisition, we issued equity-based compensation, a portion of which is classified within permanent equity as noncontrolling interest and the remainder of which is classified as other liabilities, to certain parties of the transaction. See NOTE 13 – Equity-Based Compensation Awards.
Consideration Transferred
The following table summarizes the consideration transferred and the net assets acquired for our asset acquisitions and business combinations during the periods presented:
| | | | | | | | | | | | | | | | | | | | | | | | | | | | | | | | | | | | |
| Asset Acquisitions | | Business Combinations | |
| July Western Eagle Ford Acquisition | | October Western Eagle Ford Acquisition | | Uinta Transaction | | DJ Basin Acquisition | | Central Basin Platform Acquisition | | Contango Merger | |
| (in thousands) | |
| Consideration transferred: | | | | | | | | | | | | |
| Cash consideration | $ | 592,735 | | | $ | 235,069 | | | $ | 632,400 | | | $ | 60,800 | | | $ | 60,373 | | | $ | — | | |
| Equity consideration | — | | | — | | | — | | | — | | | — | | | 654,616 | | |
| Total | $ | 592,735 | | | $ | 235,069 | | | $ | 632,400 | | | $ | 60,800 | | | $ | 60,373 | | | $ | 654,616 | | |
| Assets acquired and liabilities assumed: | | | | | | | | | | | | |
| Cash and cash equivalents | $ | — | | | $ | — | | | $ | — | | | $ | — | | | $ | — | | | $ | 14,202 | | |
| Accounts receivable, net | — | | | — | | | — | | | — | | | 767 | | | 151,331 | | |
| | | | | | | | | | | | |
| Prepaid and other current assets | 355 | | | — | | | — | | | — | | | — | | | 8,275 | | |
| | | | | | | | | | | | |
| Oil and natural gas properties - proved | 595,025 | | | 239,573 | | | 785,150 | | | 21,645 | | | 73,687 | | | 1,001,942 | | |
| Oil and natural gas properties - unproved | 22,310 | | | 9,819 | | | 70,057 | | | 39,155 | | | — | | | — | | |
| Field and other property and equipment | — | | | — | | | 8,374 | | | — | | | 753 | | | 6,955 | | |
| | | | | | | | | | | | |
| Goodwill | — | | | — | | | — | | | — | | | — | | | 77,689 | | |
| Investments in equity affiliates | — | | | — | | | — | | | — | | | — | | | 15,047 | | |
| Other assets | — | | | — | | | — | | | — | | | — | | | 3,514 | | |
| Accounts payable and accrued liabilities | (12,668) | | | (5,790) | | | — | | | — | | | (2,236) | | | (193,195) | | |
| Derivative liabilities – current | — | | | — | | | (179,696) | | | — | | | — | | | (44,002) | | |
| Long-term debt | — | | | — | | | — | | | — | | | — | | | (140,000) | | |
| Deferred tax liability | — | | | — | | | — | | | — | | | — | | | (83,250) | | |
| Derivative liabilities – noncurrent | — | | | — | | | — | | | — | | | — | | | (14,592) | | |
| Asset retirement obligations | (10,541) | | | (7,908) | | | (37,203) | | | — | | | (12,598) | | | (142,100) | | |
| Other liabilities | (1,746) | | | (625) | | | (14,282) | | | — | | | — | | | (7,200) | | |
| Net assets acquired | $ | 592,735 | | | $ | 235,069 | | | $ | 632,400 | | | $ | 60,800 | | | $ | 60,373 | | | $ | 654,616 | | |
Divestitures
Permian Basin Divestiture
On November 4, 2022, we entered into a definitive purchase and sale agreement with an unaffiliated third party to sell certain of our non-core producing properties and related oil and natural gas leases in Ector County in the Permian Basin in exchange for cash consideration, subject to customary purchase price adjustments, of $80.0 million. We closed this transaction in December 2022 and recorded a loss of $0.9 million during the year ended December 31, 2022.
Equity Method InvestmentExaro
In April 2022, our equity method investment,investee, Exaro Energy III, LLC ("Exaro"), entered into a purchase and sale agreement to sell its operations in the Jonah Field in Wyoming. During the year ended December 31, 2022, we received a distribution from Exaro of $6.8 million primarily as a result of the sale.
Chama
In February 2022, we contributed all of the assets and prospects in the Gulf of Mexico formerly owned by Contango to Chama in exchange for a 9.4% interest in Chama, which interest was valued at $3.8 million. As a result, we derecognized the assets and liabilities that were contributed to Chama from our consolidated balance sheets and recorded an investment in equity affiliates for our interest in Chama, as well as a $4.5 million gain related to the deconsolidation of these assets and liabilities. John Goff, the Chairman of our Board of Directors, holds an approximate interest of 17.5% in Chama, and the remaining interests are held by other investors. Pursuant to the Limited Liability Company Agreement of Chama, we may be required to fund certain workover costs, and we will be required to fund plugging and abandonment costs related to the producing assets we contributed to Chama.
Permian Basin Divestiture
On November 4, 2022, we entered into a definitive purchase and sale agreement with an unaffiliated third party to sell certain of our non-core producing properties and related oil and natural gas leases in Ector County in the Permian Basin in exchange for cash consideration, subject to customary purchase price adjustments, of $80.0 million. We closed this transaction in December 2022 and recorded a loss of $0.9 million during the year ended December 31, 2022.
Contango Merger
In December 2021, we acquired all of Contango's outstanding common stock through the issuance of 39,834,461 shares of Crescent Class A Common Stock and settled Contango's equity-based compensation plans through the issuance of 3,270,915 shares of Crescent Class A Common Stock, of which 1,150,991 shares of treasury stock were withheld to meet employee payroll tax withholding obligations. Contango's properties are primarily located in Oklahoma, Texas, Wyoming and Louisiana. We accounted for the Contango Merger as a business combination using the acquisition method under GAAP. The fair value of consideration transferred totaled $654.6 million based on the closing share price of Contango's common stock on the date of the Merger Transactions as shares of Crescent Class A common stock were not yet publicly traded. During the year ended December 31, 2022, we recognized measurement period adjustments for the Contango Merger that increased Accounts receivable, net by $5.6 million, reduced Oil and natural gas properties - proved by $0.2 million, and increased Accounts payable and accrued liabilities by $6.5 million, with offsetting adjustments to Goodwill on our consolidated balance sheets. As a result of the acquisition, and after our measurement period adjustments, we recognized $77.7 million of goodwill that is primarily attributable to deferred tax liabilities associated with the transaction and expected synergies from our combined operations. This goodwill is not expected to be deductible for income tax reporting purposes. During the year ended December 31, 2022, we performed our annual impairment test and fully impaired the carrying value of goodwill related to the Contango Merger.
From the date of the Contango Merger through December 31, 2021, revenues and net income associated with the operations acquired through the acquisition were $36.4 million and $5.6 million, respectively. We recognized transaction related expenses of $12.9 million for the year ended December 31, 2021.
The following table summarizes our unaudited pro forma financial information for the years ended December 31, 2021 and 2020 as if the Contango acquisition occurred on January 1, 2020 (unaudited):
| | | | | | | | | | | |
| Year Ended December 31, |
| 2021 | | 2020 |
| (in thousands) |
| Revenues | $ | 1,943,741 | | $ | 970,921 |
| Net income (loss) | $ | (432,328) | | $ | (507,837) |
The unaudited pro forma information is presented for illustration purposes only and is not necessarily indicative of the operating results that would have occurred had the acquisition been completed on January 1, 2020, nor is it necessarily indicative of future operating results of the combined entity.
Central Basin Platform Acquisition
In December 2021, we acquired from an unrelated third-party certain operated producing oil and natural gas properties predominately located in the Central Basin Platform in Texas and New Mexico, with additional properties in the southwestern Permian and Powder River Basins, for total cash consideration of $60.4 million, including customary purchase price adjustments. The purchase price was funded using cash on hand and borrowings under our Revolving Credit Facility (as defined in NOTE 8 – Debt). We accounted for the Central Basin Platform Acquisition as an asset acquisition and recorded an additional $73.7 million of proved oil and natural gas properties, including an ARO asset of $12.6 million.
DJ Basin Acquisition
In March 2021, we acquired a portfolio of oil and natural gas mineral assets located in the DJ Basin from an unrelated third-party operator for total consideration of $60.8 million (the "DJ Basin Acquisition"). The DJ Basin Acquisition was funded using cash on hand and borrowings under our Prior Credit Agreements. We accounted for the DJ Basin Acquisition as an asset acquisition and the purchase price was allocated 35.6% to proved oil and natural gas properties and 64.4% to unproved oil and natural gas properties. In conjunction with the DJ Basin Acquisition, we issued equity-based compensation, a portion of which is classified within permanent equity as noncontrolling interest and the remainder of which is classified as other liabilities, to certain parties of the transaction. See NOTE 13 – Incentive Compensation Arrangements.
Titan Acquisition
In August 2020, through a series of transactions, we consummated the acquisition of all of the outstanding membership interests in Liberty Energy LLC (and the oil and natural gas assets owned thereby) pursuant to the Contribution Agreement, dated as of July 19, 2020, by and among Independence Energy LLC, Liberty Energy Holdings, LLC (“Liberty Holdco”) and the other parties thereto, in consideration for the issuance of certain membership interests in Independence Energy LLC to an entity substantially owned by Liberty Holdco. Subsequent to the acquisition, we changed the name of Liberty Energy, LLC to Titan. Titan owns certain working interests in non-operated producing and non-producing oil and natural gas properties in the Permian, Rockies, Eagle Ford and Arkoma Basins, which includes a 50% interest in the DJ Basin Erie Hub Gathering System. During the year ended December 31, 2020, we transferred $455.1 million of equity consideration in the form of 0.4 million Class A units of our Predecessor. During the year ended December 31, 2021, due to post-closing adjustments that increased the purchase price, we issued an additional $7.2 million in equity consideration in our Predecessor. We recognized transaction related expenses of $8.7 million for the year ended December 31, 2020.
Consideration Transferred
The following table summarizes the consideration transferred and the estimated fair value of identified assets acquired and liabilities assumed for transactions accounted for as business combinations during the periods presented:
| | | | | | | | | | | |
| Contango Merger | | Titan Acquisition |
| (in thousands) |
| Consideration transferred: | | | |
| Equity consideration | $ | 654,616 | | | $ | 461,983 | |
| Total | $ | 654,616 | | | $ | 461,983 | |
| Assets acquired and liabilities assumed: | | | |
| Cash and cash equivalents | $ | 14,202 | | | $ | 482 | |
| Accounts receivable, net | 151,331 | | | 29,044 | |
| Derivative assets – current | — | | | 12,000 | |
| Prepaid and other current assets | 8,275 | | | 49,079 | |
| | | |
| Oil and natural gas properties - proved | 1,001,942 | | | 375,014 | |
| | | |
| Field and other property and equipment | 6,955 | | | 30,232 | |
| Derivative assets – noncurrent | — | | | 114 | |
| Goodwill | 77,689 | | | — | |
| Investment in equity affiliates | 15,047 | | | — | |
| Other assets | 3,514 | | | — | |
| Accounts payable and accrued liabilities | (193,195) | | | (6,539) | |
| Derivative liabilities – current | (44,002) | | | (4,550) | |
| Long-term debt | (140,000) | | | — | |
| Deferred tax liability | (83,250) | | | — | |
| Derivative liabilities – noncurrent | (14,592) | | | (1,484) | |
| Asset retirement obligations | (142,100) | | | (21,409) | |
| Other liabilities | (7,200) | | | — | |
| Fair value of net assets acquired | $ | 654,616 | | | $ | 461,983 | |
Claiborne Parish Divestiture
Certain producing properties and oil and natural gas leases in Claiborne Parish, Louisiana were acquired in the Contango Merger and were classified as held for sale and included within Oil and natural gas properties – proved in our preliminary purchase price allocation. In December 2021, we entered into a purchase and sale agreement with an unaffiliated third-party that encompassed the sale of certain producing properties and oil and natural gas leases in Claiborne Parish, Louisiana in exchange for cash consideration, net of closing adjustments, of $4.3 million. We did not recognize a gain or loss for the year ended December 31, 2021 as a result of the transaction.
Arkoma Basin Divestiture
In May 2021, we executed a purchase and sale agreement with an unaffiliated third-party that encompassed the sale of certain producing properties and oil and natural gas leases in the Arkoma Basin in exchange for cash consideration, net of closing adjustments, of $22.1 million. We recognized a $8.8 million gain on sale of assets in our combined and consolidated statements of operations for the year ended December 31, 2021, as a result of the transaction.
Midland and Ector County Divestiture
In December 2019, we entered into a Term Assignment of Oil and Gas Lease conveying all of our interest in the Midland and Ector county leases between the top of the Mississippian formation down to the base of the Woodford formation, “deep rights”, for total bonus consideration of $7.9 million and a primary term of four years from the effective date, January 1, 2020. We received $4.0 million in December 2019 when the agreement was signed and the remaining $3.9 million was received in March 2020.
NOTE 4 – Property, Plant and Equipment
The following table summarizes our oil and natural gas properties as of December 31, 20222023 and 2021:2022:
| | As of December 31, |
| 2022 | | 2021 |
| (in thousands) |
| As of December 31, | | | As of December 31, |
| 2023 | | | 2023 | | 2022 |
| (in thousands) | | | (in thousands) |
| Proved oil and natural gas properties (successful efforts method) | Proved oil and natural gas properties (successful efforts method) | $ | 7,113,819 | | | $ | 6,043,602 | |
| Unproved oil and natural gas properties | Unproved oil and natural gas properties | 314,255 | | | 308,721 | |
| Oil and natural gas properties, at cost | Oil and natural gas properties, at cost | 7,428,074 | | | 6,352,323 | |
| Less: accumulated depreciation, depletion, amortization and impairment | Less: accumulated depreciation, depletion, amortization and impairment | (2,102,286) | | | (1,881,934) | |
| Oil and natural gas properties, net | Oil and natural gas properties, net | $ | 5,325,788 | | | $ | 4,470,389 | |
Other Property
The following table summarizes other property, plant and equipment as of December 31, 20222023 and 2021:2022:
| | Estimated useful life | | As of December 31, |
| 2022 | | 2021 |
| (years) | | (in thousands) |
| Estimated useful life | | | Estimated useful life | | As of December 31, |
| | 2023 | | | | 2023 | | 2022 |
| (years) | | | (years) | | (in thousands) |
| Gathering and pipeline system | Gathering and pipeline system | 30 | | $ | 106,022 | | | $ | 106,023 | |
| Vehicles | Vehicles | 3-5 | | 13,126 | | | 10,836 | |
| Computers, furniture, and equipment | Computers, furniture, and equipment | 3-10 | | 5,799 | | | 7,175 | |
| Buildings and improvements | Buildings and improvements | 5-30 | | 6,008 | | | 6,641 | |
| Land | Land | | 5,374 | | | 5,467 | |
| Financing right of use asset | Financing right of use asset | 1-5 | | 13,120 | | | 5,249 | |
| Field inventory | Field inventory | | 27,382 | | | 2,927 | |
| Field and other property and equipment, at cost | Field and other property and equipment, at cost | | 176,831 | | | 144,318 | |
| Less: accumulated depreciation, amortization and impairment | Less: accumulated depreciation, amortization and impairment | | (64,849) | | | (59,594) | |
| Field and other property and equipment, net | Field and other property and equipment, net | | $ | 111,982 | | | $ | 84,724 | |
Capitalized Exploratory Well Costs
Capitalized exploratory well costs are included in unproved oil and natural gas properties. As of December 31, 20222023 and 2021,2022, we did not have any capitalized exploratory well costs.
NOTE 5 – Derivatives
In the normal course of business, we are exposed to certain risks including changes in the prices of oil, natural gas and NGLs which may impact the cash flows associated with the sale of our future oil and natural gas production. We enter into derivative contracts with lenders under our revolving credit facilities that consist of either a single derivative instrument or a combination of instruments to manage our exposure to these risks. We have variable rate debt outstanding, which is subject to interest rate risk based on volatility in underlying interest rates. Historically, we have, at times, entered into interest rate swaps to reduce the volatility in interest rates on our earnings. Our interest rate swaps matured in 2021 and as such we recorded realized and unrealized gains and losses on our outstanding positions during the yearsyear ended December 31, 2020 and 2021.
As of December 31, 2022,2023, our commodity derivative instruments consisted of fixed price swaps and collars which are described below:
Fixed Price and Basis Swaps: Fixed price swaps receive a fixed price and pay a floating market price to counterparty on the notional amount. Our basis swaps fix the basis differentials between the index price at which we sell our production as compared to the index price used in the basis swap. Under a swap contract, we will receive payment if the settlement price is less than the fixed price and would be required to make a payment to the counterparty if the settlement price is greater than the fixed price.
Collars: Collars provide a minimum and maximum price on a notional amount of sales volume. Under a collar, we will receive payment if the settlement price is less than the minimum price of the range and make a payment to the counterparty if the settlement price is greater than the maximum price of the range. We would not be required to make a payment or receive payment if the settlement price falls within the range.
The following table details our net volume positions by commodity as of December 31, 2022:2023:
| | Production Period | Production Period | | Volumes | | Weighted Average Fixed Price | | Fair Value | Production Period | | Volumes | | Weighted Average Fixed Price | | Fair Value |
| (in thousands) | | | | (in thousands) |
| | (in thousands) | | | | (in thousands) | | | | | | (in thousands) |
| Crude oil swaps (Bbls): | Crude oil swaps (Bbls): | |
| WTI | WTI | |
| 2023 | | 9,710 | | | $60.00 | | $ | (180,441) | |
| WTI | |
| WTI | |
| 2024 | |
| 2024 | |
| 2024 | 2024 | | 5,721 | | | $63.82 | | (54,455) | |
| | | Brent | Brent | |
| 2023 | | 527 | | | $52.52 | | (15,690) | |
| | Brent | |
| | Brent | |
| 2024 | |
| 2024 | |
| 2024 | 2024 | | 276 | | | $68.65 | | (2,536) | |
| | Crude oil collars - WTI (Bbls): | |
| 2023 | | 1,155 | | | $48.68 | — | | $57.87 | | (24,467) | |
| | Crude oil collars – WTI (Bbls): | |
| | Crude oil collars – WTI (Bbls): | |
| | Crude oil collars – WTI (Bbls): | |
| 2024 | |
| 2024 | |
| 2024 | |
2025(1) | |
| | Crude oil collars – Brent (Bbls): | |
| Crude oil collars – Brent (Bbls): | |
| Crude oil collars – Brent (Bbls): | |
| 2024 | |
| 2024 | |
| 2024 | |
| 2025 | |
| | Natural gas swaps (MMBtu): | Natural gas swaps (MMBtu): | |
| 2023 | | 62,248 | | | $2.73 | | (92,657) | |
| Natural gas swaps (MMBtu): | |
| Natural gas swaps (MMBtu): | |
| 2024 | |
| 2024 | |
| 2024 | 2024 | | 9,604 | | | $4.14 | | (1,139) | |
| | NGL swaps (Bbls): | |
| 2023 | | 1,379 | | | $40.80 | | 15,710 | |
| | | Crude oil basis swaps (Bbls): | Crude oil basis swaps (Bbls): | |
| 2023 | | 2,461 | | | $1.15 | | 23 | |
| Natural gas basis swaps (MMBtu): | |
| 2023 | | 8,202 | | | $(0.43) | | 980 | |
| Calendar Month Average roll swaps (Bbls): | |
| 2023 | | 2,736 | | | $0.05 | | (896) | |
| Natural gas collars (MMBtu): | |
| 2023 | | 550 | | | $2.63 | — | | $3.01 | | (659) | |
| | Crude oil basis swaps (Bbls): | |
| | Crude oil basis swaps (Bbls): | |
| 2024 | |
| 2024 | |
| 2024 | 2024 | | 18,300 | | | $3.38 | — | | $4.56 | | (5,607) | |
| | Natural gas basis swaps (MMBtu): | |
| Natural gas basis swaps (MMBtu): | |
| Natural gas basis swaps (MMBtu): | |
| 2024 | |
| 2024 | |
| 2024 | |
| 2025 | |
| Calendar Month Average ("CMA") roll swaps (Bbls): | |
| 2024 | |
| 2024 | |
| 2024 | |
| | Natural gas collars (MMBtu): | |
| Natural gas collars (MMBtu): | |
| Natural gas collars (MMBtu): | |
| 2024 | |
| 2024 | |
| 2024 | |
| 2025 | |
| | Total | Total | | $ | (361,834) | |
| Total | |
| Total | |
We use derivative commodity instruments and enter into swap contracts which are governed by International Swaps and Derivatives Association master agreements. The following table shows the effects of master netting arrangements on the fair value of our derivative contracts at December 31, 20222023 and 2021:2022:
| | Gross Fair Value | | Effect of Counterparty Netting | | Net Carrying Value |
| (in thousands) |
| December 31, 2022 | |
| Gross Fair Value | | | Gross Fair Value | | Effect of Counterparty Netting | | Net Carrying Value |
| (in thousands) | | | (in thousands) |
| December 31, 2023 | |
| Assets: | Assets: | |
| Assets: | |
| Assets: | |
| Derivative assets – current | |
| Derivative assets – current | |
| Derivative assets – current | Derivative assets – current | $ | 21,880 | | | $ | (7,002) | | | $ | 14,878 | |
| Derivative assets – noncurrent | Derivative assets – noncurrent | 10,338 | | | (10,338) | | | — | |
| Total assets | Total assets | $ | 32,218 | | | $ | (17,340) | | | $ | 14,878 | |
| Liabilities: | Liabilities: | | | | | |
| Derivative liabilities – current | Derivative liabilities – current | $ | (319,977) | | | $ | 7,002 | | | $ | (312,975) | |
| Derivative liabilities – current | |
| Derivative liabilities – current | |
| Derivative liabilities – noncurrent | Derivative liabilities – noncurrent | (74,075) | | | 10,338 | | | (63,737) | |
| Total liabilities | Total liabilities | $ | (394,052) | | | $ | 17,340 | | | $ | (376,712) | |
| December 31, 2021 | | | | | |
| December 31, 2022 | |
| Assets: | Assets: | |
| Assets: | |
| Assets: | |
| Derivative assets – current | |
| Derivative assets – current | |
| Derivative assets – current | Derivative assets – current | $ | 2,983 | | | $ | (2,983) | | | $ | — | |
| Derivative assets – noncurrent | Derivative assets – noncurrent | 4,834 | | | (4,255) | | | 579 | |
| Total assets | Total assets | $ | 7,817 | | | $ | (7,238) | | | $ | 579 | |
| Liabilities: | Liabilities: | | | | | |
| Derivative liabilities – current | Derivative liabilities – current | $ | (256,508) | | | $ | 2,983 | | | $ | (253,525) | |
| Derivative liabilities – current | |
| Derivative liabilities – current | |
| Derivative liabilities – noncurrent | Derivative liabilities – noncurrent | (137,726) | | | 4,255 | | | (133,471) | |
| Total liabilities | Total liabilities | $ | (394,234) | | | $ | 7,238 | | | $ | (386,996) | |
See NOTE 6 – Fair Value Measurements for more information.
The amount of realized and unrealized gain (loss) recognized in gainGain (loss) on derivatives in our combined and consolidated statements of operations was as follows for the years ended December 31, 2023, 2022 2021 and 2020:2021:
| | Years ended December 31, |
| 2022 | | 2021 | | 2020 |
| (in thousands) |
| Years ended December 31, | | | Years ended December 31, |
| 2023 | | | 2023 | | 2022 | | 2021 |
| (in thousands) | | | (in thousands) |
| Derivatives not designated as hedging instruments: | Derivatives not designated as hedging instruments: | |
| Realized gain (loss) on oil positions | |
| Realized gain (loss) on oil positions | |
| Realized gain (loss) on oil positions | Realized gain (loss) on oil positions | $ | (395,147) | | | $ | (180,572) | | | $ | 149,713 | |
| Realized loss on early settlement of certain oil positions | Realized loss on early settlement of certain oil positions | — | | | (198,688) | | | — | |
| Realized gain (loss) on natural gas positions | Realized gain (loss) on natural gas positions | (327,098) | | | (80,253) | | | 32,638 | |
| Realized gain (loss) on NGL positions | Realized gain (loss) on NGL positions | (57,015) | | | (68,766) | | | 14,458 | |
| Realized gain (loss) on interest hedges | Realized gain (loss) on interest hedges | — | | | (7,373) | | | (12,435) | |
| Total realized gain (loss) | Total realized gain (loss) | (779,260) | | | (535,652) | | | 184,374 | |
| Unrealized gain (loss) on commodity hedges | Unrealized gain (loss) on commodity hedges | 102,358 | | | (337,715) | | | 8,836 | |
| Unrealized gain (loss) on interest hedges | Unrealized gain (loss) on interest hedges | — | | | 7,347 | | | 2,074 | |
| Total unrealized gain (loss) | Total unrealized gain (loss) | 102,358 | | | (330,368) | | | 10,910 | |
| Total gain (loss) on derivatives | Total gain (loss) on derivatives | $ | (676,902) | | | $ | (866,020) | | | $ | 195,284 | |
During the years ended December 31, 2022 and 2021, we settled certain of our outstanding derivative oil commodity contracts for open positions associated with calendar years 2022 and 2023. Subsequent to the settlements, we entered into new commodity derivative contracts at prevailing market prices.
NOTE 6 – Fair Value Measurements
GAAP defines fair value as the price that would be received to sell an asset or paid to transfer a liability in an orderly transaction between market participants at the measurement date (exit price). Generally, the determination of fair value requires the use of significant judgment and different approaches and models under varying circumstances. Under a market-based approach, we consider prices of similar assets, consult with brokers and experts, or employ other valuation techniques. Under an income-based approach, we generally estimate future cash flows and then discount them at a risk-adjusted rate. We classify the inputs used to measure the fair value of our financial assets and liabilities into the following hierarchy:
Level 1: Quoted prices (unadjusted) in active markets for identical assets or liabilities as of the reporting date. Active markets are those in which transactions for the asset or liability occur in sufficient frequency and volume to provide pricing information on an ongoing basis.
Level 2: Quoted market prices for similar assets or liabilities in active markets, quoted prices for identical or similar assets and liabilities in markets that are not active or other than quoted prices that are observable, either directly or indirectly, and can be corroborated by observable market data.
Level 3: Unobservable inputs that reflect management’s best estimates and assumptions of what market participants would use in measuring the fair value of an asset or liability.
Financial assets and liabilities are classified in their entirety based on the lowest level of input that is significant to the fair value measurement. Our assessment of significance for a particular input to the fair value measurement requires judgment and may affect the valuation of fair value assets and liabilities within the fair value hierarchy levels.
Recurring Fair Value Measurements
The following table presents the location and fair value of our derivative assets and liabilities that were accounted for at fair value on a recurring basis as of December 31, 20222023 and 2021,2022, by level within the fair value hierarchy:
| | Fair Value Measurement Using |
| Level 1 | | Level 2 | | Level 3 | | Total |
| (in thousands) |
| December 31, 2022 | |
| Fair Value Measurement Using | | | Fair Value Measurement Using |
| Level 1 | | | Level 1 | | Level 2 | | Level 3 | | Total |
| (in thousands) | | | (in thousands) |
| December 31, 2023 | |
| Financial assets: | Financial assets: | |
| Financial assets: | |
| Financial assets: | |
| Derivative assets | |
| Derivative assets | |
| Derivative assets | Derivative assets | $ | — | | | $ | 32,218 | | | $ | — | | | $ | 32,218 | |
| Financial Liabilities: | Financial Liabilities: | |
| Derivative liabilities | Derivative liabilities | $ | — | | | $ | (394,052) | | | $ | — | | | $ | (394,052) | |
| December 31, 2021 | |
| Derivative liabilities | |
| Derivative liabilities | |
| December 31, 2022 | |
| Financial assets: | Financial assets: | |
| Financial assets: | |
| Financial assets: | |
| Derivative assets | |
| Derivative assets | |
| Derivative assets | Derivative assets | $ | — | | | $ | 7,817 | | | $ | — | | | $ | 7,817 | |
| Financial Liabilities: | Financial Liabilities: | |
| Derivative liabilities | Derivative liabilities | $ | — | | | $ | (394,234) | | | $ | — | | | $ | (394,234) | |
| Derivative liabilities | |
| Derivative liabilities | |
Non-Recurring Fair Value Measurements
Certain nonfinancial assets and liabilities are measured at fair value on a non-recurring basis. We utilize fair value measurement on a non-recurring basis to value our oil and natural gas properties when the carrying value of such property exceeds the respective undiscounted future cash flows. We also utilize fair value measurement on a non-recurring basis to value our goodwill when the carrying value of such reporting unit exceeds the respective discounted future cash flows. The inputs used to determine such fair values are primarily based upon internally developed cash flow models, as well as market-based valuations as discussed in Note 2 and are classified within Level 3.
As stated in NOTE 2 - Summary of Significant Accounting Policies, goodwill and our oil and natural gas properties were written down to their fair value resulting in an impairment expense. During the year ended December 31, 2023, we recorded impairment expense of $77.7$153.5 million related to Oil and $65.2natural gas properties and Investments in equity affiliates. We recorded an impairment of $149.6 million respectively, duringrelated to Oil and natural gas properties with a carrying value of $238.1 million that was determined to not be
recoverable and a fair value of $88.5 million. We also recorded an other-than-temporary impairment of $3.9 million related to Investments in equity affiliates for an investment that was determined to be fully impaired. During the year ended December 31, 2022, in connection with our annual goodwill impairment test, we recorded impairment charges of $142.9 million, including $77.7 million related to Goodwill that was fully impaired and $247.2$65.2 million during the year ended December 31, 2020.related to Oil and natural gas properties with a carrying value of $183.2 million that was determined to not be recoverable and a fair value of $118.0 million. The fair value was determined using a discounted cash flow model based on the expected present value of the future net cash flows from our oil and natural gas
reserves. Significant Level 3 assumptions associated with the calculation of discounted cash flows used in the impairment analysis include estimates of (i) future prices based on the forward commodity price curve as of December 31, 2023, (ii) production costs, development expenditures and anticipated production, appropriatebased on our 2023 net proved reserves, and (iii) a risk-adjusted discount rates and other relevant data.rate of 10%.
Our other non-recurring fair value measurements include the estimates of the fair value of assets and liabilities acquired through business combinations. Both theThe Contango Merger and Titan Acquisition werewas accounted for using the acquisition method under GAAP, which requires all assets acquired and liabilities assumed in the acquisitions to be recorded at fair values at the acquisition date of each transaction. Oil and natural gas properties were valued based on an income approach using a discounted cash flow model utilizing Level 3 inputs, including internally generated development and production profiles and price and cost assumptions. Net derivative liabilities assumed in the acquisitions were valued based on Level 2 inputs similar to the Company's other commodity price derivatives. See NOTE 3 – Acquisitions and Divestitures.
Other Fair Value Measurements
The carrying value of cash and cash equivalents, accounts receivable, accounts payable and accrued liabilities approximate their fair values due to the short-term maturities of these instruments. Our long-term debt obligations under our Revolving Credit Facility also approximate fair value because the associated variable rates of interest are market based. The fair value of the 2026Senior Notes (as defined in NOTE 8 – Debt) as of December 31, 2023 and 2022 and 2021 was $661.5$1,750.7 million and $521.5$661.5 million based on quoted market prices.
NOTE 7 – Accounts Payable and Accrued Liabilities
Accounts payable and accrued liabilities consisted of the following as of December 31, 20222023 and 2021:2022:
| | As of December 31, |
| 2022 | | 2021 |
| (in thousands) |
| As of December 31, | | | As of December 31, |
| 2023 | | | 2023 | | 2022 |
| (in thousands) | | | (in thousands) |
| Accounts payable and accrued liabilities: | Accounts payable and accrued liabilities: | |
| Accounts payable | |
| Accounts payable | |
| Accounts payable | Accounts payable | $ | 104,343 | | | $ | 87,336 | |
| Accrued lease and asset operating expense | Accrued lease and asset operating expense | 58,375 | | | 55,228 | |
| | Accrued capital expenditure | Accrued capital expenditure | 76,246 | | | 60,647 | |
| Accrued capital expenditure | |
| Accrued capital expenditure | |
| Accrued general and administrative | Accrued general and administrative | 13,688 | | | 12,193 | |
| Accrued transportation expense | 31,525 | | | 20,639 | |
| Accrued gathering, transportation and marketing expense | |
| | Accrued revenue and royalties payable | |
| Accrued revenue and royalties payable | |
| Accrued revenue and royalties payable | Accrued revenue and royalties payable | 160,775 | | | 75,827 | |
| Accrued interest expense | Accrued interest expense | 11,672 | | | 6,325 | |
| Accrued severance taxes | Accrued severance taxes | 55,496 | | | 5,062 | |
| Other | Other | 12,570 | | | 14,624 | |
| Total accounts payable and accrued liabilities | Total accounts payable and accrued liabilities | $ | 524,690 | | | $ | 337,881 | |
NOTE 8 – Debt
2026Senior Notes
OnIn February 2023, we issued $400.0 million aggregate principal amount of 9.250% senior notes due 2028 (the "Original 2028 Notes"). We then issued additional aggregate principal amounts of 2028 Notes (as later defined) of $300.0 million, $150.0 million, and $150.0 million in July 2023 (the "July 2028 Notes"), September 2023 (the "September 2028 Notes"), and December 2023 (the "December 2028 Notes" and collectively with the Original Notes, July 2028 Notes and September 2028 Notes, the "2028 Notes"), respectively. The aggregate proceeds from the offerings of the 2028 Notes were $977.4 million, after adjusting for discounts, premiums and offering expenses, but excluding accrued interest payable by purchasers of the 2028
Notes. We used the aggregate proceeds to repay a portion of outstanding borrowings under our Revolving Credit Facility and to fund a portion of our acquisitions.
All issuances of the 2028 Notes are treated as a single series of securities under the indenture governing the Original 2028 Notes, will vote together as a single class with the Original 2028 Notes, and have substantially identical terms, other than the issue date, the issue price, and the first interest payment date.
The 2028 Notes bear interest at an annual rate of 9.250%, which is payable on February 15 and August 15 of each year and mature on February 15, 2028. We may, at our option, redeem all or a portion of the 2028 Notes at any time at certain redemption prices.
In May 6, 2021, Independence Energy Finance LLC (n/k/a Crescent Energy Finance LLC), our wholly owned subsidiary,we issued $500.0 million aggregate principal amount of 7.25% senior notes due 2026 (the "Original 2026 Notes") at par. In February 2022, we issued an additional $200.0 million aggregate principal amount of 7.250% senior notes due 2026 at 101% of par (the "Additional 2026 Notes" and, together with the Original 2026 Notes, the "2026 Notes"). Both issuances of the 2026 Notes are treated as a single series, will vote together as a single class, and have identical terms and conditions, other than the issue date, the issue price and the first interest payment. The 2026 Notes bear interest at an annual rate of 7.25%, which is payable on May 1 and November 1 of each year and mature on May 1, 2026. We may, at our option, redeem all or a portion of the 2026 Notes at any time at certain redemption prices.
The 2026Senior Notes are our senior unsecured obligations and the 2026Senior Notes and the related guarantees rank equally in right of payment with the borrowings under our Revolving Credit Facility and any of our other future senior indebtedness and senior to any of our future subordinated indebtedness. The 2026Senior Notes are guaranteed on a senior unsecured basis by each of our existing and future subsidiaries that will guarantee our Revolving Credit Facility. The 2026Senior Notes and the guarantees are effectively subordinated to all of our secured indebtedness (including all borrowings and other obligations under our Revolving Credit
Facility) to the extent of the value of the collateral securing such indebtedness and structurally subordinated in right of payment to all existing and future indebtedness and other liabilities (including trade payables) of any future subsidiaries that do not guarantee the 2026Senior Notes.
The 2026indentures governing the Senior Notes indenture contains covenants that, among other things, limit the ability of the our restricted subsidiaries to: (i) incur or guarantee additional indebtedness or issue certain types of preferred stock; (ii) pay dividends or distributions in respect of its equity or redeem, repurchase or retire its equity or subordinated indebtedness; (iii) transfer or sell assets; (iv) make investments; (v) create certain liens; (vi) enter into agreements that restrict dividends or other payments from any non-Guarantor restricted subsidiary to it; (vii) consolidate, merge or transfer all or substantially all of its assets; (viii) engage in transactions with affiliates; and (ix) create unrestricted subsidiaries.
We may, at our option, redeem all or a portion of the 2026 Notes at any time on or after May 1, 2023 at certain redemption prices. We may also redeem up to 40% of the aggregate principal amount of the 2026 Notes before May 1, 2023 with an amount of cash not greater than the net proceeds that we raise in certain equity offerings at a redemption price equal to 107.250% of the principal amount of the 2026 Notes being redeemed, plus accrued and unpaid interest, if any, to, but excluding, the redemption date. In addition, prior to May 1, 2023, we may redeem some or all of the 2026 Notes at a price equal to 100% of the principal amount thereof, plus a "make-whole" premium, plus accrued and unpaid interest, if any, to, but excluding, the redemption date.
If we experience certain kinds of changes of control accompanied by a ratings decline, holders of the 2026Senior Notes may require us to repurchase all or a portion of their notes at certain redemption prices. The 2026Senior Notes are not listed, and we do not intend to list the notes in the future, on any securities exchange, and currently there is no public market for the notes.
Revolving Credit Facility
Overview
In connection with the 2026 Notes issuance in May 2021, we entered into a senior secured reserve-based revolving credit agreement (as amended, restated, amended and restated or otherwise modified to date, the "Revolving Credit Facility") with Wells Fargo Bank, N.A., as administrative agent for the lenders and letter of credit issuer, and the lenders from time to time party thereto. We have entered into amendments to the Revolving Credit Facility, which have (i) increased our elected commitment amount from $700.0 million to $1.3 billion, (ii) increased our borrowing base from $1.3 billion to $2.0 billion, (iii) increased our maximum credit amount from $1.5 billion to $3.0 billion, (iv) extended the maturity date from May 6, 2025 to September 23, 2027 and (v) reduced the applicable margin by 0.50% so that loans under the Revolving Credit Facility will be priced based on a secured overnight financing rate ("SOFR") plus 2.35% to 3.35% or an adjusted base rate plus 1.25% to 2.25%, in each case, based on utilization of the Revolving Credit Facility. Our credit facility contains terms that if certain conditions regarding our outstanding 2026 Notes exist in January 2026, it will mature in January 2026 prior to the extended maturity date.
In connection with the closing of the July Western Eagle Ford Acquisition, we redetermined our Revolving Credit Facility, which reaffirmed our borrowing base at $2.0 billion with an elected commitment amount of $1.3 billion. At December 31, 2022,2023, we had $559.4$23.5 million of borrowings and $9.8$14.4 million in letters of credit outstanding under the Revolving Credit Facility.
The obligations under the Revolving Credit Facility remain secured by first priority liens on substantially all of the Company’s and the guarantors’ tangible and intangible assets, including without limitation, oil and natural gas properties and associated assets and equity interests owned by the Company and such guarantors. In connection with each redetermination of the borrowing base, the Company must maintain mortgages on at least 85% of the net present value, discounted at 9% per annum (“PV-9”) of the oil and natural gas properties that constitute borrowing base properties. The Company’s domestic direct and indirect subsidiaries are required to be guarantors under the Revolving Credit Facility, subject to certain exceptions.
The borrowing base is subject to semi-annual scheduled redeterminations on or about April 1 and October 1 of each year, as well as (i) elective borrowing base interim redeterminations at our request not more than twice during any consecutive 12-month period or the required lenders not more than once during any consecutive 12-month period and (ii) elective borrowing base interim redeterminations at our request following any acquisition of oil and natural gas properties with a purchase price in the aggregate of at least 5.0% of the then effective borrowing base. The borrowing base will be automatically reduced upon (i) the issuance of certain permitted junior lien debt and other permitted additional debt, (ii) the sale or other disposition of borrowing base properties if the aggregate PV-9 of such properties sold or disposed of is in excess of 5.0% of the borrowing base then in effect and (iii) early termination or set-off of swap agreements (a) the administrative agent relied on in determining the borrowing base or (b) if the value of such swap agreements so terminated is in excess of 5.0% of the borrowing base then in effect.
,.
The combined proceeds from the 2026 Notes issuance, Revolving Credit Facility and Noncontrolling Interest Carve-Out were used to fully repay all amounts outstanding under our Prior Credit Agreements (as defined below), which were then terminated upon the repayment of the remaining principal and accrued interest.
Interest
Borrowings under the Revolving Credit Facility bear interest at either (i) a U.S. dollar alternative base rate (based on the prime rate, the federal funds effective rate or an adjusted SOFR), plus an applicable margin or (ii) SOFR, plus an applicable margin, at the election of the borrowers. The applicable margin varies based upon our borrowing base utilization then in effect. The fee payable for the unused revolving commitments is 0.5% per year and is included within interestInterest expense on our combined and consolidated statements of operations. Our weighted average interest rate on loan amounts outstanding as of December 31, 2023 and 2022 were 9.75% and 2021 were 6.98% and 3.13%, respectively.
Covenants
The Revolving Credit Facility contains certain covenants that restrict the payment of cash dividends, certain borrowings, sales of assets, loans to others, investments, merger activity, commodity swap agreements, liens and other transactions without the adherence to certain financial covenants or the prior consent of our lenders. We are subject to (i) maximum leverage ratio and (ii) current ratio financial covenants calculated as of the last day of each fiscal quarter. The Revolving Credit Facility also contains representations, warranties, indemnifications and affirmative and negative covenants, including events of default relating to nonpayment of principal, interest or fees, inaccuracy of representations or warranties in any material respect when made or when deemed made, violation of covenants, bankruptcy and insolvency events, certain unsatisfied judgments and change of control. If an event of default occurs and we are unable to cure such default, the lenders will be able to accelerate maturity and exercise other rights and remedies.
Letters of Credit
From time to time, we may request the issuance of letters of credit for our own account. Letters of credit accrue interest at a rate equal to the margin associated with SOFR borrowings. At December 31, 20222023 and 2021,2022, we had letters of credit outstanding of $9.8$14.4 million and $20.7$9.8 million, respectively, which reduces the amount available to borrow under our Revolving Credit Facility.
Prior Credit Agreements
At December 31, 2021, certain of our subsidiaries had revolving credit facilities with syndicates of lenders (the "Prior Credit Agreements"). The amounts we were able to borrow under each of the Prior Credit Agreements was limited by a borrowing base, which was based on the oil and natural gas properties, proved reserves, total indebtedness and other factors and was consistent with customary lending criteria. On May 6, 2021, we early terminated the Prior Credit Agreements with the proceeds from the issuance of the 2026 Notes and the Noncontrolling Interest Carve-out and borrowings under our Revolving Credit Facility.
The following table summarizes our debt balances as of December 31, 20222023 and 2021:
| | | | | | | | | | | | | | | | | | | | | | | |
| Debt Outstanding | | Letters of Credit Issued | | Borrowing Base | |
Maturity |
| (in thousands) |
| December 31, 2022 | | | | | | | |
| Revolving Credit Facility | $ | 559,449 | | | $ | 9,770 | | | $ | 2,000,000 | | | 9/23/2027 |
| 7.25% senior notes due 2026 | 700,000 | | | — | | | — | | | 5/1/2026 |
| Less: Unamortized discount and issuance costs | (11,891) | | | | | | | |
| Total long-term debt | $ | 1,247,558 | | | | | | | |
| December 31, 2021 | | | | | | | |
| Revolving Credit Facility | $ | 543,000 | | | $ | 20,653 | | | $ | 1,300,000 | | | 5/6/2025 |
| 7.25% senior notes due 2026 | 500,000 | | | — | | | — | | | 5/1/2026 |
| Less: Unamortized discount and issuance costs | (12,594) | | | | | | | |
| Total long-term debt | $ | 1,030,406 | | | | | | | |
| | | | | | | | | | | | | | | | | | | | | | | |
| Debt Outstanding | | Letters of Credit Issued | | Borrowing Base | |
Maturity |
| (in thousands) |
| December 31, 2023 | | | | | | | |
| Revolving Credit Facility | $ | 23,500 | | | $ | 14,408 | | | $ | 2,000,000 | | | 9/23/2027 |
| 7.250% Senior Notes due 2026 | 700,000 | | | — | | | — | | | 5/1/2026 |
| 9.250% Senior Notes due 2028 | 1,000,000 | | | — | | | — | | | 2/15/2028 |
| Less: Unamortized discount, premium and issuance costs | (29,125) | | | | | | | |
| Total long-term debt | $ | 1,694,375 | | | | | | | |
| | | | | | | |
| December 31, 2022 | | | | | | | |
| Revolving Credit Facility | $ | 559,449 | | | $ | 9,770 | | | $ | 2,000,000 | | | 9/23/2027 |
| 7.250% Senior Notes due 2026 | 700,000 | | | — | | | — | | | 5/1/2026 |
| Less: Unamortized discount, premium and issuance costs | (11,891) | | | | | | | |
| Total long-term debt | $ | 1,247,558 | | | | | | | |
NOTE 9 – Asset Retirement Obligations
Our ARO liabilities are based on our net ownership in wells and facilities and management’s estimate of the costs to abandon and remediate those wells and facilities together with management’s estimate of the future timing of the costs to be incurred. The following table summarizes activity related to our ARO liabilities for the years ended December 31, 20222023 and 2021:2022:
| | Year Ended December 31, |
| 2022 | | 2021 |
| (in thousands) |
| Year Ended December 31, | | | Year Ended December 31, |
| 2023 | | | 2023 | | 2022 |
| (in thousands) | | | (in thousands) |
| Balance at beginning of period | Balance at beginning of period | $ | 266,007 | | | $ | 109,616 | |
Additions(1) | Additions(1) | 38,198 | | | 156,201 | |
| Retirements | Retirements | (6,489) | | | (1,252) | |
| Accretion expense | Accretion expense | 20,814 | | | 7,121 | |
| Revisions | Revisions | 63,900 | | | — | |
| Noncontrolling Interest Carve-out | — | | | (3,810) | |
| | Sale | |
| Sale | |
| Sale | Sale | (16,816) | | | (1,869) | |
| Balance at end of period | Balance at end of period | 365,614 | | | 266,007 | |
| Less: current portion | Less: current portion | (18,746) | | | (7,905) | |
| Balance at end of period, noncurrent portion | Balance at end of period, noncurrent portion | $ | 346,868 | | | $ | 258,102 | |
(1)During the year ended December 31, 2023 and 2022, our ARO additions primarily related to properties acquired in the Western Eagle Ford Acquisitions and Uinta Acquisition. During the year ended December 31, 2021, our ARO additions related to properties acquired in our 2021 acquisitions.Transaction. See NOTE 3 – Acquisitions and Divestitures for additional information.
NOTE 10 – Equity and Redeemable Noncontrolling Interests
Equity
Class A and Class B Common Stock
As of December 31, 20222023 and 2021,2022, we had 48,282,16391,608,800 and 41,954,38548,282,163 shares of Class A Common Stock and 118,645,32388,048,124 and 127,536,463118,645,323 shares of Class B Common Stock outstanding, respectively. Our Class A Common Stock is publicly traded, while our Class B Common Stock is 100% owned by the former owners of Independence. We declared and paid dividends of $0.53 and $0.63 per share of Class A Common Stock during the yearyears ended December 31, 2022.2023 and 2022, respectively.
Equity Issuance
In September 2023, we conducted an underwritten public offering (the "Equity Issuance") of 12.7 million shares of Class A Common Stock at a price to the public of $12.25 per share (not including underwriter discounts and commissions). This includes 1.7 million shares of Class A Common Stock that were issued upon the underwriters exercise of their 30-day option to purchase additional shares to cover over-allotments pursuant to the related underwriting agreement. We received net proceeds of $145.7 million from the Equity Issuance, after deducting underwriting fees and expenses.
Class A Conversions
During 2023, an affiliate of KKR redeemed approximately 30.6 million OpCo Units (and we cancelled a corresponding number of shares of Class B Common Stock) for an equivalent number of shares of Class A Common Stock (the "Class A Conversions"); 27.6 million of such shares of Class A Common Stock were subsequently distributed to certain of its legacy investors in privately-managed funds and accounts; 3.0 million of such shares of Class A Common Stock were sold at a price per share of $10.90, pursuant to Rule 144, through a broker-dealer. We did not receive any proceeds or incur any material expenses associated with the Class A Conversions.
In September 2022, Independence Energy Aggregator L.P., the entity through which certain affiliated entities hold their interests in us, exchanged 6.3 million units representing membership interests in OpCo (together with a corresponding number of shares of our Class B Common Stock) for shares of our Class A Common Stock and agreed to sell 5.75 million shares of our Class A Common Stock (the "Offering") at a price to the public of $15.00 per share, or a net price of $14.10 per share after deducting the underwriters' discounts and commissions. We did not receive any cash proceeds from the Offering. Concurrent with the closing of the Offering, we repurchased an aggregate of approximately 2.6 million OpCo Units from PT Independence Energy Holdings LLC for $36.2 million and cancelled a corresponding number of shares of our Class B Common Stock (the "Concurrent OpCo Unit Purchase," and, together with the Offering, the "Equity"2022 Equity Transactions"). As a result of the 2022 Equity Transactions, the total number of shares of our Class A Common Stock increased by 6.3 million shares, including 0.6 million shares of our Class A Common Stock that were not included as part of the Offering, but rather issued in exchange for shares of Class B Common Stock and distributed in-kind by Independence Energy Aggregator L.P. to affiliates, and the number of shares of our Class B Common Stock decreased by approximately 8.9 million. After the Equity Transactions, shares of our Class A Common Stock represent approximately 29% of the outstanding shares of Class A Common Stock and Class B Common Stock, taken together, and we own approximately 29% of the outstanding OpCo Units. Redeemable noncontrolling interests decreased by $158.1 million while APIC increased by $121.8 million as a result of the 2022 Equity Transactions and to reflect the new ownership of OpCo.
Treasury stock
At December 31, 20222023 and 2021,2022, our treasury stock shares represent shares we withheld associated with the payroll tax withholding obligations due from employees upon the vesting of stock awards. We include the shares withheld as treasuryTreasury stock on our consolidated balance sheets and separately pay the payroll tax obligation. These retained shares are not part of a publicly announced program to repurchase shares of our Class A Common Stock and are accounted for at cost. We do not have a publicly announced program to repurchase shares of our Class A Common Stock.
Predecessor members' equity
Prior to the Merger Transactions, Independence had two classes of equity in the form of Class A Units and Class B Units. Both Class A Units and Class B Units were considered common units, and distributions were made pro rata in accordance with each unit’s respective ownership percentage. At the time of the Merger Transactions, only Class A Units were issued and outstanding. As a result of the Merger Transactions, all Class A Units were exchanged for our Class B Common Stock and no Class A Units or Class B Units remain issued or outstanding.
Noncontrolling interests
We record noncontrolling interest associated with third party ownership interests in our subsidiaries. Income or loss associated with these interests is classified as net income (loss) attributable to noncontrolling interest on our combined and consolidated statements of operations.
In April 2021, certain minority investors exchanged 100% of their interests in our Barnett Basin natural gas assets for 9,508 of our Predecessor's Class A Units ("April 2021 Exchange"). Since we already consolidateconsolidated the results of these assets, this transaction was accounted for as an equity transaction and reflected as a reclassification from noncontrolling interests to members’ equity with no gain or loss recognized on exchange.
In December 2020, certain other minority owners
In August 2020, in connection with the Independence Reorganization, certain interests in our consolidated subsidiaries owned by a third-party investor were not contributed to the Predecessor. These interests were reclassified from members’ equity to noncontrolling interest as of the date of the Independence Reorganization and all income and loss attributable to these interests is recorded as net income (loss) attributable to noncontrolling interests from the date of the Independence Reorganization. In May 2021, these noncontrolling equity interests were redeemed in exchange for the third-party investor’s proportionate share of the underlying oil and natural gas interests held by its consolidated subsidiaries (the "Noncontrolling Interest Carve-out"). Additionally, the third-party investor contributed cash of approximately $35.5 million to repay its proportionate share of the underlying debt outstanding under our Prior Credit Agreements and other liabilities. The percentage ownership of these certain consolidated subsidiaries owned by the third-party investor ranges from 2.21% to 7.38%.
The following table discloses the effects on equity of changes in our ownership interest in our subsidiaries related to transactions with holders of noncontrolling interests:
| | | Year Ended December 31, |
| | 2022 | | 2021 | | 2020 |
| | (in thousands) |
| | | Year Ended December 31, | |
| | | Year Ended December 31, | |
| | | Year Ended December 31, | |
| | | 2023 | | | | | 2023 | | 2022 | | 2021 |
| | | (in thousands) | | | | | (in thousands) |
| Net income (loss) attributable to Crescent Energy and its Predecessor | Net income (loss) attributable to Crescent Energy and its Predecessor | | $ | 96,674 | | | $ | (358,544) | | | $ | (118,649) | |
| Transfers (to) from noncontrolling interests | Transfers (to) from noncontrolling interests | | |
| Decrease in Predecessor members’ equity related to the Independence Reorganization | |
| Decrease in Predecessor members’ equity related to the Independence Reorganization | |
| Decrease in Predecessor members’ equity related to the Independence Reorganization | Decrease in Predecessor members’ equity related to the Independence Reorganization | | — | | | — | | | (101,926) | |
| Increase in Predecessor members’ equity related to the December 2020 Exchange | Increase in Predecessor members’ equity related to the December 2020 Exchange | | — | | | — | | | 657,370 | |
| Increase in Predecessor members’ equity related to the April 2021 Exchange | Increase in Predecessor members’ equity related to the April 2021 Exchange | | — | | | 62,051 | | | — | |
| Net transfers (to) from noncontrolling interests | Net transfers (to) from noncontrolling interests | | — | | | 62,051 | | | 555,444 | |
| Changes from net income (loss) attributable to Crescent Energy and its Predecessor and transfers (to) from noncontrolling interests | Changes from net income (loss) attributable to Crescent Energy and its Predecessor and transfers (to) from noncontrolling interests | | $ | 96,674 | | | $ | (296,493) | | | $ | 436,795 | |
Redeemable Noncontrolling Interests
In connection with the Merger Transactions, 127.5 million OpCo Units were issued to the former owners of Independence. The former owners of Independence also own all outstanding shares of our Class B Common Stock. Pursuant to the OpCo LLC Agreement, holders of OpCo Units, other than the Company, may redeem all or a portion of their OpCo Units, together with a corresponding number of shares of Class B Common Stock, for either (a) shares of Class A Common Stock or (b) an approximately equivalent amount of cash as determined pursuant to the terms of the OpCo LLC Agreement, at the election of the Company. In connection with the exercise of such redemption, a corresponding number of shares of Class B Common Stock will be cancelled. The redemption election is not considered to be within the control of the Company because the holders of Class B Common Stock and their affiliates control the Company through direct representation on the Board of Directors. As a result, we present the noncontrolling interests in OpCo as redeemable noncontrolling interests outside of permanent equity. Redeemable noncontrolling interest is recorded at the greater of the carrying value or redemption amount with a corresponding adjustment to additional paid-in capital. The redemption amount is based on the 10-day volume-weighted average closing price (“VWAP”) of Class A Common Stock at the end of the reporting period. Changes in the redemption value are recognized immediately as they occur, as if the end of the reporting period was also the redemption date for the instrument, with an offsetting entry to additional paid-in capital.
In September 2023, the proceeds from the Equity Issuance, including the exercise of the underwriters' over-allotment, were contributed by Crescent to OpCo in exchange for 12.7 million OpCo Units. As a result of the additional OpCo Units owned by Crescent, we reclassified $65.8 million from Redeemable noncontrolling interests to Additional paid-in capital.
During 2023, the Class A Conversion reduced the number of shares of our Class B Common Stock outstanding by 30.6 million shares. A corresponding number of OpCo Units were transferred to Crescent, which reduced the value of our redeemable noncontrolling interests by $679.6 million.
In September 2022, the 2022 Equity Transactions reduced the number of outstanding shares of Class B Common Stock by 8.9 million and resulted in the cancellation of a corresponding number of OpCo Units.
From the date of the Merger Transactions through December 31, 2022,2023, we recorded adjustments to the value of our redeemable noncontrolling interests as shown below:
| | | | | |
| Redeemable Noncontrolling Interest |
| (in thousands) |
| Balance as of December 7, 2021 | $ | 2,353,977 | |
| Net loss attributable to redeemable noncontrolling interests | (58,761) | |
| Accrued OpCo distribution | (2,706) | |
| Equity-based compensation, net of withholding taxes | 16,412 | |
| Cancellation of OpCo Units associated with repurchase of treasury stock | 16,091 | |
| Balance as of December 31, 2021 | $ | 2,325,013 | |
| Net income attributable to redeemable noncontrolling interests | 381,257 | |
| Contributions | 5,985 | |
| Distributions | (213) | |
| Distributions from OpCo related to Class A common stock dividend, Manager compensation and income taxes | (126,384) | |
| Accrued OpCo distribution | (9,513) | |
| Equity-based compensation | 18,623 | |
| Cancellation of OpCo Units associated with 2022 Equity Transactions | (158,065) | |
| Balance as of December 31, 2022 | $ | 2,436,703 | |
| Net income attributable to redeemable noncontrolling interests | 253,909 | |
| Contributions | 1,238 | |
| Distributions | (417) | |
| Distributions from OpCo related to Class A common stock dividend, Manager compensation and income taxes, net | (80,805) | |
| Accrued OpCo distribution | (6,794) | |
| Equity-based compensation | 42,782 | |
| Change in redeemable noncontrolling interests associated with the Class A Conversions | (679,567) | |
| Change in redeemable noncontrolling interests associated with the Equity Issuance | (65,841) | |
| Balance as of December 31, 2023 | $ | 1,901,208 | |
| |
NOTE 11 – Income Taxes
Prior to the Merger Transactions, we were organized as Delaware limited liability companies and Delaware limited partnerships and were treated as flow-through entities for U.S. federal income tax purposes. As a result, our tax provision for the yearsyear ended December 31, 2021 and 2020 was minimal. Subsequent to the Merger Transactions, we are subject to U.S. federal income and state tax on our allocable share of any taxable income of OpCo.
During the yearyears ended December 31, 2023 and 2022, we decreased APIC by $92.5 million and $32.0 million, respectively, related to a change in the deferred tax liability related to (i) our estimated basis in our ownership interests in OpCo and (ii)as a result of the Equity Transactions.Issuance and Class A Conversions. As of December 31, 20222023 and 2021,2022, we did not have any uncertain tax positions.
Details of current and deferred income taxes are provided in the following tables:
| | Year Ended December 31, |
| 2022 | | 2021 | | 2020 |
| Year Ended December 31, | | | Year Ended December 31, |
| 2023 | | | 2023 | | 2022 | | 2021 |
| Federal income tax expense (benefit) | Federal income tax expense (benefit) | (in thousands) | Federal income tax expense (benefit) | (in thousands) |
| Current | Current | $ | 323 | | | $ | — | | | $ | — | |
| Deferred | Deferred | 38,002 | | | (935) | | | — | |
| State income tax expense (benefit) | State income tax expense (benefit) | |
| Current | Current | 2,790 | | | 629 | | | 14 | |
| Current | |
| Current | |
| Deferred | Deferred | (4,824) | | | — | | | — | |
| Total income tax expense (benefit) | Total income tax expense (benefit) | $ | 36,291 | | | $ | (306) | | | $ | 14 | |
The difference between the statutory federal income tax rate and the Company's effective income tax rate is explained as follows:
| | Year Ended December 31, |
| 2022 | | 2021 | | 2020 |
| Year Ended December 31, | | | Year Ended December 31, |
| 2023 | | | 2023 | | 2022 | | 2021 |
| Federal income taxes statutory rate | Federal income taxes statutory rate | 21.0 | % | | 21.0 | % | | — | % | Federal income taxes statutory rate | 21.0 | % | | 21.0 | % | | 21.0 | % |
| Increase (decrease) in rate as a result of: | Increase (decrease) in rate as a result of: | |
| State income tax provision, net of federal benefit | State income tax provision, net of federal benefit | (0.6) | % | | (0.1) | % | | — | % |
| State income tax provision, net of federal benefit | |
| State income tax provision, net of federal benefit | | 1.0 | % | | (0.6) | % | | (0.1) | % |
| Change in valuation allowance (1) | |
Change in valuation allowance (1) | |
Change in valuation allowance (1) | Change in valuation allowance (1) | 2.6 | % | | — | % | | — | % | — | % | | 2.6 | % | | — | % |
Permanent adjustments (2) | Permanent adjustments (2) | 0.9 | % | | (1.7) | % | | — | % | Permanent adjustments (2) | — | % | | 0.9 | % | | (1.7) | % |
Income attributable to Predecessor that was not subject to corporate income tax (3) | Income attributable to Predecessor that was not subject to corporate income tax (3) | — | % | | (18.4) | % | | — | % | Income attributable to Predecessor that was not subject to corporate income tax (3) | — | % | | — | % | | (18.4) | % |
| Income attributable to noncontrolling interests and redeemable noncontrolling interests | Income attributable to noncontrolling interests and redeemable noncontrolling interests | (15.6) | % | | (0.7) | % | | — | % | Income attributable to noncontrolling interests and redeemable noncontrolling interests | (15.3) | % | | (15.6) | % | | (0.7) | % |
| Other | Other | (1.3) | % | | — | % | | — | % | Other | — | % | | (1.3) | % | | — | % |
| Effective income tax rate | Effective income tax rate | 7.0 | % | | 0.1 | % | | — | % | Effective income tax rate | 6.7 | % | | 7.0 | % | | 0.1 | % |
(1)During the year ended December 31, 2022, we recognized a valuation allowance for our recognized built-in loss ("RBIL") deferred tax asset as it was not more likely than not to be fully utilized.
(2)During the year ended December 31, 2022, the permanent items primarily related to the impairment of goodwill recognized that is not deductible for tax. During the year ended December 31, 2021, the permanent items primarily related to disallowed officer compensation under Section 162(m) of the Internal Revenue Code.
(2)(3) During the year ended December 31, 2021, income attributable to our Predecessor was not subject to corporate income tax as we were organized as limited liability companies and limited partnerships that were treated as flow-through entities for U.S federal income tax purposes prior to the Merger Transactions.
Significant components of the Company's deferred income taxes were as follows:
| | Year Ended December 31, |
| 2022 | | 2021 |
| Year Ended December 31, | | | Year Ended December 31, |
| 2023 | | | 2023 | | 2022 |
| Deferred tax liabilities | Deferred tax liabilities | (in thousands) | Deferred tax liabilities | (in thousands) |
| Outside basis in OpCo | Outside basis in OpCo | $ | 148,655 | | | $ | 98,079 | |
| OpCo state deferred tax | OpCo state deferred tax | 2,567 | | | — | |
| Total deferred tax liabilities | Total deferred tax liabilities | 151,222 | | | 98,079 | |
| Deferred tax assets | Deferred tax assets | |
Federal and state NOL (1) | 25,417 | | | 38,317 | |
U.S. federal and state NOLs (1) | |
U.S. federal and state NOLs (1) | |
U.S. federal and state NOLs (1) | |
| Recognized built-in loss carryforward | Recognized built-in loss carryforward | 19,286 | | | 6,872 | |
| NOL and RBIL valuation allowance | NOL and RBIL valuation allowance | (43,986) | | | (30,567) | |
| | Equity-based compensation | |
| Equity-based compensation | |
| Equity-based compensation | |
| Other | Other | 3,157 | | | 920 | |
| Total deferred tax assets, net of valuation allowance | Total deferred tax assets, net of valuation allowance | 3,874 | | | 15,542 | |
| Net deferred income tax liability | Net deferred income tax liability | $ | 147,348 | | | $ | 82,537 | |
(1)At December 31, 20222023 and 2021,2022, we had Federal NOLsU.S. federal net operating loss carryforwards ("NOLs") of $1.9 million, net of tax, that have expiration dates beginning in 2029. At December 31, 20222023 and 2021,2022, we also have FederalU.S. federal NOLs of $23.4$30.0 million and $36.4$23.4 million, net of tax, that were generated after 2017 and have indefinite lives but are limited to offsetting 80% of taxable income in a given tax year.
We assess the available positive and negative evidence to determine if sufficient future taxable income will be generated to use the existing deferred tax assets. On the basis of this evaluation, as of December 31, 20222023 and 2021,2022, a valuation allowance has been recorded to recognize only the portion of the deferred tax assets that are more likely than not to be realized. The amount of the deferred tax asset considered realizable, however, could be adjusted in the future.
As part of the Merger Transactions, we acquired U.S. federal and state NOLs of $30.6 million. A portion of these NOLs are subject to a valuation allowance of $30.6$23.5 million due to thebecause we do not believe they will be recoverable as a result of limitations on
their use under Section 382 limitation.382. During the year ended December 31, 2021, and after the Merger Transactions, we recorded an additional valuation allowance related to additional state NOLs incurred that we do not believe are recoverable. During the year
ended December 31, 2022, we recorded an additional $19.3 million valuation allowance related to recognized built-in-loss ("RBIL") property that was also subject to the Section 382 limitation.limitation applicable to the NOLs acquired in the Merger Transactions. At December 31, 2023 and 2022, the valuation allowance related to our RBIL carryforward was $20.6 million and $19.3 million, respectively.
PursuantAs we noted above, we have U.S. federal NOLs and RBILs that are subject to Sectionslimitation under Section 382. Section 382 and 383 of the Internal Revenue Code utilization of ourprovides that we can only utilize these NOLs and credits is subjectRBILs in an amount equal to a small annual limitation. These annual limitationsThe Section 382 limitation may result in the expiration of NOLs and creditsRBILs prior to utilization.
As of December 31, 2022utilization and 2021,accordingly we didhave maintained a valuation allowance related to U.S. federal NOLs and RBILs that we do not have any uncertain tax positions.believe are recoverable due to the limitations under Section 382.
NOTE 12 – Commitments and Contingencies
From time to time, we may be a plaintiff or defendant in a pending or threatened legal proceeding arising in the normal course of business. We are currently unaware of any proceedings that, in the opinion of management, will individually or in the aggregate have a material adverse effect on our financial position, results of operations or cash flows.
We are subject to extensive federal, state and local environmental laws and regulations. These laws regulate the discharge of materials into the environment and may require us to remove or mitigate the environmental effects of the disposal or release of petroleum or chemical substances at various sites. We believe we are currently in compliance with all applicable federal, state and local regulations. Accordingly, no liability or loss associated with environmental remediation was recognized as of December 31, 2023 and 2022 except for the following:
On February 14, 2022, the New Mexico Energy, Minerals and Natural Resources Department’s Oil Conservation Division (“OCD”) issued a Notice of Violation to us for failure to file form C-115 according to required deadlines and having too many inactive wells. OCD proposed a civil penalty of $0.9 million, the plugging and abandonment of certain inactive wells, and the imposition of certain other restrictions on our operations. The parties discussed a resolution to the matter and on November 16, 2022, the OCD entered into a Stipulated Final Order (the “Order”) with us pursuant to which we agreed to pay a civil penalty of $0.1 million, the OCD withdrew the allegation of exceeding the number of inactive wells permitted and we agreed to pay a penalty of $500 for each day for each late or missing C-115 report from May 1, 2022 to April 30, 2023.
Carbon Dioxide Purchase Agreement
We assumed one take-or-pay carbon dioxide purchase agreement as part of a prior acquisition. The agreement includes a minimum volume commitment to purchase carbon dioxide at a price stipulated in the contract. The agreement provides carbon dioxide for use in our enhanced recovery projects in certain of our properties. The daily minimum volume commitments are 119 MMcf/per day from June 2021 to May 2026, with the commitment effectively ending in May 2026. We expect to purchase more carbon dioxide through the end of the agreement in 2026 than our minimum volume commitments, and, in accordance with the agreement, if we do not meet our minimum volume commitments for a year (or years), we can make up the volumes in future years through 2029 as long as we pay for our minimum volumes each year. As of December 31, 20222023 and 2021,2022, we have met the required minimum volumes.
Oil and Natural Gas Transportation and Gathering Agreements
We have entered into certain oil and natural gas transportation and gathering agreements with various pipeline carriers. Under these agreements, we are obligated to ship minimum daily quantities or pay for any deficiencies at a specified rate. We are also obligated under certain of these arrangements to pay a demand charge for firm capacity rights on pipeline systems regardless of the amount of pipeline capacity that we utilize. If we do not utilize the capacity, we can release it to others, thus reducing our potential liability. We recognized $15.6 million, $4.5 million $5.8 million and $14.5$5.8 million of transportation expense in our combined and consolidated statements of operations related to minimum volume deficiencies for the years ended December 31, 2023, 2022 2021 and 2020,2021, respectively.
The following table summarizes our future commitments related to these oil and natural gas transportation and gathering agreements as of December 31, 2022:2023:
| | As of December 31, 2022 |
| (in thousands) |
| 2023 | $ | 13,542 | |
| As of December 31, 2023 | | | As of December 31, 2023 |
| (in thousands) | | | (in thousands) |
| 2024 | 2024 | 4,528 | |
| 2025 | 2025 | 3,808 | |
| 2026 | 2026 | 3,301 | |
| 2027 | 2027 | 2,906 | |
| 2028 | |
| Thereafter | Thereafter | 12,834 | |
| Total minimum future commitments | Total minimum future commitments | $ | 40,919 | |
NOTE 13 – IncentiveEquity-Based Compensation ArrangementsAwards
Overview
We and certain of our subsidiaries have entered into incentive compensation award agreements to grant profits interest awards, restricted stock units ("RSUs"), performance stock units ("PSUs") and other incentive awards to our employees, our Manager, and non-employee directors. The following table summarizes compensation cost we recognized in connection with our incentiveequity-based compensation awards for the years indicated:
| | | | | | | | | | | | | | | | | |
| Year Ended December 31, |
| 2022 | | 2021 | | 2020 |
| (in thousands) |
| Recognized in expense (income): | | | | | |
| ASC Topic 710 profits interest awards | $ | 1,021 | | | $ | — | | | $ | — | |
| ASC Topic 718 liability-classified profits interest awards | 10,137 | | | (2,043) | | | (797) | |
| ASC Topic 718 equity-classified profits interest awards | 2,403 | | | 1,563 | | | ��� | |
| ASC Topic 718 equity-classified RSU awards | 1,192 | | | — | | | — | |
| ASC Topic 718 equity-classified PSU awards | 24,331 | | | 1,120 | | | — | |
| ASC Topic 718 equity-classified Contango PSU awards | — | | | 39,279 | | | — | |
| Total expense (income) | 39,084 | | | 39,919 | | | (797) | |
| Capitalized to proved and unproved oil and natural gas properties: | | | | | |
| ASC Topic 718 liability-classified profits interest awards | — | | | 1,806 | | | — | |
| ASC Topic 718 equity-classified profits interest awards | — | | | 1,567 | | | — | |
| Total capitalized compensation cost | — | | | 3,373 | | | — | |
| Total compensation cost | $ | 39,084 | | | $ | 43,292 | | | $ | (797) | |
| | | | | | | | | | | | | | | | | |
| Year Ended December 31, |
| 2023 | | 2022 | | 2021 |
| (in thousands) |
| Recognized in expense (income): | | | | | |
| Liability-classified profits interest awards | $ | 298 | | | $ | 10,137 | | | $ | (2,043) | |
| Equity-classified profits interest awards | 12,799 | | | 2,403 | | | 1,563 | |
| Equity-classified LTIP RSU awards | 1,685 | | | 1,192 | | | — | |
| Equity-classified LTIP PSU awards | 118 | | | — | | | — | |
| Equity-classified Manager PSU awards | 68,036 | | | 24,331 | | | 1,120 | |
| Equity-classified Contango PSU awards | — | | | — | | | 39,279 | |
| Total equity-based compensation expense (income) | $ | 82,936 | | | $ | 38,063 | | | $ | 39,919 | |
| | | | | |
| | | | | |
| | | | | |
| | | | | |
| | | | | |
Our incentive compensation awards may contain certain service-based, performance-based, and market-based vesting conditions, which are further discussed below.
ASC Topic 710 compensation awards
Incentive unit awards
Certain of our subsidiaries have issued incentive awards that require continuous service in order to receive distributions, and do not represent an equity interest. As these incentive awards are similar to a cash bonus plan, compensation cost is measured based on the present value of expected benefits that are probable of being paid and recognized over the period services are provided. Compensation cost is remeasured at each reporting period based on expected future benefits. We recognized $1.0 million for the year ended December 31, 2022 and we did not recognize any compensation cost for this type of incentive award during the years ended 2021 and 2020.
ASC Topic 718 stock-basedEquity-based compensation awards
Liability-classified profits interest awards
Certain of our subsidiariesWe issue profits interests that are liability-classified stock-based compensation awards. These awards contain different vesting conditions ranging from performance-based conditions that vest upon the achievement of certain return thresholds to time-based service requirements ranging from one year to four years. Each of these profits interests is liability-classified because of certain features within these awards that predominantly contain characteristics of liability instruments. Compensation cost for these awards is presented within generalGeneral and administrative expense on the consolidated statements of operations with a corresponding credit to other long-term liabilities on the consolidated balance sheets.
We did not have any unrecognized compensation cost related to time-based unvested liability-classified profits interest awards at December 31, 2023 and 2022. Unrecognized compensation cost related to performance-based unvested liability classified profits interest awards was $3.7$3.8 million as of December 31, 20222023 and $2.8$3.7 million at December 31, 2021.2022. As of December 31, 20222023 and 2021,2022, we carried $10.1$5.8 million and $7.1$10.1 million in Other long-term liabilities on the consolidated balance sheets, respectively. Transactions involving all of our unvested liability-classified stock-based compensation profits interest awards is summarized below:
| | | | | | | | | | | | | | | | | |
| Year Ended December 31, |
| 2022 | | 2021 | | 2020 |
| (units in thousands) |
| Beginning balance | 708 | | | 888 | | | 1,215 | |
| Granted | — | | | 708 | | | — | |
| | | | | |
| Vested | — | | | (110) | | | (203) | |
| Forfeited | (707) | | | (778) | | | (125) | |
| Ending balance | 1 | | | 708 | | | 888 | |
| | | | | |
| (in millions) |
| Fair value of vested awards | $ | — | | | $ | 2.9 | | | $ | 7.7 | |
| Cash settlements of liability-classified profits interest awards | $ | — | | | $ | 0.9 | | | $ | — | |
| | | | | | | | | | | | | | | | | |
| Year Ended December 31, |
| 2023 | | 2022 | | 2021 |
| (units in thousands) |
| Beginning balance | 1 | | | 708 | | | 888 | |
| Granted | — | | | — | | | 708 | |
| | | | | |
| Vested | — | | | — | | | (110) | |
| Forfeited | — | | | (707) | | | (778) | |
| Ending balance | 1 | | | 1 | | | 708 | |
| | | | | |
| (in millions) |
| Fair value of vested awards | $ | — | | | $ | — | | | $ | 2.9 | |
| Cash settlements of liability-classified profits interest awards | — | | | — | | | 0.9 | |
During the year ended December 31, 2022, we entered into amendments to the award agreements of certain of our subsidiaries' liability-classified profits interests, which resulted in a modification from liability classification to equity classification. As a result, we recorded a reclassification of $7.3 million from other long-term liabilities to noncontrolling interest on the consolidated balances sheets.
Equity-classified profits interest awards
Certain of our subsidiariesWe issue equity-classified profits interests awards. These awards that contain different vesting conditions ranging from performance-based conditions that vest upon the achievement of certain return thresholds to time-based service requirements ranging from one year to four years. Each of these profits interests is equity-classified because of certain features within these awards that predominantly contain characteristics of equity instruments. Compensation cost for these awards is presented within General and administrative expense on the combined and consolidated statements of operations with a corresponding credit to Additional paid-in capital on the consolidated balance sheets.
Unrecognized compensation cost related to time-based unvested equity-classified profits interest awards was $25.4 million and $28.3 million asat each of December 31, 2023 and 2022 and is expected to be recognized over a remaining weighted average service period of 2.7 years. Unrecognized compensation cost related to our performance based equity-classified profits interest awards was $37.7 million and $39.2 million as of December 31, 2023 and 2022. Transactions involving all of our unvested equity-classified profits interest awards, including weighted average grant date fair values, are summarized below:
| | | | | | | | | | | |
| Units | | Weighted average grant date fair value |
| (in thousands) | | |
| | | |
| | | |
| | | |
| | | |
| Unvested at December 31, 2021 | 199 | | | $ | — | |
| Granted | 132,691 | | | 0.11 | |
| Modified | 1,778 | | | 35.10 | |
| Vested | (15,840) | | | 0.15 | |
| Forfeited | (27) | | | — | |
| Unvested at December 31, 2022 | 118,801 | | | $ | 0.66 | |
| Granted | 433 | | | 54.97 | |
| | | |
| Vested | (15) | | | — | |
| Forfeited | (12,630) | | | 0.78 | |
| Unvested at December 31, 2023 | 106,589 | | | $ | 0.86 | |
| | | | | | | | | | | | | | | | | |
| Year Ended December 31, |
| 2023 | | 2022 | | 2021 |
| (in thousands) |
| Cash settlement of awards during the period | $ | — | | | $ | — | | | $ | 150 | |
| Fair value of awards vested during the period | — | | | 2,403 | | | 1,768 | |
| | | | | | | | | | | |
| Units | | Weighted average grant date fair value |
| (in thousands) | | |
| Unvested at December 31, 2020 | — | | | $ | — | |
| Granted | 477 | | | 10.98 | |
| Vested | (25) | | | 10.61 | |
| Forfeited | (253) | | | 11.02 | |
| Unvested at December 31, 2021 | 199 | | | $ | — | |
| Granted | 132,691 | | | 0.11 | |
| Modified | 1,778 | | | 35.10 | |
| Vested | (15,840) | | | 0.15 | |
| Forfeited | (27) | | | — | |
| Unvested at December 31, 2022 | 118,801 | | | $ | 0.66 | |
| | | | | | | | | | | | | | | | | |
| Year Ended December 31, |
| 2022 | | 2021 | | 2020 |
| (in thousands) |
| Cash settlement of awards during the period | $ | — | | | $ | 150 | | | $ | — | |
| Fair value of awards vested during the period | $ | 2,403 | | | $ | 1,768 | | | $ | — | |
Equity-classified LTIP RSU Awards
During the yearyears ended December 31, 2023 and 2022, we granted equity-classified LTIP RSUs under the Crescent Energy Company 2021 Equity Incentive Plan to certain directors, officers and employees. Each LTIP RSU represents the contingent right to receive one share of Class A Common Stock. LTIP RSUs will vest over a period of one to three years, with equity based compensation expense recognized ratably over the applicable vesting period. Compensation cost for these awards is presented within General and administrative expense on the consolidated statements of operations with a corresponding credit to Additional paid-in capital on the consolidated balance sheets.
We did not have any equity-classified LTIP RSU awards that vested during the yearsyear ended December 31, 2022, 2021 and 2020. 2022.
At December 31, 2023 and 2022, we had $2.4 million and $1.2 million of unrecognized compensation cost related to unvested equity-classified LTIP RSU awards.awards, which are expected to be recognized over a remaining weighted average period of 1.4 years and 1.3 years, respectively. Transactions involving all of our unvested equity-classified LTIP RSU awards, including weighted average grant date fair values, are summarized below:
| | Target Class A Shares | | Weighted average grant date fair value |
| (in thousands) | | |
| Target Class A Shares | | | Target Class A Shares | | Weighted average grant date fair value |
| (in thousands) | |
| Unvested at December 31, 2021 | |
| Unvested at December 31, 2021 | |
| Unvested at December 31, 2021 | Unvested at December 31, 2021 | — | | | $ | — | |
| Granted | Granted | 130 | | | 18.41 | |
| Vested | Vested | — | | | — | |
| Forfeited | Forfeited | — | | | — | |
| Unvested at December 31, 2022 | Unvested at December 31, 2022 | 130 | | | $ | 18.41 | |
| Granted | |
| Vested | |
| Forfeited | |
| Unvested at December 31, 2023 | |
Equity-classified LTIP PSU Awards
In conjunction withDuring the Merger Transactions,year ended December 31, 2023, we granted equity-classified ManagerLTIP PSUs under the Crescent Energy Company 2021 Equity Incentive Plan PSUs in accordance with the Manager Incentive Plan. The PSU performance periods are generally three years with the performance period end dates ranging from December 2024 through December 2028.to certain employees. Each LTIP PSU represents the right to receive a target 2%one share of our issued and outstanding Class A Common Stock, on such LTIP PSU's performance period end date, modified by an amount ranging from 0% to 240% based on certain absolute and relative shareholder return components. Compensation cost for these awards is presented within General and administrative expense on the combined and consolidated statements of operations with a corresponding credit to Additional paid-in capital and Redeemable noncontrolling interest on the consolidated balance sheets.
At December 31, 2023, we had $2.2 million of unrecognized compensation cost related to unvested equity-classified LTIP PSU Awards, which are expected to be recognized over a remaining weighted average period of 3.7 years. Transactions involving all of our unvested equity-classified LTIP PSU awards, including weighted average grant date fair value, are summarized below:
| | | | | | | | | | | |
| Target Class A Shares | | Weighted average grant date fair value |
| (in thousands) | | |
| Unvested at December 31, 2022 | — | | | $ | — | |
| Granted | 102 | | | 22.75 | |
| Vested | — | | | — | |
| Forfeited | — | | | — | |
| Unvested at December 31, 2023 | 102 | | | $ | 22.75 | |
Equity-classified Manager PSU Awards
In conjunction with the Merger Transactions, we granted equity-classified Manager PSUs in accordance with the Manager Incentive Plan. The Manager PSU performance periods are generally three years with the performance period end dates ranging from December 2024 through December 2028. Each Manager PSU represents the right to receive a target 2% of our issued and outstanding Class A Common Stock on such Manager PSU's performance period end date, modified by an amount ranging
from 0% to 240% based on certain absolute and relative shareholder return components. Compensation cost for these awards is presented within General and administrative expense on the combined and consolidated statements of operations with a corresponding credit to Additional paid-in capital and Redeemable noncontrolling interest on the consolidated balance sheets.
During the year ended December 31, 2023, in conjunction with the Equity Issuance, Class A Conversions and LTIP RSU award vesting, we increased our Class A Common Stock share count by 43.3 million shares. As a result, the number of equity-classified Manager PSU target Class A Shares granted under the Crescent Energy Company 2021 Manager Incentive Plan increased by 4.3 million shares. We accounted for this increase as a change in estimate and recognized additional expense of $30.4 million during the year ended December 31, 2023.
During the year ended December 31, 2022, in conjunction with the Offering, we increased our Class A Common Stock share count by 6.3 million shares. As a result, the number of Manager PSU target Class A Shares increased by 0.6 million shares at a weighted average grant date fair value of $22.75 per
share, and we recognized a stock-based compensation award change in estimate in connection with such increase. As a result of this change in estimate, we recognized an additional expense of $2.5 million during the year ended December 31, 2022.
Unrecognized compensation cost related to unvested awards was $114.9 million and $84.4 million, at a weighted average grant date fair value of $22.75 per share as of December 31, 2023 and 2022, and is expected to be recognized over a remaining weighted-average period of 2.9 and 3.9 years. Transactions involving all of our unvested Manager PSUs including weighted average grant date fair values, are summarized below:
| | | | | | | |
| Target Class A Shares | | |
| (in thousands) | | |
| Unvested at December 31, 2020 | — | | |
| Granted | 4,195 | | |
| Vested | — | | |
| Forfeited | — | | |
| Unvested at December 31, 2021 | 4,195 | | | |
| Granted | 632 | | | |
| Vested | — | | | |
| Forfeited | — | | | |
| Unvested at December 31, 2022 | 4,827 | | | |
| Granted | 4,333 | | | |
| Vested | — | | | |
| Forfeited | — | | | |
| Unvested at December 31, 2023 | 9,160 | | | |
Equity-classified Contango PSU Awards
Prior to the Merger Transaction, Contango issued equity-classified PSU awards to its employees in exchange for their services to Contango over each award's respective performance period. As part of the Merger Transactions, Contango's equity-classified PSUs were modified to pay out 300% of the target PSU award amount at the close of the Merger Transactions. Because the PSU awards were modified as part of the Merger Transactions, during the year ended December 31, 2021 we recorded compensation cost in the amount of the increase in the fair value of the Contango equity-classified PSUs as a result of the modification immediately after the close of the Merger Transactions within General and administrative expense on the combined and consolidated statements of operations with corresponding credits to Additional paid-in capital and Redeemable noncontrolling interests on the consolidated balance sheets.
NOTE 14 – Related Party Transactions
KKR Group
Management Agreement
In connection with the Merger Transactions, we entered into a management agreement (the "Management Agreement") with KKR Energy Assets Manager LLC (the "Manager"). Pursuant to the Management Agreement, the Manager provides the Company with its senior executive management team and certain management services. The Management Agreement has an initial term of three years and shall renew automatically at the end of the initial term for an additional three-year period unless the Company or the Manager elects not to renew the Management Agreement.
As consideration for the services rendered pursuant to the Management Agreement and the Manager’s overhead, including compensation of the executive management team, the Manager is entitled to receive compensation ("Management Compensation") on a quarterly basis equal to our pro rata share (based on our relative ownership of OpCo) of $53.3 million.an annual
$55.5 million fee. This amount will increase over time as our ownership percentage of OpCo increases. In addition, as our business and assets expand, Management Compensation may increase by an amount equal to 1.5% per annum of the net proceeds from all future issuances of our equity securities (including in connection with acquisitions). However, incremental Management Compensation will not apply to the issuance of our shares upon the redemption or exchange of OpCo Units. During the years ended December 31, 2023, 2022 and 2021, we recorded general and administrative expense of $23.8 million, $14.3 million and $0.9 million, respectively, and made cash distributions of $33.2 million and $32.3 million in December 31,2023and 2022 to our redeemable noncontrolling interests related to the Management Agreement. We did not make any cash distributions to our redeemable noncontrolling interest during the year ended December 31, 2021. In addition, at December 31, 20222023 and 20212022, we accrued $13.3$13.9 million and $3.6$13.3 million, included within Accounts payable - affiliates on the consolidated balance sheets, for distributions to our redeemable noncontrolling interests in OpCo related to the Management Agreement which will be paid during the first quarter of 2023.2024.
Additionally, the Manager is entitled to receive incentive compensation ("Incentive Compensation") under which the Manager is targeted to receive 10% of our outstanding Class A Common Stock based on the achievement of certain performance-based
measures. The Incentive Compensation consists of five tranches that settle over a five-year period beginning in 2024, and each tranche relates to a target number of shares of Class A common stock equal to 2% of the outstanding Class A common stock as of the time such tranche is settled. So long as the Manager continuously provides services to us until the end of the performance period applicable to a tranche, the Manager is entitled to settlement of such tranche with respect to a number of shares of Class A common stock ranging from 0% to 4.8% of the of the outstanding Class A Common Stock at the time each tranche is settled. During the yearyears ended December 31, 2023, 2022 and 2021, we recorded general and administrative expense of $68.0 million, $24.3 million and $1.1 million, respectively, related to the Incentive Compensation. See NOTE 13 – IncentiveEquity-Based Compensation ArrangementsAwards for more information.
KKR Funds
From time to time, we may invest in upstream oil and gas assets alongside EIGF II and/or other KKR funds ("KKR Funds") pursuant to the terms of the Management Agreement. In these instances, certain of our consolidated subsidiaries enter into Master Service Agreements ("MSA") with entities owned by KKR Funds, pursuant to which our subsidiaries provide certain services to such KKR Funds, including the allocation of the production and sale of oil, natural gas and NGLs, collection and disbursement of revenues, operating expenses and general and administrative expenses in the respective oil and natural gas properties, and the payment of all capital costs associated with the ongoing operations of the oil and natural gas assets. Our subsidiaries settle balances due to or due from KKR Funds on a monthly basis. The administrative costs associated with these MSAs are allocated by us to KKR Funds based on (i) an actual basis for direct expenses we may incur on their behalf or (ii) an allocation of such charges between the various KKR Funds based on the estimated use of such services by each party. As of December 31, 20222023 and 2021,2022, we had a related party receivable of $0.1 million and $0.8 million, and $3.3 millionrespectively, included within Accounts receivable – affiliates and a related party payable of $27.9 million and $14.0 million, and $3.4 millionrespectively, included within Accounts payable – affiliates on our consolidated balance sheets associated with KKR Funds transactions.
Secondary Offering
During the year ended December 31, 2022, KKR Capital Markets LLC ("KCM"),
We engage KCM, an affiliate of KKR Group, received $1.3 million in underwriterfor capital market transactions including notes offerings, credit facility structuring and equity offerings. The following table summarizes fees, discounts and commissions in connection with the Offering. Concurrently with the closing of the Offering, we repurchased an aggregate of approximately 2.6 million OpCo Units from PT Independence for $36.2 million and cancelled a corresponding number of our Class B Common Stock. Refer to further discussion in NOTE 1 – Organization and Basis of Presentation regarding the Equity Transactions.
Other Transactions
During the year ended December 31, 2022, we incurred $0.7 million in feespaid to KCM in connection with their role as book-running manager of the Additional 2026 Notes (as defined in our debt and equity transactions:
| | | | | | | | | | | | | | | | | |
| Year Ended December 31, |
| 2023 | | 2022 | | 2021 |
| (in millions) |
| Amounts paid to KCM | $5.2 | | $3.5 | | $1.6 |
| | | | | |
| | | | | |
| | | | | |
| | | | | |
| | | | | |
| | | | | |
NOTE 8 – Debt
).
We recorded these fees asto debt issuance costs within Long-term debt (note offerings) and Other assets (credit facility structuring) or APIC (equity offerings). At December 31, 2023 we had a related party payable of $0.3 million, included within Accounts payable - affiliates on theour consolidated balance sheets. Additionally, we paid $1.5 million in fees tosheet associated with KCM related to the amendment to our Revolving Credit Facility, which increased our borrowing base and elected commitment amount in connection with the Uinta Transaction. We recorded these fees as debt issuance costs within transactions.
Other assets on the consolidated balance sheets. See NOTE 8 – Debt.Transactions
During the year ended December 31, 2021,2023, we paid $1.6 million in fees to KCM, for services provided as a book-running manager in connection with the issuancemade cash distributions of our 2026 Notes in May 2021 and recorded as debt issuance costs within Long-term debt on the consolidated balance sheets. Additionally, we paid $0.1$0.8 million to KKR Capstone Americas LLC for professional fees supportour redeemable noncontrolling interests related to insurancetheir pro rata share of cash distributions made to Crescent Energy Company to pay income taxes. In addition, we reimburse KKR for any costs incurred on our behalf. At December 31, 2023 we had $1.3 million accrued within Accounts payable - affiliates for reimbursable costs and employee benefits due diligence and placement and recorded as General and administrative expense ondistributions to our redeemable noncontrolling interests for their pro rata share of taxes which will be paid during the combined and consolidated statementsfirst quarter of operations.2024.
During the year ended December 31, 2022, we made cash distributions of $18.1 million to our redeemable noncontrolling interests related to their pro rata share of cash distributions made to Crescent Energy Company to pay income taxes. At December 31, 2022, we had $0.1 million accrued within Accounts payable - affiliates for distributions to our redeemable noncontrolling interests in OpCo related to their pro rata share of taxes which will bewas paid during the first quarter of 2023.
During the year ended December 31, 2023, we signed a ten-year office sublease agreement with KKR. The terms of the lease provide for an annual base rent of approximately $0.7 million. Upon lease commencement in December 2023, we recorded a $5.3 million right-of-use asset in Other assets, an operating lease liability of $0.4 million in Other current liabilities and $4.9 million in Other liabilities on the consolidated balance sheets. We also recorded our allocated share of leasehold improvement cost from KKR of $6.6 million to Accounts payable - affiliates and Field and other property and equipment, at cost on the consolidated balance sheets.
Board of Directors
During the year ended December 31, 2023, we signed a ten-year office lease with an affiliate of Crescent Real Estate LLC. John C. Goff, the Chairman of our Board of Directors, is affiliated with Crescent Real Estate LLC. The terms of the lease provide for annual base rent of approximately $0.3 million, increasing over the term of the lease, and the payment by one of our subsidiaries of certain other customary expenses. Upon lease commencement in April 2023, we recorded a $2.4 million right-of-use asset in Other assets, an operating lease liability of $0.1 million in Other current liabilities and $2.3 million in Other liabilities on the consolidated balance sheets. During the first quarter of 2024, we entered into an amendment to the original lease agreement for additional office space. Under the amended agreement our annual base rent is $0.4 million increasing to $0.5 million over the life of the agreement.
In February 2022, we contributed all the assets and prospects in the Gulf of Mexico formerly owned by Contango to Chama, an entity in which we retained an interest of approximately 9.4%. John Goff, the Chairman of our Board of Directors, holds an interest of approximately 17.5% in Chama, and the remaining interest is held by other investors. Pursuant to the Limited Liability Company Agreement of Chama, we may be required to fund certain workover costs and we will be required to fund plugging and abandonment costs related to producing assets held by Chama (collectively, “Crescent Contributions”). We receive 90.0% of cash flows from the producing assets, which amount is increased for any Crescent Contributions. At December 31, 2022 we had an equity investment in Chama of $4.2 million. During the year ended December 31, 2023, we identified an indicator that the carrying value of our equity method investment was not recoverable and thus recorded an other-than-temporary impairment charge of $3.9 million.
FDL
Certain of our consolidated subsidiaries previously entered into an Oil and Natural Gas Property Operating and Services Agreement (the “FDL Agreement”) with FDL Operating LLC ("FDL"). As of December 31, 2021, we had a net related party receivable due from FDL totaling $16.9 million, included within Accounts receivable – affiliates on our consolidated balance sheets, which was settled during the year ended December 31, 2022.
Pursuant to the FDL Agreement, FDL was engaged to manage the day-to-day operations of the business activities of certain of our consolidated subsidiaries, including allocating to us and other interest holders the production and sale of oil, natural gas and
natural gas liquids, collection and disbursement of revenues, operating expenses and general and administrative expenses in the respective oil and natural gas properties and the payment of all capital costs associated with the ongoing operations of such properties. As part of the engagement, FDL will then allocate the revenues, operating expenses, general and administrative expenses and cash collected to us and others as appropriate. We settled balances due to or due from FDL on a monthly basis.
On September 20, 2021 we provided notice that we are terminating the FDL Agreement effective on March 31, 2022 and, as part of the termination principal terms, we agreed to pay up to $6.7 million in wind down costs and additional severance costs for certain qualifying, dedicated employees, of which any unused portion will be returned to us at the end of the wind down period. During the year ended December 31, 2021, we recorded $3.3 million of general and administrative expense associated with the termination and had $0.3 million and $1.9 million remaining in an escrow account to fund these wind down costs at December 31, 2023 and 2022.
In May 2022, we repurchased all of the noncontrolling interests and working interests in our assets held directly by affiliates of FDL for aggregate consideration of approximately $8.8 million, effectively purchasing the remainder of FDL's management ownership of certain of our consolidated subsidiaries. Subsequent to this transaction, FDL is no longer a related party and we
have no remaining relationship with FDL other than the payment of wind down costs, which we expect to be fully funded by the amount already deposited in escrow and recorded as Other assets on our consolidated balance sheets.
RPM
Prior to 2022, an affiliate of KKR Group had a Master Management Services Agreement (the “MSA”) with a subsidiary of RPM Energy Management Partnership L.P. (“RPM”) to act as the manager of certain mineral and non-operated assets controlled by our consolidated subsidiaries. Pursuant to the MSA and under management of certain KKR affiliated entities, RPM managed the day-to-day operations of the business activities of certain of our oil and natural gas properties. We reimbursed RPM for all reasonable out-of-pocket expenses incurred for fulfilling its obligations under the MSA (“Allocable Overhead Costs”). The Allocable Overhead Costs were charged to us on an actual basis without mark-up or subsidy. As such, the Allocable Overhead Costs approximated reasonable market rates and were representative of the expenses that we would have incurred had we not entered into the MSA. We settled balances due to or due from RPM on a monthly basis.
On December 31, 2021, we terminated our relationship with RPM. As of December 31, 2021 we had a payable due to RPM of $1.7 million included within Accounts payable – affiliates on our consolidated balance sheets which was settled in 2022.
NOTE 15 – Earnings Per Share
We have two classes of common stock in the form of Class A Common Stock and Class B Common Stock. Our shares of Class A Common Stock are entitled to dividends, and shares of Class B Common Stock do not have rights to participate in dividends or undistributed earnings. However, shareholders of Class B Common Stock receive pro rata distributions from OpCo through their ownership of OpCo Units. We apply the two-class method for purposes of calculating earnings per share (“EPS”). The two-class method determines earnings per share of common stock and participating securities according to dividends or dividend equivalents declared during the period and each security's respective participation rights in undistributed earnings and losses. Net income (loss) per share - diluted excludes the effect of 4.2 million PSUs for the year ended December 31, 2021 that were antidilutive.
As described in NOTE 1 – Organization and Basis of Presentation, our financial statements have been retrospectively recast to reflect the historical accounts of Independence and the Contributed Entities on a combined basis due to the Merger Transactions and Independence Reorganization, respectively. Net income (loss) for periods prior to the Merger Transactions is allocated to our Predecessor as our Predecessor's Class A Units were exchanged for shares of Class B Common Stock in connection with the Merger Transactions. Net income (loss) attributable to Crescent Energy is allocated to Class A Common Stock and Class B Common Stock based on the participation rights of each class to share in undistributed earnings and losses after giving effect to dividends declared during the period, if any.
The following table sets forth the computation of basic and diluted net income (loss) per share:
| | Year Ended December 31, |
| 2022 | | 2021 | | 2020 |
| (in thousands, except share and per share amounts) |
| Year Ended December 31, | | | Year Ended December 31, |
| 2023 | | | 2023 | | 2022 | | 2021 |
| (in thousands, except share and per share amounts) | | | (in thousands, except share and per share amounts) |
| Numerator: | Numerator: | |
| Net income (loss) | |
| Net income (loss) | |
| Net income (loss) | Net income (loss) | $ | 480,600 | | | $ | (432,227) | | | $ | (216,124) | |
| Less: net (income) loss attributable to Predecessor | Less: net (income) loss attributable to Predecessor | — | | | 339,168 | | | 118,649 | |
| Less: net (income) loss attributable to noncontrolling interests | Less: net (income) loss attributable to noncontrolling interests | (2,669) | | | 14,922 | | | 97,475 | |
| Less: net (income) loss attributable to redeemable noncontrolling interests | Less: net (income) loss attributable to redeemable noncontrolling interests | (381,257) | | | 58,761 | | | — | |
| Net income (loss) attributable to Crescent Energy - basic | Net income (loss) attributable to Crescent Energy - basic | $ | 96,674 | | | $ | (19,376) | | | $ | — | |
| Add: Reallocation of net income attributable to redeemable noncontrolling interest for the dilutive effect of RSUs | Add: Reallocation of net income attributable to redeemable noncontrolling interest for the dilutive effect of RSUs | 25 | | | — | | | — | |
| Add: Reallocation of net income attributable to redeemable noncontrolling interest for the dilutive effect of PSUs | Add: Reallocation of net income attributable to redeemable noncontrolling interest for the dilutive effect of PSUs | 490 | | | — | | | — | |
| Net income (loss) attributable to Crescent Energy - diluted | Net income (loss) attributable to Crescent Energy - diluted | $ | 97,189 | | | $ | (19,376) | | | $ | — | |
| Denominator: | Denominator: | | | | | |
| Weighted-average Class A Common Stock outstanding - basic | Weighted-average Class A Common Stock outstanding - basic | 43,865,176 | | | 41,954,385 | | |
| Weighted-average Class A Common Stock outstanding - basic | |
| Weighted-average Class A Common Stock outstanding - basic | |
| Add: dilutive effect of RSUs | Add: dilutive effect of RSUs | 11,867 | | | — | | |
| Add: dilutive effect of PSUs | Add: dilutive effect of PSUs | 234,780 | | | — | | |
| Weighted-average Class A common stock outstanding – diluted | Weighted-average Class A common stock outstanding – diluted | 44,111,823 | | | 41,954,385 | | |
| Weighted-average Class B Stock outstanding - basic and diluted | Weighted-average Class B Stock outstanding - basic and diluted | 124,856,941 | | | 127,536,463 | | |
| Net income (loss) per share: | Net income (loss) per share: | |
Class A Common Stock - basic (1) | Class A Common Stock - basic (1) | $ | 2.20 | | | $ | (0.46) | | |
Class A Common Stock - basic (1) | |
Class A Common Stock - basic (1) | |
Class A Common Stock - diluted (1) | Class A Common Stock - diluted (1) | $ | 2.20 | | | $ | (0.46) | | |
| Class B Common Stock - basic and diluted | Class B Common Stock - basic and diluted | $ | — | | | $ | — | | |
(1)Represents weighted-average Class A common stock outstanding and net income (loss) per share of Class A common stock for the period subsequent to the Merger Transactions.
NOTE 16 – Subsequent Events
Subsequent events have been evaluated through the date of issuance of these financial statements, and there have been no events subsequent to December 31, 2022,2023, other than those items disclosed below, that would require additional adjustments to our disclosure in our financial statements.
February Notes Offering
In February 2023, we issued $400.0 million aggregate principal amount of 9.250% senior notes due 2028 (the "2028 Notes"). The estimated proceeds of the offering were $391.3 million, after deducting the initial purchasers' discount and offering expenses, which we used to repay a portion of outstanding borrowings under our Revolving Credit Facility. The 2028 Notes bear interest at an annual rate of 9.250%, which is payable on February 15 and August 15 of each year and mature on February 15, 2028. We incurred $1.1 million in fees to KCM in connection with the issuance of the 2028 Notes.
Dividend
On March 7, 2023,4, 2024, the Board of Directors approved a quarterly cash dividend of $0.17$0.12 per share, or $0.68$0.48 per share on an annualized basis, to be paid to our shareholders of our Class A Common Stock with respect to the fourth quarter of 2022.2023. The quarterly dividend is payable on March 31, 202328, 2024 to shareholders of record as of the close of business on March 20, 2023.15, 2024. OpCo unitholders will also receive a distribution based on their pro rata ownership of OpCo Units.
The payment of quarterly cash dividends is subject to management’s evaluation of our financial condition, results of operations and cash flows in connection with such payments and approval by our Board of Directors. Management and the Board of Directors will evaluate any future changes in cash dividends on a quarterly basis.
Our Board of Directors authorized a stock repurchase program on March 4, 2024 with an approved limit of $150.0 million and a two-year term. Repurchases may be of our Class A Common Stock or of OpCo Units (with the cancellation of a corresponding number of shares of our Class B Common Stock). Such repurchase may be made by Crescent or by OpCo, as applicable, and may be made from time to time in the open market, in a privately negotiated transaction, through purchases made in accordance with the Rule 10b5-1 of the Exchange Act or by such other means as will comply with applicable state and federal securities laws. The timing of any repurchases under the share repurchase program will depend on market conditions, contractual limitations and other considerations. The program may be extended, modified, suspended or discontinued at any time, and does not obligate us to repurchase any dollar amount or number of shares..
NOTE 17 – Supplemental Oil and Natural Gas Disclosures (Unaudited)
Geographic Area of Operation
All of the oil and natural gas properties in which we have working interests and mineral and royalty interests are located within the continental U.S., with the majority concentrated in Texas, Rockies and Oklahoma. Therefore, the following disclosures about our costs incurred and proved reserves are presented on a combined and consolidated basis. In addition, at December 31, 2021, we had a 37% ownership in our equity method investment, Exaro, that operates in the Jonah Field in Wyoming. During the year ended December 31, 2022, our equity method investment, Exaro, sold its operations, see NOTE 3 – Acquisitions and Divestitures for additional information.
Oil and Natural Gas Reserve Information
The following table presents our net proved reserves for the years ended December 31, 2023, 2022 2021 and 20202021 and the changes in net proved oil, natural gas and NGL reserves during such years. The net proved reserves for our equity method investment, Exaro, are presented based on our 37% ownership percentage. Because Exaro was acquired in 2021 as part of the Merger Transactions and subsequently sold in 2022, no values are presented for 20222023 and 2020.2022.
| | Developed and Undeveloped | Developed and Undeveloped | Oil
(MBbls) | | Natural Gas
(MMcf) | | Natural Gas Liquids
(MBbls) | | Total
(MBoe) | Developed and Undeveloped | Oil
(MBbls) | | Natural Gas
(MMcf) | | Natural Gas Liquids
(MBbls) | | Total
(MBoe) |
| Consolidated operations | Consolidated operations | | | | | | | |
| | Net proved reserves at December 31, 2019 | 211,533 | | 1,161,239 | | 61,126 | | 466,199 |
Revisions of previous estimates (1) | (57,708) | | (478,153) | | (20,279) | | (157,680) |
| Extensions, discoveries, and other additions | 4,088 | | 21,479 | | 603 | | 8,271 |
| Sales of reserves in place | — | | — | | — | | — |
Purchases of reserves in place (2) | 22,409 | | 196,840 | | 18,952 | | 74,168 |
| Production | (13,132) | | (78,541) | | (5,078) | | (31,300) |
| Net proved reserves at December 31, 2020 | 167,190 | | 822,864 | | 55,324 | | 359,658 |
Revisions of previous estimates (3) | 9,147 | | 316,572 | | 16,480 | | 78,389 |
| Extensions, discoveries, and other additions | 7,007 | | 17,247 | | 2,093 | | 11,975 |
| Sales of reserves in place | (6,333) | | (48,977) | | (3,265) | | (17,762) |
Purchases of reserves in place (4) | 46,386 | | 451,702 | | 11,960 | | 133,630 |
| Production | (13,237) | | (89,455) | | (6,099) | | (34,245) |
| Net proved reserves at December 31, 2021 | 210,160 | | 1,469,953 | | 76,493 | | 531,645 |
Revisions of previous estimates (5) | (18,859) | | (14,815) | | 4,167 | | (17,158) |
Extensions, discoveries, and other additions (6) | 37,208 | | 60,312 | | 7,751 | | 55,011 |
| Sales of reserves in place | (6,006) | | (19,365) | | (2,680) | | (11,915) |
Purchases of reserves in place (7) | 42,444 | | 138,920 | | — | | 65,597 |
| Production | (21,865) | | (128,470) | | (7,110) | | (50,387) |
| Net proved reserves at December 31, 2022 | 243,082 | | 1,506,535 | | 78,621 | | 572,793 |
| | Equity affiliate | | | | | | | |
| | Net proved reserves at December 31, 2020 | Net proved reserves at December 31, 2020 | — | | — | | — | | — |
| Revisions of previous estimates | — | | — | | — | | — |
| | Net proved reserves at December 31, 2020 | |
| | Net proved reserves at December 31, 2020 | | 167,190 | | 822,864 | | 55,324 | | 359,658 |
Revisions of previous estimates (1) | | Revisions of previous estimates (1) | 9,147 | | 316,572 | | 16,480 | | 78,389 |
| Extensions, discoveries, and other additions | Extensions, discoveries, and other additions | — | | — | | — | | — | Extensions, discoveries, and other additions | 7,007 | | 17,247 | | 2,093 | | 11,975 |
| Sales of reserves in place | Sales of reserves in place | — | | — | | — | | — | Sales of reserves in place | (6,333) | | (48,977) | | (3,265) | | (17,762) |
| Purchases of reserves in place | 205 | | 20,880 | | — | | 3,685 |
Purchases of reserves in place (2) | | Purchases of reserves in place (2) | 46,386 | | 451,702 | | 11,960 | | 133,630 |
| Production | Production | (1) | | (115) | | — | | (20) | Production | (13,237) | | (89,455) | | (6,099) | | (34,245) |
| Net proved reserves at December 31, 2021 | 204 | | 20,765 | | — | | 3,665 |
| Revisions of previous estimates | — | | — | | — | | — |
| Extensions, discoveries, and other additions | — | | — | | — | | — |
| Sales of reserves in place | (200) | | (20,357) | | — | | (3,593) |
| Purchases of reserves in place | — | | — | | — | | — |
| | Developed and Undeveloped | Developed and Undeveloped | Oil
(MBbls) | | Natural Gas
(MMcf) | | Natural Gas Liquids
(MBbls) | | Total
(MBoe) | Developed and Undeveloped | Oil
(MBbls) | | Natural Gas
(MMcf) | | Natural Gas Liquids
(MBbls) | | Total
(MBoe) |
| Net proved reserves at December 31, 2021 | | Net proved reserves at December 31, 2021 | 210,160 | | 1,469,953 | | 76,493 | | 531,645 |
Revisions of previous estimates (3) | | Revisions of previous estimates (3) | (18,859) | | (14,815) | | 4,167 | | (17,158) |
Extensions, discoveries, and other additions (4) | | Extensions, discoveries, and other additions (4) | 37,208 | | 60,312 | | 7,751 | | 55,011 |
| Sales of reserves in place | | Sales of reserves in place | (6,006) | | (19,365) | | (2,680) | | (11,915) |
Purchases of reserves in place (5) | | Purchases of reserves in place (5) | 42,444 | | 138,920 | | — | | 65,597 |
| Production | | Production | (21,865) | | (128,470) | | (7,110) | | (50,387) |
| Net proved reserves at December 31, 2022 | | Net proved reserves at December 31, 2022 | 243,082 | | 1,506,535 | | 78,621 | | 572,793 |
Revisions of previous estimates (6) | | Revisions of previous estimates (6) | (15,501) | | (472,337) | | (11,676) | | (105,901) |
Extensions, discoveries, and other additions (7) | | Extensions, discoveries, and other additions (7) | 2,808 | | 16,240 | | 1,635 | | 7,150 |
| Sales of reserves in place | | Sales of reserves in place | (1,655) | | (15,075) | | (1,774) | | (5,942) |
Purchases of reserves in place (8) | | Purchases of reserves in place (8) | 46,018 | | 271,682 | | 43,301 | | 134,599 |
| Production | | Production | (24,287) | | (130,629) | | (8,475) | | (54,533) |
| Net proved reserves at December 31, 2023 | | Net proved reserves at December 31, 2023 | 250,465 | | 1,176,416 | | 101,632 | | 548,166 |
| | Equity affiliate | |
| | Equity affiliate | |
| | Equity affiliate | |
| | Net proved reserves at December 31, 2020 | |
| | Net proved reserves at December 31, 2020 | |
| | Net proved reserves at December 31, 2020 | | — | | — |
| | Purchases of reserves in place | |
| | Purchases of reserves in place | |
| | Purchases of reserves in place | | 205 | | 20,880 | | — | | 3,685 |
| Production | | Production | (1) | | (115) | | — | | (20) |
| Net proved reserves at December 31, 2021 | | Net proved reserves at December 31, 2021 | 204 | | 20,765 | | — | | 3,665 |
| | Sales of reserves in place | |
| | Sales of reserves in place | |
| | Sales of reserves in place | | (200) | | (20,357) | | — | | (3,593) |
| | Production | |
| Production | |
| Production | Production | (4) | | (408) | | — | | (72) | (4) | | (408) | | — | | (72) |
| Net proved reserves at December 31, 2022 | Net proved reserves at December 31, 2022 | — | | — | | — | | — | Net proved reserves at December 31, 2022 | — | | — |
| | | Net proved reserves at December 31, 2023 | |
| | Net proved reserves at December 31, 2023 | |
| | Net proved reserves at December 31, 2023 | | — | | — |
| | Total company | |
| Total company | |
| Total company | Total company | |
| | Net proved reserves at December 31, 2020 | 167,190 | | 822,864 | | 55,324 | | 359,658 |
| | Net proved reserves at December 31, 2021 | |
| | Net proved reserves at December 31, 2021 | |
| | Net proved reserves at December 31, 2021 | Net proved reserves at December 31, 2021 | 210,364 | | 1,490,718 | | 76,493 | | 535,310 | 210,364 | | 1,490,718 | | 76,493 | | 535,310 |
| Net proved reserves at December 31, 2022 | Net proved reserves at December 31, 2022 | 243,082 | | 1,506,535 | | 78,621 | | 572,793 | Net proved reserves at December 31, 2022 | 243,082 | | 1,506,535 | | 78,621 | | 572,793 |
| Net proved reserves at December 31, 2023 | | Net proved reserves at December 31, 2023 | 250,465 | | 1,176,416 | | 101,632 | | 548,166 |
(1)Revisions of previous estimates include 92.0 MMBoe downward revisions of our PUD reserves. The revisions are primarily due to declining commodity prices which decreased the quantity of reserves recoverable from our proved locations, and also resulted in the removal of certain PUD locations that were uneconomic at year end prices.
(2)Purchases in place of 74.2 MMBoe were primarily related to the Permian and DJ Basins.
(3)Revisions of previous estimates include 92.7 MMBoe upward revision due to pricing and cost changes, offset by 21.1 MMBoe downward revisions of our PUD reserves due to the removal of certain locations that are no longer part of our five-year consolidated development plan following the Merger Transactions.
(4)(2)Purchases in place included 125.6 MMBoe from our Merger Transactions, 5.6 MMBoe from our Central Basin Platform Acquisition and 2.5 MMBoe from our DJ Basin Acquisition.
(5)(3)Revisions of previous estimates primarily relate to increased expected future costs driven by inflation and a higher commodity price environment.
(6)(4)Extensions, discoveries and other additions of 55.0 MMBoe primarily relate to PUD extensions most of which related to our Eagle Ford asset.
(7)(5)Purchases of reserves in place of 65.6 MMBoe primarily related to our Uinta Acquisition.
(6)Revisions of previous estimates primarily relate to a 133 MMBoe downward revision from lower oil and natural gas prices, partially offset by 27 MMBoe in upward revisions from a variety of factors primarily driven by new contracts, operating expense revisions and upward forecast revisions in certain basins.
(7)Extensions, discoveries and other additions of 7.2 MMBoe primarily relate to PUD extensions all of which related to our Eagle Ford and Uinta assets.
(8)Purchases of reserves in place of 134.6 MMBoe primarily related to our Western Eagle Ford Acquisitions.
The following table sets forth our net proved oil, natural gas and NGL reserves for both our consolidated operations and our investment in Exaro as of the years ended December 31, 2023, 2022 2021 and 2020:
| | | | | | | | | | | | | | | | | | | | | | | |
| Proved Developed Reserves |
Oil (MBbls) | | Natural Gas (MMcf) | | Natural Gas Liquids (MBbls) | | Total (MBoe) |
| Consolidated operations | | | | | | | |
| December 31, 2022 | 160,113 | | | 1,398,770 | | | 66,803 | | | 460,046 | |
| December 31, 2021 | 158,091 | | | 1,404,570 | | | 66,402 | | | 458,588 | |
| December 31, 2020 | 92,024 | | | 748,496 | | | 44,307 | | | 261,079 | |
| Equity affiliate | | | | | | | |
| December 31, 2022 | — | | | — | | | — | | | — | |
| December 31, 2021 | 204 | | | 20,765 | | | — | | | 3,665 | |
| December 31, 2020 | — | | | — | | | — | | | — | |
| | | | | | | | | | | | | | | | | | | | | | | |
| Proved Undeveloped Reserves |
Oil (MBbls) | | Natural Gas (MMcf) | | Natural Gas Liquids (MBbls) | | Total (MBoe) |
| Consolidated operations | | | | | | | |
| December 31, 2022 | 82,969 | | | 107,765 | | | 11,818 | | | 112,747 | |
| December 31, 2021 | 52,069 | | | 65,383 | | | 10,091 | | | 73,057 | |
| December 31, 2020 | 75,166 | | | 74,368 | | | 11,017 | | | 98,579 | |
| Equity affiliate | | | | | | | |
| December 31, 2022 | — | | | — | | | — | | | — | |
| December 31, 2021 | — | | | — | | | — | | | — | |
| December 31, 2020 | — | | | — | | | — | | | — | |
| | | | | | | | | | | | | | | | | | | | | | | |
| Proved Developed Reserves |
Oil (MBbls) | | Natural Gas (MMcf) | | Natural Gas Liquids (MBbls) | | Total (MBoe) |
| Consolidated operations | | | | | | | |
| December 31, 2023 | 176,546 | | | 1,032,578 | | | 87,316 | | | 435,958 | |
| December 31, 2022 | 160,113 | | | 1,398,770 | | | 66,803 | | | 460,046 | |
| December 31, 2021 | 158,091 | | | 1,404,570 | | | 66,402 | | | 458,588 | |
| Equity affiliate | | | | | | | |
| December 31, 2023 | — | | | — | | | — | | | — | |
| December 31, 2022 | — | | | — | | | — | | | — | |
| December 31, 2021 | 204 | | | 20,765 | | | — | | | 3,665 | |
| | | | | | | | | | | | | | | | | | | | | | | |
| Proved Undeveloped Reserves |
Oil (MBbls) | | Natural Gas (MMcf) | | Natural Gas Liquids (MBbls) | | Total (MBoe) |
| Consolidated operations | | | | | | | |
| December 31, 2023 | 73,919 | | | 143,838 | | | 14,316 | | | 112,208 | |
| December 31, 2022 | 82,969 | | | 107,765 | | | 11,818 | | | 112,747 | |
| December 31, 2021 | 52,069 | | | 65,383 | | | 10,091 | | | 73,057 | |
| Equity affiliate | | | | | | | |
| December 31, 2023 | — | | | — | | | — | | | — | |
| December 31, 2022 | — | | | — | | | — | | | — | |
| December 31, 2021 | — | | | — | | | — | | | — | |
Capitalized Costs Relating to Oil and Gas Producing Activities
The following table summarizes the capitalized costs relating to our oil and natural gas producing activities for both our consolidated operations and our investment in Exaro as of December 31, 20222023 and 2021:2022:
| | As of December 31, |
| 2022 | | 2021 |
| (in thousands) |
| As of December 31, | | | As of December 31, |
| 2023 | | | 2023 | | 2022 |
| (in thousands) | | | (in thousands) |
| Consolidated operations | Consolidated operations | |
| Proved oil and natural gas properties (successful efforts method) | |
| Proved oil and natural gas properties (successful efforts method) | |
| Proved oil and natural gas properties (successful efforts method) | Proved oil and natural gas properties (successful efforts method) | $ | 7,113,819 | | | $ | 6,043,602 | |
| Unproved oil and natural gas properties | Unproved oil and natural gas properties | 314,255 | | | 308,721 | |
| Oil and natural gas properties, at cost | Oil and natural gas properties, at cost | 7,428,074 | | | 6,352,323 | |
| Less: accumulated depreciation, depletion, amortization and impairment | Less: accumulated depreciation, depletion, amortization and impairment | (2,102,286) | | | (1,881,933) | |
| Net capitalized costs | Net capitalized costs | $ | 5,325,788 | | | $ | 4,470,390 | |
| | Equity affiliate | Equity affiliate | |
| Proved oil and natural gas properties (successful efforts method) | $ | — | | | $ | 9,043 | |
| Unproved oil and natural gas properties | — | | | — | |
| Oil and natural gas properties, at cost | — | | | 9,043 | |
| Less: accumulated depreciation, depletion and amortization | — | | | (67) | |
| Equity affiliate | |
| Equity affiliate | |
| | Net capitalized costs | Net capitalized costs | $ | — | | | $ | 8,976 | |
| | Net capitalized costs | |
| | Net capitalized costs | |
Costs Incurred in Oil and Gas Property Acquisition, Exploration and Development Activities
Acquisition costs include costs incurred to purchase, lease or otherwise acquire property. Exploration costs include additions to exploratory wells, including those in progress, and exploration expenses. Development costs include additions to production facilities and equipment and additions to development wells, including those in progress.
The following table summarizes costs incurred related to our oil and natural gas activities for both our consolidated operations and our investment in Exaro for the years ended December 31, 2023, 2022 2021 and 2020:
| | | | | | | | | | | | | | | | | |
| Year Ended December 31, |
| 2022 | | 2021 | | 2020 |
| (in thousands) |
| Consolidated operations | | | | | |
| Acquisition costs: | | | | | |
| Proved | $ | 793,081 | | | $ | 1,098,696 | | | $ | 355,010 | |
| Unproved | 71,387 | | | 41,355 | | | 680 | |
| Field and other property and equipment | 8,200 | | | — | | | — | |
| Exploration costs | 3,425 | | | 1,180 | | | — | |
| Development | 624,880 | | | 194,828 | | | 83,013 | |
| Total costs incurred | $ | 1,500,973 | | | $ | 1,336,059 | | | $ | 438,703 | |
| | | | | |
| Equity affiliate | | | | | |
| Acquisition costs: | | | | | |
| Proved | $ | — | | | $ | — | | | $ | — | |
| Unproved | — | | | — | | | — | |
| Exploration costs | — | | | — | | | — | |
| Development | — | | | — | | | — | |
| Total costs incurred | $ | — | | | $ | — | | | $ | — | |
| | | | | | | | | | | | | | | | | |
| Year Ended December 31, |
| 2023 | | 2022 | | 2021 |
| (in thousands) |
| Consolidated operations | | | | | |
| Acquisition costs: | | | | | |
| Proved | $ | 836,159 | | | $ | 793,081 | | | $ | 1,098,696 | |
| Unproved | 35,474 | | | 71,387 | | | 41,355 | |
| Field and other property and equipment | — | | | 8,200 | | | — | |
| Exploration costs | 9,328 | | | 3,425 | | | 1,180 | |
| Development | 578,316 | | | 624,880 | | | 194,828 | |
| Total costs incurred | $ | 1,459,277 | | | $ | 1,500,973 | | | $ | 1,336,059 | |
| | | | | |
| Equity affiliate | | | | | |
| | | | | |
| | | | | |
| | | | | |
| | | | | |
| | | | | |
| Total costs incurred | $ | — | | | $ | — | | | $ | — | |
Standardized Measure of Discounted Future Net Cash Flows Relating to Proved Oil and Gas Reserves
The following information has been developed utilizing procedures prescribed by ASC Topic 932, Extractive Industries – Oil and Gas, and based on crude oil, NGL and natural gas reserves and production volumes estimated by our engineering staff. The estimates were based on a 12-month average for first-day-of-the month commodity prices. The following information may be useful for certain comparative purposes, but should not be solely relied upon in evaluating our performance. Further, information contained in the following table should not be considered as representative of realistic assessments of future cash flows, nor should the standardized measure of discounted future net cash flows be viewed as representative of our current value.
The future cash flows presented below are based on sales prices and cost rates in existence as of the date of the projections. It is expected that material revisions to some estimates of crude oil, NGL and natural gas reserves may occur in the future, development and production of the reserves may occur in periods other than those assumed, and actual prices realized and costs incurred may vary significantly from those used.
Management does not rely upon the following information in making investment and operating decisions. Such decisions are based upon a wide range of factors, including estimates of probable and possible reserves as well as proved reserves, and varying price and cost assumptions considered more representative of a range of possible economic conditions that may be anticipated.
Future net cash flows were calculated at December 31, 2023, 2022 2021 and 20202021 by applying prices, which were the simple average of the first-of-the-month commodity prices, adjusted for location and quality differentials, with consideration of known contractual price changes. The following table provides the average benchmark prices per unit, before location and quality differential adjustments, used to calculate the related reserve category:
| | Year Ended December 31, |
| 2022 | | 2021 | | 2020 |
| Year Ended December 31, | | | Year Ended December 31, |
| 2023 | | | 2023 | | 2022 | | 2021 |
| Average benchmark price per unit: | Average benchmark price per unit: | |
| Crude oil (Bbl) | Crude oil (Bbl) | $ | 93.67 | | | $ | 66.56 | | | $ | 39.56 | |
| Crude oil (Bbl) | |
| Crude oil (Bbl) | |
| Crude oil (Bbl) | |
| Crude oil (Bbl) | |
| Crude oil (Bbl) | |
| Crude oil (Bbl) | |
| Crude oil (Bbl) | |
| Crude oil (Bbl) | |
| Crude oil (Bbl) | |
| Crude oil (Bbl) | |
| Crude oil (Bbl) | |
| Crude oil (Bbl) | |
| Crude oil (Bbl) | |
| Crude oil (Bbl) | |
| Natural gas (MMBtu) | Natural gas (MMBtu) | $ | 6.36 | | | $ | 3.60 | | | $ | 1.99 | |
The following table sets forth the standardized measure of discounted future net cash flows for both our consolidated operations and our investment in Exaro from projected production of oil and natural gas reserves and excludes the midstream revenue impact on a portion of our operations that could reduce future production costs, for the years ended December 31, 2023, 2022 2021 and 2020:2021:
| | | | | | | | | | | | | | | | | |
| Year Ended December 31, |
| 2022 | | 2021 | | 2020 |
| (in thousands) |
| Consolidated operations | | | | | |
| Future cash inflows | $ | 33,628,495 | | | $ | 21,063,117 | | | $ | 8,232,932 | |
| Future production costs | (14,077,136) | | | (10,194,648) | | | (4,280,563) | |
Future development costs (1) | (2,380,931) | | | (1,477,562) | | | (1,353,957) | |
Future income taxes (3) | (773,479) | | | (352,136) | | | (30,155) | |
| Future net cash flows | 16,396,949 | | | 9,038,771 | | | 2,568,257 | |
| Annual discount of 10% for estimated timing | (7,262,283) | | | (4,080,471) | | | (1,240,397) | |
| Standardized measure of discounted future net cash flows | $ | 9,134,666 | | | $ | 4,958,300 | | | $ | 1,327,860 | |
| | | | | |
Equity affiliate (2) | | | | | |
| Future cash inflows | $ | — | | | $ | 99,290 | | | $ | — | |
| Future production costs | — | | | (55,371) | | | — | |
| Future development costs | — | | | (2,309) | | | — | |
| Future income taxes | — | | | (1,730) | | | — | |
| Future net cash flows | — | | | 39,880 | | | — | |
| Annual discount of 10% for estimated timing | — | | | (16,702) | | | — | |
| Standardized measure of discounted future net cash flows | $ | — | | | $ | 23,178 | | | $ | — | |
| | | | | | | | | | | | | | | | | |
| Year Ended December 31, |
| 2023 | | 2022 | | 2021 |
| (in thousands) |
| Consolidated operations | | | | | |
| Future cash inflows | $ | 24,267,134 | | | $ | 33,628,495 | | | $ | 21,063,117 | |
| Future production costs | (11,897,791) | | | (14,077,136) | | | (10,194,648) | |
Future development costs (1) | (2,713,247) | | | (2,380,931) | | | (1,477,562) | |
Future income taxes (3) | (410,721) | | | (773,479) | | | (352,136) | |
| Future net cash flows | 9,245,375 | | | 16,396,949 | | | 9,038,771 | |
| Annual discount of 10% for estimated timing | (3,956,193) | | | (7,262,283) | | | (4,080,471) | |
| Standardized measure of discounted future net cash flows | $ | 5,289,182 | | | $ | 9,134,666 | | | $ | 4,958,300 | |
| | | | | |
Equity affiliate (2) | | | | | |
| Future cash inflows | $ | — | | | $ | — | | | $ | 99,290 | |
| Future production costs | — | | | — | | | (55,371) | |
| Future development costs | — | | | — | | | (2,309) | |
| Future income taxes | — | | | — | | | (1,730) | |
| Future net cash flows | — | | | — | | | 39,880 | |
| Annual discount of 10% for estimated timing | — | | | — | | | (16,702) | |
| Standardized measure of discounted future net cash flows | $ | — | | | $ | — | | | $ | 23,178 | |
(1) Future development costs include future abandonment and salvage costs.
(2) The average benchmark prices used for the equity affiliate were $66.55 per barrel for crude oil and $3.64 per MMBtu for natural gas during the year ended December 31, 2021. During the year ended December 31, 2022, our equity method investment, Exaro, sold its operations.
(3) Our future income taxes are based upon on our allocable share of any taxable income of OpCo. Estimated future taxable income or loss generated by OpCo is generally allocated and passed through to Crescent at our proportionate share of OpCo unit ownership which at December 31, 2023, 2022 and 2021 was 28.92%51.0%, 28.9% and 24.75%24.8%, respectively.
Changes in standardized measure of discounted future net cash flows
The following table sets forth the changes in the standardized measure of discounted future net cash flows for both our consolidated operations and our investment in Exaro for the years ended December 31, 2023, 2022 2021 and 2020:2021:
| | | | | | | | | | | | | | | | | |
| Year Ended December 31, |
| 2022 | | 2021 | | 2020 |
| (in thousands) |
| Consolidated operations | | | | | |
| Balance at beginning of period | $ | 4,958,300 | | | $ | 1,327,860 | | | $ | 3,110,848 | |
| Net change in prices and production costs | 4,156,736 | | | 3,330,299 | | | (1,184,939) | |
| Net change in future development costs | (132,213) | | | 117,333 | | | 160,465 | |
| Sales and transfers of oil and natural gas produced, net of production expenses | (2,083,147) | | | (872,521) | | | (290,053) | |
| Extensions, discoveries, additions and improved recovery, net of related costs | 1,105,549 | | | 162,657 | | | 31,688 | |
| Purchases of reserves in place | 1,333,452 | | | 1,236,388 | | | 176,480 | |
| Sales of reserves in place | (118,253) | | | (84,095) | | | — | |
| Revisions of previous quantity estimates | (952,958) | | | (295,234) | | | (887,395) | |
| Previously estimated development costs incurred | 488,934 | | | 95,879 | | | 32,873 | |
| Net change in taxes | (251,714) | | | (184,419) | | | 19,350 | |
| Accretion of discount | 575,440 | | | 124,153 | | | 283,954 | |
| Changes in timing and other | 54,540 | | | — | | | (125,411) | |
| Balance at end of period | $ | 9,134,666 | | | $ | 4,958,300 | | | $ | 1,327,860 | |
| | | | | |
| Equity affiliate | | | | | |
| Balance at beginning of period | $ | 23,178 | | | $ | — | | | $ | — | |
| Net change in prices and production costs | — | | | — | | | — | |
| Net change in future development costs | — | | | — | | | — | |
| Sales and transfers of oil and natural gas produced, net of production expenses | (2,063) | | | (1,246) | | | — | |
| Extensions, discoveries, additions and improved recovery, net of related costs | — | | | — | | | — | |
| Purchases of reserves in place | — | | | 26,154 | | | — | |
| Sales of reserves in place | (22,845) | | | — | | | — | |
| Revisions of previous quantity estimates | — | | | — | | | — | |
| Previously estimated development costs incurred | — | | | — | | | — | |
| Net change in taxes | 1,730 | | | (1,730) | | | — | |
| Accretion of discount | — | | | — | | | — | |
| Changes in timing and other | — | | | — | | | — | |
| Balance at end of period | $ | — | | | $ | 23,178 | | | $ | — | |
| | | | | | | | | | | | | | | | | |
| Year Ended December 31, |
| 2023 | | 2022 | | 2021 |
| (in thousands) |
| Consolidated operations | | | | | |
| Balance at beginning of period | $ | 9,134,666 | | | $ | 4,958,300 | | | $ | 1,327,860 | |
| Net change in prices and production costs | (2,859,297) | | | 4,156,736 | | | 3,330,299 | |
| Net change in future development costs | (141,382) | | | (132,213) | | | 117,333 | |
| Sales and transfers of oil and natural gas produced, net of production expenses | (1,354,856) | | | (2,083,147) | | | (872,521) | |
| Extensions, discoveries, additions and improved recovery, net of related costs | 119,025 | | | 1,105,549 | | | 162,657 | |
| Purchases of reserves in place | 1,338,224 | | | 1,333,452 | | | 1,236,388 | |
| Sales of reserves in place | (90,157) | | | (118,253) | | | (84,095) | |
| Revisions of previous quantity estimates | (2,244,012) | | | (952,958) | | | (295,234) | |
| Previously estimated development costs incurred | 301,839 | | | 488,934 | | | 95,879 | |
| Net change in taxes | 190,444 | | | (251,714) | | | (184,419) | |
| Accretion of discount | 960,208 | | | 575,440 | | | 124,153 | |
| Changes in timing and other | (65,520) | | | 54,540 | | | — | |
| Balance at end of period | $ | 5,289,182 | | | $ | 9,134,666 | | | $ | 4,958,300 | |
| | | | | |
| Equity affiliate | | | | | |
| Balance at beginning of period | $ | — | | | $ | 23,178 | | | $ | — | |
| Net change in prices and production costs | — | | | — | | | — | |
| Net change in future development costs | — | | | — | | | — | |
| Sales and transfers of oil and natural gas produced, net of production expenses | — | | | (2,063) | | | (1,246) | |
| Extensions, discoveries, additions and improved recovery, net of related costs | — | | | — | | | — | |
| Purchases of reserves in place | — | | | — | | | 26,154 | |
| Sales of reserves in place | — | | | (22,845) | | | — | |
| Revisions of previous quantity estimates | — | | | — | | | — | |
| Previously estimated development costs incurred | — | | | — | | | — | |
| Net change in taxes | — | | | 1,730 | | | (1,730) | |
| Accretion of discount | — | | | — | | | — | |
| Changes in timing and other | — | | | — | | | — | |
| Balance at end of period | $ | — | | | $ | — | | | $ | 23,178 | |
SCHEDULE I
CONDENSED FINANCIAL INFORMATION OF REGISTRANT
CRESCENT ENERGY COMPANY
PARENT COMPANY BALANCE SHEETS
| | December 31, 2022 | | December 31, 2021 |
| (in thousands, except share and unit data) |
| December 31, 2023 | | | December 31, 2023 | | December 31, 2022 |
| (in thousands, except share and unit data) | | | (in thousands, except share and unit data) |
| ASSETS | ASSETS | |
| Current assets: | Current assets: | |
| Current assets: | |
| Current assets: | |
| Cash and cash equivalents | |
| Cash and cash equivalents | |
| Cash and cash equivalents | |
| Income tax receivable | Income tax receivable | $ | 5,304 | | | $ | — | |
| Accounts receivable - affiliates | Accounts receivable - affiliates | 3,852 | | | 914 | |
| Total current assets | Total current assets | 9,156 | | | 914 | |
| Investment in subsidiary | Investment in subsidiary | 3,439,524 | | | 3,102,262 | |
| TOTAL ASSETS | TOTAL ASSETS | $ | 3,448,680 | | | $ | 3,103,176 | |
| | LIABILITIES, REDEEMABLE NONCONTROLLING INTERESTS AND EQUITY | LIABILITIES, REDEEMABLE NONCONTROLLING INTERESTS AND EQUITY | |
| LIABILITIES, REDEEMABLE NONCONTROLLING INTERESTS AND EQUITY | |
| LIABILITIES, REDEEMABLE NONCONTROLLING INTERESTS AND EQUITY | |
| Current liabilities: | Current liabilities: | |
| Current liabilities: | |
| Current liabilities: | |
| Accounts payable – affiliates | |
| Accounts payable – affiliates | |
| Accounts payable – affiliates | Accounts payable – affiliates | $ | 3,854 | | | $ | 914 | |
| Accrued liabilities | Accrued liabilities | 1,051 | | | 68 | |
| Total current liabilities | Total current liabilities | 4,905 | | | 982 | |
| Deferred tax liability | Deferred tax liability | 144,781 | | | 82,537 | |
| Total liabilities | Total liabilities | 149,686 | | | 83,519 | |
| Contingencies (Note 3) | Contingencies (Note 3) | | | | Contingencies (Note 3) | | | |
| Redeemable noncontrolling interests | Redeemable noncontrolling interests | 2,436,703 | | | 2,325,013 | |
| Equity: | Equity: | |
| | Class A common stock, $0.0001 par value; 1,000,000,000 shares authorized and 49,433,154 and 43,105,376 shares issued and 48,282,163 and 41,954,385 shares outstanding as of December 31, 2022 and 2021, respectively | 5 | | | 4 | |
| Class B common stock, $0.0001 par value; 500,000,000 shares authorized and 118,645,323 and 127,536,463 shares issued and outstanding as of December 31, 2022 and 2021, respectively | 12 | | | 13 | |
| Preferred stock, $0.0001 par value; 500,000,000 shares authorized and 1,000 Series I preferred shares issued and outstanding as of December 31, 2022 and 2021 | — | | | — | |
| Treasury stock, at cost; 1,150,991 shares of Class A common stock as of December 31, 2022 and 2021 | (18,448) | | | (18,448) | |
| Class A common stock, $0.0001 par value; 1,000,000,000 shares authorized and 92,680,353 and 49,433,154 shares issued and 91,608,800 and 48,282,163 shares outstanding as of December 31, 2023 and 2022, respectively | |
| | Class A common stock, $0.0001 par value; 1,000,000,000 shares authorized and 92,680,353 and 49,433,154 shares issued and 91,608,800 and 48,282,163 shares outstanding as of December 31, 2023 and 2022, respectively | |
| | Class A common stock, $0.0001 par value; 1,000,000,000 shares authorized and 92,680,353 and 49,433,154 shares issued and 91,608,800 and 48,282,163 shares outstanding as of December 31, 2023 and 2022, respectively | |
| Class B common stock, $0.0001 par value; 500,000,000 shares authorized and 88,048,124 and 118,645,323 shares issued and outstanding as of December 31, 2023 and 2022, respectively | |
| Preferred stock, $0.0001 par value; 500,000,000 shares authorized and 1,000 Series I preferred shares issued and outstanding as of December 31, 2023 and 2022 | |
| Treasury stock, at cost; 1,071,553 and 1,150,991 shares of Class A common stock as of December 31, 2023 and 2022, respectively | |
| Additional paid-in capital | Additional paid-in capital | 804,587 | | | 720,016 | |
| Retained earnings (accumulated deficit) | 61,957 | | | (19,376) | |
| Retained earnings | |
| Noncontrolling interests | Noncontrolling interests | 14,178 | | | 12,435 | |
| Total equity | Total equity | 862,291 | | | 694,644 | |
| TOTAL LIABILITIES, REDEEMABLE NONCONTROLLING INTERESTS AND EQUITY | TOTAL LIABILITIES, REDEEMABLE NONCONTROLLING INTERESTS AND EQUITY | $ | 3,448,680 | | | $ | 3,103,176 | |
The accompanying notes to financial statements are an integral part of these condensed financial statements.
SCHEDULE I - CONTINUED
CONDENSED FINANCIAL INFORMATION OF REGISTRANT
CRESCENT ENERGY COMPANY
PARENT COMPANY STATEMENTS OF OPERATIONS
| | Year Ended December 31, |
| 2022 | | 2021 | | 2020 |
| (in thousands, except per share amounts) |
| Year Ended December 31, | | | Year Ended December 31, |
| 2023 | | | 2023 | | 2022 | | 2021 |
| (in thousands, except per share amounts) | | | (in thousands, except per share amounts) |
| Revenues | Revenues | $ | — | | | $ | — | | | $ | — | |
| Expenses: | Expenses: | |
| General and administrative expense | |
| General and administrative expense | |
| General and administrative expense | General and administrative expense | 14,313 | | | 914 | | | — | |
| Total expenses | Total expenses | 14,313 | | | 914 | | | — | |
| Income (loss) before taxes and equity in income (losses) of subsidiary | Income (loss) before taxes and equity in income (losses) of subsidiary | (14,313) | | | (914) | | | — | |
| Income tax benefit (expense) | Income tax benefit (expense) | (31,979) | | | 867 | | | — | |
| Income (loss) before equity in income (losses) of subsidiary | Income (loss) before equity in income (losses) of subsidiary | (46,292) | | | (47) | | | — | |
| Equity in income (losses) of subsidiary, net of tax | Equity in income (losses) of subsidiary, net of tax | 526,892 | | | (432,180) | | | (216,124) | |
| Net income (loss) | Net income (loss) | 480,600 | | | (432,227) | | | (216,124) | |
| Less: net (income) loss attributable to Predecessor | Less: net (income) loss attributable to Predecessor | — | | | 339,168 | | | 118,649 | |
| Less: net (income) loss attributable to noncontrolling interests | Less: net (income) loss attributable to noncontrolling interests | (2,669) | | | 14,922 | | | 97,475 | |
| Less: net (income)loss attributable to redeemable noncontrolling interests | (381,257) | | | 58,761 | | | — | |
| Less: net (income) loss attributable to redeemable noncontrolling interests | |
| Net income (loss) attributable to Crescent Energy | Net income (loss) attributable to Crescent Energy | $ | 96,674 | | | $ | (19,376) | | | $ | — | |
| Net income (loss) per Share: | | | | | |
| Net income (loss) per share: | |
| Class A common stock - basic | |
| Class A common stock - basic | |
| Class A common stock - basic | Class A common stock - basic | $ | 2.20 | | | $ | (0.46) | | |
| Class A common stock - diluted | Class A common stock - diluted | $ | 2.20 | | | $ | (0.46) | | |
| Class B common stock - basic and diluted | Class B common stock - basic and diluted | $ | — | | | $ | — | | |
| Weighted Average Shares Outstanding: | |
| Weighted average shares outstanding: | |
| Class A common stock - basic | |
| Class A common stock - basic | |
| Class A common stock - basic | Class A common stock - basic | 43,865 | | | 41,954 | | |
| Class A common stock - diluted | Class A common stock - diluted | 44,112 | | | 41,954 | | |
| Class B common stock - basic and diluted | Class B common stock - basic and diluted | 124,857 | | | 127,536 | | |
The accompanying notes to financial statements are an integral part of these condensed financial statements.
SCHEDULE I - CONTINUED
CONDENSED FINANCIAL INFORMATION OF REGISTRANT
CRESCENT ENERGY COMPANY
PARENT COMPANY STATEMENTS OF CASH FLOWS
| | Year Ended December 31, |
| 2022 | | 2021 | | 2020 |
| (in thousands) |
| Year Ended December 31, | | | Year Ended December 31, |
| 2023 | | | 2023 | | 2022 | | 2021 |
| (in thousands) | | | (in thousands) |
| Cash flows from operating activities: | Cash flows from operating activities: | |
| Net income (loss) | |
| Net income (loss) | |
| Net income (loss) | Net income (loss) | $ | 480,600 | | | $ | (432,227) | | | $ | (216,124) | |
| Adjustments to reconcile net income (loss) to net cash used in operating activities: | Adjustments to reconcile net income (loss) to net cash used in operating activities: | |
| Equity in (income) losses of subsidiary | Equity in (income) losses of subsidiary | (526,892) | | | 432,180 | | | 216,124 | |
| Equity in (income) losses of subsidiary | |
| Equity in (income) losses of subsidiary | |
| Deferred income taxes (benefit) | Deferred income taxes (benefit) | 30,611 | | | (935) | | | — | |
| Changes in operating assets and liabilities: | Changes in operating assets and liabilities: | |
| Accounts receivable | (5,304) | | | — | | | — | |
| Income tax receivable | |
| Income tax receivable | |
| Income tax receivable | |
| Accounts receivable - affiliates | |
| Accounts payable – affiliates | Accounts payable – affiliates | 2,940 | | | 914 | | | — | |
| Accrued liabilities | Accrued liabilities | 983 | | | 68 | | | — | |
| Net cash used in operating activities | Net cash used in operating activities | (17,062) | | | — | | | — | |
| Net cash provided by investing activities | Net cash provided by investing activities | — | | | — | | | — | |
| Cash flows from financing activities: | |
| Distributions from OpCo | |
| Distributions from OpCo | |
| Distributions from OpCo | Distributions from OpCo | 44,571 | | | — | | | — | |
| Dividend to Class A common stock | Dividend to Class A common stock | (27,509) | | | — | | | — | |
| Contribution to OpCo | |
| Net cash provided by financing activities | Net cash provided by financing activities | 17,062 | | | — | | | — | |
| Net change in cash, cash equivalents and restricted cash | Net change in cash, cash equivalents and restricted cash | — | | | — | | | — | |
| Cash, cash equivalents and restricted cash, beginning of period | Cash, cash equivalents and restricted cash, beginning of period | — | | | — | | | — | |
| Cash, cash equivalents, and restricted cash, end of period | Cash, cash equivalents, and restricted cash, end of period | $ | — | | | $ | — | | | $ | — | |
The accompanying notes to financial statements are an integral part of these condensed financial statements.
SCHEDULE I - CONTINUED
CRESCENT ENERGY COMPANY
NOTES TO PARENT COMPANY FINANCIAL STATEMENTS
NOTE 1 – Corporate Structure and Basis of Presentation
Corporate Structure
Our Class A Common Stock is listed on The New York Stock Exchange under the symbol “CRGY.” We are structured as an “Up-C,” with substantially all of our assets and operations held by Crescent Energy OpCo LLC ("OpCo"). Crescent is a holding company, the sole material assetassets of which consists ofare units of OpCo ("OpCo Units"). The assets and liabilities of OpCo represent substantially all of our consolidated assets and liabilities with the exception of certain current and deferred taxes and certain liabilities under the Management Agreement, as defined within “Notes to Combined and Consolidated Financial Statements—NOTE 14 -– Related Party Transactions Transactions"to the combined and consolidated financial statements of Crescent included elsewhere in "Part II., Item 8. Financial Statements and Supplementary Data" of this Annual Report. Certain restrictions and covenants related to the transfer of assets from OpCo are discussed further in "Notes to Combined and Consolidated Financial Statements—NOTE 8 -– Debtto the combined and consolidated financial statements of Crescent" included elsewhere in "Part II., Item 8. Financial Statements and Supplementary Data" of this Annual Report. Shares of Crescent Class A common stock, par value $0.0001 per share ("Class A Common Stock") have both voting and economic rights with respect to Crescent. Holders of Crescent Class B common stock, par value $0.0001 per share ("Class B Common Stock"), which shares of Class B Common Stock have voting (but no economic) rights with respect to Crescent, hold a corresponding amount of economic, non-voting OpCo Units. OpCo Units may be redeemed or exchanged for Class A Common Stock or, at our election, cash on the terms and conditions set forth in the Amended and Restated Limited Liability Company Agreement of OpCo (“OpCo LLC Agreement”). Additionally, an affiliate of the KKR Group (as defined in –Basis of Presentation) is the sole holder of Crescent's non-economic Series I preferred stock, $0.0001 par value per share, which entitles the holder thereof to appoint the Board of Directors of Crescent and to certain other approval rights.
Basis of Presentation
In connection with the series of transactions completed on December 7, 2021 (the "Merger Transactions"), Independence Energy LLC ("Independence") merged with and into OpCo in a common control transaction that is referred to herein as the "Crescent Reorganization." As required by GAAP, the contribution of Independence was accounted for as a reorganization of entities under common control, in a manner similar to a pooling of interests, with all assets and liabilities transferred to us at their carrying amounts. Because the Crescent Reorganization resulted in a change in the reporting entity, and in order to furnish comparative financial information prior to the Merger Transactions, our financial statements have been retrospectively recast to reflect the historical accounts of Independence, our accounting predecessor (the "Predecessor").
As the sole managing member of OpCo, we are responsible for all operational, management and administrative decisions related to OpCo’s business. Because the unit holders of OpCo lack the characteristics of a controlling financial interest, OpCo was determined to be a variable interest entity. Crescent is considered the primary beneficiary of OpCo as it has both the power to direct OpCo and the right to receive benefits from OpCo. As a result, we consolidate the financial results of OpCo and its subsidiaries, including Crescent Energy Finance LLC. At December 31, 2021, OpCo was owned 25% by Crescent and 75% by holders of our redeemable noncontrolling interests representing former owners of Independence. During the year ended December 31, 2023 and 2022, our ownership of OpCo increased due to the 2022 Equity Transactions as described in "Notes to Combined and Consolidated Financial Statements—NOTE 1 – Organization and Basis of Presentation to the combined and consolidated financial statements of Crescent" included elsewhere in "Part II., Item 8. Financial Statements and Supplementary Data" of this Annual Report. At December 31, 2023 and 2022, our ownership of OpCo was 29%51% and 29%, respectively, and 49% and 71%, respectively, of OpCo was owned by holders of our redeemable noncontrolling interests.
These condensed parent company financial statements reflect the activity of Crescent as the parent company to OpCo and have been prepared in accordance with Rules 5-04 and 12-04 of Regulation S-X, as the restricted net assets of OpCo and its consolidated subsidiaries exceed 25% of the consolidated net assets of Crescent. This information should be read in conjunction with the combined and consolidated financial statements of Crescent included elsewhere in "Part II., Item 8. Financial Statements and Supplementary Data" of this Annual Report.
NOTE 2 – Income Taxes
For details regarding income taxes, see "Notes to Combined and Consolidated Financial Statements—NOTE 11 – Income Taxes to the combined and consolidated financial statements of Crescent" included elsewhere in "Part II., Item 8. Financial Statements and Supplementary Data" of this Annual Report.
NOTE 3 – Contingencies
For details regarding contingencies related to litigation, see "Notes to Combined and Consolidated Financial Statements—NOTE 12 – Commitments and ContingenciesContingencies" to the combined and consolidated financial statements of Crescent included elsewhere in "Part II., Item 8. Financial Statements and Supplementary Data" of this Annual Report.
Item 9. Changes in and Disagreements With Accountants on Accounting and Financial Disclosures
None.
Item 9A. Controls and Procedures
Limitations on Effectiveness of Controls and Procedures
We maintain disclosure controls and procedures ("Disclosure Controls") within the meaning of Rules 13a-15(e) and 15d-15(e) of the Exchange Act. Our Disclosure Controls are designed to ensure that information required to be disclosed by us in the reports we file or submit under the Exchange Act, such as this Annual Report, is recorded, processed, summarized and reported within the time periods specified in the SEC’s rules and forms.
Our Disclosure Controls are also designed to ensure that such information is accumulated and communicated to our management, including our Chief Executive Officer and Chief Financial Officer, as appropriate, to allow timely decisions regarding required disclosure. In designing and evaluating our Disclosure Controls, management recognizes that any controls and procedures, no matter how well designed and operated, can provide only reasonable assurance of achieving the desired control objectives.
Evaluation of Disclosure Controls and Procedures
The Company's Chief Executive Officer and Chief Financial Officer have evaluated the effectiveness of the design and operation of the Company's Disclosure Controls, as of December 31, 2022.2023. Based on such evaluation, such officers have concluded that, as of December 31, 2022,2023, the Company's disclosure controls and procedures are designed and effective to ensure that information required to be included in the Company's reports filed or submitted under the Exchange Act is recorded, processed, summarized and reported within the time periods specified by the SEC's rules and forms and that information required to be disclosed in the Company's reports filed or submitted under the Exchange Act is accumulated and communicated to the Company's management including its principal executive officer and principal financial officer, or persons performing similar functions, as appropriate, to allow timely decisions regarding required disclosure.
In designing and evaluating the Company's disclosure controls and procedures, management recognizes that any controls and procedures, no matter how well designed and operated, can provide only reasonable, and not absolute, assurance that the objectives of the control system will be met. In addition, the design of any control system is based in part upon certain assumptions about the likelihood of future events and the application of judgment in evaluating the cost-benefit relationship of possible controls and procedures. Because of these and other inherent limitations of control systems, there is only reasonable assurance that the Company's controls will succeed in achieving their goals under all potential future conditions.
Changes in Internal Control over Financial Reporting
There were no changes in the Company's internal control over financial reporting (as defined by Rules 13a-15(f) and 15d-15(f) under the Exchange Act) that occurred during the quarter ended December 31, 2022,2023, that have materially affected, or are reasonably likely to materially affect, the Company's internal control over financial reporting.
Management's Assessment of Internal Control over Financial Reporting
Management of the Company is responsible for establishing and maintaining effective internal control over financial reporting as such term is defined in Rule 13a-15(f) under the Securities Exchange Act of 1934. As of December 31, 2022,2023, management assessed the effectiveness of our internal control over financial reporting. In making this assessment, management, including our Chief Executive Officer and Chief Financial Officer, used the criteria set forth by the Internal Control – Integrated Framework (2013) issued by the Committee of Sponsoring Organizations of the Treadway Commission ("COSO"). Based on this assessment, our Chief Executive Officer and Chief Financial Officer have concluded that our internal control over financial reporting was effective as of December 31, 2022.2023.
Deloitte & Touche LLP, the independent registered public accounting firm that audited our consolidated financial statements included in this annual report on Form 10-K,Annual Report, has also audited the effectiveness of our internal control over financial reporting as of December 31, 20222023 and has issued an unqualified opinionattestation report on the effectiveness of our internal control over financial reporting as of December 31, 2022.2023. Please see their "Report of Independent Registered Public Accounting Firm" included below.
REPORT OF INDEPENDENT REGISTERED PUBLIC ACCOUNTING FIRM
To the shareholders and the Board of Directors of Crescent Energy Company
Opinion on Internal Control over Financial Reporting
We have audited the internal control over financial reporting of Crescent Energy Company and subsidiaries (the “Company”) as of December 31, 2022,2023, based on criteria established in Internal Control — Integrated Framework (2013) issued by the Committee of Sponsoring Organizations of the Treadway Commission (COSO). In our opinion, the Company maintained, in all material respects, effective internal control over financial reporting as of December 31, 2022,2023, based on criteria established in Internal Control — Integrated Framework (2013) issued by COSO.
We have also audited, in accordance with the standards of the Public Company Accounting Oversight Board (United States) (PCAOB), the consolidated financial statements as of and for the year ended December 31, 20222023 of the Company and our report dated March 7, 2023,4, 2024 expressed an unqualified opinion on those financial statements.
Basis for Opinion
The Company’s management is responsible for maintaining effective internal control over financial reporting and for its assessment of the effectiveness of internal control over financial reporting, included in the accompanying Management’s ReportAssessment on Internal Controls,Control over Financial Reporting, appearing under Part II, Item 9A. Our responsibility is to express an opinion on the Company’s internal control over financial reporting based on our audit. We are a public accounting firm registered with the PCAOB and are required to be independent with respect to the Company in accordance with the U.S. federal securities laws and the applicable rules and regulations of the Securities and Exchange Commission and the PCAOB.
We conducted our audit in accordance with the standards of the PCAOB. Those standards require that we plan and perform the audit to obtain reasonable assurance about whether effective internal control over financial reporting was maintained in all material respects. Our audit included obtaining an understanding of internal control over financial reporting, assessing the risk that a material weakness exists, testing and evaluating the design and operating effectiveness of internal control based on the assessed risk, and performing such other procedures as we considered necessary in the circumstances. We believe that our audit provides a reasonable basis for our opinion.
Definition and Limitations of Internal Control over Financial Reporting
A company’s internal control over financial reporting is a process designed to provide reasonable assurance regarding the reliability of financial reporting and the preparation of financial statements for external purposes in accordance with generally accepted accounting principles. A company’s internal control over financial reporting includes those policies and procedures that (1) pertain to the maintenance of records that, in reasonable detail, accurately and fairly reflect the transactions and dispositions of the assets of the company; (2) provide reasonable assurance that transactions are recorded as necessary to permit preparation of financial statements in accordance with generally accepted accounting principles, and that receipts and expenditures of the company are being made only in accordance with authorizations of management and directors of the company; and (3) provide reasonable assurance regarding prevention or timely detection of unauthorized acquisition, use, or disposition of the company’s assets that could have a material effect on the financial statements.
Because of its inherent limitations, internal control over financial reporting may not prevent or detect misstatements. Also, projections of any evaluation of effectiveness to future periods are subject to the risk that controls may become inadequate because of changes in conditions, or that the degree of compliance with the policies or procedures may deteriorate.
/s/ Deloitte & Touche LLP
Houston, Texas
March 7, 20234, 2024
Item 9B. Other Information
Not applicableTrading Arrangements
During the three months ended December 31, 2023, none of our directors or officers (as defined in Rule 16a-1(f) of the Exchange Act) adopted, terminated or modified a “Rule 10b5-1 trading arrangement” or non-Rule 10b5-1 trading arrangement (as each term is defined in Item 408 of Regulation S-K).
Item 9C. Disclosure Regarding Foreign Jurisdiction that Prevent Inspections.
Not applicable
Part III
Part III
Item 10. Directors, Executive Officers and Corporate Governance
Board of Directors and Executive Officers
The following table sets forth information regarding the members (each, a “Director”) of our Board of Directors and officers (each, an “Executive Officer”).
| | | | | | | | |
| Name | Age | Position |
| David C. Rockecharlie | 5051 | Chief Executive Officer and Director |
| Brandi Kendall | 3839 | Chief Financial Officer and Director |
| Todd N. Falk | 4243 | Chief Accounting Officer |
| Benjamin M. Conner | 37 | Executive Vice President
| John Clayton “Clay” Rynd | 3334 | Executive Vice President |
| Bo Shi | 3435 | General Counsel and Corporate Secretary |
| John C. Goff | 6768 | Chairman and Director |
| Claire S. Farley | 6465 | Director |
| Robert G. Gwin | 5960 | Director |
| Ellis L. “Lon” McCain | 7576 | Director |
| Karen J. Simon | 6364 | Director |
| Erich Bobinsky | 3435 | Director |
| Bevin Brown | 4647 | Director |
The following are biographical summaries of the business experience of each Director and Executive Officer.
David C. Rockecharlie has served as Crescent Energy Company’s Chief Executive Officer and a director on our Board since December 2021. Mr. Rockecharlie previously served as the Chief Executive Officer of Independence's managing member since March 2021, prior to which he served as Manager and President of Independence's managing member beginning in June 2020. Mr. Rockecharlie also served on Independence's Board since June 2020. Mr. Rockecharlie joined KKR in 2011 and is currently a Partner and Head of KKR’s Energy Real Assets business and Chairman of KKR’s Energy Investment Committee. Prior to joining KKR, Mr. Rockecharlie was co-founder and co-CEO of RPM Energy, LLC, a privately-owned oil and gas company. Previously, Mr. Rockecharlie served as co-head of Jefferies & Company’s Energy Investment Banking Group and before that was an executive with El Paso Corp., where he led a variety of corporate activities. Mr. Rockecharlie began his career as an energy investment banker with S.G. Warburg and Donaldson, Lufkin & Jenrette. Mr. Rockecharlie received an A.B., magna cum laude, from Princeton University. We believe Mr. Rockecharlie’s extensive industry experience and longstanding relationship with KKR make him well-suited to serve as a Director.
Brandi Kendall has served as Crescent Energy Company’s Chief Financial Officer and a director since December 2021. Ms. Kendall previously served as Chief Financial Officer of Independence's managing member since March 2021, prior to which she served as Vice President of Independence's managing member beginning in June 2020. Ms. Kendall has also served as a director on Independence's Board since August 2020. Ms. Kendall joined KKR in 2013 and is responsible for a broad range of portfolio management activities for its Energy Real Assets team, including finance, planning, risk management and corporate development. Prior to joining KKR, Ms. Kendall served as director, finance and planning at Marlin Midstream and finance associate at NFR Energy. Ms. Kendall began her career in the energy investment banking industry, having held positions at JP Morgan and Tudor, Pickering, Holt & Co. Ms. Kendall earned a B.A. in Economics, Managerial Studies and Kinesiology from Rice University. We believe Ms. Kendall’s financial expertise and energy industry experience make her well-suited to serve as a Director.
Todd N. Falk has served as Crescent Energy Company’s Chief Accounting Officer since December 2021. Mr. Falk previously served as Chief Accounting Officer of Independence's managing member since March 2021, prior to which he served as Vice President, Finance of Independence's managing member beginning in June 2020. Mr. Falk joined KKR in 2018 and is currently a Managing Director and Chief Accounting Officermember of KKR’s Energy Real Assets business. Prior to joining KKR, Mr. Falk served as Director of Finance and Controller of Vitruvian Exploration from October 2013 to September 2018. Mr. Falk began his career at Deloitte, where as a senior manager he assisted clients with complex financial reporting issues, specializing in initial public offerings and
other interactions with the SEC. Mr. Falk has over 20 years of finance and accounting experience in the energy
industry, is a Certified Public Accountant and holds a B.S., magna cum laude, in Accounting and an M.S. in Finance from Texas A&M University.
Benjamin M. ConnerJohn Clayton “Clay” Rynd has served as Crescent Energy Company’s Executive Vice President since December 2021. Mr. Conner previously served as Executive Vice President of Independence's managing member since March 2021. Mr. Conner joined KKR in 2014 and is a member of the Energy Real Assets team. During his time at KKR, he has been involved in numerous upstream oil and gas investments in North America within the Energy Income and Growth Fund. Prior to joining KKR, Mr. Conner was with Lime Rock Partners and was directly involved in numerous investments, with a particular focus in North American upstream oil & gas and oilfield equipment, manufacturing and services. Prior to joining Lime Rock, he was with the natural resources investment banking group of J.P. Morgan, where he worked on numerous corporate advisory and financing transactions. He is a graduate of the McCombs School of Business at the University of Texas (M.P.A., B.B.A.).
John Clayton “Clay” Rynd has served as Crescent Energy Company’s Executive Vice President since December 2021. Mr. Rynd previously served as Executive Vice President of Independence's managing member since March 2021. Mr. Rynd joined KKR in 2015 and is a member of the Energy Real Assets team. During his time at KKR, heHe has been involved in numerous oil and gas investments across KKR’s Energy Real Assets strategy, including the creation of Crescent Energy. In addition, Mr. Rynd has been involved in North America within the Energy Income and Growth Funds strategy as well as KKR’sKKR's investments in FlowStream Commodities and Resource Environmental Solutions. Prior to joining KKR, Mr. Rynd was with Tudor, Pickering, Holt & Co. in the investment banking division, where he focused primarily on strategic advisory and M&A transactions for companies across the energy sector. Prior to that, he worked within the equity research division at Tudor, Pickering, Holt & Co. Mr. Rynd holds a B.A. in both Economics and History from Texas A&M University.
Bo Shi has served as Crescent Energy Company’s General Counsel and Corporate Secretary since December 2021. Mr. Shi previously served as General Counsel for Independence since October 2021. Prior to joining Independence, Mr. Shi worked as a Senior Associate at Vinson & Elkins L.L.P from October 2014 to January 2018, and from December 2018 to October 2021. While at Vinson & Elkins L.L.P., his practice focused on capital markets transactions, corporate governance and mergers and acquisitions, primarily within the oil and gas industry. From January 2018 until December 2018, Mr. Shi served as Senior Counsel at IPSCO Tubulars Inc., a producer and supplier of oil country tubular goods. He received a J.D. from Harvard Law School and a B.A. in Political Science and Policy Studies from Rice University.
John C. Goff, a private investor based in Fort Worth, Texas, has served as Chairman of the Crescent Energy Company Board of Directors since December 2021. He was elected to the board of directors of Contango in August 2018 and as Non-Executive Chairman of the board in October 2019. Mr. Goff founded his family office, Goff Capital, in 2009. Goff Capital invests in a variety of public and private industries and is presently focused on investments in real estate, aerospace, oil & gas, entertainment, and wellness. Mr. Goff co-founded Crescent Real Estate with Richard Rainwater in the early 1990’s, designing the strategy and orchestrating the acquisitions leading to its initial public offering (NYSE) in May 1994. Under his leadership as CEO, Crescent Real Estate grew from approximately $500 million at its IPO to $6.5 billion upon its sale to Morgan Stanley in August 2007. Crescent Real Estate provided its shareholders with a 15.4 percent compounded annual return and more than $2.5 billion in cash dividends during its 13 years as a public company. In November 2009, Mr. Goff reacquired Crescent Real Estate in a partnership with Barclays Capital, and in December 2017 he purchased Barclays Capital’s interest to become the principal owner of Crescent Real Estate and its subsidiaries. Crescent Real Estate currently has assets under management, development and investment capacity of more than $4$10 billion. Mr. Goff graduated from The University of Texas at Austin and is a member of McCombs Business School Hall of Fame. He was named EY Entrepreneur of the Year for the Southwest Region in 2014 and more recently, was inducted to the North Texas Real Estate, the Dallas Business and the Fort Worth Business Halls of Fame. Mr. Goff brings investment and financial acumen, including expertise in analyzing opportunities, risks and strategy in investments in various industries, including energy investments, and providing guidance regarding corporate governance matters, which makes him well-suited to serve as a Director.
Claire S. Farley has served as a Director since December 2021 and previously served as a Director of Independence from August 2020 until the closing of the Merger Transactions. Ms. Farley served as a Senior Advisor to KKR’s Energy Real Assets team from 2011 through 2021, after having joined KKR in 2011 as a Partner. Prior to joining KKR, she was co-founder and co-CEO of RPM Energy LLC. Ms. Farley previously was an advisory director of Jefferies Randall & Dewey, also serving as co-president. She was CEO of Randall & Dewey before it combined with Jefferies & Company. Prior to that, she served in various roles at Texaco, Inc., including CEO of HydroTexaco, president of the North American production division and president of worldwide exploration and new ventures. She has also served as CEO of two start-up ventures: Intelligent Diagnostics Corporation, and Trade-Ranger Inc. Ms. Farley serves on the board of directors of Technip FMC and LyondellBasell Industries, N.V. Ms. Farley holds a B.S. from Emory University. We believe that Ms. Farley’s leadership, investing and energy experience make her well-suited to serve as a Director.
Robert G. Gwin has served as a Director since December 2021. Mr. Gwin was previously President of Anadarko Petroleum Corporation (“Anadarko”), one of the world’s largest independent oil and natural gas exploration and production companies, until August of 2019, when the company was purchased by Occidental Petroleum Corporation. He previously was Executive Vice President, Finance and Chief Financial Officer of Anadarko from 2009 to 2018. Mr. Gwin is also currently a director of TechnipFMC plc, and was previously a director of Pembina Pipeline Corporation, and Enable Midstream Partners, LP, where he previously served as Chairman of its board of directors. He also was Chairman of the board of directors of LyondellBasell Industries, N.V. from 2013 to 2018, where he served as a director beginning in 2011. From 2010 to 2019, Mr. Gwin also served as the Chairman of the board of directors of both Western Gas Partners, LP, and its general partner Western Gas Equity Partners, and as a director of both entities beginning in 2007. Mr. Gwin was also the Chairman of the board of directors of LyondellBasell Industries, N.V. from 2013 to 2018, where he served as a director beginning in 2011. He has served on numerous community and charitable organization boards
throughout his career, currently including the MD Anderson Cancer Center, the Fuqua School of Business aat Duke University, and Communities in Schools – Houston. He holds a Bachelor of Science degree from the University of Southern California and a Master of Business Administration degree from the Fuqua School of Business at Duke University, and is a Chartered Financial Analyst (CFA). We believe Mr. Gwin’s business and industry experience make him well-suited to serve as a Director.
Ellis L. “Lon” McCain has served as a Director since December 2021. Mr. McCain was previously a director of Contango from February 2006 through the consummation of the Merger Transactions, at which time he was serving as Chairman of Contango’s Audit Committee. Mr. McCain also served as Contango’s Lead Director from the 2014 Annual Meeting through the 2016 Annual Meeting. Mr. McCain served as Executive Vice President and Chief Financial Officer of Ellora Energy, Inc. (“Ellora”) from July 2009 through August 2010, when Ellora was merged into a subsidiary of Exxon Mobil Corporation. Prior to Ellora, Mr. McCain was Vice President, Treasurer, and Chief Financial Officer of Westport Resources Corporation (“Westport”), a publicly traded exploration and production company, from 2001 until the sale of Westport to Kerr McGee Corporation and his retirement from Westport in 2004. From 1992 until joining Westport in 2001, Mr. McCain was Senior Vice President and Principal of Petrie Parkman & Co., an investment banking firm specializing in the oil and gas industry. From 1978 until joining Petrie Parkman & Co., Mr. McCain held senior financial management positions with Presidio Oil Company, Petro-Lewis Corporation, and Ceres Capital. He was an Adjunct Professor of Finance at the University of Denver from 1982 through 2005. In addition to the board of Crescent Energy Company, Mr. McCain currently serves on the board of Cheniere Energy Partners, GP, LLC, the general partner of Cheniere Energy Partners, L.P., a publicly traded partnership. Previously, he served on the board of Continental Resources, Inc. from 2006 to November 2022. Mr. McCain received a B.A. in business administration and an M.B.A. with a major in finance from the University of Denver. Mr. McCain brings extensive business, financial and management expertise to the Company from his background as Chief Financial Officer of Ellora and Westport and from his tenure as an investment banker specializing in the oil and gas industry. Mr. McCain also brings considerable experience from his position as a director with several other energy companies. We believe Mr. McCain’s extensive business, financial, management and director expertise qualify him to serve on our Board and as Chairman of our Audit Committee.
Karen J. Simon has served as a Director since December 2021. Ms. Simon was previously a director of Contango from April 2021 through the consummation of the Merger Transactions. Ms. Simon previously served as Vice Chairman, Investment Banking, at JPMorgan before retiring in December 2019. Over her 36 year banking career, she held a number of leadership positions, including Global Co-Head of Financial Sponsor Coverage, providing M&A and capital raising investment banking services to private equity funds; Co-Head of EMEA Debt Capital Markets and Head of EMEA Oil & Gas coverage, both in London, and most recently she founded JPMorgan’s Director Advisory new client group focused on providing advice to public company Directors. Ms. Simon is currently a director of two European public companies; one of which she chairs, Energean plc in London (LON: ENOG) since March 2018 and Aker ASA in Oslo (OSL: AKER) since April 2013. At Energean, Ms. Simon is a member of Remuneration committee and Chairs the Nomination & Governance committee. Additionally, Ms. Simon has served as a Senior Advisor Consultant with Independence Point Advisors, the first female-owned investment bank based in the United States, since 2022. Ms. Simon received dual graduate business degrees in 1983: an M.B.A. from Southern Methodist University in Dallas and a Master of International Management from the American Graduate School of International Management (Thunderbird) in Arizona. Earlier, she graduated from the University of Colorado, earning a Bachelor of Arts cum laude in Economics. We believe Ms. Simon’s business and investment experience make her well-suited to serve as a Director.
Erich Bobinsky has served as a Director since December 2021. Mr. Bobinsky previously served as a director of Independence from August 2020 until the consummation of the Merger Transactions. Mr. Bobinsky is a Director at Liberty Mutual Investments (“LMI”), a position he has held since April 2019. Mr. Bobinsky joined LMI in 2010. Mr. Bobinsky holds a B.S. in Corporate Finance and Accounting from Bentley University. Mr. Bobinsky also holds a Chartered Financial Analyst (CFA) designation and is a member of the Boston Security Analysts Society. We believe that Mr. Bobinsky’s investment experience and relationship with LMI make him well-suited to serve as a Director.
Bevin Brown has served as a Director since December 2021. Ms. Brown previously served as a director of Independence from August 2020 until the consummation of the Merger Transactions. Ms. Brown is the Managing Director of Portfolio Strategy & Management for Global Partnerships and Innovation at LMI, a position she has held since February 2020, prior to which she
served as a Director at LMI beginning in 2013. Prior to joining LMI, Ms. Brown was a Director at a private equity firm and a Manager at PwC. Ms. Brown holds a B.S. from Stonehill College. We believe that Ms. Brown’s investment experience and relationship with LMI make her well-suited to serve as a Director.
Composition of our Board of Directors
Members of our Board of Directors are designated by the Preferred Stockholder, and, as applicable, any successor thereto. Our current Board of Directors consists of nine Directors. Pursuant to the Merger Transactions, two of our current Directors were designated by Contango, including Mr. Goff as Chairman and Mr. McCain, and seven Directors were designated by the
Preferred Stockholder, including Messrs. Rockecharlie, Bobinsky and Gwin and Msses. Kendall, Brown, Simon and Farley, subject to the Specified Rights Agreement and Voting Agreement, as described below.
The Board has determined that each of Mses. Brown, Farley and Simon and Messrs. Bobinsky, Goff, Gwin and McCain is “independent” under the relevant standards of the NYSE. Because the Preferred Stockholder is the sole owner of our Non-Economic Series I Preferred Stock and accordingly has the exclusive right to appoint our Board of Directors, we are a “controlled company” under the Sarbanes-Oxley Act and NYSE rules; therefore, our Compensation Committee and Nominating & Governance Committee are not required to consist entirely of independent directors. See Item 1A. Risk Factors—“Risks related to our governance structure—We are a “controlled company” within the meaning of NYSE rules and, as a result, qualify for and rely on exemptions from certain corporate governance requirements.”
For information regarding procedure by which a presiding director is selected for each executive session and the process by which any interested party may communicate with the non-management directors or independent directors as a group, please see the Company’s Corporate Governance Guidelines at www.crescentenergyco.com.
Specified Rights Agreement & Voting Agreement
The Specified Rights Agreement, dated as of June 7, 2021, by and among PT Independence and Independence Energy Aggregator GP LLC ("Aggregator GP"), a Delaware limited liability company (the “Specified Rights Agreement”) grants PT Independence the right to designate two Directors to our Board of Directors (one of whom must be an Independent Director), so long as Liberty Mutual Insurance Co. beneficially owns a number of shares of Common Stock equal to at least 33.33% of its initial ownership of shares of Class B Common Stock. For so long as PT Independence owns at least one share of Common Stock, PT Independence shall have the right to designate one Director to our Board of Directors. Presently, the PT Independence designees to our Board of Directors are Mr. Bobinsky and Ms. Brown.
Pursuant to the Voting Agreement, dated as of June 7, 2021, by and between John C. Goff, Independence and the other signatories thereto (the “Voting Agreement”), Mr. Goff was granted the right to be appointed to our Board of Directors in connection with the closing of the Merger Transactions. Mr. Goff may only be removed for cause by a majority vote of Independent Directors.
There are no arrangements or understandings between any Director and any other person pursuant to which the Director was selected as a Director, other than the provisions of the Transaction Agreement, the Voting Agreement and the Specified Rights Agreement, relating to the appointment of directors. Except as otherwise disclosed herein and other than Mr. Rockecharlie’s and Ms. Kendall’s indirect interest in the Management Agreement as employees of KKR, none of the directors is a participant in any related party transaction required to be reported pursuant to Item 404(a) of Regulation S-K.
Audit Committee
We have a separately-designated Audit Committee of the Board of Directors (the “Audit Committee”) in accordance with Section 3(a) (58)(A) of the Exchange Act. Our Audit Committee has three members: Messrs. McCain and Bobinsky and Ms. Simon. Mr. McCain currently serves as the chairperson of the Audit Committee. Our Board of Directors has determined that each of Messrs. McCain and Bobinsky and Ms. Simon constitute “Audit Committee Financial Experts” as defined in Section 11 of the Securities Act. Likewise, each of the members serving on our Audit Committee are “independent” under the relevant standards of the NYSE.NYSE and the SEC.
Compensation Committee Interlocks and Insider Participation
The members of the Compensation Committee of the Board during the year ending December 31, 2023 were Mses. Brown, Farley and Kendall. Ms. Kendall was an officer of the Company during fiscal year 2023. None of the members who served on the Compensation Committee at any time during fiscal year 2023 had any relationship requiring disclosure in “Part III., Item 13. Certain Relationships and Related Transactions, and Director Independence,” except for Ms. Kendall’s indirect interest in the Management Agreement as an employee of KKR. See“Part III., Item 13. Certain Relationships and Related Transactions, and Director Independence—Agreements Related to the Merger Transactions—Management Agreement.” No executive officer of the Company served as a member of the compensation committee of another entity that had an executive officer serving as a member of our Board of Directors or our Compensation Committee. No executive officer of the Company served as a member of the board of another entity that had an executive officer serving as a member of our Compensation Committee.
Code of Business Conduct and Ethics
Our Board of Directors has adopted a Code of Business Conduct and Ethics ("Code of Ethics") that applies to all of our directors, officers and employees, including our principal executive, principal financial and principal accounting officers, or persons performing similar functions. Our Code of Ethics is available free of charge on our website, www.crescentenergyco.com. We intend to satisfy the disclosure requirement under Item 5.05 of Form 8-K regarding amendment to, or waiver from, a provision of our Code of Ethics by posting such information onat the website address and location specified above within four business days following the date of the amendment or waiver.
Delinquent Section 16(a) Reports
None.
Item 11. Executive Compensation
Compensation Discussion and Analysis
This Compensation Discussion and Analysis reviews the compensation policies and programs for individuals who were deemed our “named executive officers” or “NEOs,” as determined under applicable SEC rules.
The narrative discussion set forth in this Compensation Discussion and Analysis is intended to provide additional information related to the data presented in the compensation-related tables included throughout the “Executive Compensation” section of this proxy statement and largely describes the compensation program that was in place from January 1, 20222023 to December 31, 2022.2023.
Executive Summary
Named Executive Officers
The following individuals were deemed our named executive officers for the year ended December 31, 2022:2023:
•David C. Rockecharlie, Chief Executive Officer and Director;
•Brandi Kendall, Chief Financial Officer and Director;
•Todd N. Falk, Chief Accounting Officer;
•Benjamin M. Conner, Executive Vice President
•John Clayton "Clay" Rynd, Executive Vice President; and
•Bo Shi, General Counsel and Corporate Secretary.
We have been externally managed by our Manager since the closing of the Merger Transactions pursuant to the terms of the Management Agreement. During fiscal year 2022,2023, all of our executive officers other than Mr. Shi, which consists of four of the five individuals deemed to be our named executive officers above, were employed by the Manager (such named executive officers who are employed by the Manager, the “Manager Executives”). Because our Management Agreement provides that our Manager is responsible for managing our day-to-day affairs, the Manager Executives did not currently receive any cash or equity-based compensation from us or any of our subsidiaries for serving as our executive officers. Additionally, the Management Agreement does not require the Manager Executives to dedicate a specific amount of time to fulfilling our Manager’s obligations to us under the Management Agreement and does not require a specified amount or percentage of the fees paid to the Manager to be allocated to the Manager Executives. Our Manager does not compensate its employees specifically for such services because these individuals also provide investment management and other services to other investment vehicles that are sponsored, managed or advised by affiliates of our Manager. As a result, our Manager has informed us that it cannot identify the portion of the compensation awarded to the Manager Executives by our Manager that relates solely to their services to us. Accordingly, we are unable to provide complete compensation information for any of the Manager Executives, including our Chief Executive Officer, as the total compensation of the Manager Executives reflects the performance of all the investment vehicles for which these individuals provide services, including, but not limited to, us.
Mr. Shi is the only named executive officer who was employed by us during fiscal year 20222023 and the only named executive officer for whom we made compensation determinations during fiscal year 2022.2023. Accordingly, unless specified otherwise, the following disclosures regarding the compensation paid to our named executive officers relates only to the compensation paid to Mr. Shi. As described below under the heading “Item 13. Certain Relationships and Related Transactions, and Director Independence—KKR Funds,” certain of our consolidated subsidiaries have entered into MSAs with entities owned by KKR Funds. Pursuant to the MSAs, certain of our employees, including Mr. Shi, provide services to such entities and the Company is reimbursed for compensation paid by the Company to our employee in respect of services provided to such entities. However, the disclosures related to Mr. Shi’s compensation set forth herein reflect 100% of the compensation paid to Mr. Shi by the Company and have not been reduced by amounts, if any, for which the Company was reimbursed by entities owned by KKR Funds.
Compensation Objectives
Our compensation program is intended to attract, motivate and retain talented individuals, such as Mr. Shi, who are committed to high performance and achieving successful company results. Our compensation program is not only designed to align the incentives of executives with our stockholders’ interests, but also to promote the achievement of key corporate performance measures.
Summary of Compensation Practices
We strive to maintain judicious governance standards and compensation practices by regularly reviewing best practices. We incorporated many best practices when forming our 20222023 compensation program, including the following:
What We Do
| | | | | |
| R | Align our executive compensation with long-termCompany performance |
| R | Align executives’ interests with those of stockholders through awards of stock-based compensation |
| R | Engage an independent compensation consultant, Meridian Compensation Partners (“Meridian”), to assess our practices |
| R | Require that all annual equity awards have a minimum of one year before any initial vesting |
| R | Maintain trading policies that: •Prohibit all employees from short selling our securities, entering into any derivative transactions with respect to our securities, or otherwise hedging the risk and rewards of our securities •Prohibit Section 16 officers and directors from pledging our securities •Claw back incentive-based compensation under certain circumstances |
| R | Review the independence of the Compensation Committee’s independent compensation consultant annually |
| R | Provide for limited perquisites |
What We Don’t Do
| | | | | |
| Q | Automatically increase salaries each year or make lock-step changes in compensation based on peer group compensation levels or metrics |
| Q | Pay guaranteed or multi-year cash bonuses |
| Q | Provide significant perquisites |
| Q | Provide tax gross-ups |
| Q | Provide single-trigger payments upon a change in control |
To help retain and motivate executives, our compensation committee aims to offer competitive compensation packages through a mix of cash and long-term, equity-based incentives. The compensation committee does not have any formal policies for allocating total compensation among the various components. Instead, the compensation committee uses its judgment, in consultation with Meridian, to establish an appropriate balance of short-term and long-term compensation for such named executive officers. The balance may change from year to year based on corporate strategy, financial performance and non-financial objectives, among other considerations.
Process for Determining 20222023 Compensation
We do not determine the cash or other compensation payable by our Manager to the Manager Executives. Our Manager and its affiliates determine the salaries, bonuses and other wages earned by the Manager Executives from our Manager and its affiliates. Our Manager and its affiliates also determine whether and to what extent the Manager Executives will be provided with the opportunity to participate in employee benefit plans. The process for determining the compensation paid to Mr. Shi and our non-employee directors during 20222023 is described below.
Role of Compensation Committee
The compensation committee oversees our executive compensation and employee benefit programs, and, as a result, reviews and approves all compensation decisions relating to Mr. Shi. The compensation committee also approves its report for inclusion in this Annual Report and has reviewed and discussed this Compensation Discussion and Analysis with management.
The compensation committee reviews and approves, or recommends that our Board of Directors approve, the compensation of Mr. Shi and our non-employee directors, administers our incentive compensation and benefit plans, selects and retains independent compensation consultants and assesses whether any of our compensation policies and programs have the potential to encourage excessive risk-taking. The compensation committee may delegate, to any subcommittee it may form, responsibility and authority for any particular matter as it deems appropriate under the circumstances. The compensation committee may also delegate approval of award grants and other responsibilities regarding the administration of compensatory programs to a subcommittee consisting solely of members of the compensation committee or to members of the Board who are “non-employee directors” for purposes of Rule 16b-3 of the Exchange Act.
Role of Independent Compensation Consultant
During fiscal year 2022,2023, the compensation committee continued to engage Meridian as its independent compensation consultant to assist the committee with its responsibilities related to our executive officer and director compensation programs. A representative of Meridian attends compensation committee meetings as requested. Meridian provides no services to management or the compensation committee that are unrelated to the duties and responsibilities of the compensation committee, and the compensation committee makes all decisions regarding the compensation of Mr. Shi and our non-employee directors. Meridian reports directly to the compensation committee, and all work conducted by Meridian for us is on behalf of the compensation committee.
Role of Chief Executive Officer and Senior Management
Our named executive officers regularly interact with the compensation committee and its chair to suggest and discuss our compensation structure and programs. Our chief executive officer makes recommendations for the annual cash and equity incentive awards for Mr. Shi and other employees of the Company.
Use of Market Data and Peer Group Analysis
From time to time, Meridian provides the compensation committee with market and peer group data for comparison purposes, such as to compare equity and pay mix practices. Meridian provides the compensation committee with a general survey of total compensation benchmarks that are reviewed by the compensation committee in its compensation determinations.
Risk Assessment of Compensation Plans
WeEach year, the Committee assesses the Company’s risk profile relative to the executive compensation program and confirms that its compensation programs and policies do not create or encourage excessive risks that are reasonably likely to have a material adverse impact on the Company. As a result, we believe that our compensation program does not encourage excessive or unnecessary risk taking. This is primarily due to the fact that our compensation programs and the compensation arrangements with the Manager are designed to encourage our named executive officers and employees to focus on both short-term and long-term strategic goals, thereby creating an ownership culture and helping to align the interests of our employees and our stockholders. Accordingly, our compensation program is balanced between short-term and long-term incentive compensation. Short-term incentive compensation is paid to Mr. Shi annually in cash, but is dependent on satisfying quantitative and qualitative factors determined in the discretion of the Compensation Committee each year. 28% percent of the total annual incentive compensation awarded to Mr. Shi during 2022 was in the form of a long-term equity-based award that vests in equal annual installments over a three-year period.
20222023 Compensation Decisions
Base Salary
Base salaries serve to provide fixed cash compensation to our employees, including Mr. Shi, for performing their ongoing responsibilities to the Company. During 2022, Mr. Shi’s initial base salary of $300,000, which was in effect from the inception of his employment through December 31, 2022, was determined by our predecessor prior to the closing of the Merger Transactions.$300,000. Effective January 1, 2023, based on informationan analysis of the competitive marketplace provided by Meridian and Mr. Shi's contributions, performance and experience, the Compensation Committee approved the increase of Mr. Shi’s base salary to $400,000.
While we do not pay the Manager Executives any cash compensation, we pay the Management Compensation to our Manager. The Management Compensation compensates our Manager for the services that it provides to the Company, including making the Manager Executives available to serve as our executive officers. The Manager Compensation is described in more detail under the heading “Items 1 and 2. Business and Properties—Management Agreement.”
Annual Cash Incentive Awards
Annual cash incentive awards are used to motivate and reward our employees, including Mr. Shi. We do not maintain a formal annual cash incentive award program, as such awards are instead determined on a discretionary basis and are generally based on individual performance and the financial health and performance of the Company. The target amount of Mr. Shi’s annual cash incentive compensation for 2022, which2023 was set at 115% of Mr. Shi’s base salary, was determined by our predecessor prior to the closing of the Merger Transactions.salary. The Compensation Committee reviewed input from Meridian and the considerations outlined above and no changes to Mr. Shi’s target annual cash incentive compensation have been instituted for 2023.2024.
Equity-Based Compensation
We have adopted two equity incentive plans pursuant to which we may grant equity-based compensation to our service providers. Our Compensation Committee believes that awards under these plans promote alignment of the interests of management with those of our stockholders and promote creation of value for our stockholders. The Manager Incentive Plan governs the Incentive Compensation granted to our Manager, and the Equity Incentive Plan governs awards to our service providers who are not employees of the Manager, including Mr. Shi.
During 2022 and 2023, we issued restricted stock unit awards subject to time-based vesting to certain of our employees, including Mr. Shi, and our non-employee directors pursuant to the Equity Incentive Plan. The target value of $100,000 for Mr. Shi’s 2022 equity-based compensation was determined by our predecessor prior to the closing of the Merger Transactions. On April 1, 2022,3, 2023, Mr. Shi was granted 7,305an award of 9,285 RSUs, with the number of such RSUs determined by dividing Mr. Shi’s target equity award value (which was $130,000) by $13.69,$14.00, which was the volume-weighted average closing price per share of our Class A Common Stock for the first 20 trading days followingpreceding December 7, 2022 (matching the completion ofmeasurement period under the Merger Transactions.Manager Incentive Plan). Mr. Shi’s 2022 RSU Award vests2023 award of RSUs will vest in substantially equallyequal installments on each of the first three anniversaries of the grant date; provided he remains continuously employed byApril 1, 2023, subject to his continuous employment with the Company through each such vesting date. The actual value realized by Mr. Shi with respect to his 2022 RSU Awardawards will be dependent on the value of the Class A Common Stock on the relevant settlement date.
Because all of the Manager Executives were employees of our Manager, none of the Manager Executives were eligible to receive an award under the Equity Incentive Plan and thus no Manager Executive received an award of equity-based compensation from us during fiscal year 2022.2022 or 2023. While we do not pay the Manager Executives any equity-based compensation, we pay our Manager the Incentive Compensation. The Incentive Compensation serves to further align the interests of our Manager and the Manager Executives with those of the Company and its stockholders and mitigates the possibility of excessive risk taking. The Incentive Compensation is described in more detail under the headings “Items 1 and 2. Business and Properties—Management Agreement” and “Item 12. Security Ownership of Certain Beneficial Owner and Management and Related Stockholder Matters—Equity Compensation Plan Information.”
Employment Agreements and Severance and Change in Control Benefits
We have not entered into employment agreements with any of our named executive officers. Further, we do not have any arrangements that would obligate us to make payments to the Manager Executives upon the termination of their services to us or in the event of a change in control of us. However, the award agreementagreements governing the RSU awardawards granted to Mr. Shi in 2022 providesand 2023 provide for “double trigger” acceleration of vesting in the event that Mr. Shi experiences a qualifying termination in the 12-month period following a change in control. Mr. Shi is not entitled to any payments or benefits in connection with a termination of his employment that occurs prior to, or more than 12 months following, a change in control. The arrangement with Mr. Shi is described in more detail under the heading “—Potential Payments Upon Termination or Change in Control.”
Other Benefits
Employee Benefits
We offer a comprehensive array of benefits to our employees, including Mr. Shi. These benefits are offered in order to attract and retain qualified employees. Subject to the terms of any applicable plans, policies or programs, Mr. Shi is entitled to receive employee benefits, including any and all vacation, deferred compensation, retirement, health and welfare insurance as we may provide from time to time to salaried employees generally, and such other benefits as the Compensation Committee may from time to time establish for our management-level employees.
Retirement Benefits
We currently maintain a retirement plan intended to provide benefits under section 401(k) of the Code whereby employees, including Mr. Shi, are allowed to contribute a portion of their base salaries to a tax qualified retirement account. In fiscal yearyears 2022 and 2023, matching contributions were made to participating employees equal to 100% of the employee’s deferral contributions up to 5% of the employee’s compensation, subject to applicable nondiscrimination limitations imposed by the Code. The contributions made on behalf of Mr. Shi for fiscal year 20222023 are disclosed in the footnotes to the Summary Compensation Table.
Other Compensation Policies and Practices
Anti-Hedging and Pledging Policies
All directors, officers and other employees of the Company are prohibited from making any short sales of any securities of the Company and from engaging in transactions involving Company-based derivative securities. This prohibition includes, but is not limited to, trading in Company-based option contracts, transacting in straddles or collars, hedging (generally purchasing any financial instrument or engaging in any transactions that hedge or offset, or are designed to hedge or offset, any decrease in the market value of the Company’s securities), transacting in convertible debt and writing puts or calls. In addition, pursuant to the Company’s Insider Trading Policy, directors, officers and employees are prohibited from holding the Company’s securities in a margin account or pledging securities of the Company as collateral for a loan. Pledging of the company securities in conjunction with hedging transactions is prohibited.
Stock Ownership Guidelines
To further align the interests of our directors with the interests of the Company’s other stockholders, our Nominating Committee established stock ownership and retention guidelines for our non-employee directors during 2022.2022 that continued to apply during 2023. These guidelines are described in detail under the heading “—Director Compensation” below.
Clawback Policy
In the future, we intend to adoptOn October 31, 2023, our Board of Directors adopted a clawback policy (the “Clawback Policy”) that complies with the final rule adopted by the SEC in November 2022 and the applicable listing standards adopted by the NYSE, with such clawback policy to be effective within the prescribed timeframe under such final rule and such listing standards.NYSE. The clawback policy is expected to requireClawback Policy requires us to recoup certain incentive-based compensation erroneously awarded to our current and former executive officers in the event of an accounting restatement. While the NYSE has issued its proposed listing standards, the SEC has not yet adopted such standards and so neither the final listing standards or the clawback policy have been adopted and the foregoing provisions remain subject to change. As a result, the foregoing description is qualified in its entirety by reference to the final form of the clawback policy once adopted.
Say on Pay Vote
In accordance with Dodd-Frank and as required by Rule 14a-21 of the Exchange Act, because we have not yet solicited proxies from our stockholders related to the election of directors, we have not yet held a non-binding, advisory note on the compensation of our named executive officers. We will hold such a vote at the first meeting for which we are required to do so. We value the opinions of our stockholders and are committed to excellence in corporate governance, and as part of this commitment, our Compensation Committee and Board of Directors intend to consider the results of future shareholder advisory votes when determining the compensation we pay to our named executive officers.
2023 Compensation Committee Report
Our compensation committee has furnished the following report. The information contained in this “Compensation Committee Report is not to be deemed “soliciting material” or “filed” with the SEC, nor is such information to be incorporated by reference into any future filings under the Securities Act of 1933, as amended, or the Exchange Act, except to the extent that we specifically incorporate it by reference into such filings.
The compensation committee has reviewed and discussed the Compensation Discussion and Analysis required by Item 402(b) of Regulation S-K under the Exchange Act with management. Based on such review and discussions, the compensation
committee recommended to our board of directors that the Compensation Discussion and Analysis be included in this Annual Report.
| | | | | |
| Compensation Committee of the Board of Directors |
| Claire Farley |
| Bevin Brown |
| Brandi Kendall |
20222023 Executive Compensation Tables
Summary Compensation Table
The following table sets forth the compensation paid to our named executive officers by us for their services for the fiscal years presented.
| | Name and Principal Position | Name and Principal Position | | Year | | Salary
($) | | Bonus
($) | | Stock Awards
($)(1) | | All Other Compensation
($)(2) | | Total
($) | Name and Principal Position | | Year | | Salary
($) | | Bonus
($) | | Stock Awards ($) (1) | | All Other Compensation ($) (2) | | Total
($) |
| Bo Shi | | Bo Shi | | 2023 | | 400,000 | | 460,000 | | 105,013 | | 18,920 | | 983,933 |
| General Counsel and Corporate Secretary | | General Counsel and Corporate Secretary | | 2022 | | 300,000 | | 345,000 | | 134,485 | | 14,182 | | 793,667 |
| | David C. Rockecharlie | |
| David C. Rockecharlie | |
| David C. Rockecharlie | David C. Rockecharlie | | 2022 | | — | | — | | — | | — | | — | | 2023 | | — |
| Chief Executive Officer | Chief Executive Officer | | 2021 | | — | | — | | — | | — | | — | Chief Executive Officer | | 2022 | | — |
| 2020 | | — | | — | | — | | — | | — |
| | 2021 | | | | 2021 | | — |
| Brandi Kendall | Brandi Kendall | | 2022 | | — | | — | | — | | — | | — | Brandi Kendall | | 2023 | | — |
| Chief Financial Officer | Chief Financial Officer | | 2021 | | — | | — | | — | | — | | — | Chief Financial Officer | | 2022 | | — |
| 2020 | | — | | — | | — | | — | | — |
| | 2021 | | | | 2021 | | — |
| Todd N. Falk | Todd N. Falk | | 2022 | | — | | — | | — | | — | | — | Todd N. Falk | | 2023 | | — |
| Chief Accounting Officer | Chief Accounting Officer | | 2021 | | — | | — | | — | | — | | — | Chief Accounting Officer | | 2022 | | — |
| | 2021 | | | | 2021 | | — |
| | 2020 | | — | | — | | — | | — | | — |
| Benjamin M. Conner | | 2022 | | — | | — | | — | | — | | — |
| Executive Vice President | | 2021 | | — | | — | | — | | — | | — |
| | John Clayton "Clay" Rynd | |
| | John Clayton "Clay" Rynd | |
| | | 2020 | | — | | — | | — | | — | | — |
| John Clayton "Clay" Rynd | John Clayton "Clay" Rynd | | 2022 | | — | | — | | — | | — | | — | | 2023 | | — |
| Executive Vice President | Executive Vice President | | 2021 | | — | | — | | — | | — | | — | Executive Vice President | | 2022 | | — |
| 2020 | | — | | — | | — | | — | | — |
| Bo Shi | | 2022 | | 300,000 | | 345,000 | | 134,485 | | 14,182 | | 793,667 |
| General Counsel and Corporate Secretary | |
| | 2021 | | | | 2021 | | — |
_______________
(1) The amount reported in this column represents the aggregate grant date fair value, determined in accordance with Financial Accounting Standards Board Accounting Standards Codification Topic 718, excluding the effects of estimated forfeitures, of RSUs awarded in 2023 and 2022 under our Equity Incentive Plan to Mr. Shi. The assumptions used in calculating the aggregate grant date fair value of such award are described under the heading NOTE 13 – Incentive Compensation Arrangements in the notes"Notes to our Combined and Consolidated Financial Statements—NOTE 13 – Equity-Based Compensation Awards" in "Part II., Item 8. Financial Statements included elsewhere inand Supplementary Data" of this Annual Report. As described in the Compensation Discussion and Analysis, the amount reported in this column does not reflect the actual value that will be realized by Mr. Shi in respect of his 2022 and 2023 RSU award.awards. We have not granted equity or equity-based awards to any of the Manager Executives.
(2) Amounts reported in this column for Mr. Shi reflect Company-paid life insurance premiums and 401(k) matching contributions in the amounts of $1,044$90 and $13,138$18,830 for the fiscal year ended December 31, 2022, respectively.2023.
Grants of Plan-Based Awards for Fiscal Year 20222023
The table below includes information regarding RSUs granted under our Equity Incentive Plan to our named executive officers during the fiscal year ended December 31, 2022.2023.
| | | | | | | | | | | | | | | | | | | | | | | | | | |
Name | | Grant Date | | Approval Date | | All Other Stock Awards: Number of Shares of Stock or Units (#)(1) | | Grant Date Fair Value of Stock and Option Awards ($)(2) |
David C. Rockecharlie | | — | | — | | — | | — |
Brandi Kendall | | — | | — | | — | | — |
Todd N. Falk | | — | | — | | — | | — |
Benjamin M. Conner | | — | | — | | — | | — |
| | | | | | | | | | | | | | | | | | | | | | | | | | |
| Name | | Grant Date | | Approval Date | | All Other Stock Awards: Number of Shares of Stock or Units (#) (1) | | Grant Date Fair Value of Stock and Option Awards ($) (2) |
| Bo Shi | | 04/01/2023 | | 3/3/2023 | | 9,285 | | 105,013 |
| David C. Rockecharlie | | — | | — | | — | | — |
| | | | | | | | | | | | | | | | | | | | | | | | | | |
| Name | | Grant Date | | Approval Date | | All Other Stock Awards: Number of Shares of Stock or Units (#)(1) | | Grant Date Fair Value of Stock and Option Awards ($)(2) |
| John Clayton "Clay" Rynd | | — | | — | | — | | — |
| Bo Shi | | 04/01/2022 | | 03/08/2022 | | 7,305 | | 134,485 |
| | | | | | | | | | | | | | | | | | | | | | | | | | |
| Name | | Grant Date | | Approval Date | | All Other Stock Awards: Number of Shares of Stock or Units (#) (1) | | Grant Date Fair Value of Stock and Option Awards ($) (2) |
| Brandi Kendall | | — | | — | | — | | — |
| Todd N. Falk | | — | | — | | — | | — |
| | | | | | | | |
| John Clayton "Clay" Rynd | | — | | — | | — | | — |
_______________
(1) The amount included in this column represents the number of RSUs granted to Mr. Shi pursuant to the Equity Incentive Plan during fiscal year 2022.2023. These RSUs will vest in substantially equal installments on each of the first three anniversaries of April 1, 2022.2023. For more information, see the section titled “Compensation Discussion and Analysis—Equity-Based Compensation” above.
(2) The amount reported in this column represents the aggregate grant date fair value, determined in accordance with FASB ASC 718, excluding the effects of estimated forfeitures, of the RSUs granted to Mr. Shi in 2022.2023. The assumptions used in calculating the aggregate grant date fair value of such award are described under the heading NOTE 13 – Incentive Compensation Arrangements in the notes"Notes to our Combined and Consolidated Financial Statements—NOTE 13 – Equity-Based Compensation Awards" in "Part II., Item 8. Financial Statements included elsewhere inand Supplementary Data" of this Annual Report.
Narrative to Summary Compensation Table and Grants of Plan Based Awards Table
Employment Agreements
We have not entered into employment agreements with any of our named executive officers. More information on the agreements we have entered into with our named executive officers is provided in the Compensation Discussion and Analysis above under the heading “—Compensation Discussion and Analysis—Employment Agreements and Severance and Change in Control Benefits.”
Salary and Bonus in Proportion to Total Compensation
The table below reflects the aggregate amount of Mr. Shi’s 20222023 salary and bonus in proportion to the total compensation paid to Mr. Shi during 2022.2023. The amounts reported in this table for Mr. Shi were calculated using the amounts reported in the “Salary” and “Bonus” columns of the Summary Compensation Table above. More information regarding Mr. Shi’s salary and bonus arrangements is provided in the Compensation Discussion and Analysis above under the headings “—Compensation Discussion and Analysis—20222023 Compensation Decisions—Base Salary” and “—Compensation Discussion and Analysis—20222023 Compensation Decisions—Annual Cash Incentive Awards.”
| | Name | Name | | Year | | Salary and Bonus
($) | | Salary and Bonus as a Percentage of Total Compensation | Name | | Year | | Salary and Bonus
($) | | Salary and Bonus as a Percentage of Total Compensation |
| Bo Shi | Bo Shi | | 2022 | | 645,000 | | 81% | Bo Shi | | 2023 | | 860,000 | | 87% |
We do not pay any cash or other compensation to the Manager outside of the Manager Incentive Plan as described in more detail in the Compensation Discussion and Analysis above.
2022 Equity Incentive Plan Awards
We granted an awardawards of time-based RSUs to Mr. Shi under the Equity Incentive Plan during 2022.2022 and 2023. Mr. Shi will have no right to receive any dividends or other distribution with respect to a RSU unless and until shares of Class A Common Stock have been delivered in respect of the RSUs that become vested, if any, in accordance with the terms and conditions of the corresponding RSU award. The terms and conditions, including vesting, applicable to Mr. Shi’s 2022 and 2023 RSU Awardawards are further described in the Compensation Discussion and Analysis above under the heading “—Compensation Discussion and Analysis—Equity-Based Compensation.” The potential acceleration and forfeiture events relating to Mr. Shi’s 2022 and 2023 RSU awardawards are described, as of December 31, 2022,2023, in greater detail under the heading “—Potential Payments Upon Termination or Change in Control” below.
Outstanding Equity Awards at 20222023 Fiscal Year End
The following table reflects information regarding outstanding equity-based awards held by our named executive officers as of December 31, 2022,2023, which consist of RSUs granted under the Equity Incentive Plan to Mr. Shi.
| | Name | Name | | Stock Awards (1) | |
| Number of Shares or Units of Stock That Have Not Vested
(#) | | Market Value of Shares or Units of Stock That Have Not Vested
($)(2) | |
| | Number of Shares or Units of Stock That Have Not Vested (#) (1) | |
| Number of Shares or Units of Stock That Have Not Vested (#) (1) | |
| Number of Shares or Units of Stock That Have Not Vested (#) (1) | |
| | Bo Shi | |
| | Bo Shi | |
| | Bo Shi | |
| David C. Rockecharlie | |
| David C. Rockecharlie | |
| David C. Rockecharlie | David C. Rockecharlie | | — | | $— | |
| Brandi Kendall | Brandi Kendall | | — | | — | |
| Brandi Kendall | |
| Brandi Kendall | |
| Todd Falk | Todd Falk | | — | | — | |
| Benjamin M. Conner | | — | | — | |
| Todd Falk | |
| Todd Falk | |
| John Clayton "Clay" Rynd | John Clayton "Clay" Rynd | | — | | — | |
| Bo Shi | | 7,305 | | $87,587 | |
| John Clayton "Clay" Rynd | |
| John Clayton "Clay" Rynd | |
_______________
(1) TheEach RSU award granted to Mr. Shi represents the contingent right to receive one share of our Class A Common Stock upon vestingvesting. The 2022 RSU award vested as to one-third of the RSUs granted on April 1, 2023 and vestswill vest as to an additional one-third of the RSUs granted on April 1 of 2024 and 2025. The 2023 RSU award will vest in substantially equal one-third installments on each of the first three anniversaries of April 1 2022.of 2024, 2025, and 2026.
(2) The amount included in this column represents the market value of our Class A Common Stock underlying the RSU awardawards granted to Mr. Shi, computed based on the closing price of our Class A Common Stock on December 30, 2022,29, 2023, the last trading day of 2022,2023, which was $11.99$13.21 per share.
Option Exercises and Stock Vested in Fiscal Year 20222023
None | | | | | | | | | | | | | | | |
| Name | | Stock Awards | |
| Number of Shares Acquired on Vesting (#) (1) | | Value Realized on Vesting ($) (1) | |
| | |
| Bo Shi | | 2,435 | | $27,540 | |
| David C. Rockecharlie | | — | | — | |
| Brandi Kendall | | — | | — | |
| Todd Falk | | — | | — | |
| John Clayton "Clay" Rynd | | — | | — | |
_______________
(1) Reflects shares received pursuant to the vesting, on April 1, 2023, of RSUs subject to Mr. Shi's 2022 RSU award. The value realized on vesting reflects the closing price of our named executive officers held equity or equity-based awards that were exercised or became vested duringClass A Common Stock on March 31, 2023 (the last trading day preceding the fiscal year ended December 31, 2022.vesting date), which was $11.31, multiplied by the number of shares of our Class A Common Stock received by Mr. Shi.
Pension Benefits and Nonqualified Deferred Compensation
We have not maintained, and do not currently maintain, a defined benefit pension plan or a nonqualified deferred compensation plan providing for retirement benefits to our employees, including the named executive officers.
Potential Payments Upon Termination or Change in Control
Termination and Change in Control Arrangements
Since the Manager Executives are employees of our Manager or its affiliates, we do not have any obligations to make any payments to the Manager Executives upon a termination of employment or upon a change of control. However, we are obligated to make certain payments to the Manager in connection with certain terminations of the Management Agreement. Such payments are described above under the heading “Items 1 and 2. Business and Properties—Management Agreement.”
The award agreementagreements governing Mr. Shi’s 2022 and 2023 RSU award providesawards provide that, upon a termination of Mr. Shi’s employment by the Company without “cause” or a resignation by Mr. Shi for “good reason” that, in each case, occurs within the 12 month period following a “change in control” of the Company, any RSUs that remain unvested as of the date of such termination will immediately vest in full, provided Mr. Shi has remained continuously employed by us from the grant date of such award through the date of termination. Upon a termination of Mr. Shi’s employment for any other reason, any unvested RSUs held by him as of the applicable termination date will be forfeited without consideration. Mr. Shi is not entitled to any payments or benefits in connection with a termination of his employment that occurs prior to, or more than 12 months following, a change in control of the Company.
The terms set forth below are generally defined as follows for purposes of Mr. Shi’s award agreement:
•“cause” means one or more of the following: (i) gross negligence or willful misconduct in the performance of duties to the Company or its affiliates, (ii) material breach of any material provision of any written agreement with the Company or an affiliate, or the material breach of an applicable corporate policy or code of conduct, (iii) willful conduct that is materially injurious to the Company or an affiliate, or (iv) conviction of, plea of no contest to, or the receipt of deferred adjudication or adjudicated probation in connection with a felony involving fraud, dishonesty or moral turpitude (or a crime of similar import in a foreign jurisdiction);
•“good reason” means a material diminution in base salary, provided that good reason exists only if such diminution occurs without consent, written notice is provided to the Company of such diminution within 45 days of its occurrence, such diminution remains uncorrected for 30 days following receipt of such notice and the date of termination occurs within 90 days of the date such notice is received by the Company; and
•“change in control” means one of the following: (i) the acquisition of more than 50% of the then outstanding Class A Common Stock or total voting power of the Company, (ii) a majority of the members of the Board are replaced with individuals who are not incumbent directors over any two year period, (iii) a sale, merger or similar transaction or series of related transactions involving the Company, as a result of which the owners of the Company’s securities prior to such transaction cease to hold more than 50% of the voting securities of the surviving entity, any single person owns more than 50% of the securities entitled to vote for the election of directors or the incumbent directors prior to such transaction cease to represent at least a majority of the board of the surviving entity or its parent, or (iv) the sale of all or substantially all of the assets of the Company in a transaction or series of related transactions.
Quantification of Benefits
The following table provides information concerning the estimated payments and benefits that would be provided in the circumstances described above to each of our named executive officers. Except where otherwise noted, payments and benefits are estimated assuming both qualifying termination of employment and a change in control occurred on December 31, 2022.2023. There can be no assurance that a triggering event would produce the same or similar results as those estimated below if such event occurs on any other date or at any other price, or if other circumstances affect the assumptions used to estimate these potential payments and benefits. Due to the number of factors that affect the nature and amount of any potential payments or benefits, any actual payments and benefits paid in such circumstances may be different than those set forth in the table below.
| | | | | | | | | | | | | | | | | | | | |
| Benefits and Payments | | Termination Without Cause or for Good Reason During 12 Month Period Following Change in Control
($) | | Change in Control
($)(1) | | All Other Terminations
($)(1) |
David C. RockecharlieBo Shi | | | | | | |
| Cash Severance | | $ | — | | | $ | — | | | $ | — | |
| Accelerated Equity Awards | | 186,988 (2) | | — | | — | | — |
| Total | | $ | 186,988 | | | $ | — | | | $ | — | |
| David C. Rockecharlie | | | | | | |
| Cash Severance | | $ | — | |
| Brandi Kendall | | | | | |
Cash Severance | | $ | — | | | $ | — | | | $ | — | |
| Accelerated Equity Awards | | — | | — | | — |
| Total | | $ | — | | | $ | — | | | $ | — | |
Todd N. FalkBrandi Kendall | | | | | | |
| Cash Severance | | $ | — | | | $ | — | | | $ | — | |
| Accelerated Equity Awards | | — | | — | | — |
| Total | | $ | — | | | $ | — | | | $ | — | |
Benjamin M. ConnerTodd N. Falk | | | | | | |
| Cash Severance | | $ | — | | | $ | — | | | $ | — | |
| Accelerated Equity Awards | | — | | — | | — |
| Total | | $ | — | | | $ | — | | | $ | — | |
| | | | | | |
| | | | | | |
| | | | | | |
| | | | | | |
| John Clayton "Clay" Rynd | | | | | | |
| Cash Severance | | $ | — | | | $ | — | | | $ | — | |
| | | | | | | | | | | | | | | | | | | | |
| Accelerated Equity Awards | | — | | — | | — |
| Total | | $ | — | | | $ | — | | | $ | — | |
Bo Shi | | | | | | |
Cash Severance | | $ | — | | | $ | — | | | $ | — | |
Accelerated Equity Awards | | 87,587 (2) | | — | | — |
Total | | $ | 87,587 | | | $ | — | | | $ | — | |
_______________
(1) None of the Manager Executives are eligible to receive any payments or benefits in the event of a change in control of us or a termination of employment. Further, Mr. Shi is not eligible to receive any payments or benefits in any of the following scenarios: the occurrence of a change in control without a qualifying termination of employment, a termination of employment by the Company with or without Cause outside the 12 month period following a change in control, a termination of employment due to a named executive officer’s resignation with or without good reason outside the 12 month period following a change in control, or a termination due to a named executive officer’s death or disability.
(2) This amount was calculated by multiplying (a) the number of shares of our Class A Common Stock underlying Mr. Shi’s RSU awards that would accelerate upon a qualifying termination of Mr. Shi’s employment that occurred in December 31, 2022,2023, assuming that such termination occurred during the 12-month period following a change in control, by (b) $11.99,$13.21, the closing price of our Class A Common Stock on December 30, 2022,29, 2023, the last trading day of 2022.2023.
CEO Pay Ratio
Section 953(b) of Dodd-Frank, and Item 402(u) of Regulation S-K, requires that we provide information about the relationship of the annual total compensation of David C. Rockecharlie, our chief executive officer, to the median annual total compensation of other employees providing services to us. However, as disclosed in the “Compensation Discussion and Analysis” section above, Mr. Rockecharlie did not receive any direct cash or other compensation from us nor did our Manager allocate any cash or other compensation solely for Mr. Rockecharlie’s services as our chief executive officer, and we did not reimburse our Manager or any of its affiliates for any compensation paid to Mr. Rockecharlie. As a result, we are unable to provide a ratio of the median employee’s annual total compensation to the total annual compensation of Mr. Rockecharlie.
Director Compensation
20222023 Compensation
The following table sets forth information concerning the compensation paid by us to our directors for the fiscal year ended December 31, 2022.2023.
| | Name | Name | | Fees Earned or Paid in Cash
($) | | Stock Awards
($)(2)(3) | | All Other Compensation
($) | | Total
($) | Name | | Fees Earned or Paid in Cash
($) | | Stock Awards ($)(2)(3) | | All Other Compensation
($) | | Total
($) |
| John C. Goff | John C. Goff | | 71,000 | | 168,102 | | — | | 239,102 | John C. Goff | | 80,000 | | 230,238 | | — | | 310,238 |
| Claire S. Farley | Claire S. Farley | | 91,500 | | 168,102 | | — | | 259,602 | Claire S. Farley | | 99,500 | | 129,251 | | — | | 228,751 |
| Robert G. Gwin | Robert G. Gwin | | 69,000 | | 168,102 | | — | | 237,102 | Robert G. Gwin | | 80,000 | | 129,251 | | — | | 209,251 |
| Ellis L. “Lon” McCain | Ellis L. “Lon” McCain | | 88,000 | | 168,102 | | — | | 256,102 | Ellis L. “Lon” McCain | | 100,000 | | 129,251 | | — | | 229,251 |
| Karen J. Simon | Karen J. Simon | | 73,000 | | 168,102 | | 25,000 (4) | | 256,102 | Karen J. Simon | | 80,000 | | 129,251 | | 25,000 (4) | | 234,251 |
| Erich Bobinsky (1) | Erich Bobinsky (1) | | 72,000 | | 168,102 | | — | | 240,102 | Erich Bobinsky (1) | | 80,000 | | 129,251 | | — | | 209,251 |
| Bevin Brown (1) | Bevin Brown (1) | | 71,000 | | 168,102 | | — | | 239,102 | Bevin Brown (1) | | 80,000 | | 129,251 | | — | | 209,251 |
_______________
(1) Erich Bobinsky and Bevin Brown are officers and employees of Liberty Holdco and serve on our Board of Directors as nominees of PT Independence. Mr. Bobinsky and Ms. Brown have agreed that they will not receive any separate compensation for serving as directors of the Company and have agreed to transfer to Liberty Holdco any director compensation that they receive from us, including any shares received in respect of equity or equity-based awards. As such, all amounts reported for Mr. Bobinsky and Ms. Brown in this table will not be retained by them, but instead will be transferred to Liberty Holdco. As such, Mr. Bobinsky and Ms. Brown will not retain any compensation with respect to their service on our Board of Directors in 2022.2023. The aggregate number of outstanding RSUs held, by each non-management director as of December 31, 20222023, by Mr. Goff was 9,131.20,357 and by each other non-management director was 11,428.
(2) The amounts reported in this column represent the aggregate grant date fair value, determined in accordance with FASB ASC 718, excluding the effects of estimated forfeitures, of 9,13120,357 RSUs that were granted to Mr. Goff and the 11,428 RSUs that were granted to each other non-management director pursuant to the Equity Incentive Plan on April 1, 2022.3, 2023. The assumptions used in calculating the aggregate grant date fair value of such awards are described under the heading NOTE 13—Incentive Compensation Arrangements in the notes"Notes to our Combined and Consolidated Financial Statements—NOTE 13 – Equity-Based Compensation Awards" in "Part II., Item 8. Financial Statements included elsewhere inand Supplementary Data" of this Annual Report. The RSU awards will vest in full on April 1, 2023,2024, subject to the director continuously providing services on our Board of Directors through such date.
(3) As described below, the target value of the annual equity-based compensation granted to our non-management directors is $125,000.$160,000 plus an additional award with a target value of $125,000 to the non-executive Chairman of the Board. The number of RSUs issued pursuant to the 20222023 awards was determined by dividing such target value by $13.69,$14.00, which was the volume-weighted average closing price per share of our Class A Common Stock for the first 20 trading days followingpreceding December 7, 2022 (matching the completion ofmeasurement period under the Merger Transactions.Manager Incentive Plan).
(4) The amount reported represents a charitable donation made on Ms. Simon's behalf in connection with her service on the Company's ESGSustainability Council.
Director Compensation Policy
In connection with the Merger Transactions, we established a comprehensive non-management director compensation policy. The policy is designed to provide competitive compensation necessary to attract and retain high quality non-management directors and to encourage ownership of our Class A Common Stock to further align their interests with those of the Company’s stockholders. No compensation is paid to management directors. The non-management director compensation policy in effect for the fiscal year ended December 31, 2022,2023, provided for the following compensation to our non-management directors:
•An annual cash retainer of $65,000;$80,000;
•An annual equity-based award with a value of $125,000$160,000 (adjusted for partial periods of service) granted in the form restricted stock units, subject to a one-year vesting period;
•An additional equity-based award to the non-executive Chairman of the Board with a value of $125,000 granted in the form of restricted stock units, subject to a one-year vesting period;
•An additional annual cash retainer for the following committee chairs:
◦$15,00020,000 for the chairperson of the Audit Committee,
◦$10,000 for the chairperson of the Compensation Committee, and
◦$9,500 for the chairperson of the Nominating Committee; and
•Meeting attendance fees of $1,000 for each Board of Directors and committee meeting attended in person or telephonically.
The Compensation Committee engaged Meridian to review our non-management director compensation policy. In light of the non-employee directors’ roles and responsibilities and after considering director compensation at relevant peer group companies and recommendations by Meridian, our Board of Directors adopted the following changes to our non-management director compensation policy that became effective for the 2023 calendar year:
•Increased annual cash retainer to $80,000;
•Increase the value of annual restricted stock unit award to $160,000 (adjusted for partial periods of service);
•Increased additional annual cash retainer for chairperson of Audit Committee to $20,000;
•Added additional equity-based award to the non-executive Chairman of the Board with a value of $125,000 granted in the form of restricted stock units, subject to a one-year vesting period; and
•Discontinued payment of meeting attendance fees.Committee.
We also provide for the reimbursement of out-of-pocket expenses incurred by directors in the performance of their duties, including reasonable travel expenses incurred attending meetings. Each director is indemnified for his or her actions associated with being a director to the fullest extent permitted under Delaware law.
Stock Ownership Requirements
To further align the interests of our non-employee directors with those of our stockholders, in November 2022, our Nominating Committee adopted stock ownership and retention requirements for all non-management directors, other than Mr. Bobinsky or Ms. Brown who were appointed to serve on our Board pursuant to the director nominee rights held by their employer, Liberty, and are prohibited by Liberty from owning securities of the Company in their individual capacities.
Pursuant to the stock ownership guidelines, the applicable non-management directors are required to own common stock of the Company equal in value to at least five times their total annual cash retainer, which includes any additional annual retainer paid for service on a committee. Share equivalents (including restricted stock units) are counted for purposes of satisfying the stock ownership requirement. Non-management directors must attain such ownership within five years of the date the guidelines were adopted, or five years of joining the Board, whichever is later.
Manager Incentive Plan
Prior to the closing of the Merger Transactions, we adopted and our stockholders approved, the Manager Incentive Plan. The purpose of the Manager Incentive Plan is to provide a means through which we may provide equity-based compensation to the Manager, as required by the Management Agreement. The description of the Manager Incentive Plan set forth below is a summary of the material features of the Manager Incentive Plan. This summary does not purport to be a complete description of all of the provisions of the Manager Incentive Plan and is qualified in its entirety by reference to the Manager Incentive Plan, the form of which is attached hereto as Exhibit 10.6.
Manager Incentive Plan Share Limit. Subject to adjustment in the event of certain transactions or changes of capitalization in accordance with the Manager Incentive Plan, 4,306,745 were initially reserved for issuance pursuant to awards under the Manager Incentive Plan. The aggregate number of shares of Class A Common Stock reserved for delivery shall be increased on
January 1 of each calendar year that occurs before the tenth anniversary of the Effective Date (as defined in the Manager Incentive Plan) by 10% of the additional Class A Common Stock issued, if any, during the immediately preceding calendar
year. If an award under the Manager Incentive Plan is forfeited, settled for cash or expires without the actual delivery of shares, any shares subject to such award will again be available for new awards under the Manager Incentive Plan.
Administration. The Manager Incentive Plan is administered by the board or a committee later appointed by the board.
Awards. The Manager Incentive Plan provides for the grant of (i) stock options; (ii) stock appreciation rights; (iii) restricted or unrestricted Class A Common Stock; (iv) restricted stock units; (v) other equity-based awards; (vi) incentive awards; (vii) cash awards; (viii) performance awards; and (ix) substitute awards.
Certain Transactions. If any change is made to our capitalization, such as a stock split, stock combination, stock dividend, exchange of shares or other recapitalization, merger or otherwise, which results in an increase or decrease in the number of outstanding shares of Class A Common Stock, appropriate adjustments will be made by the committee in the shares subject to awards under the Manager Incentive Plan. The committee will also have the discretion to make certain adjustments to awards in the event of a Change in Control (as defined in the Manager Incentive Plan), such as accelerating the vesting or exercisability of awards, requiring the assumption of awards or substitution of awards for new awards or cancelling awards in exchange for payments of consideration in forms determined by the committee.
Clawback Policy. All awards under the Manager Incentive Plan will be subject to our clawback or recapture policy, as in effect from time to time.
Amendment and Termination. The board may amend or terminate the Manager Incentive Plan at any time; however, no amendment may adversely impair the rights of participants with respect to outstanding awards and shareholder approval will be required for any amendment to the extent necessary to comply with applicable law or exchange listing standards. The committee will not have the authority, without the approval of shareholders, to amend any outstanding stock option or stock appreciation right to reduce its exercise price per share. The Manager Incentive Plan will remain in effect for a period of ten years following the effective date of the Manager Incentive Plan (unless earlier terminated by the Board).
Other. As described under “The Transaction Agreement and Related Agreements—OpCo LLC Agreement”, the OpCo LLC Agreement provides that, subject to certain exceptions, at any time we issue a share of Class A Common Stock or any other equity security (including awards granted under the Manager Incentive Plan) following the Merger Transactions, the net proceeds received by us with respect to such issuance, if any, will be concurrently contributed to OpCo, which, in turn, will issue one Unit (if we issue a share of Class A Common Stock) or such other equity security (if we issue equity securities other than Class A Common Stock) corresponding to the equity securities issued by us to the Company Group.
The Incentive Compensation
Following the closing of the Merger Transactions, the Manager was granted the Incentive Compensation, which is an award of restricted stock units subject to performance-based vesting (“PSUs”) under the Manager Incentive Plan, as required by the Management Agreement. This summary does not purport to be a complete description of all of the provisions of the Incentive Compensation and is qualified in its entirety by reference to the award agreement governing the Incentive Compensation (the “Award Agreement”), the form of which is included as Exhibit 10.5 hereto.
General Description. The Incentive Compensation is a grant of five “Target PSUs,” each of which corresponds to a number of shares of Class A Common Stock equal to 2% of the total number of shares of Class A Common Stock outstanding on each Performance Period End Date (as defined in the Award Agreement). The Incentive Compensation represents the right to receive shares of Class A Common Stock in an amount ranging from 0% to 240% of each Target PSU, subject to the Company’s achievement of certain performance-based vesting conditions.
Vesting. Each Target PSU will become earned, if at all, following the determination of the Company’s level of achievement of certain performance goals during a three-year performance period. For each performance period, the performance goals for (i) 60% of the Target PSU shall be based on the Company’s absolute total stockholder return (the “Absolute TSR Portion”) during the applicable performance period and (ii) 40% of the Target PSU shall be based on the relative total stockholder return (the “Relative TSR Portion”) ranking of the Company as compared to our peer group during the applicable performance period.
For each performance period, the Absolute TSR Portion of the Target PSU will become earned based on the committee’s determination of the Company’s Absolute TSR Portion in accordance with the table below.
| | | | | | | | |
| Absolute TSR (%) | | Earned Amount (% of Absolute TSR Portion)* |
| <25% | | 0% |
| | Absolute TSR (%) | | Earned Amount (% of Absolute TSR Portion)* |
| <25% | | 0% |
| 25% | 25% | | 100% | 25% | | 100% |
| 55% | 55% | | 150% | 55% | | 150% |
| 85% | 85% | | 200% | 85% | | 200% |
| 115% | 115% | | 250% | 115% | | 250% |
| 145% | 145% | | 300% | 145% | | 300% |
For each performance period, the Relative TSR Portion of the Target PSU will become earned based on the committee’s determination of the Company’s Relative TSR in accordance with the table below.
| | | | | | | | |
| Relative TSR Percentile Ranking | | Earned Amount (% of Relative TSR Portion)* |
<20th Percentile | | 0% |
20th Percentile | | 50% |
40th Percentile | | 75% |
60th Percentile | | 100% |
70th Percentile | | 125% |
≥80th Percentile | | 150% |
Acceleration of Vesting. The Award Agreement provides that unearned Target PSUs will immediately be deemed earned with respect to 100% of such Target PSUs upon the occurrence of a Change in Control or a complete liquidation or dissolution of the Company, provided that the Management Agreement has not been terminated prior to such date.
Equity Incentive Plan
Prior to the closing of the Merger Transactions, we adopted, and our stockholders approved, the Equity Incentive Plan. On May 10, 2023, the Board adopted, and stockholders holding a majority of the shares of voting power of our Class A Common Stock and Class B Common Stock approved the adoption of, the First Amendment to the Equity Incentive Plan (the “First Amendment”). The First Amendment increases the number of shares of our Class A Common Stock authorized to be delivered under the Equity Incentive Plan by 2,477,201 shares.
The purpose of the Equity Incentive Plan is to incentivize individuals providing services to the Company or its affiliates as its employees, officers or non-employee directors through grants of equity-based incentive awards. Any individual employed by the Manager or any of its parent companies is not be eligible to participate in the Equity Incentive Plan. As such, none of our executive officers, including the named executive officers, wereexcept for Mr. Shi are eligible to participate in the Equity Incentive Plan during fiscal year 2021.Plan. The description of the Equity Incentive Plan set forth below is a summary of the material features of the Equity Incentive Plan. This summary does not purport to be a complete description of all of the provisions of the Equity Incentive Plan and is qualified in its entirety by reference to the Equity Incentive Plan, the form of which is included as Exhibit 10.7 hereto, and the First Amendment, which is included as Exhibit 10.8 hereto.
Equity Incentive Plan Share Limits. Subject to adjustment in the event of certain transactions or changes of capitalization in accordance with the Equity Incentive Plan, 861,3493,338,550 shares of Class A Common Stock were initiallyare reserved for issuance pursuant to awards under the Equity Incentive Plan.Plan (after giving effect to the First Amendment). The total number of shares reserved for issuance under the Equity Incentive Plan may be issued pursuant to incentive stock options (which generally are stock options that meet the requirements of Section 422 of the Code). If an award under the Equity Incentive Plan is forfeited, settled for cash or expires without the actual delivery of shares, any shares subject to such award will again be available for new awards under the Equity Incentive Plan.
Administration. The Equity Incentive Plan is administered by the board or a committee later appointed by the board.
Awards. The Equity Incentive Plan provides for the grant of (i) stock options; (ii) stock appreciation rights; (iii) restricted or unrestricted Class A Common Stock; (iv) restricted stock units; (v) other equity-based awards; (vi) incentive awards; (vii) cash awards; (viii) performance awards; and (ix) substitute awards.
Maximum Calendar Year Award. No non-employee director may receive, in any one calendar year, more than $1,000,000 in the aggregate in awards granted under the Equity Incentive Plan and cash compensation (including retainers and cash-based awards). Notwithstanding the foregoing, awards and cash compensation may be granted or paid to non-employee directors in
excess of such limits for any calendar year in which the director first commences service on the Board of Directors, serves on a special committee of the Board of Directors, or serves as lead director or chairman of the Board of Directors.
Certain Transactions. If any change is made to the Company’s capitalization, such as a stock split, stock combination, stock dividend, exchange of shares or other recapitalization, merger or otherwise, which results in an increase or decrease in the
number of outstanding shares of Class A Common Stock, appropriate adjustments will be made by the committee in the shares subject to awards under the Equity Incentive Plan. The committee will also have the discretion to make certain adjustments to awards in the event of a Change in Control (as defined in the Equity Incentive Plan), such as accelerating the vesting or exercisability of awards, requiring the assumption of awards or substitution of awards for new awards or cancelling awards in exchange for payments of consideration in forms determined by the committee.
Clawback Policy. All awards under the Equity Incentive Plan will be subject to our clawback or recapture policy, as in effect from time to time.
Amendment and Termination. The board may amend or terminate the Equity Incentive Plan at any time; however, no amendment may adversely impair the rights of participants with respect to outstanding awards and shareholder approval will be required for any amendment to the extent necessary to comply with applicable law or exchange listing standards. The committee will not have the authority, without the approval of shareholders, to amend any outstanding stock option or stock appreciation right to reduce its exercise price per share. The Equity Incentive Plan will remain in effect for a period of ten years following the effective date (unless earlier terminated by the board).
Item 12. Security Ownership of Certain Beneficial OwnerOwners and Management and Related Stockholder Matters
The following table sets forth certain information known to us, based on filings made under Section 13(d) and 13(g) of the Exchange Act, regarding the beneficial ownership of our common stock as of February 28, 202329, 2024 by:
•each person, or group of affiliated persons, knowknown to us to beneficially own more than 5% of our common stock;
•each member of the Board of Directors;
•each of our Named Executive Officers; and
•all of our directors and executive officers as a group.
Beneficial ownership is determined in accordance with the rules of the SEC. These rules generally attribute beneficial ownership of securities to persons who possess sole or shared voting power or investment power with respect to such securities. Except as otherwise indicated, all persons listed below have sole voting and investment power with respect to the shares beneficially owned by them, subject to applicable community property laws. Unless otherwise indicated, the address of each person or entity named in the table below is c/o Crescent Energy Company, 600 Travis Street, Suite 7200, Houston, Texas 77002.
As of February 28, 2023,29, 2024, there were 48,282,16391,608,800 shares of our Class A Common Stock and 118,645,32388,048,124 shares of our Class B Common Stock outstanding.
| | Shares Beneficially Owned by Certain Beneficial Owners and Management | Shares Beneficially Owned by Certain Beneficial Owners and Management | Shares Beneficially Owned by Certain Beneficial Owners and Management |
| Class A Common Stock | | Class B Common Stock | | Combined Voting Power (1) |
| Number | | % of class | | Number | | % of class | | Number | | % of class |
| Class A Common Stock | | | Class A Common Stock | | Class B Common Stock | | Combined Voting Power (1) |
| Number | | | Number | | % of class | | Number | | % of class | | Number | | % of class |
| | 5% Stockholders | 5% Stockholders | |
| 5% Stockholders | |
| 5% Stockholders | |
Independence Energy Aggregator LP and its affiliates (2) | |
Independence Energy Aggregator LP and its affiliates (2) | |
Independence Energy Aggregator LP and its affiliates (2) | Independence Energy Aggregator LP and its affiliates (2) | — | | | — | % | | 81,831,695 | | | 69.0 | % | | 81,831,695 | | | 49.0 | % | — | | | — | | — | % | | 51,234,496 | | | 58.2 | | 58.2 | % | | 51,234,496 | | | 28.5 | | 28.5 | % |
KKR Upstream Associates LLC (3) | KKR Upstream Associates LLC (3) | 572,354 | | | 1.2 | % | | 81,831,695 | | | 69.0 | % | | 82,404,049 | | | 49.4 | % | KKR Upstream Associates LLC (3) | 572,354 | | | 0.6 | | 0.6 | % | | 51,234,496 | | | 58.2 | | 58.2 | % | | 51,806,850 | | | 28.8 | | 28.8 | % |
PT Independence Energy Holdings LLC and its affiliates (4)(5) | PT Independence Energy Holdings LLC and its affiliates (4)(5) | 18,262 | | | * | | 36,813,628 | | | 31.0 | % | | 36,831,890 | | | 22.1 | % | PT Independence Energy Holdings LLC and its affiliates (4)(5) | 41,118 | | | * | | * | | 36,813,628 | | | 41.8 | | 41.8 | % | | 36,854,746 | | | 20.5 | | 20.5 | % |
John C. Goff 2010 Family Trust (6)(9) | 8,929,051 | | | 18.5 | % | | — | | | — | % | | 8,929,051 | | | 5.3 | % |
John C. Goff 2010 Family Trust (6)(10) | | John C. Goff 2010 Family Trust (6)(10) | 8,949,408 | | | 9.8 | % | | — | | | — | % | | 8,949,408 | | | 5.0 | % |
The Vanguard Group (7) | The Vanguard Group (7) | 3,943,094 | | | 8.2 | % | | — | | | — | % | | 3,943,094 | | | 2.4 | % | The Vanguard Group (7) | 8,171,426 | | | 8.9 | | 8.9 | % | | — | | | — | | — | % | | 8,171,426 | | | 4.5 | | 4.5 | % |
Teacher Retirement System of Texas (8) | | Teacher Retirement System of Texas (8) | 8,029,515 | | | 8.8 | % | | — | | | — | % | | 8,029,515 | | | 4.5 | % |
BlackRock, Inc. (9) | | BlackRock, Inc. (9) | 6,049,064 | | | 6.6 | % | | — | | | — | % | | 6,049,064 | | | 3.4 | % |
| Directors and Named Executive Officers | Directors and Named Executive Officers | |
John C. Goff (8)(9) | 9,695,799 | | | 20.1 | % | | — | | | — | % | | 9,695,799 | | | 5.8 | % |
John C. Goff (10) | |
John C. Goff (10) | |
John C. Goff (10) | | 9,716,156 | | | 10.6 | % | | — | | | — | % | | 9,716,156 | | | 5.4 | % |
| David C. Rockecharlie | David C. Rockecharlie | 37,000 | | | * | | — | | | — | % | | 37,000 | | | * | David C. Rockecharlie | 100,000 | | | * | | * | | — | | | — | | — | % | | 100,000 | | | * | | * |
| Brandi Kendall | Brandi Kendall | 8,500 | | | * | | — | | | — | % | | 8,500 | | | * | Brandi Kendall | 20,642 | | | * | | * | | — | | | — | | — | % | | 20,642 | | | * | | * |
| John Clayton "Clay" Rynd | John Clayton "Clay" Rynd | 5,000 | | | * | | — | | | — | % | | 5,000 | | | * | John Clayton "Clay" Rynd | 7,000 | | | * | | * | | — | | | — | | — | % | | 7,000 | | | * | | * |
| Benjamin M. Conner | 17,536 | | | * | | — | | | — | % | | 17,536 | | | * |
| Todd N. Falk | Todd N. Falk | 2,350 | | | * | | — | | | — | % | | 2,350 | | | * | Todd N. Falk | 5,000 | | | * | | * | | — | | | — | | — | % | | 5,000 | | | * | | * |
Bo Shi (10) | 4,885 | | | * | | — | | | — | % | | 4,885 | | | * |
| Karen J. Simon | 49,555 | | | * | | — | | | — | % | | 49,555 | | | * |
| Ellis L. McCain | 42,196 | | | * | | — | | | — | % | | 42,196 | | | * |
Bo Shi (12) | | Bo Shi (12) | 24,124 | | | * | | — | | | — | % | | 24,124 | | | * |
Karen J. Simon (11) | | Karen J. Simon (11) | 60,983 | | | * | | — | | | — | % | | 60,983 | | | * |
Ellis L. McCain (11) | | Ellis L. McCain (11) | 53,624 | | | * | | — | | | — | % | | 53,624 | | | * |
| Erich Bobinsky | Erich Bobinsky | — | | | — | % | | — | | | — | % | | — | | | — | % | Erich Bobinsky | — | | | — | | — | % | | — | | | — | | — | % | | — | | | — | | — | % |
| Bevin Brown | Bevin Brown | — | | | — | % | | — | | | — | % | | — | | | — | % | Bevin Brown | — | | | — | | — | % | | — | | | — | | — | % | | — | | | — | | — | % |
Claire S. Farley (9) | 9,131 | | | * | | — | | | — | % | | 9,131 | | | * |
Robert G. Gwin (9) | 9,131 | | | * | | — | | | — | % | | 9,131 | | | * |
| Directors and Executive Officers as a group (13 persons) | 9,881,083 | | | 20.5 | % | | — | | | — | % | | 9,881,083 | | | 5.9 | % |
Claire S. Farley (11) | | Claire S. Farley (11) | 20,559 | | | * | | — | | | — | % | | 20,559 | | | * |
Robert G. Gwin (11) | | Robert G. Gwin (11) | 20,559 | | | * | | — | | | — | % | | 20,559 | | | * |
| Directors and Executive Officers as a group (12 persons) | | Directors and Executive Officers as a group (12 persons) | 10,028,647 | | | 10.9 | % | | — | | | — | % | | 10,028,647 | | | 5.6 | % |
(1)Represents the percentage of voting power of our Class A Common Stock and Class B Common Stock voting together as a single class. OpCo unitholders hold one share of Class B Common Stock for each OpCo Unit that they own. Each share of Class B Common Stock has no economic rights, but entitles the holder thereof to one vote for each share of Class B Common Stock held by such holder. Accordingly, the holders of Class B Common Stock (which are also OpCo unitholders) collectively have the number of votes equal to the number of shares of Class B Common Stock that they hold.
(2) Aggregator L.P. is the direct beneficial owner of the securities reported and is the entity through which certain unaffiliated limited partners and affiliated entities hold their interests in the Company and OpCo. Aggregator GP is the general partner of Aggregator. KKR Upstream Associates LLC is the sole member of Aggregator GP. KKR Group Assets Holdings III L.P. and KKR Financial Holdings LLC are the controlling members of KKR Upstream Associates LLC. KKR Group Assets III GP LLC is the general partner of KKR Group Assets Holdings III L.P. KKR Group Partnership L.P. is the sole member of each of KKR Group Assets III GP LLC and KKR Financial Holdings LLC. KKR Group Holdings Corp. is the general partner of KKR Group Partnership L.P. KKR & Co. Inc. is the sole shareholder of KKR Group Holdings Corp. KKR Management LLP is the Series I preferred stockholder of KKR & Co. Inc. Henry R. Kravis and George R. Roberts are the founding partners of KKR Management LLP. Each of such beneficial owners disclaims beneficial ownership of such securities in excess of their pecuniary interest therein.
(3) KKR Upstream Associates LLC is the direct beneficial owner of the 572,354 shares of Class A Common Stock reported and may be deemed to beneficially own the shares of Class B Common Stock held of record by Aggregator. KKR Group Assets Holdings III L.P. and KKR Financial Holdings LLC are the controlling members of KKR Upstream Associates LLC. KKR Group Assets III GP LLC is the general partner of KKR Group Assets Holdings III L.P. KKR Group Partnership L.P. is the sole member of each of KKR Group Assets III GP LLC and KKR Financial Holdings LLC. KKR Group Holdings Corp. is the general partner of KKR Group Partnership L.P. KKR & Co. Inc. is the sole stockholder of
KKR Group Holdings Corp. KKR Management LLP is the Series I preferred stockholder of KKR & Co. Inc. Henry R.
Kravis and George R. Roberts are the founding partners of KKR Management LLP. Each of such beneficial owners disclaims beneficial ownership of such securities in excess of their pecuniary interest therein.
(4) PT Independence is the direct beneficial owner of the securities reported. Liberty Holdco, a member of PT Independence, has the sole right to vote or dispose of the shares of Class B Common Stock and OpCo LLC Units held by PT Independence. Therefore, Liberty Holdco is deemed to have beneficial ownership of the shares of Class B Common Stock and OpCo LLC Units. The sole member of Liberty Holdco is LMI, which is wholly owned by Liberty Mutual Group Inc. The sole shareholder of Liberty Mutual Group Inc. is LMHC Massachusetts Holdings Inc., whose sole shareholder is Liberty Mutual Holding Company Inc. Because Liberty Mutual Holding Company Inc. is a mutual holding company, its members are entitled to vote at meetings of the company. No such member is entitled to cast 5% or more of the votes.
(5) Includes 18,26222,856 shares of Class A Common Stock underlying RSU awards held by Erich Bobinsky and Bevin Brown granted in respect of service on our Board of Directors that will vest, subject to continued service on our Board, within 60 days of the date hereof. As described in the footnotes to the Director Compensation Table, Mr. Bobinsky and Ms. Brown have agreed to remit any shares of Class A Common Stock received as compensation for service on our Board of Directors to Liberty Holdco.
(6) The address of the principal office of the John C. Goff 2010 Family Trust (“Goff Family Trust”) is 500 Commerce Street, Suite 700, Fort Worth, Texas 76102. John C. Goff is the Sole Trusteesole trustee of Goff Family Trust. Goff Family Trust is the record holder of 2,413,523 shares of Class A Common Stock, and as managing member of GFT Strategies, LLC and sole shareholder of Goff Capital, Inc. and JCG 2016 Management, LLC, may be deemed to beneficially own the shares of Class A Common Stock held of record by those entities.
(7) The address of The Vanguard Group is 100 Vanguard Boulevard, Malvern, Pennsylvania 19355.
(8)The address of Teacher Retirement System of Texas is 1000 Red River Street, Austin, Texas 78701.
(9) The address of BlackRock, Inc. is 50 Hudson Yards, New York, New York 10001.
(10) Includes 20,357 shares of Class A Common Stock underlying RSU awards granted as compensation in respect of service on our Board of Directors that will vest, subject to Mr. Goff's continued service on our Board, within 60 days of the date hereof. John C. Goff is the record holder of 714,357 shares of Class A Common Stock, and as a manager of Goff Focused Strategies, LLC, the sole board member of The Goff Family Foundation, and the sole trustee of the Goff Family Trust, which is the managing member of GFT Strategies, LLC and the sole shareholder of Goff Capital, Inc. and JCG 2016 Management, LLC, he may be deemed to beneficially own the shares of Class A Common Stock held of record by those entities.
(9)(11) Includes 9,13111,428 shares of Class A Common Stock underlying RSU awards granted as compensation in respect of service on our Board of Directors that will vest, subject to continued service on our Board, within 60 days of the date hereof.
(10)(12) Includes 2,4355,530 shares of Class A Common Stock underlying RSU awards that will vest, subject to continued employment, within 60 days of the date hereof.
* less than 1%
Equity Compensation Plan Information
The following table provides information with respect to the shares of our Class A Common Stock that may be issued under our existing equity compensation plans as of December 31, 2022.2023.
| | Plan Category(1) | Number of shares of Class A Common Stock to be issued upon exercise of outstanding options, warrants and rights | Weighted-average exercise price of outstanding options, warrants and rights(4) | Number of shares of Class A Common Stock remaining available for future issuance under equity compensation plans (excluding securities reflected in column (a)) |
| (a) | (b) | (c) |
| Plan Category | | Plan Category | Number of shares of Class A Common Stock to be issued upon exercise of outstanding options, warrants and rights | Weighted-average exercise price of outstanding options, warrants and rights (3) | Number of shares of Class A Common Stock remaining available for future issuance under equity compensation plans (excluding securities reflected in column (a)) |
| (a) | | | (a) | (b) | (c) |
| Equity compensation plans approved by security holders | Equity compensation plans approved by security holders | | |
| None | — | | $ | — | | |
| Crescent Energy Company 2021 Equity Incentive Plan | |
| Crescent Energy Company 2021 Equity Incentive Plan | |
| Crescent Energy Company 2021 Equity Incentive Plan | | 388,696 | $ | — | | 2,870,195 |
Equity compensation plans not approved by shareholders | Equity compensation plans not approved by shareholders | | |
Crescent Energy Company 2021 Manager Incentive Plan (2) | 4,939,523 (3) | $ | — | | — | |
Crescent Energy Company 2021 Equity Incentive Plan | 130,334 | $ | — | | 731,015 | |
Crescent Energy Company 2021 Manager Incentive Plan (1) | |
Crescent Energy Company 2021 Manager Incentive Plan (1) | |
Crescent Energy Company 2021 Manager Incentive Plan (1) | |
| Total | Total | 5,069,857 | | $ | — | | 731,015 | | Total | 5,327,676 | $ | — | | 2,870,195 | 2,870,195 |
(1)In connection with the Merger Transactions, the Contango Incentive Plan was assumed by the Company, but no future awards will be made under the Contango Incentive Plan. In accordance with Instruction 5 to Item 201(d) of Regulation S-K, the Contango Incentive Plan is not included in the Equity Compensation Plan Information Table. Pursuant to the terms of the Transaction Agreement, all awards that were outstanding under the Contango Incentive Plan vested and were settled following the closing of the Merger Transactions and, as such, there are no awards outstanding under the Contango Incentive Plan. No shares of our Class A Common Stock remain available for issuance under the Contango Incentive Plan.
(2)The Manager Incentive Plan contains a formula for calculating the number of securities available for issuance under the Manager Incentive Plan. Pursuant to such formula, the total number of shares of our Class A Common Stock reserved for issuance under the Manager Incentive Plan is equal to the sum of (i) 4,306,745, plus (ii) on January 1 of each calendar
year that occurs before the tenth anniversary of the effective date of the Manager Incentive Plan, 10% of the additional Class A Common Stock issued, if any, during the immediately preceding calendar year.
(3)(2)The amount reported in this row represents the maximum number of shares issuable in respect of the Incentive Compensation. The exact number of shares of Class A Common Stock covered by the Incentive Compensation will not be determinable until the Incentive Compensation vests and is settled. However, the number of shares issuable in respect of the Incentive Compensation is limited by the number of shares available for issuance under the Manager Incentive Plan, which was equal to 4,939,5234,938,980 as of December 31, 2022.2023. If the performance goals applicable to the Incentive Compensation became earned at target performance as of December 31, 2022, 4,828,2162023, 9,160,880 shares of Class A Common Stock would have become earned. If the Incentive Compensation became earned at a level in excess of the Class A Common Stock reserved for issuance under the Manager Incentive Plan, such excess would be settled in cash. For more information on the Incentive Compensation see the narrative disclosure following this table and the disclosure included elsewhere under the headings “Items 1 and 2. Business and Properties—Management Agreement.”
(4)(3)All outstanding awards under the Manager Incentive Plan and the Equity Incentive Plan represent restricted stock units subject to time- or performance-based vesting, which do not have an exercise price.
A descriptionDescriptions of the material terms of the Equity Incentive Plan and the Manager Incentive Plan inare included herein under the heading “Item 11. Executive Compensation— Equity-Based Compensation,” which descriptions are incorporated to this Equity Compensation Plan Information disclosure by reference.
Item 13. Certain Relationships and Related Transactions, and Director Independence
Policies and Procedures for Review of Related Party Transactions
A “Related Party Transaction” is a transaction, arrangement or relationship, or any series of similar transactions, arrangements or relationships, in which we or any of our subsidiaries was, is or will be a participant, the amount of which involved will or may be expected to exceed $120,000, and in which any Related Person had, has or will have a direct or indirect material interest. A “Related Person” means:
•a person who is or was (since the beginning of the Company’s last completed fiscal year, even if they do not presently serve in that role) a director or director nominee of the Company;
•a person who is or was (since the beginning of the Company’s last completed fiscal year, even if they do not presently serve in that role) a senior officer of the Company, which, among others, includes each vice president and officer of the Company that is subject to reporting under Section 16 of the Exchange Act;
•any holder of the Company’s Series I Preferred Stock (a “Preferred Holder”);
•a greater than 5% beneficial owner of any class of the Company’s voting stock (a “5% Stockholder”);
•a person who is an immediate family member of any of the foregoing persons, which means any child, stepchild, parent, stepparent, spouse, sibling, mother-in-law, father-in-law, son-in-law, daughter-in-law, brother-in-law, or sister-in-law of a director, director nominee, senior officer or 5% Stockholder of Preferred Holder, and any person (other than a tenant or employee) sharing the household of the director, director nominee, senior officer or 5% Stockholder or Preferred Holder; or
•an entity that is owned or controlled by someone listed above, an entity in which someone listed above has a substantial ownership interest or control of the entity, or an entity which someone listed above is an executive officer or general partner, or holds a similar position.
Our Related Party Transactions Policy (the “RPT Policy”) was adopted by our Board of Directors in December 2021. The RPT Policy requiredrequires that, prior to entering into a Related Party Transaction, the Audit Committee shall review the material facts of the proposed transaction in advance. If advance Audit Committee review and approval of a Related Party Transaction is not feasible, then such Related Party Transaction will be reviewed and considered and, if the Audit Committee determines it to be appropriate and not inconsistent with the interests of the Company and its stockholders, ratified at the Audit Committee’s next regularly scheduled meeting. In determining whether to approve or ratify such a Related Party Transaction, the Audit Committee will take into account, among other factors it deems appropriate, (1) whether the Related Party Transaction is on terms no less favorable than terms generally available to an unaffiliated third-party under the same or similar circumstances, (2) the extent of the Related Person’s interest in the transaction and (3) whether the Related Party Transaction is material to the Company.
Unless otherwise stated, each of the Related Party Transactions discussed below were authorized or consummated prior to our adoption of the RPT Policy.
Agreements Related to the Merger Transactions
OpCo Limited Liability Company Agreement
On December 7, 2021, in connection with the closing of the Merger Transactions, the Company and Independence’s prior owners entered into the OpCo LLC Agreement.
Pursuant to the OpCo LLC Agreement, each OpCo unitholder other than the Company and the Company Group will, subject to certain limitations, have the right, pursuant to a redemption right specified in the OpCo LLC Agreement (the "Redemption Right"), to cause OpCo to redeem all or a portion of its OpCo Units for (i) a corresponding number of shares of the Class A Common Stock, subject to conversion rate adjustments for stock splits, stock dividends, and reclassifications, or (ii) an approximately equivalent amount of cash as determined pursuant to the terms of the OpCo LLC Agreement. Alternatively, upon the exercise of the Redemption Right by an OpCo unitholder, the Company Group will have the right, pursuant to a call right specified in the OpCo LLC Agreement (the "Call Right"), to acquire each tendered OpCo Unit directly from such OpCo unitholder for, at the Company’s election, (i) one share of Class A Common Stock, subject to conversion rate adjustments for stock splits, stock dividends and reclassification and other similar transactions, or (ii) an approximately equivalent amount of cash as determined pursuant to the terms of the OpCo LLC Agreement.
In addition, subject to certain exceptions, once the Company Group holds at least 95% of the OpCo Units, the Company Group will have the right to effect the redemption of all of the OpCo Units held by each member of OpCo (other than the members of the Company Group). In connection with any redemption of OpCo Units pursuant to the Redemption Right (or an acquisition of OpCo Units by the Company Group pursuant to the Call Right), the corresponding number of shares of Class B Common Stock will be cancelled.
Registration Rights Agreement
On December 7, 2021, in connection with the closing of the Merger Transactions, the Company entered into a Registration Rights Agreement (the “Registration Rights Agreement”) with holders associated with Independence’s former owners and John C. Goff (collectively, the “Holders”), relating to the registered resale of Class A Common Stock owned by such parties as of that date (the “Registrable Securities”). Under the Registration Rights Agreement, the Company has agreed to use its reasonable best efforts to obtain the effectiveness of a registration statement following its receipt of written request by a Holder of Registrable Securities. In January 2023, the Company registered the resale of 128,927,826 shares of our Class A Common Stock (including shares of Class A Common Stock to be issued upon redemption of a corresponding number of Class B Common Stock) by certain selling stockholders pursuant to the Registration Rights Agreement.
The Holders will also have “piggyback” registration rights exercisable at any time that allow them to include the shares of the Class A Common Stock that they own in certain registrations initiated by the Company or other holders of Class A Common Stock. Independence’s former owners also have customary rights to effect certain shelf take-downs, underwritten offering and block trades. The Registration Rights Agreement will terminate at such time as there are no Registrable Securities outstanding.
Management Agreement
In connection with the Merger Transactions, we entered into a management agreement (the "Management Agreement") with KKR Energy Assets Manager LLC (the "Manager"). Pursuant to the Management Agreement, the Manager provides the Company with its senior executive management team and certain management services. The Management Agreement has an initial term of three years and shall renew automatically at the end of the initial term for an additional three-year period unless the Company or the Manager elects not to renew the Management Agreement.
As consideration for the services rendered pursuant to the Management Agreement and the Manager’s overhead, including compensation of the executive management team, the Manager is entitled to receive compensation ("Management CompensationCompensation") on a quarterly basis equal to our pro rata share (based on our relative ownership of OpCo) of $53.3 million.an annual $55.5 million fee. This amount will increase over time as our ownership percentage of OpCo increases. In addition, as our business and assets expand, Management Compensation may increase by an amount equal to 1.5% per annum of the net proceeds from all future issuances of our equity securities (including in connection with acquisitions). However, incremental Management Compensation will not apply to the issuance of our shares upon the redemption or exchange of OpCo Units. During the yearsyear ended December 31, 2022 and 2021,2023, we recorded general and administrative expense of $14.3$23.8 million and $0.9 million, respectively, and made cash distributions of
$32.3 millionin December 31, 2022 $33.2 million to our redeemable noncontrolling interests related to the Management Agreement. We did not make any cash distributions to our redeemable noncontrolling interest during the year ended December 31, 2021. In addition, at December 31, 2022 and 20212023, we accrued $13.3 million and $3.6$13.9 million, included within Accounts payable - affiliates on the consolidated balance sheets, for distributions to our redeemable noncontrolling interests in OpCo related to the Management Agreement which will be paid during the first quarter of 2023.2024.
Additionally, the Manager is entitled to receive incentive compensation ("Incentive CompensationCompensation") under which the Manager is targeted to receive 10% of our outstanding Class A Common Stock based on the achievement of certain performance-based measures. The Incentive Compensation consists of five tranches that settle over a five-year period beginning in 2024, and each tranche relates to a target number of shares of Class A common stock equal to 2% of the outstanding Class A common stock as of the time such tranche is settled. So long as the Manager continuously provides services to us until the end of the performance period applicable to a tranche, the Manager is entitled to settlement of such tranche with respect to a number of shares of Class A common stock ranging from 0% to 4.8% of the of the outstanding Class A Common Stock at the time each tranche is settled. During the year ended December 31, 2022 and 2021,2023, we recorded general and administrative expense of $24.3$68.0 million and $1.1 million respectively, related to the Incentive Compensation. See NOTE 13 – Incentive Compensation Arrangements in the notes"Notes to our Combined and Consolidated Financial Statements—NOTE 13 – Equity-Based Compensation Awards" in "Part II., Item 8. Financial Statements included elsewhere inand Supplementary Data" of this Annual Report for more information.
KKR Funds
From time to time, we may invest in upstream oil and gas assets alongside EIGF II and/or other KKR Fundsfunds ("KKR Funds") pursuant to the terms of the Management Agreement. In these instances, certain of our consolidated subsidiaries enter into Master Service Agreements ("MSA") with entities owned by KKR Funds, pursuant to which our subsidiaries provide certain services to such KKR Funds, including the allocation of the production and sale of oil, natural gas and NGLs, collection and disbursement of revenues, operating expenses and general and administrative expenses in the respective oil and natural gas properties, and the payment of all capital costs associated with the ongoing operations of the oil and natural gas assets. Our subsidiaries settle balances due to or due from KKR Funds on a monthly basis. The administrative costs associated with these MSAs are allocated by us to KKR Funds based on (i) an actual basis for direct expenses we may incur on their behalf or (ii) an
allocation of such charges between the various KKR Funds based on the estimated use of such services by each party. As of December 31, 2022 and 2021,2023, we had a related party receivable of $0.8 million and $3.3$0.1 million included within Accounts receivable – affiliates and $14.0 million and $3.4a related party payable of $27.9 million included within Accounts payable – affiliates on our consolidated balance sheets associated with KKR Funds transactions.
Secondary OfferingKKR Capital Markets LLC ("KCM")
During the year ended December 31, 2022,We engage KCM, an affiliate of KKR Group, received $1.3for capital market transactions including notes offerings, credit facility structuring and equity offerings. We paid $5.2 million in underwriterfees, discounts and commissions to KCM in connection with our debt and equity transactions during the Offering. Concurrently with the closing of the Offering, we repurchased an aggregate of approximately 2.6 million OpCo Units from PT Independence for $36.2 million and cancelled a corresponding number of our Class B Common Stock. Refer to further discussion in NOTE 1 – Organization and Basis of Presentation regarding the Equity Transactions.
Chama
In February 2022, we contributed all the assets and prospects in the Gulf of Mexico formerly owned by Contango to Chama, an entity in which we retain an interest of approximately 9.4%. Such interest is valued at approximately $3.75 million. John Goff, the Chairman of our Board of Directors, holds an interest of approximately 17.5% in Chama, and the remaining interest is held by other investors. Pursuant to the Limited Liability Company Agreement of Chama, we may be required to fund certain workover costs and we will be required to fund plugging and abandonment costs related to producing assets held by Chama (collectively, “Crescent Contributions”). We will receive 90.0% of cash flows from the producing assets, which amount is increased for any Crescent Contributions.year ended December 31, 2023.
Other Transactions
In February 2023, we incurred $1.1 million in fees to KCM in connection with the issuance of the 2028 Notes.
During the year ended December 31, 2022, we incurred $0.7 million in fees to KCM in connection with their role as book-running manager of the Additional 2026 Notes (as defined in NOTE 8 – Debt). We recorded these fees as debt issuance costs within Long-term debt on the consolidated balance sheets. Additionally, we paid $1.5 million in fees to KCM related to the amendment to our Revolving Credit Facility, which increased our borrowing base and elected commitment amount in connection with the Uinta Transaction. We recorded these fees as debt issuance costs within Other assets on the consolidated balance sheets. See NOTE 8 – Debt.
During the year ended December 31, 2021,2023, we paid $1.6 million in fees to KCM, for services provided as a book-running manager in connection with the issuancemade cash distributions of our 2026 Notes in May 2021 and recorded as debt issuance costs within Long-term debt on the consolidated balance sheets. Additionally, we paid $0.1$0.8 million to KKR Capstone Americas LLC for professional fees supportour redeemable noncontrolling interests related to insurancetheir pro rata share of cash distributions made to Crescent Energy Company to pay income taxes. In addition, we reimburse KKR for any costs incurred on our behalf. At December 31, 2023 we had $1.3 million accrued within Accounts payable - affiliates for reimbursable costs and employee benefits due diligence and placement and recorded as General and administrative expense ondistributions to our redeemable noncontrolling interests for their pro rata share of taxes which will be paid during the combined and consolidated statementsfirst quarter of operations.2024.
During the year ended December 31, 2022, we made cash distributions of $18.1 million to our redeemable noncontrolling interests related to their pro rata share of cash distributions made to Crescent Energy Company to pay income taxes. At December 31, 2022, we had $0.1 million accrued within Accounts payable - affiliates for distributions to our redeemable noncontrolling interests in OpCo related to their pro rata share of taxes which will bewas paid during the first quarter of 2023.
During the year ended December 31, 2023, we signed a ten-year office lease with an affiliate of Crescent Real Estate LLC. John C. Goff, the Chairman of our Board of Directors, is affiliated with Crescent Real Estate LLC. The terms of the lease provide for annual base rent of approximately $0.3 million, increasing over the term of the lease, and the payment by one of our subsidiaries of certain other customary expenses. Upon lease commencement in April 2023, we recorded a $2.4 million right-of-use asset in Other assets, an operating lease liability of $0.1 million in Other current liabilities and $2.3 million in Other liabilities on the consolidated balance sheets. During the first quarter of 2024, we entered into an amendment to the original lease agreement for additional office space. Under the amended agreement our annual base rent is $0.4 million increasing to $0.5 million over the life of the agreement.
Item 14. Principal Accounting Fees and Services
Our independent registered public accounting firm is Deloitte & Touche LLP, Houston, Texas, Auditor Firm ID: 34.
Aggregate fees for professional services rendered for the Company by Deloitte & Touche LLP for the years ended December 31, 20222023 and 2021,2022 are presented in the following table.
| | 2022 | | 2021 |
| (in thousands) |
| 2023 | | | 2023 | | 2022 |
| (in thousands) | | | (in thousands) |
| Audit fees | Audit fees | $ | 3,350 | | | $ | 2,360 | |
| Audit-related fees | Audit-related fees | 190 | | | 275 | |
| Tax fees | Tax fees | 2,055 | | | 2,103 | |
| | Total | Total | $ | 5,595 | | | $ | 4,738 | |
| Total | |
| Total | |
As presented in the preceding table, “Audit fees” represent amounts billed for each year in connection with (i) the annual audit of our consolidated financial statements filed on Form 10-K and related internal controls over financial reporting and (ii) the quarterly review of our consolidated financial statements filed on Form 10-Q and (iii) those10-Q. "Audit-related fees" represent amounts for services normally provided by Deloitte & Touche in connection with our statutory and regulatory filings or engagements, including comfort letters, consents and other services related to SEC matters. We are prohibited from using Deloitte & Touche to perform general bookkeeping, human resources or management functions for us, and any other service not permitted by the PCAOB. "Tax fees" represent amounts for services rendered for tax compliance. All fees presented were approved by the Audit Committee in accordance with its pre-approval policy. We did not engage Deloitte & Touche to perform any other services for us during the last two years.
The Audit Committee has determined that Deloitte & Touche LLP is independent for purposes of providing external audit services to the Company.
Audit Committee Policy for Pre-Approval of Audit, Audit-Related, Tax and Permissible Non-Audit Services
The Audit Committee has adopted procedures for pre-approving all audit and non-audit services provided by its independent accounting firm. These procedures include reviewing fee estimates for audit services and permitted recurring non-audit services, and authorizing the PartnershipCompany to execute letter agreements setting forth such fees. Audit Committee approval is required for any services to be performed by the independent accounting firm that are not specified in the letter agreements. The Audit Committee has delegated approval authority to the chairman of the Audit Committee, but any exercises of such authority are reported to the Audit Committee at the next meeting.
Part IV
Item 15. Exhibits, and Financial Statement Schedules
(a) Financial statements and financial statement schedules filed as part of this report are listed in the index included in "Part II., Item 8. Financial Statements and Supplementary Data" of this Annual Report. All valuation and qualifying accounts schedules
have been omitted because they are either not material, not required, not applicable or the information required to be presented is included in our combined and consolidated financial statements and related notes.
(b) Exhibits. The following is a list of exhibits required to be filed as a part of this Annual Report in Item 15(b).
| | | | | |
| Exhibit No. | Description |
2.12.1# | |
2.22.2# | |
| 2.3# | |
| 2.4*# | |
| 2.5*# | |
| 3.1 | |
| 3.2 | |
| 4.1 | |
| 4.2 | |
| 4.3 | |
| 4.4 | |
| 4.5 | |
| 4.6 | |
| 4.7 | |
| 4.8 | |
| | | | | |
| Exhibit No. | Description |
| 4.9 | |
| 4.10 | |
4.10*4.11 | SixthFirst Supplemental Indenture, dated as of March 6,July 20, 2023, among Crescent Energy Finance LLC, the guarantors named therein,therein, and U.S. Bank Trust Company, National Association, as trustee.trustee (incorporated by reference to Exhibit 4.2 to the Company's Current Report on Form 8-K, filed with the Securities and Exchange Commission on July 21, 2023). |
| 4.12 | |
| 4.13 |
|
| 10.1 | |
| 10.2 | |
| | | | | |
Exhibit No. | Description |
| 10.3 | |
| 10.4 | |
| 10.5† | |
| 10.6† | |
| 10.7† | |
| 10.8† | |
| 10.9† | |
10.9†10.10† | |
10.10†10.11† | |
10.11†10.12† | |
10.12†10.13† | |
10.13†10.14† | |
10.14† | |
| 10.15† | |
| | | | | |
| Exhibit No. | Description |
| 10.16† | |
| 10.17† | |
| 10.18† | |
| 10.19† | |
| 10.20† | |
| 10.21† | |
| 10.22† | |
| 10.23† | |
| 10.24 | |
| 10.25 | |
| 10.26 | Second Amendment to Credit Agreement, dated March 30, 2022, by and among Crescent Energy Company, certain subsidiaries of Crescent Energy Company, as guarantors, Wells Fargo Bank, National Association, as administrative agent, and the other lenders party thereto (incorporated by reference to Exhibit 10.1 to the Company's Current Report on Form 8-K, filed with the Securities and Exchange Commission on April 8, 2022). |
| | | | | |
Exhibit No. | Description |
| 10.27 | Third Amendment to Credit Agreement, dated March 30, 2022, by and among Crescent Energy Company, certain subsidiaries of Crescent Energy Company, as guarantors, Wells Fargo Bank, National Association, as administrative agent, and the other lenders party thereto (incorporated by reference to Exhibit 10.2 to the Company's Current Report on Form 8-K, filed with the Securities and Exchange Commission on April 8, 2022). |
| 10.28 | Fourth Amendment to Credit Agreement, dated as of September 23, 2022, among Crescent Energy Finance LLC, certain subsidiaries of Crescent Energy Company, as guarantors, Wells Fargo Bank, National Association, as administrative agent, and the other lenders party thereto (incorporated by reference to Exhibit 10.1 to the Company's Current Report on Form 8-K, filed with the Securities and Exchange Commission on September 29, 2022). |
| 10.29 | Fifth Amendment to Credit Agreement, dated July 3, 2023, by and among Crescent Energy Finance LLC, certain subsidiaries of Crescent Energy Finance LLC, as guarantors, Wells Fargo Bank, National Association, as administrative agent, collateral agent and a letter of credit issuer, and the other lenders and letter of credit issuers party thereto (incorporated by reference to Exhibit 10.1 to the Company's Current Report on Form 8-K, filed with the Securities and Exchange Commission on July 10, 2023). |
| 10.3 | Sixth Amendment to Credit Agreement, dated December 13, 2023, by and among Crescent Energy Finance LLC, certain subsidiaries of Crescent Energy Finance LLC, as guarantors, Wells Fargo Bank, National Association, as administrative agent, collateral agent and a letter of credit issuer, and the other lenders and letter of credit issuers party thereto(incorporated by reference to Exhibit 10.1 to the Company's Current Report on From 8-K, filed with the Securities and Exchange Commission on December 13, 2023). |
| 21.1* | |
| 23.1* | |
| 23.2* | |
23.3* | |
23.4* | |
23.5* | |
23.6* | |
| 31.1* | |
| 31.2* | |
| 32.1** | |
| 97.1* | |
| 99.1 | |
| 101.INS** | XBRL Instance Document. |
| 101.SCH** | XBRL Schema Document. |
| | | | | |
| Exhibit No. | Description |
| 101.CAL** | XBRL Calculation Linkbase Document. |
| 101.LAB** | XBRL Label Linkbase Document. |
| 101.PRE** | XBRL Presentation Linkbase Document. |
| 101.DEF** | XBRL Definition Linkbase Document. |
| 104** | Cover Page Interactive Data File (formatted as Inline XBRL and contained in Exhibit 101). |
* Filed herewith
** These files are furnished and deemed not filed or part of a registration statement or prospectus for purposes of Sections 11 or 12 of the Securities Act of 1933, as amended, are deemed not filed for purposes of Section 18 of the Securities Act of 1934, as amended, and otherwise are not subject to liability under those sections.
† Management contract or compensatory plan or agreement
# Certain annexes, schedules and exhibits have been omitted pursuant to Item 601(a)(5) of Regulation S-K. The Company hereby undertakes to furnish supplemental copies of any of the omitted annexes, schedules and exhibits upon request by the U.S. Securities and Exchange Commission.
Item 16. Form 10-K Summary
None.
Signatures
Pursuant to the requirements of Section 13 or 15(d) of the Securities Exchange Act of 1934, the registrant has duly caused this report to be signed on its behalf by the undersigned, thereunto duly authorized, on March 7, 2023.4, 2024.
| | |
| CRESCENT ENERGY COMPANY |
| (Registrant) |
|
| /s/ David Rockecharlie |
| David Rockecharlie |
| Chief Executive Officer |
Pursuant to the requirements of the Securities Exchange Act of 1934, this report has been signed below by the following persons on behalf of the registrant and in the capacities indicated on March 7, 2023.4, 2024.
| | | | | | | | |
| /s/ David Rockecharlie | | Chief Executive Officer and Director |
| David Rockecharlie | | (Principal Executive Officer) |
| | |
| /s/ Brandi Kendall | | Chief Financial Officer and Director |
| Brandi Kendall | | (Principal Financial Officer) |
| | |
| /s/ Todd Falk | | Chief Accounting Officer |
| Todd Falk | | (Principal Accounting Officer) |
| | |
| /s/ John C. Goff | | Chairman of the Board and Director |
| John C. Goff | | |
| | |
| /s/ Robert G. Gwin | | Director |
| Robert G. Gwin | | |
| | |
| /s/ Claire S. Farley | | Director |
| Claire S. Farley | | |
| | |
| /s/ Erich Bobinsky | | Director |
| Erich Bobinsky | | |
| | |
| /s/ Ellis L. "Lon" McCain | | Director |
| Ellis "Lon" McCain | | |
| | |
| /s/ Bevin Brown | | Director |
| Bevin Brown | | |
| | |
| /s/ Karen Simon | | Director |
| Karen Simon | | |
| | |