UNITED STATES SECURITIES AND EXCHANGE COMMISSION
Washington, D.C. 20549
FORM 10-K/A10-K
Annual Report Pursuant to Section 13 or 15(d) of
The Securities Exchange Act of 1934
For the fiscal year ended Commission file number 0-5534
December 31, 20112012
BALDWIN & LYONS, INC.
(Exact name of registrant as specified in its charter)
Indiana (State or other jurisdiction of Incorporation or organization) | 35-0160330 (I.R.S. Employer Identification No.) |
1099 North Meridian Street, Indianapolis, Indiana (Address of principal executive offices) | 46204 (Zip Code) |
Registrant's telephone number, including area code: (317) 636-9800
Securities registered pursuant to Section 12(b) of the Act: None
Securities registered pursuant to Section 12(g) of the Act:
(Title of class)
Class A Common Stock, No Par Value
Class B Common Stock, No Par Value
Indicate by check mark if the registrant is a well-known seasoned issuer, as defined in Rule 405 of the Securities Act.
Yes ___ No ü
Indicate by check mark if the registrant is not required to file reports pursuant to Section 13 or Section 15(d) of the Act.
Yes ___ No ü
Indicate by check mark whether the registrant (1) has filed all reports required to be filed by Section 13 or 15(d) of the Securities Exchange Act of 1934 during the preceding 12 months (or for such shorter periods that the registrant was required to file such reports), and (2) has been subject to such filing requirements for the past 90 days. Yes ü No ___
Indicate by check mark if disclosure of delinquent filers pursuant to Item 405 of Regulation S-K is not contained herein, and will not be contained, to the best of registrant's knowledge, in definitive proxy or information statements incorporated by reference in Part III of this Form 10-K or any amendment to this Form 10-K._____10-K. ü
Indicate by check mark whether the registrant is a large accelerated filer, an accelerated filer, or a non-accelerated filer. See definition of “accelerated filer and large accelerated filer” in Rule 12b-2 of the Exchange Act.
Large accelerated filer ____ Accelerated filer ü Non-accelerated filer ____
Indicate by check mark whether the registrant is a shell company (as defined in Rule 12b-2 of the Act). Yes ___ No ü
The aggregate market value of Class A and Class B Common Stock held by non-affiliates of the Registrant as of June 30, 2011,2012, based on the closing trade prices on that date, was approximately $199,155,221.$212,152,000.
The number of shares outstanding of each of the issuer's classes of common stock as of March 1, 2012:2013:
Common Stock, No Par Value: Class A (voting) 2,623,109 shares
Class B (nonvoting) 12,225,34812,290,035 shares
The Index to Exhibits is located on pages 83 and 84.
DOCUMENTS INCORPORATED BY REFERENCE
Portions of the Proxy Statement for Annual Meeting of Shareholders to be held on May 8, 20127, 2013 are incorporated by reference into Part III.
- 1 -
Item 1. BUSINESS
Baldwin & Lyons, Inc. was incorporated under the laws of the State of Indiana in 1930. Through its divisions and subsidiaries, Baldwin & Lyons, Inc. (referred to herein as "B&L") engages in marketing and underwriting property and casualty insurance and the assumption of property and casualty reinsurance.
B&L’s principal subsidiaries are:
| 1. | Protective Insurance Company (referred to herein as "Protective"), which is licensed by insurance authorities in all 50 states, the District of Columbia and all Canadian provinces; |
| 2. | Protective Specialty Insurance Company (referred to herein as “Protective Specialty”), which is currently approved for excess and surplus lines business by insurance authorities in 47 states and the District of Columbia and licensed in Indiana; |
| 3. | Sagamore Insurance Company (referred to herein as "Sagamore"), which is licensed by insurance authorities in 49 states and the District of Columbia and approved for excess and surplus lines business in one additional state; |
| 4. | B&L Brokerage Services, Inc., (referred to herein as "BLBS"), an Indiana domiciled insurance broker licensed in all 50 states and the District of Columbia; and |
| 5. | B&L Insurance, Ltd. (referred to herein as "BLI"), which is domiciled and licensed in Bermuda. |
Protective, Protective Specialty, Sagamore and BLI are collectively referred to herein as the "Insurance Subsidiaries." The "Company", as used herein, refers to Baldwin & Lyons, Inc. and all its subsidiaries unless the context clearly indicates otherwise.
Approximately 77% of the gross direct property and casualty insurance premiums written by the Insurance Subsidiaries during 2012 were attributable to business produced directly or indirectly by B&L. The remaining 23% of the gross direct property and casualty insurance premiums written during 2012 was originated through an extensive network of independent agents on both a retail and wholesale basis and through a limited number of arrangements with managing general agencies.
The Insurance Subsidiaries share (referred to as ceding) portions of their gross premiums written with several non-affiliated reinsurers under excess of loss and quota-share treaties covering predetermined groups of risks and by facultative (individual policy-by-policy) placements. Reinsurance is ceded to spread the risk of loss among several reinsurers and is an integral part of the Company’s business.
The Insurance Subsidiaries serve a variety of specialty markets as follows:
Fleet Transportation
The Insurance Subsidiaries provide coverage for larger companies in the motor carrier industry which retain substantial amounts of self-insurance, for independent contractors utilized by trucking companies, for medium-sized and small trucking companies on a first dollar or small deductible basis and for public livery concerns, principally covering fleets of commercial buses. This Amendment No. 1group of products is collectively referred to Form 10-K (“Amendment”) amendsas fleet transportation. Large fleet trucking products are marketed largely by the Annual Report on Form 10-KB&L agency organization directly to fleet transportation clients but also through relationships with non-affiliated brokers and specialized independent agents. The principal types of fleet transportation insurance marketed by the Insurance Subsidiaries are:
| - | Commercial motor vehicle liability, physical damage and other liability insurance. |
| - | Workers' compensation insurance. |
| - | Specialized accident (medical and indemnity) insurance for independent contractors. |
| - | Non-trucking motor vehicle liability insurance for independent contractors. |
| - | Fidelity and surety bonds. |
| - | Inland Marine consisting principally of cargo insurance. |
| - | “Captive” insurance company products, which are provided through BLI in Bermuda. |
- 2 -
B&L also performs a variety of additional services, primarily for the fiscalCompany’s insureds, including risk surveys and analyses, safety program design and monitoring, government compliance assistance, loss control and cost studies and research, development, and consultation in connection with new insurance programs including development of computerized systems to assist customers in monitoring their accident data. Extensive claims handling services are also provided, primarily to clients with self-insurance programs.
Reinsurance Assumptions
The Company accepts cessions and retrocessions from selected insurance and reinsurance companies, providing reinsurance coverage for both property and casualty events.
Approximately 63% of net reinsurance premium earned in 2012 was related to property coverages, principally reinsuring against catastrophic events. Property reinsurance premium for 2012 was split roughly evenly between business produced through a small number of retrocessions with Lloyds of London syndicates and that produced through an exclusive managing general agency partnership. Property reinsurance is concentrated in upper layers of coverage so that only major catastrophic events would be expected to have a material impact on the Company’s operations or financial position.
The remaining 37% of net reinsurance premium earned during 2012 relates to domestic professional liability coverages provided to small and medium sized insurance companies and produced through a network of independent brokers.
In addition to the assumption of risks described above, the Insurance Subsidiaries participate in numerous mandatory government-operated reinsurance pools which require insurance companies to provide coverages on assigned risks. These assigned risk pools allocate participation to all insurers based upon each insurer's portion of direct premium writings on a state or national level. Assigned risk premium typically comprises less than 1% of gross direct premium written and assumed by the Insurance Subsidiaries and are included with the property and casualty segment because they are linked to direct premiums written and earned.
Private Passenger Automobile Insurance
The Company markets private passenger automobile liability and physical damage coverages to individuals through a network of independent agents in thirty states.
Professional Liability
The Company markets a wide variety of professional liability products through wholesale and retail agents on both an admitted and surplus lines basis throughout the United States, specializing in smaller insureds.
Commercial Property and Business Owners Liability
During the period 2009 to 2012, the Company marketed commercial property and business owners liability coverages on a limited basis through a managing general agent in the state of Florida. This business has been discontinued with all inforce policies expiring in May, 2013.
Property/Casualty Losses and Loss Adjustment Expenses
Losses and loss adjustment expenses incurred typically comprise nearly two-thirds of the Company’s operating expenses. A discussion of this expense category follows.
The consolidated balance sheets include the estimated liability for unpaid losses and loss adjustment expenses ("LAE") of the Insurance Subsidiaries before the application of reinsurance credits (gross reserves). The liabilities for losses and LAE are determined using case basis evaluations and statistical projections and represent estimates of the Company’s ultimate net exposure for all unpaid losses and LAE incurred through December 31 of each year. These estimates are subject to the effects of trends in claim severity and frequency and are continually reviewed and, as experience develops and new information becomes known, the liability is adjusted as necessary. Such adjustments, either positive or negative, are reflected in current operations as recorded.
- 3 -
The Company’s reserves for losses and loss expenses are determined based on evaluations of individual reported claims and by actuarial estimation processes using historical experience, current economic information and, when necessary, available industry statistics. Reserves are evaluated in three basic categories (1) “case basis”, (2) “incurred but not reported” and (3) “loss adjustment expense” reserves. Case basis loss reserves, which comprise approximately 69% of total gross reserves at December 31, 2012, are established for specific known loss occurrences at amounts dependent upon criteria such as type of coverage, severity of injury or property damage and the underlying policy limits, as examples. Case basis reserves are estimated by experienced claims adjusters using established Company guidelines and are monitored by claims management. Incurred but not reported reserves, which are established for those losses which have occurred, but have not yet been reported to the Company, are computed on a “bulk” basis and comprise approximately 24% of total gross reserves at December 31, 2012. Common actuarial methods are employed in the establishment of incurred but not reported loss reserves using Company historical loss data, consideration of changes in the Company’s business and study of current economic trends affecting ultimate claims costs. Loss adjustment expense reserves, or reserves for the costs associated with the investigation and settlement of a claim, are a combination of case basis and bulk reserves representing the Company’s estimate of the costs associated with the claims handling process and comprise approximately 7% of total gross reserves at December 31, 2012. Loss adjustment expense reserves include amounts ultimately allocable to individual claims as well as amounts required for the general overhead of the claims handling operation which are not specifically allocable to individual claims. Historical analyses of the ratio of loss adjusting expenses to losses paid on prior closed claims and study of current economic trends affecting loss settlement costs are used to estimate the loss adjustment reserve needs related to the established loss reserves. Each of these reserve categories contain elements of uncertainty which assure variability when compared to the ultimate costs to settle the underlying claims for which the reserves are established. For a more detailed discussion of the three categories of reserves, see “Loss and Loss Expense Reserves” under the caption, “Critical Accounting Policies” beginning on page 28 in Management’s Discussion and Analysis.
The reserving process requires management to continuously monitor and evaluate the life cycle of claims.�� Our claims range from the very routine private passenger automobile “fender bender” to the highly complex and costly claims involving large tractor-trailer rigs and large-scale losses resulting from catastrophic events. Reserving for each class of claims requires a set of assumptions based upon historical experience, knowledge of current industry trends and seasoned judgment. The high limits provided by the Company’s fleet transportation liability policies provide for greater volatility in the reserving process for more serious claims. Court rulings, legislative actions, geographic location of the claim under consideration and trends in jury awards also play a significant role in the estimation process of larger claims. The Company continuously reviews and evaluates loss developments subsequent to each measurement date and adjusts its reserve estimation assumptions, as necessary, in an effort to achieve the best possible estimate of the ultimate remaining loss costs at any point in time.
Loss reserves related to certain permanent total disability (PTD) workers' compensation claims have been discounted to present value using tables provided by the National Council on Compensation Insurance which are based upon a pretax interest rate of 3.5% and adjusted for those portions of the losses retained by the insured. The loss and LAE reserves at December 31, 2012 have been reduced by approximately $6.1 million as a result of such discounting. Had the Company not discounted loss and LAE reserves, pretax income would have been approximately $.5 million higher for the year ended December 31, 2011, originally filed on March 14,2012.
For policies inforce at December 31, 2012, (the “Original 10-K”),the maximum amount for which the Company insures a fleet transportation risk is $10 million, less applicable self-insured retentions, although for the majority of policies written, the maximum limits provided by the Company are $5 million. Any limits above $10 million required by customers are either placed directly by Baldwin & Lyons, Inc. (the “Company” “we”with excess carriers or are written by the Company but 100% reinsured. Certain coverages, such as workers’ compensation, provide essentially unlimited exposure, although the Company protects itself to the extent believed prudent through the purchase of excess reinsurance for these coverages. After giving effect to current treaty and “our”). We are filing this Amendmentfacultative reinsurance arrangements the Company’s maximum exposure to amend Item 15loss from a single occurrence ranges from approximately $.25 million to $1.5 million for the vast majority of risks insured although, for certain losses occurring in current and prior policy years, maximum exposure could be as high as $3.7 million for a single occurrence. Certain reinsurance agreements effective since June 3, 2004 include provisions for aggregate deductibles that must be exceeded before the Company can recover under the terms of the Original 10-K to include the separate financial statementstreaties. The Company retains a higher percentage of the New Vernon India Fund LP (“India Fund”)direct premium (and, therefore, cedes less premium to reinsurers) in consideration of these deductible provisions. Net premiums earned and losses incurred by the Company for 2012, 2011 and 2010 each include $32.2 million, $28.7 million, and $23.4 million, respectively, related to such deductible provisions inforce during these years.
- 4 -
The Company is cedent under numerous reinsurance treaties covering its fiscalvaried product lines. Treaties are written on an annual basis, each with its own renewal date throughout the year. Treaty renewals are expected to occur annually in the foreseeable future. Because the Company occasionally offers multiple year policies and because losses from many of its products take years to develop, losses reported in the current year may be covered by a number of older reinsurance treaties with higher or lower loss retentions than those provided by current treaty provisions.
The table on page 5 sets forth a reconciliation of beginning and ending loss and LAE liability balances, for 2012, 2011 and 2010. That table is presented net of reinsurance recoverable to correspond with income statement presentation. However, a reconciliation of these net reserves to those gross of reinsurance recoverable, as presented in the balance sheet, is also shown. The table on page 11 shows the development of the estimated liability, net of reinsurance recoverable, for the ten years prior to 2012. The table on page 12 is a summary of the re-estimated liability, before consideration of reinsurance, for the ten years prior to 2012 as well as the related re-estimated reinsurance ceded for the same periods.
| RECONCILIATION OF LIABILITY FOR LOSSES AND LOSS ADJUSTMENT | ||||||||||||
| EXPENSES (GAAP BASIS) | ||||||||||||
| Year Ended December 31 | ||||||||||||
| 2012 | 2011 | 2010 | ||||||||||
| NET OF REINSURANCE RECOVERABLE: | (in thousands) | |||||||||||
| Liability for losses and LAE at the | ||||||||||||
| Beginning of the year | $ | 290,092 | $ | 218,629 | $ | 203,253 | ||||||
| Provision for losses and LAE: | ||||||||||||
| Claims occurring during the current year | 147,964 | 225,251 | 154,775 | |||||||||
| Claims occurring during prior years | (9,875 | ) | (9,696 | ) | (8,823 | ) | ||||||
| 138,089 | 215,555 | 145,952 | ||||||||||
| Payments of losses and LAE: | ||||||||||||
| Claims occurring during the current year | 44,942 | 71,699 | 56,394 | |||||||||
| Claims occurring during prior years | 94,003 | 72,393 | 74,182 | |||||||||
| 138,945 | 144,092 | 130,576 | ||||||||||
| Other reserve adjustment | - | - | - | |||||||||
| Liability for losses and LAE at end of year | 289,236 | 290,092 | 218,629 | |||||||||
| Reinsurance recoverable on unpaid losses | ||||||||||||
| at end of the year | 166,218 | 131,464 | 125,891 | |||||||||
| Liability for losses and LAE, gross of | ||||||||||||
| reinsurance recoverable, at end of the year | $ | 455,454 | $ | 421,556 | $ | 344,520 | ||||||
The reconciliation above shows that a savings of $9.9 million was developed in the liability for losses and LAE recorded at December 31, 2011, with comparative developments for the two previous calendar years.
- 5 -
The following table is a summary of the $9.9 million reserve savings by accident year (dollars in thousands):
| Years in Which Losses Were Incurred | Reserve at December 31, 2011 | (Savings) Deficiency Recorded During 2011 | % (Savings) Deficiency | |||||||||
| 2011 | $ | 153,552 | $ | (5,084 | ) | (3.3 | %) | |||||
| 2010 | 45,733 | 6,221 | 13.6 | % | ||||||||
| 2009 | 22,976 | (2,648 | ) | (11.5 | %) | |||||||
| 2008 | 15,385 | (3,583 | ) | (23.3 | %) | |||||||
| 2007 | 6,085 | (277 | ) | (4.6 | %) | |||||||
| 2006 & prior | 46,361 | (4,504 | ) | (9.7 | %) | |||||||
| $ | 290,092 | $ | (9,875 | ) | (3.4 | %) | ||||||
The (savings) deficiency recorded for these loss years was derived from varied sources, as follows (dollars in thousands):
| 2006 & Prior | 2007 | 2008 | 2009 | 2010 | 2011 | |||||||||||||||||||
| Losses and allocated loss expenses developed on cases known to exist at December 31, 2011 | $ | 391 | $ | 11 | $ | (1,162 | ) | $ | 1,386 | $ | 2,228 | $ | (453 | ) | ||||||||||
| Losses and allocated loss expenses reported on cases unknown at December 31, 2011 | 418 | 89 | 544 | 624 | 1,349 | 8,253 | ||||||||||||||||||
| Unallocated loss expenses paid | 471 | 148 | 123 | 717 | 887 | 2,942 | ||||||||||||||||||
| Change in reserves for incurred but not reported losses and allocated and unallocated loss expenses | (3,034 | ) | (384 | ) | (1,533 | ) | (4,363 | ) | (2,423 | ) | (15,878 | ) | ||||||||||||
| Net (savings) deficiency on losses from directly-produced business | (1,754 | ) | (136 | ) | (2,028 | ) | (1,636 | ) | 2,041 | (5,136 | ) | |||||||||||||
| (Savings) deficiency reported under voluntary reinsurance assumption agreements and residual markets | (2,750 | ) | (141 | ) | (1,555 | ) | (1,012 | ) | 4,180 | 52 | ||||||||||||||
| Net (savings) deficiency | $ | (4,504 | ) | $ | (277 | ) | $ | (3,583 | ) | $ | (2,648 | ) | $ | 6,221 | $ | (5,084 | ) | |||||||
- 6 -
Loss and loss expense development savings, presented separately by segment, were as follows for the years ended December 31 (dollars in thousands):
| 2012 | 2011 | 2010 | ||||||||||
| Property and casualty insurance | $ | (7,111 | ) | $ | (7,417 | ) | $ | (6,567 | ) | |||
| Reinsurance | (2,764 | ) | (2,279 | ) | (2,256 | ) | ||||||
| Totals | $ | (9,875 | ) | $ | (9,696 | ) | $ | (8,823 | ) | |||
In the first table on page 6, the amounts identified as "Net (savings) deficiency on losses from directly-produced business" consist of development on cases known at December 31, 2011, 2010,losses reported which were previously unknown at December 31, 2011 (incurred but not reported), unallocated loss expense paid related to accident years 2011 and 2009, respectively, as new Exhibits 99.1, 99.2,prior and 99.3changes in responsethe reserves for incurred but not reported losses and loss expenses. Bulk loss reserves are established to Regulation S-X Rule 3-09. Weprovide for potential future adverse development on cases known to the Company and for cases unknown at the reserve date. Changes in the reserves for incurred but not reported losses and loss expenses occur based upon information received on known and newly reported cases during the current year and the effect of that development on the application of standard actuarial methods used by the Company.
Also shown in the table are also includingamounts representing the separate but"(savings) deficiency reported under reinsurance assumption agreements and residual markets". These amounts relate to the Company's participation in both voluntary reinsurance policies and treaties and government mandated pools. The Company records its share of losses from these policies, treaties and pools based on reports from the reinsured companies, retrocessionaires and residual market administrators and does not directly establish case reserves related financial statementsto this portion of the NVH I LPCompany's business. The Company does, however, establish additional reserves for its six month periodsreinsurance losses to supplement case reserves reported by the ceding companies, when considered necessary. Involuntary residual market premiums and losses are included in the property and casualty segment. Development on residual market business was $1.5 million, $1.1 million, and $.5 million for the years ended December 31, 2012, 2011 and 2010, respectively. Reserves on this business are established by the regulatory entities and, 2009, respectivelyaccordingly, development on these losses is dependent on the adequacy of loss reserving by these entities.
The property and casualty insurance segment has historically constituted the largest portion of net reserve development savings. As shown, the savings from this segment ranged from $6.6 million to $7.4 million during the past three years. This fluctuation, which is a much smaller range than was experienced in prior years, reflects the variability associated with the larger claims covered by the Company, as well as fluctuations in the Company’s net retentions. The Company continues to incorporate more recent loss development data into its loss reserving formulae; however, the change from excess of loss to quota share treaties beginning in 2005, the widely fluctuating use of facultative reinsurance on larger risks, and the dynamic nature of losses associated with the fleet transportation business as well as the timing of settlement of large claims increases the likelihood of variability in loss developments from period to period. As discussed elsewhere, the Company has historically experienced savings in its loss developments owing to, among other things, its long-standing policy of reserving for the ultimate value of losses quickly and realistically and a willingness to settle claims based upon a seasoned evaluation of its exposures. While the Company’s basic assumptions have remained consistent, we continue to update loss data to reflect changing trends which can be expected to result in fluctuations in loss developments over time.
The development for reinsurance, with a $2.8 million savings during 2012 and similar savings recorded during 2011 and 2010, is heavily dependent on the establishment of case basis and IBNR reserves by other insurance and reinsurance companies. While the Company evaluates the sufficiency of such reserving and often adjusts reserves based on management’s independent analysis, considering the number of different entities involved and the fact that the Company must rely on external sources of information, reserve development from these products is subject to fluctuation from year to year. The consistency of the small redundancies developed during the past three years, a period of unprecedented global catastrophe losses, is reflective of management’s attention to reserving for this business.
Factors affecting the development of environmental claims are more fully discussed in the following paragraphs. The Company has little exposure to environmental losses and activity during the three year period ending 2012 has been insignificant.
- 7 -
Our goal is to produce an overall estimate of reserves which is sufficient and as close to expected ultimate losses as possible. The $9.9 million in net savings developed during 2012 represents approximately 27% of pre-tax net income before realized capital losses for 2012 but only 4.4% of December 31, 2011 net loss and LAE reserves, which is identical to the development during 2011 against December 31, 2010 net loss and LAE reserves and well within the acceptable range of variation for the Company’s diverse and complex book of business. The Company has maintained a consistent, conservative posture in its reserving process and has not significantly altered its assumptions used in the reserving process since the mid - 1980's. This process has proven to be fully adequate with no overall deficiencies developed since 1985. There were no significant changes in trends related to the numbers of claims incurred (other than correlative variances with premium volume), average settlement amounts, numbers of claims outstanding at period ends or the averages per claim outstanding during the year ended December 31, 2012 for most lines of business. However, the average settlement amounts of severe fleet transportation claims have tended to increase in recent years.
As described on page 4, changes have occurred in the Company's net per accident exposure under reinsurance agreements in place during the periods presented in the previous table. It is much more difficult to reserve for losses where policy limits are as high as $10 million per accident as opposed to those losses related to business which carries lower policy limits, such as private passenger automobile. This is because there are fewer policy limit losses in the Company's historical loss database on which to project future loss developments and the larger and more complex the loss, the greater the likelihood that litigation will become involved in the settlement process. Consequently, the level of uncertainty in the reserving process is much greater when dealing with larger losses and will routinely result in fluctuations among accident year developments.
The differences between the liability for losses and LAE reported in the accompanying 2012 consolidated financial statements prepared in accordance with generally accepted accounting principles ("GAAP") and that reported in the annual statements filed with state and provincial insurance departments in the United States and Canada in accordance with statutory accounting practices ("SAP") are as follows (dollars in thousands):
Liability reported on a SAP basis - net of reinsurance recoverable $ 295,696
Add differences:
Reinsurance recoverable on unpaid losses and LAE 166,218
Additional reserve for residual market losses not
reported to the Company at the current year end 840
Deduct differences:
Estimated salvage and subrogation recoveries recorded on
a cash basis for SAP and on an accrual basis for GAAP (7,300)
Liability reported on a GAAP basis $ 455,454
Ten Year Historical Development Tables:
The table on page 11 presents the development of GAAP balance sheet insurance reserves for each year-end from 2002 through 2011, as of December 31, 2012, net of all reinsurance credits. The top line of the table shows the estimated liability for unpaid losses and LAE recorded at the balance sheet date for each of the indicated years. This liability represents the estimated amount of losses and LAE for claims arising in all prior years that were unpaid at the respective balance sheet date, including losses that had been incurred, but not yet reported, to the Company.
The upper portion of the table shows the re-estimated amount of the previously recorded liability based on additional information available to the Company as of the end of each succeeding year. The estimate is increased or decreased as more information becomes known about the frequency and severity of individual claims and as claims are settled and paid.
The "cumulative redundancy" represents the aggregate change in the estimates of each calendar year end reserve through December 31, 2012. For example, the 2002 liability has developed a $20.5 million redundancy over ten years. That amount has been reflected in income over those ten years, as shown on the table. The effect on income of changes in estimates of the liability for losses and LAE during each of the past three years is shown in the table on page 5.
- 8 -
Historically, the Company’s net loss developments have been favorable. Reserve developments for all years ended in the period 1986 through 2011 have produced redundancies as of December 31, 2012. In addition to refinements in reserving methods, loss reserve developments since 1985 have been favorably affected by several other factors. Perhaps the most significant single factor has been the improvement in safety programs by the fleet transportation industry in general and by the Company’s insureds specifically. Statistics produced by the American Trucking Association show that driver quality has improved markedly in the past decade resulting in fewer fatalities and serious accidents. The Company’s experience also shows that improved safety and hiring programs have a dramatic impact on the frequency and severity of fleet transportation accidents and, more recently, the introduction of numerous safety devices using state-of-the-art technology has reduced rear end and cross over accidents which often produce the most serious injuries. Significant trucking industry and regulatory initiatives, such as CSA 2010, have provided strong motivation to trucking companies to upgrade their driver roster, increase monitoring of driver behavior and improve equipment maintenance, all resulting in fewer accidents. Higher self-insured retentions also play a part in reduced insurance losses. Higher retentions not only raise the excess insurance entry point but also encourage fleet transportation company management to focus even more intensely on safety programs.
The establishment of bulk reserves requires the use of historical data where available and generally a minimum of ten years of such data is required to provide statistically valid samples. As previously mentioned, numerous factors must be considered in reviewing historical data including inflation, legislative actions, new coverages provided and trends noted in the current book of business which are different from those present in the historical data. Clearly, the Company's book of business in 2012 is different from that which generated much of the ten-year historical loss data used to establish reserves in recent years. Management has noted trends toward significantly higher settlements and jury awards associated with the more serious fleet transportation liability claims over the past several years. The inflationary factors affecting these claims appear to be more subjective in nature and not in line with compensatory equity. In addition to the factors mentioned above, savings realized in recent years upon the closing of claims, as reflected in the tables on pages 5 and 12, are attributable to the Company’s experience in specializing in long-haul trucking business for over 50 years as well as its long-standing policy of reserving for losses realistically and a willingness to settle claims based upon a seasoned evaluation of the underlying exposures. The Company will continue to review the trends noted and, should it appear that such trends are permanent and projectable, they will be reflected in future reserving method refinements.
The lower section of the table on page 11 shows the cumulative amount paid with respect to the previously recorded calendar year end liability as of the end of each succeeding year. For example, as of December 31, 2012, the Company had paid $98.1 million of losses and LAE that had been incurred, but not paid, as of December 31, 2002; thus an estimated $25.7 million (21%) of losses incurred through 2002 remain unpaid as of the current financial statement date ($123.8 million incurred less $98.1 million paid). The payment patterns shown in this table demonstrate the “long-tail” nature of much of the Company’s business whereby many claims do not settle for more than ten years.
In evaluating this information, it is important to note that the method of presentation causes some development experience to be duplicated. For example, the amount of any redundancy or deficiency related to losses settled in 2005, but incurred in 2002, will be included in the cumulative development amount for each of the years-end 2002, 2003, and 2004. As such, this table does not present accident or policy year development data which readers may be more accustomed to analyzing. Rather, this table is intended to present an evaluation of the Company’s ability to establish its liability for losses and loss expenses at a given balance sheet date. It is important to note that conditions and trends that have affected development of the liability in the past may not necessarily occur in the future. Accordingly, it would not be appropriate to extrapolate future redundancies or deficiencies based on this table.
The table presented on page 12 presents loss development data on a gross (before consideration of reinsurance) basis for the same ten year period December 31, 2002 through December 31, 2011, as of December 31, 2012, with a reconciliation of the data to the net amounts shown in the table on page 11. Readers are reminded that the gross data presented on page 12 requires significantly more subjectivity in the estimation of incurred but not reported and loss expense reserves because of the high limits provided by the Company to its fleet transportation customers, much of which has been covered by excess of loss and facultative reinsurance. This is particularly true of excess of loss treaties where the Company retains risk in only the lower, more predictable, layers of coverage. Accordingly, one would generally expect more variability in development on a gross basis than on a net basis. The difference between loss developments before consideration of reinsurance, as presented on page 12, and those net of reinsurance, as shown on page 11 do not impact the Company’s operating results as all such differences are borne by reinsurers.
- 9 -
Environmental Matters:
Given the Company's principal business is insuring fleet transportation companies, on occasion claims involving a commercial automobile accident which has resulted in the spill of a pollutant are made. Certain of the Company's policies may cover these situations on the basis that they were caused by an accident that resulted in the immediate and isolated spill of a pollutant. These claims are typically reported and fully resolved within a short period of time.
In the past, the Company has received a few environmental claims that did not result from a "sudden and accidental" event. Most of these claims were made under policies issued in the 1970's primarily to one account which was involved in the business of hauling and disposing of hazardous waste. Although the Company had pollution exclusions in its policies during that period, the courts have, at times, refused to recognize such exclusions in environmental cases.
In general, establishing reserves for environmental claims, other than those associated with “sudden and accidental” losses, is subject to uncertainties that are greater than those represented by other types of claims. Factors contributing to those uncertainties include a lack of historical data, long reporting delays, uncertainty as to the number and identity of insureds with potential exposure, unresolved legal issues regarding policy coverage, and the extent and timing of any such contractual liability. Courts have reached different and sometimes inconsistent conclusions as to when the loss occurred and what policies provide coverage, what claims are covered, whether there is an insured obligation to defend, how policy limits are determined, how policy exclusions are applied and interpreted, and whether cleanup costs represent insured property damage.
As previously noted, very few environmental claims have been reported to the Company. In addition, a review of the businesses of our past and current insureds indicates that exposure to further claims of an environmental nature is limited because the vast majority of the Company's accounts are not currently, and have not in the past been, involved in the hauling of hazardous substances. Also, the revision of the pollution exclusion in the Company's policies since 1986 has, and is expected to, further limit exposure to claims from that point forward.
The Company has never been presented with an environmental claim relating to asbestos and, based on the types of business the Company has insured over the years, it is not expected that the Company will have any significant asbestos exposure.
The Company's reserves for unpaid losses and loss expenses at December 31, 2012 did not include significant amounts for liability related to environmental damage claims. The Company does not foresee significant future exposure to environmental damage claims and accordingly has established no reserve for incurred but not reported environmental losses at December 31, 2012.
Space intentionally left blank
- 10 -
| ANALYSIS OF LOSS AND LOSS ADJUSTMENT EXPENSE DEVELOPMENT--GAAP BASIS | |||||||||||||||||||||||
| (Dollars in thousands) | |||||||||||||||||||||||
| Year Ended December 31 | 2002 | 2003 | 2004 | 2005 | 2006 | 2007 | 2008 | 2009 | 2010 | 2011 | 2012 | ||||||||||||
| Liability for Unpaid | |||||||||||||||||||||||
| Losses and LAE, Net | |||||||||||||||||||||||
| of Reinsurance | |||||||||||||||||||||||
| Recoverables | $144,267 | $162,424 | $207,137 | $242,130 | $249,495 | $244,500 | $231,633 | $203,253 | $218,629 | $290,092 | $289,236 | ||||||||||||
| Liability Reestimated | |||||||||||||||||||||||
| as of: | |||||||||||||||||||||||
| One Year Later | 130,681 | 147,468 | 193,445 | 225,183 | 228,211 | 227,423 | 222,049 | 194,430 | 208,933 | 280,217 | |||||||||||||
| Two Years Later | 125,731 | 142,771 | 180,455 | 209,774 | 207,818 | 216,730 | 208,702 | 198,220 | 201,745 | ||||||||||||||
| Three Years Later | 124,693 | 137,502 | 171,332 | 200,955 | 199,503 | 206,445 | 210,562 | 188,110 | |||||||||||||||
| Four Years Later | 124,714 | 134,661 | 171,225 | 198,376 | 192,678 | 210,170 | 205,519 | ||||||||||||||||
| Five Years Later | 124,507 | 135,418 | 171,005 | 191,846 | 198,023 | 208,132 | |||||||||||||||||
| Six Years Later | 124,609 | 136,623 | 167,590 | 195,348 | 196,101 | ||||||||||||||||||
| Seven Years Later | 124,606 | 135,415 | 170,951 | 193,226 | |||||||||||||||||||
| Eight Years Later | 124,809 | 138,191 | 167,613 | ||||||||||||||||||||
| Nine Years Later | 127,462 | 134,094 | |||||||||||||||||||||
| Ten Years Later | 123,811 | ||||||||||||||||||||||
| Cumulative Redundancy | $20,456 | $28,330 | $39,524 | $48,904 | $53,394 | $36,368 | $26,114 | $15,143 | $16,884 | $9,875 | |||||||||||||
| Cumulative Amount of | |||||||||||||||||||||||
| Liability Paid Through: | |||||||||||||||||||||||
| One Year Later | $39,956 | $38,234 | $60,343 | $59,581 | $58,956 | $76,970 | $84,777 | $74,182 | $72,393 | $94,003 | |||||||||||||
| Two Years Later | 57,522 | 62,380 | 84,265 | 94,947 | 100,990 | 124,870 | 120,628 | 107,413 | 109,382 | ||||||||||||||
| Three Years Later | 69,959 | 74,198 | 102,692 | 117,522 | 127,011 | 145,857 | 142,731 | 125,038 | |||||||||||||||
| Four Years Later | 76,408 | 82,479 | 116,198 | 136,652 | 143,612 | 157,724 | 152,679 | ||||||||||||||||
| Five Years Later | 81,121 | 91,607 | 124,176 | 148,039 | 151,662 | 164,877 | |||||||||||||||||
| Six Years Later | 85,064 | 96,009 | 128,592 | 154,573 | 157,223 | ||||||||||||||||||
| Seven Years Later | 88,239 | 99,410 | 132,775 | 159,428 | |||||||||||||||||||
| Eight Years Later | 91,379 | 102,797 | 137,094 | ||||||||||||||||||||
| Nine Years Later | 94,460 | 106,689 | |||||||||||||||||||||
| Ten Years Later | 98,134 | ||||||||||||||||||||||
- 11 -
| ANALYSIS OF LOSS AND LOSS ADJUSTMENT EXPENSE DEVELOPMENT--GAAP BASIS | ||||||||||||||||||||||
| (Dollars in thousands) | ||||||||||||||||||||||
| Year Ended December 31 | 2002 | 2003 | 2004 | 2005 | 2006 | 2007 | 2008 | 2009 | 2010 | 2011 | 2012 | |||||||||||
| Direct and Assumed: | ||||||||||||||||||||||
| Liability for Unpaid Losses | ||||||||||||||||||||||
| and Loss Adjustment | ||||||||||||||||||||||
| Expenses | $277,309 | $342,449 | $440,172 | $430,273 | $409,412 | $378,616 | $389,558 | $359,030 | $344,520 | $421,556 | $455,454 | |||||||||||
| Liability Reestimated as of | ||||||||||||||||||||||
| December 31, 2012 | 294,827 | 316,998 | 362,321 | 321,897 | 297,203 | 305,100 | 302,773 | 299,698 | 314,677 | 400,189 | ||||||||||||
| Cumulative (Deficiency) Redundancy | (17,518) | 25,451 | 77,851 | 108,376 | 112,209 | 73,516 | 86,785 | 59,332 | 29,843 | 21,367 | ||||||||||||
| Ceded: | ||||||||||||||||||||||
| Liability for Unpaid Losses | ||||||||||||||||||||||
| and Loss Adjustment | ||||||||||||||||||||||
| Expenses | 133,042 | 180,025 | 233,035 | 188,143 | 159,917 | 134,116 | 157,925 | 155,777 | 125,891 | 131,464 | 166,218 | |||||||||||
| Liability Reestimated as of | ||||||||||||||||||||||
| December 31, 2012 | 171,016 | 182,904 | 194,708 | 128,671 | 101,102 | 96,968 | 97,254 | 111,588 | 112,932 | 119,972 | ||||||||||||
| Cumulative (Deficiency) Redundancy | (37,974) | (2,879) | 38,327 | 59,472 | 58,815 | 37,148 | 60,671 | 44,189 | 12,959 | 11,492 | ||||||||||||
| Net: | ||||||||||||||||||||||
| Liability for Unpaid Losses | ||||||||||||||||||||||
| and Loss Adjustment | ||||||||||||||||||||||
| Expenses | 144,267 | 162,424 | 207,137 | 242,130 | 249,495 | 244,500 | 231,633 | 203,253 | 218,629 | 290,092 | 289,236 | |||||||||||
| Liability Reestimated as of | ||||||||||||||||||||||
| December 31, 2012 | 123,811 | 134,094 | 167,613 | 193,226 | 196,101 | 208,132 | 205,519 | 188,110 | 201,745 | 280,217 | ||||||||||||
| Cumulative Redundancy | 20,456 | 28,330 | 39,524 | 48,904 | 53,394 | 36,368 | 26,114 | 15,143 | 16,884 | 9,875 | ||||||||||||
- 12 -
Marketing
The Company's primary marketing areas are outlined on pages 2 and 3.
Historically, the Company has focused its fleet transportation marketing efforts on large and medium trucking fleets, with its largest market share in the larger trucking fleets (over 150 power units). These fleets self-insure a significant portion of their risk and self-insurance plans are a specialty of the Company. The indemnity contract provided to self-insured customers is designed to cover all aspects of fleet transportation liability, including third party liability, property damage, physical damage, cargo and workers' compensation, arising from vehicular accident or other casualty loss. The self-insured program is supplemented with large deductible workers' compensation policies in states which do not allow for self-insurance of this coverage. The Company also offers work-related accident insurance, on a group basis, to independent contractors under contract to a fleet sponsor as well as workers’ compensation coverage to employees of independent contractor fleet owners. In addition, the Company offers a program of coverages for "small fleet" trucking concerns (owner-operators generally with one to six month periods ended June 30, 2011, 2010, and 2009 as new Exhibits 99.4, 99.5, 99.6, 99.7, 99.8 and 99.9, respectively, which should be readpower units). This program is currently being marketed in thirty-one states through independent agents utilizing much of the technology developed in conjunction with marketing private passenger automobile insurance. The Company’s fleet transportation offerings also include certain public livery risks, principally large and medium sized operators of bus fleets. In 2012, fleet transportation products generated approximately 69% of direct premium written and assumed by the India Fund’sCompany.
Since 1992, the Company has continuously accepted reinsurance cessions and retrocessions, principally property coverages for catastrophe exposures, from selected insurers and reinsurers. Participation in this market will vary depending on the adequacy of pricing, which can fluctuate widely from time to time. In determining the volume of catastrophe reinsurance that it will accept, the Company first determines the exposure that it is willing to accept from a single “probable maximum loss” (PML), generally defined as a 1-in-250 year event (.4% probability of occurrence based on sophisticated modeling programs), within a given geographic area. As property programs are considered, computer models of geographic exposure are evaluated against these maximums and programs are only considered if they do not cause aggregate exposure to exceed the predetermined limits. As of December 31, 2012, the Company’s modeled estimate of its largest zonal exposure to a PML from a single event is approximately 11% of consolidated surplus before state and federal tax credits and reinstatement premiums which would reduce the impact to approximately 6% of surplus. In addition to property coverages, the Company accepts reinsurance cessions for a limited amount of professional liability coverages from small and medium sized insurance companies.
Since 1995, the Company has sold private passenger automobile insurance. This program is currently being marketed primarily in nine mid-western and southern states through independent agents. Sagamore utilizes state-of-the-art technology extensively in marketing its private passenger automobile insurance products in order to provide superior service to its agents and insureds.
Beginning in the second quarter of 2009, the Company began underwriting a limited program of commercial property and business owners’ liability policies in the state of Florida, utilizing its excess and surplus lines authority and the services of a managing general agency. This business has been terminated, with final runoff of all inforce policies set to occur in May, 2013.
Beginning in the first quarter of 2010, the Company began underwriting miscellaneous professional liability coverages through wholesale and retail agents and brokers on both an admitted and surplus lines basis. The distribution platform for this product was expanded in 2011 to include programs with a managing general agent as well as retail agents. The platform was further expanded in 2012 by the launch of five new products using the same diversity of distribution sources.
Investments
The Company’s investment portfolio is essentially divided between (1) funds which are considered necessary to support insurance underwriting activities and (2) excess capital funds. Funds invested in fixed maturity and short-term securities are more than sufficient to cover underwriting operations while equity securities and limited partnerships are utilized to invest excess capital funds to achieve higher long-term returns. The following discussion will concentrate on the different investment strategies for these two major categories.
- 13 -
At December 31, 2012 the financial statements. The financial statementsstatement value of the India Fund and NVH I LPCompany's investment portfolio was approximately $682 million, including $64 million of short-term funds classified as cash equivalents. The adjusted cost of the portfolio was $627 million with the $55 million difference representing unrealized appreciation.
A comparison of the allocation of assets within the Company's investment portfolio, using adjusted cost as a basis, is as follows as of December 31:
| 2012 | 2011 | ||||||||
| State and municipal obligations | 31.0 | % | 31.7 | % | |||||
| Corporate securities | 18.9 | 15.4 | |||||||
| U.S. government obligations | 11.3 | 12.2 | |||||||
| Short-term and money markets | 10.9 | 14.3 | |||||||
| Residential mortgage-backed securities | 3.8 | 3.6 | |||||||
| Foreign government obligations | 3.5 | 3.6 | |||||||
| Commercial mortgage-backed securities | 1.8 | 1.9 | |||||||
| Government sponsored entities | - | 0.1 | |||||||
| Total fixed maturities | 81.2 | 82.8 | |||||||
| Equity securities | 9.2 | 8.0 | |||||||
| Limited partnerships (equity basis) | 9.6 | 9.2 | |||||||
| 100.0 | % | 100.0 | % | ||||||
Fixed Maturity and Short-Term Investments
Fixed maturity and short-term securities comprised 75.5% of the market value of the Company’s total invested assets at December 31, 2012. Excluding U.S. government obligations, the fixed maturity portfolio is widely diversified with no concentrations in any single industry, geographic location or municipality. The largest amount invested in any single issuer was $7.3 million (1.1% of total invested assets) although most individual investments, other than municipal bonds, are less than $750,000. The Company’s fixed maturity portfolio has a very short duration and, accordingly, the Company does not actively trade fixed maturity securities but typically holds such investments until maturity. Exceptions exist in the rare instances where the underlying credit for a specific issue is deemed to be diminished. In such cases, the security will be considered for disposal prior to maturity. In addition, fixed maturity securities may be sold when realignment of the portfolio is considered beneficial (i.e. moving from taxable to non-taxable issues) or when valuations are considered excessive compared to alternative investments.
The Investment Committee has determined that the Company’s insurance subsidiaries will, at all times, hold high grade fixed maturity securities and short-term investments with a market value equal to at least 100% of reserves for losses and loss expenses and unearned premiums, net of applicable reinsurance credits. At December 31, 2012, investment grade bonds and short-term instruments held by insurance subsidiaries equaled 148% of designated underwriting liabilities, thus providing a substantial margin above this conservative guideline.
The Company's concentration of fixed maturity funds in relatively short-term investments provides it with a level of liquidity which is more than adequate to provide for its anticipated cash flow needs.
The following comparison of the Company's fixed maturity and short-term investment portfolios, using par value as a basis, shows the changes in contractual maturities in the portfolio during 2012. Note that the expected average maturity of the portfolio is less than the contractual maturity average life shown below because the
- 14 -
Company has, in some cases, the right to put obligations and borrowers have, in some cases, the right to call or prepay obligations with or without call or prepayment penalties.
| 2012 | 2011 | ||||||||
| Less than one year | 43.5 | % | 48.8 | % | |||||
| 1 to 5 years | 42.4 | 41.4 | |||||||
| 5 to 10 years | 5.1 | 2.8 | |||||||
| More than 10 years | 9.0 | 7.0 | |||||||
| 100.0 | % | 100.0 | % | ||||||
| Average life of portfolio (years) | 3.6 | 3.1 | |||||||
Approximately $42.6 million of fixed maturity investments (6.3% of total invested assets) consists of bonds rated as less than investment grade at year end. These investments include a diversified portfolio of nearly 100 investments, including insurance linked securities with a cost basis of approximately $42.2 million.
The market value of the consolidated fixed maturity portfolio was $5.1 million greater than cost at December 31, 2012, before income taxes, which compares to a $.5 million unrealized gain at December 31, 2011. The Company analyzes fixed maturity securities for other-than-temporary impairment (“OTTI”) in accordance with the Financial Accounting Standards Board (“FASB”) OTTI guidance. As has been the Company’s consistent policy, other-than-temporary impairment is considered for any individual issue which has sustained a decline in current market value of at least 20% below original or adjusted cost, and the decline is ongoing for more than 6 months, regardless of the evaluation of the creditworthiness of the issuer or the specific issue. Additionally, the Company takes into account any known subjective information in evaluating for impairment without consideration to the Company’s 20% threshold. In 2012, the net effect of OTTI adjustments to fixed maturity securities was a $.1 million recovery, with securities owned at year end having only an insignificant non-credit related loss treated as unrealized. In 2011, the net effect of OTTI adjustments to fixed maturity securities was $.6 million with securities owned at year end having a $.1 million non-credit related loss treated as unrealized. The current net unrealized gain consists of $6.4 million of gross unrealized gains and $1.3 million of gross unrealized losses.
Equity Securities
Because of the large amount of high quality fixed maturity investments owned, relative to the Company’s loss and loss expense reserves and other liabilities, amounts invested in equity securities are not needed to fund current operations and, accordingly, can be committed for long periods of time. Equity securities comprise 15.7% of the market value of the consolidated investment portfolio at December 31, 2012, but only 9.2% of the related adjusted cost basis, as long-term holdings have appreciated significantly. The Company’s equity securities portfolio consists of over 160 separate issues with diversification from large to small capitalization issuers and among several industries. The largest single equity issue owned has a market value of $3.6 million at December 31, 2012 (.5% of total invested assets).
In general, the Company maintains a buy-and-hold philosophy with respect to equity securities. Many current holdings have been continuously owned for more than ten years, accounting for the periods endedfact that the portfolio, in total, carries a $42.1 million pre-tax unrealized gain at the current year end using original cost and over $49.4 million in unrealized gains using cost adjusted for other-than-temporary impairment. An individual equity security will be disposed of when it is determined by investment managers or the Investment Committee that there is little potential for future appreciation. All equity securities are considered to be available for sale although portfolio turnover has historically been very low. Securities are not sold to meet any quarterly or annual earnings quotas but, rather, are disposed of only when market conditions are deemed to dictate, regardless of the impact, positively or negatively, on current period earnings. In addition, equity securities may be sold when realignment of the portfolio is considered beneficial or when valuations are considered excessive compared to alternative investments. Sales of equity securities during 2012 generated both gains and losses but netted to a realized gain of $2.4 million before taxes.
- 15 -
The net effect of other-than-temporary impairment adjustments, including recovery of prior year write downs upon sale or disposal, increased investment gains from equity securities by $.3 million for the year before taxes. The reclassification of unrealized losses to realized losses occurred on each individual issue where the current market value was at least 20% below original or adjusted cost, and the decline was ongoing for more than 6 months at the date of write-down, regardless of the evaluation of the issuer or the potential for recovery. Additionally, the Company takes into account any known subjective information in evaluating for impairment without consideration to the Company’s 20% threshold. Net unrealized gains on the equity security portfolio were $49.4 million, before tax at December 31, 2011 were2012 compared to $40.4 million at December 31, 2011. The current net unrealized gain consists of $51.1 million of gross unrealized gains and $1.7 million of gross unrealized losses.
Limited Partnerships
For several years, the Company has invested in various limited partnerships engaged in securities trading activities, real estate development or small venture capital funding, as an alternative to direct equity investments. The funds used for these investments are part of the Company’s excess capital strategy. At December 31, 2012, the aggregate original investment in the limited partnerships was $29.5 million and the aggregate carrying value was $60.0 million, comprising 8.8% of invested assets.
As a group, these investments experienced increases in value during 2012, with the aggregate of the Company’s share of such gains reported by the limited partnerships totaling approximately $7.1 million. The increase in value is composed of estimated realized losses of $1.5 million and increases in estimated unrealized gains of $8.6 million. On an inception-to-date basis, active limited partnerships have produced estimated realized income of $26.1 million and estimated unrealized income of $4.4 million.
The Company follows the equity method of accounting for its limited partnership investments and, accordingly, records the total change in value as a component of net gains or losses on investments. However, readers are cautioned that, to the extent that reported increases in equity value are unrealized, they can be reduced or eliminated quickly by volatile market conditions. Further, assets purchased with reinvested realized gains can also diminish in value. In addition, a significant minority of the investments included in the limited partnerships do not availablehave readily ascertainable fair market values and, accordingly, values assigned by the general partners may not be realizable upon the sale or disposal of the related assets, which may not occur for several years. Limited partnerships also are highly illiquid investments and the Company’s ability to withdraw funds is generally subject to significant restrictions.
Investment Yields
Interest rates, particularly those on the short end of the yield curve where the vast majority of the Company’s fixed maturity investments are maintained, continued at historically low levels during 2012. As a result, pre-tax net investment income decreased $.8 million, or 7% and after tax income decreased $.7 million, or 9% during 2012. A comparison of consolidated investment yields, before consideration of investment management expenses, is as follows:
| 2012 | 2011 | ||||
| Before federal tax: | |||||
| Investment income | 2.1 | % | 2.4 | % | |
| Investment income plus investment gains (losses) | 3.6 | (0.9) | |||
| After federal tax: | |||||
| Investment income | 1.6 | 1.8 | |||
| Investment income plus investment gains (losses) | 2.5 | (0.4) | |||
Readers are also directed to the Results of Operations beginning on page 25 of this document for additional details of investment operations.
- 16 -
Regulatory Framework
The Company’s businesses are currently subject to insurance industry regulation by each of the fifty states in which the Company’s subsidiaries are licensed. In addition, minor portions of the Company’s business are subject to regulation by Bermudian and Canadian federal and provincial authorities. There can be no assurance that laws and regulations will not be changed by one or more of these regulatory bodies in ways that will require the Company to modify its business models and objectives. In particular, the United States federal government continues to undertake a substantial review and revision of the regulation and supervision of financial institutions, including insurance companies as well as tax laws and regulation, which could impact the Company’s operations and performance. While it is currently expected that federal government regulation will be focused on the largest financial companies, additional regulations are likely to increase the cost of compliance to the Company. Further, while management is not aware of any significant pending changes, the Company is also subject to regulatory risks from changes to state and federal tax laws that may affect the treatment of insurance related deductions or income recognition.
Additionally, changes in laws and regulations governing the insurance industry could have an impact on the Company’s ability to generate income from its insurance operations. The Company is obliged to comply with numerous complex and varied governmental regulations in order to maintain its authority to write insurance business. While the Company has consistently maintained each of its licenses without exception, failure to maintain compliance could result in governmental regulators temporarily preventing the Company from writing new business and therefore having a detrimental effect on the Company. Also, the ability for the Company’s insurance subsidiaries to increase insurance rates is heavily regulated for significant portions of the Company’s business and such rate increases can be denied or delayed for substantial periods by regulators.
Employees
As of December 31, 2012, the Company had 360 employees, an increase of 30 employees from the prior year end.
Competition
The insurance brokerage and agency business is highly competitive. B&L competes with a large number of insurance brokerage and agency firms and individual brokers and agents throughout the country, many of which are considerably larger than B&L. B&L also competes with insurance companies which write insurance directly with their customers.
Insurance underwriting is also highly competitive. The Insurance Subsidiaries compete with other stock and mutual companies and inter-insurance exchanges (reciprocals). There are numerous insurance companies offering the lines of insurance which are currently written or may in the future be written by the Insurance Subsidiaries. Many of these companies have been in business for longer periods of time, have significantly larger volumes of business, offer more diversified lines of insurance coverage and have significantly greater financial resources than the Company. In many cases, competitors are willing to provide coverage for rates lower than those charged by the Insurance Subsidiaries. Many potential clients self-insure workers' compensation and other risks for which the Company offers coverage, and some concerns have organized "captive" insurance companies as subsidiaries through which they insure their own operations. Some states have workers' compensation funds that preclude private companies from writing this business in those states. Federal law also authorizes the creation of "Risk Retention Groups" which may write insurance coverages similar to those offered by the Company.
The Company believes it has a competitive advantage in its major lines of business as the result of the extensive experience of its long-tenured management and staff, its superior service and products, its willingness to custom build insurance programs for its customers and the extensive use of technology with respect to its insureds and independent agent force. However, the Company is not “top-line” oriented and will readily sacrifice premium volume during periods of unrealistic rate competition. Accordingly, should competitors determine to “buy” market share with unprofitable rates, the Company’s Insurance Subsidiaries will generally experience a decline in business until pricing returns to profitable levels.
- 17 -
Availability of Documents
This Form 10-K as well as the Company’s Audit Committee Charter and Code of Conduct will be sent to shareholders without charge upon written request to the Company’s Investor Contact at the time that we filed the Original 10-K.
Item 101(b), (c)(1)(i) and (vii), and (d) of Regulation S-K:
Reference is made to Note J to the filingconsolidated financial statements which provide information concerning industry segments and is filed herewith under Item 8, Financial Statements and Supplementary Data.
Item 1A. RISK FACTORS
| · | The Company operates in the Property and Casualty insurance industry where many of its competitors are larger with far greater resources. Further, this industry is heavily regulated. Changes in laws and regulations governing the insurance industry could have a significant impact on the Company’s ability to generate income from its insurance operations. The Company’s principal subsidiaries are regulated and licensed in all 50 of the United States, the District of Columbia, all Canadian provinces and Bermuda. The Company is obliged to comply with numerous complex and varied governmental regulations in order to maintain its authority to write insurance business. Failure to maintain compliance could result in various governmental regulators preventing the Company from writing new business and therefore having a material impact on the Company. Further, the ability for the Company’s insurance subsidiaries to adjust insurance rates is regulated for significant portions of the Company’s business and such rate adjustments can be denied or delayed for substantial periods by regulators. |
| · | The Company has two classes of common stock with unequal voting rights. The Company is effectively controlled by its principal stockholders and management, which limits other stockholders’ ability to influence operations. The Company’s executive officers, directors and principal stockholders and their affiliates control nearly 63% of the outstanding shares of voting Class A common stock and 33% of the outstanding shares of non-voting Class B common stock. These parties effectively control the Company, direct its affairs, and exert significant influence in the election of directors and approval of significant corporate transactions. The interests of these stockholders may conflict with those of other stockholders, limit marketability of the stock and this concentration of voting power has the potential to delay, defer or prevent a change in control. |
| · | The Company limits its risk of loss from policies of insurance issued by its Insurance Subsidiaries through the purchase of reinsurance coverage from other insurance companies. Such reinsurance does not relieve the Company from its responsibility to policyholders should the reinsurers be unable to meet their obligations to the Company under the terms of the underlying reinsurance agreements. As a result, we are subject to credit risk relating to our ability to recover amounts due from reinsurers. While the Company has not experienced any significant reinsurance losses for over twenty five years, certain of our less significant historical reinsurance carriers have experienced deteriorating financial conditions or have been downgraded by rating agencies. If we are not able to collect the amounts due to us from reinsurers, the resultant credit losses could materially adversely affect our results of operations, equity, business and insurer financial strength. |
| · | Operating in the Property and Casualty insurance industry, the Company is exposed to loss from policies of insurance issued to its policyholders. A large portion of losses recorded by the Company are estimates of future loss payments to be made. Such estimates of future loss payments may prove to be inadequate. Reserves represent our best estimate at a given point in time. Insurance reserves are not an exact calculation of liability but instead are complex estimates derived by us, generally utilizing a variety of reserve estimation techniques from numerous assumptions and expectations about future events, many of which are highly uncertain, such as estimates of claims severity, frequency of claims, inflation, claims handling, case reserving policies and procedures, underwriting and pricing policies, changes in the legal and regulatory environment and the lag time between the occurrence of an insured event and the time of its ultimate settlement. Many of these uncertainties are not precisely quantifiable and require significant judgment on our part. As trends in underlying claims develop, particularly in so-called “long tail”, we are sometimes required to revise our reserves. This results in a charge to our earnings in the amount of the adjusted reserves, recorded in the period the change in estimate is made. These charges can be substantial and can potentially have a material impact, either positively or negatively, on our calendar year results of operations and shareholders’ equity. |
- 18 -
| · | A significant portion of the risk underwritten by the insurance subsidiaries covers property losses resulting from catastrophic events on a worldwide basis. The occurrence and valuation of loss events for this business is highly unpredictable and a single catastrophic event could result in a materially significant loss to the Company. Catastrophe losses are an inevitable part of our business. Various events can cause catastrophe losses, including hurricanes, windstorms, earthquakes, hail, explosions, severe winter weather, and fires, and their frequency and severity are inherently unpredictable. In addition, longer-term natural catastrophe trends may be changing and new types of catastrophe losses may be developing due to climate change, a phenomenon that has been associated with extreme weather events linked to rising temperatures, and includes effects on global weather patterns, greenhouse gases, sea, land and air temperatures, sea levels, rain, and snow. The extent of our losses from catastrophes is a function of both the total amount of our insured exposures in the affected areas and the severity of the events themselves. In addition, as in the case of catastrophic losses generally, it can take many months, or even years, for the ultimate cost to us to be finally determined. As our claim experience develops on a particular catastrophe, we may be required to adjust our reserves to reflect our revised estimates of the total cost of claims. While the eventual occurrence of catastrophic losses is expected, we are prohibited by U.S. generally accepted accounting principles from establishing reserves for the expected future occurrence of these losses (such as is done in the life insurance industry). Accordingly, upon the occurrence of such a loss, it will likely have a material adverse impact on the Company’s results of operations in the quarter in which it occurs. |
| · | The Company derives a significant percentage of its direct premium volume from FedEx Ground Systems, Inc. (“FedEx Ground”) and certain of its subsidiaries and related entities, and from insurance coverage provided to independent service providers under contract with FedEx Ground. While the loss of this major customer could severely reduce the Company’s revenue and earnings potential, insurance programs provided to FedEx Ground and programs provided to the independent service providers under contract with FedEx Ground are not necessarily dependent upon one another and, therefore, could be viewed as separate entities. |
| · | The Company, through its Insurance Subsidiaries, requires collateral from its insureds covering the insureds’ obligations for self-insured retentions or deductibles related to policies of insurance provided. Should the Company, as surety, become responsible for such insured obligations, the collateral held may prove to be insufficient. In this regard, FedEx Ground and certain of its subsidiaries and related entities, utilizes significant self-insured retentions and deductibles under policies of insurance provided by the Company’s insurance subsidiaries. In the case of FedEx Ground, the Company has determined that the financial strength of the customer is sufficient to allow for holding only partial collateral at this time. Should the Company become responsible for this customer’s self-insured retention and deductible obligations, the collateral held could be insufficient and the Company could sustain a significant operating loss. |
| · | Given the Company’s significant interest-bearing investment portfolio, a drop in interest rates would have an adverse impact on the Company’s earnings and financial position. Conversely, an increase in interest rates could have a significant temporary impact on the market value of the Company’s fixed maturity investment portfolio. The functioning of the fixed income markets, the values of the investments the Company holds and the Company’s ability to liquidate them may be adversely affected if those markets are disrupted by a change in interest rates or otherwise affected by significant negative factors, including, without limitation: local, national, or international events, such as regulatory changes, wars, or terrorist attacks; a recession, depression, or other adverse developments in either the U.S. or other economies that adversely affects the value of securities held in the Company’s portfolio; financial weakness or failure of one or more financial institutions that play a prominent role in securities markets or act as a counterparty for various financial instruments, which could further disrupt the markets; inactive markets for specific kinds of securities, or for the securities of certain issuers or in certain sectors, which could result in decreased valuations and impact the Company’s ability to sell a specific security or a group of securities at a reasonable price when desired; a significant change in inflation expectations, or the onset of deflation or stagflation. If the fixed-income portfolio were to suffer a decrease in value to a substantial degree, the Company’s liquidity, financial position, and financial results could be materially adversely affected. Under these circumstances, the Company’s income from these investments could be materially reduced, and declines in the value of certain securities could further reduce the Company’s results of operations, equity, business and insurer financial strength. |
| · | The Company has a large portfolio of equity securities and limited partnership investments which can fluctuate in value with a wide variety of market conditions. A decline in the aggregate value of the equity securities and limited partnership investments would result in a commensurate decline in the Company’s shareholders equity, either through the income statement or directly to surplus. The resultant decline could, at least temporarily, materially adversely affect the Company’s results of operations, equity, business and insurer financial strength. |
- 19 -
Item 2. PROPERTIES
The Company leases office space at 1099 North Meridian Street, Indianapolis, Indiana. This building is located approximately one mile from downtown Indianapolis. The lease covers approximately 81,000 square feet and expires in August, 2013. In March, 2013, the Company purchased a building and the adjacent real estate in Carmel, Indiana, approximately 13 miles from its present leased premises, and will relocate all operations to this new building by the end of August, 2013. The new building contains a total of 184,000 usable square feet and the Original 10-K.Company intends to occupy approximately 60% of this space with the remainder being leased to non-affiliated entities.
The Company also owns a building and the adjacent real estate approximately eleven miles from its main office (nine miles from the new office headquarters in Carmel, Indiana). The building contains approximately 15,000 square feet of usable space, and is used primarily for off-site data storage and as a contingent back up and disaster recovery site.
The Company's entire operations are conducted from these facilities. The current and new facilities are expected to be adequate for the Company's operations for the foreseeable future.
Item 3. LEGAL PROCEEDINGS
In the ordinary, regular and routine course of their business, the Company and its Insurance Subsidiaries are frequently involved in various matters of litigation relating principally to claims for insurance coverage provided. No currently pending matter is deemed by management to be material to the Company.
Item 4. SUBMISSION OF MATTERS TO A VOTE OF SECURITY HOLDERS
Nothing to report.
Space intentionally left blank
- 20 -
PART II
Item 5. MARKET FOR REGISTRANT'S COMMON EQUITY AND RELATED STOCKHOLDER MATTERS
The Company’s Class A and Class B common stocks are traded on The NASDAQ Stock Market® under the symbols BWINA and BWINB, respectively. The Class A and Class B common shares have identical rights and privileges except that Class B shares have no voting rights other than on matters for which Indiana law requires class voting. As of December 31, 2012, there were approximately 400 record holders of Class A Common Stock and approximately 1,000 record holders of Class B Common Stock.
The table below sets forth the range of high and low sale prices for the Class A and Class B Common Stock for 2012 and 2011, as reported by NASDAQ and published in the financial press. The quotations reflect interdealer prices without retail markup, markdown or commission and do not necessarily represent actual transactions.
| Cash | ||||||||||||||||||||
| Class A | Class B | Dividends | ||||||||||||||||||
| High | Low | High | Low | Declared | ||||||||||||||||
| 2012: | ||||||||||||||||||||
| Fourth Quarter | $ | 24.41 | $ | 22.01 | $ | 24.50 | $ | 21.36 | $ | .25 | ||||||||||
| Third Quarter | 23.99 | 21.43 | 24.33 | 21.71 | .25 | |||||||||||||||
| Second Quarter | 25.80 | 20.51 | 23.50 | 20.41 | .25 | |||||||||||||||
| First Quarter | 24.99 | 21.12 | 23.58 | 20.37 | .25 | |||||||||||||||
| 2011: | ||||||||||||||||||||
| Fourth Quarter | 25.43 | 21.41 | 24.40 | 20.22 | .25 | |||||||||||||||
| Third Quarter | 26.50 | 23.00 | 25.58 | 20.02 | .25 | |||||||||||||||
| Second Quarter | 27.00 | 20.72 | 24.46 | 21.51 | .25 | |||||||||||||||
| First Quarter | 22.39 | 19.99 | 24.54 | 21.22 | .25 | |||||||||||||||
The Company has paid quarterly cash dividends continuously since 1974. The current regular quarterly dividend rate is $.25 per share. The Company expects to continue its policy of paying regular cash dividends although there is no assurance as to future dividends because they are dependent on future earnings, capital requirements and financial conditions and are subject to regulatory restrictions. At times, the Company has paid an extra cash dividend in recognition of the Company’s more than adequate capitalization and favorable earnings. The Board intends to address the subject of dividends at each of its future meetings considering the Company’s earnings, returns on investments and its capital needs; however, shareholders should not expect extra dividends, if any, in the future to follow any predetermined pattern.
- 21 -
Corporate Performance
The following graph shows a five year comparison of cumulative total return for the Corporation’s Class B common shares, the NASDAQ Insurance Stock Index and the Russell 2000 Index. The basis of comparison is a $100 investment at December 31, 2007, in each of (i) Baldwin & Lyons, Inc., (ii) Nasdaq Insurance Stocks, and (iii) the Russell 2000 Index. All dividends are assumed to be reinvested.
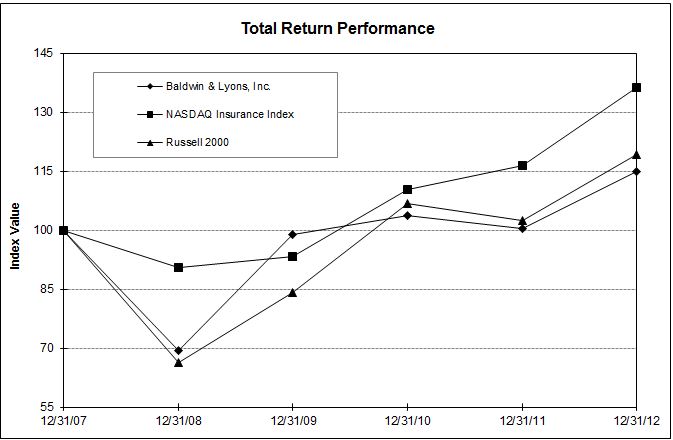
| Period Ending | ||||||||||||||||||||||||
| Index | 12/31/07 | 12/31/08 | 12/31/09 | 12/31/10 | 12/31/11 | 12/31/12 | ||||||||||||||||||
| Baldwin & Lyons, Inc. | 100.00 | 69.48 | 98.94 | 103.59 | 100.27 | 114.84 | ||||||||||||||||||
| NASDAQ Insurance Index | 100.00 | 90.40 | 93.38 | 110.31 | 116.52 | 136.14 | ||||||||||||||||||
| Russell 2000 | 100.00 | 66.21 | 84.20 | 106.82 | 102.36 | 119.09 | ||||||||||||||||||
- 22 -
Item 6. SELECTED FINANCIAL DATA
| Year Ended December 31 | ||||||||||||||||||||
| 2012 | 2011 | 2010 | 2009 | 2008 | ||||||||||||||||
| (Dollars in thousands, except per share data) | ||||||||||||||||||||
| Direct and assumed premiums written | $ | 341,286 | $ | 334,526 | $ | 295,802 | $ | 250,159 | $ | 221,942 | ||||||||||
| Net premiums earned | 237,461 | 244,570 | 214,738 | 181,300 | 182,299 | |||||||||||||||
| Net investment income | 9,930 | 10,729 | 11,335 | 13,971 | 17,063 | |||||||||||||||
| Net gains (losses) on investments | 9,011 | (17,803 | ) | 16,485 | 30,816 | (47,750 | ) | |||||||||||||
| Losses and loss expenses incurred | 138,088 | 215,555 | 145,952 | 99,351 | 115,752 | |||||||||||||||
| Net income (loss) | 31,919 | (28,175 | ) | 25,015 | 44,802 | (7,713 | ) | |||||||||||||
Earnings per share -- net income (loss) 1 | 2.15 | (1.90 | ) | 1.69 | 3.04 | (.51 | ) | |||||||||||||
Cash dividends per share 2 | 1.00 | 1.00 | 2.25 | 1.00 | 1.00 | |||||||||||||||
Investment portfolio 3 | 681,856 | 637,681 | 635,174 | 622,085 | 545,491 | |||||||||||||||
| Total assets | 983,024 | 905,294 | 837,946 | 851,315 | 777,743 | |||||||||||||||
| Shareholders' equity | 346,712 | 319,061 | 368,735 | 372,943 | 330,067 | |||||||||||||||
| Cost of treasury shares purchased | - | - | - | 880 | 8,908 | |||||||||||||||
Book value per share 1 | 23.25 | 21.49 | 24.90 | 25.31 | 22.32 | |||||||||||||||
Underwriting ratios 4 | ||||||||||||||||||||
| Losses and loss expenses | 58.1 | % | 88.1 | % | 68.0 | % | 54.8 | % | 63.5 | % | ||||||||||
| Underwriting expenses | 30.8 | % | 30.2 | % | 31.0 | % | 35.8 | % | 30.9 | % | ||||||||||
| Combined | 88.9 | % | 118.3 | % | 99.0 | % | 90.6 | % | 94.4 | % | ||||||||||
1 Earnings and book value per share are adjusted for the dilutive effect of stock options outstanding.
| 2 | Includes extra dividend of $1.25 for 2010. |
| 3 | Includes money market instruments classified with cash in the Consolidated Balance Sheets. |
| 4 | Data is for all coverages combined, does not include fee income and is presented based upon U.S. generally accepted accounting principles. |
- 23 -
Item 7. MANAGEMENT'S DISCUSSION AND ANALYSIS OF FINANCIAL CONDITION AND
RESULTS OF OPERATIONS
Liquidity and Capital Resources
The primary sources of the Company’s liquidity are (1) funds generated from insurance operations including net investment income, (2) proceeds from the sale of investments and (3) proceeds from maturing investments. The Company generally experiences positive cash flow from operations resulting from the fact that premiums are collected on insurance policies in advance of the disbursement of funds in payment of claims. Operating costs of the insurance subsidiaries, other than loss and loss expense payments, generally average less than 30% of net premiums earned on a consolidated basis and the remaining amount is available for investment for varying periods of time depending on the type of insurance coverage provided. Because losses are often settled in periods subsequent to when they are incurred, operating cash flows may, at times, become negative as loss settlements on claim reserves established in prior years exceed current revenues. During 2012, cash flow from operations totaled $55.8 million which is consistent with the $54.3 million total for 2011.
For several years, the Company’s investment philosophy has emphasized the purchase of short-term bonds with maximum quality and liquidity. As flat yield curves have not provided incentive to lengthen maturities in recent years, the Company has continued to maintain its fixed maturity portfolio at short-term levels. While the average contractual life of the Company’s bond and short-term investment portfolio increased from 3.1 to 3.6 years during 2012, the average duration of the Company’s fixed maturity portfolio remains much shorter than the contractual maturity average and significantly shorter than the duration of the Company’s liabilities. The Company also remains an active participant in the equity securities market using capital which is in excess of amounts considered necessary to fund current operations. The long-term horizon for the Company’s equity investments allows it to invest in positions where ultimate value, and not short-term market fluctuation, is the primary focus. Investments made by the Company’s domestic insurance subsidiaries are regulated by guidelines promulgated by the National Association of Insurance Commissioners which are designed to provide protection for both policyholders and shareholders.
The Company’s assets at December 31, 2012 included $68.7 million in short-term and cash equivalent investments which are readily convertible to cash without market penalty and an additional $150.7 million of fixed maturity investments (at par) maturing in less than one year. The Company believes that these liquid investments, plus the expected cash flow from current operations, are more than sufficient to provide for projected claim payments and operating cost demands. In the event competitive conditions produce inadequate premium rates and the Company chooses to further restrict volume, the liquidity of its investment portfolio would permit management to continue to pay claims as settlements are reached without requiring the disposal of investments at a loss, regardless of interest rates in effect at the time. In addition, the Company’s reinsurance program is structured to avoid significant cash outlays that accompany large losses.
Net premiums written by the Company’s insurance subsidiaries for 2012 equaled approximately 55% of the combined statutory surplus of these subsidiaries. Premium writings of 100% to 200% of surplus are generally considered acceptable by regulatory authorities. Further, the statutory capital of each of the insurance subsidiaries substantially exceeds minimum risk based capital requirements set by the National Association of Insurance Commissioners. Accordingly, the Company has the ability to significantly increase its business without seeking additional capital to meet regulatory guidelines.
At December 31, 2012, $86.1 million, or 25% of shareholders’ equity, represented net assets of the Company’s insurance subsidiaries which, at that time, could not be transferred in the form of dividends, loans or advances to the parent company because of minimum statutory capital requirements. However, management believes that these restrictions pose no material liquidity concerns for the Company. The financial strength and stability of the subsidiaries permit ready access by the parent company to short-term and long-term sources of credit. The Company maintains a $30 million unsecured line of credit and has $10.0 million of drawings outstanding on this line at December 31, 2012, the proceeds of which were used principally for general corporate purposes.
- 24 -
Results of Operations
2012 Compared to 2011
Direct premiums written for 2012 totaled $284.2 million, an increase of $10.1 million (4%) from 2011. This increase is primarily attributable to (1) a $23.5 million (11%) increase in premiums generated by fleet transportation products attributable to increased revenue and miles driven by our insureds, which is immediately reflected in premium, and the addition of several new accounts during 2012; and (2) an increase of $6.3 million in premiums generated by planned growth in the Company’s relatively new professional liability business, partially offset by decreases of (1) $15.2 million in premiums generated by commercial multi-peril business as the result of management’s decision to exit this business as part of its program to limit property catastrophe exposures; and (2) $6.0 million from personal automobile products attributable to rate increases instituted late in 2011 and throughout 2012 which returned this product line to profitability but restricted premium volume. Premiums ceded to reinsurers on direct business averaged 37.1% for 2012 compared to 30.7 % for 2011, with the increase attributable to increased direct premium writings in products which are more heavily reinsured.
Written premiums assumed from other insurers and reinsurers totaled $57.1 million during 2012, a decrease of $3.3 million (6%) from 2011. Premiums generated by property reinsurance products decreased $4.6 million (12%), reflective of management’s decision to terminate certain retrocessions effective January 1, 2012, with runoff through July 1, 2012. Partially offsetting the property decrease was an increase of $1.3 million (6%) in the Company’s growing book of professional liability reinsurance assumed.
After giving effect to changes in unearned premiums, consolidated net premiums earned totaled $237.5 million for 2012 compared to $244.6 million for 2011, a decrease of 2.9%. This decrease is in line with the commercial multi-peril, property assumed and personal automobile product reductions mentioned above which were largely offset by increased premium written in fleet transportation and professional liability.
Pre-tax investment income of $9.9 million during 2012 was 7% lower than the 2011 total as pre-tax yields were down nearly 14% on average, reflecting continuing depressed worldwide available rates, principally on shorter-term investments. After tax investment income decreased by a 9% during 2012, compared to the prior year.
Net gains on investments, before taxes, totaled $9.0 million in 2012 compared to net losses on investments of $17.8 million during 2011. Both years’ results were heavily influenced by limited partnership results with gains of $7.0 million in 2012 and losses of $21.9 million in 2011. Limited partnership ventures utilized by the Company are primarily engaged in the trading of public and private securities, including foreign securities and, to a lesser extent, small venture capital activities and real estate development. The aggregate of the Company’s share of gains in these entities represented a 13% appreciation in value for 2012 compared to a decline in value of 29% for 2011. To the extent that accounting rules require the limited partnerships to include realized and unrealized gains or losses in their net income, the Company’s proportionate share of net income will include the results as reported to the Company by the various general partners. During 2012, the $7.0 million net gain was composed of $8.6 million attributable to an increase in unrealized gains and $1.6 million attributable to realized losses. Recoveries of $1.3 million on previously impaired available-for-sale securities that were sold in 2012 are included in the net gains stated above.
Losses and loss expenses incurred during 2012 decreased $77.5 million (36%) from 2011 to $138.1 million, with virtually all of the decrease attributable to a decrease in major catastrophe losses of $65.6 million with the remainder associated with the decreased premium volume described above. The 2012 consolidated loss and loss expense ratio was 58.1% compared to 88.1% for 2011. The Company's loss and loss expense ratios for major product lines are summarized in the following table:
| 2012 | 2011 | ||||
| Fleet transportation | 66.8 | % | 68.8 | % | |
| Private passenger automobile | 65.2 | 72.2 | |||
| Commercial multi-peril | 45.9 | 50.8 | |||
| Professional liability | 67.5 | 68.6 | |||
| Property reinsurance | 11.1 | 202.9 | |||
| Casualty reinsurance | 61.4 | 60.6 | |||
| Residual market and all other | 98.2 | 144.3 | |||
| All lines | 58.1 | 88.1 | |||
- 25 -
The fleet transportation loss ratio was impacted by factors such as fluctuations in premium volume, the levels of self-insured retentions and the high policy limits which allow for more volatility in losses. The property reinsurance loss ratio was much lower in 2012 due to the lack of any major catastrophic losses to the Company, including a lack of significant impact from Superstorm Sandy late in the year. Losses from large catastrophic events during 2012 totaled just $1.0 million, compared to $66.6 million during 2011, a record year for international catastrophic events.
The Company produced an overall savings on the handling of prior year claims during 2012 of $9.9 million. This net savings is included in the computation of loss ratios shown in the previous table, as is the similar $9.7 million savings produced during 2011 on prior year claims. The $7.1 million net savings attributable to the property and casualty insurance segment was distributed among all of the Company’s products, with the majority attributable to the Company's fleet transportation and personal automobile businesses, and is generally consistent with recent prior years. The $2.8 million savings attributable to the reinsurance segment related solely to property catastrophe business. Because of the high limits provided by the Company to its fleet transportation insureds, the length of time necessary to settle larger, more complex claims and the volatility of the fleet transportation liability insurance business, the Company believes it is important to take a conservative posture in its reserving process. As claims are settled in years subsequent to their occurrence, the Company's claim handling process has, historically, tended to produce savings from the reserves provided. Changes in both gross premium volumes and the Company's reinsurance structure for its fleet transportation business can have a significant impact on future loss developments and, as a result, loss and loss expense ratios and prior year reserve development may not be consistent year to year.
Other operating expenses for 2012, before credits for ceding allowances from reinsurers, increased $7.8 million (9%) to $92.6 million. This increase is due primarily to a $5.3 million increase in salary related expenses, reflective of the Company’s growing workforce in response to the continued expansion of the Company’s products and services and the fact that incentive bonuses were eliminated in 2011 in light of the significant operating loss sustained that year. In addition, expenses attributable to continual upgrade to the Company’s automation systems and taxes based on income increased during 2012.
Reinsurance ceded credits were $3.7 million (32%) higher in 2012, resulting from increased business ceded to other companies under quota share reinsurance treaties which provide commissions to the Insurance Subsidiaries. After consideration of these expense offsets, operating expenses increased $4.1 million, or 6% from the prior year.
A portion of the Company’s fleet transportation business is produced by the direct sales efforts of Baldwin & Lyons, Inc. employees and, accordingly, this business does not incur commission expense on a consolidated basis. Rather, the expenses of the agency operations, including salaries and bonuses of salesmen, travel expenses, etc. is included in operating expenses. In general, commissions paid by the Insurance Subsidiaries to the parent company exceed related acquisition costs incurred in the production of the property and casualty insurance business. The ratio of net operating expenses of the insurance subsidiaries to net premiums earned was 30.8% in 2012 and 30.2% in 2011. Including the agency operations and corporate expenses, and after elimination of inter-company commissions, the ratio of operating expenses to operating revenue (defined as total revenue less gains (losses) on investments) was 30.6% for 2012 compared with 28.1% for 2011 with the current year increase being attributable to higher salary expense as noted above.
The effective federal tax rate on the consolidated pre-tax loss for 2012 was 31.5%. The effective rate differs from the normal statutory rate primarily as a result of tax-exempt investment income.
Net income for 2012 of $31.9 million compares to a net loss of $28.2 million during catastrophe-plagued 2011. Diluted earnings per share of $2.15 were recorded in 2012 compared to per share loss of $1.90 in 2011.
- 26 -
2011 Compared to 2010
Direct premiums written for 2011 totaled $274.1 million, an increase of $24.4 million (10%) from 2010. The increase is primarily attributable to $23.7 million (13%) in premiums generated by fleet transportation products and $9.5 million in premiums generated by the professional liability business launched in 2010. Premiums ceded to reinsurers on direct business increased $8.2 million (11%) during 2011 to $84.1 million, as the consolidated percentage of premiums ceded to direct premiums written remained relatively level at 30.7% for 2011 compared to 30.4 % for 2010.
Written premiums assumed from other insurers and reinsurers totaled $60.4 million during 2011, an increase of $14.3 million (31%) from 2010. The increase is related almost entirely to the expansion of the Company’s professional liability reinsurance business which was also launched in 2010. Premium ceded related to the reinsurance assumed business remained level with the 3% average rate from 2010.
After giving effect to changes in unearned premiums, net premiums earned totaled $244.6 million for 2011 compared to $214.7 million for 2010, an increase of 13.9%. These changes are in line with expectations and result from product expansion and continuing marketing efforts in the Property and Casualty Insurance segment and from the continued growth of professional liability reinsurance within the Reinsurance segment.
Pre-tax investment income of $10.7 million during 2011 was 5% lower than the 2010 total as pre-tax yields were down nearly 8% on average, reflecting continuing depressed worldwide available rates, principally on short-term investments. After tax investment income decreased by a similar 6% during 2011, compared to the prior year.
Net losses on investments, before taxes, totaled $17.8 million in 2011 compared to net gains on investments of $16.5 million during 2010. The net losses in 2011 are attributable to $21.9 million in limited partnerships net losses partially offset by $4.1 million in fixed maturity and equity security net direct trading gains. The aggregate of the Company’s share of losses in these entities represented a 29% decline in value for 2011 compared to an appreciation in value of 12% for 2010. During 2011, approximately $20.6 million (94%) of the net loss was attributable to a reduction in unrealized gains and only 6% resulted from realized transactions. Recoveries of $1.3 million on previously impaired available-for-sale securities that were sold in 2011 are included in the fixed maturity and equity security net gains stated above. See additional comments related to limited partnerships included in the comparison of 2012 to 2011, above.
Losses and loss expenses incurred during 2011 increased $69.6 million (48%) to $215.6 million with virtually all of the increase attributable to catastrophe losses of $66.6 million with the remainder attributable to increased premium volume. The 2011 consolidated loss and loss expense ratio was 88.1% compared to 68.0% for 2010. The Company's loss and loss expense ratios for major product lines are summarized in the following table.
| 2011 | 2010 | ||||
| Fleet transportation | 68.8 | % | 58.8 | % | |
| Private passenger automobile | 72.2 | 85.0 | |||
| Commercial multi-peril | 50.8 | 47.0 | |||
| Professional liability | 68.6 | N/M | |||
| Property reinsurance | 202.9 | 94.9 | |||
| Casualty reinsurance | 60.6 | 68.0 | |||
| Residual market and all other | 144.3 | 127.7 | |||
| All lines | 88.1 | 68.0 | |||
The fleet transportation loss ratio was impacted by factors such as fluctuations in premium volume, the levels of self-insured retentions and the high policy limits which allow for more volatility in losses. The property reinsurance loss ratio was higher in 2011 as the result of a historically unprecedented number of significant world-wide catastrophe losses. Losses from large catastrophic events during 2011 totaled $66.6 million compared to $25.2 million during 2010, itself a historically severe year for international catastrophic events.
- 27 -
The Company produced an overall savings on the handling of prior year claims during 2011 of $9.7 million. This net savings is included in the computation of loss ratios shown in the previous table, as is the $8.8 million savings produced during 2010 on prior year claims. The $7.4 million net savings attributable to the property and casualty insurance business was distributed among all of the Company’s products, with the majority attributable to the Company's fleet transportation and personal automobile businesses, and is generally consistent with recent prior years. See additional comments related to prior year loss developments included in the comparison of 2012 to 2011, above.
Other operating expenses for 2011, before credits for allowances from reinsurers, increased $6.0 million (8%) to $84.8 million. This increase is due primarily to a $6.2 million increase in commission expense partially offset by decreases in salary related expenses and taxes, licenses and fees. The higher commissions reflect expansion of the Company’s distribution channels to additional non-affiliated agents.
Reinsurance ceded credits were $1.4 million (14%) higher in 2011, resulting from increased gross premiums written on business ceded to other companies under quota share reinsurance treaties which provide commissions to the Insurance Subsidiaries. After consideration of these expense offsets, operating expenses increased $4.6 million, or 7% from the prior year, well below the increase in net premiums earned, as noted above.
A portion of the Company’s fleet transportation business is produced by the direct sales efforts of Baldwin & Lyons, Inc. employees and, accordingly, this business does not incur commission expense on a consolidated basis. Rather, the expenses of the agency operations, including salaries and bonuses of salesmen, travel expenses, etc. is included in operating expenses. In general, commissions paid by the insurance subsidiaries to the parent company exceed related acquisition costs incurred in the production of the property and casualty insurance business. The ratio of net operating expenses of the insurance subsidiaries to net premiums earned was 30.2% in 2011 and 31.0% in 2010. Including the agency operations and corporate expenses, and after elimination of inter-company commissions, the ratio of operating expenses to operating revenue (defined as total revenue less gains (losses) on investments) was 28.1% for 2011 compared with 29.5% for 2010 with the decreases in both cases attributable to the fact that expenses grew at a slower pace than premium volume.
The effective federal tax rate on the consolidated pre-tax loss for 2011 was 37.8%. The effective rate differs from the normal statutory rate primarily as a result of tax-exempt investment income.
Due to an unprecedented amount of significant catastrophic losses coupled with significant net investment losses, the Company experienced net loss for 2011 of $28.2 million compared to net income of $25.0 million for 2010. Diluted earnings per share loss of $1.90 were recorded in 2011 compared to per share income of $1.69 in 2010.
Critical Accounting Policies
The Company’s significant accounting policies which are material and/or subject to significant degrees of judgment are highlighted below.
Investment Valuation
All marketable securities are included in the Company’s balance sheets at current fair market value.
Approximately 69% of the Company’s assets are composed of investments at December 31, 2012. Approximately 91% of these investments are publicly-traded, owned directly and have readily-ascertainable market values. The remaining 9% of investments are composed primarily of minority interests in several limited partnerships. These
- 28 -
limited partnerships are engaged in the trading of public and non-public equity securities and debt, hedging transactions, real estate development and venture capital investment. These partnerships, themselves, do not have readily-determinable market values. Rather, the values recorded are those provided to the Company by the respective partnerships based on the underlying assets of the partnerships. While the majority of the underlying assets are publicly-traded securities, those which are not publically traded have been valued by the respective partnerships using their experience and judgment.
Under FASB guidance, if a fixed maturity security is in an unrealized loss position and the Company has the intent to sell the security, or it is more likely than not that the Company will have to sell the security before recovery of its amortized cost basis, the decline in value is deemed to be other-than-temporary and is recorded to net realized losses on investments in the consolidated statements of operations. For impaired fixed maturity securities that the Company does not intend to sell or it is more likely than not that the Company will not have to sell such securities, but the Company expects that it will not fully recover the amortized cost basis, the credit component of the other-than-temporary impairment is recognized in net realized losses on investments in the consolidated statements of operations and the non-credit component of the other-than-temporary impairment is recognized directly in shareholder’s equity (accumulated other comprehensive income).
In determining if and when an equity security’s decline in market value below cost is other-than-temporary, we first make an objective analysis of each individual equity security where current market value is less than cost. For any equity security where the unrealized loss exceeds 20% of original or adjusted cost, and where that decline has existed for a period of at least six months, the decline is treated as an other-than-temporary impairment, without any subjective evaluation as to possible future recovery. For individual issues where the decline in value is less than 20% but the amount of the decline is considered significant, we will also evaluate the market conditions, trends of earnings, price multiples and other key measures for the securities to determine if it appears that the decline is other-than-temporary. In those instances, the Company also considers its intent and ability to hold equity investments until recovery can be reasonably expected. For any decline which is considered to be other-than-temporary, we recognize an impairment loss in the current period earnings as an investment loss. Declines which are considered to be temporary are recorded as a reduction in shareholders’ equity, net of related federal income tax credits.
It is important to note that all available for sale securities included in the Company’s financial statements are valued at current fair market values. The evaluation process for determination of other-than-temporary decline in value of investments, as described above, does not change these valuations but, rather, determines when a decline in value will be recognized in the income statement (other-than-temporary decline) as opposed to a charge to shareholders’ equity (temporary decline). Another aspect of this accounting policy which is important to understand is that any subsequent recovery in value of investments which have incurred other-than-temporary impairment adjustments are accounted for as unrealized gains until the security is actually disposed of or sold. At December 31, 2012, unrealized gains include $8.3 million of appreciation on investments previously adjusted for other-than-temporary impairment, compared to $7.8 million of impairment write-downs at that date. This evaluation process is subject to risks and uncertainties since it is not always clear what has caused a decline in value of an individual security or since some declines may be associated with general market conditions or economic factors which relate to an industry, in general, but not necessarily to an individual issue. The Company has attempted to minimize many of these uncertainties by adopting a largely objective evaluation process as described above. However, to the extent that certain declines in value are reported as unrealized at December 31, 2012, it is possible that future earnings charges will result should the declines in value increase or persist or should the security actually be disposed of while market values are less than cost. At December 31, 2012, the total gross unrealized loss included in the Company’s investment portfolio was approximately $2.9 million. No individual issue constituted a material amount of this total. Had this entire amount been considered other-than-temporary at December 31, 2012, there would have been no impact on total shareholders’ equity or book value since the decline in value of these securities was recognized as a reduction to shareholders’ equity.
- 29 -
Reinsurance Recoverable
Reinsurance ceded transactions were as follows for the years ended December 31 (dollars in thousands):
| 2012 | 2011 | 2010 | ||||||||||
| Premium ceded (reduction to premium earned) | $ | 103,712 | $ | 85,493 | $ | 73,119 | ||||||
| Losses ceded (reduction to losses incurred) | 90,899 | 56,600 | 17,581 | |||||||||
| Commissions from reinsurers (reduction to operating expenses) | 15,185 | 11,503 | 10,081 | |||||||||
A discussion of the Company’s reinsurance strategies is presented in Item 1, Business, on page 3.
Amounts recoverable under the terms of reinsurance contracts comprise approximately 18% of total Company assets as of December 31, 2012. In order to be able to provide the high limits required by the Company’s insureds, we share a significant amount of the insurance risk of the underlying contracts with various insurance entities through the use of reinsurance contracts. Some reinsurance contracts provide that a loss be shared among the Company and its reinsurers on a predetermined pro-rata basis (“quota-share”) while other contracts provide that the Company keep a fixed amount of the loss, similar to a deductible, with reinsurers taking all losses above this fixed amount (“excess of loss”). Some risks are covered by a combination of quota-share and excess of loss contracts. The computation of amounts due from reinsurers is based upon the terms of the various contracts and follows the underlying estimation process for loss and loss expense reserves, as described below. Accordingly, the uncertainties inherent in the loss and loss expense reserving process also affect the amounts recorded as recoverable from reinsurers. Estimation uncertainties are greatest for claims which have occurred but which have not yet been reported to the Company. Further, the high limits provided by the Company’s insurance policies for fleet transportation liability, workers’ compensation and professional liability risks provide more variability in the estimation process than lines of business with lower coverage limits.
It should be noted, however, that a change in the estimate of amounts due from reinsurers on unpaid claims will not, in itself, result in charges or credits to losses incurred. This is because any change in estimated recovery follows the estimate of the underlying loss. Thus, it is the computation of the gross underlying loss that is critical.
As with any receivable, credit risk exists in the recoverability of reinsurance. This may be even more pronounced than in normal receivable situations since recoverable amounts are not generally due until the loss is settled which, in some cases, may be many years after the contract was written. If a reinsurer is unable, in the future, to meet its financial commitments under the terms of the contracts, the Company would be responsible to satisfy the reinsurer's portion of the loss. The financial condition of each of the Company’s reinsurers is initially determined upon the execution of a given treaty and only reinsurers with the superior credit ratings available are utilized. However, as noted above, reinsurers are often not called upon to satisfy their obligations for several years and changes in credit worthiness can occur in the interim period. Reviews of the current financial strength of each reinsurer are made frequently and, should impairment in the ability of a reinsurer be determined to exist, current year operations would be charged in amounts sufficient to provide for the Company’s additional liability. Such charges are included in other operating expenses, rather than losses and loss expenses incurred, since the inability of the Company to collect from reinsurers is a credit loss rather than a deficiency associated with the loss reserving process.
Space intentionally left blank
- 30 -
Loss and Loss Expense Reserves
The Company’s loss and loss expense reserves for each segment are shown in the following table on both a gross (before consideration of reinsurance) and on a net of reinsurance basis at December 31, 2012 and 2011 (dollars in thousands).
| Direct and Assumed | Net | |||||||||||||||
| Line of Business (Segment) | 2012 | 2011 | 2012 | 2011 | ||||||||||||
| Property and casualty insurance | $ | 373,667 | $ | 330,683 | $ | 221,569 | $ | 199,219 | ||||||||
| Reinsurance | 81,787 | 90,873 | 67,667 | 90,873 | ||||||||||||
| $ | 455,454 | $ | 421,556 | $ | 289,236 | $ | 290,092 | |||||||||
The Company’s reserves for losses and loss expenses (“reserves”) are determined based on complex estimation processes using historical experience, current economic information and, when necessary, available industry statistics. Reserves are evaluated in three basic categories (1) “case basis”, (2) “incurred but not reported” and (3) “loss adjustment expense” reserves. Case basis reserves are established for specific known loss occurrences at amounts dependent upon various criteria such as type of coverage, severity and the underlying policy limits, as examples. Case basis reserves are generally estimated by experienced claims adjusters using established Company guidelines and are subject to review by claims management. Incurred but not reported reserves, which are established for those losses which have occurred, but have not yet been reported to the Company, are not linked to specific claims but are computed on a “bulk” basis. Common actuarial methods are employed in the establishment of incurred but not reported loss reserves using company historical loss data, consideration of changes in the Company’s business and study of current economic trends affecting ultimate claims costs. Loss adjustment expense reserves, or reserves for the costs associated with the investigation and settlement of a claim, are also bulk reserves representing the Company’s estimate of the costs associated with the claims handling process. Loss adjustment expense reserves include amounts ultimately allocable to individual claims as well as amounts required for the general overhead of the claims handling operation that are not specifically allocable to individual claims. Historical analyses of the ratio of loss adjusting expenses to losses paid on prior closed claims and review of current economic trends affecting loss settlement costs are used to estimate the loss adjustment reserve needs related to the established loss reserves. Each of these reserve categories contain elements of uncertainty which assure variability when compared to the ultimate costs to settle the underlying claims for which the reserves are established. The reserving process requires management to continuously monitor and evaluate the life cycle of claims based on the class of business and the nature of claims. The Company’s claims range from the very routine private passenger automobile “fender bender” to the highly complex and costly third party bodily injury claim involving large tractor-trailer rigs. Reserving for each class of claims requires a set of assumptions based upon historical experience, knowledge of current industry trends and seasoned judgment. The high limits provided in many of the Company’s policies provide for greater volatility in the reserving process for more serious claims. Court rulings, legislative actions and trends in jury awards also play a significant role in the estimation process of larger claims. The Company continuously reviews and evaluates loss developments subsequent to each measurement date and adjusts its reserve estimation assumptions, as necessary, in an effort to achieve the best possible estimate of the ultimate remaining loss costs at any point in time. Changes to previously established reserve amounts are charged or credited to losses and loss expenses incurred in the accounting periods in which they are determined. Note C to the consolidated financial statements includes additional information relating to loss and loss adjustment expense reserve development.
The Company’s methods for determining loss and loss expense reserves are essentially identical for interim and annual reporting periods.
- 31 -
A detailed analysis and discussion for each of the above basic reserve categories follows.
Reserves for known losses (Case reserves)
The Company’s reserves for known claims are determined on an individual case basis and can range from the routine private passenger “fender bender” valued at a few hundred dollars to the very complex long-haul trucking claim involving multiple vehicles, severe injuries and extensive property damage costing several millions of dollars to settle. Each known claim, regardless of complexity, is handled by a claims adjuster experienced with claims of this nature and a “case” reserve, appropriate for the individual loss occurrence, is established. For very routine “short-tail” claims such as private passenger physical damage, the Company records an initial reserve that is based upon historical loss settlements adjusted for current trends. As information regarding the loss occurrence is gathered in the claim handling process, the initial reserve is adjusted to reflect the anticipated ultimate cost to settle the claim. For more complex claims which can tend toward being “long-tail” in nature, an experienced claims adjuster will review the facts and circumstances surrounding the loss occurrence to make a determination of the reserve to be established. Many of the more complex claims involve litigation and necessitate an evaluation of potential jury awards in addition to the factual information to determine the value of each claim. Each claim is frequently monitored and the recorded reserve is increased or decreased relative to information gathered during the settlement life cycle.
Reserves for incurred but not reported losses
The Company uses both standard actuarial techniques common to most insurance companies as well as techniques developed by the Company in consideration of its specialty business products. For its short-tail lines of business, the Company uses predominantly the incurred or paid loss development factor methods. The Company has found that the use of accident quarter loss development triangles, rather than those based upon accident year, are most responsive to claim settlement trends and fluctuations in premium exposures for its short-tail lines. A minimum of 12 running accident quarters is used to project the reserve necessary for incurred but not reported losses for its short-tail lines.
The Company also uses the loss development factor approach for its long-tail lines of business. A minimum of 15 accident years is included in the loss development triangles used to calculate link ratios and the selected loss development factors used to determine the reserves for incurred but not reported losses. A minimum of 20 accident years is used for long-tail workers’ compensation reserve projections. Significant emphasis is placed on the use of tail factors for the Company’s long-tail lines of business.
For the Company’s fleet transportation risks, which are covered by frequently changing reinsurance agreements and which contain wide-ranging self-insured retentions (“SIR”) as low as $25,000 per loss occurrence and as high as several million dollars per occurrence, traditional actuarial methods are supplemented by other methods in consideration of the Company’s exposures to loss. In situations where the Company’s reinsurance structure, the insured’s SIR selections, policy volume, and other factors are changing, current accident period loss exposures may not be homogenous with historical loss data to allow for reliable projection of future developed losses. Therefore, the Company supplements the above-described actuarial methods with loss ratio reserving techniques developed from our databases to arrive at the reserve for losses incurred but not reported for the calendar/accident period under review. Management relies on its extensive historical pricing and loss history databases to produce reserve factors unique to this specialty business. As losses for a given calendar/accident period develop with the passage of time, management evaluates such development on a quarterly basis and adjusts reserve factors, as necessary, to reflect current judgment with regard to the anticipated ultimate incurred losses. This process continues until all losses are settled for each period subject to this method.
Reserves for loss adjustment expenses
While certain of the Company’s products involve case basis reserving for allocated loss adjustment expenses, the majority of such reserves are determined on a bulk basis. The Company uses historical analysis of the ratios of allocated loss adjustment expenses paid to losses paid on closed claims to arrive at the expected ultimate incurred loss adjustment expense factors applicable to each affected product. Once developed, the factors are applied to the expected ultimate incurred losses, including IBNR, on all open claims. The resulting ultimate incurred allocated loss adjustment expense is then reduced by amounts paid to date on all open claims to arrive at the reserve for allocated loss adjustment expenses to be incurred in the future for the handling of specific claims.
- 32 -
For those loss adjustment expenses not specific to individual claims (general claims handling expenses referred to as unallocated loss adjustment expenses) the Company uses standard industry loss adjustment expenses paid to losses paid (net of reinsurance) ratio analysis to establish the necessary reserves. The selected factors are applied to 100% of IBNR reserves and to case reserves with consideration given for that portion of loss adjustment expense already paid at the reserve measurement date. Such factors are monitored and revised, as necessary, on a quarterly basis.
The reserving process requires management to continuously monitor and evaluate the life cycle of claims based on the class of business and the nature of claims. As previously noted, our claims vary widely in scope and complexity. Reserving for each class of claims requires a set of assumptions based upon historical experience, knowledge of current industry trends and seasoned judgment. The high limits provided in the Company’s fleet transportation liability policies provide for greater volatility in the reserving process for more serious claims. Court rulings, legislative actions and trends in jury awards also play a significant role in the estimation process of larger claims. The Company continuously reviews and evaluates loss developments subsequent to each measurement date and adjusts its reserve estimations, as necessary, in an effort to achieve the best possible estimate of the ultimate remaining loss costs at any point in time.
Sensitivity Analysis - Potential impact on reserve volatility from changes in key assumptions
Management is aware of the potential for variation from the reserves established at any particular point in time. Redundancies or deficiencies could develop in future valuations of the currently established loss and loss expense reserve estimates under a variety of reasonably possible scenarios. The Company’s reserve selections are developed to be a “best estimate” of unpaid loss at a point in time and, due to the unique nature of our exposures, particularly in the large fleet transportation excess product where insured’s policies of insurance combine large self-insured retentions with high policy limits, ranges of reserve estimates are not established during the reserving process. However, basic assumptions that could potentially impact future volatility of our valuations of current loss and loss expense reserve estimates include, but are not limited to, the following:
Consistency in the individual case reserving processes
The selection of loss development factors in the establishment of bulk reserves for incurred but reported losses and loss expenses
Projected future loss trend
Expected loss ratios for the current book of business, particularly the Company’s fleet transportation products, where the number of accounts insured, selected self-insured retentions, policy limits and reinsurance structure may vary widely period to period
Under reasonably possible scenarios, it is conceivable that the Company’s selected loss reserve estimates could be 10%, or more, redundant or deficient. The majority of the Company’s reserves for losses and loss expenses, on either a gross or a net of reinsurance basis, relates to its fleet transportation products. Perhaps the most significant example of sensitivity to variation in the key assumptions is the loss ratio selection for the Company’s fleet transportation products for policies subject to certain major reinsurance treaties (approximately $130.6 million, or approximately 34% of carried direct reserves for directly produced property and casualty business). The following table presents the approximate impacts on gross and net loss reserves of both a 10 percentage point and 20 percentage point increase or decrease in the loss factors actually utilized in the Company’s reserve determination at December 31, 2012. The Company’s selection of the range of values presented should not be construed as the Company’s prediction of future events, but rather an illustration of the impact of such events, should they occur:
| 10 Point Increase | 10 Point Decrease | 20 Point Increase | 20 Point Decrease | |
| Gross reserves | $39.4 million | $39.1 million | $78.8 million | $60.0 million |
| Net reserves | $17.6 million | $17.7 million | $32.2 million | $28.1 million |
The variation in impact from loss ratio increases and decreases is attributable to minimum and maximum premium rate factors included in the various reinsurance contracts.
- 33 -
Federal Income Tax Considerations
The liability method is used in accounting for federal income taxes. Using this method, deferred tax assets and liabilities are determined based on differences between financial reporting and tax bases of assets and liabilities and are measured using the enacted tax rates and laws that will be in effect when the differences are expected to reverse. The provision for deferred federal income tax was based on items of income and expense that were reported in different years in the financial statements and tax returns and were measured at the tax rate in effect in the year the difference originated. Net deferred tax liabilities reported at December 31 are as follows (dollars in thousands):
| 2012 | 2011 | |||||||
| Total deferred tax liabilities | $ | 27,551 | $ | 21,068 | ||||
| Total deferred tax assets | 18,973 | 28,187 | ||||||
| Net deferred tax assets (liabilities) | $ | (8,578 | ) | $ | 7,119 | |||
Deferred tax assets at December 31, 2012, include approximately $11.4 million related to the timing of deductibility of loss and loss expense reserves, the majority of which relates to policy liability discounts required by the Internal Revenue Code which are perpetual in nature and, in the absence of the termination of business, will not, in the aggregate, reverse to a material degree in the foreseeable future. An additional $2.7 million relates to impairment adjustments made to investments, as required by accounting regulations. The sizable unrealized gains in the Company’s investment portfolios would allow for the recovery of this deferred tax at any time. Unearned premiums discount and deferred ceding commissions represent $2.1 and $1.7 million of deferred tax assets, respectively. The balance of deferred tax assets consists of various normal operating expense accruals and is not considered to be material. As a result of its analysis, management has determined that no valuation allowance is necessary at December 31, 2012.
FASB provides guidance for recognizing and measuring uncertain tax positions and prescribes a threshold condition that a tax position must meet for any of the benefit of the uncertain tax position to be recognized in the financial statements. Based on this guidance, we regularly analyze tax positions taken or expected to be taken in a tax return based on the threshold condition prescribed. Tax positions that do not meet or exceed this threshold condition are considered uncertain tax positions. We accrue interest related to these uncertain tax positions which is recognized in income tax expense. Penalties, if any, related to uncertain tax positions would be recorded in income tax expenses.
Forward-Looking Information
Any forward-looking statements in this report including, without limitation, statements relating to the Company’s plans, strategies, objectives, expectations, intentions and adequacy of resources, are made pursuant to the safe harbor provisions of the Private Securities Litigation Reform Act of 1995. Investors are cautioned that such forward-looking statements involve risks and uncertainties including, without limitation, the following: (i) the Company’s plans, strategies, objectives, expectations and intentions are subject to change at any time at the discretion of the Company; (ii) the Company’s business is highly competitive and the entrance of new competitors into or the expansion of the operations by existing competitors in the Company’s markets and other changes in the market for insurance products could adversely affect the Company’s plans and results of operations; and (iii) other risks and uncertainties indicated from time to time in the Company’s filings with the Securities and Exchange Commission.
Impact of Inflation
To the extent possible, the Company attempts to recover the impact of inflation to loss costs and operating expenses by increasing the premiums it charges. Within the fleet transportation business, a majority of the Company’s premiums are charged as a percentage of an insured’s gross revenue or payroll. As these charging bases increase with inflation, premium revenues are immediately increased. The remaining premium rates charged are adjustable only at periodic intervals and often require state regulatory approval. Such periodic increases in premium rates may lag far behind cost increases.
- 34 -
To the extent inflation influences yields on investments, the Company is also affected. The Company’s short-term and fixed investment portfolios are structured in direct response to available interest rates over the yield curve. As available market interest rates fluctuate in response to the presence or absence of inflation, the yields on the Company’s investments are impacted. Further, as inflation affects current market rates of return, previously committed investments might increase or decline in value depending on the type and maturity of investment (see additional comments under Market Risk, following).
Inflation must also be considered by the Company in the creation and review of loss and loss adjustment expense reserves since portions of these reserves are expected to be paid over extended periods of time. The anticipated effect of inflation is implicitly considered when estimating liabilities for losses and loss adjustment expenses.
Market Risk
The Company operates within the property and casualty insurance industry and, accordingly, has significant invested assets which are exposed to various market risks. These market risks relate to interest rate fluctuations, equity security market prices and, to a far lesser extent, foreign currency rate fluctuations. All of the Company's invested assets, with the exception of investments in limited partnerships, are classified as available for sale.
Based on the structure of the Company’s investment portfolio, the most potentially significant of the three identified market risks relates to prices in the equity security market. Though not the largest category of the Company's invested assets, equity securities have a high potential for short-term price fluctuation. The market value of the Company's equity positions at December 31, 2012 was $107.6 million or approximately 16% of invested assets. This market valuation includes $49.5 million of appreciation over the adjusted cost basis of the equity security investments. Funds invested in the equities market are not considered to be assets necessary for the Company to conduct its daily operations and, therefore, can be committed for extended periods of time. The long-term nature of the Company's equity investments allows it to invest in positions where ultimate value, and not short-term market fluctuations, is the primary focus.
Reference is made to the discussion of limited partnership investments in Critical Accounting Policies presented on page 28 of this report. All of the market risks, attendant to equity securities, apply to the underlying assets in these partnerships, and to a greater degree because of the generally more aggressive investment philosophies utilized by the partnerships. In addition, these investments are illiquid. There is no primary or secondary market on which these limited partnerships trade and, in most cases, the Company is prohibited from disposing of its limited partnership interests for some period of time and must seek approval from the general partner for any such disposal. Distributions of earnings from these partnerships are largely at the sole discretion of the general partners and distributions are generally not received by the Company for many years after the earnings have been reported. Finally, through the application of the equity method of accounting, the Company’s share of net income reported by the limited partnerships may include significant amounts of unrealized appreciation on the underlying investments. As such, the likelihood that reported income from limited partnership investments will be ultimately returned to the Company in the form of cash is markedly lower than the Company’s other investments, where appreciation is reported only when a security is actually sold.
The Company's fixed maturity portfolio totaled $445.7 million at December 31, 2012. Approximately 63% of this portfolio is made up of U.S. Government and government agency obligations and state and municipal debt securities; 86% of the portfolio matures within 5 years; and the average contractual maturity of the Company's fixed maturity investments is approximately 3.6 years with an average duration of approximately 2.2 years. Although the Company is exposed to interest rate risk on its fixed maturity investments, given the anticipated duration of the Company's liabilities (principally insurance loss and loss expense reserves) relative to investment maturities, even a 100 to 200 basis point increase in interest rates would not have even a moderate impact on the Company's ability to conduct daily operations or to meet its obligations and would, in fact, result in significantly higher investment income in a relatively short period of time as short term investments and maturing bonds could be reinvested in the higher yielding securities very quickly.
- 35 -
There is an inverse relationship between interest rate fluctuations and the fair value of the Company's fixed maturity investments. Additionally, the fair value of interest rate sensitive instruments may be affected by the financial strength of the issuer, prepayment options, relative values of alternative investments, liquidity of the investment and other general market conditions. The Company monitors its sensitivity to interest rate risk by measuring the change in fair value of its fixed maturity investments relative to hypothetical changes in interest rates.
The following tables present the estimated effects on the fair value of financial instruments at December 31 which would result from an instantaneous change in yield rates of varying magnitudes on a static balance sheet to determine the effect such a change in rates would have on current fair value. The analysis presents the sensitivity of the fair value of the Company’s financial instruments to selected changes in market rates and prices. The range of change chosen reflects the Company’s view of changes that the Company believes are reasonably possible over a one-year period. The Company’s selection of the range of values chosen to represent changes in interest rates should not be construed as the Company’s prediction of future market events, but rather an illustration of the impact of such events, should they occur. The equity portfolio was compared to the S&P 500 index due to its correlation with the vast majority of the Company’s current equity portfolio. The limited partnership portfolio was compared to the S&P 500 and Indian BSE 500 indices due to their significant correlation with the vast majority of our limited partnership portfolio. As previously indicated, several other factors can impact the fair values of fixed maturity investments and, therefore, significant variations in market interest rates could produce quite different results from the hypothetical estimates presented below.
The following tables present the estimated effects on the fair value of financial instruments at December 31 due to an instantaneous change in yield rates of 100 basis points and a 10% decline in the S&P 500 and Indian BSE 500 indices (dollars in thousands).
| Increase (Decrease) | ||||||||||||
| Fair | Interest | Equity | ||||||||||
| Value | Rate Risk | Risk | ||||||||||
| 2012: | ||||||||||||
| U.S. government obligations | $ | 70,742 | $ | (1,094 | ) | $ | - | |||||
| Residential mortgage-backed securities | 25,040 | (1,455 | ) | - | ||||||||
| Commercial mortgage-backed securities | 11,828 | (687 | ) | - | ||||||||
| State and municipal obligations | 194,865 | (2,379 | ) | - | ||||||||
| Corporate securities | 120,596 | (2,954 | ) | - | ||||||||
| Foreign government obligations | 22,598 | (679 | ) | - | ||||||||
| Total fixed maturities | 445,669 | (9,248 | ) | - | ||||||||
| Equity securities: | ||||||||||||
| Financial institutions | 12,394 | - | (1,239 | ) | ||||||||
| Industrial & miscellaneous | 95,188 | - | (9,519 | ) | ||||||||
| Total equity securities | 107,582 | - | (10,758 | ) | ||||||||
| Limited partnerships | 59,954 | - | (4,050 | ) | ||||||||
| Short-term | 4,201 | - | - | |||||||||
| Total fixed maturities and other investments | $ | 617,406 | $ | (9,248 | ) | $ | (14,808 | ) | ||||
| 2011: | ||||||||||||
| U.S. government obligations | $ | 73,137 | $ | (1,000 | ) | $ | - | |||||
| Government sponsored entities | 349 | (3 | ) | - | ||||||||
| Residential mortgage-backed securities | 21,872 | (542 | ) | - | ||||||||
| Commercial mortgage-backed securities | 11,300 | (280 | ) | - | ||||||||
| State and municipal obligations | 190,035 | (2,983 | ) | - | ||||||||
| Corporate securities | 91,646 | (1,785 | ) | - | ||||||||
| Foreign government obligations | 21,121 | (652 | ) | - | ||||||||
| Total fixed maturities | 409,460 | (7,245 | ) | - | ||||||||
| Equity securities: | ||||||||||||
| Financial institutions | 9,428 | - | (943 | ) | ||||||||
| Industrial & miscellaneous | 78,657 | - | (7,866 | ) | ||||||||
| Total equity securities | 88,085 | - | (8,809 | ) | ||||||||
| Limited partnerships | 54,705 | - | (3,747 | ) | ||||||||
| Short-term | 3,675 | - | - | |||||||||
| Total fixed maturities and other investments | $ | 555,925 | $ | (7,245 | ) | $ | (12,556 | ) | ||||
- 36 -
The following tables present the estimated effects on the fair value of financial instruments at December 31 due to an instantaneous change in yield rates of 150 basis points and a 15% decline in the S&P 500 and Indian BSE 500 indices (dollars in thousands).
| Increase (Decrease) | ||||||||||||
| Fair | Interest | Equity | ||||||||||
| Value | Rate Risk | Risk | ||||||||||
| 2012: | ||||||||||||
| U.S. government obligations | $ | 70,742 | $ | (1,647 | ) | $ | - | |||||
| Residential mortgage-backed securities | 25,040 | (2,106 | ) | - | ||||||||
| Commercial mortgage-backed securities | 11,828 | (995 | ) | - | ||||||||
| State and municipal obligations | 194,865 | (3,547 | ) | - | ||||||||
| Corporate securities | 120,596 | (4,379 | ) | - | ||||||||
| Foreign government obligations | 22,598 | (1,011 | ) | - | ||||||||
| Total fixed maturities | 445,669 | (13,685 | ) | - | ||||||||
| Equity securities: | ||||||||||||
| Financial institutions | 12,394 | - | (1,859 | ) | ||||||||
| Industrial & miscellaneous | 95,188 | - | (14,278 | ) | ||||||||
| Total equity securities | 107,582 | - | (16,137 | ) | ||||||||
| Limited partnerships | 59,954 | - | (6,076 | ) | ||||||||
| Short-term | 4,201 | - | - | |||||||||
| Total fixed maturities and other investments | $ | 617,406 | $ | (13,685 | ) | $ | (22,213 | ) | ||||
| 2011: | ||||||||||||
| U.S. government obligations | $ | 73,137 | $ | (1,491 | ) | $ | - | |||||
| Government sponsored entities | 349 | (5 | ) | - | ||||||||
| Residential mortgage-backed securities | 21,872 | (891 | ) | - | ||||||||
| Commercial mortgage-backed securities | 11,300 | (461 | ) | - | ||||||||
| State and municipal obligations | 190,035 | (4,356 | ) | - | ||||||||
| Corporate securities | 91,646 | (2,657 | ) | - | ||||||||
| Foreign government obligations | 21,121 | (931 | ) | - | ||||||||
| Total fixed maturities | 409,460 | (10,792 | ) | - | ||||||||
| Equity securities: | ||||||||||||
| Financial institutions | 9,428 | - | (1,414 | ) | ||||||||
| Industrial & miscellaneous | 78,657 | - | (11,799 | ) | ||||||||
| Total equity securities | 88,085 | - | (13,213 | ) | ||||||||
| Limited partnerships | 54,705 | - | (5,620 | ) | ||||||||
| Short-term | 3,675 | - | - | |||||||||
| Total fixed maturities and other investments | $ | 555,925 | $ | (10,792 | ) | $ | (18,833 | ) | ||||
The Company's exposure to foreign currency risk is not material.
- 37 -
Contractual Obligations
The table below sets forth the amounts of the Company's contractual obligations at December 31, 2012.
| Payments Due by Period | ||||||||||||||||||||
| Total | Less than 1 year | 1 - 3 Years | 3 - 5 Years | More Than 5 Years | ||||||||||||||||
| (dollars in millions) | ||||||||||||||||||||
| Loss and loss expense reserves | $ | 455.5 | $ | 157.1 | $ | 130.7 | $ | 53.3 | $ | 114.4 | ||||||||||
| Investment commitments | 7.8 | 7.8 | - | - | - | |||||||||||||||
| Operating leases | 1.1 | 1.0 | 0.1 | - | - | |||||||||||||||
| Borrowings | 10.0 | 10.0 | - | - | - | |||||||||||||||
| Total | $ | 474.4 | $ | 175.9 | $ | 130.8 | $ | 53.3 | $ | 114.4 | ||||||||||
The Company’s loss and loss expense reserves do not have contractual maturity dates and the exact timing of the payment of claims cannot be predicted with certainty. However, based upon historical payment patterns, the above table presents an estimate of when we might expect our direct loss and loss expense reserves (without the benefit of reinsurance recoveries) to be paid. Timing of the collection of the related reinsurance recoverable, estimated to be $175.2 million at December 31, 2012, or 42% of the amounts presented in the above table, would approximate that of the above projected direct reserve payout.
The investment commitments in the above table relate to maximum unfunded capital obligations for limited partnership investments at December 31, 2012. The actual call dates for such funding could vary from that presented.
Borrowings are made under a line of credit with a current expiration of September 23, 2014; however, it is expected that this line of credit will be renewed for a multiple year period prior to maturity.
- 38 -
ANNUAL REPORT ON FORM 10-K
ITEM 8--FINANCIAL STATEMENTS AND SUPPLEMENTARY DATA
YEAR ENDED DECEMBER 31, 2012
BALDWIN & LYONS, INC.
INDIANAPOLIS, INDIANA
- 39 -
| Report of Independent Registered Public Accounting Firm |
- 40 -
| Consolidated Balance Sheets | ||||||||||
| Baldwin & Lyons, Inc. and Subsidiaries | ||||||||||
| December 31 | ||||||||||
| 2012 | 2011 | |||||||||
| (dollars in thousands) | ||||||||||
| Assets | ||||||||||
| Investments: | ||||||||||
| Fixed maturities | $ | 445,669 | $ | 409,460 | ||||||
| Equity securities | 107,582 | 88,085 | ||||||||
| Limited partnerships | 59,954 | 54,705 | ||||||||
| Short-term and other | 4,201 | 3,675 | ||||||||
| 617,406 | 555,925 | |||||||||
| Cash and cash equivalents | 71,549 | 89,726 | ||||||||
| Accounts receivable--less allowance (2012, $538; 2011, $659) | 83,400 | 74,094 | ||||||||
| Accrued investment income | 4,387 | 4,337 | ||||||||
| Reinsurance recoverable | 175,191 | 138,404 | ||||||||
| Prepaid reinsurance premiums | 2,679 | 3,059 | ||||||||
| Deferred policy acquisition costs | 3,091 | 4,578 | ||||||||
| Property and equipment--less accumulated depreciation | ||||||||||
| (2012, $15,184; 2011, $13,486) | 12,257 | 12,991 | ||||||||
| Other assets | 9,818 | 11,707 | ||||||||
| Current federal income taxes recoverable | 3,246 | 3,354 | ||||||||
| Deferred federal income taxes | - | 7,119 | ||||||||
| $ | 983,024 | $ | 905,294 | |||||||
| Liabilities and Shareholders' Equity | ||||||||||
| Reserves: | ||||||||||
| Losses and loss expenses | $ | 455,454 | $ | 421,556 | ||||||
| Unearned premiums | 37,273 | 39,919 | ||||||||
| 492,727 | 461,475 | |||||||||
| Reinsurance payable | 32,798 | 28,330 | ||||||||
| Short-term borrowings | 10,000 | 10,000 | ||||||||
| Depository liabilities | 42,503 | 36,436 | ||||||||
| Accounts payable and other liabilities | 49,706 | 49,992 | ||||||||
| Deferred federal income taxes | 8,578 | - | ||||||||
| 636,312 | 586,233 | |||||||||
| Shareholders' equity: | ||||||||||
| Common stock, no par value: | ||||||||||
| Class A voting -- authorized 3,000,000 shares; | ||||||||||
| outstanding -- 2012 - 2,623,109; 2011 - 2,623,109 shares | 112 | 112 | ||||||||
| Class B non-voting -- authorized 20,000,000 shares; | ||||||||||
| outstanding -- 2012 - 12,290,035; 2011 - 12,225,348 shares | 524 | 522 | ||||||||
| Additional paid-in capital | 50,275 | 48,751 | ||||||||
| Unrealized net gains on investments | 35,467 | 26,592 | ||||||||
| Foreign exchange adjustment | 1,976 | 1,759 | ||||||||
| Retained earnings | 258,358 | 241,325 | ||||||||
| 346,712 | 319,061 | |||||||||
| $ | 983,024 | $ | 905,294 | |||||||
- 41 -
| Consolidated Statements of Operations | ||||||||||||
| Baldwin & Lyons, Inc. and Subsidiaries | ||||||||||||
| Year Ended December 31 | ||||||||||||
| 2012 | 2011 | 2010 | ||||||||||
| (dollars in thousands, except per share data) | ||||||||||||
| Revenue: | ||||||||||||
| Net premiums earned | $ | 237,461 | $ | 244,570 | $ | 214,738 | ||||||
| Net investment income | 9,930 | 10,729 | 11,335 | |||||||||
| Commissions and other income | 5,722 | 6,098 | 6,911 | |||||||||
| Net realized gains (losses) on investments, excluding | ||||||||||||
| impairment losses | 9,899 | (15,897 | ) | 16,527 | ||||||||
| Total other-than-temporary impairment losses on investments | (894 | ) | (1,987 | ) | (42 | ) | ||||||
| Portion of other-than-temporary impairment losses | ||||||||||||
| recognized in other comprehensive income | 6 | 81 | - | |||||||||
| Net realized gains (losses) on investments | 9,011 | (17,803 | ) | 16,485 | ||||||||
| 262,124 | 243,594 | 249,469 | ||||||||||
| Expenses: | ||||||||||||
| Losses and loss expenses incurred | 138,088 | 215,555 | 145,952 | |||||||||
| Other operating expenses | 77,430 | 73,328 | 68,704 | |||||||||
| 215,518 | 288,883 | 214,656 | ||||||||||
| Income (loss) before federal income taxes | 46,606 | (45,289 | ) | 34,813 | ||||||||
| Federal income taxes (benefits) | 14,687 | (17,114 | ) | 9,798 | ||||||||
| Net income (loss) | $ | 31,919 | $ | (28,175 | ) | $ | 25,015 | |||||
| Per share data: | ||||||||||||
| Basic and diluted earnings (losses) | $ | 2.15 | $ | (1.90 | ) | $ | 1.69 | |||||
| Cash dividends paid | $ | 1.00 | $ | 1.00 | $ | 2.25 | ||||||
- 42 -
| Consolidated Statements of Comprehensive Income (Loss) | ||||||||||||
| Baldwin & Lyons, Inc. and Subsidiaries | ||||||||||||
| 2012 | 2011 | 2010 | ||||||||||
| (dollars in thousands) | ||||||||||||
| Net income (loss) | $ | 31,919 | $ | (28,175 | ) | $ | 25,015 | |||||
| Other comprehensive income (loss), net of tax: | ||||||||||||
| Unrealized net gains (losses) on securities: | ||||||||||||
| Unrealized holding net gains (losses) arising during the period | 10,148 | (4,645 | ) | 7,390 | ||||||||
| Less: reclassification adjustment for net gains (losses) | ||||||||||||
| included in net income (loss) | 1,273 | 2,657 | 5,382 | |||||||||
| 8,875 | (7,302 | ) | 2,008 | |||||||||
| Foreign currency translation adjustments | 217 | (230 | ) | 441 | ||||||||
| Other comprehensive income (loss) | 9,092 | (7,532 | ) | 2,449 | ||||||||
| Comprehensive income (loss) | $ | 41,011 | $ | (35,707 | ) | $ | 27,464 | |||||
- 43 -
| Baldwin & Lyons, Inc. and Subsidiaries | ||||||||||||
| 2012 | 2011 | 2010 | ||||||||||
| (dollars in thousands) | ||||||||||||
| Shareholders' equity at beginning of year | $ | 319,061 | $ | 368,735 | $ | 372,943 | ||||||
| Net income (loss) | 31,919 | (28,175 | ) | 25,015 | ||||||||
| Other comprehensive income (loss) | 9,092 | (7,532 | ) | 2,449 | ||||||||
| Cash dividends paid to shareholders | (14,886 | ) | (14,846 | ) | (33,212 | ) | ||||||
| Issuance of common stock | 1,526 | 879 | 1,540 | |||||||||
| Shareholders' equity at end of year: | $ | 346,712 | $ | 319,061 | $ | 368,735 | ||||||
- 44 -
| Baldwin & Lyons, Inc. and Subsidiaries | ||||||||||||
| 2012 | 2011 | 2010 | ||||||||||
| (dollars in thousands) | ||||||||||||
| Operating activities | ||||||||||||
| Net income (loss) | $ | 31,919 | $ | (28,175 | ) | $ | 25,015 | |||||
| Adjustments to reconcile net income (loss) to net cash | ||||||||||||
| provided by operating activities: | ||||||||||||
| Change in accounts receivable and unearned premium | (13,089 | ) | (27,227 | ) | (6,511 | ) | ||||||
| Change in accrued investment income | (50 | ) | (291 | ) | (260 | ) | ||||||
| Change in reinsurance recoverable on paid losses | 537 | 698 | (1,787 | ) | ||||||||
| Change in losses and loss expenses reserves net of reinsurance | (2,289 | ) | 71,348 | 15,499 | ||||||||
| Change in other assets, other liabilities and current income taxes | 29,850 | 18,430 | 24,984 | |||||||||
| Amortization of net policy acquisition costs | 26,772 | 29,209 | 23,967 | |||||||||
| Net policy acquisition costs deferred | (25,285 | ) | (28,961 | ) | (23,888 | ) | ||||||
| Provision for deferred income taxes | 4,299 | (9,340 | ) | 46 | ||||||||
| Bond amortization | 6,055 | 5,673 | 4,211 | |||||||||
| (Gain) loss on sale of property | 10 | (36 | ) | 5 | ||||||||
| Depreciation | 4,550 | 4,274 | 4,013 | |||||||||
| Net realized (gains) losses on investments | (9,011 | ) | 17,803 | (16,485 | ) | |||||||
| Compensation expense related to restricted stock | 1,526 | 879 | 674 | |||||||||
| Net cash provided by operating activities | 55,794 | 54,284 | 49,483 | |||||||||
| Investing activities | ||||||||||||
| Purchases of fixed maturities and equity securities | (320,434 | ) | (270,696 | ) | (346,435 | ) | ||||||
| Purchases of limited partnership interests | (2,154 | ) | - | (7 | ) | |||||||
| Distributions from limited partnerships | 3,957 | 757 | 297 | |||||||||
| Proceeds from maturities | 150,652 | 144,745 | 166,307 | |||||||||
| Proceeds from sales of fixed maturities | 103,106 | 128,018 | 105,206 | |||||||||
| Proceeds from sales of equity securities | 8,674 | 16,883 | 15,743 | |||||||||
| Net sales (purchases) of short-term investments | (529 | ) | 841 | (160 | ) | |||||||
| Decrease in principal of notes receivable from employees | 1,252 | 106 | 611 | |||||||||
| Purchases of property and equipment | (4,054 | ) | (3,488 | ) | (4,767 | ) | ||||||
| Proceeds from disposals of property and equipment | 228 | 129 | 212 | |||||||||
| Net cash provided by (used in) investing activities | (59,302 | ) | 17,295 | (62,993 | ) | |||||||
| Financing activities | ||||||||||||
| Dividends paid to shareholders | (14,886 | ) | (14,846 | ) | (33,212 | ) | ||||||
| Drawings on line of credit | - | - | 8,000 | |||||||||
| Repayment on line of credit | - | (5,000 | ) | (3,000 | ) | |||||||
| Net cash used in financing activities | (14,886 | ) | (19,846 | ) | (28,212 | ) | ||||||
| Effect of foreign exchange rates on cash and cash equivalents | 217 | (230 | ) | 441 | ||||||||
| Increase (decrease) in cash and cash equivalents | (18,177 | ) | 51,503 | (41,281 | ) | |||||||
| Cash and cash equivalents at beginning of year | 89,726 | 38,223 | 79,504 | |||||||||
| Cash and cash equivalents at end of year | $ | 71,549 | $ | 89,726 | $ | 38,223 | ||||||
- 45 -
Notes to Consolidated Financial Statements
Baldwin & Lyons, Inc. and Subsidiaries
(Dollars in thousands, except share and per share data)
Note A - Summary of Significant Accounting Policies
Basis of Presentation: The consolidated financial statements include the accounts of Baldwin & Lyons, Inc. and its wholly owned subsidiaries (the “Company"). All significant inter-company transactions and accounts have been eliminated in consolidation.
Use of Estimates: Preparation of the consolidated financial statements requires management to make estimates and assumptions that affect the amounts reported in the consolidated financial statements and accompanying notes. Actual results will differ from those estimates.
Cash and Cash Equivalents: The Company considers investments in money market funds to be cash equivalents. Carrying amounts for these instruments approximate their fair values.
Investments: Carrying amounts for fixed maturity securities represent fair value and are based on quoted market prices, where available, or broker/dealer quotes for specific securities where quoted market prices are not available. Equity securities are carried at quoted market prices (fair value). The Company accounts for investments in limited partnerships using the equity method of accounting, which requires an investor in a limited partnership to record its proportionate share of the limited partnership’s net income. To the extent that the limited partnership investees include both realized and unrealized investment gains or losses in the determination of net income or loss, then the Company would also recognize, through its statement of operations, its proportionate share of the investee’s unrealized as well as realized investment gains or losses.
Other investments, if any, are carried at either market value or cost, depending on the nature of the investment. Short-term investments are carried at cost, which approximates their fair values.
Realized gains and losses on disposals of investments are determined by specific identification of cost of investments sold and are included in income. All fixed maturity and equity securities are considered to be available for sale; the related unrealized net gains or losses (net of applicable tax effect) are reflected directly in shareholders’ equity.
In accordance with the Financial Accounting Standard Board’s (“FASB”) other than temporary impairment (“OTTI”) guidance, if a fixed maturity security is in an unrealized loss position and the Company has the intent to sell the fixed maturity security, or it is more likely than not that the Company will have to sell the fixed maturity security before recovery of its amortized cost basis, the decline in value is deemed to be other-than-temporary and is recorded to net realized losses on investments in the consolidated statements of operations. For impaired fixed maturity securities that the Company does not intend to sell or in cases where it is more likely than not that the Company will not have to sell such securities, but the Company expects that it will not fully recover the amortized cost basis, the credit component of the other-than-temporary impairment is recognized in net realized losses on investments in the consolidated statements of operations and the non-credit component of the other-than-temporary impairment is recognized directly in shareholder’s equity (accumulated other comprehensive income). Furthermore, unrealized losses caused by non-credit related factors related to fixed maturity securities for which the Company expects to fully recover the amortized cost basis continue to be recognized in accumulated other comprehensive income.
The credit component of an other-than-temporary impairment is determined by comparing the net present value of projected future cash flows with the amortized cost basis of the fixed maturity security. The net present value is calculated by discounting the Company’s best estimate of projected future cash flows at the appropriate effective interest rate.
The unrealized net gains or losses (net of applicable tax effect) related to equity securities are reflected directly in shareholders’ equity, unless a decline in value is determined to be other-than-temporary, in which case the loss is charged to income. In determining if and when a decline in market value below cost is other-than-temporary, an objective analysis is made of each individual security where current market value is less than cost. For any equity security where the unrealized loss exceeds 20% of original or adjusted cost, and where that decline has existed for a
- 46 -
Note A - Significant Accounting Policies (continued)
period of at least six months, the decline is treated as an other-than-temporary impairment. Additionally, the Company takes into account any known subjective information in evaluating for impairment without consideration to the Company’s quantitative criteria defined above, and the Company’s intent and ability to retain the equity security for a period of time sufficient to allow for such recovery in fair value.
Property and Equipment: Property and equipment is carried at cost, less accumulated depreciation. Depreciation is computed principally by the straight-line method.
Goodwill and Other Intangible Assets: Goodwill is not amortized. It is instead tested for impairment in accordance with FASB guidance, at the reporting-unit level. Goodwill is tested annually (during the fourth quarter) or more often if events or circumstances, such as adverse changes in the business climate, indicate there may be impairment. Intangible assets determined to have finite lives, such as customer relationships and employment agreements, are amortized over their estimated useful lives in a manner that best reflects the economic benefits of the intangible asset. In addition, impairment testing is performed on these amortizing intangible assets if impairment indicators are noted.
Reserves for Losses and Loss Expenses: The reserves for losses and loss expenses, minor portions of which are discounted, are determined using case basis evaluations and statistical analyses and represent estimates of the ultimate cost of all reported and unreported losses which are unpaid at year end. These reserves include estimates of future trends in claim severity and frequency and other factors which could vary as the losses are ultimately settled. While actual results could differ from such estimates, management believes that the reserves for losses and loss expenses are adequate. The estimates are continually reviewed and as adjustments to these reserves become necessary, such adjustments are reflected in current operations.
Recognition of Revenue and Costs: Premiums are earned over the period for which insurance protection is provided. A reserve for unearned premiums, computed by the daily pro-rata method, is established to reflect amounts applicable to subsequent accounting periods. Commissions to unaffiliated companies and premium taxes applicable to unearned premiums are deferred and expensed as the related premiums are earned. The Company does not defer acquisition costs which are not directly variable with the production of premium. If it is determined that expected losses and deferred expenses will likely exceed the related unearned premiums, the asset representing deferred policy acquisition costs is reduced and an expense is charged against current operations to reflect any such premium deficiency. In the event that the expected premium deficiency exceeds deferred policy acquisition costs, an additional liability would be recorded with a corresponding expense to current operations for the amount of the excess premium deficiency. Anticipated investment income is considered in determining recoverability of deferred acquisition costs.
Reinsurance: Reinsurance premiums, commissions, expense reimbursements and reserves related to reinsured business are accounted for on bases consistent with those used in accounting for the original policies issued and the terms of the reinsurance contracts. Premiums ceded to other insurers have been reported as a reduction of premium earned. Amounts applicable to reinsurance ceded for unearned premium and claim loss reserves have been reported as reinsurance recoverable assets. Certain reinsurance contracts provide for additional or return premiums and commissions based upon profits or losses to the reinsurer over prescribed periods. Estimates of additional or return premiums and commissions are adjusted quarterly to recognize actual loss experience to date as well as projected loss experience applicable to the various contract periods. Estimates of reinstatement premiums on reinsurance contracts covering catastrophic events are, to the extent reasonably determinable, recorded concurrently with the related loss.
Should impairment in the ability of a reinsurer to satisfy its obligations to the Company be determined to exist, current year operations would be charged in amounts sufficient to provide for the Company’s additional liability. Such charges, when incurred, are included in other operating expenses, rather than losses and loss expenses incurred, since the inability of the Company to collect from reinsurers is a credit risk rather than a deficiency associated with the loss reserving process.
The Company accounts for foreign and domestic reinsurance using the periodic method. Under the periodic method, premiums are recognized as revenue ratably over the contract term, and claims, including an estimate of claims incurred but not reported, are recognized as they occur.
- 47 -
Note A - Significant Accounting Policies (continued)
Deferred income tax assets and liabilities are recognized for temporary differences between the financial statement and tax return bases of assets and liabilities based on enacted tax rates and laws. The deferred tax benefits of the deferred tax assets are recognized to the extent realization of such benefits is more likely than not. Deferred income tax expense or benefit generally represents the net change in deferred income tax assets and liabilities during the year. Current income tax expense represents the tax liability associated with revenues and expenses currently taxable or deductible on various income tax returns for the year reported.
Restricted Stock: Restricted shares vest ratably over the vesting period from the date of grant and are accelerated for retirement eligible recipients due to the non-substantive post-grant date vesting clause per Accounting Standard Codification (“ASC”) 715, Compensation-Retirement Benefits. Restricted stock is valued based on the closing price of the stock on the day the award is granted. Non-vested restricted shares will be forfeited should an executive’s employment terminate for any reason other than death, disability, or retirement as defined by the Compensation Committee.
Earnings Per Share: Diluted earnings per share of common stock are based on the average number of shares of Class A and Class B common stock outstanding during the year, adjusted for the dilutive effect, if any, of restricted stock awards outstanding. Basic earnings per share are presented exclusive of the effect of share-based awards outstanding.
Comprehensive Income: The Company records accumulated other comprehensive income from unrealized gains and losses on available-for-sale securities as a separate component of shareholders’ equity. Foreign exchange adjustments are generally not material and the Company has no defined benefit pension plan. A reclassification adjustment to other comprehensive income is made for gains during the period included in net income.
Fair Value Measurements: In January 2010, the FASB issued revised accounting guidance that clarifies and provides additional disclosure requirements related to recurring and non-recurring fair value measurements. The guidance requires separate disclosures for the amounts of significant transfers in and out of Level 1 and Level 2 fair value measurements, along with an explanation for the transfers. Additionally, a separate disclosure is required for purchases, sales, issuances and settlements on a gross basis for Level 3 fair value measurements. The guidance also provides additional clarification for both the level of disaggregation reported for each class of assets or liabilities and disclosures of inputs and valuation techniques used to measure fair value for both recurring and non-recurring fair value measurements for assets and liabilities categorized as Level 2 or Level 3.
Newly Adopted Accounting Standards: In October 2010, the FASB issued updated guidance to address the diversity in practice for the accounting for costs associated with acquiring or renewing insurance contracts. This guidance modifies the definition of acquisition costs to specify that a cost must be directly related to the successful acquisition of a new or renewal insurance contract in order to be deferred. If application of this guidance would result in the capitalization of acquisition costs that had not previously been capitalized by a reporting entity, the entity may elect not to capitalize those costs. The guidance, which was effective January 1, 2012, had no impact on the Company’s consolidated financial statements.
In May 2011, the FASB issued updated accounting guidance that changes the wording used to describe many of the requirements in GAAP for measuring fair value and for disclosing information about fair value measurements to ensure consistency between GAAP and International Financial Reporting Standards. The guidance also expands the disclosures for fair value measurements that are estimated using significant unobservable (Level 3) inputs. The guidance, which was effective January 1, 2012, had no financial impact on the Company’s consolidated financial statements; however additional disclosures are noted.
In June 2011, the FASB issued revised accounting guidance that eliminates the option to present the components of other comprehensive income as part of the statement of shareholders' equity. Instead, comprehensive income must be reported in either a single continuous statement of comprehensive income which contains two sections, net income and other comprehensive income, or in two separate but consecutive statements. The guidance, which was effective January 1, 2012, had no financial impact on the Company’s consolidated financial statements; however additional disclosures are noted.
Reclassification: Certain prior year balances have been reclassified to conform to the current year presentation.
- 48 -
| Note B - Investments | ||||||||||||||||||||
| The following is a summary of available for sale securities at December 31: | ||||||||||||||||||||
| Net | ||||||||||||||||||||
| Cost or | Gross | Gross | Unrealized | |||||||||||||||||
| Fair | Amortized | Unrealized | Unrealized | Gains | ||||||||||||||||
| Value | Cost | Gains | Losses | (Losses) | ||||||||||||||||
| 2012: | ||||||||||||||||||||
| U.S. government obligations | $ | 70,742 | $ | 70,720 | $ | 43 | $ | (21 | ) | $ | 22 | |||||||||
| Residential mortgage-backed securities | 25,040 | 23,954 | 1,218 | (132 | ) | 1,086 | ||||||||||||||
| Commercial mortgage-backed securities | 11,828 | 11,006 | 849 | (27 | ) | 822 | ||||||||||||||
| State and municipal obligations | 194,865 | 194,258 | 757 | (150 | ) | 607 | ||||||||||||||
| Corporate securities | 120,596 | 118,574 | 2,923 | (901 | ) | 2,022 | ||||||||||||||
| Foreign government obligations | 22,598 | 22,047 | 602 | (51 | ) | 551 | ||||||||||||||
| Total fixed maturities | 445,669 | 440,559 | 6,392 | (1,282 | ) | 5,110 | ||||||||||||||
| Equity securities: | ||||||||||||||||||||
| Financial institutions | 12,394 | 5,925 | 6,542 | (73 | ) | 6,469 | ||||||||||||||
| Industrial & miscellaneous | 95,188 | 52,202 | 44,568 | (1,582 | ) | 42,986 | ||||||||||||||
| Total equity securities | 107,582 | 58,127 | 51,110 | (1,655 | ) | 49,455 | ||||||||||||||
| Total available-for-sale securities | $ | 553,251 | $ | 498,686 | $ | 57,502 | $ | (2,937 | ) | 54,565 | ||||||||||
| Applicable federal income taxes | (19,098 | ) | ||||||||||||||||||
| Net unrealized gains - net of tax | $ | 35,467 | ||||||||||||||||||
| 2011: | ||||||||||||||||||||
| U.S. government obligations | $ | 73,137 | $ | 73,009 | $ | 139 | $ | (11 | ) | $ | 128 | |||||||||
| Government sponsored entities | 349 | 345 | 4 | - | 4 | |||||||||||||||
| Residential mortgage-backed securities | 21,872 | 21,778 | 619 | (525 | ) | 94 | ||||||||||||||
| Commercial mortgage-backed securities | 11,300 | 11,388 | 116 | (204 | ) | (88 | ) | |||||||||||||
| State and municipal obligations | 190,035 | 188,991 | 1,275 | (231 | ) | 1,044 | ||||||||||||||
| Corporate securities | 91,646 | 91,949 | 1,429 | (1,732 | ) | (303 | ) | |||||||||||||
| Foreign government obligations | 21,121 | 21,483 | 168 | (530 | ) | (362 | ) | |||||||||||||
| Total fixed maturities | 409,460 | 408,943 | 3,750 | (3,233 | ) | 517 | ||||||||||||||
| Equity securities: | ||||||||||||||||||||
| Financial institutions | 9,428 | 4,955 | 4,778 | (305 | ) | 4,473 | ||||||||||||||
| Industrial & miscellaneous | 78,657 | 42,736 | 36,921 | (1,000 | ) | 35,921 | ||||||||||||||
| Total equity securities | 88,085 | 47,691 | 41,699 | (1,305 | ) | 40,394 | ||||||||||||||
| Total available-for-sale securities | $ | 497,545 | $ | 456,634 | $ | 45,449 | $ | (4,538 | ) | 40,911 | ||||||||||
| Applicable federal income taxes | (14,319 | ) | ||||||||||||||||||
| Net unrealized gains - net of tax | $ | 26,592 | ||||||||||||||||||
- 49 -
Note B – Investments (continued)
The following table summarizes, for fixed maturity and equity security investments in an unrealized loss position at December 31, the aggregate fair value and gross unrealized loss categorized by the duration those securities have been continuously in an unrealized loss position.
| 2012 | 2011 | |||||||||||||||||||||||
| Number of Securities | Fair Value | Gross Unrealized Loss | Number of Securities | Fair Value | Gross Unrealized Loss | |||||||||||||||||||
| Fixed maturity securities: | ||||||||||||||||||||||||
| 12 months or less | 170 | $ | 90,607 | $ | (483 | ) | 206 | $ | 86,470 | $ | (2,303 | ) | ||||||||||||
| Greater than 12 months | 58 | 19,283 | (799 | ) | 44 | 11,930 | (930 | ) | ||||||||||||||||
| Total fixed maturities | 228 | 109,890 | (1,282 | ) | 250 | 98,400 | (3,233 | ) | ||||||||||||||||
| Equity securities: | ||||||||||||||||||||||||
| 12 months or less | 20 | 6,955 | (842 | ) | 35 | 8,317 | (1,275 | ) | ||||||||||||||||
| Greater than 12 months | 11 | 6,640 | (813 | ) | 4 | 216 | (30 | ) | ||||||||||||||||
| Total equity securities | 31 | 13,595 | (1,655 | ) | 39 | 8,533 | (1,305 | ) | ||||||||||||||||
| Total | 259 | $ | 123,485 | $ | (2,937 | ) | 289 | $ | 106,933 | $ | (4,538 | ) | ||||||||||||
Unrealized losses in the Company’s fixed maturity portfolio are generally the result of interest rate fluctuations as well as the disruption of credit markets occasioned by financial market turmoil. The average unrealized loss for all fixed maturity securities in a loss position at December 31, 2012 is approximately 1% of original or adjusted cost. The Company does not intend to sell any fixed maturity securities and it is not more likely than not that the Company will have to sell any fixed maturity security before recovery of its amortized cost basis. For equity securities, the Company has evaluated the near-term prospects of the investment in relation to the severity and duration of the impairment and based on that evaluation the Company has the ability and intent to hold these investments until a recovery of fair value. Therefore, the Company does not believe the unrealized losses represent an other-than-temporary impairment as of December 31, 2012.
The fair value and the cost or amortized cost of fixed maturity investments at December 31, 2012, by contractual maturity, are shown below. Actual maturities may differ from contractual maturities because borrowers have, in some cases, the right to call or prepay obligations with or without call or prepayment penalties. Pre-refunded municipal bonds are classified based on their pre-refunded call dates.
| Fair Value | Cost or Amortized Cost | |||||||||||||||
| One year or less | $ | 152,034 | 34.1 | % | $ | 151,687 | 34.4 | % | ||||||||
| Excess of one year to five years | 222,173 | 49.9 | 220,010 | 49.9 | ||||||||||||
| Excess of five years to ten years | 21,492 | 4.8 | 21,122 | 4.8 | ||||||||||||
| Excess of ten years | 3,137 | 0.7 | 3,044 | 0.7 | ||||||||||||
| Total maturities | 398,836 | 89.5 | 395,863 | 89.8 | ||||||||||||
| Asset-backed securities | 46,833 | 10.5 | 44,696 | 10.2 | ||||||||||||
| $ | 445,669 | 100.0 | % | $ | 440,559 | 100.0 | % | |||||||||
- 50 -
Note B – Investments (continued)
Major categories of investment income for the years ended December 31 are summarized as follows:
| 2012 | 2011 | 2010 | |||||||||||
| Fixed maturities | $ | 10,052 | $ | 11,016 | $ | 11,838 | |||||||
| Equity securities | 2,121 | 1,738 | 1,433 | ||||||||||
| Money market funds | 38 | 36 | 39 | ||||||||||
| Short-term and other | 5 | 24 | 32 | ||||||||||
| 12,216 | 12,814 | 13,342 | |||||||||||
| Investment expenses | (2,286 | ) | (2,085 | ) | (2,007 | ) | |||||||
| Net investment income | $ | 9,930 | $ | 10,729 | $ | 11,335 | |||||||
Gains and losses on investments, including equity method earnings from limited partnerships, for the years ended December 31 are summarized below:
| 2012 | 2011 | 2010 | ||||||||||
| Fixed maturities: | ||||||||||||
| Gross gains | $ | 3,860 | $ | 6,443 | $ | 4,005 | ||||||
| Gross losses | (3,961 | ) | (6,805 | ) | (1,215 | ) | ||||||
| Net gains (losses) | (101 | ) | (362 | ) | 2,790 | |||||||
| Equity securities: | ||||||||||||
| Gross gains | 3,191 | 7,409 | 7,447 | |||||||||
| Gross losses | (1,131 | ) | (2,960 | ) | (1,958 | ) | ||||||
| Net gains | 2,060 | 4,449 | 5,489 | |||||||||
| Limited partnerships - net gain (loss) | 7,052 | (21,890 | ) | 8,206 | ||||||||
| Total net gains (losses) | $ | 9,011 | $ | (17,803 | ) | $ | 16,485 | |||||
Shareholders' equity includes approximately $20,000, net of deferred federal income taxes, of undistributed earnings from limited partnerships as of December 31, 2012.
Gain and loss activity for fixed maturity and equity security investments, as shown in the previous table, include adjustments for other-than-temporary impairment for the years ended December 31 summarized as follows:
| 2012 | 2011 | 2010 | ||||||||||
| Cumulative charges to income at beginning of year | $ | 8,178 | $ | 7,604 | $ | 9,235 | ||||||
| Writedowns based on objective and subjective criteria | 888 | 1,906 | 42 | |||||||||
| Recovery of prior writedowns upon sale or disposal | (1,293 | ) | (1,332 | ) | (1,673 | ) | ||||||
| Net pre-tax realized gain (loss) | 405 | (574 | ) | 1,631 | ||||||||
| Cumulative charges to income at end of year | $ | 7,773 | $ | 8,178 | $ | 7,604 | ||||||
| Addition (reduction) to earnings per share from net | ||||||||||||
| after-tax realized gain (loss) | $ | .02 | $ | (.03 | ) | $ | .07 | |||||
| Unrealized gain on investments previously | ||||||||||||
| written down at end of the year - see note below | $ | 8,158 | $ | 6,782 | $ | 9,535 | ||||||
Note: Recovery in market value of an investment which has previously been adjusted for other-than-temporary impairment is treated as an unrealized gain until the investment matures or is sold.
- 51 -
Note B – Investments (continued)
There is no primary or secondary market for the Company’s investments in limited partnerships and, in most cases, the Company is prohibited from disposing of its limited partnership interests for some period of time and generally must seek approval from the general partner for any such disposal. Distributions of earnings from these partnerships are largely at the sole discretion of the general partners and distributions are generally not received by the Company for many years after the earnings have been reported. The Company has commitments to contribute an additional $7,846 to various limited partnerships as of December 31, 2012.
The Company has invested a total of $24,000 in three limited partnerships, with an aggregate estimated value of $39,745 at December 31, 2012, that are managed by organizations in which three directors of the Company are executive officers, directors or owners. The Company’s ownership interest in these limited partnerships ranges from 4% to 14%. These limited partnerships added $2,485, ($18,673) and $7,464, net of fees, to investment gains (losses) in 2012, 2011 and 2010, respectively. During 2012, 2011 and 2010, the Company has recorded management fees of $650, $793 and $820, respectively, and performance-based fees of $0, $0 and $687, respectively, to these organizations for management of these limited partnerships. The Company has been informed that the fee rates applied to its investments in these limited partnerships are the same as, or lower than, the fee rates charged to unaffiliated customers for similar investments.
The Company utilized the services of a broker-dealer firm of which two directors of the Company are employees or partial owners. This broker-dealer serves as agent for purchases and sales of securities and manages an equity securities portfolio and fixed maturity portfolio with market values of approximately $1,869 and $19,300, respectively, at December 31, 2012. The Company has been informed that commission and management rates charged by this broker-dealer to the Company are commensurate with rates charged to non-affiliated customers for similar investments. Total commissions and net fees earned by the broker-dealer and affiliates on these transactions and for advice and consulting were approximately $186, $174 and $155 during 2012, 2011 and 2010, respectively.
The Company’s limited partnerships include one significant investment which invests in public and private equity markets in India. This limited partnership investment’s value as of December 31, 2012 and 2011 was $25,868 and $23,465, respectively. At December 31, 2012, the Company’s estimated ownership interest in this limited partnership investment was just over 4%. The Company's share of earnings from this limited partnership investment was $2,404, ($9,732) and $3,521 in 2012, 2011 and 2010, respectively. The summarized financial information of the significant limited partnership investment as of and for the years ended December 31 is as follows:
| 2012 | 2011 | 2010 | ||||||||||
| Total assets | $ | 641,071 | $ | 633,165 | $ | 963,207 | ||||||
| Total partners' capital | 559,745 | 579,568 | 895,207 | |||||||||
| Net increase (decrease) in partners' capital resulting from operations | 60,734 | (266,314 | ) | 98,279 | ||||||||
The fair value of regulatory deposits with various insurance departments in the United States and Canada totaled $47,791and $41,758 at December 31, 2012 and 2011, respectively.
Short-term investments at December 31, 2012 include $4,201 in time certificates of deposit by a Bermuda bank.
The Company’s fixed maturities are over 90% invested in investment grade fixed maturity investments. The Company has a total of $35,300, representing 17 different investments, of fixed maturity investments which were originally issued with guarantees by three different third party insurance companies, with the largest exposure to a single investment being $5,300. The average S&P credit rating of such investments, with consideration of the guarantee, is AA. The average S&P underlying credit rating of such investments, without consideration of the guarantee, would remain AA. The Company does not have any direct exposure to any guarantor.
Approximately $42,600 of fixed maturity investments (6.3% of total invested assets) consists of bonds rated as less than investment grade at year end. These investments include a diversified portfolio of over 40 investments including catastrophe bonds and have a $408 net unrealized gain position at December 31, 2012.
- 52 -
Note C - Loss and Loss Expense Reserves
Activity in the reserves for losses and loss expenses is summarized as follows. All amounts are shown net of reinsurance, unless otherwise indicated.
| 2012 | 2011 | 2010 | |||||||||
| Reserves at the beginning of the year | $ 290,092 | $ 218,629 | $ 203,253 | ||||||||
| Provision for losses and loss expenses: | |||||||||||
| Claims occurring during the current year | 147,963 | 225,251 | 154,775 | ||||||||
| Claims occurring during prior years | (9,875) | (9,696) | (8,823) | ||||||||
| Total incurred | 138,088 | 215,555 | 145,952 | ||||||||
| Loss and loss expense payments: | |||||||||||
| Claims occurring during the current year | 44,942 | 71,699 | 56,394 | ||||||||
| Claims occurring during prior years | 94,002 | 72,393 | 74,182 | ||||||||
| Total paid | 138,944 | 144,092 | 130,576 | ||||||||
| Reserves at the end of the year | 289,236 | 290,092 | 218,629 | ||||||||
| Reinsurance recoverable on unpaid losses at the end of the year | 166,218 | 131,464 | 125,891 | ||||||||
| Reserves, gross of reinsurance | |||||||||||
| recoverable, at the end of the year | $ 455,454 | $ 421,556 | $ 344,520 | ||||||||
The table above shows that a savings of $9,875 was developed during 2012 in the settlement of claims occurring on or before December 31, 2011 with comparative developments for the two previous calendar years. The net savings for each year are composed of individual claim savings and deficiencies which, in the aggregate have resulted from the settlement of claims at amounts lower than previously reserved and from changes in estimates of losses incurred but not reported as part of the normal reserving process.
The major components of the developments shown above are as follows for the years ended December 31:
| 2012 | 2011 | 2010 | ||||||||||
| Property and casualty insurance | $ | (7,111 | ) | $ | (7,417 | ) | $ | (6,567 | ) | |||
| Reinsurance | (2,764 | ) | (2,279 | ) | (2,256 | ) | ||||||
| Totals | $ | (9,875 | ) | $ | (9,696 | ) | $ | (8,823 | ) | |||
Favorable loss development is influenced by the Company’s long-standing policy of reserving for losses realistically and a willingness to settle claims based upon a seasoned evaluation of its exposures. Loss reserves pertaining to the Company’s property reinsurance business are established partially by the ceding reinsurers although the Company routinely adjusts such reserves if management determines that additional reserves could be necessary. Accordingly, there is potential for fluctuations in loss developments related to reinsurance assumed to be more pronounced than those experienced on directly produced business which is reserved entirely by Company personnel. In addition, changes in the Company’s net retention under reinsurance treaties will impact developments as more or less business is retained. These trends were considered in the establishment of the Company’s reserves at December 31, 2012 and 2011.
Loss reserves on certain permanent total disability workers’ compensation reserves have been discounted to present value at pre-tax rates not exceeding 3.5%. At December 31, 2012 and 2011, loss reserves have been reduced by approximately $6,118 and $6,642, respectively. Discounting is applied to these claims since the amount of periodic payments to be made during the lifetime of claimants is fixed and determinable.
Loss reserves have been reduced by estimated salvage and subrogation recoverable of approximately $7,839 and $7,158 at December 31, 2012 and 2011, respectively.
- 53 -
Note D – Reinsurance
The insurance subsidiaries cede portions of their gross premiums written to certain other insurers under excess of loss and quota share treaties and by facultative placements. Reinsurance treaties with other companies permit the recovery of a portion of related direct losses. Management determines the amount of net exposure it is willing to accept generally on a product line basis. Certain treaties covering fleet transportation risks include annual deductibles which must be exceeded before the Company can recover under the terms of the treaty. The Company retains a higher percentage of the direct premium in consideration of these deductible provisions. The Company remains liable to the extent the reinsuring companies are unable to meet their obligations under reinsurance contracts.
The Company also serves as an assuming reinsurer on treaties with direct writing insurance companies as well as under retrocessions from other reinsurers for catastrophic property coverages. Accordingly, the occurrence of catastrophic events can have a significant impact on the Company's operations. The Company also assumes reinsurance from direct writing insurance companies for casualty insurance coverages. In addition, the insurance subsidiaries participate in certain mandatory residual market pools which require insurance companies to provide coverages on assigned risks. The assigned risk pools allocate participation to all insurers based upon each insurer’s portion of premium writings on a state or national level. Historically, the operation of these assigned risk pools have resulted in net losses allocated to the Company although such losses have not been material in relation to the Company’s operations.
The following table summarizes the impact of reinsurance ceded and assumed on the Company’s net premium written and earned for the most recent three years:
| Premiums Written | Premiums Earned | |||||||||||||||||||||||
| 2012 | 2011 | 2010 | 2012 | 2011 | 2010 | |||||||||||||||||||
| Direct | $ | 284,200 | $ | 274,101 | $ | 249,699 | $ | 287,982 | $ | 270,002 | $ | 245,912 | ||||||||||||
| Ceded on direct | (105,292 | ) | (84,130 | ) | (75,907 | ) | (101,396 | ) | (83,580 | ) | (71,869 | ) | ||||||||||||
| Net direct | 178,908 | 189,971 | 173,792 | 186,586 | 186,422 | 174,043 | ||||||||||||||||||
| Assumed | 57,086 | 60,425 | 46,103 | 53,191 | 60,061 | 41,945 | ||||||||||||||||||
| Ceded on assumed | (2,316 | ) | (1,913 | ) | (1,250 | ) | (2,316 | ) | (1,913 | ) | (1,250 | ) | ||||||||||||
| Net assumed | 54,770 | 58,512 | 44,853 | 50,875 | 58,148 | 40,695 | ||||||||||||||||||
| Net | $ | 233,678 | $ | 248,483 | $ | 218,645 | $ | 237,461 | $ | 244,570 | $ | 214,738 | ||||||||||||
Net losses and loss expenses incurred for 2012, 2011 and 2010 have been reduced by ceded reinsurance recoveries of approximately $90,899, $56,600, and $15,318, respectively. Ceded reinsurance premiums and loss recoveries for the purchase of catastrophe reinsurance coverage on the Company’s net direct business were not material.
Net losses and loss expenses incurred for 2012, 2011 and 2010 include approximately $16,486, $88,934, and $38,318, respectively, net of retrocessional recoveries of $20,000 during 2012, relating to reinsurance assumed from non-affiliated insurance or reinsurance companies.
Components of reinsurance recoverable at December 31 are as follows:
| 2012 | 2011 | |||||||
| Case unpaid losses, net of valuation allowance | $ | 105,940 | $ | 72,914 | ||||
| Incurred but not reported unpaid losses and loss expenses | 59,421 | 56,262 | ||||||
| Paid losses and loss expenses | 2,506 | 3,043 | ||||||
| Unearned premiums | 7,324 | 6,185 | ||||||
| $ | 175,191 | $ | 138,404 | |||||
- 54 -
Note E - Income Taxes
Deferred income taxes are calculated to account for the net tax effects of temporary differences between the carrying amounts of assets and liabilities for financial reporting purposes and the amounts used for income tax purposes. Significant components of the Company's deferred tax assets and liabilities as of December 31 are as follows:
| 2012 | 2011 | |||||||
| Deferred tax liabilities: | ||||||||
| Unrealized gain on fixed income and equity security investments | $ | 19,098 | $ | 14,319 | ||||
| Deferred acquisition costs | 2,782 | 3,576 | ||||||
| Salvage and subrogation | 2,555 | 2,275 | ||||||
| Limited partnership investments | 1,554 | - | ||||||
| Other | 1,562 | 898 | ||||||
| Total deferred tax liabilities | 27,551 | 21,068 | ||||||
| Deferred tax assets: | ||||||||
| Loss and loss expense reserves | 11,384 | 18,377 | ||||||
| Unearned premiums discount | 2,097 | 2,361 | ||||||
| Other-than-temporary investment declines | 2,733 | 2,902 | ||||||
| Deferred compensation | 734 | 845 | ||||||
| Deferred ceding commission | 1,700 | 1,974 | ||||||
| Limited partnership investments | - | 1,459 | ||||||
| Other | 325 | 269 | ||||||
| Total deferred tax assets | 18,973 | 28,187 | ||||||
| Net deferred tax assets (liabilities) | $ | (8,578 | ) | $ | 7,119 | |||
A summary of the difference between federal income tax expense computed at the statutory rate and that reported in the consolidated financial statements is as follows:
| 2012 | 2011 | 2010 | ||||||||||||||
Statutory federal income rate applied to pretax income (loss) $ 16,312 | $ | (15,851) | $ | 12,185 | ||||||||||||
| Tax effect of (deduction): | ||||||||||||||||
| Tax-exempt investment income | (933 | ) | (1,145 | ) | (1,296 | ) | ||||||||||
| Net reduction of tax positions | (693 | ) | (174 | ) | (826 | ) | ||||||||||
| Other | 1 | 56 | (265 | ) | ||||||||||||
| Federal income tax expense (benefit) | $ | 14,687 | $ | (17,114 | ) | $ | 9,798 | |||||||||
| Federal income tax expense (benefit) consists of the following: | ||||||||||||
| 2012 | 2011 | 2010 | ||||||||||
| Taxes (credits) on pre-tax income (loss): | ||||||||||||
| Current | $ | 10,819 | $ | (8,205 | ) | $ | 9,752 | |||||
| Deferred | 3,868 | (8,909 | ) | 46 | ||||||||
| $ | 14,687 | $ | (17,114 | ) | $ | 9,798 | ||||||
- 55 -
Note E – Income Taxes (continued)
| The components of the provision for deferred federal income taxes (credits) are as follows: | |||||||||||||
| 2012 | 2011 | 2010 | |||||||||||
| Limited partnerships | $ | 3,013 | $ | (7,196 | ) | $ | 485 | ||||||
| Discounts of loss and loss expense reserves | (57 | ) | (2,546 | ) | (107 | ) | |||||||
| Unearned premium discount | 265 | (30 | ) | (517 | ) | ||||||||
| Deferred compensation | 112 | 499 | (735 | ) | |||||||||
| Other-than-temporary investment declines | 169 | (240 | ) | 571 | |||||||||
| Deferred acquisitions costs and ceding commission | (520 | ) | (87 | ) | (27 | ) | |||||||
| Other | 886 | 691 | 376 | ||||||||||
| Provision for deferred federal income tax (credits) | $ | 3,868 | $ | (8,909 | ) | $ | 46 | ||||||
Cash flows related to federal income taxes paid, net of refunds received, for 2012, 2011 and 2010 were $3,661, $2,859, and $9,000 respectively.
The Company is required to establish a valuation allowance for any portion of the gross deferred tax asset that management believes will not be realized. Management has determined that no such valuation allowance is necessary at December 31, 2012 or 2011. As of December 31, 2012, the Internal Revenue Service had completed examinations and settled all audits through the Company’s 2004 tax year.
The Company has no uncertain tax positions as of December 31, 2012. Previous tax positions were uncertain only as to the timing of deductibility and therefore, if recognized, would have had no impact on the Company’s effective tax rate. The Company recognizes accrued interest and penalties, if any, related to unrecognized tax benefits in income tax expense and changes in such accruals would impact the Company’s effective tax rate. Amounts accrued for the payment of interest at December 31, 2012, 2011 and 2010 were not material.
The table below reconciles the amount of unrecognized federal income taxes as of December 31, 2012 and 2011. The amount has no impact on the Company’s effective tax rate and excludes interest, which is treated as income tax expense per the Company’s accounting policy. During 2012, the Company decided it was no longer necessary to carry this amount as it was determined that the tax years to which uncertain tax positions related are now closed.
| 2012 | 2011 | |||||||
| Balance at January 1 | $ | 6,000 | $ | 6,000 | ||||
| Reductions for tax positions of the current year | - | - | ||||||
| Reductions for tax positions of prior years | (6,000 | ) | - | |||||
| Balance at December 31 | $ | - | $ | 6,000 | ||||
- 56 -
| Note F - Shareholders' Equity | ||||||||||||||||||||||
| Changes in common stock outstanding and additional paid-in capital are as follows: | ||||||||||||||||||||||
| Additional | ||||||||||||||||||||||
| Class A | Class B | Paid-in | ||||||||||||||||||||
| Shares | Amount | Shares | Amount | Capital | ||||||||||||||||||
| Balance at January 1, 2010 | 2,623,109 | $ | 112 | 12,109,878 | $ | 517 | $ | 46,337 | ||||||||||||||
| Restricted stock grants | - | - | 77,131 | 3 | 1,537 | |||||||||||||||||
| Balance at December 31, 2010 | 2,623,109 | 112 | 12,187,009 | 520 | 47,874 | |||||||||||||||||
| Restricted stock grants | - | - | 38,339 | 2 | 877 | |||||||||||||||||
| Balance at December 31, 2011 | 2,623,109 | 112 | 12,225,348 | 522 | 48,751 | |||||||||||||||||
| Restricted stock grants | - | - | 64,687 | 2 | 1,524 | |||||||||||||||||
| Balance at December 31, 2012 | 2,623,109 | $ | 112 | 12,290,035 | $ | 524 | $ | 50,275 | ||||||||||||||
The Company's Class A and Class B common stock has a stated value of approximately $.04 per share.
| Note G - Other Operating Expenses | |||||||||||||
| Details of other operating expenses for the years ended December 31: | |||||||||||||
| 2012 | 2011 | 2010 | |||||||||||
| Amortization of gross deferred policy acquisition costs | $ | 41,957 | $ | 40,712 | $ | 34,048 | |||||||
| Other underwriting expenses | 27,242 | 25,290 | 23,894 | ||||||||||
| Expense allowances from reinsurers | (15,185 | ) | (11,503 | ) | (10,081 | ) | |||||||
| Total underwriting expenses | 54,014 | 54,499 | 47,861 | ||||||||||
| Operating expenses of non-insurance companies | 23,416 | 18,829 | 20,843 | ||||||||||
| Total other operating expenses | $ | 77,430 | $ | 73,328 | $ | 68,704 | |||||||
Note H - Employee Benefit Plans
The Company maintains a defined contribution 401(k) Employee Savings and Profit Sharing Plan (the “Plan”) which covers nearly all employees who have completed one year of service. The Company's contributions to the Plan for 2012, 2011 and 2010 were $1,539, $1,452 and $1,497, respectively.
Note I - Stock Purchase and Option Plans
In accordance with the terms of the 1981 Stock Purchase Plan (1981 Plan), the Company is obligated to repurchase shares issued under the 1981 Plan, at a price equal to 90% of the book value of the shares at the end of the quarter immediately preceding the date of repurchase. No shares have ever been repurchased under the 1981 Plan. At December 31, 2012, there were 124,099 shares (Class A) and 380,458 shares (Class B) outstanding which remain eligible for repurchase by the Company.
The Company maintains two stock option plans and one restricted stock unit plan which are described below.
Director Option Plan:
Under the Director Option Plan (the “Director Plan”), which is shareholder approved, the Company has reserved 300,000 shares of Class B common stock for the granting of discounted and market value options to non-employee directors. Approximately 167,000 shares of Class B common stock are available for future grants. No options were granted to directors during the three year period ended December 31, 2012. Additionally, no discounted options were outstanding or exercised at any time during this three year period. Accordingly, no compensation cost was charged against income for the Director Plan for 2012, 2011 and 2010.
- 57 -
Note I - Stock Purchase and Option Plans (continued)
Employee Option Plan:
Under the Employee Option Plan (the “Employee Plan”), which is shareholder approved, the Company has reserved 1,125,000 shares of Class B common stock for the granting of discounted and market value options to employees. Approximately 259,000 shares of Class B common stock are available for future grants. No options were granted to employees during the three year period ended December 31, 2012. Additionally, no options were outstanding or exercised at any time during this period. Accordingly, no compensation cost was charged against income for the Employee Plan for 2012, 2011 and 2010.
The Company's policy is to issue new shares to satisfy share option exercises.
Restricted Stock:
Each year, beginning in 2009, the Company has issued shares of class B restricted stock to the Company’s outside directors. The shares serve as the annual retainer compensation for the outside directors for the periods shown below. The shares are distributed on the vesting date and have a total value of $440 for each of the annual periods. The table below provides detail of the stock issuances to date as of December 31, 2012:
| Effective | Number of Shares | Vesting | Value | ||||||||
| Date | Issued | Date | Period | Per Share | |||||||
| 6/11/2009 | 20,900 | 5/5/2010 | 7/1/2009 - 6/30/2010 | $ | 21.05 | ||||||
| 5/4/2010 | 17,754 | 5/4/2011 | 7/1/2010 - 6/30/2011 | $ | 24.78 | ||||||
| 5/10/2011 | 19,558 | 5/10/2012 | 7/1/2011 - 6/30/2012 | $ | 22.50 | ||||||
| 5/8/2012 | 20,119 | 5/8/2013 | 7/1/2012 - 6/30/2013 | $ | 21.87 | ||||||
Compensation expense related to the above stock grant is recognized over the period in which the directors render the services.
Director compensation cost associated with restricted stock grants of $440 was charged against income for the restricted stock units for 2012, 2011 and 2010.
Effective February 9, 2011, the Company issued 14,473 shares of class B restricted stock to certain of the Company’s executives. The restricted shares will be paid solely in the Company’s class B stock. The restricted shares represent compensation to certain executives under the Company’s 2010 Executive Incentive Bonus Plan. The restricted shares vest ratably over a three year period from the date of grant and are accelerated for retirement eligible recipients due to the non-substantive post-grant date vesting clause per ASC 715, Compensation-Retirement Benefits. Restricted stock was valued based on the closing price of the stock on the day the award was granted. Each share was valued at $23.39 per share representing a total value of $339. Non-vested restricted shares will be forfeited should an executive’s employment terminate for any reason other than death, disability, or retirement as defined by the Compensation Committee.
Effective February 4, 2013, the Company issued 52,389 shares of class B restricted stock to certain of the Company’s executives. The restricted shares will be paid solely in the Company’s class B stock. The restricted shares represent compensation to certain executives under the Company’s 2012 Executive Incentive Bonus Plan. The restricted shares will vest ratably over a three year period from the date of grant and are accelerated for retirement eligible recipients due to the non-substantive post-grant date vesting clause per ASC 715, Compensation-Retirement Benefits. Restricted stock was valued based on the closing price of the stock on the day the award was granted. Each share was valued at $23.69 per share representing a total value of $1,241. Non-vested restricted shares will be forfeited should an executive’s employment terminate for any reason other than death, disability, or retirement as defined by the Compensation Committee.
- 58 -
Note I - Stock Purchase and Option Plans (continued)
Through 2002, the Company provided loans to certain employees for the sole purpose of purchasing the Company’s Class B common stock in the open market. The underlying securities served as collateral for these loans. All employee loans had been paid in full as of March 31, 2012. No additional loans will be made under this program.
Note J - Reportable Segments
The Company operates within two reportable business segments: property and casualty insurance and reinsurance. The property and casualty insurance segment provides multiple line insurance coverage primarily to fleet transportation companies and to independent contractors who contract with fleet transportation companies, as well as individual personal automobile coverage, professional liability coverages and business owners’ and commercial property policies. The reinsurance segment accepts cessions from other insurance companies as well as retrocessions from selected reinsurance companies, providing property catastrophe and casualty reinsurance coverages.
The Company evaluates performance and allocates resources based on past or expected results from insurance underwriting operations before income taxes. Underwriting gain or loss does not include net investment income or gains or losses on the Company's investment portfolio. All investment-related revenues are managed at the corporate level. Underwriting gain or loss for the property and casualty insurance segment includes revenue and expense from the Company's agency operations since the agency operations serve as a primary direct marketing facility for this segment. Management does not identify or allocate assets to reportable segments when evaluating segment performance and depreciation expense is not material for any of the reportable segments. The accounting policies of each reportable segment are the same as those described in the summary of significant accounting policies.
The following table provides certain profit and loss information for each reportable segment for the years ended
December 31:
| 2012 | 2011 | 2010 | |||||||||||
| Direct and assumed premium written: | |||||||||||||
| Property and casualty insurance | $ | 284,200 | $ | 274,101 | $ | 249,699 | |||||||
| Reinsurance | 57,086 | 60,425 | 46,103 | ||||||||||
| Totals | $ | 341,286 | $ | 334,526 | $ | 295,802 | |||||||
| Net premium earned: | |||||||||||||
| Property and casualty insurance | $ | 186,586 | $ | 186,422 | $ | 174,043 | |||||||
| Reinsurance | 50,875 | 58,148 | 40,695 | ||||||||||
| Totals | $ | 237,461 | $ | 244,570 | $ | 214,738 | |||||||
| Underwriting gain (loss): | |||||||||||||
| Property and casualty insurance | $ | 23,491 | $ | 19,646 | $ | 26,308 | |||||||
| Reinsurance | 20,567 | (45,113 | ) | (6,725 | ) | ||||||||
| Totals | $ | 44,058 | $ | (25,467 | ) | $ | 19,583 | ||||||
- 59 -
Note J - Reportable Segments (continued)
The following table reconciles reportable segment profits to the Company’s consolidated income (loss) before federal income taxes:
| 2012 | 2011 | 2010 | |||||||||||
| Profit: | |||||||||||||
| Underwriting gain (loss) | $ | 44,058 | $ | (25,467 | ) | $ | 19,583 | ||||||
| Net investment income | 9,930 | 10,729 | 11,335 | ||||||||||
| Net realized gains (losses) on investments | 9,011 | (17,803 | ) | 16,485 | |||||||||
| Corporate expenses | (16,393 | ) | (12,748 | ) | (12,590 | ) | |||||||
| Income (loss) before federal income taxes | $ | 46,606 | $ | (45,289 | ) | $ | 34,813 | ||||||
One customer of the property and casualty insurance segment, FedEx Ground Systems, Inc. (“FedEx Ground”) and certain of its subsidiaries and related entities represents approximately $19,052, $23,347 and $20,187 of the Company’s consolidated direct and assumed premium written in 2012, 2011 and 2010, respectively. An additional $146,447, $129,508 and $115,625 for 2012, 2011 and 2010, respectively, is placed with the Company by a non-affiliated broker on behalf of independent contractors of this same customer.
Note K - Earnings Per Share
The following is a reconciliation of the denominators used in the calculation of basic and diluted earnings per share for the years ended December 31:
| 2012 | 2011 | 2010 | ||||||||||
| Average share outstanding for basic earnings per share | 14,838,767 | 14,818,354 | 14,782,624 | |||||||||
| Dilutive effect of share equivalents | 29,482 | - | 16,078 | |||||||||
| Average shares outstanding for diluted earnings per share | 14,868,249 | 14,818,354 | 14,798,702 | |||||||||
During 2011 the Company sustained a net loss. Accordingly, the anti-dilutive effect of 19,983 shares was excluded from the calculation of the average shares outstanding.
Note L - Concentrations of Credit Risk
The Company writes policies of excess insurance attaching above self-insured retentions ("SIR") and also writes policies that contain large, per-claim deductibles. Those losses and claims that fall within the SIR limits are obligations of the insured; however, the Company writes surety bonds in favor of various regulatory agencies guaranteeing the insureds’ payment of claims within the SIR. Further, specified portions of losses and claims incurred under large deductible policies, while obligations of the Company, are contractually reimbursable to the Company from the insureds. The Company requires collateral from its insureds to serve as a source of reimbursement if the Company is obligated to pay claims within the SIR by reason of an insured’s default or if the insured fails to reimburse the Company for deductible amounts paid by the Company.
Acceptable collateral may be provided in the form of letters of credit on Company approved banks, Company approved marketable securities or cash. At December 31, 2012, the Company held collateral in the aggregate amount of $197,978.
- 60 -
Note L - Concentrations of Credit Risk (Continued)
The amount of collateral required of an insured is determined by the financial condition of the insured, the type of obligations guaranteed by the Company, estimated reserves for incurred losses within the SIR or deductible that have been reported to the insured or the Company, estimated incurred but not reported losses, and estimates for losses that are expected to occur, within the SIR or deductible, prior to the next collateral adjustment date. In general, the Company attempts to hold collateral equal to 100% of the ultimate losses that would be paid by or due the Company in the event of an insured’s default. Periodic audits are conducted by the Company to evaluate its exposure and the collateral required. If a deficiency in collateral is noted as the result of an audit, additional collateral is requested immediately. Because collateral amounts contain numerous estimates of the Company’s exposure, are adjusted only periodically and are sometimes reduced based on the superior financial condition of the insured, the amount of collateral held by the Company at a given point in time may not be sufficient to fully reimburse the Company for all of its guarantees or amounts due in the event of an insured’s default. In that regard, the Company is not fully collateralized for the guarantees made for, or the deductible amounts that may be due from FedEx Ground and certain of its subsidiaries and related entities, and in the event of their default, such default may have a material adverse impact on the Company. The Company estimates its uncollateralized exposure related to this customer to be as much as 31% of shareholders' equity at December 31, 2012.
In addition, the Company's balance sheet includes paid and estimated unpaid amounts recoverable from reinsurers under various agreements totaling $175,191 at December 31, 2012, as more fully discussed in Note D - Reinsurance. These recoverables are largely uncollateralized. The largest estimated amount due from an individual reinsurer was $51,493, for which the Company holds approximately $43,600 in collateral. The second largest estimated amount due was $21,753 at December 31, 2012.
Investments in limited partnerships include an aggregate of $39,745 invested in three limited partnerships, New Vernon India Fund, New Vernon Global Opportunity Fund and New Vernon Aegir Fund which are managed by organizations in which three directors of the Company are executive officers, directors and owners.
Note M – Acquisition and related Goodwill and Intangibles
On October 31, 2008, the Company purchased Transportation Specialty Insurance Agency, Inc., (“TIA”) of Toledo, Ohio for a cash purchase price of $3,500. TIA is a commercial lines specialty insurance agency primarily focusing on the needs of the transportation industry including trucking independent contractors as well as fleet trucking companies. TIA is part of the Company’s property and casualty insurance segment. As part of the purchase, the Company recorded goodwill of $3,152 and intangible assets related to customer relationships and employment agreements of $179 which are included in Other Assets in the consolidated balance sheets and has recorded amortization of intangible assets of $28, $35 and $41 during 2012, 2011 and 2010, respectively. Accumulated amortization on intangible assets was $158 and $130 as of December 31, 2012 and 2011, respectively.
Note N – Debt
The Company maintains a revolving line of credit with a $30,000 limit, with an expiration date of September 23, 2014. Interest on this line of credit is referenced to LIBOR and can be fixed for periods of up to one year at the Company’s option. Outstanding drawings on this line of credit were $10,000 as of December 31, 2012 and 2011. At December 31, 2012, the effective interest rate was 1.11%. The Company has $20,000 remaining unused under the line of credit at December 31, 2012. The current outstanding borrowings were used principally for general corporate purchases.
- 61 -
Note O – Fair Value
Assets and liabilities recorded at fair value in the consolidated balance sheets are categorized based upon the level of judgment associated with the inputs used to measure their fair value. The following tables summarize fair value measurements by level for assets measured at fair value on a recurring basis:
As of December 31, 2012:
| Description | Total | Level 1 | Level 2 | Level 3 | ||||||||||||
| U.S. government obligations | $ | 70,742 | $ | 70,742 | $ | - | $ | - | ||||||||
| Residential mortgage-backed securities | 25,040 | - | 25,040 | - | ||||||||||||
| Commercial mortgage-backed securities | 11,828 | - | 11,828 | - | ||||||||||||
| State and municipal obligations | 194,865 | - | 194,865 | - | ||||||||||||
| Corporate securities | 118,945 | - | 107,263 | 11,682 | ||||||||||||
| Options embedded in convertible securities | 1,651 | - | 1,651 | - | ||||||||||||
| Foreign government obligations | 22,598 | - | 22,598 | - | ||||||||||||
| Total fixed maturities | 445,669 | 70,742 | 363,245 | 11,682 | ||||||||||||
| Equity securities | 107,582 | 107,582 | - | - | ||||||||||||
| Short term | 4,201 | 4,201 | - | - | ||||||||||||
| Cash equivalents | 64,450 | - | 64,450 | - | ||||||||||||
| $ | 621,902 | $ | 182,525 | $ | 427,695 | $ | 11,682 | |||||||||
As of December 31, 2011:
| Description | Total | Level 1 | Level 2 | Level 3 | ||||||||||||
| U.S. government obligations | $ | 73,137 | $ | 73,137 | $ | - | $ | - | ||||||||
| Government sponsored entities | 349 | - | 349 | - | ||||||||||||
| Residential mortgage-backed securities | 21,872 | - | 21,872 | - | ||||||||||||
| Commercial mortgage-backed securities | 11,300 | - | 11,300 | - | ||||||||||||
| State and municipal obligations | 190,035 | - | 190,035 | - | ||||||||||||
| Corporate securities | 90,141 | - | 73,091 | 17,050 | ||||||||||||
| Options embedded in convertible securities | 1,505 | - | 1,505 | - | ||||||||||||
| Foreign government obligations | 21,121 | - | 21,121 | - | ||||||||||||
| Total fixed maturities | 409,460 | 73,137 | 319,273 | 17,050 | ||||||||||||
| Equity securities | 88,085 | 88,085 | - | - | ||||||||||||
| Short term | 3,675 | 2,982 | 693 | - | ||||||||||||
| Cash equivalents | 81,756 | - | 81,756 | - | ||||||||||||
| $ | 582,976 | $ | 164,204 | $ | 401,722 | $ | 17,050 | |||||||||
- 62 -
Note O – Fair Value (continued)
Level inputs, as defined by the FASB guidance, are as follows:
| Level Input: | Input Definition: | |
| Level 1 | Inputs are unadjusted, quoted prices for identical assets or liabilities in active markets at the measurement date. | |
| Level 2 | Inputs other than quoted prices included in Level 1 that are observable for the asset or liability through corroboration with market data at the measurement date. | |
| Level 3 | Unobservable inputs that reflect management’s best estimate of what market participants would use in pricing the asset or liability at the measurement date. |
The Level 3 assets consist of a portfolio of insurance-linked securities. The insurance-linked securities are valued using the average of estimated market quotes from multiple insurance-linked securities brokers. The broker quotes include Level 3 inputs which are significant to the valuation of the insurance-linked securities. There were no Level 3 sales, no transfers into Level 3 and no transfers out of Level 3 during 2012 or 2011. A reconciliation of the beginning and ending balances of assets measured at fair value on a recurring basis using Level 3 inputs is as follows for the years ended December 31:
| 2012 | 2011 | |||||||
| Beginning of period balance | $ | 17,050 | $ | 17,242 | ||||
| Total gains or losses (realized or unrealized) | ||||||||
| included in income | 1,653 | 387 | ||||||
| Purchases | 400 | 6,522 | ||||||
| Settlements | (7,421 | ) | (7,101 | ) | ||||
| End of period balance | $ | 11,682 | $ | 17,050 | ||||
Quoted market prices are obtained whenever possible. Where quoted market prices are not available, fair values are estimated using present value or other valuation techniques. These techniques are significantly affected by our assumptions, including discount rates and estimates of future cash flows. Potential taxes and other transaction costs have not been considered in estimating fair values.
Transfers between levels, if any, are recorded as of the beginning of the reporting period. There were no significant transfers of assets between Level 1 and Level 2 during 2012, 2011 and 2010.
In addition to the preceding disclosures on assets recorded at fair value in the consolidated balance sheets, FASB guidance also requires the disclosure of fair values for certain other financial instruments for which it is practicable to estimate fair value, whether or not such values are recognized in the consolidated balance sheets.
Non-financial instruments such as real estate, property and equipment, other assets, deferred income taxes and intangible assets, and certain financial instruments such as policy reserve liabilities are excluded from the fair value disclosures. Therefore, the fair value amounts cannot be aggregated to determine the underlying economic value to the Company.
The carrying amounts reported in the consolidated balance sheets for cash, accounts receivables, reinsurance recoverable, notes receivable, accounts payable and accrued expenses, income taxes payable, short term borrowings and unearned income approximate fair value because of the short term nature of these items. These assets and liabilities are not included in the table below.
- 63 -
Note O – Fair Value (continued)
The following methods, assumptions and inputs were used to estimate the fair value of each class of financial instrument:
Limited partnerships: The Company accounts for investments in limited partnerships using the equity method of accounting, which requires an investor in a limited partnership to carry the investment at its proportionate share of the limited partnership’s equity. The underlying assets of the Company’s investments in limited partnerships are carried at fair value, and, therefore, the Company’s carrying value of limited partnerships approximates fair value. As these investments are not actively traded and the corresponding inputs are based on data provided by the investees, they are classified as Level III.
Short-term borrowings: The fair value of our short-term borrowings is based on quoted market prices for the same or similar debt, or, if no quoted market prices are available, on the current market interest rates available to us for debt of similar terms and remaining maturities.
A summary of the carrying value and fair value by level of financial instruments not recorded at fair value on the Company’s consolidated balance sheet at December 31, 2012 is as follows:
| Carrying | Fair Value | |||||||||||||||||||
| Value | Level 1 | Level II | Level III | Total | ||||||||||||||||
| Assets: | ||||||||||||||||||||
| Limited partnerships | $ | 59,954 | $ | - | $ | - | $ | 59,954 | $ | 59,954 | ||||||||||
| Liabilities: | ||||||||||||||||||||
| Short-term borrowings | 10,000 | - | 10,000 | - | 10,000 | |||||||||||||||
A summary of the carrying value and fair value by level of financial instruments not recorded at fair value on the Company’s consolidated balance sheet at December 31, 2011 is as follows:
| Carrying | Fair | |||||||
| Value | Value | |||||||
| Assets: | ||||||||
| Limited partnerships | $ | 54,705 | $ | 54,705 | ||||
| Liabilities: | ||||||||
| Short-term borrowings | 10,000 | 10,000 | ||||||
| Quarterly results of operations are as follows: | |||||||||||||||||||||||||||||||||
| Results by Quarter | |||||||||||||||||||||||||||||||||
| 2012 | 2011 | ||||||||||||||||||||||||||||||||
| 1st | 2nd | 3rd | 4th | 1st | 2nd | 3rd | 4th | ||||||||||||||||||||||||||
| Net premiums earned | $ | 61,551 | $ | 59,655 | $ | 54,853 | $ | 61,402 | $ | 57,601 | $ | 62,344 | $ | 60,429 | $ | 64,196 | |||||||||||||||||
| Net investment income | 2,422 | 2,431 | 2,343 | 2,734 | 2,653 | 2,644 | 2,779 | 2,652 | |||||||||||||||||||||||||
| Net gains (losses) on investments | 5,381 | (5,453 | ) | 8,781 | 302 | (1,469 | ) | (1,963 | ) | (17,460 | ) | 3,088 | |||||||||||||||||||||
| Losses and loss expenses incurred | 34,904 | 33,739 | 30,477 | 38,970 | 65,673 | 55,166 | 48,637 | 46,079 | |||||||||||||||||||||||||
| Net income (loss) | 11,506 | 4,050 | 11,687 | 4,676 | (15,198 | ) | (5,504 | ) | (12,971 | ) | 5,498 | ||||||||||||||||||||||
| Net income (loss) per share - diluted | $ | .78 | $ | .27 | $ | .78 | $ | .31 | $ | (1.02 | ) | $ | (.38 | ) | $ | (.87 | ) | $ | .37 | ||||||||||||||
- 64 -
Note Q - Statutory
Net income (loss) of the insurance subsidiaries, as determined in accordance with statutory accounting practices, was $29,262, ($19,120) and $12,542 for 2012, 2011 and 2010, respectively. Consolidated statutory surplus for these subsidiaries was $338,857 and $313,705 at December 31, 2012 and 2011, respectively, of which $55,192 may be transferred by dividend or loan to the parent company during calendar year 2013 with proper notification to, but without approval from, regulatory authorities. An additional $196,234 of shareholders’ equity of such insurance subsidiaries could, under existing regulations, be advanced or loaned to the parent company with prior notification to and approval from regulatory authorities, although it is unlikely that transfers of this size would be practical.
Minimum statutory surplus necessary for the insurance subsidiaries to satisfy statutory risk based capital requirements was $86,060 at December 31, 2012.
Note R - Leases
The Company leases office space and certain computer and related equipment using noncancelable operating leases. Lease expense for 2012, 2011 and 2010 was $1,506 $1,483 and $1,386, respectively. At December 31, 2012, future lease payments for operating leases with initial or remaining noncancelable terms of one year or more consisted of the following:
| 2013 | $ | 998 | ||
| 2014 | 49 | |||
| 2015 | 15 | |||
| 2016 | - | |||
| 2017 | - | |||
| Thereafter | - | |||
| Total minimum payments required | $ | 1,062 |
Note S – Accumulated Other Comprehensive Income
A reconciliation of the components of accumulated other comprehensive income at December 31 is as follows:
| 2012 | 2011 | |||||||
| Investments: | ||||||||
| Total unrealized gain before federal income taxes | $ | 54,565 | $ | 40,911 | ||||
| Deferred tax liability | (19,098 | ) | (14,319 | ) | ||||
| Net unrealized gains on investments | 35,467 | 26,592 | ||||||
| Foreign exchange adjustment: | ||||||||
| Gross unrealized gains | 3,039 | 2,706 | ||||||
| Deferred tax liability | (1,063 | ) | (947 | ) | ||||
| Net unrealized gains on foreign exchange adjustment | 1,976 | 1,759 | ||||||
| Accumulated other comprehensive income | $ | 37,443 | $ | 28,351 | ||||
- 65 -
Note S – Accumulated Other Comprehensive Income (continued)
Other comprehensive income (loss) reclassification adjustments for the years ended December 31 are as follows:
| 2012 | 2011 | 2010 | ||||||||||
| Investments: | ||||||||||||
| Pre-tax holding gains (losses) on debt and equity | ||||||||||||
| securities arising during period | $ | 15,612 | $ | (7,146 | ) | $ | 11,369 | |||||
| Applicable federal income taxes (credits) | 5,464 | (2,501 | ) | 3,979 | ||||||||
| 10,148 | (4,645 | ) | 7,390 | |||||||||
| Pre-tax gains (losses) on debt and equity securities | ||||||||||||
| included in net income (loss) during period | 1,959 | 4,088 | 8,280 | |||||||||
| Applicable federal income taxes (credits) | 686 | 1,431 | 2,898 | |||||||||
| 1,273 | 2,657 | 5,382 | ||||||||||
| Change in unrealized gains (losses) on investments | $ | 8,875 | $ | (7,302 | ) | $ | 2,008 | |||||
Reconciliation of accumulated other comprehensive income and retained earnings for the years ended December 31 are as follows:
| 2012 | 2011 | 2010 | ||||||||||
| Beginning accumulated other comprehensive income | $ | 28,351 | $ | 35,883 | $ | 33,434 | ||||||
| Change in foreign exchange adjustment | 217 | (230 | ) | 441 | ||||||||
| Change in unrealized net gains (losses) on investments | 8,875 | (7,302 | ) | 2,008 | ||||||||
| Ending accumulated other comprehensive income | $ | 37,443 | $ | 28,351 | $ | 35,883 | ||||||
| 2012 | 2011 | 2010 | ||||||||||
| Beginning retained earnings | $ | 241,325 | $ | 284,346 | $ | 292,543 | ||||||
| Net income (loss) | 31,919 | (28,175 | ) | 25,015 | ||||||||
| Dividends | (14,886 | ) | (14,846 | ) | (33,212 | ) | ||||||
| Ending retained earnings | $ | 258,358 | $ | 241,325 | $ | 284,346 | ||||||
Note T - Subsequent Events
We have evaluated subsequent events for recognition or disclosure in the consolidated financial statements filed on Form 10-K with the U.S. Securities and Exchange Commission and no events have occurred during this period which require recognition or disclosure in this document.
- 66 -
Item 9. CHANGES IN AND DISAGREEMENTS WITH ACCOUNTANTS ON ACCOUNTING AND FINANCIAL DISCLOSURE
No response to this item is required.
Item 9A. CONTROLS AND PROCEDURES
The Company’s management, under the direction of our Chief Executive Officer (“CEO”) and Chief Financial Officer (“CFO”), has performed an evaluation of its disclosure controls and procedures (as defined by Exchange Act rules 13a-15(e) and 15d-15(e)) as of the end of the period covered by this report. Based on this evaluation, the Company's CEO and CFO have concluded that the Company’s disclosure controls and procedures were effective in ensuring that information required to be disclosed by the company is recorded, processed, summarized, and reported within the time periods specified in the SEC's rules and forms. In addition, there have not been any significant changes in internal controls or other factors that could significantly affect internal controls subsequent to the date of the Company's most recent evaluation.
Management's Responsibility For Financial Statements
Management is responsible for the preparation of the Company’s consolidated financial statements and related information appearing in this report. Management believes that the consolidated financial statements fairly reflect the form and substance of transactions and that the financial statements reasonably present the Company’s financial position and results of operations in conformity with U.S. generally accepted accounting principles. Management has included in the Company’s financial statements amounts that are based upon estimates and judgments which it believes are reasonable under the circumstances.
Ernst & Young LLP, an independent registered public accounting firm, audits the Company’s consolidated financial statements in accordance with the standards of the Public Company Accounting Oversight Board and provides an objective, independent review of the fairness of reported operating results and financial position.
The Board of Directors of the Company has an Audit Committee composed of four non-management Directors. The committee meets periodically with financial management, the internal auditors and the independent registered public accounting firm to review accounting, control, auditing and financial reporting matters.
Management's Report on Internal Control Over Financial Reporting
The Company’s management is responsible for establishing and maintaining adequate internal control over financial reporting, as such term is defined in Exchange Act Rules 13a-15(f) and 15d-15(f). Under the supervision and with the participation of management, including the chief executive officer and the chief financial officer, the Company conducted an evaluation of the effectiveness of its internal control over financial reporting based on the framework in Internal Control – Integrated Framework issued by the Committee of Sponsoring Organizations of the Treadway Commission. Based on our evaluation under this framework, management concluded that the Company’s internal control over financial reporting was effective as of December 31, 2012. The effectiveness of the Company's internal control over financial reporting as of December 31, 2012 has been audited by Ernst & Young LLP, an independent registered public accounting firm, as stated in their report which is included herein.
- 67 -
Report of Independent Registered Public Accounting Firm
The Board of Directors and Shareholders of Baldwin & Lyons, Inc.
We have audited Baldwin & Lyons, Inc. and subsidiaries’ (the Company’s) internal control over financial reporting as of December 31, 2012, based on criteria established in Internal Control—Integrated Framework issued by the Committee of Sponsoring Organizations of the Treadway Commission (the COSO criteria). The Company’s management is responsible for maintaining effective internal control over financial reporting, and for its assessment of the effectiveness of internal control over financial reporting included in the accompanying Management’s Report on Internal Control Over Financial Reporting. Our responsibility is to express an opinion on the Company’s internal control over financial reporting based on our audit.
We conducted our audit in accordance with the standards of the Public Company Accounting Oversight Board (United States). Those standards require that we plan and perform the audit to obtain reasonable assurance about whether effective internal control over financial reporting was maintained in all material respects. Our audit included obtaining an understanding of internal control over financial reporting, assessing the risk that a material weakness exists, testing and evaluating the design and operating effectiveness of internal control based on the assessed risk, and performing such other procedures as we considered necessary in the circumstances. We believe that our audit provides a reasonable basis for our opinion.
A company’s internal control over financial reporting is a process designed to provide reasonable assurance regarding the reliability of financial reporting and the preparation of financial statements for external purposes in accordance with generally accepted accounting principles. A company’s internal control over financial reporting includes those policies and procedures that (1) pertain to the maintenance of records that, in reasonable detail, accurately and fairly reflect the transactions and dispositions of the assets of the company; (2) provide reasonable assurance that transactions are recorded as necessary to permit preparation of financial statements in accordance with generally accepted accounting principles, and that receipts and expenditures of the company are being made only in accordance with authorizations of management and directors of the company; and (3) provide reasonable assurance regarding prevention or timely detection of unauthorized acquisition, use or disposition of the company’s assets that could have a material effect on the financial statements.
Because of its inherent limitations, internal control over financial reporting may not prevent or detect misstatements. Also, projections of any evaluation of effectiveness to future periods are subject to the risk that controls may become inadequate because of changes in conditions, or that the degree of compliance with the policies or procedures may deteriorate.
In our opinion, Baldwin & Lyons, Inc. and subsidiaries maintained, in all material respects, effective internal control over financial reporting as of December 31, 2012, based on the COSO criteria.
We also have audited, in accordance with the standards of the Public Company Accounting Oversight Board (United States), the consolidated balance sheets of Baldwin & Lyons, Inc. and subsidiaries as of December 31, 2012 and 2011, and the related consolidated statements of operations, comprehensive income (loss), shareholders’ equity, and cash flows for each of the three years in the period ended December 31, 2012 and our report dated March 8, 2013 expressed an unqualified opinion thereon.
/s/ ERNST & YOUNG LLP
Indianapolis, IN
March 8, 2013
- 68 -
PART III
Item 10. DIRECTORS AND EXECUTIVE OFFICERS OF THE REGISTRANT
The information with respect to the directors of the Registrant to be provided under this item is omitted from this Report because the Registrant will file with the Commission a definitive proxy statement pursuant to Regulation 14A involving the election of directors not later than 120 days after the close of its fiscal year.
The information required by Item 10 of this Report with respect to directors which will appear in the definitive proxy statement is incorporated by reference herein.
The executive officers of the Company will serve until the next annual meeting of the Board of Directors and until their respective successors are elected and qualified. Except as otherwise indicated, the occupation of each officer during the past five years has been in his current position with the Company.
The following summary sets forth certain information concerning the Company's executive officers as of December 31, 2012:
Name | Age | Title | Served in Such Capacity Since | ||
Gary W. Miller | 72 | Executive Chairman | 1997 (1) | ||
| Joseph J. DeVito | 61 | CEO, President and COO | 2007 (2) | ||
| G. Patrick Corydon | 64 | Executive Vice President and CFO | 1979 (3) | ||
| Mark L. Bonini | 53 | Executive Vice President | 2001 (4) | ||
| Craig C. Morfas | 53 | Executive Vice President and Secretary | 2008 (5) | ||
| (1) Mr. Miller was elected Executive Chairman in December, 2010. He was elected Chairman and CEO in 1997 and has served in various capacities since 1965. |
| (2) Mr. DeVito was elected Chief Executive Officer in December, 2010. He was elected President and Chief Operating Officer in 2007, Executive Vice President in 2001 and has served in various capacities since 1981. |
| (3) Mr. Corydon was elected Executive Vice President in 2008 and previously served as Senior Vice President from 1997 and has been CFO since 1979. |
| (4) Mr. Bonini was elected Executive Vice President in February, 2011. He was elected Vice President of the Company in 2001. |
| (5) Mr. Morfas was elected Executive Vice President in February, 2012. He was elected Senior Vice President in February, 2011 and previously was Vice President and Secretary of the Company since 2008. |
Item 11. EXECUTIVE COMPENSATION *
Item 12. SECURITY OWNERSHIP OF CERTAIN BENEFICIAL OWNERS AND MANAGEMENT *
Item 13. CERTAIN RELATIONSHIPS, RELATED TRANSACTIONS AND DIRECTOR INDEPENDENCE *
Item 14. PRINCIPAL ACCOUNTANT FEES AND SERVICES *
* The information to be provided under Items 11, 12, 13 and 14 is omitted from this Report because the Registrant will file with the Commission a definitive proxy statement pursuant to Regulation 14A involving the election of directors not later than 120 days after the close of its fiscal year. The information required by these items of this Report which will appear in the definitive proxy statement is incorporated by reference herein. |
- 69 -
PART IV
Item 15. EXHIBITS, AND FINANCIAL STATEMENT SCHEDULES AND REPORTS ON FORM 8-K
| (a) | 1. List of Financial Statements--The following consolidated financial statements of the registrant and its subsidiaries (including the Report of Independent Registered Public Accounting Firm) are submitted in Item 8 of this report. |
| Consolidated Balance Sheets - December 31, 2012 and 2011 | ||
| 2. | List of Financial Statement Schedules--The following consolidated financial statement schedules of Baldwin & Lyons, Inc. and subsidiaries are included in Item 15(d): |
| Pursuant to Article 7: |
| Schedule I -- Summary of Investments--Other than Investments in Related Parties |
| Schedule II -- Condensed Financial Information of the Registrant |
| Schedule III -- Supplementary Insurance Information |
| Schedule IV -- Reinsurance |
Schedule VI -- Supplemental Information Concerning Property/Casualty Insurance Operations |
All other schedules to the consolidated financial statements required by Article 7 and Article 5 of Regulation S-X are not required under the related instructions or are inapplicable and therefore have been omitted.
- 70 -
3. Listing of Exhibits:
Number & Caption from Exhibit Table of Item 601 of Regulation S-K | Exhibit Number and Description |
| (3) (Articles of Incorporation & By Laws) | EXHIBIT 3(i) – Articles of Incorporation of Baldwin & Lyons, Inc., as amended (Incorporated as an exhibit by reference to Exhibit 3(a) to the Company's Annual Report on Form 10-K for the year ended December 31, 1986) |
EXHIBIT 3(ii)-- By-Laws of Baldwin & Lyons, Inc., as restated (Incorporated as an exhibit by reference to Exhibit 99.1 to the Company’s Current Report on Form 8-K dated May 4, 2004) | |
| (10) (Material Contracts) | EXHIBIT 10(a)-- 1981 Employee Stock Purchase Plan (Incorporated as an exhibit by reference to Exhibit A to the Company's definitive Proxy Statement for its Annual Meeting held May 5, 1981) |
EXHIBIT 10(b)-- Baldwin & Lyons, Inc. Employee Discounted Stock Option Plan (Incorporated as an exhibit by reference to Appendix A to the Company’s definitive Proxy Statement for its Annual Meeting held May 2, 1989) | |
EXHIBIT 10(c)-- Baldwin & Lyons, Inc. Deferred Directors Fee Option Plan (Incorporated as an exhibit by reference to Exhibit 10(f) to the Company's Annual Report on Form 10-K for the year ended December 31, 1989) | |
EXHIBIT 10(d)-- Baldwin & Lyons, Inc. Amended Employee Discounted Stock Option Plan (Incorporated as an exhibit by reference to Exhibit 10(f) to the Company's Annual Report on Form 10-K for the year ended December 31, 1992) | |
EXHIBIT 10(e)-- Baldwin & Lyons, Inc. Restated Employee Discounted Stock Option Plan. (Incorporated as an exhibit by reference to Exhibit 10(f) to the Company’s Annual Report on Form 10-K for the year ended December 31, 1997) | |
EXHIBIT 10(f)-- Baldwin & Lyons, Inc. Executive Incentive Bonus Plan (Incorporated as an exhibit by reference to the Company's definitive Proxy Statement for its Annual Meeting held May 5, 2009) | |
EXHIBIT 10(g)-- Baldwin & Lyons, Inc. Managing General Agency Agreement with Paladin Catastrophe Management LLC | |
Number & Caption from Exhibit Table of Item 601 of Regulation S-K | Exhibit Number and Description |
(14) (Code of ethics) | EXHIBIT 14-- Code of Business Conduct of Baldwin & Lyons, Inc. (Incorporated as an exhibit by reference to Exhibit 14 to the Company’s Annual Report on Form 10-K for the year ended December 31, 2005) |
(21) (Subsidiaries of the registrant) | EXHIBIT 21-- Subsidiaries of Baldwin & Lyons, Inc. |
| (23) (Consents of experts and counsel) | EXHIBIT 23-- Consent of Ernst & Young LLP |
| (24) (Powers of Attorney) | EXHIBIT 24-- Powers of Attorney for certain Officers and Directors |
| (31) (Certification) | EXHIBIT 31.1-- Certification of CEO pursuant to Section 302 of the Sarbanes-Oxley Act |
EXHIBIT 31.2-- Certification of CFO pursuant to Section 302 of the Sarbanes-Oxley Act | |
| (32) (Certification) | EXHIBIT 32-- Certification of CEO and CFO pursuant to Section 906 of the Sarbanes-Oxley Act and 18 U.S.C. 1350 |
| (b) | A report on Form 8-K was filed by the Company in the fourth quarter of 2012 to announce its third quarter earnings press release. |
| (c) | Exhibits. The response to this portion of Item 15 is submitted as a separate section of this report. |
| (d) | Financial Statement Schedules. The response to this portion of Item 15 is submitted on pages 72 through 78 of this report. |
- 71 -
| SCHEDULE I -- SUMMARY OF INVESTMENTS- | ||||||||||||
| OTHER THAN INVESTMENTS IN RELATED PARTIES | ||||||||||||
| Form 10-K - Year Ended December 31, 2012 | ||||||||||||
| Baldwin & Lyons, Inc. and Subsidiaries | ||||||||||||
| (Dollars in thousands) | ||||||||||||
| Column A | Column B | Column C | Column D | |||||||||
| Amount At | ||||||||||||
| Which Shown | ||||||||||||
| Fair | In The Balance | |||||||||||
| Type of Investment | Cost | Value | Sheet (A) | |||||||||
| Fixed Maturities: | ||||||||||||
| Bonds: | ||||||||||||
| U.S. government obligations | 70,720 | 70,742 | 70,742 | |||||||||
| Mortgage-backed securities | 34,960 | 36,868 | 36,868 | |||||||||
| State and municipal obligations | 194,258 | 194,865 | 194,865 | |||||||||
| Foreign government obligations | 22,047 | 22,598 | 22,598 | |||||||||
| Corporate securities | 118,574 | 120,596 | 120,596 | |||||||||
| Total fixed maturities | 440,559 | 445,669 | 445,669 | |||||||||
| Equity Securities: | ||||||||||||
| Common Stocks: | ||||||||||||
| Industrial, miscellaneous and all other | 58,127 | 107,582 | 107,582 | |||||||||
| Total equity securities | 58,127 | 107,582 | 107,582 | |||||||||
| Limited partnerships | 59,954 | 59,954 | 59,954 | |||||||||
| Short-term: | ||||||||||||
| Certificates of deposit | 4,201 | 4,201 | 4,201 | |||||||||
| Total short-term and other | 4,201 | 4,201 | 4,201 | |||||||||
| Total investments | $ | 562,841 | $ | 617,406 | $ | 617,406 | ||||||
| (A) Investments presented above do not include $64,450 of money market funds classified with cash and | ||||||||||||
| cash equivalents in the balance sheet. | ||||||||||||
- 72 -
| SCHEDULE II | ||||||||
| CONDENSED FINANCIAL INFORMATION OF REGISTRANT | ||||||||
| Form 10-K | ||||||||
| Baldwin & Lyons, Inc. | ||||||||
| (Dollars in thousands) | ||||||||
| Condensed Balance Sheets | ||||||||
| December 31 | ||||||||
| 2012 | 2011 | |||||||
| Assets | ||||||||
| Investment in subsidiaries | $ | 362,450 | $ | 334,328 | ||||
| Due from affiliates | 2,719 | 5,282 | ||||||
| Investments other than subsidiaries: | ||||||||
| Fixed maturities | 11,073 | 11,353 | ||||||
| Limited partnerships | 255 | 291 | ||||||
| 11,328 | 11,644 | |||||||
| Cash and cash equivalents | 12,134 | 5,690 | ||||||
| Accounts receivable | 8,033 | 5,890 | ||||||
| Other assets | 7,225 | 7,694 | ||||||
| Total assets | $ | 403,889 | $ | 370,528 | ||||
| Liabilities and shareholders' equity | ||||||||
| Liabilities: | ||||||||
| Premiums payable | $ | 29,652 | $ | 26,367 | ||||
| Deposits from insureds | 15,489 | 13,682 | ||||||
| Notes payable to bank | 10,000 | 10,000 | ||||||
| Current payable federal income taxes | - | 368 | ||||||
| Other liabilities | 2,036 | 1,050 | ||||||
| 57,177 | 51,467 | |||||||
| Shareholders' equity: | ||||||||
| Common stock: | ||||||||
| Class A | 112 | 112 | ||||||
| Class B | 524 | 522 | ||||||
| Additional paid-in capital | 50,275 | 48,751 | ||||||
| Unrealized net gains on investments | 35,467 | 26,592 | ||||||
| Retained earnings | 260,334 | 243,084 | ||||||
| 346,712 | 319,061 | |||||||
| Total liabilities and shareholders' equity | $ | 403,889 | $ | 370,528 | ||||
| See notes to condensed financial statements | ||||||||
- 373 -
| SCHEDULE II | ||||||||||||
| CONDENSED FINANCIAL INFORMATION OF REGISTRANT | ||||||||||||
| Form 10-K | ||||||||||||
| Baldwin & Lyons, Inc. | ||||||||||||
| (Dollars in thousands) | ||||||||||||
| Condensed Statements of Operations | ||||||||||||
| Year Ended December 31 | ||||||||||||
| 2012 | 2011 | 2010 | ||||||||||
| Revenue: | ||||||||||||
| Commissions and service fees | $ | 20,753 | $ | 20,974 | $ | 21,913 | ||||||
| Dividends from subsidiaries | 14,000 | 14,000 | 15,000 | |||||||||
| Net investment income | 48 | 100 | 135 | |||||||||
| Net realized gains (losses) on investments | (49 | ) | 67 | (100 | ) | |||||||
| Other | 24 | 98 | 284 | |||||||||
| 34,776 | 35,239 | 37,232 | ||||||||||
| Expenses: | ||||||||||||
| Salary and related items | 15,410 | 12,281 | 12,869 | |||||||||
| Other | 7,098 | 5,550 | 5,615 | |||||||||
| 22,508 | 17,831 | 18,484 | ||||||||||
| Income before federal income taxes | ||||||||||||
| and equity in undistributed | ||||||||||||
| income of subsidiaries | 12,268 | 17,408 | 18,748 | |||||||||
| Federal income tax (benefit) | (629 | ) | 1,004 | 1,195 | ||||||||
| 12,897 | 16,404 | 17,553 | ||||||||||
| Equity in undistributed income (loss) | ||||||||||||
| of subsidiaries | 19,022 | (44,579 | ) | 7,462 | ||||||||
| Net income (loss) | $ | 31,919 | $ | (28,175 | ) | $ | 25,015 | |||||
- 74 -
| SCHEDULE II | ||||||
| CONDENSED FINANCIAL INFORMATION OF REGISTRANT | ||||||
| Form 10-K | ||||||
| Baldwin & Lyons, Inc. | ||||||
| (Dollars in thousands) | ||||||
| Condensed Statements of Cash Flows | ||||||
| Year Ended December 31 | ||||||
| 2012 | 2011 | 2010 | ||||
| Net cash provided by operating activities | $20,735 | $13,255 | $32,296 | |||
| Investing activities: | ||||||
| Purchases of long-term investments | (8,944) | (10,025) | (10,889) | |||
| Sales or maturities of long-term investments | 8,902 | 9,704 | 9,910 | |||
| Decrease in notes receivable from employees | 1,252 | 106 | 611 | |||
| Distributions from limited partnerships | - | 444 | 23 | |||
| Net disposals (purchases) of property and equipment | (834) | (622) | 413 | |||
| Other | 228 | 128 | 212 | |||
| Net cash provided by (used in) investing activities | 604 | (265) | 280 | |||
| Financing activities: | ||||||
| Dividends paid to shareholders | (14,886) | (14,846) | (33,212) | |||
| Drawing on line of credit | - | - | 8,000 | |||
| Repayment on line of credit | - | (5,000) | (3,000) | |||
| Net cash used in financing activities | (14,886) | (19,846) | (28,212) | |||
| Increase (decrease) in cash and cash equivalents | 6,453 | (6,856) | 4,364 | |||
| Cash and cash equivalents at beginning of year | 5,690 | 12,546 | 8,182 | |||
| Cash and cash equivalents at end of year | $12,143 | $5,690 | $12,546 | |||
| See notes to condensed financial statements | ||||||
Note to Condensed Financial Statements--Basis of PresentationThe Company's investment in subsidiaries is stated at cost plus equity in the undistributed earnings of subsidiaries since the date of acquisition. The Company's share of net income of its subsidiaries is included in income using the equity method. These financial statements should be read in conjunction with the Company's consolidated financial statements. | ||||||
- 75 -
| SCHEDULE III -- SUPPLEMENTARY INSURANCE INFORMATION | ||||||||||||||||||||
| Form 10-K | ||||||||||||||||||||
| Baldwin & Lyons, Inc. and Subsidiaries | ||||||||||||||||||||
| (Dollars in thousands) | ||||||||||||||||||||
| Column A | Column B | Column C | Column D | Column E | Column F | Column G | Column H | Column I | Column J | Column K | ||||||||||
| Year Ended December 31 | ||||||||||||||||||||
| Reserves | ||||||||||||||||||||
| for Unpaid | Other | Benefits, | Amortization | |||||||||||||||||
| Deferred | Claims | Policy | Claims, | of Deferred | ||||||||||||||||
| Policy | and Claim | Claims and | Net | Net | Losses and | Policy | Other | Net | ||||||||||||
| Acquisition | Acquisition | Unearned | Benefits | Premium | Investment | Settlement | Acquisition | Operating | Premiums | |||||||||||
| Segment | Costs | Expenses | Premiums | Payable | Earned | Income | Expenses | Costs | Expenses | Written | ||||||||||
| (A) | (A) | (A) (B) | ||||||||||||||||||
| Property/Casualty | ||||||||||||||||||||
| Insurance | ||||||||||||||||||||
| 2012 | $ 3,091 | $ 455,454 | $ 37,273 | --- | $ 237,461 | $ 9,930 | $ 138,088 | $ 41,957 | $ 12,057 | $ 233,678 | ||||||||||
| 2011 | 4,578 | 421,556 | 39,919 | --- | 244,570 | 10,729 | 215,555 | 40,712 | 13,786 | 248,483 | ||||||||||
| 2010 | 4,826 | 344,520 | 29,819 | --- | 214,738 | 11,335 | 145,952 | 34,048 | 13,813 | 218,645 | ||||||||||
(A) Allocations of certain expenses have been made to investment income, settlement expenses and other operating expenses and are based on a number of assumptions and estimates. Results amont these catagories would change if different methods were applied.
(B) Commissions paid to the Parent Company have been eliminated for this presentation. Commission allowances relating to reinsurance ceded are offset against other operating expenses.
- 76 -
| SCHEDULE IV -- REINSURANCE | ||||||||||||||||||||
| Form 10-K | ||||||||||||||||||||
| Baldwin & Lyons, Inc. and Subsidiaries | ||||||||||||||||||||
| (Dollars in thousands) | ||||||||||||||||||||
| Column A | Column B | Column C | Column D | Column E | Column F | |||||||||||||||
| % of | ||||||||||||||||||||
| Ceded | Assumed | Amount | ||||||||||||||||||
| Direct | to Other | from Other | Net | Assumed to | ||||||||||||||||
| Premiums | Companies | Companies | Amount | Net | ||||||||||||||||
| Premiums Earned - | ||||||||||||||||||||
| Property/casualty insurance: | ||||||||||||||||||||
| Years Ended December 31: | ||||||||||||||||||||
| 2012 | $ | 287,982 | $ | 103,712 | $ | 53,191 | $ | 237,461 | 21.4 | |||||||||||
| 2011 | 270,002 | 85,493 | 60,061 | 244,570 | 23.8 | |||||||||||||||
| 2010 | 245,912 | 73,119 | 41,945 | 214,738 | 19.0 | |||||||||||||||
Note: Included in Ceded to Other Companies is $2,316, $1,913 and $1,250 for 2012, 2011 and 2010, respectively, relating to retrocessions associated with premiums assumed from other companies. Amount Assumed to Net percentage above considers the impact of this retrocession.
- 77 -
| SCHEDULE VI--SUPPLEMENTAL INFORMATION | ||||||||||||||||||||||||
| CONCERNING PROPERTY/CASUALTY INSURANCE OPERATIONS | ||||||||||||||||||||||||
| Form 10-K | ||||||||||||||||||||||||
| Baldwin & Lyons, Inc. and Subsidiaries | ||||||||||||||||||||||||
| (Dollars in thousands) | ||||||||||||||||||||||||
| Column A | Column B | Column C | Column D | Column E | Column F | Column G | Column H | Column I | Column J | Column K | ||||||||||||||
| As of December 31 | Year Ended December 31 | |||||||||||||||||||||||
| Reserves | Claims and Claim | Amortiza- | ||||||||||||||||||||||
| for Unpaid | Discount, | Adjustment Expenses | tion of | |||||||||||||||||||||
| Deferred | Claims | if any | Incurred Related to | Deferred | Paid Claims | |||||||||||||||||||
| AFFILIATION | Policy | and Claim | Deducted | Net | (1) | (2) | Policy | and Claim | Net | |||||||||||||||
| WITH | Acquisi- | Adjustment | in | Unearned | Earned | Investment | Current | Prior | Acquisition | Adjustment | Premiums | |||||||||||||
| REGISTRANT | tion Costs | Expenses | Column C | Premiums | Premiums | Income | Year | Years | Costs | Expenses | Written | |||||||||||||
| Consolidated Property/Casualty Subsidiaries: | (A) | |||||||||||||||||||||||
| 2012 | $3,091 | $455,454 | $6,118 | $37,273 | $237,461 | $9,930 | $147,964 | $(9,875) | $41,957 | $138,945 | $233,678 | |||||||||||||
| 2011 | 4,578 | 421,556 | 6,642 | 39,919 | 244,570 | 10,729 | 225,251 | (9,696) | 40,712 | 144,092 | 248,483 | |||||||||||||
| 2010 | 4,826 | 344,520 | 6,463 | 29,819 | 214,738 | 11,335 | 154,775 | (8,823) | 34,048 | 130,576 | 218,645 | |||||||||||||
(A) Loss reserves on certain reinsurance assumed and permanent total disability worker's compensation claims have been discounted to present value using pretax interest rates not exceeding 3.5%.
- 78 -
SIGNATURES
Pursuant to the requirements of Section 13 or 15 (d) of the Securities Exchange Act of 1934, the Registrant has duly caused this report to be signed on its behalf by the undersigned, thereunto duly authorized.
BALDWIN & LYONS, INC.
By_/s/ Joseph J. | ||
Joseph J. DeVito, Director, Chief Executive Officer and President | ||
Pursuant to the requirements of the Securities Exchange Act of 1934, this report has been signed below by the following persons on behalf of the Registrant and in the capacities and on the dates indicated.
By_/s/ Gary W. | ||
Gary W. Miller, Director and Executive Chairman | ||
By_/s/ G. Patrick | ||
G. Patrick Corydon, Executive Vice President and CFO (Principal Financial and Accounting Officer) | ||
By_/s/ Joseph J. | ||
Joseph J. DeVito, Director, Chief Executive Officer and President | ||
By_/s/ Stuart D. | ||
Stuart D. Bilton, Director | ||
By_/s/ Otto N. Frenzel | ||
Otto N. Frenzel IV, Director | ||
By_/s/ John M. | ||
John M. O'Mara, Director | ||
- 479 -
SIGNATURES (CONTINUED)
By_/s/ Thomas H. | ||
Thomas H. Patrick, Director | ||
By_/s/ John | ||
John Pigott, Director | ||
By_/s/ Kenneth D. | ||
Kenneth D. Sacks, Director | ||
By_/s/ Nathan | ||
Nathan Shapiro, Director | ||
By_/s/ Norton | ||
Norton Shapiro, Director | ||
By_/s/ Robert | ||
Robert Shapiro, Director | ||
By_/s/ Steven A. | ||
Steven A. Shapiro, Director | ||
By_/s/ John D. | ||
John D. Weil, Director | ||
(*) By Craig C. Morfas, Attorney-in-Fact
- 580 -
ANNUAL REPORT ON FORM 10-K
ITEM 15(c)--CERTAIN EXHIBITS
YEAR ENDED DECEMBER 31, 2012
BALDWIN & LYONS, INC.
INDIANAPOLIS, INDIANA
- 81 -
BALDWIN & LYONS, INC.
Form 10-K for the Fiscal Year
Ended December 31, 2012
INDEX TO EXHIBITS
Exhibit No. | Begins on sequential page number of Form 10-K |
EXHIBIT 3(i)-- Articles of Incorporation of Baldwin & Lyons, Inc. as amended (Incorporated as an exhibit by reference to Exhibit 3(a) to the Company's Annual Report on Form 10-K for the year ended December 31, 1986) | N/A |
EXHIBIT 3(ii)-- By-Laws of Baldwin & Lyons, Inc., as restated (Incorporated as an exhibit by reference to Exhibit 99.1 to the Company's Current Report on Form 8-K dated May 4, 2004) | N/A |
EXHIBIT 10(a)-- 1981 Employees Stock Purchase Plan (Incorporated as an exhibit by reference to Exhibit A to the Company's definitive Proxy Statement for its Annual Meeting held May 5, 1981) | N/A |
EXHIBIT 10(b)-- Baldwin & Lyons, Inc. Employee Discounted Stock Option Plan (Incorporated as an exhibit by reference to Appendix A to the Company's definitive Proxy Statement for its Annual Meeting held May 2, 1989) | N/A |
EXHIBIT 10(c)-- Baldwin & Lyons, Inc. Deferred Directors Fee Option Plan (Incorporated as an exhibit by reference to Exhibit 10(f) to the Company's Annual Report on Form 10-K for the year ended December 31, 1989) | N/A |
EXHIBIT 10(d)-- Baldwin & Lyons, Inc. Amended Employee Discounted Stock Option Plan (Incorporated as an exhibit by reference to Exhibit 10(f) to the Company's Annual Report on Form 10-K for the year ended December 31, 1989) | N/A |
EXHIBIT 10(e)-- Baldwin & Lyons, Inc. Restated Employee Discounted Stock Option Plan (Incorporated as an exhibit by reference to Exhibit 10(f) to the Company's Annual Report on Form 10-K for the year ended December 31, 1997) | N/A |
EXHIBIT 10(f)-- Baldwin & Lyons, Inc. Executive Incentive Bonus Plan (Incorporated as an exhibit by reference to the Company's definitive Proxy Statement for its Annual Meeting held May 5, 2009) | N/A |
EXHIBIT 10(g)-- Baldwin & Lyons, Inc. Managing General Agency Agreement with Paladin Catastrophe Management LLC | N/A |
- 82 -
| INDEX TO EXHIBITS (CONTINUED) | |
Exhibit No. | Begins on sequential page number of Form 10-K |
EXHIBIT 14-- Code of Business Conduct, as amended May 3, 2005 (Incorporated as an exhibit by reference to Exhibit 14 to the Company's Annual Report on Form 10-K for the year ended December 31, 2005) | N/A |
EXHIBIT 21-- Subsidiaries of Baldwin & Lyons, Inc. | 84 |
EXHIBIT 23-- Consent of Ernst & Young LLP | 85 |
EXHIBIT 24-- Powers of Attorney for certain Officers and Directors | 86 - 88 |
EXHIBIT 31.1-- Certification of CEO pursuant to Section 302 of the Sarbanes-Oxley Act of 2002. | 89 and 90 |
EXHIBIT 31.2-- Certification of CFO pursuant to Section 302 of the Sarbanes-Oxley Act of 2002. | 91 and 92 |
EXHIBIT 32.1-- Certification of CEO and CFO pursuant to 18 U.S.C. Section 1350, as adopted pursuant to Section 906 of the Sarbanes-Oxley Act of 2002. | 93 |
83 -