
UNITED STATES
SECURITIES AND EXCHANGE COMMISSION
Washington, D.C. 20549
FORM 10-K/A10-K
| x | ANNUAL REPORT PURSUANT TO SECTION 13 OR 15(d) OF THE SECURITIES EXCHANGE ACT OF 1934. |
x ANNUAL REPORT PURSUANT TO SECTION 13 OR 15(d) OF THE SECURITIES EXCHANGE ACT OF 1934.
For the fiscal year ended March 31, 2008
2010
OR
| ¨ | TRANSITION REPORT PURSUANT TO SECTION 13 OR 15(d) OF THE SECURITIES EXCHANGE ACT OF 1934. |
¨ TRANSITION REPORT PURSUANT TO SECTION 13 OR 15(d) OF THE SECURITIES EXCHANGE ACT OF 1934.
For the transition period from to .
Commission file number:File Number 000-15071
![]()
Adaptec, Inc.
(Exact name of Registrant as Specified in its Charter)
| 94-2748530 | ||
| (State or Other Jurisdiction of Incorporation or Organization) | (I.R.S. Employer Identification Number) |
691 S. Milpitas Blvd.
Milpitas, California 95035
(Address of Principal Executive Offices, including Zip Code)
(408) 945-8600
(Registrant'sRegistrant’s Telephone Number, including Area Code)
Securities registered pursuant to Section 12(b) of the Act: Common Stock, $0.001 Par Value(Title of Class)
The NASDAQ Global Market
| Title of each class | Name of each exchange on which registered | |
| Common Stock, $.001 Par Value | The NASDAQ Global Market |
(Name of Each Exchange on which Registered)
Securities registered pursuant to Section 12(g) of the Act:None
Indicate by check mark if the registrantRegistrant is a well-known seasoned issuer, as defined in Rule 405 of the Securities Act. YESYes ¨ NO No x
Indicate by check mark if the registrantRegistrant is not required to file reports pursuant to Section 13 or Section 15(d) of the Act. YESYes ¨ NO No x
Indicate by check mark whether the registrantRegistrant (1) has filed all reports required to be filed by Section 13 or 15 (d)15(d) of the Securities Exchange Act of 1934 during the preceding 12 months (or for such shorter period that the registrantRegistrant was required to file such reports), and (2) has been subject to such filing requirements for the past 90 days. YESYes x NO No ¨
Indicate by check mark whether the registrant has submitted electronically and posted on its corporate Web site, if any, every Interactive Data File required to be submitted and posted pursuant to Rule 405 of Regulation S-T (§ 232.405 of this chapter) during the preceding 12 months (or for such shorter period that the registrant was required to submit and post such files). Yes ¨ No ¨
Indicate by check mark if disclosure of delinquent filers pursuant to Item 405 of Regulation S-K is not contained herein, and will not be contained, to the best of registrant'sthe Registrant’s knowledge, in definitive proxy or information statements incorporated by reference in Part III of this Form10-KForm 10-K or any amendment to this Form 10-K. x
Indicate by check mark whether the registrantRegistrant is a large accelerated filer, an accelerated filer, a non-accelerated filer or a smaller reporting company. See definition of "large“large accelerated filer," "accelerated” “accelerated filer,"” and "smaller“smaller reporting company"company” in Rule 12b-2 of the Exchange Act. (Check one):
Large accelerated filer ¨ Accelerated filer x Non-accelerated filer ¨
(Do not check if a smaller reporting company) Smaller reporting company ¨
Indicate by check mark whether the registrantRegistrant is a shell company (as defined in Rule 12b-2 of the Exchange Act). YESYes ¨ NO No x
The aggregate market value of the voting stock held by non-affiliates of the Registrant was $384,610,684$301,782,484 based on the closing sale price of the Registrant'sRegistrant’s common stock on The NASDAQ Global Market on the last business day of the Registrant'sRegistrant’s most recently completed second fiscal quarter. Shares of the Registrant'sRegistrant’s common stock beneficially owned by each executive officer and director of the Registrant and by each person known by the Registrant to beneficially own 10% or more of its outstanding common stock have been excluded in that such persons may be deemed to be affiliates. This determination of affiliate status is not necessarily a conclusive determination for other purposes.
At May 30, 2008,12, 2010, the Registrant had 120,623,158120,396,971 shares of common stock outstanding, $.001 par value per share.
DOCUMENTS INCORPORATED BY REFERENCE
Part III incorporates by reference certain information fromPortions of the Registrant's definitiveRegistrant’s Proxy Statement, for its 2008 Annual Meetingto be filed with the Securities and Exchange Commission within 120 days after the end of Stockholders.
EXPLANATORY NOTE
This Amendment No. 1 on Form 10-K/A (this "Amendment") amends ourthe fiscal year covered by this Annual Report on Form 10-K for the year ended March 31, 2008, originally filedits 2010 Annual Meeting of Stockholders are incorporated by reference in Part III of this Annual Report on June 13, 2008 (the "Original Filing"). We are filing this Amendment solely due to a technical administrative error that resulted in the incorrect files, including the actual Form 10-K and attachments thereto, being submitted for filing.10-K.
FORWARD LOOKING STATEMENTS
This Annual Report on Form 10-K contains forward-looking statements that involve risks and uncertainties. The statements contained in this document that are not purely historical are forward-looking statements within the meaning of Section 27A of the Securities Act of 1933, as amended, or the Securities Act, and Section 21E of the Securities Exchange Act of 1934, including, without limitationas amended, or the Exchange Act. Forward-looking statements are statements regarding future events or our future performance, and include statements regarding projected operating results. These forward-looking statements are based on current expectations, beliefs, intentions or strategies, regardingforecasts and assumptions and involve a number of risks and uncertainties that could cause actual results to differ materially from those anticipated by these forward-looking statements. These risks include, but are not limited to: completion of the market fortransaction with PMC-Sierra discussed elsewhere in this Annual Report on Form 10-K; the ability of our operations to maximize the value of our RAID technology business and non-core patents; our ability to deploy our capital in a manner that maximizes stockholder value; general economic conditions; revenue received from our current operations; declines in consumer spending; failure to achieve our operational objectives; ability to reduce our operating costs; support from the contract manufacturers to which we have outsourced manufacturing, assembly and packaging of our products; our ability to launch new products and theirpotential failure of anticipated long-term benefits from new products to materialize; difficulty in forecasting the volume and timing of customer orders; reduced demand in the server, network storage and desktop computer markets; our customers,target markets’ failure to accept, or delay in accepting, network storage and other advanced storage solutions, including our intention to continue to evaluate acquisitions, strategic alliances and/or strategic investments,MaxIQ SSD Cache Performance Solution, SCSI, SAS, SATA and iSCSI lines of products; the performance of our expectations regarding theproducts; decline in consumer acceptance of our revenues derived from largecurrent products; the timing and volume of orders by OEM customers for storage products; our ability to control and manage costs associated with the levelsdelivery of new products; and the adverse effects of the intense competition we face in our expenditures and savings for various expense items and our expected capital expenditures and liquidity in future periods.business. We may identify these statements by the use of words such as "anticipate," "believe," "continue," "could," "estimate," "expect," "intend," "may," "might," "plan," "potential," "predict," "project," "should," "will," "would"“anticipate,” “believe,” “continue,” “could,” “estimate,” “expect,” “intend,” “may,” “might,” “plan,” “potential,” “predict,” “project,” “should,” “will,” “would” and other similar expressions. All forward-looking statements included in this document are based on information available to us on the date hereof,of this Annual Report on Form 10-K, and we assume no obligation to update any such forward-looking statements, except as may otherwise be required by law.
Our actual results could differ materially from those anticipated in these forward-looking statements as a result of certain factors, including those set forth in the "Risk Factors"“Risk Factors” section in Part I, Item 1A of this Annual Report on Form 10-K and elsewhere in this document. In evaluating our business, current and prospective investors should consider carefully these factors in addition to the other information set forth in this document.
PART I
For your convenience, we have included, in Note 2122 to the Consolidated Financial Statements, included in “Item 8: Financial Statements and Supplementary Data” of this Annual Report on Form 10-K, a Glossary that contains (1) a brief description of a few key acronyms commonly used in our industry that are used in this Annual Report and (2) a list offew accounting rules and regulationsacronyms, including accounting regulatory bodies, that are also referred to herein. These acronyms and accounting rules and regulations are listed in alphabetical order.
OverviewDescription
We currently provide innovative data center I/O solutions that protect, accelerate, optimize, and condition data in today’s most demanding data center environments. Our products are used in IT environments ranging from traditional enterprise environments to fast growing, on-demand cloud computing data centers. Our products enable data center managers, channel partners and OEMs to deploy best-in-class storage solutions that reliably move, manage, storeto meet their customers’ evolving IT and protect critical databusiness requirements. Around the world, leading corporations, government organizations, and digital content. We deliver softwaremedium and hardware components that provide reliable storage connectivity and advanced data protection to leading OEMs and through distribution channel partners.small businesses trust Adaptec technology. Our software and hardware products range frominclude ASICs, HBAs, RAID controllers, hostAdaptec RAID software, Adaptec RAID Codestorage management software, Advanced Data Protection software, Storage Management software, Snapshotstorage virtualization software and other solutions that span SCSI, SAS, SATA and iSCSI interface technologies. Our Snap Servers offer NAS solutions fortechnologies,
3
including both fixed capacityhard disk and modular expandability.solid state drives. System integrators and white box suppliers build server and storage solutions based on Adaptec technology in order to deliver products with superior price and performance, data protection and interoperability.interoperability to their clients and customers.
Our broad range of RAID controllers and add-in cards provide businesses with a variety of price and performance options for connecting their storage. These options range from low cost HBAs to high performance and high availability RAID controller cards. Further, our products use a common management interface designed to simplify storage administration and reduce related costs. Our products are sold to enterprises, SMBs, government agencies and end users engaged in a broad range of vertical markets across geographically diverse markets principally through distribution channel customers, OEMs, system integrators, system builders, and value added resellers.General Information
We were incorporated in 1981 in California and completed our initial public offering in 1986. In March 1998, we reincorporated in Delaware. WeOur shares of common stock are anincluded in the S&P Small Cap 600 Index member.Index. Our principal executive offices are located at 691 South Milpitas Boulevard, Milpitas, California 95035 and our telephone number at that location is (408) 945-8600. We also maintain our website at http://www.adaptec.com.www.adaptec.com. Information found on or accessible through our website is not part of and is not incorporated into, this Annual Report on Form 10-K.
Business StrategyOutlook
We are focused on delivering differentiated solutions around critical I/O technologies for data storage. We have taken stepsIn December 2009, we announced the retention of Blackstone Advisory Partners L.P. to alignserve as our expenses with revenues, minimize investments in areas that do not deliverexclusive financial advisor relating to a fair return, develop partnerships with supplierspotential sale or disposition of RAID ASIC technologies to support and improve the competitivenesscertain of our assets or business operations. On May 8, 2010, subsequent to our fiscal year-end, we entered into an Asset Purchase Agreement with PMC-Sierra, Inc., or PMC-Sierra for the sale of certain assets and for PMC-Sierra to assume certain liabilities related to our business of providing data storage hardware and software solutions and products including ASICs, HBAs, RAID controllers, Adaptec RAID software, Adaptec RAID code, or ARC, storage management software including Adaptec Storage Manager or ASM, option ROM BIOS, command line interface or CLI, storage virtualization software, and other solutions that span SCSI, SAS, and SATA interface technologies, and that optimize the performance of both hard disk and solid state drives, for a purchase price of approximately $34 million. In this Annual Report on Form 10-K, we refer to the transactions contemplated by the Asset Purchase Agreement with PMC-Sierra as the PMC Transaction. Assuming satisfaction of the closing conditions in the channel. We are also exploringAsset Purchase Agreement with PMC-Sierra, we anticipate that the PMC Transaction will be consummated in June 2010. As we continue to proceed with certain specific and other customary closing conditions necessary to consummate the PMC Transaction, we remain committed to providing service and support for our existing customers and end-users. Whether or not the PMC Transaction is consummated, our revenues may be negatively impacted during this pre-closing period as the transaction creates uncertainty in the marketplace for our existing customers and end-users, who may be less likely to place orders with us as a result of this uncertainty.
Assuming the PMC Transaction is consummated, we intend to explore all strategic partnerships with ASIC vendorsalternatives to maximize stockholder value going forward, including deploying the proceeds of the PMC Transaction and our other assets in seeking business acquisition opportunities and other actions to redeploy our capital. Additionally, we will, as previously announced, continue to consider our options related to those products and technology obtained from our acquisition of Aristos Logic Corporation, or Aristos, which we refer to in this Annual Report on Form 10-K as our Aristos products, as well as our other remaining operating assets, including non-core patents and real estate holdings. With respect to our Aristos products, options that we may consider include (i) ceasing to invest additional funds in our effortsAristos products, winding-down the sale of our Aristos products and fulfilling our remaining contractual obligations with our existing customers, which we would expect to obtain design wins from OEMs for their next generation of products.
We simplifybe completed in six months, or by September 2010, or (ii) seeking to sell the latest storage technologies, making them affordable and accessibleassets related to our Aristos products to a wide rangethird party. We will also explore alternatives for maximizing the value of our non-core patent portfolio and remaining real estate assets. Following and assuming the consummation of the PMC Transaction, we remain committed to providing value to all of our stockholders and will aggressively pursue opportunities to deploy the significant cash and liquid assets on hand to create value for our stockholders, including exploring opportunities to deploy this cash and liquid assets to make acquisitions of businesses through solutions that combine hardwarewill maximize stockholder value and/or engaging in stock buybacks and software. Our goalcash dividends. Going forward our business is expected to become a leading storage solutions companyconsist of capital redeployment and identification of new, profitable business operations in which we can utilize our management team continuously reviewsexisting working capital and evaluates all aspectsmaximize the use of our business. In fiscal 2008,net operating losses, or NOLs.
If we focused on strengthening our market position and scaling down our operations relative to our revenue basis. During fiscal 2008,consummate the PMC Transaction discussed above, we implemented the following steps to support our corporate strategy:
restructuring charges, acceleration of compensation expense related to unvested stock-based awards, potential cash bonus payments and (2) beginning in the second quarter, by reducingpotential accelerated payments of certain of our workforce by approximately 20% in an effort to better align our cost structure with our anticipated revenue stream and to improvecontractual obligations, which may impact our results of operations and cash flows.
Except where noted, the discussion regarding our business in this Annual Report on Form 10-K is as of March 31, 2010. As of the date of this Annual Report on Form 10-K, the PMC Transaction has not been consummated. The PMC Transaction may not be consummated.
Products Overview
We operate in one segment. For an analysis of financial information about our geographic areas, see “Note 19—Segment, Geographic and Significant Customer Information” to the Consolidated Financial Statements included in “Item 8: Financial Statements and Supplementary Data” of this Annual Report on Form 10-K.
We currently provide data protection storage products and sell a broad range of storage technologies, including ASICs, board-level I/O and RAID controllers and software. We sell these products directly to OEMs, ODMs that supply OEMs, system integrators, VARs and end users through our network of distribution and reseller channels. We consider all our products to be similar in nature and function.
Components.
RAID Controllers and HBAs. We offer a wide range of HBAs and RAID controllers for use with SATA, SAS and Parallel SCSI products fromdrives, including our DSG segment were moved into our DPS segmentline of Unified Serial® cards, which can be used with both SATA and categorized as "Other", as it represents a reconciling item to our consolidated results of operations. We decided not to invest furtherSAS drives, including Solid State Drives. The SATA and SAS technologies are offered in our DSG segment due to OEMs incorporating other connectivity technologies directly into theirSeries 1, Series 2, Series 3, Series 5 and Series 5Z families. Our SATA products additional competitors entering the market and the complexities of the retail channel. We believe that reorganizing our business segments will enable us to better coordinate product planning and meet our customer needs. Our business consists of two reportable segments:
|
|
|
|
We currently depend onprovide a small number of large OEM customersflexible solution for a significant portion of our revenues, and we have been unsuccessful recently in obtaining design wins from these customers. We have evaluated this portion of our business, and we are no longer pursuing future business from large OEM customers with our current product portfolio, as we believe the future growth opportunities for our current products are limited. As a result, we expect the revenues obtained from large OEM customers to decline significantly in future periods. Since the growth of our new generation of serial products is not keeping pace with the decline in revenues from our parallel products and from our OEM customers, we may seek growth opportunities beyond those presented by our existing product lines by entering into strategic alliances, partnerships or acquisitions in order to scale our business. This includes both strengthening our partnerships in silicon-based technology and broadening our silicon-based intellectual property to improve our business opportunities. We also continue to review and evaluate our existing product portfolio, operating structure and markets to determine the future viability of our existing products and market positions.
Unless otherwise indicated the following discussion pertains only to our continuing operations.
We focused on strengthening our market position through innovation and new products, which included delivering a number of new products over the past four quarters.
Available Information
We make available free of charge through our Internet website at http://www.adaptec.com the following filings as soon as reasonably practicable after they are electronically filed with or furnished to the Securities and Exchange Commission: our Annual Report on Form 10-K, Quarterly Reports on Form 10-Q, Current Reports on Form 8-K and allamendments to those reports filed or furnished pursuant to Section 13(a) or 15(d) of the Securities Exchange Act of 1934.
Business Segment and Products Overview
In fiscal 2008, our DPS segment accounted for $145.1 million of our net revenues and our SSG segment accounted for $22.3 million of our net revenues. For an analysis of financial information about our segments as well as our geographic areas, see "Note 18 -Segment, Geographic and Significant Customer Information" to the consolidated financial statements included elsewhere in this Annual Report on Form 10-K.
Following are discussions of our key product offerings for our DPS and SSG businesses.
DPS
Components.
RAID Controllers and HBAs. Adaptec offers a wide range of HBAs and RAID controllers for use with SATA, SAS and Parallel SCSI drives, including our line of Unified Serial™ cards which can be used with both SATA and SAS drives. Our new family of products is designed to meet evolving storage needs by providing high performance, reliable storage management tools, hardware and software compatibility and high levels of support. Our Series 5Z products, which were introduced in fiscal 2010, reduce the cost of data center maintenance by eliminating the need to monitor battery charge levels, service battery modules or power down servers for battery replacement. While we have used our own ASICs in these products in the past, our latest generation of products uses ROC technology from Intel Corporation. Future products will be based on partnerships with other ASIC vendors.Our controller cards include 4, 8, 16, 20 and 28-port designs, which help end users simplify the design of their solutions.
Host I/O. Driven by market needs for capacity and data protection, the host I/O interfaces support various connectivity requirements between the central processor and internal and external peripherals, including external storage and tape devices. AdaptecOur host I/O products provide customers with high-speed PCI, PCI-X, PCIe, SCSI, SAS or SATA connectivity. These technologies can be applied to a variety of applications, including storage of email, medical records, digital images, and records of financial transactions.
SoftwareRSP.RSPs, which are related to our Aristos products, are ASIC devices incorporating a collection of hardware engines that fully automate the operation of the data path and eliminate the performance bottlenecks found in other silicon-based software RAID solutions. Our RSP products provide our customers with cost- and energy-efficiencies in data protection without compromising performance. Our primary markets include Blade Servers and External Storage applications where high performance and high availability features are required.
Data Center Data Conditioning Features. Our Intelligent Power Management technology allows users to reduce their power consumption without impacting storage performance providing a green footprint to public and private cloud data centers. Our MaxIQ SSD Cache Performance Solution, introduced in fiscal 2010, maximizes performance while minimizing capital and operating costs by utilizing both solid state drives and hard disk drives, to create High-Performance Hybrid Arrays.
5
Software.
Our products incorporate software that simplifies data management and protection for businesses of all sizes. We distribute the software through various methods. Some of
Host RAID. We license our software is licensed independent of the hardware to run on a range of products, including ours.
The primary software products that we license are as follows:
Host RAID. Hosthost RAID technology, which allows our customers to leverage the I/O components already incorporated on their serversserver chipsets to connect them with RAID-providedRAID-providing low cost data protection. Typically, suchfunctionality has been considered important for mission critical data only. Host RAID enables customers not only to protect their data drives but also to include protection for the boot drives.
The following software products are available in combination with hardware or can be purchased as an upgrade.
RAID.RAID. Our RAID technology reduces a customer'scustomer’s dependence on the reliability of a single disk drive by duplicatingencoding data across multiple drives. We apply our RAID technology independent of the disk drive interface to provide data protection on SCSI, SATA and SAS disk drives. This independence enables our RAID software, firmware and hardware to be available across the full spectrum of servers from entry to enterprise.
Adaptec Storage Manager. Adaptec Storage Manager is a single RAID storage management utility that enables customers and IT managers to easily manage storage across DAS environments, create storage solutions and SAN environments. It allows the user to configure, expand, manage and monitor local and remote RAID storageprotect data (RAID) from a single client workstation.
SSG
Storage Systems.
Fixed Capacity. Our Snap Server fixed capacity storage systems are ideal for SMBs or remote offices, and enterprise networks are available in three different plug-and-play desktop or rack mount designs and eight different fixed capacity levels from 160 gigabytes to 2 terabytes. Since the Snap Server 110, 210, and 410 models are designed to be easy to set up and maintain, they are regularly used in locations where there may not be any dedicated IT personnel. While offering small form factors, these products deliver high performance and offer a variety of softwaredisk drive failure. Standard features through the GuardianOS operating system that can be customized with optional add-on software to cost-effectively meet the specific data protection and management needs of the customer.
Scalable. Our Snap Server scalable storage systems are ideal for SMBs that are experiencing rapid data growth. Two rack mount models, the Snap Server 520 and 650, provide base capacity between one and three terabytes, and a scalable capacity up to 66 terabytes usingincluded with our S50 JBOD expansion arrays. These models have hot-swappable drives, dual hot-swappable power supplies, dual gigabit Ethernet ports with Ethernet teaming, 4-way OS boot and UPS support. Similar to the fixed capacity systems, they offer high performance through an AMD 64bit Dual Opteron Processor architecture and the GuardianOS operating system. These systems include value added software for supporting both block iSCSI and file data types, antivirus, snapshots, and BakBone NetVault backup software with Virtual Tape Library support.
Software
Data Protection. Adaptec offers several integrated and add-on software applications for the Snap Server product line thatSATA or SAS RAID controllers allow our customersproducts to move, share, managedeliver a high level of data protection.
Other Software. We provide software development kits and protect their data. BakBone NetVaultcommand line interface tools to help simplify storage management and support for third-party backup software are integratedprovide manufacturing tools to simplify the integration of our products into GuardianOS in order to facilitate disaster recovery operations. Snap EDR provides data replication across the company or across a public WAN. Snap EDR encrypts the data in transit for extra security and also allows customers to easily manage inventory and archive data stored remotely. StorAssure software continuously backs up files from desktop and laptop systems throughout the enterprise. Snap Server Manager software allows customers to manage all Snap Servers in the company from a single console.customer solutions.
Sales, Marketing and Customers
We sell through our sales force to distribution channels worldwide, which market our products under the Adaptec brand; they, in turn, sell to VARs, system integrators and retail customers. We provide training and support for our distribution customers and to VARs. We also sell board-based products and provide technical support to end users worldwide through major computer-product retailers. Sales to distribution customers accounted for approximately 50% of our total revenues in fiscal 2008. Our primary distributors in fiscal 2008, in alphabetical order, were Bell Microproducts, Ingram Micro and Tech Data.
We also sell our products through our sales force directly to OEMs worldwide who market our products under their brands. We work closely with our OEM customers to design and integrate current and next generation products to meet the specific requirements of end users. Our OEM sales force focuses on developing relationships with OEM customers. The sales process involved in gaining major design wins can be complex, lengthy, and expensive. Sales to these OEM customers accounted for approximately 50%35% of our total net revenues in fiscal 2008.2010. Our primary OEM customers in fiscal 2008,2010, in alphabetical order, were Dell, Hewlett-Packard, Hitachi,IBM, Intel and IBM.Super Micro Computer, Inc. We expect net revenues obtained from largeour parallel SCSI products and our serial legacy products sold to OEM customers to continue to decline significantly in future periods as we are no longer pursuing future business from these customers with our current product portfolio,quarters as we believe the future growth opportunities for our currentthese products are limited due to the loss offailure to secure certain design wins.
We also sell through our sales force to distribution channels worldwide, which market our products under the Adaptec brand; they, in turn, sell to VARs, system integrators and retail customers. We provide training and support for our distribution customers and to VARs. We also sell board-based products and provide technical support to end users worldwide through major computer-product retailers. Sales to distribution customers accounted for approximately 65% of our total net revenues in fiscal 2010. Our primary distributors in fiscal 2010, in alphabetical order, were Bell Microproducts, CPI Computer Partner Handels GmbH, Ingram Micro, Synnex and Tech Data.
We emphasize customer service as a key element of our marketing strategy and maintain application engineers at our corporate headquarters and in the field. This includes assisting current and prospective customers in the use of our products, and providing the systems-level expertise and software experience of our engineering staff to customers with particularly difficult design problems. A high level of customer service is also maintained through technical support hotlines, email and dial-in-fax capabilities.
A small number of our customers account for a substantial portion of our net revenues. In fiscal 2008,2010, IBM, Bell Microproducts and Ingram Micro accounted for 34%17%, 16% and 11%15% of our total net revenues, respectively. In fiscal 2007,2009, IBM and Dell accounted for 34% and 13%36% of our total net revenues, respectively.revenues. In fiscal 2006,2008, IBM and Dell accounted for 28% and 15%40% of our total net revenues, respectively. We expect that a limited number of customers will continue to account for a substantial portion of our net revenues in fiscal 2009 and the foreseeable future.revenues.
International
We have entered into several arrangements with IBM over the past several years. In May 2000, we entered into a patent cross-license agreement with IBM, which was subsequently amended in March 2002, and obtained a release of past infringement claims made prior to January 1, 2000 and received the right to use certain IBM patents from January 1, 2000 through June 30, 2007. Additionally, we granted IBM a license to use all of our patents for the same period. A number of the licensed patents have either expired or are no longer significant to our product portfolio. If we should determine that it is necessary to extend the term of the patent license, we believe that we will be able to reach agreement with IBM for such an extension, without interruption to our business operations. In March 2002, we entered into a non-exclusive, perpetual technology licensing agreement and an exclusive three-year product supply agreement with IBM. The technology licensing agreement grants us the right to use IBM's ServeRAID technology for our internal and external RAID products. Under the product supply agreement, we deliver RAID software, firmware and hardware to IBM for use in IBM's xSeries servers.
International
Wecurrently maintain operations in six foreignfour countries and sell our products in additional countries through various representatives and distributors. We believe this geographic diversity allows us to draw on business and technical expertise from an international workforce, provides both stability to our operations, and diversifies revenue streams to offset geographic economic trends and offers us an opportunity to penetrate new markets.
A summary of our net revenuerevenues and net property, plant and equipment by geographic area is set forth in Note 1819 to the Consolidated Financial Statements.Statements included in “Item 8: Financial Statements and Supplementary Data” of this Annual Report on Form 10-K. We generated approximately 68%66% of our overall revenues in 2008fiscal 2010 from outside of the United States.States primarily from commercial customers. These sales include sales to foreign subsidiaries of U.S. companies. A majority of our revenues originating outside the United States was from commercial customers rather than foreign governments.
Competition
The markets for all of our products within the DPS and SSG segments are highly competitive and are characterized by rapid technological advances, frequent new product introductions, evolving industry and customer standards and competitive pricing pressures. Our competitive strategy is to continue to leverage our technical expertise and concentrate on delivering a comprehensive set of highly reliable, high performance storage and connectivity products with superior data protection that simplify storage management for organizations of all sizes. We design advanced features into our products, with a particular emphasis on data transfer rates, software-defined features and compatibility with major operating systems and most peripherals.
We believe the principal competitive factors in the markets for our DPS products are product price versus performance, product features and functionality, reliability, technical service and support, scalability and interoperability and brand awareness. We compete primarily with controller and HBA product offerings from Applied Micro Circuits, Areca Technology Corporation and LSI.
We believe the principal competitive factorsLSI, and several smaller suppliers in the markets for our SSG products are price, performance, product features, ease-of-use, breadth of product line, reliability, technical service and support, value-added software functionality for data protection, management of geographically dispersed storage systems, replication of data between sites, and brand awareness. At the low end of the market, some of our Snap Server product line competes withaddition to ASIC product offerings from Buffalo, IomegaLSI, Marvell and LaCie. At the mid range of the market, some of our Snap Server product line competes with product offerings from Dell, Hewlett-Packard and Network Appliance. PMC-Sierra.
Backlog
We typically receive orders for our products within two weeks or less of the desired delivery date, and most orders are subject to rescheduling and/or cancellation with little or no penalty. We maintain remote inventory locations at some of our largest OEM's siteOEMs’ sites with product ordering and delivery occurring when the OEM customer accepts our product into their inventory. In light of industry practice and experience, we do not believe that backlog at any given time is a meaningful indicator of our ability to achieve any particular level of revenue or financial performance.
Manufacturing
Beginning in the fourth quarter of fiscal 2006, we outsourcedWe outsource the manufacturing of the majority of our products to Sanmina-SCI Corporation. We employ Surface Mount Technology Corporation, or SMTC,Sanmina-SCI. We entered into a manufacturing agreement with Sanmina-SCI in February 2009 that expires in the fourth quarter of fiscal 2012. However, this manufacturing agreement with Sanmina-SCI will be transferred to manufacture certain of our ServeRAID products that are sold to IBM. We also employ SuperMicro and Universal Scientific Industrial Co., Ltd., or USI, to manufacture certain systems products.PMC-Sierra if the PMC Transaction is consummated. We believe that SMTC, SuperMicro, USI and Sanmina-SCI will be able to meet our anticipated needs for both current and future technologies.
Our final assembly and test operations for our ASIC products are performed by Amkor Technology and Advanced Semiconductor Engineering. Advanced Semiconductor Engineering also warehouses and ships our products on our behalf.
Intellectual Property
We seek to establish and maintain our proprietary rights in our technology and products through the use of patents, copyrights, trademarks and trade secret laws. As of March 31, 2008,2010, we had 426465 issued patents, expiring between February 2011 and 2026,October 2027, covering various aspects of our technologies. In addition, the Adaptec name and logo are trademarks or registered trademarks of ours in the United States and other countries. However, certain patents, as well as the Adaptec name and logo, will be transferred to PMC-Sierra if the PMC Transaction is consummated. If consummated, PMC-Sierra will also receive a non-exclusive license for the non-core patents that we will retain. We believe our patents and other intellectual property rights have value, but we do not consider any single patent to be essential to our business. We also seek to maintain our trade secrets and confidential information by non-disclosure policies and through the use of appropriate confidentiality agreements.
7
Research and Development
We continually enhance our existing products and develop new products to meet changing customer demands. The high technology industry is characterized by rapid technological innovation, evolving industry standards, changes in customer requirements and new product introductions and enhancements. We believe that ourOur future performance will depend in large part on our ability to maintain and enhance our current product line and to develop new products that achieve market acceptance, maintain competitiveness and meet an expanding range of customer requirements. To achieve this objective,these objectives, we intend tomay continue to leverage our technical expertise and product innovation capabilities to address storage-access products across a broad range of users and platforms. We may also enter into strategic alliances or partnerships or acquire complementary businesses or technologies where appropriate. We maintainentered into a researchthree-year strategic development agreement with HCL Technologies Limited, or HCL, to provide product development and engineering services for our product portfolio. However, the three-year strategic development center in Bangalore, India, which we expanded in fiscal 2007.agreement with HCL will be transferred to PMC-Sierra if the PMC Transaction is consummated.
Approximately 42%45% of our employees were engaged in research and development in fiscal 2008at March 31, 2010 as compared to 44% and 22% in fiscal years 200742% at March 31, 2009 and 2006,2008, respectively. Our research and development expenses were $39.8$29.5 million, or 23.8%40% of total net revenues, $56.6$26.9 million, or 22%23% of total net revenues, and $68.2$34.0 million, or 20%23% of total net revenues, for fiscal years 2008, 20072010, 2009 and 2006,2008, respectively. Research and development expenses primarily consist of salaries and related costs of employees engaged in ongoing research, design and development activities amortization of purchased technology and subcontracting costs.
We anticipate that we will continue to have significant research and development expenditures in the future in order to continue to offer innovative, high-quality products and services to maintain and enhance our competitive position. Our investment in research and development primarily focuses on developing new products for external storage, storage software and server storage markets. We also invest in research and development of RAID and virtual technologies supporting iSCSI, SATA and SAS connectivity.
Environmental Laws
Certain of our operations involve the use of substances regulated under various federal, state and international environmental laws. It is our policy to apply strict standards for environmental protection to sites inside and outside the United States, even if not subject to regulations imposed by local governments.
The European Parliament has enactedliability for environmental remediation and related costs is accrued when it is considered probable and the Restriction on Use of Hazardous Substances Directive,costs can be reasonably estimated. Environmental costs are presently not material to our operations or RoHS Directive, which restricts the sale of new electrical and electronic equipment containing certain hazardous substances, including lead. We believe that our products are RoHS compliant. However, if any of our products that are designated to be RoHS compliant are deemed to be non-compliant, we may suffer a loss of revenue, be unable to sell affected products in certain markets or countries and be at a competitive disadvantage.
Similar legislation has been or may be enacted in other jurisdictions and countries. If our products become non- compliant with the various environmental laws and regulations, we could incur substantial costs which could negatively affect our results of operations and financial position. For example, in fiscal 2006, we recorded an excess inventory expense of $1.9 million related to the transition of our products to comply with the RoHS Directive.
Employees
As of March 31, 2008,2010, we had a total of 391187 employees, consisting of 165 in research and development, 120 in sales and marketing, 66 in general administration and 40 in operation support.which excludes outsourced partners. Overall employee headcount declined by 35%19% in fiscal 20082010 compared to fiscal 2007,2009, and headcount declined by 47%41% in fiscal 20072009 compared to fiscal 2006.2008. We had a total of 598232 and 1,128391 employees at the end of fiscal 20072009 and 2006,2008, respectively. We expect our employee headcount to decline significantly if the PMC Transaction is consummated.
We believe that we currently have favorable employee relations; however, due to the general uncertainty regarding the outlook of our company, we may experience a higher level of attrition in our workforce.relations. None of our employees are represented by a collective bargaining agreement, nor have we ever experienced work stoppages.
Available Information
We make available free of charge through our Internet website at http://www.adaptec.com the following filings as soon as reasonably practicable after they are electronically filed with or furnished to the Securities and Exchange Commission, or SEC: our Annual Report on Form 10-K, Quarterly Reports on Form 10-Q, Current Reports on Form 8-K, proxy, information statements and all amendments to those reports filed or furnished pursuant to Section 13(a) or 15(d) of the Exchange Act. The SEC also maintains a web site at http://www.sec.gov that contains reports, proxy and information statements, and other information that we file electronically with the SEC and that may also be read and copied at the SEC’s Public Reference Room at 100 F Street, N.E., Washington, D.C. 20549. Information regarding the operation of the SEC’s Public Reference Room may be obtained by calling the SEC at 1-800-SEC-0330.
Item 1A.Risk Factors
Our business faces significant risks. The risks described below may not be the only risks we face. Additional risks that we do not yet know of or that we currently think are immaterial may also impair our results of operations and financial condition. If any of the events or circumstances described in the following risks actually occurs,
occur, our business, financial condition or results of operations could suffer, and the trading price of our common stock could decline. The risk factors outlined below include the risks associated with the consummation of the PMC Transaction, as well as our current operations.
Risks Related to Consummation of the PMC Transaction
If we do not complete the proposed sale of certain assets related to our business operations to PMC-Sierra, the continued operations of our business may result in losses from operations until an alternate course of action can be implemented. ActionsOn May 8, 2010, subsequent to our fiscal year-end, we entered into an Asset Purchase Agreement with PMC-Sierra for the sale of certain of our assets related to our business operations. Assuming satisfaction of the closing conditions contained in the Asset Purchase Agreement with PMC-Sierra, we anticipate consummating this transaction in June 2010. Until the consummation of the PMC Transaction, we intend to continue operating our business, subject to the consent of PMC-Sierra as required in certain circumstances pursuant to the Asset Purchase Agreement. This includes seeking growth opportunities beyond those presented by our existing product lines by entering into strategic alliances or partnerships to grow our business and increase our operating performance; however, we may not succeed in these efforts. The Asset Purchase Agreement with PMC–Sierra places a requirement of PMC-Sierra consent in certain specific circumstances with respect to our ability to operate, dispose of and maintain the assets subject to the PMC Transaction. The Asset Purchase Agreement with PMC-Sierra also includes closing conditions, which include among others (i) required regulatory approvals, (ii) absence of any law or order prohibiting closing, (iii) the absence of any change, development or event that would reasonably be expected to have a material adverse effect on the assets being purchased, (iv) certain third party consents, (v) the release of any non-excepted security interests in the assets being purchased, (vi) the absence of any proceedings which could reasonably challenge, restrain, prohibit or make illegal the PMC Transaction, (vii) the delivery of a legal opinion by our legal counsel in Delaware, (viii) the acceptance by certain employees of PMC-Sierra’s offers of employment, (ix) the accuracy of the representations and warranties of the parties, and (x) compliance by the parties with their obligations. If the PMC Transaction is not consummated, we may continue to incur operating losses until we can implement an alternate course of action, and we may also be adversely affected by negative market perceptions, which may have takena material adverse effect on our financial results, including the loss of customers and employees. We may also be required to record impairment charges for our long-lived assets in the future.
If the PMC Transaction is not consummated, we will have incurred substantial costs that may adversely affect our business, financial condition and results of operations and the actions thatmarket price of our common stock. We have incurred and will incur substantial transaction costs and expenses in connection with the PMC Transaction. These costs are primarily associated with the fees of our financial advisors and attorneys. Management resources may be diverted in an additional effort to consummate the PMC Transaction, and we are consideringsubject to obtaining PMC-Sierra consent in certain specific circumstances with regards to the conduct of our business prior to closing the PMC Transaction. Further, the closing of the PMC Transaction is subject to closing conditions contained in the Asset Purchase Agreement with PMC-Sierra on the conduct of our business. If the PMC Transaction is not consummated, we will have incurred significant costs for which we will have received little or no benefit. In addition, if the PMC Transaction is not consummated, we may experience negative reactions from the financial markets and our stockholders, potential investors, customers and employees. Each of these factors may also adversely affect the trading price of our common stock and our business, financial condition and results of operations.
The pending PMC Transaction may create uncertainty for our customers and employees. While the PMC Transaction is pending, customers may delay or defer decisions to purchase our products and existing customers may experience uncertainty about our products. This may adversely affect our ability to gain new customers and retain existing customers, which could adversely affect our business, financial condition and financial results inof operations. In addition, because of the short-term, anduncertainty regarding our operations, customers may not haveorder our products even if the long-term beneficial results that we intend. Our management team continuously reviews and evaluates all aspects of our business, including our product portfolio, our relationships with strategic partners and our research and development focus and sales and marketing efforts to better scale our operations relative to our cost basis.
The actions thatPMC Transaction is not consummated. Even though we have takenimplemented retention programs with our employees, current employees may experience uncertainty about their relationship with us, and key employees may depart because of issues relating to the actions that we are consideringuncertainty and difficulty involved in our continued operations. The loss of key employees could adversely affect our business, financial condition and results of operations.
9
Risks Associated with Operations after Consummation of the PMC Transaction
If we are successful in consummating the PMC Transaction, our operating results and financial condition may be impacted by significant charges. If the PMC Transaction is consummated, it is likely that we will incur significant charges, at such time. We believe our potential exposure may include, but is not limited to, the following:
increased amortization or depreciation of our long-lived assets due to potential changes to the expected remaining useful lives;
potential impairment of our long-lived assets;
restructuring charges;
acceleration of compensation expense related to unvested stock-based awards;
potential cash bonus payments; and,
potential accelerated payments of certain of our contractual obligations.
Such charges, which we cannot quantify at this time, are likely to adversely impact our results of operations and financial condition.
We will likely incur significant restructuring expenses in the short-term,near future. Subsequent to our fiscal year-end, we approved a restructuring plan to reduce our operating expenses. We expect to complete our actions by December 2010, which is primarily contingent upon the consummation of the PMC Transaction, including the expected transition services we are required to provide to PMC-Sierra. The restructuring charges to be incurred will primarily result in cash expenditures related to severance and related benefits, and to a lesser extent, exiting certain operating facilities and disposing excess assets. In an effort to continue saving operational costs subsequent to our fiscal year-end, we notified certain of our engineering employees and provided them one-time severance benefits of approximately $1.8 million, which is expected to be recorded in the first quarter of fiscal 2011, as we intend to outsource our ASIC and silicon needs. We cannot quantify the remaining impact of this restructuring plan to our Consolidated Statements of Operations at this time as the remaining restructuring actions are contingent upon the consummation of the PMC Transaction. Moreover, we could encounter delays in executing our restructuring plan, which could cause further disruption and additional unanticipated expense to our Consolidated Statements of Operations in the near future.
If the PMC Transaction is consummated, the NASDAQ Stock Market may determine that we are operating as a “public shell” and may decide to subject us to delisting proceedings or additional and more stringent continued listing criteria. If the PMC Transaction is consummated, the NASDAQ Listings Qualification Panel may determine that after such sale we are a “public shell” company. While the NASDAQ Stock Market has no bright-line or qualitative test for determining whether a particular company is a “public shell,” the exchange has expressed the opinion that the securities of companies operating as “public shells” may be subject to market abuses or other volatile conduct that is detrimental to the interests of the investing public. The NASDAQ Stock Market has defined a public shell as a company with no or nominal operations and either no or nominal assets, assets consisting solely of cash and cash equivalents, or assets consisting of any amount of cash and cash equivalents and nominal other assets. Should the PMC Transaction close, the NASDAQ Listing Qualifications Panel may perform a facts and circumstances analysis to determine whether they believe we are a “public shell.” Listed companies determined to be “public shells” by the NASDAQ Listings Qualification Panel may be subject to delisting proceedings or additional and more stringent continued listing criteria. If our common stock were delisted from the NASDAQ Global Market, liquidity in our shares and the trading prices of our shares could be negatively impacted.
Should the PMC Transaction be consummated and our other operating assets sold, written-off or disposed of, we may be considered a “shell company” under federal securities laws and may become subject to more stringent reporting requirements. Under Rule 405 of the Securities Act and Exchange Act Rule 12b-2, a shell company is defined as an entity that has no or nominal operations and either (a) no or nominal assets; (b) assets consisting solely of cash and cash equivalents; or (c) assets consisting of any amount of cash and cash
equivalents and nominal other assets. Should the PMC Transaction be consummated, depending on our future activities and operations, we may be deemed a “shell company” under the federal securities laws and regulations. The Securities and Exchange Commission’s rules prohibit the use of Form S-8 for the registration of shares under equity incentive plans by a shell company and require a shell company to file a Form 8-K to report the same type of information that would be required if it were filing to register a class of securities under the Exchange Act whenever the shell company is reporting the event that caused it to cease being a shell company. Being a shell company may adversely impact our ability to offer our stock to officers, directors and consultants, and thereby make it more difficult to attract and retain qualified individuals to perform services for us, and will likely increase the costs of registration compliance following the completion of a business combination.
If the PMC Transaction is consummated and depending on our future activities and operations, we may be deemed an investment company, which could impose on us burdensome compliance requirements and restrict our activities, which may make it difficult for us to complete future business combinations or acquisitions. The Investment Company Act of 1940, as amended, or the Investment Company Act, requires registration, as an investment company, of companies that are engaged primarily in the business of investing, reinvesting, owning, holding or trading securities. Generally, companies may be deemed investment companies under the Investment Company Act if they are viewed as engaging in the business of investing in securities or they own investment securities having a value exceeding 40% of certain assets. After the consummation of the PMC Transaction and depending on our future activities and operations, we may become subject to the Investment Company Act. While Rule 3a-2 of the Investment Company Act provides an exemption that allows companies that may be deemed investment companies but that have a bona fide intent to engage primarily in a business other than that of investing in securities up to one year to engage in such other business activity, we may not qualify for this or any other exemption under the Investment Company Act. If we are deemed to be an investment company under the Investment Company Act, we may be subject to certain restrictions that may make it difficult for us to complete a business combination, including:
restrictions on the nature of and custodial requirements for holding our investments; and
restrictions on our issuance of securities which may make it difficult for us to complete a business combination.
In addition, we may have imposed upon us burdensome requirements, including:
registration as an investment company;
adoption of a specific form of corporate structure; and
reporting, record keeping, voting, proxy and disclosure requirements and other rules and regulations.
If we become subject to the Investment Company Act, compliance with these additional regulatory burdens would require additional costs and expenses. There can be no assurance that we will not be deemed to be an investment company, as defined under Sections 3(a)(1)(A) and (C) of the Investment Company Act or that we will qualify for the exemption under Rule 3a-2 of the Investment Company Act.
If the carrying value of our long-lived assets is not recoverable, an impairment loss must be recognized which would adversely affect our financial results. Certain events or changes in circumstances would require us to assess the recoverability of the carrying value amount of our long-lived assets. With the announcement made by us in December 2009 that we initiated a process to pursue the potential sale or disposition of certain of our assets or business operations, we evaluated our long-lived assets to determine whether the carrying value would be recoverable. As we continued through this sale process on certain of our assets or business operations in the fourth quarter of fiscal 2010, we reevaluated the recoverability of our long-lived assets’ carrying value at March 31, 2010. Based on our analysis, our long-lived assets were not considered impaired in either the third or fourth quarters of fiscal 2010 as the sum of the expected undiscounted future cash flows exceeded the carrying value of our long-lived assets of $ $27.4 million at March 31, 2010. However, if the PMC Transaction is consummated, the carrying value of our remaining long-lived assets may not be recoverable in the future whether or not we decide to continue our efforts in the sale of the Aristos products or wind down or dispose of the Aristos products. As a result, if certain events or changes in circumstances arise, we may be required to record
11
impairment charges for our long-lived assets in future periods or shorten the remaining useful life of our long-lived assets, which would require us to record higher amortization or depreciation expense in future periods.
If our common stock becomes subject to the SEC’s penny stock rules, broker-dealers may experience difficulty in completing customer transactions and trading activity in our securities may be adversely affected. Our common stock may become a “penny stock” pursuant to Rule 3a51-1 of the Exchange Act. Broker-dealer practices in connection with transactions in penny stocks are regulated by certain penny stock rules adopted by the SEC. Penny stocks generally are defined as equity securities with a price of less than $5.00 per share, with certain exemptions. The penny stock rules require a broker-dealer, prior to purchase or sale of a penny stock not otherwise exempt from the rules, to deliver to the customer a standardized risk disclosure document that provides information about penny stocks and the risks associated with the penny stock market. The broker-dealer also must provide the customer with current bid and offer quotations for the penny stock, the compensation of the broker-dealer and its salesperson in the transaction, and monthly account statements showing the market value of each penny stock held in the customer account. In addition, the penny stock rules generally require that, prior to a transaction in a penny stock, the broker-dealer make a special written determination that the penny stock is a suitable investment for the purchaser and receive the purchaser’s written agreement to the transaction. These disclosure requirements may have the effect of reducing the level of trading activity in the secondary market of a stock that becomes subject to the penny stock rules.
If the PMC Transaction is consummated, failure to successfully identify and enter into a new line of business or identify possible acquisition candidates could cause our stock price to decline. If the PMC Transaction is consummated, we expect to pursue actively a new line of business operations and to explore all strategic alternatives to maximize stockholder value going forward, including deploying the proceeds of the PMC Transaction and our other assets in seeking business acquisition opportunities and other actions to redeploy our capital, while we manage our remaining operations. In relation to pursuing such strategic alternatives and new business acquisition opportunities, our stock price may decline due to any or all of the following potential occurrences:
we may not be able to identify a profitable new line of business or deploy successfully our resources to operate profitably in such line of business;
we may not be able to find suitable acquisition candidates or may not be able to acquire suitable candidates with our limited financial resources;
we may not be able to utilize our existing NOLs to offset future earnings;
we may have difficulty retaining our key remaining employees; and
we may have difficulty retaining our Board of Directors or attracting suitable qualified candidates should a current director resign.
There can be no assurance that we will be able to identify suitable acquisition candidates or business and investment opportunities once the PMC Transaction is consummated. We have incurred recurring operating losses related to our operations since 2001 (other than during 2004). If the PMC Transaction is consummated, we intend to explore strategic alternatives and identify new business acquisition opportunities in which we may utilize our NOLs. There is no guarantee that we will be able to identify such new business acquisition opportunities or strategic alternatives in which we may redeploy our assets and the proceeds of the PMC Transaction. If we are unable to identify new business opportunities or acquire suitable acquisition candidate(s), we may continue to incur operating losses and negative cash flows, and our results of operations and stock price may suffer.
Following the consummation of the PMC Transaction, our stockholders may be subject to the broad discretion of management. Should the PMC Transaction be consummated, we will have limited operating assets, and our business strategy will involve identifying new business and investment opportunities. Our stockholders may not have an opportunity to evaluate the long-term beneficial resultsspecific merits or risks of any such proposed transactions or investments. As a result, our stockholders may be dependent on the broad discretion and judgment
of management in connection with the application of our capital and the selection of acquisition or investment targets. There can be no assurance that determinations ultimately made by us will permit us to achieve profitable operations.
There may be risks associated with acquisitions and investments pursued after consummation of the PMC Transaction, including our decisions to sell, write-off or dispose of our remaining operating assets. As part of our business strategy following consummation of the PMC Transaction, we may evaluate new acquisition and investment opportunities. Acquisitions involve numerous risks, including difficulties in the assimilation of the operations and products or services of the acquired companies, the expenses incurred in connection with the acquisition and subsequent integration of operations and products or services and the potential loss of key employees of the acquired company. There can be no assurance that we intendwill successfully identify, complete or integrate any future acquisitions or investments or that completed acquisitions or investments will contribute favorably to our operations and couldfuture financial condition. In addition, we may be subject to certain risks and liabilities depending on our continued efforts to sell our Aristos products or other current operating assets or wind-down or dispose of our Aristos products or other current operating assets, including requirements under existing contracts with customers for our Aristos products, and possible disposition of our non-core patent portfolio and remaining real estate assets. There can be no assurance that we will be able to successfully wind-down or dispose of our Aristos products and fulfill all of our contractual obligations with customers of such products by September 2010, or successfully dispose of or redeploy our non-core patent portfolio and remaining real estate assets, which may result in an adverse effect on our financial condition and stock price.
We will incur significant costs in connection with our evaluation of new business opportunities and suitable acquisition candidates. If the following:
We will likely have no operating history in our new line of employees;
We may be unable to realize the benefits of our assets;
Additionally, if we underwent an ownership change, the NOLs would be subject to an annual limit on the amount of the taxable income that may be offset by our NOLs generated prior to the ownership change. If an ownership change were to occur, we may be unable to use a significant portion of our NOLs to offset taxable income.
The amount of NOLs that we have claimed has not been audited or otherwise validated by the U.S. Internal Revenue Service, or the IRS. The IRS could challenge our calculation of the amount of our NOLs, and our
13
determinations as to when a prior change in ownership occurred, and other provisions of the Internal Revenue Code, may limit our ability to carry forward our NOLs to offset taxable income in future years. If the IRS was successful with respect to any such challenge, the potential tax benefit of the NOLs to us could be substantially reduced.
We may issue a substantial amount of our common stock in the future which could cause dilution to our stockholders and otherwise adversely affect our stock price. A key element of our business strategy will be to make acquisitions. While we may make acquisition(s) in whole or in part with cash, as part of such strategy, we may issue additional shares of common stock as consideration for such acquisitions. These issuances could be significant. To the extent that we make acquisitions and issue our shares of common stock as consideration, our existing stockholders’ equity interest may be diluted. Any such issuance will also increase the number of outstanding shares of common stock that will be eligible for sale in the future. Persons receiving shares of our common stock in connection with these acquisitions may be more likely to sell off their common stock, which may influence the price of our common stock. In addition, the potential issuance of additional shares in connection with anticipated acquisitions could lessen demand for our common stock and result in a lower price than might otherwise be obtained. We may issue common stock in the future for other purposes as well, including in connection with financings, for compensation purposes, in connection with strategic transactions or for other purposes.
We may face litigation from stockholders related to the consummation of the PMC Transaction. With respect to the PMC Transaction, we may be subject to purported class action or derivative complaints that may be filed against us. The outcome of this potential future litigation is difficult to predict and quantify and the defense of such claims or actions can be costly. Such potential litigation would divert financial and management resources and result in general business disruption, regardless of whether the allegations are valid or whether we are ultimately held liable. A temporary or permanent injunction could delay or prevent completion of the PMC Transaction and such delay or failure could adversely affect us and cause adverse effects in our results of operations, cash flows and financial condition.
Risk Factors Related to Operations Should the PMC Transaction not be Consummated
As our revenue base continues to decline from our current operations, we may choose to exit or divest some or a substantial portionall of our current operations to focus on new opportunities. OurShould the PMC Transaction not be consummated, our management team continuously reviewswill continue to review and evaluatesevaluate our product portfolio, operating structure, and markets to determine the future viability of our existing products and market positions. We may determinepositions, including any possible alternative transaction(s), and the possible future divestiture in an alternate transaction of certain of our assets or business operations, should it be determined that the infrastructure and expenses necessary to sustain anour existing business or product offering isofferings are greater than the potential contribution margin that will be obtainable in the future. As a result, we may determine that it is in our best interest to continue to explore transactions in which we seek to sell, exit or divest such existing business or product offering. For example, subsequent to our fiscal year-end, as previously announced, we continue to consider our options related to our Aristos products, which includes an effort to sell, wind-down or dispose of these products. There can be no assurance that we will be able to successfully wind-down or dispose of our products and technology obtained from our acquisition of Aristos and fulfill all of our contractual obligations with customers of such products, which may result in fiscal 2007, we decidedan adverse effect on our financial condition and results of operations. Should the PMC Transaction not to invest further in our DSG business due to OEMs incorporating other connectivity technologies directly into their products, the increased level of competition entering the marketbe consummated and the complexitiessale or disposition process were continued, such process may create uncertainty in the marketplace with our customers and our suppliers, which could result in the following:
loss of customers;
reduced revenue base;
increased dependency on suppliers;
inability to obtain products or services in a timely manner for competitive prices;
increased operating costs;
employee attrition;
impairment of our long-lived assets;
material restructuring charges; and
loss of liquidity.
In the retail channel. As a result,past, we wound down the DSG business throughout fiscal 2007 and exited it at March 31, 2007. However, we may seek growth opportunities beyond those presented by our existing product lines by entering into strategic alliances, partnerships or acquisitions in order to scale our business, and we may not succeed in these efforts.
We currently dependhave depended on a small number of large OEM customers for a significant portion of our revenues, and we have been unsuccessfulmay not be successful in obtaining new OEM designs wins, which willmay prevent us from sustaining or growing our revenues from OEM customers.A small number of large OEMs have historically been responsible for a significant percentage of our revenues. However, we have failed to secure design wins from these OEM customers in connection with their new products, which will adversely affect our future revenues. For example, in the second quarter of fiscal 2008, a significant customer notified us that we did not receive design wins for our next generation serial products, which will have a significant negative impact on our revenues in future quarters. customers.We have evaluated thisthe OEM portion of our business, and, should the PMC Transaction not be consummated, we are no longer pursuinglikely to focus many of our efforts on our channel business opportunities and selectively or opportunistically pursue future business from large OEM customers with our current product portfolio, as we believe the future growth opportunities with OEMs for most of our current products are limited. While we gained some new OEM business and opportunities for products containing unified serial technologies as a result of the Aristos acquisition that have resulted in sales, we believe such sales are unlikely to offset the decline in OEM sales from our legacy products in the future as we continue to consider our options to sell, exit or divest our Aristos products.
We depend on a few key customers and the loss of any of them could significantly reduce our net revenues. Historically, a small number of our customers have accounted for a significant portion of our net revenues. For example, in fiscal 2010, IBM, Bell Microproducts and Ingram Micro accounted for 17%, 16% and 15% of our total net revenues, respectively, and in fiscal years 2009 and 2008, IBM accounted for 36% and 40% of our total net revenues, respectively. We believe that our major customers continually evaluate whether or not to purchase products from alternate or additional sources. Additionally, our customers’ economic and market conditions frequently change, and many of our customers may be negatively impacted by the current global economic turmoil. Accordingly, we cannot assure you that one or more of our major customers will not reduce, delay or eliminate its purchases from us, which would likely cause our revenues to decline further. Our current customers may also reduce or eliminate their purchases from us due to the uncertainty of our future operations. While we have gained some new OEM business and opportunities for products containing unified serial technologies as a result of the Aristos acquisition that have resulted in sales, such sales are unlikely to offset the decline in OEM sales from our legacy products in the future; therefore, we will currently be increasingly dependent on our channel products and customers for future revenue growth. This is particularly critical because our sales are made by means of standard purchase orders rather than long-term contracts. As a result, we expectcannot assure you that our few key customers will continue to purchase quantities of our products at current levels, or at all.
If our design wins do not result in significant sales, our revenues will continue to decline. A “design win” occurs when a customer or prospective customer notifies us that our product has been selected to be integrated within its product. The success that we ultimately experience from a design win is largely a factor of the success of the customer’s product into which our product has been integrated. We have virtually no control over, and sometimes have very little visibility, as to the success of our customer’s products, which is dependent upon a number of factors including current market conditions. If our design wins do not result in significant sales, our revenues obtained from large OEM customerswill continue to decline which could adversely affect our business.
Our operations depend on the efforts of our workforce, particularly our executives, principal engineers and other key employees, the loss of whom could affect the growth and success of our business. To be successful, we must retain and motivate our executives, our principal engineers and other key employees, including those in managerial, technical, marketing and information technology support positions. In particular, our product generation efforts depend on hiring and retaining qualified engineers. Competition for experienced management, technical, marketing and support personnel such as these remains intense. We must also continue to motivate all of our other employees and keep them focused on our strategies and goals, which may be particularly difficult due to morale challenges posed by the uncertainty of our future operations and their future employment with us. Each of our employees is an “at-will” employee, and, as a result, any of our employees could terminate their employment with us at any time without penalty. Due to the general uncertainty regarding the outlook of our company, we have implemented a retention plan in an effort to retain some of our key
15
employees. The loss of any of our key employees as well as a high level of attrition from all our other employees could have a significant impact on our operations. In addition, should the PMC Transaction be consummated, we will be required to fulfill certain transition services to PMC-Sierra, and the loss of any of our employees that are key to such transition activities could have an adverse effect on, and increase the cost of, providing these transition services.
If we do not meet our expense reduction and cost containment goals, we may have to continue to implement additional restructuring plans to reduce our operating costs. This may cause us to incur additional material restructuring charges and result in adverse effects on our employee capacities. We implemented several restructuring plans and recorded related restructuring charges of $1.6 million, $6.1 million and $6.3 million in fiscal years 2010, 2009 and 2008, respectively. These restructuring plans primarily involved the reduction of our workforce and the closure of certain facilities. The goals of our restructuring plans that were implemented were to bring our operational expenses to appropriate levels relative to our net revenues, while simultaneously implementing extensive company-wide expense-control programs. Subsequent to our fiscal year-end, we approved a restructuring plan to reduce our operating expenses. We expect to complete our actions by December 2010, which is primarily contingent upon the consummation of the PMC Transaction, including the expected transition services we are required to provide to PMC-Sierra. The restructuring charges to be incurred will primarily result in cash expenditures related to severance and related benefits, and to a lesser extent, exiting certain operating facilities and disposing excess assets. In an effort to continue saving operational costs subsequent to our fiscal year-end, we notified certain of our engineering employees and provided them one-time severance benefits of approximately $1.8 million, which is expected to be recorded in the first quarter of fiscal 2011, as we intend to outsource our ASIC and silicon needs. We cannot quantify the remaining impact of this restructuring plan to our Consolidated Statements of Operations at this time as the remaining restructuring actions are contingent upon the consummation of the PMC Transaction. Moreover, we could encounter delays in executing our restructuring plan, which could cause further disruption and additional unanticipated expense to our Consolidated Statements of Operations in the near future. Further, our restructuring plan could result in a potential adverse effect on employee capabilities that could harm our efficiency and our ability to act quickly and effectively.
Our operating results may be adversely affected by unfavorable economic and market conditions and the uncertain geopolitical environment.Economic conditions have deteriorated significantly in the past in many of the countries and regions in which we do business and may be depressed for the foreseeable future. Global economic conditions have also been challenged by worldwide liquidity and credit concerns and the related effects on economies around the world. While the liquidity crisis has passed and we have seen some improvement in global economic conditions, any adverse global economic conditions in our markets that may occur in the future periods.would likely negatively impact our business, which could result in:
reduced demand for our products;
increased price competition for our products;
increased risk of excess and obsolete inventories;
increased risk in the collectibility of cash from our customers;
increased risk in potential reserves for doubtful accounts and write-offs of accounts receivable; and
higher operating costs as a percentage of revenues.
If the global economic crisis causes demand in the server and network storage markets to decline, demand for our products would also likely be negatively affected. Some of the factors that could influence demand in the server and network storage markets include continuing increases in fuel and other energy costs, labor costs, access to credit, consumer confidence and other macroeconomic factors affecting corporate spending behavior. It is difficult to predict future server sales growth, if any. If global economic conditions remain uncertain or deteriorate further, we may experience material adverse impacts on our business, operating results and financial condition.
We may sustain losses in our investment portfolio due to adverse changes in the global credit markets. Global economic conditions have been challenged in the past by slowing growth and the sub-prime debt devaluation crisis, causing worldwide liquidity and credit concerns. While the liquidity and credit concerns have passed and we have seen some improvement in global economic conditions, any adverse change in global economic conditions may adversely impact our financial results. A substantial portion of our assets consists of investments in marketable securities that we hold as available-for-sale and mark to market. While there has been a decline in the trading values of certain of the securities in which we have invested, we have not recognized a material loss on our securities as the unrealized losses incurred were not deemed to be other-than-temporary. We expect to realize the full value of all our marketable securities upon maturity or sale, as we have the intent and ability to hold the securities until the full value is realized. However, we cannot provide any assurance that our invested cash, cash equivalents and marketable securities will not be impacted by adverse conditions in the financial markets, which may require us to record an impairment charge that could adversely impact our financial results.
If our customers or financial institutions that maintain our cash, cash equivalents and marketable securities, experience financial difficulties, which is more likely in the current weakened state of the economy, our revenues, operating results or cash balances may be adversely impacted. We do not carry credit insurance on our accounts receivables and any difficulty in collecting outstanding amounts due from our customers, particularly customers that place larger orders or experience financial difficulties, could adversely affect our revenues and our operating results. In addition, we maintain our cash, cash equivalents and marketable securities with certain financial institutions in which our balances exceed the limits that are insured by the Federal Deposit Insurance Corporation. If the underlying financial institutions fail or other adverse conditions occur in the financial markets, our cash balances may be impacted.
We depend on contract manufacturers and subcontractors, and if they fail to meet our manufacturing needs, it could delay shipments of our products and result in the loss of customers or revenues and increased manufacturing costs, which would have an adverse effect on our results. We rely on contract manufacturers for manufacturing our products and subcontractors for the assembly and packaging of the integrated circuits included in our products. In February 2009, we entered into a three-year manufacturing agreement with Sanmina-SCI to manufacture a majority of our products. However, this three-year strategic manufacturing agreement with Sanmina-SCI will be transferred to PMC-Sierra assuming the PMC Transaction is consummated. We must work closely with Sanmina-SCI to ensure that products are delivered on a timely basis. In addition, we must ensure that Sanmina-SCI continues to provide quality products. However, with our intent to pursue the potential sale or disposition regarding certain of our assets or our business operations, we may encounter difficulties in obtaining products and/or services in a timely manner for competitive prices from our suppliers. If Sanmina-SCI is unwilling or unable to meet our supply needs, as was the case in the earlier stages of our contract with them, including timely delivery and adherence to standard quality, we could lose customers or revenues and incur increased manufacturing costs, which would have an adverse effect on our operating results.
Due to the nature of this relationship, and the continuous changes in the prices of components and parts, we are in ongoing negotiations with Sanmina-SCI concerning product pricing. Any adverse outcome of future negotiations concerning product pricing could adversely impact our gross margins. We have no long-term agreements with our assembly and packaging subcontractors. We also employ Amkor Technology and Advanced Semiconductor Engineering to final assemble and test operations related to our ASIC products. We cannot assure you that these subcontractors will continue to be able and willing to meet our requirements. Any significant disruption in supplies from or degradation in the quality of components or services supplied by these contract manufacturers and subcontractors could delay shipments and result in the loss of customers or revenues, which could have an adverse effect on our operating results.
The impact of industry technology transitions and market acceptance of our new products may cause our revenues to continue to decline. We have experienced a significant decline in our revenues as the industry continues to transition from parallel to serial connectivity, as the revenues we generate from sales of our serial products has not grown at a fast enough rate to offset declines in sales of our parallel products. We expect this trend to continue in future periods. In addition, products that we may develop may not gain sufficient market
17
acceptance to offset the decline in revenues from certain of our existing products or otherwise contribute significantly to revenues. These factors, individually or in the aggregate, could cause our revenues to continue to decline.
Our dependence on new products may cause our net revenues to fluctuate or decline.We depend on a few key customers and the loss of any of them could significantly reduce our net revenues. Historically, a small number of our customers have accounted for a significant portion of our net revenues, and we expect that a limited number of customers will continue to represent a substantial portion of our net revenues for the foreseeable future. For example, in fiscal 2008, IBM and Ingram Micro accounted for 34% and 11 % of our total net revenues, respectively, whereas in fiscal 2007, IBM and Dell accounted for 34% and 13% of our total net revenues, respectively. We believe that our major customers continually evaluate whether or not to purchase products from alternate or additional sources. Additionally, our customers' economic and market conditions frequently change. Accordingly, we cannot assure you that a major customer will not reduce, delay or eliminate its purchases from us, which would likely cause our revenues to decline. For example, in the second quarter of fiscal 2008, a significant customer notified us that we did not receive design wins for our next generation serial products, which will have a significant negative impact on our revenues in future quarters. As our revenues from our large OEM customers continue to decline, we will be dependent on our channel products and customers for future revenue growth. We do not carry credit insurance on our accounts receivables and any difficulty in collecting outstanding amounts due from our customers, particularly customers that place larger orders or experience financial difficulties, could adversely affect our revenues and our operating results. Because our sales are made by means of standard purchase orders rather than long-term contracts, we cannot assure you that these customers will continue to purchase quantities of our products at current levels, or at all.Our operations depend on key personnel, the loss of whom could affect the growth and success of our business. In order to be successful, we must retain and motivate our executives, our principal engineers and other key employees, including those in managerial, technical, marketing and information technology support positions. In particular, our product generation efforts depend on hiring and retaining qualified engineers. Competition for experienced management, technical, marketing and support personnel such as these remains intense. Each of these personnel is an "at- will" employee, and, as a result, these employees could terminate their employment with us at any time without penalty and may seek employment with one or more of our competitors. Due to the general uncertainty regarding the outlook of our company, we have in the past implemented a retention plan in an effort to retain some of our key employees, and may do so again in the future. To the extent we do not implement a retention plan we may experience a higher level of attrition of our key employees. Furthermore, even if we do implement a retention plan, it may not have the desired effect of retaining our key employees. We must also continue to motivate all of our other employees and keep them focused on our strategies and goals, which may be particularly difficult due to morale challenges posed by continued workforce reductions. The loss of any of our key employees could have a significant impact on our operations.In order to execute our strategies, we may enter into strategic alliances with, partner with, invest in or acquire companies with complementary or strategic products or technologies. Costs associated with these strategic alliances, investments or acquisitions may adversely affect our results of operations. This impact could be exacerbated if we are unable to integrate the acquired companies, products or technologies. We may pursue strategic transactions, partnerships, investments and acquisitions in order to scale our business as sales of our core parallel products continue to decline. These may include both strengthening our partnerships in silicon-based technology and broadening our silicon-based intellectual property to improve our business opportunities. In order to be successful in the strategic alliances, partnerships, investments or acquisitions that we may enter into or make, we must:Conduct strategic alliances, partnerships, investments or acquisitions that enhance our time to market with new products;Successfully prevail over competing bidders for target strategic alliances, partnerships, investments or acquisitions at an acceptable price;Invest in companies and technologies that contribute to the profitable growth of our business;Integrate acquired operations into our business and maintain uniform standards, controls and procedures;Retain the key employees of the acquired operations; andDevelop the capabilities necessary to exploit newly acquired technologies.The benefits of any strategic alliances, partnerships, investments or acquisitions may prove to be less than anticipated and may not outweigh the costs reported in our financial statements, and we may not obtain the operational leverage or realize the improvements we intend or desire with the actions we take.Completing any potential future strategic alliances, partnerships, investments or acquisitions could cause significant diversions of management time and resources and divert focus from the activities of our current operations. We may encounter difficulty in integrating and assimilating the operations and personnel of the acquired companies into our operations or the acquired technology and rights into our services. We may also lack the experience or expertise in the new products and markets, which may impair the relationships with customers or suppliers of the acquired business. The acquisition of new operations may require us to develop additional internal controls to support these new operations. We may experience material deficiencies or weaknesses in our internal control over financial reporting as a result of the addition of new operations or due to changes to our internal controls, which could have a material impact on our results of operations when corrected. Additionally, we may not be successful in overcoming these risks or any other problems encountered in connection with these or other acquisitions, strategic alliances or investments, which could result in an adverse impact on our ability to develop or sustain the acquired business.If we acquire new businesses, products or technologies in the future, we may be required to assume warranty claims or other contingent liabilities, including liabilities unknown at the time of acquisition, and amortize significant amounts of other intangible assets and, over time, recognize significant charges for impairment of goodwill, other intangible assets or other losses.If we consummate any potential future acquisitions in which the consideration consists of our common stock or other securities, our existing stockholders' ownership may be significantly diluted. If we proceed with any potential future acquisitions in which the consideration is cash, we may be required to use a substantial portion of our available cash. If we were to use a substantial portion of our available cash, we might need to repatriate cash from our subsidiaries, which may cause us to incur additional income taxes at a rate up to 40%, which is our blended (federal and state) statutory rate in the United States. In addition, we may be required to invest significant resources in order to perform under a strategic alliance or partnership, or to complete an acquisition or investment, which could adversely affect our results of operations, at least in the short-term, even if we believe the acquisition, strategic alliance or investment will benefit us in the long-term.If we are not successful in completing a strategic alliance or partnerships with or acquisition of companies with complementary or strategic products or technologies, our future growth may be hindered.In order to scale our operations relative to our cost basis, we may need to identify attractive strategic alliance, partnership or acquisition candidates and complete a transaction with them. If we fail to identify and complete a successful strategic alliance, partnership or acquisition, we expect that our revenues will continue to decline and we may be at a competitive disadvantage or we may be adversely affected by negative market perceptions, any of which may have a material adverse effect on our financial results.If we do not meet our expense reduction goals, we may have to continue to implement additional restructuring plans in order to reduce our operating costs. This may cause us to incur additional material restructuring charges and result in adverse effects on our employee capacities. We have implemented several restructuring plans to reduce our operating costs and recorded related restructuring charges of $6.3 million, $3.7 million and $10.4 million in fiscal years 2008, 2007 and 2006, respectively. These restructuring plans primarily involved the reduction of our workforce and the closure of certain facilities, which included our manufacturing operations in Singapore in fiscal 2006. The goals of our restructuring plans that were implemented prior to fiscal 2006 were to support future growth opportunities, focus on investments that grow revenues and increase operating margins. Our recent goals involve better alignment of our cost structure with our anticipated revenue stream and improving our results of operations and cash flow. We have in the past not realized, and in the future may not realize, the anticipated benefits of the restructuring plans we initiated. To the extent that we do not meet our expense reduction goals, we may be required to implement further restructuring plans, which may lead us to incur material restructuring charges. Further, our restructuring plans could result in a potential adverse effect on employee capabilities that could harm our efficiency and our ability to act quickly and effectively in the rapidly changing technology markets in which we sell our products. Our If the PMC Transaction is not consummated, our future success significantly dependsmay depend upon our completing and introducing enhanced and new products at competitive prices and performance levels in a timely manner. The success of new product introductions depends on several factors, including the following:
designing products to meet customer needs;
product costs;
timely completion and introduction of new product designs;
quality of new products;
differentiation of new products from those of our competitors; and
market acceptance of our products.
Our product life cycles in each of our segments may be as brief as 12 months. As a result, we believe that we willmay continue to incur significant expenditures for research and development in the future. We may fail to identify new product opportunities and may not develop and bring new products to market in a timely manner. In addition, products or technologies developed by others may render our products or technologies obsolete or noncompetitive, or our targeted customers may not select our products for design or integration into their products. The failure of any of our new product development efforts could have an adverse effect on our business and financial results.
We have introduced RAID-enabled products based on the next generation SATA technology and delivered our products based on SAS technology to certain major customers for testing and integration. We will not succeed in generating significant revenues from our new SATA and SAS technology products if the market does not adapt to these new technologies, which would, over time, adversely affect our net revenues and operating results.
If we lose the cooperation of other hardware and software producers whose products are integral to ours, our ability to sustain or grow our revenues could be adversely affected. We must design our current products to operate effectively with a variety of hardware and software products supplied by other manufacturers, including the following:
I/O and RAID ASICs;
microprocessors;
peripherals;
system software;
server and desktop motherboards; and
enclosures.
We depend on significant cooperation from these manufacturers to achieve our design objectives and develop products that operate successfully with their products. These companies could, from time to time, elect to make it more difficult for us to design our products for successful operability with their products. For example, if one or more of these companies were to determine that as a result of competition or other factors, our products would not be broadly accepted by the markets we target, these companies may no longer work with us to plan for new products and new generations of our products, which would make it more difficult to introduce products on a timely basis or at all. Further, some of these companies might decide not to continue to offer products that are compatible with our technology and our markets could contract. If any of these events were to occur, our revenues and financial results could be adversely affected.
If we are unable to compete effectively, our net revenues and gross margins could be adversely affected. The markets for all of our products are intensely competitive and are characterized by the following:
rapid technological advances;
frequent new product introductions;
evolving industry standards; and
price erosion.
WeTo be competitive, our current products must continue to enhance our productsbe enhanced and improved on a timely basis to keep pace with market demands. If we do not do so, or if our competition is more effective in developing products that meet the needs of our existing and potential customers, we may lose market share and not participate in the future growth of our target markets. Revenues for our SATA products sold to our OEM customers have declined and we expect these revenues to continue to decline, as our products are at the end of their life cycles and certain of our customers have moved to other suppliers to obtain next generation SATA technologies. We also expect a significant negative impact on our net revenues from a decline in sales of our unified serial legacy products sold to OEMs in future quarters as a significant customerIBM notified us in the second quarter of fiscal 2008 that we did not receive design wins for our next generationtheir new serial products.
Our future revenue growth in our DPS segment remains largely dependent on the success of our new products addressing unified serial technologies and growing our market share in the channel. Our future revenue growth in our SSG segment remains largely dependent on the successful development and marketing of new productschannel, and our ability to expand our presence in the reseller channel. Our future operating results will also be influenced by our ability to participate in the development of the network storage market in which we face intense competition from other companies that are also focusing on networked storage products. In June 2009, we launched a new product in the unified serial RAID controller family, Series 5Z, which leverages solid state technology to eliminate the need to monitor battery charge levels or shut down servers for battery replacement. If we experience an incremental decline in our revenues beyond the declines anticipated, and we are unable to effectively manage our inventory levels, we may be required to record additional inventory-related charges, which would adversely impact our gross margins.
We cannot assure you that we will have sufficient resources to accomplish any or all of the following:
satisfy any growth in demand for our products;
make timely introductions of new products;
compete successfully in the future against existing or potential competitors; or
prevent price competition from eroding margins.
We depend on the efforts of our distributors, which if reduced, could result in a loss of sales of our products in favor of competitive offerings. We derived approximately 50%65% of our total net revenues for fiscal 20082010 from independent distributor and reseller channels. Our financial results could be adversely affected if our relationships with these distributors or resellers were to deteriorate or if the financial condition of these distributors or resellers were to decline. We continue to monitor and evaluate our distributors and may terminate distributor relationships to improve our product placement or improve distribution channels; however, the termination of a distributor may adversely affect our financial results in the short-term.short term.
Our distributors generally offer a diverse array of products from several different manufacturers. Accordingly, we are at risk that these distributors may give higher priority to selling products from other suppliers. A reduction in sales efforts by our current distributors could adversely affect our business and financial results. For example, some of our distributors threatened to stop selling our products or make pricing of our products non-competitive if we did not agree to absorb their costs to comply with the Waste Electrical and Electronic Equipment Directive with respect to our products. Our distributors build inventories in anticipation of future sales, and if such sales do not occur as rapidly as they anticipate, our distributors will decrease the size of their product orders. If we decrease our price protection or distributor-incentive programs, our distributors may also decrease their orders from us. In addition, we have from time to time taken actions to reduce levels of products at distributors and may do so in the future. These actions may affect our net revenues and negatively affect our financial results.
We currently purchase all of the finished production silicon wafers, chips and other key components used in our products from suppliers, and if they fail to meet our manufacturing needs, it would delay our production and We depend on contract manufacturers and subcontractors, and if they fail to meet our manufacturing needs, it could delay shipments of our products and result in the loss of customers or revenues and increased manufacturing costs, which would have an adverse effect on our results. We rely on contract manufacturers for manufacturing our products and subcontractors for the assembly and packaging of the integrated circuits included in our products. On December 23, 2005, we entered into a three-year contract manufacturing agreement with Sanmina-SCI, which expires in the third quarter of fiscal 2009. Under this agreement, Sanmina-SCI assumed manufacturing operations for the majority of our products. The transition of the manufacturing facilities did not go as well as we expected, as Sanmina-SCI experienced material shortages that impacted its ability to meet delivery commitments on a consistent basis, which negatively impacted our net revenues and operating results in the first quarter of fiscal 2007. We continued to see an impact in our channel penetration in the second and third quarters of fiscal 2007 as a result of not meeting the demands in the first quarter of fiscal 2007. We must work closely with Sanmina-SCI to ensure that products are delivered on a timely basis. In addition, we must ensure that Sanmina-SCI continues to provide quality products. If Sanmina-SCI is unwilling or unable to meet our supply needs, including timely delivery and adherence to standard quality, we could lose customers or revenues and incur increased manufacturing costs, which would have an adverse effect on our operating results.Due to the nature of this relationship, and the continuous changes in the prices of components and parts, we are in ongoing negotiations with Sanmina-SCI concerning product pricing. Any adverse outcome of future disputes concerning product pricing could adversely impact our gross margins. We have no long-term agreements with our assembly and packaging subcontractors. We also employ SMTC to manufacture certain ServeRAID products, SuperMicro and USI to manufacture certain systems products, and Amkor Technology and Advanced Semiconductor Engineering to final assemble and test operations related to our ASIC products. We cannot assure you that these subcontractors will continue to be able and willing to meet our requirements for these components or services. Any significant disruption in supplies from or degradation in the quality of components or services supplied by these contract manufacturers and subcontractors could delay shipments and result in the loss of customers or revenues, which could have an adverse effect on our financial results.our product shipments to customers and negatively affect our operations. Independent foundries manufacture to our specifications all of the finished silicon wafers and chips used for our products. We currently
19
purchase finished production silicon wafers used in our products from Taiwan Semiconductor Manufacturing Company, or TSMC.TSMC, and purchase finished production chips from LSI Corporation. In addition, we purchase some of our key components used in our products from sole-source suppliers. The manufacture of semiconductor devices and other components are sensitive to a wide variety of factors, including the following:
the availability of raw materials;
the availability of manufacturing capacity;
transition to smaller geometries of semiconductor devices;
the level of contaminants in the manufacturing environment;
impurities in the materials used; and
the performance of personnel and equipment.
We cannot assure you that manufacturing problems may not occur in the future. A shortage of raw materials or production capacity could lead our suppliers to allocate available capacity to other customers. Any prolonged inability to obtain wafers and other key components with competitive performance and cost attributes, adequate yields or timely deliveries would delay our production and our product shipments, and could have an adverse effect on our business and financial results. We expect that our suppliers will continually seek to convert their processes for manufacturing wafers and key components to more advanced process technologies. Such conversions entail inherent technological risks that can affect yields and delivery times. If for any reason the suppliers we use are unable or unwilling to satisfy our wafer and other key component needs, we will be required to identify and qualify additional suppliers. Additional suppliers for wafers and other key components may be unavailable, may take significant amounts of time to qualify or may be unable to satisfy our requirements on a timely basis.
Because our sales are made by means of standard purchase orders rather than long-term contracts, if demand for our customers'customers’ products declines or if our customers do not control their inventories effectively, they may cancel or reschedule shipments previously ordered from us or reduce their levels of purchases from us. The volume and timing of orders received during a quarter are difficult to forecast. Our customers generally order based on their forecasts and they frequently encounter uncertain and changing demand for their products. If demand falls below such forecasts or if our customers do not control their inventories effectively, they may cancel or reschedule shipments previously ordered from us. Our customers have from time to time in the past canceled or rescheduled shipments previously ordered from us, and we cannot assure you that they will not do so in the future. For example, in the third quarter of fiscal 2007, the demand for our products from certain OEM customers substantially declined from their initial forecasts, which adversely affected our operating results. As our sales are made by means of standard purchase orders rather than long-term contracts, we cannot assure you that these customers will continue to purchase quantities of our products at current levels, or at all. Historically, we have set our operating budget based on forecasts of future revenues because we do not have significant backlog. Because much of our operating budget is relatively fixed in the short-term, if revenues do not meet our expectations, then our financial results will be adversely affected.
If we fail to adequately forecast demand for our products, we may incur excess product inventory costs and our financial results will be adversely affected.We have a three-year contract manufacturing agreement with Sanmina-SCI to manufacture a majority of our products, which expires in the third quarter of fiscal 2009. affected.As the sales of our products are completed through standard purchase orders rather than long-term contracts, we provide our contract manufacturer forecasts based on anticipated future demand from our customers. To the extent that our customers'customers’ demands fall below their initial forecastforecasts and we are unable to sell the product to another customer, and because our purchase commitment lead time to manufacture products with theour contract manufacturer is longer than the lead time for a customer to cancel or reschedule an order, we may be exposed to excess product inventory costs and our financial results will be adversely affected. For example, in the third quarter of fiscal 2007, we incurred significant inventory-related charges of $7.8 million due to a significant decline in our revenue stream.
Our operating results have fluctuated in the past, and are likely to continue to fluctuate, and if our future results are below the expectations of investors or securities analysts, the market price of our common stock would likely decline significantly.Our quarterly operating results have fluctuated in the past, and are likely to vary significantly in the future, based on a number of factors related to our industry and the markets for our products. Factors that are likely to cause our operating results to fluctuate include those discussed in this Risk
Factors section. For example, in fiscal 2009, our operating results were materially impacted by unusual charges, such as a goodwill impairment charge of $16.9 million.
Our operating expenses are largely based on anticipated revenues, and a large portion of our expenses, including facility costs and salaries, are fixed in the short term. As a result, lower than anticipated revenues for any reason could cause significant variations in our operating results from quarter to quarter.
Due to the factors summarized above, and the other risks described in this section, we believe that you should not rely on period-to-period comparisons of our financial results as an indication of our future performance. In the event that our operating results fall below the expectations of securities analysts or investors, the market price of our common stock could decline substantially.
We may be subject to a higher effective tax rate that could negatively affect our results of operations and financial position. We are subject to income and other taxes in the United States and in the foreign taxing jurisdictions in which we operate. The determination of our worldwide provision for income taxes and current and deferred tax assets and liabilities requires judgment and estimation and is subject to audit and redetermination by the taxing authorities. Although we believe our tax estimates are reasonable, the following factors could cause our effective tax rate to be materially different than tax amounts recorded in our Our operating results may be adversely affected by unfavorable economic and market conditions and the uncertain geopolitical environment. Adverse economic conditions in some markets may impact our business, which could result in:Reduced demand for our products;Increased price competition for our products;Increased risk of excess and obsolete inventories; andHigher operating costs as a percentage of revenues.Demand for our products would likely be negatively affected if demand in the server and network storage markets declines. It is difficult to predict future server sales growth, if any. In addition, other technologies may replace the technologies used in our existing products and the acceptance of our products using new technologies in the market may not be widespread, which could adversely affect our revenues.consolidated financial statements:Consolidated Financial Statements:
the jurisdiction in which profits are determined to be earned and taxed;
adjustments to estimated taxes upon finalization of various tax returns;
changes in available tax credits;
changes in share-based compensation expense;
changes in tax laws, the interpretation of tax laws either in the United States or abroad or the issuance of new interpretative accounting guidance related to uncertain transactions and calculations where the tax treatment was previously uncertain; and
the resolution of issues arising from tax audits with various tax authorities.
The factors noted above may cause a higher effective tax rate that could materially affect our income tax provision, results of operations or cash flows in the period or periods for which such determination is made.
We held approximately $95.7 million of cash, cash equivalents and marketable securities at our subsidiaries in Singapore and Cayman Islands at March 31, 2008. During the fourth quarter of fiscal 2005, we repatriated $360.6 million of cash from Singapore to the United States in connection with the American Jobs Creation Act of 2004 which provided a one-time deduction of 85% for certain dividends from controlled foreign corporations. If the amount repatriated does not qualify for the one-time deduction, we could incur additional income taxes at up to the United States Federal statutory rate of 35%, which would negatively affect our results of operations and financial condition.
Our reliance on industry standards and technological changes in the marketplace may cause our net revenues to fluctuate or decline. The computer industry is characterized by various, evolving standards and protocols. We design our products to conform to certain industry standards and protocols such as the following:
Technologies:
| Technologies: | ||
•CIFS | •PCI | |
•Ethernet | •PCIe | |
•Fibre channel | •PCI-X | |
•FTP | •RAID | |
•HTTP | •SAS | |
•IPsec | •SATA | |
•iSCSI | •SCSI | |
•NFS | •SMI-S | |
| Operating Systems: | ||
•Linux | •UNIX | |
•MacOS | •VMware | |
•Netware | •Windows | |
Operating Systems:
21
If user acceptance of these standards declines, or if new standards emerge, and if we do not anticipate these changes and develop new products accordingly, these changes could adversely affect our business and financial results.
We are subject to various environmental laws and regulations that could impose substantial costs upon us and may adversely affect our business. We may from time to time be subject to various state, federal, and international laws and regulations governing the environment, including laws regulating the manufacture and distribution of chemical substances and laws restricting the presence of certain substances in electronics products. For example, the European Parliament enacted the Restriction of Hazardous Substances, or RoHS, directive, which restricts the sale of new electricalAlthough not currently mandated by any laws and electronic equipment containing certain hazardous substances, including lead. We recorded an excess inventory expense of $1.9 millionregulations, we experienced a delay in fiscal 2006 related to the transitionsales from some of our customers that required halogen-free products, to complywhich eliminated the use of environmentally sensitive materials, including certain “salt-formers.” If our products become non-compliant with the RoHS directive. If any ofvarious environmental laws and regulations or no longer meet our customer specification for environmental products, that are designated to be RoHS compliant are deemed to be non-compliant, we may suffer a loss of revenues, be unable to sell affected products in certain markets or countries and be at a competitive disadvantage.Similar legislation has been or may be enacted in other jurisdictions and countries. If We could also incur substantial costs to comply our products become non- compliant withto meet the various environmental needs of our customers, laws and regulations, we could incur substantial costs which could negatively affect our results of operations and financial position.
If we do not provide adequate support during our customers'customers’ design and development stage, or if we are unable to provide such support in a timely manner, we may lose revenues to our competitors. Certain of our products are designed to meet our customers'customers’ specifications and, to the extent we are not able to meet these expectations in a timely manner or provide adequate support during our customers'customers’ design and development stage, our customers may choose to buy similar products from another company. If this were to occur, we may lose revenues and market share to our competitors.
If there is a shortage of components used in our customers'customers’ products, our sales may decline, which could adversely affect our results of operations and financial position. If our customers are unable to purchase certain components whichthat are embedded into their products, their demand for our products may decline. In addition, we or our customers may be impacted by component shortages if components that comply with the RoHSRestriction of Hazardous Substances directive are not available. Similar shortages of components used in our products or our customers'customers’ products could adversely affect our net revenues and financial results in future periods.
Product quality problems could lead to reduced revenues and gross margins. We produce highly complex products that incorporate leading-edge technologies, including both hardware and software. Software often contains "bugs"“bugs” which can interfere with expected operations. We cannot assure you that our pre-shipment testing programs will be adequate to detect all defects which might interfere with customer satisfaction, reduce sales opportunities, or affect our gross margins if the costs of remedying the problems exceed reserves established for that purpose. An inability to cure a product defect could result in the failure of a product line, and withdrawal, at least temporarily, from a product or market segment, damage to our reputation, inventory costs, product reengineering expenses, and a material impact on revenues and gross margins.
To execute our strategies, we may enter into strategic alliances with, or partner with companies with complementary or strategic products or technologies or make other structural changes to our business. Costs associated with these strategic alliances or partnerships may adversely affect our results of operations. This impact could be exacerbated if we are unable to integrate the products or technologies.Our charter documents We may pursue strategic transactions or partnerships to scale our business as sales of our core parallel products continue to decline. These may include both strengthening our partnerships in silicon-based technology and Delaware law contain anti-takeover provisionsbroadening our silicon-based intellectual property to improve our business opportunities. To be successful in any strategic alliances or partnerships that we may enter into or make, we must:
conduct strategic alliances or partnerships that enhance our time to market with new products;
successfully prevail over competing bidders for target strategic alliances or partnerships at an acceptable price;
invest in technologies that contribute to the profitable growth of our business;
develop the capabilities necessary to exploit newly acquired technologies; and
consider structural changes to achieve additional stockholder return.
The benefits of any strategic alliances or partnerships may prove to be less than anticipated and may not outweigh the costs reported in our financial statements, and we may not obtain the operational leverage or realize the improvements we intend or desire with the actions we take.
Completing any potential future strategic alliances or partnerships could prevent, discouragecause significant diversions of management time and resources and divert focus from the activities of our current operations. In addition, we may be required to invest significant resources to perform under a strategic alliance or delaypartnership, which could adversely affect our results of operations, at least in the short-term, even if we believe the strategic alliance or partnership will benefit us in the long-term.
If we are not successful in completing strategic alliances or partnerships with companies with complementary or strategic products or technologies, our future growth may be hindered. To scale our operations relative to our cost basis, we may need to identify attractive strategic alliance or partnership candidates and complete a change in controltransaction with them. If we fail to identify and complete successful strategic alliances or management,partnerships, we expect that our revenues will continue to decline and we may be at a competitive disadvantage or we may be adversely affected by negative market perceptions, any of which may affect the price ofhave a material adverse effect on our common stock.Some provisions of our certificate of incorporation and bylaws could have the effect of making it more difficult for a potential acquirer to acquire a majority of our outstanding voting stock. These include completing procedural requirements for stockholders holding 5% of voting shares to take action by written consent and restricting the ability of stockholders to call special meetings. In addition, the indenture relating to the 3/4% Notes provides that in the event of certain changes in control, each holder of our 3/4% Notes will have the right to require us to repurchase such holder's 3/4% Notes at a price equal to the principal amount of the 3/4% Notes being purchased, plus any accrued and unpaid interest. We are also subject to provisions of Section 203 of the Delaware General Corporation Law which prohibits us from engaging in any business combination with an interested stockholder for a period of three years from the date the person became an interested stockholder, unless certain conditions are met. These restrictions could have the effect of delaying or preventing a change of control or management.financial results.
Some of our products contain "open source"“open source” software, and any failure to comply with the terms of one or more of these open source licenses could negatively affect our business. Some of our products are distributed with software licensed by its authors or other third parties under so-called "open source"“open source” licenses, including, for example, the GNU General Public License, or GPL, GNU Lesser General Public License, or LGPL, the Mozilla Public License, the BSD License and the Apache License. Some of those licenses may require as a condition of the license that we make available source code for modifications or derivative works we create based upon, incorporating, or using the open source software, that we provide notices with our products, and/or that we license such modifications or derivative works under the terms of a particular open source license or other license granting third parties certain rights of further use. If an author or other third party that distributes such open source software were to allege that we had not complied with the conditions of one or more of those open source licenses, we could be required to incur legal expenses in defending against such allegations, and if our defenses were not successful we could be enjoined from distribution of the products that contained the open source software and required to either make the source code for the open source software available, to grant third parties certain rights of further use of our software, or to remove the open source software from our products, which could disrupt our distribution and sale of some of our products. In addition, if we combine our proprietary software with open source software in a certain manner, we could under some of the open source licenses, be required to release the source code of our proprietary software. If an author or other third party that distributes open source software were to obtain a judgment against us based on allegations that we had not complied with the terms of any such open source licenses, we could also be subject to liability for copyright infringement damages and breach of contract for our past distribution of such open source software.
Our international operations involve a number of political, economic and other risks that could adversely affect our ability to sell our products in certain countries, create local economic conditions that reduce demand for our products among our target markets and expose us to potential disruption in the supply of necessary components. Our international operations and sales are subject to political and economic risks, including political instability, currency controls, and changes in import/export regulations, tariffs and freight rates. We maintain a research and development center in Bangalore, India, which we expanded in fiscal 2007. Many of our subcontractors are primarily located in Asia and we have sales offices and customers located throughout Europe, Japan and other countries. In addition, because our primary wafer supplier, TSMC, is located in Taiwan, we may be subject to certain risks resulting from political instability in Taiwan, including conflicts between Taiwan and the People'sPeople’s Republic of China. These and other international risks could result in the creation of political or other non-economic barriers to our being able to sell our products in certain countries, create local economic conditions that reduce demand for our products among our target markets, expose us to potential disruption in the supply of necessary components or otherwise adversely affect our ability to generate
23
revenues and operate effectively. In addition, the operations of our remote locations are subject to management oversight and control. If our business practices and corporate controls are not adhered to worldwide, our business and financial results could be adversely affected.
We depend on third parties to transport our products. We rely on independent freight forwarders to move our products between manufacturing plants and our customers. Any transport or delivery problems because of their errors, or because of unforeseen interruptions in their activities due to factors such as strikes, political instability, terrorism, natural disasters and accidents, could adversely affect our business, financial condition and results of operations and ultimately impact our relationship with our customers.
If actual results or events differ materially from those contemplated by us in making estimates and assumptions, our reported financial condition and results of operations for future periods could be materially affected. The preparation of financial statements in conformity with accounting principles generally accepted in the United States of America requires management to make estimates and assumptions that affect the amounts reported in the consolidated financial statementsConsolidated Financial Statements and accompanying notes. For example, we have identified key accounting estimates in our Critical Accounting Policies included in “Item 7: Management’s Discussion and Analysis of Financial Condition and Results of Operations” of this Annual Report on Form 10-K, which include revenue recognition, cash, cash equivalents and marketable securities valuation, inventory, goodwill,impairment of long-lived assets, stock-based compensation and income taxes. Furthermore, Note 1 to the Consolidated Financial Statements included in “Item 8: Financial Statements and Supplementary Data” of this Annual Report on Form 10-K describes the significant accounting policies essential to preparing our consolidated financial statements.Consolidated Financial Statements. The preparation of these financial statements requires estimates and assumptions that affect the reported amounts and disclosures. Although we believe that our judgments and estimates are appropriate and correct, actual future results may differ materially from our estimates.
If we are unable to protect and enforce our intellectual property rights, we may be unable to compete effectively. Although we actively maintain and defend our intellectual property rights, we may be unable to adequately protect our proprietary rights. In addition, the laws of certain territories in which our products are or may be developed, manufactured or sold, including Asia and Europe, may not protect our products and intellectual property rights to the same extent as the laws of the United States. Because we conduct a substantial portion of our operations outside of the United States and sell to a worldwide customer base, we are more dependent on our ability to protect our intellectual property in international environments than would be the case if a larger portion of our operations were domestic.
Despite our efforts, we may be unable to prevent third parties from infringing upon or misappropriating our intellectual property, which could harm our business and ability to compete effectively. We have from time to time discovered counterfeit copies of our products being manufactured or sold by others. Although we have programs to detect and deter the counterfeiting of our products, significant availability of counterfeit products could reduce our revenues and damage our reputation and goodwill with customers.
Third parties may assert infringement claims against us, which may be expensive to defend and could divert our resources. From time to time, third parties assert exclusive patent, copyright and other intellectual property rights to our key technologies, and we expect to continue to receive such claims in the future. The risks of receiving additional claims from third parties may be increased in periods when we begin to offer product lines employing new technologies relative to our existing products.
We cannot assure you that third parties will not assert other infringement claims against us, directly or indirectly, in the future, that assertions by third parties will not result in costly litigation or that we would prevail in such litigation or be able to license any valid and infringed intellectual property from third parties on commercially reasonable terms. These claims may be asserted in respect of intellectual property that we own or that we license from others. In addition to claims brought against us by third parties, we may also bring litigation against others to protect our rights. Intellectual property litigation, regardless of the outcome, could result in substantial costs to us and diversion of our resources and management time and attention, and could adversely affect our business and financial results.
We may be required to pay additional federal income taxes which could negatively affect our results of operations and financial position. We were previously subject to IRS audits for our fiscal years 1994 through 2003. During the third quarter of fiscal 2007, we reached resolution with the United States taxing authorities relating to those fiscal years. However, our Our tax provision continues to reflect judgment and estimation regarding components of the settlement such as interest calculations and the application of the settlements to foreign, state and local taxing jurisdictions. Although we believe our tax estimates are reasonable, the ultimate tax outcome may materially differ from the tax amounts recorded in our condensed consolidated financial statementsConsolidated Financial Statements and may cause a higher effective tax rate that could materially affect our income tax provision, results of operations or cash flows in the period or periods for which such determination is made. TheIn fiscal 2009, the IRS is currently auditingconcluded its audit of our Federalfederal income tax returns for the fiscal 2004 through 2006 audit cycle. The IRS issued a No Change Report indicating no change to our tax liability; however, the IRS continues to have the ability to adjust tax attributes relating to these years in subsequent audits. We believe that we have provided sufficient tax provisions for these years and that the ultimate outcome of theany future IRS audits that include the tax attributes will not have a material adverse impact on our financial position or results of operations in future periods. However,While the tax authorities in the foreign jurisdictions that we cannot predict with certainty howoperate in continue to audit our tax returns for fiscal years subsequent to 1999, the potential outcome of these matters will be resolvedaudits is uncertain and whether we will be required to makecould result in material tax provisions or additional tax payments.payments in future periods.
Future changes in financial accounting standards or practices or existing taxation rules or practices may cause adverse unexpected revenue fluctuations and affect our reported results of operations.Aoperations. A change in accounting standards or practices or a change in existing taxation rules or practices can have a significant effect on our reported results and may even affect our reporting of transactions completed before the change is effective. New accounting pronouncements and taxation rules and varying interpretations of accounting pronouncements and taxation practices have occurred and may occur in the future. For example, upon our adoption of FIN 48 on April 1, 2007, we revised our policy in conformity with the liability classification requirements of FASB Interpretation No. 48, "
Accounting for Uncertainty in Income Taxes-an Interpretation of FASB Statement No. 109," or FIN 48, which clarifies the accounting for uncertainty in income tax positions. This interpretation requires that we recognize in our financial statements the impact of a tax position if that position is more likely than not to be sustained on audit, based on the technical merits of the position. At March 31, 2008 we had $4.4 million in "Other long-term liabilities" for uncertain tax positions related to FIN 48 and we continue to recognize interest expense for and or penalties related to these uncertain tax positions in the Consolidated Statement of Operations within "Provision for (benefit from) income taxes".
We may be engaged in legal proceedings that could cause us to incur unforeseen expenses and could occupy a significant amount of our management'smanagement’s time and attention. From time to time we are subject to litigation or claims that could negatively affect our business operations and financial position. Such disputes could cause us to incur unforeseen expenses, could occupy a significant amount of our management'smanagement’s time and attention, and could negatively affect our business operations and financial position.
We are exposed to fluctuations in foreign currency exchange rates. Because a significant portion of our business is conducted outside the United States, we face exposure to adverse movements in foreign currency exchange rates. These exposures may change over time as business practices evolve and could have an adverse impact on our financial results and cash flows. Historically, our exposures have related to non-dollar- denominatednon-dollar-denominated operating expenses in Europe and Asia. We began Euro-denominated sales to our distribution customers in the European Union in the fourth quarter of fiscal 2003.2003; however, we switched back to United States dollar-denominated sales to our distribution customers in the European Union in the fourth quarter of fiscal 2008. An increase in the value of the dollar could increase the real cost to our customers of our products in markets outside the United States where we sell in dollars, and a weakened dollar could increase the cost of local operating expenses and procurement.
We hold minoritynon-controlling interests in privately held venture funds, and if these venture funds face financial difficulties in their operations, our investments could be impaired. We continue to hold minority interestsnon-controlling interest in privately held venture funds. At March 31, 2008,2010, the carrying value of such investments aggregated $1.7$1.2 million. These investments are inherently risky because these venture funds invest in companies that may still be in the development stage or depend on third parties for financing to support their ongoing operations. In addition, the markets for the technologies or products of these companies are typically in the early stages and may never develop. If these companies do not have adequate cash funding to support their operations, or if they encounter difficulties developing their technologies or products, the venture funds'funds’ investments in these companies may be impaired, which in turn, could result in impairment of our investment in these venture funds. For example, in fiscal 2007, we2009, the value of our non-controlling interest in privately held venture funds, declined resulting in a recorded a charge of $0.9 million relating to other-than-temporary decline in$0.4 million. The carrying value of these investments is based on quarterly statements we receive from the funds. The statements are generally received one quarter in arrears, as more timely valuations are not practical. The statements reflect the net asset value, which we use to determine the fair value for these investments, which (a) do not have a minority investment.readily determinable fair value and
25
(b) either have the attributes of an investment company or prepare their financial statements consistent with the measurement principles of an investment company. The assumptions we use due to lack of observable inputs may impact the fair value of these equity investments in future periods. While we have seen some improvement in global economic conditions, any adverse changes in equity investments and current market conditions may require us to record an impairment charge against all or a portion of the investments in the future. Such an action would adversely affect our financial results.
Changes in securities laws and regulations have increased and may continue to increase our costs. Changes in the laws and regulations affecting public companies, including the provisions of the Sarbanes-Oxley Act of 2002 and rules promulgated by the Securities and Exchange Commission,SEC, have increased and may continue to increase our expenses as we devote resources to respond to their requirements. In particular, we incurred additional administrative expense to implement Section 404 of the Sarbanes-Oxley Act, which requires management to report on, and our independent registered public accounting firm to attest to, the effectiveness of our internal control over financial reporting.
In addition, the NASDAQ Global Market, on which our common stock is listed, has also adopted comprehensive rules and regulations relating to corporate governance. These laws, rules and regulations have increased and may continue to increase the scope, complexity and cost of our corporate governance, reporting and disclosure practices. We also expect these developments may make it more difficult and more expensive for us to obtain director and officer liability insurance in the future, and we may be required to accept reduced coverage or incur substantially higher costs to obtain coverage. Further, our board members, Chief Executive Officer and Chief Financial Officer could face an increased risk of personal liability in connection with the performance of their duties. As a result, we may have difficultly attracting and retaining qualified board members and executive officers, which would adversely affect our business.
Internal control deficiencies or weaknesses that are not yet identified could emerge. Over time we may identify and correct deficiencies or weaknesses in our internal control over financial reporting and, where and when appropriate, report on the identification and correction of these deficiencies or weaknesses. However, the internal control procedures can provide only reasonable, and not absolute, assurance that deficiencies or weaknesses are identified. Deficiencies or weaknesses that are not yet identified could emerge, and the identification and corrections of these deficiencies or weaknesses could have a material impact on our results of operations.
Internal control issues that appear minor now may later become material weaknesses. We are required to publicly report on deficiencies or weaknesses in our internal control over financial reporting that meet a materiality standard as required by law and related regulations and interpretations. Management may, at a point in time, accurately categorize a deficiency or weakness as immaterial or minor and therefore not be required to publicly report such deficiency or weakness. Such determination, however, does not preclude a change in circumstances such that the deficiency or weakness could, at a later time, become a material weakness that could have a material impact on our results of operations.
We may encounter natural disasters, which could cause disruption to our employees or interrupt the manufacturing process for our products. Our operations could be subject to natural disasters and other business disruptions, which could seriously harm our revenues and financial condition and increase our costs and expenses. Our corporate headquarters are located in California, near major earthquake faults. Additionally, our primary wafer supplier, TSMC, is located in Taiwan, which has experienced significant earthquakes in the past. A severe earthquake could cause disruption to our employees or interrupt the manufacturing process, which could affect TSMC'sTSMC’s ability to supply wafers to us, which would negatively affect our business and financial results. The ultimate impact on us and our general infrastructure of being located near major earthquake faults is unknown, but our net revenues and financial condition and our costs and expenses could be significantly impacted in the event of a major earthquake.
Manmade problems such as computer viruses or terrorism may disrupt our operations and harm our operating results. Despite our implementation of network security measures, our servers are vulnerable to computer viruses, break-ins and similar disruptions from unauthorized tampering with our computer systems. Any such event could have an adverse effect on our business, operating results, and financial condition. In addition, the effects of war or acts of terrorism could have an adverse effect on our business, operating results, and financial condition. In addition, as a company with headquarters and significant operations located in the
United States, we may be impacted by actions against the United States. We are predominantly uninsured for losses and interruptions caused by terrorist acts and acts of war.
We may experience significant fluctuations in our stock price, which may, in turn, significantly affect the trading price of our convertible notes.price. Our stock has experienced substantial price volatility, particularly as a result of quarterly variations in our operating results, the published expectations of securities analysts and as a result of announcements by our competitors and us. In addition, the stock market has experienced significant price and volume fluctuations, particularly in recent months, that have affected the market price of many technology companies, in particular, and that have often been unrelatedrelated to the operating performance of such companies. In addition,extraordinary conditions in the price of our securities may also be affected by general global, economicbroader macroeconomic and market conditions and the cost of operations in one or more of our productfinancial markets. While we cannot predict the individual effect that these factors may have on the price or our securities, theseThese factors, either individually or in the aggregate, could result in significant variations in the price of our common stock during any given period of time. These fluctuations in our stock price also impact the price of our outstanding 3/4% Notes, and the likelihood of the 3/4% Notes being converted into our common stock.
Item 1B.Unresolved Staff Comments
Not applicable.
As of March 31, 2008,2010, we owned and leased various properties in the United States and in foreign countries totaling approximately 462,000270,000 square feet, of which approximately 238,000160,000 square feet were leased/subleased or available to lease/sublease to third parties. The building leases expire at varying dates through fiscal 20112014 and include renewals at our option. During fiscal 2010, we reduced our owned and leased properties by approximately 13% from the 309,000 square feet we owned or leased at March 31, 2009. During fiscal 2009, we reduced our owned and leased properties by approximately 33% from the 462,000 square feet we owned or leased at March 31, 2008. During fiscal 2008, we reduced our owned and leased properties by approximately 34% from the 701,000 square feet we owned or leased at March 31, 2007. During fiscal 2007, we reduced our ownedThese consolidation efforts include having certain facilities, located in California, Minnesota, North Carolina and leased property by 3% fromWashington, subleased or made available for sublease and closing or substantially downsizing operations in Florida, Bangalore, India, the 724,000 square feet we owned or leased at March 31, 2006.United Kingdom and Ireland.
Our headquartersprincipal executive offices are located in Milpitas, California which includesand include research and development, technical support, sales, marketing and administrative functions. In addition, we lease buildings in Florida, Minnesota, North CarolinaFoothill Ranch, California, and Washington.Orlando, Florida. We use these properties primarily for research and development, technical support, and sales and marketing functions. Internationally, we operate in Australia, England, Germany India, Ireland, Japan and Singapore.Japan. We use these properties primarily for research and development, technical design, technical support, sales and salesadministrative functions.
The table below is a summary of the facilities we owned and leased at March 31, 2008:
United States Other Countries Total --------------- --------------- ---------- (in square feet)Owned Facilities 104,000 (a) -- 104,000 Leased Facilities 302,000 (b) 56,000 (c) 358,000 --------------- --------------- ---------- Total Facilities 406,000 56,000 462,000 =============== =============== ==========
________________________2010:
(a)Approximately 30,000 square feet are available for lease.
| United States | Other Countries | Total | ||||||
| (in square feet) | ||||||||
Owned Facilities | 104,000 | (a) | — | 104,000 | ||||
Leased Facilities | 150,000 | (b) | 16,000 | (c) | 166,000 | |||
Total Facilities | 254,000 | 16,000 | 270,000 | |||||
(b) There are subleases on a portion of these facilities of approximately 158,000 square feet and approximately 43,000 square feet are available for lease.
| (a) | We lease approximately 27,000 square feet and approximately 17,000 square feet are available for lease. |
(c) Approximately 7,000 square feet are available for sublease.
| (b) | We sublease approximately 84,000 square feet and approximately 28,000 square feet are available for sublease. |
| (c) | Approximately 4,000 square feet are available for sublease. |
We do not separately track our major facilities by segments nor are the segments evaluated under the criteria. Substantiallyoperate in one segment; therefore, all of our facilities are managed at the properties are used at least in part by each of our segments and we retain the flexibility to use each of the properties in whole or in part for each of the segments.
corporate level. We believe our existing facilities and equipment are well maintained and in good operating condition, and we believe our facilities are sufficient to meet our needs for the foreseeable future. Our future facilities requirements will depend upon our business, and we believe additional space, if required, can be obtained on reasonable terms.
27
As part of the PMC Transaction, PMC-Sierra has agreed to assume the obligations for certain of our leased facilities, primarily related to our international sites, if the transaction is consummated. There can be no guarantee the PMC Transaction will be consummated or that PMC-Sierra will assume such leases.
We were previously subject to IRS audits for our fiscal years 1994 through 2003. During the third quarter of fiscal 2007, we reached resolution with the United States taxing authorities on all outstanding audit issues relating to those fiscal years. However, our tax provision continues to reflect judgment and estimation regarding components of the settlement such as interest calculations and the application of the settlements to state and local taxing jurisdictions. Although we believe our tax estimates are reasonable, the ultimate tax outcome may materially differ from the tax amounts recorded in our consolidated financial statements and may cause a higher effective tax rate that could materially affect our income tax provision, results of operations or cash flows in the period or periods for which such determination is made. The IRS is currently auditing our Federal income tax returns for the fiscal 2004 through 2006 audit cycle. We believe that we have provided sufficient tax provisions for these years and the ultimate outcome of the IRS audits will not have a material adverse impact on our financial position or results of operations in future periods. However, we cannot predict with certainty how these matters will be resolved and whether we will be required to make additional tax payments.
We are a party to other litigation matters and claims, including those related to intellectual property, which are normal in the course of our operations, and while the results of such litigation matters and claims cannot be predicted with certainty, we believe that the final outcome of such matters will not have a material adverse impact on our financial position or results of operations. However, because of the nature and inherent uncertainties of litigation, should the outcome of these actions be unfavorable, our business, financial condition, results of operations and cash flows could be materially and adversely affected.
In connection with our acquisitions of Snap Appliance Inc.,Aristos, and Eurologic Systems Group Limited, or Eurologic, Elipsan Limited, or Elipsan, and Platys Communications, Inc., or Platys, portionsa portion of the respective purchase priceprices and other future payments totaling $6.7 million, $3.8 million, $2.0$4.3 million and $15.0$3.8 million, respectively, were held back, which we refer to collectively as the Holdbacks, to secure potential indemnification obligations of Aristos and Eurologic stockholders for unknown liabilities that may have existed as of theeach acquisition dates. Asdate. The Aristos Holdback of March 31, 2008, the Eurologic Holdback balance$4.3 million was $1.5 million for previously asserted claims.paid in full in fiscal 2010. In fiscal 2007,2009, we resolved allthe remaining disputed, outstanding claims against the Snap ApplianceEurologic Holdback and the Platys Holdback. The Elipsan Holdbackby entering into a deed of $2.0 millionindemnity and a portionwritten settlement agreement with the representative of the Snap Appliance Holdback were paidEurologic stockholders, which resulted in an additional payment of $1.3 million. Our initial payment of $2.3 million to the Eurologic stockholders was recorded in fiscal 2006.2005. The remaining Eurologic Holdback balance of $0.2 million was retained by us and was recognized as a gain in fiscal 2009 in “Loss from discontinued operations, net of taxes” in the Consolidated Statements of Operations.
For an additional discussion of certain risks associated with legal proceedings, see "Risk Factors" in Item 1A“Item 1A: Risk Factors” of this report.Annual Report on Form 10-K.
Item 4.Submission of Matters to a Vote of Security HoldersRemoved and Reserved
No matters were submitted to a vote of our security holders, through the solicitation of proxies or otherwise, during the fourth quarter of fiscal 2008.
PART II
Item 5.Market for Registrant'sRegistrant’s Common Equity, Related Stockholder Matters and Issuer Purchases of Equity Securities
Market Information for Common Stock
Our common stock is currently traded on the NASDAQ Global Market under the symbol "ADPT."“ADPT.” The following table sets forth the high and low sales prices of our common stock for the periods indicated as reported by the NASDAQ Global Market. The market price of our common stock has been volatile. See "Risk Factors" in Item 1AFor an additional discussion, see “Item 1A: Risk Factors” of this report.Annual Report on Form 10-K.
Fiscal 2008 Fiscal 2007 -------------------- -------------------- High Low High Low --------- --------- --------- ---------First quarter $ 4.17 $ 3.60 $ 5.90 $ 4.08 Second quarter 3.93 3.23 4.66 3.80 Third quarter 3.95 3.15 4.79 4.22 Fourth quarter 3.42 2.34 4.75 3.45
| Fiscal 2010 | Fiscal 2009 | |||||||||||
| High | Low | High | Low | |||||||||
First quarter | $ | 3.00 | $ | 2.35 | $ | 3.40 | $ | 2.58 | ||||
Second quarter | 3.36 | 2.25 | 4.24 | 3.10 | ||||||||
Third quarter | 3.56 | 2.98 | 3.71 | 2.41 | ||||||||
Fourth quarter | 3.46 | 2.97 | 3.61 | 2.20 | ||||||||
As of May 30, 2008,12, 2010, there were approximately 583528 stockholders of record of our common stock.
Dividends
We have not declared or paid cash dividends on our common stock and do not expectstock. However, we remain committed to payproviding value to all of our stockholders, which may include paying cash dividends on our common stock in the foreseeable future. It is presently our policy to reinvest earnings for our business.
Issuer Purchases of Equity Securities
We did notIn July 2008, our Board of Directors authorized a stock repurchase anyprogram to purchase up to $40.0 million of our equity securitiescommon stock. No common stock repurchases occurred during the fourth quarter of fiscal 2008.2010. We have repurchased approximately $4.1 million in shares of our common stock in the open market through March 31, 2010. As of March 31, 2010, $35.9 million remained available for repurchase under the authorized stock repurchase program.
In the fourth quarter of fiscal 2010, we withheld less than 0.1 million shares to cover the applicable taxes, relating to the vesting of shares of restricted stock. The average price per share of the shares withheld was $3.36. The shares withheld for tax purposes are not considered common stock repurchases under our authorized plan.
29
Stock Performance Graph
The following graph compares the cumulative total stockholder return of our common stock to the NASDAQ Composite Index and the NASDAQ Computer and Data Processing Index. The graph assumes that $100 was invested on March 31, 20032005 and its relative performance was tracked through March 31, 20082010 in our common stock and in each index, and that all dividends paid were reinvested. These indices, which reflect formulas for dividend reinvestment and weighting of individual stocks, do not necessarily reflect returns that could be achieved by an individual investor. Notwithstanding anything to the contrary set forth in any of our previous or future filings under the Securities Act of 1933 or the Securities Exchange Act of 1934 that might incorporate this Annual Report or future filings made by us under those statutes, the stock price performance graph is not considered "soliciting“soliciting material,"” is not deemed "filed"“filed” with the SEC and is not deemed to be incorporated by reference into any of those prior filings or into any future filings made by us under those statues.

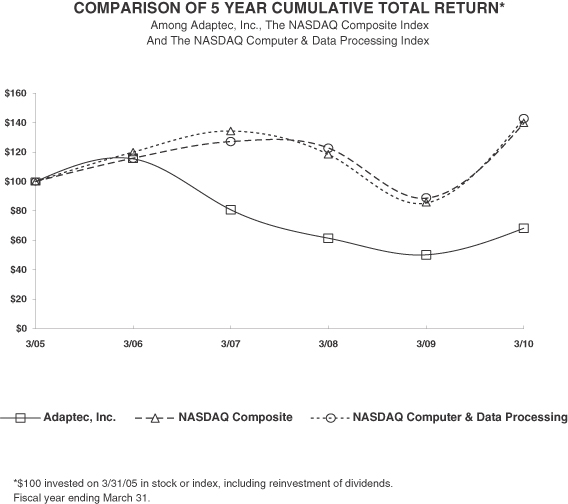
3/31/03 3/31/04 3/31/05 3/31/06 3/31/07 3/31/08 Adaptec, Inc. 100.00 145.27 79.44 91.71 64.18 48.76 NASDAQ Composite 100.00 151.01 152.38 181.06 189.63 177.49 NASDAQ Computer & Data Processing 100.00 124.00 134.00 156.97 171.51 164.93
| 3/31/05 | 3/31/06 | 3/31/07 | 3/31/08 | 3/31/09 | 3/31/10 | |||||||
Adaptec, Inc. | 100.00 | 115.45 | 80.79 | 61.38 | 50.10 | 68.27 | ||||||
NASDAQ Composite | 100.00 | 119.97 | 134.27 | 118.46 | 85.30 | 142.80 | ||||||
NASDAQ Computer & Data Processing | 100.00 | 115.84 | 127.08 | 122.78 | 88.71 | 139.53 |
The stock price performance included in this graph is not necessarily indicative of future stock price performance.
Item 6.Selected Financial Data
The following selected financial information has been derived from the audited consolidated financial statements.Consolidated Financial Statements. The information set forth below is not necessarily indicative of results of future operations and should be read in conjunction with "Management's“Management’s Discussion and Analysis of Financial Condition and Results of Operations"Operations” and the audited consolidated financial statementsConsolidated Financial Statements and related notes included elsewhere in this Annual Report on Form 10-K. We completed the sale to IBM of our IBM i/p Series RAID business in September 2005, and sold the OEM block-based portion of our systems business to Sanmina-SCI Corporation and its wholly owned subsidiary, Sanmina-SCI USA, Inc. in January 2006.2006 and sold the Snap Server NAS portion of our former SSG segment, or the Snap Server NAS business, to Overland Storage, Inc., or Overland, in June 2008. The information below has been reclassified to reflect the IBM i/p Series RAID business, and the OEM block-based portion of our systems business and the Snap Server NAS business as discontinued operations.
Years Ended March 31, --------------------------------------------------------------- 2008(2)(3) 2007(2)(4) 2006(2)(5) 2005(2)(6) 2004(2)(7) ----------- ----------- ----------- ----------- -----------(in thousands, except per share amounts)Consolidated Statements of Operations Data:Net revenues(1) $ 167,400 $ 255,208 $ 344,142 $ 402,516 $ 395,688 Cost of revenues(1) 104,927 173,974 230,249 240,314 209,268 ----------- ----------- ----------- ----------- ----------- Gross profit 62,473 81,234 113,893 162,202 186,420 ----------- ----------- ----------- ----------- ----------- Total operating expenses(1) 102,950 142,305 262,424 244,202 196,014 Income (loss) from continuing operations (10,094) 24,846 (135,832) (129,645) 78,207 Loss from discontinued operations, net of taxes -- (546) (22,410) (15,461) (15,300) Income from disposal of discontinued operations, net of taxes 479 6,543 9,810 -- -- Net income (loss) $ (9,615) $ 30,843 $ (148,432) $ (145,106) $ 62,907Net Income (Loss) Per Share Data:Basic: Continuing operations $ (0.09) $ 0.21 $ (1.20) $ (1.17) $ 0.72 Discontinued operations $ 0.00 $ 0.05 $ (0.11) $ (0.14) $ (0.14) Net income (loss) $ (0.08) $ 0.26 $ (1.31) $ (1.31) $ 0.58 Diluted: Continuing operations $ (0.09) $ 0.20 $ (1.20) $ (1.17) $ 0.65 Discontinued operations $ 0.00 $ 0.04 $ (0.11) $ (0.14) $ (0.12) Net income (loss) $ (0.08) $ 0.25 $ (1.31) $ (1.31) $ 0.53 Shares used in computing net income (loss) per share: Basic 118,613 116,602 113,405 110,798 108,656 Diluted 118,613 136,690 113,405 110,798 128,807March 31, --------------------------------------------------------------- 2008(2)(3) 2007(2)(4) 2006(2)(5) 2005(2)(6) 2004(2)(7) ----------- ----------- ----------- ----------- -----------(in thousands)Consolidated Balance Sheets Data:Cash, cash equivalents and marketable securities $ 626,216 $ 572,423 $ 556,552 $ 526,556 $ 663,854 Restricted cash and marketable securities 1,670 3,244 4,749 6,381 9,161 Net assets of discontinued operations -- -- -- 55,774 -- Total assets 700,087 715,402 737,399 963,506 1,051,104 Long-term liabilities 19,231 228,009 229,349 263,664 263,852 Stockholders' equity 424,096 422,158 369,445 510,323 644,891 Working capital 424,663 616,033 522,039 507,122 715,228
________________________
| Fiscal Years Ended March 31, | ||||||||||||||||||||
| 2010(2)(3) | 2009(2)(4) | 2008(2)(5) | 2007(2)(6) | 2006(2)(7) | ||||||||||||||||
| (in thousands, except per share amounts) | ||||||||||||||||||||
Consolidated Statements of Operations Data: | ||||||||||||||||||||
Net revenues(1) | $ | 73,682 | $ | 114,774 | $ | 145,501 | $ | 227,148 | $ | 310,145 | ||||||||||
Cost of revenues (inclusive of amortization of acquisition-related intangible assets)(1) | 40,288 | 65,413 | 88,925 | 150,759 | 201,876 | |||||||||||||||
Gross profit(1) | 33,394 | 49,361 | 56,576 | 76,389 | 108,269 | |||||||||||||||
Total operating expenses(1) | 64,994 | 85,721 | 89,612 | 115,290 | 235,906 | |||||||||||||||
Income (loss) from continuing operations, net of taxes | (18,670 | ) | (13,976 | ) | (5,372 | ) | 42,688 | (114,938 | ) | |||||||||||
Loss from discontinued operations, net of taxes | — | (941 | ) | (4,722 | ) | (18,388 | ) | (43,304 | ) | |||||||||||
Gain on disposal of discontinued operations, net of taxes | 1,236 | 4,727 | 479 | 6,543 | 9,810 | |||||||||||||||
Net income (loss) | $ | (17,434 | ) | $ | (10,190 | ) | $ | (9,615 | ) | $ | 30,843 | $ | (148,432 | ) | ||||||
Income (Loss) Per Share Data: | ||||||||||||||||||||
Basic: | ||||||||||||||||||||
Continuing operations | $ | (0.16 | ) | $ | (0.12 | ) | $ | (0.05 | ) | $ | 0.37 | $ | (1.01 | ) | ||||||
Discontinued operations | $ | 0.01 | $ | 0.03 | $ | (0.04 | ) | $ | (0.10 | ) | $ | (0.30 | ) | |||||||
Net income (loss) | $ | (0.15 | ) | $ | (0.09 | ) | $ | (0.08 | ) | $ | 0.26 | $ | (1.31 | ) | ||||||
Diluted: | ||||||||||||||||||||
Continuing operations | $ | (0.16 | ) | $ | (0.12 | ) | $ | (0.05 | ) | $ | 0.33 | $ | (1.01 | ) | ||||||
Discontinued operations | $ | 0.01 | $ | 0.03 | $ | (0.04 | ) | $ | (0.09 | ) | $ | (0.30 | ) | |||||||
Net income (loss) | $ | (0.15 | ) | $ | (0.09 | ) | $ | (0.08 | ) | $ | 0.25 | $ | (1.31 | ) | ||||||
Shares used in computing income (loss) per share: | ||||||||||||||||||||
Basic | 119,196 | 119,767 | 118,613 | 116,602 | 113,405 | |||||||||||||||
Diluted | 119,196 | 119,767 | 118,613 | 136,690 | 113,405 | |||||||||||||||
| March 31, | ||||||||||||||||||||
| 2010(3) | 2009(4) | 2008(5) | 2007(6) | 2006(7) | ||||||||||||||||
| (in thousands) | ||||||||||||||||||||
Consolidated Balance Sheets Data: | ||||||||||||||||||||
Cash, cash equivalents and marketable securities(8) | $ | 375,347 | $ | 376,592 | $ | 626,216 | $ | 572,423 | $ | 556,552 | ||||||||||
Restricted cash and marketable securities | — | — | 1,670 | 3,244 | 4,749 | |||||||||||||||
Total assets | 429,076 | 450,107 | 700,087 | 715,402 | 737,399 | |||||||||||||||
Long-term liabilities(8) | 9,568 | 14,974 | 19,231 | 228,009 | 229,349 | |||||||||||||||
Stockholders’ equity | 397,703 | 410,880 | 424,096 | 422,158 | 369,445 | |||||||||||||||
Working capital(8) | 377,035 | 385,219 | 424,663 | 616,033 | 522,039 | |||||||||||||||
31
Notes:
(1) Prior period consolidated financial statements have been reclassified to the current period presentation. The reclassifications for discontinued operations had no impact on net income (loss), total assets or total stockholders' equity.
| (1) | Prior period information has been reclassified to conform to the current period presentation. The reclassifications for discontinued operations had no impact on net income (loss), total assets or total stockholders’ equity. |
The following actions affect the comparability of the data for the periods presented in the above table:
(2) We completed a total of five acquisitions in fiscal years 2005 and 2004 and recorded write-offs of acquired in-process technologies for the Snap Appliance and Elipsan acquisitions of $2.2 million and $4.0 million in fiscal 2005 and 2004, respectively. We recorded restructuring charges in fiscal years 2008, 2007, 2006, 2005 and 2004 (see Note 10
| (2) | We completed the acquisition of Aristos in fiscal 2009 (see Note 2 to the Consolidated Financial Statements). We recorded restructuring charges in fiscal years 2010, 2009, 2008, 2007 and 2006 (see Note 11 to the Consolidated Financial Statements) of $1.6 million, $6.1 million, $6.3 million, $3.7 million and $10.4 |
| (3) | In fiscal 2010, we (i) recorded stock-based compensation expense of $5.8 million, of which $1.6 million related to the modification of certain stock-based awards (see Note 9 to the Consolidated Financial Statements), (ii) received $0.9 million as part of a class action suit (see Note 13 to the Consolidated Financial Statements), (iii) $0.4 from the sale of an investment in a non-controlling interest of a non-public company (see Note 13 to the Consolidated Financial Statements) and (iv) recorded a gain of $1.2 million on the sale of the Snap Server NAS business (see Note 3 to the Consolidated Financial Statements). |
| (4) | In fiscal 2009, we (i) recorded an impairment charge of $16.9 million to write-off goodwill (see Note 7 to the Consolidated Financial Statements), (ii) recorded stock-based compensation of $3.2 million (see Note 9 to the Consolidated Financial Statements), (iii) recorded a gain of $2.3 million on the sale of marketable equity securities (see Note 13 to the Consolidated Financial Statements), (iv) recorded a gain of $1.7 million on the repurchase of our 3/4% Convertible Senior Notes due 2023, or 3/4% Notes on the open market (see Note 13 to the Consolidated Financial Statements), (v) recorded a gain of $4.6 million on the sale of the Snap Server NAS business (see Note 3 to the Consolidated Financial Statements) and (vi) recorded a tax benefit arising from the resolution of tax disputes and the adjustment of taxes due in a prior period (see Note 14 to the Consolidated Financial Statements). |
| (5) | In fiscal 2008, we (i) recorded a gain of $6.7 million on the sale of certain properties (see Note 12 to the Consolidated Financial Statements), (ii) recorded stock-based compensation of $6.0 million (see Note 9 to the Consolidated Financial Statements), (iii) realized a gain of $1.6 million on the sale of a marketable debt security in a foreign entity that was obtained as part of a fiscal 2004 acquisition and (iv) wrote off intangible assets of $2.2 million (see Notes 7 and 12 to the Consolidated Financial Statements). |
| (6) | In fiscal 2007, we (i) recorded stock-based compensation of $7.6 million, (ii) wrote down an investment of $0.9 million and (iii) received a discrete tax benefit of $60.2 million primarily attributable to the settlement of certain tax disputes with the United States and Singapore taxing authorities, which included the resolution of our fiscal 1997 U.S. Tax Court Litigation settlement and our fiscal 2002 and fiscal 2003 IRS audit cycles. |
| (7) | In fiscal 2006, we recorded (i) an impairment charge of $90.6 million to write-off goodwill, (ii) a loss on disposal of assets of $1.6 million, (iii) a gain of $12.1 million on the sale of the OEM block-based systems business and (iv) a loss of $2.3 million on the sale of the IBM i/p Series RAID business. |
| (8) | In fiscal 2008, we reclassified our 3/4% Notes of $225.3 million from long-term liabilities to current liabilities. In fiscal 2009, we utilized cash to pay off substantially all of this debt, in the amount of $222.9 million (see Note 8 to the Consolidated Financial Statements). In addition, we paid approximately $38.0 million to acquire Aristos in fiscal 2009 (see Note 2 to the Consolidated Financial Statements). |
(3) In fiscal 2008, we (i) recorded a gain of $6.7 million on the sale of certain properties (see Note 11 to the Consolidated Financial Statements), (ii) recorded stock-based compensation in accordance with SFAS No. 123(R) of $6.6 million (see Note 8 to the Consolidated Financial Statements), (iii) realized a gain of $1.6 million on the sale of a marketable debt security in a foreign entity that was obtained as part of a fiscal 2004 acquisition, (iv) wrote down intangible assets (see Note 5 to the Consolidated Financial Statements) by $2.4 million, (v) recorded income from the disposal of discontinued operations (see Note 2 to the Consolidated Financial Statements) of $0.5 million and (vi) recorded a tax benefit of $2.7 million.
(4) In fiscal 2007, we (i) recorded an impairment charge of $13.2 million related to the Snap server portion of our systems business (see Note 5 to the Consolidated Financial Statements), (ii) recorded stock-based compensation in accordance with SFAS No. 123(R) of $8.5 million (see Note 8 to the Consolidated Financial Statements), (iii) recorded a write-down of a minority investment of $0.9 million (see Note 11 to the Consolidated Financial Statements), and (iv) received a discrete tax benefit of $60.2 million primarily attributable to the settlement of certain tax disputes with the United States and Singapore taxing authorities, which included the resolution of our fiscal 1997 U.S. Tax Court Litigation settlement for our fiscal 2002 and fiscal 2003 IRS audit cycles.
(5) In fiscal 2006, we recorded (i) an impairment charge of $90.6 million to write-off goodwill (see Note 5 to the Consolidated Financial Statements), (ii) an impairment charge of $10.0 million to write-down the systems business' long-lived assets to fair value (see Note 2 to the Consolidated Financial Statements), (iii) a loss on disposal of assets of $1.6 million (see Note 11 to the Consolidated Financial Statements), and (iv) a gain of $12.1 million on the sale of the OEM block-based systems business (see Note 2 to the Consolidated Financial Statements).
(6) In fiscal 2005, we (i) recorded an impairment charge of $52.3 million to reduce goodwill related to our former Channel segment, (ii) recorded a gain of $2.8 million on the sale of certain properties, (iii) recorded charges of $0.9 million and $1.6 million for severance, benefits, loss on the sale of property and equipment and legal fees associated with the strategic alliances entered into with ServerEngines and Vitesse, respectively, (iv) made a payment of $1.7 million to NSE in the form of a license fee, (v) received a tax benefit from the settlement of disputes with the United States taxing authorities, (vi) incurred $17.6 million in tax expense and a $4.5 million loss on marketable securities associated with the repatriation of $360.6 million in cash from our Singapore subsidiary and (vii) recorded a valuation allowance for deferred tax assets of $67.9 million.
(7) In fiscal 2004, we recorded (i) a gain of $49.3 million related to the settlement with the former president of Distributed Processing Technology Corporation, or DPT, (ii) a reduction in the deferred tax asset valuation allowance of $21.6 million, (iii) a $6.0 million impairment charge, and (iv) a reduction of previously accrued tax related liabilities of $6.3 million.
Item 7.Management'sManagement’s Discussion and Analysis of Financial Condition and Results of Operations
This "Management's“Management’s Discussion and Analysis of Financial Condition and Results of Operations"Operations” section should be read in conjunction with the other sections of this Annual Report on Form 10-K, including "Item“Item 1: Business"Business”; "Item“Item 6: Selected Financial Data"Data”; and "Item“Item 8: Financial Statements and Supplementary Data."” This section containsincludes forward-looking statements within the meaning of Section 27A of the Securities Act, and Section 21E of the Exchange Act. Forward-looking statements such as “will,” “believe,” “are projected to be” and similar expressions are statements regarding future events or our future performance, and include statements regarding projected operating results. These forward-looking statements are based on current expectations, beliefs, intentions, strategies, forecasts and assumptions and involve a number of risks and uncertainties that could cause actual results to differ materially from those anticipated by these forward-looking statements, including statements regarding our expectations, beliefs, intentions or strategies regarding our business, including,statements. These risks include, but are not limited to: completion of the PMC Transaction discussed elsewhere in this Annual Report on Form 10-K; the ability of our operations to maximize the value of our anticipatedRAID technology business and non-core patents; our ability to deploy our capital in a manner that maximizes stockholder value; general economic conditions; revenue received from our current operations; declines in revenues from our parallel SCSI products and our SATA products sold to our OEM customers, the possibility that we might enter into strategic alliances, partnerships or acquisitions in order to scale our business, the expected impact on our future revenues and the timing of such impact, of ourconsumer spending; failure to receive design wins for the next generation serial products from a significant customer, the amount by which we expectachieve our operational objectives; ability to reduce our annual operating expenses duecosts; support from the contract manufacturers to which we have outsourced manufacturing, assembly and packaging of our fiscal 2008 restructuring plansproducts; our ability to launch new products and potential failure of anticipated long-term benefits from new products to materialize; difficulty in forecasting the volume and timing of customer orders; reduced demand in the server, network storage and desktop computer markets; our expected capital expenditurestarget markets’ failure to accept, or delay in accepting, network storage and liquidityother advanced storage solutions, including our MaxIQ SSD Cache Performance Solution, SCSI, SAS, SATA and iSCSI lines of products; the performance of our products; decline in future periods.consumer acceptance of our current products; the timing and volume of orders by OEM customers for storage products; our ability to control and manage costs associated with the delivery of new products; and the adverse effects of the intense competition we face in our business. These forward-looking statements are based on our current expectations and could be affected by the uncertainties and risk factors described throughout this filing and particularly in the "Risk Factors"“Risk Factors” set forth in Part I, Item 1A of this Annual Report on Form 10-K. As a result, our actual results may differ materially from those anticipated in these forward-looking statements.
Basis of Presentation
In September 2008, we acquired Aristos, a provider of RAID technology to the data storage industry, pursuant to an agreement and plan of merger by and among Adaptec, Aristos, Ariel Acquisition Corp., a wholly owned subsidiary of ours, and TPG Ventures, L.P., solely in its capacity as the representative of stockholders of Aristos. We decidedrefer to retainthe agreement and plan of merger with Aristos in this Annual Report on Form 10-K as the Merger Agreement. The Merger Agreement provided for our acquisition of Aristos through a merger in which Aristos became our wholly-owned subsidiary. The Aristos acquisition was accounted for as a purchase business combination and, accordingly, the results of Aristos have been included in our consolidated results of operation and financial position from the date of acquisition.
In June 2008, we sold the Snap Server portion of our systemsNAS business and terminated our efforts to sell this business, effective at the end of the first quarter of fiscal 2007.Overland. Accordingly, we reclassified the financial statements and related disclosures for all periods presented to reflect (1) the Snap Server portion of the systemsthis business back to continuing operations and (2) the IBM i/p Series RAID business, sold to IBM in September 2005, and the OEM block-based portion of the systems business, sold to Sanmina-SCI Corporation and its wholly owned subsidiary, Sanmina-SCI USA, in January 2006, as discontinued operations. These reclassifications had no impact on net income (loss),loss, total assets or total stockholders'stockholders’ equity. Unless otherwise indicated, the following discussion pertains only to our continuing operations.
In addition, since the sale of our Snap Server NAS business in June 2008, we revisedhave operated in one segment. We currently provide data protection storage products and currently sell a broad range of our internal reporting structure in the first quarter of fiscal 2008 bystorage technologies, including the remaining SCSI products from our previous DSG segment into our DPS segment as we wound down the DSG business throughout fiscal 2007 and exited it at March 31, 2007. The remainder of the DSG segment was included in the "Other" category, as it represents a reconciling item to our consolidated results of operations. We decided not to invest further in our DSG segment due to OEMs incorporating other connectivity technologies directly into their products, the increased level of competition entering the market and the complexities of the retail channel. Our DSG segment provided high-performanceASICs, board-level I/O connectivity and digital media products for personal computing platforms, including notebookRAID controllers, and desktop PCs, which were sold to retailers, OEMs and distributors. We also identified a new segment, SSG, in the first quarter of fiscal 2007 as a result of retaining the Snap Server portion of the systems business. Our SSG segment provides Snap Server storage systems for storage and protection of file (NAS) and block (iSCSI) data, as well as related backup, replication, snapshot, and management software. We sell these products directly to OEMs, ODMs that supply OEMs, system integrators, VARs and end users through our network of distribution partners, solution providers, e-tailers and VARs.reseller channels. We consider all of our products to be similar in nature and function.
Overview
In December 2009, we announced the retention of Blackstone Advisory Partners L.P. to serve as our exclusive financial advisor relating to a potential sale or disposition of certain of our assets or business
33
operations. On May 8, 2010, subsequent to our fiscal year-end, we entered into an Asset Purchase Agreement with PMC-Sierra for the sale of certain assets and for PMC-Sierra to assume certain liabilities related to our business of providing data storage hardware and software solutions and products including ASICs, HBAs, RAID controllers, Adaptec RAID software, ARC, storage management software including ASM, option ROM BIOS, CLI, storage virtualization software, and other solutions that span SCSI, SAS, and SATA interface technologies, and that optimize the performance of both hard disk and solid state drives, for a purchase price of approximately $34 million. In this Annual Report on Form 10-K, we refer to the transactions contemplated by the Asset Purchase Agreement with PMC-Sierra as the PMC Transaction. We also implemented two restructuring plansanticipate that the PMC Transaction will be consummated in fiscal 2008: (1)June 2010. As we continue to proceed with certain specific and other customary closing conditions necessary to consummate the PMC Transaction, we remain committed to providing service and support for our existing customers and end-users. Whether or not the PMC Transaction is consummated, our revenues may be negatively impacted during this pre-closing period as the transaction creates uncertainty in the first quarter,marketplace for our existing customers and end-users, who may be less likely to place orders with us as a result of this uncertainty.
Assuming the PMC Transaction is consummated, we intend to explore all strategic alternatives to maximize stockholder value going forward, including deploying the proceeds of the PMC Transaction and our other assets in seeking business acquisition opportunities and other actions to redeploy our capital. Additionally, we will, as previously announced, continue to consider our options related to our Aristos products, as well as our other remaining operating assets, including non-core patents and real estate holdings. With respect to our Aristos products, options that we may consider include (i) ceasing to invest additional funds in our Aristos products, winding-down the sale of our Aristos products and fulfilling our remaining contractual obligations with our existing customers, which we would expect to be completed in six months, or by eliminating duplicative resourcesSeptember 2010, or (ii) seeking to reducesell the assets related to our operating expensesAristos products to a third party. We will also explore alternatives for maximizing the value of our non-core patent portfolio and remaining real estate assets. Following and assuming the consummation of the PMC Transaction, we remain committed to providing value to all of our stockholders and will aggressively pursue opportunities to deploy the significant cash and liquid assets on hand to create value for our stockholders, including exploring opportunities to deploy this cash and liquid assets to make acquisitions of businesses that will maximize stockholder value and/or engaging in stock buybacks and cash dividends. Going forward our business is expected to consist of capital redeployment and identification of new, profitable business operations in which we can utilize our existing working capital and maximize the use of our NOLs.
If we consummate the PMC Transaction discussed above, we may incur significant charges in the future, which charges include, but are not limited to, increased amortization or depreciation of our long-lived assets due to a declining revenue basepotential changes to the expected remaining useful lives, potential impairment of our long-lived assets, restructuring charges, acceleration of compensation expense related to unvested stock-based awards, potential cash bonus payments and (2) beginning in the second quarter, by reducingpotential accelerated payments of certain of our workforce by approximately 20% in an effort to better align our cost structure with our anticipated revenue stream and to improvecontractual obligations, which may impact our results of operations and cash flows.
Overviewfinancial condition. The aggregate of these amounts cannot be quantified at this time. Further subsequent event disclosures related to expected changes to the remaining useful lives of our long-lived assets, stock-based activity and associated compensation expense, and restructuring charges are discussed in Note 7, 9 and 11, respectively, to the Consolidated Financial Statements.
In fiscal 2008,2010, our net revenues decreased 34%36% as compared to fiscal 2007 primarily2009 due to the declining revenue basea decrease in revenues associated with our legacy products of $49.8 million, which included our parallel SCSI products and our serial legacy products sold primarily to OEM customers, offset by an increase in sales volumes of our parallel products. Our net revenues were further impacted by our inability to obtain design wins from our OEM customers, primarily for our next generationnewer serial products.products, including data center data conditioning features, of $8.7 million. We expect revenues from our parallel SCSI products and our serial legacy products sold to OEM customers to continue to decline in fiscal 2009.future quarters, regardless of whether the PMC Transaction is consummated. Our gross marginsmargin in fiscal 20082010 improved to 37%45% compared to 32%43% in fiscal 20072009, primarily due to favorable pricing negotiations with our suppliers, efficiencies gained with our contract manufacturer and improved standard product contributions due to favorable customer mixes and lower inventory-related charges, offset by our lower sales volume over which was a resultour fixed costs were distributed. Operating expenses decreased in fiscal 2010 as compared to fiscal 2009 primarily due to the impairment charge of $16.9 million to write-off goodwill in fiscal 2009, our continued focus on improving product component costs.cost reductions, including temporary reductions in employees’ compensation in fiscal 2010, reductions in outside service providers, and
restructuring efforts implemented in fiscal years 2010 and 2009. This was partially offset by certain manufacturing-related costs that are relatively fixed being spread over a smaller revenue base. Operating expenses decreasedemployee retention obligations of $0.7 million and higher stock-based compensation expense of $2.6 million primarily due to the modification of certain stock-based awards of $1.6 million in fiscal 20082010, which included modifications of $0.9 million related to the separation agreement with Subramanian Sundaresh, our former CEO, a fiscal 2010 expense related to guaranteed cash payments of $1.6 million associated with the execution of the separation and consulting service agreements with Mr. Sundaresh, professional fees of $1.2 million incurred in fiscal 2010 related to our response to the consent solicitation initiated by Steel Partners II, L.P., Steel Partners Holdings L.P., Steel Partners LLC, Steel Partners II GP LLC, Warren Lichtenstein, Jack L. Howard, and John J. Quicke, collectively referred to in this Annual Report on Form 10-K as comparedthe Steel Group, on September 4, 2009 seeking stockholder approval on three proposals relating to fiscal 2007 primarily as a result of cost reductionsour bylaws and restructuring efforts that were initiated in previous quarters combined with additional attrition in our workforce.
Our future revenue growth in our DPS segment is largely dependent on the successcomposition of our new products addressing unified serial technologiesBoard of Directors and growing our market sharea charge recorded in fiscal 2010 for the channel. We currently depend on a small numberreimbursement of large OEM customers$0.7 million related to professional fees that the Steel Group incurred for a significant portion of our revenues, and we have been unsuccessful in obtaining designs wins from these customers. We have evaluated this portion of our business, and we are no longer pursuing future business from large OEM customers with our current product portfolio, as we believe the future growth opportunities for our current products are limited. As a result, we expect the revenues obtained from large OEM customers to decline significantly in future periods. Since the growth of our new generation of serial products is not keeping pace with the decline in revenues from our parallel products and from our OEM customers, we may seek growth opportunities in this market beyond those presented by our existing product lines by entering into strategic alliances, partnerships or acquisitions in order to scale our business. This includes both strengthening our partnerships in silicon-based technology and broadening our silicon-based intellectual property to improve our business opportunities. Our future revenue growth in our SSG segment remains largely dependent on the successful development and marketing of new products and our ability to expand our presence in the reseller channel. We also continue to review and evaluate our existing product portfolio, operating structure and markets to determine the future viability of our existing products and market positions.consent solicitation.
Results of Operations
The following table sets forth the items in the Consolidated Statements of Operations as a percentage of net revenues:
Years Ended March 31, ---------------------------------------- 2008 2007 2006 ------------ ------------ ------------
Years Ended March 31, 2010 2009 2008 Net revenues
100 % 100 % 100 % Cost of revenues (inclusive of amortization of acquisition-related intangible assets)
55 57 61 Gross margin
45 43 39 Operating expenses:
Research and development
40 23 23 Selling, marketing and administrative
44 30 35 Amortization of acquisition-related intangible assets
2 1 2 Restructuring charges
2 5 4 Goodwill impairment
— 15 — Other gains, net
— — (2 ) Total operating expenses
88 74 62 Loss from continuing operations
(43 ) (31 ) (23 ) Interest and other income, net
14 18 22 Interest expense
(0 ) (1 ) (3 ) Loss from continuing operations before income taxes
(29 ) (14 ) (4 ) Benefit from (provision for) income taxes
3 2 (0 ) Income (loss) from continuing operations, net of taxes
(26 ) (12 ) (4 ) Discontinued operations, net of taxes:
Loss from discontinued operations, net of taxes
— (1 ) (3 ) Gain on disposal of discontinued operations, net of taxes
2 4 0 Income (loss) from discontinued operations, net of taxes
2 3 (3 ) Net loss
(24 )% (9 )% (7 )% Net Revenues.
FY2010 Percentage
ChangeFY2009 Percentage
ChangeFY2008 (in millions, except percentage) Net revenues
$ 73.7 (36 )% $ 114.8 (21 )% $ 145.5 35
Net revenues
100 % 100 % 100 % Cost of revenues 63 68 67 ------------ ------------ ------------ Gross profit 37 32 33 ------------ ------------ ------------ Operating expenses: Research and development 24 22 20 Selling, marketing and administrative 34 24 21 Amortization of acquisition-related intangible assets 2 2 3 Restructuring charges 3 2 3 Goodwill impairment -- -- 26 Other charges (gains) (2) 6 3 ------------ ------------ ------------ Total operating expenses 61 56 76 ------------ ------------ ------------ Loss from continuing operations (24) (24) (43) Interest and other income 18 10 5 Interest expense (2) (1) (1) ------------ ------------ ------------ Loss from continuing operations before income taxes (8) (15) (39) Benefit from income taxes (2) (25) -- ------------ ------------ ------------ Income (loss) from continuing operations (6) 10 (39) ------------ ------------ ------------ Discontinued operations, net of taxes: Income (loss) from discontinued operations, net of taxes -- -- (7) Income from disposal of discontinued operations, net of taxes 0 2 3 ------------ ------------ ------------ Income (loss) from discontinued operations, net of taxes 0 2 (4) ------------ ------------ ------------ Net income (loss) (6)% 12 % (43)% ============ ============ ============
________________________
Net Revenues
The following table sets forth our net revenuesdecreased by segment:
Percentage Percentage FY2008 Change FY2007 Change FY2006 ------------ ---------- --------- ---------- --------- (in millions, except percentage)DPS $ 145.1 (32)% $ 214.5 (24)% $ 283.1 SSG 22.3 (20)% 28.1 (17)% 33.9 OTHER -- (100)% 12.6 (53)% 27.1 ------------ --------- ---------Total Net Revenues $ 167.4 (34)% $ 255.2 (26)% $ 344.1============ ========= =========
Fiscal 2008$41.1 million in fiscal 2010 compared to Fiscal 2007fiscal 2009, due to a decline in sales volume of our legacy products, which primarily included our parallel SCSI products and our serial products sold to OEM customers, of $49.8 million, offset by an increase in sales volumes of our newer serial products, including data center data conditioning features, of $8.7 million.
Net revenues from our DPS segment decreased by $69.4$30.7 million in fiscal 20082009 compared to fiscal 2007,2008, primarily due to a decline in sales volume of our parallel SCSI products of $52.3$27.5 million and aan overall decline in our other parallel products of $26.2 million and, to a lesser extent, a decline of $18.3 million in sales volume of our legacy SATAserial products sold primarily to OEM customers.customers of $9.3 million. This was partially offset by an increase in average selling prices and sales volumes of our unified serial products sold to channel customers of $27.8 million. $6.9 million, due to increased acceptance of these products.
The decline in sales volumesvolume of our parallel SCSI products was primarily attributable to the industry transition from parallel to serial products, in which we have a lower market share. The decline in sales volume of our serial legacy products sold to OEM customers was primarily attributable to the fact that certain OEM customers have moved to other suppliers to obtain the next generation serial technologies. We expect net revenues for our parallel SCSI products to continue to decline. In addition, we expect net revenues forand our SATAserial legacy products sold to our OEM customers to continue to decline as certain of our customers have moved to other suppliers to obtain next - -generation SATA technologies. We also expect a significant negative impact on our net revenues from our unified serial products in future quarters, regardless of whether the PMC Transaction is consummated.
Geographical Revenues and Customer Concentration
| Years Ended March 31, | |||||||||
Geographical Revenues: | 2010 | 2009 | 2008 | ||||||
North America | 40 | % | 35 | % | 37 | % | |||
Europe | 33 | % | 32 | % | 29 | % | |||
Pacific Rim | 27 | % | 33 | % | 34 | % | |||
Total Revenues | 100 | % | 100 | % | 100 | % | |||
Our Pacific Rim revenues decreased as a significantpercentage of our total revenues by 6% in fiscal 2010 compared to fiscal 2009 primarily due to a decline in revenues from IBM, our largest customer, notified uswho purchased products primarily in the second quarter ofthis region. IBM revenues declined in fiscal 2008 that2010 compared to fiscal 2009, as we did not receive design wins for our nexttheir current generation serial products.
Net revenues from our SSG segment decreased by $5.8million in fiscal 2008 compared to fiscal 2007 primarily due to a decline in unit sales of our server products. Although we launched new storage server products in the second quarter of fiscal 2008, the sales ofWe expect our storage server products were negatively impacted by competitive market conditions and reductions to our inventory levels from our channel partners.
Fiscal 2007 compared to Fiscal 2006
Net revenues from our DPS segment decreased by $66.3 million in fiscal 2007 as compared to fiscal 2006, reflecting a 37% decline in sales volumes of our parallel SCSI products, which was partially offset by a 34% increase in sales of our serial products. The decline in sales volumes of our SCSI products was primarily attributable to the transition from parallel to serial products, in which we have a lower market share, and a continuing shift to lower-priced SATA solutions, in which there is a more competitive market. Sales of our parallel SCSI products represented 61% of the total DPS sales in fiscal 2007 compared to 74% in fiscal 2006, while sales of our serial products represented 36% of the total DPS sales in fiscal 2007 compared to 20% in fiscal 2006. The DPS segment was also negatively impacted in fiscal 2007 due to a decline in sales volumes for our SATA solution products sold to our OEM customers, as the products are reaching the end of their life cycles. The DPS segment performance was also hindered during fiscal 2007 due to supply issues that resulted from the transition of our manufacturing operations to Sanmina-SCI in January 2006. Sanmina-SCI experienced material shortages and was challenged with systems' transitions that impacted its ability to meet delivery commitments on a consistent basis, which consequently prevented us from completing certain product shipments during the first quarter of fiscal 2007. We continued to see an impact in our channel penetration in the second and third quarters of fiscal 2007 as a result of these challenges in the first quarter of fiscal 2007.
Net revenues from our SSG segment decreased by $5.9 million in fiscal 2007 as compared to fiscal 2006 primarily as a result of our reduced sales and marketing activities while the Snap Server portion of our systems business was available for sale, combined with customer concerns over the future of this product line.
Net revenues from our Other category decreased by $16.7 million in fiscal 2007 as compared to fiscal 2006 primarily due to the decline in sales volumes of our digital media products of $9.8 million and our FireWire/1394 and SCSI-based desktop computer products of $5.1 million. The decline in sales volumes of our digital media products was primarily attributable to the decline of sales of our dual tuner products to a specific customer.
Geographical Revenues and Customer Concentration
Geographical Revenues: FY2008 FY2007 FY2006 - ----------------------------------------------------------------- --------- ---------- ---------North America 42 % 44 % 41 % Europe 29 % 27 % 29 %Pacific Rim29 % 29 % 30 % --------- ---------- ---------Total Revenues 100 % 100 % 100 %========= ========== ========= s
Our combined international revenues increased as a percentage of total revenues to 58% in fiscal 2008 from 56% in fiscal 2007. The increase was primarily due to the release of new SATA and SAS products in the third quarter of fiscal 2008 for which the European markets had a more rapid adoption rate.
Our overall international revenues declineddecrease as a percentage of our total revenues in the future as we expect the revenues from IBM to continue to decline. Our North America revenues improved as a percentage of our total revenues by 5% in fiscal 2007 as2010 compared to fiscal 20062009 primarily due to revenue declines from IBM in the Pacific Rim, combined with the recovery of macroeconomic conditions in North America.
Our North America revenues decreased as a resultpercentage of a customer that ceased purchasing from us duringour total revenues by 2% in fiscal 2006, which contributed $11.7 million2009 compared to European revenues during fiscal 2006 pursuant2008 primarily due to a last-time buy order, and supply issues at Sanmina-SCI, which impacted its ability to meet delivery commitmentsdecline in fiscal 2007. This in turn prevented us from completing certain product shipments during fiscal 2007, which included shipmentssales to our international distributors that sellOEM customers and to our customers shifting their manufacturing locations from North America to international customers.sites, and, to a lesser extent, increased sales and acceptance of our serial products sold to our channel customers at our international locations.
A small number of our customers account for a substantial portion of our net revenues, and we expect that a limited number of customers will continue to represent a substantial portion of our net revenues for the foreseeable future.revenues. In fiscal 2008,2010, IBM, Bell Microproducts and Ingram Micro accounted for 34%17%, 16% and 11%15% of our total net revenues, respectively. In fiscal 2007,2009, IBM and Dell accounted for 34% and 13%36% of our total net revenues, respectively.revenues. In fiscal 2006,2008, IBM and Dell accounted for 28% and 15%40% of our total net revenues.
Gross Margin.
| FY2010 | Percentage Change | FY2009 | Percentage Change | FY2008 | ||||||||||||||
| (in millions, except percentage) | ||||||||||||||||||
Gross Profit | $ | 33.4 | (32 | )% | $ | 49.4 | (13 | )% | $ | 56.6 | ||||||||
Gross Margin | 45 | % | 43 | % | 39 | % | ||||||||||||
Our gross margin is impacted by amounts recorded in cost of revenues, respectively.which primarily consists of direct product costs, manufacturing support costs, shipping and handling costs, warranty costs, inventory-related charges and amortization of acquisition-related intangible assets.
Percentage Percentage FY2008 Change FY2007 Change FY2006 ------------ ---------- --------- ---------- --------- (in millions, except percentage)Gross Profit $ 62.5 (23)% $ 81.2 (29)% 113.9 Gross Margin 37 % 32 % 33 %
The improvement in gross margin in fiscal 2010 compared to fiscal 2009 was primarily due to improved standard product contributions due to a shift in revenue mix from OEM to channel customers, with channel customers having higher average margins and our end-to-end supply chain efficiencies, including a reduction to our inventory-related charges of $2.8 million. This was partially offset by an increase in the amortization of acquisition-related intangible assets of $1.2 million in fiscal 2010 compared to fiscal 2009 related to the purchased intangible assets for core and existing technologies and backlog from the acquisition of Aristos in September 2008. Although our fixed operating costs declined in fiscal 2010 compared to fiscal 2009, our gross margins were also impacted by these costs as they were distributed over lower sales volumes.
The improvement in gross marginsmargin in fiscal 20082009 compared to fiscal 20072008 was due to improved standard product contributions as a result of our continued focus on product component costs, including the impact of favorable pricing negotiations with our suppliersend-to-end supply chain efficiencies and efficiencies gained with our contract manufacturer. We also experienced favorable product mix, primarily driven by an increase in channel versus OEM revenuea reduction in our DPS segment. Our inventory-related charges also decreased by $5.8 million in fiscal 2008 compared to fiscal 2007. This was partially offset by certain operational costs that are relatively fixed being spread over a smaller revenue base.
The declineof $3.8 million. In addition, the improvement in gross margins in fiscal 2007 compared to fiscal 2006 was primarily due to changes in our product mix from higher margin parallel SCSI products to lower margin serial products. In addition, in fiscal 2007, our inventory-related charges as compared to fiscal 2006 were higher by $2.3 million, primarilyalso due to a significant decline in our net revenues in the third quarter of fiscal 2007 from our OEM customers, compared to our original projections, and to the transition of our products to comply with the RoHS Directive. Due to the $88.9 million decline in our net revenues from fiscal 2006 to fiscal 2007, this increase in inventory- related charges had a more significant impact on our gross margins than it would have in fiscal 2006. This was partially offset by changes in our customer mix, which included a shift in net revenues by 3%revenue mix from our OEM to our channel customers, with channel customers usually having higher average margins. Costmargins, and a favorable product mix in the channel. This was offset by the amortization of sales for fiscal 2007 also included $0.6acquisition-related intangible assets of $2.5 million of stock-based compensation charges related to the adoptionpurchased intangible assets for core and existing technologies and backlog from the acquisition of SFAS No. 123(R), while fiscal 2006 had no such charges.Aristos.
Research and Development Expense Expense.
Percentage Percentage FY2008 Change FY2007 Change FY2006 ------------ ---------- --------- ---------- --------- (in millions, except percentage)
FY2010 Percentage
ChangeFY2009 Percentage
ChangeFY2008 (in millions, except percentage) Research and Development Expense
$ 29.5 9 % $ 26.9 (21 )% $ 34.0 Research and
Development $ 39.8 (30)% $ 56.6 (17)% $ 68.2
Ourdevelopment expenses primarily consist of salaries and related costs of employees engaged in ongoing research, design and development activities and subcontracting costs. Currently, our investment in research and development primarily focuses on developing new products for external storage, storage software and server storage markets. We also invest in research and development of new technologies, including iSCSI, SATA and SAS. A portion of our research and development expense fluctuates depending on the timing of major project costs such as prototype costs. We expect our research and development expense to decline in fiscal 2011 regardless of whether the PMC Transaction is consummated.
The increase in research and development expense in fiscal 2010 compared to fiscal 2009 was primarily due to the acquisition of the Aristos engineering team in September 2008 and the costs associated with the development of our technology to achieve new OEM design wins and to expand our channel offerings as well as engineering expenses related to certain chip design projects. We also recorded certain employee retention obligations of $0.4 million and higher stock-based compensation expense of $1.3 million primarily due to the impact from the true-up of actual forfeitures that occurred in fiscal 2009, which reduced our stock-based compensation expense during that period, and to a lesser extent, the modification of certain stock-based awards that increased stock-based compensation expense in fiscal 2010. This was partially offset by the temporary reductions in employees’ compensation, which began in the first quarter of fiscal 2010.
The decrease in research and development expense in fiscal 20082009 compared to fiscal 20072008 was primarily due to reduced headcount and related expenses as a result of restructuring programs implemented in fiscal years 20072008 and 2008fiscal 2009, combined with additional attrition in our workforce. This resulted inworkforce, which was reflected by a 25%52% decrease in our averagedirect headcount for employees engaged in research and development. WeA portion of this reduction in direct headcount includes the former employees that were transferred to HCL. The headcount reductions in research and development also decreased our infrastructure spending, had fewer engineering projects outstanding and hadresulted in lower stock-based compensation expense of $2.6$2.0 million in fiscal 2008 compared to $3.8 million in fiscal 2007 primarily as a result of the decrease in headcount.
The decrease in research and development expense in fiscal 2007 as2009 compared to fiscal 2006 was primarily due to reduced headcount as a result of restructuring programs implemented in fiscal 2006 and the first half of fiscal 2007, and decreased infrastructure spending.2008. This was reflected by a decrease in headcount by 33% in fiscal 2007 compared to fiscal 2006 for employees engaged in research and development. The decrease in fiscal 2007 as compared to fiscal 2006 was partially offset by stock-based compensation chargesexpense of $0.9 million recorded in fiscal 2009, related to the adoptionmanagement liquidation pool established for certain former employees of SFAS No. 123(R)Aristos pursuant to the Merger Agreement. We also incurred costs with the development of $3.8 million in fiscal 2007 as fiscal 2006 had no such charges.our technology to achieve new OEM design wins and to expand our channel offerings.
37
Selling, Marketing and Administrative Expense Expense.
Percentage Percentage FY2008 Change FY2007 Change FY2006 ------------ ---------- --------- ---------- --------- (in millions, except percentage)Selling, Marketing and Administrative $ 57.4 (6)% $ 61.3 (15)% $ 72.4
As our
| FY2010 | Percentage Change | FY2009 | Percentage Change | FY2008 | |||||||||||
| (in millions, except percentage) | |||||||||||||||
Selling, Marketing and Administrative Expense | $ | 32.6 | (7 | )% | $ | 35.0 | (31 | )% | $ | 50.4 | |||||
Our selling, marketing and administrative expense consists primarily of salaries, including commissions,commissions. We expect our selling, marketing and administrative expense fluctuatesto decline in fiscal 2011 based on changesthe anticipated cost savings we expect to our revenue levels.obtain from the reductions in workforce we implemented in fiscal 2010.
The decrease in selling, marketing and administrative expense in fiscal 20082010 compared to fiscal 20072009 was primarily a result of reductions ofin our workforce and infrastructure spending asdue to the restructuring plans we implemented in the third quarter of fiscal 2010 and in fiscal 2009, which resulted in a 30% decrease in our average headcount for employees engaged in selling, marketing and administrative functions, temporary reductions in employees’ compensation, which began in the first quarter of fiscal 2010, and reductions in outside service providers. This was partially offset by certain employee retention obligations of $0.3 million and higher stock-based compensation expense of $1.3 million primarily due to the modification of certain stock-based awards, a fiscal 2010 expense related to guaranteed cash payments of $1.6 million associated with the execution of the separation and consulting service agreements with our former CEO, professional fees of $1.2 million incurred in fiscal 2010 related to the consent solicitation initiated by the Steel Group and a charge recorded in fiscal 2010 for the reimbursement of $0.7 million related to professional fees that the Steel Group incurred with respect to the consent solicitation.
The decrease in selling, marketing and administrative expense in fiscal 2009 compared to fiscal 2008 was primarily a result of reductions in our workforce and infrastructure spending due to the restructuring plans we implemented in fiscal years 20072008 and 2008,fiscal 2009, which resulted in a 18%39% decrease in our average headcount for employees engaged in selling, marketing and administrative functions. In addition, we hadThe headcount reductions also resulted in lower stock-based compensation expense of $0.5$0.9 million in fiscal 20082009 compared to fiscal 2007 primarily due to the reduction in headcount.
The decrease in selling, marketing and administrative expense in fiscal 2007 as compared to fiscal 2006 was primarily a result of reductions of our workforce and infrastructure spending as a result of the restructuring plans we implemented in fiscal 2006 and the first half of fiscal 2007, and $1.2 million of compensation expense recorded in the first quarter of fiscal 2006 for retirement costs related to our former Chief Executive Officer.2008. This was partially offset by increased spending in marketing and selling activitiescompensation expense of $2.7$1.1 million related to increased investment in our SSG segment. In addition, selling, marketing and administrative expensethe management liquidation pool established for fiscal 2007 included $4.1 millioncertain former employees of stock-based compensation charges relatedAristos pursuant to the adoption of SFAS No. 123(R), while fiscal 2006 had no such charges. Overall headcount decreased by 28% in fiscal 2007 compared to fiscal 2006 for employees engaged in selling, marketing and administrative functions.Merger Agreement.
Amortization of Acquisition-Related Intangible Assets Assets.
Percentage Percentage FY2008 Change FY2007 Change FY2006 ------------ ---------- --------- ---------- --------- (in millions, except percentage)Amortization of Acquisition- Related Intangible Assets $ 2.9 (52)% $ 6.0 (35)% $ 9.2
| FY2010 | Percentage Change | FY2009 | Percentage Change | FY2008 | |||||||||||
| (in millions, except percentage) | |||||||||||||||
Amortization of Acquisition-Related Intangible Assets | $ | 1.3 | 72 | % | $ | 0.8 | (70 | )% | $ | 2.5 | |||||
Acquisition-related intangible assets include patents, core and existing technologies, covenants-not-to-compete, supply agreement, foundry agreement, customer relationships, trade names, backlog and royalties.backlog. We amortize the acquisition-related intangible assets over periods which reflect the pattern in which the economic benefits of the assets are expected to be realized, which is primarily using the straight-line method over their estimated useful lives, ranging from three to sixty months. Subsequent to our fiscal year-end, as a result of the PMC Transaction and our intent to either continue to pursue the sale of the Aristos products or wind down the sale or dispose of our Aristos products within the next six months, or by September 2010, as well as our consideration of the disposition or redeployment of our remaining non-core patents and real estate assets, we are expected to five years.change the remaining useful life of our intangible assets of $16.0 million related to our Aristos products, which in turn, we expect to change the amount amortized prospectively during each reporting period.
The increase in amortization of acquisition-related intangible assets in fiscal 2010 compared to fiscal 2009 was due to the amortization of purchased intangible assets from the Aristos acquisition in September 2008 for customer relationships of $0.5 million. The amortization of purchased intangible assets from the Aristos acquisition for the core and existing technologies and backlog were reflected in cost of revenues.
The decrease in amortization of acquisition-related intangible assets in fiscal 20082009 compared to fiscal 20072008 was primarily due to intangible assetsthe fact that became fully amortized in fiscal 2007 associated with our acquisitions of the IBM i/p Series RAID business and Eurologic Systems Group Limited. During the fourth quarter of fiscal 2008, we recorded an impairment charge within "Other charges (gains)" for $2.4 million to write down thesewrote off our intangible assets to zeroassociated with our acquisition of Elipsan Limited, or Elipsan, due to a revision in our forecasts during that quarter that resulted in expected negative long-term cash flows fromfor these assets for the first time. As a result of this charge, there will be no futureThis was offset by the amortization of purchased intangible assets related to these acquisitions.
The decrease in amortizationfrom the Aristos acquisition for customer relationships of acquisition-related intangible assets$0.8 million, which was recorded in fiscal 2007 compared to fiscal 2006 was primarily due to lower amortization of $1.8 million related to Snap Appliance intangible assets which were written down through "Other charges (gains)" in March and June 2006, intangible assets that became fully amortized in August 2005 associated with our acquisition of Platys of $1.3 million and certain intangible assets that became fully amortized in fiscal 2006 associated with our acquisition of ICP vortex Computersysteme GmbH of $1.0 million. This was partially offset by increased amortization of intangible assets that were retained after the disposition of the IBM i/p Series RAID business, in September 2005 by $0.9 million as we reduced the remaining useful lives of these assets.2009.
Restructuring Charges Charges.
Percentage Percentage FY2008 Change FY2007 Change FY2006 ------------ ---------- --------- ---------- --------- (in millions, except percentage)Restructuring Charges $ 6.3 69 % $ 3.7 (64)% $ 10.4
During fiscal years 2008, 2007 and 2006, we
| FY2010 | Percentage Change | FY2009 | Percentage Change | FY2008 | |||||||||||
| (in millions, except percentage) | |||||||||||||||
Restructuring Charges | $ | 1.6 | (74 | )% | $ | 6.1 | (3 | )% | $ | 6.3 | |||||
We implemented several restructuring plans which included reductions of our workforceduring fiscal years 2010, 2009 and consolidation of operations. We recorded restructuring charges of $6.3 million, $3.7 million and $10.4 million in fiscal 2008, 2007 and 2006, respectively. Of the $6.3 million recorded in fiscal 2008, $6.7 million related to restructuring charges for plans implemented in fiscal 2008 and $(0.3) million in adjustments related to prior fiscal years' restructuring plans, as actual results were lower than anticipated.
2008. The goal of these plans was to bring our operational expenses to appropriate levels relative to our net revenues, while simultaneously implementing extensive company-wide expense-control programs.
The restructuring charges of $1.6 million recorded in fiscal 2010 primarily related to the restructuring plan implemented during the fiscal year with minimal adjustments related to prior fiscal years’ restructuring plans. Of the $6.1 million recorded in fiscal 2009, $5.9 million related to restructuring charges for plans implemented in fiscal 2009 and $0.2 million related to adjustments made for prior fiscal years’ restructuring plans due to additional lease costs for facilities previously consolidated. Of the $6.3 million recorded in fiscal 2008, $6.7 million related to restructuring charges for plans implemented in fiscal 2008 and $(0.4) million related to adjustments made for prior fiscal years’ restructuring plans due to actual results being lower than anticipated. All expenses, including adjustments, associated with our restructuring plans are included in "Restructuring charges"“Restructuring charges” in the Consolidated Statements of Operations and are not allocated to segments but rather managed at the corporate level. For further discussion of our restructuring plans, please refer to Note 1011 to the Consolidated Financial Statements. The restructuring plans are discussed in detail below.
Fiscal 2010 Restructuring Plan
In the third quarter of fiscal 2010, we committed to a new restructuring plan to better align our operating costs with the continued decline in our net revenues, resulting in a restructuring charge of $1.6 million in fiscal 2010. We reduced our workforce primarily in the general administrative functions and provided severance and related benefits of $1.4 million. We also consolidated our facilities further and incurred a net estimated loss of $0.2 million for vacating the premises.
We began to achieve reductions in our annual operating expenses by approximately $3.1 million as a result of the actions taken in the third quarter of fiscal 2010 related to this plan. Approximately 13%, 8% and 79% of the restructuring cost savings were reflected as a reduction in cost of revenues, research and development expense, and selling, marketing and administrative expense, respectively, beginning primarily in the fourth quarter of fiscal 2010.
Fiscal 2009 Restructuring Plans
We recorded a total of $5.9 million in restructuring charges for plans implemented in fiscal 2009, of which $5.1 million related to severance and benefits for employee reductions worldwide and $0.8 million related to vacating certain facilities and disposing of duplicative assets.
In the first quarter of fiscal 2009, we approved and initiated a restructuring plan to (1) reduce our operating expenses due to a declining revenue base, (2) streamline our operations and (3) better align our resources with our strategic business objectives, resulting in a restructuring charge of $3.8 million in fiscal 2009. This restructuring plan included workforce reductions in all functions of the organization worldwide and consolidation of our facilities, which resulted in restructuring charges of $3.0 million and $0.8 million, respectively. Of the $3.8 million recorded in fiscal 2009 related to this restructuring plan, $0.3 million was recorded in the fourth
39
quarter of fiscal 2009, related to accrual adjustments for the additional estimated loss on our facilities and disposing of duplicative assets.
In the third quarter of fiscal 2009, we initiated additional actions to reduce expenses as our business began to be impacted by the deterioration of macroeconomic conditions, resulting in a restructuring charge of $2.1 million in fiscal 2009 related to severance and benefits for employee reductions primarily in sales, marketing and administrative functions.
Fiscal 2008 Restructuring Plans
We recorded restructuring charges of $6.7 million for plans implemented in fiscal year 2008. Of these charges,2008, of which $5.4 million related to severance and benefits for employee reductions worldwide and $1.3 million related to vacating redundant facilities and contract termination costs. Additional adjustments of $0.2 million were recorded in fiscal 2009 related to plans implemented in fiscal 2008 for facility costs.
In the first quarter of fiscal 2008, managementwe approved and initiated a plan to restructure our operations to reduce our operating expenses due to a declining revenue base by eliminating duplicative resources in all functions of the organization worldwide, resulting in a restructuring charge of $1.5 million related to severance and benefits for employee reductions.
In the second quarter of fiscal 2008, we initiated additional actions in an effort to better align cost structure with our anticipated OEM revenue stream and to improve our results of operations and cash flows. The total cost we incurred for thisflows, resulting in a restructuring charge of $5.2 million in fiscal 2008. This restructuring plan was $5.2 million, of which approximately $3.5 million was recorded in the second quarter of fiscal 2008, $0.9 million in the third quarter of fiscal 2008included workforce reductions and $0.8 million in the fourth quarter of fiscal 2008
By the end of the second quarter of fiscal 2008, we began to reduce our annual operating expenses by approximately $4.7 million as a resultconsolidation of our first quarter of fiscal 2008 restructuring plan. Approximately 30%, 6% and 64% of the restructuring cost savings were reflected as a reduction in cost of revenues, research and development expense, sales and marketing, and administrative expense, respectively. For our second quarter of fiscal 2008 restructuring plan, we expect to reduce our annual operating expenses by approximately $12.6 million beginning in the fourth quarter of fiscal 2008. Approximately 2%, 65% and 33% of the restructuring cost savings are expected to be reflected as a reduction in cost of revenues, research and development expense, and selling, marketing and administrative expense, respectively.
Fiscal 2007 Restructuring Plans
In the first and second quarters of fiscal 2007, management approved and initiated plans to restructure our operations by simplifying our infrastructure. These restructuring plans eliminated certain duplicative assets and resources in all functions of the organization worldwide due to consolidating certain processes in order to reduce our cost structure,facilities, which resulted in a chargerestructuring charges of $3.9 million in fiscal 2007. In addition, we recorded minimal provision adjustments in fiscal 2007 related to asset impairments, which were partially offset by a reduction for benefits as actual results were lower than anticipated.and $1.3 million, respectively. During fiscal 2008,2009, we recorded adjustments to the fiscal 20072008 restructuring plan accrual of $(0.2)$0.2 million related to the reduction of benefits, as actual results were lower than anticipated. As of March 31, 2008, we had utilized all of these charges and the plans are now complete.
Fiscal 2006 Restructuring Plans
In the third and fourth quarters of fiscal 2006, management approved and initiated plans to restructure operations by simplifying our infrastructure. The restructuring plans eliminated certain duplicative resources in all functions of the organization worldwide, due in part, to the discontinued operations, the vacating of redundant facilities in order to reduce our cost structure, and sale of our Singapore manufacturing facility. This resulted in a restructuring charge of $9.8 million, of which $9.1 million related to the involuntary termination of employees in all functions of the organization and $0.7 million related to theadditional estimated loss on our facilities in fiscal 2006. In addition, we recorded minimal provision adjustments in fiscal 2007, as actual results for severance and benefits were lower than anticipated. In fiscal 2008, we recorded adjustments to the fiscal 2006 restructuring plan accrual of $(0.1) million, as actual results for severance and benefits and vacating redundant facilities were lower than anticipated. As of March 31, 2008, we had utilized all of these charges and the plans are now complete.facilities.
Previous Restructuring Plans
In addition, we recorded provision adjustments of $(0.4) million in fiscal 2008 related to our restructuring plans that were implemented prior to fiscal years 2005, 2004, 2003, 2002 and 2001 restructuring plan accruals, and Snap Appliance2008, including our previous Acquisition-Related Restructuring Plan accrual (see Note 1011 to the Consolidated Financial Statements) in fiscal years 2008, 2007 and 2006 for $(0.3) million, $(0.2) million and $1.0 million, respectively. In fiscal years 2008 and 2007, the provision adjustments, primarily related to the reduction of lease costs related to the estimated loss on our facilities and a reduction of benefits as actual results were lower than anticipated. In fiscal 2006, the provision adjustments primarily related to additional lease costs related to the estimated loss on our facilities that we sublease, which was partially offset by the reduction of benefits as actual results were lower than anticipated.facilities.
Goodwill Impairment Impairment.
Percentage Percentage FY2008 Change FY2007 Change FY2006 ------------ ---------- --------- ---------- --------- (in millions, except percentage)Goodwill Impairment $ -- -- % $ -- (100)% $ 90.6
| FY2010 | Percentage Change | FY2009 | Percentage Change | FY2008 | |||||||||||
| (in millions, except percentage) | |||||||||||||||
Goodwill Impairment | $ | — | (100 | )% | $ | 16.9 | 100 | % | $ | — | |||||
Goodwill is not amortized, but instead is reviewed for impairment annually and whenever events or changes in circumstances indicate the carrying value of goodwill may not be recoverable in accordance with SFAS No. 142, "Goodwill and Other Intangible Assets."
In connection withrecoverable. During the reorganization of our segments in fiscal 2006, an assessment of the recoverability of goodwill was performed. As a result of this review, we wrote-off our entire balance of goodwill of $90.6 million in the secondfourth quarter of fiscal 2006. Factors that led2009, we experienced a significant and continued decline in the market value of our common stock, which resulted in our market capitalization falling below our net book value. Based on our annual review of goodwill in the fourth quarter of fiscal 2009, we recorded an impairment charge of $16.9 million to this conclusion included, but were not limitedwrite-off goodwill primarily due to industry technology changes such asnet book value exceeding the shiftimplied fair value. For further discussion of our goodwill impairment, please refer to Note 7 to the Consolidated Financial Statements.
Other Gains, Net.
| FY2010 | Percentage Change | FY2009 | Percentage Change | FY2008 | ||||||||||||
| (in millions, except percentage) | ||||||||||||||||
Other gains, net: | �� | |||||||||||||||
Impairment of intangible assets | $ | — | — | % | $ | — | (100 | )% | $ | 2.2 | ||||||
Gain on sale of buildings | — | — | % | — | 100 | % | (6.7 | ) | ||||||||
Other | — | — | % | — | (100 | )% | 0.9 | |||||||||
Total Other Gains, Net | $ | — | — | % | $ | — | 100 | % | $ | (3.6 | ) | |||||
Other gains, net primarily consisted of a gain from parallel to serial technology and the migration of core functionality to server chipsets; required increased investments that eventually led us to sell the IBM i/p Series RAID business in fiscal 2006 and the decision to sell the systems business; continued losses associated with sales of systems to IBM; and general market conditions.
Other Charges (Gains)
Percentage Percentage FY2008 Change FY2007 Change FY2006 ------------ ---------- --------- ---------- --------- (in millions, except percentage)Impairment of assets related to portion of systems business $ 2.4 (82)% $ 13.2 32 % $ 10.0 Impairment of investments 0.1 (88)% 0.9 100 % -- Charge (credit) related to manufacturing agreement -- 100 % (0.1) n/a% 1.6 Gain onsale ofbuildings (6.7) n/a% -- -- % -- Other 0.8 11 % 0.7 100 % -- ------------ --------- ---------Total Other Charges (Gains) $ (3.4) 123 % $ 14.7 27 % $ 11.6============ ========= =========
Other charges (gains) primarily consisted oflong-lived assets, partially offset by asset impairment charges related to certain properties or assets.
Impairment of Other Intangible Assets
We performed our regular review of long-lived assets and a minority investment. Other charges (gains) also included a gain from the sale of long-lived assets.
Impairment of Assets related to a Portion of our Systems Business and Other
We regularly perform reviews to determine if facts or circumstances aredetermined that an indicator was present either internal or external,in fiscal 2008 in which would indicate that the carrying values of our long-lived assets are impaired. If an asset is determined to be impaired, the loss is measured based on the difference between the asset's fair value and its carrying value. The estimate of fair value of the assets is based on discounting estimated future cash flows using a discount rate commensurate with the risks inherent in our current business model. The estimation of the impairment involves numerous assumptions that require judgment by us, including, but not limited to, future use of the assets for our operations versus sale or disposal of the assets and future selling prices for our products.
We had classified the entire systems business as a discontinued operation in September 2005 and sold the OEM block-based portion of the systems business in January 2006. In the fourth quarter of fiscal 2006, we recorded asset impairment charges of $10.0 million related to certain acquisition-related intangible assets for the Snap Server portion of our systems business that was previously held for sale at March 31, 2006 to adjust the carrying value of these assets to fair value, which was aligned to the offers made by potential purchasers. With the decision at the end of the first quarter of fiscal 2007 to retain and operate the Snap Server portion of the systems business, we performed an impairment analysis of this business that indicated that the carrying amount of the long-lived assets exceeded their estimated fair value. This was due in part to the limited cash flows of the business and a number of uncertainties, which included the significant research and development expenditures necessary to grow the revenue of the Snap Server portion of the systems business and the significant uncertainties associated with achieving such growth in revenue. This resulted innot recoverable. We recorded an impairment charge of $13.2$2.2 million which was recorded in "Other charges (gains)" in the Consolidated Statements of Operations in fiscal 2007. Also included in "Other charges (gains)" in fiscal 2007 was $0.7 million for legal and consulting fees incurred in connection with our efforts that had been undertaken2008 to sell the Snap Systems portion of our business.
We recorded a gain of $6.7 million related to the sale of certain properties, an impairment of $2.4 million to write down the SSGwrite-off intangible assets related to the Elipsan and Snap Appliance acquisitions to zeroacquisition due to a revision in our forecasts that resulted in expected negative long-term cash flows for the first time, and a charge of $0.8 million related to third-party service costs associated to an acquisition that we did not complete. See Note 10 to the Consolidated Financial Statements
Impairment of Minority Investment
We hold minority investments in certain non-public companies. We regularly monitor these minority investments for impairment and record reductions in the carrying values when the impairment is deemed to be other-than-temporary. Circumstances that indicate an other-than-temporary decline include the length of time and the extent to which the market value has been lower than cost. We recorded an impairment charge of $0.9 million in fiscal 2007 related to a decline in the value of a minority investment deemed to be other-than-temporary.
Manufacturing Agreement
On December 23, 2005, we entered into a three-year contract manufacturing agreement with Sanmina- SCI whereby Sanmina-SCI, upon the closing of the transaction on January 9, 2006, assumed manufacturing operations of Adaptec products. In addition, we sold certain manufacturing assets, buildings and improvements and inventory located in Singapore, with respect to printed circuit boardassemblies and storage system manufacturing operations, to Sanmina-SCI for $26.6 million (net of closing costs of $0.6 million), resulting in a loss on disposal of assets of $1.6 million that was recorded in fiscal 2006 in "Other charges (gains)"within “Other gains, net” in the Consolidated Statements of Operations. See Notes 7 and 12 to the Consolidated Financial Statements for further discussions regarding the impairment of other intangible assets.
Gain on Sale of Buildings
In fiscal 2004,2007, we decided to consolidate our properties in Milpitas, California to better align our business needs with existing operations and to provide more efficient use of our facilities. In May 2007, we completed the sale of certain of these properties that were previously classified as held for sale, with proceeds aggregating $19.9 million, which exceededexceeding our carrying value of $12.5 million. Net of selling costs, we recorded a gain of $6.7 million on the sale of the properties in fiscal 2008 to "Other charges (gains)"within “Other gains, net” in the Consolidated Statements of Operations.
Other
In fiscal 2008, we recorded a charge of $0.8 million related to costs incurred to evaluate strategic options. These charges were recorded within “Other gains, net” in the Consolidated Statements of Operations. See Note 12 to the Consolidated Financial Statements for further details.
Interest and Other Income, NetNet.
Percentage Percentage FY2008 Change FY2007 Change FY2006 ------------ ---------- --------- ---------- --------- (in millions, except percentage)Interest Income $ 28.7 18 % $ 24.4 44 % $ 16.9 Loss on Extinguishment of Debt, Net -- -- % -- 100 % (0.1) Realized Currency Transaction Gains (Losses) 2.6 165 % 0.9 n/a (0.3) Other 0.1 (58)% 0.3 (74)% 1.1 ------------ ---------- --------- ---------- ---------Total Interest and Other Income, Net $ 31.3 22 % $ 25.6 45 % $ 17.6============ ========= =========
| FY2010 | Percentage Change | FY2009 | Percentage Change | FY2008 | ||||||||||||
| (in millions, except percentage) | ||||||||||||||||
Interest and other income, net: | ||||||||||||||||
Interest income | $ | 8.5 | (50 | )% | $ | 16.9 | (41 | )% | $ | 28.7 | ||||||
Gain on sale of marketable equity securities | — | (100 | )% | 2.3 | 100 | % | — | |||||||||
Gain on sale of investments | 0.4 | 100 | % | — | — | % | — | |||||||||
Gain on settlement of class action suit | 0.9 | 100 | % | — | — | % | — | |||||||||
Gain on extinguishment of debt, net | — | (100 | )% | 1.6 | 100 | % | — | |||||||||
Realized currency transaction gains (losses) | 0.4 | n/a | (0.8 | ) | n/a | % | 2.5 | |||||||||
Other | 0.2 | (81 | )% | 1.0 | 686 | % | 0.1 | |||||||||
Total Interest and Other Income, Net | $ | 10.4 | (50 | )% | $ | 21.0 | (33 | )% | $ | 31.3 | ||||||
Interest income net, reflects interest earned on our cash, and cash equivalents and marketable securities balances. Other income, net, primarily includes recordedsecurities’ balances and realized gains and losses on strategicmarketable securities. Other income, net, is primarily attributable to realized gains on marketable equity securities and investments, gains from the repurchase of certain portions of our 3/4% Notes, and fluctuations in foreign currency gains or losses, and to a lesser extent, includes recorded changes in values not deemed to be other-than-temporary on non-controlling interest on certain investments as well as gains and losses on foreign currency transactions andthe dispositions of property and equipment.
For the fiscal year ended March 31, 2008 as compared to fiscal 2007, the increase in We expect that our interest and other income, net, waswill continue to decline in future periods primarily due to higher marketlower interest rates on marketable securities. In addition, in fiscal 2008, we realized a gain of $1.6 million on the sale of a marketable debt security that was obtained as part of a fiscal 2004 acquisition. Furthermore, there were increases in the realized foreign currency transaction gains in fiscal 2008 compared to fiscal 2007 primarily related to a stronger Euro compared to the United States dollar combined with balances we hold in our European foreign entities whose functional currency is the United States dollar.
The increase in interest and other income in fiscal 2007 as compared to fiscal 2006 was primarily due to higher interest rates, which resulted in additional income earned on our cash, cash equivalents and marketable securitiessecurities’ balances.
The decrease in interest and other income, net, gainsin fiscal 2010 compared to fiscal 2009 was primarily due to a decrease in interest earned on lower average cash balances as we used cash for the repurchase of certain portions of our 3/4% Notes and for the acquisition of Aristos in fiscal 2009, combined with lower interest rates. This was
41
partially offset by the receipt of $0.9 million from Micron Technology, Inc. as part of a class action settlement regarding DRAM antitrust matters and a gain of $0.4 million from the sale of an investment in a non-controlling interest of a non-public company.
The decrease in interest and other income, net, in fiscal 2009 compared to fiscal 2008 was primarily due to lower interest rates combined with interest earned on lower average cash balances. In addition, in fiscal 2009, we experienced realized losses on our foreign currency fluctuations, primarily relatedtransactions as compared to realized gains in fiscal 2008 due to a weaker Euro and Pound compared to United States Dollar, which was applied to our foreign currency entities. This was partially offset by a recorded gain, net of selling costs, of $2.3 million on the Euro.sale of marketable equity securities of a publicly traded company, and a gain on extinguishment of debt of $1.7 million (net of unamortized debt issuance costs) on the repurchase of our 3/4% Notes on the open market in fiscal 2009.
Interest Expense Expense.
Percentage Percentage FY2008 Change FY2007 Change FY2006 ------------ ---------- --------- ---------- --------- (in millions, except percentage)Interest Expense $ (3.6) 7 % $ (3.4) 3 % $ (3.3)
| FY2010 | Percentage Change | FY2009 | Percentage Change | FY2008 | ||||||||||||||
| (in millions, except percentage) | ||||||||||||||||||
Interest Expense | $ | (0.0 | ) | (100 | )% | $ | (1.2 | ) | (66 | )% | $ | (3.6 | ) | |||||
Interest expense is primarily associated with our 3/4% Convertible Senior Notes due 2023, or 3/4% Notes, and our 3% Notes issued in December 2003 and March 2002, respectively. Interest2003. The decrease in interest expense remained relatively flat forin fiscal 20082010 compared to fiscal 2007 as well as for2009 and fiscal 20072009 compared to fiscal 2006.2008 were primarily due to the reduction in the outstanding principal amount plus premium of the 3/4% Notes of $225.0 million, which was paid throughout fiscal 2009. We have repurchased all but $0.3 million of our 3/4% Notes as of March 31, 2010 and will not incur significant interest expense from these notes in future periods.
Benefit From (Provision For) Income Taxes.
Income Taxes
Percentage Percentage FY2008 Change FY2007 Change FY2006 ------------ ---------- --------- ---------- --------- (in millions, except percentage)Provision For (Benefit From) Income Taxes $ (2.7) (96)% $ (63.7) n/a $ 1.6
| FY2010 | Percentage Change | FY2009 | Percentage Change | FY2008 | |||||||||||
| (in millions, except percentage) | |||||||||||||||
Benefit From (Provision For) Income Taxes | $ | 2.5 | (5 | )% | $ | 2.6 | n/a | $ | (0.0 | ) | |||||
For fiscal 2008years 2010 and 2007,2009, we recorded income tax benefits of $2.7$2.5 million and $63.7$2.6 million on pre-tax losses from continuing operations of $12.8$21.1 million and $38.9$16.6 million, respectively. For fiscal 2006,2008, we recorded an income tax provision of $1.6 million$25,000 on a pre-tax loss from continuing operations of $134.2$5.3 million. Our effective tax rates include foreign losses in jurisdictions where no tax benefit is derived, foreign taxes in jurisdictions where tax rates differ from U.S. tax rates, changes in the valuation allowance on deferred tax assets, certain state minimum taxes, and discrete tax benefits associated with settling certain tax disputes primarily with the United States, Singapore and German taxing authorities, releases of our Irish withholding taxes, and included changes in judgment related to uncertain tax positions in both the United States and foreign jurisdictions based on new information received and new uncertain tax positions that were identified. Interest is accrued on prior years’ tax disputes and refund claims as a discrete item each period.
In fiscal 2010, our tax benefit included discrete tax benefits of $1.3 million related to additional tax refunds that became available to us during fiscal 2010 due to the enactment of the Worker, Homeownership and Business Act of 2009, which allowed for an extension of the net operating loss carryback period from two to five years for United States federal tax purposes. We also recorded discrete tax benefits of $4.4 million in fiscal 2010 primarily due to reaching final settlement with the German Tax Authorities for fiscal years 2001 through 2004 and the Singapore Tax Authorities for fiscal year 2001, reflecting the reversal of previously accrued liabilities and refunded tax amounts. This was partially offset by discrete tax expense of $3.6 million in fiscal 2010 primarily due to the on-going audits in our foreign jurisdictions.
In fiscal 2009, we recorded a net tax benefit of $1.4 million, which included the reversal of previously accrued liabilities related to reaching final settlement with the Singapore Tax Authorities for fiscal years 1998 through 2000 and the lapsing of the statute of limitations on a pre-acquisition tax issue related to Eurologic. This was offset by
changes in judgment related to on-going audits in our foreign jurisdictions and new foreign tax issues that were identified, which included our tax exposures that pre-date our acquisition of ICP vortex Computersysteme GmbH, or ICP vortex, resulting in increases in our liabilities for uncertain tax positions. Changes to the liabilities for uncertain tax benefits related to the Eurologic and ICP vortex items were recorded as part of the tax provision as opposed to adjusting amounts to purchase accounting as no goodwill or related intangible assets existed at March 31, 2009, due to impairments or the full amortization of intangible assets in previous fiscal years. In fiscal 2009, we also recorded a favorable tax impact due from the state of California, including accrued and unpaid interest, of approximately $1.6 million due to notices received from the California Franchise Tax Board in January 2009 as a result of their review of our amended fiscal years 1994 through 2003 tax returns. These notices indicated that certain adjustments were to be made in conjunction with adjustments made on our amended Federal tax returns for those fiscal years, due to reaching resolutions with the United States taxing authorities.authorities on all outstanding audit issues, as further discussed in Note 14 to the Consolidated Financial Statements.
We have concluded our negotiations with the IRS taxing authorities with regard to our tax disputes for our fiscal years 1994 through 2006, as discussed in Note 14 to the Consolidated Financial Statements. In fiscal 2009, the IRS issued a No Change Report indicating no change to our tax liability; however, the IRS continues to have the ability to adjust tax attributes relating to these years in subsequent audits. We believe that we have provided sufficient tax provisions for these years and that the ultimate outcome of any future IRS audits that include the tax attributes will not have a material adverse impact on our financial position or results of operations in future periods. The tax authorities in the foreign jurisdictions that we operate in continue to audit our tax returns for fiscal years subsequent to 1999. The potential outcome of these audits is uncertain and could result in material tax provisions or benefits in future periods. However, we cannot predict with certainty how these matters will be resolved and whether we will be required to make additional tax payments and believe that we have provided sufficient tax provisions for the tax exposures in our foreign jurisdictions.
As of March 31, 2010, our total gross unrecognized tax benefits were $23.9 million, of which $4.4 million, if recognized, would affect the effective tax rate. There was an overall decrease of $3.9 million in our gross unrecognized tax benefits from fiscal 2009 to fiscal 2010 due to benefits from the Singapore and Germany audit settlements noted above, offset by changes in judgment related to foreign audits during fiscal 2010.
We are subject to U.S. federal income tax as well as income taxes in many U.S. states and foreign jurisdictions. As of March 31, 2010, fiscal years 2004 onward remained open to examination by the U.S. taxing authorities and fiscal years 1999 onward remained open to examination in various foreign jurisdictions. U.S. tax attributes generated in fiscal years 2004 onward also remain subject to adjustment in subsequent audits when they are utilized.
The calculation of unrecognized tax benefits involves dealing with uncertainties in the application of complex global tax regulations. Management regularly assesses our tax positions in light of legislative, bilateral tax treaty, regulatory and judicial developments in the countries in which we do business. Management believes that it is not reasonably possible that the gross unrecognized tax benefits will change significantly within the next 12 months.
We had a valuation allowance for deferred tax assets of $44.6$81.2 million and $75.9 million at March 31, 2008,2010 and 2009, respectively, as we determined that it was more likely than not that substantially all of our net U.S. deferred tax assets will not be realized. This resulted in an increase to the valuation allowance by $5.3 million and $31.4 million during the years ended March 31, 2010 and 2009, respectively. Factors that led to this conclusion included, but were not limited to, our past operating results, cumulative tax losses in the United States and uncertain future income on a jurisdiction by jurisdiction basis. We continuously monitor the circumstances impacting the expected realization of our deferred tax assets on a jurisdiction by jurisdiction basis.
On October 22, 2004, the American Jobs Creation Act of 2004, which we refer to as the Act, was signed into law. The Act created a temporary incentive for U.S. companies to repatriate accumulated foreign earnings subject to certain limitations by providing a one-time deduction of 85% for certain dividends from controlled foreign corporations. In the fourth quarter of fiscal 2005, we repatriated $360.6 million of undistributed earnings from Singapore to the United States and incurred a tax liability of $17.6 million. The one-time deduction was allowed to the extent that the repatriated amounts were used to fund a qualified Domestic Reinvestment Plan, as required by the Act. If we do not spend the repatriated funds in accordance with our reinvestment plan, we may incur additional tax liabilities.
As of March 31, 2008, we had provided for U.S. deferred income taxes or foreign withholding taxes on our remaining undistributed earnings of $221.1 million since these earnings are not intended to be reinvested indefinitely. The additional U.S. deferred income taxes and foreign withholding taxes were offset by decreases in our valuation allowance due to a change in our assumptions. The net effect was immaterial to our results of operations and our provision for taxes.
Income (Loss) From Discontinued Operations, Net of TaxesTaxes.
Percentage Percentage FY2008 Change FY2007 Change FY2006 ------------ ---------- --------- ---------- --------- (in millions, except percentage)Income (Loss) From Discontinued Operations, Net of Taxes $ 0.5 (93)% $ 6.0 n/a $ (12.6)
The decrease in discontinued operations in fiscal 2008 compared to fiscal 2007 was primarily driven by the receipt of royalty revenues under the terms of the nonexclusive license agreement from the disposal of the IBM i/p Series RAID business, which royalty payments ceased in March 2007.
| FY2010 | Percentage Change | FY2009 | Percentage Change | FY2008 | |||||||||||
| (in millions, except percentage) | |||||||||||||||
Income (Loss) From Discontinued Operations, Net of Taxes | $ | 1.2 | (67 | )% | $ | 3.8 | n/a | $ | (4.2 | ) | |||||
43
The change in discontinued operations in fiscal 20072010 compared to fiscal 20062009 was attributable to the release of the $1.2 million related to the amended promissory note agreement with Overland, in which Overland was allowed to pay us the remaining $1.2 million receivable plus accrued interest by March 31, 2010. We released the reserve on the receivable as cash was collected due to the continued concern of Overland’s ability to pay us.
The change in discontinued operations in fiscal 2009 compared to fiscal 2008 was primarily driven by continued proceeds fromthe sale of the Snap Server NAS business to Overland in June 2008. We recorded a gain of $4.6 million on the disposal of the IBM i/p Series RAIDSnap Server NAS business in fiscal 2009 in “Gain on September 30, 2005 anddisposal of discontinued operations, net of taxes,” which included a $1.2 million reserve on the divestiturereceivable that was due to us 12 months after the closing of the OEM block-based systems business on January 31, 2006. The contributiontransaction due to the financial difficulties Overland has reported, and incurred a “Loss from discontinued operations, in fiscal 2007 was primarily related to residual royalty revenue from the salenet of the IBM i/p Series RAID business, which was partially offset by an additional estimated loss due to our inability to sublease our facility associated with the IBM i/p Series RAID business. To the extent that we are unable to sublease this facility by the endtaxes” of the lease term, which is June 2010, we may continue to record additional losses in discontinued operations$0.9 million in the future. In addition, discontinued operations in fiscal 2007 included inventory adjustments related to the divestitureConsolidated Statements of the OEM block-based systems business.Operations.
Liquidity and Capital Resources
Key Components of Cash Flow
Working Capital: As Our principal source of liquidity is cash on hand. We focus on managing the critical components of working capital, which include receivables, inventory, payables and short-term debt. Our working capital at March 31, 2010, 2009 and 2008 we reclassified the 3/4% Notes of $225.3was $377.0 million, from long-term liabilities to short-term liabilities, as we believe the holders of these 3/4% Notes will exercise their put option in December 2008. $385.2 million and $424.7 million, respectively.
The reclass of the 3/4% Notes was the primary reason for the decrease in working capital at March 31, 2010 compared to March 31, 2009 of $191.4$8.2 million was attributable to $424.7(1) a decrease in prepaid expenses and other current assets of $3.4 million forprimarily due to a tax refund received from the State of California and other foreign jurisdictions; (2) a decrease in accounts receivable of $4.2 million primarily due to lower revenue levels and our improved collection efforts; and (3) a decrease in inventory of $1.8 million due to improved efficiencies in our inventory and operations management. This was offset by decreases in accounts payables and accrued liabilities of $2.3 million as we have improved our payment turns.
The decrease in working capital at March 31, 2009 compared to March 31, 2008 comparedof $39.4 million was attributable to $616.0(1) a decrease in total current assets of $272.0 primarily driven by the utilization of $222.9 million for March 31, 2007. Without the reclassification of theto repurchase our 3/4% Notes working capital would have improved by $34.0and, to a lesser extent, $38.0 million of cash used to acquire Aristos; (2) a decrease in accounts receivable of $11.5 million primarily driven by an increasedue to lower revenue levels and our improved collection efforts; (3) a decrease in cashinventory of $5.8 million due to improved efficiencies in our inventory and cash equivalents,operations management; and (4) decreases in the combined with marketable securities,balances of $538prepaid expenses and other current assets of $3.4 million as well as accounts payables and accrued liabilities of $7.7 as we operate on a smaller business scale, which included reducing and streamlining our operating expenses. These decreases were offset by the other changes in current assets and current liabilities.our positive cash flows from operations.
Working capital increased by $93.9 million to $616.0 million as of March 31, 2007 from $522.0 million as of March 31, 2006. The increase in working capital was attributable to an increase of other assets of $6.9 million, an increase in assets held for sale of $12.5 million, an increase in marketable securities of $51.3 million, a decrease of $35.4 million related to cash equivalents combined with a decrease of accounts payable of $12.1 million and a decrease of $50.6 million in accrued liabilities.
Operating activities: Operating cash activities consist of income (loss)loss from continuing operations, net of taxes, adjusted for certain non-cash items and changes in assets and liabilities. Non-cash items primarily consist of the non-cash effect of tax settlement, impairment charges, gain on sale of long-lived assets, gain on the repurchase of the 3/4% Notes, depreciation and amortization of intangible assets, property and equipment, marketable securities and 3/4% Notes, and stock-based compensation expense recognized in accordance with SFAS No. 123(R). As of March 31, 2008, we had cash, cash equivalents, marketable securities and restricted marketable securities of $627.9 million and net accounts receivable of $23.2 million.
expense. Net cash provided by operating activities totaledwas $3.4 million, $13.7 million and $22.8 million in fiscal years 2010, 2009 and 2008, resulting primarily from a net loss of $10.1 million, and non-cash adjustments for depreciation and amortization expense of $8.2 million, stock-based compensation expense of $6.6 million, inventory related charges of $6.9 million, and ($6.7) million of gain on assets.respectively.
During fiscal 2008 accounts receivable decreased by $10.9 million, primarily due to lower revenue levels and improved collection efforts, inventory decreased by $10.1 million, primarily driven by lower revenue levels and improved efficienciesThe decline in our inventory management, primarily with our contract manufacturer, and accounts payable decreased by $15.8 million due to the lower revenue and inventory levels
Net cash provided by operating activities in fiscal 2007 improved to $14.8 million compared to cash used in operating activities of $7.1 million in fiscal 2006was primarily due to the fact that we recorded aan increase in loss from continuing operations, net of taxes of $135.8$4.7 million, a non-cash charge related to a gain on extinguishment of debt of $1.7 million recorded in fiscal 2006, compared to2009 and a recorded income from continuing operations, net of taxes, of $24.8 milliondecrease in fiscal 2007. The net cash provided by operating activities improved for fiscal 2007 primarily due to changes in depreciation and amortization of intangible assets, property and equipment and marketable securities of $17.3 million, an impairment charge of intangible assets of $13.2 million, inventory- relatedinventory-related charges of $12.9 million, stock-based compensation related to the adoption of SFAS No. 123(R) of $8.5 million and impairment of a minority investment of $0.9$2.8 million. Additional factors included the non-cash effect of tax settlement of $60.2 million andThis was offset by changes toin working capital assets and liabilities that decreased cash provided by operating activitiesoperations by $10.7$4.6 million, an increase in non-cash charges related to depreciation and amortization of which $11.4$2.3 million wasprimarily due to a reductionthe amortization of purchased intangible assets from the Aristos acquisition in accounts payable,September 2008 and an increase in stock-based compensation of $2.7 million due primarily to the modification of certain stock-based awards in fiscal 2010 and the impact caused by the true-up of actual forfeitures in fiscal 2009, which reduced our stock-based compensation expense during that period. In fiscal 2010, cash received from customers totaled $77.9 million and cash paid to suppliers and employees for payroll totaled $96.3 million. In fiscal 2010, income from continuing operations, net of taxes, included interest income of $8.5 million.
The decline in cash provided by operating activities in fiscal 2009 compared to fiscal 2008 was primarily due to changes in working capital assets and liabilities that decreased cash provided by operations by $9.3 million, an increase in loss from continuing operations, net of discontinuedtaxes by $8.6 million and a decrease in inventory-related charges of $3.8 million. This was offset by a non-cash charge due to the impairment of goodwill of $16.9 million recorded in fiscal 2009. In fiscal 2009, cash received from customers totaled $126.2 million and cash paid to suppliers and employees for payroll totaled $138.7 million. In fiscal 2009, loss from continuing operations, net of $7.2taxes, included interest income of $16.9 million.
Investing activities: Investing cash activities primarily consist of purchases, sales and maturities of restricted marketable securities and marketable securities, net cash used for acquisitions, proceeds from the sale of businesses and long-lived assets, and purchases of property and equipment. Net cash used in investing activities was $50.4 million in fiscal 2010 compared to net cash provided by investing activities wasof $85.4 million and $115.1 million in fiscal years 2009 and 2008, compared to cash used in investing activitiesrespectively. In fiscal 2010, we entered into a software license agreement with Synopsys for $1.8 million, of $49.1which $0.7 million was paid in fiscal 2007. The increase was primarily due to2010 and the remaining $1.1 million will be paid through March 2011. In fiscal 2009, we acquired Aristos for $38.0 million. In fiscal 2008, we received proceeds received from the sale of long- livedlong-lived assets of $19.9 million and a decrease inmillion. In fiscal 2010, we utilized cash for the net purchases of marketable securities of $181.3$48.9 million asand we are currently managingreceived cash proceeds from the net sales and maturities of our marketable securities of $123.2 million and $96.8 million in fiscal years 2009 and 2008, respectively. We continue to manage our cash through interest-bearing accounts. This was partially offset by a decrease in sales and maturities of marketable securities of $278.1 million.
Cash used in investing activities was $49.1 million and $287.3 million in fiscal years 2007 and 2006, respectively. Cash used in investing activities in fiscal 2007 was primarily due to purchases of restricted marketable securities and marketable securities, net of sales and maturities, of $43.9 million and purchasesWe also minimized our purchasing of property and equipment of $3.7 million. Cash used in investing activities infrom fiscal 2006 was primarily due2008 to purchases of restricted marketable securities and marketable securities, net of sales and maturities, of $340.9 million and purchasesfiscal 2009 as we continued to focus on cost control programs; however, we increased our purchasing of property and equipment from fiscal 2009 to fiscal 2010 primarily due to our investment in research and development of $7.1 million, partially offset by proceeds from the sale of the IBM i/p Series RAID and Systems businesses of $33.6 million and the sale of the Singapore manufacturing assets of $26.0 million.new technologies.
Financing activities: Financing cash activities primarily consist of repurchases onof long-term debt and our common stock under the repurchase program, and employee stock option exercises. Net cash provided byused in financing activities was $3.2 million in fiscal 2008years 2010 and 2009 was $1.4 million and $223.6 million, respectively, compared to cash used inprovided by financing activities of $3.2 million in fiscal 2007. The increase was primarily due to the repurchase2008. In fiscal years 2010 and 2009, we repurchased $0.1 million and $224.5 million, respectively, in principal amount of our remaining outstanding 3%3/4% Notes for $10.6an aggregate price of $0.1 million and $222.9 million, respectively. In fiscal years 2010 and 2009, we also repurchased $1.7 million and $2.4 million, respectively, of our common stock in fiscal 2007, offset byconnection with our authorized stock repurchase program. We continue to experience a decline in the issuance of common stock under our equity compensation programs from fiscal 2008 in stock option exercises,to fiscal 2009 and from fiscal 2009 to fiscal 2010, which was attributable to a large number of options held by our employees whose exercise prices were substantially above the current market value of our common stock combined with a reduction in our headcount andheadcount.
Common Stock Repurchase Program
In July 2008, our Board of Directors authorized a decline instock repurchase program to purchase up to $40 million of our common stock. During fiscal 2010, we purchased approximately 0.7 million shares of our common stock at an average price of $2.46 for an aggregate purchase price of $1.7 million, excluding brokerage commissions. During fiscal 2009, we purchased approximately 1.0 million shares of our common stock at an average price of $2.29 for an aggregate purchase price of $2.4 million, excluding brokerage commissions. We have accounted for these treasury shares, which have not been retired or reissued, under the treasury method. All purchases made under our 1986 Employee Stock Purchase Plan, which expiredthe program were made in April 2006.the open market. As of March 31, 2010, $35.9 million remained available for repurchase under the authorized stock repurchase program.
Cash used in financing activities was $3.2 millionLiquidity and $14.9 million in fiscal years 2007 and 2006, respectively. The cash used in financing activities in fiscal years 2007 and 2006 was driven by the repurchase of our 3% Notes for $10.6 million and $24.3 million, respectively, offset by the issuance of common stock in connection with purchases made under our employee stock purchase plan and stock option exercises of $7.4 million and $9.4 million, respectively.Capital Resource Requirements
Liquidity, Capital Resources and Financial Condition
At March 31, 2008,2010, we had $626.2$375.3 million in unrestricted cash, cash equivalents and marketable securities, of which approximately $95.7$4.1 million was held by our Singaporeforeign subsidiaries whose functional currency is the local currency. Our available-for-sale securities included short-term deposits, corporate obligations, commercial paper, municipal bonds, United States government securities, government agencies, and Cayman Licensing subsidiaries. other debt securities related to mortgage-back and asset-backed securities, and were recorded on our Consolidated Balance Sheets at fair market value, with their related unrealized gain or loss reflected as a component of “Accumulated other comprehensive income, net of taxes” in the Consolidated Statements of Stockholders’ Equity.
45
Our investment policy focuses on three objectives: to preserve capital, to meet liquidity requirements and to maximize total return. Our investment policy establishes minimum ratings for each classification of investments when purchased and investment concentration is limited to minimize risk. The policy also limits the final maturity on any investment and the overall duration of the portfolio. Given the overall market conditions, we regularly review our investment portfolio to ensure adherence to our investment policy and to monitor individual investments for risk analysis and proper valuation.
In fiscal years 2010 and 2009, we did not recognize a material loss on our securities as the unrealized losses incurred were not deemed to be other-than-temporary. We hold our marketable securities as available-for-sale and mark to market. We expect to realize the full value of all our marketable securities upon maturity or sale, as we have the intent and ability to hold the securities until the full value is realized. However, we cannot provide any assurance that our invested cash, cash equivalents and marketable securities will not be impacted by adverse conditions in the financial markets, which may require us to record an impairment charge that could adversely impact our financial results.
In addition, we maintain our cash, cash equivalents and marketable securities with certain financial institutions, in which our balances exceed the limits that are insured by the Federal Deposit Insurance Corporation. If the underlying financial institutions fail or other adverse conditions occur in the financial markets, our cash balances may be impacted.
In the fourth quarter of fiscal 2005, we repatriated $360.6 million of undistributed earnings from Singapore to the United States and incurred a tax liability of $17.6 million. The repatriated amounts are beingwere used to fund a qualified Domestic Reinvestment Plan, as required by the American Jobs Creation Act of 2004. IfWe believe we do not spendthe repatriated funds in accordance withhave met the total spending requirements of the Domestic Reinvestment Plan based on our reinvestment plan,actual spending through fiscal 2009; therefore, no further tax liabilities are expected to be incurred related to this distribution. However, fiscal years 2004 onward remain open to examination by the U.S. taxing authorities. As a result, we may incur additional tax liabilities. As of March 31, 2008,liabilities related to this distribution until fiscal years 2004 through 2009 are closed by the U.S. taxing authorities.
If the PMC Transaction is not consummated, we have provided for U.S. deferred income taxesmay enter into strategic alliances or foreign withholding taxes on the remaining undistributed earnings of $221.1 million since these earnings are not intendedpartnerships that will enable us to be reinvested indefinitely. The additional U.S. deferred income taxes and foreign withholding taxes were offset by decreases inbetter scale our valuation allowance, and the net effect was immaterialoperations relative to our resultscost basis. If we are successful in identifying attractive strategic alliances or partnerships, we may be required to use a significant portion of operationsour available cash balances.
After taking into consideration the PMC Transaction, we expect capital expenditures of approximately $0.2 million during fiscal 2011, without taking into account identifying and our provision for taxes.
acquiring new, profitable business operations.
We have invested in technology companies through two venture capital funds, Pacven Walden Venture V Funds and APV Technology Partners II, L.P. At March 31, 2008,2010 and 2009, the carrying value of such investments aggregated $1.6 million.
On March 31, 2008,$1.2 million for each period, which were based on quarterly statements we had a liability of $225.3 million of aggregate principal amount, plus a premium, related to our 3/4% Notes that are due in December 2023. Each holderreceive from each of the 3/4% Notesfunds. The statements are generally received one quarter in arrears, as more timely valuations are not practical. The statements reflect the net asset value, which we use to determine the fair value for these investments, which (a) do not have a readily determinable fair value and (b) either have the attributes of an investment company or prepare their financial statements consistent with the measurement principles of an investment company. The assumptions we use due to lack of observable inputs may impact the fair value of these equity investments in future periods. We recorded a charge of $0.4 million in fiscal 2009 to the Statements of Operations due to a decline in the values of these investments. While we have seen some improvement in global economic conditions, any adverse changes in equity investments and current market conditions may require us to purchaserecord an impairment charge against all or a portion of its 3/4% Notes on December 22, 2008 at a price equal to 100.25% of the 3/4% Notes to be purchased plus accrued and unpaid interest. In addition, each holder of the 3/4% Notes may require us to purchase all or a portion of its 3/4% Notes on December 22, 2013, on December 22, 2018 or upon the occurrence of a change of control (as definedinvestments in the indenture governing the 3/4% Notes) at a price equal to the principal amount of 3/4% Notes being purchased plus any accrued and unpaid interest. We expect all of the holders of the 3/4% Notes to exercise their put option in December 2008 (See Note 7 for a detailed discussion of our debt and equity transactions). Our current investment strategy is consistent with our expectations that the holders of the 3/4% Notes will exercise their right to require us to repurchase the 3/4% Notes in December 2008.
We are required to maintain restricted investments to serve as collateral for the first ten scheduled interest payments on our 3/4% Notes. As of March 31, 2008, we had $1.6 million of restricted marketable securities, consisting of United States government securities, which were classified as short-term, that served as such collateral.
We expect capital expenditures of between $1 million and $2 million during fiscal 2009, without taking into account any acquisitions.
We were previously subject to IRS audits for our fiscal years 1994 through 2003. During the third quarter of fiscal 2007, we reached resolution with the United States taxing authorities on all outstanding audit issues relating to those fiscal years. However, our tax provision continues to reflect judgment and estimation regarding components of the settlement such as interest calculations and the application of the settlements to state and local taxing jurisdictions. Although we believe our tax estimates are reasonable, the ultimate tax outcome may materially differ from the tax amounts recorded in our consolidated financial statements and may cause a higher effective tax rate that could materially affect our income tax provision, results of operations or cash flows in the period or periods for which such determination is made. The IRS is currently auditing our Federal income tax returns for the fiscal 2004 through 2006 audit cycle. We believe that we have provided sufficient tax provisions for these years and the ultimate outcome of the IRS audits will not have a material adverse impact on our financial position or results of operations in future periods. However, we cannot predict with certainty how these matters will be resolved and whether we will be required to make additional tax payments.
We may enter into strategic alliances, partnerships or acquisitions that will enable us to better scale our operations relative to our cost basis. If we are successful in identifying attractive strategic alliances, partnerships or acquisitions, we may be required to use a significant portion of our available cash balances. future.
We believe that our cash balances and the expected cash flows generated by operations and available sources of equity will be sufficient to satisfy our anticipated cash needs for working capital and capital expenditures for at least the next 12 months. However,The consummation of the PMC Transaction may materially change our operations, including our anticipated cash needs as we may require additionalintend to explore strategic alternatives to maximize stockholder value going forward, including deploying the proceeds of the PMC Transaction and our other assets
in seeking business acquisition opportunities and other actions to redeploy our capital. In addition, should prevailing economic conditions and/or financial, business and other factors beyond our control adversely affect our estimates of our future cash requirements, we would be required to fund acquisitions or investment opportunities.our cash requirements by alternative financing. In these instances, we may seek to raise such additional funds through public or private equity or debt financings or from other sources. We may not be able to obtain adequate or favorable financing at that time. Any equity financing we obtain may dilute existing ownership interests, and any debt financing could contain covenants that impose limitations on the conduct of our business. There can be no assurance that additional financing, if needed, would be available on terms acceptable to us or at all.
The following table summarizesCommitments and Contingencies
Legal Proceedings
We are a party to litigation matters and claims, including those related to intellectual property, which are normal in the course of our operations, and while the results of such litigation matters and claims cannot be predicted with certainty, we believe that the final outcome of such matters will not have a material adverse impact on our financial position or results of operations. However, because of the nature and inherent uncertainties of litigation, should the outcome of these actions be unfavorable, our business, financial condition, results of operations and cash flows could be materially and adversely affected.
Risks and Uncertainties
In December 2009, we announced that we initiated a process to pursue the potential sale or disposition of certain of our assets or business operations. On May 8, 2010, subsequent to our fiscal year-end, we entered into an agreement relating to the PMC Transaction and we anticipate that the PMC Transaction will be consummated in June 2010. Whether or not the PMC Transaction is consummated, our revenues may be negatively impacted during the pre-closing period as it creates uncertainty in the marketplace for our existing customers and end-users, who may be less likely to place orders as a result of this uncertainty. If we consummate the PMC Transaction, it may incur significant charges in the future, which charges include, but are not limited to, increased amortization or depreciation of our long-lived assets due to potential changes to the expected remaining useful lives, a potential impairment of our long-lived assets, restructuring charges, acceleration of compensation expense related to unvested stock-based awards, potential cash bonus payments and potential accelerated payments of certain of our contractual obligations, which may impact our results of operations and financial condition. The aggregate of these amounts cannot be quantified at March 31, 2008.
associated compensation expense, and restructuring charges are discussed in Note 7, 9 and 11, respectively, to the Consolidated Financial Statements.Contractual Obligations (in thousands) Payments Due By Period - ---------------------------------------- ---------------------------------------------------------- Less More than than Total 1 year 1-3 years 3-5 years 5 years ---------- ---------- ---------- ---------- ----------Long-Term Debtthis time. Further subsequent event disclosures related to expected changes to the remaining useful lives of our long-lived assets, stock-based activity andAssociated Interest(1)$ 226,238 $ 226,238 $ -- $ -- $ -- Operating Leases 12,876 5,012 6,533 1,331 -- Purchase Obligations (2) 14,886 14,886 -- -- -- Other Long-Term Liabilities (3) 810 -- -- -- 810 ---------- ---------- ---------- ---------- ---------- Total $ 254,810 $ 246,136 $ 6,533 $ 1,331 $ 810 ========== ========== ========== ========== ==========
________________________Convertible Subordinated Notes
(1) Long-term debt includes anticipated interest payments onIn fiscal 2009, we repurchased a total of $191.0 million in principal amount of our 3/4% Notes that are noton the open market for an aggregate price of $188.9 million, resulting in a gain on extinguishment of debt of $1.7 million (net of unamortized debt issuance costs of $0.4 million), which was recorded on ourwithin “Interest and other income, net” in the Consolidated Balance Sheets. As we expect allStatements of Operations. In addition, the majority of the remaining holders of the 3/4% Notes to exerciseexercised their put option in December 2008 and January 2009, which would requirerequired us to purchase all or a portion of theirour 3/4% Notes at a price equal to 100.25% of the face valueprincipal of the 3/4% Notes, to be purchasedresulting in the redemption of the 3/4% Notes for an aggregate cost of $34.0 million, plus accrued and unpaid interest, any future repurchases would reduce anticipated interest and/orinterest. In fiscal 2010, we repurchased a total of $0.1 million at a price equal to 100% of the principal payments.
(2) Foramount of the purposes3/4% Notes. At March 31, 2010, we had a remaining liability of this table, contractual obligations for the purchase$0.3 million of goods or services are defined as agreementsaggregate principal amount related to our 3/4% Notes that are enforceable, non-cancelable and legally binding and that specify all significant terms, including: fixed or minimum quantities to be purchased; fixed, minimum or variable price provisions; and the approximate timing of the transaction. Our purchase orders are based on our current needs and are fulfilled by our vendors within short time horizons. The expected timing of payment of the obligations discussed above was estimated based on information available to us as of March 31, 2008. Timing of payments and actual amounts paid may be different depending on the time of receipt of goods or services or changes to agreed-upon amounts for some obligations.
(3) Other long-term liabilities primarily consist of a defined benefit retirement plan at one of our foreign subsidiaries that we acquireddue in fiscal 2004. The liability is calculated in accordance with statutory government plans.
(4) In addition to the amounts shown in the table above, $4.4 million of unrecognized tax benefits have been recorded as liabilities in accordance with FIN 48. The timing of any payments which could result from the unrecognized tax benefits will depend upon a number of factors. Accordingly, the timing of payment cannot be estimated. We do not expect a significant tax payment related to the obligation to occur within the next 12 months.
Off Balance-Sheet Arrangements
In conjunction with the issuanceDecember 2023. Each remaining holder of the 3/4% Notes may require us to purchase all or a portion of our 3/4% Notes on December 22, 2013, on December 22, 2018 or upon the occurrence of a change of control (as defined in December 2003, we entered into a convertible bond hedge transaction with an affiliate of one of the original purchasers ofindenture governing the 3/4% Notes. The convertible bond hedge is designedNotes) at a price equal to mitigate stock dilution from conversionthe principal amount of the 3/4% Notes. The convertible bond hedge has value if the average market price per share of our common stock upon exerciseNotes being purchased plus any accrued and unpaid interest and we may redeem some or expiration of the bond hedge is greater than $11.704 per share. Under the convertible bond hedge arrangement, the counterparty agreed to sell to us up to 19.2 million shares of our common stock, which is the number of shares issuable upon conversionall of the 3/4% Notes in full,for cash at a redemption price equal to 100% of $11.704 per share. The convertible bond hedge transactionthe principal amount of the notes being redeemed, plus accrued interest to, but
47
excluding, the redemption date. We may seek to make open market repurchases of the remaining balance of our 3/4% Notes within the next twelve months (See Note 8 to the Consolidated Financial Statements for a detailed discussion of our debt and equity transactions).
Intellectual Property and Other Indemnification Obligations
We have entered into agreements with customers and suppliers that include intellectual property indemnification obligations. These indemnification obligations generally require us to compensate the other party for certain damages and costs incurred as a result of third party intellectual property claims arising from these transactions. In each of these circumstances, payment by us is conditional on the other party making a claim pursuant to the procedures specified in the particular contract, which procedures typically allow us to challenge the other party’s claims. Further, our obligations under these agreements may be settledlimited in terms of time and/or amount, and in some instances, we may have recourse against third parties for certain payments made by it under these agreements. In addition, we have agreements whereby we indemnify our directors and certain of our officers for certain events or occurrences while the officer or director is, or was, serving at our option eitherrequest in cashsuch capacity. These indemnification agreements are not subject to a maximum loss clause; however, we maintain a director and officer insurance policy which may cover all or net shares and expires in December 2008. Settlementa portion of the convertible bond hedge in net shares onliabilities arising from our obligation to indemnify our directors and officers. It is not possible to make a reasonable estimate of the expiration date would result in us receiving a numbermaximum potential amount of sharesfuture payments under these or similar agreements due to the conditional nature of our common stock with a value equal to the amount otherwise receivable on cash settlement. Should there be an early unwind of the convertible bond hedge transaction, the amount of cash or net shares potentially received by us will depend upon then-existing overall market conditions, and on our stock price, the volatility of our stockobligations and the unique facts and circumstances involved in each particular agreement. Historically, we have not incurred significant costs to defend lawsuits or settle claims related to such agreements and no amount of time remaining onhas been accrued in the convertible bond hedge. The fair value of the 3/4% Notes as ofaccompanying Consolidated Financial Statements with respect to these indemnification guarantees.
Contractual Obligations
Our contractual obligations at March 31, 2008 was $216 million.2010 are as follows:
| Payments Due By Period | |||||||||||||||
Contractual Obligations (in thousands) | Total | Less than 1 year | 1-3 years | 3-5 years | More than 5 years | ||||||||||
Long-term debt(1) | $ | 349 | $ | 349 | $ | — | $ | — | $ | — | |||||
Operating lease obligations(2) | 3,443 | 2,329 | 1,020 | 94 | — | ||||||||||
Purchase obligations(3) | 12,405 | 12,405 | — | — | — | ||||||||||
Other long-term liabilities(4) | 934 | — | — | — | 934 | ||||||||||
Tax obligations(5) | 3,656 | — | 3,656 | — | — | ||||||||||
HCL agreement(6) | 2,866 | 2,116 | 750 | — | — | ||||||||||
Certain compensation costs(7) | 1,241 | 1,241 | — | — | — | ||||||||||
Total | $ | 24,894 | $ | 18,440 | $ | 5,426 | $ | 94 | $ | 934 | |||||
| (1) | Long-term debt includes anticipated interest payments on our 3/4% Notes that are not recorded on our Consolidated Balance Sheets. As we will seek to make open market repurchases of the remaining balance of our 3/4% Notes within the next twelve months, we have continued to classify the 3/4% Notes as short-term obligations, due less than one year. Any future repurchases of our 3/4% Notes would reduce anticipated interest and/or principal payments. |
| (2) | Operating lease obligations include amounts recorded in “Accrued and other liabilities” and “Other long-term liabilities” on our Consolidated Balance Sheets of $0.6 million and $0.2 million, respectively related to the consolidation of our facilities associated with our restructuring plans. Assuming the PMC Transaction is consummated, PMC-Sierra has agreed to assume the obligations for certain of our leased facilities, primarily related to our international sites. |
| (3) | For the purposes of this table, contractual obligations for the purchase of goods or services are defined as agreements that are enforceable, non-cancelable and legally binding and that specify all significant terms, including: fixed or minimum quantities to be purchased; fixed, minimum or variable price provisions; and the approximate timing of the transaction. Our purchase orders are based on our current needs and are |
| fulfilled by our vendors within short time horizons. The expected timing of payment of the obligations discussed above was estimated based on information available to us as of March 31, 2010. Timing of payments and actual amounts paid may be different depending on the time of receipt of goods or services or changes to agreed-upon amounts for some obligations. |
| (4) | Other long-term liabilities included a defined benefit retirement plan at one of our foreign subsidiaries that we acquired in fiscal 2004. The liability is calculated in accordance with statutory government plans. |
| (5) | Tax obligations relate to liabilities for uncertain tax positions, which were reflected in “Other long-term liabilities.” The timing of any payments which could result from the unrecognized tax benefits will depend upon a number of factors. Management believes that it is not reasonably possible that the net unrecognized tax benefits will change significantly within the next 12 months. For the purposes of this table, we have disclosed the gross unrecognized tax benefits in the “one to three years” column based on our estimate on the timing of payment for the remaining tax obligations. |
| (6) | The strategic development agreement relates to a three-year agreement with HCL, to provide product development and engineering services for our product portfolio. However, this agreement will be transferred to PMC-Sierra assuming the PMC Transaction is consummated. |
| (7) | Certain compensation costs represents expected payments based on the probability that specified objectives will be received, including objectives related to the potential sale or other disposition of certain of our assets and business operations based on a consulting service agreement that we entered into with Subramanian Sundaresh, our former CEO, and other contractual arrangements with certain management or executive officers. Of the $1.2 million of certain compensation costs disclosed in the above table, $1.1 million is recorded in “Accrued and other liabilities” on our Consolidated Balance Sheets. |
Critical Accounting Policies and Estimates
Our discussion and analysis of our financial condition and results of operations are based on our consolidated financial statements,Consolidated Financial Statements, which have been prepared in accordance with accounting principles generally accepted in the United States. Note 1 to the Consolidated Financial Statements describes the significant accounting policies essential to our consolidated financial statements.Consolidated Financial Statements. The preparation of these financial statements requires estimates and assumptions that affect the reported amounts and disclosures. Although we believe that our judgments and estimates are appropriate and correct, actual future results may differ materially from our estimates.
We believe the following to be our critical accounting policies because they are both important to the portrayal of our financial condition and results of operations and they require critical management judgments and estimates about matters that are uncertain. If actual results or events differ materially from those contemplated by us in making these estimates, our reported financial condition and results of operation for future periods could be materially affected. See "Risk Factors"“Risk Factors” for certain risks relating to our future operating results.
Revenue Recognition: We recognize revenue from the majority of our product sales, including sales to OEMs, distributors and retailers, upon shipment from us, provided that title has passed, persuasive evidence of an arrangement exists, the price is fixed or determinable and collectibility is reasonably assured. Revenue from sales where software is essential to the functionality is recognized when passage of title and risk of ownership is transferred to customers, persuasive evidence of an arrangement exists, which is typically upon sale of product by our customer, the price is fixed or determinable and collectibility is reasonably assured.probable. We consider the following basicmany different criteria for evaluating revenue recognition on sales transactions: SAB No. 104, EITF No. 00-21, SOP No. 97-2, and SFAS No. 48, among other related interpretations.transactions. The application of the appropriate accounting principle to our revenue is dependent upon specific transactions or combinations of transactions. Significant management judgments and estimates must be made and used in connection with the revenue recognized in any accounting period.
Our channel arrangements provide for certain product rotation rights. Additionally, we permit the return of products subject to certain conditions. We establish allowances for expected product returns in accordance with SFAS No. 48.returns. We also establish allowances for rebate payments under certain marketing programs entered into by our channel partners. These
49
allowances are recorded as direct reductions of revenue and accounts receivable. We make estimates of future returns and rebates based primarily on our past experience as well as the volume of products in the channel, trends in channel inventory, economic trends that might impact customer demand for our products (including the competitive environment), the economic value of the rebates being offered and other factors. In the past, actual returns and rebates have not been significantly different from our estimates, however, actual returns and rebates in any future period could differ from our estimates, which could impact the net revenue we report.
We maintain an allowance for doubtful accounts for losses that we estimate will arise from our customers'customers’ inability to make required payments. We make estimates of the collectibility of our accounts receivable by considering factors such as historical bad debt experience, specific customer creditworthiness, the age of the accounts receivable balances and current economic trends that may affect a customer'scustomer’s ability to pay. If the financial condition of our customers deteriorates or if economic conditions worsen, increases in the allowance for doubtful accounts may be required in the future. We cannot predict future changes in the financial stability of our customers, and there can be no assurance that our allowance for doubtful accounts will be adequate. The allowance for doubtful accounts was $519,000
Cash, Cash Equivalents and $258,000Marketable Securities Valuation: Our marketable securities are classified as available-for-sale and are reported at fair market value, inclusive of unrealized gains and losses, as of March 31, 2007the respective balance sheet date. Marketable securities consist of corporate obligations, commercial paper, municipal bonds, United States government securities, government agencies, and 2008, respectively.other debt securities related to mortgage-back and asset-backed securities Our Consolidated Balance Sheet is updated at each reporting period to reflect the change in the fair value of our marketable securities that have declined below or risen above their original cost. Our Statements of Operations reflects a charge in the period in which a determination is made that the decline in fair value is considered other-than-temporary. We do not hold our securities for trading or speculative purposes.
Inventory:Inventory: Inventory is stated at the lower of cost (principally standard cost which approximates actual cost on a first-in, first-out basis) or market value. The valuation of inventory requires us to estimate obsolete or excess inventory as well as inventory that are not of salable quality. The determination of obsolete or excess inventory requires us to estimate the future demand for our products within specific time horizons, generally six to twelve months. To the extent our demand forecast for specific products is less than quantities of our product on hand and our non-cancelable orders, we could be required to record additional inventory reserves, which would have a negative impact on our gross margin. Additionally, if actual demand is higher than our demand forecast for specific products that have been fully reserved, our future margins may be higher.
Stock-based compensation: In the first quarter of fiscal 2007, we adopted SFAS No. 123(R) using the modified prospective method and began accounting for our stock-based compensation using a fair-valued based recognition method. Under the provisions of SFAS No. 123(R), stock-based compensation cost is estimated at the grant date based on the fair- value of the award and is recognized as expense ratably over the requisite service period of the award. Determining the appropriate fair-value model and calculating the fair value of stock-based awards at the grant date requires considerable judgment, including estimating stock price volatility, expected option life and forfeiture rates. We develop our estimates based on historical data and market information which can change significantly over time. A small change in the estimates used can have a relatively large change in the estimated valuation.
We use the Black-Scholes option valuation model to value stock awards. We estimate stock price volatility based on an average of our historical volatility and the implied volatility derived from traded options on our stock. Estimated option life and forfeiture rate assumptions are derived from normalized historical data. For stock-based compensation awards with graded vesting that were granted after fiscal 2006, we recognize compensation expense using the straight-line amortization method over the requisite service period of the awards and adjusted for estimated forfeitures.
Income Taxes:On April 1, 2007, we adopted FIN 48, which clarifies the accountingWe account for uncertainty in income taxes recognized in an enterprise's financial statements in accordance with SFAS No. 109. FIN 48 requiresfor uncertain tax positions using a two-step process to determine the amount of tax benefit to be recognized. First, the tax position must be evaluated to determine the likelihood that it will be sustained upon external examination. If the tax position is deemed "more-likely-than-not"“more-likely-than-not” to be sustained, the tax position is then assessed to determine the amount of benefit to recognize in our financial statements. The amount of the benefit that may be recognized is the largest amount that has a greater than 50 percent likelihood of being realized upon ultimate settlement. Prior to the adoption of FIN 48, our policy was to classify accruals for uncertain positions as a current liability unless it was highly probable that there would not be a payment or settlement for such identified risks for a period of at least a year. In addition, upon the adoption of FIN 48, we continued to recognize interest and/or penalties related to uncertain tax positions as income tax expense in our Consolidated Statements of Operations.
We must make certain estimates and judgments in determining income tax expense for financial statement purposes. These estimates and judgments occur in the calculation of certain tax assets, tax credits, benefits, deductions and liabilities, which arise from differences in the timing of recognition of revenue and expense for tax and financial statement purposes, as well as the interest and penalties related to those uncertain tax positions. Significant changes to these estimates may result in an increase or decrease to our tax provision in subsequent periods.
In the fiscal 2008, we experienced significant variances in the impact of specific rate items compared to prior years. The majority of the effective tax rate differences were driven by the overall decrease in our consolidated net loss from $28.7 million in fiscal 2007 to $12.1 in fiscal 2008. Other significant shifts include the impact of tax reserves, foreign losses not benefited, foreign income taxed at non-U.S. rates, and distributions from subsidiaries.
We must assess the likelihood that we will be able to recover our deferred tax assets. We consider historical levels of income, expectations and risks associated with estimates of future taxable income and ongoing prudent and feasible tax planning strategies in assessing the need for the valuation allowance. If recovery is not likely, we must increase our provision for taxes by recording a valuation allowance against the deferred tax assets that we estimate will not ultimately be recoverable. As a result of our analysis of expected future income at March 31, 2008, the full valuation allowance against our net U.S. deferred tax assets totaled $44.6 million.
In addition, the calculation of our tax liabilities involves dealing with uncertainties in the application of complex global tax regulations. We recognize liabilities for anticipated tax audit issues in the United States and other tax jurisdictions based on our estimate of whether, and the extent to which, additional taxes and related interest will be due. If we ultimately determine that payment of these amounts is unnecessary, we reverse the liability and recognize a tax benefit during the period in which we determine that the liability is no longer necessary. We record an additional charge in our provision for taxes in the period in which we determine that the recorded tax liability is less than we expect the ultimate assessment to be. Tax related
Impairment of Long-Lived Assets: Long-lived assets primarily relate to our intangible assets and liabilities asproperty and equipment. Intangible assets are amortized over their estimated useful lives ranging from three months to five years, reflecting the pattern in which the economic benefits of March 31, 2007 reflect settlements reached during the fiscal year, which generated a net tax benefitassets are expected to be realized. Property and equipment are stated at cost and depreciated or amortized using the straight-line method over the estimated useful lives of $60.2 million in fiscal 2007 and $26.4 million in fiscal 2005. For a discussion of current tax matters, see Note 13 to the Consolidated Financial Statements.
Major Transactionsassets.
We regularly perform reviews to determine if facts or circumstances are continually exploring strategic acquisitionspresent, either internal or external, which would indicate that the carrying values of our long-lived assets may not be recoverable. Indicators include, but are not limited to, build upon our existing library of intellectual property and enhance our technological leadershipa significant decline in the marketsmarket price of a long-lived asset, an expectation that more likely than not, a long-lived asset will be sold or otherwise disposed of significantly before the end of its previously estimated useful life and a current period operating or cash flow loss combined with a historical or projected operating or cash flow loss.
The recoverability of the carrying value of the long-lived assets, other than goodwill, is based on the estimated future undiscounted cash flows derived from the use of the asset. If a long-lived asset is determined to be impaired, the loss is measured based on the difference between the long-lived asset’s fair value and its carrying value. The estimate of fair value of long-lived assets is based on a discounted estimated future cash flows method and applying a discount rate commensurate with the risks inherent in whichour current business model. Our current business model contains management’s subjective estimates and judgments; however, actual results may be materially different than the assumptions made by management.
Impairment Review
In December 2009, we operate. Below isannounced that we initiated a discussion regardingprocess to pursue the acquisitions and dispositions that were transacted duringpotential sale or disposition of certain of our assets or business operations. As a result of this announcement, we evaluated our long-lived assets to determine whether the carrying value would be recoverable in the third quarter of fiscal years 2008, 2007 and 2006.
Fiscal 2008
Dispositions
We recorded a net gain from discontinued2010. As we continued through this sale process on certain of our assets or business operations of $0.5 million, net of taxes, duringin the fourth quarter of fiscal 2008,2010, we reevaluated the recoverability of our long-lived assets’ carrying value at March 31, 2010. Based on our analysis, our long-lived assets were not considered impaired in either the third and fourth quarters of fiscal 2010 as the sum of the expected undiscounted future cash flows exceeded the carrying value of our long-lived assets of $27.4 million at March 31, 2010. The sum of the expected undiscounted future cash flows was weighted to take into consideration the possible outcomes of whether the long-lived assets, which relatedwere considered as one asset group based on the lowest level of independent cash flows generated, would be retained and utilized as opposed to sold or disposed. Subsequent to our fiscal year-end, as a result of the reduction of accrued liabilities associated withPMC Transaction and our intent to either continue to pursue the sale of the IBM i/p Series RAID business and related royalties. Additionally during the fourth quarter of fiscal 2008, we recorded an impairment of $2.4 million to writeour Aristos products or wind down the SSG intangible assets related tosale or dispose of our Aristos products within the Elipsan and Snap Appliance acquisitions to zero due to a revision in our forecasts that resulted in expected negative long-term cash flows for these assets for the first time.
Fiscal 2007
Reclassification
We decided to divest our systems business, including substantially all of the operating assets and cash flows that were obtained through the Snap Appliance and Eurologic Systems acquisitions,next six months, or by September 2010, as well as internally developed hardwareour consideration of the disposition or redeployment of our remaining non-core patents and softwarereal estate assets, we are expected to change the remaining useful life of our intangible assets of $16.0 million related to our Aristos products, which in turn, we expect to change the amount amortized prospectively during each reporting period. However, if the PMC Transaction is not consummated, we may not be able to realize our expected undiscounted future cash flows based on foreseen negative market perceptions. This may lead us to exit or divest in some additional or all of our current operations to focus on new opportunities. As a result, we will continue to reevaluate and reassess whether we may be required to record impairment charges for our long-lived assets in future periods.
51
Acquisitions
On September 2005. On July 6, 2006,3, 2008, we decidedcompleted the acquisition of Aristos, a provider of RAID technology to retain the Snap Serverdata storage industry. The Merger Agreement provided for our acquisition of Aristos through a merger in which Aristos became our wholly-owned subsidiary. The acquisition of Aristos was to allow us to expand into adjacent RAID markets that we believed would provide us with growth opportunities, including blade servers, enterprise-class external storage systems and performance desktops, and would provide us with a strong ASIC roadmap. In addition, this acquisition enabled us to pursue new OEM opportunities and expand our channel product offerings containing unified serial technologies.
We acquired Aristos for a purchase price of approximately $38.9 million, which consisted of: (i) approximately $28.7 million that was paid to certain Aristos senior preferred stockholders and warrant holders; (ii) approximately $3.2 million under a management liquidation pool established by Aristos prior to completion of the merger, which was immediately paid upon closing of the transaction; (iii) approximately $6.2 million to retire and satisfy certain commercial obligations and payables of Aristos; and (iv) $0.8 million accrued in direct transaction fees, including legal, valuation and accounting fees.
Aristos Holdback: A portion of the systems businessAristos acquisition price totaling $4.3 million referred to herein as the Aristos Holdback, was held in an escrow account to secure potential indemnification obligations of Aristos stockholders for unknown liabilities that may have existed as of the acquisition date. The Aristos Holdback was to be paid in two installments to the former Aristos stockholders during the twelfth and terminated our ongoing effortseighteenth months after the acquisition closing date, except for funds necessary to sell this business. This resultedprovide for any pending claims. The Aristos Holdback of $4.3 million was paid in full in fiscal 2010.
Management Liquidation Pool: As part of the Merger Agreement, we agreed to pay certain former employees of Aristos a total of $5.6 million through a management liquidation pool established by Aristos prior to the completion of the merger. Of the $5.6 million, $3.2 million was immediately paid upon closing of the transaction and was included in the reclassificationpurchase price allocation of the financial statementscost to acquire Aristos. The remaining $2.4 million was payable over time, not to exceed twelve months, contingent upon the continued employment of certain employees with us, and related disclosures for all periods presentedwas expensed to reflect the Snap Server portionConsolidated Statements of our systems businessOperations as continuing operations effective in the first quarterearned. In fiscal years 2010 and 2009, we recorded expense of fiscal 2007. This included recording an asset impairment charge of $13.2$0.1 million related to certain acquisition-related intangible assets and $0.7$2.3 million, for legal and consulting fees incurred in connection with our efforts that had been undertaken to sell the Snap Server portion of our systems business, which was recorded in "Other charges (gains)"respectively in the Consolidated Statements of Operations related to the management liquidation pool.
The Aristos acquisition was accounted for as a business combination and, accordingly, the results of Aristos have been included in fiscal 2007.
In addition, we reorganized our segmentsconsolidated results of operations and financial position from the date of acquisition. The allocation of the Aristos purchase price to the tangible and identifiable intangible assets acquired and liabilities assumed was based on valuation techniques such as the discounted cash flows and weighted average cost methods used in the first quarter of fiscal 2007, identifying SSG as a new segment, in additionhigh technology industry using assumptions and estimates from management to our then existing DPS and DSG segments. Our SSG group provides Snap Server storage systems for storage and protection of both file (NAS) and block (iSCSI) data, as well as related backup, replication, snapshot, and management software. We sell these products to end users through our network of distribution partners, solution providers, e-tailers and VARs.calculate fair value.
Fiscal 2006
Dispositions
On December 23, 2005,June 27, 2008, we entered into a three-year contract manufacturingan asset purchase agreement with Sanmina-SCI whereby Sanmina-SCI,Overland for the sale of the Snap Server NAS business for $3.3 million, of which $2.1 million was received by us upon the closing of the transaction on January 9, 2006, assumed manufacturing operations of Adaptec products. In addition, we sold certain manufacturing assets, buildings and improvements and inventory located in Singapore, with respectthe remaining $1.2 million was to printed circuit board assemblies and storage system manufacturing operations, to Sanmina-SCI for $26.6 million (net of closing costs of $0.6 million), resulting in a loss on disposal of assets of $1.6 million that was recorded in "Other charges (gains)"be received on the Consolidated Statementstwelve-month anniversary of Operations.
On September 30, 2005,the closing of the transaction. In fiscal 2009, we soldestablished a reserve for the remaining $1.2 million of this receivable as a result of the financial difficulties Overland had reported. In fiscal 2010, we amended the promissory note agreement with Overland, which allowed Overland to pay us the remaining $1.2 million receivable plus accrued interest by March 31, 2010. Due to our IBM i/p Series RAID businesscontinued concern regarding Overland’s ability to IBM for approximately $22.0 million plus $1.3 million for certain fixed assets. In addition, IBM purchased certain related inventory at our net book valuepay us, we released the reserve on the receivable as cash was collected. Under the terms of $0.8 million. We alsothe agreement, Overland granted IBMus a nonexclusive license to certain intellectual property and soldwe provided Overland limited support services to IBM substantially allhelp ensure a smooth transition. Expenses incurred in the transaction primarily include approximately $0.5 million for broker, legal and accounting fees. In addition, we accrued $0.1 million for lease obligations. We recorded a gain of the assets dedicated to the engineering and manufacturing of RAID controllers and connectivity products for the IBM i/p Series RAID business. Under the terms of the nonexclusive license, IBM paid us royalties for the sale of our board-level products on a quarterly basis through March 31, 2007, which were recognized as contingent consideration in discontinued operations when earned. In fiscal years 2007 and 2006, we received royalties, net of taxes of $7.4$1.2 million and $4.6 million on the disposal of the Snap Server NAS business in fiscal years 2010 and 2009, respectively, which we recorded in "Income (loss) from“Gain on disposal of discontinued operations, net of taxes,"” in the Consolidated Statements of
Operations. The gain recorded in fiscal 2010 was based on the cash received in connection with the amended promissory note agreement with Overland. To date, we have recorded a cumulative gain of $5.8 million through fiscal 2010 on the disposal of the Snap Server NAS business in “Gain on disposal of discontinued operations, net of taxes,” in the Consolidated Statements of Operations. In addition, in fiscal 2007, we recorded an additional estimated loss, net of taxes, of $0.8 million related to our facility associated with the IBM i/p Series RAID business in "Income (loss) from disposal of discontinued operations, net of taxes" in our Consolidated Statements of Operations. To the extent that we are unable to sublease this facility by the end of the lease term, which is June 2010, we may continue to record additional losses in discontinued operations in the future. Through March 31, 2007, we had recognized a cumulative gain of $4.3 million on the disposal of the IBM i/p Series RAID business. In fiscal 2008, we recorded a net gain from discontinued operations of $0.5 million related to the reduction of accrued liabilities associated with the sale of the IBM i/p Series RAID business and related royalties.
On January 31, 2006, we signed a definitive agreement with Sanmina-SCI Corporation and its wholly owned subsidiary, Sanmina-SCI USA, Inc., for the sale of our OEM block-based systems business for $14.5 million, of which the final payment of $2.5 million was received in February 2008. In addition, Sanmina-SCI USA agreed to pay us contingent consideration of up to an additional $12.0 million if certain revenue levels are achieved over a three-year period. As of March 31, 2008, we believe that it is unlikely that revenue levels to earn this contingent consideration will be achieved. We recorded a gain of $12.1 million on the disposal of the OEM block-based systems business in the fourth quarter of fiscal 2006. In the fourth quarter of fiscal 2007, Sanmina-SCI exercised its put option to return any inventory not used within one year of the close of the transaction, which resulted in us charging $0.4 million to "Income (loss) from disposal of discontinued operations, net of taxes" in our Consolidated Statements of Operations.
Recent Accounting Pronouncements
For a discussion onof the impact of recently issued accounting pronouncements, see "RecentAccounting Pronouncements"“Recent Accounting Pronouncements” in "Note 1 - “Note 1—Summary of Significant Accounting Policies"Policies” to the Consolidated Financial Statements included in this Annual Report on Form 10-K.
Item 7A.Quantitative and Qualitative Disclosures Aboutabout Market Risk
Interest Rate Risk
We are exposed to interest rate risk related to our investment portfolio and debt issuances. As of March 31, 2008,2010, our available-for-sale debt investments, excluding those classified as cash equivalents, totaled $388.0$311.4 million (see Note 34 to the Consolidated Financial Statements) and included corporate obligations, commercial paper, other debt securities, municipal bonds and United States government securities, all of which are of high investment grade as specified by our investment policy. Our investment policy also limits investment concentration, the final maturity on any investment and the overall duration of the portfolio to preserve capital, to meet liquidity requirements and to maximize total return. These investments are generally classified as available-for-sale and, consequently, are recorded on our balance sheet at fair market value with their related unrealized gain or loss reflected as a component of "Accumulated“Accumulated other comprehensive income, (loss)." Due tonet of taxes.” Given the relatively short-term nature ofoverall market conditions, we regularly review our investment portfolio to ensure adherence to our investment policy and to monitor individual investments for risk analysis and proper valuation. If the ability to liquidateyield-to-maturity on our current available-for-sale investments declines by 10%, our “Interest and other income, net” in the portfolio, we do not believe that an immediate 10% increase or decrease in interest ratesConsolidated Statements of Operations would have a material effect on the fair market value of our portfolio.be negatively impacted by approximately $0.6 million.
Equity Price Risk
We consider our direct exposure to equity price risk to be minimal. We have invested in technology companies through two venture capital funds. As of March 31, 2008,2010, the carrying value of such investments aggregated $1.6$1.2 million (see Note 95 to the Consolidated Financial Statements). We monitor our equity investments on a periodic basis.basis, by recording these investments based on quarterly statements we receive from the funds. The statements are generally received one quarter in arrears, as more timely valuations are not practical. In the event that the carrying value of our equity investments exceeds their fair value, andor the decline in value is determined to be other-than-temporary, the carrying value is reduced to its current fair value. While we have seen some improvement in global economic conditions, any adverse changes in equity investments and current market conditions may require us to record an impairment charge against all or a portion of the investments in the future. Such an action would adversely affect our financial results.
Foreign Currency Risk
We translate foreign currencies into U.S dollarsDollars for reporting purposes;purposes and currency fluctuations can have an impact on our results. For all three fiscal years presented2010, 2009 and 2008, there was an immaterialno material currency exchange impact from our intercompany transactions. The amount of local currency obligations settled in any period is not significant to our cash flows or results of operations, although we continuously monitor the amount and timing of those obligations. We do not believe that aA 10% change in foreign currency exchange rates for our cash, cash equivalents and marketable securities that are denominated in foreign currencies would have a significantnegatively impact on our annual financial results of operations or cash flows.by approximately 0.4 million.
53
Item 8.Financial Statements and Supplementary Data
See the index appearing under Item 15(a)(1) on page 7157 of this Annual Report on Form 10-K for the Consolidated Financial Statements at March 31, 20082010 and 20072009 and for each of the three years in the period ended March 31, 2008 and2010, as well as the Report of Independent Registered Public Accounting Firm.
Item 9.Changes in and Disagreements with Accountants on Accounting and Financial Disclosure
Not applicable.
Item 9A.Controls and Procedures
Evaluation of Disclosure Controls and Procedures
Under the supervision and with the participation of our management, including our Chief Executive Officer (CEO)CEO and our Chief Financial Officer (CFO),CFO, we conducted an evaluation of our disclosure controls and procedures (as defined in Rules 13a-15(e) and 15d-15(e) under the Securities Exchange Act of 1934 (Exchange Act), as of the end of the period covered by this Annual Report on Form 10-K. Based upon that evaluation, our CEO and our CFO have concluded that the design and operation of our disclosure controls and procedures were effective to ensureprovide reasonable assurance that the information required to be disclosed by us in reports that we file or submit under the Exchange Act (i) is recorded, processed, summarized and reported within the time periods specified in Securities and Exchange CommissionSEC rules and forms and (ii) is accumulated and communicated to our management, including our CEO and CFO, as appropriate to allow timely decisions regarding required disclosure.
Changes in Internal Control over Financial Reporting
There werehas been no changes tochange in our internal control over financial reporting (as defined in Rules 13a-15(f) and 15d-15(f) under the Exchange Act) that occurred during the period covered by this reportfourth quarter of fiscal 2010, which ended on March 31, 2010, that havehas materially affected, or areis reasonably likely to materially affect, our internal control over financial reporting.
Management'sManagement’s Report on Internal Control Overover Financial Reporting
Our management is responsible for establishing and maintaining adequate internal control over financial reporting (as defined in Rules 13a-15(f) and 15d-15(f) under the Securities Exchange Act of 1934)Act). Our internal control over financial reporting is designed to provide reasonable assurance regarding the reliability of financial reporting and the preparation of financial statements for external purposes in accordance with generally accepted accounting principles.
Under the supervision and with the participation of our management, including our principal executive officer and principal financial officer, we conducted an evaluation of the effectiveness of our internal control over financial reporting based on the framework set forth in Internal Control - Control—Integrated Framework issued by the Committee of Sponsoring Organizations of the Treadway Commission. Based on our evaluation under the framework set forth in Internal Control - Control—Integrated Framework, our management concluded that our internal control over financial reporting was effective as of March 31, 2008.2010.
The effectiveness of our internal control over financial reporting as of March 31, 20082010 has been audited by PricewaterhouseCoopers LLP, an independent registered public accounting firm, as stated in their report which appears in Item 15(a) of this Annual Report on Form 10-K.
Inherent Limitations on Effectiveness of Controls
Our management, including our Chief Executive Officer and Chief Financial Officer, does not expect that our disclosure controls and procedures or our internal controls will prevent all errors and all fraud. A control system, no matter how well conceived and operated, can only provide only reasonable not absolute, assurance that the objectives of the control system are met. Further, the designBecause of a control system must reflect the fact that there are resource constraints, and the benefitsthese inherent limitations, no evaluation of controls must be considered relative to their costs. Ourour disclosure controls and procedures andor our internal controlscontrol over financial reporting have been designed to provide reasonable assurance of achieving their objectives. Because of the inherent limitations in all control systems, no evaluation of controls canwill provide absolute assurance that all control issues and instances ofmisstatements due to error or fraud if any, have been detected.will not occur.
None.
PART III
Item 10.10.Directors, Executive Officers and Corporate Governance
Directors and Executive Officers and Directors
The name and ageInformation with respect to our directors required by this Item is incorporated in this Annual Report on Form 10-K by reference to the information under the caption “Proposal No. 1—Election of eachDirectors” of our directors andProxy Statement for our Annual Meeting of Stockholders to be held in 2010.
Information with respect to our executive officers, andincluding their name, age, respective positions with Adaptec and biographical information as of May 12, 2010 are set forth below. Additional biographical information concerning each
John J. Quicke has served as a member of our directors and executive officers follows the table.
Name Age Principal Occupation- --------------------------- ------- ---------------------------------------------------------- Subramanian "Sundi" Sundaresh 52 President, Chief Executive Officer and Director Mary L. Dotz 50 ViceBoard of Directors since 2007. In January 2010, Mr. Quicke was appointed to serve as our Interim President and ChiefFinancial Officer Marcus D. Lowe 52 Vice PresidentExecutive Officer. Mr. Quicke is a Managing Director and operating partner ofEmerging Business UnitSteel Partners LLC. He has been associated with Steel Partners LLC andCorporate Development Jon S. Castor (1) (2) 56 Director Jack L. Howard (3) 46 Director Joseph S. Kennedy (1) 61 Director Robert J. Loarie (2) 65 Director D. Scott Mercer 57 Chairman of the Board of Directors John Mutch (1) 51 Director John J.its affiliates since September 2005. Mr. Quicke(2) 58 Director Douglas E. Van Houweling (3) 64 Director
________________________
(1) Audit Committee member
(2) Compensation Committee member
(3) Governance and Nominating Committee member
Subramanian "Sundi" Sundaresh has served as one of our directors since 2005 and our Chief Executive Officer since November 2005, President since May 2005 and briefly served as our Executive Vice President of Marketing and Product Development in May 2005. Prior to rejoining Adaptec, Mr. Sundaresh provided consulting services at various companies, including Adaptec, from December 2004 to April 2005. Between July 2002 and December 2004, Mr. Sundareshalso served as President and Chief Executive Officer of Candera,Del Global Technologies Corp., a company that is engaged in developing, manufacturing and marketing medical and dental imaging systems, and power conversation subsystems and components worldwide, since August 2009 and as a director of Del Global since September 2009. He has served as a director of Rowan Companies, Inc., a suppliercontract drilling company, since January 2009. Mr. Quicke served as a director of network storage controllers. FromAngelica Corporation, a provider of health care linen management services, from August 2006 to July 19982008. Mr. Quicke served as Chairman of the Board of NOVT from April 2006 to April 2002, Mr. SundareshJanuary 2008 and served as President and Chief Executive Officer of Jetstream Communications,NOVT from April 2006 to November 2006. He served as a director of Layne Christensen Company, a provider of Voice over Broadband solutions.products and services for the water, mineral, construction and energy markets, from October 2006 to June 2007. He has served as a director of WHX since July 2005 and as a Vice President since October 2005. Mr. Sundaresh previously worked at AdaptecQuicke served as a director, President and Chief Operating Officer of Sequa Corporation, a diversified industrial company, from 1993 to March 2004, and Vice Chairman and Executive Officer of Sequa from March 19932004 to June 1998 asMarch 2005. As Vice PresidentChairman and General ManagerExecutive Officer of Sequa, he was responsible for the Personal I/OAutomotive, Metal Coating, Specialty Chemicals, Industrial Machinery and Other Product operating segments of the company. From March 2005 to August 2005, Mr. Quicke occasionally served as a consultant to Steel Partners and explored other business and Corporate Vice President of Worldwide Marketing.opportunities.
Mary L. Dotz has served as our Chief Financial Officer since March 31, 2008. Prior to joining Adaptec, Ms. Dotz served as Chief Financial Officer for Beceem Communications Inc., a provider of chipsets for the WIMAX market, from October 2005 to March 2008. Previously, Ms. Dotz served as Senior Vice President and Chief Financial Officer of Pinnacle Systems, Inc., a supplier of digital video products, from January 2005 until the acquisition of Pinnacle by Avid Technology, Inc. in August 2005. Prior to that, Ms. Dotz held various finance positions at NVIDIA Corporation, a fabless semiconductor company, from October 2000 to January 2005, including Vice President Finance and Corporate Controller, and Interim Chief Financial Officer from April 2002 to September 2002.
Marcus D. Lowe has served as our Vice President of Emerging Business Unit and Corporate Development since April 2006 and Vice President and General Manager from July 2005 to March 2006. Prior to rejoining Adaptec, Mr. Lowe was a Managing Director at Praxis Ventures, a consulting and investment firm, from April 2004 to June 2005. Between July 2000 and March 2004, Mr. Lowe served as Chief Executive Officer and President of New Moon Systems, Inc., a software provider to manage and deploy Windows-based applications to end-user desktops. Mr. Lowe previously worked at Adaptec from 1991 to 1997 as a General Manager for the SCSI business group, and later the Fibre Channel products group.
Jon S. Castor has served as one of our directors since 2006. Mr. Castor has been a private investor since June 2004. From January 2004 to June 2004, Mr. Castor was an Executive Advisor to the Chief Executive Officer of Zoran Corporation, a provider of digital solutions for applications in the digital entertainment and digital imaging markets, and from August 2003 to December 2003, he was Senior Vice President and General Manager of Zoran's DTV Division. From October 2002 to August 2003, Mr. Castor was the Senior Vice President and General Manager of the TeraLogic Group at Oak Technology Inc., a developer of integrated circuits and software for digital televisions and printers, which was acquired by Zoran. In 1996, Mr. Castor co-founded TeraLogic, Inc., a developer of digital television integrated circuits, software and systems, where he served in several capacities, including as its Chief Executive Officer and director from November 2000 to October 2002, when it was acquired by Oak Technology.
Jack L. Howard has served as one of our directors since 2007. He co-founded Steel Partners II, L.P. ("Steel Partners"), a private investment partnership, in 1993. He is the President of Steel Partners LLC ("Partners LLC"), a global investment management firm. He has been associated with Partners LLC and its affiliates since December 2003. Mr. Howard has served as the Chief Operating Officer of SP Acquisition Holdings, Inc. ("SP Acquisition"), a company formed for the purpose of acquiring one or more businesses or assets, since June 2007 and has served as its Secretary since February 2007. He also served as a director of SP Acquisition from February 2007 to June 2007 and as its Vice-Chairman from February 2007 to August 2007. Mr. Howard has served as Chairman of the Board of WebFinancial Corporation, which through its operating subsidiaries operates niche banking markets, since June 2005. He served as Chairman of the Board and Chief Executive Officer of Gateway Industries, Inc., a provider of database development and website design and development services, from February 2004 to April 2007 and as Vice President from December 2001 to April 2007. Mr. Howard currently serves as a director of WHX Corporation, CoSine Communications, Inc., and NOVT Corporation.
Joseph S. Kennedy has served as one of our directors since 2001. Mr. Kennedy has been a private investor since May 2008. From June 2003 until May 2008, Mr. Kennedy served as President and Chief Executive Officer of Omneon, Inc., a developer of video media servers for the broadcast industry. From June 1999 until March 2002, he served as President, Chief Executive Officer and Chairman of the Board of Pluris Inc., a developer of Internet routers. Mr. Kennedy was the founder and Chief Executive Officer of Rapid City Communications from February 1996 until that company was acquired by Bay Networks in June 1997, after which time he served as President and General Manager of Bay Networks' switching products division until June 1998.
Robert J. Loarie has served as one of our directors since 1981. Mr. Loarie retired as an Advisory Director of Morgan Stanley & Co., a diversified investment firm in October 2007, and he has been a private investor since that time. He also served as Managing Director for Morgan Stanley & Co from December 1997 until March 2003, and as a principal of that firm from August 1992 until November 1997. Mr. Loarie also has served as a general partner or managing member of several venture capital investment partnerships or limited liability companies affiliated with Morgan Stanley since August 1992.
D. Scott Mercer has served as director since 2003 and as Chairman of the Board of Directors since September 2006. He has served as Chief Executive Officer of Conexant Systems, Inc., a fabless semiconductor company supplying the imaging, PC media and DSL markets, since April 2008. He was a private investor from January 2005 through May 2005 and also from December 2005 through March 2008. Mr. Mercer served as our Interim Chief Executive Officer from May 2005 through November 2005. Mr. Mercer served as a Senior Vice President and Advisor to the Chief Executive Officer of Western Digital Corporation, a supplier of disk drives to the personal computer and consumer electronics industries, from February 2004 through December 2004. Prior to that, Mr. Mercer was a Senior Vice President and the Chief Financial Officer of Western Digital Corporation from October 2001 through January 2004. From June 2000 to September 2001, Mr. Mercer served as Vice President and Chief Financial Officer of Teralogic, Inc., a supplier of semiconductors and software to the digital television industry. From June 1996 through May 2000, Mr. Mercer held various senior operating and financial positions with Dell, Inc., a provider of products and services enabling customers to build their information-technology and Internet infrastructures. Mr. Mercer is also a director of Conexant Systems, Inc., Palm, Inc., and SMART Modular Technologies, Inc.
John Mutch has served as one of our directors since 2007. Since December 2005, Mr. Mutch has been the founder and managing partner of MV Advisors, LLC, a strategic block investment firm that provides focused investment and strategic guidance to small and mid-cap technology companies. Prior to founding MV Advisors, Mr. Mutch was the President and CEO of Peregrine Systems, an enterprise software provider. In March 2003, Mr. Mutch was appointed to the Peregrine Board of Directors by the U.S. Bankruptcy Court and assisted the company in its bankruptcy work out. Mr. Mutch became President and CEO of Peregrine in August 2003 until its sale to Hewlett Packard in December of 2005. Previously, Mr. Mutch served as President and CEO of HNC Software, an enterprise analytics software provider that was sold to Fair Isaac in August 2002. Mr. Mutch also spent seven years at Microsoft Corporation in a variety of executive sales and marketing positions. Mr. Mutch is also a director of Phoenix Technologies Ltd., and EDGAR Online, Inc.
John J. Quicke has served as one of our directors since 2007. Mr. Quicke is a Managing Director and operating partner of Partners LLC. He has been associated with Partners LLC and its affiliates since September 2005. Mr. Quicke served as Chairman of the Board of NOVT from April 2006 to January 2008 and served as President and Chief Executive Officer of NOVT from April 2006 to November 2006. He has served as a director of WHX since July 2005, as a Vice President since October 2005 and as President and Chief Executive Officer of its Bairnco Corporation subsidiary since April 2007. Mr. Quicke currently serves as a director of Angelica Corporation, a provider of healthcare linen management services. Mr. Quicke served as a director, President and Chief Operating Officer of Sequa Corporation, a diversified industrial company, from 1993 to March 2004, and Vice Chairman and Executive Officer of Sequa from March 2004 to March 2005. As Vice Chairman and Executive Officer of Sequa, he was responsible for the Automotive, Metal Coating, Specialty Chemicals, Industrial Machinery and Other Product operating segments of the company. From March 2005 to August 2005, Mr. Quicke occasionally served as consultant to Steel Partners and explored other business opportunities.
Douglas E. Van Houweling has served as one of our directors since 2002. Mr. Houweling has served as the President and Chief Executive Officer of the University Corporation for Advanced Internet Development (UCAID), the formal organization supporting Internet2, since November 1997. Dr. Van Houweling also serves as a professor in the School of Information at the University of Michigan. Before undertaking his responsibilities at UCAID, Dr. Van Houweling was Dean for Academic Outreach and Vice Provost for Information and Technology at the University of Michigan.
Section 16(a) Beneficial Ownership Reporting Compliance
Information with respect to compliance by our directors, executive officers and 10% or greater stockholders with Section 1616(a) of the Securities Exchange Act requires our directors and certainrequired by this Item is incorporated in this Annual Report on Form 10-K by reference to the information under the caption “Section 16(a) Beneficial Ownership Reporting Compliance” of our officers, and persons who own more than 10%Proxy Statement for our Annual Meeting of a registered classStockholders to be held in 2010.
Audit Committee
Information regarding the Audit Committee of our equity securities, to file initial reportsBoard of ownershipDirectors and reportsour Audit Committee financial expert is incorporated by reference from the information under the caption: “Proposal No. 1—Election of changes in ownership with the SEC. SEC regulations also require these persons to furnish us with a copy of all Section 16(a) forms they file. Based solely on our reviewDirectors” of the copiesProxy Statement for our Annual Meeting of the forms furnishedStockholders to us and written representations from our officers who are required to file Section 16(a) forms and our directors, we believe that all Section 16(a) filing requirements were met during fiscal 2008, except that Steel Partners II, L.P. filed one Form 4 late during fiscal 2008, which covered two purchases of shares of our common stock by Steel Partners II, L.P., a Form 4 was filed late for John J. Quicke related to his initial grants of restricted stock units and stock appreciation rights, and a Form 4 was filed late for Jack L. Howard related to his initial grants of restricted stock units and stock appreciation rights.be held in 2010.
55
Code of Conduct
We maintain a Code of Business Conduct, Ethics, and Compliance, which incorporates our code of ethics that is applicable to all employees, including all officers, and our independent directors with regard to their Adaptec-related activities. The Code of Business Conduct, Ethics, and Compliance incorporates our guidelines designed to deter wrongdoing and to promote honest and ethical conduct and compliance with applicable laws and regulations. It also incorporates our expectations of our employees that enable us to provide accurate and timely disclosure in our filings with the Securities and Exchange Commission, or SEC, and other public communications. In addition, it incorporates Adaptecour guidelines pertaining to topics such as health and safety compliance; diversity and non-discrimination; supplier expectations; and privacy. The full text of the Code of Business Conduct, Ethics, and Compliance is published on the Company's web siteour website under Corporate Governance at http://www.adaptec.com. The Companyinvestor.adaptec.com. We will post any amendments to the Code of Business Conduct, Ethics, and Compliance, as well as any waivers that are required to be disclosed by the rules of either the SEC or The NASDAQ Stock Market, on our website.
Audit Committee
We have an Audit Committee of our Board of Directors, the current members of which are John Mutch (Chair), Jon S. Castor and Joseph S. Kennedy, each of whom are "independent" as defined by the rules of The NASDAQ Stock Market. Our Board of Directors has determined none of our Audit Committee members qualify as an "audit committee financial expert," as defined under Item 407(d)(5) of Regulation S-K, although each member of the Audit Committee is financially literate, as required by NASDAQ listing standards. We believe that our Audit Committee is able to perform its required functions and responsibilities without having an audit committee financial expert due to the fact that each member of our Audit Committee meets the NASDAQ financial sophistication requirement of having past employment experience in finance or accounting, requisite professional certification in accounting, or any other comparable experience or background which results in the individual's financial sophistication, including being or having been a chief executive officer, chief financial officer or other senior officer with financial oversight responsibilities; NASDAQ rules only require that one member of our Audit Committee meet this financial sophistication requirement. However, despite the financial sophistication of each member of our Audit Committee, we are currently seeking a new member of the Audit Committee that qualifies as an "audit committee financial expert." The Audit Committee assists the full Board of Directors in its general oversight of our financial reporting, internal controls and audit functions, and is directly responsible for the appointment, compensation and retention of our independent registered public accounting firm, which reports to the Audit Committee.
Stockholder Nominations of Directors
During fiscal 2008,2010, we did not make any material changes to the procedures by which our security holders may recommend nominees to our Board of Directors.
Item 11.11.Executive Compensation
Compensation Discussion and Analysis
This section discusses our executive compensation philosophy, decisions and practices for fiscal 2008. It places in perspective the earnings of our "named officers" listed in the Summary Compensation Table on page 56.
Compensation Philosophy and Overview
Our pay programs are designed to attract, retain and motivate a qualified workforce to achieve our financial and strategic objectives. Our compensation program strives to: pay for performance by rewarding each employee for team results and his or her individual contribution to our success and provide managersInformation with guidelines to make fair and equitable compensation decisions.
We believe that the most effective compensation program is one that is designed to reward the achievement of our financial and strategic goals, and which aligns executives' interests with those of our stockholders.
The compensation programs for our executive officers have three principal elements: a base salary which is developed in part by referencing the 50th percentile of the market, cash incentive bonuses linked to achievement of financial and corporate goals and equity-based incentive compensation. In addition, we provide our executive officers a variety of benefits that in most cases are available generally to all of our salaried employees. We view the components of compensation as related but distinct. We believe that an executive's compensation package should be fair and reasonable when taken as a whole.
The compensation philosophy of the Compensation Committee of the Board of Directors (the "Committee") is to keep cash compensation at a competitive level while providing the opportunity to be significantly rewarded through equity if Adaptec and our stock price perform well over time. We also believe that, for most technology companies, stock-based compensation is generally the primary motivator in attracting executives rather than base salary or cash bonuses.
We believe that our executive officers should have a larger portion of their equity incentive awards at risk as compared with our other employees. We also believe, over the long term, that executive officers should have a greater percentage of their equity compensation in the form of stock options and performance-contingent stock rather than time-based restricted stock, as stock options and performance-contingent stock have greater risk associated with them than time-based restricted stock.
Fiscal Year 2008. Adaptec experienced various challenges in fiscal 2008 that required us to modify and focus our executive compensation programs toward retaining key employees in an unstable and unpredictable operating environment. In designing appropriate compensation programs, we had multiple factors to consider: (1) a shrinking revenue base resulting from a loss of key customers and a broader decline in one of our core business segments; (2) strategic acquisition and restructuring initiatives; (3) a potential proxy contest, settlement of which resulted in three new investor representatives joining the Board; (4) significant turnover (voluntary and involuntary) among both the executive ranks and among the broader employee population; and (5) aggressive cost cutting initiatives.
Because of these special circumstances, we implemented changesrespect to executive compensation required by this Item is incorporated in fiscal 2008. Our benchmarking of compensation included companies having lower revenues than those with which we had compared ourselves in prior years. Because we needed to emphasize retention, we also provided special cash retention incentives basedthis Annual Report on service for executives other than our Chief Executive Officer, a retention program with performance-contingent incentives for our Chief Executive Officer, and all equity awards during the fiscal year were made in the form of time-based restricted stock awards ("RSAs") rather than a combination of RSAs and stock options. We continue to believe that, over the long term, executive officers should have a greater percentage of their equity compensation in the form of stock options and performance-contingent stock rather than time-based RSAs, and we do not view cash retention incentives as a long-term element of executive compensation. However, in light of the circumstances we faced in fiscal 2008, we believe the changes we made to our executive compensation programs were necessary.
In addition, as we have done since the second half of fiscal 2006, we established bonus targets based on minimization of losses, which the Board and management believed to be unavoidable in fiscal 2008, even though our objective is to be in a position to require net profits to fund our bonus pool.
Role of the Compensation Committee
The current members of the Committee are Jon S. Castor, who is the Chair of the Committee, Robert J. Loarie, and John J. Quicke. Mr. Castor and Mr. Loarie served on the Committee for all of fiscal 2008. Mr. Quicke joined the Committee in December 2007 upon his election to our Board of Directors at our 2007 Annual Meeting of Stockholders.
The Committee ensures that our executive compensation and benefits program is consistent with our compensation philosophy and our corporate governance guidelines and is empowered to determine executive officers' total compensation, and, subjectForm 10-K by reference to the approval ofinformation under the Board, to determine our Chief Executive Officer's total compensation.
Thecaptions “Executive Compensation,” “Compensation Committee reviews our overall compensation strategy at least annually to ensure that it promotes stockholder interests, supports our strategicInterlocks and tactical objectivesInsider Participation” and provides for appropriate rewards and incentives for our executive officers. The Committee's most recent overall compensation review occurred in February and April 2008.
Typically,“Compensation Committee meetings are attended by, for all or a portion of each meeting, not only the Committee members but also our Chief Executive Officer, our Vice President Human Resources, an independent compensation consultant from Compensia, Inc. and legal counsel from Fenwick West LLP.
Role of Executive Officers in Compensation Decisions
Mr. Subramanian Sundaresh, our Chief Executive Officer, annually reviews the performance of eachReport” of our other executive officers. Mr. Sundaresh rates the performance of his direct staff and the Committee rates the performance of Mr. Sundaresh in consultation with the other non-executive Directors. Each executive officer also completes a self assessment of his/her performance. The conclusions reached by Mr. Sundaresh and his recommendations based on these reviews, including with respect to continued employment, salary adjustments, incentive awards and equity award amounts, are presented to the Committee. The Committee thoughtfully considers the Chief Executive Officer's recommendations when exercising its own judgment in making compensation decisions and awards to our executive officers who report to the Chief Executive Officer.
Survey Analysis
In fiscal 2008, we engaged Radford Surveys + Consulting, a business unit of AON Consulting ("Radford"), to provide comprehensive compensation data. Radford conducts a number of compensation surveysProxy Statement for the technology industry. The surveys compare practices among other high technology companies and cover base salary, cash incentives, stock equity incentive grants and total cash as a percentage of total direct compensation.
Radford provides quarterly summaries of industry trends to our Vice President, Human Resources, which enables Human Resources to remain current on total compensation trends and which is shared with the Committee. Our Vice President, Human Resources also reviews different surveys consisting of: the Radford Total Company Results survey comprised of data from approximately 170 technology companies with $200 million to $1 billion in annual revenues, the Radford Total Company Results survey comprised of data from approximately 140 technology companies with $50 million to $200 million in annual revenues, and the Radford Stock by Level report which explains stock practices in over 500 technology companies primarily located in the San Francisco Bay Area. The Committee also considers other reference points in reviewing compensation data. For example, we used a Custom Select Company Results survey provided by Radford that compares compensation information for a peer group of high technology companies or their divisions, identified by Adaptec executives and approved by the Committee. This peer group of companies, with similar revenues, are primarily in the storage, computer peripherals, and semiconductor components businesses with which we compete for executive and technical employees. The list of peer companies is as follows:
Acer America                         Emulex              Packeteer                      Synaptics
   (Subsidiary of Acer Inc.)

Commvault Systems                    Foundry Networks    PMC-Sierra                     Wind River Systms

Datalogic Scanning                   Informatica         Silicon Image                  Xyratex International
   (Subsidiary of Datalogic S.p.A.)

Dolby Laboratories                   Interwoven          Silicon Storage Technology     Zantaz

Dot Hill System                      Iomega              Sonic Wall
In positions outside of engineering and product management, we seek executive talent within the broader technology industry. Relevant survey positions and data that match the skills of our officers are analyzed and presented to the Committee. As noted above, in fiscal 2008, the Committeealso began to compare our executives' compensation with compensation at companies having lower revenues than the companies with which we had compared ourselves in prior years. The companies which participate in the surveys may differ from year to year because companies may elect to join or no longer participate in the survey on an annual basis and the companies' revenue size may differ making them no longer a match to our criteria.
External Advisors
The Committee has the authority to engage the services of outside advisors. The Committee used the services of Compensia, Inc. as an independent advisor to assist the Committee in its review of fiscal 2008 compensation for executive officers and other elements of Adaptec's executive pay program. In fiscal 2008, Compensia completed a comprehensive review of our Board of Directors' compensation, an analysis of severance and retention practices, and a discussion document on performance-based equity compensation. Compensia provides no services to management.
Accounting and Tax Implications of Our Compensation Policies
In designing our compensation programs, the Committee considers the financial accounting and tax consequences to Adaptec as well as the tax consequences to employees. We account for equity compensation paid to our employees under SFAS 123R, which requires us to estimate and record an expense over the service period of the award. The SFAS 123R cost of our equity awards is considered by management as part of our equity grant recommendations to the Committee.
Section 162(m) of the Internal Revenue Code places a limit of $1 million on the amount of compensation that we may deduct for income tax purposes in any one year with respect to our Chief Executive officer and certain other of our most highly compensated executive officers. This limitation does not apply to compensation that is considered "performance based" under applicable tax rules. Our executive stock options are intended to qualify as "performance-based," so that compensation attributable to those options is fully tax deductible. Time-based RSAs that we awarded in fiscal 2008 and prior years, do not meet the requirements of Section 162(m) as performance based. Therefore, the fair market value of the shares that vest during a particular year will be counted along with other non-performance-based compensation in that year in determining whether the $1 million limit for non-performance-based compensation is exceeded. Although we also provide cash compensation to executives in forms that do not meet the requirements for "performance-based" compensation, such as base salary and annual incentive pay, we have no individuals who received non-performance based cash compensation in excess of the Section 162(m) tax deduction limit in fiscal year 2008, excluding the receipt by Mr. Sundaresh of his prior deferrals upon the termination of our nonqualified deferred compensation plan as described below in "Nonqualified Deferred Compensation."
Fiscal Year 2008 Executive Compensation Program
Components of our Compensation Program
Base Salary
In fiscal 2008, we set base salaries for our executive officers after considering the survey information discussed above under "Survey Analysis," with emphasis on the companies with lower revenues. Based on the results of these surveys and the input from Compensia, the Committee determines whether our executive officers are paid competitively. We believe the officers should be paid competitively, not above or below the market data unless their experience or responsibilities warrant either a higher or lower placement compared to market. With the exception of Mary L. Dotz, our Chief Financial Officer who was hired on March 31, 2008, in fiscal 2008 our executives were paid at slightly above the 50th percentile of those in Radford Total Company Results survey of technology companies with revenues of less than $200 million and slightly below the 50th percentile for the Radford Total Company Results survey for companies with revenues of $200 million to $1 billion. As a result, executives did not receive increases in base salary for fiscal 2008, with the exception of Messrs. Goyal and Terlizzi.
For fiscal 2008, the base salary for Mr. Sundaresh, our Chief Executive Officer, was $450,000, the base salary for Mr. Christopher G. O'Meara, our former Chief Financial Officer, was $325,000; the base salary for Mr. Marcus D. Lowe, our Vice President, Emerging Business Unit and Corporate Development was $260,000. Messrs. Sundaresh, O'Meara, and Lowe did not receive an increase in their base salaries for fiscal 2008 based on their market position. Effective April 1, 2007 (the first day of fiscal 2008), the base salary of Mr. Manoj Goyal, our former Vice President and General Manager of Data Protection Solutions, increased from $240,000 to $255,000, and the base salary of Mr. Stephen Terlizzi, our former Vice President and General Manager of the Storage Solutions Group, increased from $220,000 to $230,000.
Mary L. Dotz, our Chief Financial Officer, joined Adaptec on March 31, 2008 with a negotiated base salary of $265,000.
Retention and Other Special Compensation Programs
In fiscal 2008, the Committee was focused on retaining executives due to uncertainty created by the potential proxy contest, the high percentage of employee turnover, and potential business transactions we were considering. The Committee asked Compensia for guidance and recommendations in determining the appropriate retention program for our executive officers and, in April 2007, reviewed a special report prepared by Compensia explaining retention practices. The Committee believes that stability in the executive team is critical in order to retain the executive officers and meet our financial and corporate goals. Accordingly, a performance-contingent program was put in place for our Chief Executive Officer, and a service-based retention award was developed for the other executive officers with an amount equal to two months of base salary payable at the end of November, 2007 and a an amount equal to four months of base salary payable in April 2008.
The design provided for the larger payment later in the fiscal year after key company actions were to be completed to reinforce the retention theme. Mr. O'Meara received $162,500; Mr. Lowe received $130,000; Mr. Goyal received $127,500; and Mr. Terlizzi received $115,000 under this program. The Committee made a decision not to offer the time-based retention incentive to Mr. Sundaresh to ensure that he focused the executive team on achieving specific goals; instead, the Committee created a performance-contingent retention program for him. The Committee identified three critical individual goals to improve our revenue potential, and lower our operating expenses and enhance the strategic direction of our company. Each goal was valued at two months of base salary. The Committee determined that Mr. Sundaresh satisfied 100% of the first goal by signing an agreement with an ASIC partner by September 30, 2007, 50% of the second goal by eliminating infrastructure costs in IT and Facilities, and 0% of the third goal, as a proposed corporate transaction was not completed. This resulted in an aggregate 50% achievement of his performance goals, equaling a payment of $112,500, or three months of his base salary. The combination of these programs was believed sufficient to retain our Chief Executive Officer and our other executives.
The special programs implemented in fiscal 2008 have run their course and, as of the date of this report, there are no special retention programs in place.
Incentive Program
In fiscal 2008, we paid bonuses to our executive officers pursuant to our Adaptec Incentive Plan (the "AIP"), with individuals eligible to receive payments from the AIP twice per year, following the close of the second and fourth fiscal quarters. The funding of the bonus pool under the AIP for each of the two six-month bonus periods was conditioned upon two major components: specific financial results and non-financial corporate goals that were approved by the Committee. The financial results component was based upon Adaptec achieving a minimum threshold for operating profit before income taxes ("OPBT") for each six-month bonus period. The corporate goals related to matters such as business partnerships, inventory management, growth in key revenue areas, improving gross margin and other business process improvements. There was also a 60% minimum achievement threshold required to fund the bonus pool for the portion of the bonus attributable to non-financial corporate goals. The Committee determined the weight of each goal and the percentage of achievement. Achievement of goals was measured at the beginning of the third fiscal quarter for the first half cash bonuses and at the beginning of the first fiscal quarter of the following fiscal year for the second half cash bonuses. The non-financial corporate goals accounted for 25% of the funding of the AIP pool and the financial corporate goals accounted for 75% of the funding pool.
We used the same Radford survey data discussed above to determine cash bonus incentive targets as a percentage of base salary. Our executive officers could achieve 0% to 200% of their target incentive based upon our Company's performance and their individual performance. Actual achievement levels with respect to the financial and non-financial corporate goals established the bonus pool funding; then Mr. Sundaresh and the Committee evaluated the individual performance of the officers and determined what amount each would receive on a discretionary basis. For fiscal 2008, the target bonus payments for our named executive officers were as follows: 85% of Mr. Sundaresh's base salary; 60% of Mr. O'Meara's base salary; and 50% of each of Messrs. Lowe, Goyal, and Terlizzi's base salary. Thus, for example, Mr. Sundaresh could have received an actual bonus of between 0 and 170% of his base salary for the fiscal year, divided over two six-month periods, with 85% of his base salary, or $382,500, being the annual target bonus. Ms. Dotz was not eligible for a payment, as she was not employed by us until the last day of fiscal 2008.
For the first six months of fiscal 2008, we did not achieve the 60% threshold for our non-financial corporate goals. The non-financial corporate goals and the specific criteria for determining whether they were met are confidential commercial information. The Committee established these goals as stretch goals and believed that, taken as a whole, they were achievable but difficult. With respect to the financial goals for the first six months of fiscal 2008, the cutoff threshold amount, below which no payment would be made, for achieving the OPBT goal was an OPBT loss of $25 million, and the target OPBT goal was a loss of no more than $21 million and no less than $20 million. As noted above, these goals reflected the fact that we anticipated an OPBT loss, and the Committee, while preferring to only reward profitability, believed it to be important to our success to nonetheless provide an incentive to the executives to minimize or control losses. Actual OPBT was a loss of $19.9 million. Even though we achieved the OPBT target, management recommended, and the Committee approved, a cap of 85% of the financial goals component in light of our overall results. The foregoing resulted in the Committee approving a funding budget of 64% of the AIP target. The calculation is (0% x 25% corporate goals) + (85% x 75% financial goals) = 64% attainment of target funding.
For the second six months of fiscal 2008, we exceeded the 60% threshold for our non-financial corporate goals. These goals, and the specific criteria for determining whether they were met, also represent confidential commercial information. The Committee established these goals as stretch goals and believed that, taken as a whole, they were achievable but difficult. With respect to our financial objectives for the period, the cutoff threshold was an OPBT loss of $9 million and the target OPBT goal was a loss of less than $4 million. Actual OPBT was a loss of $8.1 million, representing a 25% achievement level. The foregoing resulted in the Committee approving a budget of 35.6% of the AIP target. The calculation is (67.5% x 25% corporate goals) + (25% x 75% financial goals) = 35.6% attainment of target funding.
In total for fiscal 2008, Messrs. Sundaresh, O'Meara, Lowe, Goyal, and Terlizzi received less than their targets based on Adaptec's and their individual performance. Mr. Sundaresh received a total cash incentive of 42% of his base salary; Mr. O'Meara received 18% of his base salary; and Messrs. Lowe and Goyal received 22% of their base salaries; and Mr. Terlizzi received 13% of his base salary.
Annual Annual Target % of Achieved % of Base Salary Base Salary Total Award----------- -------------- ----------- Sundaresh 85 % 42 % $ 190,575 O'Meara 60 % 18 % $ 60,000 Lowe 50 % 22 % $ 56,000 Goyal 50 % 22 % $ 55,000 Terlizzi 50 % 13 % $ 29,500
Equity-Based Long Term Incentive Compensation
We generally use stock options and restricted stock awards to ensure that our executive officers have a continuing stake in our long-term success and to align their interests with the interests of our stockholders. As noted above, in fiscal 2008, we utilized only restricted stock awards in order to provide the necessary incentives, increase retention and minimize potential dilution and compensation expense. We review the Radford surveys noted above to determine the 50th percentile for equity awards. We evaluated the value of awards to determine a recommended range for each of our executive officers. We also reviewed the executive officers' current holdings of unvested equity and the extent to which those holdings provided adequate retention incentive, and noted that stock options awarded in prior years to our executives had exercise prices that exceeded the market price of our common stock in fiscal 2008. Because the Committee did not believe, based on the advice of its advisors, that stock options with exercise prices in excess of our stock price provided adequate incentive to retain executives in a declining market for Adaptec and the industry, the Committee agreed, in fiscal 2008, to utilize only restricted stock awards and to issue such awards with a shorter, two - -year vesting schedule. In fiscal 2008, Messrs. Sundaresh, O'Meara, Lowe, Goyal, and Terlizzi received 200,000 RSAs, 75,000 RSAs, 70,000 RSAs, 100,000 RSAs, and 70,000 RSAs, respectively.The awards were determined by calculating the value of proposed awards in comparison tothe 50th percentile of equity grants noted in the Radford surveys above. The value of the awards made in fiscal 2008 to each of Mr. Sundaresh and the other named executive officers (other than Mr. Terlizzi) was less than the value of the awards made in fiscal 2007. Mr. Terlizzi was not a named executive officer in fiscal 2007. Fifty percent of the restricted stock awards vest on the first anniversary of the grant date and the other 50% vest on the second anniversary of the grant date. Messrs. O'Meara, Goyal, and Terlizzi did not vest in any of the RSAs because they left Adaptec before the first vesting date. As noted above, we do not plan to continue this strategy indefinitely. We have not determined equity awards for fiscal 2009.
Ms. Dotz received a new hire stock award consisting of an option to purchase 125,000 shares of Adaptec stock and 50,000 shares of restricted stock. The option vests 25% on the one-year anniversary of her hire date and quarterly thereafter, at 6.25%, and will be fully vested at the end of four years. The restricted stock award vests 50% on her one-year anniversary and 50% on her second-year anniversary with Adaptec. The grant was determined based on the Radford surveys noted above and the value of unvested equity held by other executives.
The table on page 57 describes the option grants and restricted stock awards made to the executive officers during the fiscal year.
All equity-based awards have been reflected in our consolidated financial statements, based upon the applicable FAS 123R accounting guidance. We do not have any program, plan or practice that requires us to grant equity-based awards to our executive officers on specified dates and we have not made grants of such awards that were timed to precede or follow the release or withholding of material non-public information. Our practice has been to grant equity-based awards at regularly scheduled Committee meetings. The exercise prices are determined based on the closing price of our common stock on the date that the grants are approved.
Perquisites
Our executive officers are eligible for the same health and welfare programs and benefits as the rest of Adaptec's employees. In addition, all vice president level and more senior employees, including our executive officers, receive a car allowance valued at $650 per month, and are eligible for an annual executive physical. In addition, executive officers receive reimbursement for personal financial and tax advice up to $2,500 per year, reimbursement for health club initiation fees of up to $300 plus 50% of the club's monthly dues, up to $55.00 per month, and survivor benefit management services up to a maximum cost of $3,000. Beginning in fiscal 2009, the health club benefit has been eliminated.
Employment Contracts
We have entered into employment agreements with each of our executive officers which provide that if such officer is terminated other than for "cause" (which includes violation of material duties, refusal to perform his/her duties in good faith, breach of his/her employment agreement or employee proprietary information agreement, poor performance of duties, arrest for a felony or certain other crimes, substance abuse, violation of law or Adaptec policy, prolonged absence from duties or death), he or she is entitled to receive (1) his or her unpaid base salary and unused vacation benefits he or she has accrued prior to the date of his of her termination; (2) a one-time payment equal to 12 months of base salary for Messrs. Sundaresh and O'Meara, and nine months of base salary for Messrs. Lowe, Goyal and Terlizzi and Ms. Dotz, plus an additional week of base salary for each year of service beyond three years of service; (3) outplacement services in an amount not to exceed $10,000 or, for Ms. Dotz, $5,000; and (4) coverage for the executive officer and his or her dependents under Adaptec's health, vision and dental insurance plans pursuant to COBRA for a 12-month period for Messrs. Sundaresh and O'Meara, and a nine-month period for Messrs. Lowe, Goyal and Terlizzi and Ms. Dotz following the termination of employment. The Committee selected these amounts at the time these executives were hired by us (or promoted to an executive position) based on prior practice within Adaptec, information gathered from outplacement companies and, for agreements entered into after the Committee retained Compensia in January 2007, severance data provided by Compensia.
We have terminated the employment of Messrs. Terlizzi, O'Meara and Goyal, and they have received the severance payments set forth in the "Payments Upon Termination or Change In Control" table pursuant to the agreements described above.
Change of Control
The change of control arrangements of our executive officers, also set forth in their employment agreements, are as follows:
If within one year of a change of control (1) there is a material reduction of the annual base and target incentive compensation specified in his or her employment agreement to which he or she does not consent, (2) there is a failure of Adaptec's successor after a change of control to assume his or her employment agreement, (3) his or her employment is terminated without cause by Adaptec's successor, (4) there is a substantial change in his or her position or responsibility or (5) his or her position relocates to more than 25 additional commute miles (one way) and he or she elects to be terminated, then he or she will receive, upon signing a separation agreement and general release: (a) a one-time payment equal to his or her then-current annual base pay (one and one-half times annual base pay in the case of Mr. Sundaresh and nine months of base pay for Ms. Dotz), (b) his or her then-current targeted bonus payout, (c) COBRA benefits for one year (nine months in the case of Ms. Dotz), (d) outplacement services not to exceed $10,000 ($5,000 in the case of Ms. Dotz), and (e) accelerated vesting of his or her stock options and restricted stock awards as provided for under the 2004 Equity Incentive Plan.
Under our 1990 Stock Plan, 1999 Stock Plan and our 2004 Equity Incentive Plan, in the event of a Change in Control, any awards outstanding upon the date of such Change in Control will have vesting accelerated as of the date of such Change in Control as to an additional 25% of the unvested shares subject to such awards. We no longer make awards under our 1990 and 1999 Stock Plans. Future awards under our 2004 Equity Incentive Plan will not provide for such acceleration. If within 12 months following a Change in Control, an employee is terminated by the successor employer for any reason, such employee's awards outstanding upon such Change in Control that are not yet exercisable and vested on such date shall become 100% vested and exercisable.
The Committee has decided to eliminate the "single trigger" acceleration of vesting upon a change in control described above. This change will apply to awards made after May 30, 2008. With this change, we believe our future executive severance and change of control practices are generally in line with those in place at other technology companies. We believe these change of control arrangements, the value of which are contingent on the value obtained in a change of control transaction, effectively create incentives for our executive team to build stockholder value and to obtain the highest value possible should we be acquired in the future, despite the risk of losing employment and potentially not having the opportunity to otherwise vest in equity awards which comprise a significant component of each executive's compensation. These arrangements are intended to attract and retain qualified executives that could have other job alternatives that may appear to them to be less risky absent these arrangements, particularly given the significant level of acquisition activity in the technology sector. Except for the acceleration of a portion of the grants to our executive officers, as described above, our change of control arrangements for our executive officers are "double trigger," meaning that acceleration of vesting is not awarded upon a change of control unless the executive's employment is terminated involuntarily (other than for cause) within 12 months following the transaction. We believe this structure strikes a balance between the necessary executive recruitment and retention effects described above, and the needs of potential acquiring companies, who often place significant value on retaining an executive team.
Nonqualified Deferred Compensation
The Adaptec Deferred Compensation Plan was terminated in fiscal 2008 resulting in a Plan payment of $683,963.63 to Mr. Sundaresh based on earnings he deferred from 1994 through 1998 during his prior employment with Adaptec.
Executive Compensation Tables
Summary Compensation Table
The following table provides information with respect to the compensation earned during fiscal 2008 by our Chief Executive Officer, our Chief Financial Officer, our former Chief Financial Officer and our other two highest paid executive officers who were serving as executive officers at the end of fiscal 2008, as well as one additional former executive officer who was one of our three highest compensated executive officers for fiscal 2008 (excluding our Chief Executive Officer, our Chief Financial Officer and our former Chief Financial Officer). This additional executive officer was not serving as an executive officer at the end of fiscal 2008. We refer to these five executive officers as our "named executive officers."
Change in Pension Value Non- and Non- Equity qualifed Incentive Deferred All Plan Compen- Other Stock Option Compen- sation Compen- Name and Fiscal Bonus Awards awards sation Earings sation Principal Position Year Salary ($) ($)(1) ($)(2) ($)(2) ($)(3) ($) ($)(4) Total ($)- ----------------------------- ------ ----------- ----------- ---------- ----------- ----------- ------------ ---------- ------------- Subramanian "Sundi" Sundaresh 2008 $ 450,000 -- $369,966 $ 228,098 $ 303,075 $ 29,927 $ 26,976 $ 1,408,042 Chief Executive Officer 2007 $ 450,000 -- $ 90,981 $ 163,336 $ 180,000 $ 32,455 $ 27,004 $ 943,776 and President Christopher G. O'Meara (5) 2008 $ 325,000 $ 162,500 $164,805 $ 256,251 $ 60,000 -- $ 380,184 (6) $ 1,348,740 Former Vice President 2007 $ 325,000 -- $ 42,480 $ 167,978 $ 101,000 -- $ 12,789 $ 649,247 and Chief Financial Office Mary L. Dotz (7) 2008 $ 1,020 -- -- -- -- -- $ 49 $ 1,069 Vice President 2007 -- -- -- -- -- -- -- -- and Chief Financial Officer Marcus D. Lowe 2008 $ 260,000 $ 130,000 $131,474 $ 80,740 $ 56,000 -- $ 22,738 $ 680,952 Vice President 2007 $ 260,000 -- $ 32,753 $ 89,889 $ 67,000 -- $ 17,939 $ 467,581 and General Manager Manoj Goyal (8) 2008 $ 255,000 $ 127,500 $123,671 $ 121,766 $ 55,000 $ 407 $ 25,419 $ 708,763 Former Vice President 2007 $ 215,000 $ 50,000(9)$ 10,958 $ 54,365 $ 53,300 $ 575 $ 18,500 $ 402,698 and General Manager of Data Protection Solutions Stephen Terlizzi (10) 2008 $ 198,846 $ 115,000 $ 59,979 $ 37,673 $ 29,500 -- $ 195,084 (11)$ 636,082 Former Vice President 2007 $ 97,308 -- -- $ 10,379 -- -- $ 9,217 (4)$ 116,904 and General Manager of the Storage and Solutions Group
(1) Unless otherwise indicated, the amounts shown in this column represent retention bonuses paid pursuant to the terms of retention agreements that we entered into with these executive officers on August 14, 2007. For more information regarding these retention agreements, see "Compensation Discussion and Analysis."
(2) The amounts shown do not reflect compensation actually received by the named executive officer. Instead, the amounts shown are the aggregate fair value of stock options and awards granted for financial statement reporting purposes pursuant to SFAS 123(R),with the exception that estimated forfeitures related to service-based vesting were disregarded in these amounts. The assumptions used to calculate the value of option awards are set forth under Note 8 to the Consolidated Financial Statements included herein for the fiscal year ended March 31, 2008.
(3) The amounts shown in this column represent payments made pursuant to the terms of our Adaptec Incentive Plan and, with respect to Mr. Sundaresh, also includes a performance bonus of $112,500 pursuant to the terms of his incentive performance agreement entered into on August 31, 2007. For more information regarding our Adaptec Incentive Plan and Mr. Sundaresh's incentive performance agreement, see "Compensation Discussion and Analysis."
(4) The amounts shown in this column consist of one or more of the following: health and life insurance premiums paid by Adaptec, an automobile allowance, matching contributions made to the officer's 401(K) plan, medical reimbursement, financial planning services and employee stock purchase plan disqualifying dispositions and health club.
(5) Mr. O'Meara's employment with us was terminated effective March 31, 2008.
(6) Includes a severance payment of $325,000 and vacation payout of $41,347.
(7) Ms. Dotz began her employment with us on March 31, 2008, the last day of fiscal 2008.
(8) Mr. Goyal's employment with us was terminated on April 21, 2008. As a result of this termination, he received a severance payment of $191,250, which was a fiscal 2009 event.
(9) Consists of a signing bonus in connection with the hiring of Mr. Goyal in June 2006.
(10) Mr. Terlizzi's employment with us was terminated on February 1, 2008.
(11) Includes a severance payment of $172,500.
Grants of Plan-Based Awards
All Other All Other Stock Option Awards: Exercise Estimated Future Payouts under Awards: Number of or Base Grant Date Non-Equity Incentive Plan Number Shares Securities Price Fair Value Awards (1) Shares of Underlying of Option of Stock and ------------------------------------------- Stock or Units Options Awards Option Awards Name Grant Date Threshold ($) Target ($) Maximum ($) (#) (2) (#) ($/Sh) (4)- ----------------------- ------------- -------------- ------------ ------------- ------------- -------------- -------------- ---------------- Subramanian "Sundi" -- -- $ 382,500 $ 765,000 -- -- -- -- Sundaresh 08/23/2007 -- -- -- 200,000 -- -- $ 699,800 - ----------------------- ------------- -------------- ------------ ------------- ------------- -------------- -------------- ---------------- Christopher G. O'Meara 08/23/2007 -- -- -- 75,000 -- $ 262,425 - ----------------------- ------------- -------------- ------------ ------------- ------------- -------------- -------------- ---------------- Mary L. Dotz (3) -- -- $ 132,500 $ 265,000 -- -- -- -- 03/31/2008 -- -- -- -- 125,000 $ 2.94 $ 121,725 03/31/2008 -- -- -- 50,000 -- -- $ 146,950 - ----------------------- ------------- -------------- ------------ ------------- ------------- -------------- -------------- ---------------- Marcus Lowe -- -- $ 130,000 $ 260,000 -- -- -- -- 08/23/2007 -- -- -- 70,000 -- -- $ 244,930 - ----------------------- ------------- -------------- ------------ ------------- ------------- -------------- -------------- ---------------- Manoj Goyal 08/23/2007 -- -- -- 100,000 -- -- $ 349,900 - ----------------------- ------------- -------------- ------------ ------------- ------------- -------------- -------------- ---------------- Stephen Terlizzi 08/23/2007 -- -- -- 70,000 -- -- $ 244,930
(1) Represents potential cash payments to be earned under the 2009 Adaptec Incentive Plan.
(2) The awards granted to Mr. Sundaresh and Mr. Lowe will vest with respect to 50% of the underlying shares in August 2008, with the remainder of the shares vesting August 2009. The award granted to Ms. Dotz vests in two equal annual installments, with 50% of the shares vesting on March 31, 2009 and the balance of the shares vesting on March 31, 2010. The awards granted to Messrs. O'Meara, Goyal and Terlizzi have expired in connection with their termination of employment with us.
(3) The stock options granted to Ms. Dotz vest with respect to 25% of the underlying shares on March 31, 2009 and with respect to an additional 6.25% of the underlying shares at the end of each subsequent three-month period such that the options will be fully vested on March 31, 2012
(4) The amounts reflect the value we determined for accounting purposes for these awards and do not reflect whether the recipient has actually realized or will realize a financial benefit from the awards. The value of a stock award or option award is based on the fair value as of the grant date of such award determined pursuant to SFAS 123(R). Pursuant to SEC rules, the amounts shown exclude the impact of estimated forfeitures related to service-based vesting conditions. For additional information on the valuation assumptions underlying the grant date fair value of these awards see Note 8 to the Consolidated Financial Statements.
Outstanding Equity Awards
The following table provides information with respect to each unexercised stock option and unvested restricted stock award held by the named executive officers as of March 31, 2008.
Option Awards Stock Awards ------------------------------------------------------------ ---------------------------------- Number of Number of Market Value Securities Securities Number of of Shares or Underlying Underlying Shares or Units of Unexercised Unexercised Option Option Units of Stock Stock That Options Options Exercise Expiration That Have Not Have not Name (#)Exercisable (#)Unexercisable Price ($) Date Vested Vested($) (1) -------------------------- ----------- ---------------- ----------- ------------ --------------- -------------Subramanian "Sundi" Sundares 164,999 135,001 (2) $ 3.65 05/23/2012 25,000 (3) $ 73,500 100,000 -- $ 3.45 09/19/2010 25,000 (4) $ 73,500 87,500 62,500 (5) $ 4.24 06/14/2013 200,000 (6) $ 588,000 62,500 87,500 (7) $ 4.48 11/13/2013 -- --414,999 285,001 250,000 $ 735,000Christopher G. O'Meara (8) 149,999 150,001 $ 6.03 07/01/2008 10,000 $ 29,400 35,000 25,000 $ 4.24 07/01/2008 15,000 $ 44,100 33,333 46,667 $ 4.48 07/01/2008 75,000 $ 220,500218,332 221,668 100,000 $ 294,000Mary L. Dotz -- 125,000 (9) $ 2.94 03/31/2015 50,000 (10) $ 147,000 Marcus D. Lowe 50,000 50,000 (11) $ 4.17 07/11/2012 9,000 (12) $ 26,460 80,000 -- $ 3.45 09/19/2010 9,000 (13) $ 26,460 29,165 20,835 (14) $ 4.24 06/14/2013 70,000 (15) $ 205,800 20,833 29,167 (16) $ 4.48 11/13/2013 -- --179,998 100,002 88,000 $ 258,720Manoj Goyal (8) 59,062 75,938 $ 5.47 07/21/2008 9,000 $ 26,460 20,833 29,167 $ 4.48 07/21/2008 100,000 $ 294,00079,895 105,105 109,000 $ 320,460Stephen Terlizzi (8) 23,437 -- $ 4.65 05/01/2008 -- --23,437 -- -- --
(1) The market value of the shares of restricted stock that have not yet vested was calculated based on the closing trading price for our common stock on The NASDAQ Global Market on March 31, 2008 of $2.94 per share.
(2) This option vested with respect to 20% of the underlying shares on May 23, 2006 and vests with respect to an additional 5% of the underlying shares at the end of each subsequent three-month period such that the option will be fully vested on May 23, 2010.
(3) These shares of restricted stock vest on June 14, 2008.
(4) These shares of restricted stock vest on November 13, 2008.
(5) This option vests with respect to 8.33% of the underlying shares at the end of each three-month period such that the option will be fully vested on June 14, 2009.
(6) These shares of restricted stock vest with respect to 50% of the underlying shares on August 23, 2008, with the remainder of the shares vesting on August 23, 2009.
(7) This option vests with respect to 8.33% of the underlying shares at the end of each three-month period such that the option will be fully vested on November 13, 2009.
(8) The employment of each Messrs. O'Meara, Goyal and Terlizzi with Adaptec has terminated. All of their unexercisable stock options have terminated, and their exercisable options will expire, if not exercised, by their expiration dates, all of their unvested shares of restricted stock have been forfeited.
(9) This option vests with respect to 25% of the underlying shares on March 31, 2009 and with respect to an additional 6.25% of the underlying shares at the end of each susequeent three-month period such that the options will be fully vested on March 31, 2012.
(10) These shares of restricted stock vest in two equal annual installments, with 50% of the shares vesting on March 31, 2009 and the balance of the shares vesting March 31, 2010.
(11) This option vested with respect to 20% of the underlying shares on May 23, 2006 and vests with respect to an additional 5% of the underlying shares at the end of each subsequent three-month period such that the option will be fully vested on July 11, 2010.
(12) These shares of restricted stock vest on June 14, 2008.
(13) These shares of restricted stock vest on November 13, 2008.
(14) This option vests with respect to 8.33% of the underlying shares at the end of each three-month period such that the option will be fully vested on June 14, 2009.
(15) These shares of restricted stock vest with respect to 50% of the underlying shares on August 23, 2008, with the remainder of the shares vesting on August 23, 2009.
(16) This option vests with respect to 8.33% of the underlying shares at the end of each three-month period such that the option will be fully vested on November 13, 2009.
Option Exercises and Stock Vested
The following table provides information regarding restricted stock awards held by the named executive officers that vested during the year ended March 31, 2008. None of the named executive officers exercised any options during fiscal 2008.
Number of Shares Value Acquired Realized On Vesting On Vesting Name (#) (6) ------------------------------ ------------ ---------- ------------------------------ ------------ -------------Subramanian "Sundi" Sundaresh 16,064 (1) $ $94,000 16,065 (2) $ $84,500 Christopher G. O'Meara 6,425 (3) $ $37,600 9,639 (4) $ $50,700 Mary L. Dotz -- -- Marcus D. Lowe 5,783 (5) $ $33,840 5,783 (6) $ $30,420 Manoj Goyal 5,783 (7) $ $30,420 Stephen Terlizzi -- --
None of our named executive officers hold stock awards or restricted stock subject to vesting.
(1) On June 14, 2007, 25,000 shares of restricted stock vested. However, we retained 8,936 of the shares to satisfy the income tax obligations of Mr. Subramanian. As a result he received the shares indicated in this column.
(2) On November 13, 2007, 25,000 shares of restricted stock vested. However, we retained 8,935 of the shares to satisfy the income tax obligations of Mr. Subramanian. As a result he received the shares indicated in this column.
(3) On June 14, 2007, 10,000 shares of restricted stock vested. However, we retained 3,575 of the shares to satisfy the income tax obligations of Mr. O'Meara. As a result he received the shares indicated in this column.
(4) On November 13, 2007, 15,000 shares of restricted stock vested. However, we retained 5,361 of the shares to satisfy the income tax obligations of Mr. O'Meara. As a result he received the shares indicated in this column.
(5) On June 14, 2007, 9,000 shares of restricted stock vested. However, we retained 3,217 of the shares to satisfy the income tax obligations of Mr. Lowe. As a result he received the shares indicated in this column.
(6) On November 13, 2007, 9,000 shares of restricted stock vested. However, we retained 3,217 of the shares to satisfy the income tax obligations of Mr. Lowe. As a result he received the shares indicated in this column.
(7) On November 13, 2007, 9,000 shares of restricted stock vested. However, we retained 3,217 of the shares to satisfy the income tax obligations of Mr. Goyal. As a result he received the shares indicated in this column.
(8) The closing price of our common stock on The NASDAQ Global Market was $3.76 on June 14, 2007 and $3.38 on November 13, 2007.
Nonqualified Deferred Compensation Table
The following table provides information with respect to the non-qualified deferred compensation activity for fiscal 2008 for the named executive officers.
Aggregate Aggregate Aggregate Earnings in Withdrawals Balance at Last Fiscal Distributions Last Fiscal Name Year ($) Year - --------------------------- ----------- ------------ -----------Subramanian "Sundi" Sundare(1) $ 29,927 $ 683,964 (1) $ -- Christopher G. O'Meara $ -- $ -- $ -- Mary L. Dotz $ -- $ -- $ -- Marcus D. Lowe $ -- $ -- $ -- Manoj Goyal $ 407 $ -- $ 10,668 Stephen Terlizzi $ -- $ -- $ --
(1) All contributions were made by Mr. Sundaresh during his previous employment with Adaptec from 1993 through 1998. The plan which these deposits were held under was terminated in fiscal 2008 and all amounts were distributed to Mr. Sundaresh.
Potential Payments upon Termination or Change in Control
The following table describes the potential payments and benefits upon termination of our named executive officers' employment before or after a change in control of Adaptec, as if each officer's employment terminated as of March 31, 2008. For purposes of valuing the severance and vacation payout payments in the table below, we used each officer's base salary rate in effect on March 31, 2008, and the number of accrued but unused vacation days on March 31, 2008.
Termination Without Cause or a Constructive Termination Termination Without Cause Change After a Change Prior to Change in in Control Name Benefits in Control Control (1) -------------------------- -------------------- -------------------- ----------------- -------------------Subramanian "Sundi" Sundaresh Severance $ 450,000 -- $ 675,000 Bonus $ -- -- $ 382,500 Equity Acceleration (2)$ -- $ 183,750 $ 551,250 Cobra Premium (3)$ 17,184 -- $ 17,184 Vacation Payout $ 37,542 -- $ 37,542 Perquisites (4)$ 10,000 -- $ 10,000 -------------------------- -------------------- -------------------- ----------------- ------------------- Christopher G. O'Meara (5) Severance $ 325,000 -- -- Bonus -- -- -- Equity Acceleration (2) -- -- -- Cobra Premium (3)$ 5,742 -- -- Vacation Payout $ 27,283 -- -- Perquisites (4) -- -- -- -------------------------- -------------------- -------------------- ----------------- ------------------- Mary L. Dotz Severance $ 198,750 -- $ 198,750 Bonus -- -- $ 132,500 Equity Acceleration (2) -- $ 36,750 $ 147,000 Cobra Premium (3)$ 4,307 -- $ 4,307 Vacation Payout -- -- $ -- Perquisites (4)$ 5,000 -- $ 5,000 -------------------------- -------------------- -------------------- ----------------- ------------------- Marcus D. Lowe Severance $ 195,000 -- $ 260,000 Bonus -- -- $ 130,000 Equity Acceleration (2) -- $ 64,680 $ 194,040 Cobra Premium (3)$ 4,307 -- $ 5,742 Vacation Payout $ 37,078 -- $ 37,078 Perquisites (4)$ 10,000 -- $ 10,000 -------------------------- -------------------- -------------------- ----------------- ------------------- Manoj Goyal (5) Severance $ 191,250 -- -- Bonus -- -- -- Equity Acceleration (2) -- -- -- Cobra Premium (3)$ 12,888 -- -- Vacation Payout $ 10,172 -- -- Perquisites (4)$ 4,500 -- -- -------------------------- -------------------- -------------------- ----------------- ------------------- Stephen Terlizzi (5) Severance $ 172,500 -- -- Bonus -- -- -- Equity Acceleration (2) -- -- -- Cobra Premium (3)$ 12,888 -- -- Vacation Payout $ 4,091 -- -- Perquisites (4)$ 3,500 -- -- -------------------------- -------------------- -------------------- --------------- -------------------Total Value $ 1,738,982 $ 285,180 $ 2,797,893-------------------------- -------------------- -------------------- ----------------- -------------------
(1) A "constructive termination" event is (1) a material reduction of the annual base and target incentive compensation specified in the officer's employment agreement to which he does not consent, (2) a failure of Adaptec's successor after a change of control to assume the officer's employment agreement, (3) a substantial change in the officer's position or responsibility or (4) the officer's position relocates to more than 25 additional commute miles (one way).
(2) Under our 1990 Stock Plan, 1999 Stock Plan and 2004 Equity Incentive Plan, in the event of a Change in Control, any awards outstanding upon the date of such Change in Control will have their vesting accelerated as of the date of such Change in Control as to an additional 25% of the shares subject to such awards. As discussed in "Compensation Discussion and Analysis," future equity awards will not contain this "single trigger" acceleration. If within 12 months following a Change in Control, an employee is terminated by the successor employer for any reason, such employee's outstanding awards that are not yet exercisable and vested on the date of such Change in Control shall become 100% vested and exercisable. The value of the equity acceleration was calculated based on the assumption that the change in control occurred and the officer's employment terminated on March 31, 2008, and that the fair market value per share of our common stock on that date was $2.94, which was the closing trading price of our common stock on The NASDAQ Global Market on March 31, 2008. The value of option vesting acceleration was calculated by multiplying the number of unvested shares subject to acceleration by the difference between $2.94 and the exercise price per share of the accelerated option. The value of stock vesting acceleration was calculated by multiplying the number of unvested shares by $2.94.
(3) COBRA payout amounts are estimated based on the monthly premium.
(4) Perquisites consist of outplacement services through the use of a company or consultant in an amount not to exceed to the values shown in the table.
(5) Messrs. O'Meara, Goyal and Terlizzi are no longer our employees. Vacation amounts reflect payments received upon termination. For these individuals, there is no potential additional payout due to a change in control as of year ended the date of this proxy.
Director Compensation
Overview
Our one director who is a company employee - Mr. Sundaresh - receives no additional or special compensation for serving as a director. Our non-employee directors receive a combination of cash and equity compensation for serving on our Board. In addition, we reimburse non-employee directors for out-of-pocket expenses incurred in connection with attending Board and committee meetings.
Cash Compensation
Our non-employee directors receive (1) an annual cash retainer of $6,500 per fiscal quarter, (2) a per-meeting retainer of $3,000 for each Board meeting attended (either in person or by telephone); however, the Chairperson of the Board may designate a given meeting as a $2,000-reduced-fee meeting and (3) a per-meeting retainer of $1,200 for each Board committee meeting attended that the Chairperson of the committee designates a formal meeting. These amounts are paid quarterly.
Equity Compensation
Our 2006 Director Plan is a "discretionary" plan and does not provide for automatic granting of options and other equity awards to our non-employee directors. Instead, our Board of Directors approves stock options and equity awards under that plan. We anticipate that the Board of Directors will generally grant stock options and shares of restricted common stock to our non-employee directors that will vest in one to three years. Additionally, for affiliated non-employee directors, we anticipate that the Board of Directors will continue to grant restricted stock units and stock appreciation rights to achieve consistency in their equity compensation with that of non-affiliated directors.
Director Compensation Table
Restricted Stock Or Restricted Option Fees Earned Stock Unit Awards ($) Name or Paid in Cash ($) Awards ($) (1) (1) Total - ------------------------- --------------------- ------------------- ------------- -----------------Jon S. Castor $ 116,175 $ 53,629 (2) $ 21,646 (5) $ 191,450 Joseph S. Kennedy $ 66,900 $ 27,966 (2) $ 7,184 (5) $ 102,050 Robert J. Loarie $ 85,100 $ 27,966 (2) $ 7,184 (5) $ 120,250 D. Scott Mercer $ 86,488 $ 27,966 (2) $ 28,793 (5) $ 143,246 Judith M. O'Brien (7) $ 78,038 $ 41,703 $ 10,956 $ 130,697 Charles J. Robel (7) $ 80,400 $ 16,040 $ 9,180 $ 105,620 Douglas E. Van Houweling $ 84,700 $ 27,966 (2) $ 7,184 (5) $ 119,850 John Mutch $ 28,900 $ 4,292 (3) $ 3,060 (6) $ 36,253 Jack L. Howard $ 24,563 $ 1,952 (4) $ -- 26,514 John J. Quicke $ 27,275 $ 1,952 (4) $ -- 29,227
(1) These amounts reflect the dollar amount of expense recognized for financial statement reporting purposes for fiscal 2008 in accordance with SFAS 123(R), with the exception that estimated forfeitures related to service-based vesting were disregarded in these amounts. Assumptions used in the calculation of this amount for purposes of our financial statements are included in Note 8 to the Consolidated Financial Statements.
(2) We awarded each of Mr. Castor, Mr. Kennedy, Mr. Loarie, Mr. Mercer, and Mr. Van Houweling 6,250 shares of restricted stock on December 13, 2007. These awards became fully vested on May 31, 2008.
(3) We awarded Mr. Mutch 16,250 shares of restricted stock on December 13, 2007. This award shall vest with respect to 33-1/3% of the shares on the first anniversary of the grant date, and with respect to 8-1/3% of the shares quarterly thereafter.
(4) We awarded each of Mr. Howard Mr. Quicke 16,250 restricted stock units on February 7, 2008. These restricted stock units shall vest with respect to 33-1/3% of the shares on the first anniversary of the grant date, and with respect to 8- 1/3% of the shares quarterly thereafter.
(5) We granted each of Mr. Castor, Mr. Kennedy, Mr. Loarie, Mr. Mercer, and Mr. Van Houweling options to purchase 12,500 shares of our common stock on December 13, 2007. These options vestedwith respect to 25% of the shares covered by the option on a quarterly basis (with the first vesting date being August 31, 2007) such that the option became fully vested on May 31, 2008.
(6) We granted Mr. Mutch an option to purchase 32,500 shares of our common stock on December 13, 2007. This option shall vest with respect to 33-1/3% of the shares covered by the option on the first anniversary of the grant date and with respect to 8-1/3% of the shares covered by the option quarterly thereafter.
(7) Ms. O'Brien and Mr. Robel resigned did not stand for re-election at our Annual Meeting of Stockholders to be held on December 13, 2007.
In addition, we granted each of Mr. Howard and Mr. Quicke stock appreciation rights covering 32,500 shares of our common stock on February 7, 2008. These stock appreciation rights vest with respect to 33-1/3% of the award on the first anniversary of the grant date and with respect to 8-1/3% of the award quarterly thereafter. There was no expense incurred in fiscal 2008 related to these stock appreciation rights.2010.
Compensation Committee Interlocks and Insider Participation
The Compensation Committee currently consists of Mr. Castor (Chairman), Mr. Loarie and Mr. Quicke, none of whom has any interlocking relationships, as defined by the SEC.
Compensation Committee Report
The members of the Compensation Committee have reviewed and discussed the Compensation Discussion and Analysis section set forth above with management and, based on such review and discussion, the members of the Compensation Committee recommended to the Board that the Compensation Discussion and Analysis be included in our Annual Report on Form 10-K for the year ended March 31, 2008.
THE COMPENSATION COMMITTEE
Jon S. Castor
Robert J. Loarie
John J. Quicke
Item 12.12.Security Ownership of Certain Beneficial Owners and Management and Related Stockholder Matters
STOCK OWNERSHIP OF PRINCIPAL STOCKHOLDERS AND MANAGEMENT
The following table presents certain information regardingInformation with respect to the beneficialsecurities authorized for issuance under our equity compensation plans and the security ownership of our common stock as of May 21,2008 by (a) each beneficial owner of 5% or more of our outstanding stock known to us, (b) each of our directors, (c) each of our named executive officers and (d) all5% stockholders required by this Item is incorporated in this Annual Report on Form 10-K by reference to the information under the captions: “Stock Ownership of Principal Stockholders and Management” and “Executive Compensation—Equity Compensation Plan Information” of our directors and executive officers as a group.
The percentageProxy Statement for our Annual Meeting of beneficial ownership for the table is based on approximately 120,645,945 shares of our common stock outstanding as of May 21, 2008. To our knowledge, except under community property laws or as otherwise noted, the persons and entities named in the table have sole voting and sole investment power over their shares of our common stock. Unless otherwise indicated, each beneficial owner listed below maintains a mailing address of c/o Adaptec, Inc., 691 South Milpitas Boulevard, Milpitas, California 95035.
The number of shares beneficially owned by each stockholder is determined under SEC rules and is not necessarily indicative of beneficial ownership for any other purpose. Under these rules, beneficial ownership includes those shares of common stock over which the stockholder has sole or shared voting or investment power and those shares of common stock that the stockholder has the rightStockholders to acquire within 60 days after May 21, 2008, including through the exercise of any equity award. The "Percentage of Shares" column treats as outstanding all shares underlying equity awards held by the stockholder, but not shares underlying equity awards held by other stockholders.
Adaptec Shares Beneficially Owned --------------------------------------- Percentage of Shares Name of Beneficial Owner Number of Shares (1) Outstanding -------------------------------- ----------------- ----------------- Directors and Executive Officers:-------------------------------- Jon S. Castor 51,250 * Jack L. Howard -- * Joseph S. Kennedy 140,000 * Robert J. Loarie (2) 192,604 * D. Scott Mercer 160,000 * John Mutch 16,250 * John J. Quicke -- * Douglas E. Van Houweling 140,000 * Subramanian "Sundi" Sundaresh 757,128 * Marcus D. Lowe 286,528 * Mary L. Dotz 50,000 * ------------------ Directors and Executive Officers 1,793,760 1.49 % as a group (11 persons) ==================5% Stockholder:-------------------------------- Steel Partners II, L.P. (3) 19,107,826 15.84 % Dimensional Fund Advisors, L.P. (4) 9,791,284 8.12 % Renaissance Technologies LLC (5) 9,534,100 7.90 % Donald Smith & Co., Inc. (6) 8,185,464 6.78 % Barclays Global Investors, N.A. (7) 6,578,643 5.45 %
(1) Includes the following shares that may be acquired upon exercise of stock options granted under our stock option plans within 60 days after May 21, 2008, and the following restricted shares that have been awarded but have not yet released as of May 21, 2008.
Number of Restricted Name Number of Options Stock - ------------------- ------------------ ---------------Jon S. Castor 28,750 6,250 Joseph S. Kennedy 127,500 6,250 Robert J. Loarie 132,500 6,250 D. Scott Mercer 147,500 6,250 Douglas E. Van Houweling 127,500 6,250 John Mutch -- 16,250 Jack L. Howard -- -- John J. Quicke -- -- Subramanian "Sundi" Sundare 454,999 250,000 Marcus D. Lowe 198,332 88,000 Mary L. Dotz -- 50,000 ---------- --------- Directors and executive 1,217,081 435,500 officers as a group ========== =========
(2) Includes 53,854 shares held in the name of a trust for the benefit of Mr. Loarie and his family.2010.
(3) Steel Partners II, L.P. ("Steel Partners") has sole voting and dispositive power over all of the shares. Steel Partners, L.L.C. is the general partner of Steel Partners. The sole executive officer and managing member of Steel Partners, L.L.C. is Warren G. Lichtenstein, who is Chairman of the Board, Chief Executive Officer and Secretary. By virtue of his positions with Steel Partners, L.L.C. and Steel Partners, Mr. Lichtenstein has the power to vote and dispose of all of the shares. Steel Partners' address is 590 Madison Avenue, 32nd Floor, New York, New York 10022. As of June 11, 2008, Steel Partners reported that it owned 19,653,450 shares of our common.
(4) Dimensional Fund Advisors, L.P. ("Dimensional") reported that it has sole voting power and dispositive powerInformation with respect to allthe Compensation Committee of our Board of Directors required by this Item is incorporated in this Annual Report on Form 10-K by reference to the shares. Dimensional furnishes investment advice to four investment companies registeredinformation under the Investment Company Actcaptions “Proposal No. 1—Election of 1940,Directors” and serves as investment manager to certain other commingled group trusts“Compensation Committee Interlocks and separate accounts (these investment companies, trusts and accounts are collectively referred to as the "Funds"). AllInsider Participation” of the shares are ownedour Proxy Statement for our Annual Meeting of record by the Funds. Dimensional's address is 1299 Ocean Avenue, Santa Monica, California 90401. All information regarding Dimensional is based solely upon Amendment No. 1 to its Schedule 13G/A filed by it with the SEC on February 6, 2008.
(5) Renaissance Technologies LLC ("Renaissance") reported that both it and James H. Simons, who controls Renaissance, have sole voting power and dispositive power with respect to all of the shares. Renaissance's address is 800 Third Avenue, New York, New York 10022. All information regarding Renaissance is based solely upon the Schedule 13G filed by it with the SEC on February 13, 2008.
(6) Donald Smith & Co., Inc. ("Donald Smith") reported that it has sole voting power with respect to 7,489,414 shares and sole dispositive power with respect to all of the shares. All of the shares are owned of record by advisory clients of Donald Smith. Donald Smith's address is 152 West 57th Street, New York, New York 10019. All information regarding Dimensional is based solely upon the Schedule 13G filed by it with the SEC on February 8, 2008.
(7) Barclays Global Investors, N.A. reported that it had sole voting power with respect to 2,261,112 shares and sole dispositive power with respect to 2,714,101 shares, Barclays Global Fund Advisors had sole voting power with respect to 2,749,501 shares and sole dispositive power with respect to 3,740,602 shares and that Barclays Global Investors, Ltd. had sole dispositive power with respect to 123,940 shares. The address of each of Barclays Global Investors, N.A. and Barclays Global Fund Advisors is 45 Fremont Street, San Francisco, California 94105. The address of Barclays Global Investors, Ltd. is Murray House, 1 Royal Mint Court, London, England EC3N 4HH. All information regarding these entities is based solely upon the Schedule 13G filed by them with the SEC on February 5, 2008.
Equity Compensation Plan Information
The following table sets forth information as of March 31, 2008 regarding equity awards under our 2004 Equity Incentive Plan; Snap Appliance, Inc. 2002 Stock Option and Restricted Stock Purchase Plan; Broadband Storage, Inc. 2001 Stock Option and Restricted Stock Purchase Plan; 2000 Non-statutory Stock Option Plan; 1999 Stock Plan; 1990 Stock Plan; Distributed Processing Technology Corp. Omnibus Stock Option Plan; Stargate Solutions, Inc. 1999 Incentive Stock Plan; Eurologic Systems Group Limited 1998 Share Option Plan; 2006 Director Option Plan; 2000 Director Option Plan; 1990 Directors' Option Plan, and any amendments to such plans:
Equity Compensation Plan Information Table ------------------------------------------------------------ (a) (b) (c) ----------------- ------------------ ------------------ Number of Number of SecuritiesStockholders to beWeighted-avarage Securities Issued upon Exercise Remaining Available Exercise of Price of for Future Issuance Outstanding Outstanding under Equity Options, Options, Compensation Plan Warrants Warrants Warrants Plan Category and Rights and Rights and Rights- ------------------------------ ----------------- ------------------ ------------------ Equity compensation plans 11,022,110 5.39 21,538,679 (1) apprived by security holders Equity compensation plans not 113,378 3.07 -- approved by security holders (2) - ------------------------------ ----------------- ------------------ Total 11,135,488 5.36 21,538,679 ================= ==================
Item 13.13.Certain Relationships and Related Transactions, and Director Independence
TRANSACTIONS WITH RELATED PERSONS
Related Party Transactions Policy and Procedures
Any related party transactions, excluding compensation (whether cash, equity or otherwise), which is delegatedInformation with respect to the Compensation Committee, involving onecertain relationships of our directors, or executive officers must be reviewed and approved5% stockholders and related transactions required by this Item is incorporated in this Annual Report on Form 10-K by reference to the Audit Committee or another independent body ofinformation under the Board of Directors. Any member of the Audit Committee who is a related partycaption “Transactions with respect to a transaction under review may not participate in the deliberations or vote on the approval or ratification of the transaction. However, such a director may be counted in determining the presence of a quorum at a meeting of the committee that considers the transaction. Related parties include anyPersons” of our directors or executive officers, certain ofProxy Statement for our stockholders and their immediate family members. To identify any related party transactions, each year, we submit and require our directors and officers to complete director and officer questionnaires identifying any transactions with us in which the executive officer or director or their family members has an interest. In addition, the Nominating and Governance Committee of our Board of Directors determines, on an annual basis, which members of our Board of Directors meet the definition of independent director as defined in the rules of The NASDAQ Stock Market and reviews and discusses any relationships with a director that would potentially interfere with his or her exercise of independent judgment in carrying out the responsibilities of a director.
Certain Related Party Transactions
Settlement Agreement with Steel Partners
On October 26, 2007, we entered into a Settlement Agreement (the "Settlement Agreement") with Steel Partners, L.L.C. and Steel Partners II, L.P. (collectively, "Steel Partners") to end the election contest that was to occur at our 2007 Annual Meeting of Stockholders (the "Annual Meeting"). Steel Partners, our largest stockholder, beneficially owned approximately 16.29% of our common stock as of June 11, 2008.
Pursuant to the Settlement Agreement, we agreed:
Pursuant to the Settlement Agreement, Steel Partners agreed:
In December 2007, we held our 2007 Annual Meeting of Stockholders, at which our stockholders elected nine directors to our Board of Directors, including each of the Steel Partners Nominees. Mr. Quicke is an Operating Partner of Steel Partners, Ltd., a management advisory company that provides management advisory services to Steel Partners II, L.P. and its affiliates, and Mr. Howard is Vice Chairman of Steel Partners, Ltd. Steel represented to us in the Settlement Agreement that Mr. Howard and Mr. Quicke may be deemed to be affiliates of Steel under the rules of the Securities Exchange Act of 1934, but that Mr. Mutch was not an affiliate of Steel. Mr. Quicke was appointed to our Compensation Committee, Mr. Howard was appointed to our Nominating and Governance Committee and Mr. Mutch was appointed to our Audit Committee. We have compensated each of the Steel Partners Nominees with equity awards or equity based awards as described in Item 11 under the caption "Director Compensation."
The Settlement Agreement terminated immediately following the Annual Meeting, except as to specific provisions as set forth in the Settlement Agreement.
Indemnification Arrangements
Our Certificate of Incorporation and Bylaws contain provisions that limit the liability of our directors and provide for indemnification of our officers and directors to the full extent permitted under Delaware law. Under our Certificate of Incorporation, and as permitted under the Delaware General Corporation Law, directors are not liable to us or our stockholders for monetary damages arising from a breach of their fiduciary duty of care as directors, including such conduct during a merger or tender offer. In addition, we have entered into separate indemnification agreements with our directors and officers that could require us to, among other things, indemnify them against certain liabilities that may arise by reason of their status or service as directors or officers. Such provisions do not, however, affect liability for any breach of a director's duty of loyalty to us or our stockholders, liability for acts or omissions not in good faith or involving intentional misconduct or knowing violations of law, liability for transactions in which the director derived an improper personal benefit or liability for the payment of a dividend in violation of Delaware law. Such limitation of liability also does not limit a director's liability for violation of, or otherwise relieve us or our directors from the necessity of complying with, federal or state securities laws or affect the availability of equitable remedies such as injunctive relief or rescission.
Other than as set forth in this section and the compensation arrangements set forth in Item 11 of this Form 10- K, since April 1, 2007 there has not been, nor is there currently proposed, any transaction in which we were or will be a participant and in which the amount involved exceeded $120,000 and in which any executive officer, director, 5% beneficial owner of our common stock or member of the immediate family of any of the foregoing persons had or will have a direct or indirect material interest.
Director Independence
Our Chief Executive Officer, Subramanian "Sundi" Sundaresh, is a member of our Board of Directors. Each of our non-employee directors, Jon S. Castor, Joseph S. Kennedy, D. Scott Mercer, John Mutch, John J. Quicke, Jack L. Howard and Douglas E. Van Houweling, qualifies as "independent" in accordance with the rules of The NASDAQ Stock Market. The NASDAQ independence definition includes a series of objective tests, including that a director may not be our employee and that the director has not engaged in various types of business dealings with us. In addition, as further required by the NASDAQ rules, our Board of Directors has made a subjective determination as to each independent director that no relationship exists which, in the opinion of the Board of Directors, would interfere with the exercise of such director's independent judgment in carrying out the responsibilities of a director.
Item 14.14.Principal Accounting Fees and Services
FeesInformation with respect to principal independent registered public accounting firm fees and services required by this Item is incorporated in this Annual Report on Form 10-K by reference to the information under the captions “Proposal No. 2—Ratification of Appointment of Independent Registered Public Accounting Firm” and “Fees Paid to PricewaterhouseCoopers LLP
The following table presents information regarding the fees estimated and billed by PricewaterhouseCoopers LLP and affiliated entities (collectively "PricewaterhouseCoopers")LLP” of our Proxy Statement for our 2008 and 2007 fiscal years.
for the Year Ended March 31, -------------------------------- NatureAnnual Meeting ofServices 2008 2007- ----------------------------- --------------- --------------- Audit Fees $ 1,692,000 $ 1,570,000 Audit-Related Fees 182,000 -- Tax Fees 153,000 164,000 All Other Fees -- -- - ----------------------------- --------------- --------------- Total Fees $ 2,027,000 $ 1,734,000 =============== ===============
Audit Fees. This category includesprofessional services rendered for the audit of our annual consolidated financial statements, review of consolidated financial statements included in our quarterly reports on Form 10-Q and services that were provided in connection with statutory and regulatory filings or engagements.
Audit-Related Fees. This category includes professional services rendered by PricewaterhouseCoopers that were related to due diligence on a potential acquisition.
Tax Fees. This category includesprofessional services rendered by PricewaterhouseCoopers that were related to tax advice, tax compliance and foreign tax matters.
All Other Fees. We did not incur any Other Fees during these periods.
Audit Committee Pre-Approval Policies and Procedures
Section 10A(i)(1) of the Exchange Act and related SEC rules require that all auditing and permissible non-audit servicesStockholders to be performed by a company's principal accountants be approvedheld in advance by the Audit Committee of the Board, subject to a de minimis exception set forth in the SEC rules (the "De Minimis Exception"). Pursuant to Section 10A(i)(3) of the Exchange Act and related SEC rules, the Audit Committee has established procedures by which the Chairperson of the Audit Committee may pre-approve such services provided the pre-approval is detailed as to the particular service or category of services to be rendered and the Chairperson reports the details of the services to the full Audit Committee at its next regularly scheduled meeting. None of the audit-related or non-audit services described above were performed pursuant to the De Minimis Exception during the periods in which the pre-approval requirement has been in effect.2010.
In the 2008 and 2007 fiscal years, the Audit Committee followed SEC guidelines in approving all services rendered by PricewaterhouseCoopers.PART IV
PART IV
Item 15.Exhibits and Financial Statement Schedules
| (a) | The following documents are filed as a part of this Annual Report on Form 10-K: |
| Page | ||
1. Index to Financial Statements | ||
| F-1 | ||
Consolidated Statements of Operations—Fiscal Years Ended March 31, 2010, 2009 and 2008 | F-2 | |
| F-3 | ||
Consolidated Statements of Cash Flows—Fiscal Years Ended March 31, 2010, 2009 and 2008 | F-4 | |
Consolidated Statements of Stockholders’ Equity—Fiscal Years Ended March 31, 2010, 2009 and 2008 | F-5 | |
| F-6 | ||
2. Financial Statement Schedule | ||
| II-1 | ||
3. Exhibits | ||
The exhibits listed in the accompanying index to exhibits, which follows the signature page, are filed or incorporated by reference as part of this Annual Report on Form 10-K. | ||
| (b) | Exhibits |
See Item 15(a)(3), above.
| (c) | Financial Statement Schedules |
See Item 15(a)(2), above.
57
(a) The following documents are filed as a part of this Annual Report on Form 10-K:
1. Index to Financial Statements
Report of Independent Registered Public Accounting FirmConsolidated Statements of OperationsConsolidated Balance SheetsConsolidated Statements of Cash FlowsConsolidated Statements of Stockholders' EquityNotes to Consolidated Financial Statements
2. Financial Statement Schedule
3. Exhibits
The exhibits listed in the accompanyingindex to exhibits, which follows the signature page, are filed or incorporated by reference as part of this Annual Report on Form 10-K.
(b)Exhibits
See Item 15(a)(3), above.
(c)Financial Statement Schedules
See Item 15(a)(2), above.
REPORT OF INDEPENDENT REGISTERED PUBLIC ACCOUNTING FIRM
To theBoard of Directors and Stockholders of Adaptec, Inc.
In our opinion, the consolidated financial statements listed in the index appearing under Item 15(a)(1), present fairly, in all material respects, the financial position of Adaptec, Inc. and its subsidiaries at March 31, 20082010 and March 31, 20072009, and the results of their operations and their cash flows for each of the three years in the period ended March 31, 20082010 in conformity with accounting principles generally accepted in the United States of America. In addition, in our opinion, the financial statement schedule listed in the index appearing under Item 15(a)(2) presents fairly, in all material respects, the information set forth therein when read in conjunction with the related consolidated financial statements. Also in our opinion, the Company maintained, in all material respects, effective internal control over financial reporting as of March 31, 2008,2010, based on criteria established inInternal Control - Control—Integrated Framework issued by the Committee of Sponsoring Organizations of the Treadway Commission (COSO). The Company'sCompany’s management is responsible for these financial statements and financial statement schedule, for maintaining effective internal control over financial reporting and for its assessment of the effectiveness of internal control over financial reporting, included in Management'sManagement’s Report on Internal Control over Financial Reporting, appearing under Item 9A. Our responsibility is to express opinions on these financial statements, on the financial statement schedule, and on the Company'sCompany’s internal control over financial reporting based on our integrated audits. We conducted our audits in accordance with the standards of the Public Company Accounting Oversight Board (United States). Those standards require that we plan and perform the audits to obtain reasonable assurance about whether the financial statements are free of material misstatement and whether effective internal control over financial reporting was maintained in all material respects. Our audits of the financial statements included examining, on a test basis, evidence supporting the amounts and disclosures in the financial statements, assessing the accounting principles used and significant estimates made by management, and evaluating the overall financial statement presentation. Our audit of internal control over financial reporting included obtaining an understanding of internal control over financial reporting, assessing the risk that a material weakness exists, and testing and evaluating the design and operating effectiveness of internal control based on the assessed risk. Our audits also included performing such other procedures as we considered necessary in the circumstances. We believe that our audits provide a reasonable basis for our opinions.
As discussed in Note 1 to the Consolidated Financial Statements, effective April 1, 2006, the Company changed the manner in which it accounts for stock-based compensation.
As discussed in Note 1314 to the Consolidated Financial Statements, effective April 1, 2007, the Company changed the manner in which it accounts for uncertain tax positions.
A company'scompany’s internal control over financial reporting is a process designed to provide reasonable assurance regarding the reliability of financial reporting and the preparation of financial statements for external purposes in accordance with generally accepted accounting principles. A company'scompany’s internal control over financial reporting includes those policies and procedures that (i) pertain to the maintenance of records that, in reasonable detail, accurately and fairly reflect the transactions and dispositions of the assets of the company; (ii) provide reasonable assurance that transactions are recorded as necessary to permit preparation of financial statements in accordance with generally accepted accounting principles, and that receipts and expenditures of the company are being made only in accordance with authorizations of management and directors of the company; and (iii) provide reasonable assurance regarding prevention or timely detection of unauthorized acquisition, use, or disposition of the company'scompany’s assets that could have a material effect on the financial statements.
Because of its inherent limitations, internal control over financial reporting may not prevent or detect misstatements. Also, projections of any evaluation of effectiveness to future periods are subject to the risk that controls may become inadequate because of changes in conditions, or that the degree of compliance with the policies or procedures may deteriorate.
| /s/ PricewaterhouseCoopers LLP |
| San Jose, California |
| May 27, 2010 |
San Jose, CaliforniaF-1
June 13, 2008
ADAPTEC, INC.
CONSOLIDATED STATEMENTS OF OPERATIONS
Years Ended March 31, 2010 2009 2008 (in thousands, except per share amounts) Net revenues
$ 73,682 $ 114,774 $ 145,501 Cost of revenues (inclusive of amortization of acquisition-related intangible assets)
40,288 65,413 88,925 Gross profit
33,394 49,361 56,576 Operating expenses:
Research and development
29,486 26,929 33,966 Selling, marketing and administrative
32,600 34,995 50,432 Amortization of acquisition-related intangible assets
1,300 758 2,535 Restructuring charges
1,608 6,092 6,273 Goodwill impairment
— 16,947 — Other gains, net
— — (3,594 ) Total operating expenses
64,994 85,721 89,612 Loss from continuing operations
(31,600 ) (36,360 ) (33,036 ) Interest and other income, net
10,461 21,008 31,335 Interest expense
(6 ) (1,229 ) (3,646 ) Loss from continuing operations before income taxes
(21,145 ) (16,581 ) (5,347 ) Benefit from (provision for) income taxes
2,475 2,605 (25 ) Loss from continuing operations, net of taxes
(18,670 ) (13,976 ) (5,372 ) Discontinued operations, net of taxes:
Loss from discontinued operations, net of taxes
— (941 ) (4,722 ) Gain on disposal of discontinued operations, net of taxes
1,236 4,727 479 Income (loss) from discontinued operations, net of taxes
1,236 3,786 (4,243 ) Net loss
$ (17,434 ) $ (10,190 ) $ (9,615 ) Basic and diluted income (loss) per share:
Loss from continuing operations, net of taxes
$ (0.16 ) $ (0.12 ) $ (0.05 ) Income (loss) from discontinued operations, net of taxes
$ 0.01 $ 0.03 $ (0.04 ) Net loss
$ (0.15 ) $ (0.09 ) $ (0.08 ) Shares used in computing income (loss) per share:
Basic and diluted
119,196 119,767 118,613 See accompanying Notes to the Consolidated Financial Statements.
Years Ended March 31, ---------------------------------------- 2008 2007 2006 ------------ ------------ ------------ (in thousands, except per share amounts)ADAPTEC, INC.Net revenues $ 167,400 $ 255,208 $ 344,142 Cost of revenues 104,927 173,974 230,249 ------------ ------------ ------------ Gross profit 62,473 81,234 113,893 ------------ ------------ ------------ Operating expenses: Research and development 39,804 56,573 68,179 Selling, marketing and administrative 57,351 61,325 72,376 Amortization of acquisition-related intangible assets 2,893 5,996 9,234 Restructuring charges 6,273 3,711 10,430 Goodwill impairment -- -- 90,602 Other charges (gains) (3,371) 14,700 11,603 ------------ ------------ ------------ Total operating expenses 102,950 142,305 262,424 ------------ ------------ ------------ Loss from continuing operations (40,477) (61,071) (148,531) Interest and other income 31,335 25,618 17,621 Interest expense (3,646) (3,405) (3,314) ------------ ------------ ------------ Loss from continuing operations before income taxes (12,788) (38,858) (134,224) Provision for (benefit from) income taxes (2,694) (63,704) 1,608 ------------ ------------ ------------ Income (loss) from continuing operations, net of taxes (10,094) 24,846 (135,832) ------------ ------------ ------------ Discontinued operations, net of taxes: Loss from discontinued operations, net of taxes -- (546) (22,410) Income from disposal of discontinued operations, net of taxes 479 6,543 9,810 ------------ ------------ ------------ Income (loss) from discontinued operations, net of taxes 479 5,997 (12,600) ------------ ------------ ------------ Net income (loss) $ (9,615) $ 30,843 $ (148,432) ============ ============ ============ Income (loss) per share: Basic: Continuing operations $ (0.09) $ 0.21 $ (1.20) Discontinued operations $ 0.00 $ 0.05 $ (0.11) Net income (loss) $ (0.08) $ 0.26 $ (1.31) Diluted: Continuing operations $ (0.09) $ 0.20 $ (1.20) Discontinued operations $ 0.00 $ 0.04 $ (0.11) Net income (loss) $ (0.08) $ 0.25 $ (1.31) Shares used in computing income (loss) per share: Basic 118,613 116,602 113,405 Diluted 118,613 136,690 113,405
CONSOLIDATED BALANCE SHEETS
| March 31, | ||||||
| 2010 | 2009 | |||||
| (in thousands, except par value) | ||||||
Assets | ||||||
Current assets: | ||||||
Cash and cash equivalents | $ | 63,948 | $ | 111,724 | ||
Marketable securities | 311,399 | 264,868 | ||||
Accounts receivable, net of allowance for doubtful accounts of $34 in 2010 and $46 in 2009 | 7,528 | 11,735 | ||||
Inventories | 2,342 | 4,095 | ||||
Prepaid expenses | 2,354 | 2,257 | ||||
Other current assets | 11,269 | 14,793 | ||||
Total current assets | 398,840 | 409,472 | ||||
Property and equipment, net | 11,353 | 11,664 | ||||
Intangible assets, net | 16,029 | 19,748 | ||||
Other long-term assets | 2,854 | 9,223 | ||||
Total assets | $ | 429,076 | $ | 450,107 | ||
Liabilities and Stockholders’ Equity | ||||||
Current liabilities: | ||||||
Accounts payable | $ | 9,188 | $ | 10,528 | ||
Accrued and other liabilities | 12,271 | 13,251 | ||||
3/4% Convertible Senior Subordinated Notes due 2023 | 346 | 474 | ||||
Total current liabilities | 21,805 | 24,253 | ||||
Other long-term liabilities | 4,755 | 7,310 | ||||
Deferred income taxes | 4,813 | 7,664 | ||||
Total liabilities | 31,373 | 39,227 | ||||
Commitments and contingencies (Note 10) | ||||||
Stockholders’ equity: | ||||||
Preferred stock; $0.001 par value | ||||||
Authorized shares, 1,000; Series A shares, 250 designated; outstanding shares, none | — | — | ||||
Common stock; $0.001 par value | ||||||
Authorized shares, 400,000; outstanding shares, 120,401 as of March 31, 2010 and 120,711 as of March 31, 2009 | 119 | 120 | ||||
Additional paid-in capital | 203,229 | 200,293 | ||||
Accumulated other comprehensive income, net of taxes | 4,286 | 2,964 | ||||
Retained earnings | 190,069 | 207,503 | ||||
Total stockholders’ equity | 397,703 | 410,880 | ||||
Total liabilities and stockholders’ equity | $ | 429,076 | $ | 450,107 | ||
See accompanying Notes to Consolidated Financial Statements.
F-3
CONSOLIDATED STATEMENTS OF CASH FLOWS
| Years Ended March 31, | ||||||||||||
| 2010 | 2009 | 2008 | ||||||||||
| (in thousands) | ||||||||||||
Cash Flows From Operating Activities: | ||||||||||||
Net loss | $ | (17,434 | ) | $ | (10,190 | ) | $ | (9,615 | ) | |||
Less: Income (loss) from discontinued operations, net of taxes | 1,236 | 3,786 | (4,243 | ) | ||||||||
Loss from continuing operations, net of taxes | (18,670 | ) | (13,976 | ) | (5,372 | ) | ||||||
Adjustments to reconcile loss from continuing operations, net of taxes, to net cash provided by operating activities of continuing operations: | ||||||||||||
Stock-based compensation expense | 5,816 | 3,159 | 5,999 | |||||||||
Inventory-related charges (credit) | (847 | ) | 1,987 | 5,753 | ||||||||
Depreciation and amortization | 10,051 | 7,801 | 7,840 | |||||||||
Impairment of goodwill and intangible assets | — | 16,947 | 2,205 | |||||||||
Gain on sale of long-lived assets | — | — | (6,735 | ) | ||||||||
Gain on sale of investments | (440 | ) | (2,255 | ) | — | |||||||
Gain on extinguishment of debt | — | (1,643 | ) | — | ||||||||
Other non-cash items | 47 | 346 | 751 | |||||||||
Changes in assets and liabilities, net of effects from the purchase of Aristos Logic Corporation: | ||||||||||||
Accounts receivable | 4,207 | 12,145 | 10,920 | |||||||||
Inventories | 2,600 | 2,297 | 11,140 | |||||||||
Prepaid expenses and other current assets | 1,959 | 4,031 | 6,506 | |||||||||
Other assets | 6,367 | (4,738 | ) | 2,497 | ||||||||
Accounts payable | (1,331 | ) | (2,036 | ) | (15,878 | ) | ||||||
Other liabilities | (7,582 | ) | (10,057 | ) | (4,206 | ) | ||||||
Net Cash Provided by Operating Activities of Continuing Operations | 2,177 | 14,008 | 21,420 | |||||||||
Net Cash Provided by (Used in) Operating Activities of Discontinued Operations | 1,236 | (358 | ) | 1,374 | ||||||||
Net Cash Provided by Operating Activities | 3,413 | 13,650 | 22,794 | |||||||||
Cash Flows From Investing Activities: | ||||||||||||
Purchase of Aristos Logic Corporation, net of cash acquired | — | (38,005 | ) | — | ||||||||
Purchase of intangible assets | (702 | ) | — | — | ||||||||
Proceeds from sale of long-lived assets | — | — | 19,881 | |||||||||
Proceeds from sale of investments | 440 | — | — | |||||||||
Purchases of property and equipment | (1,283 | ) | (622 | ) | (1,512 | ) | ||||||
Purchases of marketable securities | (236,947 | ) | (231,349 | ) | (181,295 | ) | ||||||
Sales of marketable securities | 102,856 | 273,132 | 175,603 | |||||||||
Maturities of marketable securities | 85,187 | 79,777 | 100,777 | |||||||||
Maturities of restricted marketable securities | — | 1,688 | 1,688 | |||||||||
Net Cash Provided by (Used in) Investing Activities of Continuing Operations | (50,449 | ) | 84,621 | 115,142 | ||||||||
Net Cash Provided by (Used in) Investing Activities of Discontinued Operations | — | 776 | (66 | ) | ||||||||
Net Cash Provided by (Used in) Investing Activities | (50,449 | ) | 85,397 | 115,076 | ||||||||
Cash Flows From Financing Activities: | ||||||||||||
Repurchases and redemption on long-term debt | (128 | ) | (222,915 | ) | — | |||||||
Proceeds from the issuance of common stock | 448 | 1,676 | 3,179 | |||||||||
Repurchase of common stock | (1,756 | ) | (2,401 | ) | — | |||||||
Net Cash Provided by (Used in) Financing Activities | (1,436 | ) | (223,640 | ) | 3,179 | |||||||
Effect of Foreign Currency Translation on Cash and Cash Equivalents | 696 | (3,594 | ) | 2,940 | ||||||||
Net Increase (Decrease) in Cash and Cash Equivalents | (47,776 | ) | (128,187 | ) | 143,989 | |||||||
Cash and Cash Equivalents at Beginning of Year | 111,724 | 239,911 | 95,922 | |||||||||
Cash and Cash Equivalents at End of Year | $ | 63,948 | $ | 111,724 | $ | 239,911 | ||||||
See accompanying Notes to Consolidated Financial Statements.
CONSOLIDATED STATEMENTS OF STOCKHOLDERS’ EQUITY
| Common Stock | Additional Paid-in Capital | Accumulated Other Comprehensive Income, Net of Taxes | Retained Earnings | Total | |||||||||||||||||||
| Shares | Amount | ||||||||||||||||||||||
| (in thousands) | |||||||||||||||||||||||
Balance, March 31, 2007 | 118,856 | $ | 119 | $ | 190,236 | $ | 3,178 | $ | 228,625 | $ | 422,158 | ||||||||||||
Cumulative effect adjustment, net of taxes related to the adoption of uncertain tax positions | — | — | — | — | (1,317 | ) | (1,317 | ) | |||||||||||||||
Adjusted balance, March 31, 2007 | 118,856 | 119 | 190,236 | 3,178 | 227,308 | 420,841 | |||||||||||||||||
Components of comprehensive loss: | |||||||||||||||||||||||
Net loss | — | — | — | — | (9,615 | ) | (9,615 | ) | |||||||||||||||
Unrealized gains on available-for-sale investments, net of taxes | — | — | — | 1,861 | — | 1,861 | |||||||||||||||||
Foreign currency translation adjustment, net of taxes | — | — | — | 1,954 | — | 1,954 | |||||||||||||||||
Total comprehensive loss, net of taxes | (5,800 | ) | |||||||||||||||||||||
Sale of common stock under employee stock purchase and option plans | 1,035 | 3 | 3,176 | — | — | 3,179 | |||||||||||||||||
Net issuance of restricted shares | 1,187 | — | — | — | — | — | |||||||||||||||||
Net settlement of restricted shares | (158 | ) | (1 | ) | (751 | ) | — | — | (752 | ) | |||||||||||||
Stock-based compensation | — | — | 6,628 | — | — | 6,628 | |||||||||||||||||
Balance, March 31, 2008 | 120,920 | 121 | 199,289 | 6,993 | 217,693 | 424,096 | |||||||||||||||||
Components of comprehensive loss: | |||||||||||||||||||||||
Net loss | — | — | — | — | (10,190 | ) | (10,190 | ) | |||||||||||||||
Unrealized losses on available-for-sale investments, net of taxes | — | — | — | (600 | ) | — | (600 | ) | |||||||||||||||
Foreign currency translation adjustment, net of taxes | — | — | — | (3,429 | ) | — | (3,429 | ) | |||||||||||||||
Total comprehensive loss, net of taxes | (14,219 | ) | |||||||||||||||||||||
Sale of common stock under employee option plans | 499 | 1 | 1,675 | — | — | 1,676 | |||||||||||||||||
Net issuance of restricted shares | 671 | — | — | — | — | — | |||||||||||||||||
Net settlement of restricted shares | (346 | ) | (1 | ) | (1,659 | ) | — | — | (1,660 | ) | |||||||||||||
Stock-based compensation | — | — | 3,388 | — | — | 3,388 | |||||||||||||||||
Repurchase of common stock | (1,033 | ) | (1 | ) | (2,400 | ) | — | — | (2,401 | ) | |||||||||||||
Balance, March 31, 2009 | 120,711 | 120 | 200,293 | 2,964 | 207,503 | 410,880 | |||||||||||||||||
Components of comprehensive loss: | |||||||||||||||||||||||
Net loss | — | — | — | — | (17,434 | ) | (17,434 | ) | |||||||||||||||
Unrealized gains on available-for-sale investments, net of taxes | — | — | — | 110 | — | 110 | |||||||||||||||||
Foreign currency translation adjustment, net of taxes | — | — | — | 1,212 | — | 1,212 | |||||||||||||||||
Total comprehensive loss, net of taxes | (16,112 | ) | |||||||||||||||||||||
Sale of common stock under employee option plans | 182 | 1 | 447 | — | — | 448 | |||||||||||||||||
Net issuance of restricted shares | 620 | — | — | — | — | — | |||||||||||||||||
Net settlement of restricted shares | (406 | ) | (1 | ) | (1,572 | ) | — | — | (1,573 | ) | |||||||||||||
Stock-based compensation | — | — | 5,816 | — | — | 5,816 | |||||||||||||||||
Repurchase of common stock | (706 | ) | (1 | ) | (1,755 | ) | — | — | (1,756 | ) | |||||||||||||
Balance, March 31, 2010 | 120,401 | $ | 119 | $ | 203,229 | $ | 4,286 | $ | 190,069 | $ | 397,703 | ||||||||||||
See accompanying Notes to the Consolidated Financial Statements.
F-5
ADAPTEC, INC.CONSOLIDATED BALANCE SHEETS
March 31, ------------------------ 2008 2007 ----------- ----------- (in thousands, except per share amounts) AssetsCurrent assets: Cash and cash equivalents $ 239,911 $ 95,922 Marketable securities 386,305 476,501 Restricted marketable securities 1,670 1,660 Accounts receivable, net of allowance for doubtful accounts of $258 in 2008 and $519 in 2007 23,204 34,127 Inventories 9,926 28,717 Prepaid expenses 1,344 1,403 Other current assets 19,063 30,429 Assets held for sale -- 12,509 ----------- ----------- Total current assets 681,423 681,268 Property and equipment, net 13,284 15,852 Restricted marketable securities, less current portion -- 1,584 Other intangible assets, net -- 7,011 Other long-term assets 5,380 9,687 ----------- ----------- Total assets $ 700,087 $ 715,402 =========== ===========Liabilities and Stockholders' EquityCurrent liabilities: Accounts payable $ 12,311 $ 28,101 Accrued and other liabilities 19,128 37,134 3/4% Convertible Senior Subordinated Notes ("3/4% Notes") 225,321 -- ----------- ----------- Total current liabilities 256,760 65,235 3/4% Notes, less current portion -- 225,000 Other long-term liabilities 9,335 3,009 Deferred income taxes 9,896 -- ----------- ----------- Total liabilities 275,991 293,244 ----------- ----------- Commitments and contingencies (Note 9) Stockholders' equity: Preferred stock; $0.001 par value Authorized shares, 1,000; Series A shares, 250 designated; outstanding shares, none -- -- Common stock; $0.001 par value Authorized shares, 400,000; outstanding shares, 120,920 as of March 31, 2008 and 118,856 as of March 31, 2007 121 119 Additional paid-in capital 199,289 190,236 Accumulated other comprehensive income, net of taxes 6,993 3,178 Retained earnings 217,693 228,625 ----------- ----------- Total stockholders' equity 424,096 422,158 ----------- ----------- Total liabilities and stockholders' equity $ 700,087 $ 715,402 =========== ===========
See accompanying Notes to the Consolidated Financial Statements.
ADAPTEC, INC.CONSOLIDATED STATEMENTS OF CASH FLOWS
Years Ended March 31, ------------------------------- 2008 2007 2006 --------- --------- --------- (in thousands) Cash Flows From Operating Activities:Net income (loss) $ (9,615) $ 30,843 $(148,432) Less: Income (loss) from discontinued operations, net of taxes 479 5,997 (12,600) --------- --------- --------- Income (loss) from continuing operations, net of taxes (10,094) 24,846 (135,832) Adjustments to reconcile income (loss) from continuing operations, net of taxes, to net cash provided by (used for) operating activities: Stock-based compensation 6,628 8,473 1,653 Inventory-related charges 6,916 12,942 10,671 Depreciation and amortization 8,254 17,326 25,887 Impairment of goodwill and intangible assets 2,545 13,203 100,626 Loss (gain) on sale of long-lived assets (6,215) -- 1,579 Non-cash effect of tax settlement -- (60,221) -- Loss on extinguishment of debt -- -- 80 Other non-cash items 115 1,688 1,267 Changes in assets and liabilities: Accounts receivable 10,920 12,745 22,289 Inventories 10,104 (8,622) 8,003 Prepaid expenses and other current assets 6,515 18,794 (5,354) Other assets 2,497 (12,038) (419) Accounts payable (15,878) (11,442) (21,366) Other liabilities (4,259) (10,125) (22,245) --------- --------- --------- Net Cash Provided by (Used in) Operating Activities of Continuing Operations 18,048 7,569 (13,161) Net Cash Provided by Operating Activities of Discontinued Operations 4,746 7,239 6,051 --------- --------- --------- Net Cash Provided by (Used in) Operating Activities 22,794 14,808 (7,110) --------- --------- ---------Cash Flows From Investing Activities:Proceeds from the sale of the IBM i/p and systems business -- -- 33,630 Proceeds from the sale of the Singapore manufacturing assets -- -- 25,986 Proceeds from sale of long-lived assets 19,881 -- 2,684 Purchases of property and equipment (1,578) (3,733) (7,058) Purchases of marketable securities (181,295) (301,524) (596,866) Sales of marketable securities 175,603 209,116 217,186 Maturities of marketable securities 100,777 46,846 37,090 Maturities of restricted marketable securities 1,688 1,688 1,688 Payment of holdbacks in connection with acquisitions of Platys and Eurologic -- (1,507) -- --------- --------- --------- Net Cash Provided by (Used in) Investing Activities of Continuing Operations 115,076 (49,114) (285,660) Net Cash Used in Investing Activities of Discontinued Operations -- -- (1,655) --------- --------- --------- Net Cash Provided by (Used in) Investing Activities 115,076 (49,114) (287,315) --------- --------- ---------Cash Flows From Financing Activities:Repurchases and redemption on long-term debt -- (10,637) (24,309) Proceeds from the issuance of common stock 3,179 7,438 9,388 --------- --------- --------- Net Cash Provided by (Used in) Financing Activities 3,179 (3,199) (14,921) --------- --------- --------- Effect of Foreign Currency Translation on Cash and Cash Equivalents 2,940 2,054 (869) --------- --------- --------- Net Increase (Decrease) in Cash and Cash Equivalents 143,989 (35,451) (310,215) Cash and Cash Equivalents at Beginning of Year 95,922 131,373 441,588 --------- --------- --------- Cash and Cash Equivalents at End of Year $ 239,911 $ 95,922 $ 131,373 ========= ========= =========
See accompanying Notes to the Consolidated Financial Statements.
ADAPTEC, INC.CONSOLIDATED STATEMENTS OF STOCKHOLDERS' EQUITY
Additional Common Stock Additional Deferred Other -------------------- Paid-in Stock-based Comprehensive Retained Shares Amount Capital Compensation Income (Loss) Earnings Total --------- --------- --------- ------------ ------------ --------- --------- (in thousands)Balance, March 31, 2005 112,339 $ 112 $ 165,707 $ (2,416) $ 706 $ 346,214 $ 510,323 Components of comprehensive loss: Net loss -- -- -- -- -- (148,432) (148,432) Unrealized losses on available-for-sale investments, net of taxes -- -- -- -- (2,687) -- (2,687) Foreign currency translation adjustment, net of taxes -- -- -- -- (800) -- (800) --------- Total comprehensive loss, net of taxes (151,919) Sale of common stock under employee stock purchase and option plans 3,131 3 9,385 -- -- -- 9,388 Amortization of deferred stock-based compensation -- -- -- 1,653 -- -- 1,653 Adjustment of deferred stock-based compensation (3) -- (444) 444 -- -- -- --------- --------- --------- ------------ ------------ --------- --------- Balance, March 31, 2006 115,467 115 174,648 (319) (2,781) 197,782 369,445 Components of comprehensive income: Net income -- -- -- -- -- 30,843 30,843 Unrealized gains on available-for-sale investments, net of taxes -- -- -- -- 3,792 -- 3,792 Foreign currency translation adjustment, net of taxes -- -- -- -- 2,167 -- 2,167 --------- Total comprehensive income, net of taxes 36,802 Sale of common stock under employee stock purchase and option plans 2,334 4 7,434 -- -- -- 7,438 Net issuance of restricted shares 1,055 -- 843 -- -- -- 843 Adjustment to stock-based compensation -- -- (319) 319 -- -- -- Stock-based compensation -- -- 7,630 -- -- -- 7,630 --------- --------- --------- ------------ ------------ --------- --------- Balance, March 31, 2007 118,856 119 190,236 -- 3,178 228,625 422,158 Cumulative effect adjustment, net of taxes related to the adoption of FIN 48 -- -- -- -- -- (1,317) (1,317) --------- --------- --------- ------------ ------------ --------- --------- Adjusted balance 118,856 119 190,236 -- 3,178 227,308 420,841 Components of comprehensive loss: Net loss -- -- -- -- -- (9,615) (9,615) Unrealized gains on available-for-sale investments, net of taxes -- -- -- -- 1,861 -- 1,861 Foreign currency translation adjustment, net of taxes -- -- -- -- 1,954 -- 1,954 --------- Total comprehensive loss, net of taxes (5,800) Sale of common stock under employee stock purchase and option plans 1,035 3 3,176 -- -- -- 3,179 Net issuance of restricted shares 1,187 -- -- -- -- -- -- Net settlement of restricted shares (158) (1) (751) -- -- -- (752) Stock-based compensation -- -- 6,628 -- -- -- 6,628 --------- --------- --------- ------------ ------------ --------- --------- Balance, March 31, 2008 120,920 $ 121 $ 199,289 $ -- $ 6,993 $ 217,693 $ 424,096 ========= ========= ========= ============ ============ ========= =========
See accompanying Notes to the Consolidated Financial Statements.
ADAPTEC, INC.
NOTES TO CONSOLIDATED FINANCIAL STATEMENTS
Note 1. Organization and Summary of Significant Accounting Policies
Subsequent Events
In December 2009, Adaptec, Inc. (“Adaptec” or the “Company”) announced the retention of Blackstone Advisory Partners L.P. to serve as its exclusive financial advisor relating to a potential sale or disposition of certain of its assets or business operations. On May 8, 2010, subsequent to the Company’s fiscal year-end, Adaptec entered into an Asset Purchase Agreement with PMC-Sierra, Inc., (“PMC-Sierra”) for the sale of certain assets and for PMC-Sierra to assume certain liabilities related to its business of providing data storage hardware and software solutions and products including ASICs, HBAs, RAID controllers, Adaptec RAID software, Adaptec RAID code (“ARC”), storage management software including Adaptec Storage Manager (“ASM”), option ROM BIOS, command line interface (“CLI”), storage virtualization software, and other solutions that span SCSI, SAS, and SATA interface technologies, and that optimize the performance of both hard disk and solid state drives (the “PMC Transaction”), for a purchase price of approximately $34 million. The Company anticipates that the PMC Transaction will be consummated in June 2010 and that its results of operations and financial condition may be impacted by this transaction.
Assuming the PMC Transaction is consummated, the Company intends to explore all strategic alternatives to maximize stockholder value going forward, including deploying the proceeds of the PMC Transaction and the Company’s other assets in seeking business acquisition opportunities and other actions to redeploy its capital. Additionally, the Company will, as previously announced, continue to consider its options related to those products and technology (the “Aristos products”) obtained from its acquisition of Aristos Logic Corporation (“Aristos”), as well as its other remaining operating assets, including non-core patents and real estate holdings. With respect to the Aristos products, options that the Company may consider include (i) ceasing to invest additional funds in the Aristos products, winding-down the sale of Aristos products and fulfilling its remaining contractual obligations with the Company’s existing customers, which the Company would expect to be completed in six months, or by September 2010, or (ii) seeking to sell the assets related to Aristos products to a third party. The Company will also explore alternatives for maximizing the value of its non-core patent portfolio and remaining real estate assets. Going forward Adaptec’s business is expected to consist of capital redeployment and identification of new, profitable business operations in which the Company can utilize its existing working capital and maximize the use of its net operating losses (“NOLs”).
If the Company consummates the PMC Transaction discussed above, Adaptec may incur significant charges in the future, which charges include, but are not limited to, increased amortization or depreciation of its long-lived assets due to potential changes to the expected remaining useful lives, a potential impairment of its long-lived assets, restructuring charges, acceleration of compensation expense related to unvested stock-based awards, potential cash bonus payments and potential accelerated payments of certain of its contractual obligations, which may impact the Company’s results of operations and financial condition. The aggregate of these amounts cannot be quantified at this time. Further subsequent event disclosures related to expected changes to the remaining useful lives of our long-lived assets, stock-based activity and associated compensation expense, and restructuring charges are discussed in Note 7, 9 and 11, respectively, to the Consolidated Financial Statements.
Except where noted, the discussions regarding the Company’s business in these Notes to the Consolidated Financial Statements is as of March 31, 2010 and does not take into account the PMC Transaction, which, as of the date of the Consolidated Financial Statements and related Notes, has not been consummated and which may not be consummated.
Description
Adaptec Inc. ("Adaptec" or the "Company")currently provides innovative data center I/O solutions that protect, accelerate, optimize, and condition data in today’s most demanding data center environments. The Company’s products are used in IT environments ranging from traditional enterprise environments to fast growing, on-demand cloud computing data
ADAPTEC, INC.
NOTES TO CONSOLIDATED FINANCIAL STATEMENTS (Continued)
(Unaudited)
Note 1. Organization and Summary of Significant Accounting Policies (Continued)
centers. The Company’s products enable data center managers, channel partners and OEMs to deploy best-in-class storage solutions that reliably move, manage, storeto meet their customers’ evolving IT and protect critical data and digital content.business requirements. The Company delivers software and hardware components that provide reliable storage connectivity and advanced data protection to leading OEMs and through distribution channel partners. The Company'sCompany’s software and hardware products range frominclude ASICs, HBAs, RAID controllers, hostAdaptec RAID software, Adaptec RAID Codestorage management software, Advanced Data Protection software, Storage Management software, Snapshotstorage virtualization software and other solutions that span SCSI, SAS, SATA and iSCSI interface technologies. The Company's Snap Servers offer NAS solutions fortechnologies, including both fixed capacityhard disk and modular expandability.solid state drives. System integrators and white box suppliers build server and storage solutions based on Adaptec technology in order to deliver products with superior price and performance, data protection and interoperability.interoperability to their clients and customers.
Basis of Presentation
The Company's consolidated financial statementsCompany’s Consolidated Financial Statements include the accounts of Adaptec and its subsidiaries. All significant intercompany accounts and transactions have been eliminated in consolidation. Key acronyms used in the Company'sCompany’s industry and accounting rules and regulationsacronyms, including regulatory bodies, referred to within the Notes to the Consolidated Financial Statements are listed in alphabetical order in Note 2122 to the Consolidated Financial Statements.
Use of Estimates and Reclassifications
In accordance with accounting principles generally accepted in the United States of America, management utilizes certain estimates and assumptions that affect the reported amounts of assets and liabilities at the date of the financial statements and the reported amounts of revenues and expenses during the reporting period. Management bases its estimates on historical experience and regularly evaluates estimates and assumptions related to revenue recognition, allowances for doubtful accounts, sales returns and allowances, warranty reserves, inventory reserves, stock-based compensation expense, goodwill and purchased intangible asset valuations, review of long-lived assets for impairments, strategic investments, deferred income tax asset valuation allowances, uncertain tax positions, tax contingencies, self-insurance, restructuring costs, litigation and other loss contingencies. The actual results the Company experiences may differ materially and adversely from its original estimates.
Certain reclassifications have been made to prior period reported amounts to conform to the current year presentation, relatingrelated to the reclassification of discontinued operations as discussed further in Note 2Notes 3, 4, 5 and 19 to the Consolidated Financial Statements. These reclassifications had no impact on net loss, total assets or total stockholders’ equity. Unless otherwise indicated, the Notes to the Consolidated Financial Statements relate to the discussion of the Company'sCompany’s continuing operations.operations as of March 31, 2010.
Foreign Currency Translation
For foreign subsidiaries whose functional currency is the local currency, the Company translates assets and liabilities to United States dollarsDollars using period-end exchange rates, and translates revenues and expenses using average monthly exchange rates. The resulting cumulative translation adjustments are included in "Accumulated“Accumulated other comprehensive income, net of taxes,"” a separate component of stockholders'stockholders’ equity in the Consolidated Balance Sheets.
For foreign subsidiaries whose functional currency is the United States dollar,Dollar, certain assets and liabilities are remeasured at the period-end or historical rates are used as appropriate. Revenues and expenses are remeasured at the average monthly exchange rates. Currency transaction gains and losses are recognized in current operations and have not been material to the Company'sCompany’s operating results for the periods presented.
Derivative Financial Instruments
The Company did not enter into forward exchange or other derivative foreign currency contracts during the fiscal years ended March 31, 2008, 2007F-7
ADAPTEC, INC.
NOTES TO CONSOLIDATED FINANCIAL STATEMENTS (Continued)
(Unaudited)
Note 1. Organization and 2006. The Company does not hold or issue foreignexchange contracts for trading or speculative purposes. In connection with the issuanceSummary of its 3/4% Notes due 2023, the Company entered into a derivative financial instrument to repurchase its common stock, at the Company's option, at specified prices in the future to mitigate potential dilution as a result of the conversion of the 3/4% Notes (see Note 7 to the Consolidated Financial Statements).Significant Accounting Policies (Continued)
Fair Value of Financial Instruments
For certain of the Company'sCompany’s financial instruments, including cash and cash equivalents, accounts receivable, accounts payable and other current liabilities, the carrying amounts approximate their fair value due to the relatively short maturity of these items. Investments in available-for-sale securities are carried at fair value based on quoted market prices or estimated based on quoted market prices for financial instruments with similar characteristics.
The related cost basis and the estimated fair value for the Company'sCompany’s 3/4% Convertible Senior Notes due December 22, 2023 (the “3/4% Notes”) at March 31, 2010 and 2009 was $0.3 million and $0.5 million, respectively. Although the remaining balance of its 3/4% Notes is relatively small and the market trading is very limited, the Company expects the cost basis of $0.3 million and $0.5 million at March 31, 2008 was $225.0 million2010 and $216.0 million, respectively. The related cost basis and the estimated fair value2009, respectively, for the Company's 3/4% Notes at March 31, 2007 was $225.0 million, and $204.8 million, respectively.to approximate fair value. The Company'sCompany’s convertible debt is recorded at theits carrying values,value, not the estimated fair values.value.
Cash Equivalents and Marketable Securities
Cash equivalents consist of highly liquid investments with remaining maturities of three months or less atfrom the date of purchase. Marketable securities consist of corporate obligations, commercial paper, municipal bonds, United States government securities, government agencies, and other debt securities municipal bondsrelated to mortgage-back and United States governmentasset-backed securities with remaining maturities beyond three months.months from the date of purchase. The Company'sCompany classifies its marketable securities as short-term, even though certain securities mature beyond one year, as the Company has the ability to liquidate these securities at any time. The Company’s policy is to protect the value of its investment portfolio and minimize principal risk by earning returns based on current interest rates.
Marketable securities, including equity securities, are classified as available-for-sale and are reported at fair market value and unrealized gains and losses, net of income taxes are included in "Accumulated“Accumulated other comprehensive income, net of taxes"taxes” as a separate component of stockholders'stockholders’ equity in the Consolidated Balance Sheets. The marketable securities are adjusted for amortization of premiums and discounts and such amortization is included in "Interest“Interest and other income"income, net” in the Consolidated Statements of Operations. When the fair value of an investment declines below its original cost, the Company considers all available evidence to evaluate whether the decline in value is other-than-temporary. Among other things, the Company considers the duration and extent to which the market value has declined relative to its cost basis and economic factors influencing the markets. Unrealized losses considered other-than-temporary are charged to "Interest“Interest and other income"income, net” in the Consolidated Statements of Operations in the period in which the determination is made. Gains and losses on securities sold are determined based on the average cost method and are included in "Interest“Interest and other income"income, net” in the Consolidated Statements of Operations. The Company does not hold its securities for trading or speculative purposes.
Restricted marketable securities consist of United States government securities that are required as security under the indenture related to the 3/4% Notes (see Note 7 to the Consolidated Financial Statements for further discussion).
Concentration of Risk
Financial instruments that potentially subject the Company to significant concentrations of credit risk consist principally of cash, cash equivalents, marketable securities and trade accounts receivable. The Company invests in high-credit quality investments, maintained with major financial institutions. The Company, by policy, limits the amount of credit exposure through diversification, and management regularly monitors the composition of its investment portfolio for compliance with the Company'sCompany’s investment policies.
The Company sells its products to OEMs, distributors and retailers throughout the world. Sales to customers are predominantly denominated in United States dollarsDollars and, as a result, the Company believes its foreign
ADAPTEC, INC.
NOTES TO CONSOLIDATED FINANCIAL STATEMENTS (Continued)
(Unaudited)
Note 1. Organization and Summary of Significant Accounting Policies (Continued)
currency risk relating to sales is minimal. The Company performs ongoing credit evaluations of its customers'customers’ financial condition and generally does not require collateral from its customers. The Company maintains an allowance for doubtful accounts based upon the expected collectibility of all accounts receivable.
Three customers accounted for 17%32%, 16%15% and 13% of gross accounts receivable at March 31, 2010. Three customers accounted for 40%, 19% and 16% of gross accounts receivable at March 31, 2008. Four customers accounted for 23%, 22%, 11% and 11% of gross accounts receivable at March 31, 2007.2009. In fiscal 2008,2010, IBM, Bell Microproducts and Ingram Micro accounted for 34%17%, 16% and 11%15% of the Company'sCompany’s total net revenues, respectively. In fiscal 2007,2009, IBM and Dell accounted for 34% and 13%36% of the Company’s total net revenues, respectively.revenues. In fiscal 2006,2008, IBM and Dell accounted for 28% and 15%40% of the Company’s total net revenues, respectively.revenues.
The Company currently purchases the majority of its finished products from Sanmina-SCI Corporation (“Sanmina-SCI”), and if Sanmina-SCI fails to meet the Company'sCompany’s manufacturing needs, it wouldmay be required to delay product shipments to the Company'sCompany’s customers. The Company'sIn February 2009, the Company entered into a new manufacturing agreement with Sanmina-SCI is scheduled to expirethat expires in the thirdfourth quarter of fiscal 2009.2012. This three-year strategic manufacturing agreement with Sanmina-SCI will be transferred to PMC-Sierra if the PMC Transaction is consummated.
The industry in which the Company currently operates is characterized by rapid technological change, competitive pricing pressures and cyclical market patterns. The Company'sCompany’s financial results are affected by a wide variety of factors, including general economic conditions worldwide, economic conditions specific to its industry, the timely implementation of new manufacturing technologies and the ability to safeguard patents and intellectual property in a rapidly evolving market. In addition, the market for its products has historically been cyclical and subject to significant economic downturns at various times. As a result, the Company may experience significant period-to-period fluctuations in future operating results due to the factors mentioned above or other factors. The Company believes that its existing sources of liquidity, including its cash, cash equivalents and marketable securities, will be adequate to support its operating and capital investment activities for the next twelve months.
Inventories
Inventories are stated at the lower of cost or market, with cost determined on a first-in, first-out basis. The Company writes down inventories based on estimated excess and obsolete inventories, determined primarily by future demand forecasts. At the point of loss recognition, a new, lower cost basis for that inventory is established, and subsequent changes in facts and circumstances do not result in the restoration or increase in that newly established cost basis.
Goodwill
Goodwill represented the excess of the purchase price paid over the fair value of tangible and identifiable intangible net assets acquired in business combinations. Goodwill was not amortized, but instead was reviewed annually, in the Company’s fourth quarter of each year, and whenever events or changes in circumstances occurred which indicated that goodwill might be impaired. Impairment of goodwill was tested at the Company level, as the Company contained only one reporting unit, and compared the net book value, including goodwill, to the fair value. To determine fair value, the Company’s review process used the income approach and the market approach. The Company also considered its market capitalization on the dates of its impairment tests in determining the fair value of the Company. If the net book value of the Company exceeds its implied fair value, goodwill is considered impaired and a second step is performed to measure the amount of impairment loss, if any. For details regarding goodwill and associated impairment charges taken in fiscal 2009 refer to Note 7 to the Consolidated Financial Statements.
F-9
ADAPTEC, INC.
NOTES TO CONSOLIDATED FINANCIAL STATEMENTS (Continued)
(Unaudited)
Note 1. Organization and Summary of Significant Accounting Policies (Continued)
Intangible Assets, Net
Intangible assets, net, consist of acquisition-related intangible assets, software license agreement, intellectual property and warrants and are carried at cost less accumulated amortization. Intangible assets, net, are amortized over their estimated useful lives ranging from three months to five years, reflecting the pattern in which the economic benefits of the assets are expected to be realized. For details regarding intangible assets, net, refer to Note 7 to the Consolidated Financial Statements.
Property and Equipment, Net
Property and equipment, net, are stated at cost and depreciated or amortized using the straight-line method over the estimated useful lives of the assets. The Company capitalizes substantially all costs related to the purchase and implementation of software projects used for internal business operations. Capitalizedinternal- useCapitalized internal-use software costs primarily include license fees, consulting fees and any associated direct labor costs and are amortized over the estimated useful life of the asset, typically a three- to five-year period.
Goodwill and Other Intangible Assets, Net
Goodwill represents the excess of the purchase price paid over the fair value of tangible and identifiable intangible net assets acquired in business combinations. Goodwill is reviewed annually and whenever events or circumstances occur which indicate that goodwill might be impaired. Other intangible assets, net, consist of acquisition-related intangible assets, intellectual property and warrants. Other intangible assets, net, are carried at cost less accumulated amortization. Other intangible assets, net, are amortized over their estimated useful lives ranging from three months to seven years, reflecting the pattern in which the economic benefits of the assets are expected to be realized.
Goodwill is not amortized, but instead is reviewed annually and whenever events or circumstances occur which indicate that goodwill might be impaired. Impairment of goodwill is tested at the Company's reporting unit level, which is at the Company's operating segment level, by comparing each segment's carrying amount, including goodwill, to the fair value of that segment. To determine fair value, the Company's review process uses the income, or discounted cash flows, approach and the market approach. If the carrying amount of the segment exceeds its implied fair value, goodwill is considered impaired and a second step is performed to measure the amount of impairment loss, if any.
Impairment of Long-Lived Assets
In accordance with SFAS No. 144, theThe Company regularly performs reviews to determine if facts or circumstances are present, either internal or external, which would indicate if the carrying values of its long-lived assets are impaired. WhenIf a long-lived asset is determined to be impaired, the Company determines thatloss is measured based on the difference between the long-lived asset’s fair value and its carrying value. The recoverability of the carrying value of itsthe long-lived assets, other than goodwill, may not be recoverablewas based uponon the existenceestimated future undiscounted cash flows derived from the use of one or more indicatorsthe asset. The estimate of impairment, the Company measures any impairmentfair value of long-lived assets was based on a discounted estimated future cash flows method and applying a discount rate commensurate with the risks inherent in itsthe Company’s current business model. The impairment of long-lived assets is included in "Other charges (gains)"“Other gains, net” in the Consolidated Statements of Operations. For details regarding long-lived assets’ impairment analysis or charges taken in fiscal 2008, 2007years 2010, 2009 and 20062008 refer to Note 5Notes 7 and 12 to the Consolidated Financial Statements.
Stock-Based Compensation
The Company has employee and director stock compensation plans which are more fully described in Note 89 to the Consolidated Financial Statements. Beginning in fiscal 2007, the Company accounts for stock-based compensation in accordance with SFAS No. 123(R) using the modified prospective transition method. Under SFAS No. 123(R), theThe Company measures and recognizes stock-based compensation expense for all stock-based awards made to its employees and directors, including employee stock options, employee stock purchase plans, and other stock-based awards, based on estimated fair values.values using a straight-line amortization method over the respective requisite service period of the awards and adjusts it for estimated forfeitures. In addition, the Company also adoptedapplies the alternative transition method provided in FSP FAS No. 123(R)-3 for calculating the effects of share-based compensation pursuant to SFAS No. 123(R), which included a simplified method to establish the beginning balance of the additional paid in capital pool related to the tax effects of employee stock-based compensation, which is available to absorb tax deficiencies recognized subsequentshortfalls. Tax shortfalls arise when actual tax benefits realized upon the exercise of stock options are less than the tax benefit recorded in the financial statements. Disclosure provisions related to the adoption of SFAS No. 123(R). Prior to fiscal 2007, the Company accounted forequity instruments, including stock-based compensation in accordance with APB Opinion No. 25 as interpreted by FIN 44, and complied with the disclosure provisions of SFAS No. 148, an amendment of SFAS No. 123. Under APB Opinion No. 25, compensation expense, was recognized on the measurement date based on the excess, if any, of the fair value of the Company's common stock over the amount an employee must pay to acquire the common stock. In addition, the Company also accounted for equity instruments issued to non-employees in accordance with the provisions of SFAS No. 123 and EITF No. 96-18, which required that such equity instruments be recorded at their fair value on the measurement date, which is typically the date of grant. Disclosures related to the Company's adoption of SFAS No. 123(R) and disclosure provision of SFAS No. 148 are discussed further in Note 89 to the Consolidated Financial Statements.
Revenue Recognition
The Company considers many different criteria for evaluating revenue recognition on sales transactions, including guidance and related interpretations from SAB No. 104, EITF No. 00- 21, SOP No. 97-2, and SFAS No 48, as well as other related accounting literature.transactions. The application of the appropriate accounting principle to the Company'sCompany’s revenue is dependent upon specific transactions or combination of transactions. As described below, significant management judgments and estimates must be made and used in connection with the revenue recognized in any accounting period. Material differences may result in the amount and timing of revenue for any period if management had made different judgments or utilized different estimates.
ADAPTEC, INC.
NOTES TO CONSOLIDATED FINANCIAL STATEMENTS (Continued)
(Unaudited)
Note 1. Organization and Summary of Significant Accounting Policies (Continued)
The Company recognizes revenue from its product sales, including sales to OEMs, distributors and retailers, when persuasive evidence of an arrangement exists, delivery has occurred or services have been rendered, the price is fixed or determinable and collectibility is reasonably assured. These criteria are usually met upon shipment from the Company, provided that the risk of loss has transferred to the customer, customer acceptance has been obtained or acceptance provisions have lapsed, or the Company has established a historical pattern that acceptance by the customer has been fulfilled. The Company'sCompany’s sales are based on customer purchase orders, and to a lesser extent, contractual agreements, which providesprovide that evidence of an arrangement exists.
The Company'sCompany’s distributor arrangements provide distributors with certain product rotation rights. Additionally, the Company permits distributors to return products subject to certain conditions. The Company establishes allowances for expected product returns in accordance with SFAS No. 48.returns. The Company also establishes allowances for rebate payments under certain marketing programs entered into with distributors. These allowances comprise the Company'sCompany’s revenue reserves and are recorded as direct reductions of revenue and accounts receivable. The Company makes estimates of future returns and rebates based primarily on its past experience as well as the volume of products in the distributor channel, trends in distributor inventory, economic trends that might impact customer demand for its products (including the competitive environment), the economic value of the rebates being offered and other factors. In the past, actual returns and rebates have not been significantly different from the Company'sCompany’s estimates. However, actual returns and rebates in any future period could differ from the Company'sCompany’s estimates, which could impact the net revenue it reports.
For products which contain software, where software is essential to the functionality of the product, or software product sales, the Company recognizes revenue when passage of title and risk of ownership is transferred to customers, persuasive evidence of an arrangement exists, which is typically upon sale of product by the customer, the price is fixed or determinable and collectibility is probable, in accordance with SOP No. 97-2, as amended and modified by SOP 98-9.probable. For software sales that are considered multiple element transactions, the entirefeeentire fee from the arrangement is allocated to each respective element based on its vendor specific fair value or upon the residual method and recognized when revenue recognition criteria for each element are met. Vendor specific fair value for each element is established based on the sales price charged when the same element is sold separately or based upon a renewal rate.
Software Development Costs
The Company'sCompany’s policy is to capitalize software development costs incurred after technological feasibility has been demonstrated, which is determined to be the time a working model has been completed. Through March 31, 2008,2010, costs incurred subsequent to the establishment of technological feasibility have not been significant and all software development costs have been charged to "Research“Research and Development"development” in the Consolidated Statements of Operations.
Income Taxes
On April 1, 2007, theThe Company adopted FIN 48, which accounts for income taxes for uncertain tax positions using a two-step process to determine the amount of tax benefit to be recognized. First, the tax position must be evaluated to determine the likelihood that it will be sustained upon external examination. If the tax position is deemed "more-likely-than-not"“more-likely-than-not” to be sustained, the tax position is then assessed to determine the amount of benefit to recognize in the Company'sCompany’s financial statements. The amount of the benefit that may be recognized is the largest amount that has a greater than 50 percent likelihood of being realized upon ultimate settlement. Prior to the adoption of FIN 48, the Company's policy was to classify accruals for uncertain positions as a current liability unless it was highly probable that there would not be a payment or settlement for such identified risks for a period of at least a year. Upon adoption of FIN 48, the Company revised its policy in conformity with the liability classification requirements of FIN 48. At March 31, 2008,2010 and 2009, the Company had recorded $4.4liabilities of $3.7 million in other long-term liabilitiesand $8.2 million, respectively, for uncertain tax positions related to FIN 48 and the Company continues to recognize interest and/or penalties related to uncertain tax positions as income tax expense within “Benefit from (provision for) income taxes” in its Consolidated StatementStatements of Operations. To the extent
F-11
ADAPTEC, INC.
NOTES TO CONSOLIDATED FINANCIAL STATEMENTS (Continued)
(Unaudited)
Note 1. Organization and Summary of Significant Accounting Policies (Continued)
that accrued interest and penalties do not ultimately become payable, amounts accrued will be reduced and reflected as a reduction of the overall income tax provision in the period that such determination is made. The amount of interest and penalties accrued during fiscal years 2010, 2009 and 2008 was immaterial. Due to the complexity and uncertainty associated with the Company'sCompany’s tax contingencies, the Company cannot make a reasonably reliable estimate of the period in which cash settlement will be made for the Company'sCompany’s liabilities associated with uncertain tax positions.
The Company accounts for income taxes using an asset and liability approach, which requires recognition of deferred tax assets and liabilities for the expected future tax consequences of events that have been recognized in the Company's consolidated financial statements,Company’s Consolidated Financial Statements, but have not been reflected in the Company'sCompany’s taxable income. A valuation allowance is established to reduce deferred tax assets to their estimated realizable value. The Company provides a valuation allowance to the extent that the Company does not believe it is more likely than not that it will generate sufficient taxable income in future periods to realize the benefit of its deferred tax assets. Predicting future taxable income is difficult, and requires the use of significant judgment.
Recent Accounting Pronouncements
In February 2006,April 2009, the FASB issued SFAS No. 155, which permits fair value remeasurementamended the requirements for any hybrid financial instrument that contains an embedded derivative that otherwise would require bifurcation. SFAS No. 155 also clarifiesthe recognition and amends certainmeasurement of other-than-temporary impairments for debt securities by modifying the current “intent and ability” indicator and to record impairments related to credit losses in earnings while all other provisions of SFAS No. 133 and SFAS No. 140. SFAS No. 155 is effective for all hybrid financial instruments held, obtained or issued byfactors are to be recognized in other comprehensive income. An other-than-temporary impairment must be recognized if the Company has the intent to sell the debt security or if it is more likely than not that the Company will be required to sell the debt security before its anticipated recovery. An impairment related to credit losses is when there is a difference between the present value of the cash flows expected to be collected and the amortized cost basis for fiscal years beginning with the Company's fiscal 2008.each security. The adoption of SFAS No. 155the accounting standard related to the accounting and reporting requirements for debt and equity securities for the recognition of other-than-temporary impairment, including impairments for credit losses, which was effective for interim and annual periods ending after June 15, 2009, or which began with the Company’s first quarter of fiscal 2010, did not have a materialfinancial impact on the Company's resultsCompany’s Consolidated Financial Statements; however, the disclosure requirements mandated by this accounting standard are discussed further in Note 4 to the Consolidated Financial Statements.
In June 2009, the FASB issued the ASC, which becomes the single source of operationsauthoritative, nongovernmental GAAP, except for rules and interpretive releases of the SEC, which are sources of authoritative GAAP for SEC registrants. All other literature, with the exception of non-grandfathered and non-SEC literature, will be considered non-authoritative. All guidance contained in the Codification carries an equal level of authority. The ASC, which was effective for interim and annual periods ending after September 15, 2009, or financial position.the Company’s second quarter of fiscal 2010, did not have an impact on the Company’s Consolidated Financial Statements as the Codification does not change GAAP, but is intended to make it easier to find and research applicable GAAP guidance to a particular transaction or specific accounting issue.
In September 2006,2009, the FASB issued SFAS No. 157,amended the requirements for revenue recognition, which defines fair value, establishes a frameworkeliminates the use of the residual method and givesincorporates the use of an estimated selling price to allocate arrangement consideration. In addition, the revenue recognition guidance regarding the methods used for measuring fair value, and expands disclosures about fair value measurements. In February 2008, the FASB issued FSP FAS No. 157-1 and FSP FAS No. 157-2. FSP FAS No. 157-1 excludes SFAS No. 13, as well as other accounting pronouncements that address fair value measurements on lease classification or measurement under SFAS No. 13 fromamends the scope of SFAS No. 157. FSP FAS No. 157-2 delaysto exclude tangible products that contain software and non-software components that function together to deliver the effective date of SFAS No. 157 for all nonrecurring fair value measurements of non-financial assets and non-financial liabilities until fiscal years beginning after November 15, 2008. Both FSP FAS No. 157-1 and FSP FAS No. 157-2product’s essential functionality. The amendments to the accounting standards related to revenue recognition are effective upon the Company's initial adoption of SFAS No. 157, which is effective beginning with the Company's fiscal 2009, and interim periods within that fiscal year. The Company is evaluating the financial impact that SFAS No. 157 will have and expects that the financial impact, if any, will not be material on its consolidated financial statements.
In February 2007, the FASB issued SFAS No. 159, which permits companies to choose to measure certain financial instruments and certain other items at fair value that are not currently required to be measured at fair value. The standard requires that unrealized gains and losses on items for which the fair value option has been elected be reported in earnings. SFAS 159 is effective for fiscal years beginning after NovemberJune 15, 2007,2010, which will bebegin with the Company'sCompany’s first quarter of fiscal year 2009.2012, unless adopted early. Upon adoption, the Company may apply the guidance retrospectively or prospectively for new or materially modified arrangements. The Company is currently evaluating the financial impact that SFAS No. 159this accounting standard will have and expects that the financial impact, if any, will not be material on its consolidated financial statements.Consolidated Financial Statements.
ADAPTEC, INC.
NOTES TO CONSOLIDATED FINANCIAL STATEMENTS (Continued)
(Unaudited)
Note 1. Organization and Summary of Significant Accounting Policies (Continued)
In June 2007,January 2010, the FASB ratified EITF No. 07-3, which requires nonrefundable advance research and development payments for goods and services to be deferred and capitalized and subsequently expensed whenamended the research and development activities are performed, subject to an assessment of recoverability. EITF No. 07-3 is effective for new contractual arrangements entered into beginning with the Company's fiscal 2009, and interim periods within that fiscal year. The Company does not believe EITF No. 07-3 will have a material effect on its results of operations and financial position.
In December 2007, the FASB ratified EITF No. 07-1, which defines collaborative arrangements and establishes reporting and disclosure requirements for transactionsthe fair value measurements for recurring and nonrecurring non-financial assets and liabilities. The guidance provides that an entity shall disclose any significant transfers of assets and liabilities between participantsthose that are actively traded in a collaborative arrangementmarkets (level 1) and between participants inthose that are not actively traded but have observable inputs (level 2), and the arrangementreasons for the transfers. The disclosure requirements regarding the transfers of assets and third parties. EITF No. 07-1 isliabilities, which was effective for interim or fiscal periods beginning after December 15, 2009, or which began with the Company'sCompany’s fourth quarter of fiscal 2009. The Company expects that the2010, did not have a financial impact if any, of the adoption of EITF No. 07-1 will not be material on its consolidated financial statements.
In December 2007, the FASB issued SFAS No. 141(R), which establishes the principles and requirements for how an acquirer in a business combination (1) recognizes and measures in its financial statements the identifiable assets acquired, the liabilities assumed and any non-controlling interest in the acquiree, (2) recognizes and measures the goodwill acquired in the business combination or a gain from a bargain purchase and (3) determines what information to disclose to enable users of the financial statements to evaluate the nature and financial effects of the business combination. SFAS No. 141(R) is effective beginning with the Company's fiscal 2010. The impact of the adoption of SFAS No. 141(R) on the Company's results of operations and financial position will depend onCompany’s Consolidated Financial Statements; however, the nature and extent of business combinations that it completes, if any,disclosure requirements mandated by this accounting standard are discussed further in or after fiscal 2010.
In December 2007, the SEC issued SAB 110 to amend the SEC's views discussed in SAB 107 regarding the use of the "simplified" method in developing an estimate of expected term of "plain vanilla" share options in accordance with SFAS No. 123(R). SAB 110 allows a company, under certain circumstances, to continue to use the "simplified" method beyond December 31, 2007. SAB 110 is effective beginning with the Company's fiscal 2009. As discussed in Note 8Notes 5 to the Consolidated Financial Statements,Statements. The guidance also provides that disclosures for assets and liabilities with significant unobservable inputs (level 3) should separately disclose the Company has utilized the weighted average for estimating the expected term of its stock option grants.
In December 2007, the FASB issued SFAS No. 160, "Non-controlling Interests in Consolidated Financial Statements, an Amendment of ARB No. 51." SFAS No. 160 changes the accountingpurchases, sales, issuances and reporting for minority interests such that minority interests will be recharacterized as non-controlling interests and will be required to be reported as a component of equity, and requires that purchases or sales of equity interests that do not resultsettlements in a change in control be accounted forrollforward as equity transactionsopposed to aggregating it as one. The disclosure requirements regarding further details surrounding assets and upon a loss of control, requires the interest sold, as well as any interest retained, to be recorded at fair value with any gain or loss recognized in earnings. SFAS No. 160 isliabilities utilizing level 3 are effective for fiscal years beginning after December 15, 2008,2010, which will bebegin with the Company'sCompany’s first quarter of fiscal year 2009.2012. The Company is evaluatingdoes not anticipate that the financial impact that SFAS No. 160additional disclosure requirements will have a material impact on its Consolidated Financial Statements.
Note 2. Acquisitions
On September 3, 2008, the Company completed the acquisition of Aristos, a provider of RAID technology to the data storage industry, pursuant to an Agreement and expectsPlan of Merger dated as of August 27, 2008 (the “Merger Agreement”) by and among Adaptec, Aristos, Ariel Acquisition Corp., a wholly owned subsidiary of Adaptec, and TPG Ventures, L.P., solely in its capacity as the representative of stockholders of Aristos. The Merger Agreement provided for the Company’s acquisition of Aristos through a merger in which Aristos became a wholly-owned subsidiary of the Company. The acquisition of Aristos was to allow the Company to expand into adjacent RAID markets that the financial impact, ifCompany believed would provide it with growth opportunities, including blade servers, enterprise-class external storage systems and performance desktops, and would provide the Company with a strong ASIC roadmap. In addition, this acquisition enabled the Company to pursue new OEM opportunities and expand its channel product offerings containing unified serial technologies.
The Company acquired Aristos for a purchase price of approximately $38.9 million, which consisted of: (i) approximately $28.7 million that was paid to certain Aristos senior preferred stockholders and warrant holders; (ii) approximately $3.2 million under a management liquidation pool established by Aristos prior to completion of the merger, which was immediately paid upon closing of the transaction; (iii) approximately $6.2 million to retire and satisfy certain commercial obligations and payables of Aristos; and (iv) $0.8 million accrued in direct transaction fees, including legal, valuation and accounting fees. A summary of the purchase cost was as follows (in thousands):
Cash paid to certain Aristos senior preferred stockholders and warrant holders, including escrow amount | $ | 28,727 | |
Cash paid under management liquidation pool | 3,221 | ||
Cash paid to retire and satisfy certain commercial obligations and payables of Aristos | 6,162 | ||
Direct acquisition-related transaction costs | 800 | ||
Total purchase price | $ | 38,910 | |
Aristos Holdback: A portion of the Aristos acquisition price totaling $4.3 million was held in an escrow account (“Aristos Holdback”) to secure potential indemnification obligations of Aristos stockholders for unknown liabilities that may have existed as of the acquisition date. The Aristos Holdback was to be paid in two installments to the former Aristos stockholders during the twelfth and eighteenth months after the acquisition
F-13
ADAPTEC, INC.
NOTES TO CONSOLIDATED FINANCIAL STATEMENTS (Continued)
(Unaudited)
Note 2. Acquisitions (Continued)
closing date, except for funds necessary to provide for any willpending claims. The Aristos Holdback of $4.3 million was paid in full in fiscal 2010.
Management Liquidation Pool: As part of the Merger Agreement, the Company agreed to pay certain former employees of Aristos a total of $5.6 million through a management liquidation pool established by Aristos prior to the completion of the merger. Of the $5.6 million, $3.2 million was immediately paid upon closing of the transaction and was included in the purchase price allocation of the cost to acquire Aristos. The remaining $2.4 million was payable over time, not be material on its consolidated financial statements.
In March 2008,to exceed twelve months, contingent upon the FASB issued SFAS No. 161, "Disclosures about Derivative Instrumentscontinued employment of certain employees with the Company, and Hedging Activities." SFAS No. 161 amends and expandswas expensed to the disclosure requirementsConsolidated Statements of SFAS No. 133 for derivative instruments and hedging activities. SFAS No. 161 is effective for the Company'sOperations as earned. In fiscal years beginning after November 15, 2008, with early adoption permitted. 2010 and 2009, the Company recorded expense of $0.1 million and $2.3 million, respectively, in the Consolidated Statements of Operations related to the management liquidation pool.
The CompanyAristos acquisition was accounted for as a business combination and, accordingly, the results of Aristos have been included in the Company’s consolidated results of operations and financial position from the date of acquisition. The allocation of the Aristos purchase price to the tangible and identifiable intangible assets acquired and liabilities assumed is evaluatingsummarized below, and was based on valuation techniques such as the effectdiscounted cash flows and weighted average cost methods used in the implementationhigh technology industry using assumptions and estimates from management to calculate fair value.
| September 26, 2008 | ||||
| (in thousands) | ||||
Goodwill | $ | 16,947 | ||
Intangible assets: | ||||
Core and existing technologies | 18,800 | |||
Customer relationships | 3,900 | |||
Backlog | 340 | |||
Total intangible assets | 23,040 | |||
Tangible assets acquired and liabilities assumed: | ||||
Cash | 105 | |||
Accounts receivable, net | 201 | |||
Inventory | 580 | |||
Prepaid expenses and other current assets | 1,235 | |||
Property and equipment, net | 570 | |||
Total assets acquired | 2,691 | |||
Accounts payable | (352 | ) | ||
Current liabilities | (3,416 | ) | ||
Total liabilities assumed | (3,768 | ) | ||
Net liabilities assumed | (1,077 | ) | ||
Total purchase price | $ | 38,910 | ||
The values allocated to core and existing technologies, customer relationships and backlog created as a result of the acquisition of Aristos will have on its consolidated financial statements.
In April 2008,be amortized over estimated useful lives of sixty months, thirty-six months and three months, respectively, reflecting the FASB issued FASB Staff Position No. FAS 142-3, "Determiningperiod in which the Useful Lifeeconomic benefits of Intangible Assets." FSP 142-3 amends the factorsassets are expected to be considered in determiningrealized. The total value allocated to the acquired intangible assets as a result of the Aristos acquisition is being amortized over an estimated weighted average useful life of fifty-five months. No residual value was estimated for the intangible assets. Its intent isGoodwill was not expected to improvebe deductible for tax purposes.
F-14
ADAPTEC, INC.
NOTES TO CONSOLIDATED FINANCIAL STATEMENTS (Continued)
(Unaudited)
Note 2. Acquisitions (Continued)
Pro forma financial information: The following unaudited pro forma financial information for fiscal 2009 presents the consistency betweencombined results of the useful lifeCompany and Aristos, as if the acquisition had occurred at the beginning of anthe period presented. Such pro forma results are not necessarily indicative of what actually would have occurred had the Aristos acquisition been in effect for the periods presented nor are they indicative of results that could occur in the future. Certain adjustments have been made to the combined results of operations, including the amortization of acquired other intangible assetassets, a reduction to interest income to reflect the cash paid for the acquisition, a reduction to interest expense related to the Aristos debt and the periodelimination of expected cash flows used to measure itsthe change in fair value. FSP 142-3 is effectivevalue of preferred stock warrants, which were extinguished as part of the Merger Agreement, and the elimination of share-based compensation expense recognized by Aristos, as the Company did not assume any share-based awards as part of the merger. The pro forma financial results for fiscal years beginning after December 15, 2008. The Company is evaluating the effect the implementation will have on its consolidated financial statements.2009 and 2008 were as follows:
On May 9, 2008, the FASB issued FASB Staff Position No. APB 14-1, "Accounting for Convertible Debt Instruments That May Be Settled in Cash Upon Conversion (Including Partial Cash Settlement)." FSP APB 14-1 requires issuers of convertible debt that may be settled wholly or partly in cash when converted to account for the debt and equity components separately. FSP APB 14-1 is effective for fiscal years beginning after December 15, 2008 and must be applied retrospectively to all periods presented. The Company is evaluating the effect the implementation will have on its consolidated financial statements.
| Year Ended March 31, | ||||||||
| 2009 | 2008 | |||||||
(in thousands, except per share amounts) | ||||||||
Net revenues | $ | 116,560 | $ | 150,267 | ||||
Loss from continuing operations, net of taxes | $ | (24,635 | ) | $ | (28,287 | ) | ||
Income from discontinued operations, net of taxes | 3,786 | (4,243 | ) | |||||
Net loss | $ | (20,849 | ) | $ | (32,530 | ) | ||
Basic and diluted income (loss) per share: | ||||||||
Loss from continuing operations, net of taxes | $ | (0.21 | ) | $ | (0.24 | ) | ||
Income (loss) from discontinued operations, net of taxes | $ | 0.03 | $ | (0.04 | ) | |||
Net loss | $ | (0.17 | ) | $ | (0.27 | ) | ||
Shares used in computing income (loss) per share: | ||||||||
Basic and diluted | 119,767 | 118,613 | ||||||
Note 2.3. Discontinued Operations
Snap Server NAS Portion of its Systems Business:On June 27, 2008, the Company entered into an asset purchase agreement with Overland Storage, Inc. (“Overland”) for the sale of the Snap Server NAS portion of the Company’s former SSG segment (the “Snap Server NAS business”) for $3.3 million, of which $2.1 million was received by the Company upon the closing of the transaction and the remaining $1.2 million was to be received on the twelve-month anniversary of the closing of the transaction. In fiscal 2009, the Company established a reserve for the remaining $1.2 million of this receivable as a result of the financial difficulties Overland had reported. In fiscal 2010, the Company amended the promissory note agreement with Overland, which allowed Overland to pay the Company the remaining $1.2 million receivable plus accrued interest by March 31, 2010. Due to the Company’s continued concern regarding Overland’s ability to pay the Company, the Company released the reserve on the receivable as cash was collected. Under the terms of the agreement, Overland granted the Company a nonexclusive license to certain intellectual property and the Company provided Overland limited support services to help ensure a smooth transition. Expenses incurred in the transaction primarily include approximately $0.5 million for broker, legal and accounting fees. In addition, the Company accrued $0.1 million for lease obligations. The Company recorded a net gain fromof $1.2 million and $4.6 million on the disposal of the Snap Server NAS business in fiscal years 2010 and 2009, respectively, in “Gain on disposal of discontinued operations, net of taxes,” in the Consolidated Statements of Operations. The gain recorded in fiscal 2010 was based on the cash received in connection with the amended promissory note agreement with Overland. To date,
ADAPTEC, INC.
NOTES TO CONSOLIDATED FINANCIAL STATEMENTS (Continued)
(Unaudited)
Note 3. Discontinued Operations (Continued)
the Company has recorded a cumulative gain of $5.8 million through fiscal 2010 on the disposal of the Snap Server NAS business in “Gain on disposal of discontinued operations, net of taxes,” in the Consolidated Statements of Operations.
Net revenues and the components of loss related to the Snap Server NAS business included in discontinued operations, which were previously included in the Company’s SSG segment, were as follows:
| Year Ended March 31, | ||||||||
| 2009 | 2008 | |||||||
| (in thousands) | ||||||||
Net revenues | $ | 4,413 | $ | 21,899 | ||||
Loss from discontinued operations before provision for income taxes | (941 | ) | (7,441 | ) | ||||
Benefit from income taxes | — | 2,719 | ||||||
Loss from discontinued operations, net of taxes | $ | (941 | ) | $ | (4,722 | ) | ||
In the third quarter of fiscal 2009, the Company recorded $0.2 million related to the settlement of certain claims and accruals that resulted from the sale of the Snap Server NAS business.
The components of net liabilities, at the time of the sale of the Snap Server NAS business, were as follows:
| June 27, 2008 | ||||
| (in thousands) | ||||
Inventories | $ | 1,466 | ||
Accounts receivable, net | (466 | ) | ||
Total current assets of discontinued operations | 1,000 | |||
Property and equipment, net | 53 | |||
Total assets of discontinued operations | 1,053 | |||
Accrued and other liabilities | (4,067 | ) | ||
Total current liabilities of discontinued operations | (4,067 | ) | ||
Net liabilities of discontinued operations | $ | (3,014 | ) | |
Accounts receivable and accounts payable on the Consolidated Balance Sheet at June 27, 2008, related to the Snap Server NAS business, were not included in discontinued operations as the Company retained these assets and liabilities; however, since Overland assumed service and support liabilities for deferred revenue, deferred margin and warranty, the Company was relieved of these liabilities as well as certain sales returns and allowances contained in accounts receivable.
IBM i/p Series RAID business:In fiscal 2008, the Company recorded $0.5 million for fiscal 2008,to “Gain on disposal of discontinued operations, net of taxes” in its Consolidated Statements of Operations, which related to the reduction of accrued liabilities associated with the sale of the IBM i/p Series RAID business and related royalties.
IBM i/p Series RAID Business:
Onroyalties in September 30, 2005, the Company entered into a series of arrangements with IBM pursuant to which the Company sold its IBM i/p Series RAID business to IBM for approximately $22.0 million plus $1.3 million for certain fixed assets. In addition, IBM purchased certain related inventory at the Company's net book value of $0.8 million. Expenses incurred in the transaction primarily included costs of approximately $0.5 million for legal and accounting fees. In addition, the Company accrued $0.3 million for lease obligations. Under the terms of the agreements, the Company granted IBM a nonexclusive license to certain intellectual property and sold to IBM substantially all of the assets dedicated to theengineering and manufacturing of RAID controllers and connectivity products for the IBM i/p Series RAID Business. Under the terms of the nonexclusive license, IBM paid royalties to the Company for the sale of its board-level products on a quarterly basis through March 31, 2007, which were recognized as contingent consideration in discontinued operations when earned. In fiscal years 2007 and 2006, the Company received royalties, net of taxes, of $7.4 million and $4.6 million, respectively, which the Company recorded in "Income (loss) from disposal of discontinued operations, net of taxes," in the Consolidated Statements of Operations. In addition, in fiscal 2007, the Company recorded an additional estimated loss; net of taxes, of $0.8 million related to its facility associated with the IBM i/p Series RAID business in "Income (loss) from disposal of discontinued operations, net of taxes" in its Consolidated Statements of Operations. To the extent that the Company is unable to sublease this facility by the end of the lease term, which is June 2010, the Company may continue to record additional losses in discontinued operations in the future. Through March 31, 2008, the2005. The Company had recognized a cumulative gain of $4.8 million on the disposal of the IBM i/p Series RAID business.
Net revenues and the components of loss related to the IBM i/p Series RAID business included in discontinued operations, which were previously included in the Company's DPS segment, were as follows:
Year Ended March 31, 2006 ---------- (in thousands)Net revenues $ 19,734 ========== Loss from discontinued operations before income taxes $ (14,551) Benefit from income taxes (360) ---------- Loss from discontinued operations, net of taxes $ (14,191) ==========
Systems Business:
On September 29, 2005, the Company decided to divest its systems business, including substantially all of the operating assets and cash flows that were obtained through the Snap Appliance and Eurologic Systems acquisitions as well as internally developed hardware and software. Accordingly, the Company classified the systems business as a discontinued operation in the consolidated financial statements for the three-year period ended March 31, 2006 and began pursuing a sale of the systems business.
On January 31, 2006, the Company signed a definitive agreement with Sanmina-SCI Corporation and its wholly owned subsidiary, Sanmina-SCI USA, Inc., for the sale of the Company's OEM block-based portion of its systems business for $14.5 million, of which the final payment of $2.5 million was received in February 2008. In addition, Sanmina- SCI USA agreed to pay the Company contingent consideration of up to an additional $12.0 million if certain revenue levels are achieved over a three-year period. As of March 31, 2008, the Company believes that it is unlikely that revenue levels to earn this contingent consideration will be achieved. The Company recorded a gain of $12.1 million on the disposal of the OEM block- based systems business in the fourth quarter of fiscal 2006. In the fourth quarter of fiscal 2007, Sanmina-SCI exercised its put option to return any inventory not used within one year of the close of the transaction, which resulted in the Company charging $0.4 million to "Income (loss) from discontinued operations, net of taxes" in its Consolidated Statements of Operations.2008.
In the fourth quarter of fiscal 2006, the Company recorded asset impairment charges of $10.0 million related to certain acquisition-related intangible assets (see Note 5 to the Consolidated Financial Statements) for the Snap Server portion of its systems business that was previously held for sale at March 31, 2006, to adjust the carrying value of these assets to fair value, which was aligned to the offers being negotiated.
The Company received offers from prospective buyers for the Snap Server portion of its systems business; however, management concluded that the potential value from retaining the operations outweighed the offers received for the business. As a result, on July 6, 2006, the Company decided to retain the Snap Server portion of the systems business and terminated its ongoing efforts to sell this business. This resulted in the reclassification of the financial statements and related disclosures for all periods presented to reflect the Snap Server portion of its systems business as continuing operations effective in the first quarter of fiscal 2007. In addition, the Company recorded asset impairment charges of $13.2 million related to certain acquisition-related intangible assets (see Note 5 to the Consolidated Financial Statements) and $0.7 million for legal and consulting fees incurred in connection with its efforts that had been undertaken to sell the Snap Server portion of its systems business, which was recorded in "Other charges (gains)" in the Consolidated Statements of Operations in fiscal 2007.
Net revenues and the components of income (loss) related to the OEM block-based portion of the Company's systems business included in the discontinued operations, were as follows:
Years Ended March 31, ----------------------- 2007 (1) 2006 ---------- ---------- (in thousands)Net revenues $ 2,036 $ 31,723 ========== ========== Loss from discontinued operations before provision for income taxes $ (529) $ (8,219) Provision for income taxes 17 -- ---------- ---------- Loss from discontinued operations, net of taxes $ (546) $ (8,219) ========== ==========
________________________
(1) The Company generated net revenues from one customer that remained with the Company after the divestiture of the OEM block-based systems business.
Note 3.4. Marketable Securities
The Company'sCompany’s investment policy focuses on three objectives: to preserve capital, to meet liquidity requirements and to maximize total return. The Company’s investment policy establishes minimum ratings for each classification of investments when purchased and investment concentration is limited to minimize risk. The
F-16
ADAPTEC, INC.
NOTES TO CONSOLIDATED FINANCIAL STATEMENTS (Continued)
(Unaudited)
Note 4. Marketable Securities (Continued)
policy also limits the final maturity on any investment and the overall duration of the portfolio. Given the overall market conditions, the Company regularly reviews its investment portfolio to ensure adherence to its investment policy and to monitor individual investments for risk analysis and proper valuation.
The Company’s portfolio of marketable securities, including restricted marketable securities at March 31, 20082010 was as follows:
Gross Gross Estimated Unrealized Unrealized Fair Cost Gains Losses Value ----------- ---------- ---------- ----------- (in thousands) Available-for-Sale Marketable Securities:Short-term deposits $ 60,979 $ -- $ -- 60,979 Corporate obligations 110,543 720 (573) 110,690 United States government securities 116,920 1,790 (5) 118,705 Other debt securities 156,746 1,886 (39) 158,593 ----------- ---------- ---------- ----------- Total available-for-sale securities 445,188 4,396 (617) 448,967 Less: amounts classified as cash equivalents 60,992 -- -- 60,992 ----------- ---------- ---------- ----------- Total $ 384,196 $ 4,396 $ (617) 387,975 =========== ========== ========== ===========
| Cost | Gross Unrealized Gains | Gross Unrealized Losses | Estimated Fair Value | ||||||||||||
| (in thousands) | |||||||||||||||
Available-for-Sale Marketable Securities: | |||||||||||||||
Short-term deposits | $ | 16,739 | $ | — | $ | — | $ | 16,739 | |||||||
United States government securities | 41,058 | 156 | (15 | ) | 41,199 | ||||||||||
Government agencies | 92,795 | 905 | (34 | ) | 93,666 | ||||||||||
Mortgage-backed securities | 42,309 | 559 | (55 | ) | 42,813 | ||||||||||
State and municipalities | 1,065 | — | (2 | ) | 1,063 | ||||||||||
Corporate obligations | 136,934 | 1,675 | (18 | ) | 138,591 | ||||||||||
Asset-backed securities | 7,791 | 119 | — | 7,910 | |||||||||||
Total available-for-sale securities | 338,691 | 3,414 | (124 | ) | 341,981 | ||||||||||
Amounts classified as cash equivalents | (30,582 | ) | — | — | (30,582 | ) | |||||||||
Amounts classified as marketable securities | $ | 308,109 | $ | 3,414 | $ | (124 | ) | $ | 311,399 | ||||||
The Company'sCompany’s portfolio of marketable securities, including restricted marketable securities at March 31, 20072009 was as follows:
Gross Gross Estimated Unrealized Unrealized Fair Cost Gains Losses Value ----------- ---------- ---------- ----------- (in thousands) Available-for-Sale Marketable Securities:Short-term deposits $ 13,370 $ -- $ -- 13,370 Corporate obligations 170,269 88 (409) 169,948 United States government securities 102,061 138 (349) 101,850 Other debt securities 215,233 1,459 (308) 216,384 ----------- ---------- ---------- ----------- Total available-for-sale securities 500,933 1,685 (1,066) 501,552 Less: amounts classified as cash equivalents 21,807 -- -- 21,807 ----------- ---------- ---------- ----------- Total $ 479,126 $ 1,685 $ (1,066) 479,745 =========== ========== ========== ===========
| Cost | Gross Unrealized Gains | Gross Unrealized Losses | Estimated Fair Value | ||||||||||||
| (in thousands) | |||||||||||||||
Available-for-Sale Marketable Securities: | |||||||||||||||
Short-term deposits | $ | 62,657 | $ | — | $ | — | $ | 62,657 | |||||||
United States government securities | 6,511 | 144 | — | 6,655 | |||||||||||
Government agencies | 86,746 | 1,751 | — | 88,497 | |||||||||||
Mortgage-backed securities | 43,366 | 654 | (9 | ) | 44,011 | ||||||||||
Corporate obligations | 92,311 | 1,071 | (559 | ) | 92,823 | ||||||||||
Asset-backed securities | 32,755 | 198 | (71 | ) | 32,882 | ||||||||||
Total available-for-sale securities | 324,346 | 3,818 | (639 | ) | 327,525 | ||||||||||
Amounts classified as cash equivalents | (62,657 | ) | — | — | (62,657 | ) | |||||||||
Amounts classified as marketable securities | $ | 261,689 | $ | 3,818 | $ | (639 | ) | $ | 264,868 | ||||||
Sales of marketable securities resulted in gross realized gains of $1.9$0.7 million, $0.2$1.4 million and $0.1$1.9 million during fiscal years 2008, 20072010, 2009 and 2006,2008, respectively. Sales of marketable securities resulted in gross realized losses of $0.1$0.2 million, $0.6$0.8 million and $0.7$0.1 million during fiscal years 2010, 2009 and 2008, 2007 and 2006, respectively.
ADAPTEC, INC.
NOTES TO CONSOLIDATED FINANCIAL STATEMENTS (Continued)
(Unaudited)
Note 4. Marketable Securities (Continued)
The following table summarizes the fair value and gross unrealized losses of the Company'sCompany’s available-for-sale marketable securities, aggregated by type of investment instrument and length of time that individual securities have been in a continuous unrealized loss position, at March 31, 2008:2010:
have been in a continuous unrealized loss position, at March 31, 2009:Less than 12 Months 12 Months or Greater Total ---------------------- ---------------------- -------------------- Gross Gross Gross Fair Unrealized Fair Unrealized Fair Unrealized Value Losses Value Losses Value Losses ---------- ---------- ---------- ---------- --------- --------- (in thousands)Corporate obligations $ 37,588 $ (554) $ 2,031 $ (19) $ 39,619 $ (573) United States government
Less than 12 Months 12 Months or Greater Total Fair Value Gross
Unrealized
LossesFair Value Gross
Unrealized
LossesFair Value Gross
Unrealized
Losses(in thousands) United States government securities
$ 4,957 $ (15 ) $ — $ — $ 4,957 $ (15 ) Government agencies
23,322 (34 ) — — 23,322 (34 ) Mortgage-backed securities
7,702 (55 ) — — 7,702 (55 ) Corporate obligations
1,064 (2 ) — — 1,064 (2 ) Asset-backed securities
16,038 (18 ) — — 16,038 (18 ) Total
$ 53,083 $ (124 ) $ — $ — $ 53,083 $ (124 ) The following table summarizes the fair value and gross unrealized losses of the Company’s available-for-sale marketable securities,
1,912 (5) -- -- 1,912 (5) Other debtaggregated by type of investment instrument and length of time that individual securities8,844 (39) -- -- 8,844 (39) ---------- ---------- ---------- ---------- --------- --------- $ 48,344 $ (598) $ 2,031 $ (19) $ 50,375 $ (617) ========== ========== ========== ========== ========= =========
| Less than 12 Months | 12 Months or Greater | Total | |||||||||||||||||||
| Fair Value | Gross Unrealized Losses | Fair Value | Gross Unrealized Losses | Fair Value | Gross Unrealized Losses | ||||||||||||||||
| (in thousands) | |||||||||||||||||||||
Mortgage-backed securities | $ | 3,836 | $ | (9 | ) | $ | — | $ | — | $ | 3,836 | $ | (9 | ) | |||||||
Corporate obligations | 20,097 | (303 | ) | 8,154 | (256 | ) | 28,251 | (559 | ) | ||||||||||||
Asset-backed securities | 5,874 | (70 | ) | 499 | (1 | ) | 6,373 | (71 | ) | ||||||||||||
Total | $ | 29,807 | $ | (382 | ) | $ | 8,653 | $ | (257 | ) | $ | 38,460 | $ | (639 | ) | ||||||
The Company'sCompany’s investment portfolio consists of both corporate and government securities that have a maximum maturity ofgenerally mature within three years. The longer the duration of these securities, the more susceptible they are to changes in market interest rates and bond yields. As yields increase, those securities purchased with a lower yield-at-cost show a mark-to-market unrealized loss. All unrealized losses are due to liquidity challenges and changes in interest rates and bond yields. The Company has considered all available evidence and determined that the marketable securities in which unrealized losses were recorded in fiscal years 2010 and 2009 were not deemed to be other-than-temporary. The Company holds its marketable securities as available-for-sale and marks them to market. The Company expects to realize the full value of all these investmentsits marketable securities upon maturity or sale.sale, as the Company has the intent and ability to hold the securities until the full value is realized. However, the Company cannot provide any assurance that its invested cash, cash equivalents and marketable securities will not be impacted by adverse conditions in the financial markets, which may require the Company to record an impairment charge that could adversely impact its financial results.
F-18
ADAPTEC, INC.
NOTES TO CONSOLIDATED FINANCIAL STATEMENTS (Continued)
(Unaudited)
Note 4. Marketable Securities (Continued)
The amortized cost and estimated fair value of investments in available-for-sale debt securities at March 31, 2008,2010 and 2009, by contractual maturity, were as follows:
Estimated Cost Fair Value ------------------ -------------- (in thousands)Mature in one year or less $ 234,170 $ 235,011 Mature after one year through three years 207,468 210,323 Mature after three years 3,550 3,633 ------------------ -------------- $ 445,188 $ 448,967 ================== ==============
| March 31, 2010 | March 31, 2009 | |||||||||||
| Cost | Estimated Fair Value | Cost | Estimated Fair Value | |||||||||
| (in thousands) | ||||||||||||
Mature in one year or less | $ | 154,314 | $ | 155,728 | $ | 165,435 | $ | 166,294 | ||||
Mature after one year through three years | 184,060 | 185,934 | 155,980 | 158,236 | ||||||||
Mature after three years | 317 | 319 | 2,931 | 2,995 | ||||||||
| $ | 338,691 | $ | 341,981 | $ | 324,346 | $ | 327,525 | |||||
The maturities of asset-backed and mortgage-backed securities were estimated primarily based upon assumed prepayment forecasts utilizing interest rate scenarios and mortgage loan characteristics.
Note 5. Fair Value Measurements
On April 1, 2008, the Company partially adopted the accounting and disclosure requirements for measuring fair value related to all of the Company’s recurring non-financial assets and liabilities. On April 1, 2009, the Company adopted the remaining accounting and disclosure requirements for the non-recurring fair value measurements of non-financial assets and liabilities, including guidance provided by the FASB on how to determine the fair value of assets and liabilities when the volume and level of activity for the asset or liability has significantly decreased when compared with normal market activity for the asset or liability as well as guidance on identifying circumstances that indicate a transaction is not orderly. The adoption of these accounting standards did not have a material impact on the Company’s Consolidated Financial Statements.
Fair value is defined as the price that would be received for selling an asset or paid to transfer a liability in the principal or most advantageous market for the asset or liability in an orderly transaction between market participants on the measurement date. The accounting standard surrounding fair value measurements establishes a fair value hierarchy, consisting of three levels, which requires an entity to maximize the use of observable inputs and minimize the use of unobservable inputs when measuring fair value.
The Company has investedutilized levels 1 and 2 to value its financial assets on a recurring basis. Level 1 instruments use quoted prices in technologyactive markets for identical assets or liabilities, which include the Company’s cash accounts, short-term deposits and money market funds as these specific assets are liquid. Level 1 instruments also include United States government securities, government agencies and substantially all mortgage-backed securities as these securities are backed by the federal government and traded in active markets frequently with sufficient volume. Level 2 instruments use quoted prices in markets that are not active or other inputs that are observable or can be corroborated by observable market data for substantially the full term of the assets or liabilities and include corporate obligations and asset-backed securities as similar or identical instruments can be found in active markets. At both March 31, 2010 and 2009, there were no significant transfers that occurred between levels 1 and 2 of its financial assets. In addition, at both March 31, 2010 and 2009, the Company did not have any assets utilizing level 3 to value its financial assets on a recurring basis. Level 3 is supported by little or no market activity and requires a high level of judgment to determine fair value.
ADAPTEC, INC.
NOTES TO CONSOLIDATED FINANCIAL STATEMENTS (Continued)
(Unaudited)
Note 5. Fair Value Measurements (Continued)
Financial assets measured at fair value on a recurring basis at March 31, 2010 and 2009 were as follows:
| Total | March 31, 2010 | Total | March 31, 2009 | |||||||||||||||
| Fair Value Measurements At Reporting Date Using | Fair Value Measurements At Reporting Date Using | |||||||||||||||||
| Quoted Prices in Active Markets for Identical Assets (Level 1) | Significant Other Observable Inputs (Level 2) | Quoted Prices in Active Markets for Identical Assets (Level 1) | Significant Other Observable Inputs (Level 2) | |||||||||||||||
| (in thousands) | ||||||||||||||||||
Cash,including short-term deposits(1) | $ | 50,105 | $ | 50,105 | $ | — | $ | 111,724 | $ | 111,724 | $ | — | ||||||
United States government securities(2) | 41,199 | 41,199 | — | 6,655 | 6,655 | — | ||||||||||||
Government agencies(3) | 93,666 | 93,666 | — | 88,497 | 88,497 | — | ||||||||||||
Mortgage-backed securities(3) | 42,813 | 41,696 | 1,117 | 44,011 | 41,821 | 2,190 | ||||||||||||
State and Municipalities(3) | 1,063 | 1,063 | — | — | — | — | ||||||||||||
Corporate obligations(4) | 138,591 | — | 138,591 | 92,823 | — | 92,823 | ||||||||||||
Asset-backed securities(3) | 7,910 | — | 7,910 | 32,882 | — | 32,882 | ||||||||||||
Total | $ | 375,347 | $ | 227,729 | $ | 147,618 | $ | 376,592 | $ | 248,697 | $ | 127,895 | ||||||
| (1) | At March 31, 2010, the Company recorded $50,100,000 and $5,000 within “Cash and cash equivalents” and “Marketable securities,” respectively. At March 31, 2009, the Company recorded $111,724,000 within “Cash and cash equivalents.” |
| (2) | At March 31, 2010, the Company recorded $4,099,000 and $37,100,000 within “Cash and cash equivalents” and “Marketable securities,” respectively. At March 31, 2009, the Company recorded $6,655,000 within “Marketable securities.” |
| (3) | Recorded within “Marketable securities.” |
| (4) | At March 31, 2010, the Company recorded $9,749,000 and $128,842,000 within “Cash and cash equivalents” and “Marketable securities,” respectively. At March 31, 2009, the Company recorded $92,823,000 within “Marketable securities.” |
At March 31, 2010, the Company utilized level 3, which is categorized as significant unobservable inputs, to value its non-financial assets on a non-recurring basis. The non-financial assets related to the Company’s non-controlling interest in certain non-public companies through two venture capital funds, Pacven Walden Ventures V Funds and APV Technology Partners II, L.P. Pacven Walden Venture V Funds invests in technology companies worldwide, primarily in the communications, electronics, IT services, internet, software, life sciences and semiconductor industries. APV Technology Partners II, L.P. invests in technology companies that are privately-held, which are organized in the United States. At March 31, 20082010 and 2007,2009, the carrying value of such investments aggregated $1.6$1.2 million and $2.0 million, respectivelyfor each period, and was included within "Other“Other Long Term Assets"Assets” on the Consolidated Balance Sheets. The Company regularly monitors these investments by recording these investments based on quarterly statements the Company receives from the funds. The statements are generally received one quarter in arrears, as more timely valuations are not practical. The statements reflect the net asset value, which the Company uses to determine the fair value for these investments, which (a) do not have a readily determinable fair value and (b) either have the attributes of an investment company or prepare their financial statements consistent with the measurement principles of an investment company. Assumptions used by the Company due to
F-20
ADAPTEC, INC.
NOTES TO CONSOLIDATED FINANCIAL STATEMENTS (Continued)
(Unaudited)
Note 5. Fair Value Measurements (Continued)
lack of observable inputs may impact the fair value of these equity investments in future periods. In the event that the carrying value of its equity investments exceeds their fair value, or the decline in value is determined to be other-than-temporary, the carrying value is reduced to its current fair value, which is recorded in “Interest and Other Income, Net,” in the Consolidated Statements of Operations. At both March 31, 2010 and 2009, there were no transfers in or out of level 3 of its non-recurring assets.
Note 4.6. Balance Sheet Details
Inventories
The components of net inventories at March 31, 20082010 and 20072009 were as follows:
March 31, ------------------------ 2008 2007 ----------- ----------- (in thousands)Raw materials $ 107 $ 390 Work-in-process 760 3,536 Finished goods 9,059 24,791 ----------- ----------- Inventories $ 9,926 $ 28,717 =========== ===========
| March 31, | ||||||
| 2010 | 2009 | |||||
| (in thousands) | ||||||
Raw materials | $ | 8 | $ | 62 | ||
Work-in-process | 393 | 240 | ||||
Finished goods | 1,941 | 3,793 | ||||
Inventories | $ | 2,342 | $ | 4,095 | ||
Property and Equipment, Net
The components of property and equipment, net, at March 31, 20082010 and 20072009 were as follows:
March 31, ------------------------------- Life 2008 2007 ----------- ----------- ----------- (in thousands)Land -- $ 2,855 $ 2,855 Buildings and improvements 5-40 years 13,108 13,090 Machinery and equipment 3-5 years 33,401 47,627 Furniture and fixtures 3-7 years 27,787 43,467 Lower of useful life or Leasehold improvements life of lease 3,166 5,181 ----------- ----------- 80,317 112,220 Accumulated depreciation and amortization (67,033) (96,368) ----------- ----------- Property and equipment, net $ 13,284 $ 15,852 =========== ===========
| March 31, | ||||||||||
| Life | 2010 | 2009 | ||||||||
| (in thousands) | ||||||||||
Land | — | $ | 2,855 | $ | 2,855 | |||||
Buildings and improvements | 5-40 years | 12,698 | 12,915 | |||||||
Machinery and equipment | 3-5 years | 3,672 | 20,545 | |||||||
Furniture and fixtures | 3-7 years | 13,279 | 33,470 | |||||||
Leasehold improvements | Lesser of useful life or life of lease | 123 | 626 | |||||||
| 32,627 | 70,411 | |||||||||
Accumulated depreciation and amortization | (21,274 | ) | (58,747 | ) | ||||||
Property and equipment, net | $ | 11,353 | $ | 11,664 | ||||||
Depreciation and amortization expense was $3.6$1.5 million, $2.3 million and $5.2$3.5 million in fiscal years 20082010, 2009 and 2007,2008, respectively. The Company retireddisposed of fully depreciated assets in fiscal 2008 and2010, resulting in the write-off of $37.8 million in both the associated cost and the accumulated depreciation amounts were written off in the fiscal year of the disposition.depreciation.
ADAPTEC, INC.
NOTES TO CONSOLIDATED FINANCIAL STATEMENTS (Continued)
(Unaudited)
Note 6. Balance Sheet Details (Continued)
Accrued and Other Liabilities
The components of accrued and other liabilities at March 31, 20082010 and 20072009 were as follows:
March 31, 2010 2009 (in thousands) Tax-related
$ 1,075 $ 1,540 Acquisition-related
418 616 Accrued compensation and related taxes(1)
4,717 5,652 Deferred margin
2,717 1,338 Obligations under software license agreement
1,053 — Other
2,291 4,105 Accrued and other liabilities
$ 12,271 $ 13,251
| (1) | In fiscal 2010, accrued compensation and related taxes included certain employee retention obligations of $0.8 million. |
Other Long-term Liabilities
The components of other long-term liabilities at March 31, ------------------------
2008 2007
----------- -----------
(in thousands)
Tax related $ 597 $ 9,590
Acquisition related 2,587 2,123
Accrued compensation2010 and related taxes 5,439 7,672
Deferred margin 1,829 5,265
Other 8,676 12,484
----------- -----------
Accrued and other liabilities $ 19,128 $ 37,134
=========== ===========
2009 were as follows:
| March 31, | ||||||
| 2010 | 2009 | |||||
| (in thousands) | ||||||
Tax-related | $ | 3,656 | $ | 5,852 | ||
Acquisition-related | 165 | 614 | ||||
Other | 934 | 844 | ||||
Other long-term liabilities | $ | 4,755 | $ | 7,310 | ||
Accumulated Other Comprehensive Income, Net of Taxes
The components of accumulated other comprehensive income, net of taxes, at March 31, 20082010 and 20072009 were as follows:
March 31, ------------------------ 2008 2007 ----------- ----------- (in thousands)Unrealized gain on marketable securities, net of tax of $1,365 in fiscal 2008 and $- in fiscal 2007 $ 2,420 $ 559 Foreign currency translation, net of tax of $1,287 in fiscal 2008 and $- in fiscal 2007 4,573 2,619 ----------- ----------- Accumulated other comprehensive income, net of taxes $ 6,993 $ 3,178 =========== ===========
| March 31, | ||||||
| 2010 | 2009 | |||||
| (in thousands) | ||||||
Unrealized gain on marketable securities, net of taxes of $1,365 in both fiscal years 2010 and 2009 | $ | 1,930 | $ | 1,820 | ||
Foreign currency translation, net of taxes of $1,287 in both fiscal years 2010 and 2009 | 2,356 | 1,144 | ||||
Accumulated other comprehensive income, net of taxes | $ | 4,286 | $ | 2,964 | ||
F-22
ADAPTEC, INC.
NOTES TO CONSOLIDATED FINANCIAL STATEMENTS (Continued)
(Unaudited)
Note 5.7. Goodwill and Other Intangible Assets, Net
Goodwill
In connection with the reorganizationA reconciliation of the Company's segments in fiscal 2006, an assessment ofchanges to the recoverabilityCompany’s carrying amount of goodwill for fiscal 2009 was performed.as follows:
| Total | ||||
| (in thousands) | ||||
Balance at March 31, 2008 | $ | — | ||
Goodwill acquired during the period (Note 2) | 16,947 | |||
Goodwill impairment | (16,947 | ) | ||
Balance at March 31, 2009 | $ | — | ||
In September 2008, goodwill was increased by $16.9 million due to the acquisition of Aristos (Note 2). Goodwill was not allocated but managed at the Company level, as the Company contains only one reporting unit. During the fourth quarter of fiscal 2009, the Company experienced a significant and continued decline in the market value of its common stock, which resulted in the Company’s market capitalization falling below its net book value. In addition, the Company performed its annual review of goodwill in the fourth quarter of fiscal 2009. As a result of this review,the assessment, the Company wrote-offdetermined that its entire balancenet book value exceeded the implied fair value; therefore, the Company recorded an impairment charge of goodwill of $90.6$16.9 million in fiscal 2009 to write-off the second quarterentire goodwill balance. This impairment charge was recorded within “Goodwill impairment” in the Consolidated Statements of fiscal 2006. Factors that led to this conclusion included, but were not limited to, industry technology changes such as the shift from parallel to serial technology and the migration of core functionality to server chipsets; required increased investments that eventually led the Company to sell the IBM i/p Series RAID business in fiscal 2007 and the decision to sell the systems business; continued losses associated with sales of systems to IBM; and general market conditions.Operations.
Other Intangible Assets, Net
The components of other intangible assets, net, at March 31, 20082010 and 20072009 were as follows:
March 31, 2010 March 31, 2009 Gross
Carrying
AmountAccumulated
AmortizationNet
Carrying
AmountGross
Carrying
AmountAccumulated
AmortizationNet
Carrying
Amount(in thousands) Acquisition-related intangible assets:
Patents, core and existing technologies
$ 34,348 $ (21,501 ) $ 12,847 $ 34,348 $ (17,742 ) $ 16,606 Customer relationships
4,233 (2,391 ) 1,842 4,233 (1,091 ) 3,142 Trade names
674 (674 ) — 674 (674 ) — Backlog
340 (340 ) — 340 (340 ) — Subtotal
39,595 (24,906 ) 14,689 39,595 (19,847 ) 19,748 Intellectual property assets and warrants
26,992 (26,992 ) — 26,992 (26,992 ) — Software license
1,755 (415 ) 1,340 — — — Intangible assets, net
$ 68,342 $ (52,313 ) $ 16,029 $ 66,587 $ (46,839 ) $ 19,748 In July 2009, the Company entered into a software license agreement with Synopsys, Inc. for $1.8 million, of which $0.7 million was paid in fiscal 2010 and the remaining $1.1 million will be paid through March
31, 2008 March 31, 2007 ---------------------------------- ---------------------------------- Gross Net Gross Net Carrying Accumulated Carrying Carrying Accumulated Carrying Amount2011. The amortization of the software license agreement is being recorded in “Research and development” over an estimated useful life of three years reflecting the pattern in which economic benefits of the assets are realized.Amortization
Amount Amount Amortization Amount ---------- ---------- ---------- ---------- ---------- ---------- (in thousands)Acquisition-related intangible assets: Patents, core and existing technologies$ 43,545 $ (43,545) $ -- $ 43,545 $ (38,539) $ 5,006 Customer relationships 1,047 (1,047) -- 1,047 (1,034) 13 Trade names 10,774 (10,774) -- 10,774 (10,474) 300 ---------- ---------- ---------- ---------- ---------- ---------- Subtotal 55,366 (55,366) -- 55,366 (50,047) 5,319 Intellectual property assets and warrants 40,242 (40,242) -- 40,242 (38,550) 1,692 ---------- ---------- ---------- ---------- ---------- ---------- Other intangible assets, net $ 95,608 $ (95,608) $ -- $ 95,608 $ (88,597) $ 7,011 ========== ========== ========== ========== ========== ==========
Intellectual property assets consist of a patent license fee, a technology license fee and an amount allocated to a product supply agreement (see Note 16 to the Consolidated Financial Statements). Amortization ofother intangible assets, net was $7.0$5.5 million, $12.3$3.3 million and $15.8$4.2 million in fiscal years 2010, 2009 and 2008, 2007respectively.
F-23
ADAPTEC, INC.
NOTES TO CONSOLIDATED FINANCIAL STATEMENTS (Continued)
(Unaudited)
Note 7. Goodwill and 2006, respectively.Intangible Assets, Net (Continued)
The Company regularly performs reviews to determine if facts or circumstances areperformed its regular review of long-lived assets and determined that an indicator was present either internal or external,in fiscal 2008 in which would indicate that the carrying values of its long-lived assets are impaired. If an asset is determined to be impaired,value was not recoverable. The Company measured the impairment loss is measured based onand recognized the difference betweenamount in which the asset'scarrying value exceeded the estimated fair value and its carrying value. The estimateby recording an impairment charge of fair value of$2.2 million in fiscal 2008 to write-off the intangible assets is based on discounting estimated futurerelated to the Elipsan acquisition due to a revision in the Company’s forecasts that resulted in expected negative long-term cash flows using a discount rate commensurate withfor these assets for the risks inherentfirst time, which was recorded within “Other gains, net” in the Company's current business model.Consolidated Statements of Operations. The estimation of the impairment involvesinvolved numerous assumptions that require judgment by the Company, including, but not limited to, future use of the assets for the Company'sCompany’s operations versus sale or disposal of the assets and future selling prices for the Company'sCompany’s products.
In December 2009, the Company announced that it initiated a process to pursue the potential sale or disposition of certain of its assets or business operations. As a result of this announcement, the Company evaluated its long-lived assets to determine whether the carrying value would be recoverable in the third quarter of fiscal 2010. As the Company continued through this sale process on certain of its assets or business operations in the fourth quarter of fiscal 2006,2010, the Company recorded asset impairment charges of $10.0 million related to certain acquisition-related intangible assets forreevaluated the Snap Server portionrecoverability of its systems business that was previously held for salelong-lived assets’ carrying value at March 31, 2006 to adjust2010. Based on the Company’s analysis, its long-lived assets were not considered impaired in either the third or fourth quarters of fiscal 2010 as the sum of the expected undiscounted future cash flows exceeded the carrying value of theseits long-lived assets to fair value, which was aligned to the offers made by potential purchasers. During the first quarter of fiscal 2007, as a result$27.4 million at March 31, 2010. The sum of the decisionexpected undiscounted future cash flows was weighted to retain and operatetake into consideration the Snap Server portionpossible outcomes of the systems business, the Company performed an impairment analysis that indicated that the carrying amount ofwhether the long-lived assets, exceeded their estimated fair value. This was due in partwhich were considered as one asset group based on the lowest level of independent cash flows generated, would be retained and utilized as opposed to sold or disposed.
The annual amortization expense of the intangible assets, net, that existed as of March 31, 2010, is expected to be as follows:
| Estimated Amortization Expense | |||
| (in thousands) | |||
Fiscal years: | |||
2011 | $ | 5,645 | |
2012 | 4,887 | ||
2013 | 3,931 | ||
2014 | 1,566 | ||
Total | $ | 16,029 | |
Subsequent to the limited cash flowsCompany’s fiscal year-end, with entering into an Asset Purchase Agreement with PMC-Sierra with respect to the PMC Transaction and the Company’s intent to either continue to pursue the sale of the business and a numberAristos products or wind down the sale or dispose of uncertainties, which includedits Aristos products within the significant research and development expenditures necessary to grownext six months, or by September 2010, as well as the revenueCompany’s consideration of the Snap Server portiondisposition or redeployment of its remaining non-core patents and real estate assets, the systems business andCompany is expected to change the significant uncertainties associated with achieving such growth in revenue. This resulted in an impairment chargeremaining useful life of $13.2 million, which was recorded in "Other charges (gains)" in the Consolidated Statementsits intangible assets of Operations in fiscal 2007, of which $5.6 million, $3.1 million and $4.5$16.0 million related to the Company's acquisition-related intangible assets for existing technology, core technology, and trade name, respectively.
During the fourth quarter of fiscal 2008,Aristos products, which in turn, the Company recorded an impairment of $2.4 millionexpects to write downchange the SSG intangible assets relatedamount amortized prospectively during each reporting period. However, if the PMC Transaction is not consummated, the Company may not be able to the Elipsan and Snap Appliance acquisitions to zero due to a revision in the Company's forecasts that resulted inrealize its expected negative long-termundiscounted future cash flows for these assets for the first time.
Note 6. Assets Held For Sale
In fiscal 2007,based on foreseen negative market perceptions. This may lead the Company decided to consolidate its propertiesexit or divest in Milpitas, Californiasome additional or all of our current operations to better align its business needs with existing operations and to provide more efficient use of its facilities.focus on new opportunities. As a result, three owned buildings, including associated building improvements and property, plant and equipment, have been classified as assets held for sale and were included in "Assets held for sale" in the Consolidated Balance Sheets at March 31, 2007 at the Company's carrying value of $12.5 million, which was lower than the fair value less cost to sell.
In May 2007, the Company completed the sale of the three buildings with proceeds aggregatingwill continue to $19.0 million, which exceeded the Company's carrying value of $12.3 million. Net of selling costs,reevaluate and reassess whether the Company recorded a gain on the sale of the properties of $6.7 millionmay be required to record impairment charges for its long-lived assets in fiscal 2008 to "Other charges (gains)" in the Consolidated Statements of Operations.future periods.
ADAPTEC, INC.
NOTES TO CONSOLIDATED FINANCIAL STATEMENTS (Continued)
(Unaudited)
Note 7. Convertible8. 3/4% Notes
3/4% Notes:In December 2003, the Company issued $225.0 million in aggregate principal amount of 3/4% Notes due December 22, 2023.Notes. The issuance costs associated with the 3/4% Notes totaled $6.8 million, which was amortized to interest expense over five years, and the net proceeds to the Company from the offering of the 3/4% Notes were $218.2 million. The Company pays cash interest at an annual rate of 3/4% of the principal amount at issuance, payable semi-annually on June 22 and December 22 of each year. The 3/4% Notes are subordinated to all existing and future senior indebtedness of the Company. The Company did not apply the accounting standard issued in May 2008 by the FASB with regards to applying a nonconvertible debt borrowing rate on its 3/4% Notes in fiscal 2010, as its 3/4% Notes may not be settled in cash or other assets upon conversion. As a result, this accounting standard, which was effective for the Company beginning with its fiscal 2010, had no impact on its Consolidated Financial Statements.
The 3/4% Notes are convertible at the option of the holders into shares of the Company'sCompany’s common stock, par value $0.001 per share, only under the following circumstances: (1) prior to December 22, 2021, on any date during a fiscal quarter if the closing sale price of the Company'sCompany’s common stock was more than 120% of the then current conversion price of the 3/4% Notes for at least 20 trading days in the period of the 30 consecutive trading days ending on the last trading day of the previous fiscal quarter, (2) on or after December 22, 2021, if the closing sale price of the Company'sCompany’s common stock was more than 120% of the then current conversion price of the 3/4% Notes, (3) if the Company elects to redeem the 3/4% Notes, (4) upon the occurrence of specified corporate transactions or significant distributions to holders of the Company'sCompany’s common stock occur or (5) subject to certain exceptions, for the five consecutive business day period following any five consecutive trading day period in which the average trading price of the 3/4% Notes was less than 98% of the average of the sale price of the Company'sCompany’s common stock during such five-day trading period multiplied by the 3/4% Notes then current conversion rate. Subject to the above conditions, each $1,000 principal amount of 3/4% Notes is convertible into approximately 85.4409 shares of the Company'sCompany’s common stock (equivalent to an initial conversion price of approximately $11.704 per share of common stock).
TheIn fiscal 2009, the Company may redeem some or allrepurchased a total of $191.0 million in principal amount of its 3/4% Notes on the open market for an aggregate price of $188.9 million, resulting in a gain on extinguishment of debt of $1.7 million (net of unamortized debt issuance costs of $0.4 million), which was recorded within “Interest and other income, net” in the Consolidated Statements of Operations. In addition, the majority of the remaining holders of the 3/4% Notes for cash onexercised their put option in December 22, 2008 and January 2009, which required the Company to purchase its 3/4% Notes at a redemption price equal to 100.25% of the principal of the 3/4% Notes, resulting in the redemption of the 3/4% Notes for an aggregate cost of $34.0 million, plus accrued and unpaid interest. In fiscal 2010, the Company repurchased a total of $0.1 million at a price equal to 100% of the principal amount of the notes being redeemed, plus accrued interest3/4% Notes. At March 31, 2010, the Company had a remaining liability of $0.3 million of aggregate principal amount related to but excluding,its 3/4% Notes. Each remaining holder of the redemption date. After3/4% Notes may require the Company to purchase all or a portion of its 3/4% Notes on December 22, 2008,2013, on December 22, 2018 or upon the occurrence of a change of control (as defined in the indenture governing the 3/4% Notes) at a price equal to the principal amount of 3/4% Notes being purchased plus any accrued and unpaid interest and the Company may redeem some or all of the 3/4% Notes for cash at a redemption price equal to 100% of the principal amount of the notes being redeemed, plus accrued interest to, but excluding, the redemption date.
Each holder The Company may seek to make open market repurchases of the remaining balance of its 3/4% Notes may requirewithin the Company to purchase all or a portion of their 3/4% Notes on December 22, 2008 at a price equal to 100.25% of the 3/4% Notes to be purchased plus accrued and unpaid interest. As the Company expects all of the holders of the 3/4% Notes to exercise their put option in December 2008, the Company reclassified the 3/4% Notes from long-term liabilities to current liabilities, which is reflected in the Consolidated Balance Sheet at March 31, 2008. In addition, each holder of the 3/4% Notes may require the Company to purchase all or a portion of their 3/4% Notes on December 22, 2013, on December 22, 2018 or upon the occurrence of a change of control (as defined in the Indenture governing the 3/4% Notes) at a price equal to the principal amount of 3/4% Notes being purchased plus any accrued and unpaid interest.next twelve months.
The Company pays cash interest at an annual rate of 3/4% of the principal amount at issuance, payable semi- annually on June 22 and December 22 of each year, which interest payments commenced on June 22, 2004. Debt issuance costs of $6.8 million are being amortized to interest expense over five years. The 3/4% Notes are subordinated to all existing and future senior indebtedness of the Company.
(1) In connection with the issuance of the 3/4% Notes, the Company purchased marketable securities totaling $7.9 million as security for the first ten scheduled interest payments due on the 3/4% Notes. The marketable securities, which consist of United States government securities, are reported at fair market value with unrealized gains and losses, net of income taxes, recorded in "Accumulated other comprehensive income, net of taxes" as a separate component of the stockholders' equity on the Consolidated Balance Sheets. At March 31, 2008, the Company had $1.7 million classified as restricted marketable securities due within one year, consisting of United States government securities that served as such collateral.
Convertible Bond Hedge and Warrant
Concurrent with the issuance of the 3/4% Notes, the Company entered into a convertible bond hedge transaction with an affiliate of one of the initial purchasers of the 3/4% Notes. Under the convertible bond hedge arrangement, the counterparty agreed to sell to the Company up to 19.2 million shares of the Company's common stock, which is the number of shares issuable upon conversion of theCompany’s
F-25
ADAPTEC, INC.
NOTES TO CONSOLIDATED FINANCIAL STATEMENTS (Continued)
(Unaudited)
Note 8. 3/4% Notes in full,(Continued)
common stock at a price of $11.704 per share. The convertible bond hedge transaction may be settled at the Company's option, either in cash or net shares, and expires in December 2008. Settlement of the convertible bond hedge in net shares on the expiration date would result in the Company receiving a number of shares of its common stock with a value equal to the amount otherwise receivable on cash settlement. Should there be an early unwind of the convertible bond hedge transaction, the amount of cash or net shares potentially received by the Company will depend upon then existing overall market conditions, and on the Company's stock price, the volatility of the Company's stock and the amount of time remaining on the convertible bond hedge. The convertible bond hedge transaction cost of $64.1 million has beenwas accounted for as an equity transactiontransaction. The Company did not receive net shares or cash from the convertible bond hedge as this instrument had no value and expired in accordance with EITF No. 00-19.December 2008.
During the fourth quarter ofIn fiscal 2004, in conjunction with the issuance of the 3/4% Notes, the Company received $30.4 million from the issuance to an affiliate of one of the initial purchasers of the 3/4% Notes of a warrant to purchase up to 19.2 million shares of the Company'sCompany’s common stock at an exercise price of $18.56 per share. The warrant expires in December 2008. At expiration, the Company may, at its option, elect to settle the warrants on a net share basis or for cash. As of March 31, 2008, the warrant hadnot been exercised and remained outstanding. The warrant was valued using the Black-Scholes valuation model using a volatility rate of 42%, risk-free interest rate of 3.6% and an expected life of 5 years. The value of the warrant of $30.4 million has beenwas classified as equity because it meets allequity. The warrant expired unexercised in December 2008.
Note 9. Employee Stock and Other Benefit Plans
Subsequent to the equity classification criteria of EITF No. 00-19. The separate warrant and convertible bond hedge transactions have the potential of limiting the dilution associated with the conversionCompany’s fiscal year-end, as a result of the 3/4% Notes from approximately 19.2signing of the Asset Purchase Agreement with PMC-Sierra related to the PMC Transaction, the Compensation Committee of the Board of Directors agreed to modify and accelerate substantially all employee unvested stock-based awards and anticipates paying cash bonuses of up to $3.0 million, to as few as 12.1 million shares.
3% Notes: In March 2002,the majority of which are contingent upon the consummation of the PMC Transaction (and none of which affect the Company’s current Interim President and CEO). This was done partially in recognition that the Company issued $250 million in aggregate principal amountwill not pay any annual incentive awards for fiscal 2011.The Company cannot quantify the impact of 3% Notes for net proceedsthe modification of $241.9 million. The 3% Notes were due on March 5, 2007 and have been repaid.
In fiscal 2007, the Company redeemed the outstanding $10.6 million balance ofstock-based compensation expense to its 3% Notes at par value. In fiscal 2006, the Company repurchased $24.6 million in aggregate principal amount of its 3% Notes on the open market for an aggregate price of $24.3 million, resulting in a loss on extinguishment of debt of $0.1 million (including unamortized debt issuance costs of $0.3 million). The loss on extinguishment of debt has been included in "Interest and other income" in the Consolidated Statements of Operations.Operations at this time. The Company also expects the future activity related to its stock benefit plans to be minimal and that the remaining unamortized stock-based compensation expense and the weighted-average period in which its stock-based awards are recognized will be negligible upon the consummation of the PMC Transaction due to the recognition of this expense upon consummation.
Note 8. Share-based Compensation
Stock Benefit Plans
The Company grants stock options and other stock-based awards to employees, directors and consultants under two equity incentive plans, the 2004 Equity Incentive Plan and the 2006 Director Plan. In addition, the Company has outstanding options issued under equity incentive plans that have terminated and equity plans that it assumed in connection with its previous acquisitions. The Company also enabled eligible employees to participate inmaintained its 1986 Employee Stock Purchase Plan whichuntil that plan expired in April 2006. These plans are described in further detail below.
Employee Stock Purchase Plan: The Company authorized 15,600,000 shares of common stock for issuance under the 1986 ESPP, which expired in April 2006. Under the ESPP, eligible employees were able to authorize payroll deductions of up to 10% of their salary to purchase shares of the Company's common stock at the lower of 85% of the market value of the common stock at the beginning of the 24 month offering period or at the end of each applicable six month purchase period. In fiscal 2008, the Company issued 0.4 million shares under the ESPP in connection with offering periods that remained in effect subsequent to the expiration of the plan.As of March 31, 2008, no shares remained available to be issued; therefore, there was no unamortized stock-based compensation expense related to shares issuable under the ESPP.
Equity Incentive Plans, including the 2004 Equity Incentive Plan, the 2000 Non-statutory Stock Option Plan, 1999 Stock Option Plan and 1990 Stock Option:Plan: In August 2004, the Company'sCompany’s Board of Directors and its stockholders approved the Company'sCompany’s 2004 Equity Incentive Plan and reserved for issuance thereunder 10,000,000 shares of the Company'sCompany’s common stock plus shares reserved but not issued under the Company'sCompany’s 2000 Non-statutory Stock Option Plan, 1999 Stock Option Plan and 1990 Stock Option Plan. The 2004 Equity Incentive Plan provides for the granting of incentive stock options, non-statutory stock options, restricted stock, stock awards, restricted stock units and stock appreciation rights to employees, employee directors and consultants. Stock options are subject to terms and conditions as determined by the Compensation Committee of the Company'sCompany’s Board of Directors. For new hires, 25% of the shares subject to stock options for new hires generally vest and become exercisable one year from the date of grant and the balance of the shares then vest quarterly thereafter for the next three years. Stock options expire seven years from the date of grant. The Company’s stockholders approved the amendment and restatement of its 2004 Equity Incentive Plan at the 2008 Annual Meeting of Stockholders. Amendments to the 2004 Equity Incentive Plan included (1) reducing the number of shares available for grant to 14,500,000; however, the reserve will be proportionately reduced if the Company’s Board of Directors chooses to effect a reverse stock split based on certain exchange ratios approved by the Company’s stockholders;
ADAPTEC, INC.
NOTES TO CONSOLIDATED FINANCIAL STATEMENTS (Continued)
(Unaudited)
Note 9. Employee Stock and Other Benefit Plans (Continued)
(2) removing the 5,000,000 share limitation with respect to stock-based awards granted at less than fair market value; (3) revising the categories of performance-related goals that may be applicable to stock-based awards granted under the plan; (4) removing the “single trigger” acceleration of vesting upon a change in control; and (5) modifying the definition of incumbent directors with respect to the definition of a change of control. As of March 31, 2008,2010, the Company had an aggregate of 28.520.1 million shares of its common stock reserved for issuance under its 2004 Equity Incentive Plan, of which 10.26.2 million shares arewere subject to outstanding options and restrictedother stock awards, and 20.013.9 million shares arewere available for future grants of options and other stock awards.
Director Stock Option Plans, including the 2006 Director Stock Option Plan, 2000 Director Stock Option Plan and 1990 Directors'Directors’ Stock Option Plan: In September 2006, the Company'sCompany’s Board of Directors and its stockholders approved the Company'sCompany’s 2006 Director Plan and reserved for issuance thereunder 1,200,000 shares of the Company'sCompany’s common stock plus shares reserved but not issued under the Company'sCompany’s 2000 Director Stock Option Plan and the 1990 Directors'Directors’ Stock Option Plan. The 2006 Director Plan provides for the granting of non-qualified stock options, restricted stock, restricted stock units and stock appreciation rights to non-employee directors. Although grants made under the 2006 Director Plan are discretionary, the Company expects thatCompany’s compensation program practice was as follows for fiscal 2010: (1) neweach non-employee directors will receive an option to purchase 32,500 shares of the Company's common stock, in which 25% of the shares subject to these stock options will vest and become exercisable one year from the date of grant and the balance of the shares will vest quarterly thereafter for the next three years, (2) existing non-employee directors will receivedirector received an option to purchase 12,500 shares of the Company'sCompany’s common stock on May 31st of each year, with such option vesting quarterly over one year (3) a newand, (2) each non-employee director will receive 16,250directors received 12,500 shares of restricted stock in which one-third of the shares will vest one year from the date of grant and quarterly thereafter for the next two years for the balance of the shares for initial grants and (4) existing non-employee directors will receive 6,250 shares of restricted stock on May 31st of each year, which will fully vest one year after the date of grant. StockHowever, both the option to purchase 12,500 shares of the Company’s common stock and 12,500 shares of restricted stock will vest immediately if the relationship between the Company and the non-employee director ceases for any reason. In addition, in fiscal 2010, the Company’s Board of Directors modified the vesting terms for all grants made prior to fiscal 2010 such that the options expire ten years fromto purchase the dateCompany’s stock and shares of grant.restricted stock will vest immediately if the relationship between the Company and the non-employee director ceases for any reason. As of March 31, 2008,2010, the Company had an aggregate of 2.12.0 million shares of its common stock reserved for issuance under its 2006 Director Plan, of which 0.60.4 million shares arewere subject to outstanding options and restrictedother stock awards, and 1.51.6 million shares arewere available for future grants. During the third quarter of fiscal 2008, the Company entered into an agreement with Steel Partners II, L.P. (the "Settlement Agreement") which included ending the election contest that was to occur at the Company's 2007 Annual Meeting of Stockholders (the "Annual Meeting"). Steel beneficially owned approximately 15% of the Company's common stock as of December 31, 2007. See Note 17 - Settlement with Steel Partners, L.L.C. and Steel Partners II, L.P. to the Consolidated Financial Statements for further discussion.
Assumed Stock Option Plans: The Company has assumed the stock option plans and the outstanding stock options of certain acquired companies, which includeincluding Snap Appliance, Inc. in fiscal 2005 and Eurologic Systems Group Limited (“Eurologic”) in fiscal 2004, Platys Communications, Inc. in fiscal 2002 and Distributed Processing Technology Corporation in fiscal 1999.2004. No further options may be granted under these assumed plans. However, options that were outstanding under these plans will continue to be governed by their existing terms and may be exercised for shares of the Company'sCompany’s common stock at any time prior to the expiration of the option term. As of March 31, 2008,2010, the Company had 0.1 millionminimal shares of common stock reserved that are subject to outstanding options under these assumed plans.
Stock-Based Compensation
On April 1, 2006,F-27
ADAPTEC, INC.
NOTES TO CONSOLIDATED FINANCIAL STATEMENTS (Continued)
(Unaudited)
Note 9. Employee Stock and Other Benefit Plans (Continued)
Stock Benefit Plans Activities
Equity Incentive Plans: A summary of option activity under all of the Company adopted the provisionsCompany’s equity incentive plans as of SFAS No. 123(R) using the modified prospective transition method, which requires the Company to measureMarch 31, 2010 and recognize compensation expense for all stock-based awards made to its employees and directors, including employee stock options, employee stock purchase plans, and other stock-based awards, based on estimated fair values. Accordingly, the Consolidated Statements of Operations forchanges during fiscal years 2008, 2009 and 2007 reflect2010 was as follows:
| Shares | Weighted Average Exercise Price | Weighted Average Remaining Contractual Term (Years) | Aggregate Intrinsic Value | ||||||||
| (in thousands, except exercise price and contractual terms) | |||||||||||
Outstanding at March 31, 2007 | 12,992 | $ | 7.11 | ||||||||
Granted | 544 | $ | 3.51 | ||||||||
Exercised | (605 | ) | $ | 3.29 | |||||||
Forfeited | (901 | ) | $ | 5.05 | |||||||
Expired | (3,051 | ) | $ | 9.10 | |||||||
Outstanding at March 31, 2008 | 8,979 | $ | 6.67 | ||||||||
Granted | 1,293 | $ | 3.45 | ||||||||
Exercised | (498 | ) | $ | 3.36 | |||||||
Forfeited | (792 | ) | $ | 4.78 | |||||||
Expired | (3,610 | ) | $ | 8.58 | |||||||
Outstanding at March 31, 2009 | 5,372 | $ | 5.21 | ||||||||
Granted | 1,584 | $ | 2.87 | ||||||||
Exercised | (182 | ) | $ | 2.46 | |||||||
Forfeited | (515 | ) | $ | 3.08 | |||||||
Expired | (1,377 | ) | $ | 7.78 | |||||||
Outstanding at March 31, 2010 | 4,882 | $ | 4.05 | 3.86 | $ | 594 | |||||
Options vested and expected to vest at March 31, 2010 | 4,655 | $ | 4.10 | 3.74 | $ | 512 | |||||
Options exercisable at | |||||||||||
March 31, 2008 | 7,118 | $ | 7.25 | ||||||||
March 31, 2009 | 3,763 | $ | 5.90 | ||||||||
March 31, 2010 | 3,844 | $ | 4.34 | 3.19 | $ | 252 | |||||
ADAPTEC, INC.
NOTES TO CONSOLIDATED FINANCIAL STATEMENTS (Continued)
(Unaudited)
Note 9. Employee Stock and Other Benefit Plans (Continued)
The aggregate intrinsic value is calculated as the impactdifference between the price of adopting SFAS No. 123(R). Under the modified prospective transition method prior periods are not revisedCompany’s common stock on The NASDAQ Global Market and the exercise price of the underlying awards for comparative purposes.
Stock-based compensation expense recognized inthe 1.5 million shares subject to options that were in-the-money at March 31, 2010. During fiscal years 20082010 and 2007 includes (a) stock-based award payments granted prior to, but not yet vested2009, the aggregate intrinsic value of options exercised under the Company’s equity incentive plans was $0.3 million for each period, determined as of April 1, 2006 based on the grant date fairof option exercise. During fiscal 2008, the aggregate intrinsic value estimated in accordance withof options exercised under the original provisions of SFAS No. 123, as adjusted for estimated forfeitures and (b) stock-based award payments granted subsequent to April 1, 2006, based on the grant-date fair value estimated in accordance with the provisions of SFAS No. 123(R). The Company recognized the stock-based compensation costs for all stock-based awardsusing a straight-line amortization method over the respective requisite service period of the awardsand adjusted it for estimated forfeitures.
The Company has elected to adopt the alternative transition method provided in FASB Staff Position 123(R)-3 for calculating the tax effects of stock-based compensation pursuant to SFAS No. 123(R). The alternative transition method includes simplified methods to establish the beginning balance of the additional paid in capital pool available to absorb tax deficiencies recognized subsequent to the adoption of SFAS No. 123(R). Tax deficiencies arise when actual tax benefits realized upon the exercise of stock options are less than the tax benefit recorded in the financial statements.
Company’s equity incentive plans was minimal. The following table summarizes information about the impactCompany’s options outstanding and exercisable equity incentive plans as of March 31, 2010:
| Options Outstanding | Options Exercisable | |||||||||||
Range of Exercise Prices | Number Outstanding | Weighted Average Remaining Contractual Life | Weighted Average Exercise Price | Number Outstanding | Weighted Average Exercise Price | |||||||
| (in thousands, except exercise price and contractual life) | ||||||||||||
$2.41 - $2.84 | 153 | 7.46 | $ | 2.74 | 71 | $ | 2.84 | |||||
$2.86 - $2.86 | 1,041 | 6.34 | $ | 2.86 | 410 | $ | 2.86 | |||||
$2.87 - $3.30 | 515 | 6.41 | $ | 3.11 | 324 | $ | 3.11 | |||||
$3.45 - $3.45 | 770 | 0.47 | $ | 3.45 | 770 | $ | 3.45 | |||||
$3.48 - $3.78 | 855 | 4.24 | $ | 3.69 | 747 | $ | 3.70 | |||||
$3.81 - $4.24 | 744 | 3.00 | $ | 4.08 | 718 | $ | 4.09 | |||||
$4.28 - $9.31 | 655 | 2.16 | $ | 6.17 | 655 | $ | 6.17 | |||||
$9.36 - $21.12 | 149 | 0.96 | $ | 12.71 | 149 | $ | 12.71 | |||||
$2.41 - $21.12 | 4,882 | 3.86 | $ | 4.05 | 3,844 | $ | 4.34 | |||||
As of March 31, 2010, the total unamortized stock-based compensation expense related to non-vested stock options, net of estimated forfeitures, was $1.1 million, and this expense is expected to be recognized over a remaining weighted-average period of 2.09 years.
Restricted Stock: Restricted stock awards and restricted stock units (collectively, “restricted stock”) have been granted under the Company’s 2004 Equity Incentive Plan and 2006 Director Plan. The Company’s right to repurchase shares of restricted stock awards lapses upon vesting, at which time the shares of restricted stock awards are released to the employees or directors. Restricted stock units are converted into common stock upon the release to the employees or directors upon vesting. Upon the vesting of restricted stock, the Company primarily uses the net share settlement approach, which withholds a portion of the adoptionshares to cover the applicable taxes. As of SFAS No. 123(R)March 31, 2010, there were 0.9 million shares of service-based restricted stock awards and 0.8 million shares of restricted stock units outstanding, all of which are subject to forfeiture if employment terminates prior to the release of restrictions, exclusive of certain change of control provisions. Under the 2004 Equity Incentive Plan, restrictions generally lapse in one of the following ways: (1) 50% one year from the date of grant and the remainder on the second anniversary of the grant date; (2) 100% one year from the date of grant; (3) 33–1/3% one year from the date of grant and the remainder on the second anniversary of the grant date; (4) 66–2/3% one year from the date of grant and the remainder on the second anniversary of the grant date or (5) upon meeting certain performance criteria after being evaluated over a specified period from the date of grant. Under the 2006 Director Plan, restrictions generally lapse one year from the date of grant for non-employee directors; however, restricted stock will vest immediately if the relationship between the Company and the non-employee director ceases for any reason. The cost of restricted stock, determined to be the fair market value of the shares at the date of grant, is expensed ratably over the period the restrictions lapse; except for those
F-29
ADAPTEC, INC.
NOTES TO CONSOLIDATED FINANCIAL STATEMENTS (Continued)
(Unaudited)
Note 9. Employee Stock and Other Benefit Plans (Continued)
restricted stock units that would vest over a specified period based upon meeting certain performance criteria from the date of grant, which would then be evaluated on a quarterly basis. Under the 2004 Equity Incentive Plan, the specified period for restricted stock units with performance-based vesting generally ranges from 18 months to 36 months. Of the 0.8 million shares of restricted stock units outstanding at March 31, 2010, 0.7 million represented restricted stock units with performance-based vesting. The Company assessed the probability of these performance criteria being achieved at March 31, 2010 and 2009 and determined its probability was remote. Therefore, the Company did not record any stock-based compensation expense associated with these restricted stock units with performance-based vesting in fiscal years 2010 and 2009.
A summary of activity for restricted stock as of March 31, 2010 and changes during fiscal years 2010, 2009 and 2008 was as follows:
| Shares | Weighted Average Grant-Date Fair Value | |||||
| (in thousands, except weighted average grant-date fair value) | ||||||
Non-vested stock at March 31, 2007 | 1,179 | $ | 4.37 | |||
Awarded | 1,949 | $ | 3.47 | |||
Vested | (544 | ) | $ | 4.37 | ||
Forfeited | (599 | ) | $ | 3.88 | ||
Non-vested stock at March 31, 2008 | 1,985 | $ | 3.64 | |||
Awarded | 2,146 | $ | 3.46 | |||
Vested | (1,105 | ) | $ | 3.68 | ||
Forfeited | (845 | ) | $ | 3.66 | ||
Non-vested stock at March 31, 2009 | 2,181 | $ | 3.43 | |||
Awarded | 1,811 | $ | 2.85 | |||
Vested | (1,258 | ) | $ | 3.64 | ||
Forfeited | (1,016 | ) | $ | 2.86 | ||
Non-vested stock at March 31, 2010 | 1,718 | $ | 3.01 | |||
All restricted stock was awarded at the par value of $0.001 per share. As of March 31, 2010, the total unrecognized compensation expense related to non-vested restricted stock that is expected to vest, net of estimated forfeitures, which is inclusive of the restricted stock units with performance-based vesting discussed above, was $2.8 million, and this expense is expected to be recognized over a remaining weighted-average period of 1.75 years.
ADAPTEC, INC.
NOTES TO CONSOLIDATED FINANCIAL STATEMENTS (Continued)
(Unaudited)
Note 9. Employee Stock and Other Benefit Plans (Continued)
Stock-Based Compensation
Stock-based compensation expense included in the Consolidated Statements of Operations for fiscal years 2010, 2009 and 2008 and 2007:
Years Ended March 31, ------------------------------------------ 2008 2007 -------------------- -------------------- (in thousands)Stock-based compensation expense by caption: Cost of revenues $ 380 $ 576 Research and development 2,577 3,753 Selling, marketing and administrative 3,671 4,144 -------------------- -------------------- Stock-based compensation expense effect on income from continuing operations, net of taxes $ 6,628 $ 8,473 ==================== ==================== Stock-based compensation expense by type of award: Stock options $ 2,272 $ 6,271 Restricted stock awards and restricted stock units 4,740 1,359 Employee stock purchase plan (1) (384) 843 -------------------- -------------------- Stock-based compensation expense effect on income from continuing operations, net of taxes $ 6,628 $ 8,473 ==================== ====================
__________________________were as follows:
(1) The Company recorded a reduction to expense for the employee stock purchase plan in fiscal 2008 based on (a) the actual purchases that occurred on August 14, 2007 and February 14, 2008 and (b) the fact that no new offering period exists, as the 1986 ESPP expired in April 2006.
| Years Ended March 31, | ||||||||||
| 2010(2) | 2009 | 2008 | ||||||||
| (in thousands) | ||||||||||
Stock-based compensation expense by caption: | ||||||||||
Cost of revenues | $ | 441 | $ | 382 | $ | 380 | ||||
Research and development | 1,567 | 252 | 2,205 | |||||||
Selling, marketing and administrative | 3,808 | 2,525 | 3,414 | |||||||
Stock-based compensation expense effect on loss from continuing operations, net of taxes(1) | $ | 5,816 | $ | 3,159 | $ | 5,999 | ||||
Stock-based compensation expense by type of award: | ||||||||||
Stock options | $ | 2,098 | $ | 1,104 | $ | 2,092 | ||||
Restricted stock awards and restricted stock units | 3,718 | 2,055 | 4,253 | |||||||
Employee stock purchase plan(3) | — | — | (346 | ) | ||||||
Stock-based compensation expense effect on loss from continuing operations, net of taxes(1) | $ | 5,816 | $ | 3,159 | $ | 5,999 | ||||
| (1) | The total stock-based compensation, net of taxes, recorded on the Consolidated Statements of Operations and Consolidated Statements of Cash Flows for fiscal years 2009 and 2008 differs from the Consolidated Statements of Stockholders’ Equity as the Consolidated Statements of Stockholders’ Equity includes both continuing and discontinued operations. |
| (2) | In fiscal 2010, the Company’s Consolidated Statements of Operations included additional compensation expense of $1.6 million relating to accelerated vesting of certain options and shares of restricted stock or extending the period to exercise stock options after termination. Of this amount, $1.0 million was attributable to options and $0.6 million was attributable to restricted stock. Of the $1.6 million additional compensation expense recorded in fiscal 2010, $0.9 million related to the modification of stock-based awards in connection with the Separation Agreement of Subramanian Sundaresh, the former CEO. |
| (3) | The Company recorded a credit to the Consolidated Statements of Operations for the Company’s 1986 Employee Stock Purchase Plan in fiscal 2008 based on (a) actual purchases that occurred on August 14, 2007 and February 14, 2008 and (b) the fact that no new offering period exists, as the Company’s 1986 Employee Stock Purchase Plan expired in April 2006. |
Stock-based compensation expense in the above table does not reflect any significant income taxes, which is consistent with the Company'sCompany’s treatment of income or loss from its United States operations. As a result of adopting SFAS No. 123(R) on April 1, 2006, the Company's net income (loss) for fiscal years 2008 and 2007 was lower by $6.6 million and $8.5 million, respectively, than if the Company had continued to account for share-based compensation under APB Opinion No. 25. The basic and diluted net loss per share for fiscal 2008 was $0.06 and $0.05 lower, respectively, than if the Company had continued to account for share-based compensation under APB Opinion No. 25. The basic and diluted net income per share for fiscal 2007 was $0.07 and $0.06 lower, respectively, than if the Company had continued to account for share-based compensation under APB Opinion No. 25.In addition, prior to adopting SFAS No. 123(R), the Company presented the tax benefits of stock option exercises as operating cash flows in the Consolidated Statements of Cash Flows; however, in accordance with SFAS No. 123(R), the tax benefits of stock option exercises are now classified as financing cash flows with a corresponding deduction from operating cash flows. For fiscal years 20082010, 2009 and 2007,2008, there was no income tax benefitbenefits realized for the tax deductions from option exercises of the share-basedstock-based payment arrangements; therefore, no amounts were reclassified from operating to financing cash flows.arrangements. In addition, there was no stock-based compensation costs capitalized as part of an asset in fiscal years 2010, 2009 and 2008 2007as the amounts were not material.
F-31
ADAPTEC, INC.
NOTES TO CONSOLIDATED FINANCIAL STATEMENTS (Continued)
(Unaudited)
Note 9. Employee Stock and 2006.Other Benefit Plans (Continued)
Prior to April 1, 2006, the Company accounted for stock-based compensation in accordance with APB Opinion No. 25 as interpreted by FIN 44, and complied with the disclosure provisions of SFAS No. 148, an amendment of SFAS No. 123. Under APB Opinion No. 25, compensation expense was recognized on the measurement date based on the excess, if any, of the fair value of the Company's common stock over the amount an employee must pay to acquire the common stock. The employee stock purchase plan was deemed non-compensatory under APB Opinion No. 25; therefore, no compensation cost was recorded in relation to the discount offered to employees for purchases made under the employee stock purchase plan. Under SFAS No. 123, compensation costs related to shares issued under ESPP offerings, restricted stock awards and assumed unvested acquisition-related stock options, determined to be the fair market value of the shares at the date of grant, have been recognized as compensation expense ratably over the respective vesting period. The following table illustrates the effect on net loss and net loss per share as if the Company had applied the fair value recognition provisions:
Year Ended March 31, 2006 -------------------- (in thousands, except per share amounts)Net loss, as reported $ (148,432) Add: Stock-based compensation expense previously determined under intrinsic value method, net of taxes 1,653 Deduct: Stockbased compensation expense determined under fair value based method, net of taxes (12,826) -------------------- Pro forma net loss $ (159,605) ==================== Basic net loss per share: As reported $ (1.31) Pro forma $ (1.41) Diluted net loss per share: As reported $ (1.31) Pro forma $ (1.41)
Valuation Assumptions
Upon adoption of SFAS No. 123(R), theThe Company selectedused the Black-Scholes option pricing model as the most appropriate model for determining the estimated fair value for stock-based awards. The use of the Black-Scholes model requires the use of extensive actual exercise behavior data and the use of a number of complex assumptions including expected volatility, risk-free interest rate, expected term, and expected dividends.
Beginning April 1, 2006, the Company'sThe Company’s policy is to estimate the volatility of its stock using historical volatility, as well as the implied volatility in market-traded options on its common stock in accordance with guidance in SFAS No. 123(R) and SAB 107. Management determined that a blend of implied volatility and historical volatility would be more reflective of market conditions and a better indicator of expected volatility than using purely historical volatility.stock. Given the lack of market data since April 1, 2006 relating to traded options in the Company'sCompany’s common stock, only historical volitilityvolatility has been used in the Company's FAS No. 123(R)Company’s stock-based fair value calculations. The Company will continue to monitor these and other relevant factors used to measure expected volatility for future option grants. Prior to the adoption of SFAS No. 123(R), the Company used its historical common stock price volatility in accordance with SFAS No. 123 for purposes of pro forma information disclosed in the notes to its consolidated financial statements for prior periods.
The risk-free interest rate assumption is based upon observed interest rates using the implied yield currently available on U.S. Treasury zero-coupon issues that is appropriate for the term of the Company'sCompany’s stock options.
The dividend yield assumption is based on the Company'sCompany’s history and expectation of dividend payouts. The Company has historically not paid dividends and has no foreseeable plans to issue dividends as it is the Company'sCompany’s current policy to reinvest earnings for its business.
The expected term of stock options represents the weighted-average period that the stock options are expected to remain outstanding. The Company derived the expected term assumption based on its historical settlement experience, while giving consideration to options that have life cycles less than the contractual terms and vesting schedules in accordance with guidance in SFAS No. 123(R) and SAB 107. Prior to the adoption of SFAS No. 123(R), the Company used its historical settlement experience to derive the expected term for purposes of pro forma information under SFAS No. 123, as disclosed in the notes to its consolidated financial statements for the related periods.vesting.
The fair value of the Company'sCompany’s outstanding stock options and other stock-based awards granted in fiscal years 2010, 2009 and 2008, was estimated using the following weighted-average assumptions:
Years Ended March 31, ---------------------------------------------- 2008 2007 2006 -------------- -------------- --------------Equity Incentive Plans: Expected life (in years) 4.3 4.1 2.6 Risk-free interest rates 3.02% 4.8 % 4.1 % Expected volatility 37 % 44 % 39 % Dividend yield -- -- -- Weighted average fair value $ 3.03 $ 2.63 $ 1.07 ESPP: Expected life (in years) n/a 1.00-1.25 1.2 Risk-free interest rates n/a 5.07 - 5.11% 3.8 % Expected volatility n/a 44 % 40 % Dividend yield n/a -- -- Weighted average fair value n/a $ 1.11 $ 3.01
| Years Ended March 31, | ||||||||||||
| 2010(1) | 2009 | 2008 | ||||||||||
Equity Incentive Plans: | ||||||||||||
Expected life (in years) | 4.0 | 4.4 | 4.3 | |||||||||
Risk-free interest rates | 2.2 | % | 2.7 | % | 3.7 | % | ||||||
Expected volatility | 49 | % | 38 | % | 38 | % | ||||||
Dividend yield | — | — | — | |||||||||
Weighted average fair value | ||||||||||||
Stock options | $ | 1.16 | $ | 1.21 | $ | 1.48 | ||||||
Restricted stock | $ | 2.86 | $ | 3.46 | $ | 3.47 | ||||||
The guidance in SFAS No. 123(R) is relatively new and the application of these principles may be subject to further interpretation and guidance.
| (1) | The stock option granted in fiscal 2010 were made primarily during the first half of fiscal 2010, which was prior to the announcement of the Company pursuing a potential sale or disposition of certain of its assets or business operations. As a result, the expected term reflects the weighted-average period that the stock options were expected to remain outstanding, which was determined at the time of grant. |
There are significant variations among allowable valuation models, and there is a possibility that the Company may adopt a different valuation model or refine the inputs and assumptions under its current valuation model in the future resulting in a lack of consistency in future periods. The Company'sCompany’s current or future valuation model and the inputs and assumptions it makes may also lack comparability to other companies that use different models, inputs, or assumptions, and the resulting differences in comparability could be material.
ADAPTEC, INC.
NOTES TO CONSOLIDATED FINANCIAL STATEMENTS (Continued)
(Unaudited)
Note 9. Employee Stock and Other Benefit Plans Activities(Continued)
Equity Incentive Plans: A summary of option activity
Other Benefit Plans
The Company has a defined contribution retirement plan under allSection 401(k) of the Company's equity incentive plans asInternal Revenue Code for eligible U.S. employees. The 401(k) allows participants to defer between 3% and 25% of March 31,their annual compensation for fiscal years 2008 and changes during2009 on a pre-tax basis and defer between 3% and 75% of their annual compensation for fiscal years 2006, 2007 and 2008 is presented below:
Weighted Average Weighted Remaining Average Contractual Aggregate Exercise Term Intrinsic Shares Price (Years) Value -------------- -------------- -------------- -------------- (in thousands, except exercise price and contractual terms)Outstanding at March 31, 2005 21,170 $ 10.49 Granted 7,954 $ 3.74 Exercised (1,530) $ 3.20 Forfeited and cancelled (7,652) $ 9.09 -------------- Outstanding at March 31, 2006 19,942 8.90 Granted 2,637 $ 4.41 Exercised (1,244) $ 3.52 Forfeited and cancelled (8,343) $ 11.07 -------------- Outstanding at March 31, 2007 12,992 $ 7.11 Granted 544 $ 3.51 Exercised (605) $ 3.29 Forfeited and cancelled (3,952) $ 8.18 -------------- Outstanding at March 31, 2008 8,979 $ 6.67 3.41 $ 128 ============== ============== ============== ============== Options vested and expected to vest at March 31, 2008 8,593 $ 6.78 3.30 $ 128 ============== ============== ============== ============== Options exercisable at March 31, 2006 13,531 $ 10.62 ============== ============== March 31, 2007 9,501 $ 7.84 ============== ============== March 31, 2008 7,118 $ 7.25 2.82 $ 126 ============== ============== ============== ==============
The aggregate intrinsic value is calculated as the difference between the exercise price of the underlying awards and the price of the Company's common stock2010 on The NASDAQ Global Market for the 0.2 million sharesa pre-tax basis, where were all subject to options that were in-the-moneythe statutory limits prescribed by the Internal Revenue Code. The Company matched employee contributions at March 31, 2008.a one to one ratio, with a maximum contribution of $2,000 per year per eligible employee. Effective January 1, 2008, the Company matches at a 50% rate for each dollar contributed by each eligible employee on their first $6,000 contributed during the calendar year. The Company may make additional variable matching contributions to eligible employees based on the Company’s performance. The matching contributions made by the Company are immediately vested. During fiscal years 2010, 2009 and 2008, 2007the Company’s contributions to the 401(k) plan were $0.4 million, $0.5 million and 2006,$0.5 million, respectively. The Company also maintains other benefit plans for its non-U.S. employees in which the Company contributed $0.2 million, $0.3 million and $0.4 million in fiscal years 2010, 2009 and 2008.
Common Stock Repurchase Program
In July 2008, the Company’s Board of Directors authorized a stock repurchase program to purchase up to $40 million of the Company’s common stock. During fiscal 2010, the Company purchased approximately 0.7 million shares of its common stock at an average price of $2.46 for an aggregate intrinsic valuepurchase price of options exercised$1.7 million, excluding brokerage commissions. During fiscal 2009, the Company purchased approximately 1.0 million shares of its common stock at an average price of $2.29 for an aggregate purchase price of $2.4 million, excluding brokerage commissions. The Company has accounted for these treasury shares, which have not been retired or reissued, under the Company's equity incentive plans was $0.04 million, $1.2 million and $3.5 million, respectively, determined as oftreasury method. All purchases made under the date of option exercise. The following table summarizes information aboutprogram were made in the Company's options outstanding and exercisable equity incentive plans as of March 31, 2008:
Options Outstanding Options Exercisable ----------------------------------------- ---------------------------- Weighted Average Weighted Weighted Number Remaining Average Number Average Range of Outstanding Contractual Exercise Outstanding Exercise Exercise Prices at 3/31/08 Life Price at 3/31/08 Price - -------------------- -------------- ------------ ------------ -------------- ------------ (in thousands, except exercise price and contractual life)$0.18 - $3.28 301 7.24 $ 2.63 66 $ 1.04 $3.31 - $3.45 1,835 2.54 3.45 1,804 3.45 $3.50 - $3.98 942 4.19 3.81 538 3.84 $4.01 - $4.40 905 5.46 4.21 503 4.21 $4.42 - $4.51 905 4.50 4.49 524 4.49 $4.52 - $6.30 1,159 4.39 5.78 828 5.81 $6.42 - $8.80 918 2.58 7.73 889 7.74 $8.82 - $12.50 973 1.84 11.25 925 11.35 $12.66 - $15.97 905 1.22 15.10 905 15.10 $16.25 - $16.25 136 3.08 21.66 136 21.66 -------------- -------------- 8,979 3.41 $ 6.67 7,118 $ 7.25 ============== ==============
open market. As of March 31, 2008, the total unamortized stock-based compensation expense related to non-vested stock options, net of estimated forfeitures, was $2.62010, $35.9 million and this expense is expected to be recognized over a remaining weighted- average period of 2.17 years. Compensation expensesremained available for all stock-based awards granted are recognized using the straight-line amortization method.
Restricted Stock Awards and Restricted Stock Units:Restricted stock awards and restricted stock units were grantedrepurchase under the Company's 2004 Equity Incentive Plan and 2006 Director Plan. The restrictedauthorized stock units are converted into shares of the Company's common stock upon vesting, while the Company's right to repurchase shares of restricted stock lapses upon vesting. As of March 31, 2008, there were 1.7 million shares of service-based restricted stock awards and 0.2 million restricted stock units outstanding, all of which are subject to forfeiture if employment terminates prior to the release of restrictions. Under the 2004 Equity Incentive Plan, restrictions generally lapse either (1) 50% one year from the date of grant and the remainder at the second anniversary or (2) 100% one year from the date of grant. Under the 2006 Director Plan, restrictions generally lapse (1) one year from the date of grant for existing non-employee directors or (2) one year from the date of grant with respect to one-third of the shares and quarterly thereafter for the next two years for the balance of the shares for initial grants to new non-employee directors. The cost of these awards, determined to be the fair market value of the shares at the date of grant, is expensed ratably over the period the restrictions lapse.program.
A summary of activity for restricted stock awards and restricted stock units as of March 31, 2008 and changes during fiscal years 2008, 2007 and 2006 is as follows:
Weighted Average Grant-Date Fair Shares Value -------------- -------------- (in thousands, except weighted average grant-date fair value)Nonvested stock at March 31, 2005 15 $ 7.92 Awarded -- -- Released (12) 7.94 Forfeited and cancelled (3) 7.85 -------------- Nonvested stock at March 31, 2006 -- $ -- Awarded 1,287 4.36 Released -- -- Forfeited and cancelled (108) 4.30 -------------- Nonvested stock at March 31, 2007 1,179 $ 4.37 Awarded 1,949 3.47 Released (544) 4.37 Forfeited and cancelled (599) 3.88 -------------- Nonvested stock at March 31, 2008 1,985 $ 3.64 ==============
All restricted stock awards were awarded at the par value of $0.001 per share. As of March 31, 2008, the total unrecognized compensation expense related to non-vested restricted stock awards and restricted stock units that are expected to vest, net of estimated forfeitures, was $3.3 million. This expense is expected to be recognized over a remaining weighted-average period of 0.75 years.
Note 9.10. Commitments and Contingencies
Operating Lease Obligations
The Company leases certain office facilities, vehicles, and equipment under operating lease agreements that expire at various dates through fiscal 2012.2014. As of March 31, 2008,2010, future minimum lease payments and future sublease income under non-cancelable operating leases and subleases were as follows:
Future Minimum Future Lease Sublease Payments Income ----------- ----------- (in thousands)2009 $ 5,012 $ 532 2010 4,135 151 2011 2,398 29 2012 1,331 -- 2013 and thereafter -- -- ----------- ----------- Total $ 12,876 $ 712 =========== ===========
| Future Minimum Lease Payments | Future Sublease Income | |||||
| (in thousands) | ||||||
2011 | $ | 2,329 | $ | 1,426 | ||
2012 | 913 | 797 | ||||
2013 | 107 | 91 | ||||
2014 | 94 | — | ||||
2015 and thereafter | — | — | ||||
Total | $ | 3,443 | $ | 2,314 | ||
Net rent expense was approximately $3.6$1.0 million, $2.5$1.5 million and $3.5$3.6 million during fiscal years 2008, 20072010, 2009 and 2006,2008, respectively.
F-33
ADAPTEC, INC.
NOTES TO CONSOLIDATED FINANCIAL STATEMENTS (Continued)
(Unaudited)
Note 10. Commitments and Contingencies (Continued)
As part of the PMC Transaction , PMC-Sierra has agreed to assume the obligations for certain of the Company’s leased facilities, primarily related to its international sites, if the transaction is consummated.
Purchase Obligations
Purchase obligations relate to the Company’s contractual commitments to purchase goods or services. At March 31, 2010, the Company’s purchase obligations aggregated $12.4 million, which was based on the Company’s current needs and the Company’s expectations that its vendors will fulfill these orders in fiscal 2011.
In July 2008, the Company entered into a three-year strategic development agreement with HCL Technologies Limited, (“HCL”), to provide product development and engineering services for its product portfolio. Under the terms of the agreement, HCL agreed to employ certain of the Company’s former engineering employees, who will work exclusively on the Company’s engineering projects. In connection with this agreement, the Company incurred costs of $2.4 million and $1.7 million in fiscal years 2010 and 2009, respectively, and has recorded these amounts within “Research and development expense” in the Consolidated Statements of Operations. The Company was previously subject to IRS audits for its fiscal years 1994 through 2003. During the third quarter of fiscal 2007, the Company reached resolution with the United States taxing authorities on all outstanding audit issues relating to those fiscal years. However, the Company's tax provision continues to reflect judgment and estimation regarding components of the settlement such as interest calculations and the application of the settlements to state and local taxing jurisdictions. Although the Company believes its tax estimates are reasonable, the ultimate tax outcome may materially differ from the tax amounts recorded in its consolidated financial statements and may cause a higher effective tax rate that could materially affect its income tax provision, results of operations or cash flows in the period or periods for which such determination is made. The IRS is currently auditing the Company's Federal income tax returns for the fiscal 2004 through 2006 audit cycle. The Company believes that it has provided sufficient tax provisions for these years and the ultimate outcome of the IRS audits will not have a material adverse impact on its financial position or results of operations in future periods. However, the Company cannot predict with certainty how these matters will be resolved and whether it will be requiredcommitted to make additional tax payments.payments up to $2.9 million through fiscal 2012, of which $2.1 million is expected to be due in fiscal 2011 and the remaining $0.8 million is expected to be due in fiscal 2012. However, this agreement will be transferred to PMC-Sierra assuming the PMC Transaction is consummated.
Legal Proceedings
The Company is a party to other litigation matters and claims, including those related to intellectual property, which are normal in the course of its operations, and while the results of such litigation matters and claims cannot be predicted with certainty, the Company believes that the final outcome of such matters will not have a material adverse impact on its financial position or results of operations. However, because of the nature and inherent uncertainties of litigation, should the outcome of these actions be unfavorable, the Company'sCompany’s business, financial condition, results of operations and cash flows could be materially and adversely affected.
In connection with the Company'sCompany’s acquisitions of Snap Appliance,Aristos and Eurologic, Elipsan Limited ("Elipsan"), and Platys Communications, Inc. ("Platys"), portionsa portion of the respective purchase priceprices and other future payments totaling $6.7 million, $3.8 million, $2.0$4.3 million and $15.0$3.8 million, respectively, were held back (the "Holdbacks"“Holdbacks”) to secure potential indemnification obligations of Aristos and Eurologic stockholders for unknown liabilities that may have existed as of theeach acquisition dates. Asdate. The Aristos Holdback of March 31, 2008,$4.3 million was paid in full in fiscal 2010. In fiscal 2009, the Company assertedresolved the remaining disputed, outstanding claims against the Eurologic Holdback, totaling $1.5by entering into a deed of indemnity and a written settlement agreement with the representative of the Eurologic stockholders, which resulted in an additional payment of $1.3 million. InThe Company’s initial payment of $2.3 million to the Eurologic stockholders was recorded in fiscal 2007,2005. The remaining Eurologic Holdback balance of $0.2 million was retained by the Company resolved all outstanding claims againstand was recognized as a gain in fiscal 2009 in “Loss from discontinued operations, net of taxes” in the Snap Appliance HoldbackConsolidated Statements of Operations.
Risks and Uncertainties
In December 2009, the Company announced that it initiated a process to pursue the potential sale or disposition of certain of its assets or business operations. On May 8, 2010, subsequent to its fiscal year-end, the Company entered into an agreement relating to the PMC Transaction and the Platys Holdback.Company anticipates that the PMC Transaction will be consummated in June 2010. Whether or not the PMC Transaction is consummated, the Company’s revenues may be negatively impacted during the pre-closing period as it creates uncertainty in the marketplace for the Company’s existing customers or end-users, who may be less likely to place orders as a
ADAPTEC, INC.
NOTES TO CONSOLIDATED FINANCIAL STATEMENTS (Continued)
(Unaudited)
Note 10. Commitments and Contingencies (Continued)
result of this uncertainty. If the Company consummates the PMC Transaction, it may incur significant charges in the future, which charges include, but are not limited to, increased amortization or depreciation of its long-lived assets due to potential changes to the expected remaining useful lives, potential impairment of its long-lived assets, restructuring charges, acceleration of compensation expense related to unvested stock-based awards, potential cash bonus payments and potential accelerated payments of certain of its contractual obligation, which may impact its results of operations and financial condition. The Elipsan Holdbackaggregate of $2.0these amounts cannot be quantified at this time. However, further subsequent event disclosures related to expected changes to the remaining useful lives of our long-lived assets, stock-based activity and associated compensation expense, and restructuring charges are discussed in Note 7, 9 and 11, respectively, to the Consolidated Financial Statements. The Company also recorded certain compensation costs of $1.1 million within “Accrued liabilities” on its Consolidated Balance Sheets at March 31, 2010, related to the expected payments based on the probability that specified objectives will be achieved, including objectives related to the potential sale or other disposition of certain of its assets and business operations based on a portionconsulting service agreement that the Company entered into with Subramanian Sundaresh, the Company’s former CEO, and other contractual arrangements with certain members of the Snap Appliance Holdback were paid in fiscal 2006.management and executive officers.
Note 10.11. Restructuring Charges
DuringSubsequent to the Company’s fiscal year-end, the Company approved a restructuring plan to reduce its operating expenses. The Company expects to complete its actions by December 2010, which is primarily contingent upon the consummation of the PMC Transaction, including the expected transition services the Company is required to provide to PMC-Sierra. The restructuring charges to be incurred will primarily result in cash expenditures related to severance and related benefits, and to a lesser extent, exiting certain operating facilities and disposing excess assets. In an effort to continue saving operational costs s, the Company notified certain of its engineering employees and provided them one-time severance benefits of approximately $1.8 million, which is expected to be recorded in the first quarter of fiscal 2011, as the Company intends to outsource its ASIC and silicon needs. The Company cannot quantify the remaining impact of this restructuring plan to its Consolidated Statements of Operations at this time as the remaining restructuring actions are contingent upon the consummation of the PMC Transaction.
The Company implemented several restructuring plans during fiscal years 2010, 2009 and 2008 2007 and 2006, the Company recorded restructuring charges of $1.6 million, $6.1 million and $6.3 million, $3.7respectively. The goal of these plans was to bring its operational expenses to appropriate levels relative to its net revenues, while simultaneously implementing extensive company-wide expense-control programs.
The restructuring charges of $1.6 million recorded in fiscal 2010 primarily related to the restructuring plan implemented during the fiscal year with minimal adjustments related to prior fiscal years’ restructuring plans. Of the $6.1 million recorded in fiscal 2009, $5.9 million related to restructuring charges for plans implemented in fiscal 2009 and $10.4$0.2 million respectively.related to adjustments made for prior fiscal years’ restructuring plans due to additional lease costs for facilities it had previously consolidated. Of the $6.3 million recorded in fiscal 2008, $6.7 million related to restructuring charges for plans implemented in fiscal 2008 and $(0.4) million in adjustments related to adjustments made for prior fiscal years'years’ restructuring plans asdue to actual results werebeing lower than anticipated.All expenses, including adjustments, associated with the Company'sCompany’s restructuring plans are included in "Restructuring charges"“Restructuring charges” in the Consolidated Statements of Operations and are not allocated to segments, but rather managed at the corporate level. The restructuring plans are discussed in detail below.
F-35
ADAPTEC, INC.
NOTES TO CONSOLIDATED FINANCIAL STATEMENTS (Continued)
(Unaudited)
Note 11. Restructuring Charges (Continued)
Fiscal 2010 Restructuring Plan
In the third quarter of fiscal 2010, the Company committed to a new restructuring plan to better align its operating costs with the continued decline in its net revenues, resulting in a restructuring charge of $1.6 million in fiscal 2010. The Company reduced its workforce primarily in the general administrative functions and provided severance and related benefits of $1.4 million. The Company also consolidated its facilities further and incurred a net estimated loss of $0.2 million for vacating the premises.
The following table sets forth the activity in the accrued restructuring balances related to the restructuring plan implemented in fiscal year 2010:
| Severance And Benefits | Other Charges | Total | ||||||||||
| (in thousands) | ||||||||||||
Charges for Fiscal 2010 Restructuring Plans | $ | 1,435 | $ | 220 | $ | 1,655 | ||||||
Cash paid | (1,355 | ) | (124 | ) | (1,479 | ) | ||||||
Accrual balance at March 31, 2010 | 80 | 96 | 176 | |||||||||
The Company anticipates that the remaining restructuring severance and benefits accrual balance of $0.1 million at March 31, 2010 will be substantially paid out by the end of the first quarter of fiscal 2011, while the remaining restructuring other charges of $0.1 million, relating primarily to leases obligations, will be paid out through the third quarter of fiscal 2011, which was reflected in “Accrued and other liabilities” in the Consolidated Balance Sheets.
Fiscal 2009 Restructuring Plans
In the first quarter of fiscal 2009, the Company approved and initiated a restructuring plan to (1) reduce its operating expenses due to a declining revenue base, (2) streamline its operations and (3) better align its resources with its strategic business objectives, resulting in a restructuring charge of $3.8 million in fiscal 2009. This restructuring plan included workforce reductions in all functions of the organization worldwide and consolidation of its facilities, which resulted in restructuring charges of $3.0 million and $0.8 million, respectively. Of the $3.8 million recorded in fiscal 2009 related to this restructuring plan, $0.3 million was recorded in the fourth quarter of fiscal 2009, related to accrual adjustments for the additional estimated loss on the Company’s facilities and disposing of duplicative assets.
In the third quarter of fiscal 2009, the Company initiated additional actions to reduce expenses as its business began to be impacted by the deterioration of macroeconomic conditions, resulting in a restructuring charge of $2.1 million in fiscal 2009 related to severance and benefits for employee reductions primarily in sales, marketing and administrative functions.
ADAPTEC, INC.
NOTES TO CONSOLIDATED FINANCIAL STATEMENTS (Continued)
(Unaudited)
Note 11. Restructuring Charges (Continued)
The following table sets forth the activity in the accrued restructuring balances related to the restructuring plans implemented in fiscal year 2009:
| Severance And Benefits | Other Charges | Total | ||||||||||
| (in thousands) | ||||||||||||
Charges for Fiscal 2009 Restructuring Plans | $ | 5,186 | $ | 354 | $ | 5,540 | ||||||
Accrual adjustments | (54 | ) | 395 | 341 | ||||||||
Non-cash utilization | — | (124 | ) | (124 | ) | |||||||
Cash paid | (4,046 | ) | (455 | ) | (4,501 | ) | ||||||
Accrual balance at March 31, 2009 | 1,086 | 170 | 1,256 | |||||||||
Accrual adjustments | (16 | ) | — | (16 | ) | |||||||
Cash paid | (1,070 | ) | (157 | ) | (1,227 | ) | ||||||
Accrual balance at March 31, 2010 | $ | — | $ | 13 | $ | 13 | ||||||
The Company anticipates that the remaining restructuring at March 31, 2010, relating primarily to leases obligations, will be paid out through the first quarter of fiscal 2011, which was reflected in “Accrued and other liabilities” in the Consolidated Balance Sheets.
Fiscal 2008 Restructuring Plans
In the first quarter of fiscal 2008, managementthe Company approved and initiated a plan to restructure the Company'sits operations to reduce the Company'sCompany’s operating expenses due to a declining revenue base by eliminating duplicative resources in all functions of the organization worldwide, resulting in a restructuring charge of $1.5 million related to severance and benefits for employee reductions.
In the second quarter of fiscal 2008, the Company initiated additional actions in an effort to better align its cost structure with its anticipated OEM revenue stream and to improve the Company'sCompany’s results of operations and cash flows. The total costflows, resulting in a restructuring charge of $5.2 million in fiscal 2008. This restructuring plan included workforce reductions and consolidation of its facilities, which resulted in restructuring charges of $3.9 million and $1.3 million, respectively. During fiscal 2009, the Company incurred for thisrecorded adjustments to the fiscal 2008 restructuring plan was $5.2 million,accrual of which it recorded approximately $3.5 million in the second quarter of fiscal 2008, $0.9 million in the third quarter of fiscal 2008 and $0.8 million in the fourth quarter of fiscal 2008.
Of the $6.7 million of plans implemented and recorded in fiscal 2008, $5.4$0.2 million related to severance and benefits for employee reductions primarily related to the Company's OEM engineering resources and related support and service organizations worldwide and $1.3 million related to vacating redundant facilities and contract termination costs.additional estimated loss on the Company’s facilities.
The following table sets forth the activity in the accrued restructuring balances related to the restructuring plans implemented in fiscal year 2008:
(Continued)Severance And Other Benefits
Severance
And
BenefitsOther
ChargesTotal (in thousands) Charges for Fiscal 2008 Restructuring Plans
$ 5,375 $ 1,289 $ 6,664 Non-cash utilization
— (151 ) (151 ) Cash paid
(5,354 ) (210 ) (5,564 ) Accrual balance at March 31, 2008
21 928 949 Accrual adjustments
(14 ) 195 181 Cash paid
(7 ) (721 ) (728 ) Accrual balance at March 31, 2009
— 402 402 Accrual adjustments
— (14 ) (14 ) Cash paid
— (378 ) (378 ) Accrual balance at March 31, 2010
$ — $ 10 $ 10 F-37
ADAPTEC, INC.
NOTES TO CONSOLIDATED FINANCIAL STATEMENTS (Continued)
(Unaudited)
Note 11. Restructuring Charges
Total ------------ ------------ ------------ (in thousands)Restructuring charge $ 5,375 $ 1,289 $ 6,664 Non-cash utilization -- (151) (151) Cash paid (5,354) (210) (5,564) ------------ ------------ ------------ Accrual balance at March 31, 2008 $ 21 $ 928 $ 949 ============ ============ ============
The Company anticipates that the remaining restructuring accrual balance of $0.9 million,at March 31, 2010, relating primarily to long-term leases,lease obligations, will be paid out through the first quarter of fiscal 2011. The remaining restructuring accrual balance is2011, which was reflected in "Accrued“Accrued and other liabilities" and "Other long-term liabilities"liabilities” in the Consolidated Balance Sheets.
Previous Restructuring PlansFiscal 2007 Restructuring PlansIn the first and second quarters of fiscal 2007, management approved and initiated plans to restructure the Company's operations by simplifying its infrastructure. These restructuring plans eliminated certain duplicative assets and resources in all functions of the organization worldwide due to consolidating certain processes in order to reduce its cost structure, which resulted in a charge of $3.9 million in fiscal 2007. In addition, the Company recorded minimal provision adjustments related to asset impairments, which were partially offset by a reduction for benefits as actual results were lower than anticipated. During fiscal 2008, the Company recorded adjustments to the fiscal 2007 restructuring plan accrual of $(0.2) million related to the reduction for benefits, as actual results were lower than anticipated. As of March 31, 2008, the Company had utilized all of these charges and the plans are now complete.Fiscal 2006 Restructuring PlansIn the third and fourth quarters of fiscal 2006, management approved and initiated plans to restructure the Company's operations by simplifying the Company's infrastructure. These restructuring plans eliminated certain duplicative resources in all functions of the organization worldwide, due in part, to the discontinued operations, the vacating of redundant facilities in order to reduce the Company's coststructure, and the sale of the Company's Singapore manufacturing facility. This resulted in a restructuring charge of $9.8 million in fiscal 2006 and minimal provision adjustments in fiscal 2007, as actual results for severance and benefits were lower than anticipated. In fiscal 2008, the Company recorded adjustments to the fiscal 2006 restructuring plan accrual of $(0.1) million, as actual results for severance and benefits and vacating redundant facilities were lower than anticipated. As of March 31, 2008, the Company had utilized all of these charges and the plans are now complete.
In each quarter of fiscal 2005, the CompanyThe Company’s management implemented several restructuring plans prior to streamline the corporate organization, thereby reducing operating costs by consolidating duplicative resources in connection with the acquisition of Snap Appliance and the strategic alliance with Vitesse Semiconductor Corporation ("Vitesse") and costs pertaining to estimated future obligations for non-cancelable lease payments for excess facilities in Germany and United Kingdom.During fiscal 2006, the Company recorded adjustments to the fiscal 2005 restructuring plans of $(0.4) million related to the reduction for benefits, as actual results were lower than anticipated and a reduction of lease costs related to the estimated loss on the Company's facilities. As of March 31, 2006, the Company had utilized all of these charges and the plans are now complete.
In fiscal years 2003, 2002 and 2001, the Company's management implemented restructuring plans2008 to reduce expenses, streamline operations, and improve operating efficiencies.efficiencies and simplify its infrastructure, which included employee reductions and consolidation of facilities. The Company has substantially completed its execution of these plans. The remainingplans prior to fiscal 2008. Any residual accrual balancebalances after fiscal 2008 primarily related to the estimated loss on facilities that the Company subleased in Florida and California through April 2008, the end of the lease term.terms. The estimated loss representsrepresented the estimated future obligations for the non- cancelablenon-cancelable lease payments, net of the estimated future sublease income. During fiscal years 2008, 20072009 and 2006,2008, the Company recorded adjustments to these plans for $(0.1) million, $(0.2) million and $0.8$(0.4) million, respectively.
The following table sets forth the activity in the accrued restructuring balances related to the fiscal years 2003, 2002 and 2001 restructuring plans for lease obligations at As of March 31, 2008, 20072009, the Company had utilized all of the charges and fiscal 2006:
FY 2003 FY 2002 FY 2001 Restructuring Restructuring Restructuring Plan Plan Plan Total -------------- -------------- -------------- --------- (in thousands)Accrual balance at March 31, 2005 $ 56 $ 271 $ 966 $ 1,293 Provision adjustment 154 411 238 803 Cash paid (96) (290) (663) (1,049) -------------- -------------- -------------- --------- Accrual balance at March 31, 2006 $ 114 $ 392 $ 541 $ 1,047 Provision adjustment 8 (107) (115) (214) Cash paid (94) (199) (234) (527) -------------- -------------- -------------- --------- Accrual balance at March 31, 2007 28 86 192 306 Provision adjustment -- -- (70) (70) Cash paid (5) (14) (103) (122) -------------- -------------- -------------- --------- Accrual balance at March 31, 2008 $ 23 $ 72 $ 19 $ 114 ============== ============== ============== =========
the plans are now complete.
The Company anticipates that the remaining restructuring accrual balance for fiscal years 2003, 2002 and 2001 restructuring plans of $0.1 million at March 31, 2008 will be substantially paid out by the first quarter of fiscal 2009. The remaining restructuring accrual balance is reflected in "Accrued and other liabilities" in the Consolidated Balance Sheets.
Previous Acquisition-Related Restructuring
During the first quarter ofIn fiscal 2006, in connection with one of its previous acquisitions, the Company finalized its Snap Appliance integration plan to integrate the acquired company’s operations to eliminate certain duplicative resources, including severance and related benefits in connection with the involuntary termination of approximately 24 employees, exiting duplicative facilities and disposing of duplicative assets. The acquisition-related restructuring liabilities of $6.7 million were accounted for under EITF No. 95-3 and therefore wereThis plan was initially included in the purchase price allocation.allocation of the acquired company. The severance and related benefits was paid by fiscal 2007. The remaining liability related to long-term lease obligations, in which the lease term ends in October 2011. Any further changes to the Company'sCompany’s finalized plan will be accounted for under SFAS No. 146 and will be recorded in "Restructuring charges"“Restructuring charges” in the Consolidated Statements of Operations. In the third quarter of fiscal 2006,2009, the Company recorded additional adjustments of $0.2 million, due to additional estimated loss related to theon these facilities that the Company subleased. As of March 31, 2008, the Company had utilized $5.2 million of these charges. The Company anticipates that the remaining restructuring accrual balance of $1.7 million will be paid out by the third quarter of fiscal 2012, related to long- term lease obligations.
The following table sets forth the activity in the accrued restructuring balance related to the Snap Applianceits previous acquisition-related restructuring plan for fiscal 2008, 20072010, 2009 and 2006:2008:
Severance And Other Benefits Charges Total ------------ ------------ ------------ (in thousands)Accrual
Other
Charges(in thousands) Accrual balance at March 31, 2007
$ 2,121 Cash paid
(385 ) Accrual balance at March 31, 2008
1,736 Accrual adjustments
214 Cash paid
(719 ) Accrual balance at March 31, 2009
1,231 Accrual adjustments
(17 ) Cash paid
(630 ) Accrual balance at March 31, 2010
$ 584 The Company anticipates that the remaining restructuring balance of $0.6 million at March 31,
2005 $ 155 $ 2,901 $ 3,056 Provision adjustment (49) 244 195 Cash2010, related to long- term lease obligations, will be paid(60) (656) (716) ------------ ------------ ------------ Accrualout through the third quarter of fiscal 2012. Of the remaining restructuring accrual balanceat March 31, 2006 $ 46 $ 2,489 $ 2,535 Cash paid (46) (368) (414) ------------ ------------ ------------ Accrual balance at March 31,of $0.6 million, $0.4 million was reflected in “Accrued and other liabilities” and $0.2 million was reflected in “Other long-term liabilities” in the Consolidated Balance Sheets.ADAPTEC, INC.
NOTES TO CONSOLIDATED FINANCIAL STATEMENTS (Continued)
(Unaudited)
Note 12. Other Gains, Net
In fiscal 2007,
-- 2,121 2,121 Cash paid -- (385) (385) ------------ ------------ ------------ Accrual balance at March 31, 2008 $ -- $ 1,736 $ 1,736 ============ ============ ============
Note 11. Other Charges (Gains)
Fiscal 2008 Other Charges (Gains)
Thethe Company decided to consolidate its properties in Milpitas, California to better align its business needs with existing operations and to provide more efficient use of its facilities. In May 2007, the Company completed the sale of certain of these properties that were previously classified as held for sale, with proceeds aggregating $19.9 million, exceeding its carrying value of $12.5 million. Net of selling costs, the Company recorded a gain of $6.7 million related toon the sale of certainthe properties in fiscal 2008 which was recorded in "Other charges (gains)"within “Other gains, net” in the Consolidated Statements of Operations.
In the fourth quarter of fiscal 2008, the Company also recorded an impairment charge of $2.4$2.2 million to write-off the remaining SSG intangible assets related to the Elipsan and Snap Appliance acquisitions. During fiscal 2008,acquisition due to a revision in its forecasts that resulted in expected negative long-term cash flows for the Companyfirst time and recorded a charge of $0.8 million related to third-party service costs associated with an acquisition that it did not complete.
Fiscal 2007 Other Charges (Gains)
The Companyincurred to evaluate strategic options. These charges were recorded asset impairment charges of $13.2 million related to certain acquisition-related intangible assets and $0.7 million for legal and consulting fees incurred in connection with its efforts that had been undertaken to sell the Snap Server portion of its systems business, which was recorded in "Other charges (gains)" in the Consolidated Statements of Operations in fiscal 2007.
The Company holds minority investments in certain non-public companies. The Company regularly monitors these minority investments for impairment and records reductions in the carrying values when the impairment is deemed to be other- than-temporary. Circumstances that indicate an other-than-temporary decline include the length of time and the extent to which the market value has been lower than cost. The Company recorded an impairment charge of $0.9 million in fiscal 2007 related to a decline in the value of a minority investment deemed to be other-than-temporary.
Fiscal 2006 Other Charges (Gains)
The Company recorded asset impairment charges of $10.0 million related to certain acquisition-related intangible assets. On December 23, 2005, the Company entered into a three-year contract manufacturing agreement with Sanmina-SCI whereby Sanmina-SCI, upon the closing of the transaction on January 9, 2006, assumed manufacturing operations of Adaptec products. In addition, the Company sold certain manufacturing assets, buildings and improvements and inventory located in Singapore to Sanmina-SCI for $26.6 million (net of closing costs of $0.6 million). In connection with this agreement, the Company recorded a loss on disposal of assets of $1.6 million that was recorded in fiscal 2006 in "Other charges (gains)"within “Other gains, net” in the Consolidated Statements of Operations.
Note 12.13. Interest and Other Income, Net
The components of interest and other income, net, for all periods presented were as follows:
Years Ended March 31, ---------------------------------------- 2008 2007 2006 ------------ ------------ ------------ (in thousands)Interest income $ 28,662 $ 24,362 $ 16,861 Loss
Years Ended March 31, 2010 2009 2008 (in thousands) Interest income
$ 8,496 $ 16,932 $ 28,662 Gain on sale of marketable equity securities
— 2,255 — Gain on sale of investments
440 — — Gain on settlement of class action suit
944 — — Gain on extinguishment of debt, net
— 1,643 — Realized currency transaction gains (losses)
399 (789 ) 2,550 Other
182 967 123 Interest and other income, net
$ 10,461 $ 21,008 $ 31,335 In fiscal 2010, the Company received $0.9 million from Micron Technology, Inc. as part of a class action settlement regarding DRAM antitrust matters and recorded a gain of $0.4 million from the sale of an investment in a non-controlling interest of a non-public company.
In fiscal 2009, the Company recorded a gain, net of selling costs, of $2.3 million on the sale of marketable equity securities of a publicly traded company.
In fiscal 2009, the Company repurchased a total of $191.0 million in principal amount of its 3/4% Notes on the open market for an aggregate price of $188.9 million, resulting in a gain on extinguishment of debt
net -- -- (79) Foreign currency transaction gains (losses) 2,550 963 (301) Other 123 293 1,140 ------------ ------------ ------------ Total $ 31,335 $ 25,618 $ 17,621 ============ ============ ============
of $1.7 million (net of unamortized debt issuance costs of $0.4 million). In addition, the majority of the remaining holders of the 3/4% Notes exercised their put option in December 2008, which required the Company to purchase its 3/4% Notes at a price equal to 100.25% of the principal of the 3/4% Notes, resulting in the redemption of the 3/4% Notes for an aggregate cost of $34.0 million, plus accrued and unpaid interest. See Note 13.8 to the Consolidated Financial Statements for further details.
F-39
ADAPTEC, INC.
NOTES TO CONSOLIDATED FINANCIAL STATEMENTS (Continued)
(Unaudited)
Note 14. Income Taxes
The components of loss from continuing operations before provision for (benefit from)benefit from (provision for) income taxes for all periods presented were as follows:
Years Ended March 31, ---------------------------------------- 2008 2007 2006 ------------ ------------ ------------ (in thousands)Loss from continuing operations before taxes: Domestic $ (6,488) $ (25,693) $ (100,872) Foreign (6,300) (13,165) (33,352) ------------ ------------ ------------ $ (12,788) $ (38,858) $ (134,224) ============ ============ ============
| Years Ended March 31, | ||||||||||||
| 2010 | 2009 | 2008 | ||||||||||
| (in thousands) | ||||||||||||
Loss from continuing operations before income taxes: | ||||||||||||
Domestic | $ | (24,462 | ) | $ | (14,394 | ) | $ | 953 | ||||
Foreign | 3,317 | (2,187 | ) | (6,300 | ) | |||||||
Total loss from continuing operations before income taxes | $ | (21,145 | ) | $ | (16,581 | ) | $ | (5,347 | ) | |||
The components of the provision for (benefit from)benefit from (provision for) income taxes from continuing operations for all periods presented were as follows:
Years Ended March 31, ---------------------------------------- 2008 2007 2006 ------------ ------------ ------------ (in thousands)Federal: Current $ (897) $ (51,610) $ 644 Deferred (2,348) -- 313 ------------ ------------ ------------ (3,245) (51,610) 957 ------------ ------------ ------------ Foreign: Current 190 (4,206) (594) Deferred 1,001 (79) (313) ------------ ------------ ------------ 1,191 (4,285) (907) ------------ ------------ ------------ State: Current (339) (7,809) 1,558 Deferred (301) -- -- ------------ ------------ ------------ (640) (7,809) 1,558 ------------ ------------ ------------ Provision for (benefit from) income taxes $ (2,694) $ (63,704) $ 1,608 ============ ============ ============
| Years Ended March 31, | |||||||||||
| 2010 | 2009 | 2008 | |||||||||
| (in thousands) | |||||||||||
Federal: | |||||||||||
Current | $ | 1,341 | $ | 344 | $ | 837 | |||||
Deferred | — | — | — | ||||||||
| 1,341 | 344 | 837 | |||||||||
Foreign: | |||||||||||
Current | 162 | 744 | (190 | ) | |||||||
Deferred | 1,018 | 6 | (1,001 | ) | |||||||
| 1,180 | 750 | (1,191 | ) | ||||||||
State: | |||||||||||
Current | (46 | ) | 1,511 | 329 | |||||||
Deferred | — | — | — | ||||||||
| (46 | ) | 1,511 | 329 | ||||||||
Benefit from (provision for) income taxes | $ | 2,475 | $ | 2,605 | $ | (25 | ) | ||||
The Company'sCompany’s effective tax rate differed from the federal statutory tax rate for all periods presented as follows:
Years Ended
Years Ended March 31, 2010 2009 2008 Federal statutory rate
35.0 % 35.0 % 35.0 % State taxes, net of federal benefit
(0.2 )% (0.6 )% (1.9 )% Foreign losses not benefited
(0.3 )% (18.7 )% (110.0 )% Changes in tax reserves
2.1 % 20.2 % 33.6 % OID Interest
— % 15.0 % 60.2 % Change in valuation allowance
(25.2 )% (2.5 )% 81.2 % Distributions from foreign subsidiaries
— % — % (72.3 )% Goodwill impairment charges
— % (35.8 )% — % Other permanent differences
0.3 % 3.1 % (26.3 )% Effective income tax rate
11.7 % 15.7 % (0.5 )% ADAPTEC, INC.
NOTES TO CONSOLIDATED FINANCIAL STATEMENTS (Continued)
(Unaudited)
Note 14. Income Taxes (Continued)
In fiscal 2010, the Company’s tax benefit included discrete tax benefits of $1.3 million related to additional tax refunds that became available to the Company during fiscal 2010 due to the enactment of the Worker, Homeownership and Business Act of 2009, which allowed for an extension of the net operating loss carryback period from two to five years for United States federal tax purposes. The Company also recorded discrete tax benefits of $4.4 million in fiscal 2010 primarily due to reaching final settlement with the German Tax Authorities for fiscal years 2001 through 2004 and the Singapore Tax Authorities for fiscal year 2001, reflecting the reversal of previously accrued liabilities and refunded tax amounts. This was partially offset by discrete tax expense of $3.6 million in fiscal 2010 primarily due to the on-going audits in its foreign jurisdictions.
In fiscal 2009, the Company recorded a net tax benefit of $1.4 million, which included the reversal of previously accrued liabilities related to reaching final settlement with the Singapore Tax Authorities for fiscal years 1998 through 2000 and the lapsing of the statute of limitations on a pre-acquisition tax issue related to Eurologic. This was offset by changes in judgment related to on-going audits in its foreign jurisdictions and new foreign tax issues that were identified, which included its tax exposures that pre-date its acquisition of ICP vortex Computersysteme GmbH (“ICP vortex”), resulting in increases in the Company’s liabilities for uncertain tax positions. Changes to the liabilities for uncertain tax benefits related to the Eurologic and ICP vortex items were recorded as part of the tax provision as opposed to adjusting amounts to purchase accounting as no goodwill or related intangible assets existed at March 31,
---------------------------------------- 2008 2007 2006 ------------ ------------ ------------Federal statutory rate (35.0)% (35.0)% (35.0)% State taxes, net2009, due to impairments or the full amortization offederal benefit 0.7 % (1.1)% 1.2 % Foreign subsidiary income at other thanintangible assets in previous fiscal years. In fiscal 2009, theU.S.Company also recorded a favorable taxrate -- % (15.0)% (8.7)% Foreign losses not benefited 46.0 % 12.3 % 16.9 % Changesimpact due from the state of California, including accrued and unpaid interest, of approximately $1.6 million due to notices received from the California Franchise Tax Board intax reserves (4.1)% (148.9)% 0.5 % OID Interest (25.2)% (11.8)% (3.2)% Stock-based compensation -- % (6.1)% -- % Change in valuation allowance (34.8)% 29.4 % 16.4 % Distributions from foreign subsidiaries 30.2 % -- % -- % Other permanent difference 1.1 % 12.3 % -1.3 % Acquisition related impairment charges -- % -- % 17.0 % Research and development credits -- % -- % (2.5)% Foreign repatriation -- % -- % (0.1)% ------------ ------------ ------------ Effective income tax rate (21.1)% (163.9)% 1.2 % ============ ============ ============
The Company's subsidiary in Singapore operated under a tax holiday through March 31, 2006. AsJanuary 2009 as a result of their review of the Company's divestiture of its manufacturing operationsCompany’s amended fiscal years 1994 through 2003 tax returns. These notices indicated that certain adjustments were to be made in Singapore,conjunction with adjustments made on the Company terminated itsCompany’s amended Federal tax holiday status and restructured its foreign operations and international tax structure. The Company does not expect these changes, in and of themselves,returns for those fiscal years, due to cause its worldwide effective tax rate to differ materially.
On October 22, 2004, the American Jobs Creation Act of 2004 (the "Act") was signed into law. The Act created a temporary incentive for U.S. companies to repatriate accumulated foreign earnings subject to certain limitations by providing a one-time deduction of 85% for certain dividends from controlled foreign corporations. In the fourth quarter of fiscal 2005, the Company repatriated $360.6 million of undistributed earnings from Singapore toreaching resolutions with the United States and incurredtaxing authorities on all outstanding audit issues, as further discussed below.
The Company has concluded its negotiations with the IRS taxing authorities with regard to its tax disputes for its fiscal years 1994 through 2006. In fiscal 2009, the IRS issued a tax liability of $17.6 million. The one-time deduction was allowedNo Change Report indicating no change to the extentCompany’s tax liability; however, the IRS continues to have the ability to adjust tax attributes relating to these years in subsequent audits. The Company believes that it has provided sufficient tax provisions for these years and that the repatriated amounts were used to fundultimate outcome of any future IRS audits that include the tax attributes will not have a qualified Domestic Reinvestment Plan, as required bymaterial adverse impact on its financial position or results of operations in future periods. The tax authorities in the Act. Ifforeign jurisdictions that the Company does not spend the repatriated fundsoperates in accordance withcontinue to audit its reinvestment plan,tax returns for fiscal years subsequent to 1999. The potential outcome of these audits is uncertain and could result in material tax provisions or benefits in future periods. However, the Company may incurcannot predict with certainty how these matters will be resolved and whether the Company will be required to make additional tax liabilities.payments and believes that it has provided sufficient tax provisions for the tax exposures in its foreign jurisdictions.
During
F-41
ADAPTEC, INC.
NOTES TO CONSOLIDATED FINANCIAL STATEMENTS (Continued)
(Unaudited)
Note 14. Income Taxes (Continued)
The significant components of the quarter endedCompany’s deferred tax assets and liabilities at March 31, 2008,2010 and 2009 were as follows:
| March 31, | ||||||||
| 2010 | 2009 | |||||||
| (in thousands) | ||||||||
Deferred tax assets: | ||||||||
Intangible assets | $ | 26,790 | $ | 29,141 | ||||
Net operating loss carryover | 53,424 | 60,816 | ||||||
Research and development tax credits | 29,440 | 28,003 | ||||||
Capitalized research and development | 6,291 | 7,786 | ||||||
Compensatory and other accruals | 9,847 | 8,603 | ||||||
Restructuring charges | 265 | 1,145 | ||||||
Foreign tax credits | 9,826 | 17,968 | ||||||
Deferred revenue | 1,051 | 552 | ||||||
Inventory reserves | 2,188 | 3,309 | ||||||
Uniform capitalization adjustment | 561 | 787 | ||||||
Fixed assets accrual | 1,456 | 1,463 | ||||||
Other, net | 1,454 | 1,544 | ||||||
Gross deferred tax assets | 142,593 | 161,117 | ||||||
Deferred tax liabilities: | ||||||||
Acquisition-related charges | (329 | ) | (337 | ) | ||||
Unremitted earnings | (59,144 | ) | (78,908 | ) | ||||
Fixed assets accrual | — | (2,327 | ) | |||||
Unrealized loss on investments | (1,000 | ) | (957 | ) | ||||
Gross deferred tax liabilities | (60,473 | ) | (82,529 | ) | ||||
Valuation allowance | (81,218 | ) | (75,948 | ) | ||||
Net deferred tax assets | $ | 902 | $ | 2,640 | ||||
The significant components of the Company’s deferred tax assets and liabilities at March 31, 2010 and 2009 were classified on its Consolidated Balance Sheets as follows:
| March 31, | ||||||||
| 2010 | 2009 | |||||||
| (in thousands) | ||||||||
Deferred tax assets: | ||||||||
Other current assets | $ | 5,089 | $ | 6,597 | ||||
Other long-term assets | 626 | 3,608 | ||||||
Total deferred tax assets | 5,715 | 10,205 | ||||||
Deferred tax liabilities: | ||||||||
Other long-term liabilities | (4,813 | ) | (7,565 | ) | ||||
Total deferred tax liabilities | (4,813 | ) | (7,565 | ) | ||||
Net deferred tax assets | $ | 902 | $ | 2,640 | ||||
F-42
ADAPTEC, INC.
NOTES TO CONSOLIDATED FINANCIAL STATEMENTS (Continued)
(Unaudited)
Note 14. Income Taxes (Continued)
The Company changed its assertion such thatcontinues to provide U.S. deferred income taxes and foreign earnings are no longer intended to be permanently reinvested. As a result,withholding taxes on our undistributed earnings. At March 31, 2010 and 2009, the Company recorded a deferred tax liability of $93.8$59.1 million and $78.9 million, respectively, related to the foreign undistributed earnings, which was offset by a reduction in the Company'sCompany’s valuation allowance against its deferred tax assets. There was no significant impact of the change in assertion on "provision for (benefit from) income taxes" in the Consolidated Statements of Operations.
The significant components of the Company's deferred tax assets and liabilities at March 31, 2008 and 2007 were as follows:
March 31, ------------------------ 2008 2007 ----------- ----------- (in thousands)Deferred tax assets: Intangible assets $ 41,214 $ 45,957 Research and development tax credits 25,782 34,854 Net operating loss carryover 31,422 15,435 Capitalized research and development 3,504 4,779 Compensatory and other accruals 8,890 5,743 Restructuring charges 1,010 1,162 Foreign tax credits 21,719 13,609 Deferred revenue 1,455 1,874 Inventory reserves 3,091 3,500 Uniform capitalization adjustment 363 1,010 Other, net 1,806 1,611 ----------- ----------- Gross deferred tax assets 140,256 129,534 ----------- ----------- Deferred tax liabilities: Acquisition-related charges (336) (3,553) Fixed assets accrual (1,014) (1,782) Unremitted earnings (93,831) -- Unrealized loss on investments (1,365) -- ----------- ----------- Gross deferred tax liability (96,546) (5,335) ----------- ----------- Valuation allowance (44,591) (124,070) ----------- ----------- Net deferred tax assets (liabilities) $ (881) $ 129 =========== ===========
The Company continuously monitors the circumstances impacting the expected realization of its deferred tax assets on a jurisdiction by jurisdiction basis. At March 31, 20082010 and 2007,2009, the Company'sCompany’s analysis of its deferred tax assets demonstrated that it was more likely than not that substantially all of its net U.S. deferred tax assets wouldwill not be realized, resulting in a full valuation allowance for deferred tax assets of $44.6$81.2 million and $124.1$75.9 million, respectively. This resulted in an increase to the valuation allowance by $5.3 million and $31.4 million during the years ended March 31, 2010 and 2009, respectively. Factors that led to this conclusion included, but were not limited to, the Company'sCompany’s past operating results, cumulative tax losses in the United States and uncertain future income on a jurisdiction by jurisdiction basis.
As of March 31, 2008,2010, the Company had net operating loss carryforwards of $85.1$149.7 million for federal and $121.7$174.7 million for state purposes that expire in various years beginning in 2019 for federal and 20162010 for state purposes. The Company had research and development credits of $19.6$30.1 million for federal purposes that expire in various years beginning in 2019 and $9.5credits of $17.5 million credits for state purposes that carry forward indefinitely until fully exhausted. The Company had foreign tax credits of $14.4$3.4 million that expire in various years beginning in 2009.2010. Of the federal net operating loss carryforwards, $9.9$10.2 million were related to stock option deductions, the tax benefit of which will be credited to additional paid-in capital when realized.
On April 1, 2007, theUncertainty in Income Taxes
The Company adopted FIN 48, which clarifies the accounting for uncertaintiesguidance regarding uncertain tax positions at the beginning of fiscal 2008, resulting in income taxes recognized in an enterprise's financial statements in accordance with SFAS No. 109. As a result of implementing FIN 48 on April 1, 2007, the Company recognized a cumulative effect adjustment of $1.3 million as a reduction to the beginning balance of "Retained earnings"“Retained earnings” reflected on its Consolidated Balance Sheets. At adoption, theStatements of Stockholders’ Equity. The Company had gross unrecognized tax benefits of $20.3 million, of which $6.3 million would impact the effective tax rate if recognized.
Following the adoption of FIN 48, the Company elected to recognizerecognizes interest and/or penalties related to uncertain tax positions within "provision for (benefit from)“Benefit from (provision for) income taxes"taxes” in the Company'sCompany’s Consolidated Statements of Operations, which is consistent with the Company's treatment of tax related interest and penalties prior to its adoption of FIN 48.
Operations. To the extent that accrued interest and penalties do not ultimately become payable, amounts accrued will be reduced and reflected as a reduction of the overall income tax provision in the period that such determination is made. The amount of interest and penalties accrued at April 1, 2007, upon the adoption of FIN 48, was immaterial. In addition, no material amount was accrued during fiscal 2008.years 2010, 2009 and 2008 was immaterial.
The following table summarizesA reconciliation of the activity relatedchanges to the Company'sCompany’s gross unrecognized tax benefits during thefor fiscal year:years 2010 and 2009 was as follows:
(In Thousands)Balance at April 1, 2007 (date of implementation) $ 20.325 Increases related to prior year tax positions 2,019 Decreases related to prior year tax positions (904) Increases related to current year tax positions 1,209 Decreases related to settlement with taxing authorities (1,139) - -------------------------------------------------- ------------- Balance at March 31, 2008 21,510 =============
| Years Ended March 31, | ||||||||||||
| 2010 | 2009 | 2008 | ||||||||||
| (in thousands) | ||||||||||||
Balance at beginning of period | $ | 27,779 | $ | 21,510 | $ | 20,325 | ||||||
Tax positions related to current year: | ||||||||||||
Additions | 430 | 1,534 | 1,209 | |||||||||
Tax positions related to prior years: | ||||||||||||
Additions | 423 | 6,854 | 2,019 | |||||||||
Reductions | (271 | ) | — | (904 | ) | |||||||
Settlements | (4,436 | ) | (1,319 | ) | (1,139 | ) | ||||||
Lapses in statutes of limitations | — | (800 | ) | — | ||||||||
Balance at end of period | $ | 23,925 | $ | 27,779 | $ | 21,510 | ||||||
F-43
ADAPTEC, INC.
NOTES TO CONSOLIDATED FINANCIAL STATEMENTS (Continued)
(Unaudited)
Note 14. Income Taxes (Continued)
As of March 31, 2008,2010, the Company’s total gross unrecognized tax benefits in the amountwere $23.9 million, of which $4.4 million, if recognized, would impactaffect the effective tax rate. There was an overall decrease of $3.9 million in the Company’s gross unrecognized tax benefits from fiscal 2009 to fiscal 2010 due to benefits from the Singapore and Germany audit settlements noted above, offset by changes in judgment related to foreign audits during fiscal 2010.
The Company is subject to U.S. federal income tax as well as income taxes in many U.S. states and foreign jurisdictions. As of March 31, 2008, tax2010, fiscal years 2004 through 2008onward remained open to examination by the U.S. federal taxing authorities taxand fiscal years 1994 through 2008 remained open to examination by U.S. state taxing authorities, tax years 1998 through 2008 remained open to examination in Singapore and tax years 2001 through 20081999 onward remained open to examination in various foreign jurisdictions. As a resultU.S. tax attributes generated in fiscal years 2004 onward also remain subject to adjustment in subsequent audits when they are utilized.
The calculation of unrecognized tax benefits involves dealing with uncertainties in the IRS's stated intent to closeapplication of complex global tax regulations. Management regularly assesses the fiscal 2004 through 2006 audit cycle as a "no change,"Company’s tax positions in light of legislative, bilateral tax treaty, regulatory and judicial developments in the countries in which the Company does business. Management believes that it is not reasonably possible that the Company's total gross unrecognized tax benefits will decrease by $3.3 million duringchange significantly within the next twelve months, none of which is expected to impact the Company's effective tax rate. The unrecognized tax benefits relate to the Company's US tax treatment of Original Issue Discount interest and cost shared equity compensation. Other than these amounts, the Company does not anticipate any significant change to its total unrecognized tax benefits during the next twelve12 months.
At March 31, 2008, the Company had a long term tax receivable balance of $2.8 million and a short term receivable of $4.6 million, primarily comprised of income taxes receivable from the IRS and foreign tax authorities. The Company's FIN 48 tax liability at March 31, 2008 was $4.4 million and is included within "Other long-term liabilities." In addition, the Company had short term deferred tax assets of $9.0 million, which was included within "Other current assets" and long-term deferred tax liabilities of $9.9 million. The net change in the Company's tax related assets and liabilities during fiscal 2008 were primarily the result of U.S. tax refunds received. Tax related liabilities are primarily composed of the accrual and release of income, withholding and transfer taxes accrued by the Company in the taxing jurisdictions in which it operates around the world, including, but not limited to, the United States, Singapore, Ireland, United Kingdom, Japan and Germany. The amount of the tax related assets and liabilities were based on management's evaluation of the Company's tax exposures in light of the complicated nature of the business transactions entered into by the Company in a global business environment.
During the quarter ended March 31, 2008, the Company changed its assertion such that foreign earnings are no longer intended to be permanently reinvested. As a result, the Company recorded a deferred tax liability of $93.8 million related to the foreign undistributed earnings, which was offset by a reduction in the Company's valuation allowance against its deferred tax assets. There was no significant impact of the change in assertion on "provision for (benefit from) income taxes" in the Consolidated Statements of Operations.
Note 14.15. Net Income (Loss)Loss Per Share
Basic net income (loss)loss per share is computed by dividing net income (loss)loss by the weighted average number of common shares outstanding during the period. Diluted net income (loss)loss per share gives effect to all potentially dilutive common shares outstanding during the period, which include certain stock-basedstock–based awards and warrants, calculated using the treasury stock method, and convertible notes which are potentially dilutive at certain earnings levels, and are computed using the if-converted method.
A reconciliation of the numerator and denominator of the basic and diluted income (loss)loss per share computations for continuing operations, discontinued operations and net income (loss)loss were as follows:
Loss Per Share (Continued)Years Ended March 31, ---------------------------------------- 2008 2007 2006 ------------ ------------ ------------ (in thousands, except per share amounts) Numerator:Income (loss) from continuing operations - basic $ (10,094) $ 24,846 $ (135,832) Income (loss) from discontinued operations - basic 479 5,997 (12,600) ------------ ------------ ------------
Years Ended March 31, 2010 2009 2008 (in thousands, except per share amounts) Numerator:
Loss from continuing operations, net of taxes—basic and diluted
$ (18,670 ) $ (13,976 ) $ (5,372 ) Income (loss) from discontinued operations, net of taxes—basic and diluted
1,236 3,786 (4,243 ) Net loss—basic and diluted
$ (17,434 ) $ (10,190 ) $ (9,615 ) Denominator:
Weighted average shares outstanding—basic
119,196 119,767 118,613 Effect of dilutive securities:
Employee stock awards and other
— — — 3/4% Notes
— — — Weighted average shares and potentially dilutive common shares outstanding—diluted
119,196 119,767 118,613 Basic and diluted income (loss) per share:
Loss from continuing operations, net of taxes
$ (0.16 ) $ (0.12 ) $ (0.05 ) Income (loss) from discontinued operations, net of taxes
$ 0.01 $ 0.03 $ (0.04 ) Net loss
$ (0.15 ) $ (0.09 ) $ (0.08 ) ADAPTEC, INC.
NOTES TO CONSOLIDATED FINANCIAL STATEMENTS (Continued)
(Unaudited)
Note 15. Net
income (loss) - basic $ (9,615) $ 30,843 (148,432) ------------ ------------ ------------Adjustment:Adjustment for interest expense on 3/4% Notes, net of taxes $ -- $ 3,062 $ -- ------------ ------------ ------------ Adjusted income (loss) from continuing operations - diluted $ (10,094) $ 27,908 $ (135,832) Adjusted income (loss) from discontinued operations - diluted 479 5,997 (12,600) ------------ ------------ ------------ Adjusted net income (loss) - diluted $ (9,615) $ 33,905 $ (148,432) ============ ============ ============ Denominator: Weighted average shares outstanding - basic 118,613 116,602 113,405 Effect of dilutive securities: Employee stock options and other -- 864 -- 3/4% Notes -- 19,224 -- ------------ ------------ ------------ Weighted average shares and potentially dilutive common shares outstanding - diluted 118,613 136,690 113,405 ============ ============ ============ Income (loss) per share: Basic: Continuing operations $ (0.09) $ 0.21 $ (1.20) Discontinued operations $ 0.00 $ 0.05 $ (0.11) Net income (loss) $ (0.08) $ 0.26 $ (1.31) Diluted: Continuing operations $ (0.09) $ 0.20 $ (1.20) Discontinued operations $ 0.00 $ 0.04 $ (0.11) Net income (loss) $ (0.08) $ 0.25 $ (1.31)
Diluted loss per share from continuing operations, discontinued operations and net loss for fiscal years 20082010, 2009 and 20062008 was based only on the weighted-average number of shares outstanding during each of the periods, as the inclusion of any common stock equivalents would have been anti-dilutive. In addition, certainAs a result, the same weighted-average number of common shares outstanding during each of those periods was used to calculate both the basic and diluted earnings per share. The potential common shares were excluded from the diluted computation from continuing operations, discontinued operations and net income for fiscal 2007 because their inclusion would have been anti-dilutive. The items excluded for fiscal years 2008, 20072010, 2009 and 20062008 were as follows:
Years Ended March 31, ---------------------------------------- 2008 2007 2006 ------------ ------------ ------------ (in thousands)Outstanding stock options 11,262 11,745 15,934 Outstanding restricted stock awards and units 1,730 2 -- Warrants (1) 19,724 19,871 19,874 3/4% Notes 19,224 -- 19,224 3% Notes -- 646 950
________________________
| Years Ended March 31, | ||||||
| 2010 | 2009 | 2008 | ||||
| (in thousands) | ||||||
Outstanding stock options | 5,557 | 6,881 | 11,262 | |||
Outstanding restricted stock | 2,296 | 1,951 | 1,730 | |||
Warrants(1) | 169 | 9,780 | 19,724 | |||
3/4% Notes | 34 | 9,293 | 19,224 | |||
(1) In connection with the issuance of its 3/4% Notes, the Company entered into a derivative financial instrument to repurchase up to 19,224,000 shares of its common stock, at the Company's
| (1) | In connection with the issuance of its 3/4% Notes, the Company entered into a derivative financial instrument to repurchase up to 19,224,000 shares of its common stock, at the Company’s option, at specified prices in the future to mitigate any potential dilution as a result of the conversion of the 3/4% Notes. However, this warrant expired unexercised in December 2008. See Note 8 to the Consolidated Financial Statements for further details. In addition, in connection with agreements entered into with IBM, the Company issued IBM warrants to purchase 500,000 shares of the Company’s common stock, which expired unexercised in June and August 2009. See Note 16 to the Consolidated Financial Statements for further details. |
Note 7 to the Consolidated Financial Statements for further details.
Note 15.16. IBM Distribution Agreement ServeRAID Agreement and Patent Cross-License Agreement
In August 2004, the Company entered into an agreement to sell external storage products to IBM. In connection with the agreement, the Company issued IBM a warrant to purchase 250,000 shares of the Company'sCompany’s common stock at an exercise price of $6.94 per share. The warrant has a term of five years from the date of issuance and was immediately exercisable.exercisable; however, the warrant expired unexercised in August 2009. The warrant was valued at $1.0 million using the Black-Scholes valuation model using a volatility rate of 62%, a risk-free interest rate of 4.0% and an estimated life of 5five years. The value of the warrant was fully expensed, as the economic benefits were not considered probable, at March 31, 2005.
In connection with the IBM i/p Series RAID acquisition in June 2004, the Company issued a warrant to IBM to purchase 250,000 shares of the Company'sCompany’s common stock at an exercise price of $8.13 per share. The warrant had a term of 5five years from the date of issuance and iswas immediately exercisable.exercisable; however, the warrant expired unexercised in June 2009. The warrant was valued at $1.1 million, net of registration costs, using the Black-Scholes valuation model using a volatility rate of 62%, a risk-free interest rate of 3.9% and an estimated life of 5five years.
In March 2002, the Company entered into a non-exclusive, perpetual technology licensing agreement and a product supply agreement with IBM. The product supply agreement had an exclusive three-year term, which was amended in fiscal 2005 to change the nature of the agreement to be non-exclusive during the extended two-year term. The technology licensing agreement grants the Company the right to use IBM's ServeRAID technology for the Company's internal and external RAID products. Under the product supply agreement, the Company supplied RAID software, firmware and hardware to IBM for use in IBM's xSeries servers. The agreement did not contain minimum purchase commitments from IBM.Note 17. Guarantees
In consideration, the Company paid IBM a non-refundable fee of $26.0 million and issued IBM a warrant to purchase 150,000 shares of the Company's common stock at an exercise price of $15.31 per share. The warrant had a term of five years from the date of issuance and was immediately exercisable; however, the warrant expired unexercised in March 2007. The warrant was valued at approximately $1.0 million using the Black-Scholes valuation model using a volatility rate of 71.6%, a risk-free interest rate of 4.7% and an estimated life of five years. The Company allocated $12.0 million of the consideration paid to IBM to the supply agreement and allocated the remainder to the technology license fee. Fair values were determined based on discounted estimated future cash flows related to the Company's OEM ServeRAID business. The cash flow periods used were five years and the discount rates used were 15% for the supply agreement asset and 20% for the technology license fee based upon the Company's estimate of their respective levels of risk. Amortization of the supply agreement and the technology license fee is included in "Net revenues" and "Costs of revenues," respectively, over a five-year period reflecting the pattern in which economic benefits of the assets are realized.
In May 2000, the Company entered into a patent cross-license agreement with IBM, which was subsequently amended in March 2002. Under the agreement, the Company obtained a release of past infringement claims made prior to January 1, 2000 and received the right to use certain IBM patents from January 1, 2000 through June 30, 2007. Additionally, the Company granted IBM a license to use all of the Company's patents for the same period. In consideration, the Company paid an aggregate patent fee of $13.3 million. The patent license fee was amortized over the period from January 1, 2000 through June 30, 2007. A number of the licensed patents have either expired or are no longer significant to the Company's product portfolio. If the Company should determine that it is necessary to extend the term of the patent license, the Company believes that it will be able to reach agreement with IBM for such an extension, without interruption to its business operations.
Note 16. Guarantees
Intellectual Property and Other Indemnification Obligations
The Company has entered into agreements with customers and suppliers that include intellectual property indemnification obligations. These indemnification obligations generally require the Company to compensate the other party for certain damages and costs incurred as a result of third party intellectual property claims arising from these transactions. In each of these circumstances, payment by the Company is conditional on the other party making a claim pursuant to the procedures specified in the particular contract, which procedures typically allow the Company to challenge the other party'sparty’s claims. Further, the Company'sCompany’s obligations under these
F-45
ADAPTEC, INC.
NOTES TO CONSOLIDATED FINANCIAL STATEMENTS (Continued)
(Unaudited)
Note 17. Guarantees (Continued)
agreements may be limited in terms of time and/or amount, and in some instances, the Company may have recourse against third parties for certain payments made by it under these agreements. In addition, the Company has agreements whereby it indemnifies its directors and certain of its officers for certain events or occurrences while the officer or director is, or was, serving at the Company'sCompany’s request in such capacity. These indemnification agreements are not subject to a maximum loss clause; however, the Company maintains a Directordirector and Officerofficer insurance policy which may cover all or a portion of the liabilities arising from its obligation to indemnify its directors and officers. It is not possible to make a reasonable estimate of the maximum potential amount of future payments under these or similar agreements due to the conditional nature of the Company'sCompany’s obligations and the unique facts and circumstances involved in each particular agreement. Historically, the Company has not incurred significant costs to defend lawsuits or settle claims related to such agreements and no amount has been accrued in the accompanying consolidated financial statementsConsolidated Financial Statements with respect to these indemnification guarantees.
Product Warranty
The Company provides an accrual for estimated future warranty costs based upon the historical relationship of warranty costs to sales. The estimated future warranty obligations related to product sales are recorded in the period in which the related revenue is recognized. The estimated future warranty obligations are affected by sales volumes, product failure rates, material usage and replacement costs incurred in correcting a product failure. If actual product failure rates, material usage or replacement costs differ from the Company'sCompany’s estimates, revisions to the estimated warranty obligations would be required; however, the Company made no adjustments to pre-existing warranty accruals in fiscal years 20082010, 2009 and 2007.2008.
A reconciliation of the changes to the Company'sCompany’s warranty accrual for fiscal years 2008, 20072010, 2009 and 20062008 was as follows:
Years Ended March 31, --------------------------------- 2008 2007 2006 ----------- ----------- -------- (in thousands)Balance at beginning of period $ 950 $ 2,051 $ 2,084 Warranties provided 2,389 3,770 5,028 Actual costs incurred (2,598) (4,871) (5,061) ----------- ----------- -------- Balance at end of period $ 741 $ 950 $ 2,051 =========== =========== ========
| Years ended March 31, | ||||||||||||
| 2010 | 2009 | 2008 | ||||||||||
| (in thousands) | ||||||||||||
Balance at beginning of period | $ | 400 | $ | 741 | $ | 950 | ||||||
Warranties provided | 624 | 930 | 2,389 | |||||||||
Actual costs incurred | (714 | ) | (1,117 | ) | (2,598 | ) | ||||||
Warranty obligations transferred with discontinued operations | — | (154 | ) | — | ||||||||
Balance at end of period | $ | 310 | $ | 400 | $ | 741 | ||||||
Note 17. Settlement18. Related Party Transactions with Steel Partners L.L.C.LLC and Steel Partners II, L.P.
On October 26, 2007, the Company,Warren G. Lichtenstein, Steel Partners, L.L.C.LLC and Steel Partners II, L.P. (together, "Steel"(collectively, “Steel Partners”) entered into an agreement (the "Settlement Agreement") ending the election contest that was to occur at the Company's 2007 Annual Meeting of Stockholders (the "Annual Meeting"). Steel beneficially owned approximately 15%became a 5% stockholder of the Company's common stock as of December 31,Company in March 2007.
In December 2007, the Company held the Annual Meeting, at which the Company's stockholders elected nine directors to the Company's Board of Directors. Of these nine directors, three of the directors, Jack L. Howard, John J. Quicke and John Mutch were nominated for election at the 2007 Annual Meeting by the Company pursuant to the terms of the Settlement Agreement. Steel represented to the Company in the Settlement Agreement thatStockholders. At such time, both Mr. Howard and Mr. Quicke may bewere deemed to be affiliates of Steel Partners under the rules of the Securities Exchange Act of 1934, but thatas amended; however, Mr. Mutch was not deemed to be an affiliate of Steel.Steel Partners at such time. Messrs. Howard, Quicke and Mutch continue to serve on the Company’s Board of Directors and Mr. Quicke was appointed tocurrently serves as the Company's Compensation Committee, Mr. Howard was appointed toInterim President and CEO of the Company's Nominating and Governance Committee and Mr. Mutch was appointed toCompany. Each of the Company's Audit Committee. The Company compensated each of thesethree directors, including the two directors who are deemed affiliates of Steel Partners, are compensated with equity awards or equity basedequity-based awards in amounts that are consistent with the Company'sCompany’s Non-Employee Director Compensation Policy. In addition, in fiscal 2010, the Company agreed to pay Mr. Quicke $30,000 per month, effective, January 4, 2010, in connection with his role as Interim President and CEO, in addition to the compensation he receives as a non-executive board
ADAPTEC, INC.
NOTES TO CONSOLIDATED FINANCIAL STATEMENTS (Continued)
(Unaudited)
Note 18. Related Party Transactions with Steel Partners LLC and Steel Partners II, L.P. (Continued)
member. As of March 31, 2010, Steel Partners beneficially owned approximately 19.5% of the Company’s common stock. In fiscal 2010, the Company reimbursed $0.7 million related to professional fees that Steel Partners II, L.P., Steel Partners Holdings L.P., Steel Partners LLC, Steel Partners II GP LLC, Warren Lichtenstein, Jack L. Howard, and John J. Quicke incurred with respect to the consent solicitation, which was recorded within “Selling, marketing and administrative expenses” in the Consolidated Statements of Operations.
Note 18.19. Segment, Geographic and Significant Customer Information
Segment Information
With OEMs incorporating other connectivity technologies directly into their products,Since the increased levelsale of competition entering the market, and the complexities of the retail channel, the Company decidedits Snap Server NAS business in fiscal 2007 not to invest further in its DSG segment. The Company's DSG segment provided high-performance I/O connectivity and digital media products for personal computing platforms, including notebook and desktop PCs, which were sold to retailers, OEMs and distributors. The Company wound down the DSG business throughout fiscal 2007 and exited it at March 31, 2007. As a result, in the first quarter of fiscalJune 2008, the Company revised its internal reporting structure by including the remaining SCSI products from its previous DSG segmenthas operated in its DPSone segment. The remainder of the DSG segment was included in the "Other" category, as it represents a reconciling item to its consolidated results of operations. In addition, during the first quarter of fiscal 2007, as a result of retaining the Snap Server portion of the systems business, the Company reorganized its internal organization structure and identified SSG as a new segment, in addition to its then existing segments. Following the revision to its internal reporting structure, the Company operated in two segments, DPS and SSG. A description of the types of customers or products and services provided by each segment is as follows:
Summarized financial information on the Company's reportable segments, under the revised internal reporting structure, is shown in the following table. The segment financial data for historical periods has been restated to reflect the current internal reporting structure. There were no inter-segment revenues for the periods shown below.function. The Company does not separately track all tangible assetsderive a significant amount of revenue from services or depreciation by segments nor are the segments evaluated under these criteria. Segment financial information is summarized as follows for fiscal years 2008, 2007 and 2006:
DPS SSG Other Total --------- --------- --------- --------- (in thousands)Fiscal 2008: Net revenues $ 145,082 $ 22,318 $ -- $ 167,400 Segment income (loss) 26,635 (6,337) -- 20,298 Fiscal 2007: Net revenues $ 214,522 $ 28,060 $ 12,626 $ 255,208 Segment income (loss) 36,894 (7,022) (922) 28,950 Fiscal 2006: Net revenues $ 283,066 $ 33,997 $ 27,079 $ 344,142 Segment income (loss) 63,244 (4,949) (5,261) 53,034
A reconciliation of the Company's "Loss from continuing operations before income taxes" on the Consolidated Statements of Operations, which consisted of its segment income (loss) and the details of unallocated corporate income and expenses for fiscal years 2008, 2007 and 2006, was as follows:
Years Ended March 31, ---------------------------------------- 2008 2007 2006 ------------ ------------ ------------ (in thousands)Total segment income $ 20,298 $ 28,950 $ 53,034 Unallocated corporate expenses, net (1) (57,873) (71,610) $ (88,930) Restructuring charges (6,273) (3,711) (10,430) Goodwill impairment -- -- (90,602) Other (charges) gains 3,371 (14,700) (11,603) Interest and other income 31,335 25,618 17,621 Interest expense (3,646) (3,405) (3,314) ------------ ------------ ------------ Loss from continuing operations before income taxes $ (12,788) $ (38,858) $ (134,224) ============ ============ ============
(1)The unallocated corporate expenses, net, included all administrative expenses, certain research and development and selling and marketing expenses, stock-based compensation expense and amortization of acquisition-related intangible assets.support.
The following table presents netNet revenues by countries based on the location of the selling entities:
Years Ended March 31, ----------------------------------------entities for fiscal years 2010, 2009 and 2008,2007 2006 ------------ ------------ ------------ (in thousands)United States $ 73,182 $ 115,064 $ 139,335 Singapore -- 91,562 204,807 Ireland 94,218 48,582 -- ------------ ------------ ------------was as follows:
Years Ended March 31, 2010 2009 2008 (in thousands) United States
$ 73,682 $ 96,658 $ 50,852 Ireland
— 18,116 94,649 Net revenues
$ 73,682 $ 114,774 $ 145,501 Net
revenues $ 167,400 $ 255,208 $ 344,142 ============ ============ ============
The following table presents net property and equipment by countries based on the location of the assets:
assets at March 31,States.------------------------ 2008 2007 ----------- ----------- (in thousands)2010 and 2009 was as follows:
March 31, 2010 2009 (in thousands) United States
$ 11,097 $ 11,517 European Countries
210 65 Pacific Rim Countries
46 82 Property and equipment, net
$ 11,353 $ 11,664 Significantly all other long-lived assets at March 31, 2010 and 2009 reside in the United
States $ 12,682 $ 14,803 Singapore 80 254 Other countries 522 795 ----------- ----------- Property and equipment, net $ 13,284 $ 15,852 =========== ===========
Note 19.20. Supplemental Disclosure of Cash Flows
Years Ended March 31, ------------------------------- 2008 2007 2006 --------- --------- --------- (in thousands)Interest paid $ 3,556 $ 4,150 $ 3,301 Income taxes paid 3,879 1,369 15,856 Income tax refund received 16,214 2,563 64 Non-cash investing and financial activities: Adjustment for deferred stock-based compensation -- (319) (444) Unrealized gains (losses) on available-for-sale securities 2,749 3,792 (2,687)
| Years Ended March 31, | ||||||||||
| 2010 | 2009 | 2008 | ||||||||
| (in thousands) | ||||||||||
Interest paid | $ | 4 | $ | 2,011 | $ | 3,556 | ||||
Income taxes paid | 2,493 | 720 | 3,879 | |||||||
Income tax refund received | 7,617 | 1,082 | 16,214 | |||||||
Non-cash investing and financial activities: | ||||||||||
Unrealized gains (losses) on available-for-sale securities | 110 | (600 | ) | 1,861 | ||||||
F-47
ADAPTEC, INC.
NOTES TO CONSOLIDATED FINANCIAL STATEMENTS (Continued)
(Unaudited)
Note 20.21. Comparative Quarterly Financial Data (unaudited)
The following table summarized the Company'sCompany’s quarterly financial data:
Quarters ------------------------------------------ First Second Third Fourth Year --------- --------- --------- --------- --------- (in thousands, except per share amounts) Fiscal 2008:Net revenues $ 42,387 $ 43,974 $ 41,162 $ 39,877 $ 167,400 Gross profit 13,997 15,378 16,169 16,929 62,473 Income (loss) from continuing operations, net of taxes (3,635) (7,488) 1,108 (79) (10,094) Loss from discontinued operations, net of taxes -- (144) -- 623 479 Net income (loss) (3,635) (7,632) 1,108 544 (9,615) Income (loss) per share: Basic Continuing operations $ (0.03) $ (0.06) $ 0.01 $ (0.00) $ (0.09) Discontinued operations $ -- $ (0.00) $ -- $ 0.01 $ 0.00 Net income (loss) $ (0.03) $ (0.06) $ 0.01 $ 0.00 $ (0.08) Diluted Continuing operations $ (0.03) $ (0.06) $ 0.01 $ (0.00) $ (0.09) Discontinued operations $ -- $ (0.00) $ -- $ 0.01 $ 0.00 Net income (loss) $ (0.03) $ (0.06) $ 0.01 $ 0.00 $ (0.08) Shares used in computing income (loss) per share: Basic 117,897 118,405 118,987 119,163 118,613 Diluted 117,897 118,405 119,622 119,163 118,613Fiscal 2007:Net revenues $ 69,071 $ 73,553 $ 60,650 $ 51,934 $ 255,208 Gross profit 22,270 26,543 14,843 17,578 81,234 Income (loss) from continuing operations, net of taxes (24,824) 48,757 5,077 (4,164) 24,846 Income from discontinued operations, net of taxes 1,554 2,308 1,301 834 5,997 Net income (loss) (23,270) 51,065 6,378 (3,330) 30,843 Income (loss) per share: Basic Continuing operations $ (0.21) $ 0.42 $ 0.04 $ (0.04) $ 0.21 Discontinued operations $ 0.01 $ 0.02 $ 0.01 $ 0.01 $ 0.05 Net income (loss) $ (0.20) $ 0.44 $ 0.05 $ (0.03) $ 0.26 Diluted Continuing operations $ (0.21) $ 0.36 $ 0.04 $ (0.04) $ 0.20 Discontinued operations $ 0.01 $ 0.02 $ 0.01 $ 0.01 $ 0.04 Net income (loss) $ (0.20) $ 0.38 $ 0.05 $ (0.03) $ 0.25 Shares used in computing income (loss) per share: Basic 115,609 116,325 116,959 117,516 116,602 Diluted 115,609 136,735 137,330 117,516 136,690
In the first quarter of fiscal 2008, the Company recorded a gain of $6.7 million on the sale of certain properties.
| Quarters | ||||||||||||||||||||
| First | Second | Third | Fourth | Year | ||||||||||||||||
| (in thousands, except per share amounts) | ||||||||||||||||||||
Fiscal 2010: | ||||||||||||||||||||
Net revenues | $ | 21,738 | $ | 18,442 | $ | 16,909 | $ | 16,593 | $ | 73,682 | ||||||||||
Gross profit | 10,103 | 8,163 | 7,468 | 7,660 | 33,394 | |||||||||||||||
Income (loss) from continuing operations, net of taxes | 154 | (4,091 | ) | (7,494 | ) | (7,239 | ) | (18,670 | ) | |||||||||||
Income from discontinued operations, net of taxes | 440 | 318 | 212 | 266 | 1,236 | |||||||||||||||
Net income (loss) | $ | 594 | $ | (3,773 | ) | $ | (7,282 | ) | $ | (6,973 | ) | $ | (17,434 | ) | ||||||
Income (loss) per share: | ||||||||||||||||||||
Basic | ||||||||||||||||||||
Continuing operations | $ | 0.00 | $ | (0.03 | ) | $ | (0.06 | ) | $ | (0.06 | ) | $ | (0.16 | ) | ||||||
Discontinued operations | $ | 0.00 | $ | 0.00 | $ | 0.00 | $ | 0.00 | $ | 0.01 | ||||||||||
Net income (loss) | $ | 0.00 | $ | (0.03 | ) | $ | (0.06 | ) | $ | (0.06 | ) | $ | (0.15 | ) | ||||||
Diluted | ||||||||||||||||||||
Continuing operations | $ | 0.00 | $ | (0.03 | ) | $ | (0.06 | ) | $ | (0.06 | ) | $ | (0.16 | ) | ||||||
Discontinued operations | $ | 0.00 | $ | 0.00 | $ | 0.00 | $ | 0.00 | $ | 0.01 | ||||||||||
Net income (loss) | $ | 0.00 | $ | (0.03 | ) | $ | (0.06 | ) | $ | (0.06 | ) | $ | (0.15 | ) | ||||||
Shares used in computing income | ||||||||||||||||||||
(loss) per share: | ||||||||||||||||||||
Basic | 119,284 | 118,961 | 119,137 | 119,403 | 119,196 | |||||||||||||||
Diluted | 119,869 | 118,961 | 119,137 | 119,403 | 119,196 | |||||||||||||||
Fiscal 2009: | ||||||||||||||||||||
Net revenues | $ | 31,503 | $ | 31,655 | $ | 28,205 | $ | 23,411 | $ | 114,774 | ||||||||||
Gross profit | 14,682 | 13,329 | 11,143 | 10,207 | 49,361 | |||||||||||||||
Income (loss) from continuing operations, net of taxes | (47 | ) | 3,312 | 90 | (17,331 | ) | (13,976 | ) | ||||||||||||
Income (loss) from discontinued operations, net of taxes | 5,060 | — | (1,396 | ) | 122 | 3,786 | ||||||||||||||
Net income (loss) | $ | 5,013 | $ | 3,312 | $ | (1,306 | ) | $ | (17,209 | ) | $ | (10,190 | ) | |||||||
Income (loss) per share: | ||||||||||||||||||||
Basic | ||||||||||||||||||||
Continuing operations | $ | (0.00 | ) | $ | 0.03 | $ | 0.00 | $ | (0.14 | ) | $ | (0.12 | ) | |||||||
Discontinued operations | $ | 0.04 | $ | — | $ | (0.01 | ) | $ | 0.00 | $ | 0.03 | |||||||||
Net income (loss) | $ | 0.04 | $ | 0.03 | $ | (0.01 | ) | $ | (0.14 | ) | $ | (0.09 | ) | |||||||
Diluted | ||||||||||||||||||||
Continuing operations | $ | (0.00 | ) | $ | 0.02 | $ | 0.00 | $ | (0.14 | ) | $ | (0.12 | ) | |||||||
Discontinued operations | $ | 0.04 | $ | — | $ | (0.01 | ) | $ | 0.00 | $ | 0.03 | |||||||||
Net income (loss) | $ | 0.04 | $ | 0.02 | $ | (0.01 | ) | $ | (0.14 | ) | $ | (0.09 | ) | |||||||
Shares used in computing income | ||||||||||||||||||||
(loss) per share: | ||||||||||||||||||||
Basic | 119,192 | 119,682 | 120,231 | 119,961 | 119,767 | |||||||||||||||
Diluted | 119,192 | 134,594 | 120,473 | 119,961 | 119,767 | |||||||||||||||
ADAPTEC, INC.
NOTES TO CONSOLIDATED FINANCIAL STATEMENTS (Continued)
(Unaudited)
Note 21. Comparative Quarterly Financial Data (unaudited) (Continued)
In the first, second, third and fourth quarters of fiscal 2008,2010, the Company recorded restructuring charges (credits) of $0.1 million, $(0.1) million, $1.0 million and $0.6 million, respectively, primarily related to adjustments made to previous restructuring plans and a restructuring plan implemented during the fiscal year. In the first, second, third and fourth quarters of fiscal 2010, the Company recorded a gain of $0.4 million, $0.3 million, $0.2 million and $0.3 million, respectively, within “Gain on disposal of discontinued operations, net of taxes” in the Consolidated Statements of Operations, based on the release of the reserve on the remaining receivable due from Overland as cash was collected. In the first, second, third and fourth quarters of fiscal 2010, the Company recorded stock-based compensation expense of $1.1 million, $1.1 million, $2.9 million and $0.7 million, respectively. In the third quarter of fiscal 2010, the Company received $0.9 million as part of a class action suit and $0.4 million from the sale of an investment in a non-controlling interest of a non-public company, which was recorded within “Interest and other income, net” in the Consolidated Statements of Operations.
In the second and third quarters of fiscal 2009, the Company recorded a gain of $1.3 million and $0.4 million, respectively, on the repurchase of its 3/4% Notes on the open market. In the first, second, third and fourth quarters of fiscal 2009, the Company recorded restructuring charges of $1.5$1.8 million, $3.5$1.4 million, $0.9 million and $0.8$1.9 million, respectively, primarily related to restructuring plans implemented in the first and secondthird quarters of fiscal 2008.2009. In the second quarter of fiscal 2009, the Company recorded a gain of $5.8 million on the sale of the Snap Server NAS business. In the third quarter of fiscal 2009, the Company established a reserve of $1.2 million for the remaining receivable due from Overland, which was recorded within “Gain on disposal of discontinued operations, net of taxes” in the Consolidated Statements of Operations. In the fourth quarter of fiscal 2008, the Company recorded adjustments of ($0.4) million related to prior fiscal years restructuring plans. During the fourth quarter of fiscal 2008,2009, the Company recorded an impairment charge of $2.4$16.9 million to write down the SSG intangible assets related to the Elipsanwrite-off goodwill and Snap Appliance acquisitions to zero due to a revision in the Company's forecasts in that quater that resulted in expected negative cash flows for these assets for the first time. In the first quarter of fiscal 2007, the Company recorded an impairment charge of $13.2 million related to the Snap server portion of its systems business and implemented a restructuring plan. In second quarter of fiscal 2007, the Company received a discrete tax benefit of $46.0 million primarily attributable to the settlement of certain tax disputes with the United States and Singapore taxing authorities, including the resolution of the Company's fiscal 1997 U.S. Tax Court Litigation and implemented a restructuring plan. In the third quarter of fiscal 2007, the Company recorded inventory-related charges of $7.8 million and received a discrete tax benefit of $12.9 million primarily attributable to the settlement of certain tax disputes with the U.S. taxing authorities, including the resolution of its fiscal 2002 and fiscal 2003 IRS audit cycle. In the fourth quarter of fiscal 2007, the Companyrecorded a write-downgain of a minority investment$2.3 million on the sale of $0.9 million (see marketable equity securities.
Note 12 to the Consolidated Financial Statements). These actions affect the comparability of this data.
Note 21.22. Glossary (Unaudited)(unaudited)
The following is a list of accounting and business related acronyms, including accounting regulatory bodies, that are contained within this Annual Report on Form 10-K. They are listed in alphabetical order.
ASC: Accounting Standards Codification
ASM: Adaptec Storage Manager
ASIC: Application Specific Integrated Circuit
CFO: Chief Financial Officer
CIFS:Common Internet File System
CLI:Command Line Interface
DAS:Direct Attached Storage
HBA: Host Bus Adapter
ADAPTEC, INC.
NOTES TO CONSOLIDATED FINANCIAL STATEMENTS (Continued)
(Unaudited)
Note 22. Glossary (unaudited) (Continued)
HTTP:Hypertext Transfer Protocol
I/O:Input/Output
IP: Internet Protocol
IPsec: Internet Protocol Security
IRS: Internal Revenue Service
iSCSI: Internet SCSI
IT: Information Technology
NAS: Network Attached Storage
NFS: Network File System
NOL: Net Operating Loss
ODM: Original Design Manufacturers
OEM: Original Equipment Manufacturer
PCIe: Peripheral Component Interconnect Express
PCI-X: Peripheral Component Interconnect Extended
RAID: Redundant Array of Independent Disks
ROC: Raid on Chip
ROM BIOS:Read Only Memory Basic Input Output System
RSP:RAID Storage Area NetworksProcessor
SAS: Serial Attached SCSI
SATA: Serial Advanced Technology Attachment
SEC: Securities and Exchange Commission
SCSI: Small Computer System Interface
SMBs: Small and Medium Businesses
SMI-S: Storage Management Initiative Specification
SSG: Storage Solutions Group
The following is a list of accounting rules and regulations and related regulatory bodies referred to within this Annual Report on Form 10-K. They are listed in alphabetical order.
SCHEDULE II
VALUATION AND QUALIFYING ACCOUNTS
FOR THE YEARS ENDED MARCH 31, 2008, 20072010, 2009 AND 20062008
Balance at Balance at Beginning Charges to the End of of Period P&L Deductions Period ---------- ---------- ---------- ---------- (in thousands)Year ended March 31, 2008 Allowance for doubtful accounts(1) $ 519 $ 65 $ 326 $ 258 Sales reserves(1) 2,399 8,020 8,144 2,275 Allowances(1) 3,303 10,506 11,754 2,055 Valuation allowance for deferred tax a 124,070 -- 79,479 44,591 -- Year ended March 31, 2007 Allowance for doubtful accounts(1) $ 814 $ 67 $ 362 $ 519 Sales returns(1) 4,743 9,393 11,737 2,399 Allowances(1) 6,067 10,241 13,005 3,303 Valuation allowance for deferred tax a 91,476 32,594 -- 124,070 Year ended March 31, 2006 Allowance for doubtful accounts(1) $ 1,029 $ 5 $ 220 $ 814 Sales returns(1) 4,199 12,445 11,901 4,743 Allowances(1) 10,090 14,350 18,373 6,067 Valuation allowance for deferred tax a 67,167 24,309 -- 91,476
________________________
| Balance at Beginning of Period | Additions | Deductions | Balance at End of Period | |||||||||
| (in thousands) | ||||||||||||
Year ended March 31, 2010 | ||||||||||||
Allowance for doubtful accounts(1) | $ | 46 | $ | — | $ | 12 | $ | 34 | ||||
Sales reserves(1) | 823 | 2,120 | 2,275 | 668 | ||||||||
Allowances(1) | 923 | 3,968 | 3,950 | 941 | ||||||||
Valuation allowance for deferred tax assets | 75,948 | 5,270 | — | 81,218 | ||||||||
Year ended March 31, 2009 | ||||||||||||
Allowance for doubtful accounts(1) | $ | 258 | $ | 25 | $ | 237 | $ | 46 | ||||
Sales reserves(1) | 2,275 | 3,314 | 4,766 | 823 | ||||||||
Allowances(1) | 2,055 | 6,220 | 7,352 | 923 | ||||||||
Valuation allowance for deferred tax assets | 44,591 | 31,357 | — | 75,948 | ||||||||
Year ended March 31, 2008 | ||||||||||||
Allowance for doubtful accounts(1) | $ | 519 | $ | 65 | $ | 326 | $ | 258 | ||||
Sales returns(1) | 2,399 | 8,020 | 8,144 | 2,275 | ||||||||
Allowances(1) | 3,303 | 10,506 | 11,754 | 2,055 | ||||||||
Valuation allowance for deferred tax assets | 124,070 | — | 79,479 | 44,591 | ||||||||
Notes:
| (1) | Amounts are included in “Accounts receivable” in the Consolidated Balance Sheets. All other schedules are omitted because they are not applicable or the amounts are immaterial or the required information is presented in the Consolidated Financial Statements and Notes thereto. |
SIGNATURESII-1
Pursuant to the requirements of Section 13 or 15(d) of the Securities Exchange Act of 1934, the Registrant has duly caused this Reportreport to be signed on its behalf by the undersigned, thereunto duly authorized.
| ||||
| ADAPTEC, INC. | ||||
Date: May 27, 2010 | /s/ | |||
Interim President and Chief Executive Officer | ||||
| ||||
Pursuant to the requirements of the Securities Exchange Act of 1934, this report has been signed below by the following persons on behalf of the Registrant and in the capacities and on the dates indicated.
Signature | Title | Date | ||
/S/ JOHN J. QUICKE JOHN J. QUICKE | Interim President and Chief Executive Officer, and Director (principal executive officer) | May 27, 2010 | ||
/S/ MARY L. DOTZ MARY L. DOTZ | Chief Financial Officer | May 27, 2010 | ||
/S/ JACK L. HOWARD JACK L. HOWARD | Chairman | May 27, 2010 | ||
/S/ JON S. CASTOR JON S. CASTOR | Director | May 27, 2010 | ||
/S/ JOHN MUTCH JOHN MUTCH | Director | May 27, 2010 | ||
/S/ LAWRENCE J. RUISI LAWRENCE J. RUISI | Director | May 27, 2010 | ||
INDEX TO EXHIBITS
Exhibit Number | Exhibit Description | Incorporated by Reference | Filed | |||||||||
Form | File Number | Exhibit | File Date | |||||||||
2.1 | Asset Purchase Agreement, dated June 27, 2008, by and between Overland Storage, Inc. and the Registrant | 8-K | 000-15071 | 2.01 | 07/03/08 | |||||||
2.2 | Agreement and Plan of Merger, dated as of August 27, 2008, by and among the Registrant., Ariel Acquisition Corp., Aristos Logic Corporation and TPG Ventures, L.P., as representative of certain former stockholders of Aristos Logic Corporation | 8-K | 000-15071 | 2.1 | 09/03/08 | |||||||
3.1 | Certificate of Incorporation of Registrant filed with Delaware Secretary of State on November 19, 1997. | 10-K | 000-15071 | 3.1 | 06/26/98 | |||||||
3.2 | Amended and Restated Bylaws of the Company. effective March 8, 2010 | 8-K | 000-15701 | 3.1 | 03/09/10 | |||||||
4.1 | Indenture, dated as of December 22, 2003, by and between the Registrant and Wells Fargo Bank, National Association. | 10-Q | 000-15071 | 4.01 | 02/09/04 | |||||||
4.2 | Form of 3/4% Convertible Senior Subordinated Note. | 10-Q | 000-15071 | 4.02 | 02/09/04 | |||||||
4.4 | Collateral Pledge and Security Agreement, dated as of December 22, 2003, by and among the Registrant, Wells Fargo Bank, National Association, as trustee, and Wells Fargo Bank, National Association, as collateral agent. | 10-Q | 000-15071 | 4.04 | 02/09/04 | |||||||
4.5 | Warrant Agreement, dated as of June 29, 2004, between the Registrant and International Business Machines Corporation | S-3 | 333-119266 | 4.03 | 09/24/04 | |||||||
4.6 | Warrant Agreement, dated as of August 10, 2004, between the Registrant and International Business Machines Corporation | S-3 | 333-119266 | 4.04 | 09/24/04 | |||||||
| Employment Agreements, Offer Letters and Separation Agreements | ||||||||||||
10.1† | Executive Employment Agreement of Subramanian “Sundi” Sundaresh, effective as of August 14, 2007. | 10-Q | 000-15071 | 10.1 | 11/06/07 | |||||||
10.2† | Offer Letter and Executive Employment Agreement between the Registrant and Mary L. Dotz, dated March 31, 2008 | 8-K | 000-15071 | 99.02 | 03/31/08 | |||||||
10.3† | Executive Employment Agreement of Marcus Lowe, effective August 21, 2007 | 10-Q | 000-15071 | 10.4 | 11/06/07 | |||||||
10.4† | Employment Agreement of Mr. John Noellert, effective as of August 14, 2007 | 8-K | 000-15071 | 10.1 | 10/30/08 | |||||||
10.5† | Employment Agreement of Mr. Anil Gupta, effective as of September 3, 2008 | 8-K | 000-15071 | 10.2 | 10/30/08 | |||||||
10.6† | Separation Agreement of Anil Gupta, effective March 31, 2009 | 8-K | 000-15071 | 10.1 | 04/03/09 | |||||||
Exhibit Number | Exhibit Description | Incorporated by Reference | Filed | |||||||||
|
|
| ||||||||||
|
| |||||||||||
|
|
| ||||||||||
|
| |||||||||||
|
|
| ||||||||||
|
| |||||||||||
|
|
| ||||||||||
| ||||||||||||
| Separation Agreement of Manoj Goyal, effective April 21, 2008 | 8-K | 000-15071 | 10.01 | 04/23/08 | ||||||||
|
|
| ||||||||||
| ||||||||||||
| Separation Agreement of John M. Westfield, effective November 17, 2009 | 10-Q | 000-15071 | 10.3 | 02/03/10 | ||||||||
|
|
| ||||||||||
| ||||||||||||
| Separation Agreement of Subramanian Sundaresh, effective January 4, 2010 | 10-Q | 000-15071 | 10.1 | 02/03/10 | ||||||||
|
|
| ||||||||||
| ||||||||||||
|
|
| ||||||||||
| ||||||||||||
| Consulting Service Agreement of Subramanian Sundaresh, effective January 4, 2010 | 10-Q | 000-15071 | 10.2 | 02/03/10 | ||||||||
|
|
| ||||||||||
| ||||||||||||
| Separation Agreement of John Noellert, effective February 4, 2010 | X | |||||||||||
|
|
| ||||||||||
| ||||||||||||
| Separation Agreement of Marcus Lowe, effective March 4, 2010 | X | |||||||||||
| Stock Plans and Related Forms | ||||||||||||
|
|
| ||||||||||
| ||||||||||||
| 1999 Stock Plan. | SC TO-I | 005-38119 | 99.(d)(2) | 05/22/01 | ||||||||
10.14† | 2000 Non-statutory Stock Option Plan and Form of Stock Option Agreement. | SC TO-I | 005-38119 | 99.(d)(3) | 05/22/01 | |||||||
10.15† | 2000 Director Option Plan and Form of Agreement. | 10-Q | 000-15071 | 10.1 | 11/06/00 | |||||||
10.16† | 2004 Equity Incentive Plan, as amended and restated on August 20, 2008 | DEF 14A | 000-15071 | A | 09/08/08 | |||||||
10.17† | Form of Stock Option Agreement under the 2004 Equity Incentive Plan | 10-Q | 000-15071 | 10.02 | 11/10/04 | |||||||
10.18† | Form of Restricted Stock Purchase Agreement under the 2004 Equity Incentive Plan | 10-Q | 000-15071 | 10.03 | 11/10/04 | |||||||
10.19† | Form of Restricted Stock Unit Agreement under the 2004 Equity Incentive Plan | 10-Q | 000-15071 | 10.04 | 11/10/04 | |||||||
10.20† | Adaptec, Inc. 2006 Director Plan | DEF 14A | 000-15071 | A | 07/28/06 | |||||||
10.21† | Restricted Stock Award Agreement under 2006 Director Plan as amended on February 7, 2008. | 8-K | 000-15071 | 10.02 | 02/11/08 | |||||||
10.22† | Stock Option Award Agreement under 2006 Director Plan as amended on February 7, 2008. | 8-K | 000-15071 | 10.01 | 02/11/08 | |||||||
10.23† | Stock Appreciation Right Award Agreement under 2006 Director Plan as amended on February 7, 2008. | 8-K | 000-15071 | 10.03 | 02/11/08 | |||||||
10.24† | Restricted Stock Unit Award Agreement under 2006 Director Plan as amended on February 7, 2008. | 8-K | 000-15071 | 10.04 | 02/11/08 | |||||||
10.25† | Eurologic Systems Group Limited 1998 Share Option Plan Rules (Amended as of 1 April 2003) | S-8 | 333-104685 | 4.03 | 04/23/03 | |||||||
Exhibit Number | Exhibit Description | Incorporated by Reference | Filed | |||||||||
Form | File Number | Exhibit | File Date | |||||||||
10.26† | Broadband Storage, Inc. 2001 Stock Option and Restricted Stock Purchase Plan | S-8 | 333-118090 | 4.03 | 08/10/04 | |||||||
10.27† | Snap Appliance, Inc. 2002 Stock Option and Restricted Stock Purchase Plan | S-8 | 333-118090 | 4.04 | 08/10/04 | |||||||
| Other Compensatory Plans | ||||||||||||
10.28† | Non-Employee Director Compensation Policy, as amended effective April 1, 2009 | X | ||||||||||
10.29† | Fiscal 2010 Adaptec Incentive Plan | X | ||||||||||
10.30† | Form of Indemnification Agreement entered into between the Company and its officers and directors | 10-K | 000-15071 | 10.47 | 06/06/07 | |||||||
| Other Material Agreements | ||||||||||||
10.31 | Base Agreement, dated as of March 24, 2002, by and between the Registrant and International Business Machines Corporation | 10-Q | 000-15071 | 10.03 | 08/09/04 | |||||||
10.32* | Manufacturing Services and Supply Agreement by and between the Registrant and Sanmina-SCI Corporation | 10-Q | 000-15071 | 10.1 | 02/07/06 | |||||||
10.33* | Amendment to Manufacturing Services and Supply Agreement by and between the Registrant and Sanmina-SCI Corporation | 10-Q | 000-15071 | 10.3 | 02/07/06 | |||||||
10.34 | Amendment to Manufacturing Services and Supply Agreement by and between the Registrant and Sanmina-SCI Corporation | 10K/A | 000-15071 | 10.37 | 06/16/08 | |||||||
10.35* | Manufacturing Services and Supply Agreement by and between the Registrant and Sanmina-SCI Corporation | 10-K | 000-15071 | 10.45 | 06/04/09 | |||||||
10.36 | Settlement Agreement, dated as of October 26, 2007, among the Registrant, Steel Partners, L.L.C. and Steel Partners II, L.P. | 8-K | 000-15071 | 10.01 | 10/31/07 | |||||||
21.1 | Subsidiaries of Registrant | X | ||||||||||
23.1 | Consent of Independent Registered Public Accounting Firm, PricewaterhouseCoopers LLP | X | ||||||||||
31.1 | Certification pursuant to Section 302 of the Sarbanes-Oxley Act of 2002. | X | ||||||||||
31.2 | Certification pursuant to Section 302 of the Sarbanes-Oxley Act of 2002. | X | ||||||||||
32.1 | Certification pursuant to Section 906 of the Sarbanes-Oxley Act of 2002. | X | ||||||||||
| † | Management contract or compensatory plan or arrangement required to be filed as an exhibit to this Annual Report on Form 10-K pursuant to Item 14(c) of said form. |
| * | Confidential treatment has been granted for portions of this agreement. |
Incorporated by Reference | ||||||||
Exhibit Number | Exhibit Description | Form | File Number | Exhibit | File Date | Filed with this 10-K | ||
2.01 | Asset Purchase Agreement, dated September 30, 2005, by and between the Registrant and International Business Machines Corporation | 8-K | 000-15071 | 2.01 | 10/06/05 | |||
3.01 | Certificate of Incorporation of Registrant filed with Delaware Secretary of State on November 19, 1997. | 10-K | 000-15071 | 3.1 | 06/26/98 | |||
3.02 | Amended and Restated Bylaws of the Company | 8-K | 000-15701 | 3.01 | 12/18/06 | |||
4.01 | Indenture, dated as of December 22, 2003, by and between the Registrant and Wells Fargo Bank, National Association. | 10-Q | 000-15071 | 4.01 | 02/09/04 | |||
4.02 | Form of 3/4% Convertible Senior Subordinated Note. | 10-Q | 000-15071 | 4.02 | 02/09/04 | |||
4.03 | Registration Rights Agreement, dated as of December 22, 2003, by and among the Registrant, and Merrill Lynch, Pierce, Fenner & Smith Incorporated and Banc of America Securities LLC. | 10-Q | 000-15071 | 4.03 | 02/09/04 | |||
4.04 | Collateral Pledge and Security Agreement, dated as of December 22, 2003, by and among the Registrant, Wells Fargo Bank, National Association, as trustee, and Wells Fargo Bank, National Association, as collateral agent. | 10-Q | 000-15071 | 4.04 | 02/09/04 | |||
4.05 | Warrant Agreement, dated as of June 29, 2004, between the Registrant and International Business Machines Corporation | S-3 | 333-119266 | 4.03 | 09/02/04 | |||
4.06 | Warrant Agreement, dated as of August 10, 2004, between the Registrant and International Business Machines Corporation | S-3 | 333-119266 | 4.04 | 09/02/04 | |||
10.01 | + | Registrant's Savings and Retirement Plan. | 10-K | 000-15071 | (A) | (A) | ||
10.02 | + | Second Amendment to the Registrant's Savings and Retirement Plan. | 10-K | 000-15071 | 10.02 | 06/14/04 | ||
10.03 | + | Third Amendment to the Registrant's Savings and Retirement Plan. | 10-K | 000-15071 | 10.03 | 06/14/05 | ||
10.04 | + | 1990 Stock Plan, as amended. | SC TO-I | 005-38119 | 99.(d)(1) | 05/22/01 | ||
10.05 | + | Forms of Stock Option Agreement, Tandem Stock Option/SAR Agreement, Restricted Stock Purchase Agreement, Stock Appreciation Rights Agreement, and Incentive Stock Rights Agreement for use in connection with the 1990 Stock Plan, as amended. | 10-K | 000-15071 | (B) | (B) | ||
10.06 | + | 1999 Stock Plan. | SC TO-I | 005-38119 | 99.(d)(2) | 05/22/01 | ||
10.07 | + | 2000 Nonstatutory Stock Option Plan and Form of Stock Option Agreement. | SC TO-I | 005-38119 | 99.(d)(3) | 05/22/01 | ||
10.08 | + | 1990 Directors' Option Plan and forms of Stock Option Agreement, as amended. | 10-K | 000-15071 | 10.6 | 06/29/99 | ||
10.09 | + | 2000 Director Option Plan and Form of Agreement. | 10-Q | 000-15071 | 10.1 | 11/06/00 | ||
10.10 | Asset Purchase Agreement between International Business Machines Corporation and the Registrant. | 10-K | 000-15071 | 10.22 | 06/24/02 | |||
10.11 | + | 2004 Equity Incentive Plan, as amended on August 24, 2006 | 8-K | 000-15071 | 99.01 | 8/30/06 | ||
10.12 | + | Form of Stock Option Agreement under the 2004 Equity Incentive Plan | 10-Q | 000-15071 | 10.02 | 11/10/04 | ||
10.13 | + | Form of Restricted Stock Purchase Agreement under the 2004 Equity Incentive Plan | 10-Q | 000-15071 | 10.03 | 11/10/04 | ||
10.14 | + | Form of Restricted Stock Unit Agreement under the 2004 Equity Incentive Plan | 10-Q | 000-15071 | 10.04 | 11/10/04 | ||
10.15 | + | Eurologic Systems Group Limited 1998 Share Option Plan Rules (Amended as of 1 April 2003) | S-8 | 333-104685 | 4.03 | 04/23/03 | ||
10.16 | + | Broadband Storage, Inc. 2001 Stock Option and Restricted Stock Purchase Plan | S-8 | 333-118090 | 4.03 | 08/10/04 | ||
10.17 | + | Snap Appliance, Inc. 2002 Stock Option and Restricted Stock Purchase Plan | S-8 | 333-118090 | 4.04 | 08/10/04 | ||
10.18 | + | Stargate Solutions, Inc. 1999 Incentive Stock Plan | S-8 | 333-69116 | 4.03 | 09/07/01 | ||
10.19 | + | Executive Employment Agreement of Subramanian "Sundi" Sundaresh, effective as of August 14, 2007 | 10-Q | 000-15071 | 10.01 | 11/06/07 | ||
10.20 | + | 2005 Deferred Compensation Plan | 10-Q | 000-15071 | 10.01 | 11/07/05 | ||
10.21 | * | Manufacturing Services and Supply Agreement by and between the Registrant and Sanmina-SCI Corporation | 10-Q | 000-15071 | 10.1 | 02/07/06 | ||
10.22 | * | Asset Purchase and Sale Agreement, dated as of December 23, 2005, by and among Adaptec Manufacturing (s) Pte. Ltd., Sanmina-SCI Corporation and Sanmina-SCI Systems Singapore Pte. Ltd. | 10-Q | 000-15071 | 10.2 | 02/07/06 | ||
10.23 | * | Amendment to Manufacturing Services and Supply Agreement by and between the Registrant and Sanmina-SCI Corporation | 10-Q | 000-15071 | 10.3 | 02/07/06 | ||
10.24 | * | Asset Purchase and Sale Agreement, dated as of January 31, 2006, by and among the Registrant, Sanmina--SCI Corporation and Sanmina-SCI USA, Inc. | 10-K | 000-15071 | 10.49 | 06/14/06 | ||
10.25 | + | Non-Employee Director Compensation Policy, as amended | 10-Q | 000-15071 | 10.1 | 11/08/06 | ||
10.26 | + | Adaptec, Inc. 2006 Director Plan | DEF 14A | 000-15071 | A | 7/28/06 | ||
10.27 | Restricted Stock Award Agreement under 2006 Director Plan as amended on February 7, 2008 | 8-K | 000-15071 | 10.02 | 02/07/08 | |||
10.28 | Stock Option Award Agreement under 2006 Director Plan | 8-K | 000-15701 | 10.01 | 02/07/08 | |||
10.29 | Stock Appreciation Right Award Agreement under 2006 Director Plan as amended on February 7, 2008 | 8-K | 000-15071 | 10.03 | 02/07/08 | |||
10.30 | Restricted Stock Award Agreement under 2006 Director Plan as amended on February 7, 2008 | 8-K | 000-15071 | 10.04 | 02/07/08 | |||
10.31 | + | Offer Letter between the Company and Jon S. Castor, dated July 17, 2006 | 8-K | 000-15071 | 99.02 | 07/20/06 | ||
10.32 | + | Fiscal 2008 Adaptec Incentive Plan | 8-K | 000-15071 | 99.1 | 04/20/07 | ||
10.33 | + | Form of Indemnificaion Agreement entered into between the Company and its officers and directors | 10-K | 000-15071 | 10.47 | 06/06/07 | ||
10.34 | + | Separation Agreement of Russell Johnson, effective September 22, 2007 | 10-Q | 000-15071 | 10.11 | 11/06/07 | ||
10.35 | Settlement Agreement dated as of October 26, 2007, among the Registrant, Steel Partners, L.L.C. and Steel partners II, L.P. | 8-K | 000-15071 | 10.01 | 10/31/07 | |||
10.36 | + | X | ||||||
10.37 | X | |||||||
10.38 | + | Offer Letter and Executive Employment Agreement between the Company and Mary Dotz, dated March 31, 2008 | 8-K | 000-15071 | 99.02 | 03/31/08 | ||
21.01 | X | |||||||
23.01 | Consent of Independent Registered Public Accounting Firm, PricewaterhouseCoopers LLP. | X | ||||||
31.1 | Certification pursuant to Section 302 of the Sarbanes-Oxley Act of 2002. | X | ||||||
31.2 | Certification pursuant to Section 302 of the Sarbanes-Oxley Act of 2002. | X | ||||||
32.1 | Certification pursuant to Section 906 of the Sarbanes-Oxley Act of 2002. | X | ||||||
(A) Incorporated by reference to exhibits filed with Registrant's Annual Report on Form 10-K for the year ended March 31, 1987.
(B) Incorporated by reference to exhibits filed with Registrant's Annual Report on Form 10-K for the year ended March 31, 1993.
+Management contract or compensatory plan or arrangement required to be filed as an exhibit to this Annual Report on Form 10-K pursuant to Item 14(c) of said form.
*Confidential treatment has been granted for portions of this agreement.